Test du Dynabook Portege X30L-G (i5-10210U, UHD 620, FHD) : un nouvel appareil léger
Note | Date | Modèle | Poids | Épaisseur | Taille | Résolution | Prix |
|---|---|---|---|---|---|---|---|
| 85.1 % v7 (old) | 06/20 | Dynabook Portege X30L-G1331 i5-10210U, UHD Graphics 620 | 859 g | 17.9 mm | 13.30" | 1920x1080 | |
| 88.9 % v7 (old) | 04/20 | Dell XPS 13 9300 Core i7-1065G7 i7-1065G7, Iris Plus Graphics G7 (Ice Lake 64 EU) | 1.2 kg | 14.8 mm | 13.40" | 1920x1200 | |
| 81.9 % v6 (old) | 04/18 | LG Gram 13Z980-A i5-8250U, UHD Graphics 620 | 965 g | 15 mm | 13.30" | 1920x1080 | |
| 86 % v7 (old) | 07/19 | Lenovo ThinkBook 13s-20R90071GE i5-8265U, UHD Graphics 620 | 1.3 kg | 15.9 mm | 13.30" | 1920x1080 | |
| 88.2 % v6 (old) | 05/18 | HP EliteBook 830 G5-3JX74EA i5-8550U, UHD Graphics 620 | 1.3 kg | 17.7 mm | 13.30" | 1920x1080 |
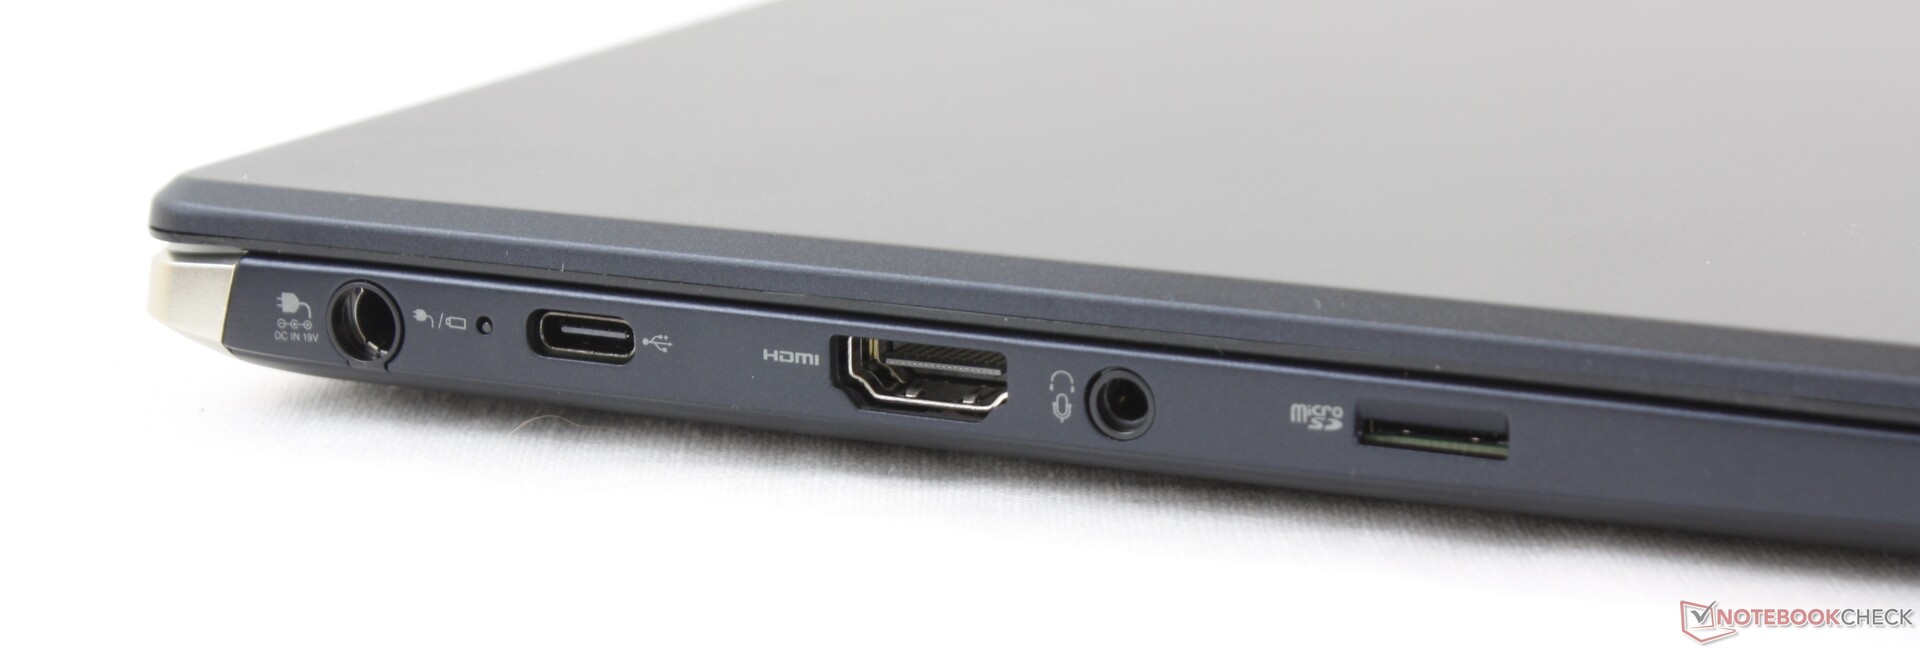
| SD Card Reader | |
| average JPG Copy Test (av. of 3 runs) | |
| HP EliteBook 1050 G1-4QY20EA (Toshiba Exceria Pro SDXC 64 GB UHS-II) | |
| Dell XPS 13 9300 Core i7-1065G7 (Toshiba Exceria Pro M501 64 GB UHS-II) | |
| Dynabook Portege X30L-G1331 (Toshiba Exceria Pro M501 64 GB UHS-II) | |
| LG Gram 13Z980-A (Toshiba Exceria Pro M501 UHS-II) | |
| maximum AS SSD Seq Read Test (1GB) | |
| HP EliteBook 1050 G1-4QY20EA (Toshiba Exceria Pro SDXC 64 GB UHS-II) | |
| Dell XPS 13 9300 Core i7-1065G7 (Toshiba Exceria Pro M501 64 GB UHS-II) | |
| LG Gram 13Z980-A (Toshiba Exceria Pro M501 UHS-II) | |
| Dynabook Portege X30L-G1331 (Toshiba Exceria Pro M501 64 GB UHS-II) | |


| |||||||||||||||||||||||||
Homogénéité de la luminosité: 91 %
Valeur mesurée au centre, sur batterie: 482 cd/m²
Contraste: 1205:1 (Valeurs des noirs: 0.4 cd/m²)
ΔE ColorChecker Calman: 1.85 | ∀{0.5-29.43 Ø4.73}
calibrated: 1.2
ΔE Greyscale Calman: 2 | ∀{0.09-98 Ø4.97}
97.7% sRGB (Argyll 1.6.3 3D)
62.5% AdobeRGB 1998 (Argyll 1.6.3 3D)
67.8% AdobeRGB 1998 (Argyll 3D)
97.6% sRGB (Argyll 3D)
66.9% Display P3 (Argyll 3D)
Gamma: 2.1
CCT: 6822 K
| Dynabook Portege X30L-G1331 Toshiba TOS508F, IPS, 13.3", 1920x1080 | Dell XPS 13 9300 Core i7-1065G7 Sharp LQ134N1, IPS, 13.4", 1920x1200 | LG Gram 13Z980-A LG LP133WF6-SPC1, IPS, 13.3", 1920x1080 | Apple MacBook Pro 13 2019 2TB3 APPA03D, IPS, 13.3", 2560x1600 | Lenovo ThinkBook 13s-20R90071GE N133HCE-EN2, a-Si IPS LED, 13.3", 1920x1080 | HP EliteBook 830 G5-3JX74EA IVO M133NVF3-R0, IPS LED, 13.3", 1920x1080 | |
|---|---|---|---|---|---|---|
| Display | 0% | 0% | 24% | 1% | -6% | |
| Display P3 Coverage (%) | 66.9 | 66.3 -1% | 66.9 0% | 96.1 44% | 67 0% | 64.2 -4% |
| sRGB Coverage (%) | 97.6 | 97.3 0% | 97.3 0% | 99.4 2% | 99.1 2% | 89.2 -9% |
| AdobeRGB 1998 Coverage (%) | 67.8 | 68.5 1% | 67.9 0% | 85.6 26% | 69.2 2% | 65.2 -4% |
| Response Times | 8% | 27% | 5% | 23% | 32% | |
| Response Time Grey 50% / Grey 80% * (ms) | 54.8 ? | 50 ? 9% | 37.6 ? 31% | 50.4 ? 8% | 40.4 ? 26% | 36 ? 34% |
| Response Time Black / White * (ms) | 35.6 ? | 33.2 ? 7% | 27.6 ? 22% | 35.2 ? 1% | 28.8 ? 19% | 24.8 ? 30% |
| PWM Frequency (Hz) | 23810 ? | 2500 ? | 116300 ? | 25000 ? | 1020 ? | |
| Screen | -30% | -37% | 16% | -19% | -66% | |
| Brightness middle (cd/m²) | 482 | 607.6 26% | 347.8 -28% | 603 25% | 319 -34% | 316 -34% |
| Brightness (cd/m²) | 452 | 595 32% | 331 -27% | 577 28% | 309 -32% | 326 -28% |
| Brightness Distribution (%) | 91 | 96 5% | 89 -2% | 92 1% | 92 1% | 85 -7% |
| Black Level * (cd/m²) | 0.4 | 0.4 -0% | 0.36 10% | 0.35 13% | 0.28 30% | 0.19 52% |
| Contrast (:1) | 1205 | 1519 26% | 966 -20% | 1723 43% | 1139 -5% | 1663 38% |
| Colorchecker dE 2000 * | 1.85 | 3.23 -75% | 2.37 -28% | 1.7 8% | 2.4 -30% | 4.5 -143% |
| Colorchecker dE 2000 max. * | 3.08 | 8.67 -181% | 4.21 -37% | 3.1 -1% | 6.3 -105% | 12.1 -293% |
| Colorchecker dE 2000 calibrated * | 1.2 | 1.01 16% | 4.21 -251% | 0.7 42% | 0.6 50% | 2.9 -142% |
| Greyscale dE 2000 * | 2 | 5.5 -175% | 2.5 -25% | 2.1 -5% | 3.8 -90% | 5 -150% |
| Gamma | 2.1 105% | 2.12 104% | 2.15 102% | 2.18 101% | 2.16 102% | 2.22 99% |
| CCT | 6822 95% | 6413 101% | 6384 102% | 6843 95% | 7335 89% | 6018 108% |
| Color Space (Percent of AdobeRGB 1998) (%) | 62.5 | 63 1% | 62.5 0% | 76.7 23% | 63.5 2% | 57.9 -7% |
| Color Space (Percent of sRGB) (%) | 97.7 | 97.5 0% | 97 -1% | 99.4 2% | 99.1 1% | 87.3 -11% |
| Moyenne finale (programmes/paramètres) | -7% /
-19% | -3% /
-22% | 15% /
16% | 2% /
-10% | -13% /
-42% |
* ... Moindre est la valeur, meilleures sont les performances
Temps de réponse de l'écran
| ↔ Temps de réponse noir à blanc | ||
|---|---|---|
| 35.6 ms ... hausse ↗ et chute ↘ combinées | ↗ 19.2 ms hausse | 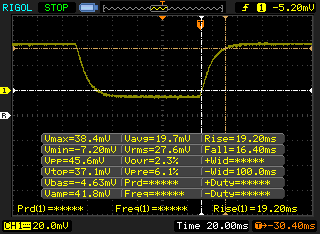 |
| ↘ 16.4 ms chute | ||
| L'écran souffre de latences très élevées, à éviter pour le jeu. En comparaison, tous les appareils testés affichent entre 0.1 (minimum) et 240 (maximum) ms. » 93 % des appareils testés affichent de meilleures performances. Cela signifie que les latences relevées sont moins bonnes que la moyenne (19.9 ms) de tous les appareils testés. | ||
| ↔ Temps de réponse gris 50% à gris 80% | ||
| 54.8 ms ... hausse ↗ et chute ↘ combinées | ↗ 26 ms hausse | 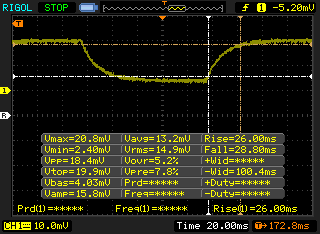 |
| ↘ 28.8 ms chute | ||
| L'écran souffre de latences très élevées, à éviter pour le jeu. En comparaison, tous les appareils testés affichent entre 0.165 (minimum) et 636 (maximum) ms. » 91 % des appareils testés affichent de meilleures performances. Cela signifie que les latences relevées sont moins bonnes que la moyenne (31.1 ms) de tous les appareils testés. | ||
Scintillement / MLI (Modulation de largeur d'impulsion)
| Scintillement / MLI (Modulation de largeur d'impulsion) décelé | 23810 Hz | ≤ 24 Niveau de luminosité | 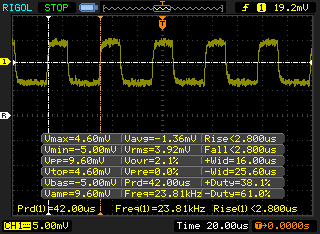 |
Le rétroéclairage de l'écran scintille à la fréquence de 23810 Hz (certainement du fait de l'utilisation d'une MDI - Modulation de largeur d'impulsion) à un niveau de luminosité inférieur ou égal à 24 % . Aucun scintillement ne devrait être perceptible au-dessus de cette valeur. La fréquence de rafraîchissement de 23810 Hz est élevée, la grande majorité des utilisateurs ne devrait pas percevoir de scintillements et être sujette à une fatigue oculaire accrue. En comparaison, 52 % des appareils testés n'emploient pas MDI pour assombrir leur écran. Nous avons relevé une moyenne à 7794 (minimum : 5 - maximum : 343500) Hz dans le cas où une MDI était active. | |||
Cinebench R15: CPU Multi 64Bit | CPU Single 64Bit
Blender: v2.79 BMW27 CPU
7-Zip 18.03: 7z b 4 -mmt1 | 7z b 4
Geekbench 5.5: Single-Core | Multi-Core
HWBOT x265 Benchmark v2.2: 4k Preset
LibreOffice : 20 Documents To PDF
R Benchmark 2.5: Overall mean
| Blender / v2.79 BMW27 CPU | |
| Dell Latitude 13 3390 | |
| Dynabook Portege X30L-G1331 | |
| Moyenne Intel Core i5-10210U (585 - 1339, n=24) | |
| Dell XPS 13 9300 i5 FHD | |
| Honor Magicbook 14 | |
| Dell XPS 13 9300 4K UHD | |
| Dell XPS 13 7390 Core i7-10710U | |
| 7-Zip 18.03 / 7z b 4 -mmt1 | |
| Dell XPS 13 9300 4K UHD | |
| Dell XPS 13 7390 Core i7-10710U | |
| Dynabook Portege X30L-G1331 | |
| Moyenne Intel Core i5-10210U (3504 - 4467, n=24) | |
| Dell XPS 13 9300 i5 FHD | |
| Dell Latitude 13 3390 | |
| Honor Magicbook 14 | |
| 7-Zip 18.03 / 7z b 4 | |
| Dell XPS 13 7390 Core i7-10710U | |
| Dell XPS 13 9300 4K UHD | |
| Dell XPS 13 9300 i5 FHD | |
| Honor Magicbook 14 | |
| Moyenne Intel Core i5-10210U (10920 - 21679, n=24) | |
| Dynabook Portege X30L-G1331 | |
| Dell Latitude 13 3390 | |
| Geekbench 5.5 / Single-Core | |
| Dell XPS 13 9300 4K UHD | |
| Dell XPS 13 9300 i5 FHD | |
| Dynabook Portege X30L-G1331 | |
| Moyenne Intel Core i5-10210U (949 - 1133, n=27) | |
| Honor Magicbook 14 | |
| Geekbench 5.5 / Multi-Core | |
| Dell XPS 13 9300 4K UHD | |
| Dell XPS 13 9300 i5 FHD | |
| Dynabook Portege X30L-G1331 | |
| Moyenne Intel Core i5-10210U (2079 - 4256, n=27) | |
| Honor Magicbook 14 | |
| HWBOT x265 Benchmark v2.2 / 4k Preset | |
| Dell XPS 13 9300 4K UHD | |
| Dell XPS 13 7390 Core i7-10710U | |
| Moyenne Intel Core i5-10210U (2.36 - 6.28, n=24) | |
| Dell XPS 13 9300 i5 FHD | |
| Dynabook Portege X30L-G1331 | |
| Honor Magicbook 14 | |
| Dell Latitude 13 3390 | |
| LibreOffice / 20 Documents To PDF | |
| Dell XPS 13 9300 4K UHD | |
| Moyenne Intel Core i5-10210U (49.6 - 80.3, n=18) | |
| Dynabook Portege X30L-G1331 | |
| R Benchmark 2.5 / Overall mean | |
| Honor Magicbook 14 | |
| Moyenne Intel Core i5-10210U (0.658 - 0.901, n=24) | |
| Dell XPS 13 9300 i5 FHD | |
| Dynabook Portege X30L-G1331 | |
| Dell XPS 13 9300 4K UHD | |
* ... Moindre est la valeur, meilleures sont les performances
| PCMark 8 Home Score Accelerated v2 | 3641 points | |
| PCMark 8 Work Score Accelerated v2 | 5039 points | |
| PCMark 10 Score | 4217 points | |
Aide | ||
| DPC Latencies / LatencyMon - interrupt to process latency (max), Web, Youtube, Prime95 | |
| Dynabook Portege X30L-G1331 | |
* ... Moindre est la valeur, meilleures sont les performances
| Dynabook Portege X30L-G1331 Samsung SSD PM981a MZVLB512HBJQ | Dell XPS 13 9300 Core i7-1065G7 Intel SSDPEMKF512G8 NVMe SSD | LG Gram 13Z980-A SK Hynix HFS256G39TND-N210A | Apple MacBook Pro 13 2019 2TB3 Apple SSD AP0256 | Lenovo ThinkBook 13s-20R90071GE SK hynix BC501 HFM512GDHTNG-8310A | |
|---|---|---|---|---|---|
| AS SSD | -36% | -83% | -105% | -38% | |
| Seq Read (MB/s) | 2067 | 1956 -5% | 496.4 -76% | 974 -53% | 1264 -39% |
| Seq Write (MB/s) | 2444 | 1227 -50% | 241.7 -90% | 1340 -45% | 518 -79% |
| 4K Read (MB/s) | 55.8 | 63 13% | 27.16 -51% | 11.35 -80% | 40.31 -28% |
| 4K Write (MB/s) | 124.6 | 156.6 26% | 61 -51% | 15.95 -87% | 119.1 -4% |
| 4K-64 Read (MB/s) | 1601 | 475.6 -70% | 376.7 -76% | 643 -60% | 772 -52% |
| 4K-64 Write (MB/s) | 1696 | 539 -68% | 231.3 -86% | 163 -90% | 672 -60% |
| Access Time Read * (ms) | 0.048 | 0.042 12% | 0.084 -75% | 0.316 -558% | 0.046 4% |
| Access Time Write * (ms) | 0.091 | 0.105 -15% | 0.235 -158% | 0.258 -184% | 0.031 66% |
| Score Read (Points) | 1864 | 734 -61% | 453 -76% | 752 -60% | 939 -50% |
| Score Write (Points) | 2065 | 818 -60% | 316 -85% | 313 -85% | 843 -59% |
| Score Total (Points) | 4908 | 1915 -61% | 997 -80% | 1465 -70% | 2234 -54% |
| Copy ISO MB/s (MB/s) | 2051 | 1022 -50% | 204.5 -90% | 1404 -32% | 943 -54% |
| Copy Program MB/s (MB/s) | 572 | 302.8 -47% | 127.6 -78% | 406.9 -29% | 292.2 -49% |
| Copy Game MB/s (MB/s) | 1447 | 491.4 -66% | 191.7 -87% | 850 -41% | 374.1 -74% |
| CrystalDiskMark 5.2 / 6 | 3% | -68% | -41% | ||
| Write 4K (MB/s) | 164.1 | 186.8 14% | 73.9 -55% | 89.3 -46% | |
| Read 4K (MB/s) | 49.34 | 71.4 45% | 25.67 -48% | 37.4 -24% | |
| Write Seq (MB/s) | 1777 | 1203 -32% | 255.2 -86% | 608 -66% | |
| Read Seq (MB/s) | 1752 | 2600 48% | 480.7 -73% | 1019 -42% | |
| Write 4K Q32T1 (MB/s) | 401.1 | 514 28% | 197.2 -51% | 487.9 22% | |
| Read 4K Q32T1 (MB/s) | 498.7 | 570 14% | 214.4 -57% | 284.8 -43% | |
| Write Seq Q32T1 (MB/s) | 2988 | 786 -74% | 254.9 -91% | 872 -71% | |
| Read Seq Q32T1 (MB/s) | 3544 | 2947 -17% | 554 -84% | 1635 -54% | |
| Write 4K Q8T8 (MB/s) | 387.3 | ||||
| Read 4K Q8T8 (MB/s) | 757 | ||||
| Moyenne finale (programmes/paramètres) | -17% /
-22% | -76% /
-77% | -105% /
-105% | -40% /
-39% |
* ... Moindre est la valeur, meilleures sont les performances

Disk Throttling: DiskSpd Read Loop, Queue Depth 8
| 3DMark 11 Performance | 2008 points | |
| 3DMark Fire Strike Score | 1173 points | |
| 3DMark Time Spy Score | 460 points | |
Aide | ||
| Bas | Moyen | Élevé | Ultra | |
|---|---|---|---|---|
| Dota 2 Reborn (2015) | 71.5 | 45.3 | 21.1 | 18.8 |
| X-Plane 11.11 (2018) | 21.9 | 14.9 | 13.2 |
| Dynabook Portege X30L-G1331 UHD Graphics 620, i5-10210U, Samsung SSD PM981a MZVLB512HBJQ | Dell XPS 13 9300 Core i7-1065G7 Iris Plus Graphics G7 (Ice Lake 64 EU), i7-1065G7, Intel SSDPEMKF512G8 NVMe SSD | LG Gram 13Z980-A UHD Graphics 620, i5-8250U, SK Hynix HFS256G39TND-N210A | Apple MacBook Pro 13 2019 2TB3 Iris Plus Graphics 645, i5-8257U, Apple SSD AP0256 | Lenovo ThinkBook 13s-20R90071GE UHD Graphics 620, i5-8265U, SK hynix BC501 HFM512GDHTNG-8310A | HP EliteBook 830 G5-3JX74EA UHD Graphics 620, i5-8550U, Samsung SSD PM961 1TB M.2 PCIe 3.0 x4 NVMe (MZVLW1T0) | |
|---|---|---|---|---|---|---|
| Noise | -0% | 1% | -3% | -1% | -2% | |
| arrêt / environnement * (dB) | 28.5 | 28.3 1% | 28.1 1% | 29.5 -4% | 28.8 -1% | 29.3 -3% |
| Idle Minimum * (dB) | 28.5 | 28.3 1% | 28.1 1% | 29.5 -4% | 28.8 -1% | 29.3 -3% |
| Idle Average * (dB) | 28.5 | 28.3 1% | 28.1 1% | 29.5 -4% | 28.8 -1% | 29.3 -3% |
| Idle Maximum * (dB) | 28.5 | 28.3 1% | 28.1 1% | 29.5 -4% | 29.7 -4% | 29.3 -3% |
| Load Average * (dB) | 32 | 32.5 -2% | 34.3 -7% | 31.1 3% | 30.7 4% | 33.2 -4% |
| Load Maximum * (dB) | 38 | 39.3 -3% | 34.3 10% | 39.3 -3% | 38.3 -1% | 36.1 5% |
| Witcher 3 ultra * (dB) | 39.3 |
* ... Moindre est la valeur, meilleures sont les performances
Degré de la nuisance sonore
| Au repos |
| 28.5 / 28.5 / 28.5 dB(A) |
| Fortement sollicité |
| 32 / 38 dB(A) |
 | ||
30 dB silencieux 40 dB(A) audible 50 dB(A) bruyant |
||
min: | ||
(±) La température maximale du côté supérieur est de 41.2 °C / 106 F, par rapport à la moyenne de 34.3 °C / 94 F, allant de 21.2 à 62.5 °C pour la classe Office.
(±) Le fond chauffe jusqu'à un maximum de 44 °C / 111 F, contre une moyenne de 36.8 °C / 98 F
(+) En utilisation inactive, la température moyenne du côté supérieur est de 28.5 °C / 83 F, par rapport à la moyenne du dispositif de 29.5 °C / 85 F.
(+) Les repose-poignets et le pavé tactile sont plus froids que la température de la peau avec un maximum de 26 °C / 78.8 F et sont donc froids au toucher.
(±) La température moyenne de la zone de l'appui-paume de dispositifs similaires était de 27.5 °C / 81.5 F (+1.5 °C / #2.7 F).
Dynabook Portege X30L-G1331 analyse audio
(+) | les haut-parleurs peuvent jouer relativement fort (83.1# dB)
Basses 100 - 315 Hz
(-) | presque aucune basse - en moyenne 29.8% plus bas que la médiane
(±) | la linéarité des basses est moyenne (8.6% delta à la fréquence précédente)
Médiums 400 - 2000 Hz
(±) | médiane réduite - en moyenne 6.8% inférieure à la médiane
(±) | la linéarité des médiums est moyenne (8.5% delta à la fréquence précédente)
Aiguës 2 - 16 kHz
(+) | des sommets équilibrés - à seulement 3.2% de la médiane
(+) | les aigus sont linéaires (5.4% delta à la fréquence précédente)
Globalement 100 - 16 000 Hz
(±) | la linéarité du son global est moyenne (26% de différence avec la médiane)
Par rapport à la même classe
» 79% de tous les appareils testés de cette catégorie étaient meilleurs, 7% similaires, 14% pires
» Le meilleur avait un delta de 7%, la moyenne était de 21%, le pire était de 53%.
Par rapport à tous les appareils testés
» 80% de tous les appareils testés étaient meilleurs, 4% similaires, 16% pires
» Le meilleur avait un delta de 4%, la moyenne était de 24%, le pire était de 134%.
Apple MacBook 12 (Early 2016) 1.1 GHz analyse audio
(+) | les haut-parleurs peuvent jouer relativement fort (83.6# dB)
Basses 100 - 315 Hz
(±) | basse réduite - en moyenne 11.3% inférieure à la médiane
(±) | la linéarité des basses est moyenne (14.2% delta à la fréquence précédente)
Médiums 400 - 2000 Hz
(+) | médiane équilibrée - seulement 2.4% de la médiane
(+) | les médiums sont linéaires (5.5% delta à la fréquence précédente)
Aiguës 2 - 16 kHz
(+) | des sommets équilibrés - à seulement 2% de la médiane
(+) | les aigus sont linéaires (4.5% delta à la fréquence précédente)
Globalement 100 - 16 000 Hz
(+) | le son global est linéaire (10.2% différence à la médiane)
Par rapport à la même classe
» 7% de tous les appareils testés de cette catégorie étaient meilleurs, 2% similaires, 91% pires
» Le meilleur avait un delta de 5%, la moyenne était de 18%, le pire était de 53%.
Par rapport à tous les appareils testés
» 5% de tous les appareils testés étaient meilleurs, 1% similaires, 94% pires
» Le meilleur avait un delta de 4%, la moyenne était de 24%, le pire était de 134%.
| Éteint/en veille | |
| Au repos | |
| Fortement sollicité |
|
Légende:
min: | |
| Dynabook Portege X30L-G1331 i5-10210U, UHD Graphics 620, Samsung SSD PM981a MZVLB512HBJQ, IPS, 1920x1080, 13.3" | Dell XPS 13 9300 Core i7-1065G7 i7-1065G7, Iris Plus Graphics G7 (Ice Lake 64 EU), Intel SSDPEMKF512G8 NVMe SSD, IPS, 1920x1200, 13.4" | LG Gram 13Z980-A i5-8250U, UHD Graphics 620, SK Hynix HFS256G39TND-N210A, IPS, 1920x1080, 13.3" | Apple MacBook Pro 13 2019 2TB3 i5-8257U, Iris Plus Graphics 645, Apple SSD AP0256, IPS, 2560x1600, 13.3" | Lenovo ThinkBook 13s-20R90071GE i5-8265U, UHD Graphics 620, SK hynix BC501 HFM512GDHTNG-8310A, a-Si IPS LED, 1920x1080, 13.3" | HP EliteBook 830 G5-3JX74EA i5-8550U, UHD Graphics 620, Samsung SSD PM961 1TB M.2 PCIe 3.0 x4 NVMe (MZVLW1T0), IPS LED, 1920x1080, 13.3" | |
|---|---|---|---|---|---|---|
| Power Consumption | -16% | -12% | -14% | -2% | -28% | |
| Idle Minimum * (Watt) | 2.8 | 4.2 -50% | 3.9 -39% | 2.1 25% | 3.1 -11% | 4.5 -61% |
| Idle Average * (Watt) | 4.9 | 6.9 -41% | 7.3 -49% | 6.9 -41% | 5.87 -20% | 6.4 -31% |
| Idle Maximum * (Watt) | 9 | 7.5 17% | 7.4 18% | 7.8 13% | 6.6 27% | 9.2 -2% |
| Load Average * (Watt) | 31.2 | 33.3 -7% | 36.1 -16% | 42 -35% | 35.3 -13% | 35.7 -14% |
| Load Maximum * (Watt) | 49.4 | 48.4 2% | 35.8 28% | 64.5 -31% | 46.5 6% | 65.4 -32% |
| Witcher 3 ultra * (Watt) | 37.1 |
* ... Moindre est la valeur, meilleures sont les performances
| Dynabook Portege X30L-G1331 i5-10210U, UHD Graphics 620, 42 Wh | Dell XPS 13 9300 Core i7-1065G7 i7-1065G7, Iris Plus Graphics G7 (Ice Lake 64 EU), 52 Wh | LG Gram 13Z980-A i5-8250U, UHD Graphics 620, 72 Wh | Apple MacBook Pro 13 2019 2TB3 i5-8257U, Iris Plus Graphics 645, 58.2 Wh | Lenovo ThinkBook 13s-20R90071GE i5-8265U, UHD Graphics 620, 45 Wh | HP EliteBook 830 G5-3JX74EA i5-8550U, UHD Graphics 620, 49 Wh | |
|---|---|---|---|---|---|---|
| Autonomie de la batterie | 53% | 46% | 57% | 10% | -14% | |
| WiFi v1.3 (h) | 8.3 | 12.7 53% | 12.1 46% | 13 57% | 9.1 10% | 7.1 -14% |
| Load (h) | 1.4 | 2.3 | ||||
| Reader / Idle (h) | 12.8 |
Points positifs
Points négatifs
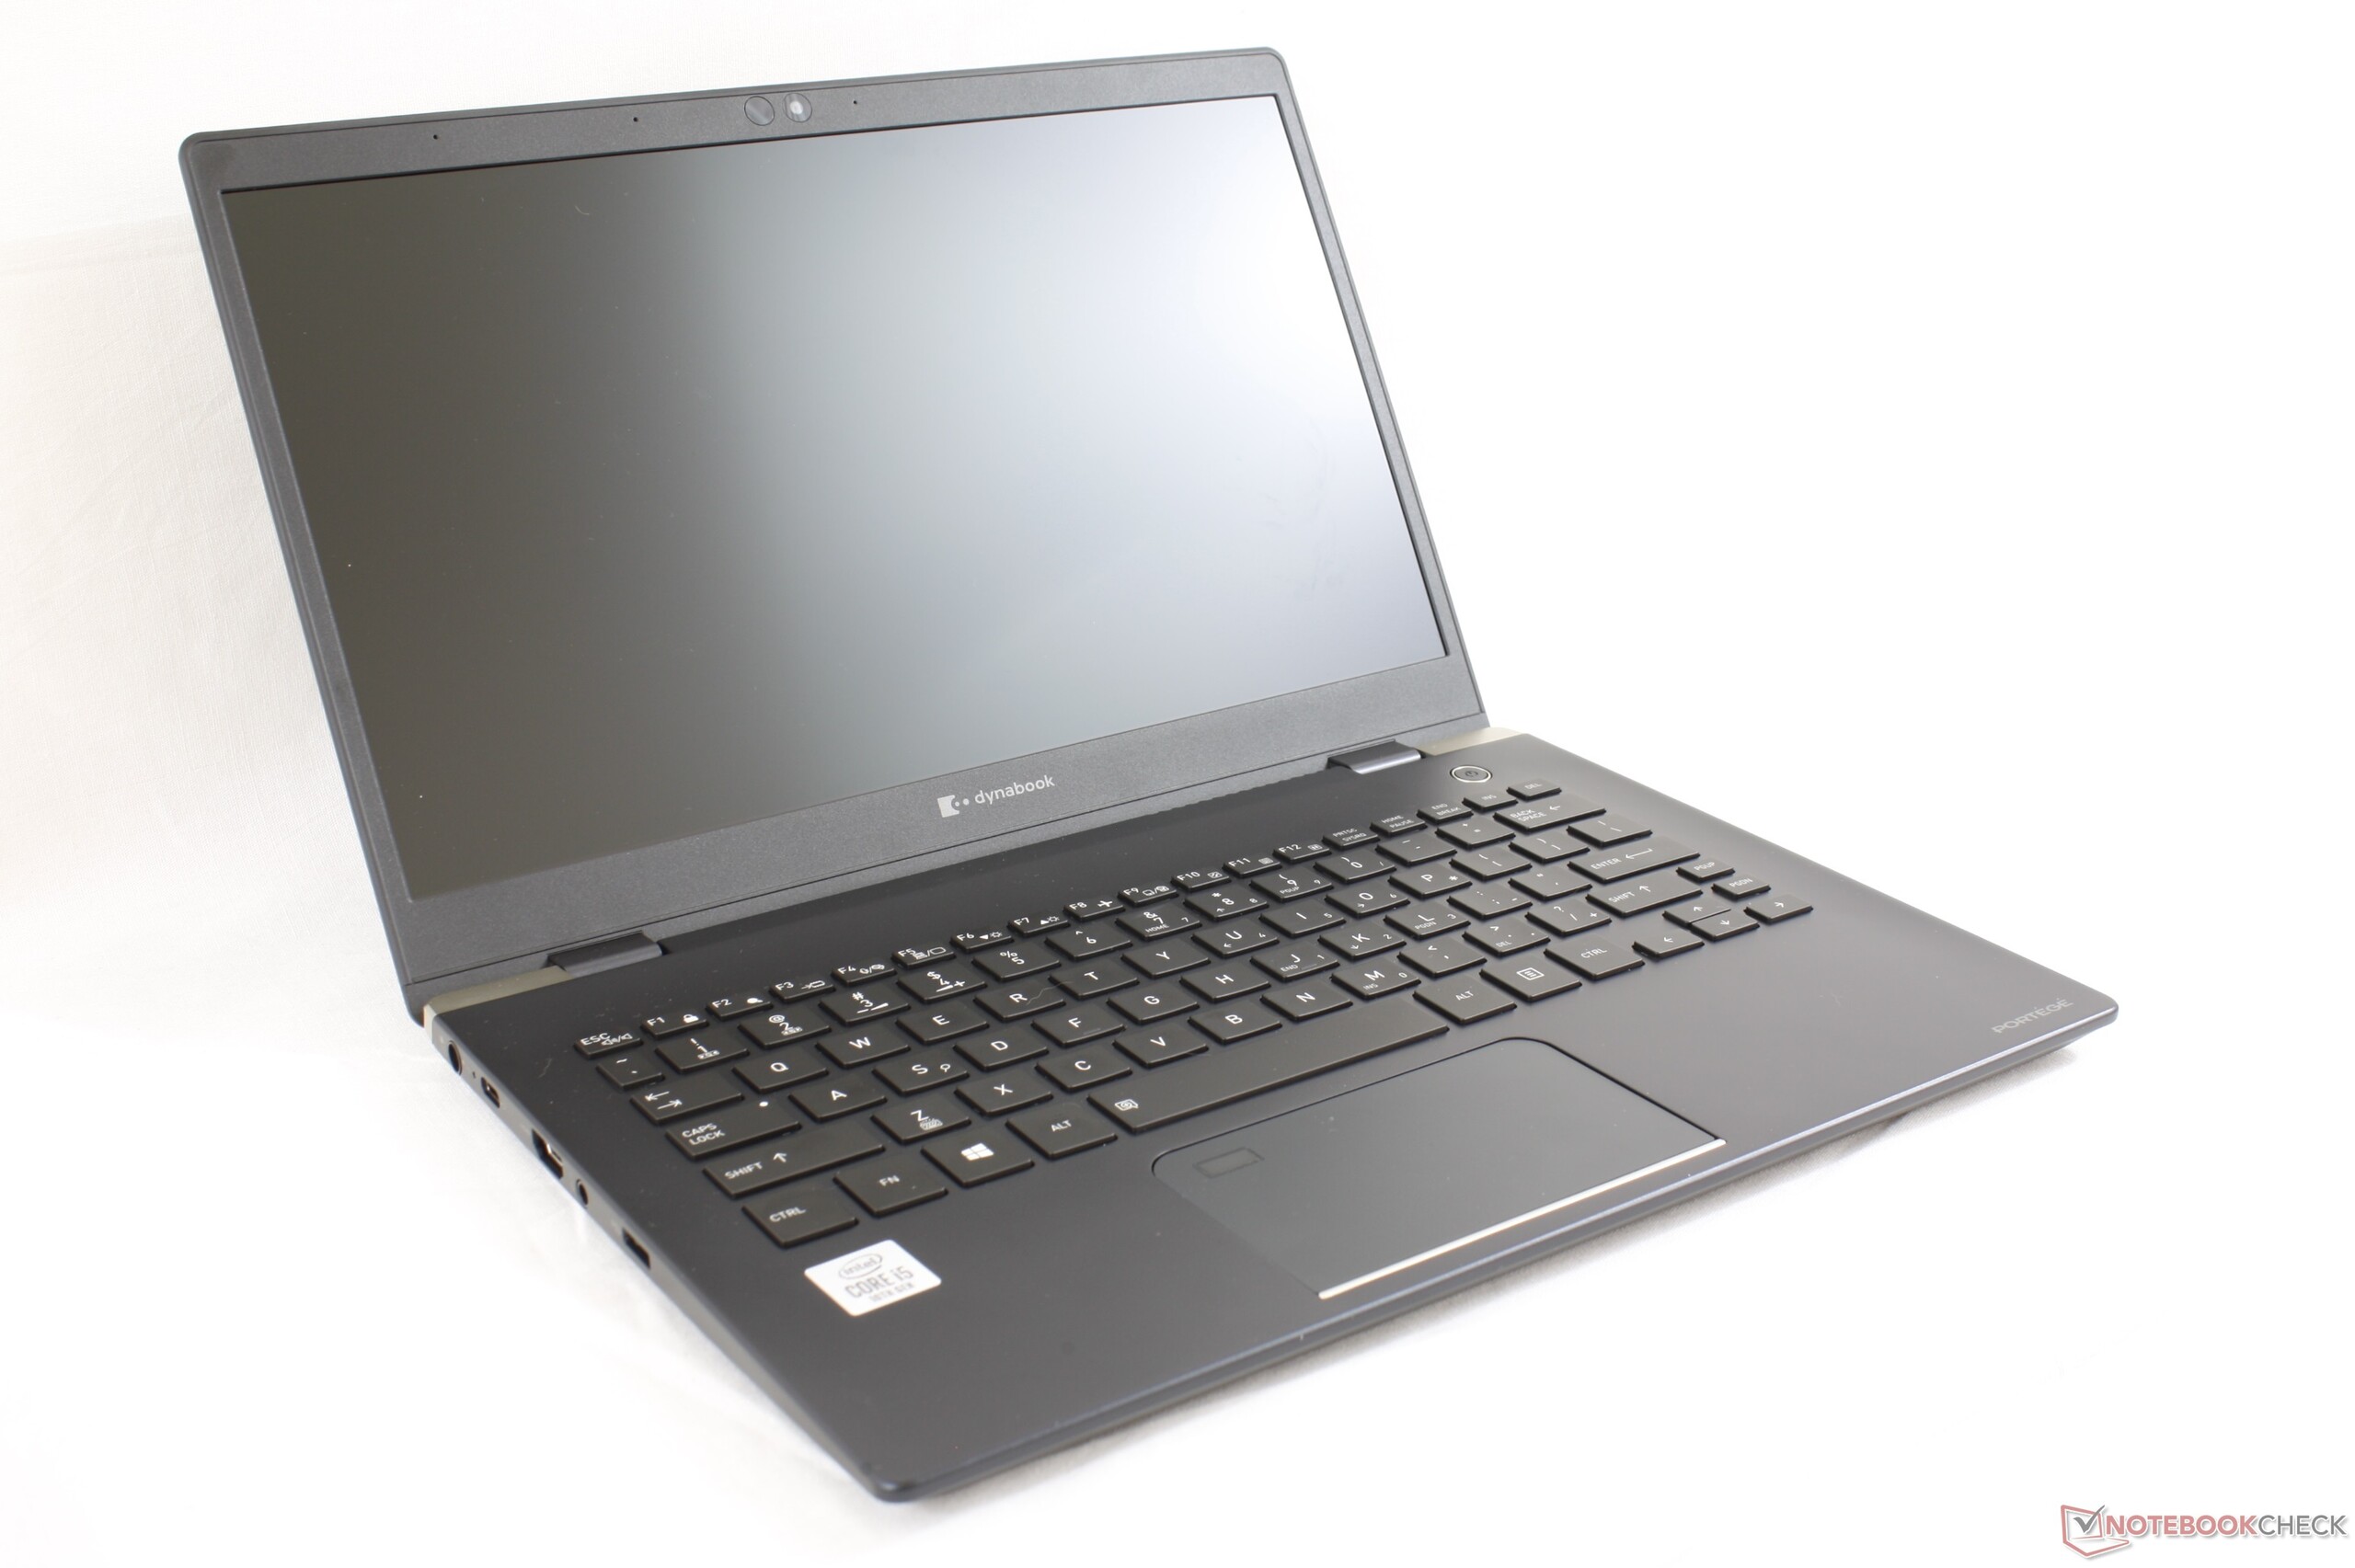
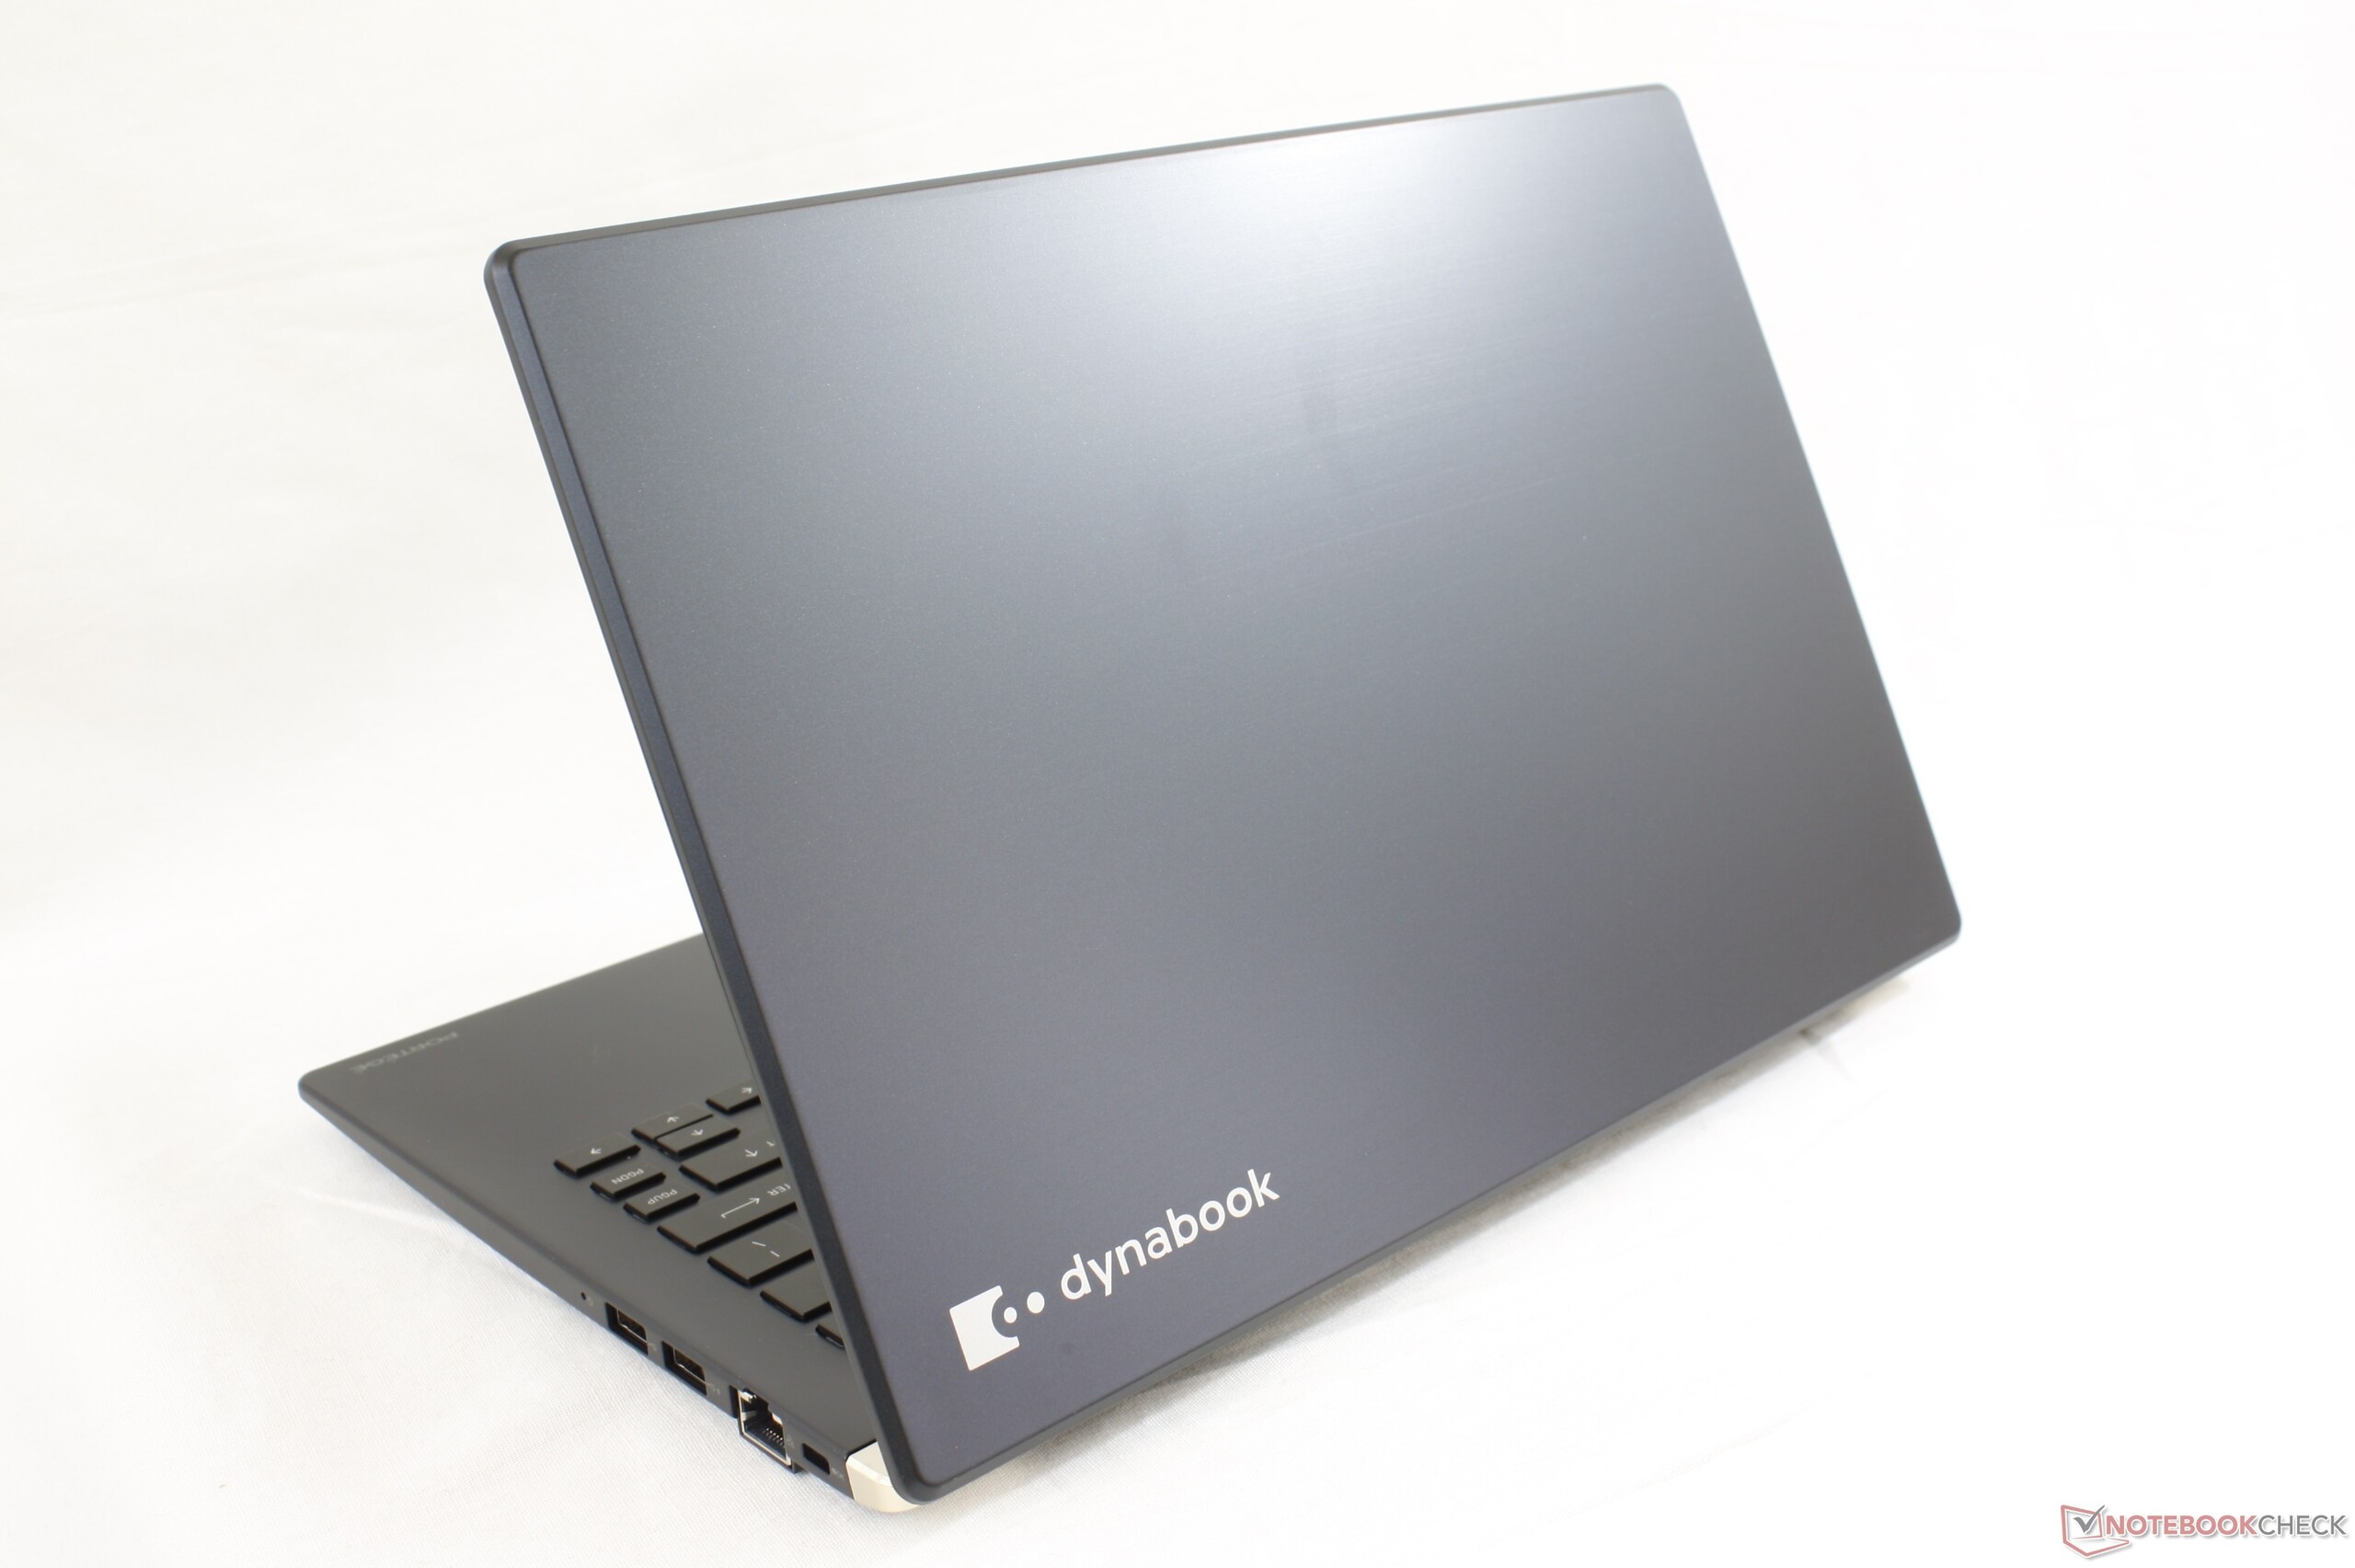
La meilleure raison d'acquérir un Dynabook Portege X30L par rapport à des alternatives comme les HP EliteBook, Dell Latitude ou Lenovo ThinkPad X serait son faible poids. On ne peut que souligner ce qu'apportent quelques centaines de grammes en moins, surtout pour ceux qui trimballent leur machine partout. Même le LG Gram 13 n'est pas aussi léger que notre Portege, et il est quand même vendu comme étant l'un des ultrabooks les plus légers que l'on peut trouver.
Si le poids n'est pas votre principal souci, alors d'autres ultraportables offriront de meilleures performances du processeur comme de la carte graphique, des touches plus fermes, une connectivité plus complète comme le Thunderbolt ou le WAN, un châssis plus rigide, une meilleure autonomie, et un accès plus aisé au SSD. Le HP EliteBook x360 1030 par exemple est plus lumineux, plus fin et plus polyvalent en déplacements, même s'il est un peu plus lourd.
Le Dynabook Portege X30L sera plus adapté aux nomades qui veulent une machine ultralégère, et qui ne laisse pas de côté les ports ou la qualité. Mais ceux qui sont plus sédentaires auront de meilleures machines puisqu'ils ne profiteront pas de l'argument principal de l'ultrabook.
L’intégralité de cette critique est disponible en anglais en suivant ce lien.
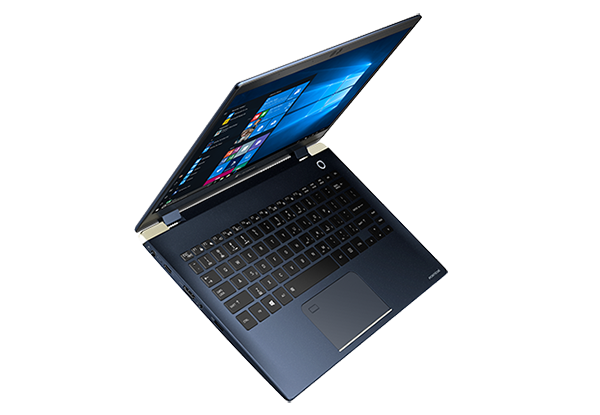
Dynabook Portege X30L-G1331
- 05/18/2020 v7 (old)
Allen Ngo
Price comparison
