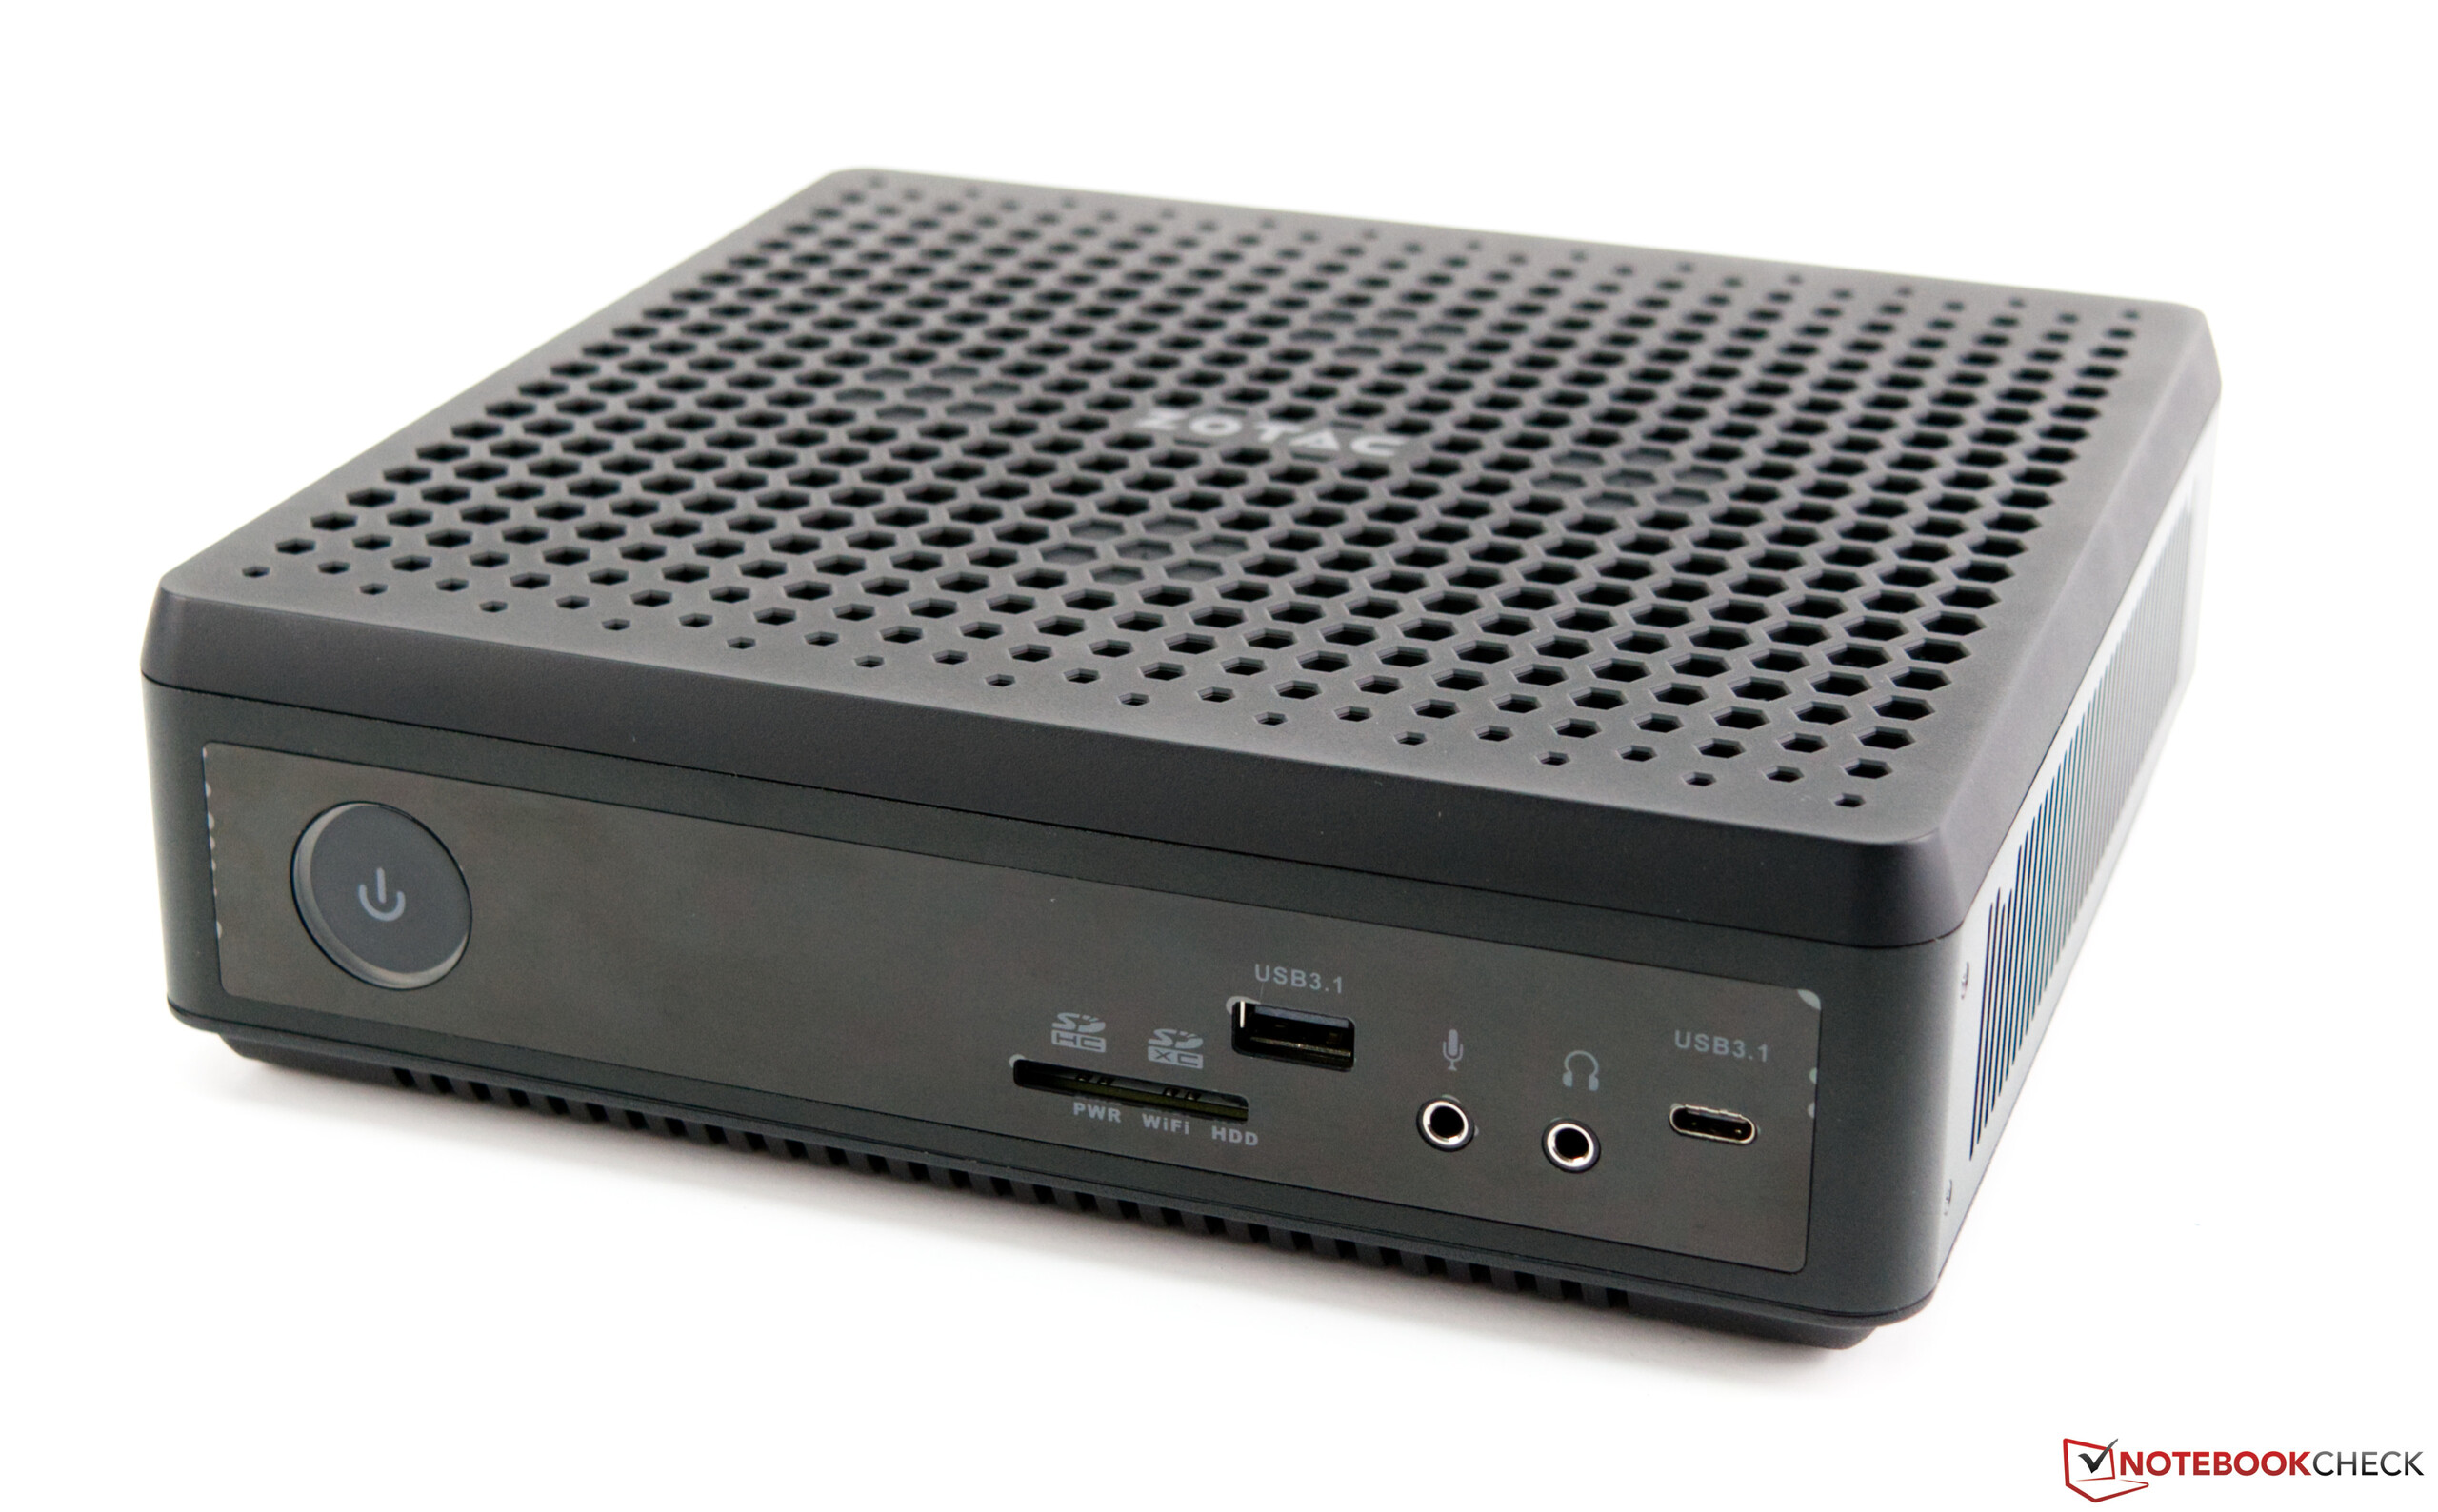
Test du Zotac ZBOX Magnus : mini PC avec GeForce RTX 2080
* ... Moindre est la valeur, meilleures sont les performances
| Borderlands 3 | |
| 1280x720 Very Low Overall Quality (DX11) | |
| Intel Ghost Canyon NUC (RTX 2070) | |
| Moyenne NVIDIA GeForce RTX 2080 Mobile (128 - 150, n=2) | |
| Zotac ZBOX Magnus EN72070V | |
| 1920x1080 Badass Overall Quality (DX11) | |
| Zotac ZBOX Magnus EN72070V | |
| Moyenne NVIDIA GeForce RTX 2080 Mobile (79.4 - 89.4, n=4) | |
| Intel Ghost Canyon NUC (RTX 2070) | |
| Metro Exodus | |
| 1280x720 Low Quality AF:4x | |
| Intel Ghost Canyon NUC (RTX 2070) | |
| Moyenne NVIDIA GeForce RTX 2080 Mobile (149 - 165, n=2) | |
| Zotac ZBOX Magnus EN72070V | |
| 1920x1080 Ultra Quality AF:16x | |
| Moyenne NVIDIA GeForce RTX 2080 Mobile (67.7 - 77.4, n=5) | |
| Zotac ZBOX Magnus EN72070V | |
| Intel Ghost Canyon NUC (RTX 2070) | |
| Far Cry New Dawn | |
| 1280x720 Low Preset | |
| Intel Ghost Canyon NUC (RTX 2070) | |
| Zotac ZBOX Magnus EN72070V | |
| Moyenne NVIDIA GeForce RTX 2080 Mobile (109 - 117, n=2) | |
| 1920x1080 Ultra Preset | |
| Moyenne NVIDIA GeForce RTX 2080 Mobile (82 - 108, n=5) | |
| Zotac ZBOX Magnus EN72070V | |
| Intel Ghost Canyon NUC (RTX 2070) | |
| Forza Horizon 4 | |
| 1280x720 Very Low Preset | |
| Intel Ghost Canyon NUC (RTX 2070) | |
| Zotac ZBOX Magnus EN72070V | |
| Moyenne NVIDIA GeForce RTX 2080 Mobile (n=1) | |
| 1920x1080 Ultra Preset AA:2xMS | |
| Zotac ZBOX Magnus EN72070V | |
| Moyenne NVIDIA GeForce RTX 2080 Mobile (n=1) | |
| Intel Ghost Canyon NUC (RTX 2070) | |
| Far Cry 5 | |
| 1280x720 Low Preset AA:T | |
| Intel Ghost Canyon NUC (RTX 2070) | |
| Zotac ZBOX Magnus EN72070V | |
| Moyenne NVIDIA GeForce RTX 2080 Mobile (123 - 123, n=2) | |
| 1920x1080 Ultra Preset AA:T | |
| Moyenne NVIDIA GeForce RTX 2080 Mobile (73 - 115, n=3) | |
| Intel Ghost Canyon NUC (RTX 2070) | |
| Zotac ZBOX Magnus EN72070V | |
| X-Plane 11.11 | |
| 1280x720 low (fps_test=1) | |
| Intel Ghost Canyon NUC (RTX 2070) | |
| Zotac ZBOX Magnus EN72070V | |
| Moyenne NVIDIA GeForce RTX 2080 Mobile (98.2 - 114, n=3) | |
| 1920x1080 high (fps_test=3) | |
| Intel Ghost Canyon NUC (RTX 2070) | |
| Zotac ZBOX Magnus EN72070V | |
| Moyenne NVIDIA GeForce RTX 2080 Mobile (73.1 - 84.7, n=3) | |
| Final Fantasy XV Benchmark | |
| 1280x720 Lite Quality | |
| Intel Ghost Canyon NUC (RTX 2070) | |
| Zotac ZBOX Magnus EN72070V | |
| Moyenne NVIDIA GeForce RTX 2080 Mobile (n=1) | |
| 1920x1080 High Quality | |
| Moyenne NVIDIA GeForce RTX 2080 Mobile (90.6 - 108, n=3) | |
| Intel Ghost Canyon NUC (RTX 2070) | |
| Zotac ZBOX Magnus EN72070V | |
| Dota 2 Reborn | |
| 1280x720 min (0/3) fastest | |
| Intel Ghost Canyon NUC (RTX 2070) | |
| Zotac ZBOX Magnus EN72070V | |
| Moyenne NVIDIA GeForce RTX 2080 Mobile (134.8 - 152.8, n=3) | |
| 1920x1080 ultra (3/3) best looking | |
| Intel Ghost Canyon NUC (RTX 2070) | |
| Zotac ZBOX Magnus EN72070V | |
| Moyenne NVIDIA GeForce RTX 2080 Mobile (103.9 - 133.8, n=3) | |
| The Witcher 3 | |
| 1024x768 Low Graphics & Postprocessing | |
| Zotac ZBOX Magnus EN72070V | |
| Moyenne NVIDIA GeForce RTX 2080 Mobile (195.8 - 414, n=9) | |
| Intel Ghost Canyon NUC (RTX 2070) | |
| 1920x1080 Ultra Graphics & Postprocessing (HBAO+) | |
| Zotac ZBOX Magnus EN72070V | |
| Moyenne NVIDIA GeForce RTX 2080 Mobile (82.2 - 105, n=16) | |
| Intel Ghost Canyon NUC (RTX 2070) | |
| 3DMark | |
| Fire Strike Extreme Graphics | |
| Moyenne NVIDIA GeForce RTX 2080 Mobile (11133 - 12514, n=2) | |
| Zotac ZBOX Magnus EN72070V | |
| Intel Ghost Canyon NUC (RTX 2070) | |
| 1920x1080 Fire Strike Graphics | |
| Moyenne NVIDIA GeForce RTX 2080 Mobile (22504 - 27319, n=16) | |
| Zotac ZBOX Magnus EN72070V | |
| Intel Ghost Canyon NUC (RTX 2070) | |
| 2560x1440 Time Spy Graphics | |
| Moyenne NVIDIA GeForce RTX 2080 Mobile (9411 - 10992, n=15) | |
| Zotac ZBOX Magnus EN72070V | |
| Intel Ghost Canyon NUC (RTX 2070) | |
| 3DMark 11 | |
| 1280x720 Performance GPU | |
| Moyenne NVIDIA GeForce RTX 2080 Mobile (31826 - 38809, n=17) | |
| Zotac ZBOX Magnus EN72070V | |
| Intel Ghost Canyon NUC (RTX 2070) | |
| 1280x720 Performance | |
| Moyenne NVIDIA GeForce RTX 2080 Mobile (20224 - 29759, n=19) | |
| Intel Ghost Canyon NUC (RTX 2070) | |
| Zotac ZBOX Magnus EN72070V | |
| Bas | Moyen | Élevé | Ultra | QHD | 4K | |
|---|---|---|---|---|---|---|
| The Witcher 3 (2015) | 338 | 279 | 175 | 95.9 | 63.9 | |
| Dota 2 Reborn (2015) | 145.2 | 135.5 | 130.5 | 124.6 | 119 | |
| Final Fantasy XV Benchmark (2018) | 150 | 117 | 90.6 | 67.7 | 39.5 | |
| X-Plane 11.11 (2018) | 114 | 102 | 84.7 | 73 | ||
| Far Cry 5 (2018) | 123 | 72 | 84 | 73 | 67 | 52 |
| Forza Horizon 4 (2018) | 169 | 147 | 145 | 139 | 122 | 82 |
| Far Cry New Dawn (2019) | 117 | 102 | 97 | 88 | 82 | 54 |
| Metro Exodus (2019) | 149 | 112 | 88.1 | 69.5 | 54.8 | 35.1 |
| Borderlands 3 (2019) | 128 | 117 | 93.4 | 84.3 | 61.4 | 33.2 |
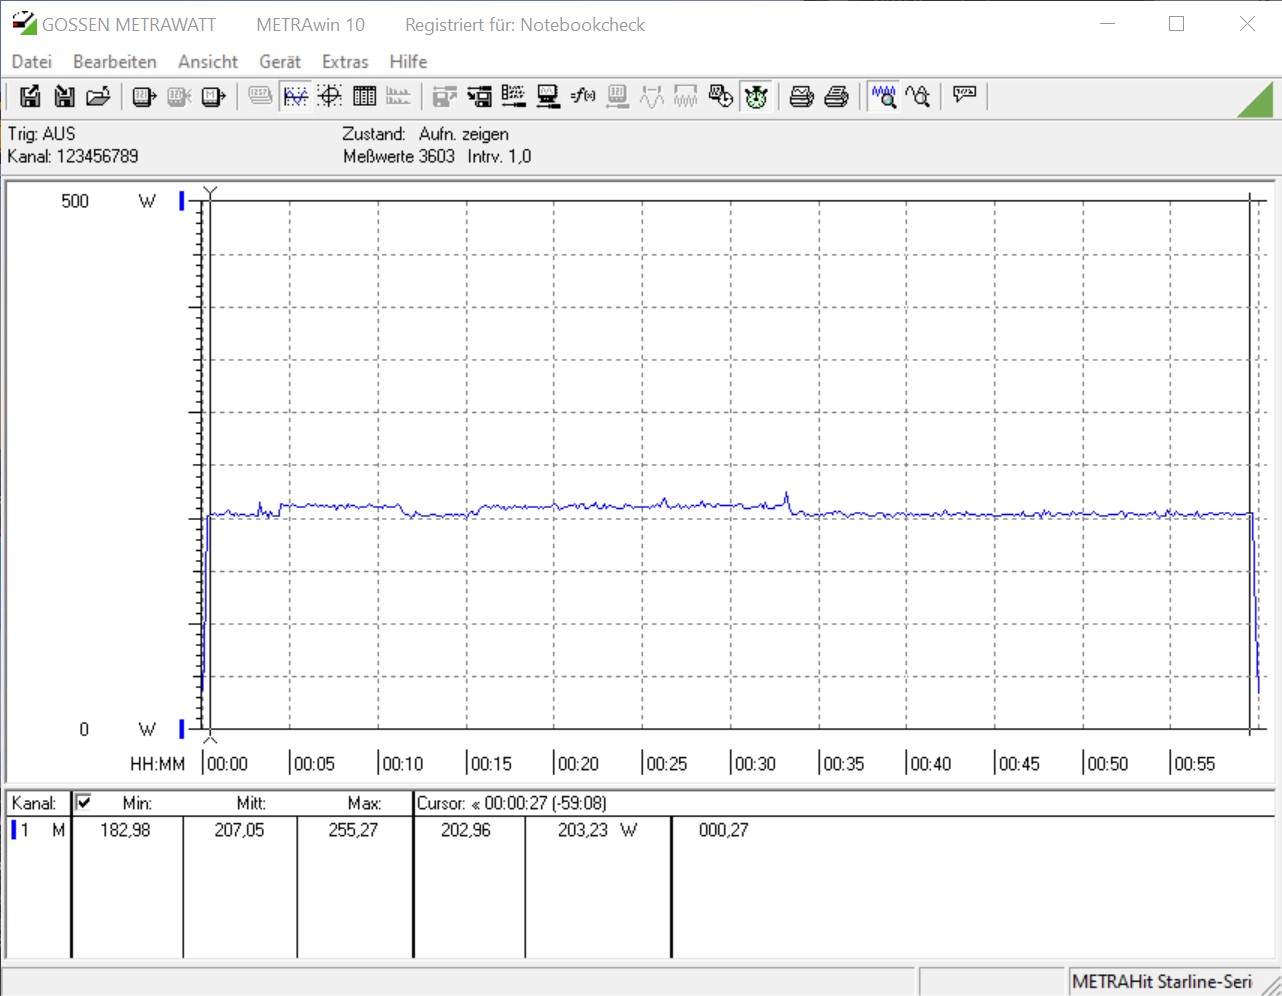
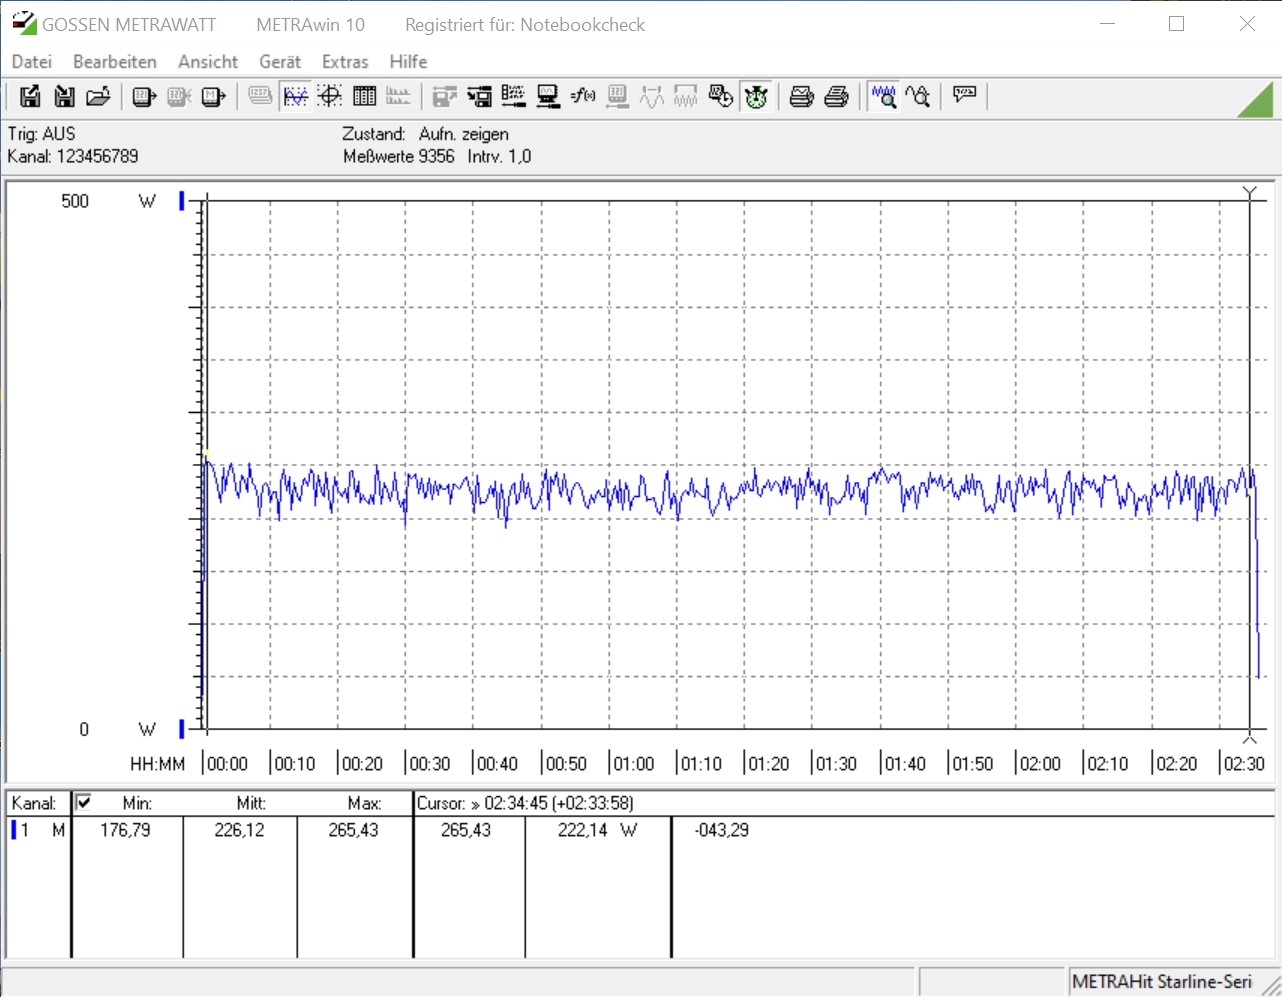
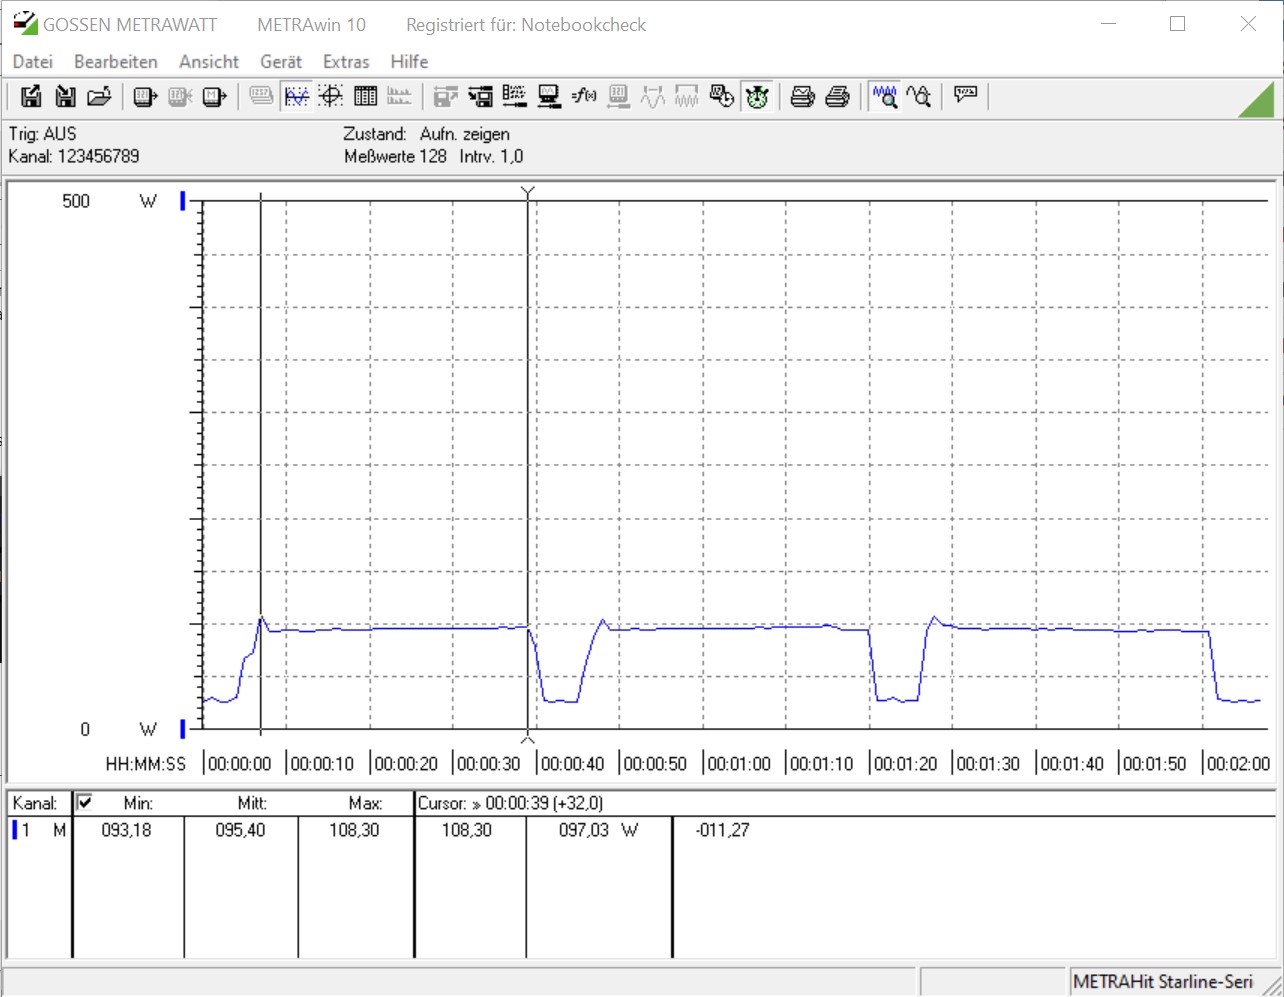
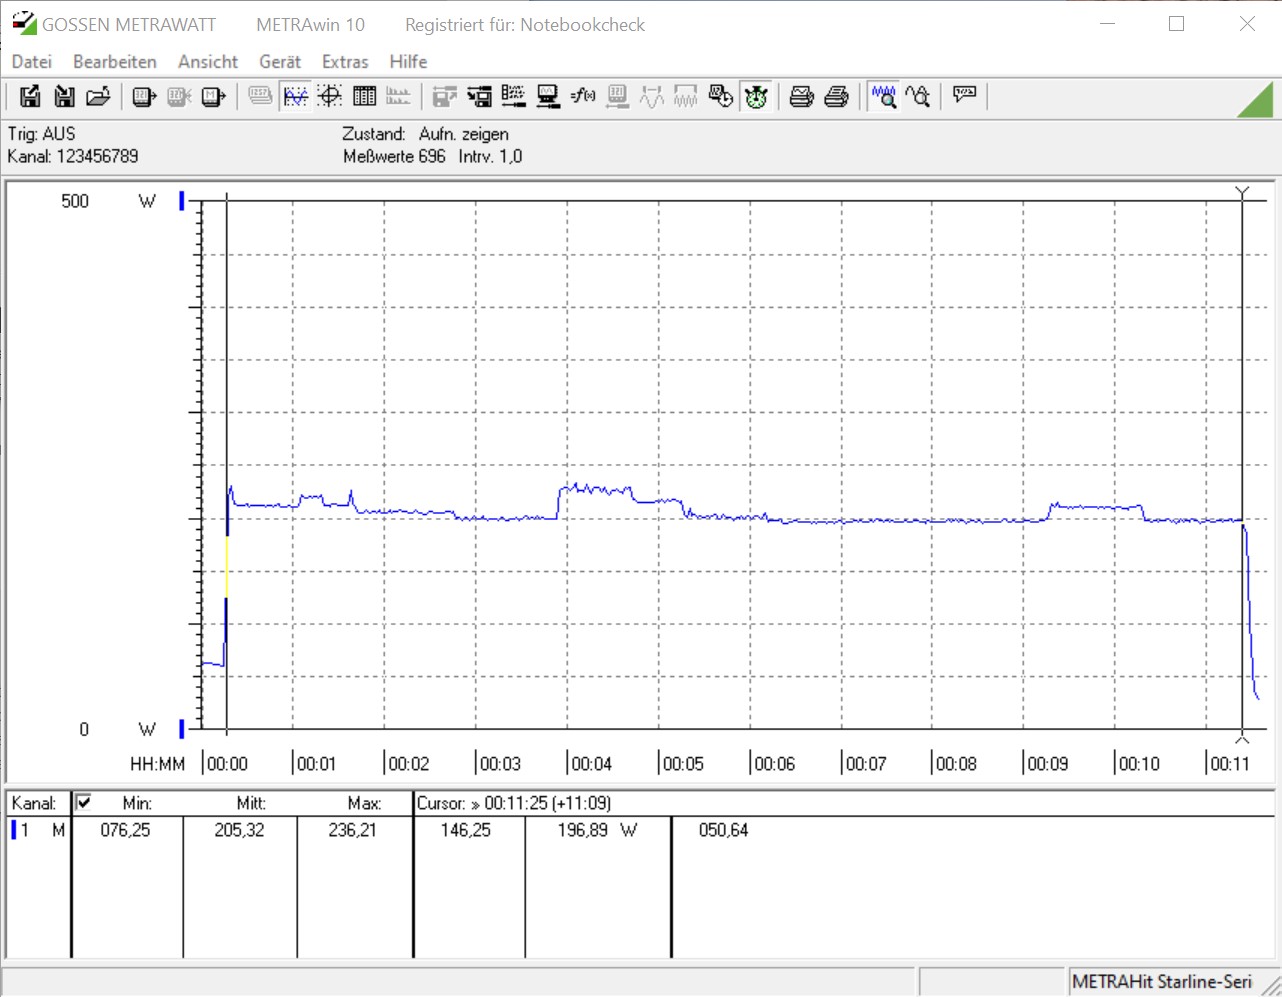
| Power Consumption | |
| 1920x1080 The Witcher 3 ultra (external Monitor) | |
| AMD Ryzen 9 3950X (Idle: 95 W) | |
| Intel Core i9-10900K (Idle: 52.3 W) | |
| Intel Core i5-10600K (Idle: 52.2 W) | |
| Intel Core i5 9400F (Idle: 57 W) | |
| Intel Ghost Canyon NUC (RTX 2070) (Idle: 33.1 W) | |
| Zotac ZBOX Magnus EN72070V (Idle: 25.7 W) | |
| Prime95 V2810 Stress (external Monitor) | |
| Intel Core i9-10900K (Idle: 52.3 W) | |
| Intel Core i5-10600K (Idle: 52.2 W) | |
| AMD Ryzen 9 3950X (Idle: 95 W) | |
| Intel Core i5 9400F (Idle: 57 W) | |
| Intel Ghost Canyon NUC (RTX 2070) (Idle: 33.1 W) | |
| Zotac ZBOX Magnus EN72070V (Idle: 25.7 W) | |
| Cinebench R15 Multi (external Monitor) | |
| Intel Core i9-10900K (Idle: 52.3 W) | |
| AMD Ryzen 9 3950X (Idle: 95 W) | |
| Intel Core i5-10600K (Idle: 52.2 W) | |
| Intel Core i5 9400F (Idle: 57 W) | |
| Zotac ZBOX Magnus EN72070V (Idle: 25.7 W) | |
| Temperatures - CPU Temperature Prime95 | |
| Intel Core i9-10900K | |
| Zotac ZBOX Magnus EN72070V | |
| AMD Ryzen 9 3950X | |
| Intel Core i5-10600K | |
| Intel Core i5 9400F | |
* ... Moindre est la valeur, meilleures sont les performances
Points positifs
Points négatifs
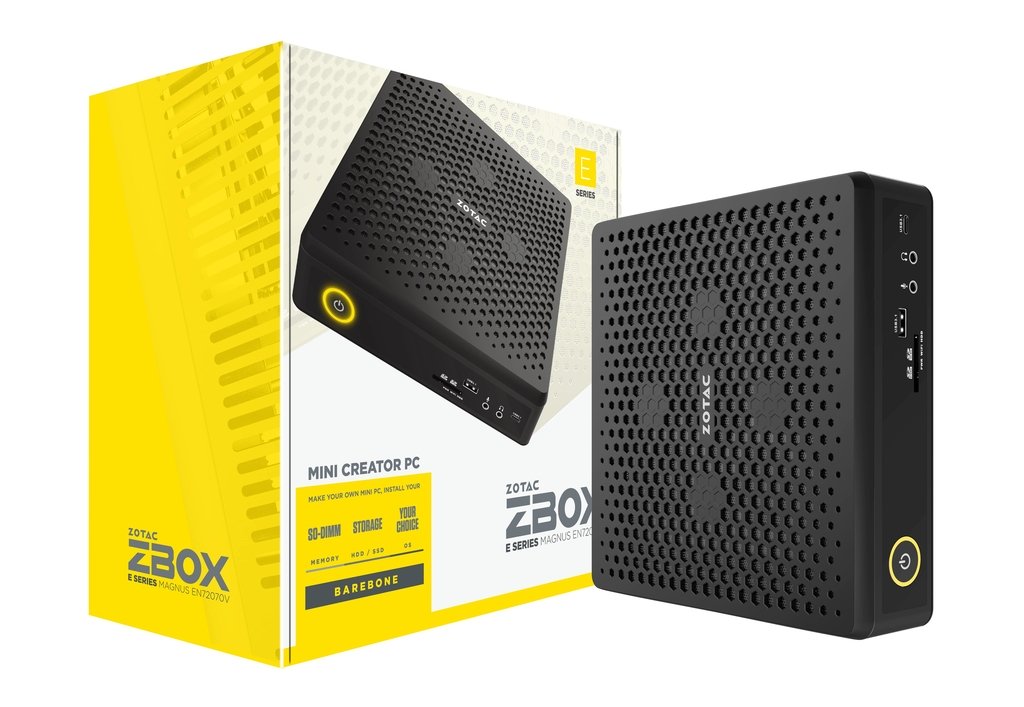
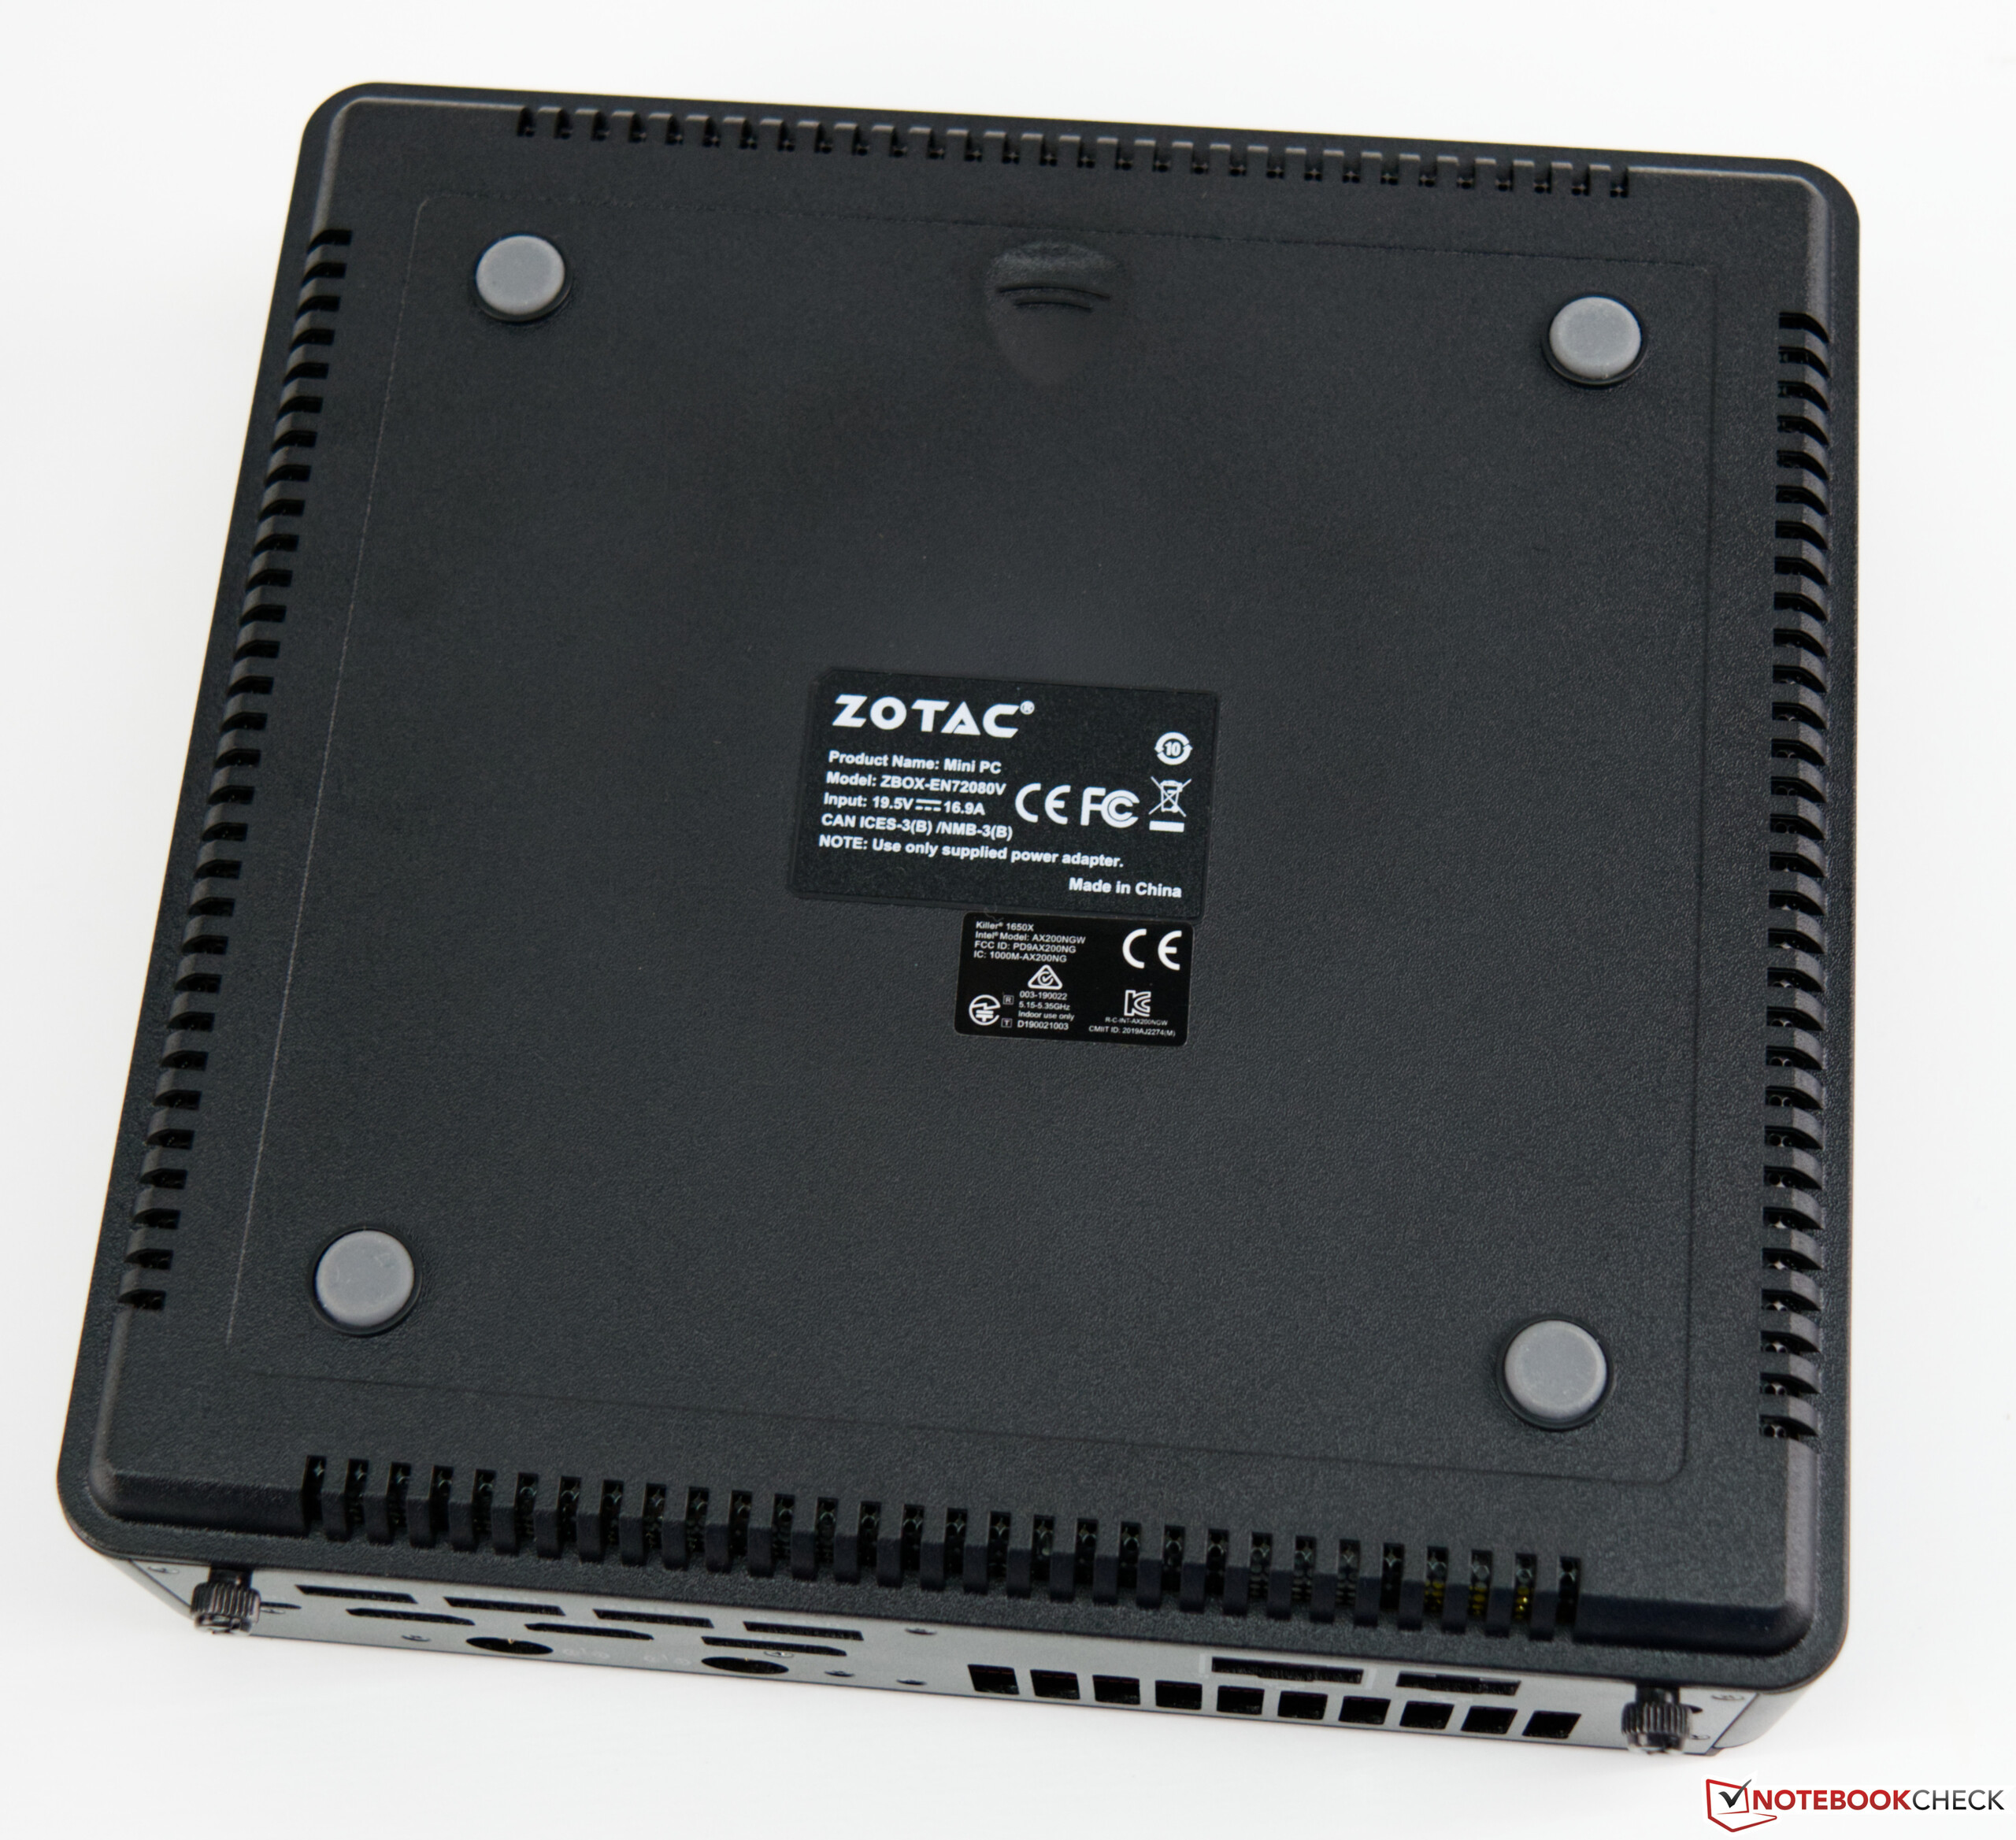
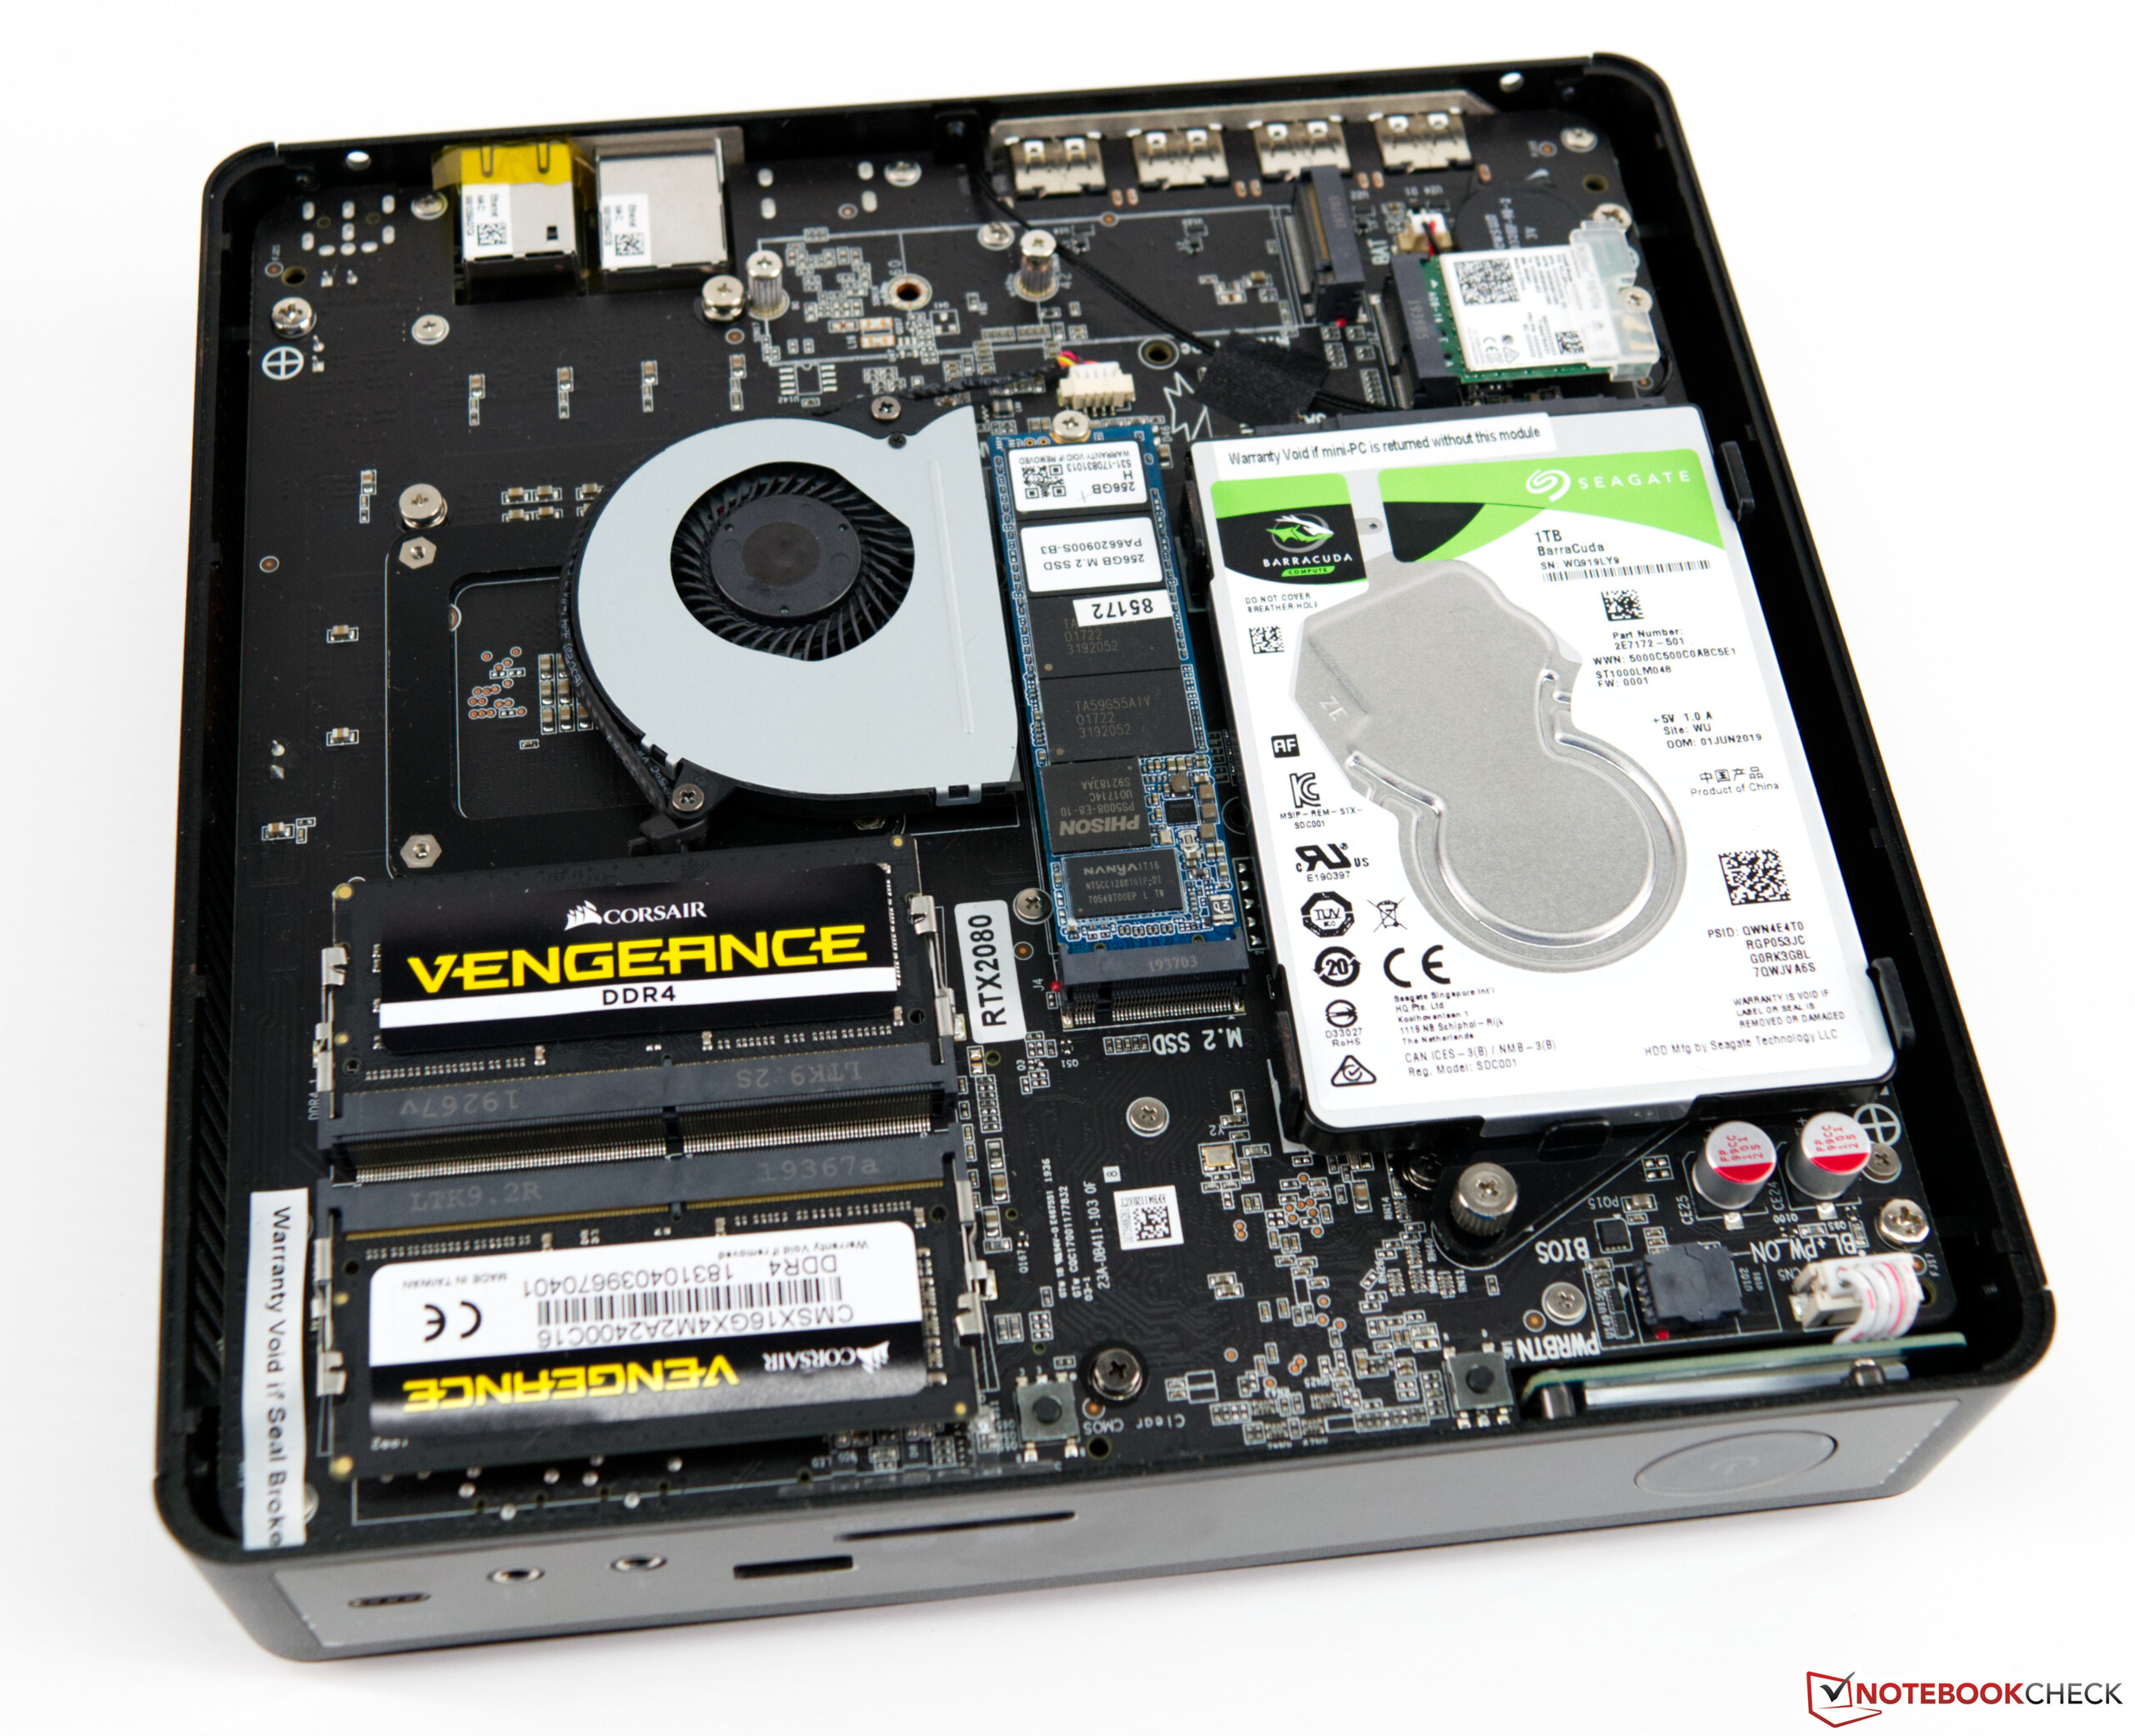
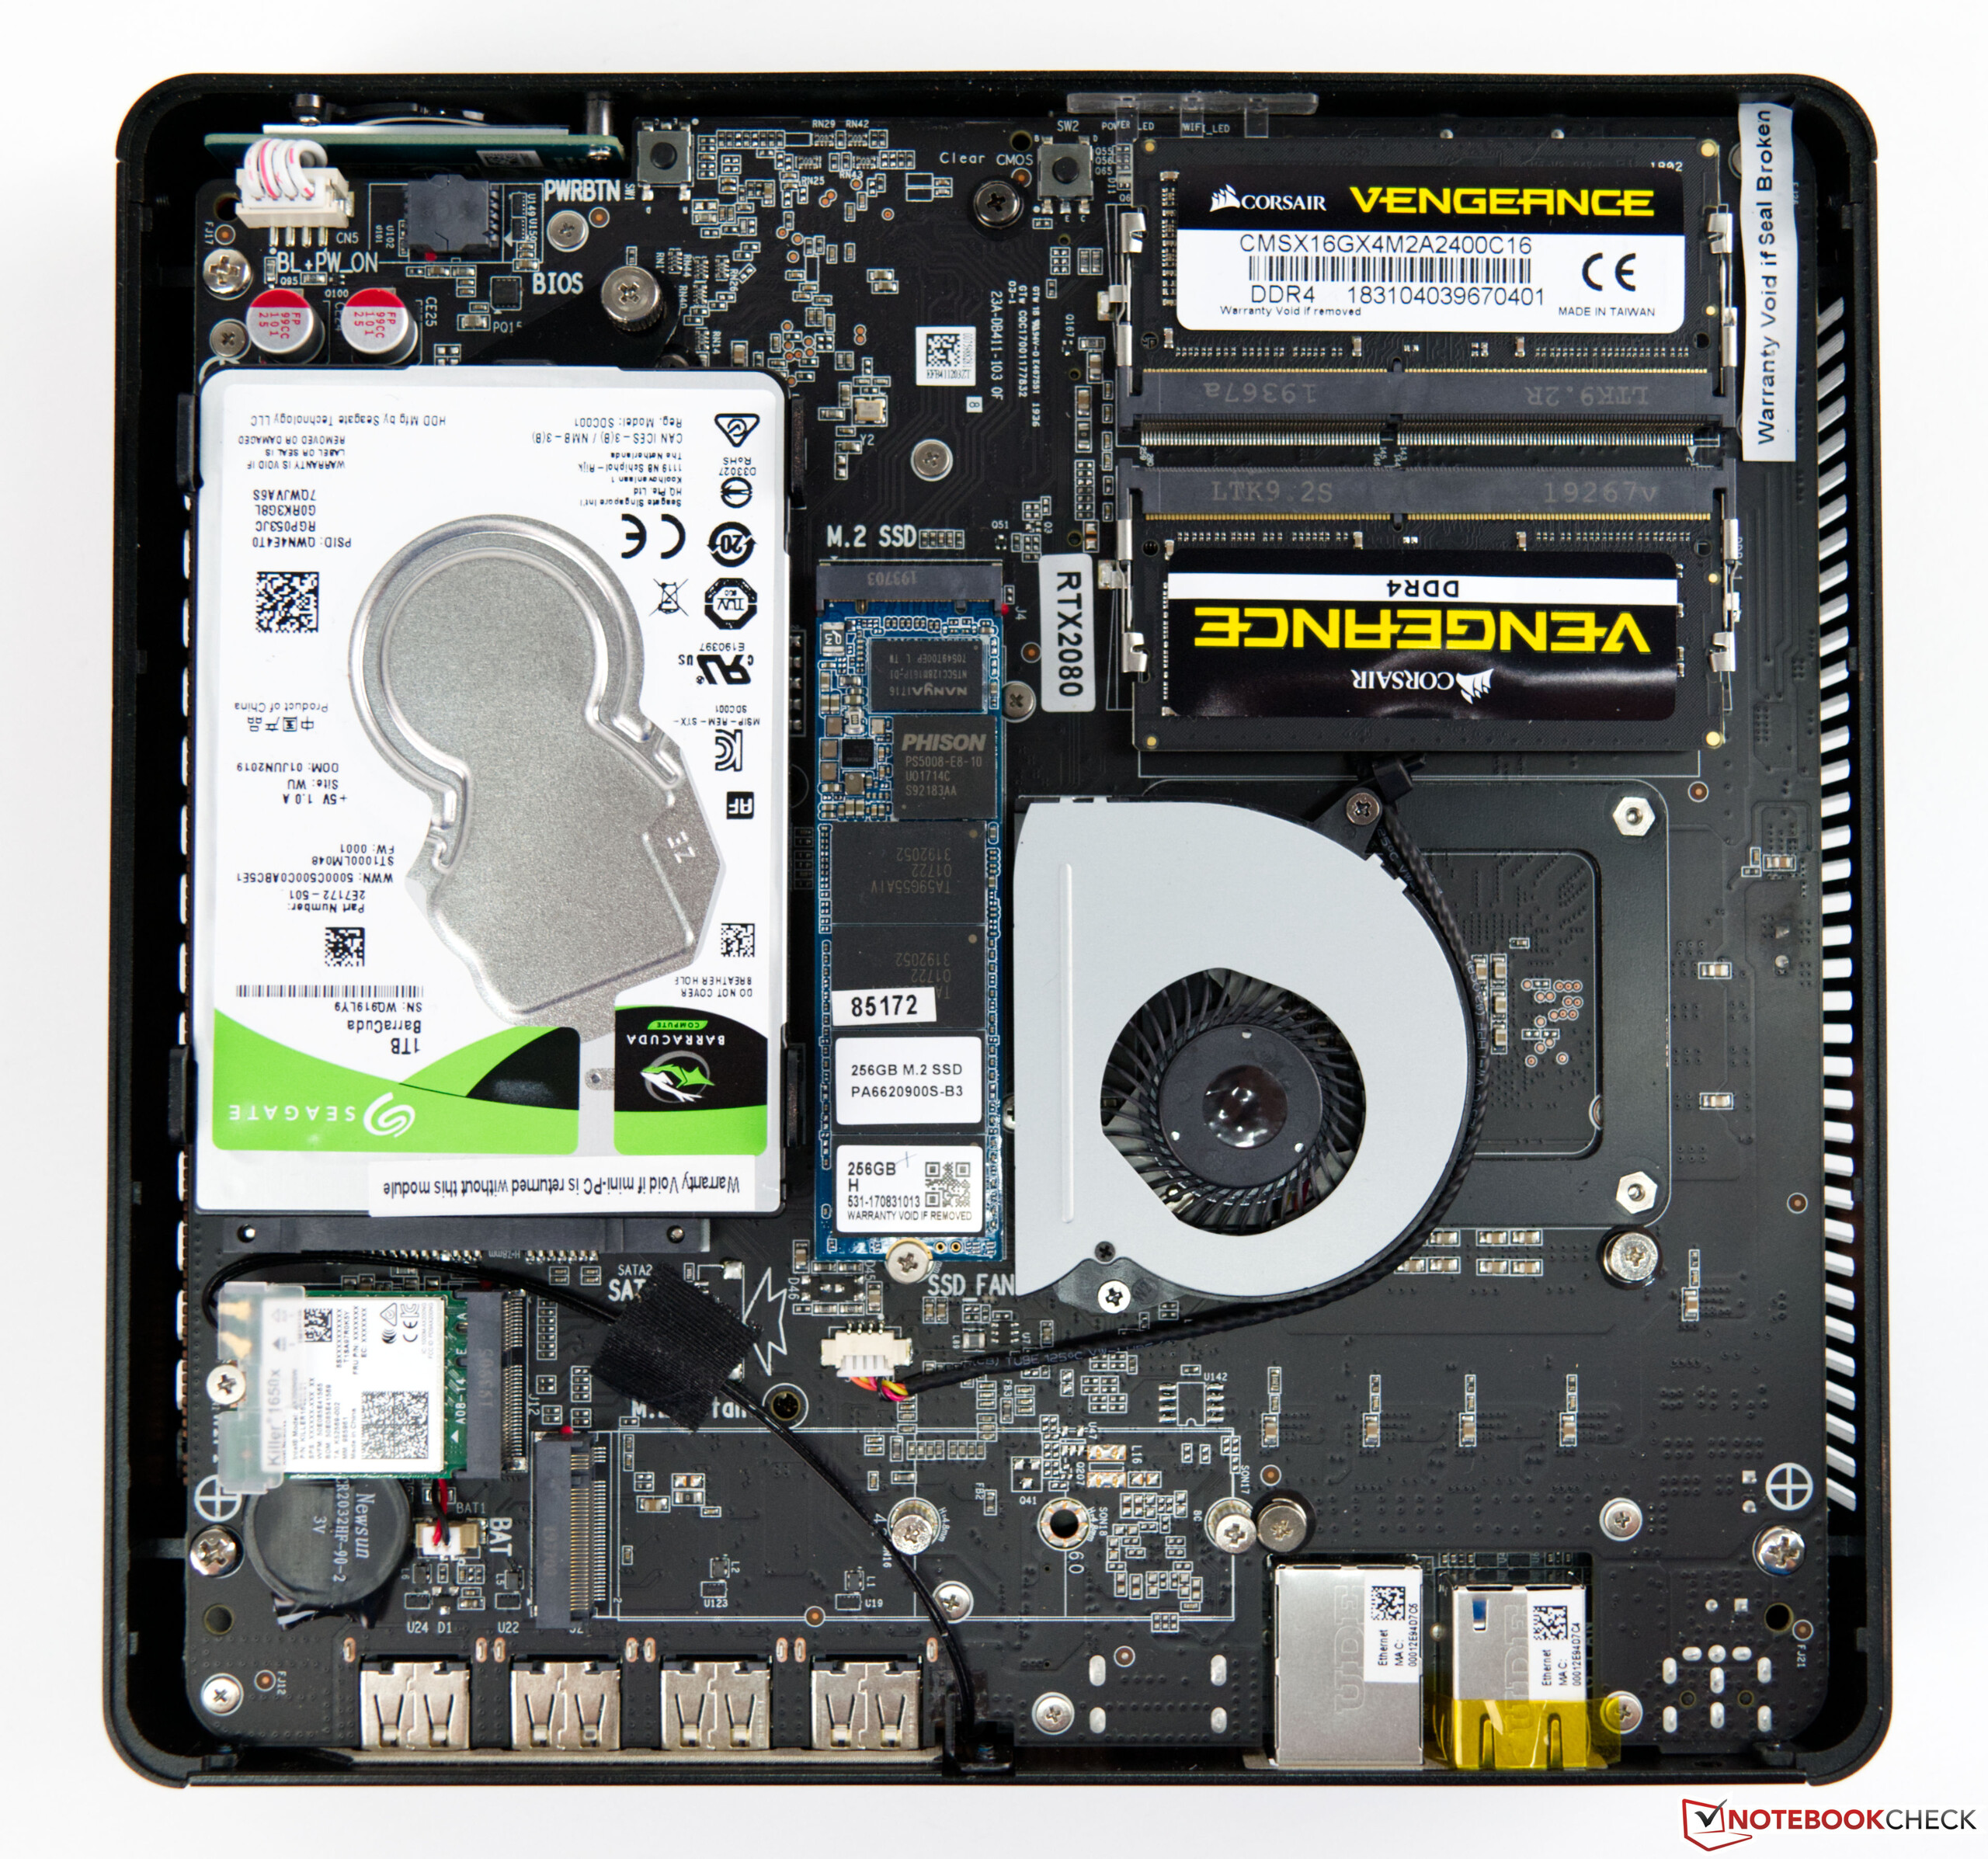
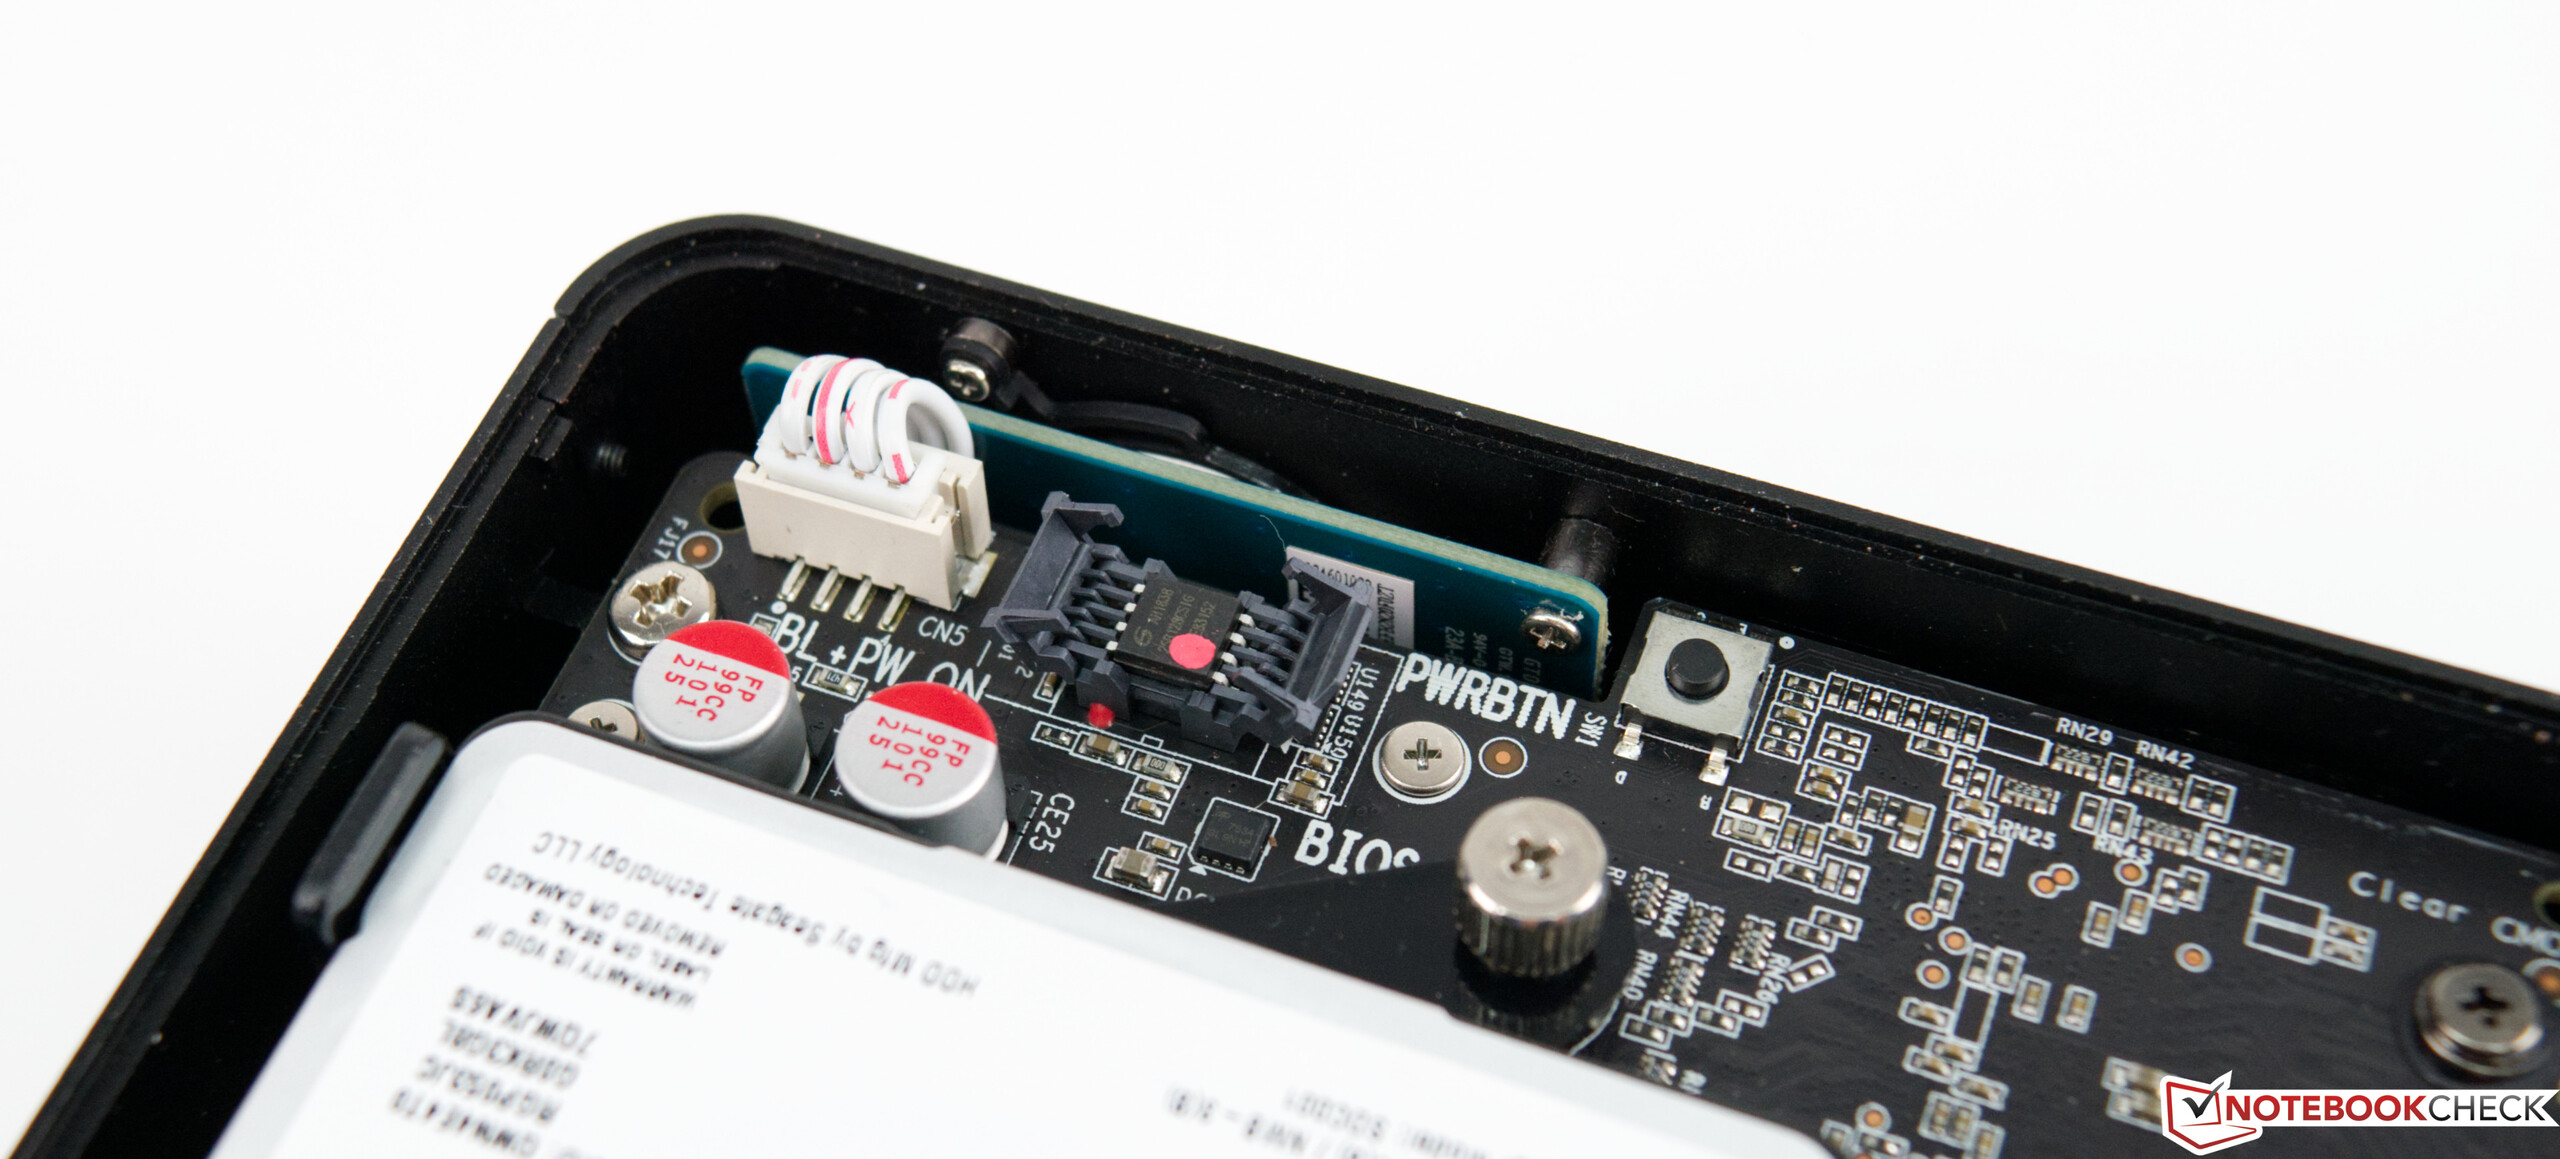
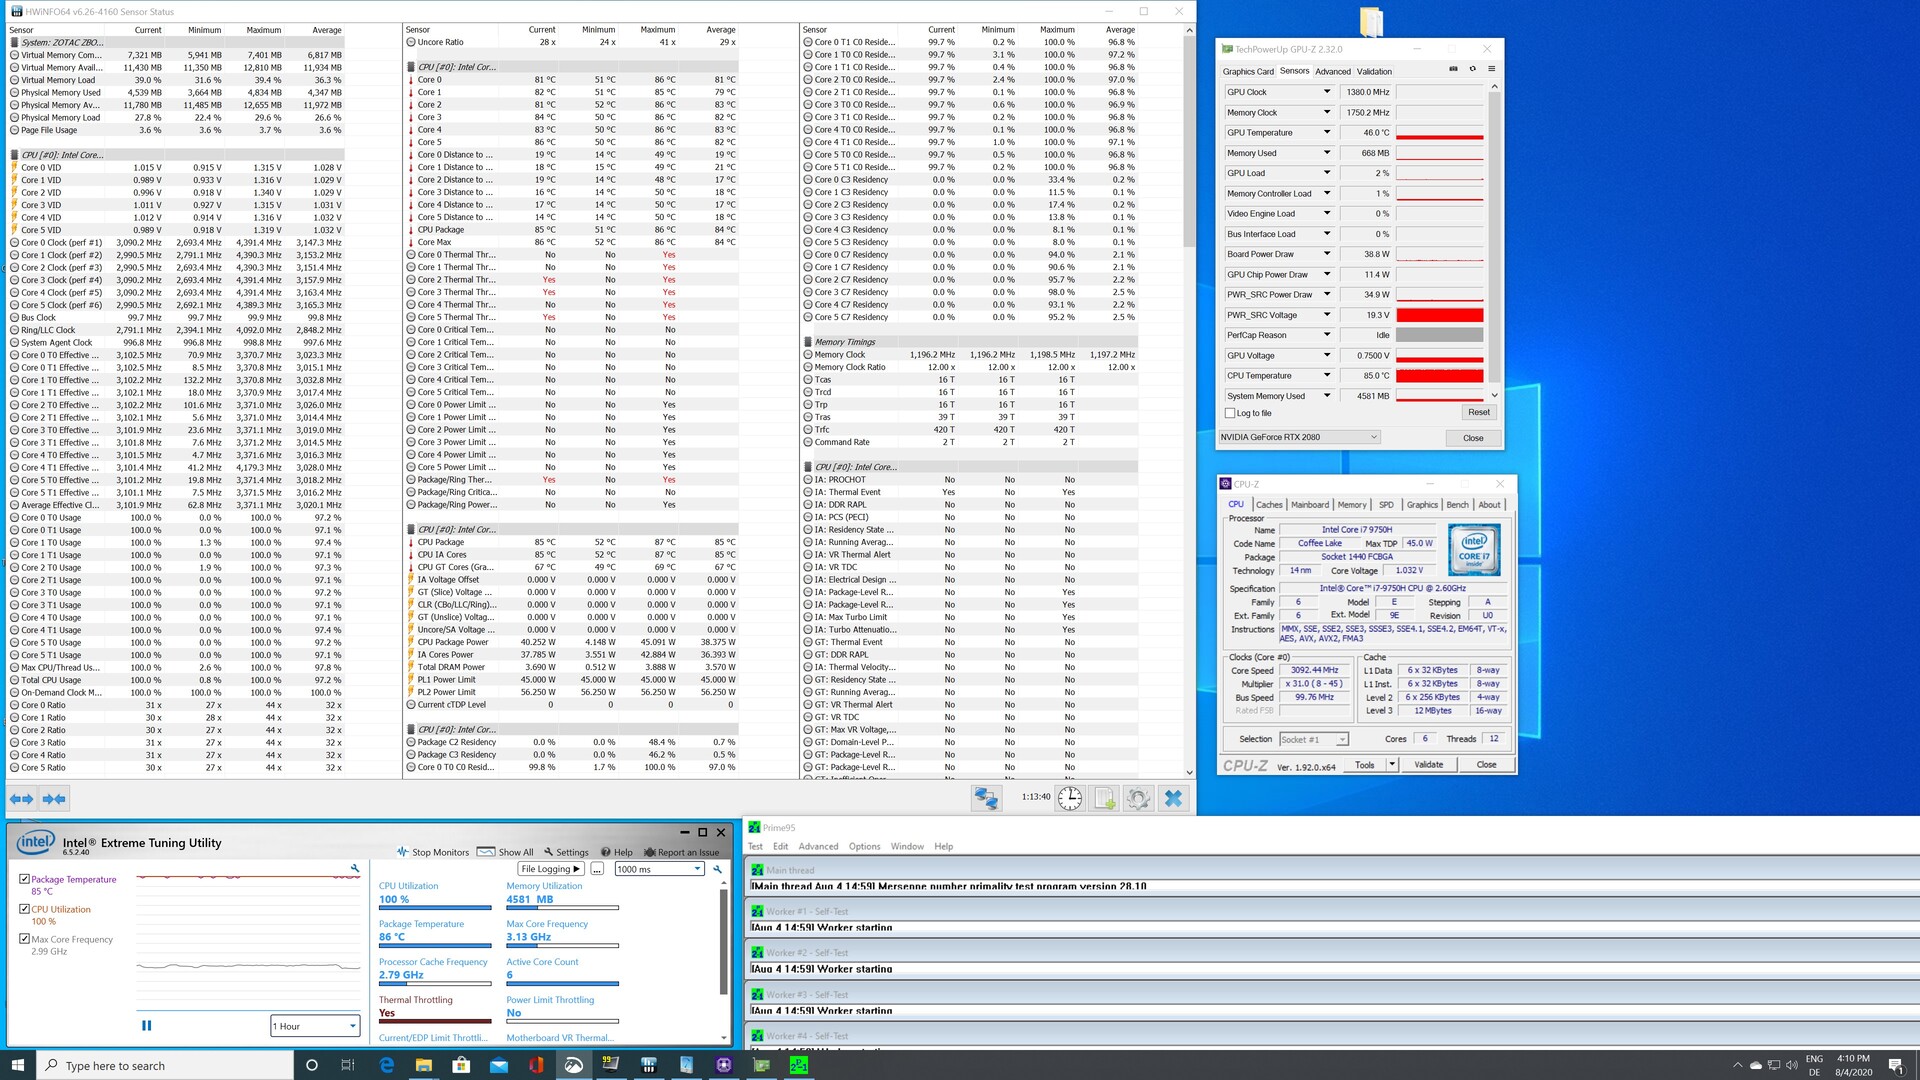
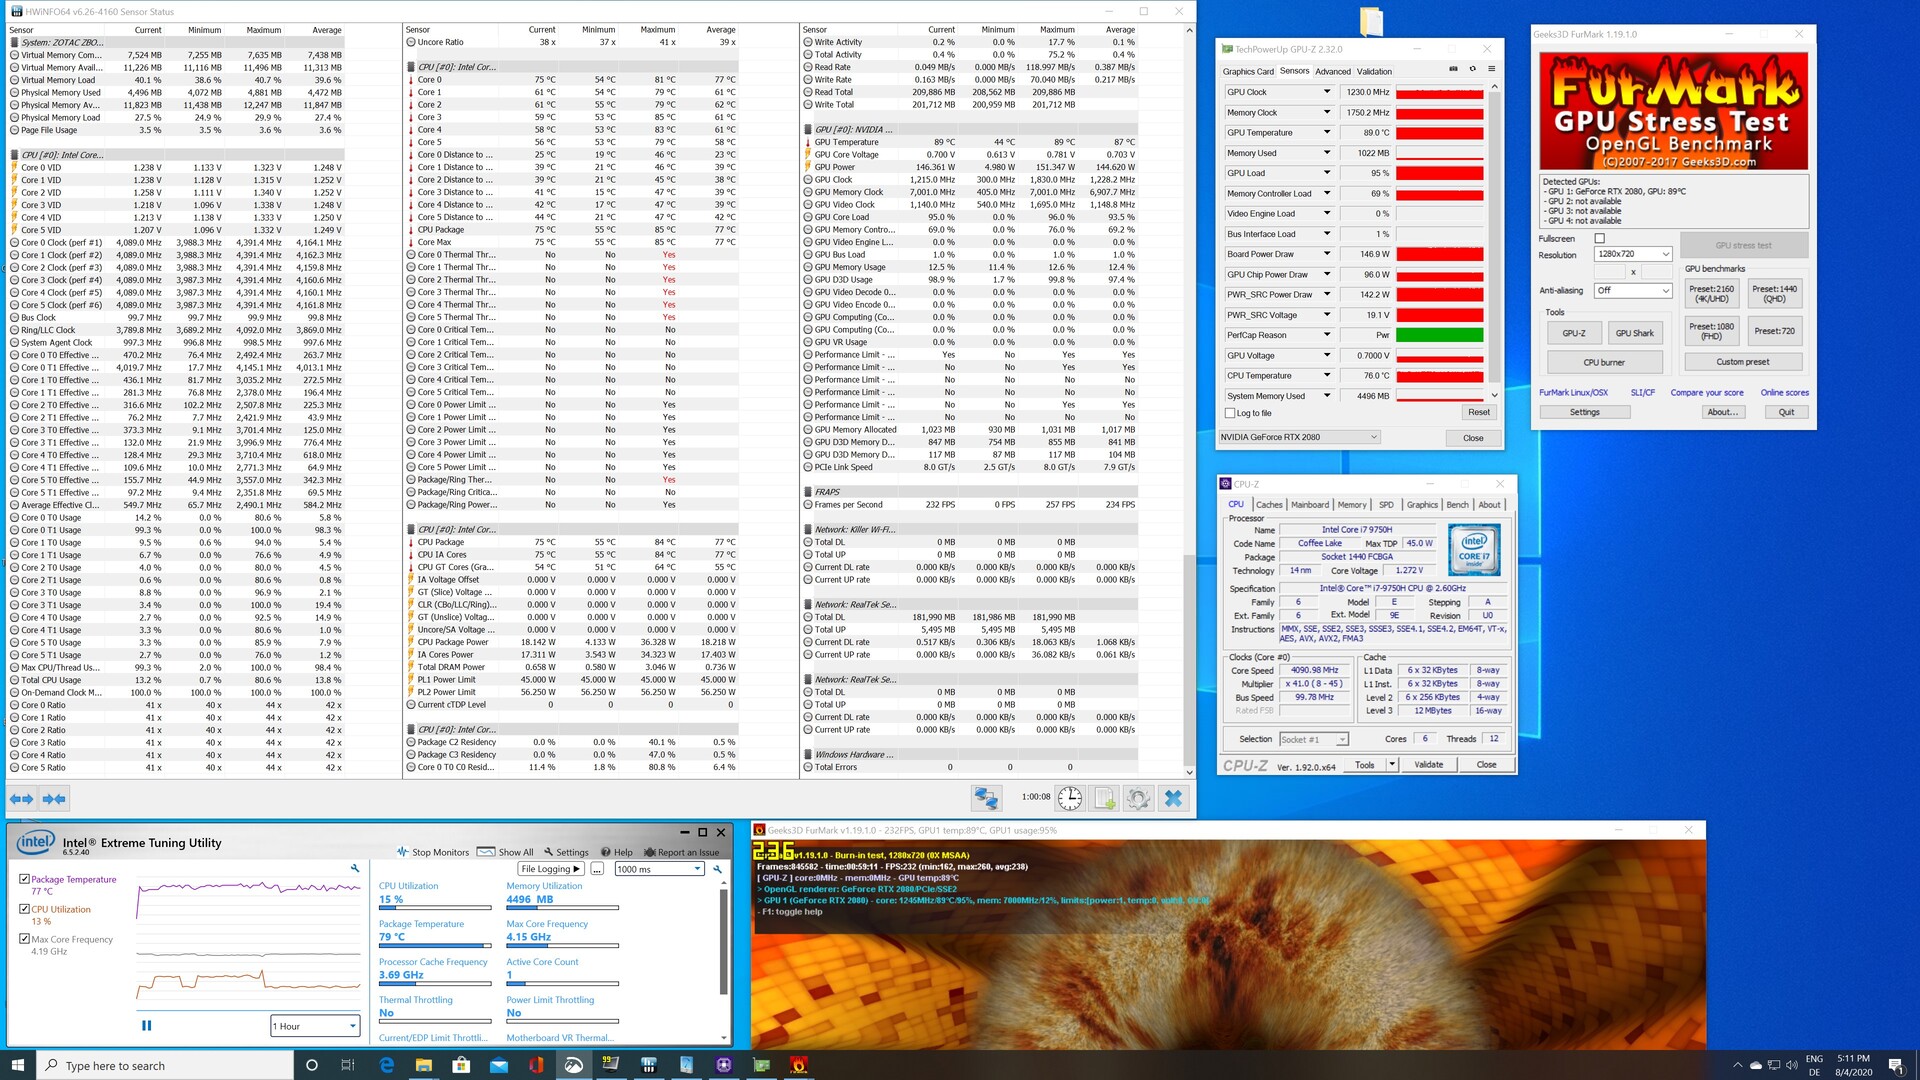
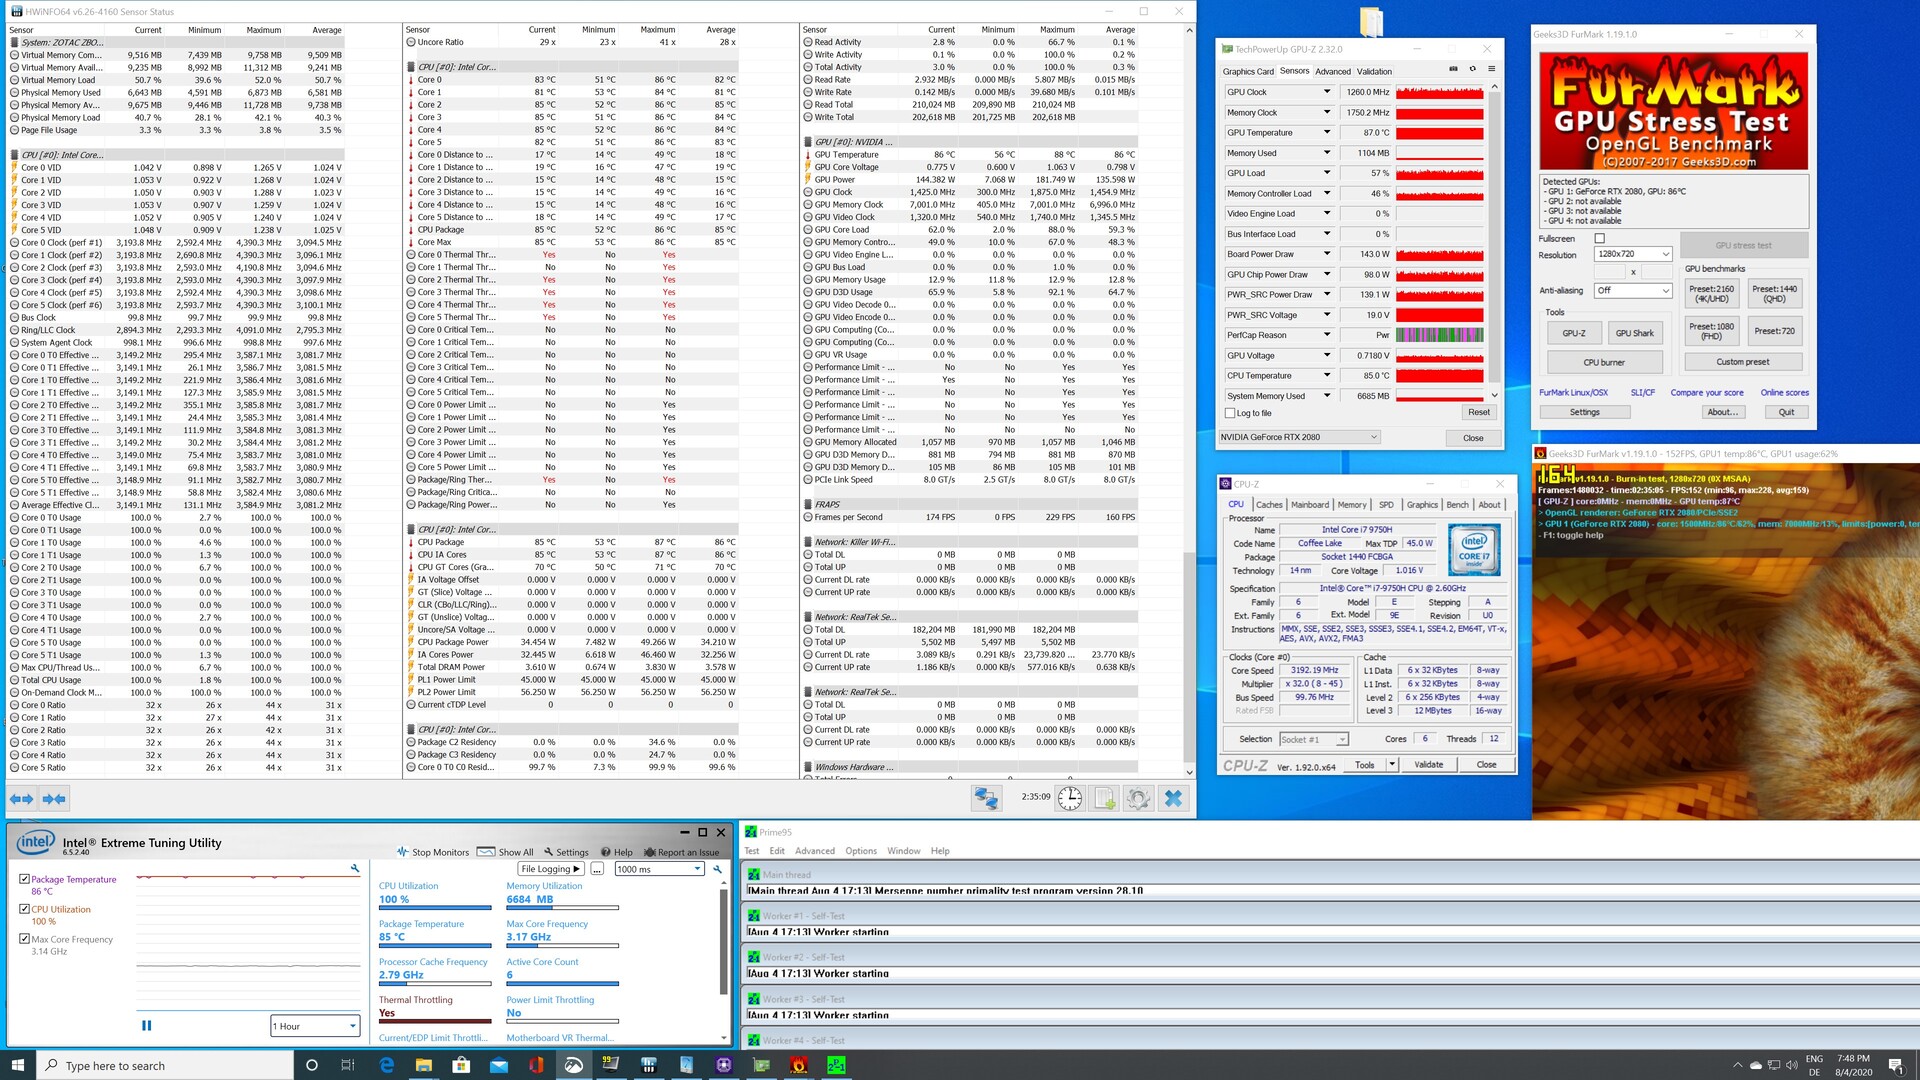
Le Zotac ZBOX Magnus n'est pas juste un PC pré à l'emploi, mais un système barebone, qui donne à l'utilisateur le choix des composants. Il est possible de choisir librement le stockage et le type de mémoire. Malheureusement, les utilisateurs sont ici contraints en ce qui concerne le processeur et la carte graphique, puisqu'il est impossible de changer ces composants après-coup.
Nous avons testé le ZBOX Magnus avec Intel Core i7-9750H et RTX 2080. Les performances brutes permettent de faire tourner fluidement tous les jeux récents sur ce petit PC, sans avoir à sacrifier les détails - mais il faut être en WQHD. Le ZBOX gère également bien la plupart des jeux en UHD, même s'il faut alors souvent réduire les détails. A noter, la GeForce RTX 2080 Mobile fournit à peu près le même niveau de performances qu'une GeForce RTX 2070 de bureau.
Le Zotac ZBOX Magnus est un mini PC de jeu puissant. Mais avant de l'acheter, il faut être prêt à s'accoutumer aux particularités d'un système barebone.
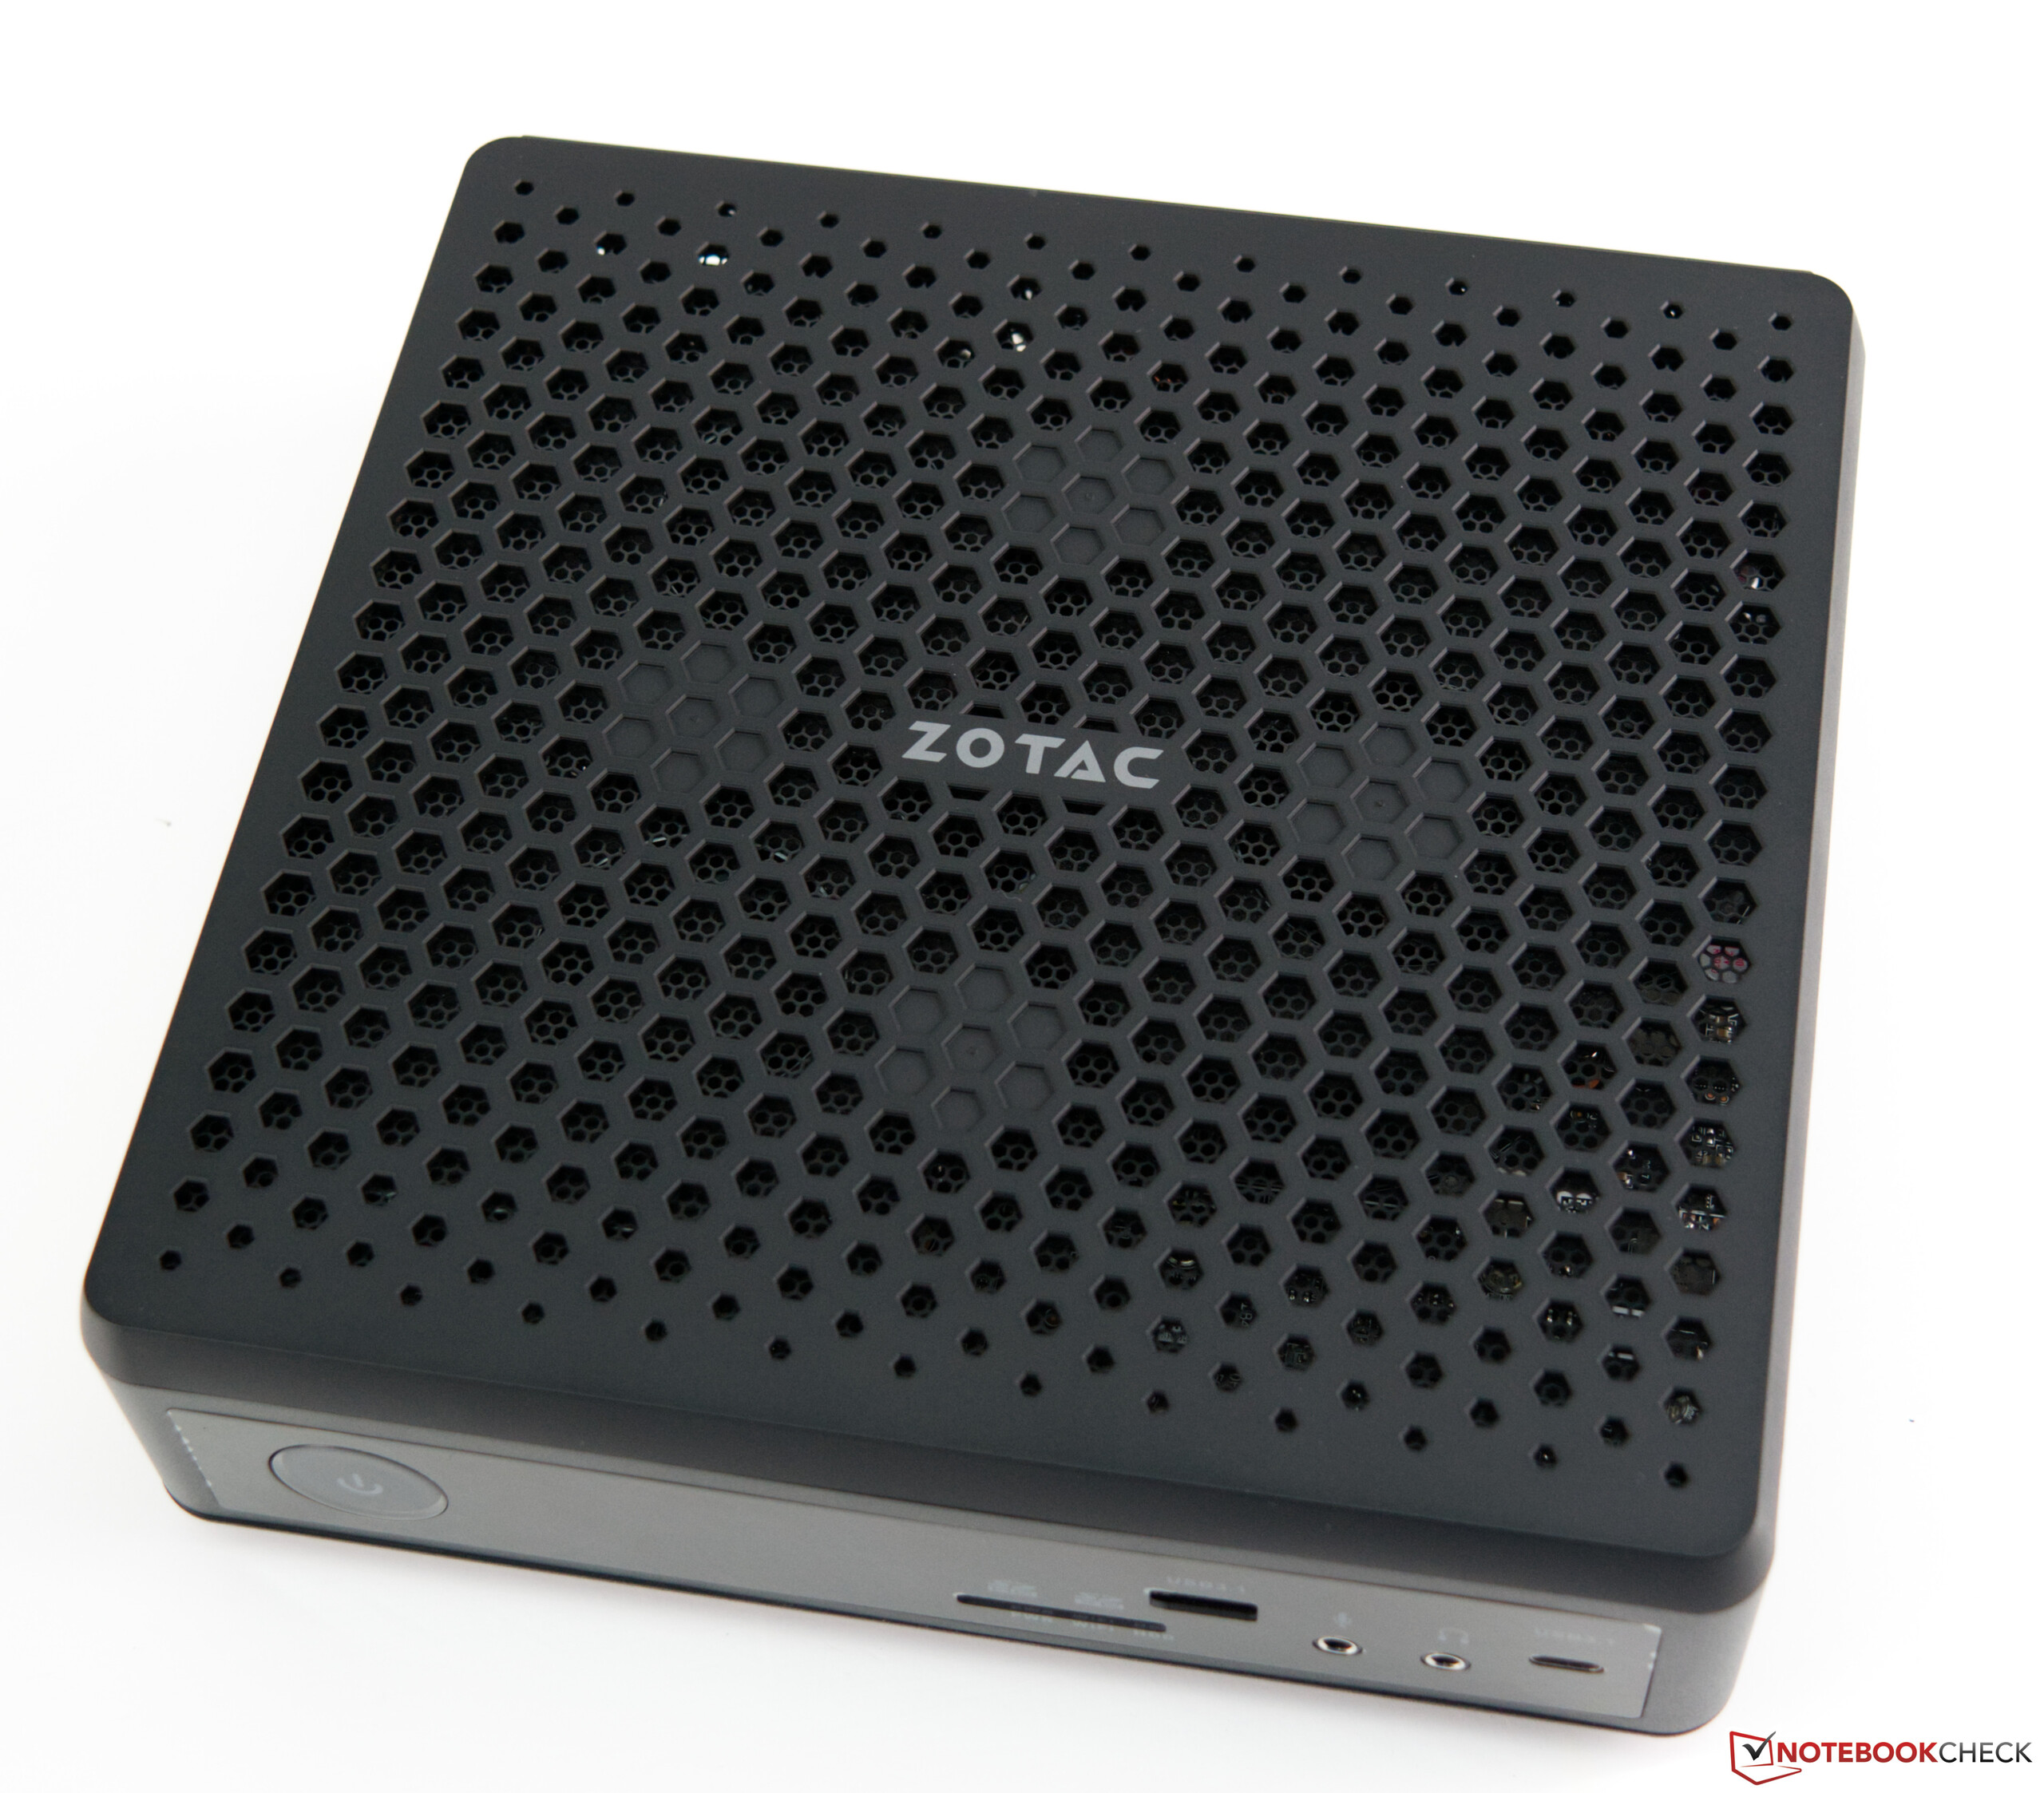
L'appareil est très intéressant en ce qui concerne sa taille. Les appareils très compact sont souvent très bruyants et souffrent d'une chauffe élevée. Dans l'ensemble, Zotac gère très bien le problème de la chauffe, et le niveau sonore en cas de sollicitations est également bon, à juste moins de 39 dB(A).
Ceux qui voudraient investir 1700 € dans ce système barebone connaissent maintenant les forces et les faiblesses du ZBOX Magnus. Au regard du prix, Intel avec le NUC Ghost Canyon et Zotac avec le ZBOX Magnus ne sont pas indulgents. Mais l'on peut considérer que le Ghost Canyon n'inclut pas de carte graphique dédiée dans le prix - le Zotac prend donc l'avantage sur ce terrain.
L’intégralité de cette critique est disponible en anglais en suivant ce lien.
