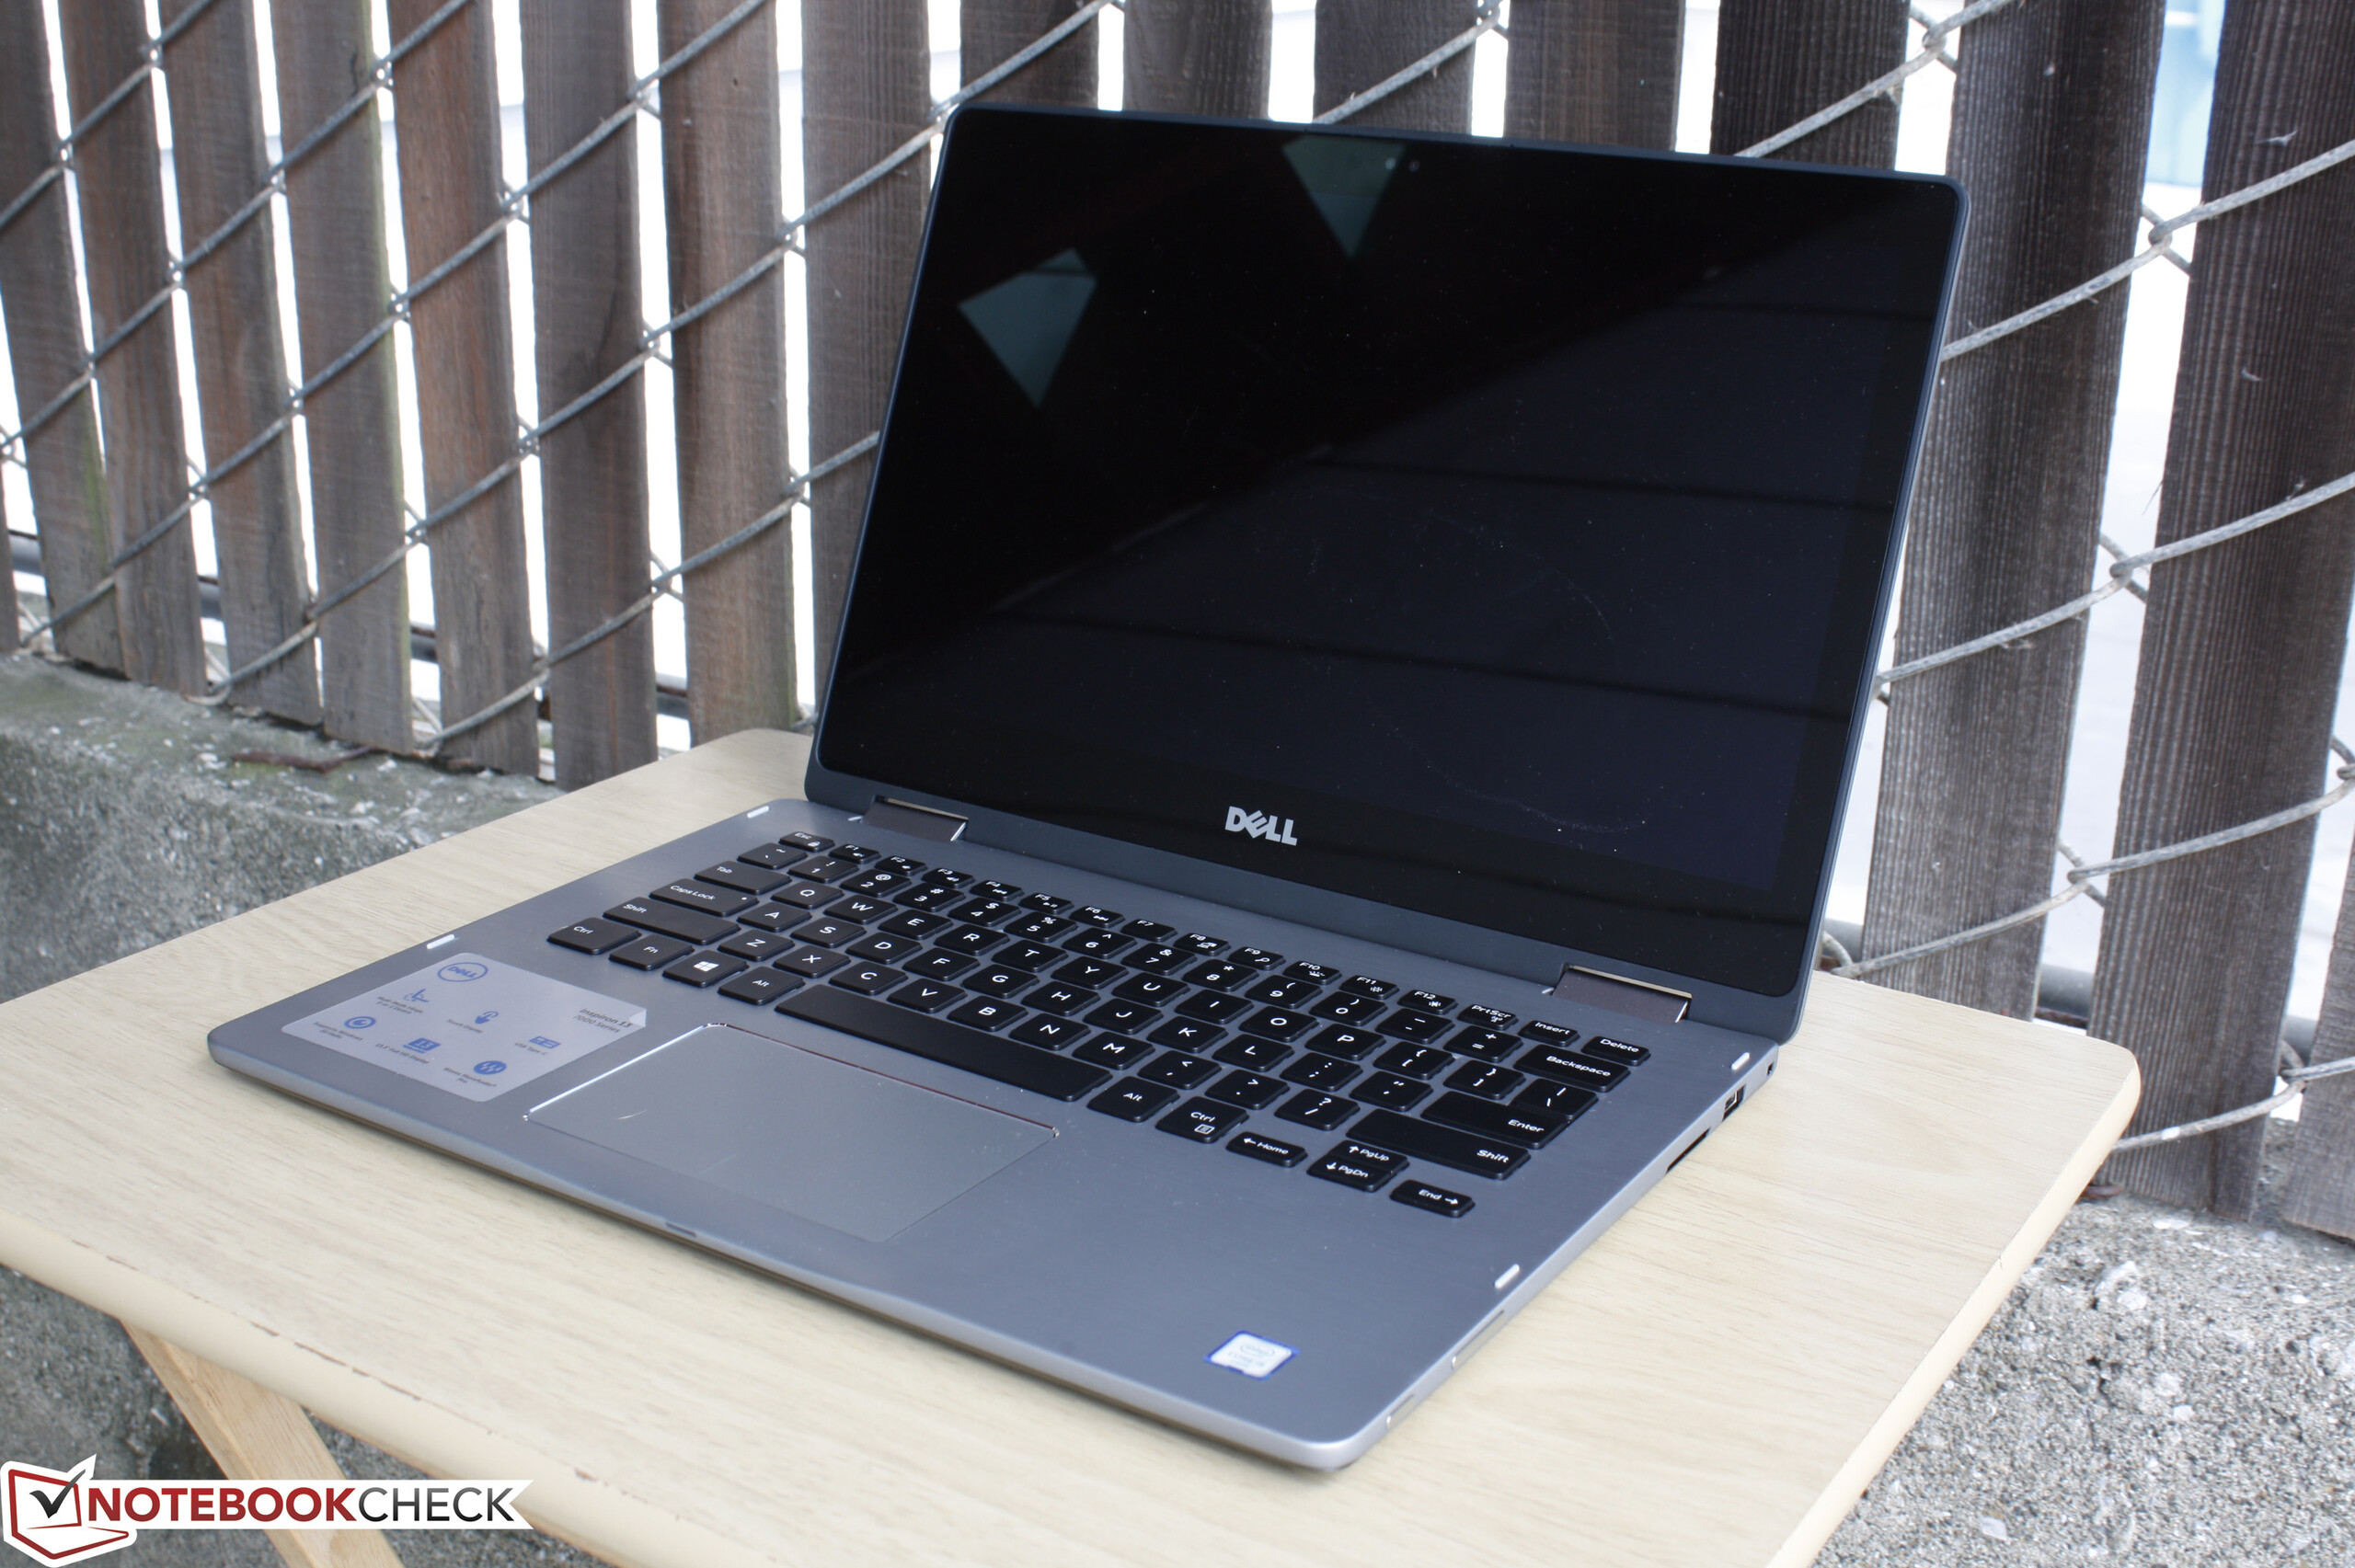
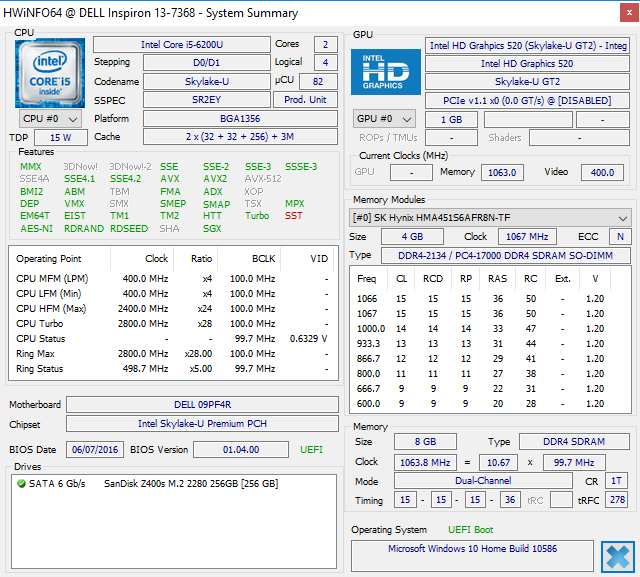
Courte critique du PC convertible Dell Inspiron 13 7368
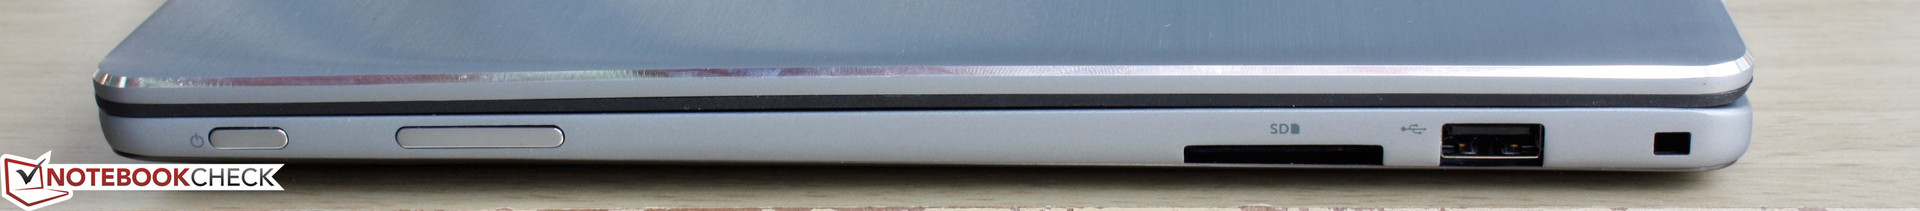
| SD Card Reader | |
| average JPG Copy Test (av. of 3 runs) | |
| Dell XPS 13 2016 9350 (FHD, i7-6560U) | |
| Apple MacBook Pro Retina 13 inch 2013-10 | |
| Lenovo IdeaPad 710S-13ISK 80SW0031US | |
| Dell Inspiron 13 7386 | |
| maximum AS SSD Seq Read Test (1GB) | |
| Dell XPS 13 2016 9350 (FHD, i7-6560U) | |
| Lenovo IdeaPad 710S-13ISK 80SW0031US | |
| Dell Inspiron 13 7386 | |
| |||||||||||||||||||||||||
Homogénéité de la luminosité: 91 %
Valeur mesurée au centre, sur batterie: 226.4 cd/m²
Contraste: 858:1 (Valeurs des noirs: 0.264 cd/m²)
ΔE ColorChecker Calman: 4.96 | ∀{0.5-29.43 Ø4.71}
ΔE Greyscale Calman: 3.71 | ∀{0.09-98 Ø4.96}
60.5% sRGB (Argyll 1.6.3 3D)
38.6% AdobeRGB 1998 (Argyll 1.6.3 3D)
42.19% AdobeRGB 1998 (Argyll 3D)
61.1% sRGB (Argyll 3D)
40.82% Display P3 (Argyll 3D)
Gamma: 2.18
CCT: 7215 K
| Dell Inspiron 13 7386 IPS, 13.3", 1920x1080 | Acer Aspire R13 R7-372T-746N Sharp LQ133T1JW02, IPS, 13.3", 2560x1440 | Dell Inspiron 13-7348 IPS, 13.3", 1920x1080 | HP Spectre x360 13-4104ng LG Philips LGD0000, IPS, 13.3", 2560x1440 | Lenovo Yoga 900-13ISK 80MK IPS, 13.3", 3200x1800 | Microsoft Surface Book Core i5 IPS, 13.5", 3000x2000 | |
|---|---|---|---|---|---|---|
| Display | 66% | 57% | 59% | 51% | 61% | |
| Display P3 Coverage (%) | 40.82 | 69.6 71% | 65.2 60% | 66.8 64% | 63.2 55% | 67 64% |
| sRGB Coverage (%) | 61.1 | 98 60% | 93.5 53% | 92.8 52% | 88.7 45% | 95.8 57% |
| AdobeRGB 1998 Coverage (%) | 42.19 | 70.7 68% | 67.1 59% | 67.3 60% | 64.9 54% | 68.9 63% |
| Response Times | 17% | 46% | 27% | 1% | ||
| Response Time Grey 50% / Grey 80% * (ms) | 56 ? | 36 ? 36% | 24 ? 57% | 38.8 ? 31% | 48.4 ? 14% | |
| Response Time Black / White * (ms) | 29.2 ? | 30 ? -3% | 19 ? 35% | 22.4 ? 23% | 32.8 ? -12% | |
| PWM Frequency (Hz) | 203.3 ? | 1000 ? | 1316 | |||
| Screen | 42% | -11% | 19% | -2% | 56% | |
| Brightness middle (cd/m²) | 226.4 | 320 41% | 375 66% | 324 43% | 319.8 41% | 430.9 90% |
| Brightness (cd/m²) | 218 | 308 41% | 351 61% | 324 49% | 302 39% | 410 88% |
| Brightness Distribution (%) | 91 | 91 0% | 89 -2% | 90 -1% | 88 -3% | 93 2% |
| Black Level * (cd/m²) | 0.264 | 0.17 36% | 0.44 -67% | 0.34 -29% | 0.835 -216% | 0.254 4% |
| Contrast (:1) | 858 | 1882 119% | 852 -1% | 953 11% | 383 -55% | 1696 98% |
| Colorchecker dE 2000 * | 4.96 | 3.18 36% | 7.37 -49% | 4.36 12% | 2.68 46% | 2.06 58% |
| Colorchecker dE 2000 max. * | 13 | 9.91 24% | ||||
| Greyscale dE 2000 * | 3.71 | 4.13 -11% | 9.54 -157% | 4.62 -25% | 2.35 37% | 2.22 40% |
| Gamma | 2.18 101% | 2.03 108% | 2.69 82% | 2.18 101% | 2.09 105% | 2.13 103% |
| CCT | 7215 90% | 6752 96% | 6685 97% | 6857 95% | 6975 93% | 6520 100% |
| Color Space (Percent of AdobeRGB 1998) (%) | 38.6 | 65 68% | 61 58% | 60 55% | 57 48% | 64 66% |
| Color Space (Percent of sRGB) (%) | 60.5 | 98 62% | 93 54% | 88 45% | 96 59% | |
| Moyenne finale (programmes/paramètres) | 42% /
43% | 23% /
7% | 41% /
31% | 25% /
14% | 39% /
49% |
* ... Moindre est la valeur, meilleures sont les performances
Temps de réponse de l'écran
| ↔ Temps de réponse noir à blanc | ||
|---|---|---|
| 29.2 ms ... hausse ↗ et chute ↘ combinées | ↗ 7.6 ms hausse | 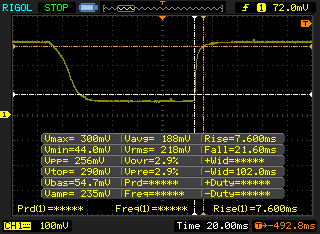 |
| ↘ 21.6 ms chute | ||
| L'écran souffre de latences relativement élevées, insuffisant pour le jeu. En comparaison, tous les appareils testés affichent entre 0.1 (minimum) et 240 (maximum) ms. » 78 % des appareils testés affichent de meilleures performances. Cela signifie que les latences relevées sont moins bonnes que la moyenne (19.8 ms) de tous les appareils testés. | ||
| ↔ Temps de réponse gris 50% à gris 80% | ||
| 56 ms ... hausse ↗ et chute ↘ combinées | ↗ 22.8 ms hausse | 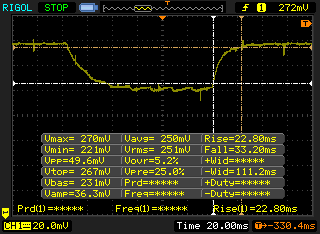 |
| ↘ 33.2 ms chute | ||
| L'écran souffre de latences très élevées, à éviter pour le jeu. En comparaison, tous les appareils testés affichent entre 0.165 (minimum) et 636 (maximum) ms. » 93 % des appareils testés affichent de meilleures performances. Cela signifie que les latences relevées sont moins bonnes que la moyenne (31 ms) de tous les appareils testés. | ||
Scintillement / MLI (Modulation de largeur d'impulsion)
| Scintillement / MLI (Modulation de largeur d'impulsion) décelé | 203.3 Hz | ≤ 99 Niveau de luminosité | 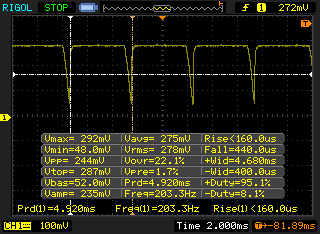 |
Le rétroéclairage de l'écran scintille à la fréquence de 203.3 Hz (certainement du fait de l'utilisation d'une MDI - Modulation de largeur d'impulsion) à un niveau de luminosité inférieur ou égal à 99 % . Aucun scintillement ne devrait être perceptible au-dessus de cette valeur. La fréquence de rafraîchissement de 203.3 Hz est relativement faible, les personnes les plus sensibles devraient percevoir un scintillement et être sujettes à une fatigue oculaire accrue (avec le niveau de luminosité indiqué) En comparaison, 52 % des appareils testés n'emploient pas MDI pour assombrir leur écran. Nous avons relevé une moyenne à 7754 (minimum : 5 - maximum : 343500) Hz dans le cas où une MDI était active. | |||
* ... Moindre est la valeur, meilleures sont les performances
| PCMark 8 Home Score Accelerated v2 | 3223 points | |
| PCMark 8 Creative Score Accelerated v2 | 4072 points | |
| PCMark 8 Work Score Accelerated v2 | 4343 points | |
Aide | ||
| Dell Inspiron 13 7386 SanDisk Z400s 256 GB M.2 2280 | Acer Aspire R13 R7-372T-746N Lite-On CV1-8B256 | Dell Inspiron 13-7348 Samsung PM851 Series MZMTE256HMHP | HP Spectre 13-4001ng x360 ADATA AXNS381E-256GM-B | Lenovo Yoga 900-13ISK 80MK Samsung SSD PM871 MZNLN512HCJH | Microsoft Surface Book Core i7 Samsung MZFLV512 NVMe | |
|---|---|---|---|---|---|---|
| CrystalDiskMark 3.0 | 27% | 22% | 22% | 37% | 120% | |
| Read Seq (MB/s) | 493.5 | 507 3% | 514 4% | 475.6 -4% | 514 4% | 953 93% |
| Write Seq (MB/s) | 329.4 | 354.4 8% | 268 -19% | 288.6 -12% | 459.5 39% | 592 80% |
| Read 512 (MB/s) | 289.8 | 355.3 23% | 411.8 42% | 322.9 11% | 413.4 43% | 520 79% |
| Write 512 (MB/s) | 304.1 | 353.9 16% | 268.6 -12% | 285.2 -6% | 424.5 40% | 591 94% |
| Read 4k (MB/s) | 19.62 | 32.66 66% | 26.94 37% | 31.87 62% | 36.34 85% | 42.66 117% |
| Write 4k (MB/s) | 72.3 | 81.6 13% | 74.5 3% | 102.7 42% | 100.1 38% | 136.3 89% |
| Read 4k QD32 (MB/s) | 147.8 | 277.6 88% | 325.9 121% | 276.7 87% | 313.8 112% | 615 316% |
| Write 4k QD32 (MB/s) | 268 | 261.2 -3% | 266.7 0% | 261.6 -2% | 96.8 -64% | 517 93% |

| 3DMark 11 | |
| 1280x720 Performance GPU (Classer selon les valeurs) | |
| Dell Inspiron 13 7386 | |
| Acer TravelMate P278-MG-76L2 | |
| Toshiba Tecra Z40-C-11F | |
| Dell Latitude 3470 N2P7L347014EMEA | |
| Fujitsu Lifebook E544 | |
| Asus Transformer Book T300LA-C4006H | |
| 1280x720 Performance Combined (Classer selon les valeurs) | |
| Dell Inspiron 13 7386 | |
| Acer TravelMate P278-MG-76L2 | |
| Toshiba Tecra Z40-C-11F | |
| Dell Latitude 3470 N2P7L347014EMEA | |
| Fujitsu Lifebook E544 | |
| Asus Transformer Book T300LA-C4006H | |
| 3DMark | |
| 1280x720 Cloud Gate Standard Graphics (Classer selon les valeurs) | |
| Dell Inspiron 13 7386 | |
| Acer TravelMate P278-MG-76L2 | |
| Toshiba Tecra Z40-C-11F | |
| Dell Latitude 3470 N2P7L347014EMEA | |
| Fujitsu Lifebook E544 | |
| Asus Transformer Book T300LA-C4006H | |
| 1920x1080 Fire Strike Graphics (Classer selon les valeurs) | |
| Dell Inspiron 13 7386 | |
| Acer TravelMate P278-MG-76L2 | |
| Toshiba Tecra Z40-C-11F | |
| Dell Latitude 3470 N2P7L347014EMEA | |
| Asus Transformer Book T300LA-C4006H | |
| 1920x1080 Ice Storm Extreme Graphics (Classer selon les valeurs) | |
| Dell Inspiron 13 7386 | |
| Acer TravelMate P278-MG-76L2 | |
| Toshiba Tecra Z40-C-11F | |
| Dell Latitude 3470 N2P7L347014EMEA | |
| 3DMark 11 Performance | 1615 points | |
| 3DMark Ice Storm Standard Score | 55696 points | |
| 3DMark Cloud Gate Standard Score | 5941 points | |
| 3DMark Fire Strike Score | 882 points | |
| 3DMark Fire Strike Extreme Score | 401 points | |
Aide | ||
| BioShock Infinite | |
| 1366x768 Medium Preset | |
| Acer TravelMate P278-MG-76L2 | |
| Intel NUC6i5SYH | |
| Dell Inspiron 13 7386 | |
| Dell Latitude 3470 N2P7L347014EMEA | |
| Lenovo B50-70 MCC2GGE | |
| Fujitsu Lifebook E544 | |
| 1366x768 High Preset | |
| Acer TravelMate P278-MG-76L2 | |
| Intel NUC6i5SYH | |
| Dell Inspiron 13 7386 | |
| Dell Latitude 3470 N2P7L347014EMEA | |
| Lenovo B50-70 MCC2GGE | |
| Fujitsu Lifebook E544 | |
| Bas | Moyen | Élevé | Ultra | |
|---|---|---|---|---|
| StarCraft II: Heart of the Swarm (2013) | 156.2 | 52.5 | 35.5 | 18.4 |
| BioShock Infinite (2013) | 31.3 | 19.5 | 16.7 | 7.1 |
| Overwatch (2016) | 34.1 | 24.8 | 15.8 |
Degré de la nuisance sonore
| Au repos |
| 29.4 / 29.4 / 29.4 dB(A) |
| Fortement sollicité |
| 32.2 / 35 dB(A) |
 | ||
30 dB silencieux 40 dB(A) audible 50 dB(A) bruyant |
||
min: | ||
| Dell Inspiron 13 7386 HD Graphics 520, 6200U, SanDisk Z400s 256 GB M.2 2280 | Acer Aspire R13 R7-372T-746N HD Graphics 520, 6500U, Lite-On CV1-8B256 | Dell Inspiron 13-7348 HD Graphics 5500, 5500U, Samsung PM851 Series MZMTE256HMHP | HP Spectre x360 13-4104ng HD Graphics 520, 6200U, Samsung SSD PM851 256 GB MZNTE256HMHP | Lenovo Yoga 900-13ISK 80MK HD Graphics 520, 6500U, Samsung SSD PM871 MZNLN512HCJH | Microsoft Surface Book Core i7 Maxwell GPU (940M, GDDR5), 6600U, Samsung MZFLV512 NVMe | |
|---|---|---|---|---|---|---|
| Noise | -10% | -6% | -7% | -3% | -10% | |
| arrêt / environnement * (dB) | 29.4 | 31.3 -6% | 31.3 -6% | |||
| Idle Minimum * (dB) | 29.4 | 31.3 -6% | 29.6 -1% | 29.6 -1% | 29.7 -1% | 31.3 -6% |
| Idle Average * (dB) | 29.4 | 31.3 -6% | 29.6 -1% | 29.6 -1% | 29.8 -1% | 31.3 -6% |
| Idle Maximum * (dB) | 29.4 | 31.8 -8% | 29.6 -1% | 34.6 -18% | 30 -2% | 31.3 -6% |
| Load Average * (dB) | 32.2 | 39.2 -22% | 35.4 -10% | 34.7 -8% | 32 1% | 38 -18% |
| Load Maximum * (dB) | 35 | 39.1 -12% | 41.4 -18% | 37.9 -8% | 38.5 -10% | 40.5 -16% |
* ... Moindre est la valeur, meilleures sont les performances
(±) La température maximale du côté supérieur est de 43.2 °C / 110 F, par rapport à la moyenne de 35.4 °C / 96 F, allant de 19.6 à 60 °C pour la classe Convertible.
(-) Le fond chauffe jusqu'à un maximum de 45.2 °C / 113 F, contre une moyenne de 36.9 °C / 98 F
(+) En utilisation inactive, la température moyenne du côté supérieur est de 26.3 °C / 79 F, par rapport à la moyenne du dispositif de 30.3 °C / 87 F.
(+) Les repose-poignets et le pavé tactile atteignent la température maximale de la peau (33.6 °C / 92.5 F) et ne sont donc pas chauds.
(-) La température moyenne de la zone de l'appui-paume de dispositifs similaires était de 28 °C / 82.4 F (-5.6 °C / #-10.1 F).
| Éteint/en veille | |
| Au repos | |
| Fortement sollicité |
|
Légende:
min: | |
| Dell Inspiron 13 7386 6200U, HD Graphics 520, SanDisk Z400s 256 GB M.2 2280, IPS, 1920x1080, 13.3" | Acer Aspire R13 R7-372T-746N 6500U, HD Graphics 520, Lite-On CV1-8B256, IPS, 2560x1440, 13.3" | Dell Inspiron 13-7348 5500U, HD Graphics 5500, Samsung PM851 Series MZMTE256HMHP, IPS, 1920x1080, 13.3" | HP Spectre x360 13-4104ng 6200U, HD Graphics 520, Samsung SSD PM851 256 GB MZNTE256HMHP, IPS, 2560x1440, 13.3" | HP Spectre 13 6500U, HD Graphics 520, Samsung PM951 NVMe MZVLV256, IPS UWVA, 1920x1080, 13.3" | Microsoft Surface Book Core i7 6600U, Maxwell GPU (940M, GDDR5), Samsung MZFLV512 NVMe, IPS, 3000x2000, 13.5" | |
|---|---|---|---|---|---|---|
| Power Consumption | -37% | 8% | -3% | -50% | -54% | |
| Idle Minimum * (Watt) | 4.6 | 6.2 -35% | 3.5 24% | 3.9 15% | 8.6 -87% | 4.5 2% |
| Idle Average * (Watt) | 7 | 8 -14% | 5.6 20% | 7.4 -6% | 11 -57% | 9.8 -40% |
| Idle Maximum * (Watt) | 7.7 | 11.6 -51% | 7.6 1% | 9.2 -19% | 11.3 -47% | 12.2 -58% |
| Load Average * (Watt) | 24.8 | 40 -61% | 26.3 -6% | 28.1 -13% | 33.8 -36% | 46 -85% |
| Load Maximum * (Watt) | 29.3 | 36.6 -25% | 29 1% | 27.6 6% | 36.2 -24% | 56 -91% |
* ... Moindre est la valeur, meilleures sont les performances
| Dell Inspiron 13 7386 6200U, HD Graphics 520, 42 Wh | Acer Aspire R13 R7-372T-746N 6500U, HD Graphics 520, 49 Wh | Dell Inspiron 13-7348 5500U, HD Graphics 5500, 43 Wh | HP Spectre x360 13-4104ng 6200U, HD Graphics 520, 56 Wh | Lenovo Yoga 900-13ISK 80MK 6500U, HD Graphics 520, 66 Wh | Microsoft Surface Book Core i5 6300U, Maxwell GPU (940M, GDDR5), 78 Wh | |
|---|---|---|---|---|---|---|
| Autonomie de la batterie | -9% | -19% | 32% | 14% | 33% | |
| Reader / Idle (h) | 12.6 | 11.2 -11% | 8.7 -31% | 14.1 12% | 17.8 41% | |
| WiFi v1.3 (h) | 6.3 | 6.4 2% | 8.3 32% | 6.7 6% | 6.7 6% | |
| Load (h) | 1.7 | 1.4 -18% | 1.6 -6% | 2.1 24% | 2.6 53% | |
| WiFi (h) | 6.6 |
Points positifs
Points négatifs
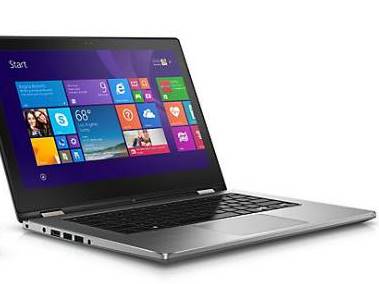
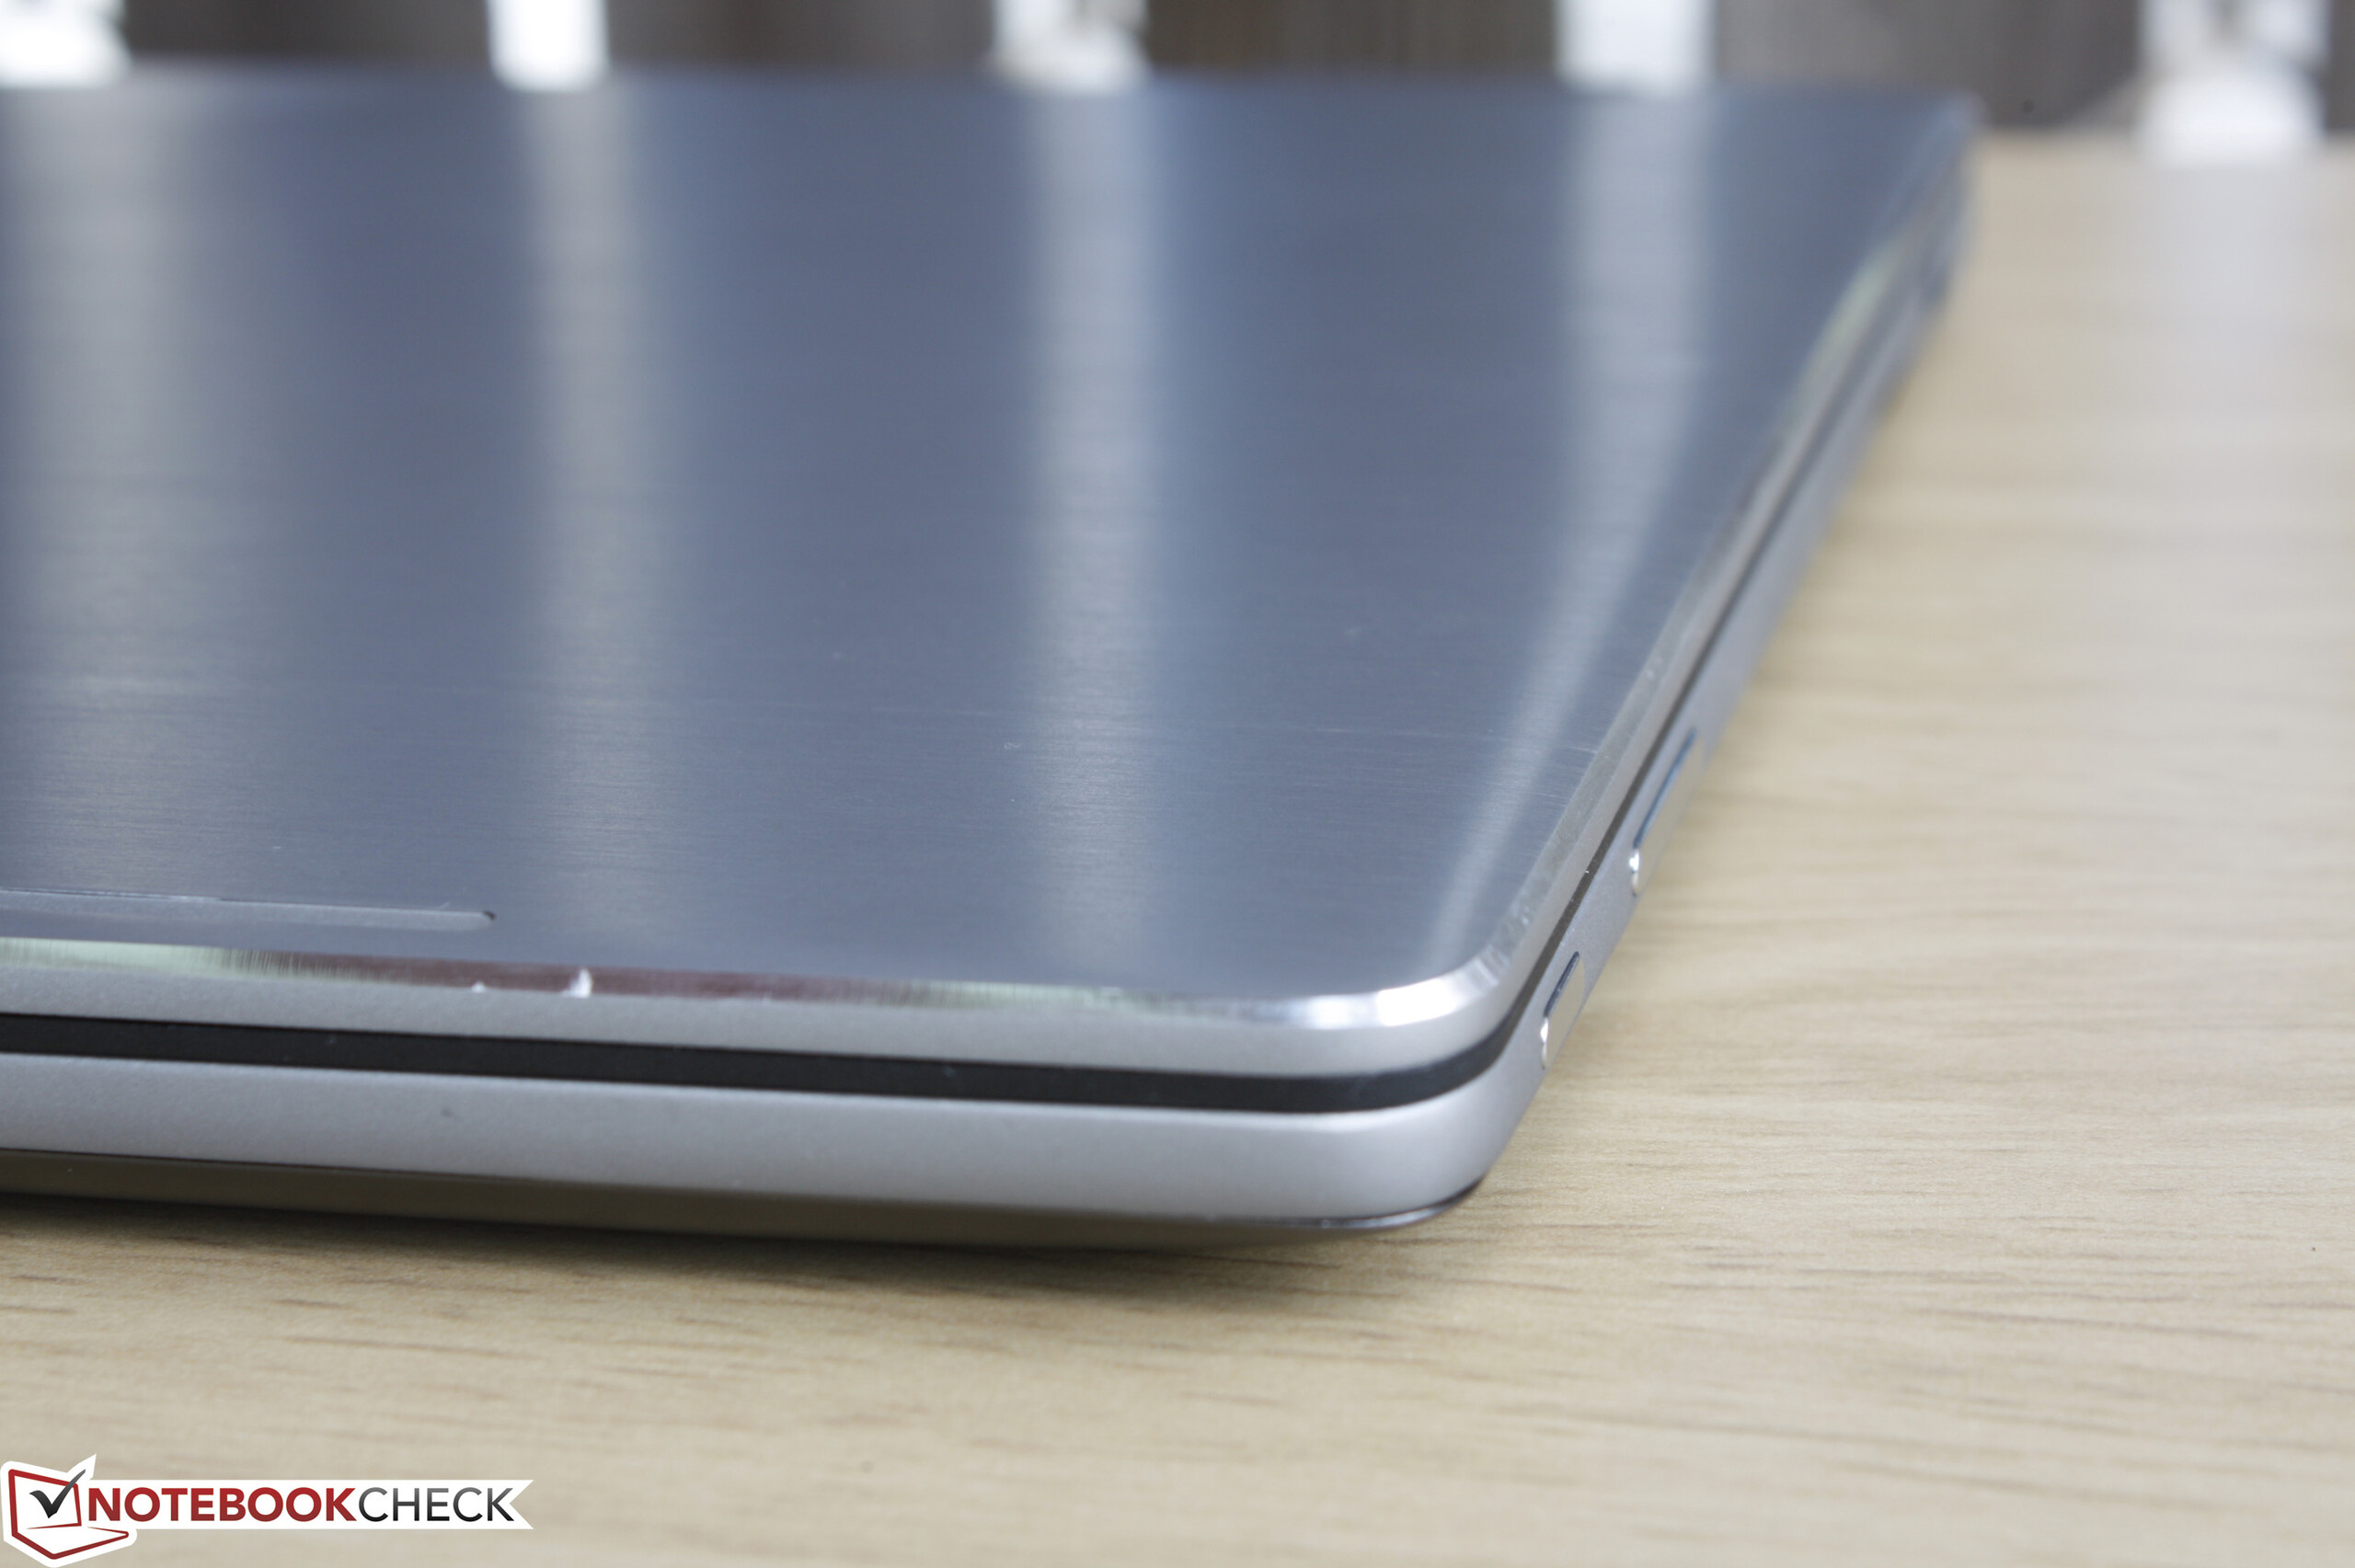
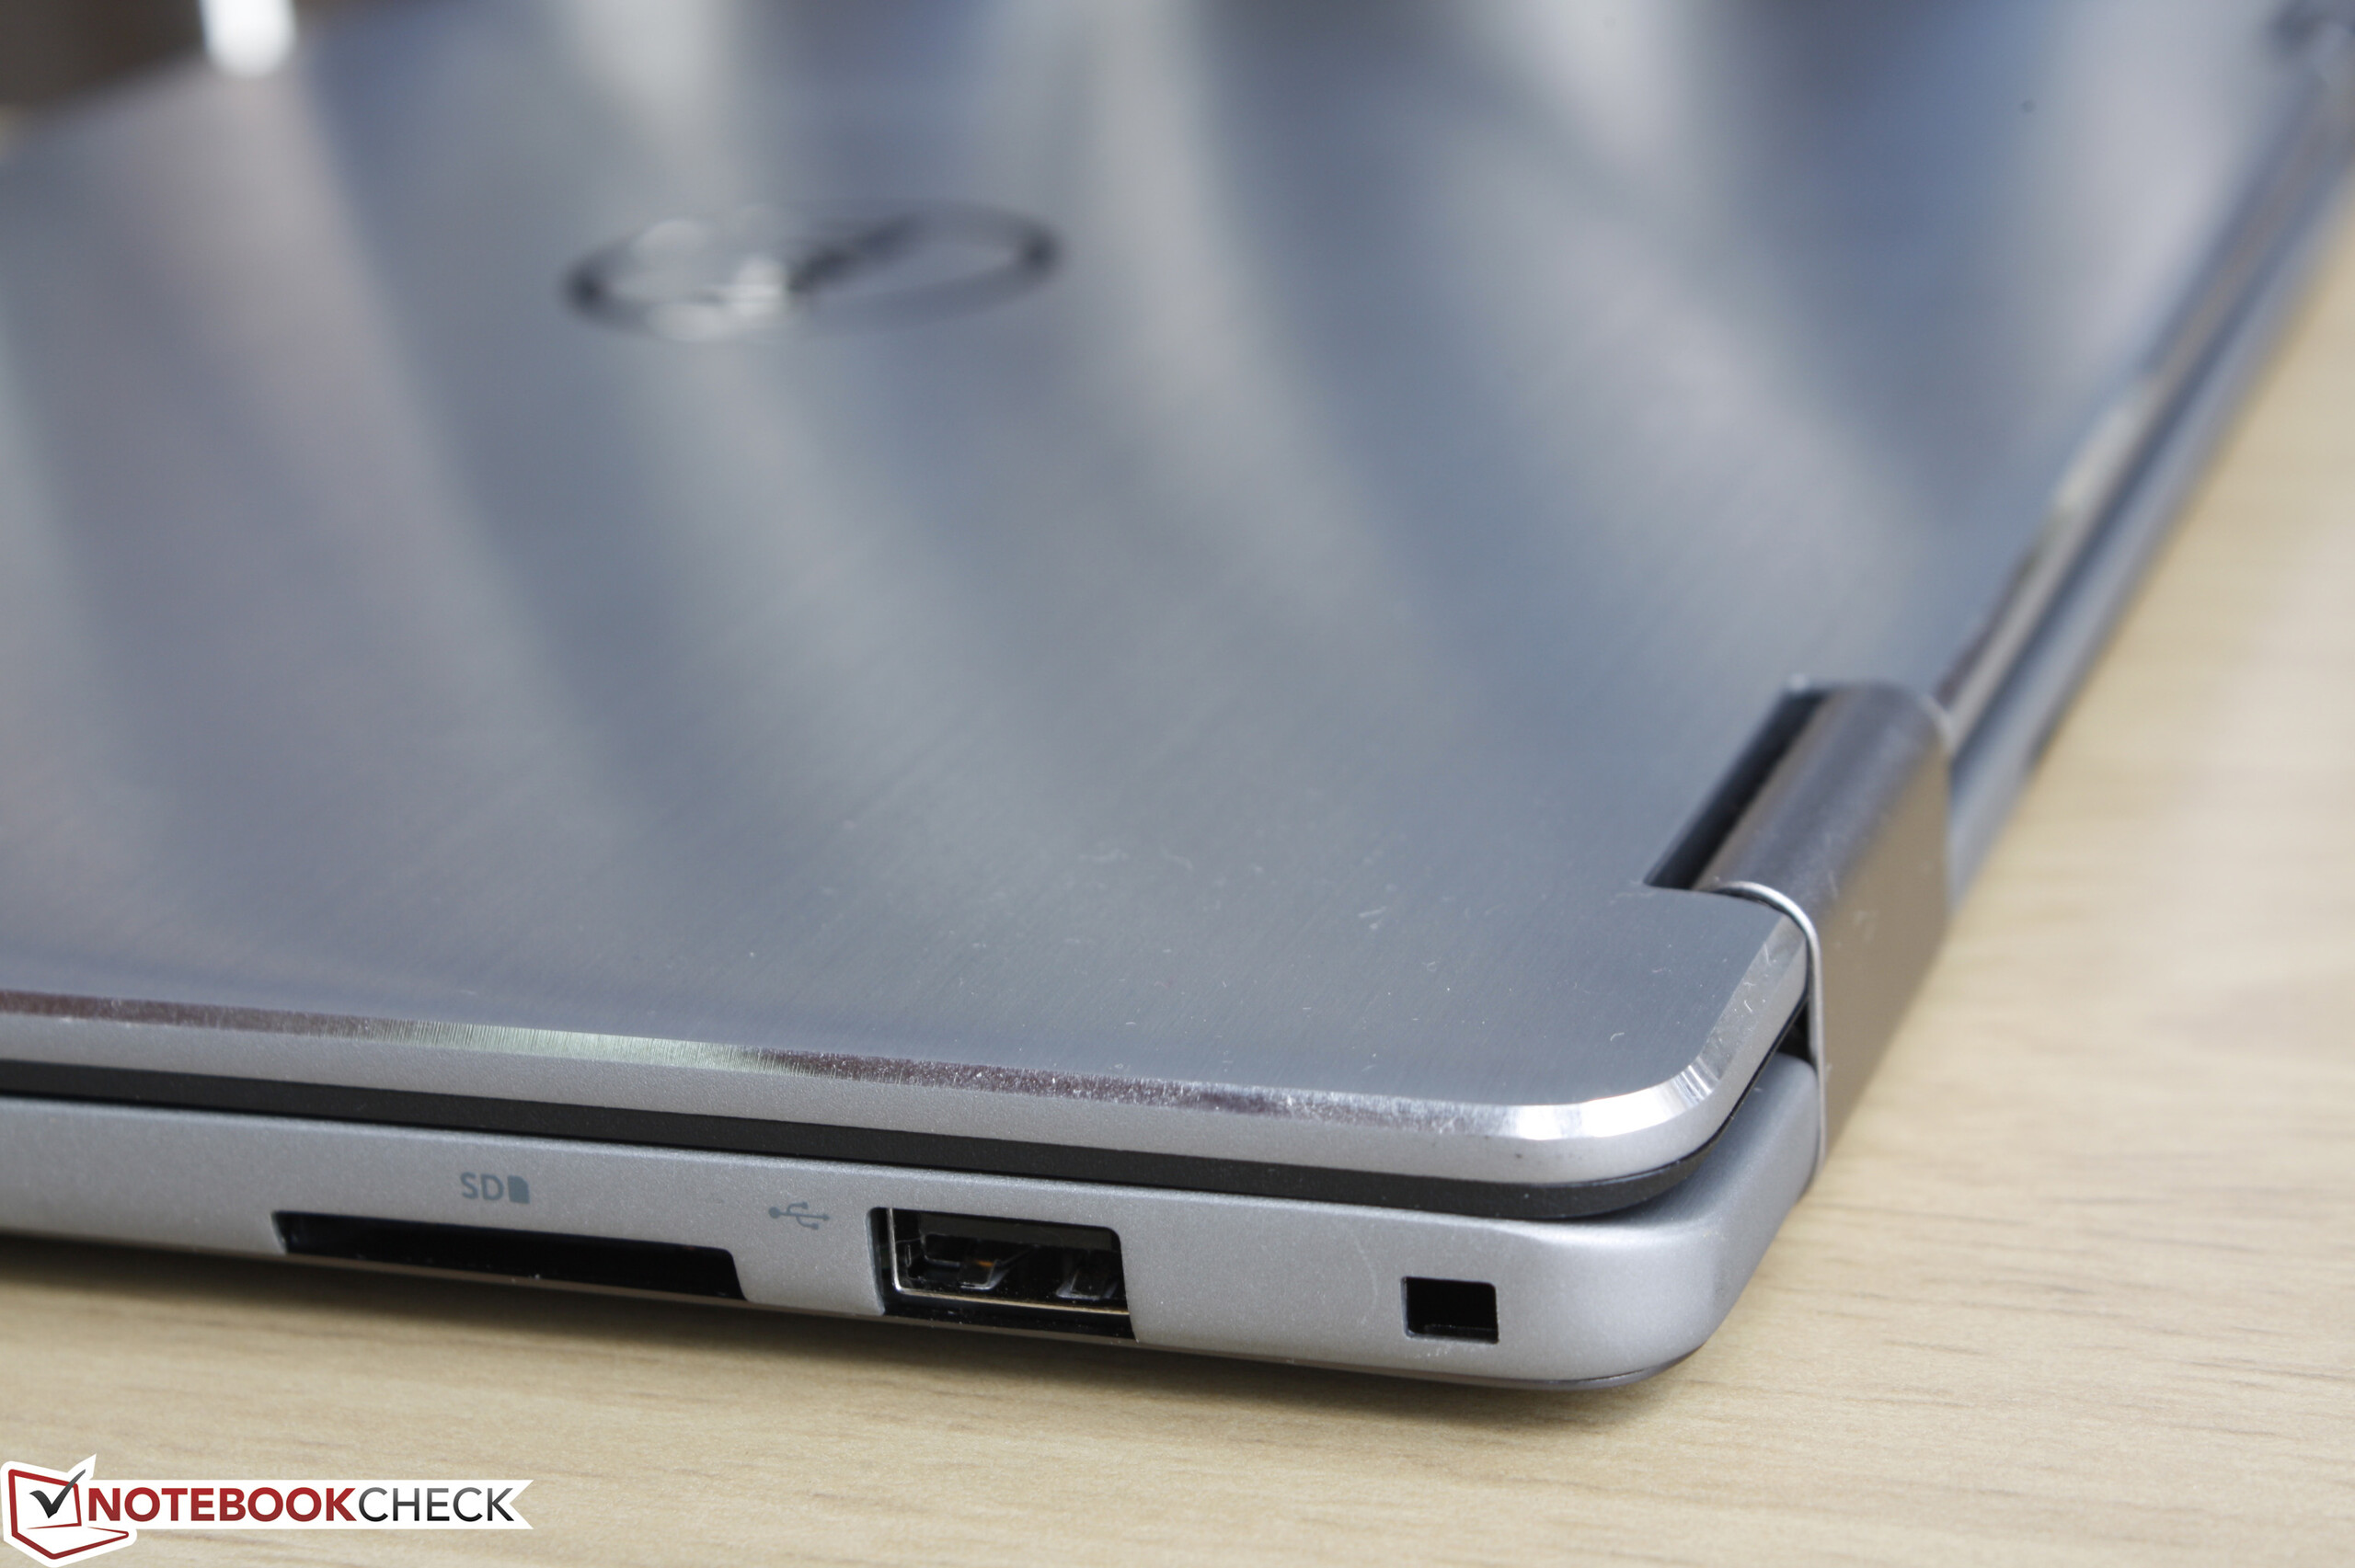
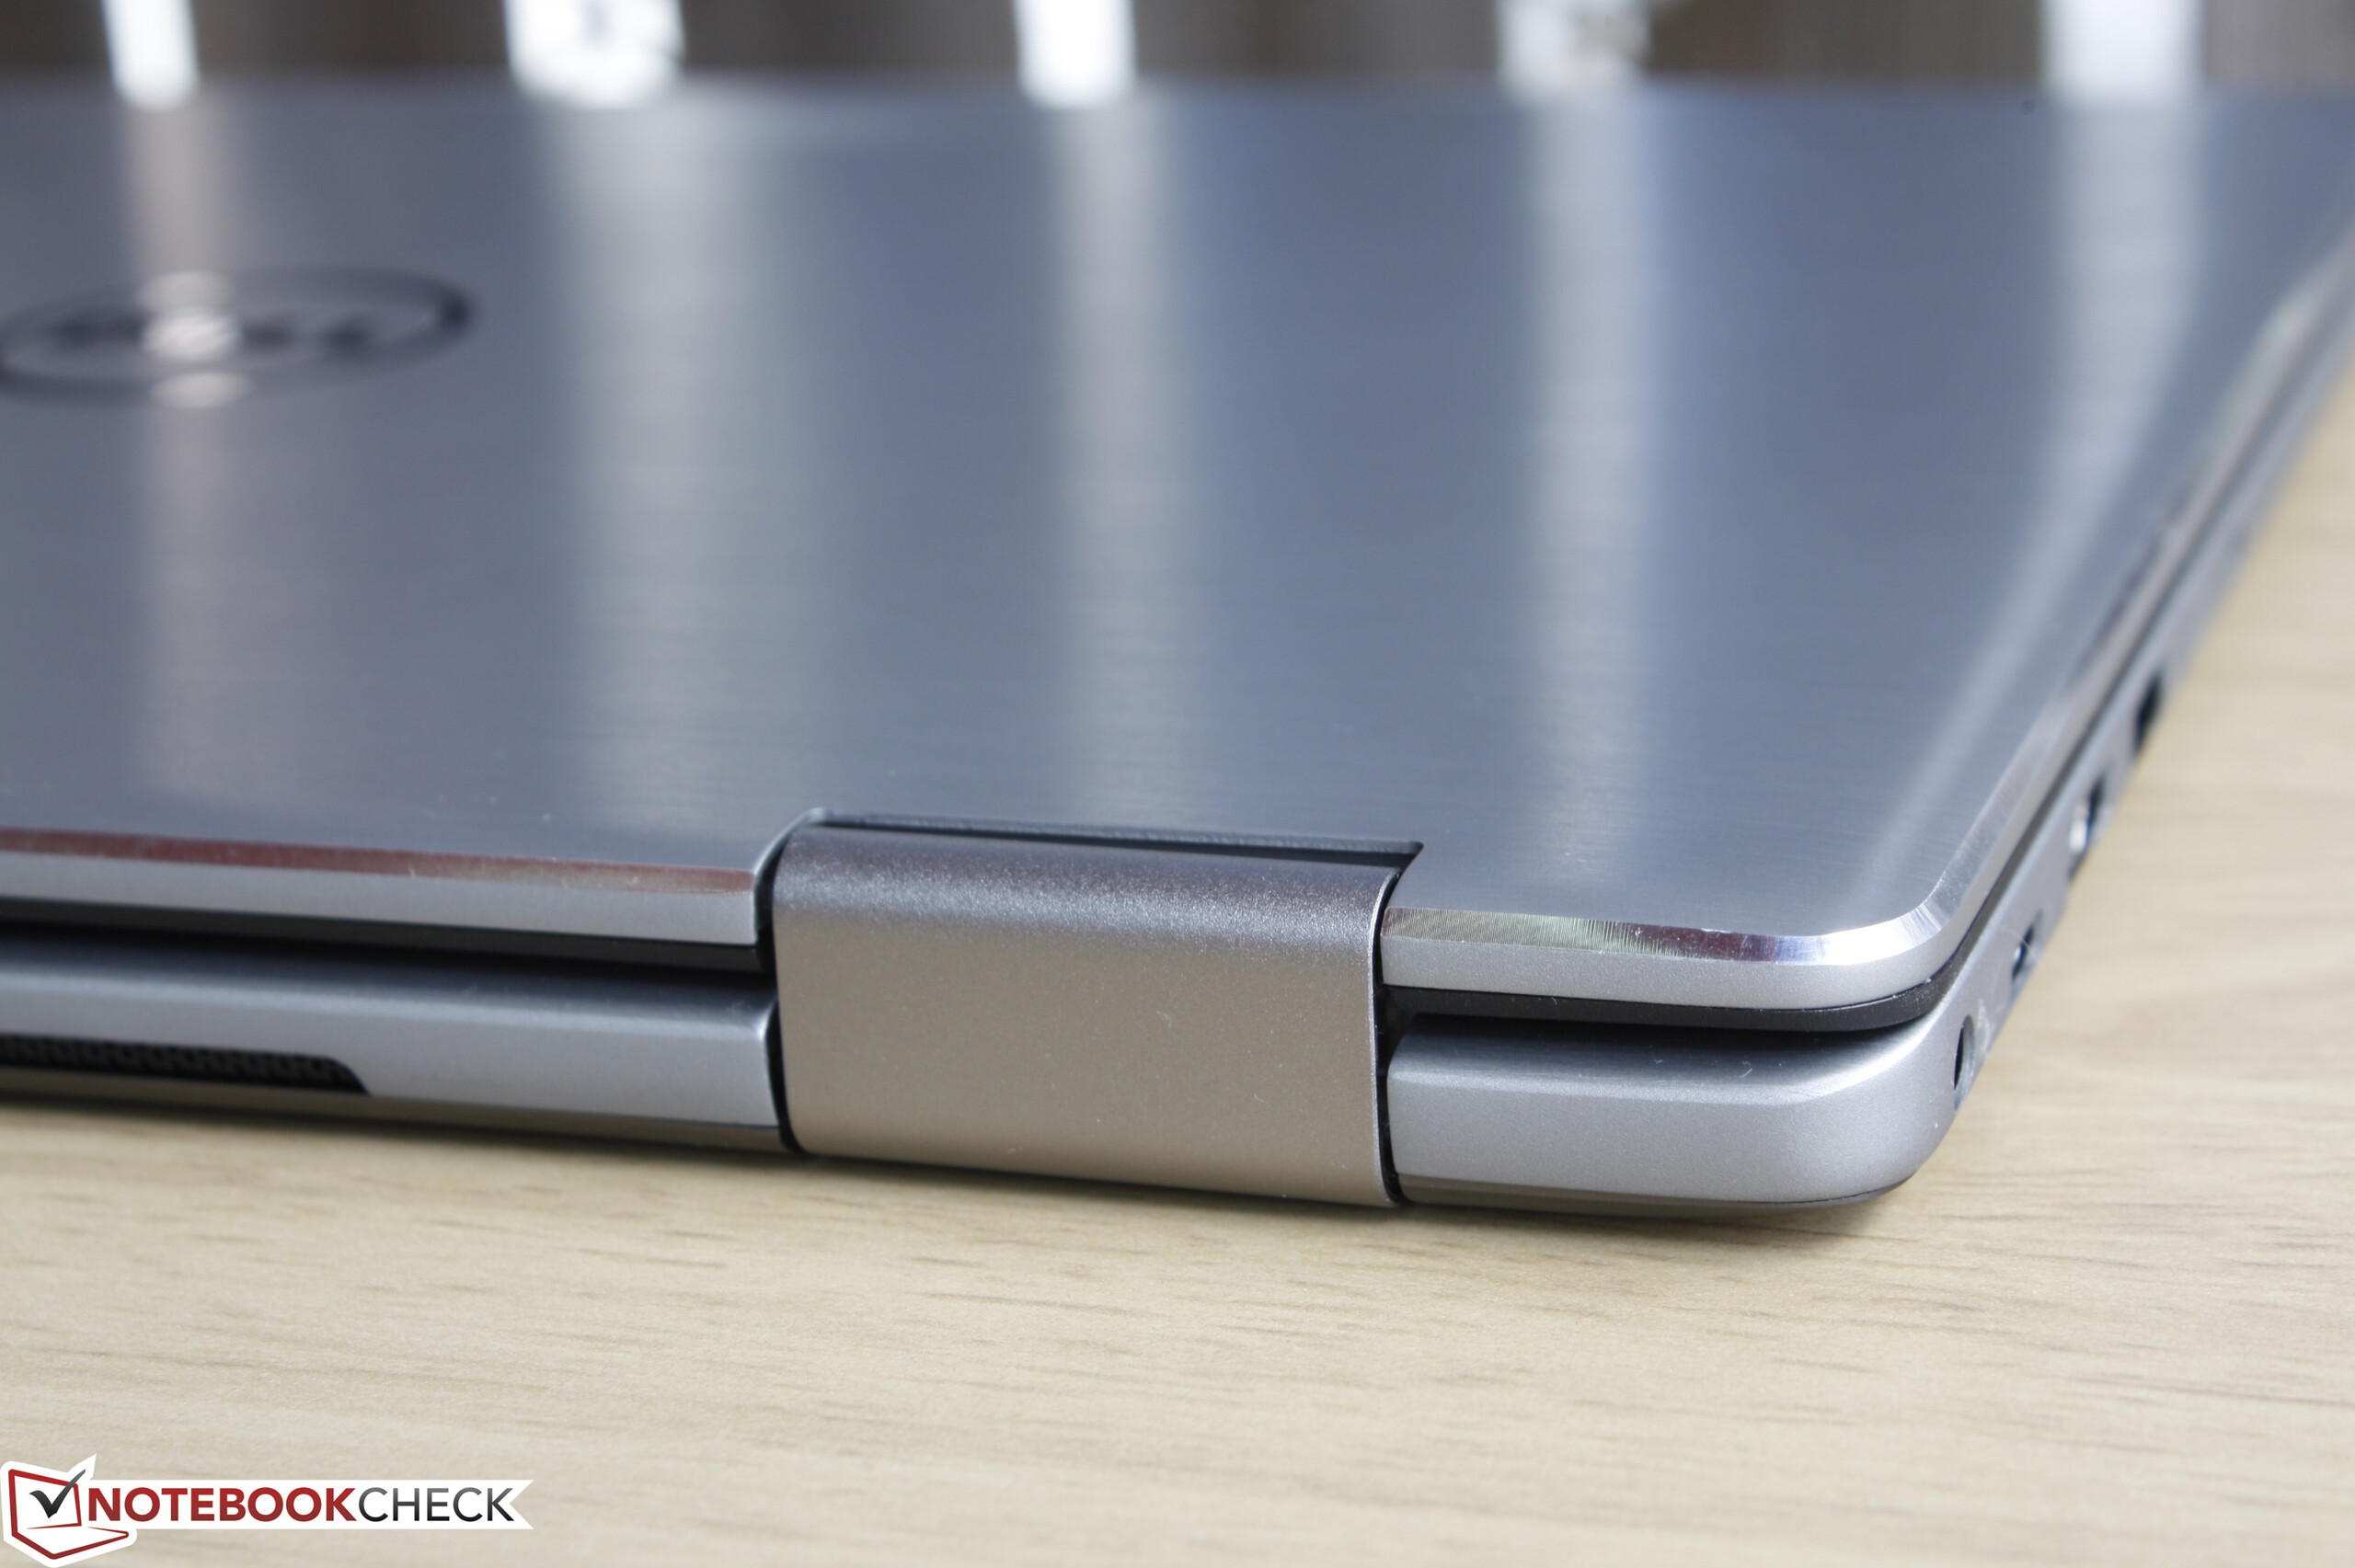
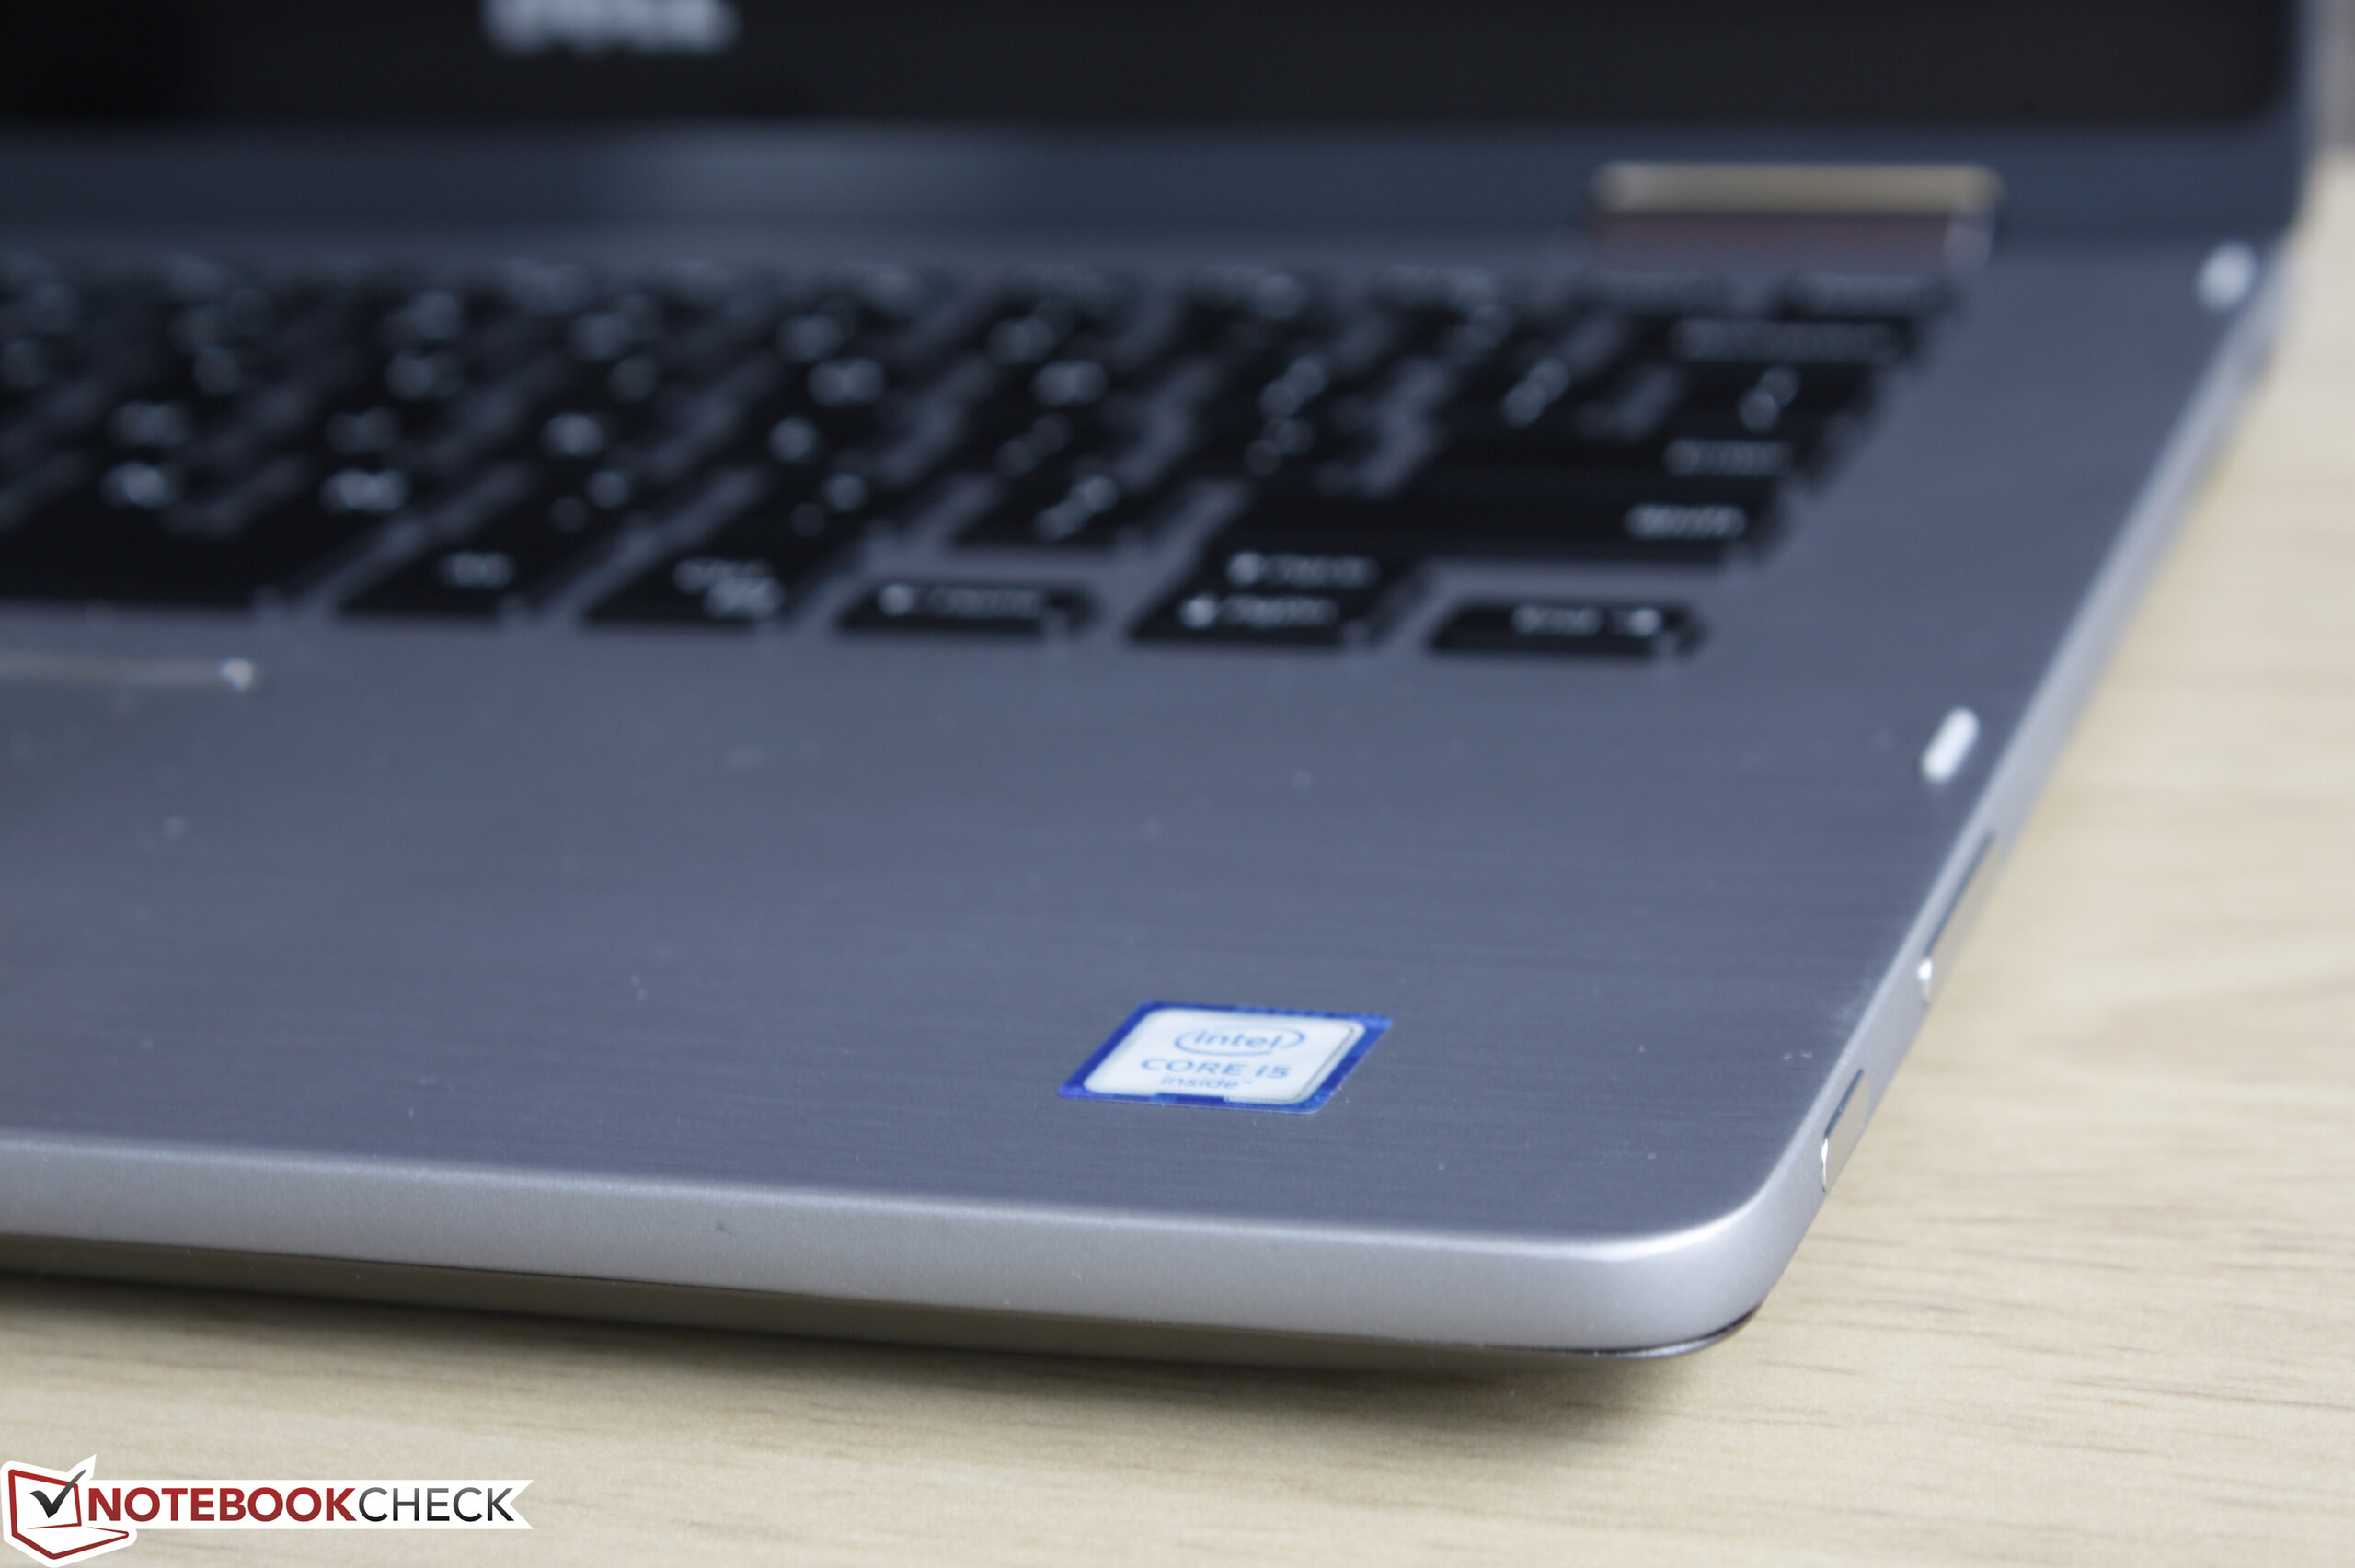
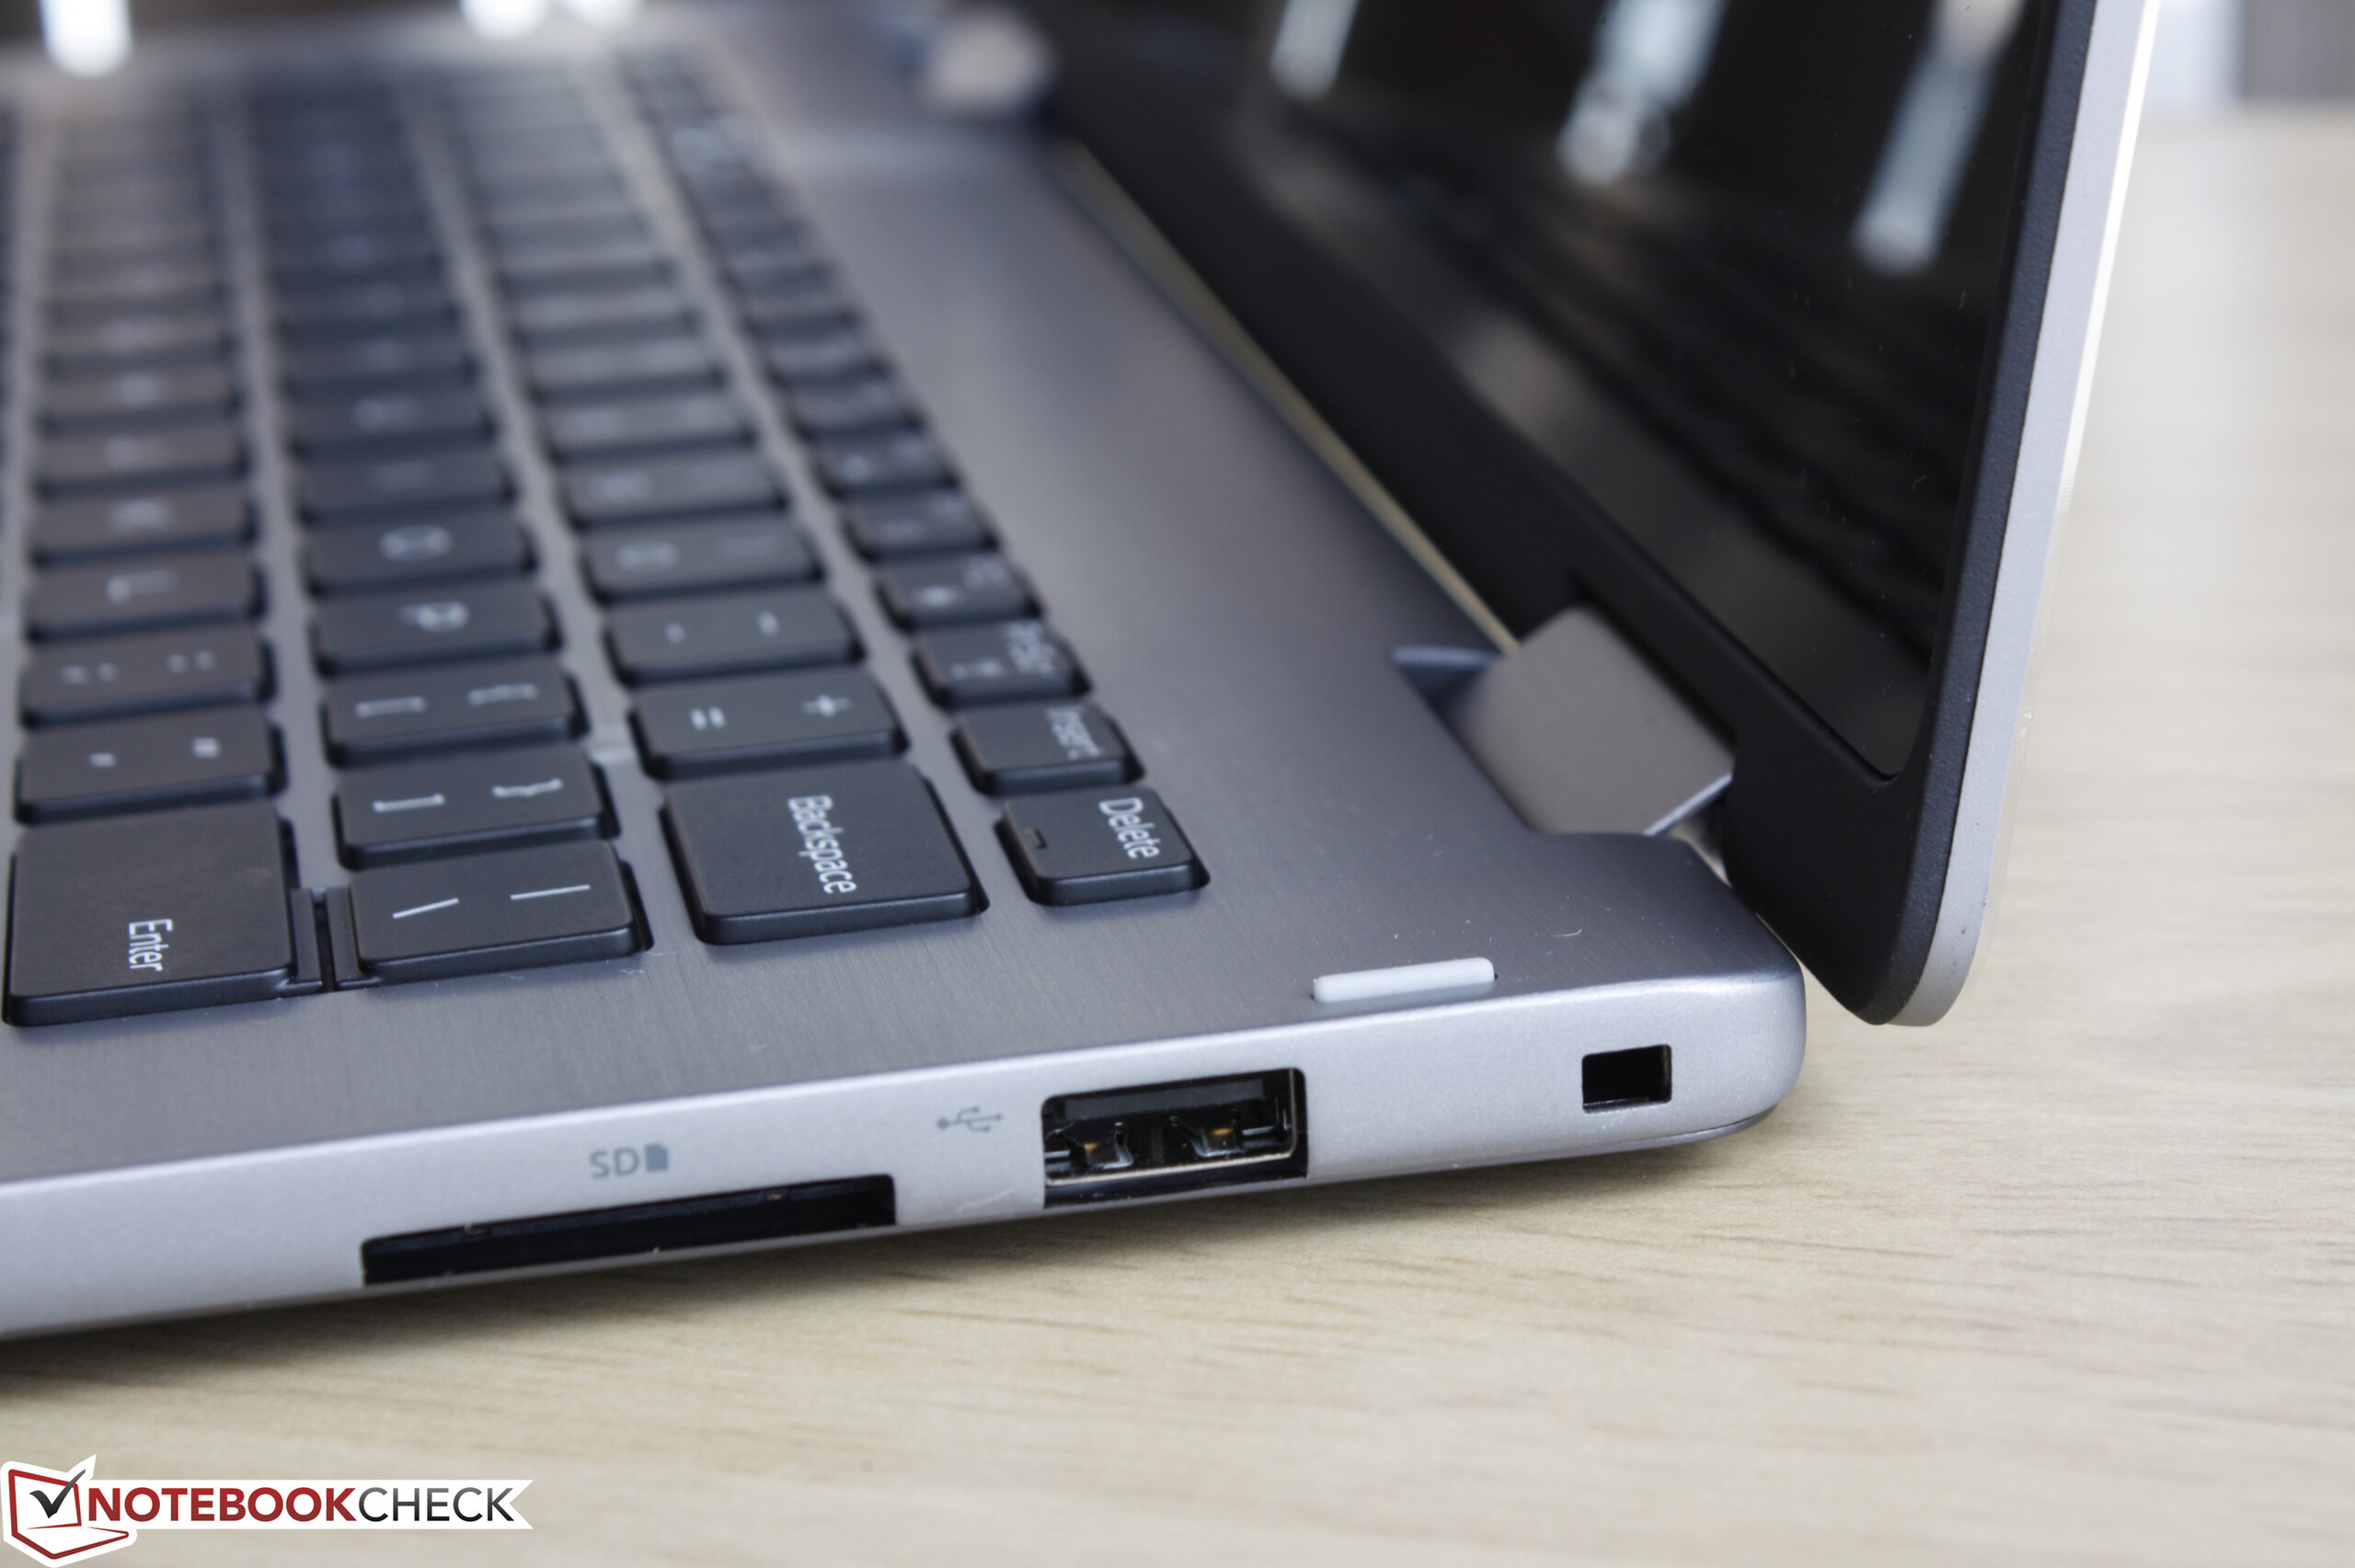
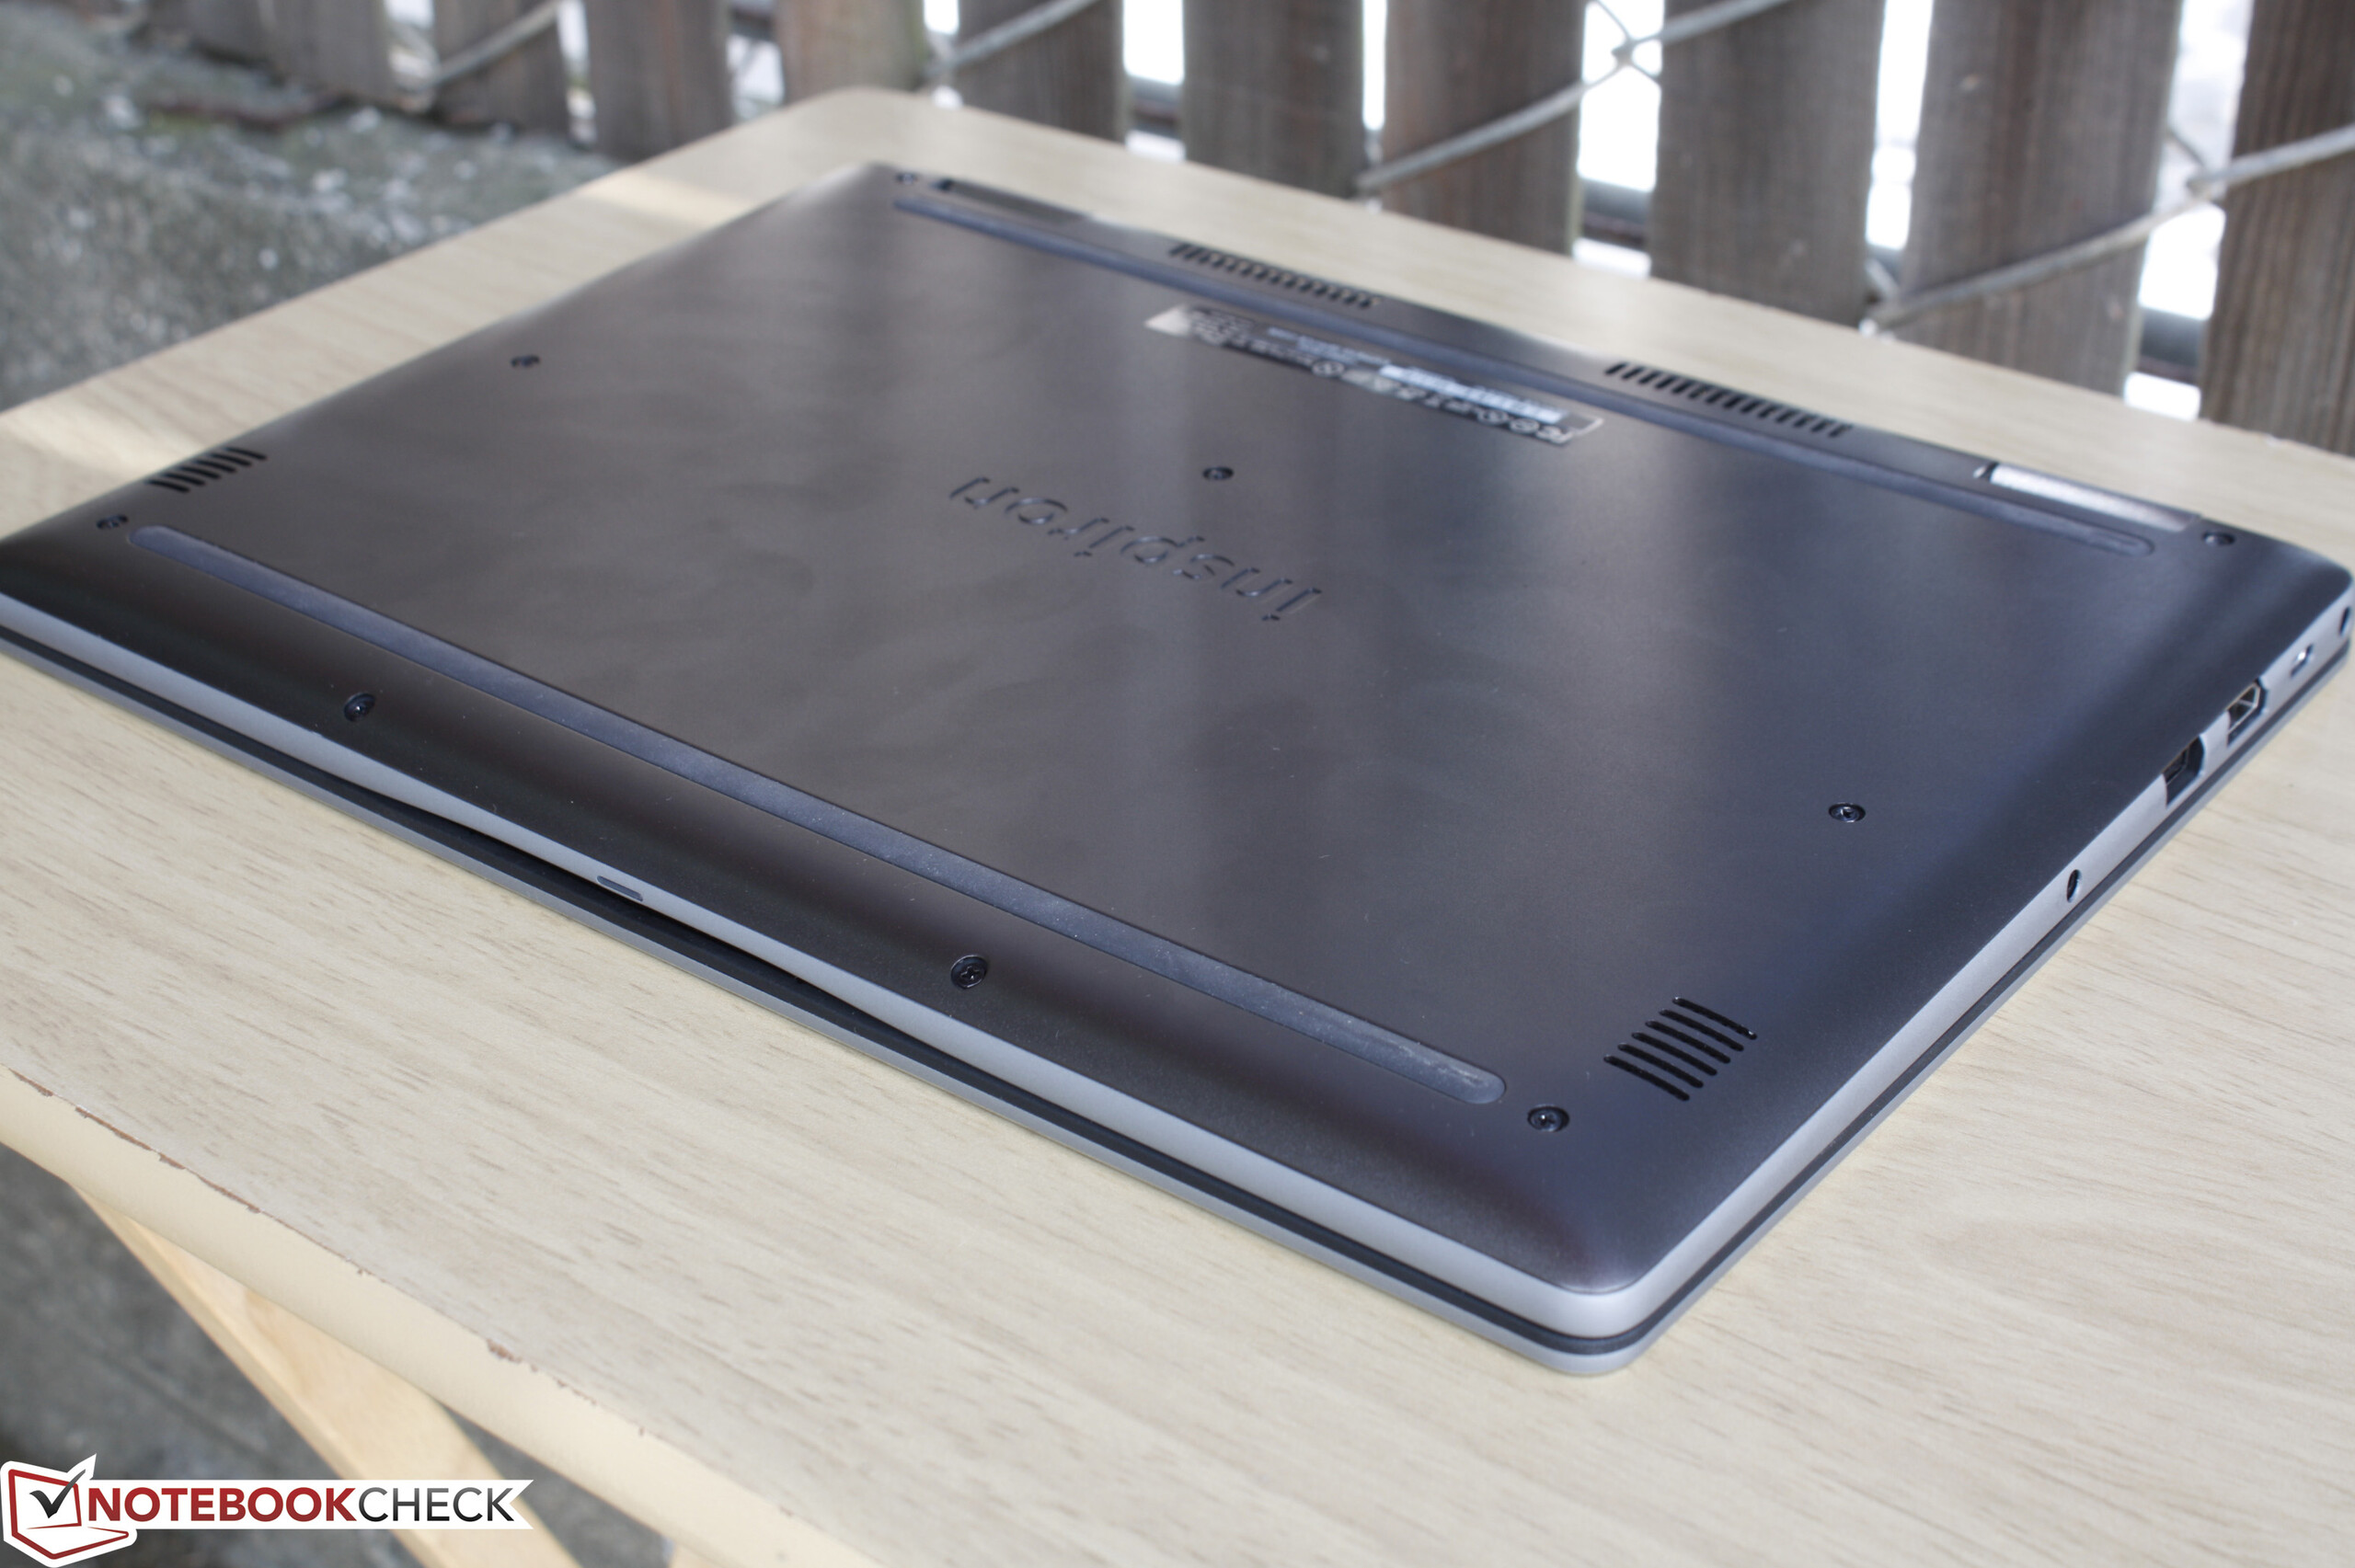
L'Inspiron 13 7368 est plus silencieux et est plus fin que l'ancien Inspiron 7348. Malheureusement, il est toujours aussi lourd et la luminosité de son écran est plus faible que sur le 7348 en fin de vie. Son utilité en tant que tablette Windows est largement limitée, la tablette n'est à l'aise qu'en environnement intérieur. Les touches du clavier sont plutôt spongieuses et le système embarque désormais moins de ports USB pleine hauteur que le modèle qu'il remplace. A nos yeux, les modifications mineures et l'ajout d'un port de USB type C Gen. 1 ne sont pas assez convaincants pour que nous vous recommandions ce nouvel Inspiron par rapport à son prédécesseur.
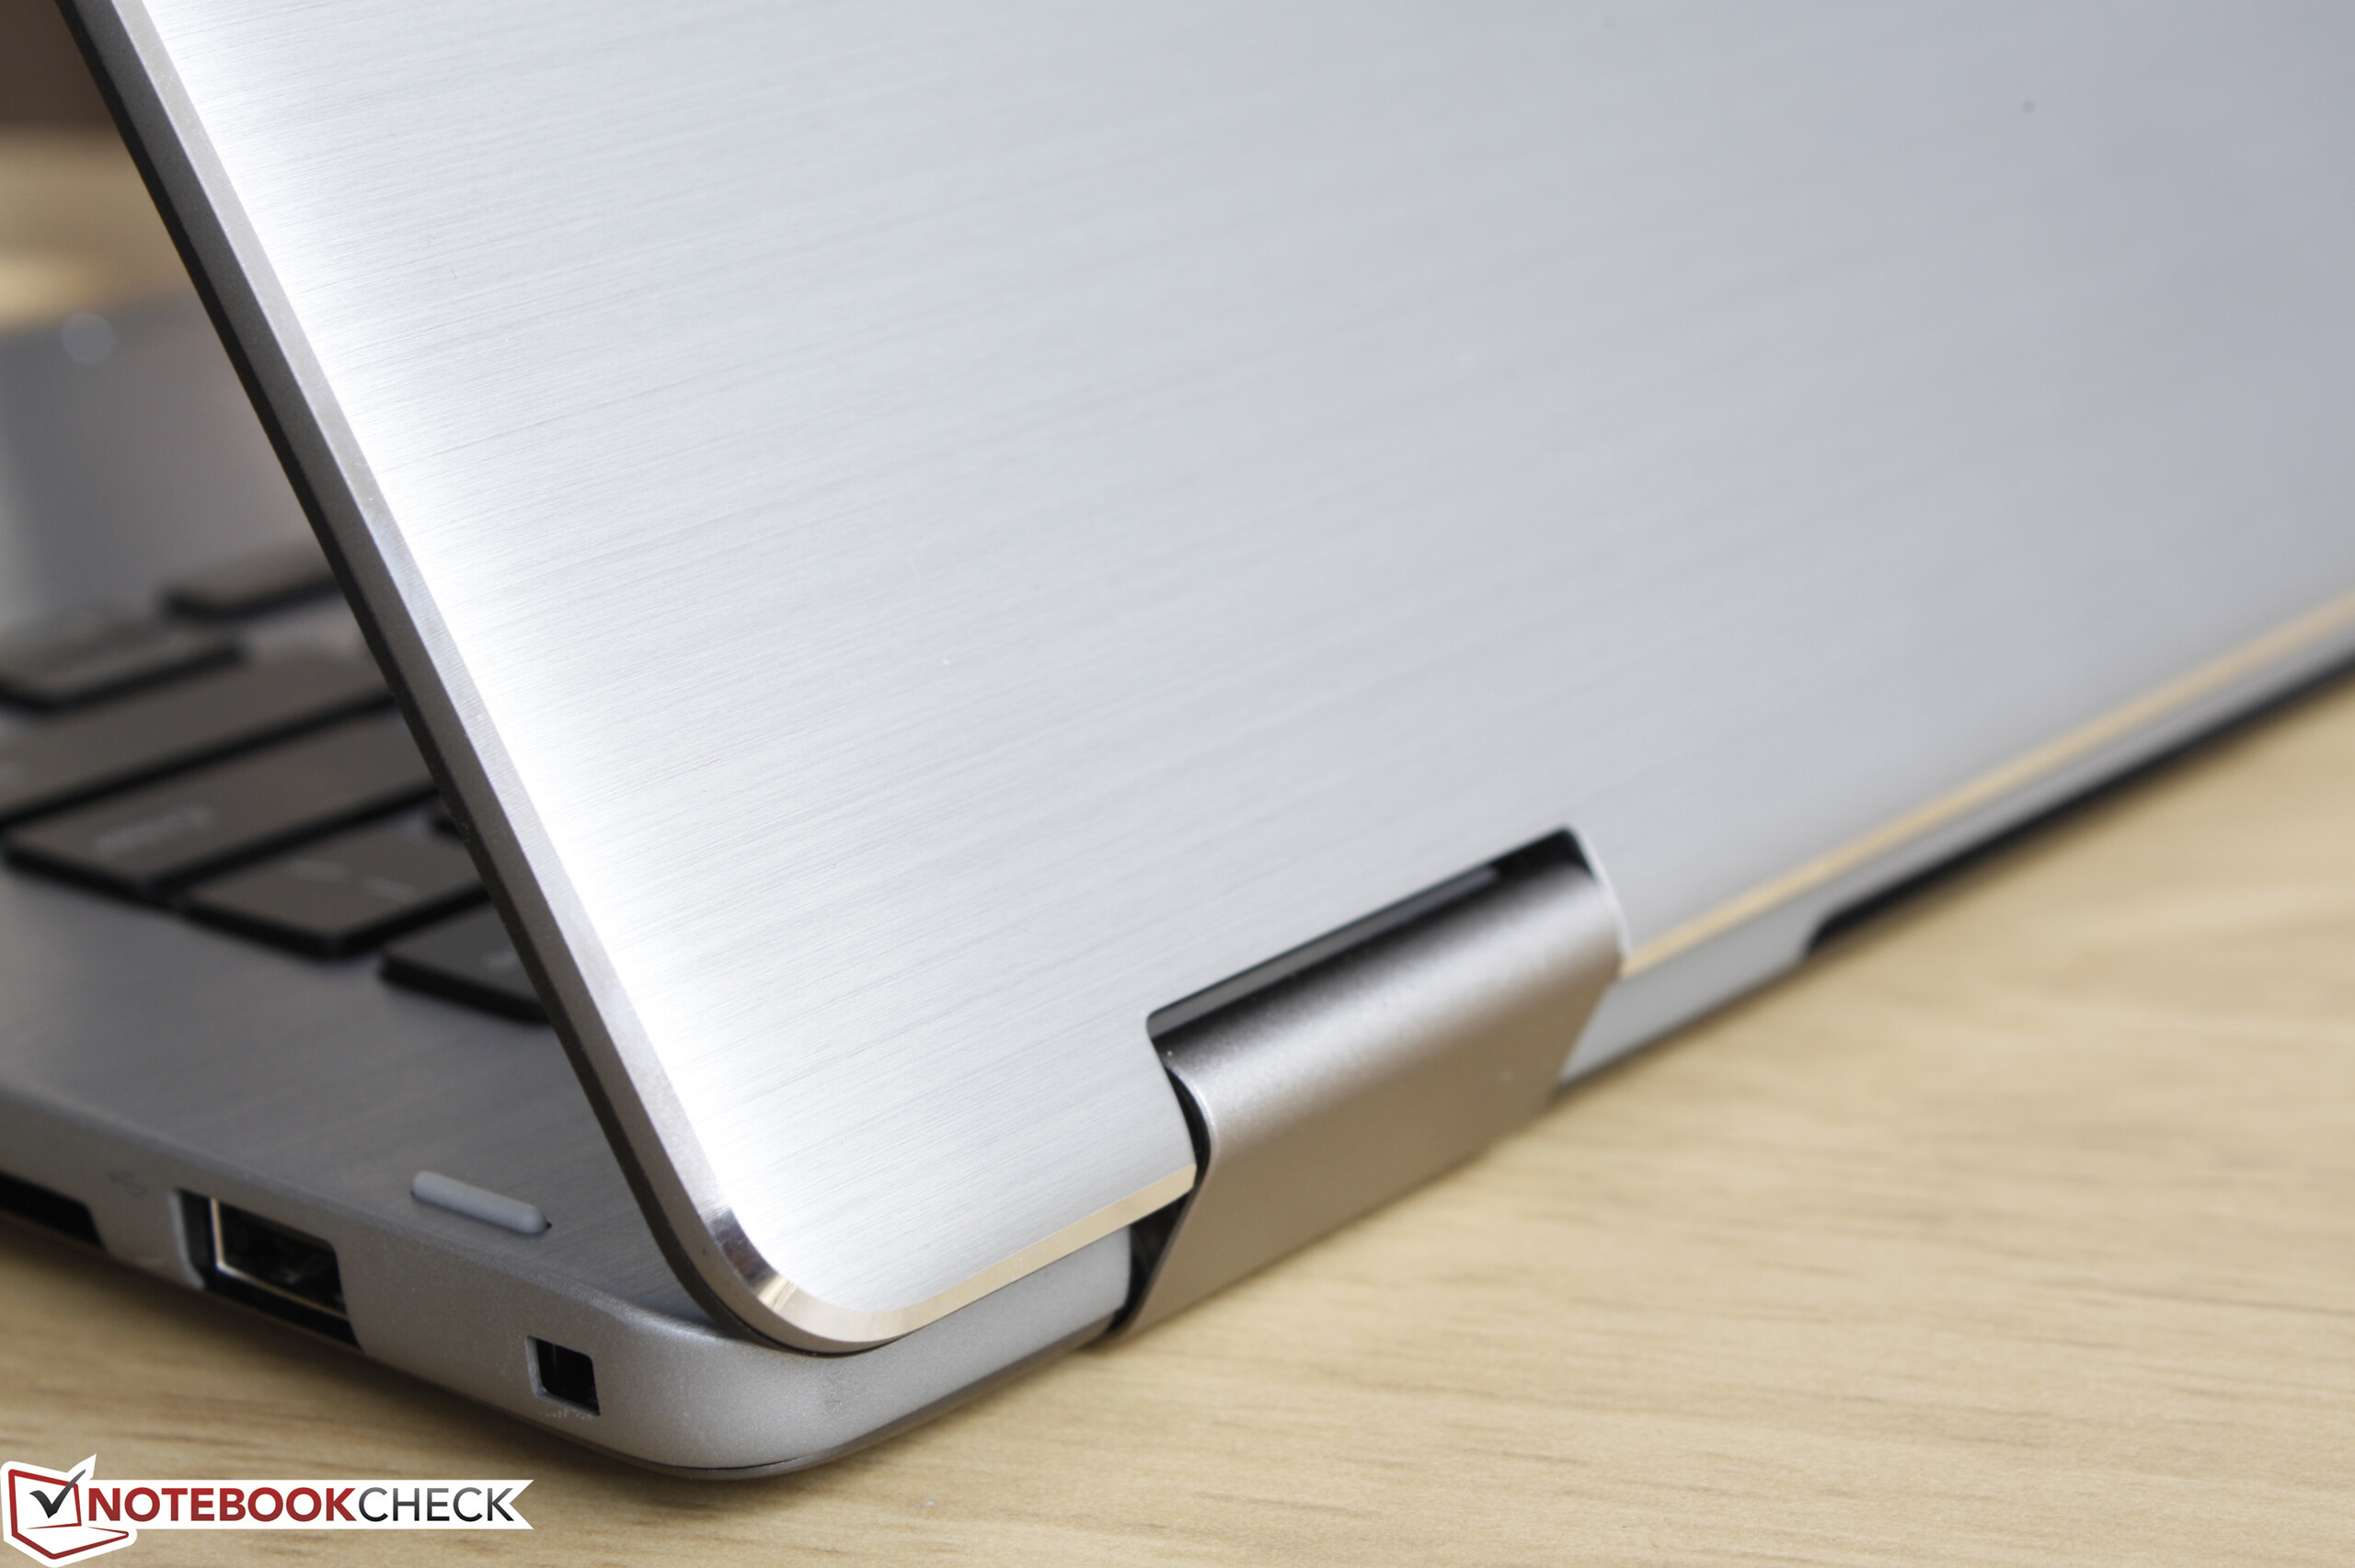
Il n'empêche qu'il s'agit là d'une convertible robuste, finement conçu, à l'entretien et à la maintenance faciles, dont les haut-parleurs s'avèrent puissants. Oui il remplacera à merveille votre ancien ordinateur portable, mais si le mode tablette n'est pas un critère d'achat, alors le très réussi XPS 13 est un cran au-dessus de l'Inspiron 13 7368 en termes de mobilité. Pour ce qui en est du marché des convertible s de 13 pouces, vous n'aurez aucun mal à trouver des références plus légères et moins encombrantes.
L'Inspiron 13 7368 n'est pas la mise à jour majeure que nous espérions pour la gamme des Inspiron. Son poids et ses dimensions le rendent impraticables en mode tablette alors que nombreux sont les Ultrabooks de 13,3 pouces aux performances et aux fonctionnalités comparables.
Pour plus de détails, vous trouverez la version complète (en anglais) de ce test ici.
Dell Inspiron 13 7386
- 07/15/2016 v5.1 (old)
Allen Ngo
Price comparison
