Courte critique du PC portable Acer Swift 1 SF114-32 (N5000, SSD, FHD)
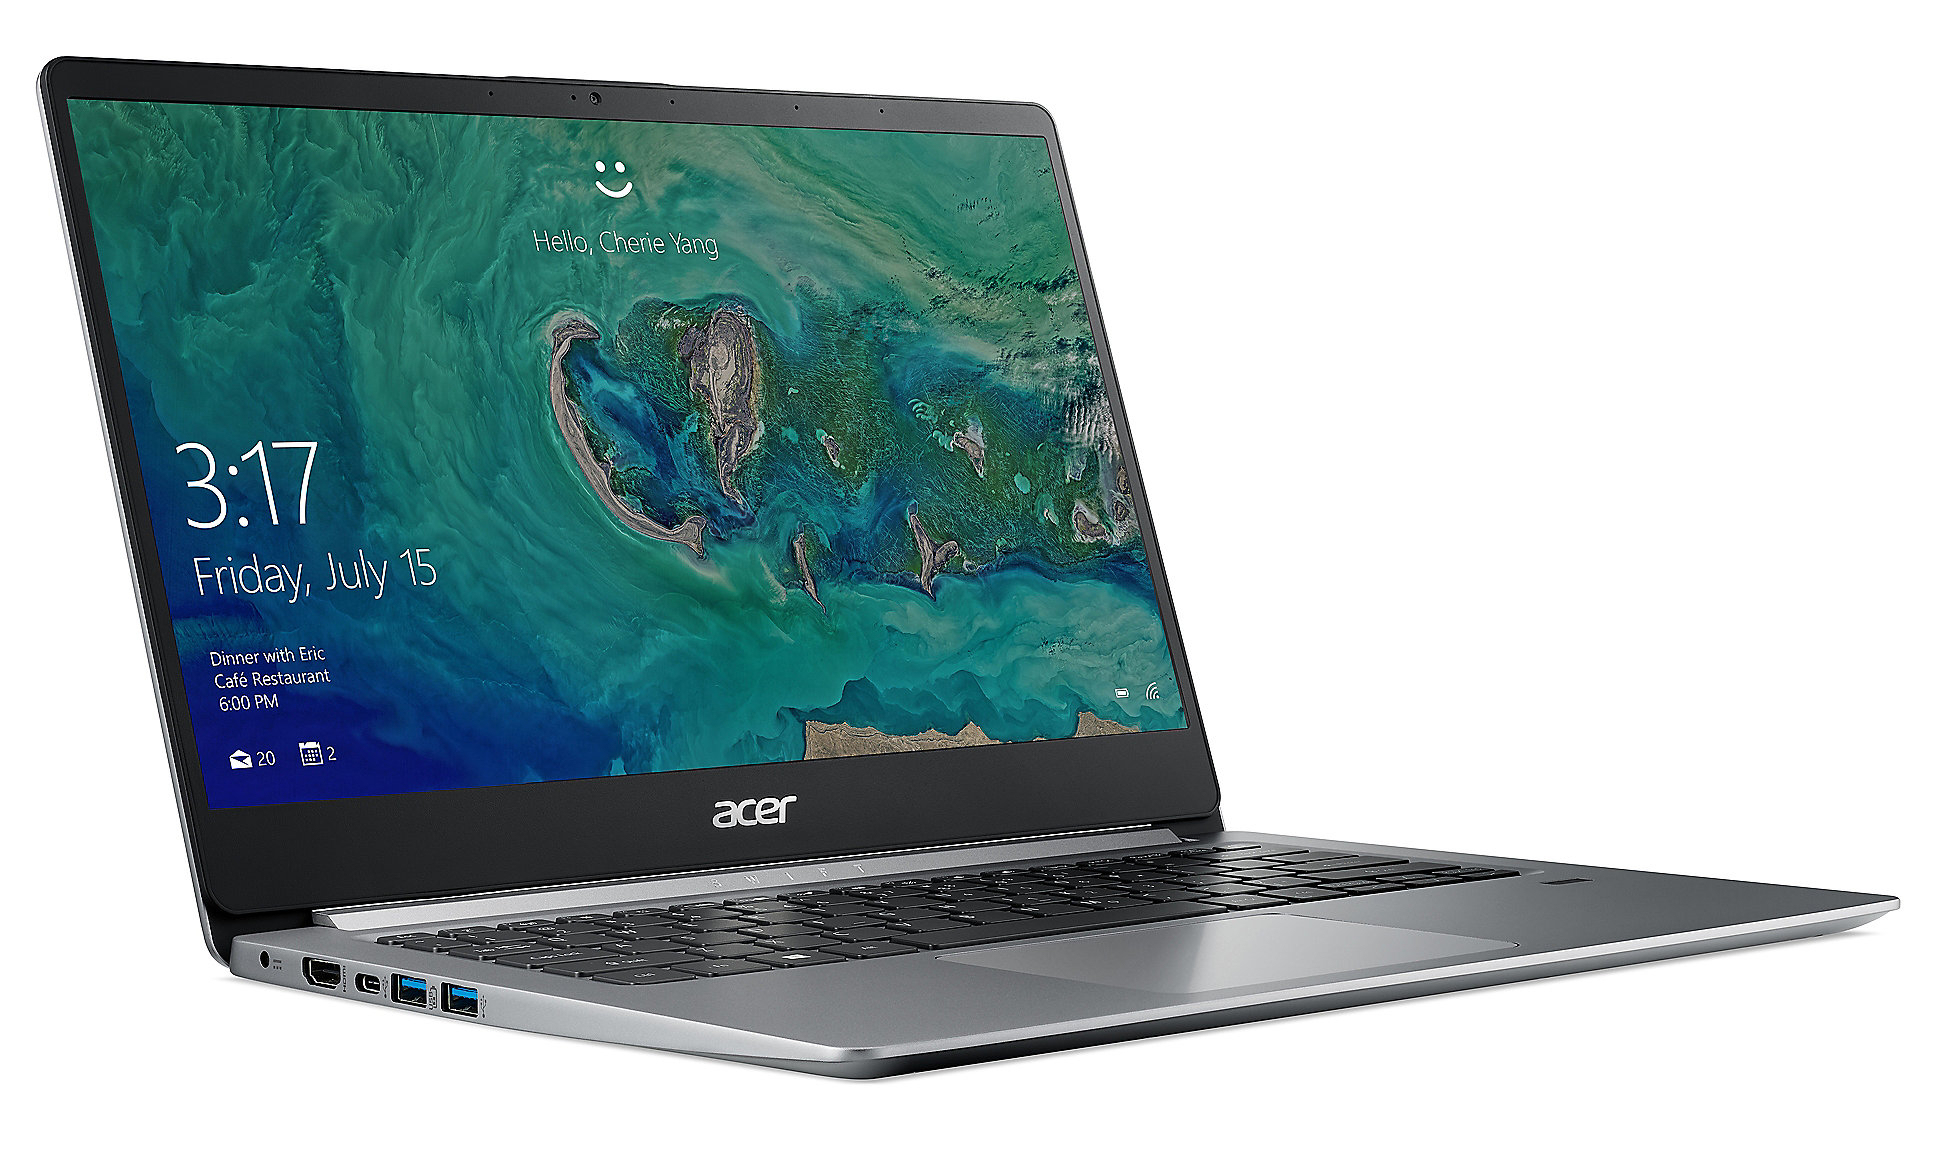
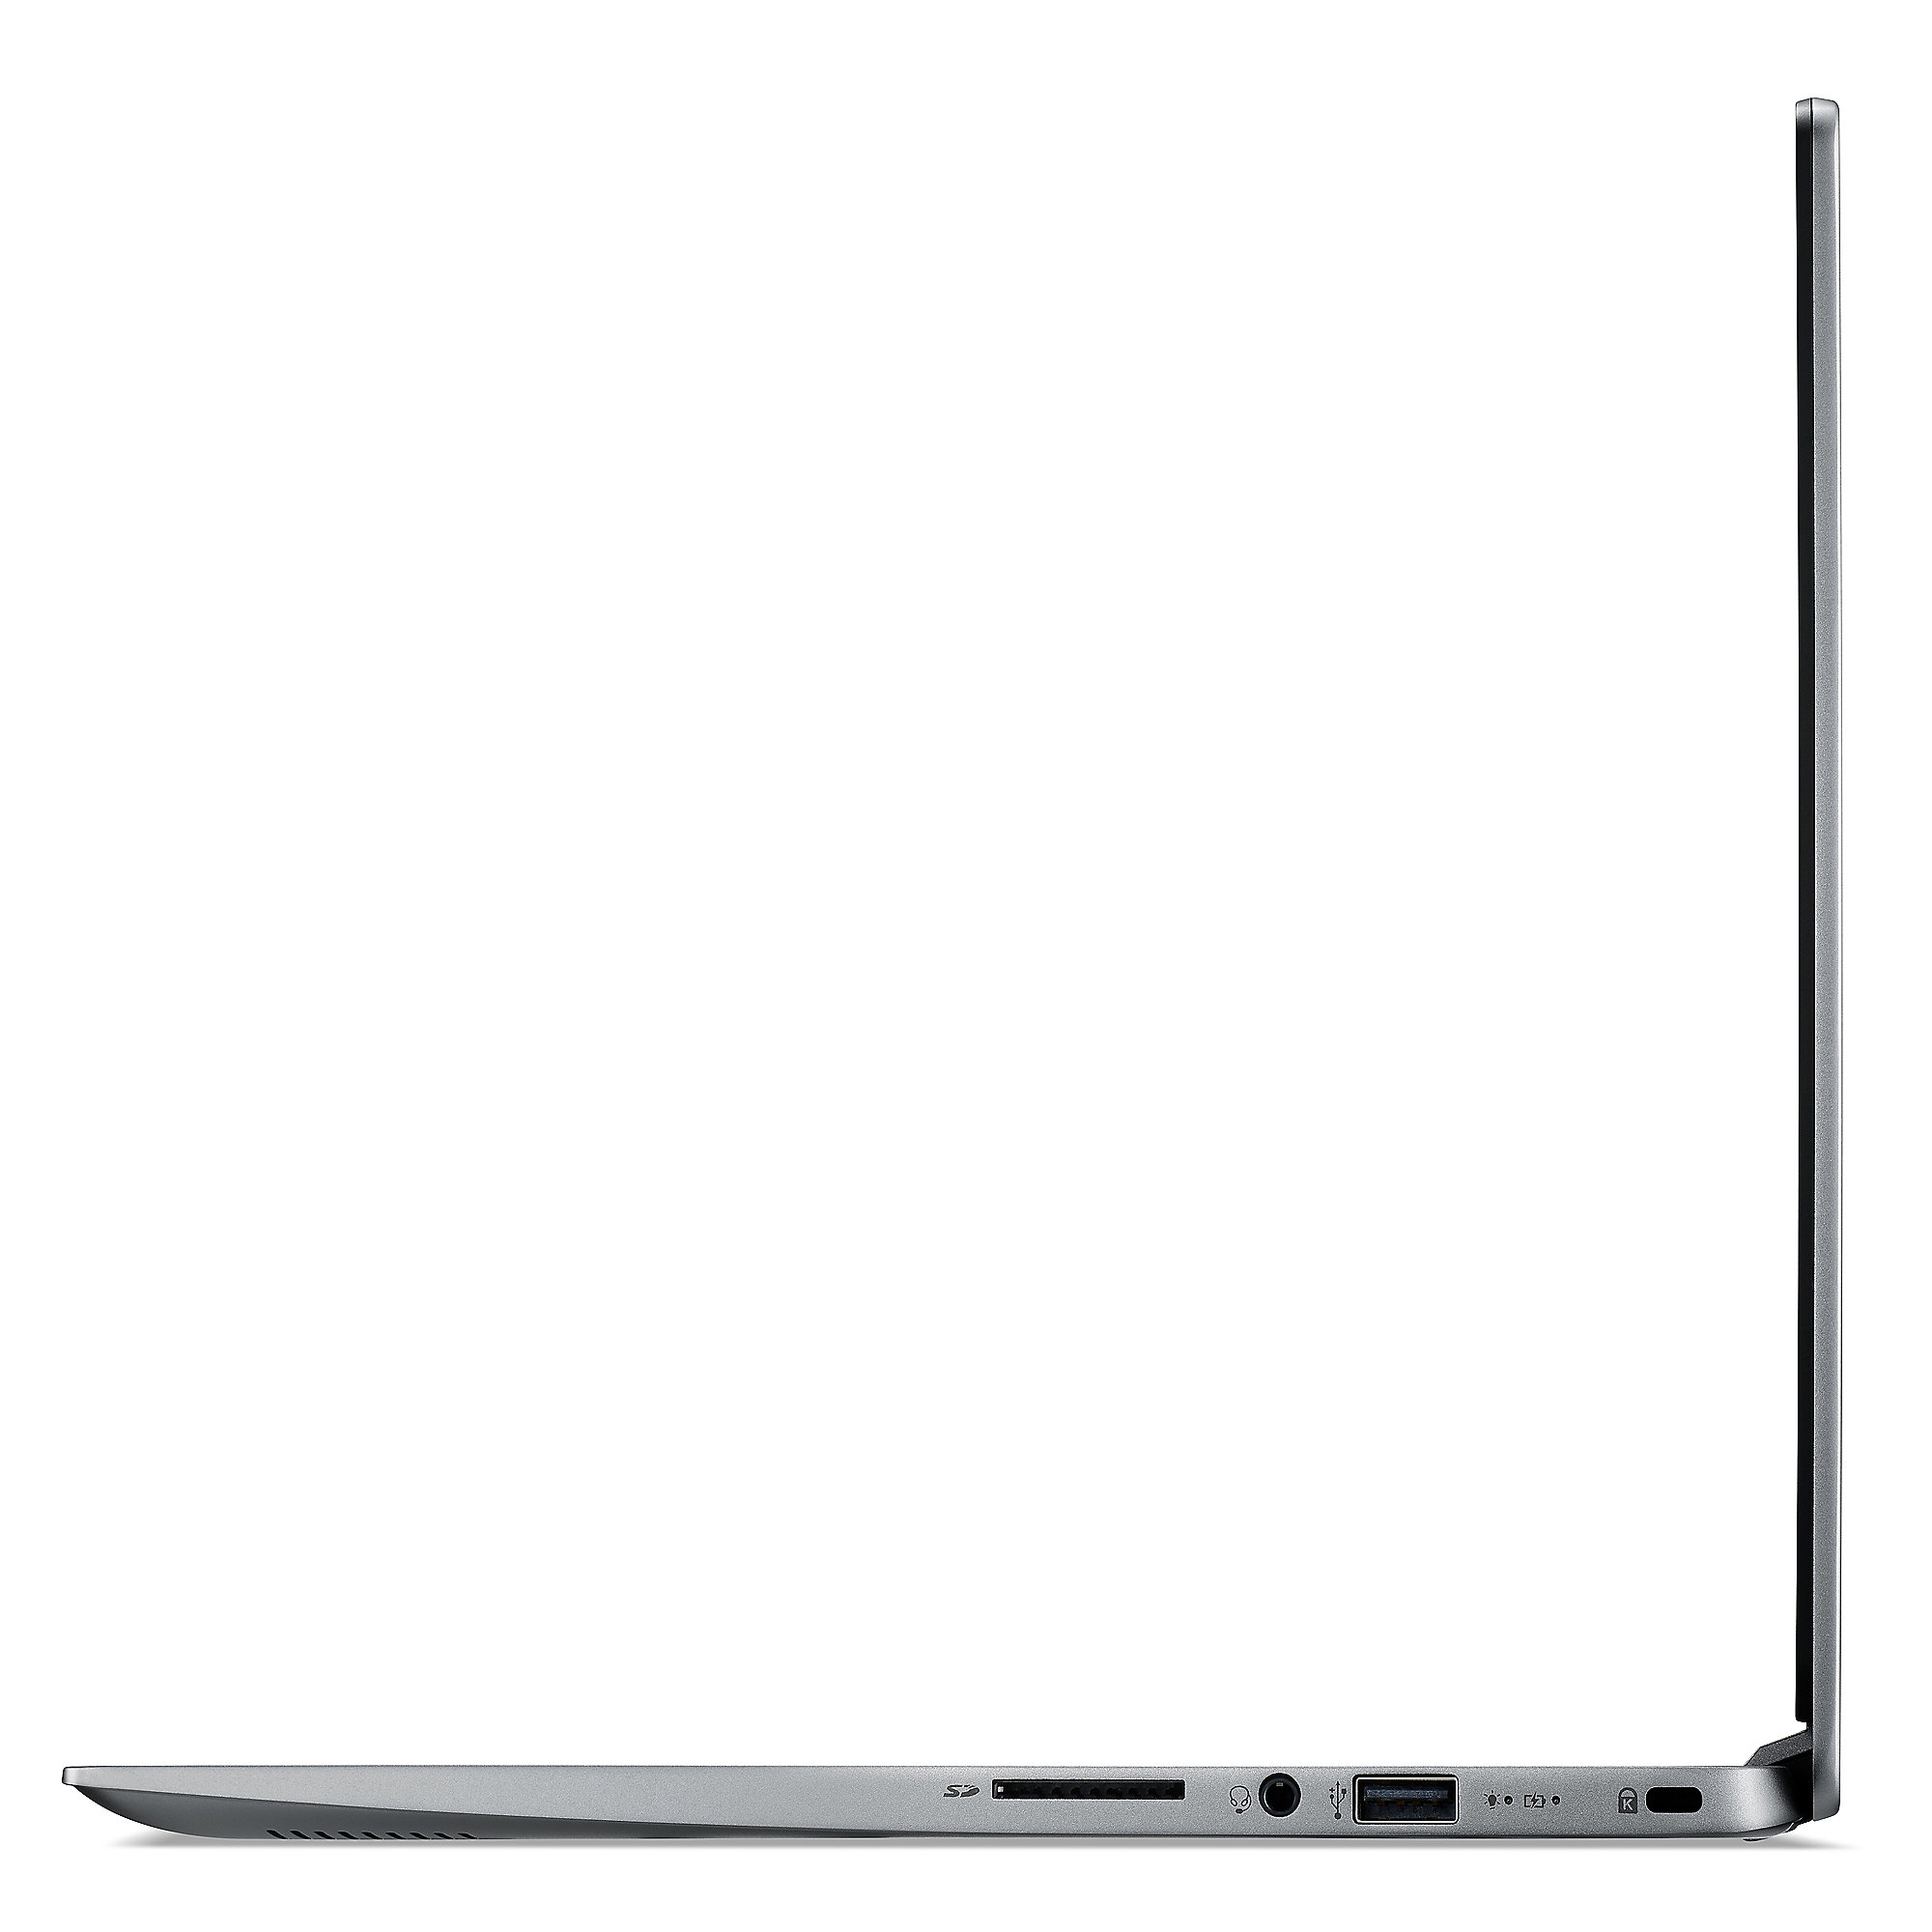
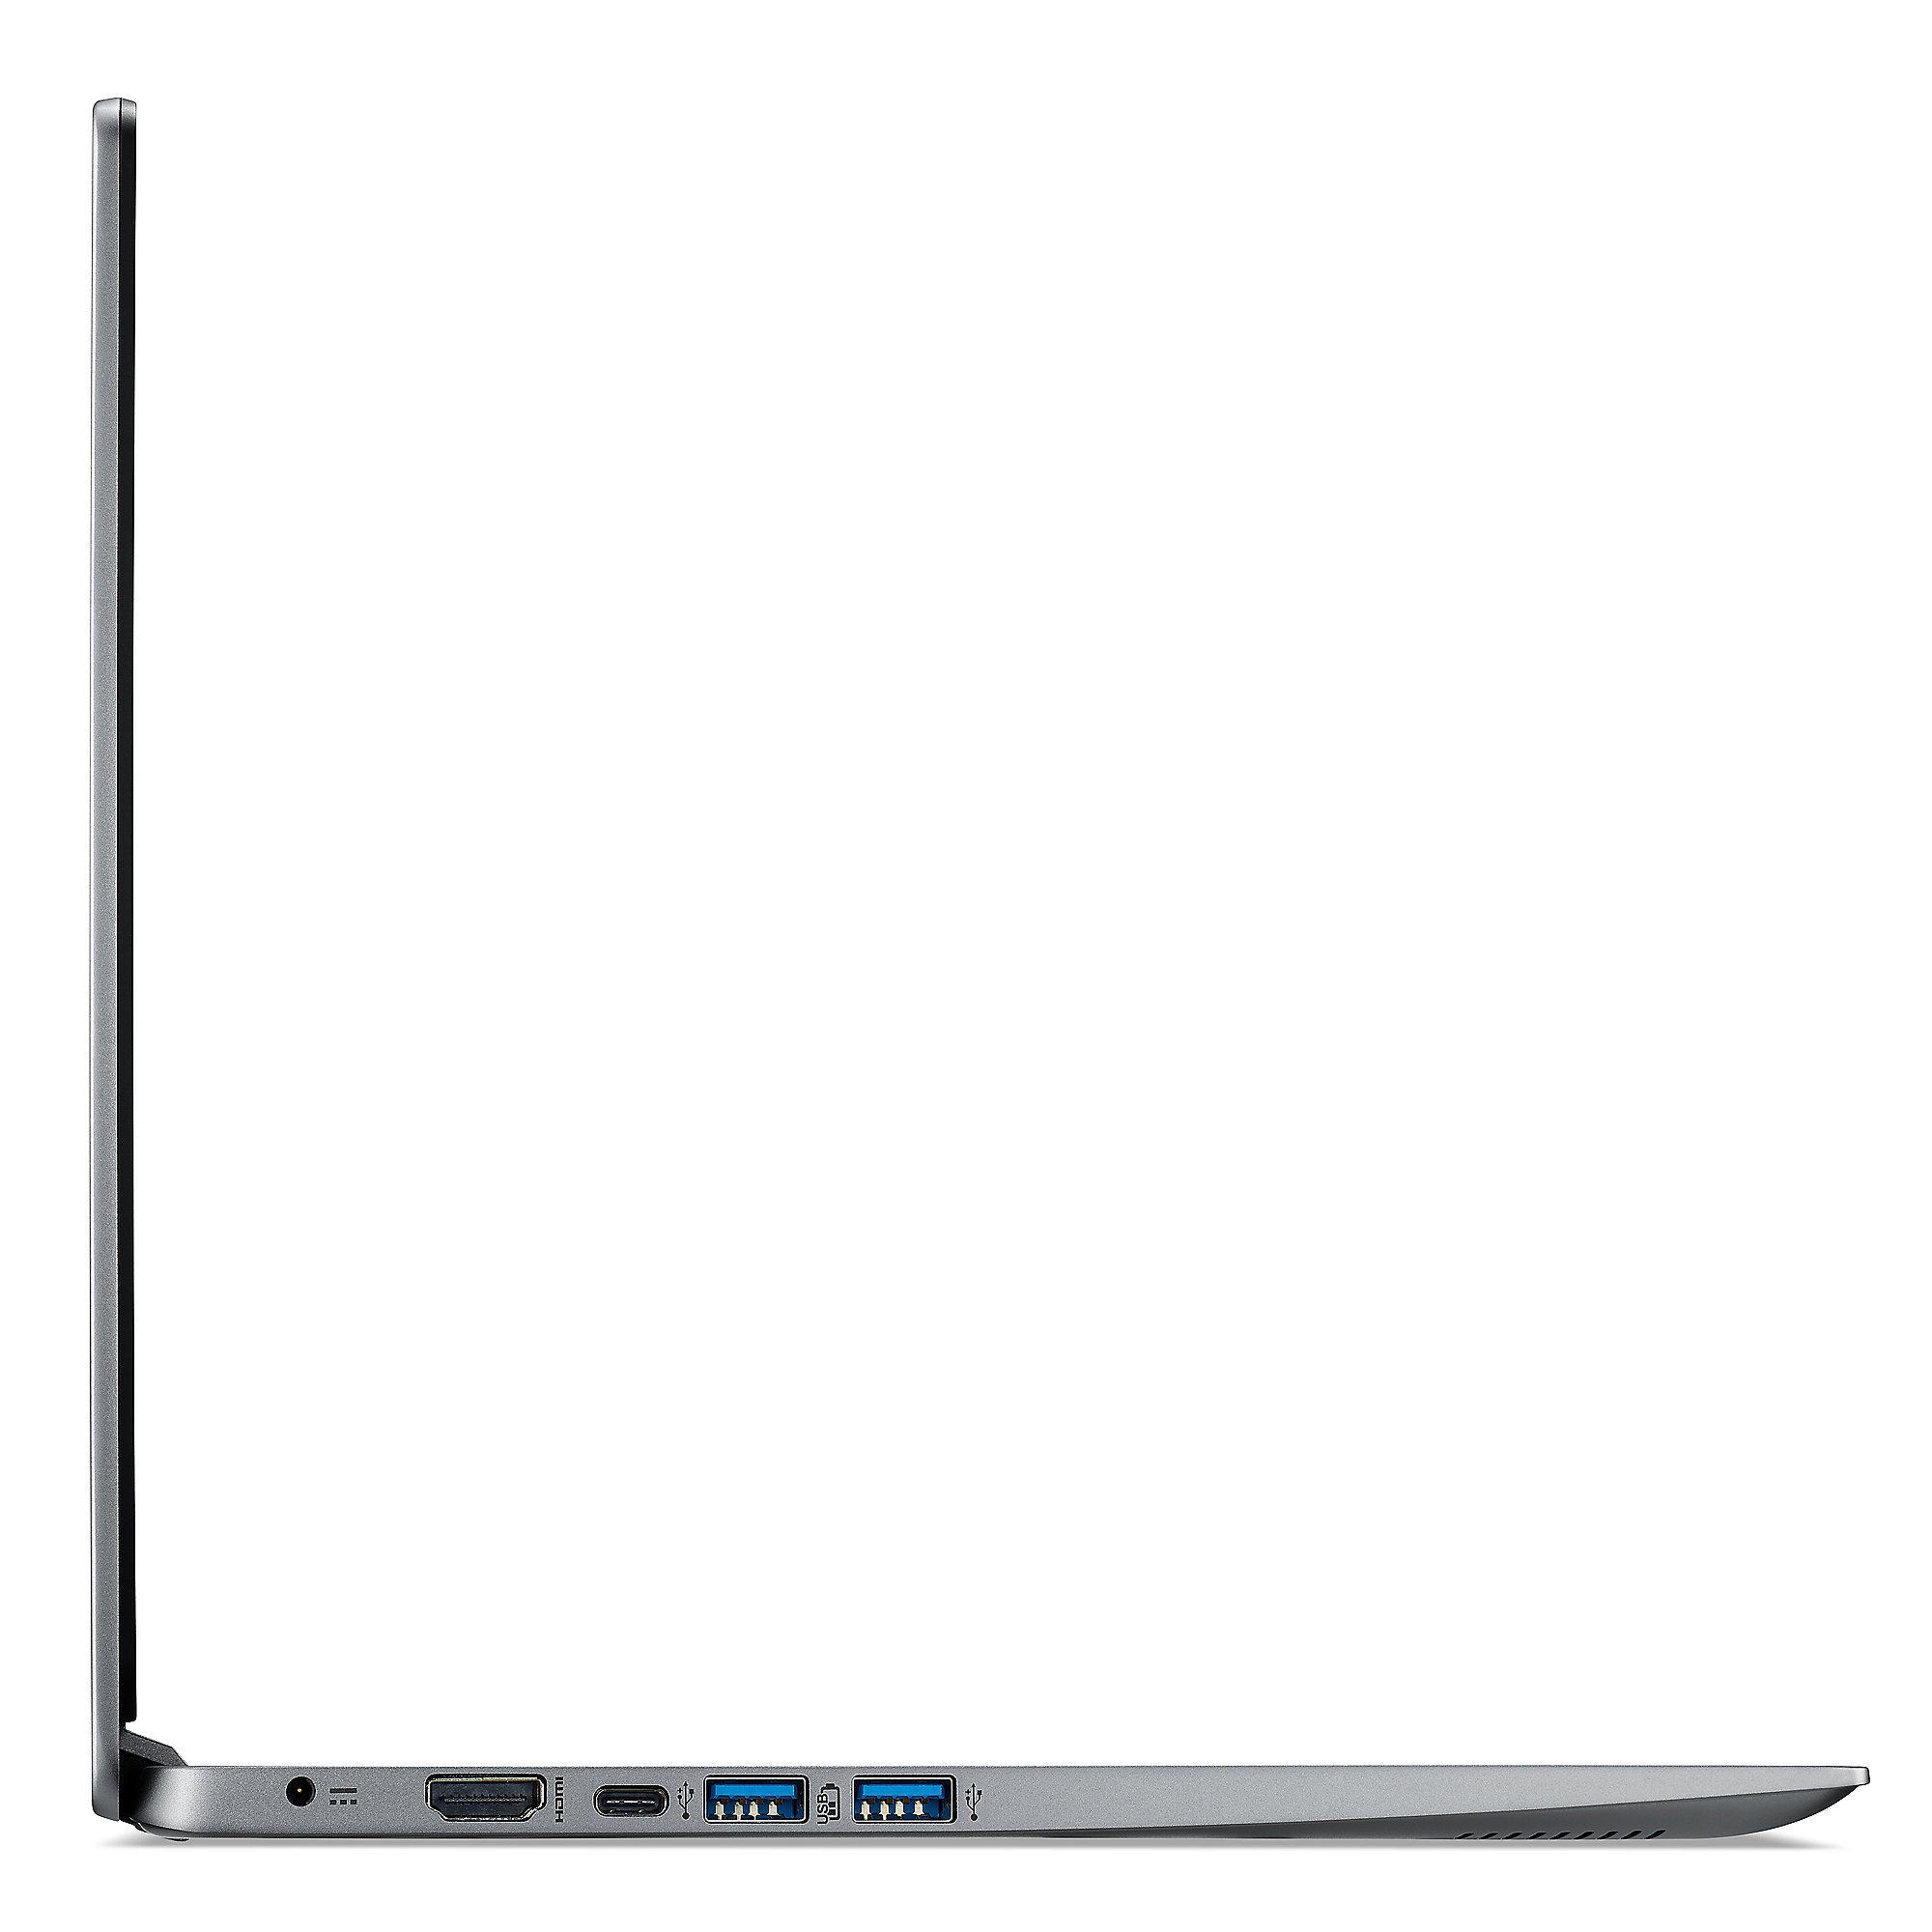
Connections


| SD Card Reader | |
| average JPG Copy Test (av. of 3 runs) | |
| HP Stream 14-ax002ng (Toshiba Exceria Pro SDXC 64 GB UHS-II) | |
| Moyenne de la classe Subnotebook (23.7 - 188, n=9, 2 dernières années) | |
| Lenovo Ideapad 120S-14IAP (Toshiba Exceria Pro M401 Reference-Card) | |
| Lenovo IdeaPad 100s-14IBR 80R900K5GE (Toshiba Exceria Pro M501 microSDXC 64GB) | |
| Asus VivoBook S14 S406UA-BV023T (Toshiba Exceria Pro M501 microSDXC 64GB) | |
| Chuwi LapBook 14 inch 2017 | |
| Acer Swift 1 SF114-32-P8GG (Toshiba Exceria Pro SDXC 64 GB UHS-II) | |
| HP 14-bp001ng (Toshiba Exceria Pro SDXC 64 GB UHS-II) | |
| Acer Swift 1 SF114-31-P6F6 (Toshiba Exceria Pro SDXC 64 GB UHS-II) | |
| maximum AS SSD Seq Read Test (1GB) | |
| Moyenne de la classe Subnotebook (24.9 - 195, n=8, 2 dernières années) | |
| Lenovo IdeaPad 100s-14IBR 80R900K5GE (Toshiba Exceria Pro M501 microSDXC 64GB) | |
| Lenovo Ideapad 120S-14IAP (Toshiba Exceria Pro M401 Reference-Card) | |
| HP Stream 14-ax002ng (Toshiba Exceria Pro SDXC 64 GB UHS-II) | |
| Chuwi LapBook 14 inch 2017 | |
| Asus VivoBook S14 S406UA-BV023T (Toshiba Exceria Pro M501 microSDXC 64GB) | |
| Acer Swift 1 SF114-32-P8GG (Toshiba Exceria Pro SDXC 64 GB UHS-II) | |
| HP 14-bp001ng (Toshiba Exceria Pro SDXC 64 GB UHS-II) | |
| Acer Swift 1 SF114-31-P6F6 (Toshiba Exceria Pro SDXC 64 GB UHS-II) | |
| Networking | |
| iperf3 transmit AX12 | |
| Acer Swift 1 SF114-32-P8GG | |
| Lenovo Ideapad 120S-14IAP | |
| Lenovo IdeaPad 100s-14IBR 80R900K5GE | |
| Asus VivoBook S14 S406UA-BV023T | |
| Chuwi LapBook 14 inch 2017 | |
| HP Stream 14-ax002ng | |
| Acer Swift 1 SF114-31-P6F6 (jseb) | |
| HP 14-bp001ng | |
| iperf3 receive AX12 | |
| Acer Swift 1 SF114-32-P8GG | |
| Chuwi LapBook 14 inch 2017 | |
| Lenovo Ideapad 120S-14IAP | |
| HP Stream 14-ax002ng | |
| Asus VivoBook S14 S406UA-BV023T | |
| Lenovo IdeaPad 100s-14IBR 80R900K5GE | |
| Acer Swift 1 SF114-31-P6F6 (jseb) | |
| HP 14-bp001ng | |
| |||||||||||||||||||||||||
Homogénéité de la luminosité: 81 %
Valeur mesurée au centre, sur batterie: 250 cd/m²
Contraste: 1923:1 (Valeurs des noirs: 0.13 cd/m²)
ΔE ColorChecker Calman: 5.54 | ∀{0.5-29.43 Ø4.71}
ΔE Greyscale Calman: 5.2 | ∀{0.09-98 Ø4.96}
56% sRGB (Argyll 1.6.3 3D)
36% AdobeRGB 1998 (Argyll 1.6.3 3D)
39.22% AdobeRGB 1998 (Argyll 3D)
56.5% sRGB (Argyll 3D)
37.96% Display P3 (Argyll 3D)
Gamma: 2.29
CCT: 5796 K
| Acer Swift 1 SF114-32-P8GG IPS, 1920x1080, 14" | Acer Swift 1 SF114-31-P6F6 TN LED, 1366x768, 14" | Chuwi LapBook 14 inch 2017 IPS, 1920x1080, 14.1" | HP 14-bp001ng TN LED, 1366x768, 14" | Asus VivoBook S14 S406UA-BV023T TN LED, 1366x768, 14" | Lenovo Ideapad 120S-14IAP TN LED, 1366x768, 14" | |
|---|---|---|---|---|---|---|
| Display | 8% | 12% | 7% | 2% | 9% | |
| Display P3 Coverage (%) | 37.96 | 40.97 8% | 42.53 12% | 40.43 7% | 38.82 2% | 41.32 9% |
| sRGB Coverage (%) | 56.5 | 61.5 9% | 63.6 13% | 60.8 8% | 58.2 3% | 62 10% |
| AdobeRGB 1998 Coverage (%) | 39.22 | 42.35 8% | 43.93 12% | 41.77 7% | 40.11 2% | 42.7 9% |
| Response Times | 9% | 9% | 24% | 27% | 28% | |
| Response Time Grey 50% / Grey 80% * (ms) | 42 ? | 32 ? 24% | 32.8 ? 22% | 43 ? -2% | 42 ? -0% | 35.2 ? 16% |
| Response Time Black / White * (ms) | 28 ? | 30 ? -7% | 29.2 ? -4% | 14 ? 50% | 13 ? 54% | 17.2 ? 39% |
| PWM Frequency (Hz) | 200 ? | 200 ? | 200 ? | 200 ? | 495 ? | |
| Screen | -44% | -30% | -75% | -52% | -80% | |
| Brightness middle (cd/m²) | 250 | 270 8% | 247.7 -1% | 189 -24% | 215 -14% | 257.4 3% |
| Brightness (cd/m²) | 240 | 247 3% | 243 1% | 190 -21% | 208 -13% | 239 0% |
| Brightness Distribution (%) | 81 | 80 -1% | 92 14% | 88 9% | 81 0% | 87 7% |
| Black Level * (cd/m²) | 0.13 | 0.57 -338% | 0.32 -146% | 0.53 -308% | 0.4 -208% | 0.54 -315% |
| Contrast (:1) | 1923 | 474 -75% | 774 -60% | 357 -81% | 538 -72% | 477 -75% |
| Colorchecker dE 2000 * | 5.54 | 3.01 46% | 6.4 -16% | 11.85 -114% | 9.37 -69% | 11.8 -113% |
| Colorchecker dE 2000 max. * | 10.5 | 6.33 40% | 24.3 -131% | 20.61 -96% | 15.84 -51% | 28 -167% |
| Greyscale dE 2000 * | 5.2 | 12.73 -145% | 4.5 13% | 13.6 -162% | 10.52 -102% | 13.3 -156% |
| Gamma | 2.29 96% | 2.36 93% | 2.33 94% | 2.49 88% | 2.45 90% | 2.2 100% |
| CCT | 5796 112% | 14629 44% | 7318 89% | 16588 39% | 11214 58% | 16811 39% |
| Color Space (Percent of AdobeRGB 1998) (%) | 36 | 39 8% | 39.8 11% | 49 36% | 37 3% | 39 8% |
| Color Space (Percent of sRGB) (%) | 56 | 62 11% | 62.9 12% | 61 9% | 58 4% | 62 11% |
| Moyenne finale (programmes/paramètres) | -9% /
-27% | -3% /
-17% | -15% /
-45% | -8% /
-31% | -14% /
-48% |
* ... Moindre est la valeur, meilleures sont les performances
Scintillement / MLI (Modulation de largeur d'impulsion)
| Scintillement / MLI (Modulation de largeur d'impulsion) non décelé |  | ||
En comparaison, 52 % des appareils testés n'emploient pas MDI pour assombrir leur écran. Nous avons relevé une moyenne à 7744 (minimum : 5 - maximum : 343500) Hz dans le cas où une MDI était active. | |||
Temps de réponse de l'écran
| ↔ Temps de réponse noir à blanc | ||
|---|---|---|
| 28 ms ... hausse ↗ et chute ↘ combinées | ↗ 16 ms hausse | 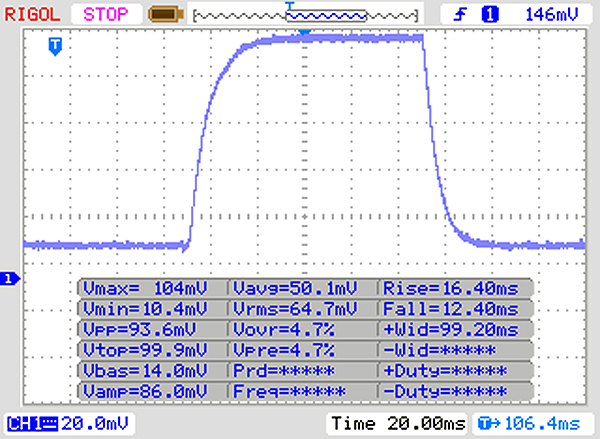 |
| ↘ 12 ms chute | ||
| L'écran souffre de latences relativement élevées, insuffisant pour le jeu. En comparaison, tous les appareils testés affichent entre 0.1 (minimum) et 240 (maximum) ms. » 71 % des appareils testés affichent de meilleures performances. Cela signifie que les latences relevées sont moins bonnes que la moyenne (19.8 ms) de tous les appareils testés. | ||
| ↔ Temps de réponse gris 50% à gris 80% | ||
| 42 ms ... hausse ↗ et chute ↘ combinées | ↗ 22 ms hausse | 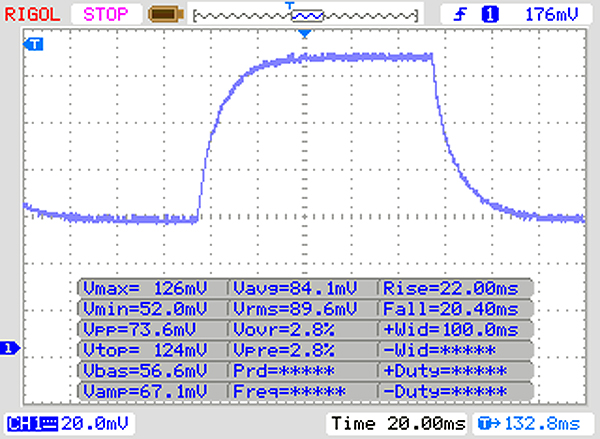 |
| ↘ 20 ms chute | ||
| L'écran souffre de latences très élevées, à éviter pour le jeu. En comparaison, tous les appareils testés affichent entre 0.165 (minimum) et 636 (maximum) ms. » 67 % des appareils testés affichent de meilleures performances. Cela signifie que les latences relevées sont moins bonnes que la moyenne (30.9 ms) de tous les appareils testés. | ||
| Cinebench R15 | |
| CPU Single 64Bit | |
| Moyenne de la classe Subnotebook (72.4 - 322, n=56, 2 dernières années) | |
| Asus VivoBook S14 S406UA-BV023T | |
| Lenovo IdeaPad V110-15IKB 80TH001SGE | |
| Lenovo B50-50 80S2000QGE | |
| Moyenne Intel Pentium Silver N5000 (73 - 80, n=12) | |
| Acer Swift 1 SF114-32-P8GG | |
| Acer Swift 1 SF113-31-P2CP | |
| Asus VivoBook Flip 14 TP401NA | |
| Dell Latitude 3180 | |
| Dell Latitude 3189 | |
| Lenovo Ideapad 120S-14IAP | |
| Acer Swift 1 SF114-31-P6F6 | |
| HP 14-bp001ng | |
| Lenovo IdeaPad 100s-14IBR 80R900K5GE | |
| Chuwi LapBook 14 inch 2017 | |
| HP Stream 14-ax002ng | |
| CPU Multi 64Bit | |
| Moyenne de la classe Subnotebook (327 - 3345, n=56, 2 dernières années) | |
| Asus VivoBook S14 S406UA-BV023T | |
| Lenovo IdeaPad V110-15IKB 80TH001SGE | |
| Moyenne Intel Pentium Silver N5000 (210 - 284, n=12) | |
| Acer Swift 1 SF114-32-P8GG | |
| Lenovo B50-50 80S2000QGE | |
| Dell Latitude 3180 | |
| Dell Latitude 3189 | |
| Asus VivoBook Flip 14 TP401NA | |
| Acer Swift 1 SF114-31-P6F6 | |
| Acer Swift 1 SF113-31-P2CP | |
| HP 14-bp001ng | |
| Chuwi LapBook 14 inch 2017 | |
| Lenovo Ideapad 120S-14IAP | |
| Lenovo IdeaPad 100s-14IBR 80R900K5GE | |
| HP Stream 14-ax002ng | |
| Geekbench 3 | |
| 32 Bit Multi-Core Score | |
| Moyenne de la classe Subnotebook (n=12 dernières années) | |
| Asus VivoBook S14 S406UA-BV023T | |
| Moyenne Intel Pentium Silver N5000 (5045 - 5868, n=6) | |
| Acer Swift 1 SF114-32-P8GG | |
| Lenovo IdeaPad V110-15IKB 80TH001SGE | |
| Dell Latitude 3180 | |
| Asus VivoBook Flip 14 TP401NA | |
| Lenovo B50-50 80S2000QGE | |
| Acer Swift 1 SF114-31-P6F6 | |
| Lenovo IdeaPad 100s-14IBR 80R900K5GE | |
| 32 Bit Single-Core Score | |
| Moyenne de la classe Subnotebook (n=12 dernières années) | |
| Asus VivoBook S14 S406UA-BV023T | |
| Lenovo IdeaPad V110-15IKB 80TH001SGE | |
| Lenovo B50-50 80S2000QGE | |
| Moyenne Intel Pentium Silver N5000 (1707 - 1876, n=6) | |
| Acer Swift 1 SF114-32-P8GG | |
| Dell Latitude 3180 | |
| Asus VivoBook Flip 14 TP401NA | |
| Acer Swift 1 SF114-31-P6F6 | |
| Lenovo IdeaPad 100s-14IBR 80R900K5GE | |
| Geekbench 4.0 | |
| 64 Bit Multi-Core Score | |
| Moyenne de la classe Subnotebook (n=12 dernières années) | |
| Asus VivoBook S14 S406UA-BV023T | |
| Moyenne Intel Pentium Silver N5000 (5211 - 5654, n=4) | |
| Lenovo IdeaPad V110-15IKB 80TH001SGE | |
| Acer Swift 1 SF114-32-P8GG | |
| Dell Latitude 3180 | |
| Asus VivoBook Flip 14 TP401NA | |
| Acer Swift 1 SF114-31-P6F6 | |
| Lenovo IdeaPad 100s-14IBR 80R900K5GE | |
| 64 Bit Single-Core Score | |
| Moyenne de la classe Subnotebook (n=12 dernières années) | |
| Asus VivoBook S14 S406UA-BV023T | |
| Lenovo IdeaPad V110-15IKB 80TH001SGE | |
| Moyenne Intel Pentium Silver N5000 (2009 - 2084, n=4) | |
| Acer Swift 1 SF114-32-P8GG | |
| Dell Latitude 3180 | |
| Asus VivoBook Flip 14 TP401NA | |
| Acer Swift 1 SF114-31-P6F6 | |
| Lenovo IdeaPad 100s-14IBR 80R900K5GE | |
| JetStream 1.1 - 1.1 Total | |
| Asus VivoBook S14 S406UA-BV023T (Edge 41) | |
| Moyenne de la classe Subnotebook (n=12 dernières années) | |
| Lenovo IdeaPad V110-15IKB 80TH001SGE (Edge 40) | |
| Lenovo B50-50 80S2000QGE (Edge 25.10586.0.0) | |
| Acer Swift 1 SF114-32-P8GG (Edge 42) | |
| Moyenne Intel Pentium Silver N5000 (104.4 - 109.8, n=6) | |
| Dell Latitude 3180 (Edge 40) | |
| Dell Latitude 3189 (Edge 38.14393.0.0) | |
| Asus VivoBook Flip 14 TP401NA (Edge 41) | |
| Chuwi LapBook 14 inch 2017 (Edge 38.14393.1066.0) | |
| Lenovo Ideapad 120S-14IAP (Microsoft Edge 40.15063.674.0) | |
| Acer Swift 1 SF114-31-P6F6 (Edge 38) | |
| Acer Swift 1 SF113-31-P2CP | |
| Lenovo IdeaPad 100s-14IBR 80R900K5GE (Edge 41) | |
| HP 14-bp001ng | |
| PCMark 7 Score | 4382 points | |
| PCMark 8 Home Score Accelerated v2 | 2141 points | |
| PCMark 8 Creative Score Accelerated v2 | 2528 points | |
| PCMark 8 Work Score Accelerated v2 | 3259 points | |
| PCMark 10 Score | 1926 points | |
Aide | ||

| Acer Swift 1 SF114-32-P8GG Micron 1100 MTFDDAV256TBN | Acer Swift 1 SF114-31-P6F6 128 GB eMMC Flash | HP 14-bp001ng Toshiba MQ01ABF050 | Asus VivoBook S14 S406UA-BV023T SanDisk SD8SN8U256G1002 | Moyenne Micron 1100 MTFDDAV256TBN | Moyenne de la classe Subnotebook | |
|---|---|---|---|---|---|---|
| CrystalDiskMark 3.0 | -67% | -90% | 23% | 26% | ||
| Read Seq (MB/s) | 425.2 | 166.5 -61% | 104.4 -75% | 480.1 13% | 465 ? 9% | |
| Write Seq (MB/s) | 377.3 | 85 -77% | 99.1 -74% | 440.3 17% | 379 ? 0% | |
| Read 512 (MB/s) | 280.3 | 153.8 -45% | 31.74 -89% | 277.5 -1% | 315 ? 12% | |
| Write 512 (MB/s) | 346.6 | 75.6 -78% | 40.27 -88% | 300.6 -13% | 315 ? -9% | |
| Read 4k (MB/s) | 19.78 | 13.2 -33% | 0.384 -98% | 28.18 42% | 24.6 ? 24% | |
| Write 4k (MB/s) | 62.4 | 13.04 -79% | 0.911 -99% | 52.6 -16% | 80.8 ? 29% | |
| Read 4k QD32 (MB/s) | 148.7 | 35.12 -76% | 0.776 -99% | 273.4 84% | 227 ? 53% | |
| Write 4k QD32 (MB/s) | 123 | 12.66 -90% | 0.912 -99% | 192.4 56% | 233 ? 89% |
| 3DMark 03 Standard | 8388 points | |
| 3DMark 05 Standard | 5802 points | |
| 3DMark 06 Standard Score | 2882 points | |
| 3DMark Vantage P Result | 2162 points | |
| 3DMark 11 Performance | 682 points | |
| 3DMark Ice Storm Standard Score | 26475 points | |
| 3DMark Cloud Gate Standard Score | 2975 points | |
| 3DMark Fire Strike Score | 397 points | |
Aide | ||
| 3DMark 11 - 1280x720 Performance GPU | |
| Moyenne de la classe Subnotebook (995 - 18489, n=54, 2 dernières années) | |
| Asus VivoBook S14 S406UA-BV023T | |
| Dell Latitude 3180 | |
| Moyenne Intel UHD Graphics 605 (588 - 902, n=14) | |
| Acer Swift 1 SF114-32-P8GG | |
| Asus VivoBook Flip 14 TP401NA | |
| Acer Aspire ES1-332-P91H | |
| Acer Swift 1 SF114-31-P6F6 | |
| HP 14-bp001ng | |
| Chuwi LapBook 14 inch 2017 | |
| HP Stream 14-ax002ng | |
| Lenovo IdeaPad 100s-14IBR 80R900K5GE | |
| ComputeMark v2.1 - 1024x600 Normal, Score | |
| Moyenne de la classe Subnotebook (944 - 10728, n=11, 2 dernières années) | |
| Moyenne Intel UHD Graphics 605 (432 - 549, n=2) | |
| Acer Swift 1 SF114-32-P8GG | |
| Acer Aspire ES1-332-P91H | |
| Lenovo Ideapad 120S-14IAP | |
| Chuwi LapBook 14 inch 2017 | |
| LuxMark v2.0 64Bit | |
| Room GPUs-only | |
| Moyenne de la classe Subnotebook (42 - 877, n=10, 2 dernières années) | |
| Moyenne Intel UHD Graphics 605 (67 - 120, n=2) | |
| Acer Swift 1 SF114-32-P8GG | |
| Acer Aspire ES1-332-P91H | |
| Sala GPUs-only | |
| Moyenne de la classe Subnotebook (53 - 2908, n=10, 2 dernières années) | |
| Moyenne Intel UHD Graphics 605 (96 - 188, n=2) | |
| Acer Swift 1 SF114-32-P8GG | |
| Acer Aspire ES1-332-P91H | |
| GFXBench (DX / GLBenchmark) 2.7 | |
| 1920x1080 T-Rex Offscreen | |
| Moyenne de la classe Subnotebook (81 - 915, n=7, 2 dernières années) | |
| Acer Aspire ES1-332-P91H | |
| Acer Swift 1 SF114-32-P8GG | |
| Moyenne Intel UHD Graphics 605 (32 - 51.9, n=3) | |
| T-Rex Onscreen | |
| Moyenne de la classe Subnotebook (54.3 - 794, n=7, 2 dernières années) | |
| Acer Aspire ES1-332-P91H | |
| Moyenne Intel UHD Graphics 605 (24 - 67.5, n=3) | |
| Acer Swift 1 SF114-32-P8GG | |
| GFXBench 3.0 | |
| 1920x1080 1080p Manhattan Offscreen | |
| Moyenne de la classe Subnotebook (206 - 591, n=6, 2 dernières années) | |
| Moyenne Intel UHD Graphics 605 (16 - 33.4, n=3) | |
| Acer Swift 1 SF114-32-P8GG | |
| Acer Aspire ES1-332-P91H | |
| on screen Manhattan Onscreen OGL | |
| Moyenne de la classe Subnotebook (60 - 338, n=6, 2 dernières années) | |
| Acer Aspire ES1-332-P91H | |
| Moyenne Intel UHD Graphics 605 (14 - 42.2, n=3) | |
| Acer Swift 1 SF114-32-P8GG | |
| GFXBench 3.1 | |
| 1920x1080 Manhattan ES 3.1 Offscreen | |
| Moyenne de la classe Subnotebook (157.5 - 336, n=6, 2 dernières années) | |
| Moyenne Intel UHD Graphics 605 (13 - 23.3, n=3) | |
| Acer Swift 1 SF114-32-P8GG | |
| Acer Aspire ES1-332-P91H | |
| on screen Manhattan ES 3.1 Onscreen | |
| Moyenne de la classe Subnotebook (60 - 222, n=6, 2 dernières années) | |
| Acer Aspire ES1-332-P91H | |
| Moyenne Intel UHD Graphics 605 (11 - 35.5, n=3) | |
| Acer Swift 1 SF114-32-P8GG | |
| GFXBench | |
| 1920x1080 Car Chase Offscreen | |
| Moyenne de la classe Subnotebook (107.4 - 260, n=8, 2 dernières années) | |
| Acer Swift 1 SF114-32-P8GG | |
| Moyenne Intel UHD Graphics 605 (7.1 - 14.6, n=3) | |
| Acer Aspire ES1-332-P91H | |
| on screen Car Chase Onscreen | |
| Moyenne de la classe Subnotebook (50.5 - 154.5, n=8, 2 dernières années) | |
| Acer Aspire ES1-332-P91H | |
| Moyenne Intel UHD Graphics 605 (7.7 - 25.1, n=3) | |
| Acer Swift 1 SF114-32-P8GG | |
| Geekbench 4.0 - Compute OpenCL Score | |
| Asus VivoBook S14 S406UA-BV023T | |
| Moyenne Intel UHD Graphics 605 (9118 - 16860, n=4) | |
| Dell Latitude 3180 | |
| Acer Aspire ES1-332-P91H | |
| Acer Swift 1 SF114-31-P6F6 | |
| Acer Swift 1 SF114-32-P8GG | |
| Asus VivoBook Flip 14 TP401NA | |
| Lenovo IdeaPad 100s-14IBR 80R900K5GE | |
| Geekbench 4.4 - Compute OpenCL Score | |
| Moyenne de la classe Subnotebook (60571 - 101219, n=5, 2 dernières années) | |
| Asus VivoBook S14 S406UA-BV023T | |
| Moyenne Intel UHD Graphics 605 (9226 - 17429, n=9) | |
| Dell Latitude 3180 | |
| Acer Swift 1 SF114-32-P8GG | |
| Asus VivoBook Flip 14 TP401NA | |
| Lenovo IdeaPad 100s-14IBR 80R900K5GE | |
| Bas | Moyen | Élevé | Ultra | |
|---|---|---|---|---|
| StarCraft 2 (2010) | 78.7 | 17.4 | 10 | 3.9 |
| Dirt 3 (2011) | 55.6 | 22.7 | 15.2 | 12.5 |
| Deus Ex Human Revolution (2011) | 27.4 | 21.2 | 6.7 | |
| The Elder Scrolls V: Skyrim (2011) | 19.9 | 12.3 | 7.5 | |
| Anno 2070 (2011) | 35 | 18 | 11.4 | |
| Diablo III (2012) | 28.8 | 21.1 | 18.6 | 12.5 |
| Dead Space 3 (2013) | 32.3 | 17.1 | 14.1 | |
| Tomb Raider (2013) | 31.6 | 18.5 | 12.5 | |
| BioShock Infinite (2013) | 20.1 | 10.8 | 9.4 | 2.8 |
| GRID 2 (2013) | 34.7 | 17.1 | ||
| GRID: Autosport (2014) | 58.5 | 16.5 | 12.5 | |
| Risen 3: Titan Lords (2014) | 14.3 | 9.5 | ||
| Sims 4 (2014) | 96.9 | 21.8 | 10.5 | |
| Middle-earth: Shadow of Mordor (2014) | 14.4 | 9.3 | ||
| F1 2014 (2014) | 31 | 20 | 13 | |
| Dragon Age: Inquisition (2014) | 7.8 | 6.2 | ||
| Battlefield Hardline (2015) | 10.9 | 9.5 | 4 | |
| Dirt Rally (2015) | 42 | 12.5 | ||
| Metal Gear Solid V (2015) | 21.6 | 15.8 | ||
| Dota 2 Reborn (2015) | 32.5 | 14.3 | 6.7 | |
| World of Warships (2015) | 22.7 | 14.3 | ||
| Rainbow Six Siege (2015) | 12.3 | |||
| The Division (2016) | 4.3 | |||
| Overwatch (2016) | 11.4 | 8.3 | ||
| Civilization 6 (2016) | 12.7 | 5.5 | ||
| For Honor (2017) | 9 | |||
| Ghost Recon Wildlands (2017) | 3.2 | |||
| Prey (2017) | 5.5 | |||
| Rocket League (2017) | 26.8 | 9.9 | ||
| Team Fortress 2 (2017) | 38 | 34.5 | 17 | |
| F1 2017 (2017) | 13 | |||
| Middle-earth: Shadow of War (2017) | 7 | |||
| X-Plane 11.11 (2018) | 6.4 | |||
| Far Cry 5 (2018) | 3 |
(+) La température maximale du côté supérieur est de 36.5 °C / 98 F, par rapport à la moyenne de 35.9 °C / 97 F, allant de 21.4 à 59 °C pour la classe Subnotebook.
(+) Le fond chauffe jusqu'à un maximum de 39.7 °C / 103 F, contre une moyenne de 39.2 °C / 103 F
(+) En utilisation inactive, la température moyenne du côté supérieur est de 25.5 °C / 78 F, par rapport à la moyenne du dispositif de 30.8 °C / 87 F.
(+) Les repose-poignets et le pavé tactile sont plus froids que la température de la peau avec un maximum de 30.3 °C / 86.5 F et sont donc froids au toucher.
(-) La température moyenne de la zone de l'appui-paume de dispositifs similaires était de 28.2 °C / 82.8 F (-2.1 °C / #-3.7 F).
Acer Swift 1 SF114-32-P8GG analyse audio
(-) | haut-parleurs pas très forts (68.1 dB)
Basses 100 - 315 Hz
(-) | presque aucune basse - en moyenne 23.2% plus bas que la médiane
(±) | la linéarité des basses est moyenne (10.6% delta à la fréquence précédente)
Médiums 400 - 2000 Hz
(+) | médiane équilibrée - seulement 2.9% de la médiane
(±) | la linéarité des médiums est moyenne (9.3% delta à la fréquence précédente)
Aiguës 2 - 16 kHz
(+) | des sommets équilibrés - à seulement 2.4% de la médiane
(+) | les aigus sont linéaires (6% delta à la fréquence précédente)
Globalement 100 - 16 000 Hz
(±) | la linéarité du son global est moyenne (21.5% de différence avec la médiane)
Par rapport à la même classe
» 73% de tous les appareils testés de cette catégorie étaient meilleurs, 5% similaires, 21% pires
» Le meilleur avait un delta de 5%, la moyenne était de 18%, le pire était de 53%.
Par rapport à tous les appareils testés
» 61% de tous les appareils testés étaient meilleurs, 7% similaires, 32% pires
» Le meilleur avait un delta de 4%, la moyenne était de 23%, le pire était de 134%.
Apple MacBook 12 (Early 2016) 1.1 GHz analyse audio
(+) | les haut-parleurs peuvent jouer relativement fort (83.6# dB)
Basses 100 - 315 Hz
(±) | basse réduite - en moyenne 11.3% inférieure à la médiane
(±) | la linéarité des basses est moyenne (14.2% delta à la fréquence précédente)
Médiums 400 - 2000 Hz
(+) | médiane équilibrée - seulement 2.4% de la médiane
(+) | les médiums sont linéaires (5.5% delta à la fréquence précédente)
Aiguës 2 - 16 kHz
(+) | des sommets équilibrés - à seulement 2% de la médiane
(+) | les aigus sont linéaires (4.5% delta à la fréquence précédente)
Globalement 100 - 16 000 Hz
(+) | le son global est linéaire (10.2% différence à la médiane)
Par rapport à la même classe
» 7% de tous les appareils testés de cette catégorie étaient meilleurs, 2% similaires, 90% pires
» Le meilleur avait un delta de 5%, la moyenne était de 18%, le pire était de 53%.
Par rapport à tous les appareils testés
» 5% de tous les appareils testés étaient meilleurs, 1% similaires, 94% pires
» Le meilleur avait un delta de 4%, la moyenne était de 23%, le pire était de 134%.
| Éteint/en veille | |
| Au repos | |
| Fortement sollicité |
|
Légende:
min: | |
| Battery Runtime - WiFi Websurfing | |
| Moyenne de la classe Subnotebook (7.25 - 24, n=59, 2 dernières années) | |
| Acer Swift 1 SF114-32-P8GG | |
| Acer Swift 1 SF114-31-P6F6 | |
| HP Stream 14-ax002ng | |
| Asus VivoBook S14 S406UA-BV023T | |
| Lenovo Ideapad 120S-14IAP | |
| HP 14-bp001ng | |
| Chuwi LapBook 14 inch 2017 | |
| Lenovo IdeaPad 100s-14IBR 80R900K5GE | |
Points positifs
Points négatifs
Avec le Swift 1 SF114-32, Acer a créé un ordinateur portable de 14 pouces qui représente un véritable progrès par rapport à son prédécesseur. Le châssis élégant, fin et compact en métal donne une bonne première impression.
Le processeur Pentium Silver N5000 augmente nettement la puissance de calcul par rapport à son prédécesseur, le Pentium N4200, se rapprochant des processeur Core i3 Broadwell. Ses performances suffisent pour les tâches de bureautique et Internet. Comme un décodeur intégré à la carte graphique prend en charge une partie de la charge processeur lors de la lecture de vidéos, l’utilisation de services de streaming ne devrait pas non plus être un problème.
Le Swift 1 SF114-32-P8GG sait séduire. Pour presque 600 €, Acer propose un appareil équilibré qui devrait avoir ses fans.
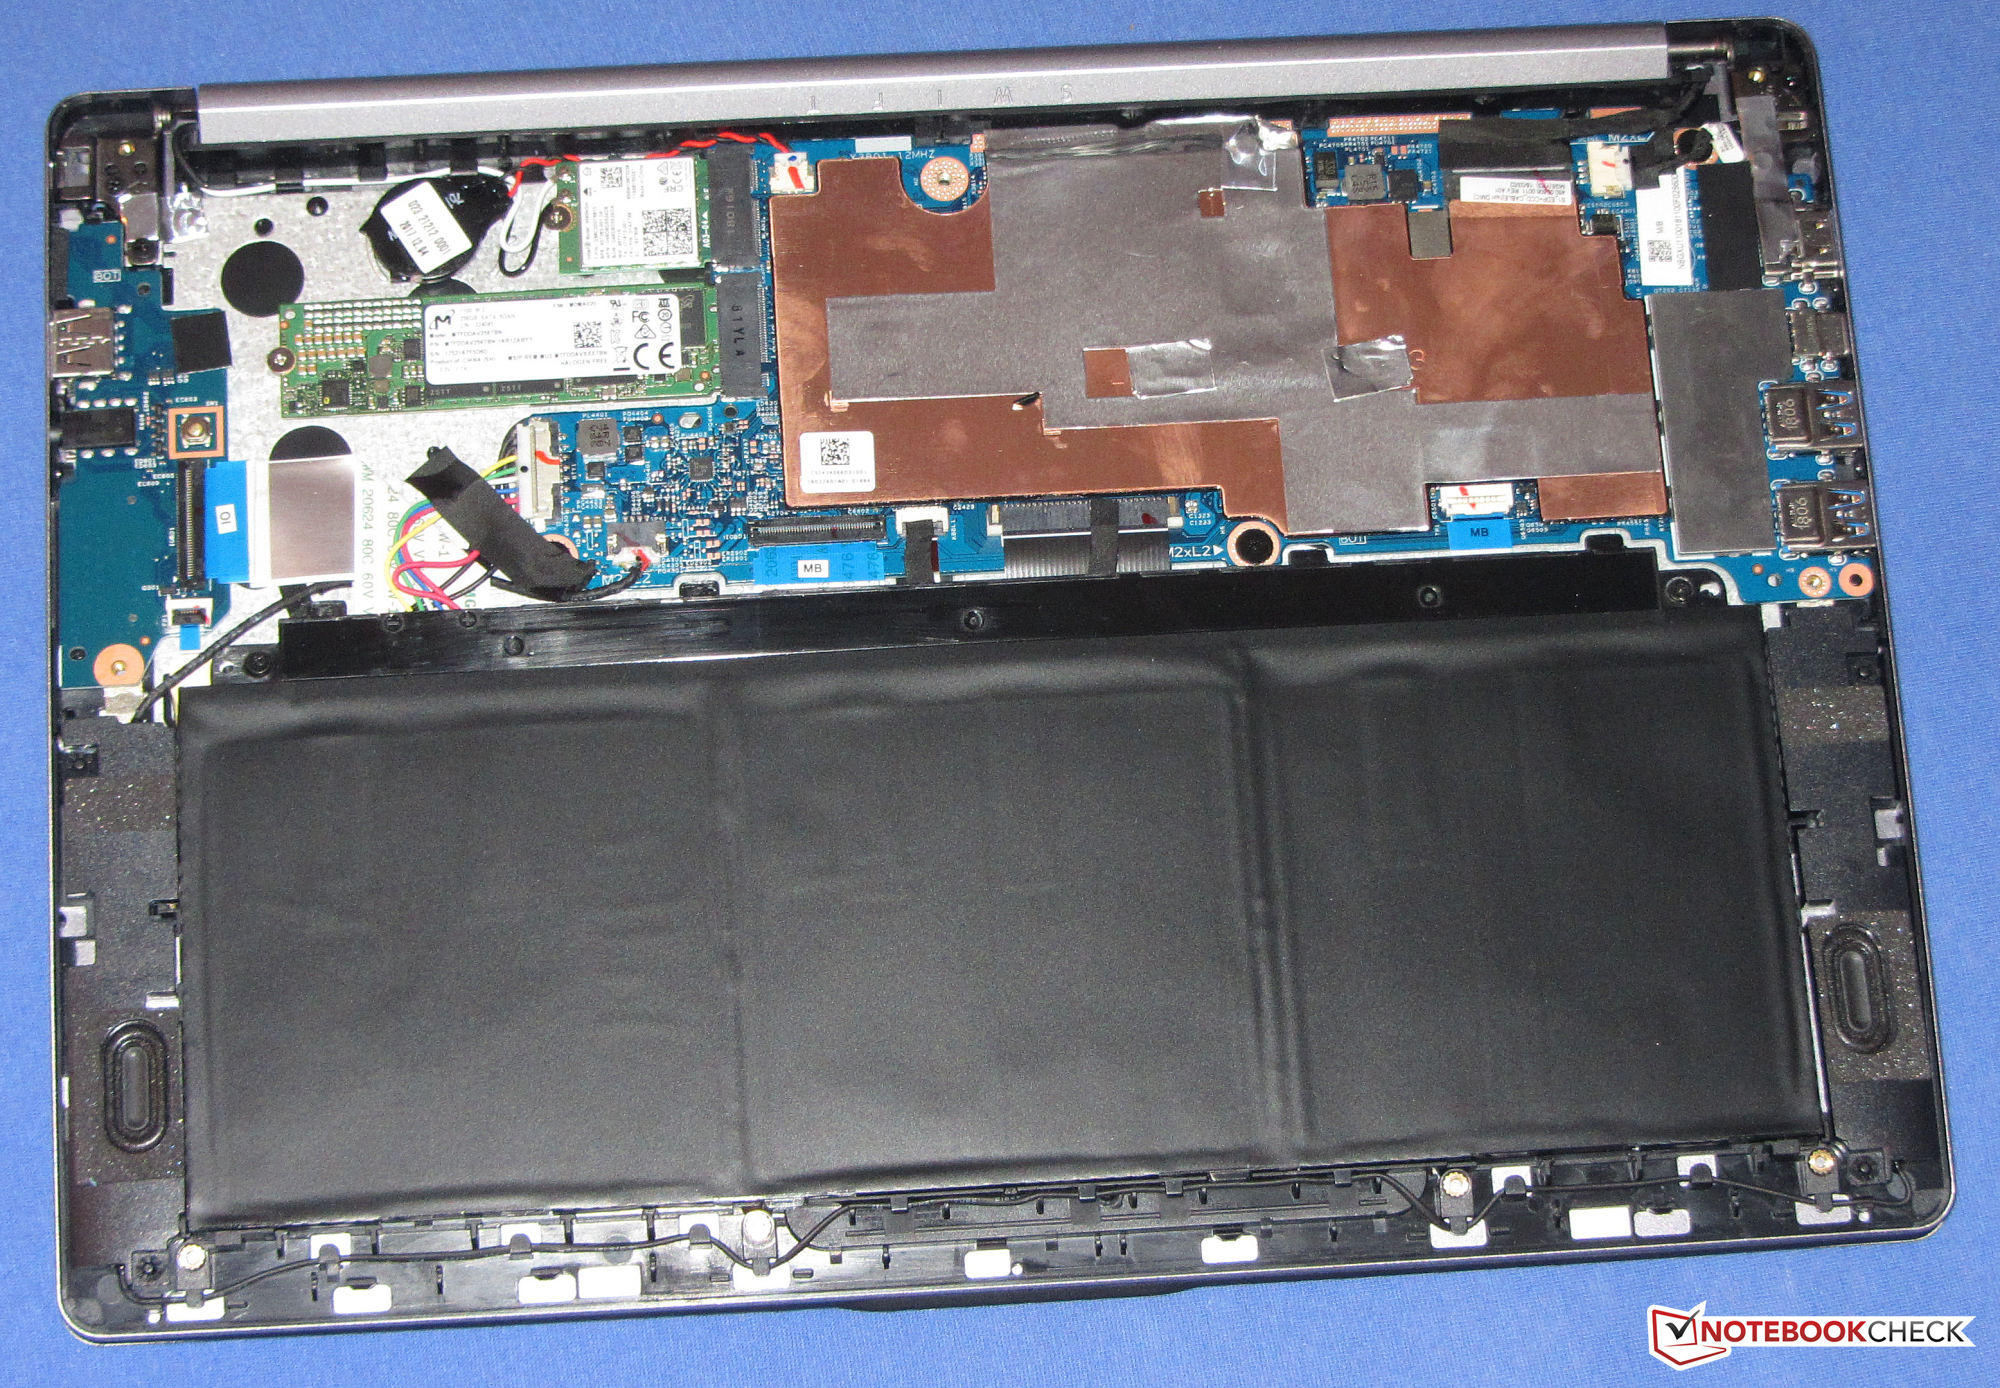
Grâce au refroidissement passif du SoC, le portable fonctionne silencieusement. Il ne chauffe pas beaucoup non plus. Son SSD lui permet d’être réactif. Il est possible de le changer, mais il faut alors ouvrir le châssis. L’écran mat IPS Full HD séduit avec un très bon contraste et des angles de vision stables. Sa luminosité maximale aurait néanmoins pu être plus élevée.
Le clavier laisse une bonne impression, et paraît adapté pour une frappe régulière. C’est appréciable qu’il soit rétroéclairé. Le tout est accompagne d’une excellente autonomie. Au final, il s’agit d’une machine mobile efficace pour la rédaction et la navigation Internet, qui présente en plus très bien.
L’intégralité de cette critique est disponible en anglais en suivant ce lien.
Acer Swift 1 SF114-32-P8GG
- 05/15/2018 v6 (old)
Sascha Mölck