Courte critique du PC portable Lenovo ThinkPad L480 (i5-8250U, UHD 620, IPS, SSD)
| SD Card Reader | |
| average JPG Copy Test (av. of 3 runs) | |
| Dell Latitude 5490-TD70X (Toshiba Exceria Pro SDXC 64 GB UHS-II) | |
| HP ProBook 440 G5-3KX87ES (Toshiba Exceria Pro SDXC 64 GB UHS-II) | |
| Lenovo ThinkPad E480-20KQS00000 (Toshiba Exceria Pro M501) | |
| Lenovo ThinkPad E480-20KNCTO1WW (Toshiba Exceria Pro M501) | |
| Lenovo ThinkPad L470-20J5S00C00 (Toshiba Exceria Pro SDXC 64 GB UHS-II) | |
| Lenovo ThinkPad L480-20LS001AGE (Toshiba Exceria Pro M501 microSDXC 64GB) | |
| Moyenne de la classe Office (19.8 - 198.5, n=22, 2 dernières années) | |
| maximum AS SSD Seq Read Test (1GB) | |
| Dell Latitude 5490-TD70X (Toshiba Exceria Pro SDXC 64 GB UHS-II) | |
| HP ProBook 440 G5-3KX87ES (Toshiba Exceria Pro SDXC 64 GB UHS-II) | |
| Lenovo ThinkPad E480-20KNCTO1WW (Toshiba Exceria Pro M501) | |
| Lenovo ThinkPad L480-20LS001AGE (Toshiba Exceria Pro M501 microSDXC 64GB) | |
| Lenovo ThinkPad L470-20J5S00C00 (Toshiba Exceria Pro SDXC 64 GB UHS-II) | |
| Lenovo ThinkPad E480-20KQS00000 (Toshiba Exceria Pro M501) | |
| Moyenne de la classe Office (27.4 - 249, n=21, 2 dernières années) | |
| |||||||||||||||||||||||||
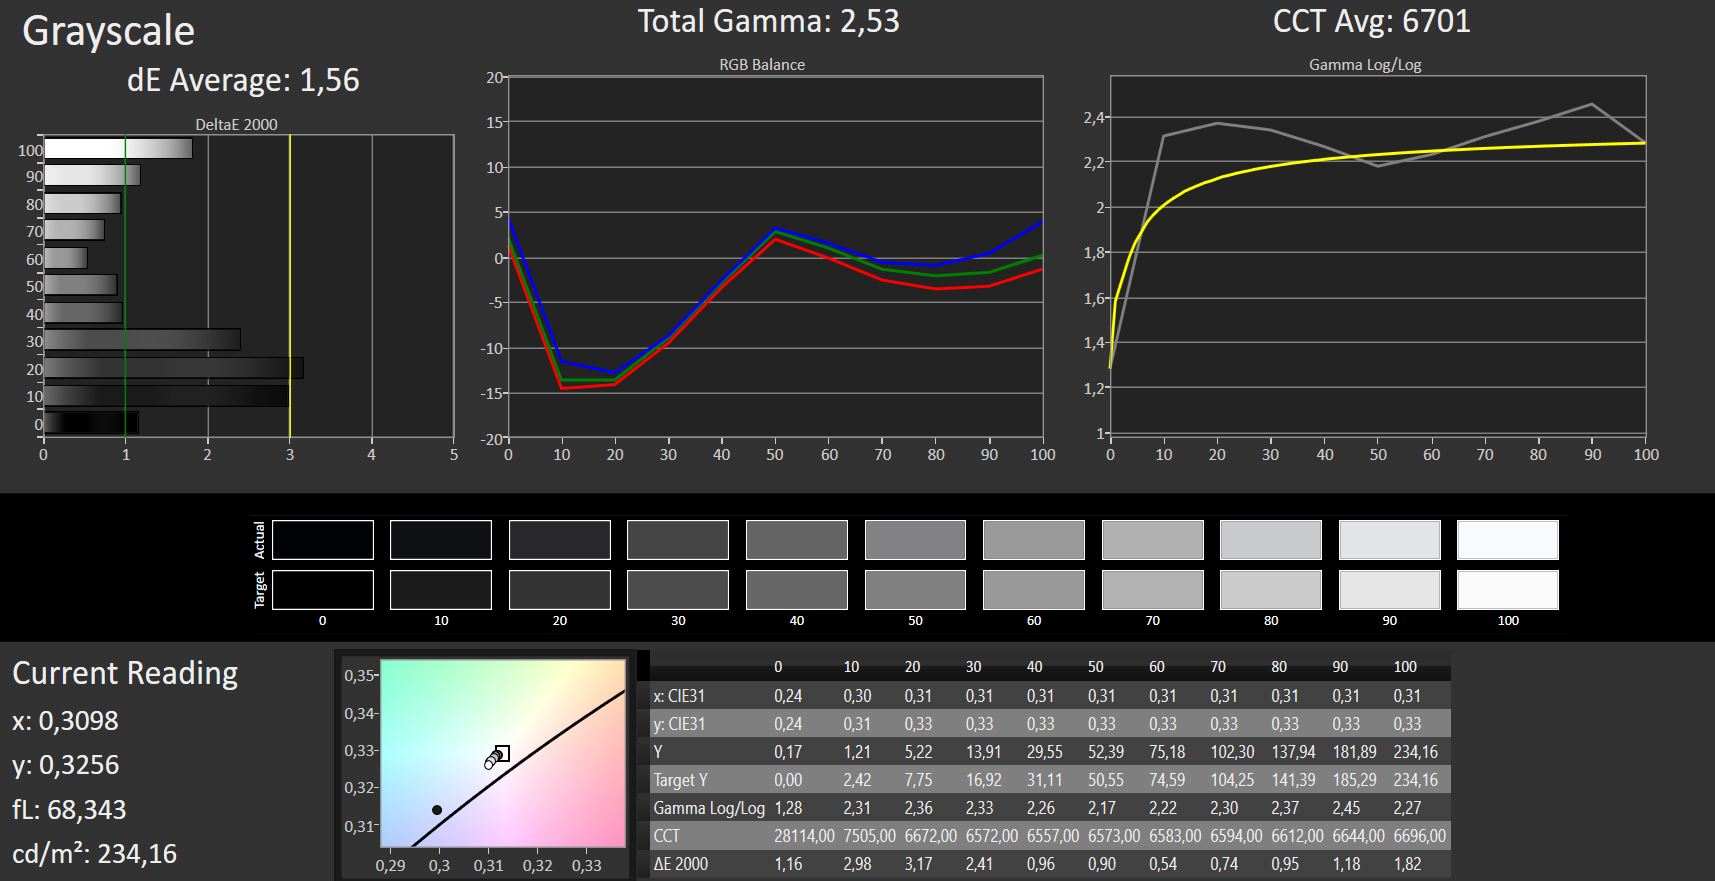
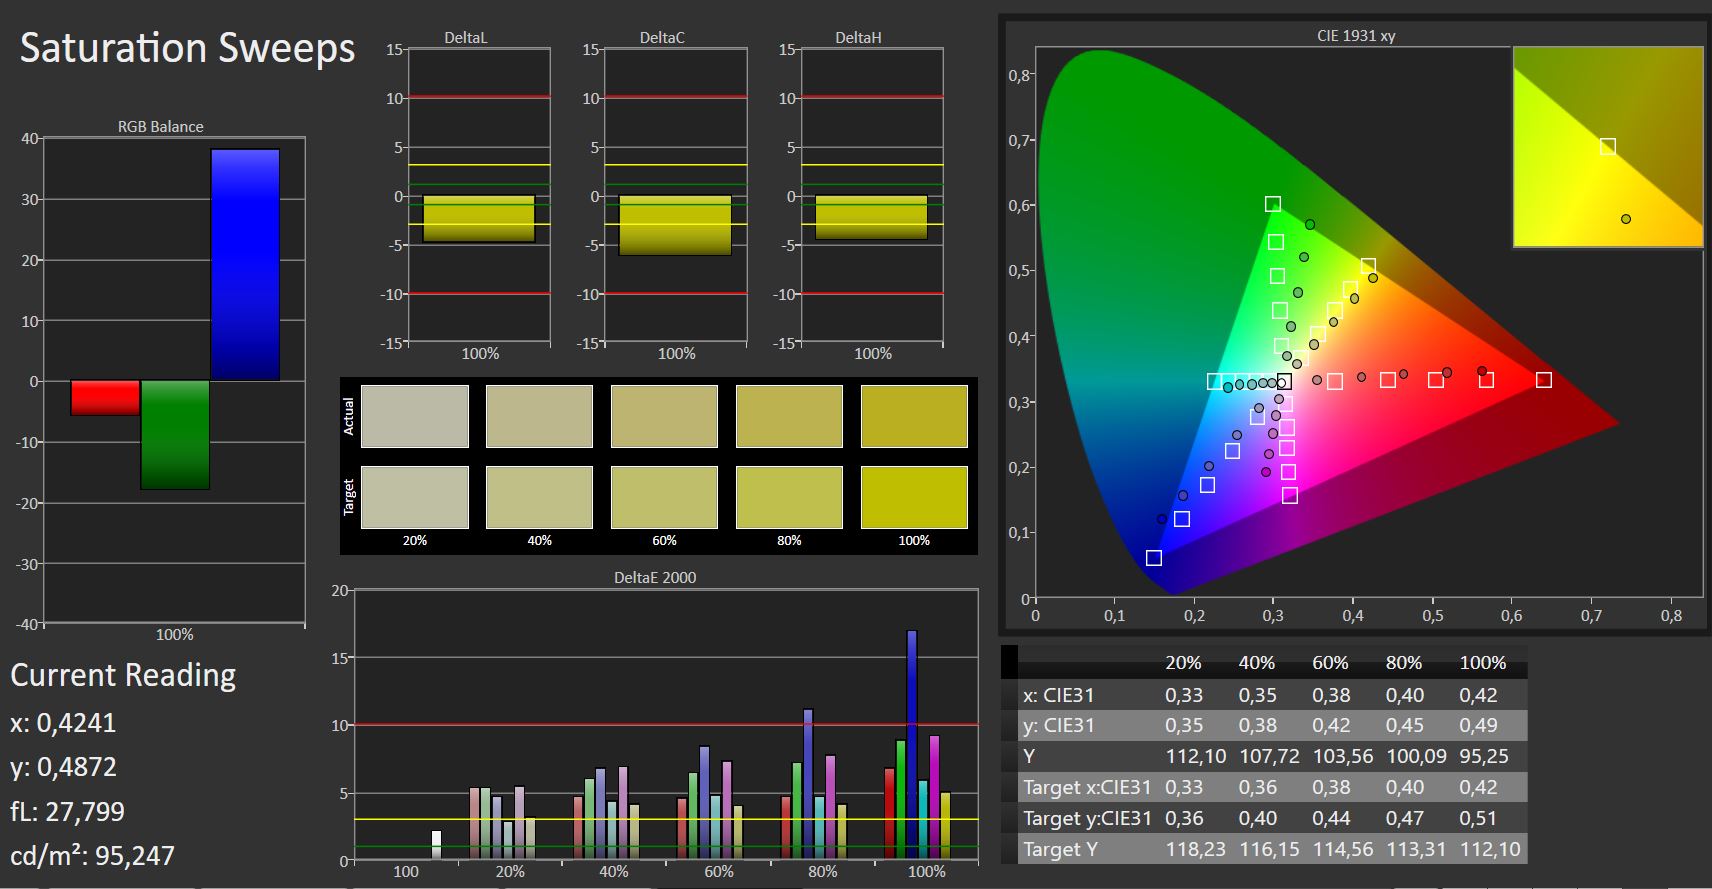
Homogénéité de la luminosité: 73 %
Valeur mesurée au centre, sur batterie: 2.3 cd/m²
Contraste: 1306:1 (Valeurs des noirs: 0.17 cd/m²)
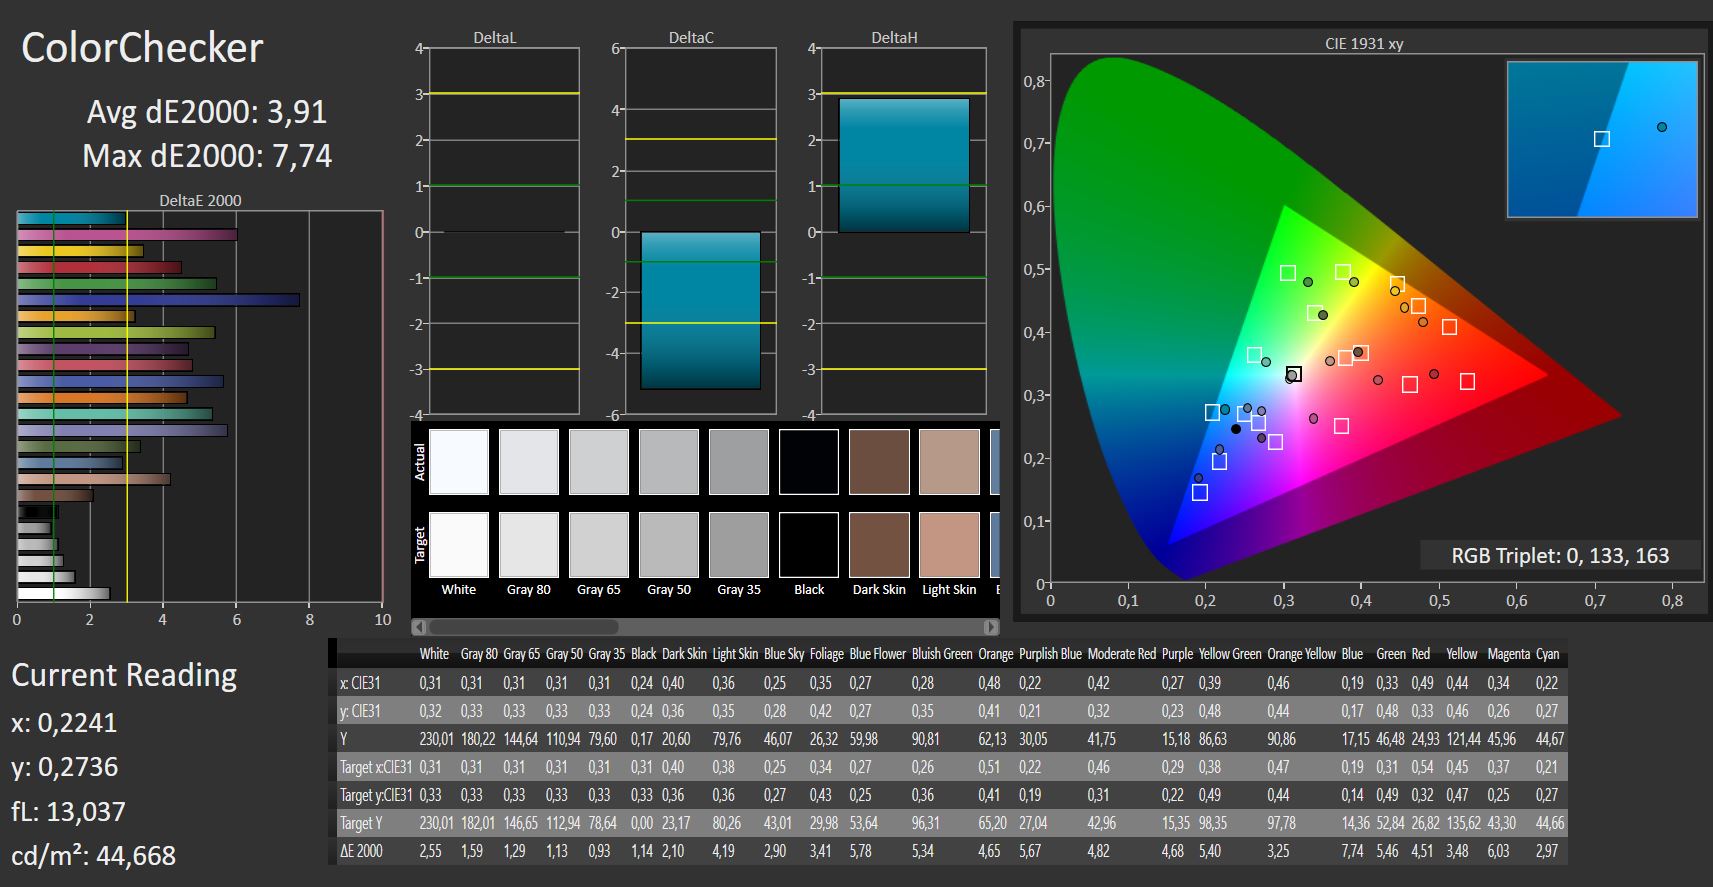
ΔE ColorChecker Calman: 3.91 | ∀{0.5-29.43 Ø4.72}
ΔE Greyscale Calman: 1.56 | ∀{0.09-98 Ø4.97}
55% sRGB (Argyll 1.6.3 3D)
35% AdobeRGB 1998 (Argyll 1.6.3 3D)
37.57% AdobeRGB 1998 (Argyll 3D)
54.7% sRGB (Argyll 3D)
36.37% Display P3 (Argyll 3D)
Gamma: 2.53
CCT: 6701 K
| Lenovo ThinkPad L480-20LS001AGE B140HAN02.4, 1920x1080, 14" | Lenovo ThinkPad L470-20J5S00C00 N140HCA-EAB, 1920x1080, 14" | Lenovo ThinkPad E480-20KNCTO1WW Innolux N140HCA-EAC, 1920x1080, 14" | Lenovo ThinkPad E480-20KQS00000 Innolux N140HCA-EAC, 1920x1080, 14" | HP ProBook 440 G5-3KX87ES LGD04B2, 1920x1080, 14" | Dell Latitude 5490-TD70X AU Optronics AUO263D, 1920x1080, 14" | |
|---|---|---|---|---|---|---|
| Display | 16% | 14% | 15% | 9% | 0% | |
| Display P3 Coverage (%) | 36.37 | 42.21 16% | 41.56 14% | 41.88 15% | 39.56 9% | 36.28 0% |
| sRGB Coverage (%) | 54.7 | 62.7 15% | 62.2 14% | 62.8 15% | 59.3 8% | 54.6 0% |
| AdobeRGB 1998 Coverage (%) | 37.57 | 43.71 16% | 42.96 14% | 43.29 15% | 40.88 9% | 37.48 0% |
| Response Times | 19% | 22% | 23% | 29% | 21% | |
| Response Time Grey 50% / Grey 80% * (ms) | 73 ? | 50.4 ? 31% | 44.8 ? 39% | 44 ? 40% | 40 ? 45% | 46.9 ? 36% |
| Response Time Black / White * (ms) | 33 ? | 30.8 ? 7% | 31.2 ? 5% | 31.2 ? 5% | 28.8 ? 13% | 31.2 ? 5% |
| PWM Frequency (Hz) | 25000 ? | 24880 ? | ||||
| Screen | -46% | -53% | -20% | -41% | -28% | |
| Brightness middle (cd/m²) | 222 | 274 23% | 262 18% | 251 13% | 236 6% | 227 2% |
| Brightness (cd/m²) | 209 | 256 22% | 245 17% | 231 11% | 221 6% | 211 1% |
| Brightness Distribution (%) | 73 | 85 16% | 83 14% | 80 10% | 88 21% | 88 21% |
| Black Level * (cd/m²) | 0.17 | 0.35 -106% | 0.19 -12% | 0.19 -12% | 0.26 -53% | 0.19 -12% |
| Contrast (:1) | 1306 | 783 -40% | 1379 6% | 1321 1% | 908 -30% | 1195 -8% |
| Colorchecker dE 2000 * | 3.91 | 6.1 -56% | 7 -79% | 5.1 -30% | 5.7 -46% | 5.6 -43% |
| Colorchecker dE 2000 max. * | 7.74 | 13.8 -78% | 23.6 -205% | 10.6 -37% | 22 -184% | 22.4 -189% |
| Greyscale dE 2000 * | 1.56 | 5.7 -265% | 6.4 -310% | 4.5 -188% | 3.8 -144% | 2.4 -54% |
| Gamma | 2.53 87% | 2.11 104% | 2.14 103% | 2.18 101% | 2.1 105% | 2.44 90% |
| CCT | 6701 97% | 6419 101% | 6065 107% | 6146 106% | 7318 89% | 6506 100% |
| Color Space (Percent of AdobeRGB 1998) (%) | 35 | 40.2 15% | 39.5 13% | 39.8 14% | 37.7 8% | 34.5 -1% |
| Color Space (Percent of sRGB) (%) | 55 | 62.4 13% | 61.9 13% | 62.5 14% | 59.2 8% | 54.4 -1% |
| Moyenne finale (programmes/paramètres) | -4% /
-25% | -6% /
-29% | 6% /
-8% | -1% /
-22% | -2% /
-16% |
* ... Moindre est la valeur, meilleures sont les performances
Temps de réponse de l'écran
| ↔ Temps de réponse noir à blanc | ||
|---|---|---|
| 33 ms ... hausse ↗ et chute ↘ combinées | ↗ 19 ms hausse | 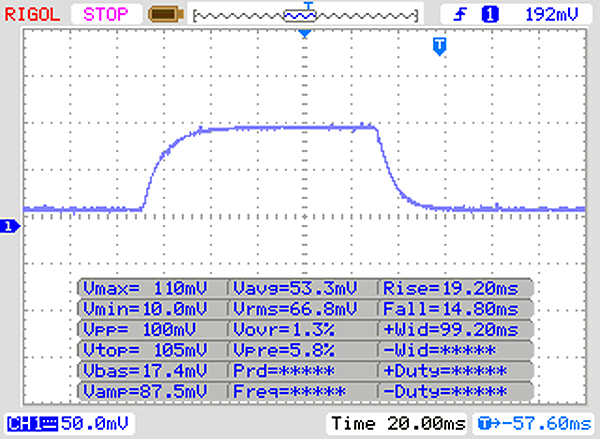 |
| ↘ 14 ms chute | ||
| L'écran souffre de latences très élevées, à éviter pour le jeu. En comparaison, tous les appareils testés affichent entre 0.1 (minimum) et 240 (maximum) ms. » 89 % des appareils testés affichent de meilleures performances. Cela signifie que les latences relevées sont moins bonnes que la moyenne (19.8 ms) de tous les appareils testés. | ||
| ↔ Temps de réponse gris 50% à gris 80% | ||
| 73 ms ... hausse ↗ et chute ↘ combinées | ↗ 36 ms hausse | 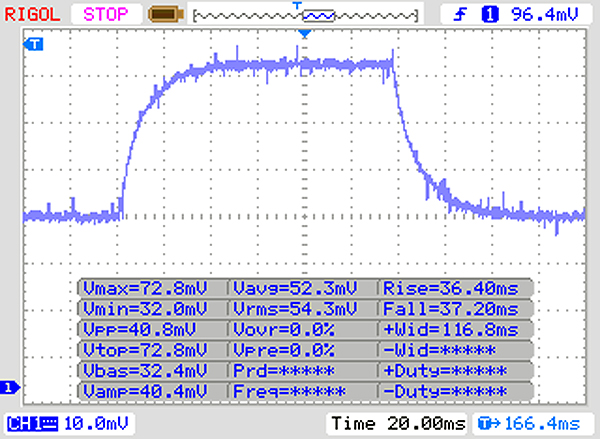 |
| ↘ 37 ms chute | ||
| L'écran souffre de latences très élevées, à éviter pour le jeu. En comparaison, tous les appareils testés affichent entre 0.165 (minimum) et 636 (maximum) ms. » 99 % des appareils testés affichent de meilleures performances. Cela signifie que les latences relevées sont moins bonnes que la moyenne (31 ms) de tous les appareils testés. | ||
Scintillement / MLI (Modulation de largeur d'impulsion)
| Scintillement / MLI (Modulation de largeur d'impulsion) non décelé | 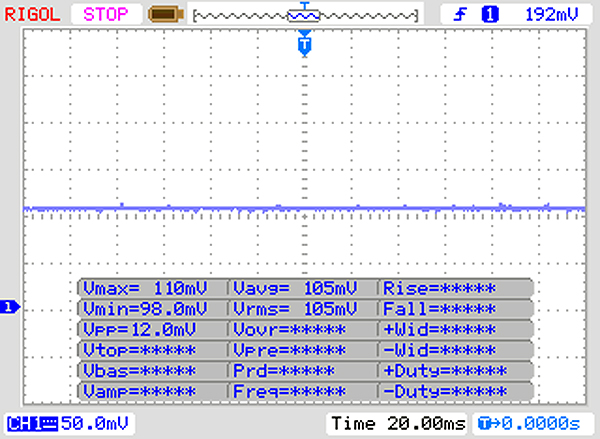 | ||
En comparaison, 52 % des appareils testés n'emploient pas MDI pour assombrir leur écran. Nous avons relevé une moyenne à 7772 (minimum : 5 - maximum : 343500) Hz dans le cas où une MDI était active. | |||
* ... Moindre est la valeur, meilleures sont les performances
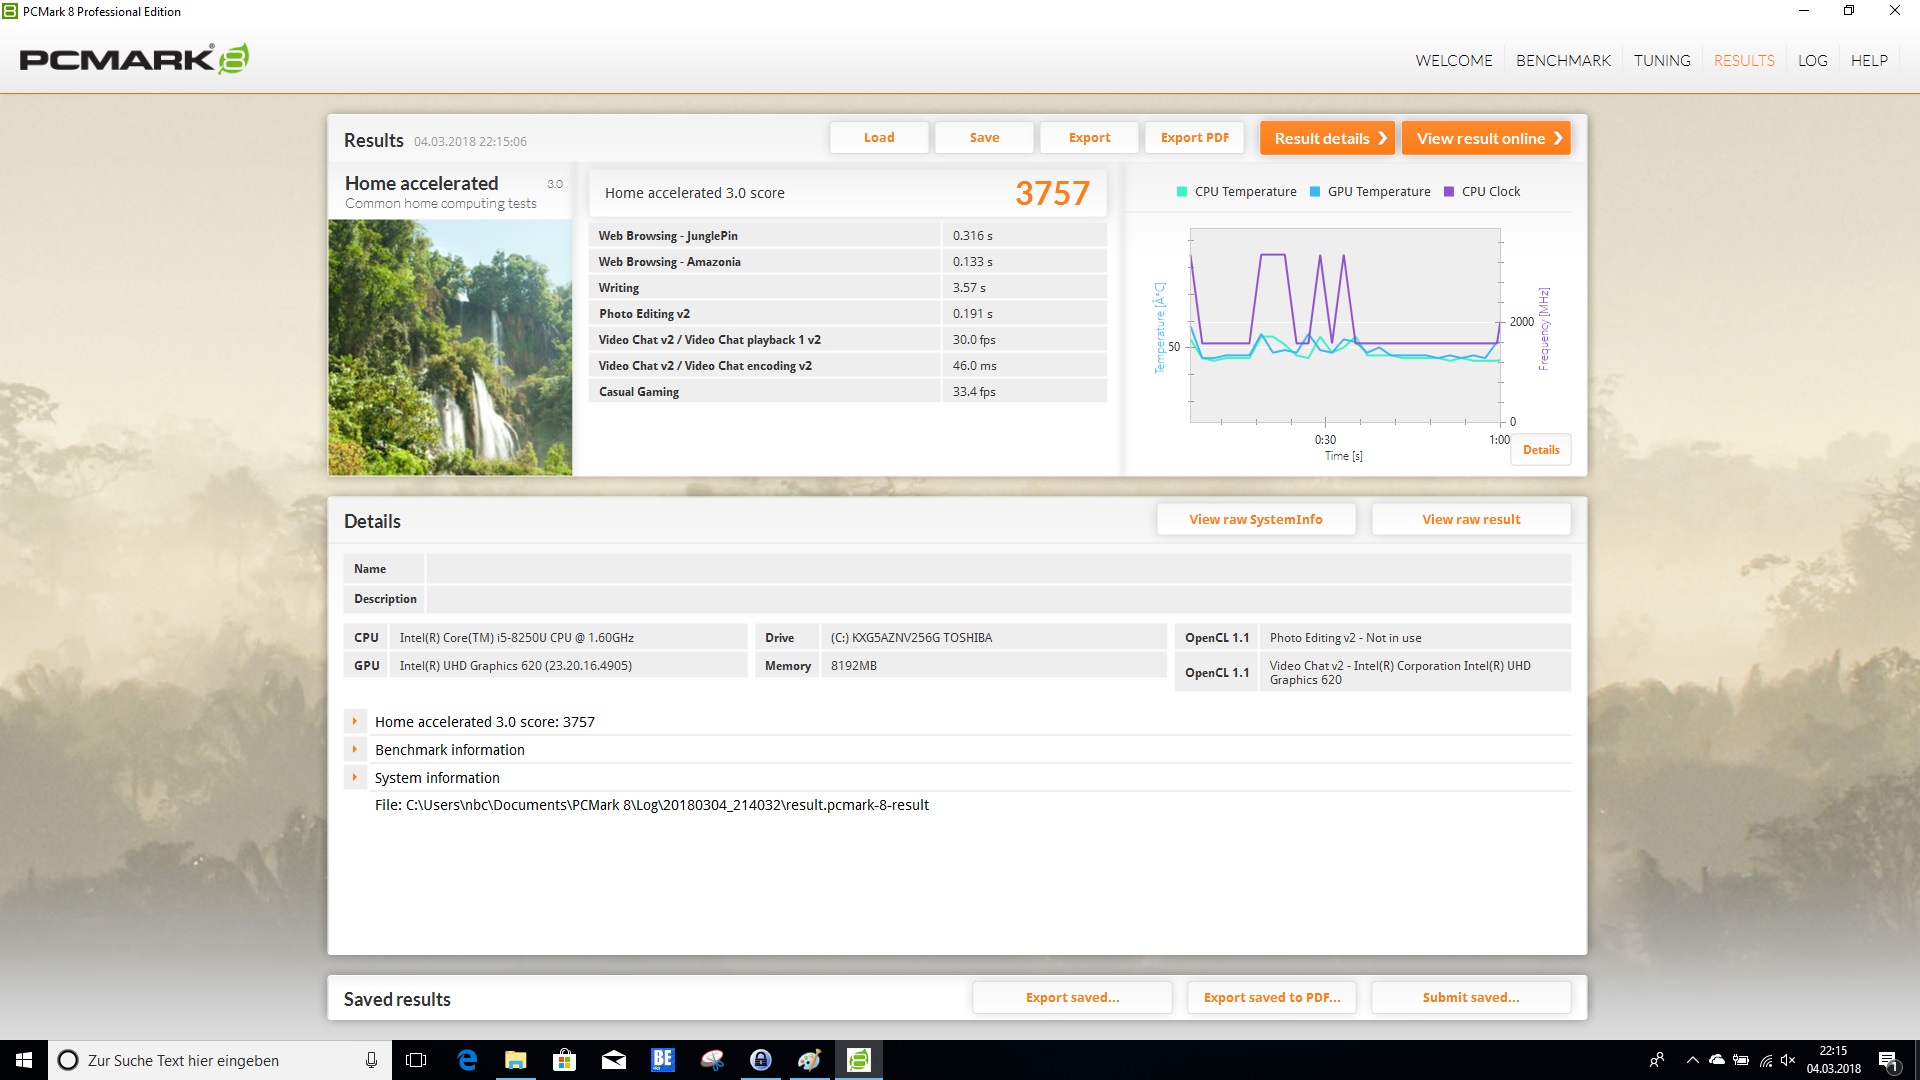
| PCMark 8 Home Score Accelerated v2 | 3757 points | |
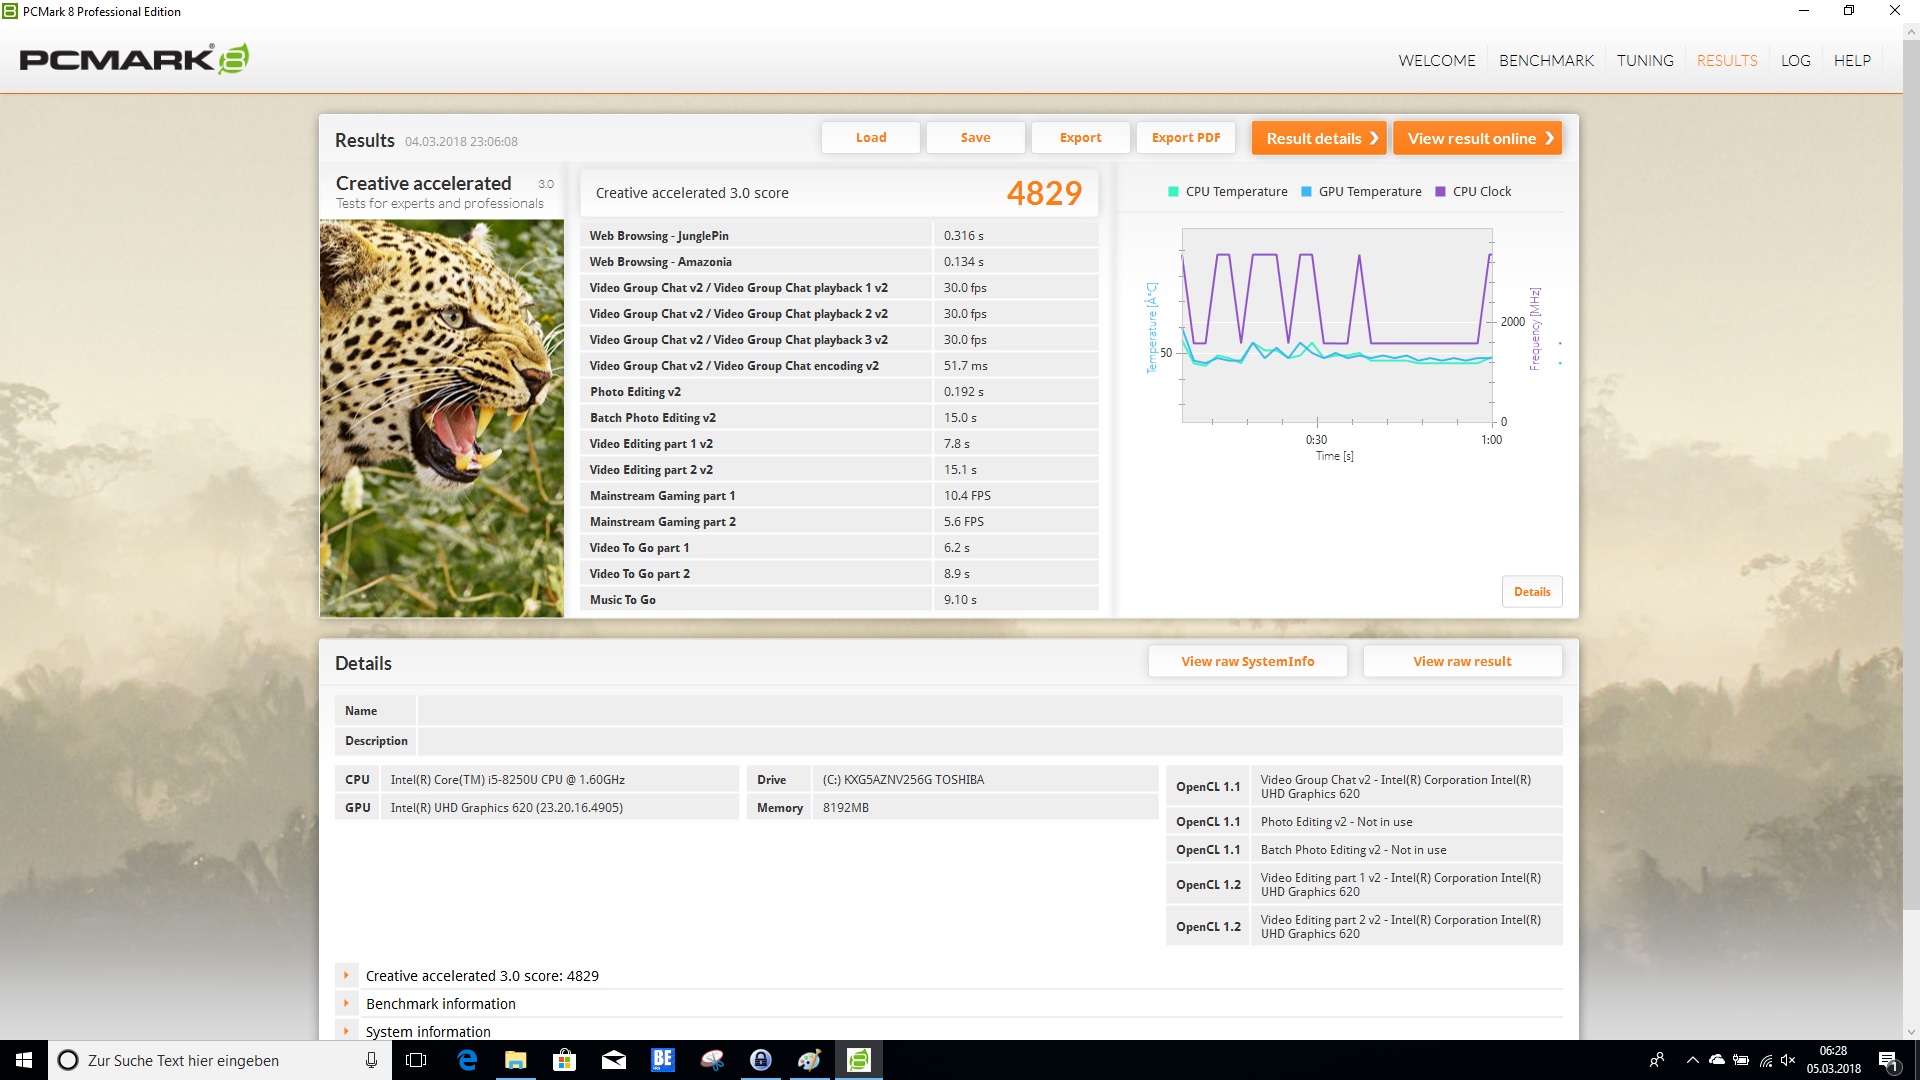
| PCMark 8 Creative Score Accelerated v2 | 4829 points | |
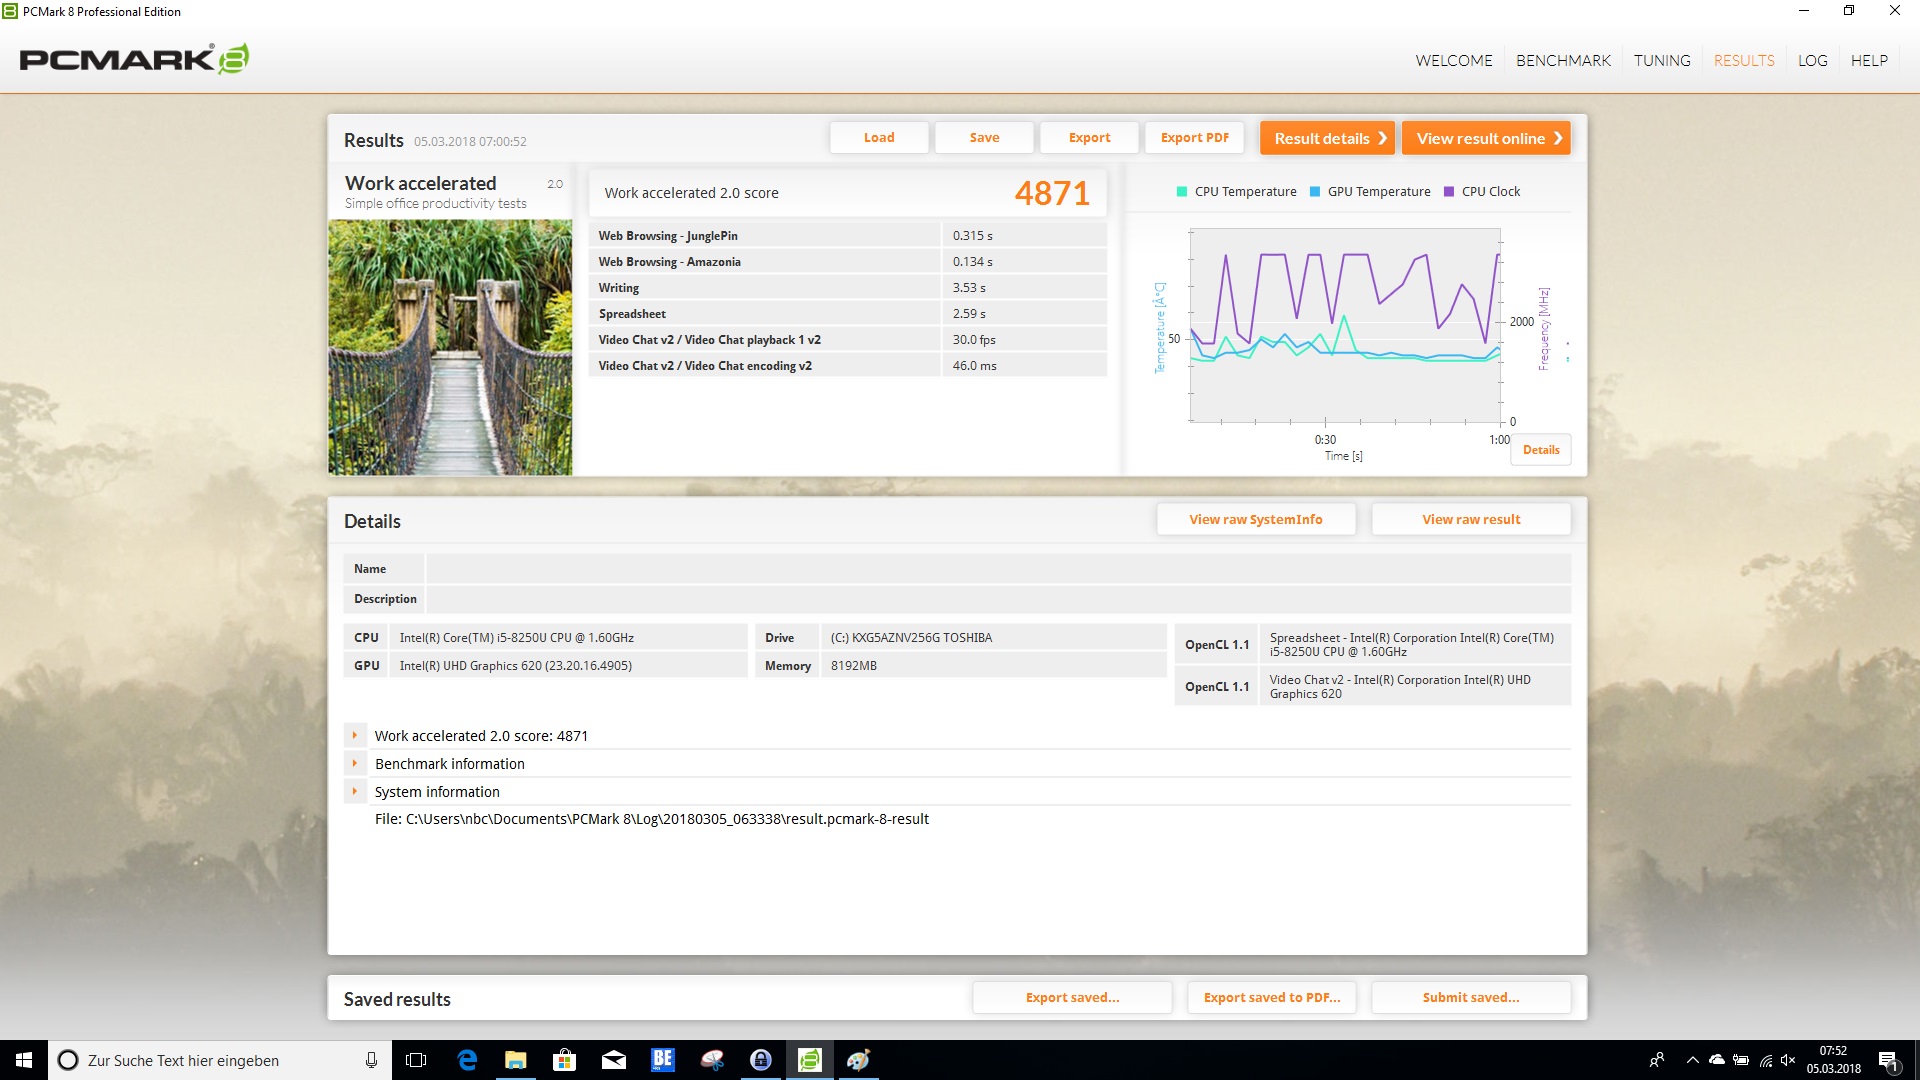
| PCMark 8 Work Score Accelerated v2 | 4871 points | |
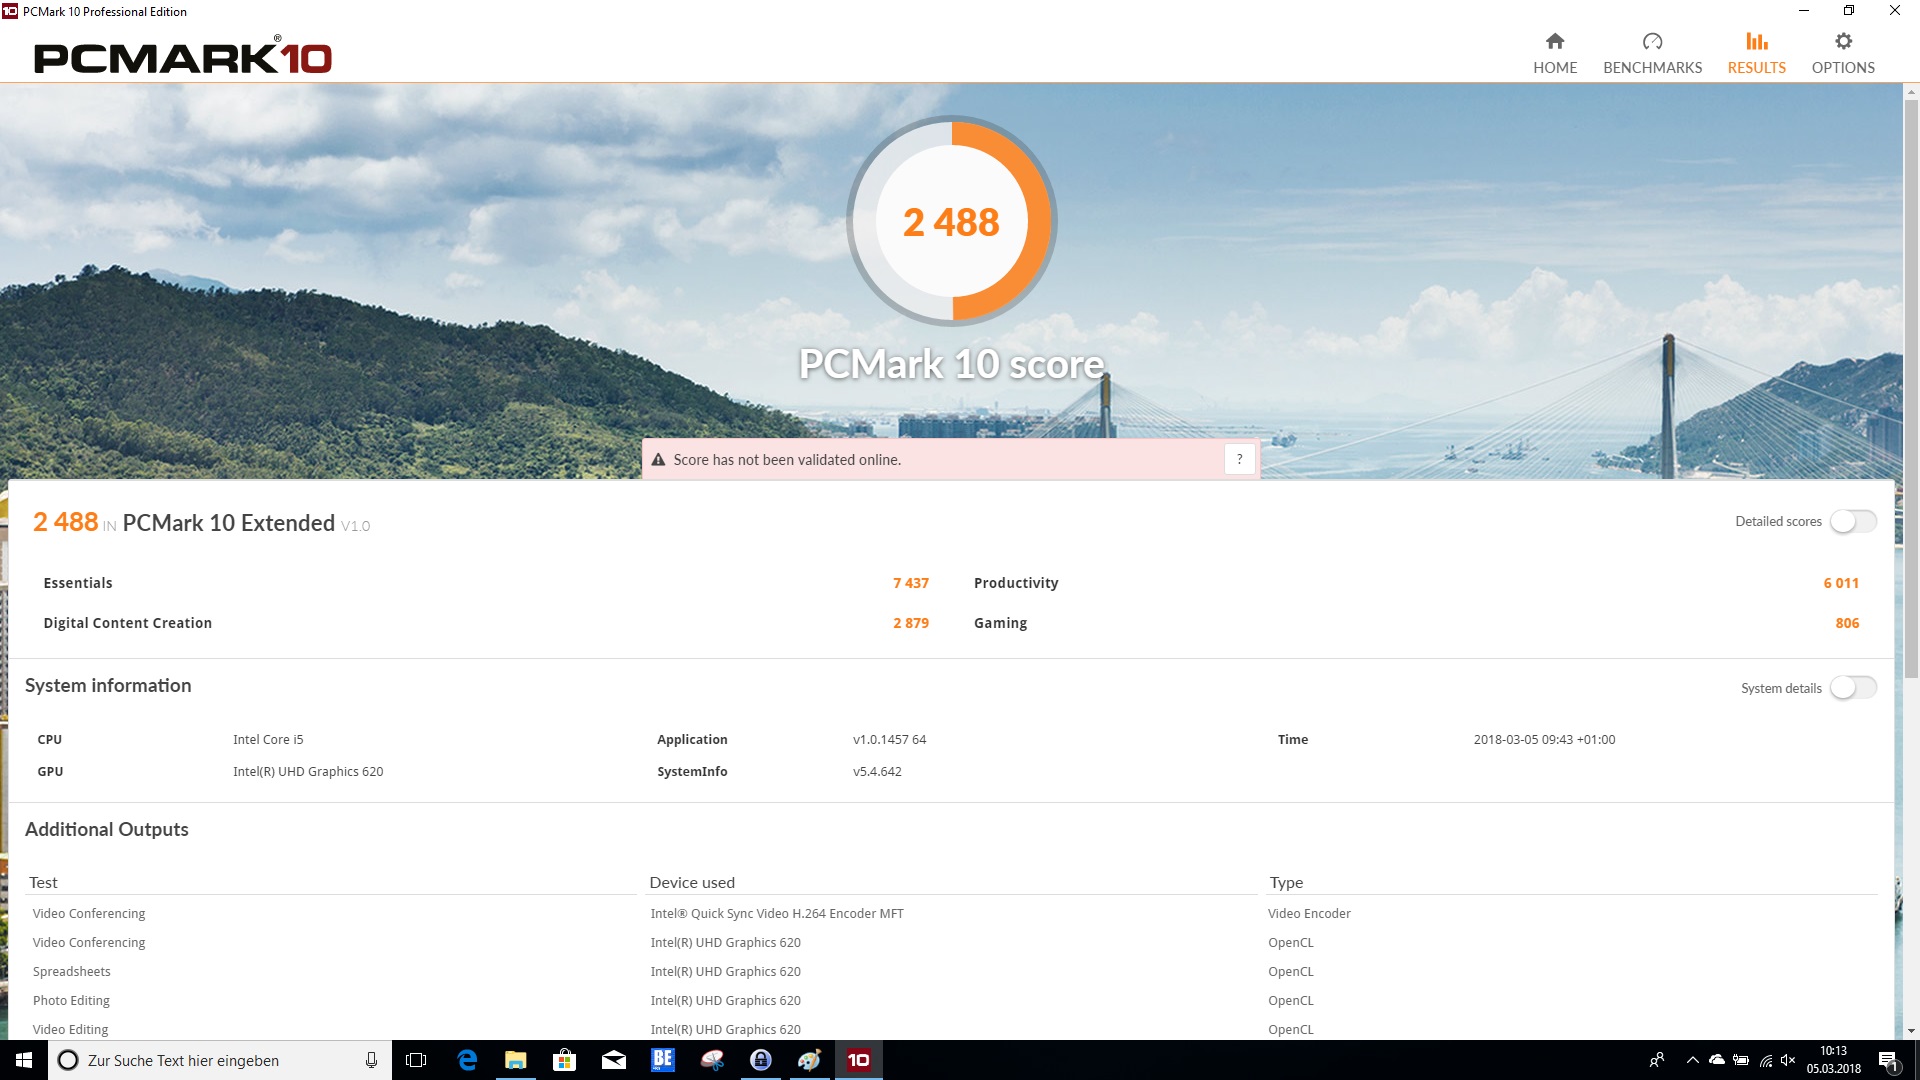
| PCMark 10 Score | 2488 points | |
Aide | ||
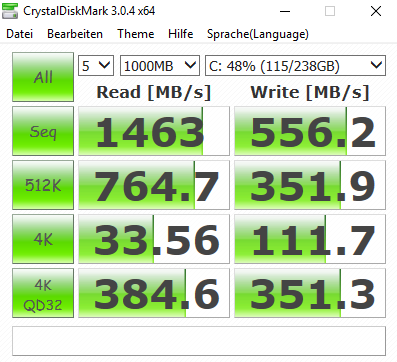
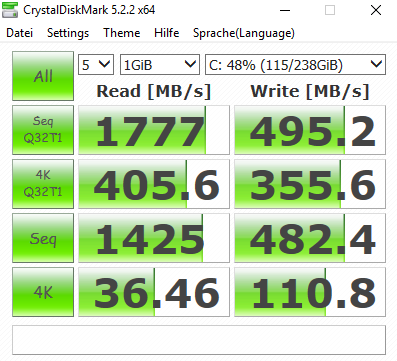
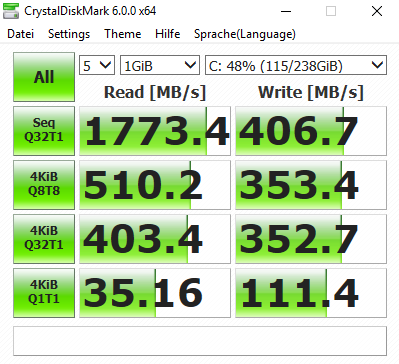
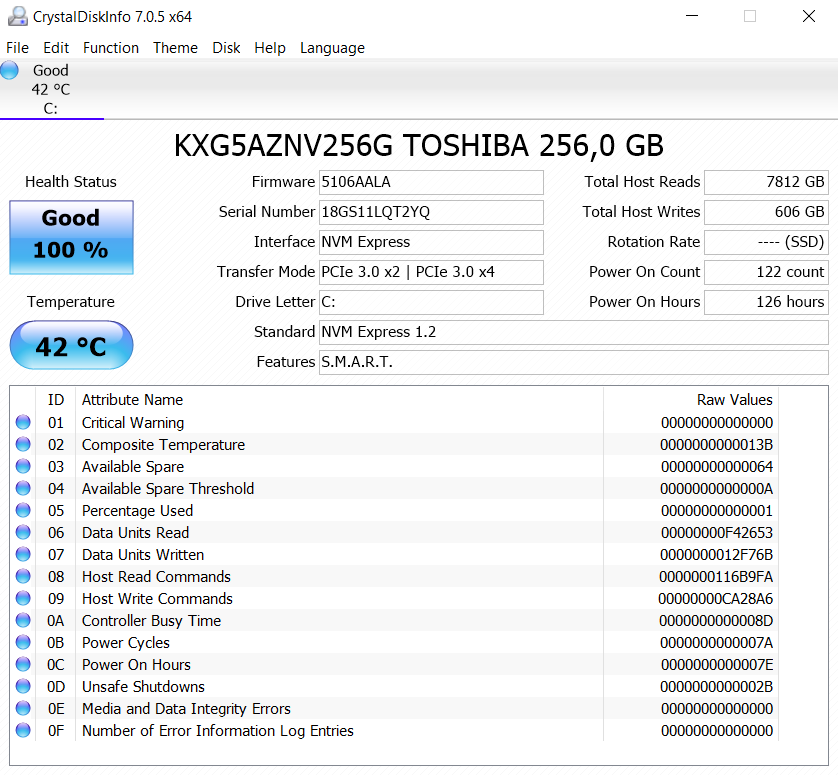
| Lenovo ThinkPad L480-20LS001AGE Toshiba KXG5AZNV256G | Lenovo ThinkPad L470-20J5S00C00 SanDisk X400 256GB, SATA (SD8SB8U-256G) | Lenovo ThinkPad E480-20KNCTO1WW Toshiba KBG30ZMT128G | Lenovo ThinkPad E480-20KQS00000 Lenovo LENSE20256GMSP34MEAT2TA | HP ProBook 440 G5-3KX87ES Intel SSD 600p SSDPEKKW256G7 | Dell Latitude 5490-TD70X Toshiba KSG60ZMV512G | |
|---|---|---|---|---|---|---|
| CrystalDiskMark 3.0 | -31% | -42% | -30% | 13% | -27% | |
| Read Seq (MB/s) | 1463 | 495.2 -66% | 909 -38% | 1295 -11% | 1181 -19% | 465.1 -68% |
| Write Seq (MB/s) | 556 | 485.7 -13% | 128.4 -77% | 160.6 -71% | 602 8% | 425 -24% |
| Read 512 (MB/s) | 765 | 323.4 -58% | 715 -7% | 872 14% | 923 21% | 410.1 -46% |
| Write 512 (MB/s) | 351.9 | 291.5 -17% | 127 -64% | 122 -65% | 600 71% | 360.7 3% |
| Read 4k (MB/s) | 33.56 | 34.2 2% | 33.35 -1% | 25.72 -23% | 35.48 6% | 27.34 -19% |
| Write 4k (MB/s) | 111.7 | 74.3 -33% | 82.3 -26% | 95.2 -15% | 139.8 25% | 89 -20% |
| Read 4k QD32 (MB/s) | 384.6 | 321.3 -16% | 197.5 -49% | 389.9 1% | 287.8 -25% | 295.6 -23% |
| Write 4k QD32 (MB/s) | 351.3 | 188 -46% | 100.2 -71% | 118.3 -66% | 417.1 19% | 300.2 -15% |

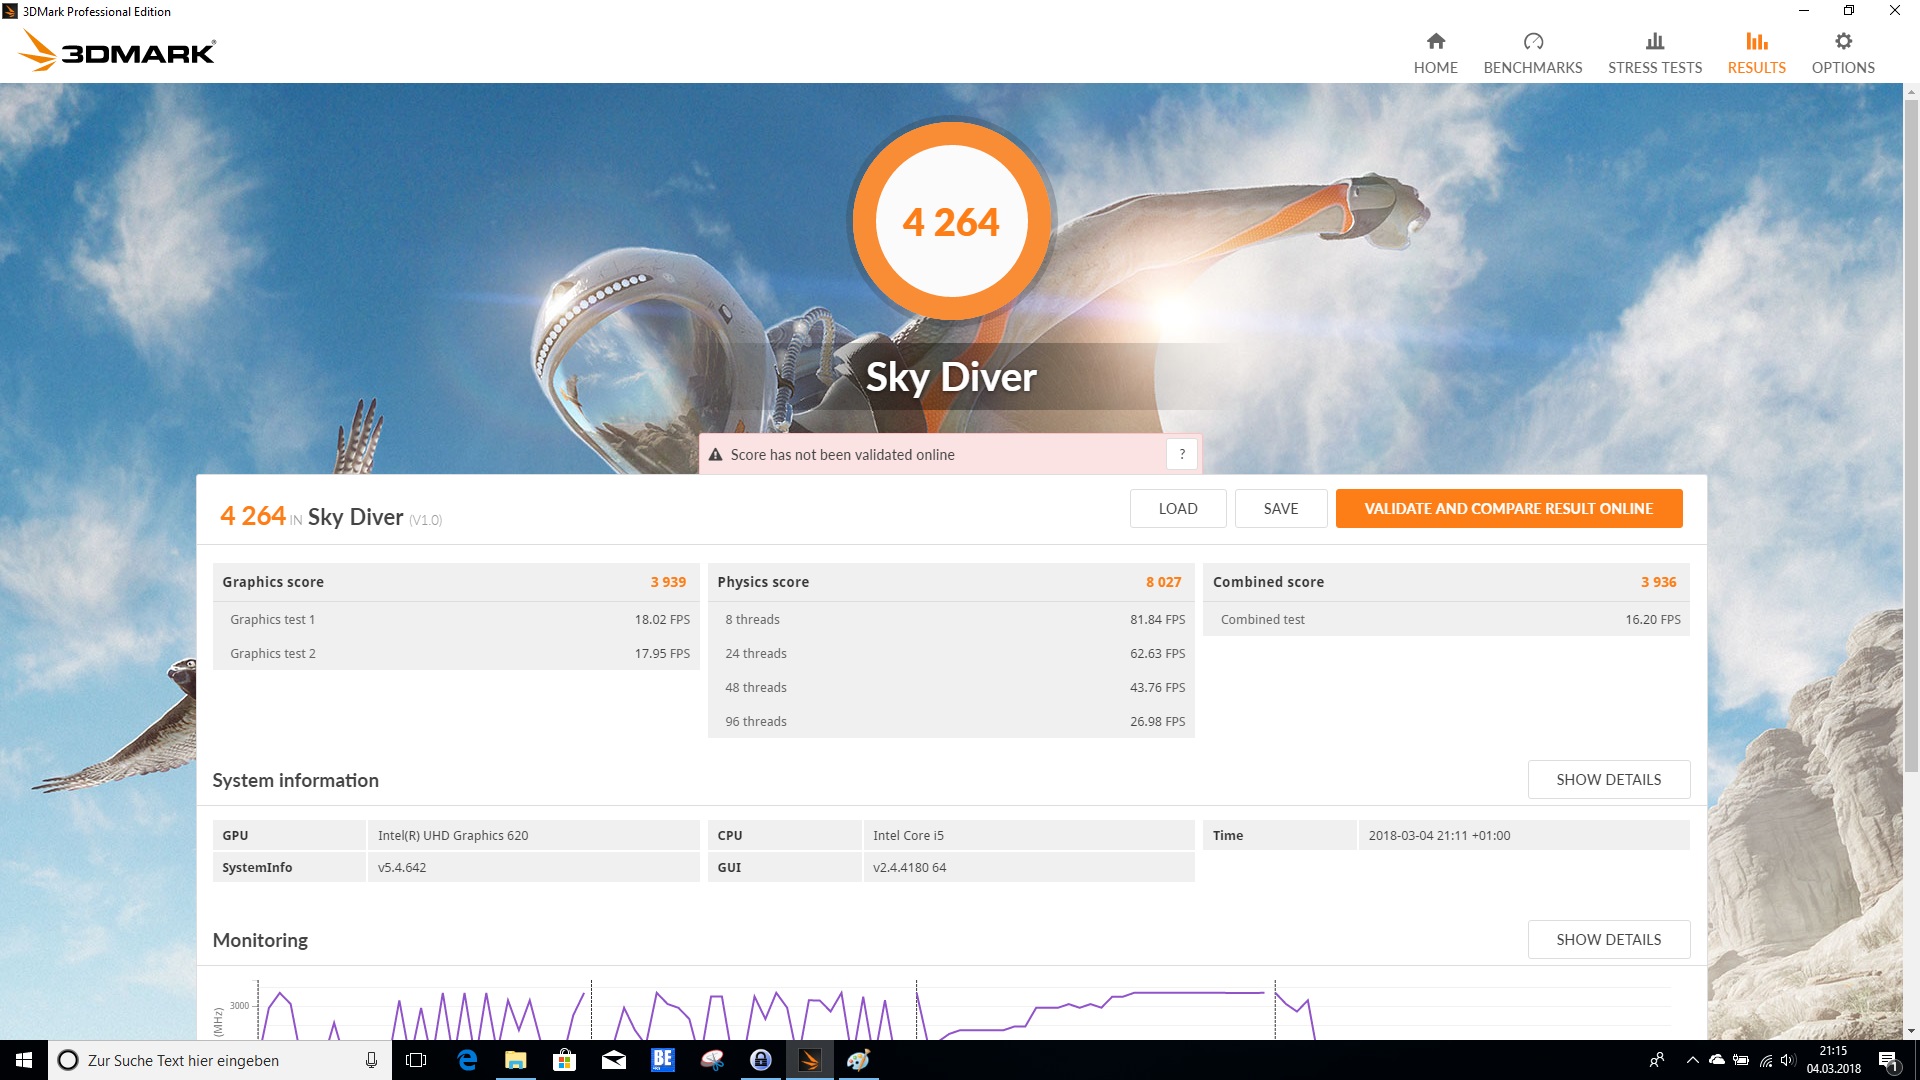
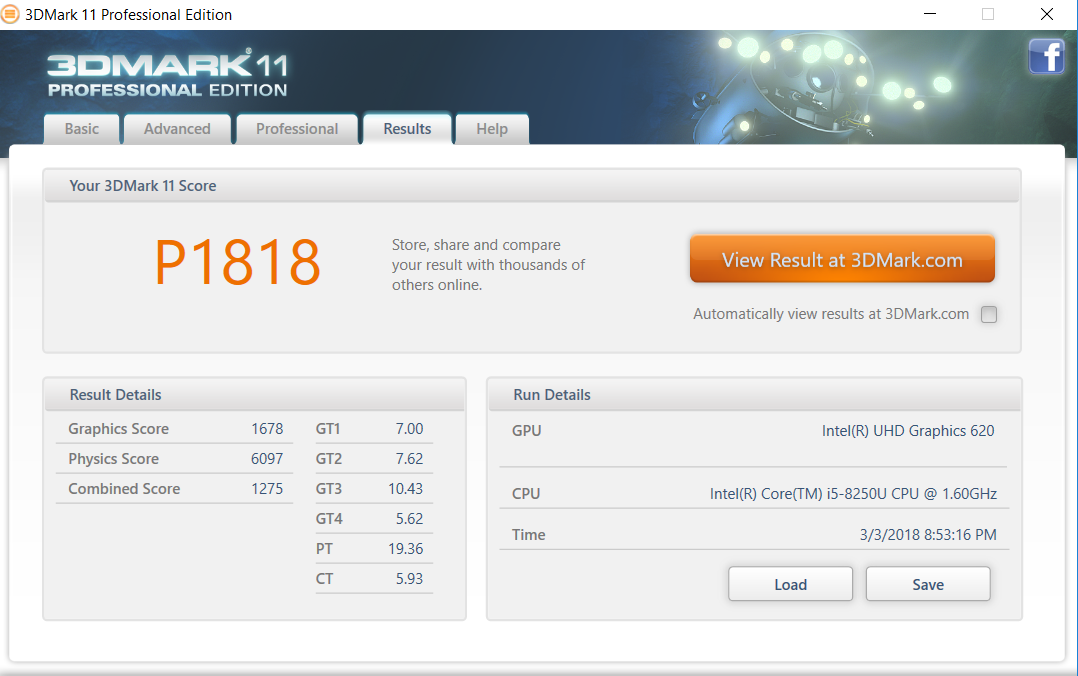
| 3DMark 11 Performance | 1818 points | |
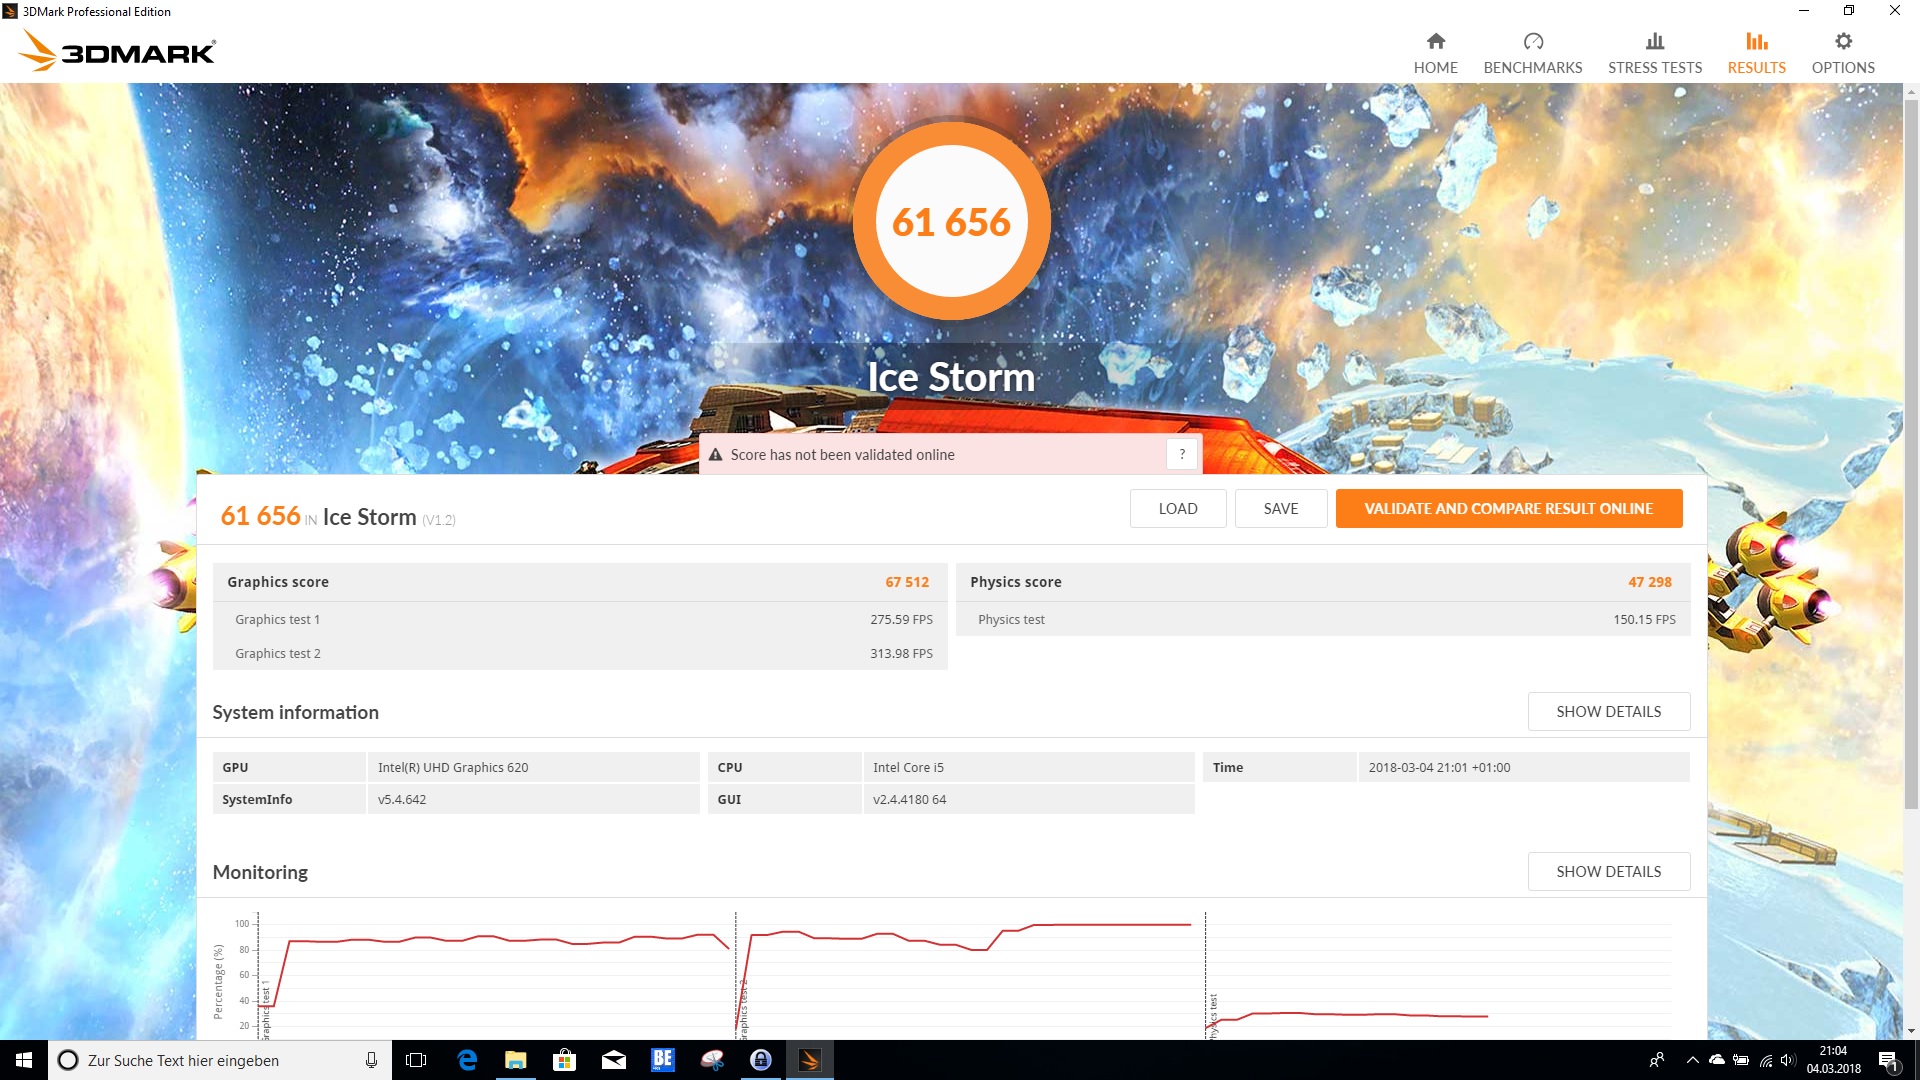
| 3DMark Ice Storm Standard Score | 61656 points | |
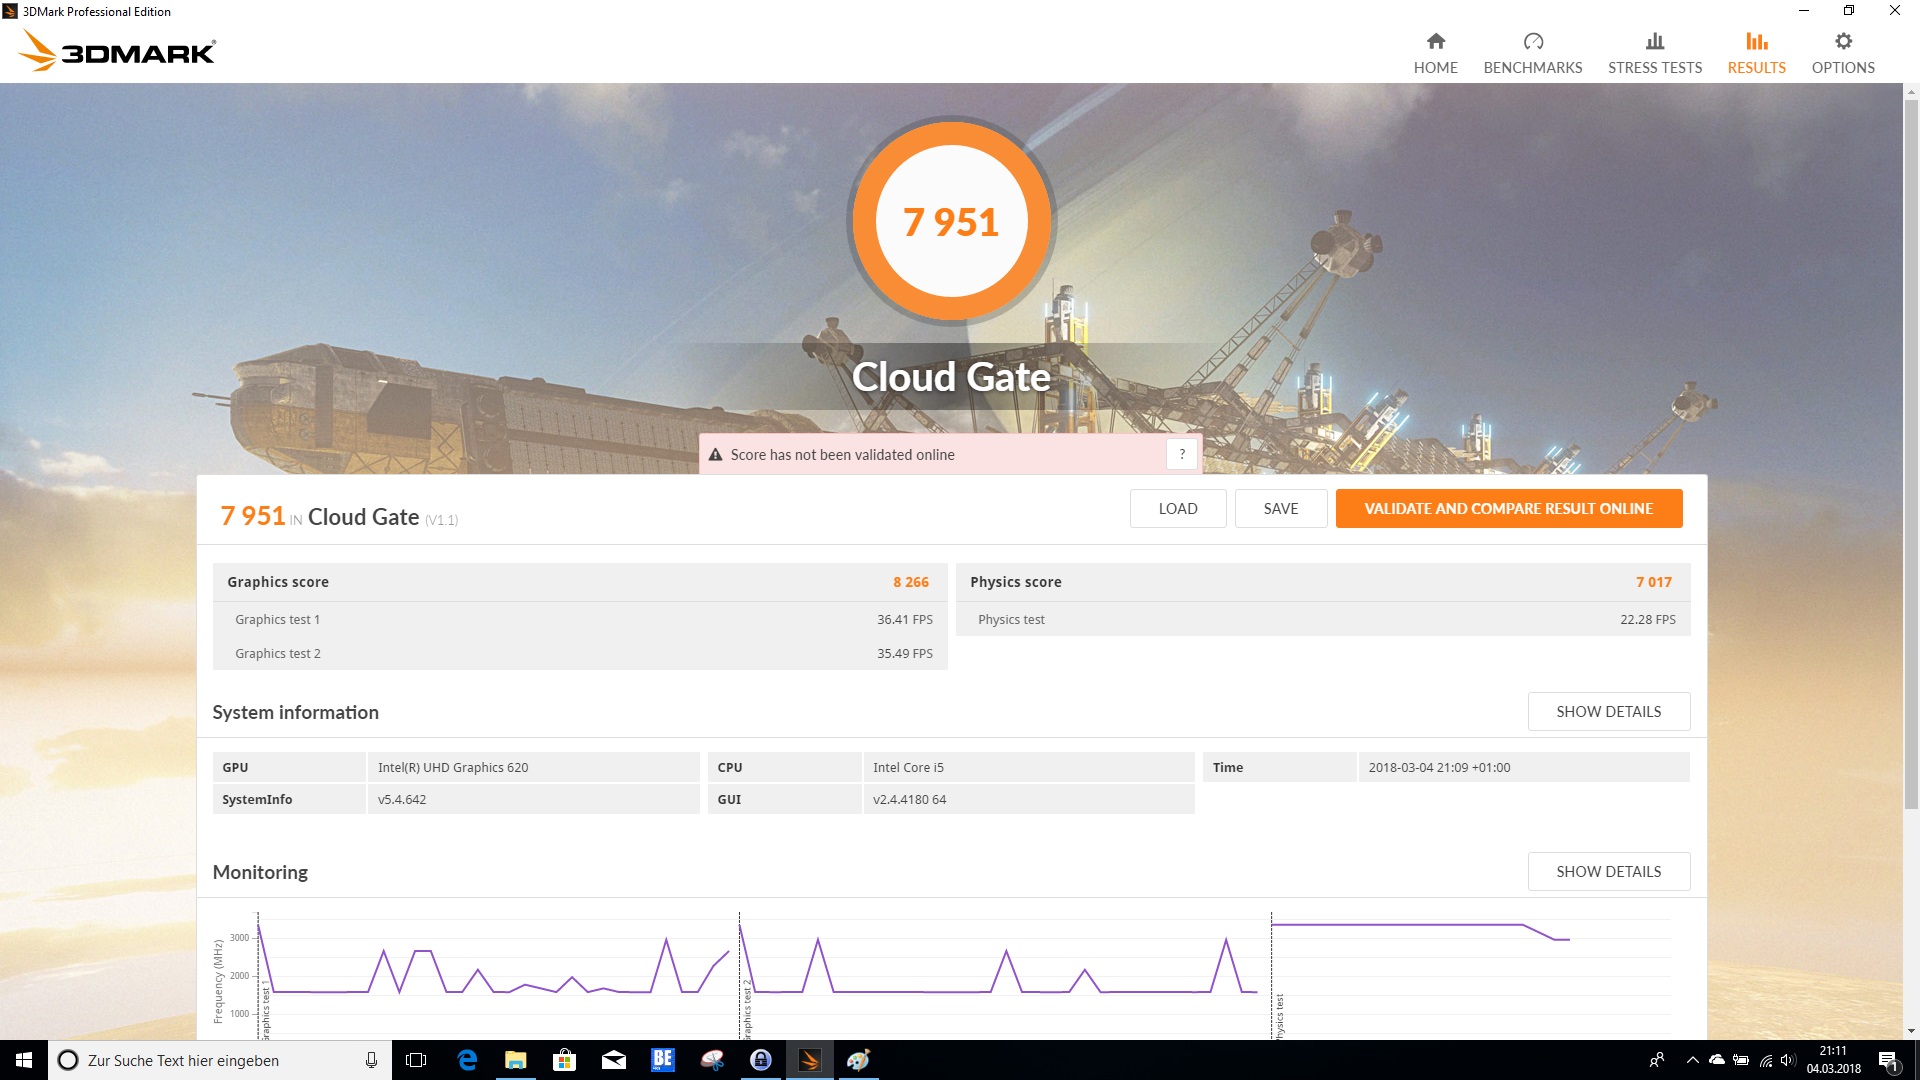
| 3DMark Cloud Gate Standard Score | 7951 points | |
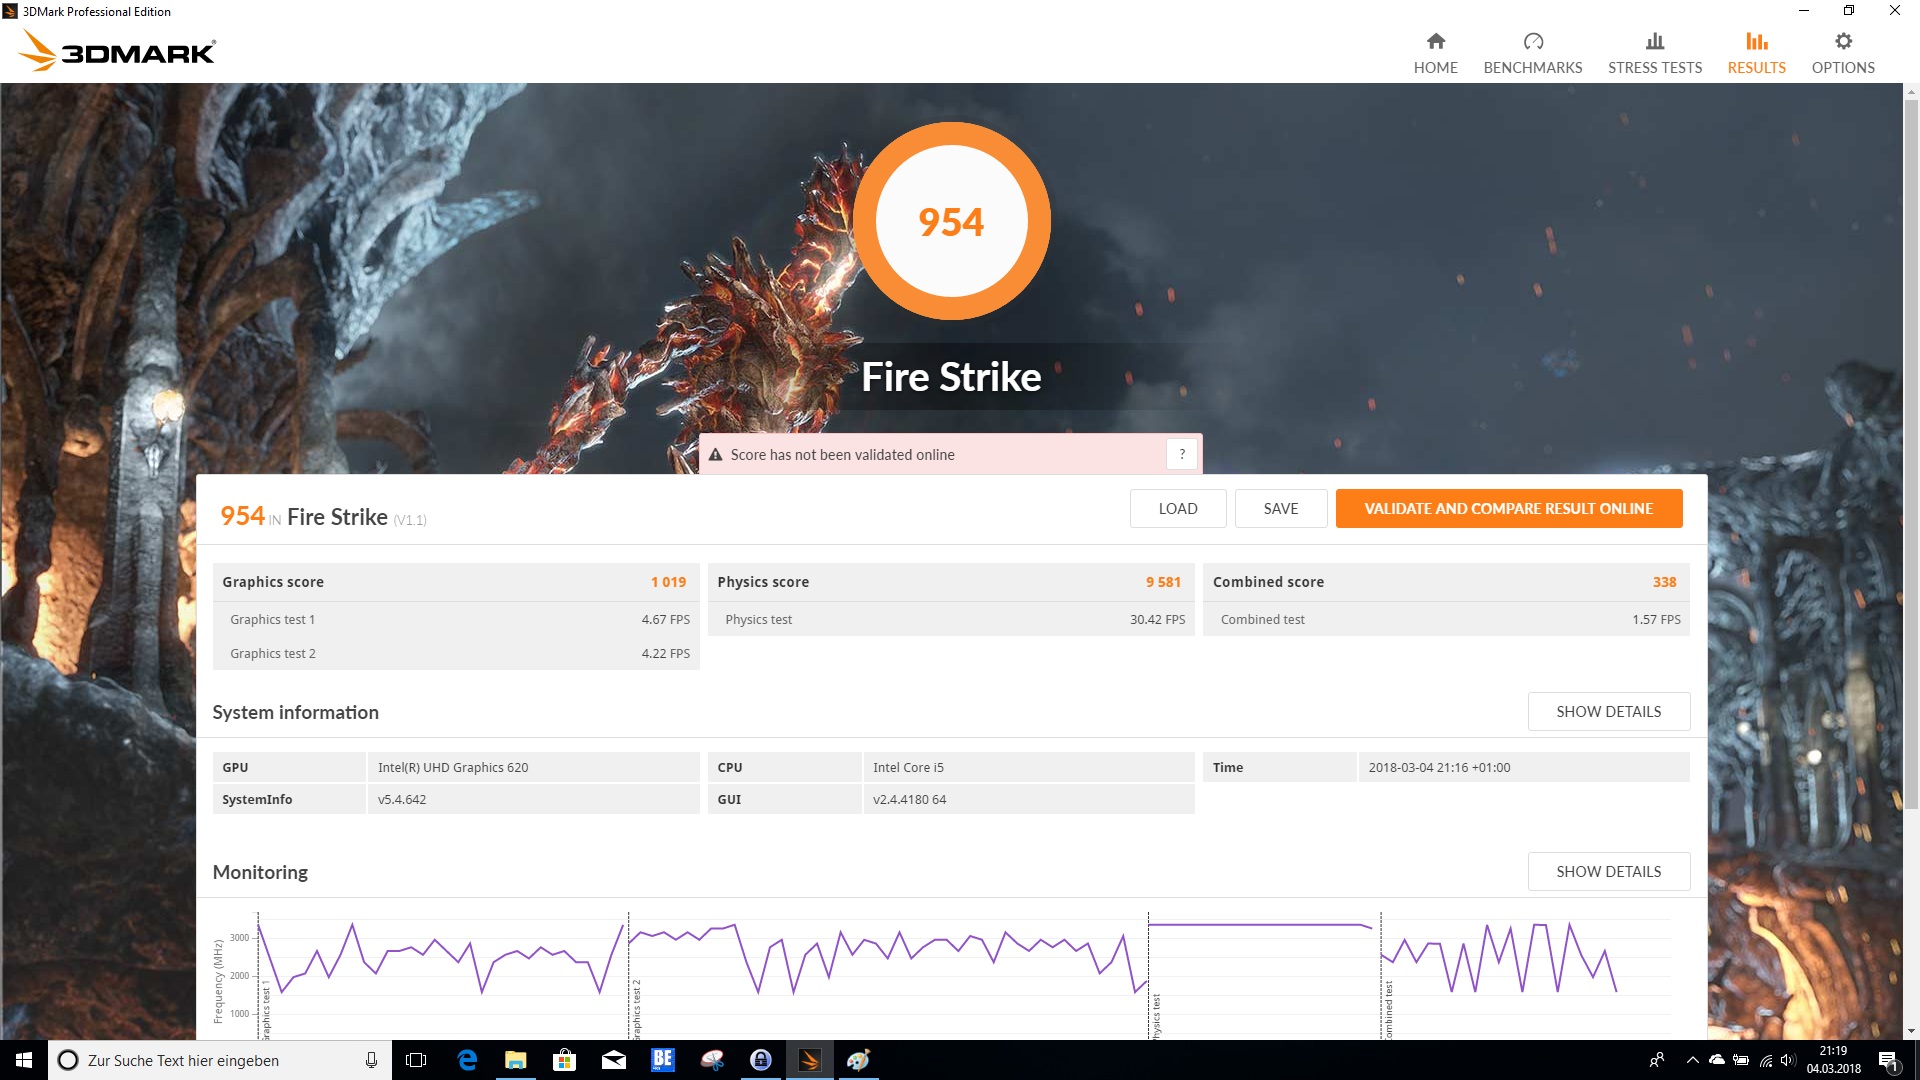
| 3DMark Fire Strike Score | 954 points | |
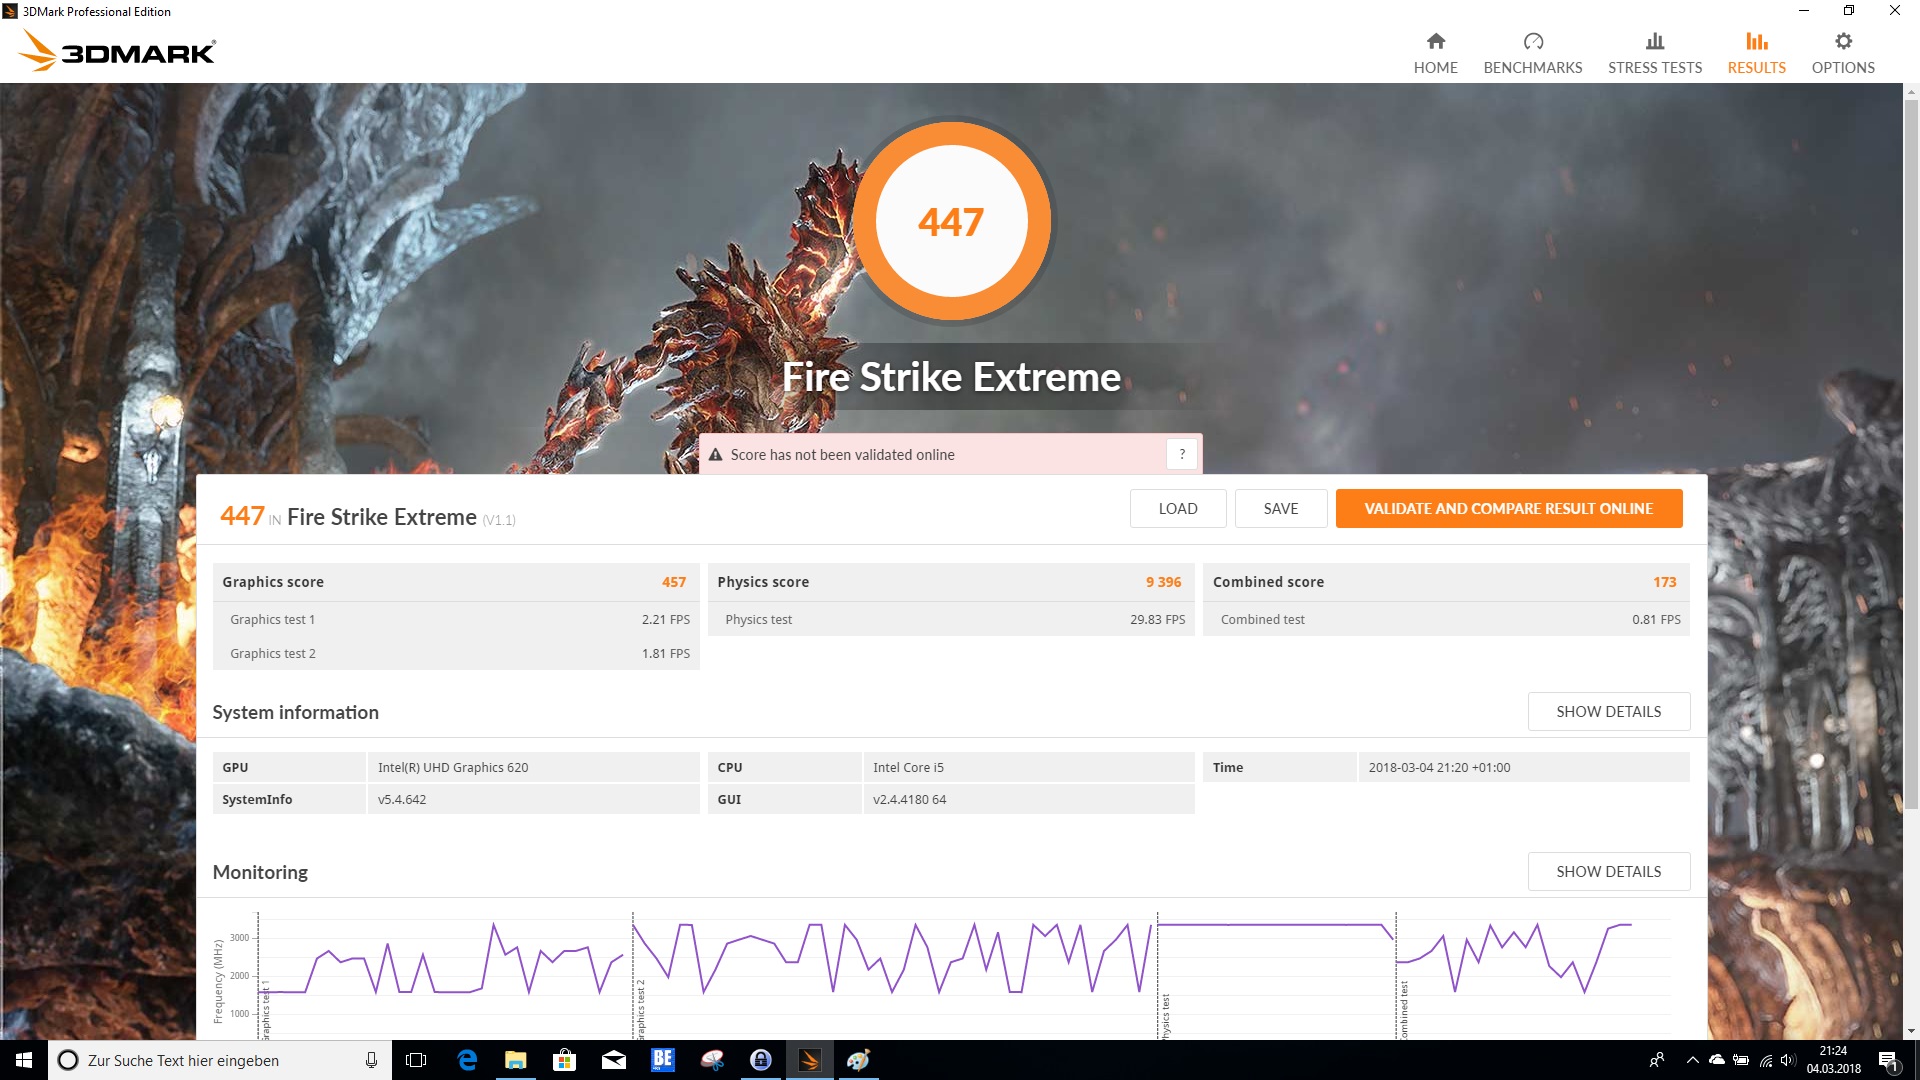
| 3DMark Fire Strike Extreme Score | 447 points | |
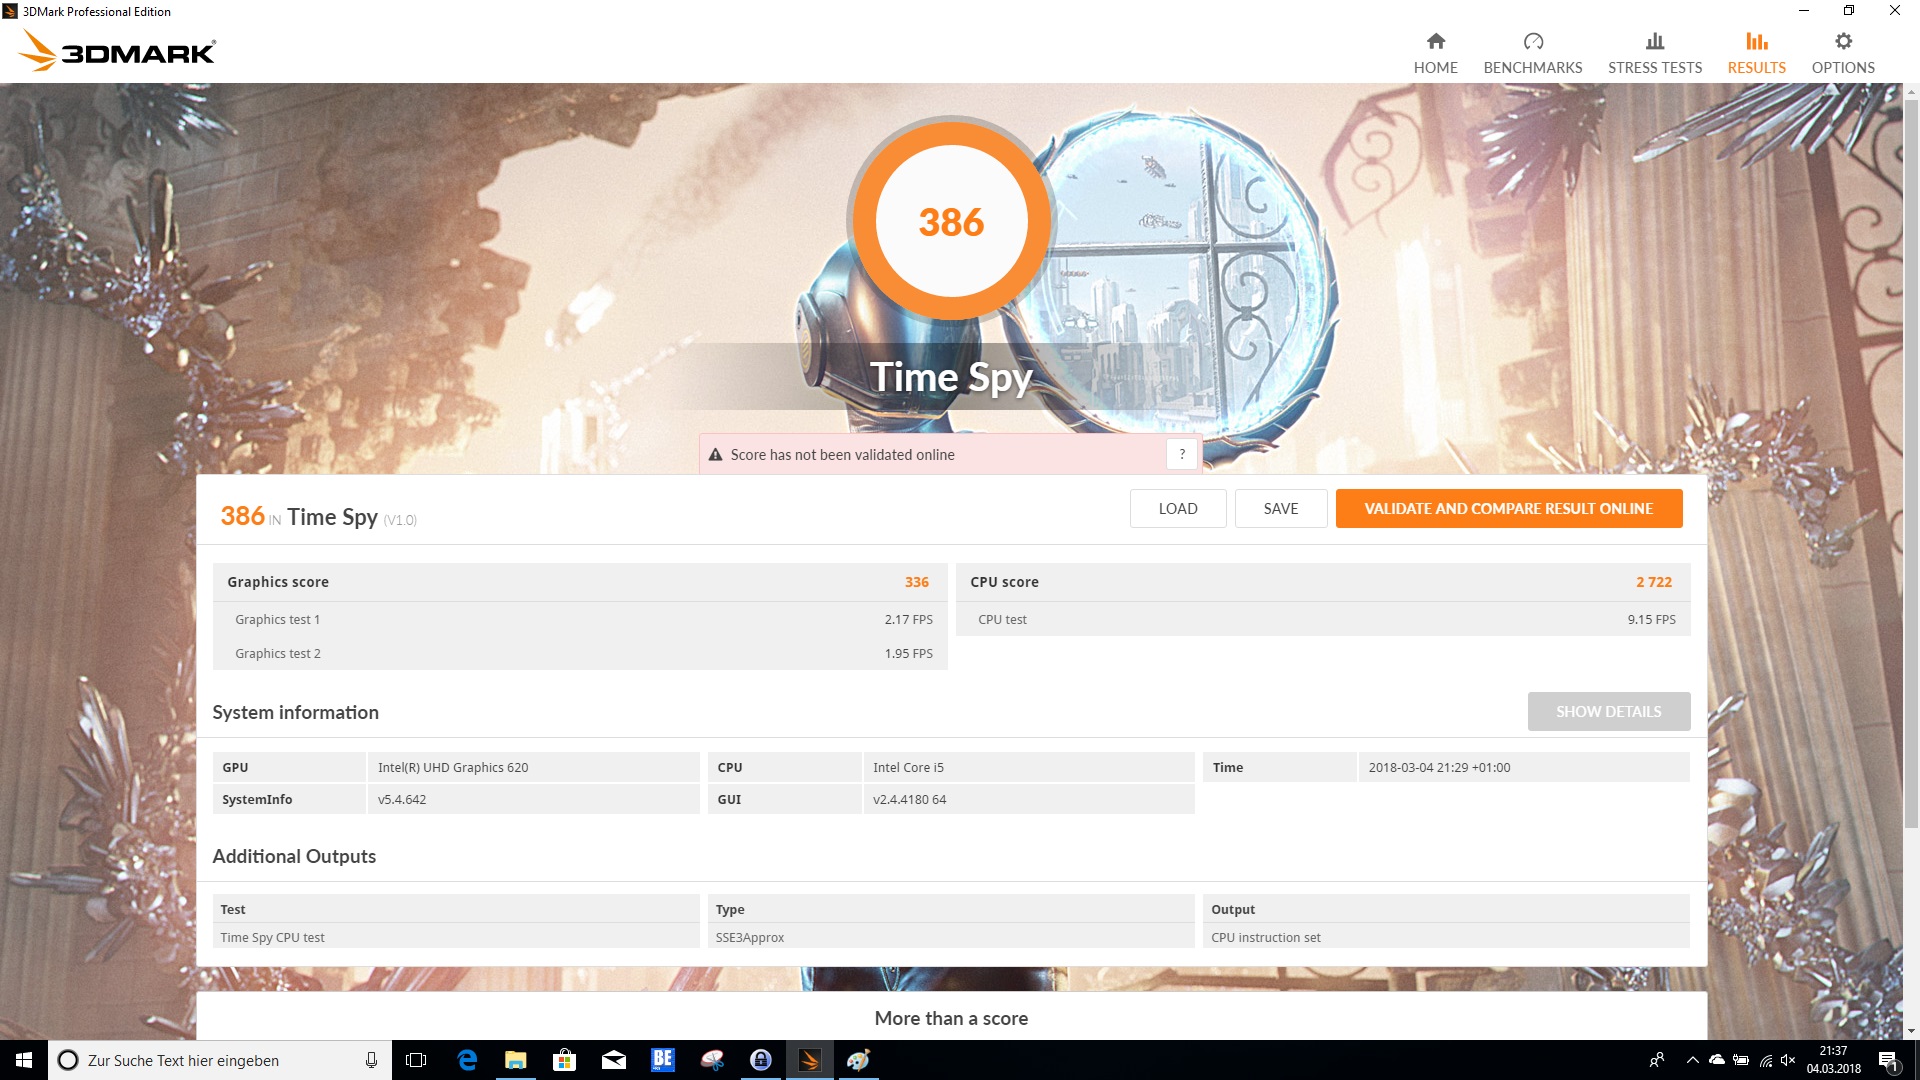
| 3DMark Time Spy Score | 386 points | |
Aide | ||
| Bas | Moyen | Élevé | Ultra | |
|---|---|---|---|---|
| BioShock Infinite (2013) | 47.4 | 27.8 | 23 | 7.7 |
| The Witcher 3 (2015) | 15.2 | 9.8 | 5.5 | |
| Rise of the Tomb Raider (2016) | 18.6 | 11.4 | 6.5 |
Degré de la nuisance sonore
| Au repos |
| 30.4 / 30.4 / 30.4 dB(A) |
| Fortement sollicité |
| 32.3 / 37 dB(A) |
 | ||
30 dB silencieux 40 dB(A) audible 50 dB(A) bruyant |
||
min: | ||
| Lenovo ThinkPad L480-20LS001AGE UHD Graphics 620, i5-8250U, Toshiba KXG5AZNV256G | Lenovo ThinkPad L470-20J5S00C00 HD Graphics 620, i5-7200U, SanDisk X400 256GB, SATA (SD8SB8U-256G) | Lenovo ThinkPad E480-20KNCTO1WW UHD Graphics 620, i5-8250U, Toshiba KBG30ZMT128G | Lenovo ThinkPad E480-20KQS00000 Radeon RX 550 (Laptop), i5-8250U, Lenovo LENSE20256GMSP34MEAT2TA | HP ProBook 440 G5-3KX87ES UHD Graphics 620, i5-8250U, Intel SSD 600p SSDPEKKW256G7 | Dell Latitude 5490-TD70X UHD Graphics 620, i5-8350U, Toshiba KSG60ZMV512G | |
|---|---|---|---|---|---|---|
| Noise | 2% | 4% | -7% | 1% | -2% | |
| arrêt / environnement * (dB) | 30.4 | 29.3 4% | 29.1 4% | 29.8 2% | 29.1 4% | 28.8 5% |
| Idle Minimum * (dB) | 30.4 | 29.3 4% | 29.1 4% | 29.8 2% | 29.1 4% | 28.8 5% |
| Idle Average * (dB) | 30.4 | 29.3 4% | 29.1 4% | 31.5 -4% | 29.1 4% | 28.8 5% |
| Idle Maximum * (dB) | 30.4 | 29.3 4% | 30.3 -0% | 33.3 -10% | 30.7 -1% | 30.9 -2% |
| Load Average * (dB) | 32.3 | 33.8 -5% | 31.8 2% | 39.1 -21% | 34.5 -7% | 35.6 -10% |
| Load Maximum * (dB) | 37 | 37.5 -1% | 33.8 9% | 40.4 -9% | 36 3% | 41.4 -12% |
| Witcher 3 ultra * (dB) | 39.1 |
* ... Moindre est la valeur, meilleures sont les performances
(±) La température maximale du côté supérieur est de 43 °C / 109 F, par rapport à la moyenne de 34.3 °C / 94 F, allant de 21.2 à 62.5 °C pour la classe Office.
(±) Le fond chauffe jusqu'à un maximum de 41.7 °C / 107 F, contre une moyenne de 36.8 °C / 98 F
(+) En utilisation inactive, la température moyenne du côté supérieur est de 24 °C / 75 F, par rapport à la moyenne du dispositif de 29.5 °C / 85 F.
(+) Les repose-poignets et le pavé tactile sont plus froids que la température de la peau avec un maximum de 24 °C / 75.2 F et sont donc froids au toucher.
(+) La température moyenne de la zone de l'appui-paume de dispositifs similaires était de 27.5 °C / 81.5 F (+3.5 °C / #6.3 F).
| Lenovo ThinkPad L480-20LS001AGE UHD Graphics 620, i5-8250U, Toshiba KXG5AZNV256G | Lenovo ThinkPad L470-20J5S00C00 HD Graphics 620, i5-7200U, SanDisk X400 256GB, SATA (SD8SB8U-256G) | Lenovo ThinkPad E480-20KNCTO1WW UHD Graphics 620, i5-8250U, Toshiba KBG30ZMT128G | Lenovo ThinkPad E480-20KQS00000 Radeon RX 550 (Laptop), i5-8250U, Lenovo LENSE20256GMSP34MEAT2TA | HP ProBook 440 G5-3KX87ES UHD Graphics 620, i5-8250U, Intel SSD 600p SSDPEKKW256G7 | Dell Latitude 5490-TD70X UHD Graphics 620, i5-8350U, Toshiba KSG60ZMV512G | |
|---|---|---|---|---|---|---|
| Heat | 4% | 9% | -25% | 3% | 5% | |
| Maximum Upper Side * (°C) | 43 | 40.1 7% | 36.7 15% | 51.9 -21% | 39 9% | 38.3 11% |
| Maximum Bottom * (°C) | 41.7 | 51 -22% | 42.8 -3% | 71.6 -72% | 45.5 -9% | 44.7 -7% |
| Idle Upper Side * (°C) | 25.7 | 22 14% | 23.4 9% | 24.8 4% | 24.8 4% | 23.7 8% |
| Idle Bottom * (°C) | 27.1 | 22.4 17% | 22.8 16% | 30 -11% | 25 8% | 25.4 6% |
* ... Moindre est la valeur, meilleures sont les performances
Lenovo ThinkPad L480-20LS001AGE analyse audio
(-) | haut-parleurs pas très forts (68.3 dB)
Basses 100 - 315 Hz
(-) | presque aucune basse - en moyenne 21.3% plus bas que la médiane
(±) | la linéarité des basses est moyenne (10.9% delta à la fréquence précédente)
Médiums 400 - 2000 Hz
(+) | médiane équilibrée - seulement 4.2% de la médiane
(±) | la linéarité des médiums est moyenne (14% delta à la fréquence précédente)
Aiguës 2 - 16 kHz
(+) | des sommets équilibrés - à seulement 2.6% de la médiane
(±) | la linéarité des aigus est moyenne (9.1% delta à la fréquence précédente)
Globalement 100 - 16 000 Hz
(±) | la linéarité du son global est moyenne (24.3% de différence avec la médiane)
Par rapport à la même classe
» 71% de tous les appareils testés de cette catégorie étaient meilleurs, 8% similaires, 21% pires
» Le meilleur avait un delta de 7%, la moyenne était de 21%, le pire était de 53%.
Par rapport à tous les appareils testés
» 74% de tous les appareils testés étaient meilleurs, 6% similaires, 21% pires
» Le meilleur avait un delta de 4%, la moyenne était de 24%, le pire était de 134%.
Lenovo ThinkPad E480-20KQS00000 analyse audio
(±) | le niveau sonore du haut-parleur est moyen mais bon (76.6# dB)
Basses 100 - 315 Hz
(±) | basse réduite - en moyenne 13.2% inférieure à la médiane
(±) | la linéarité des basses est moyenne (12.4% delta à la fréquence précédente)
Médiums 400 - 2000 Hz
(±) | médiane supérieure - en moyenne 5.2% supérieure à la médiane
(±) | la linéarité des médiums est moyenne (9.6% delta à la fréquence précédente)
Aiguës 2 - 16 kHz
(+) | des sommets équilibrés - à seulement 3.8% de la médiane
(±) | la linéarité des aigus est moyenne (10.2% delta à la fréquence précédente)
Globalement 100 - 16 000 Hz
(±) | la linéarité du son global est moyenne (19.9% de différence avec la médiane)
Par rapport à la même classe
» 42% de tous les appareils testés de cette catégorie étaient meilleurs, 9% similaires, 49% pires
» Le meilleur avait un delta de 7%, la moyenne était de 21%, le pire était de 53%.
Par rapport à tous les appareils testés
» 51% de tous les appareils testés étaient meilleurs, 7% similaires, 42% pires
» Le meilleur avait un delta de 4%, la moyenne était de 24%, le pire était de 134%.
| Éteint/en veille | |
| Au repos | |
| Fortement sollicité |
|
Légende:
min: | |
| Lenovo ThinkPad L480-20LS001AGE i5-8250U, UHD Graphics 620, Toshiba KXG5AZNV256G, IPS, 1920x1080, 14" | Lenovo ThinkPad L470-20J5S00C00 i5-7200U, HD Graphics 620, SanDisk X400 256GB, SATA (SD8SB8U-256G), IPS, 1920x1080, 14" | Lenovo ThinkPad E480-20KNCTO1WW i5-8250U, UHD Graphics 620, Toshiba KBG30ZMT128G, IPS LED, 1920x1080, 14" | Lenovo ThinkPad E480-20KQS00000 i5-8250U, Radeon RX 550 (Laptop), Lenovo LENSE20256GMSP34MEAT2TA, IPS LED, 1920x1080, 14" | HP ProBook 440 G5-3KX87ES i5-8250U, UHD Graphics 620, Intel SSD 600p SSDPEKKW256G7, IPS LED, 1920x1080, 14" | Dell Latitude 5490-TD70X i5-8350U, UHD Graphics 620, Toshiba KSG60ZMV512G, IPS, 1920x1080, 14" | |
|---|---|---|---|---|---|---|
| Power Consumption | 9% | 9% | -26% | -20% | -12% | |
| Idle Minimum * (Watt) | 3.3 | 2.6 21% | 3.5 -6% | 4.1 -24% | 4.4 -33% | 3.3 -0% |
| Idle Average * (Watt) | 6.6 | 6.3 5% | 5.3 20% | 6.3 5% | 7.1 -8% | 5.54 16% |
| Idle Maximum * (Watt) | 7.3 | 7 4% | 6.1 16% | 7.1 3% | 10.2 -40% | 6.59 10% |
| Load Average * (Watt) | 40.4 | 29.1 28% | 30 26% | 54.8 -36% | 36.5 10% | 42.4 -5% |
| Load Maximum * (Watt) | 37.4 | 42.3 -13% | 42.3 -13% | 66.4 -78% | 48.7 -30% | 67.6 -81% |
| Witcher 3 ultra * (Watt) | 43.8 |
* ... Moindre est la valeur, meilleures sont les performances
| Lenovo ThinkPad L480-20LS001AGE i5-8250U, UHD Graphics 620, 45 Wh | Lenovo ThinkPad L470-20J5S00C00 i5-7200U, HD Graphics 620, 48 Wh | Lenovo ThinkPad E480-20KNCTO1WW i5-8250U, UHD Graphics 620, 45 Wh | Lenovo ThinkPad E480-20KQS00000 i5-8250U, Radeon RX 550 (Laptop), 48 Wh | HP ProBook 440 G5-3KX87ES i5-8250U, UHD Graphics 620, 48 Wh | Dell Latitude 5490-TD70X i5-8350U, UHD Graphics 620, 68 Wh | |
|---|---|---|---|---|---|---|
| Autonomie de la batterie | 31% | 7% | 0% | 6% | 55% | |
| Reader / Idle (h) | 16.9 | 23.3 38% | 18.4 9% | 19.4 15% | 13.7 -19% | 25.9 53% |
| H.264 (h) | 8 | 10.8 35% | 7.2 -10% | 8.9 11% | 3.7 -54% | 13.2 65% |
| WiFi v1.3 (h) | 7.7 | 8 4% | 8.3 8% | 5.7 -26% | 6.9 -10% | 15 95% |
| Load (h) | 1.5 | 2.2 47% | 1.8 20% | 1.5 0% | 3.1 107% | 1.6 7% |
Points positifs
Points négatifs

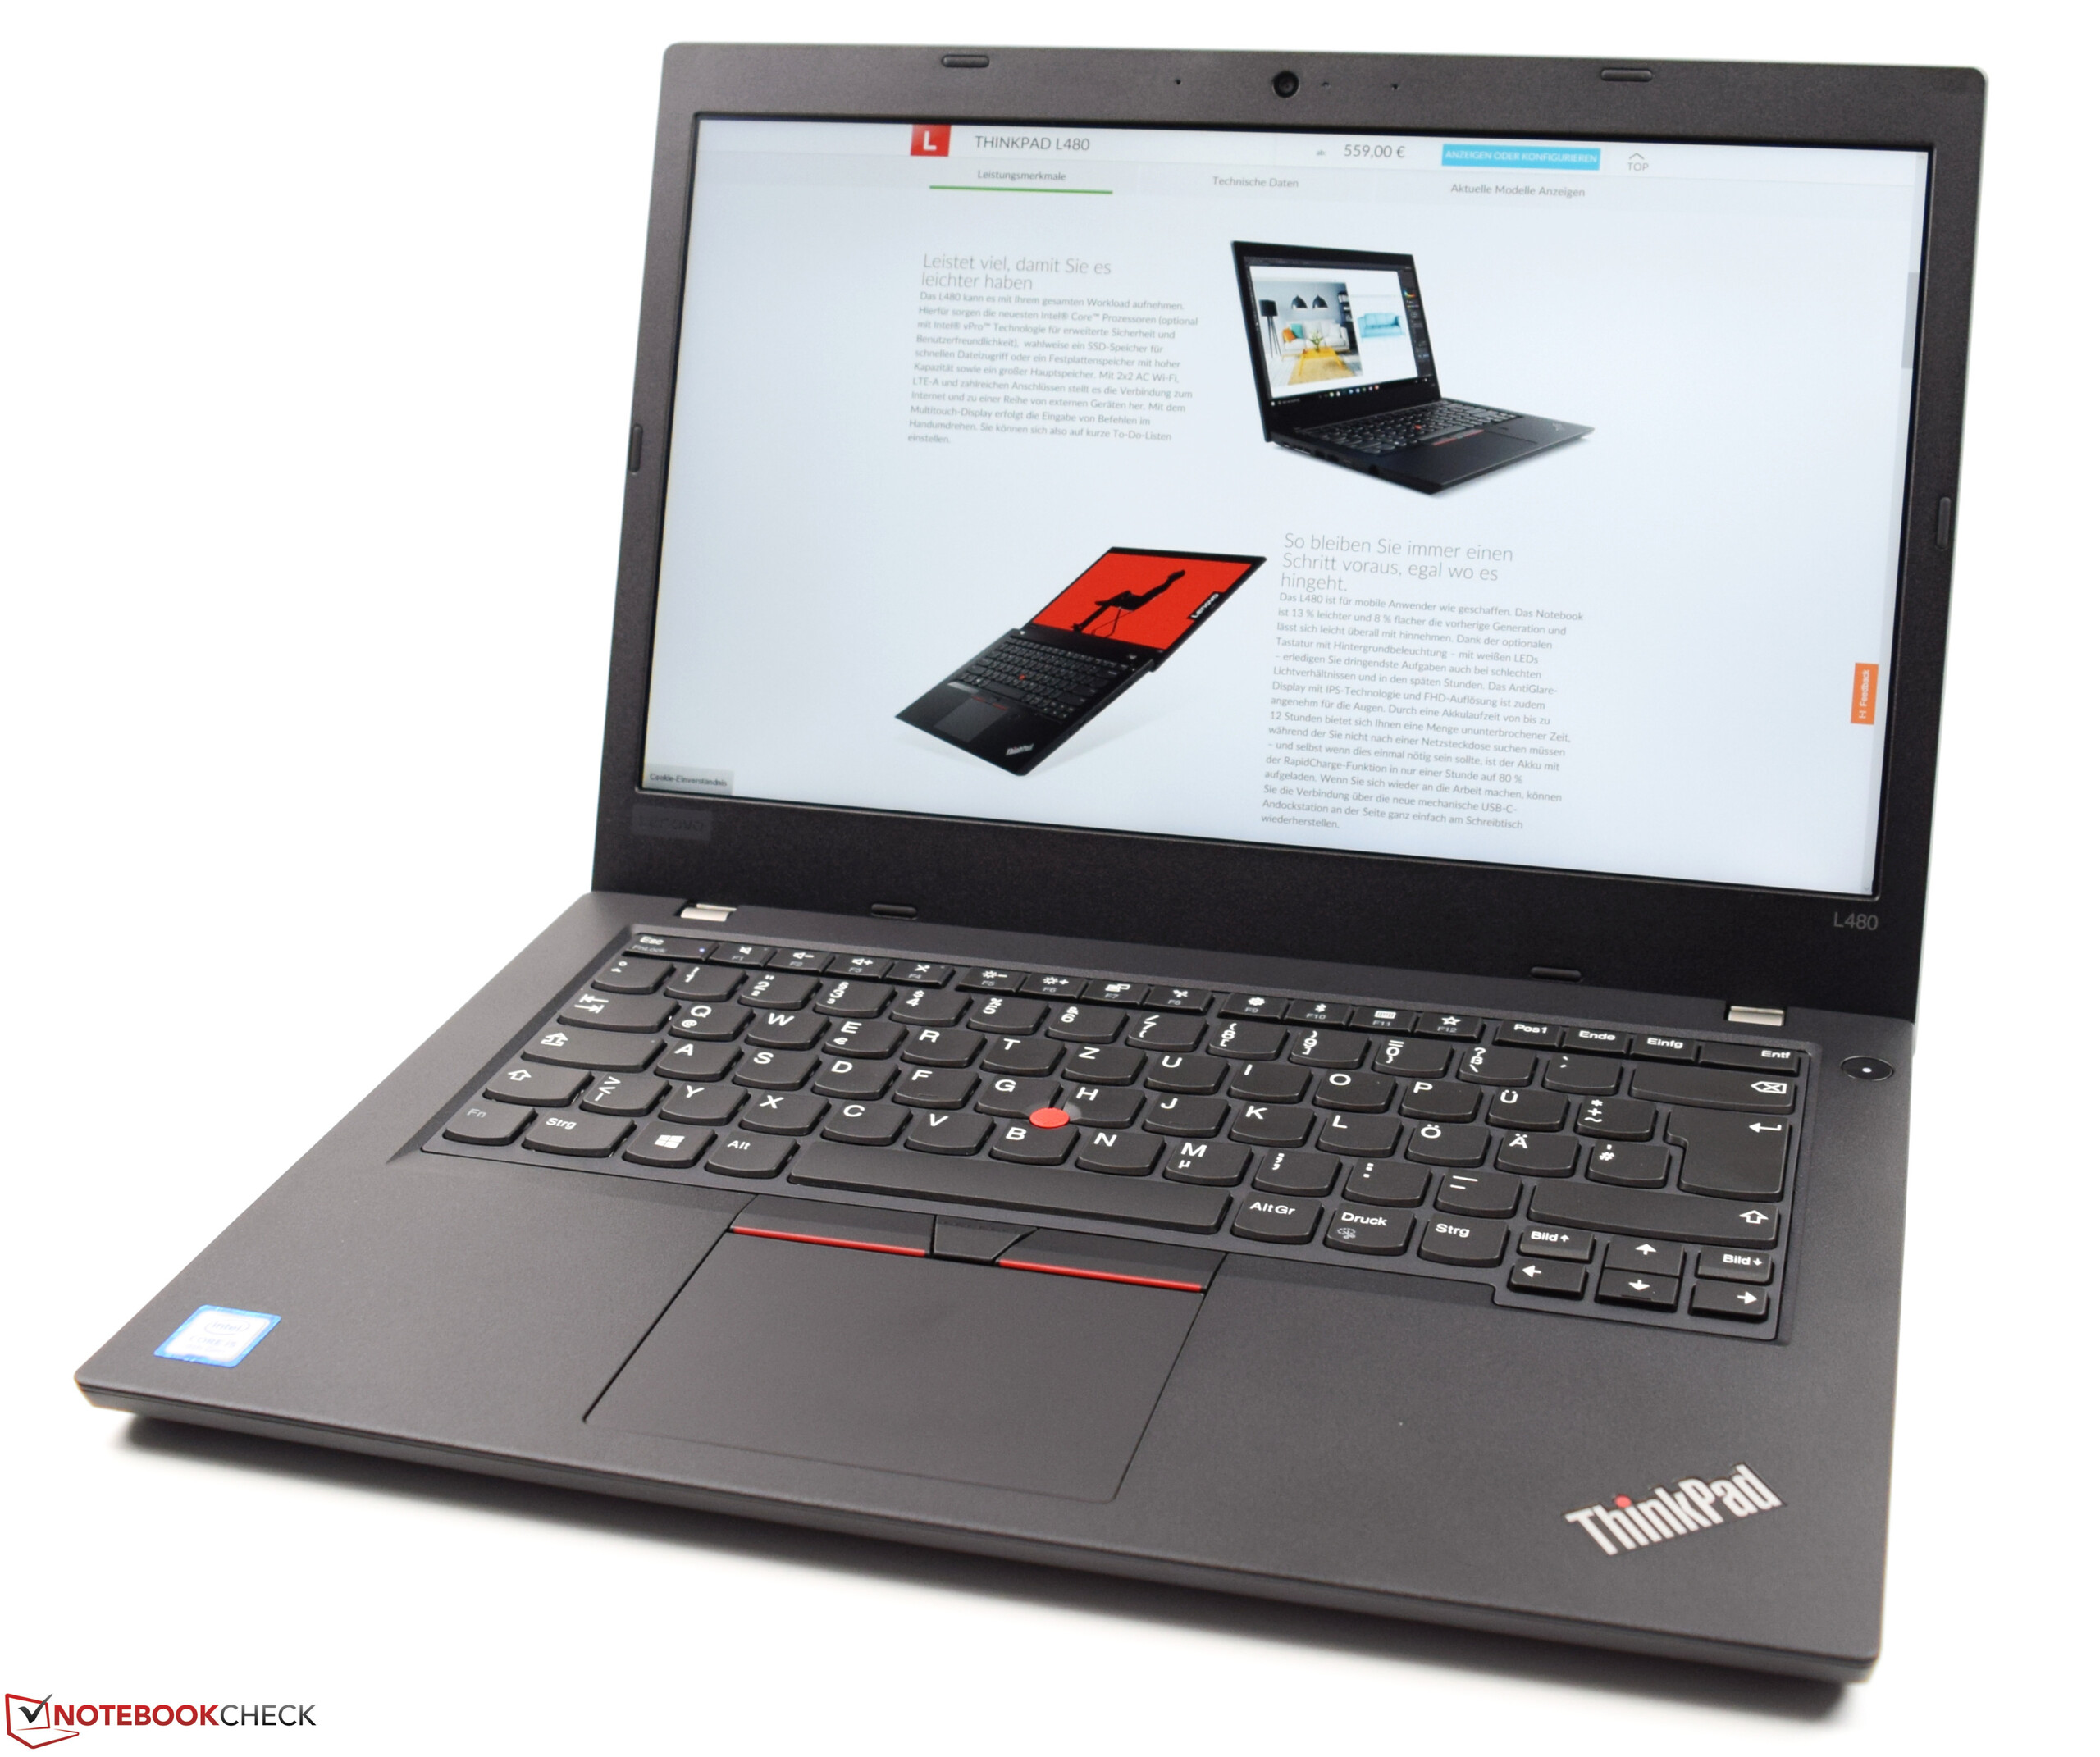
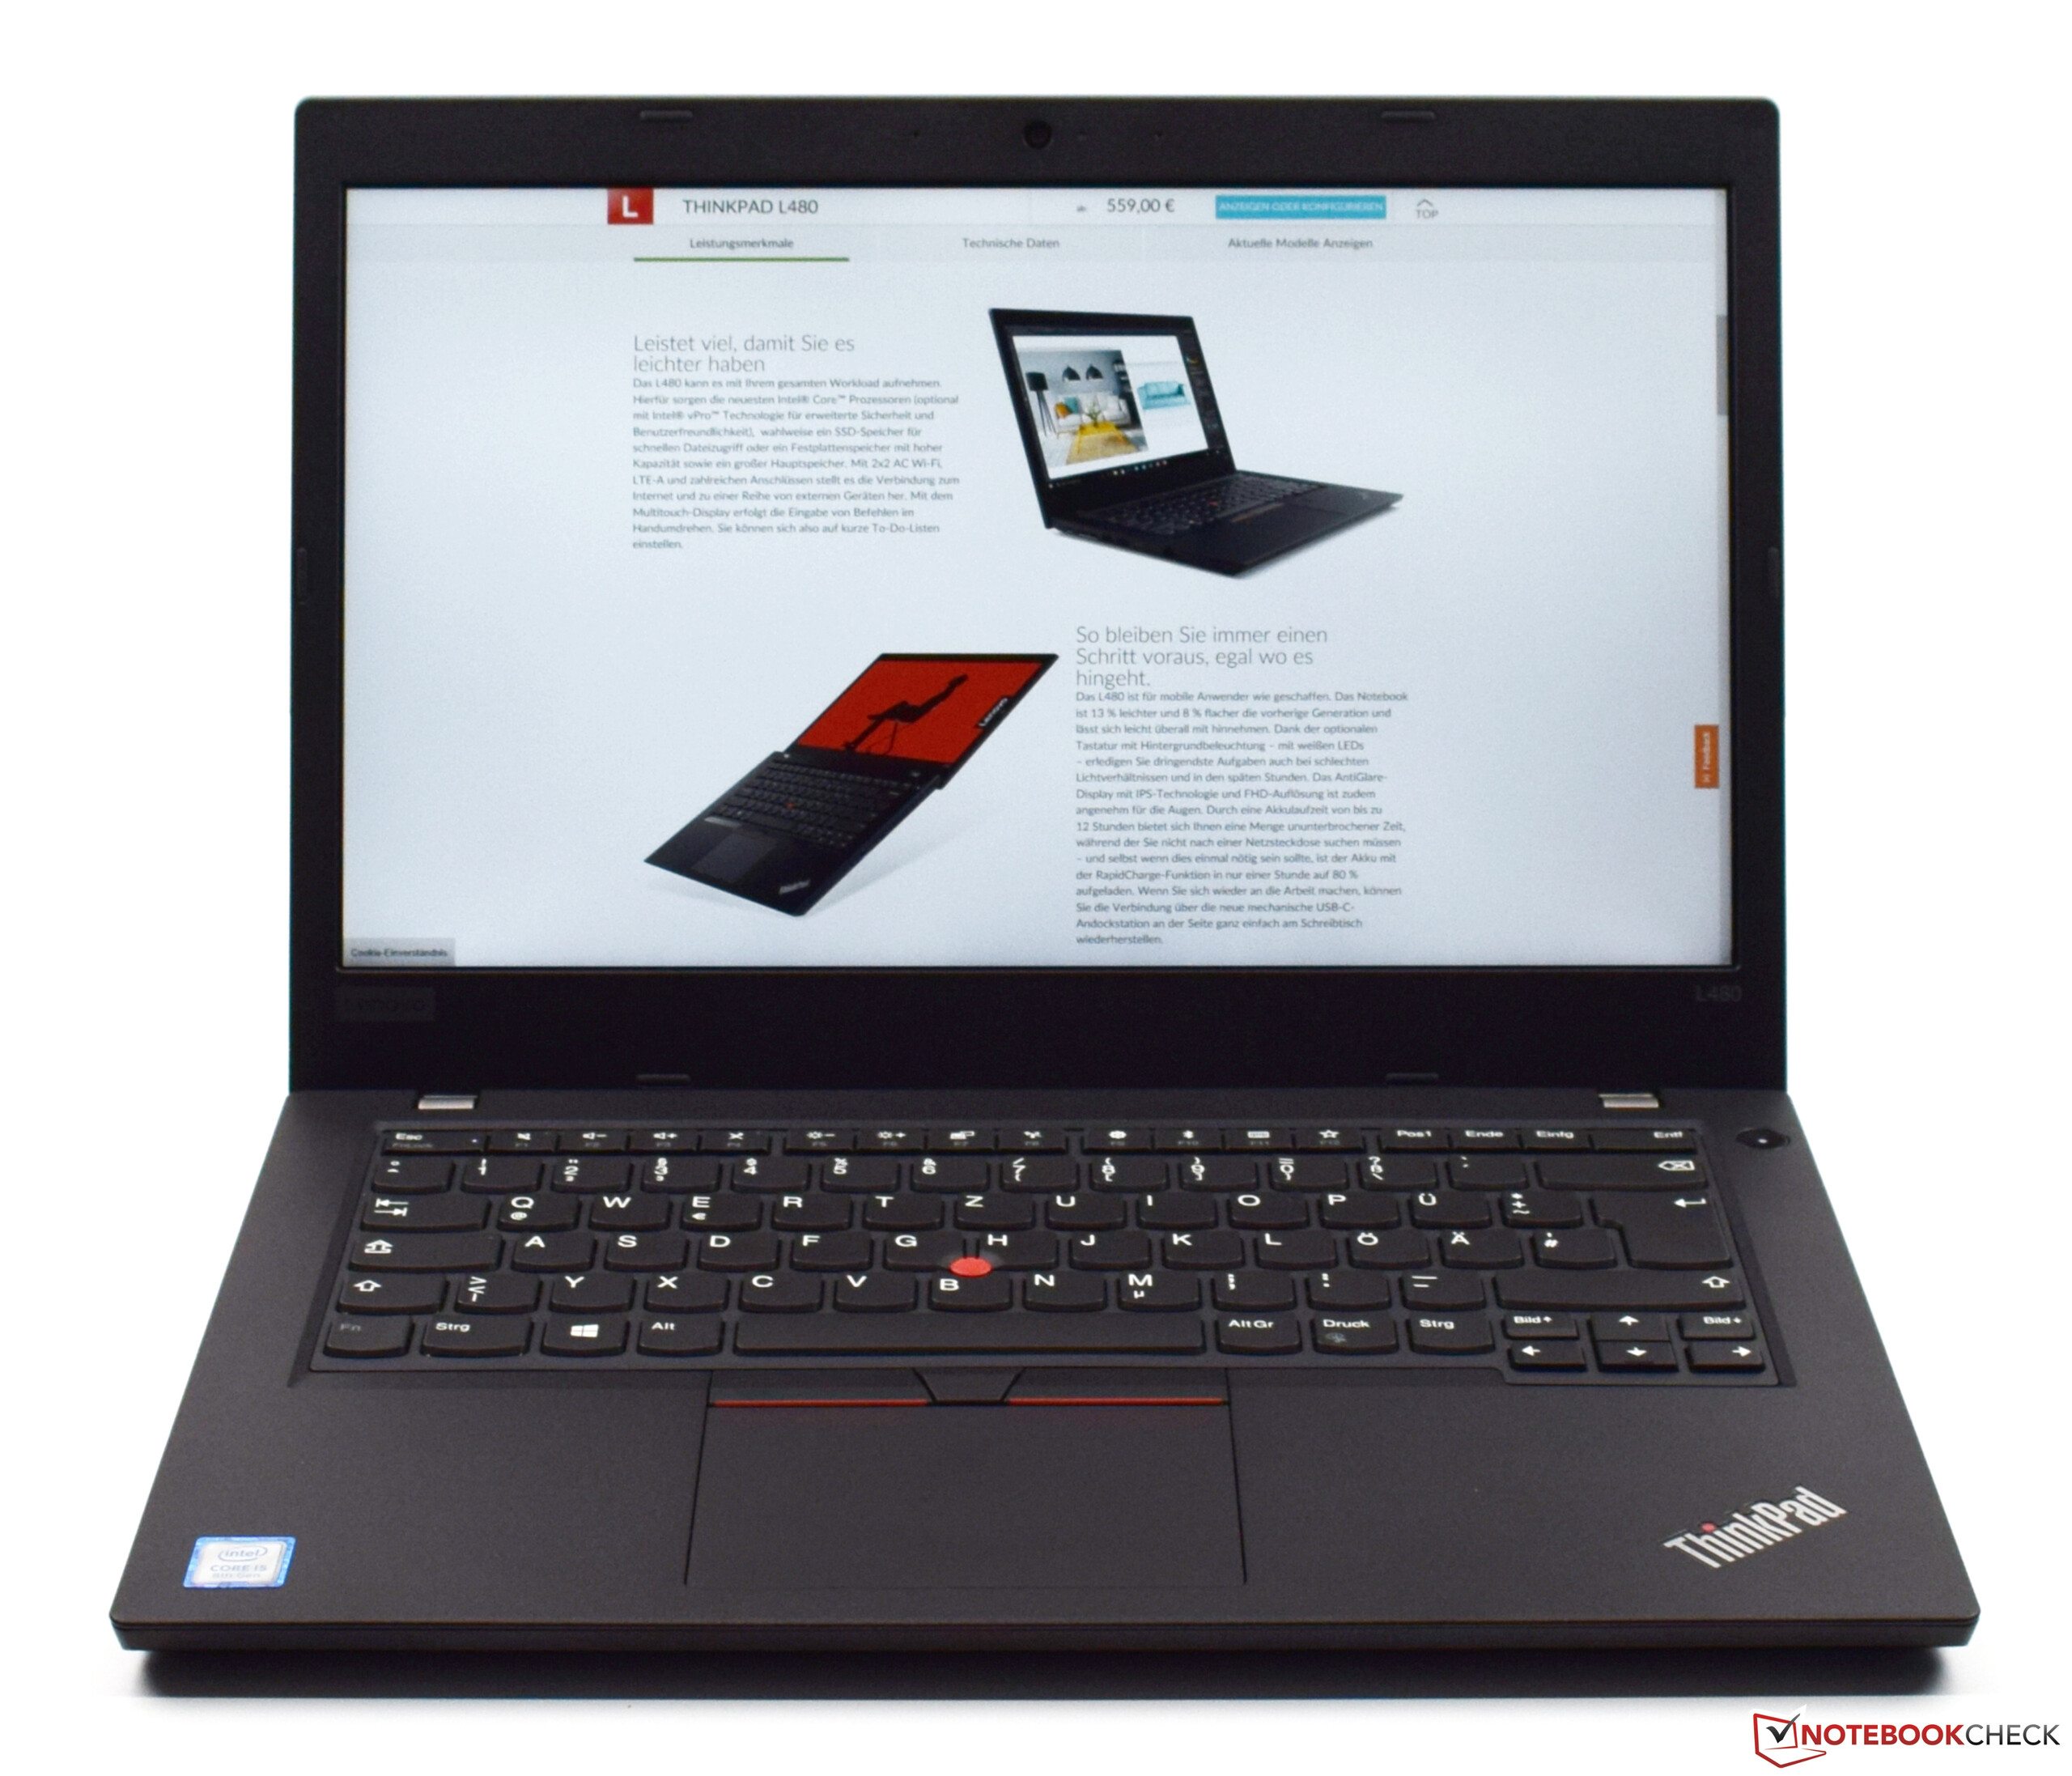
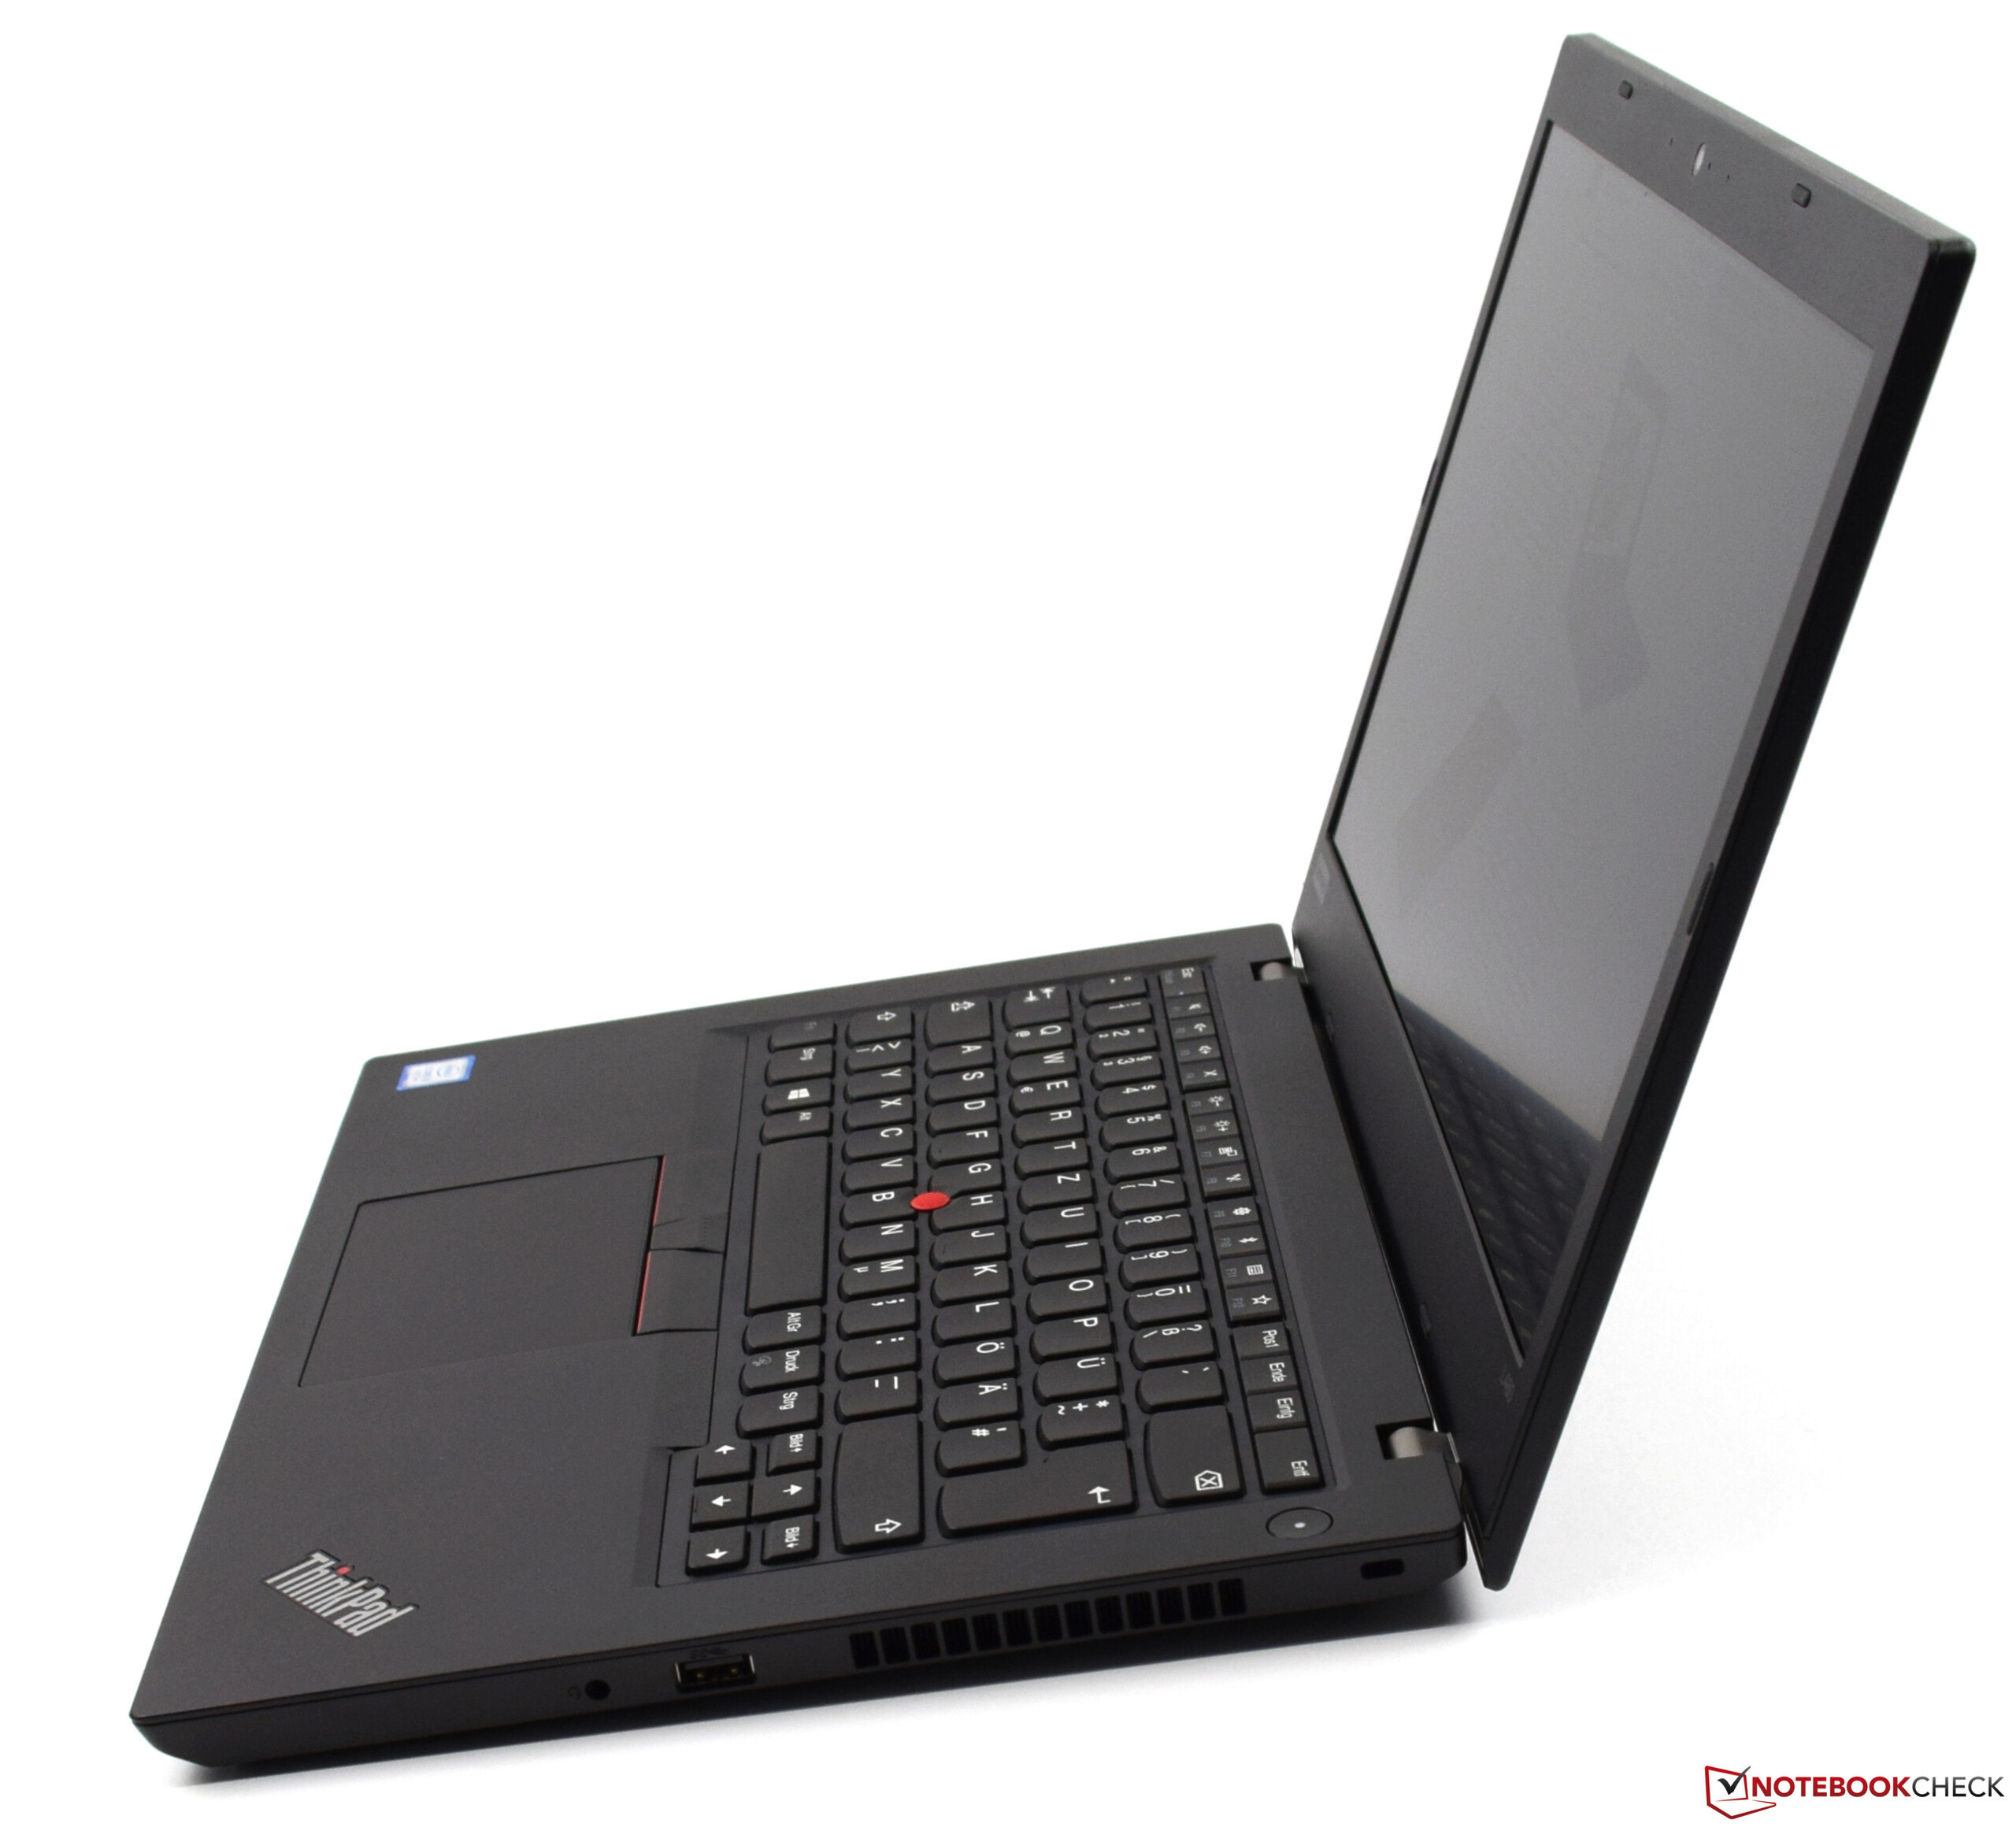
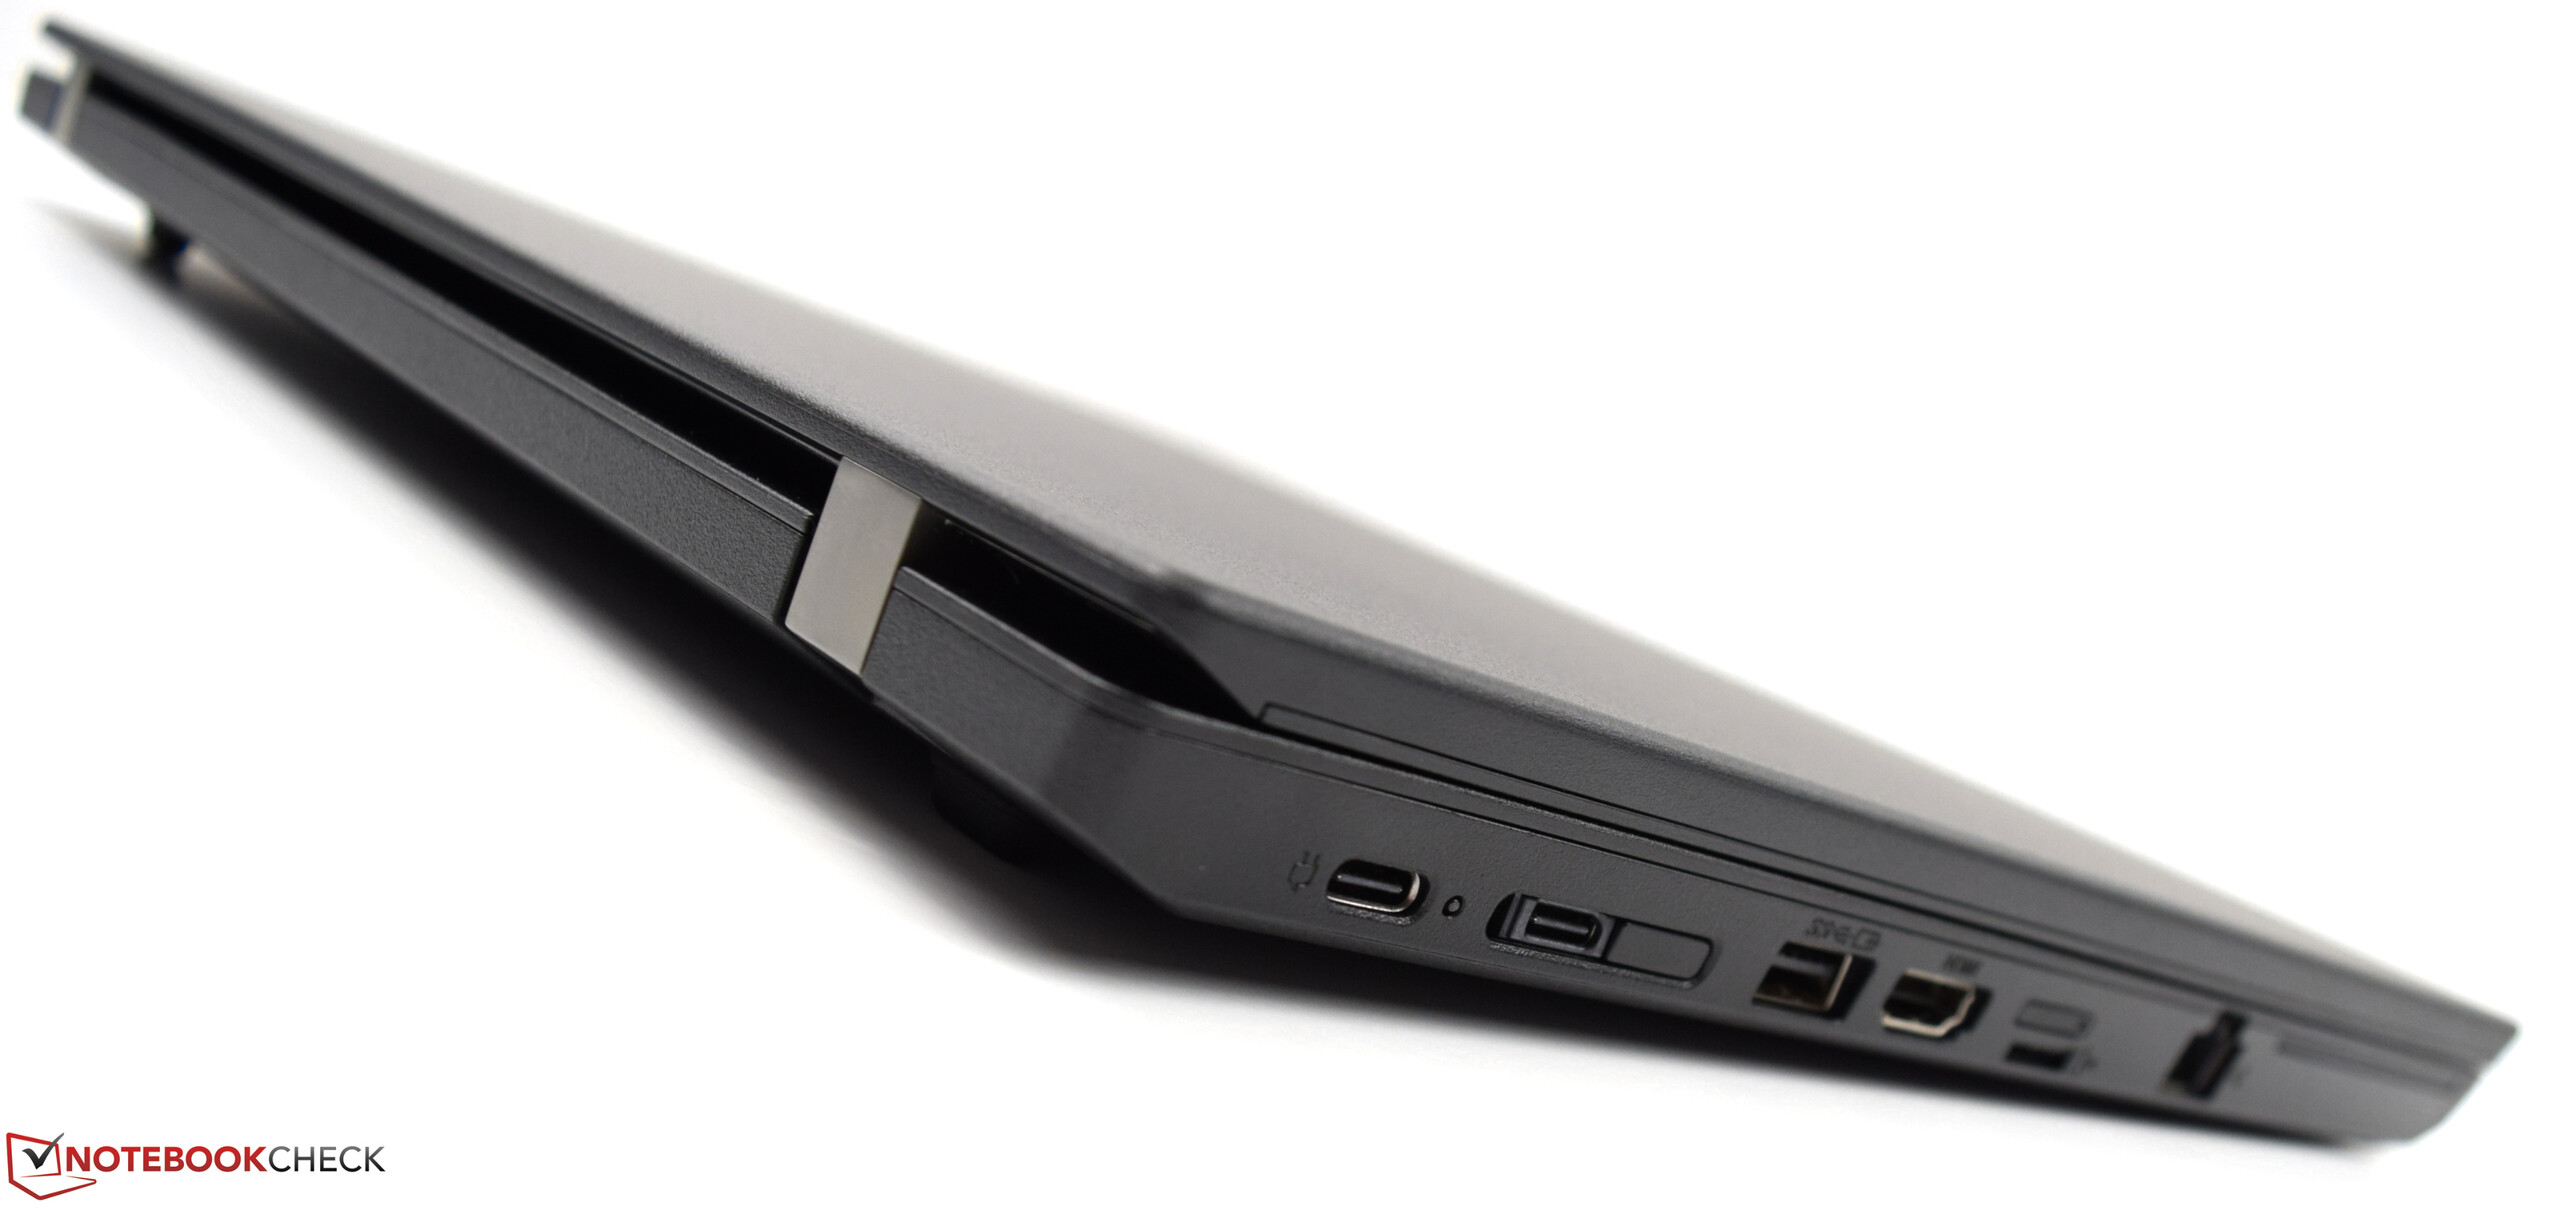
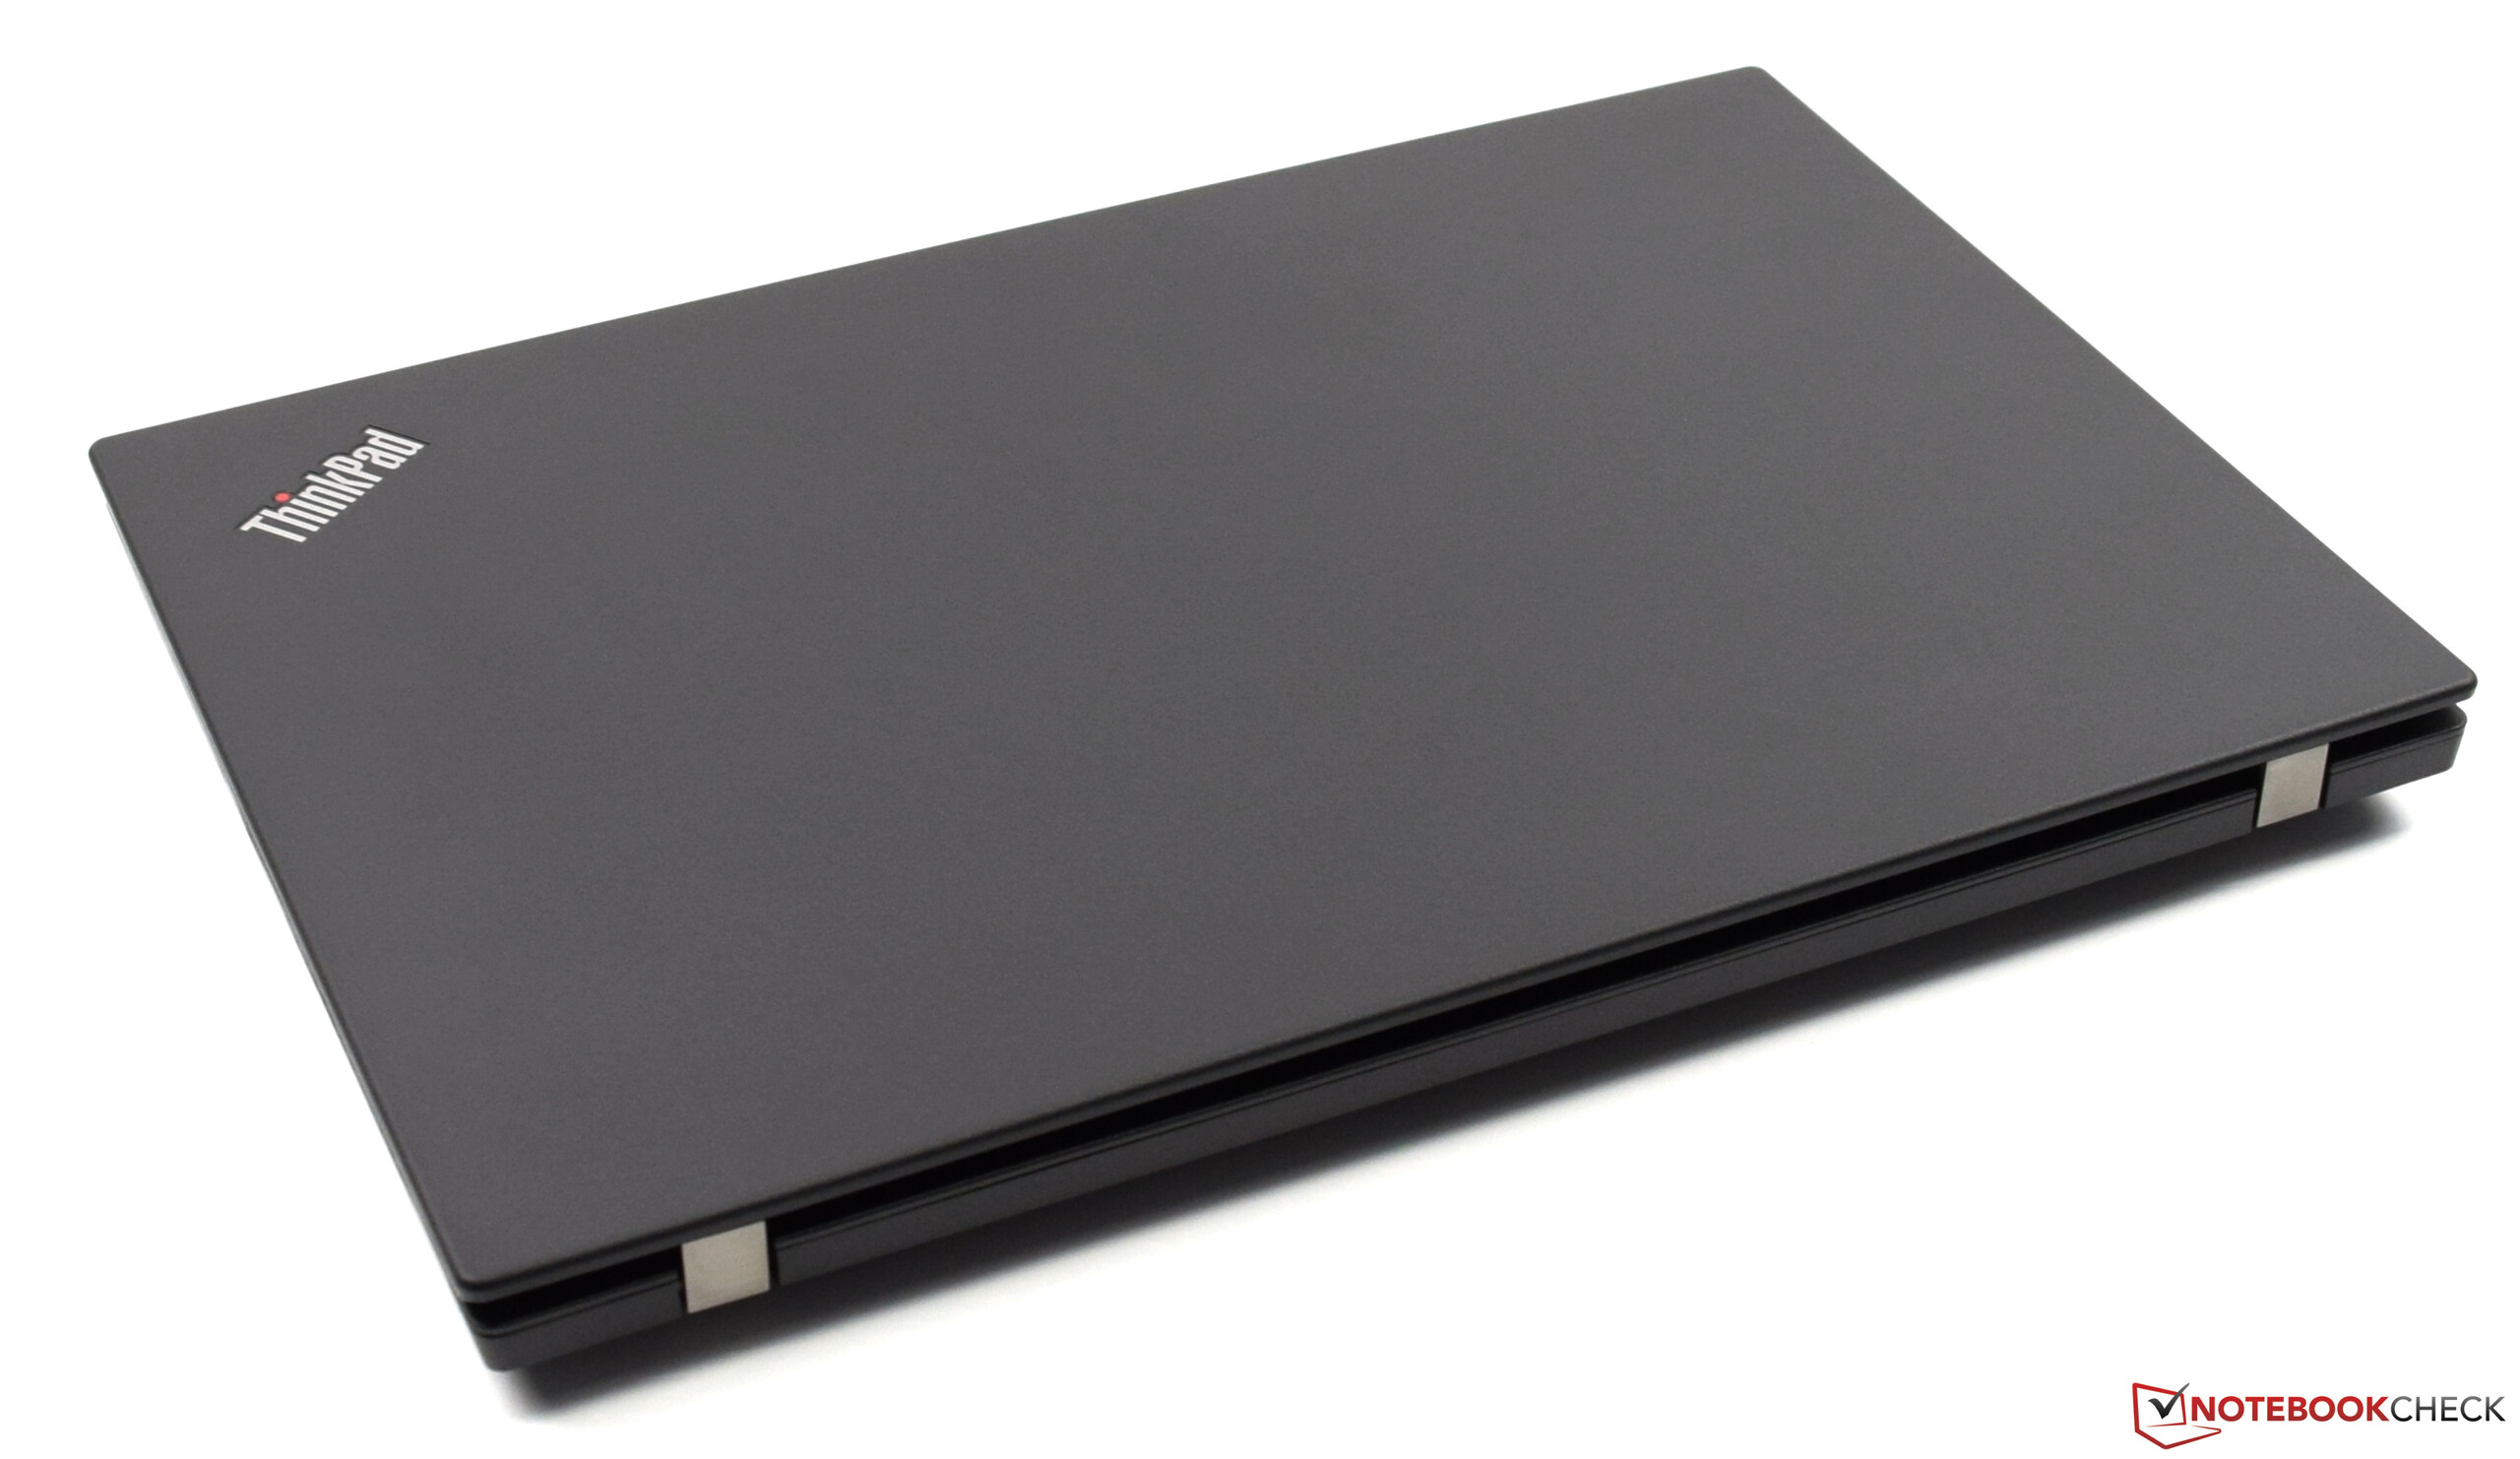
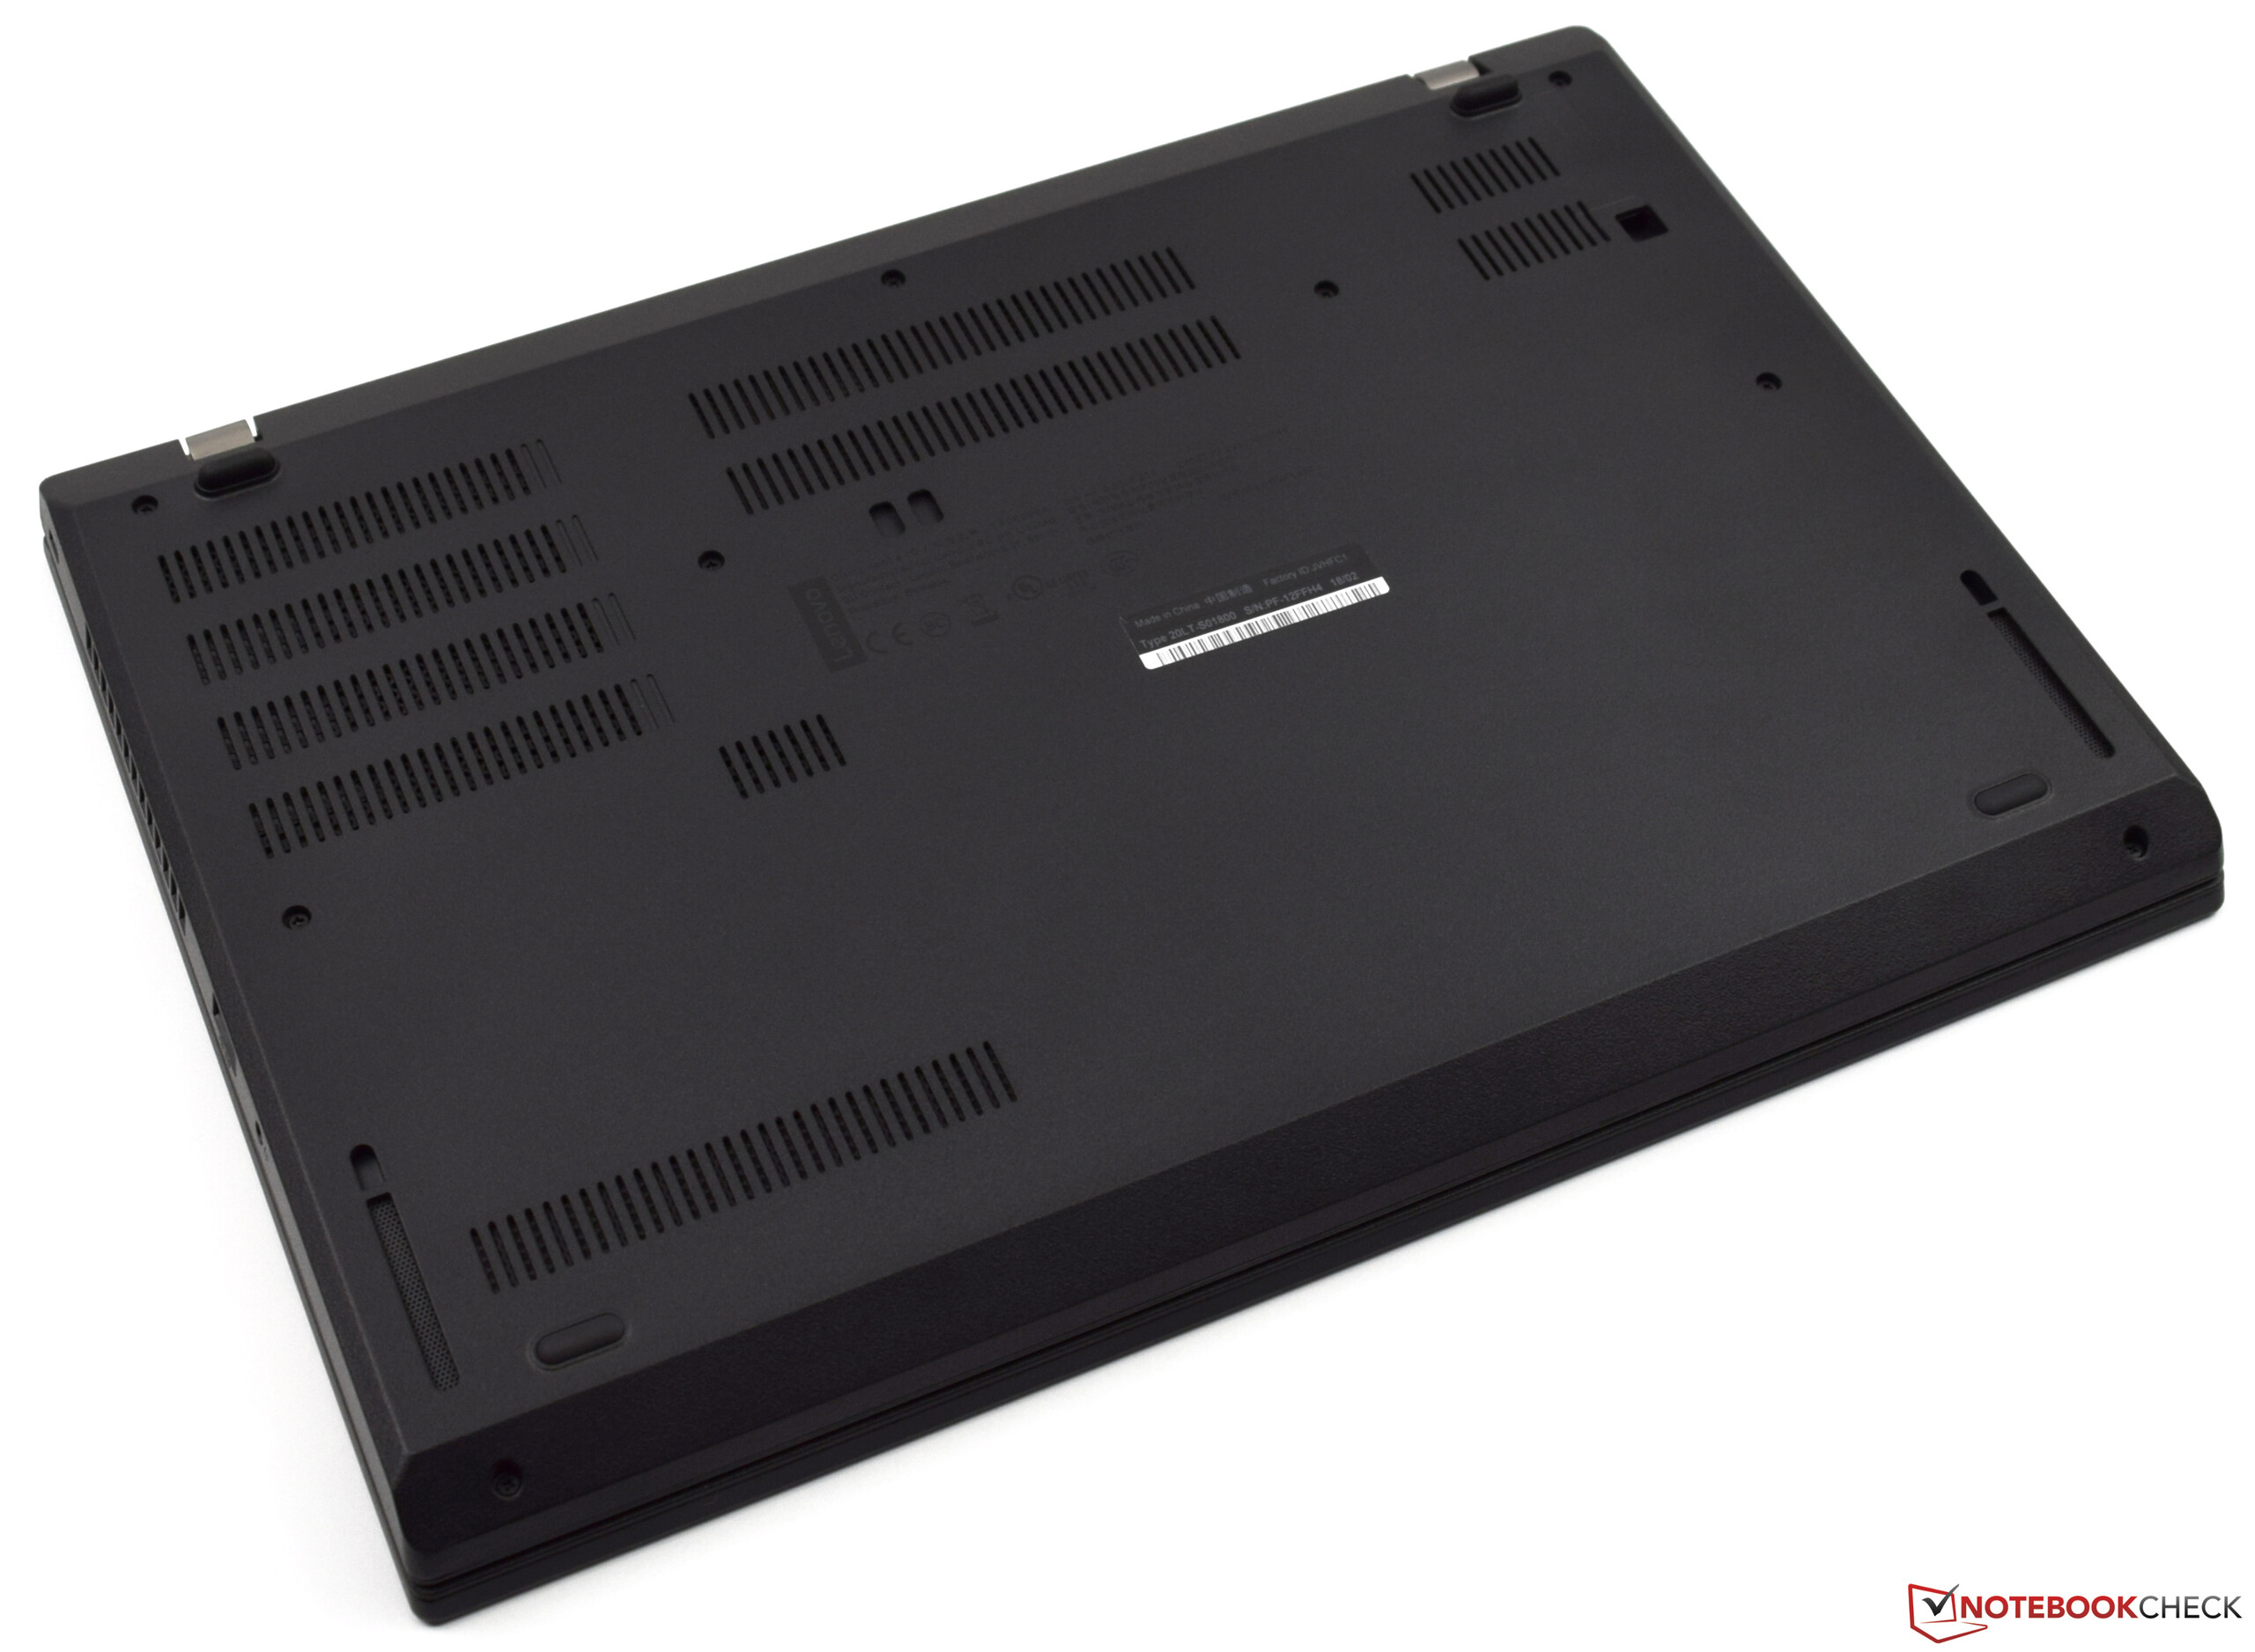
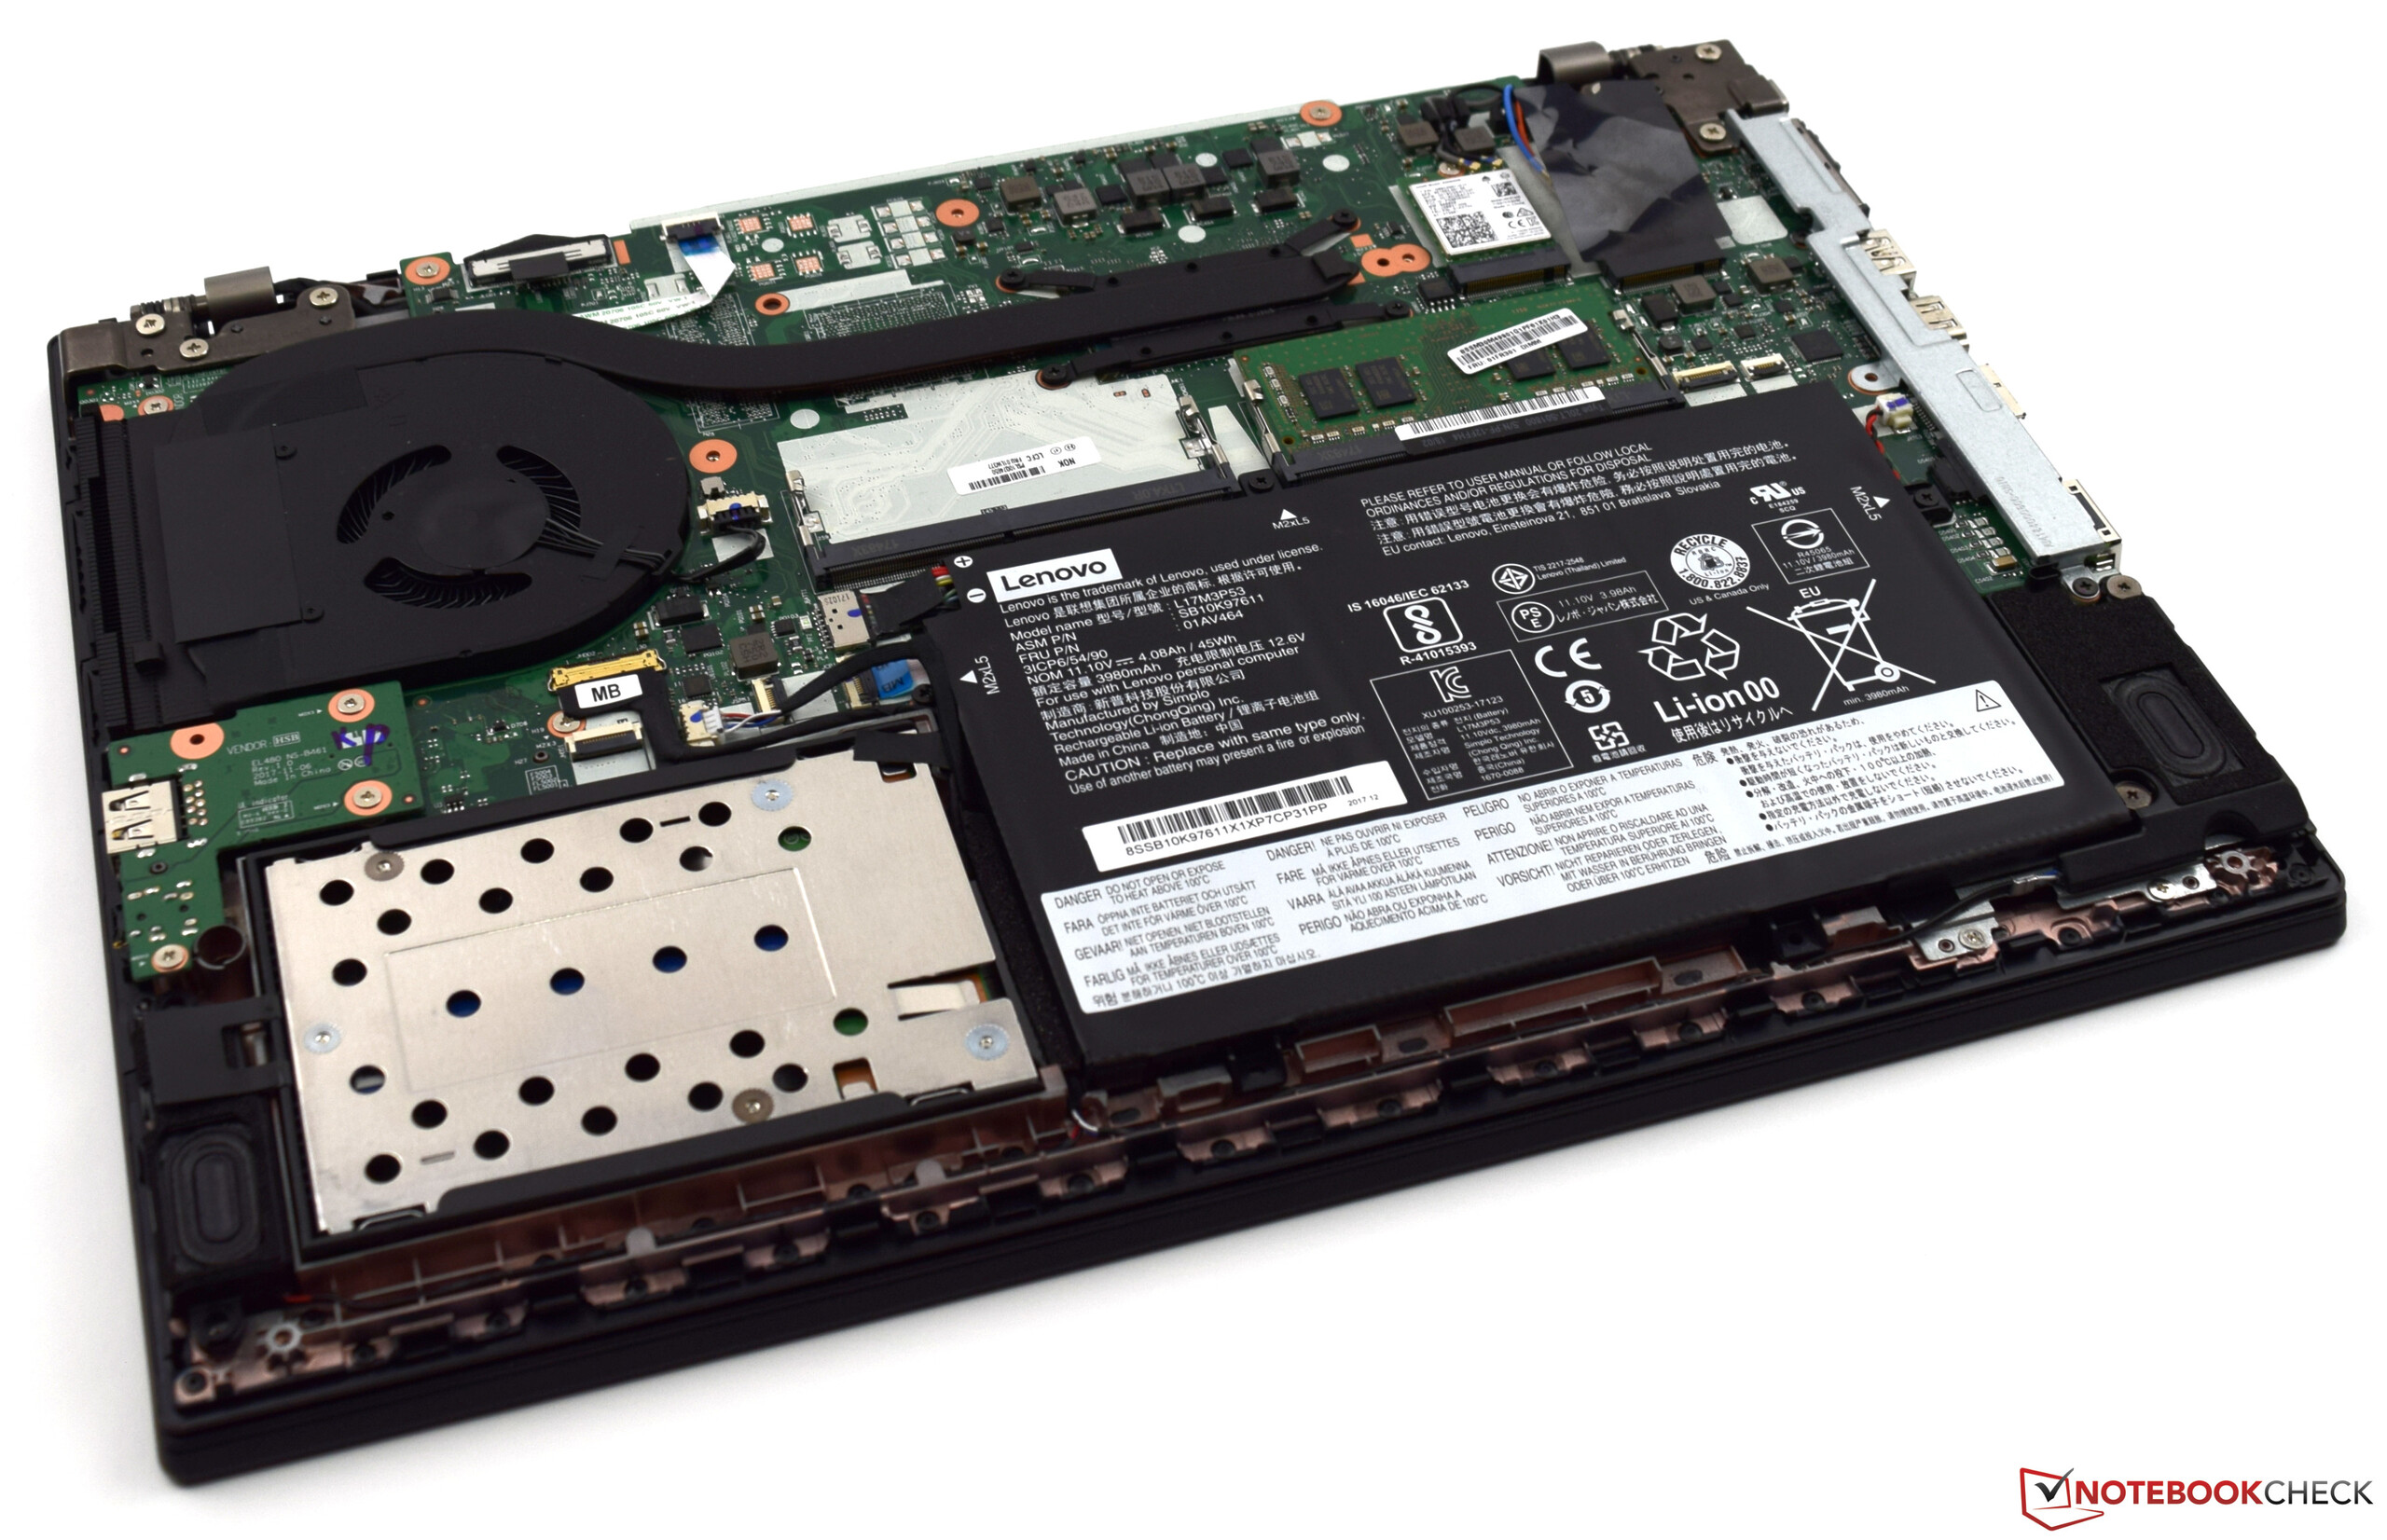
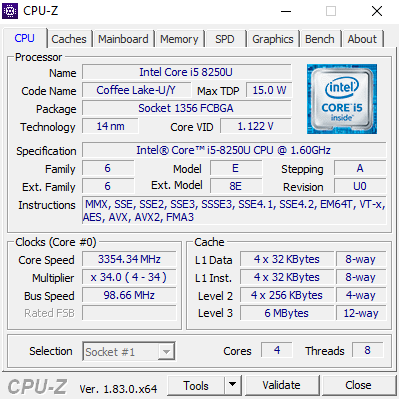
Le Lenovo ThinkPad L480 est un portable pro de 14 pouces. Notre version est équipée d’un processeur puissant et efficient. L’Intel Core i5-8250U est assez puissant pour la plupart des tâches de bureau, et devrait vous permettre d’être tranquille pour quelques années grâce à ses performances. La mémoire vive de 8 Go et le SSD de 256 Go sont également bien dimensionnés. Le châssis fin mais robuste et l’écran IPS complètent le tableau.
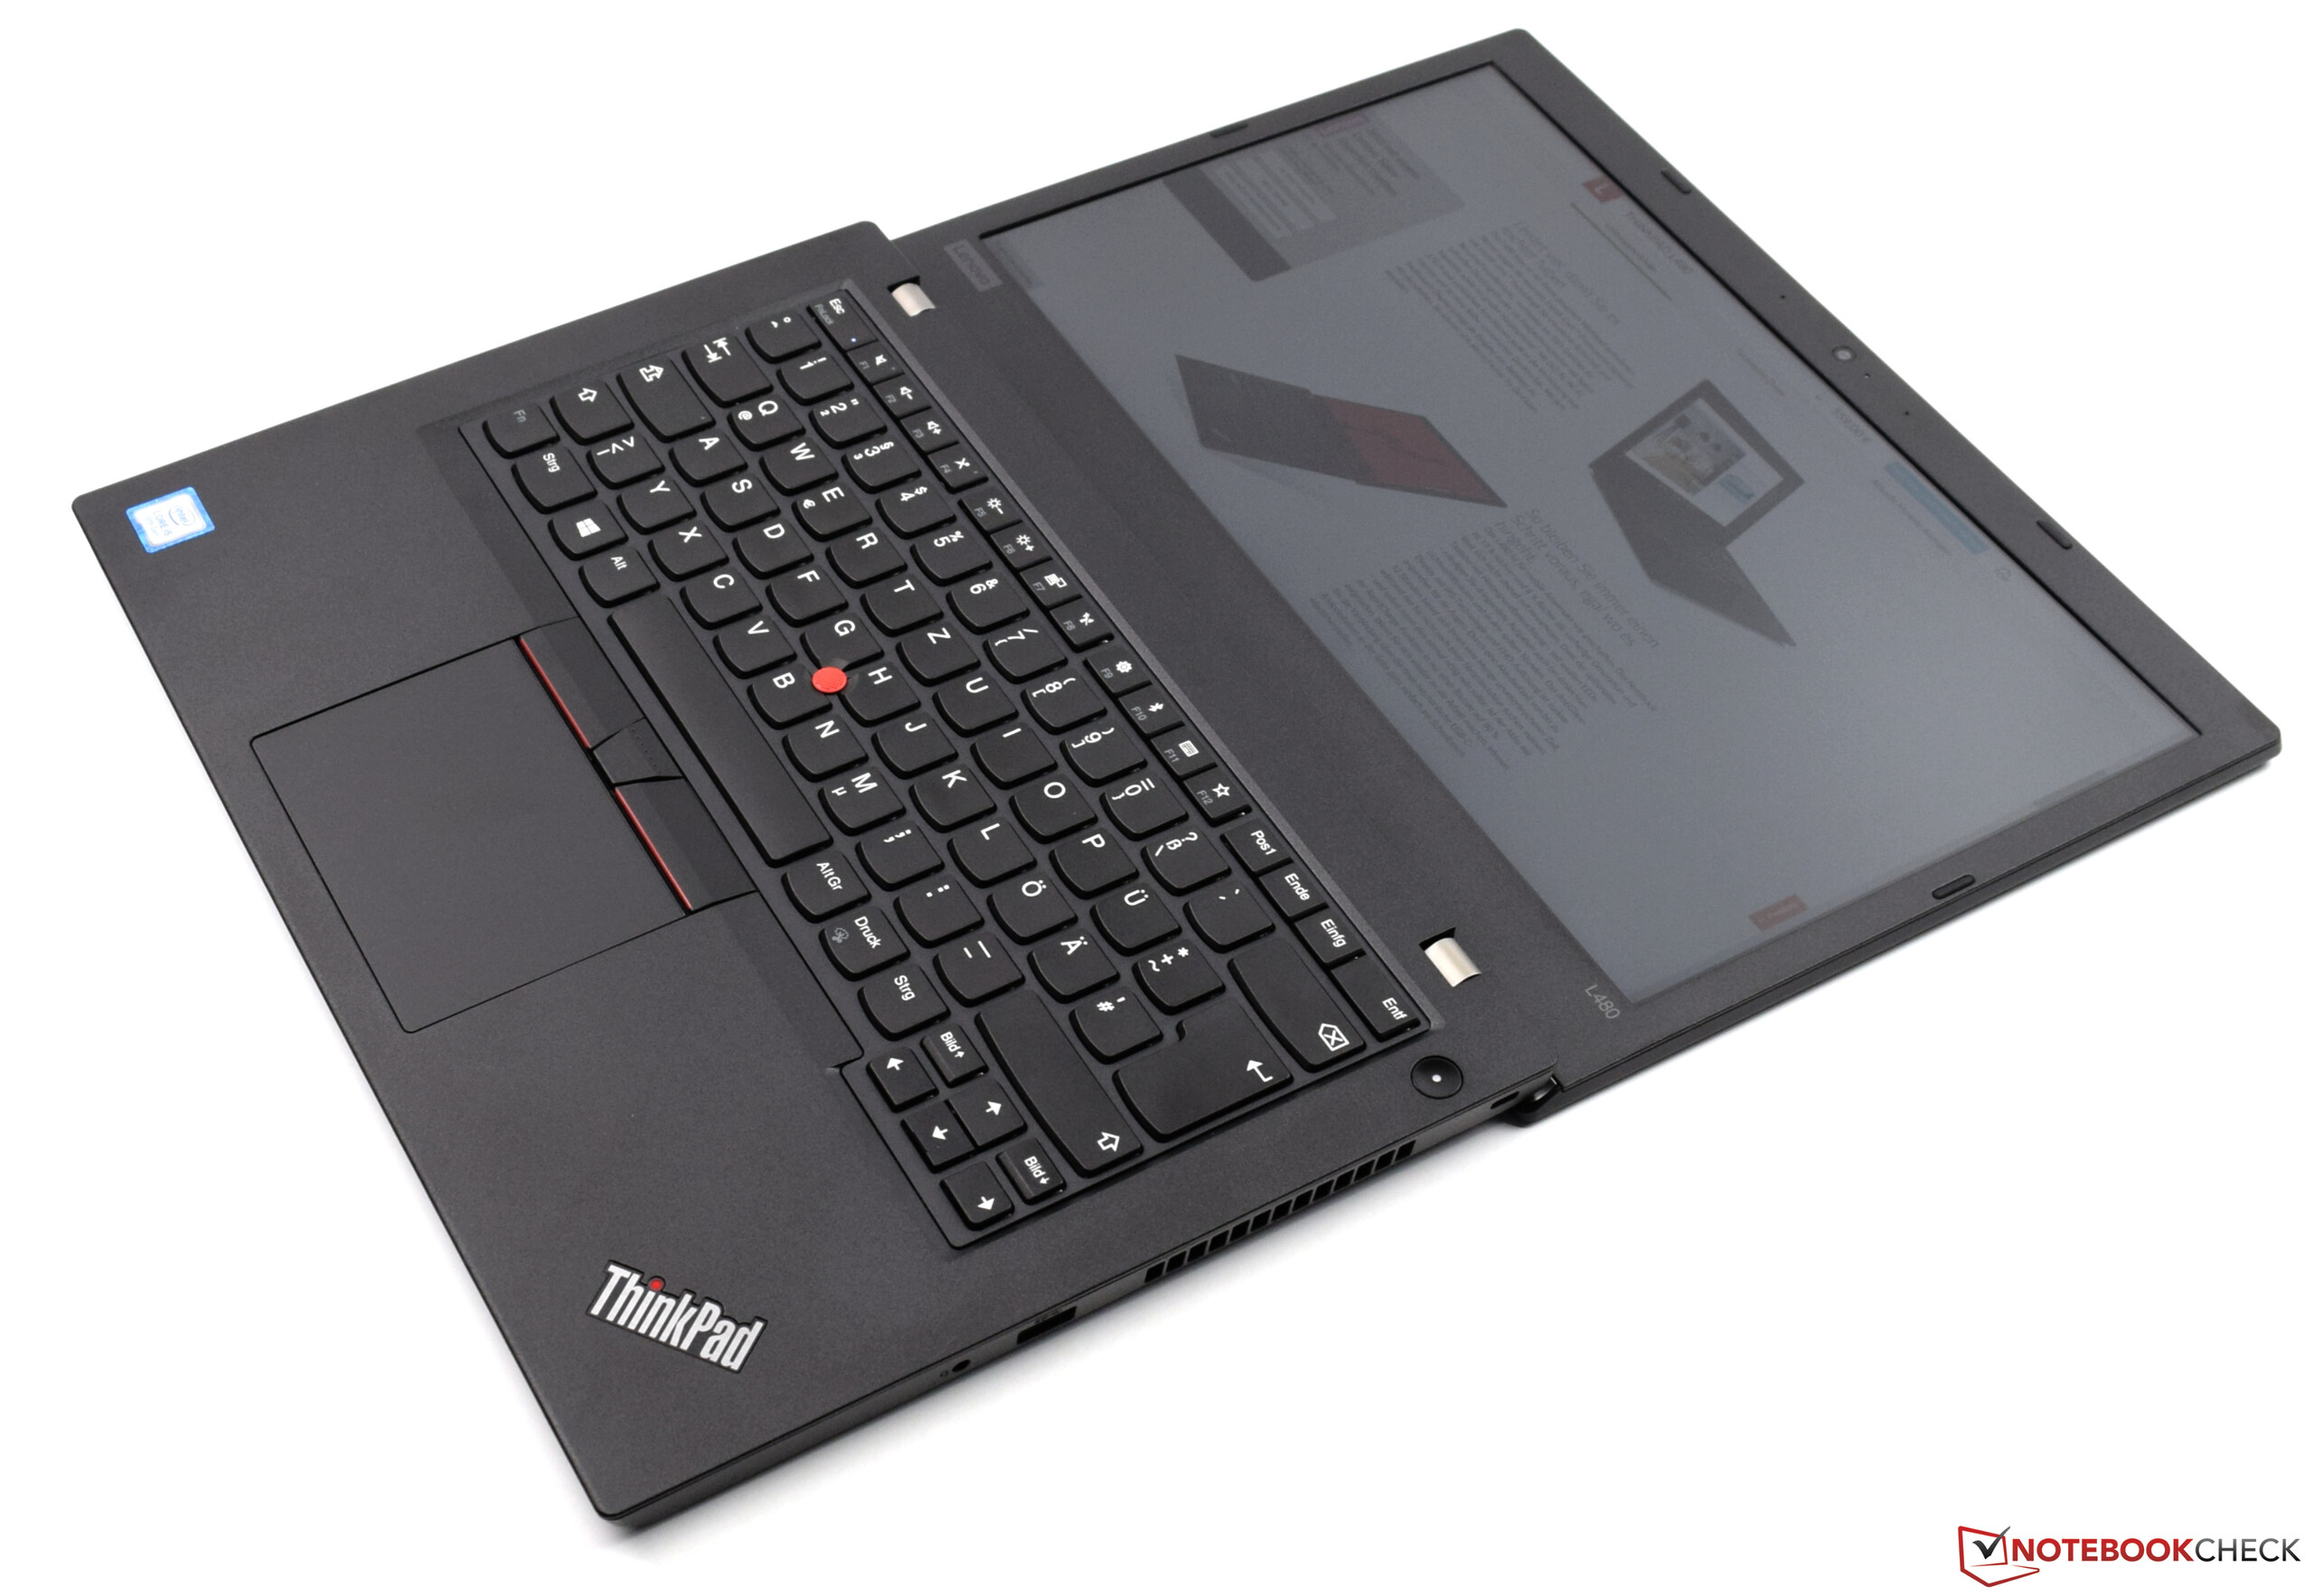
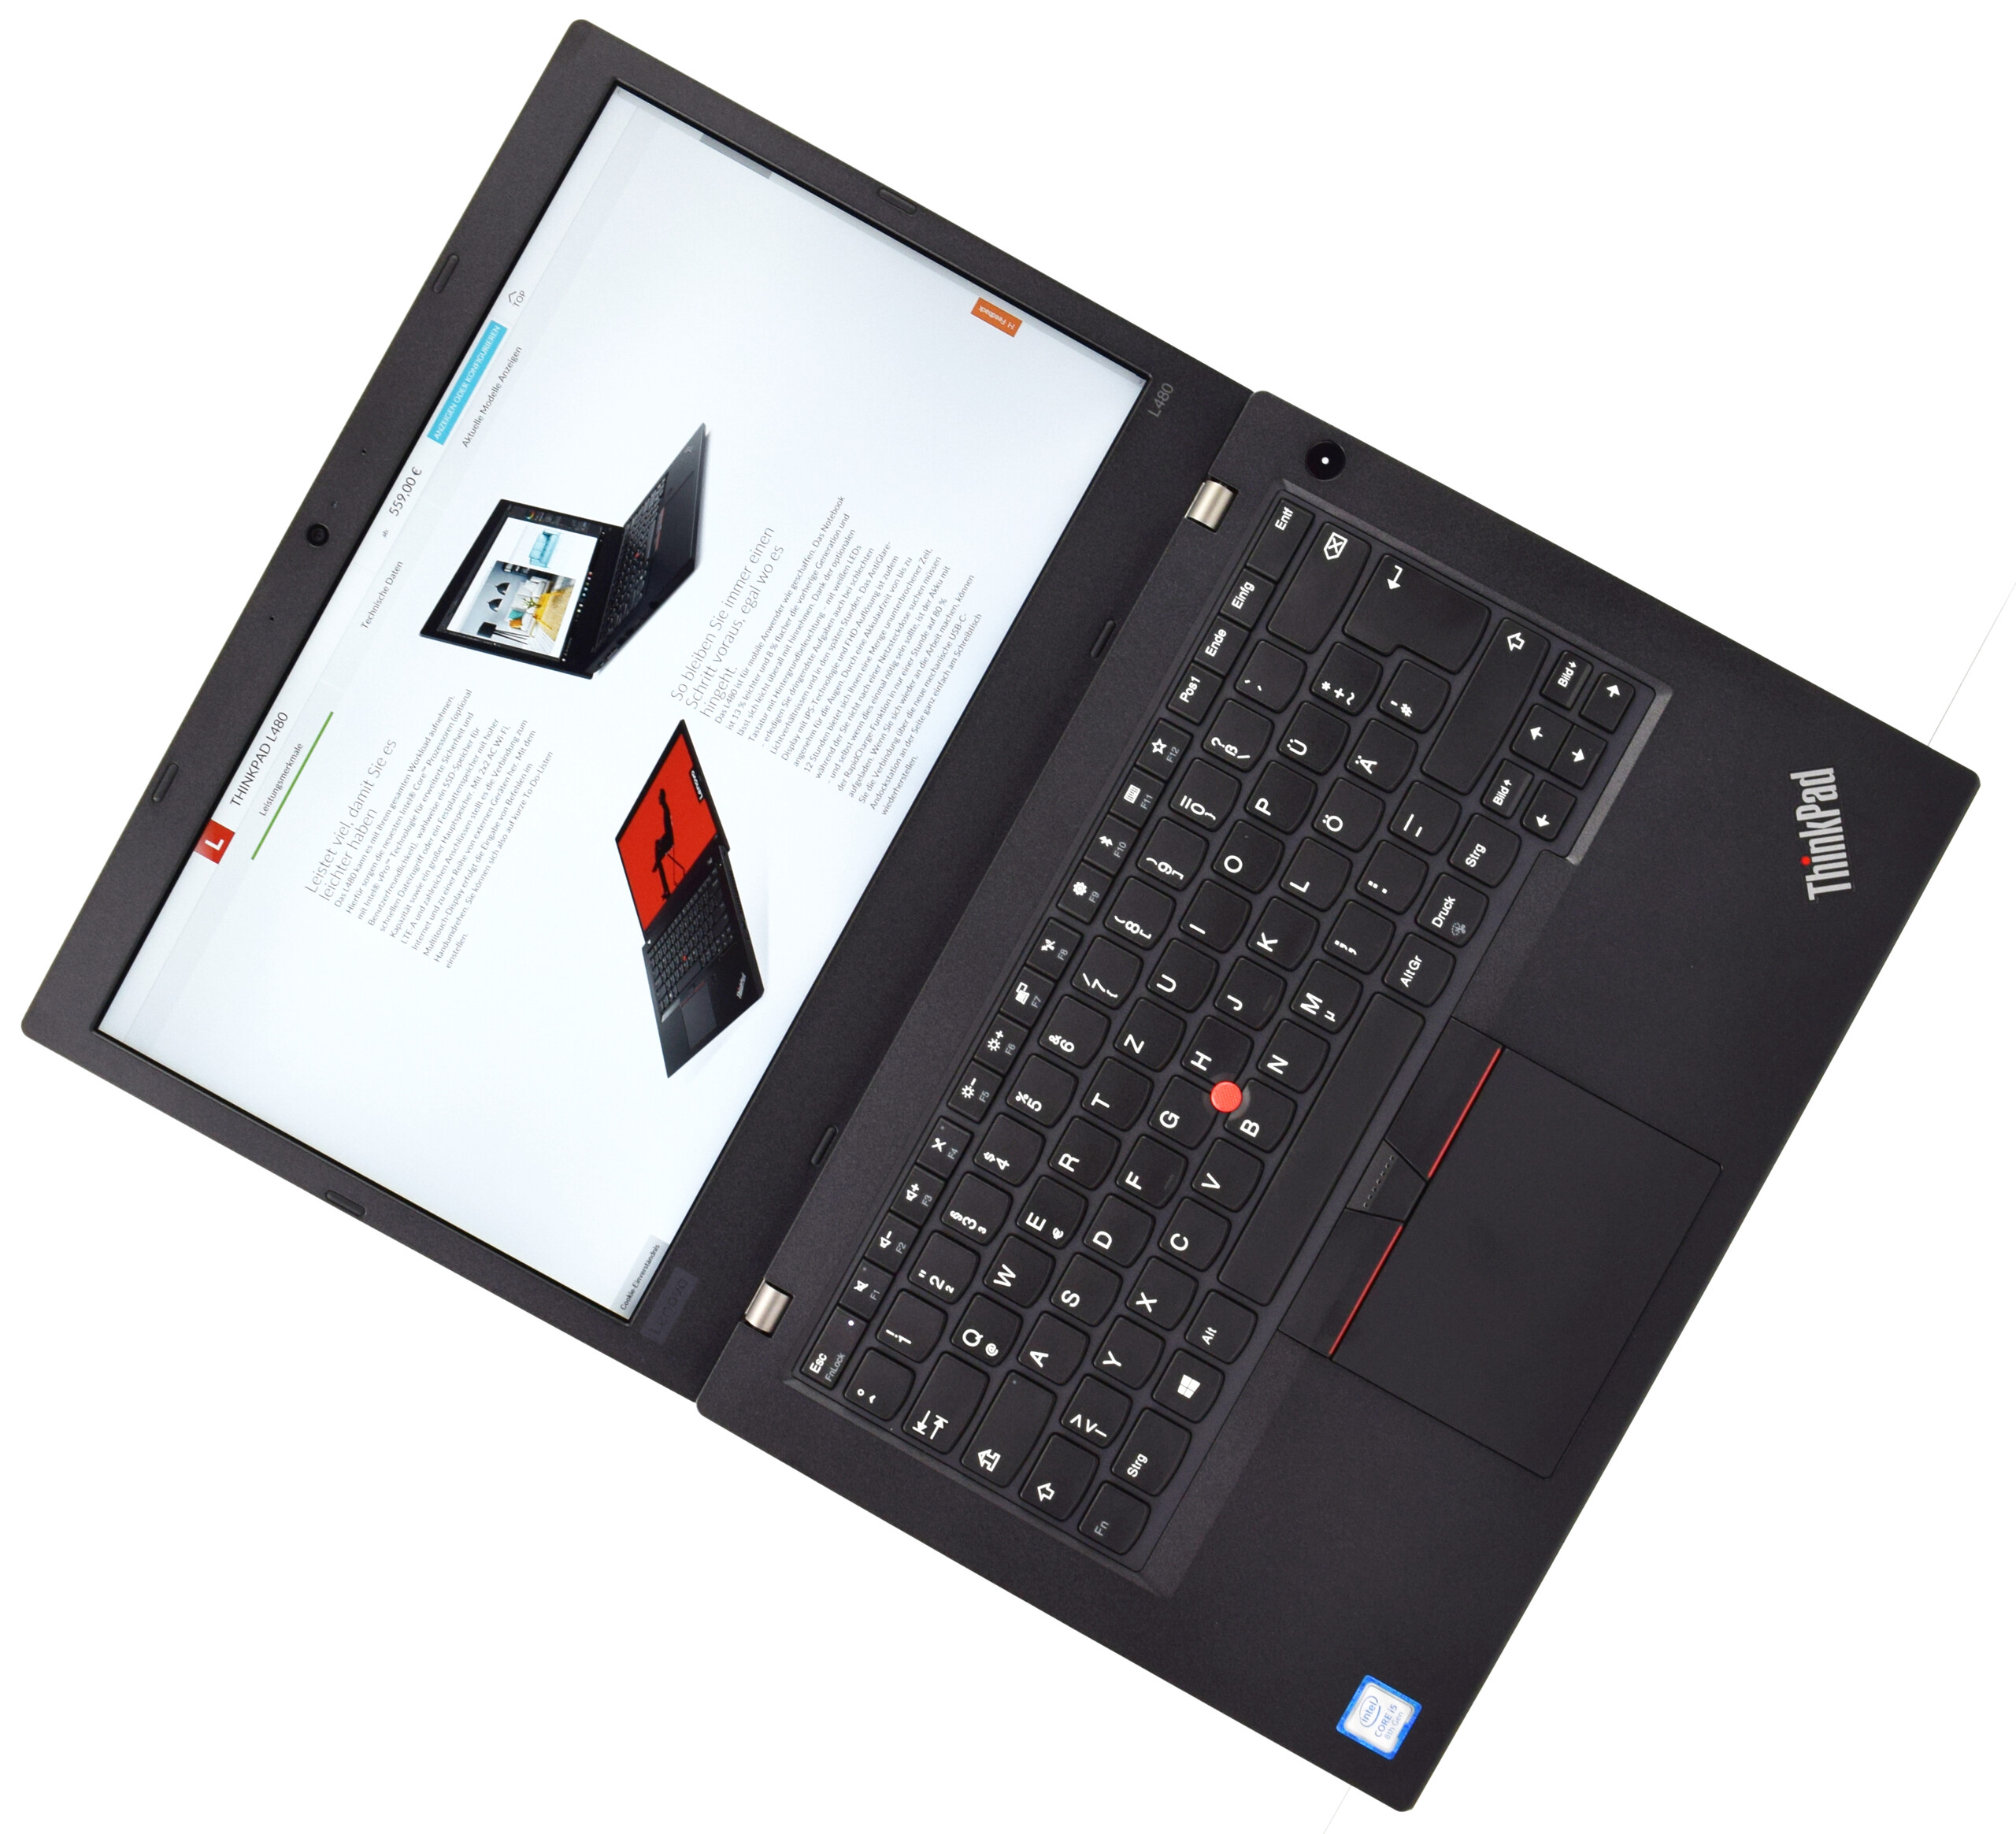
Pour moins de 1000 €, le ThinkPad est un appareil de bureau bien équipé, avec les excellents périphériques d’entrée qui font la réputation des ThinkPad. La variété des configurations disponibles permet de le calibrer exactement aux besoins de l'utilisateur.
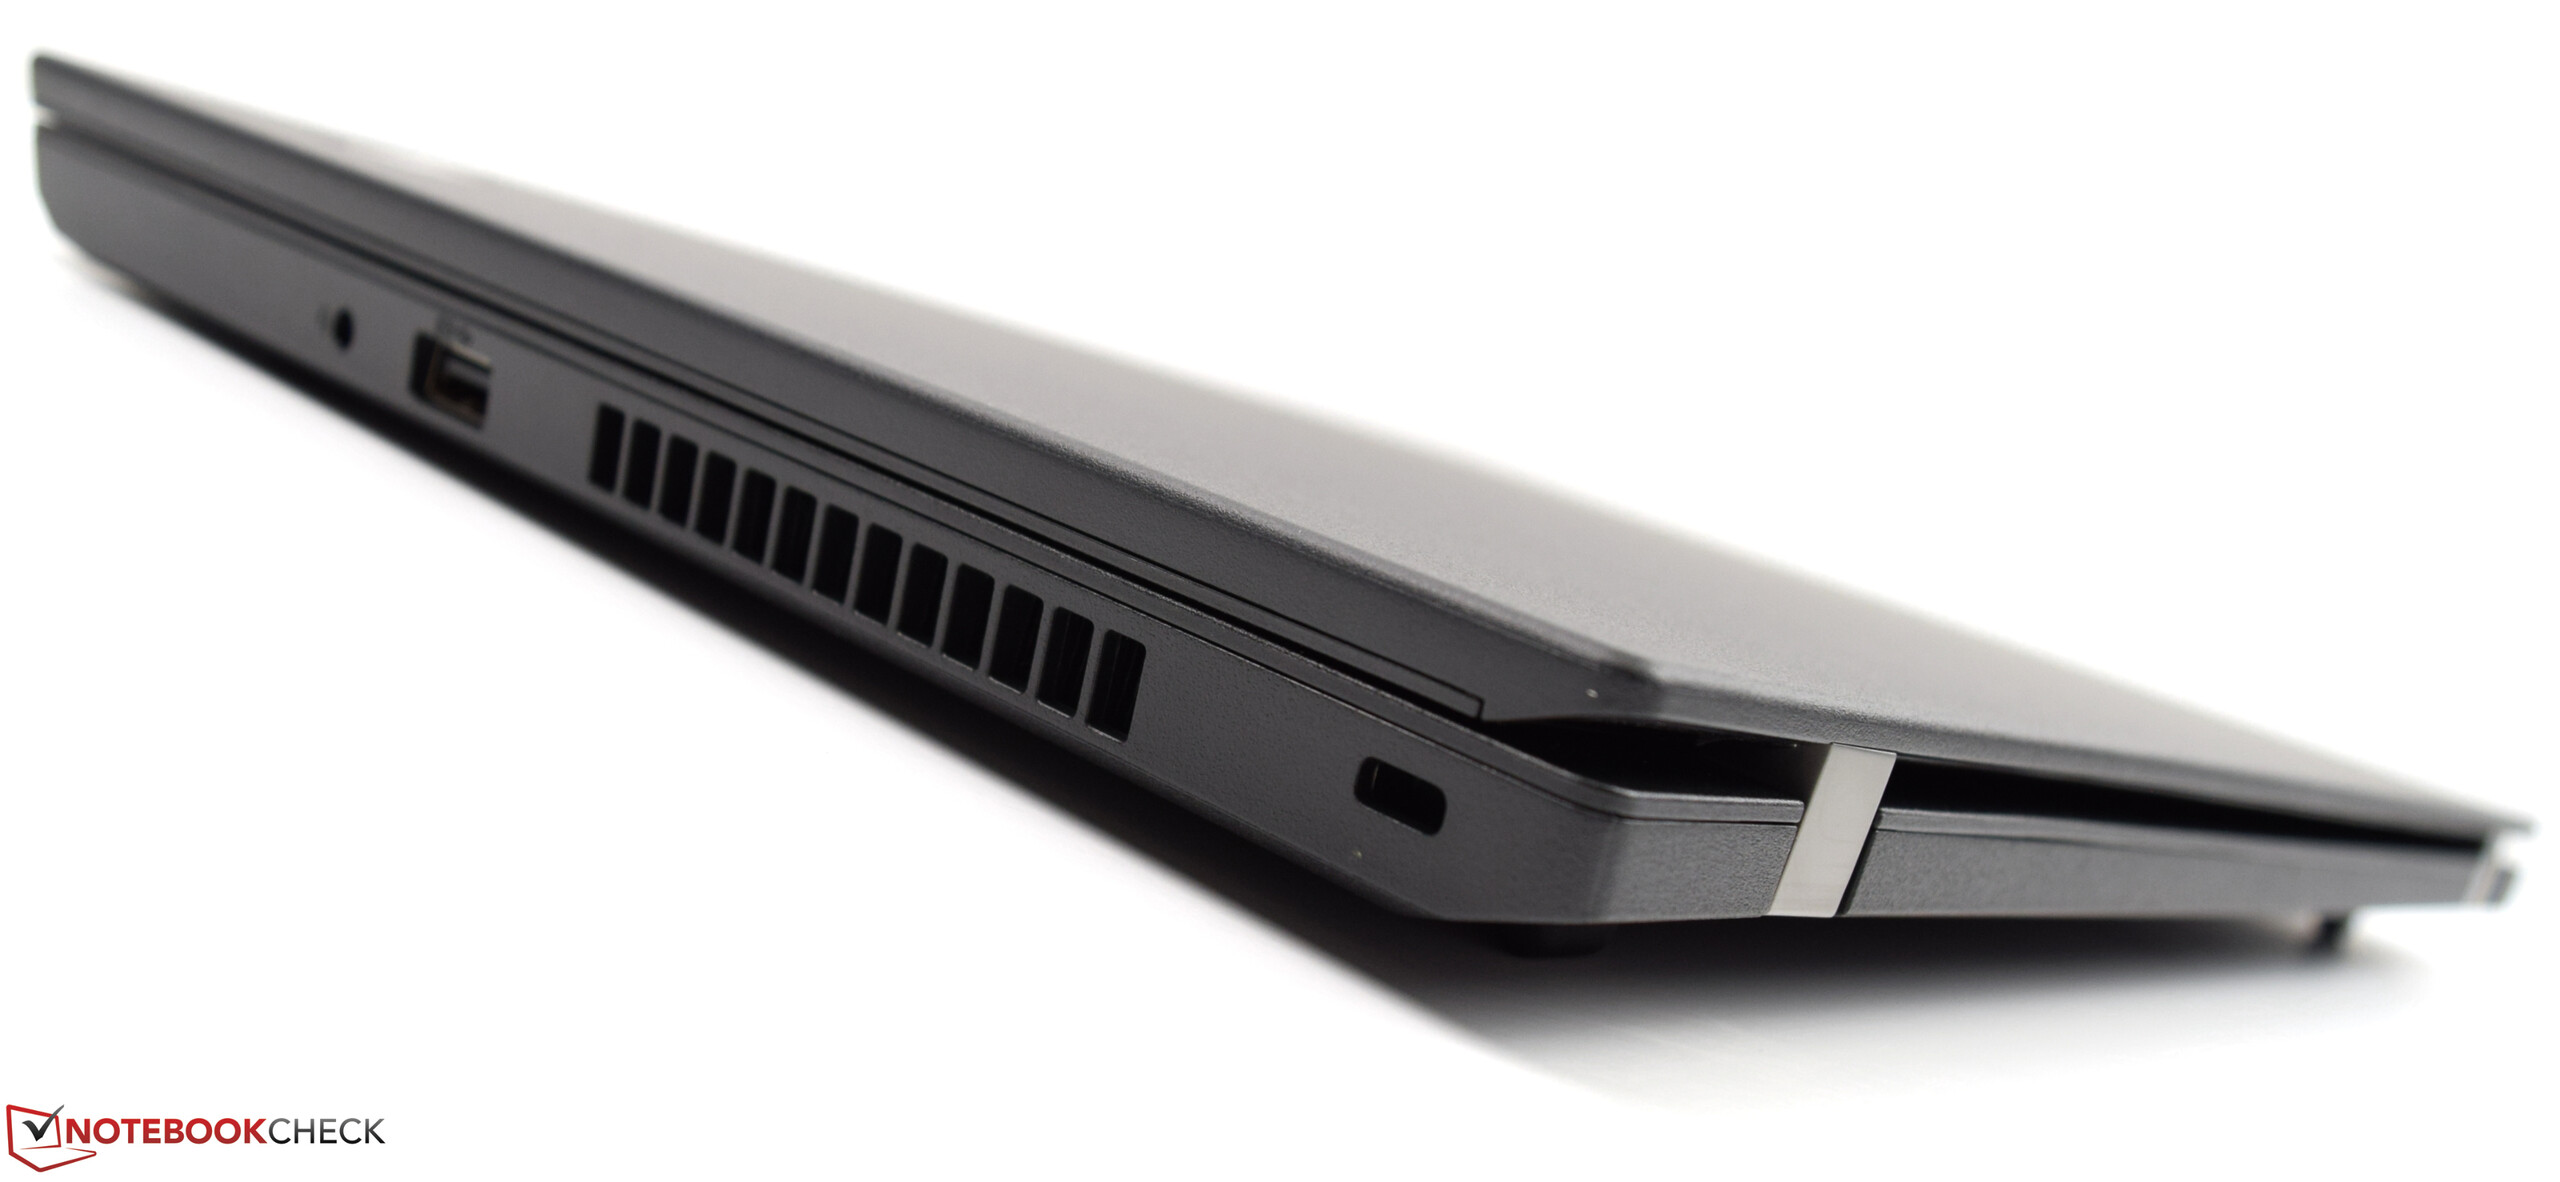
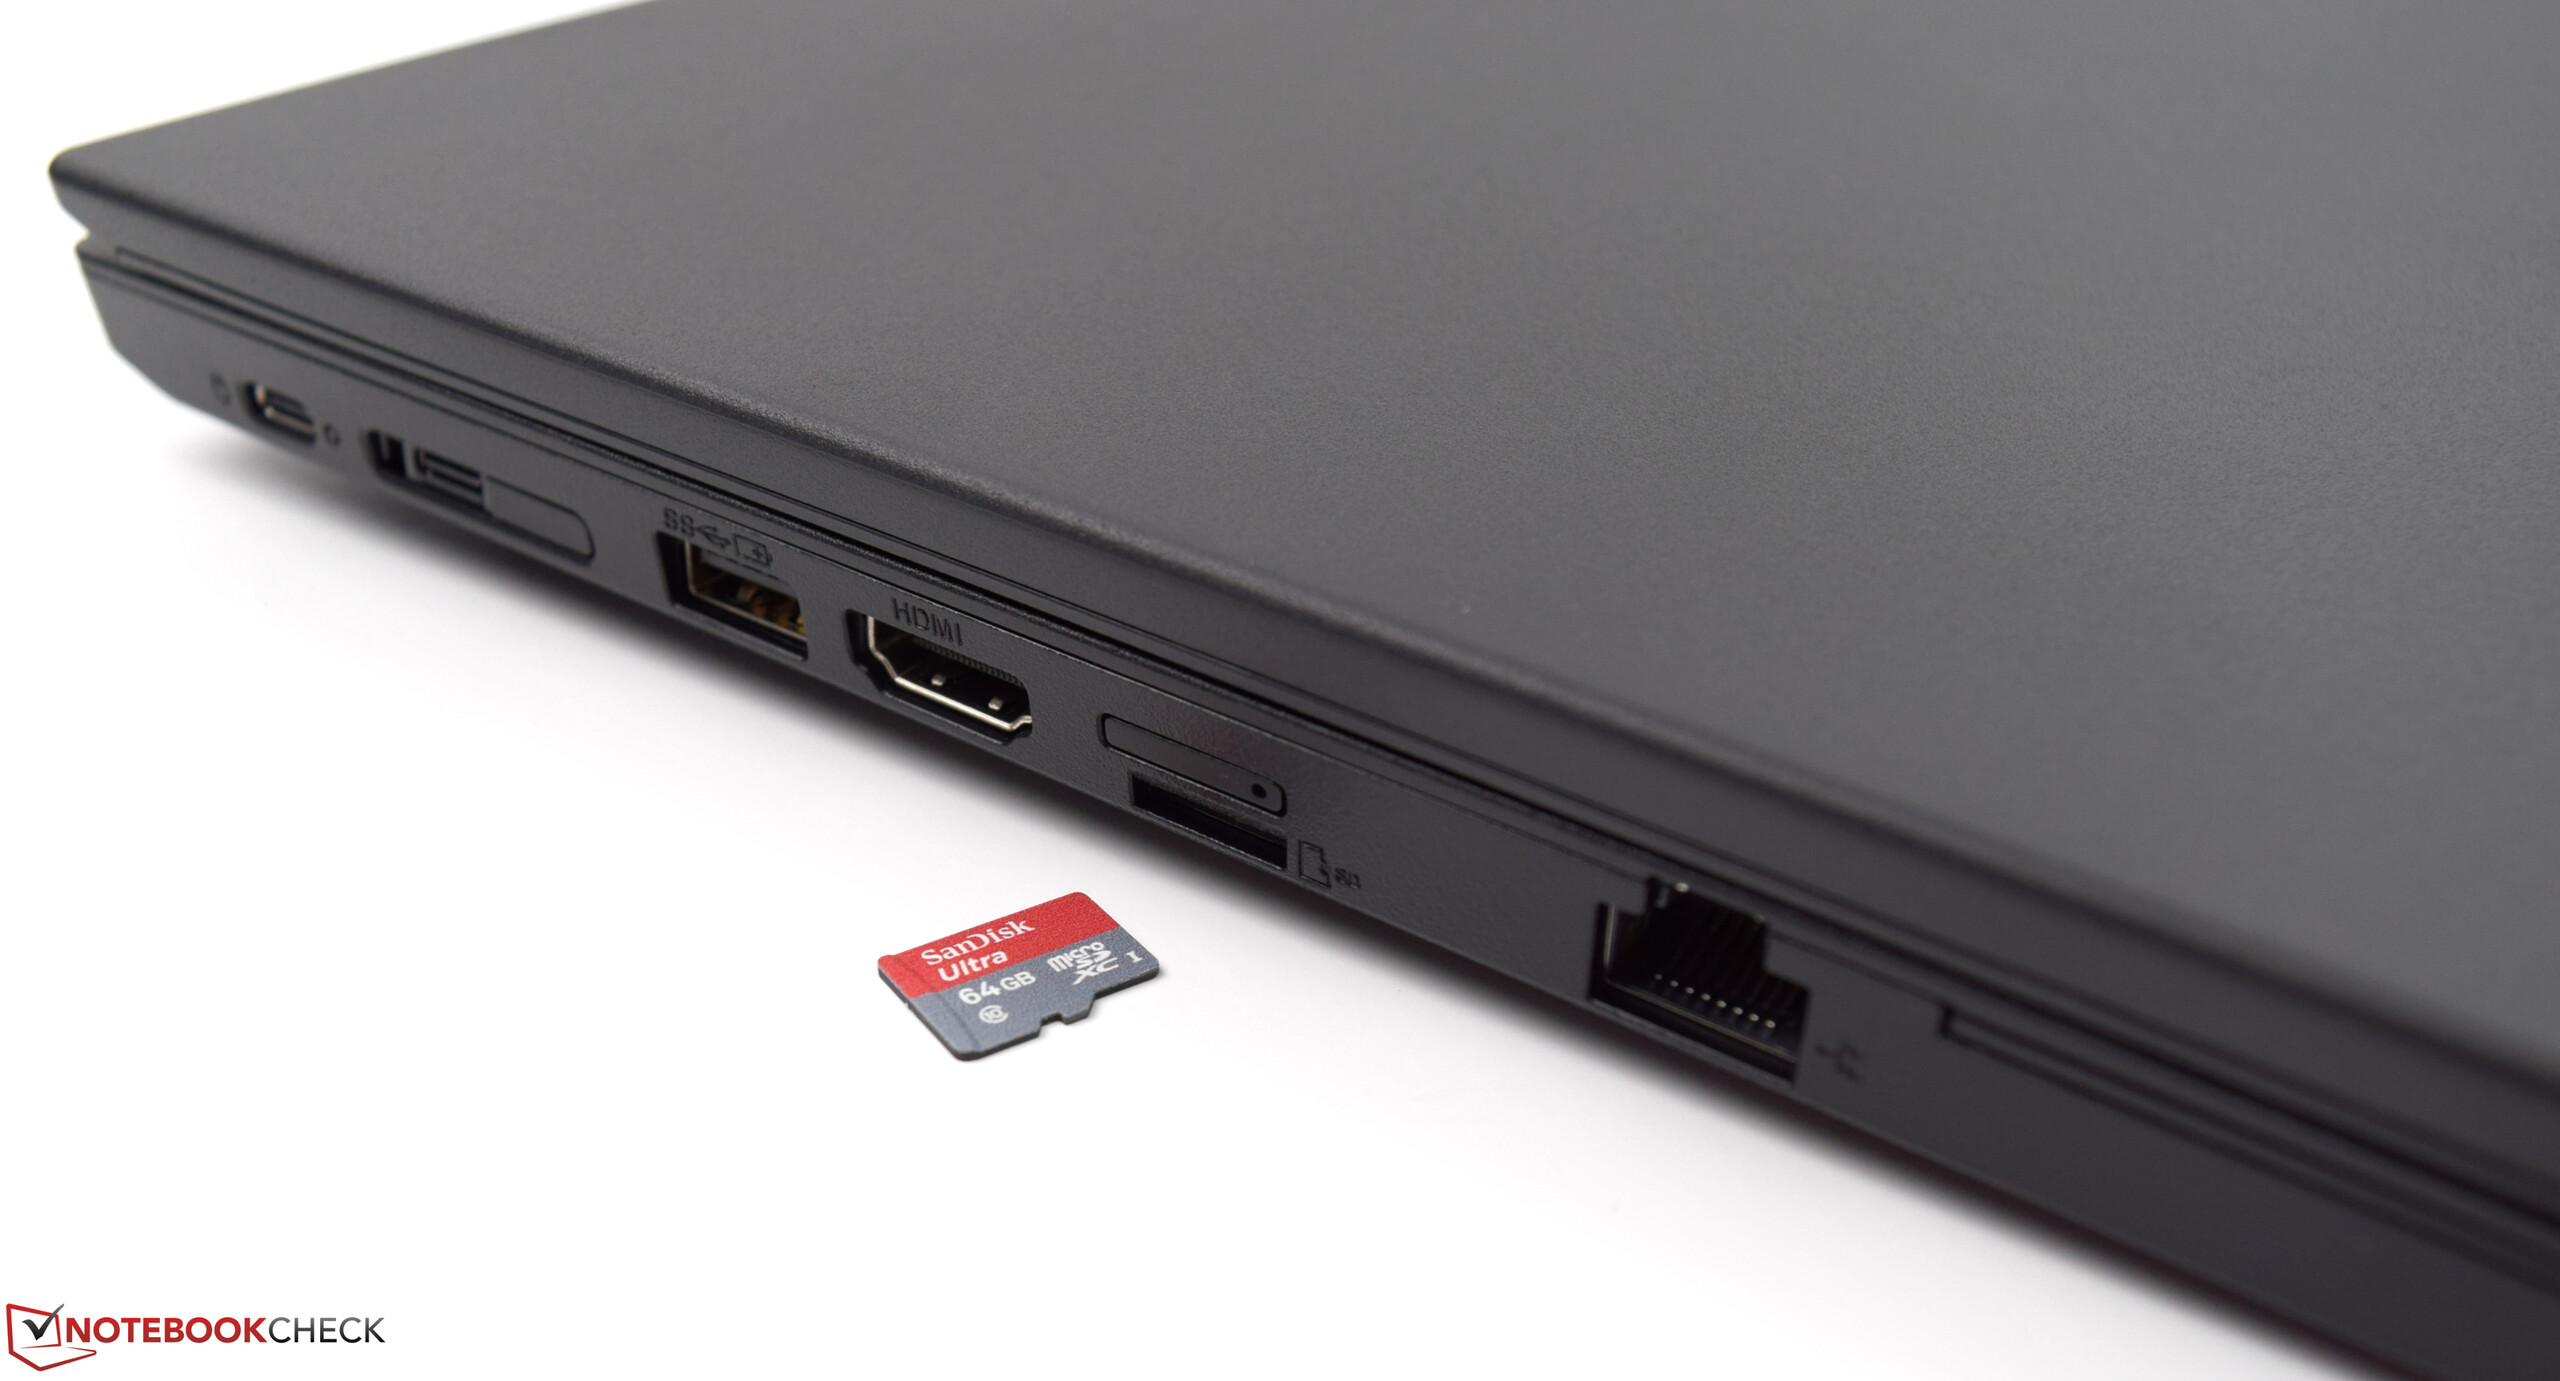
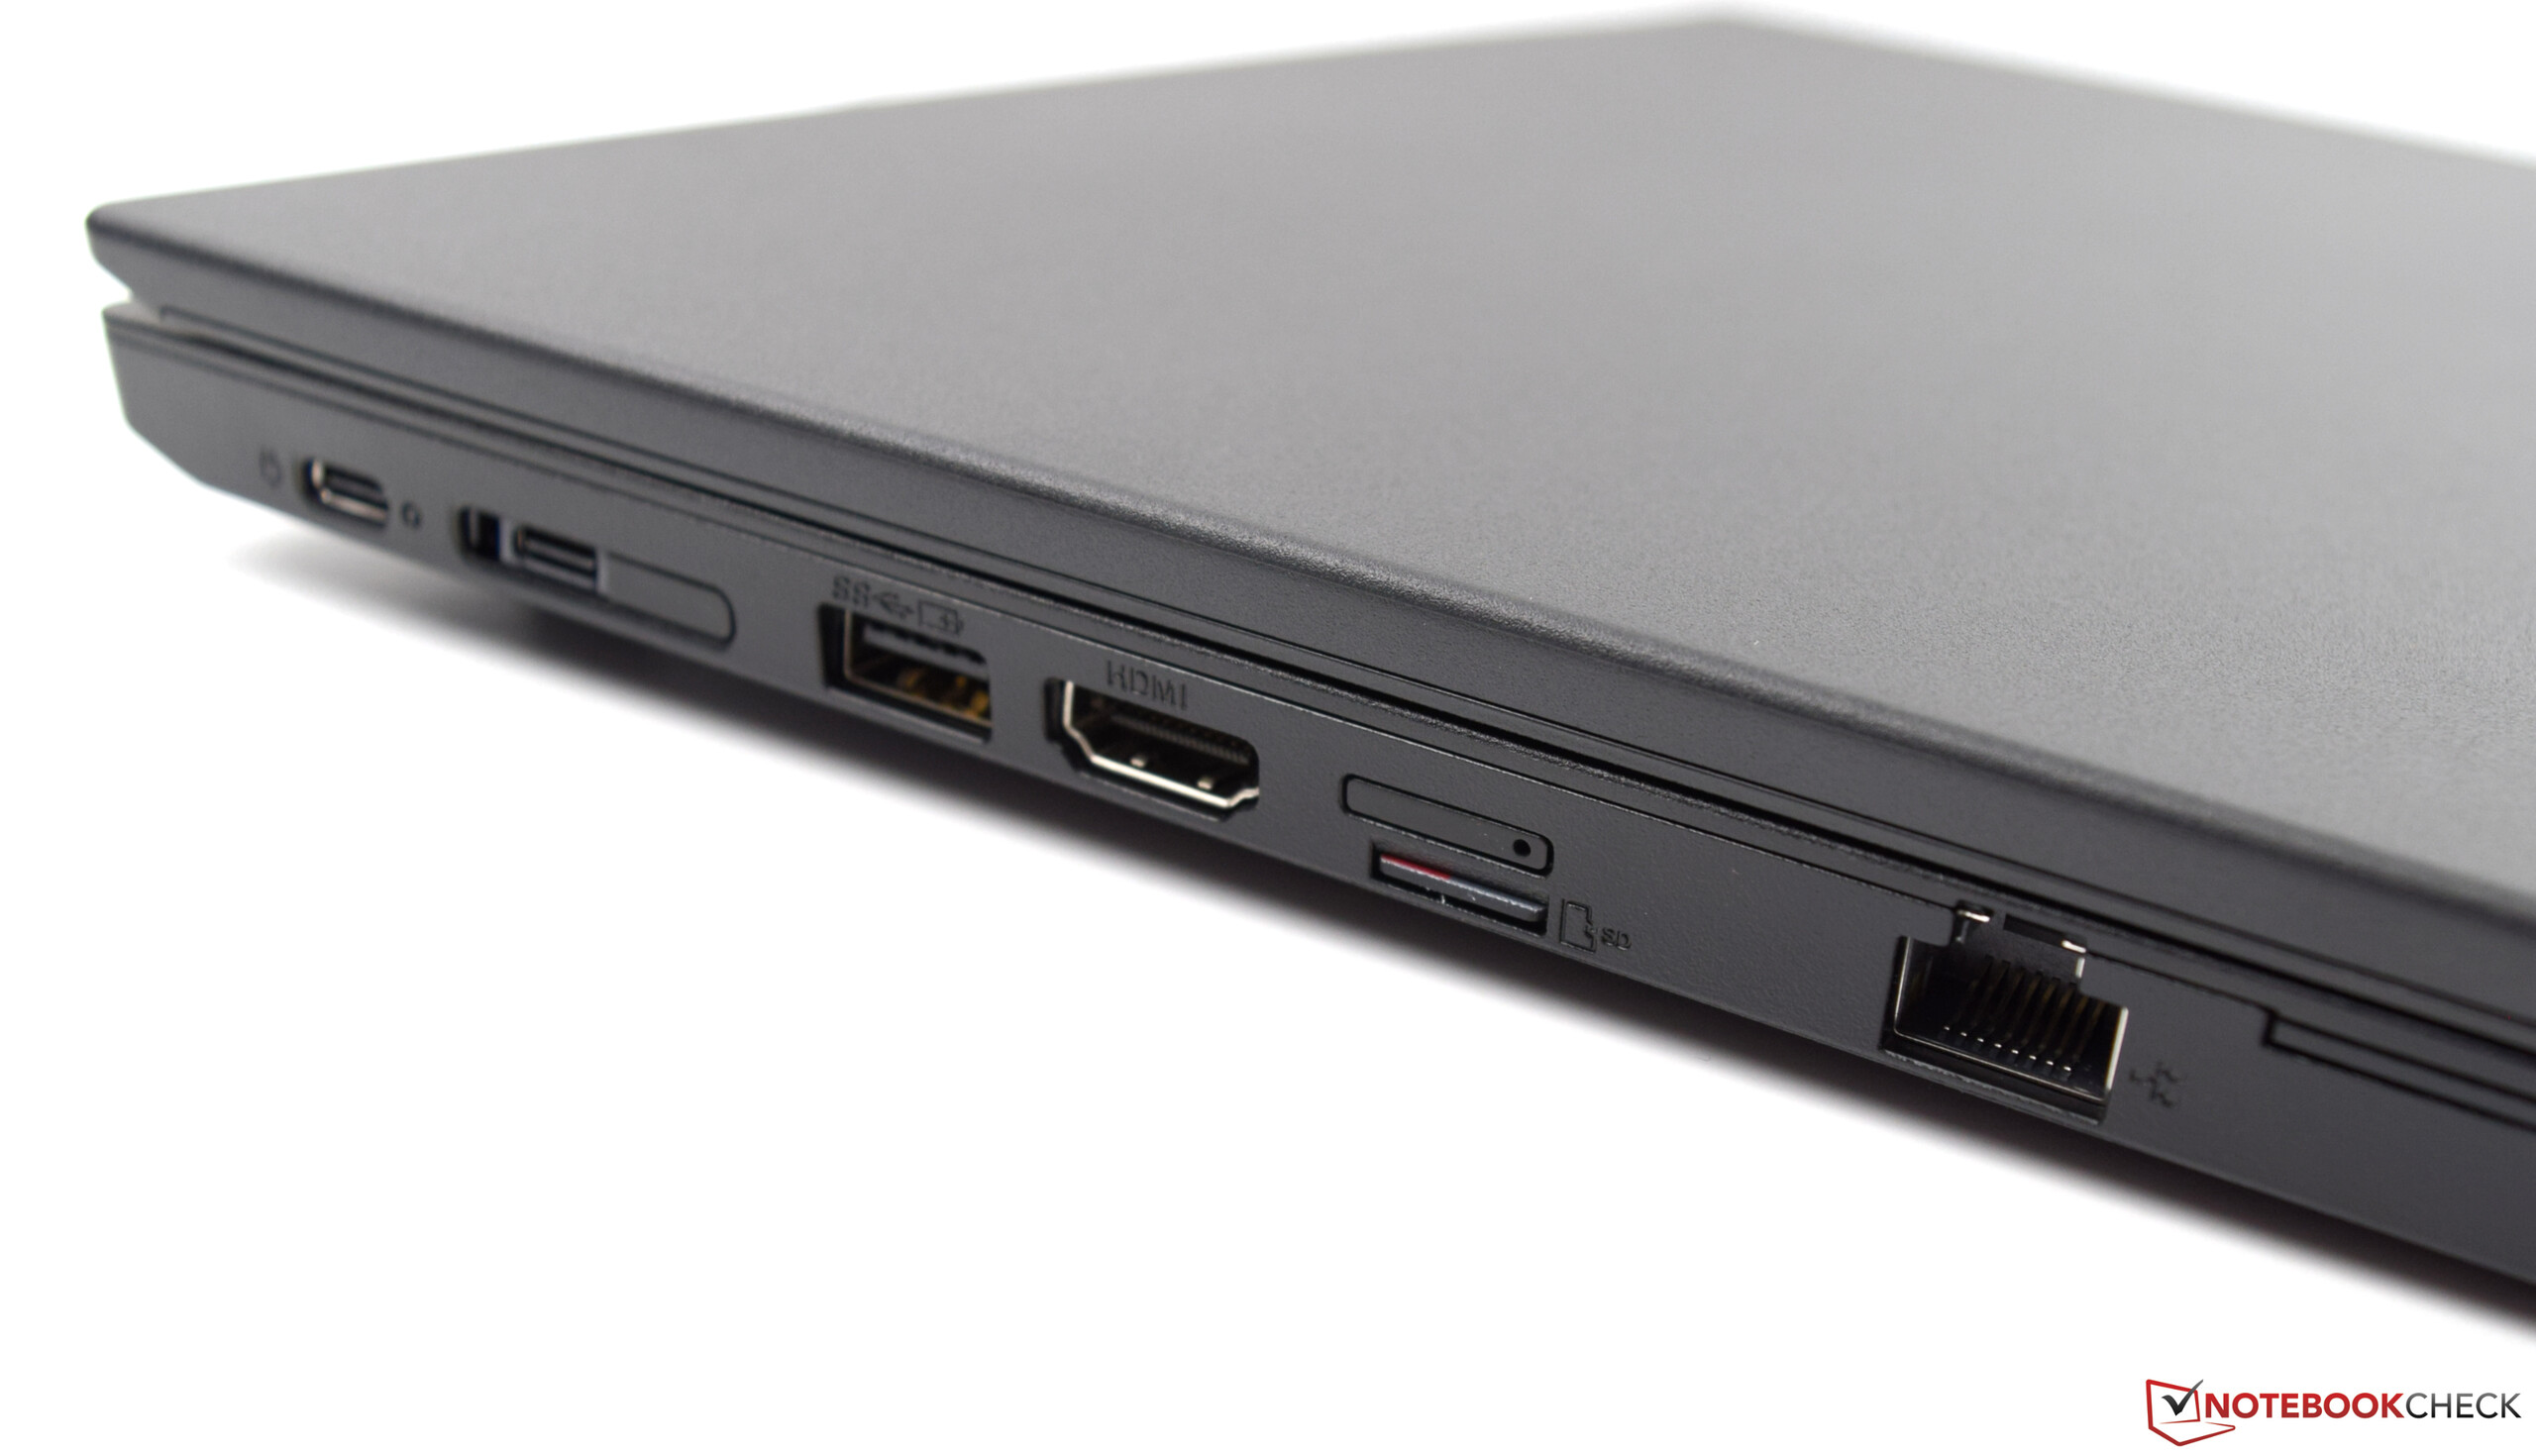
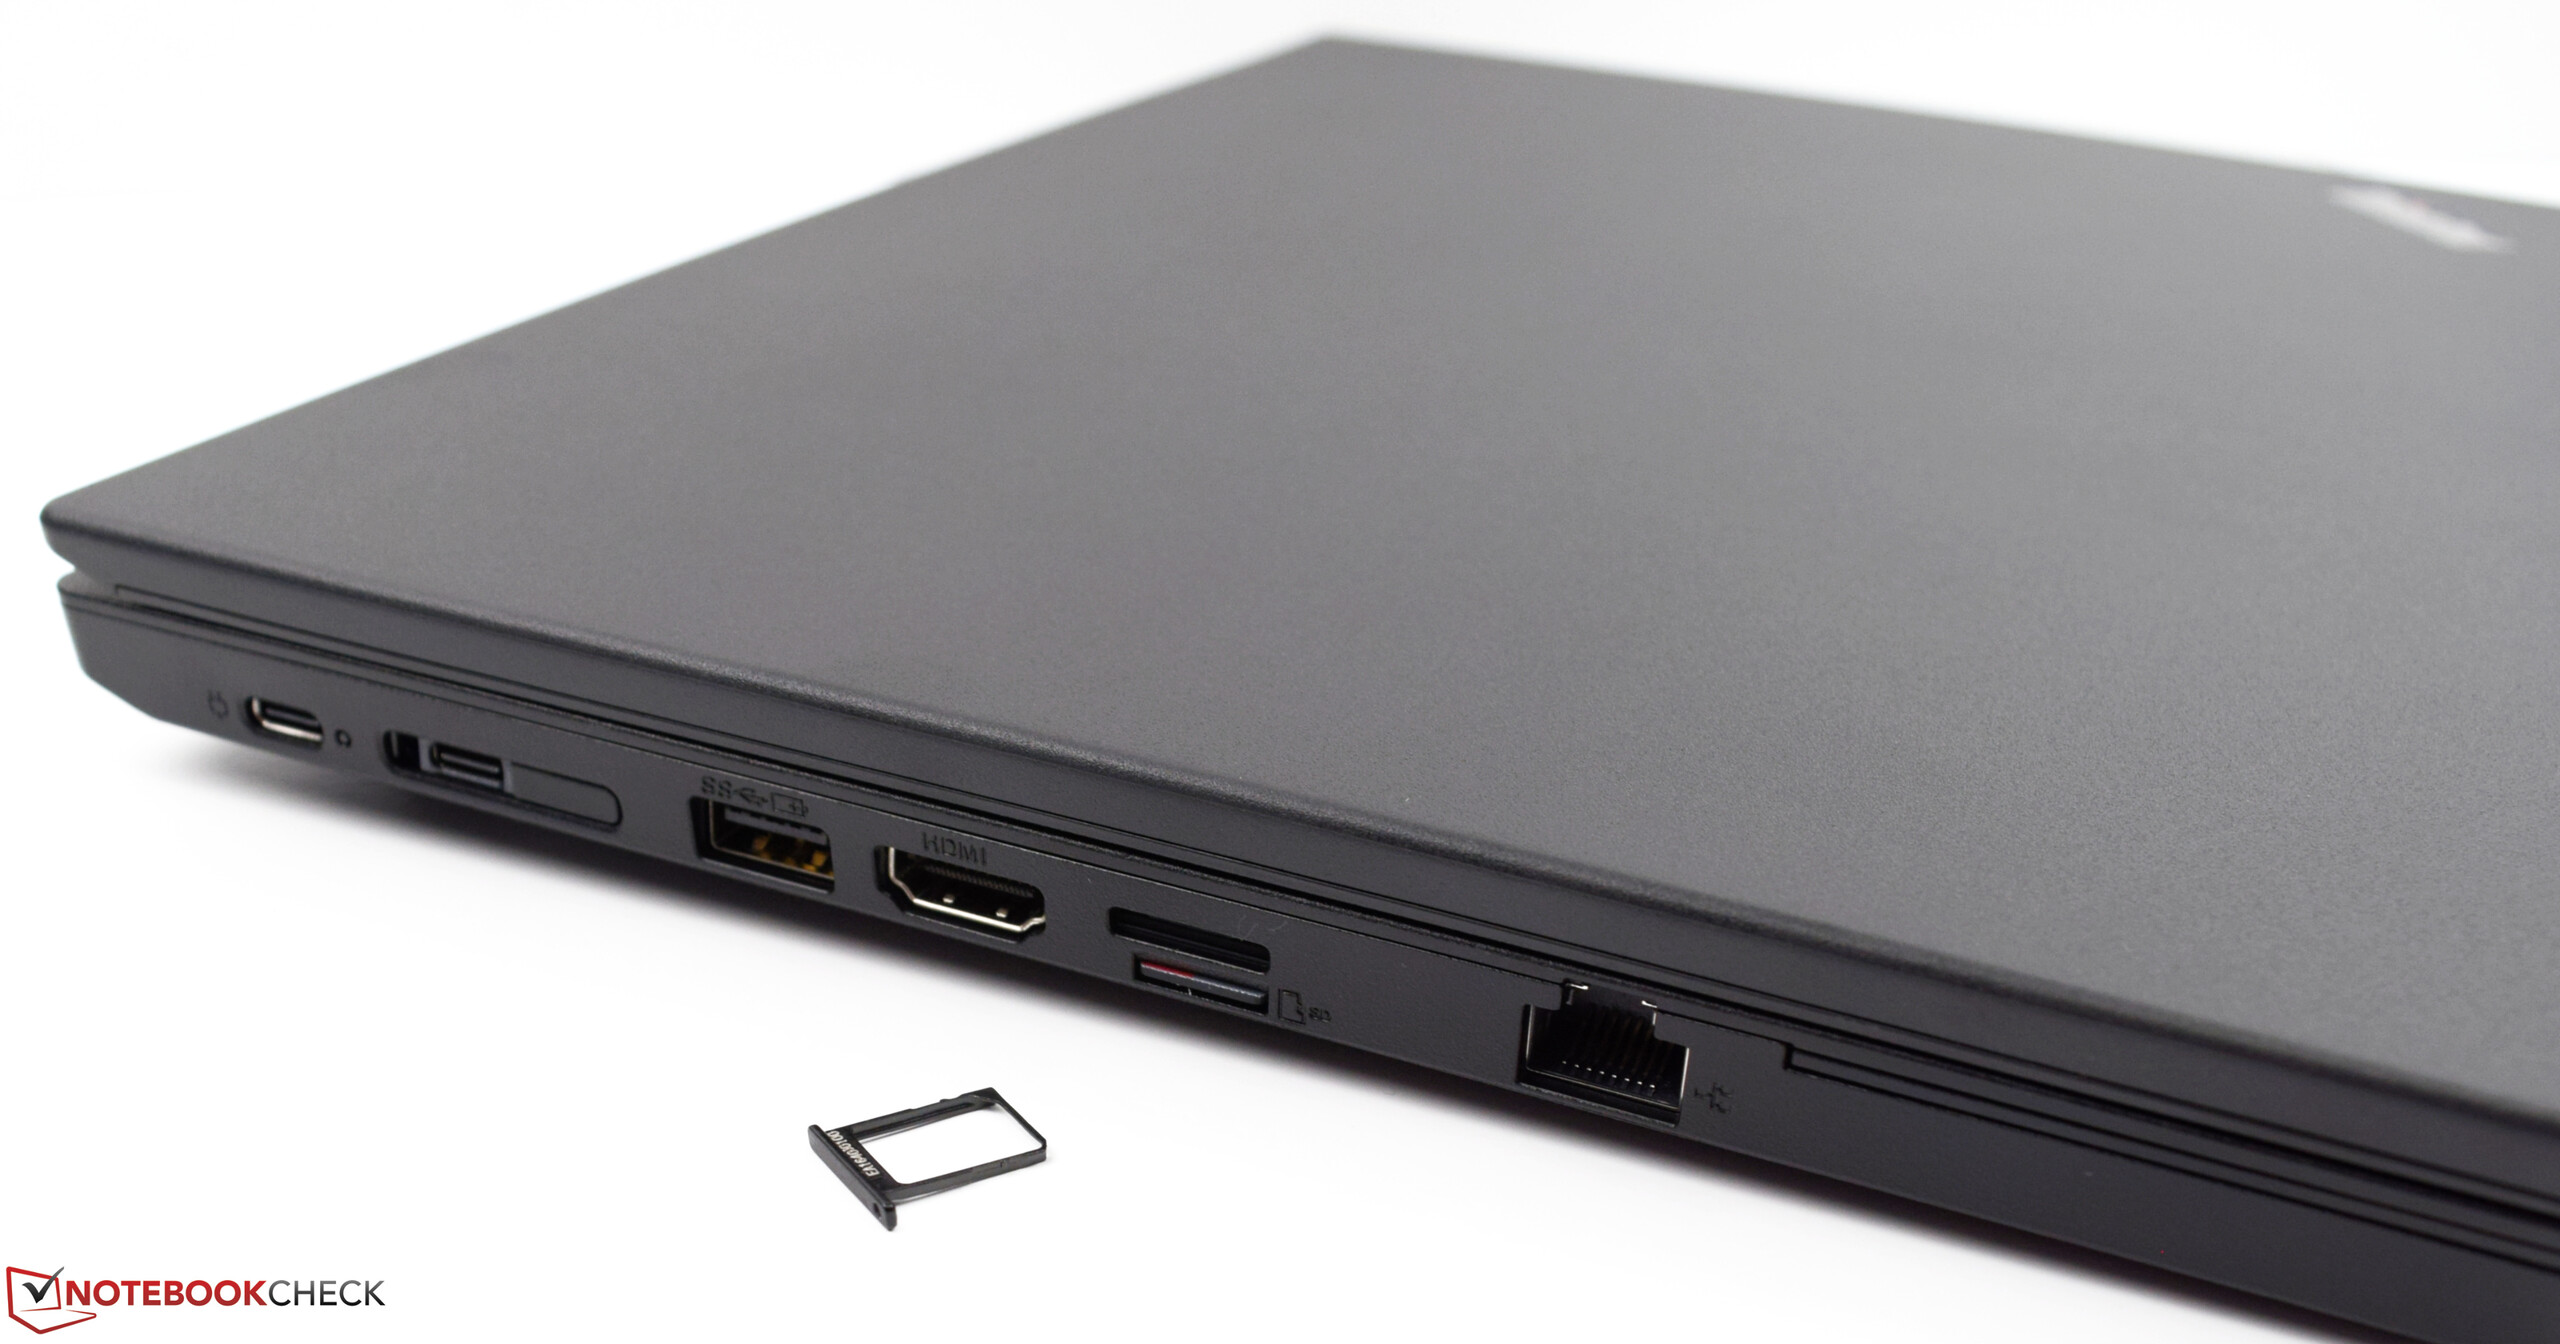
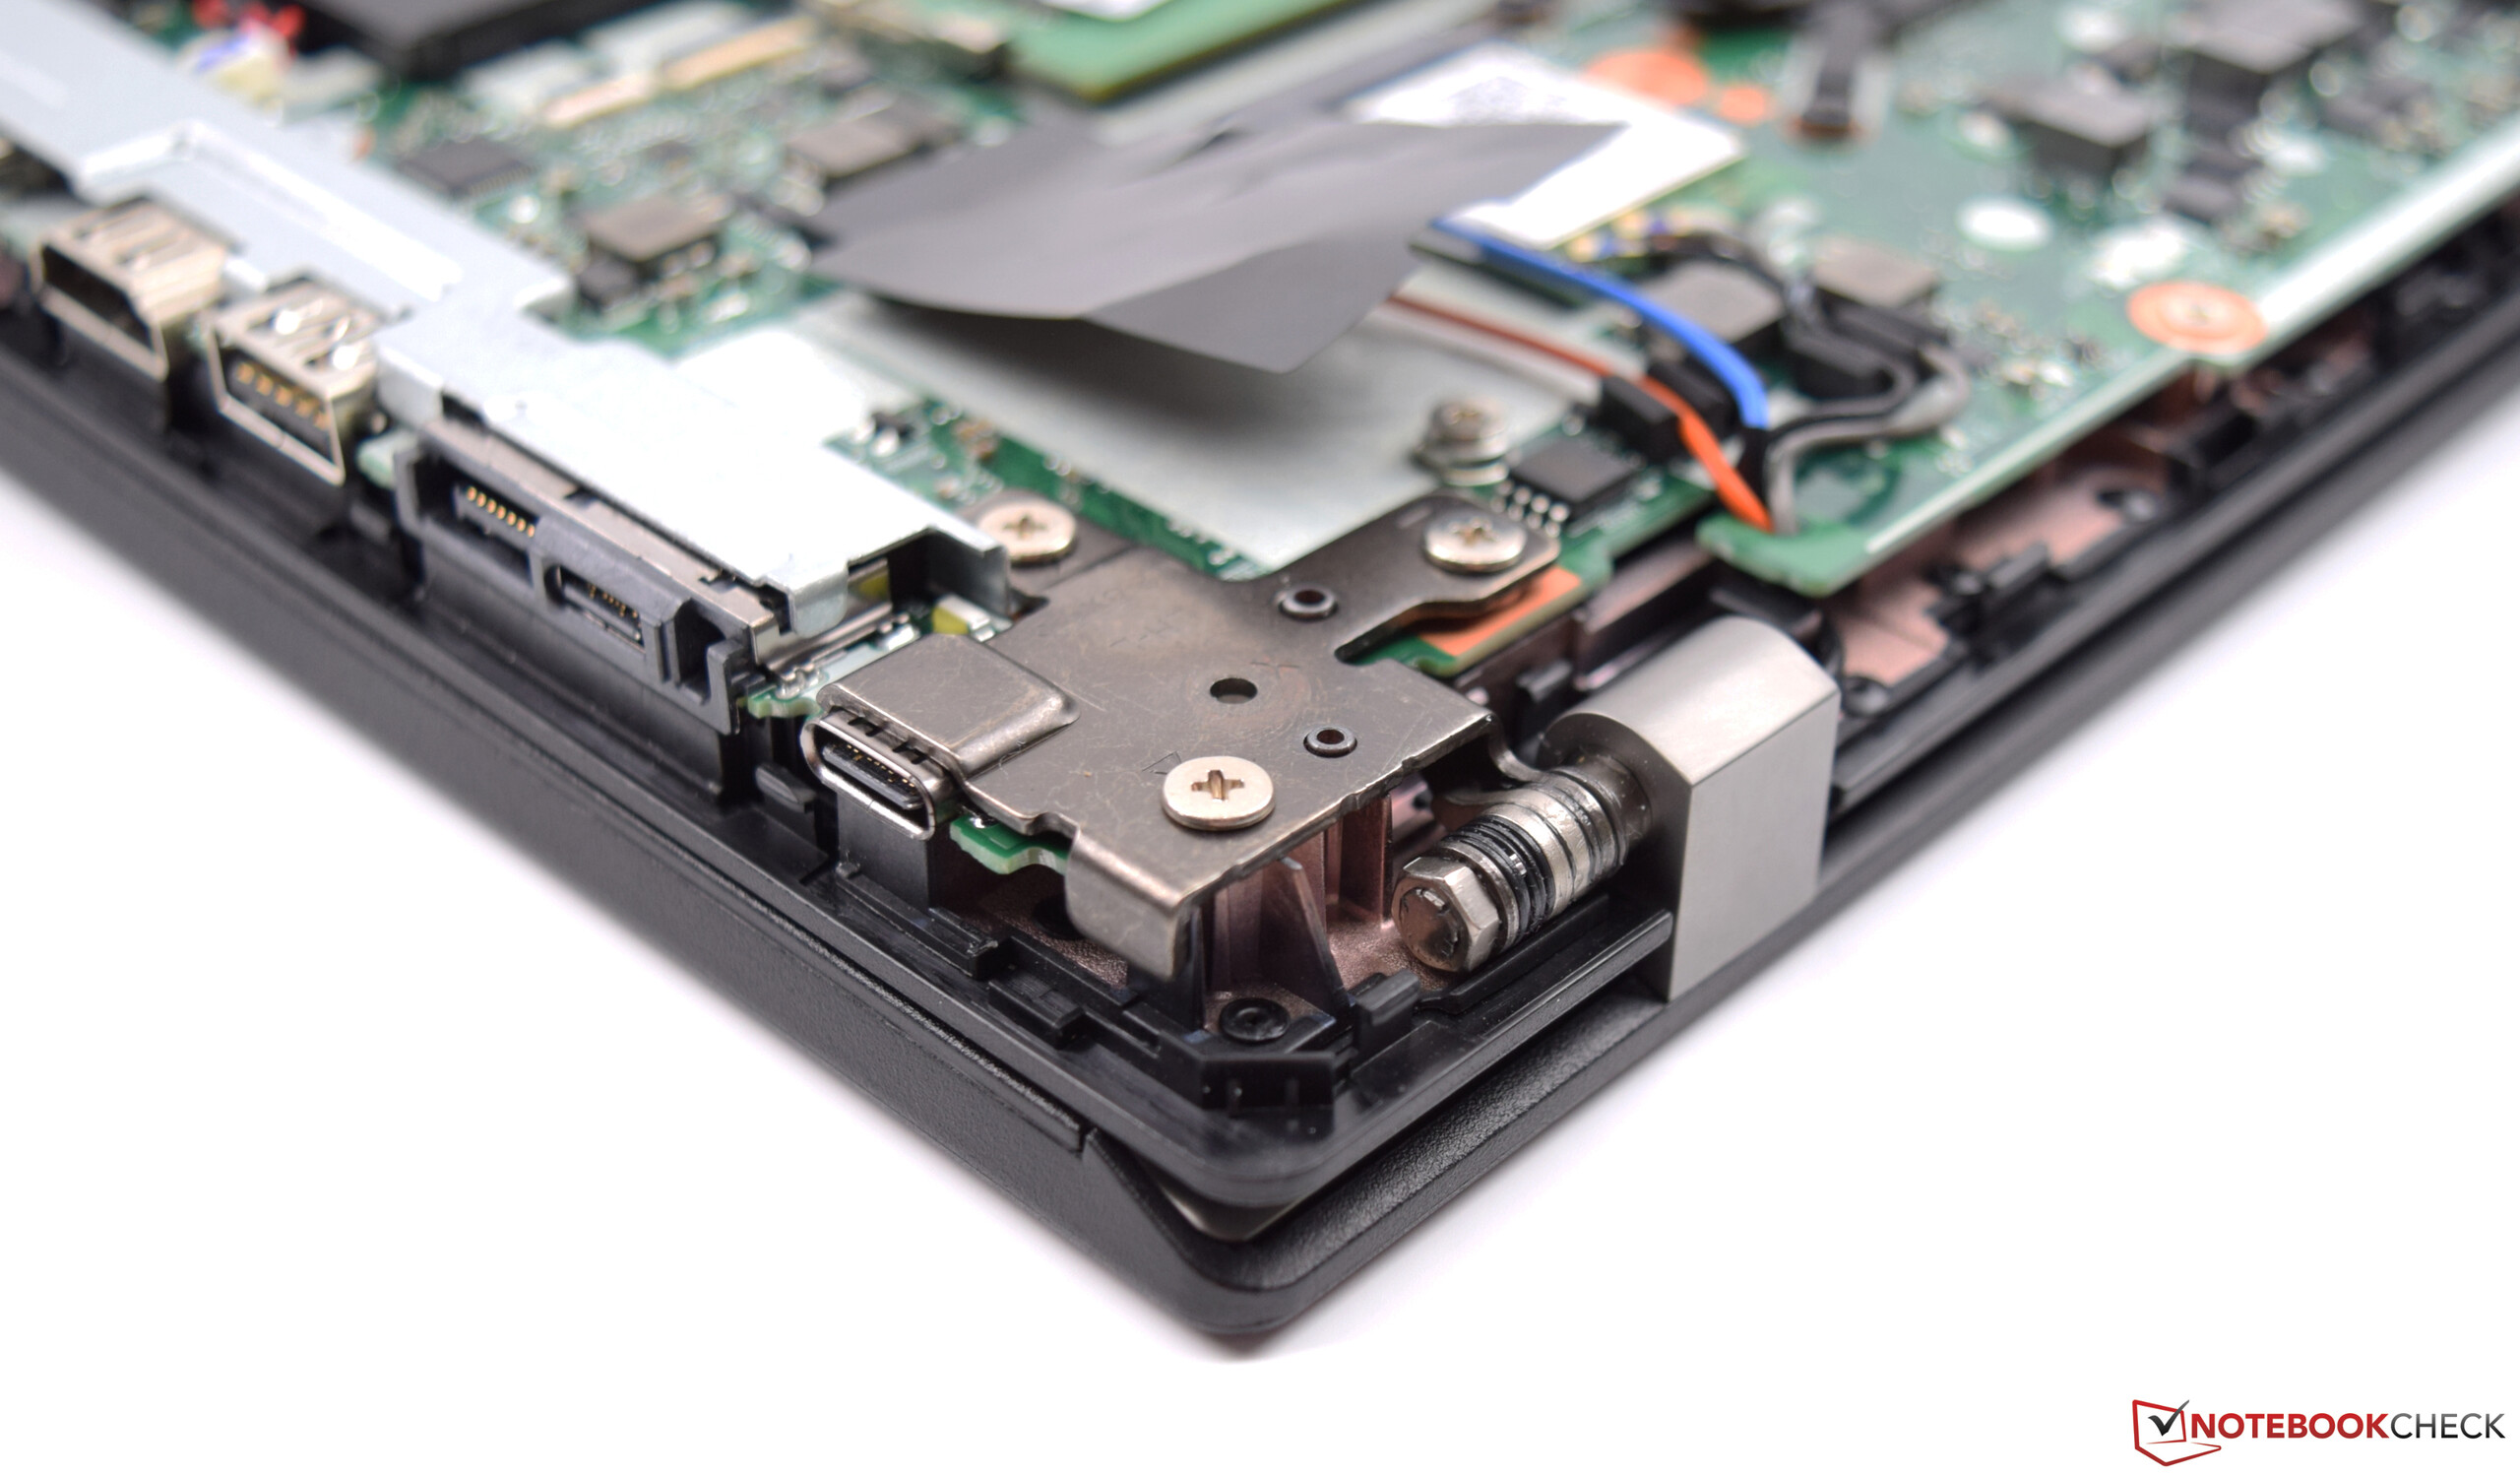
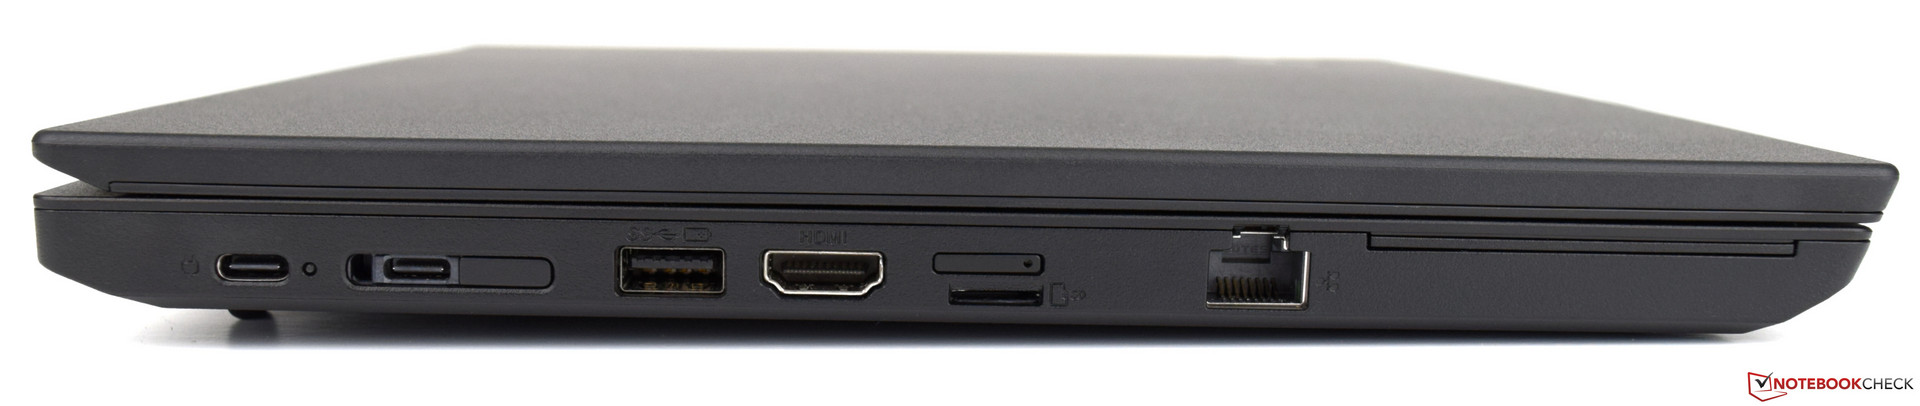
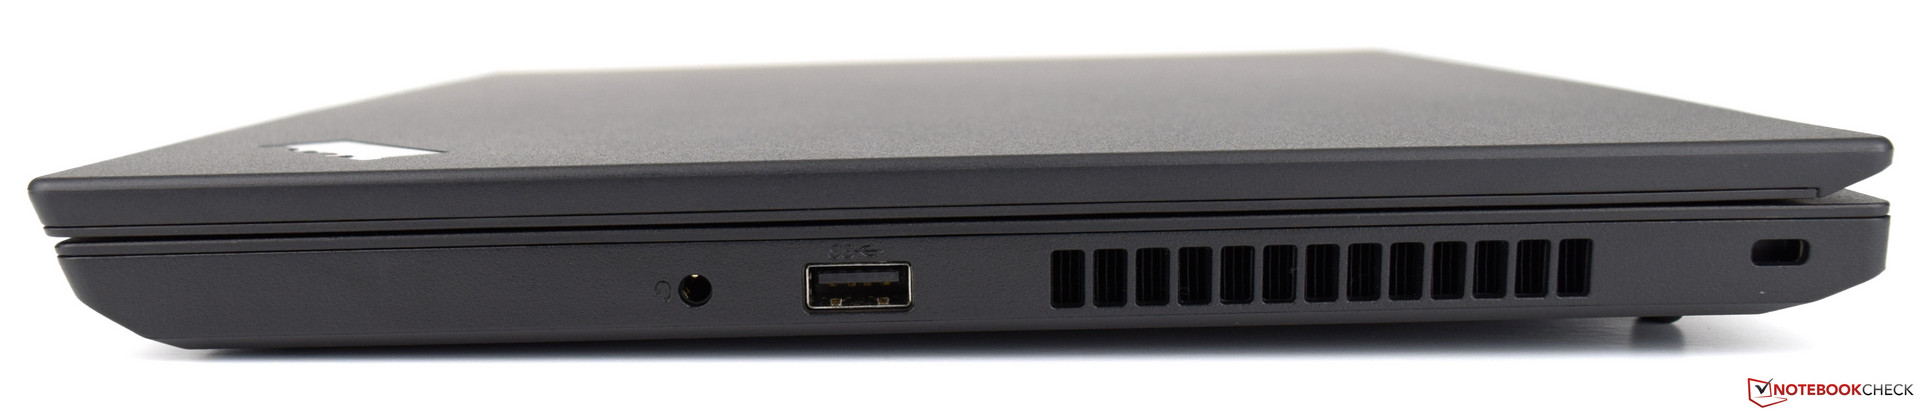
Notre avis sur l’écran est cependant plus mitigé. C’est bien d’avoir un écran IPS, mais sa luminosité n’est pas à la hauteur. Il faudra faire des compromis, et éviter de travailler à l’extérieur. En plus de cela, l’autonomie n’est pas extraordinaire par rapport à la concurrence. Les performances et la connectique complète sont à noter au rang des points forts. Enfin, il faut signaler le passage d’un lecteur de carte SD à un lecteur de carte micro SD.
L’intégralité de cette critique est disponible en anglais en suivant ce lien.
Lenovo ThinkPad L480-20LS001AGE
- 03/13/2018 v6 (old)
Sebastian Bade