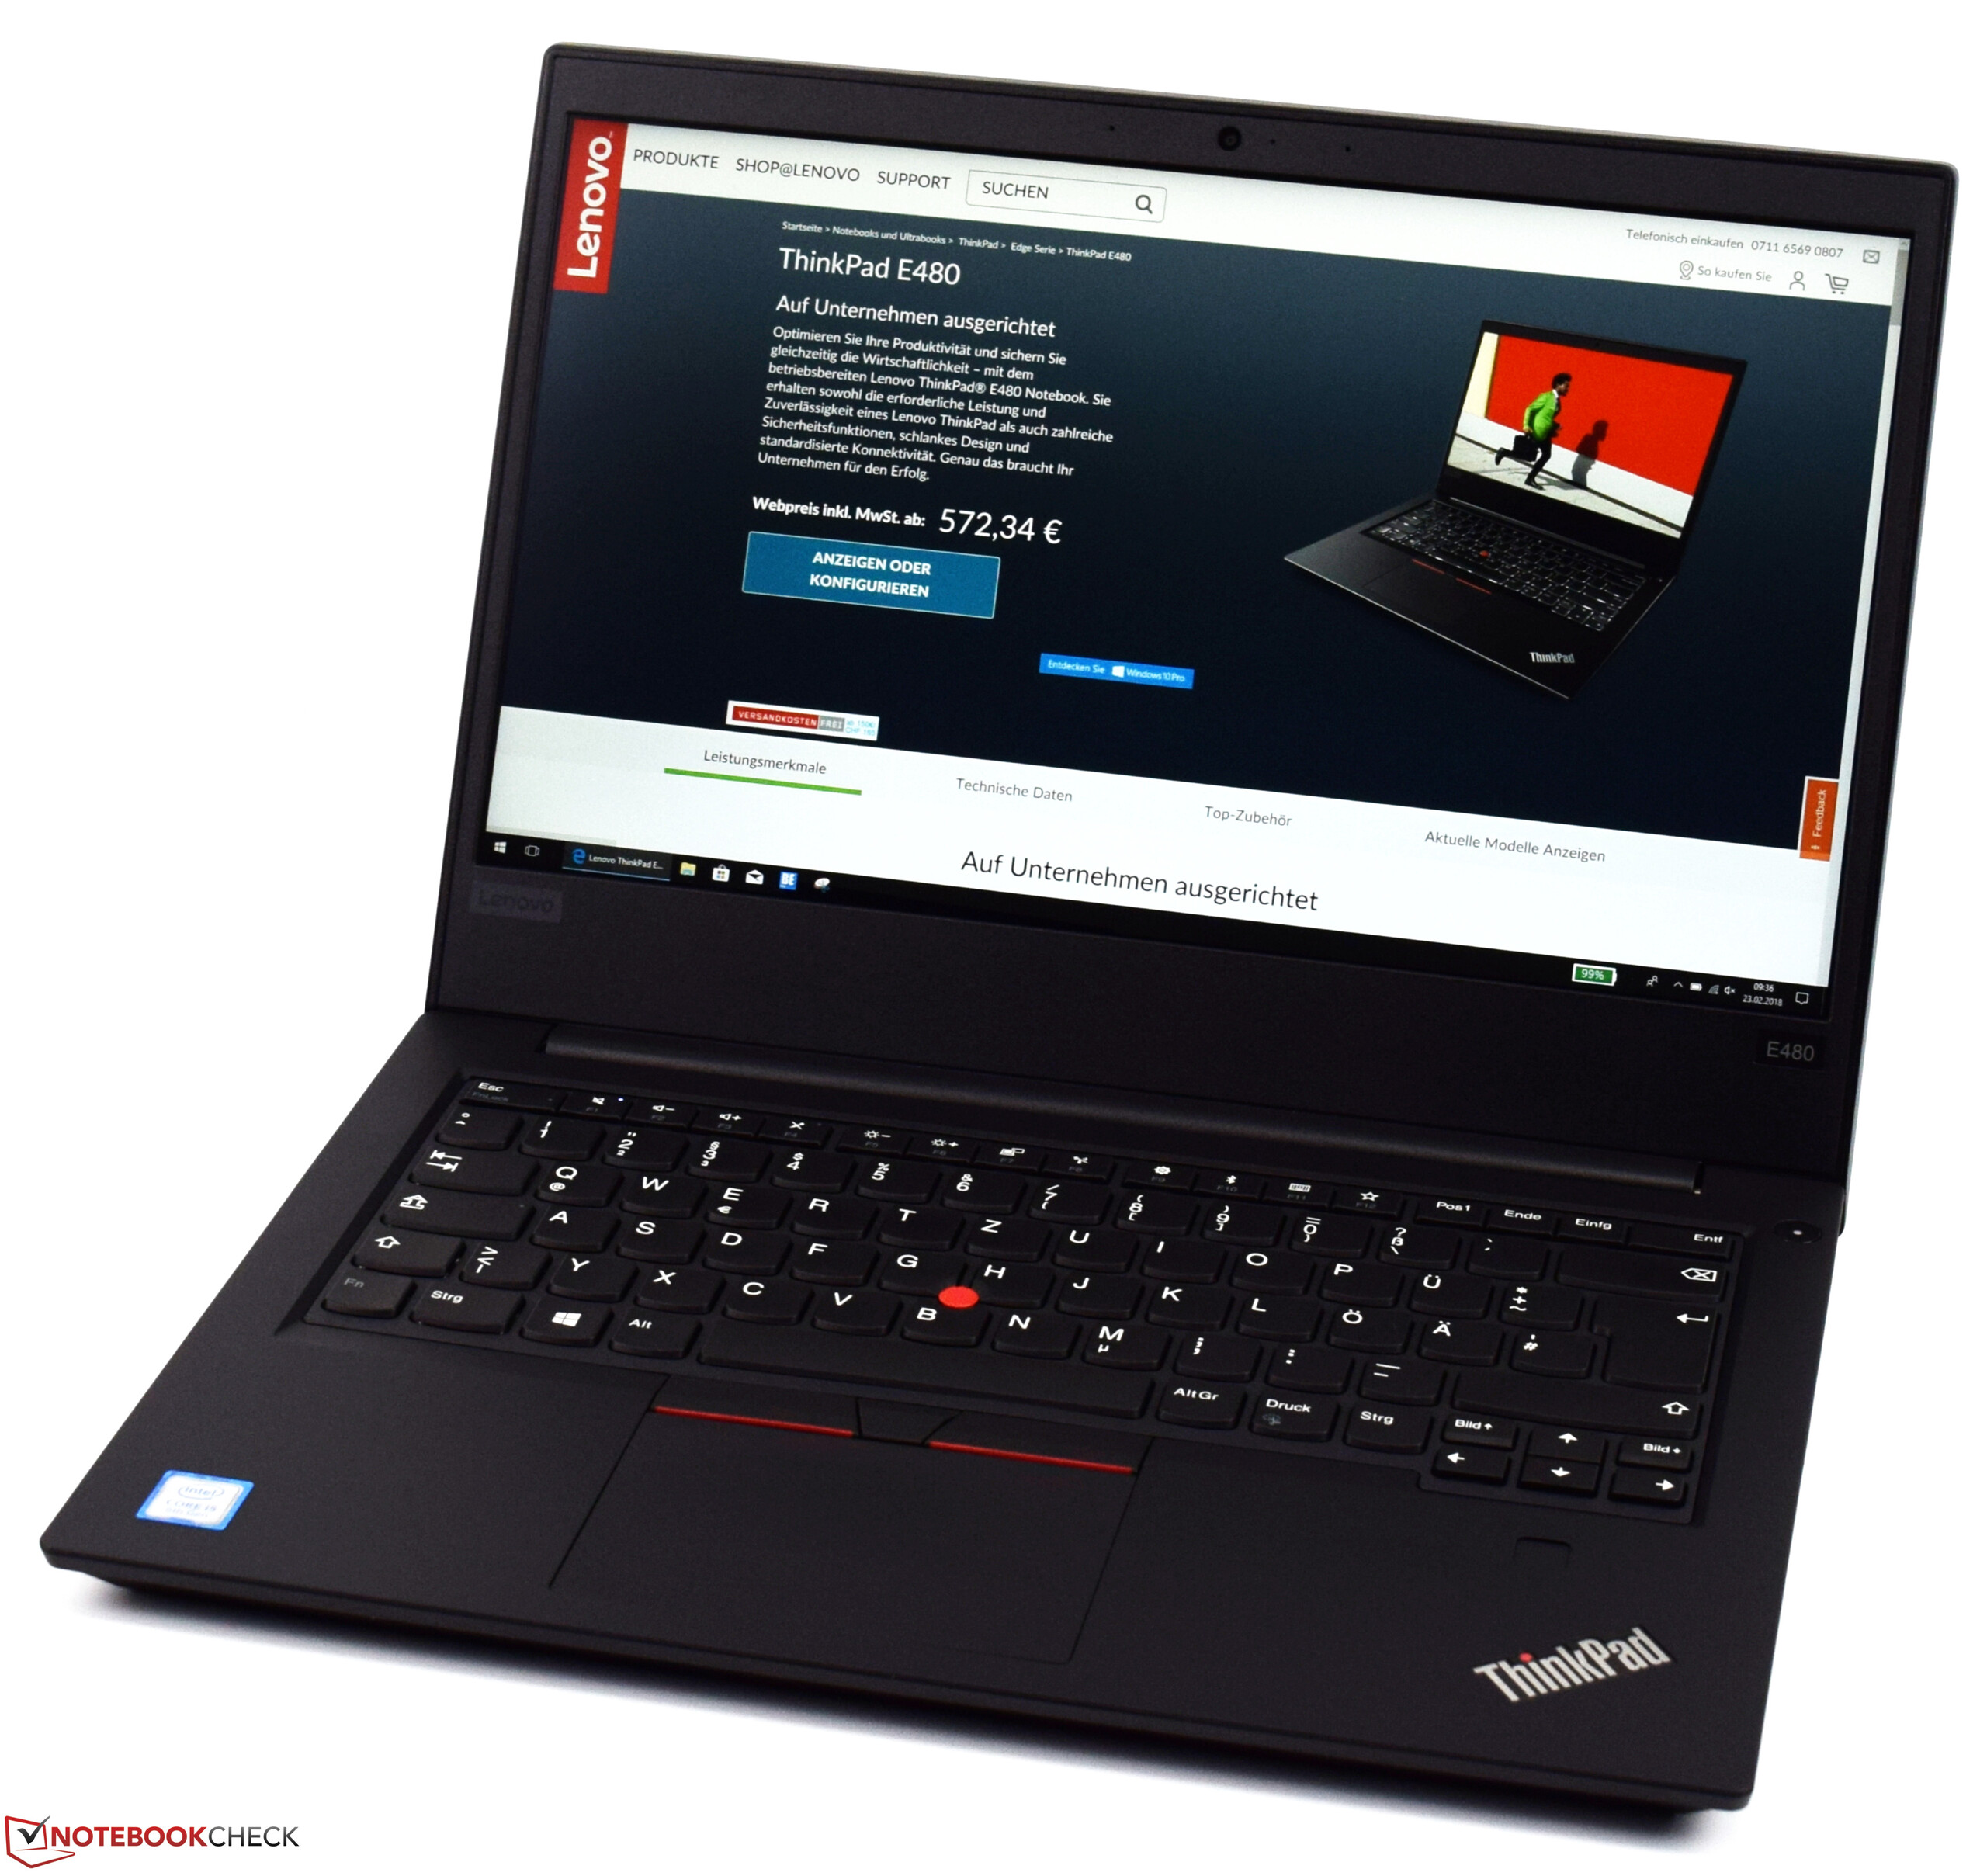
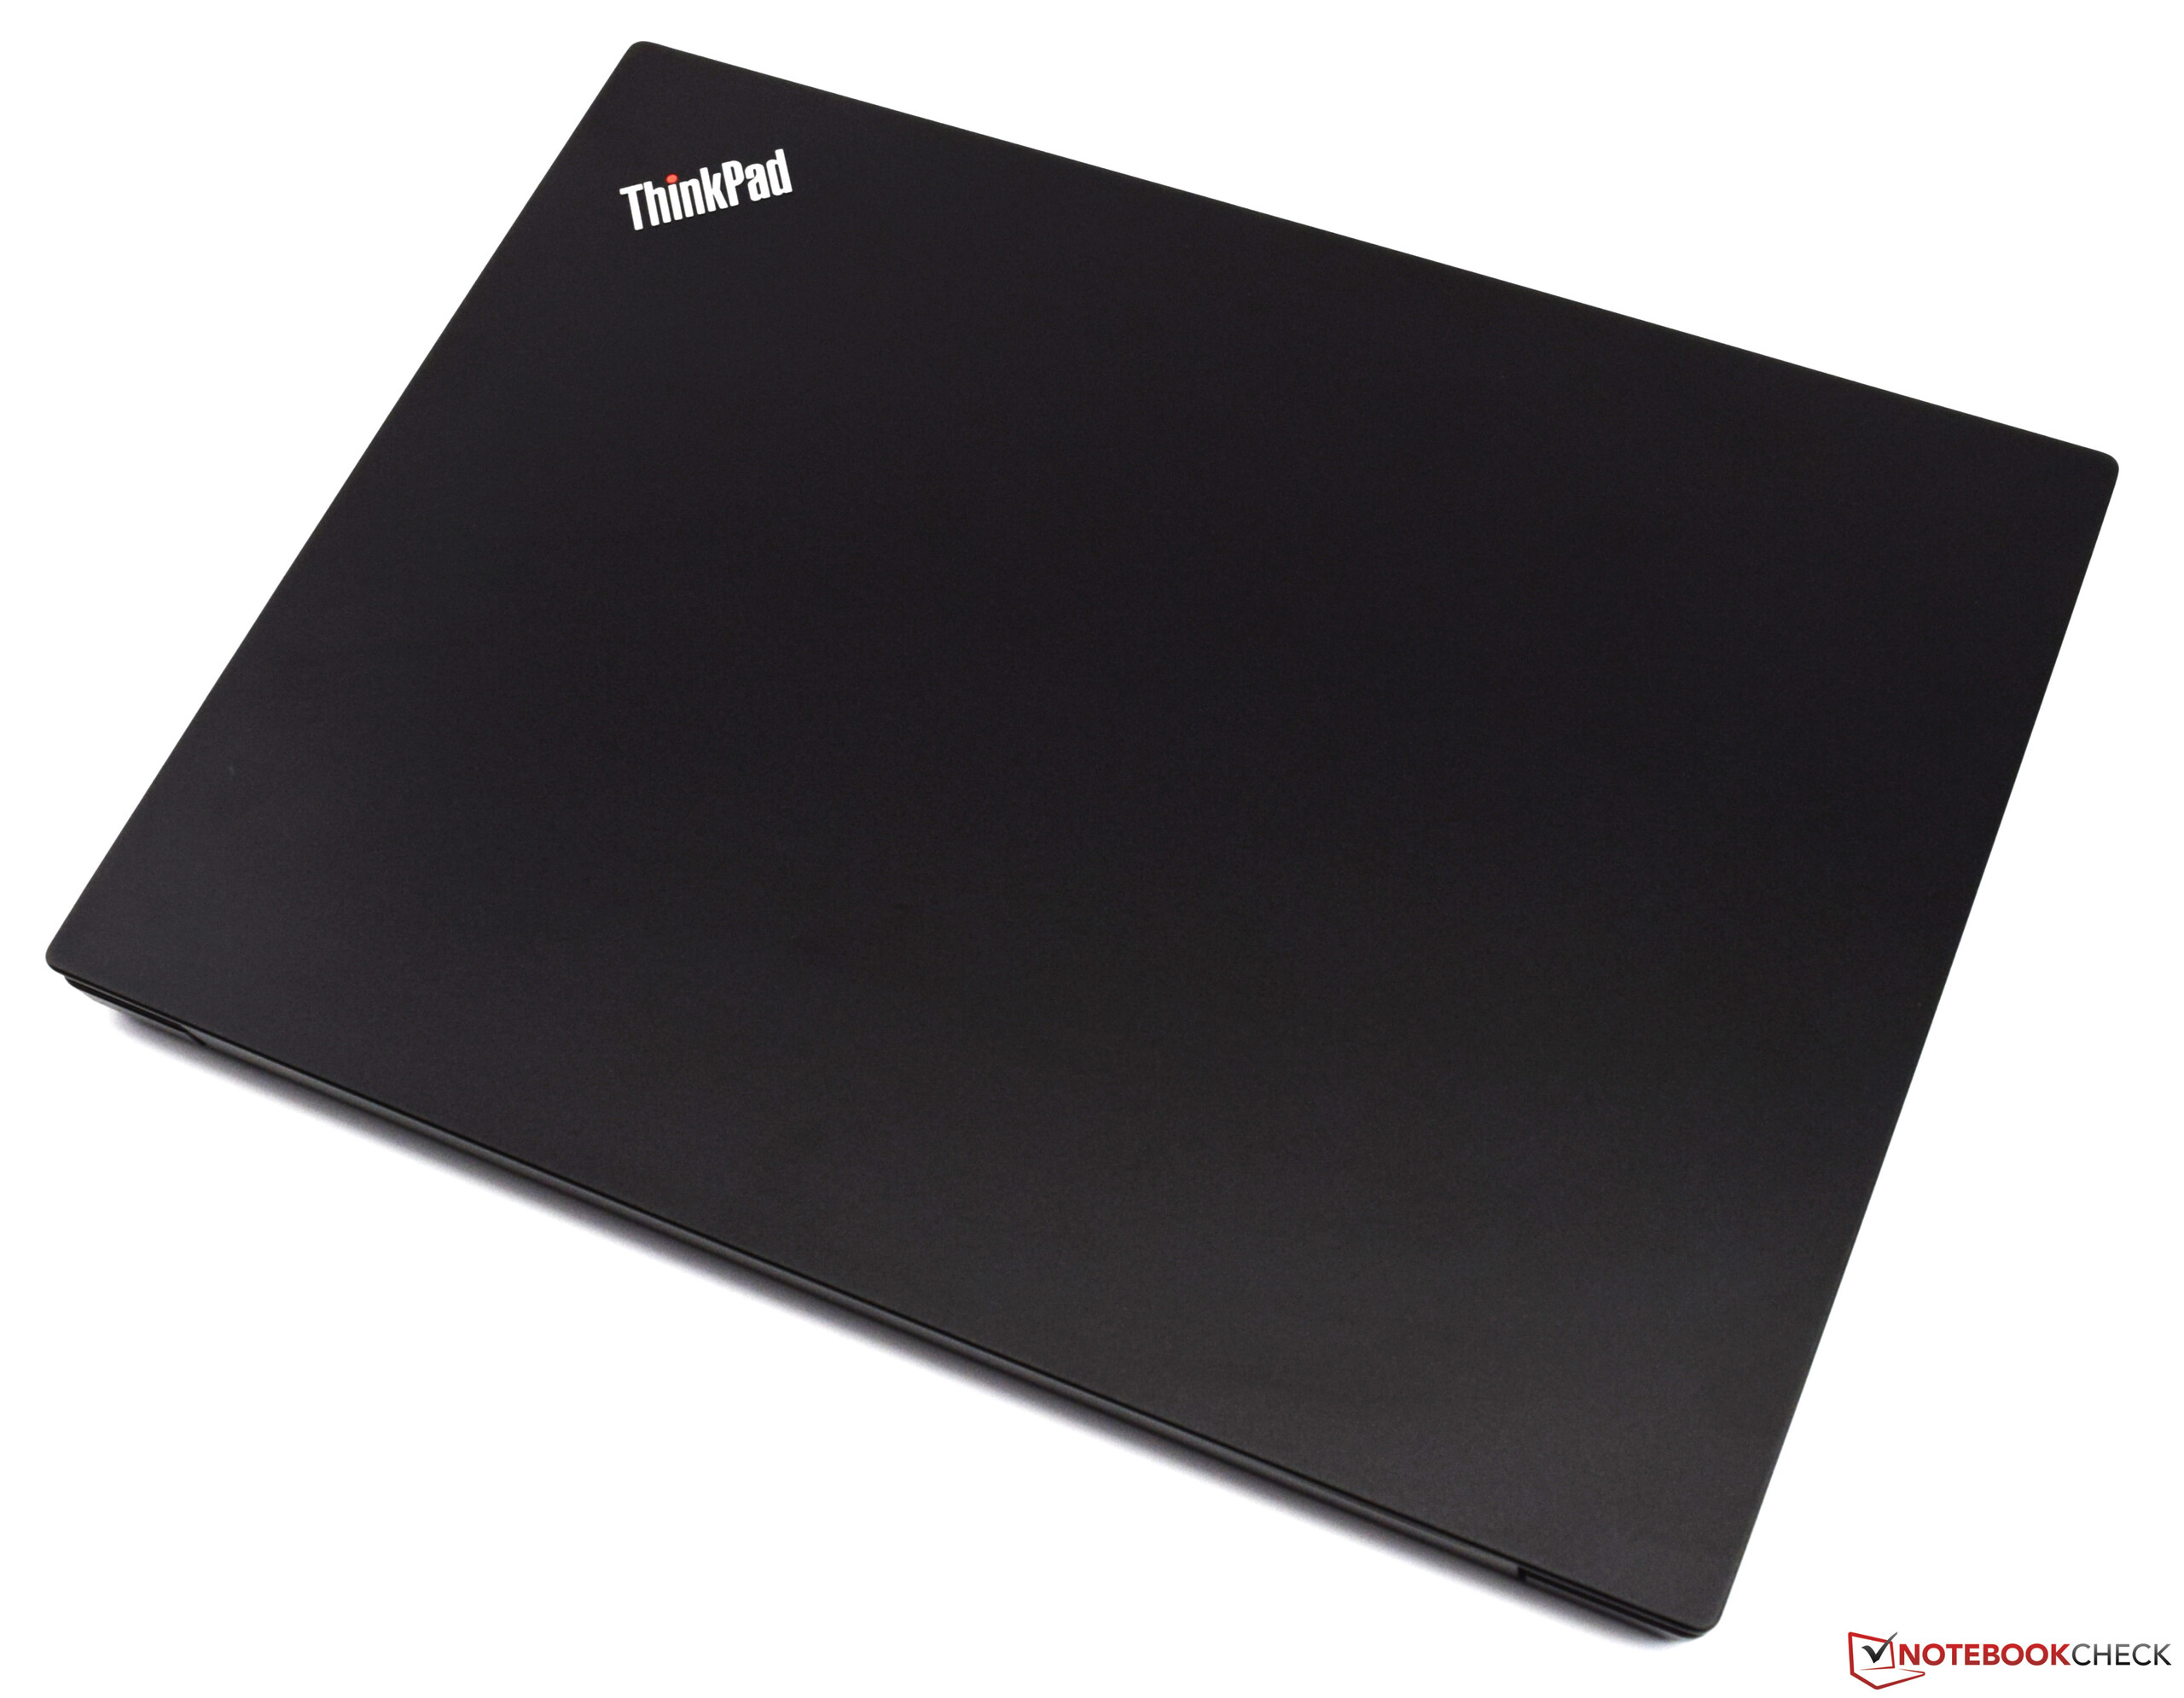
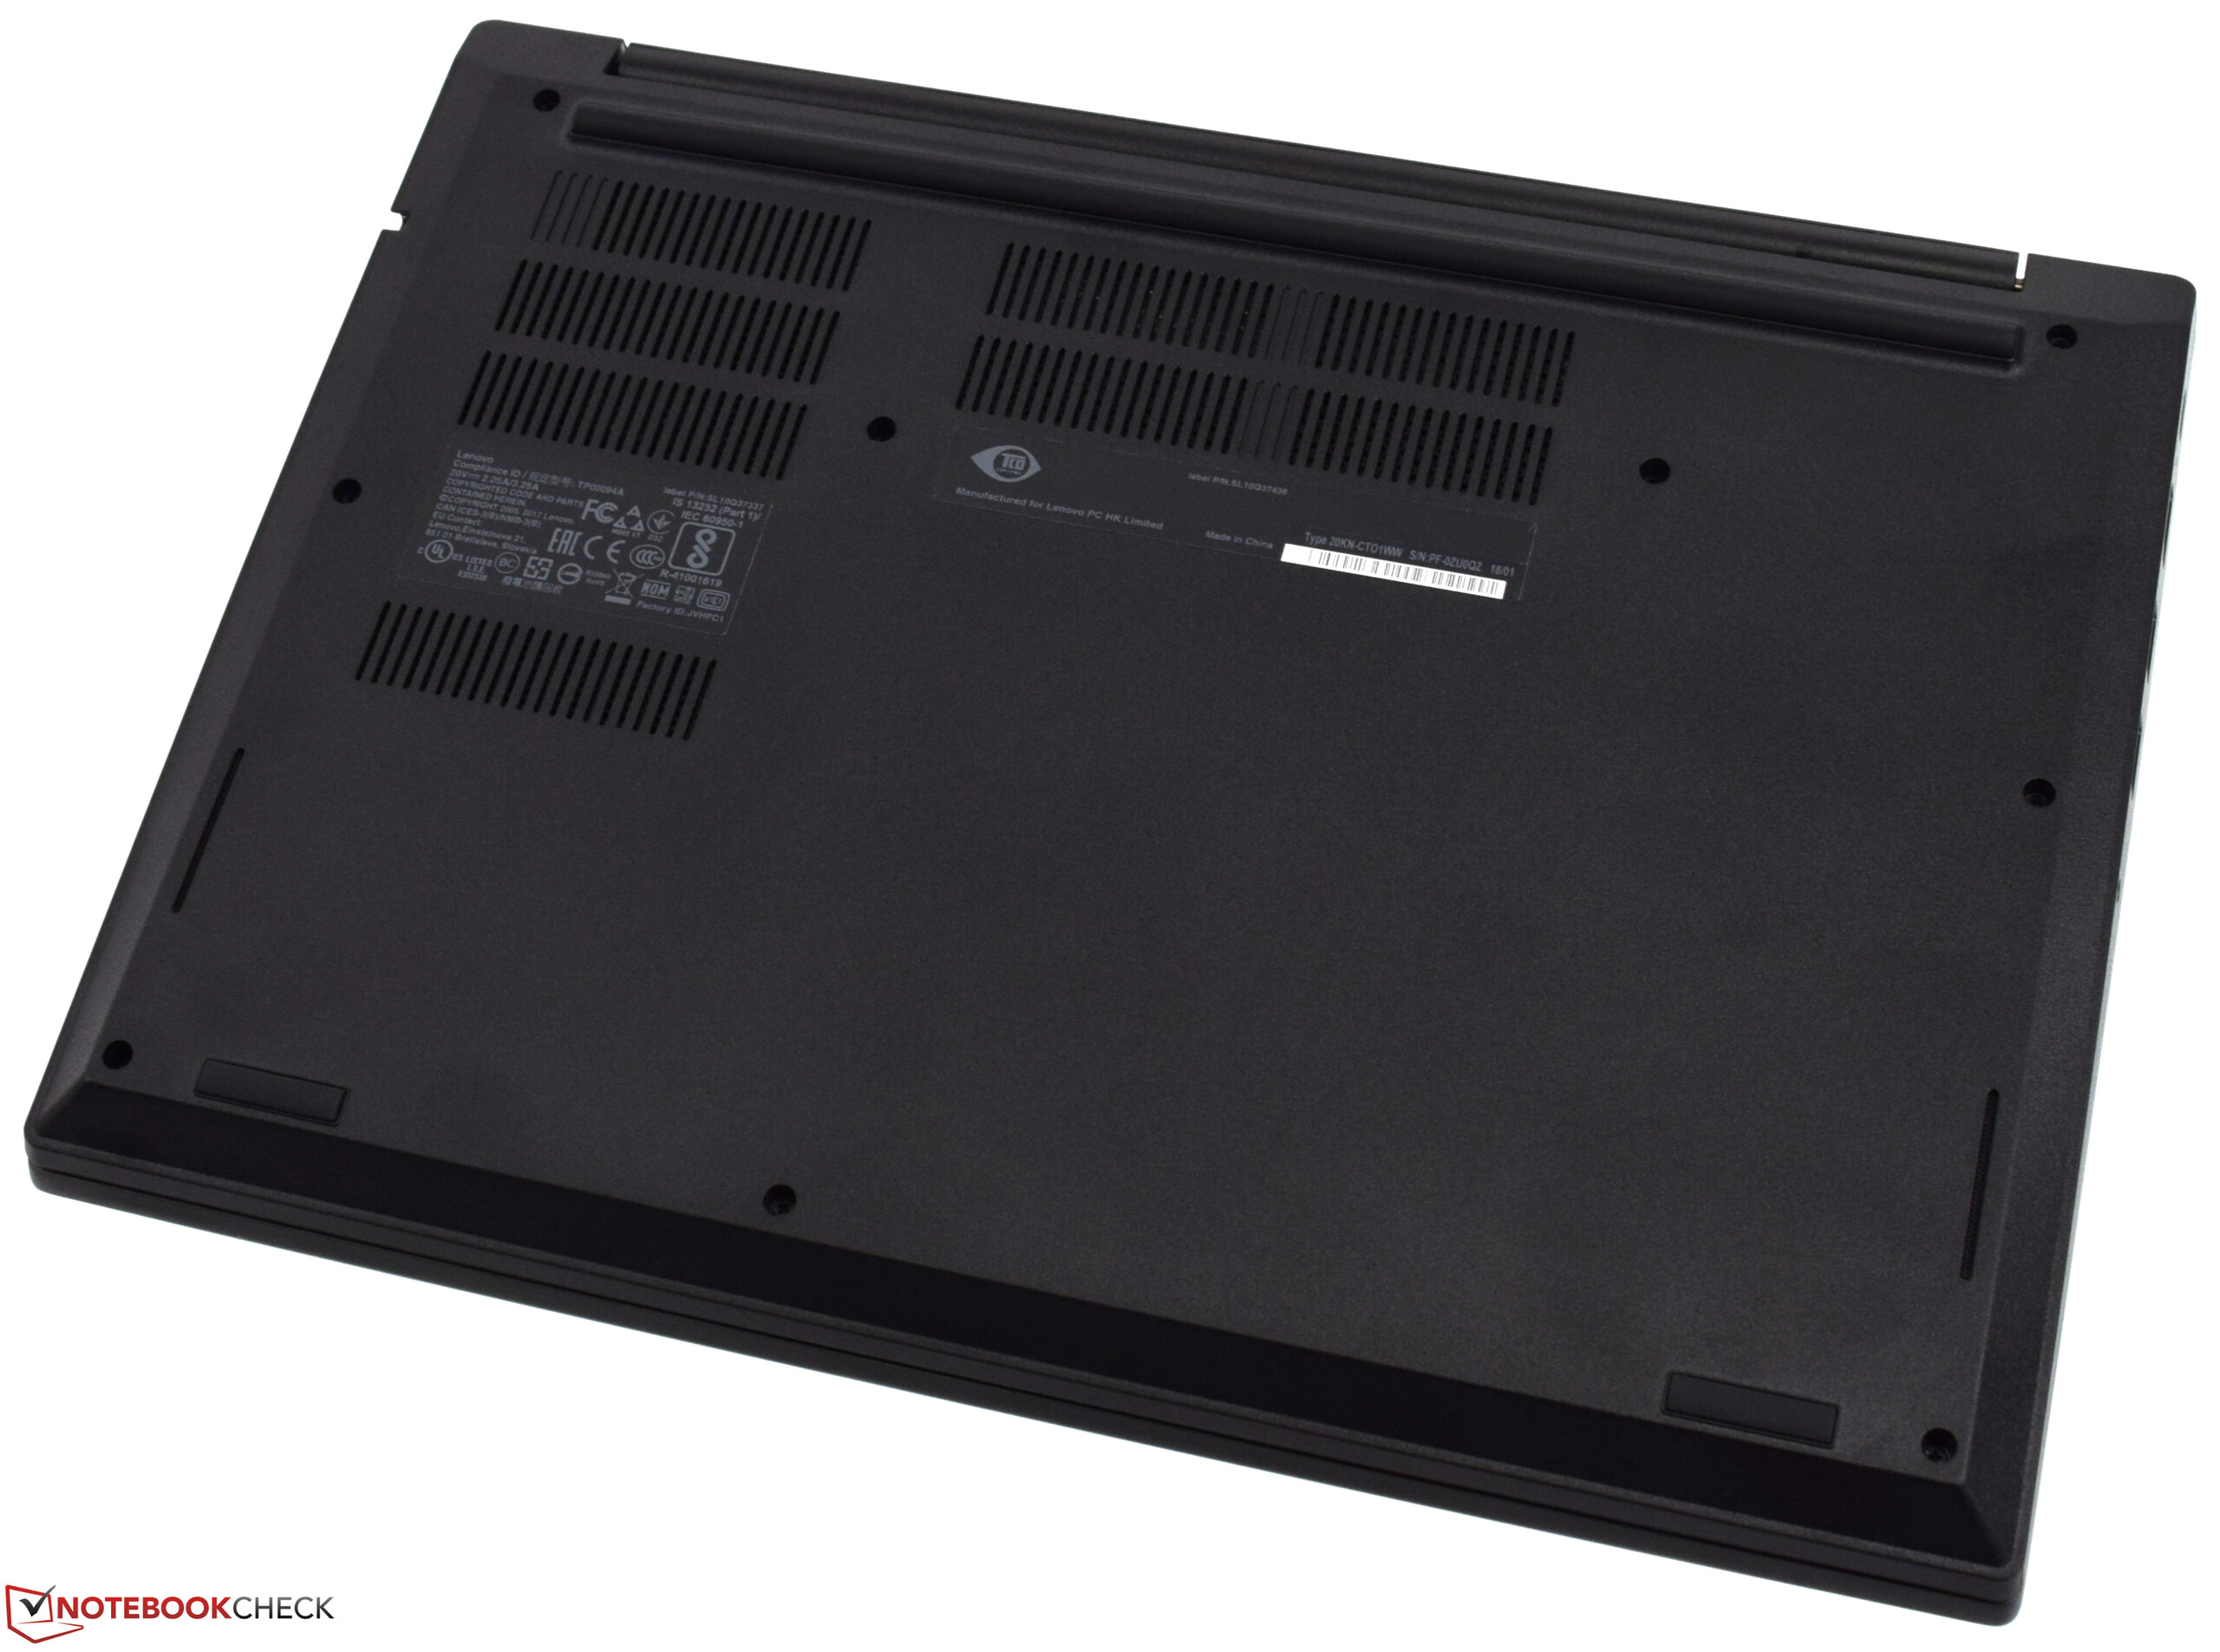
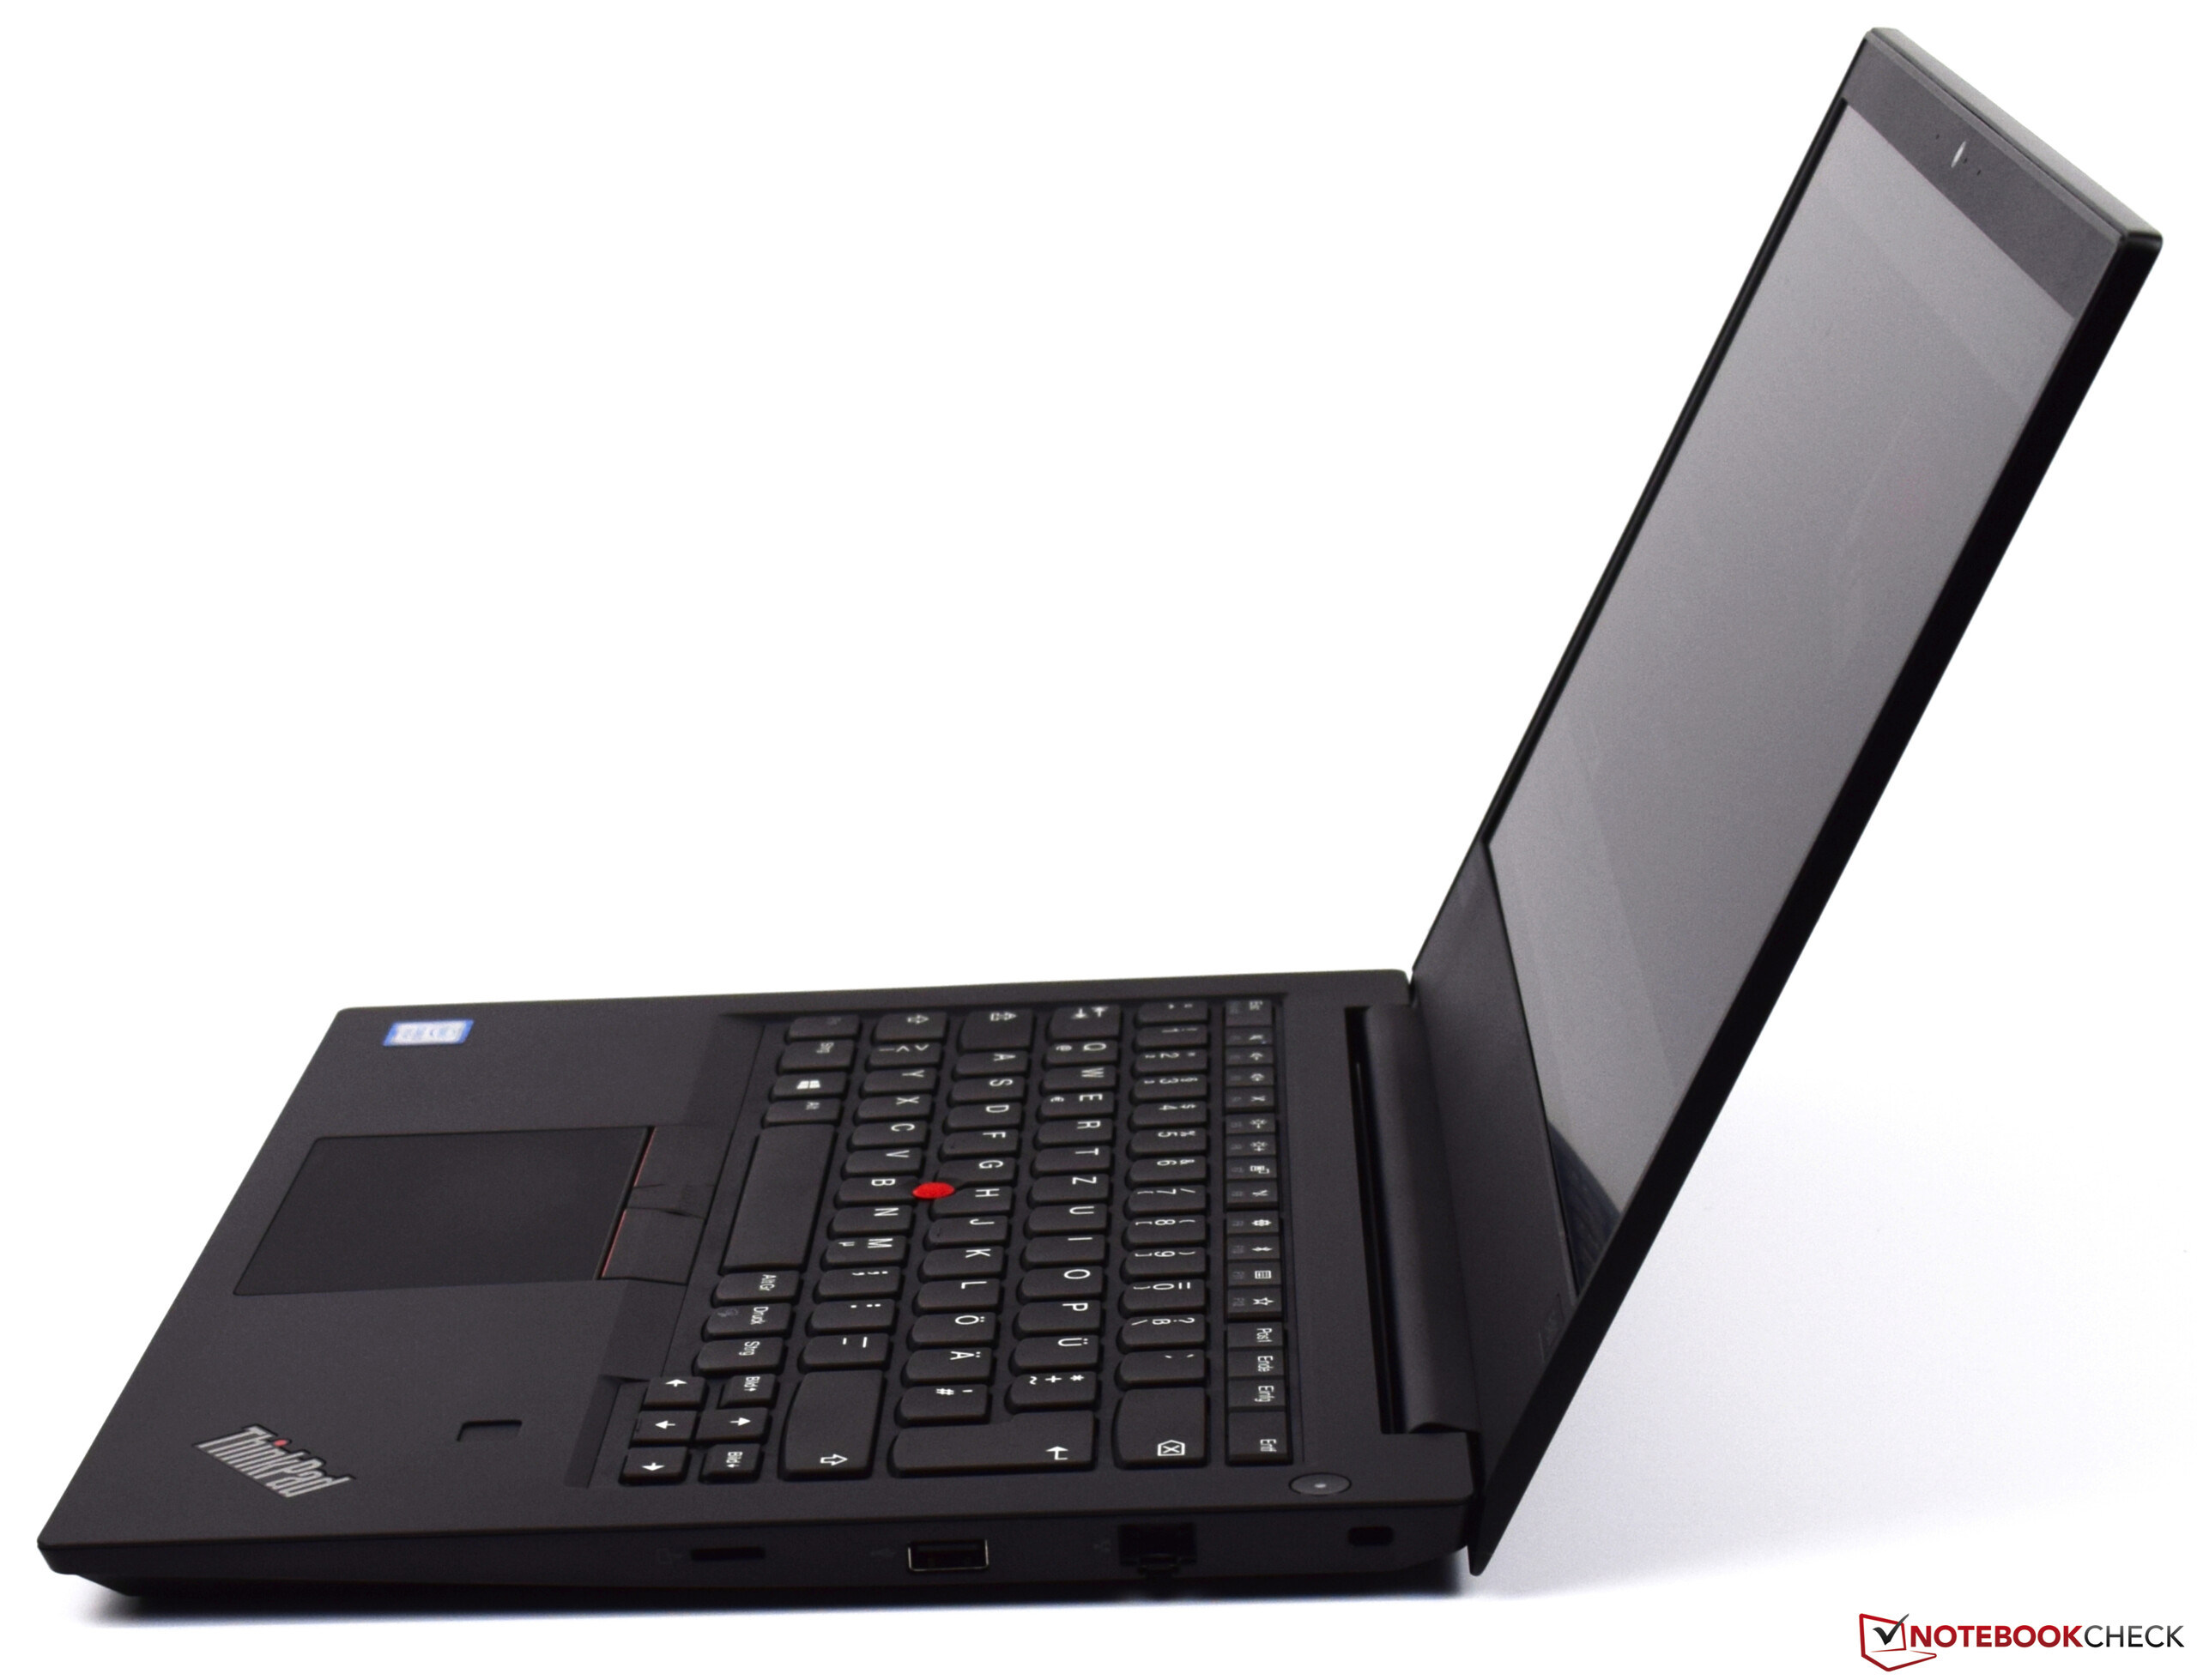
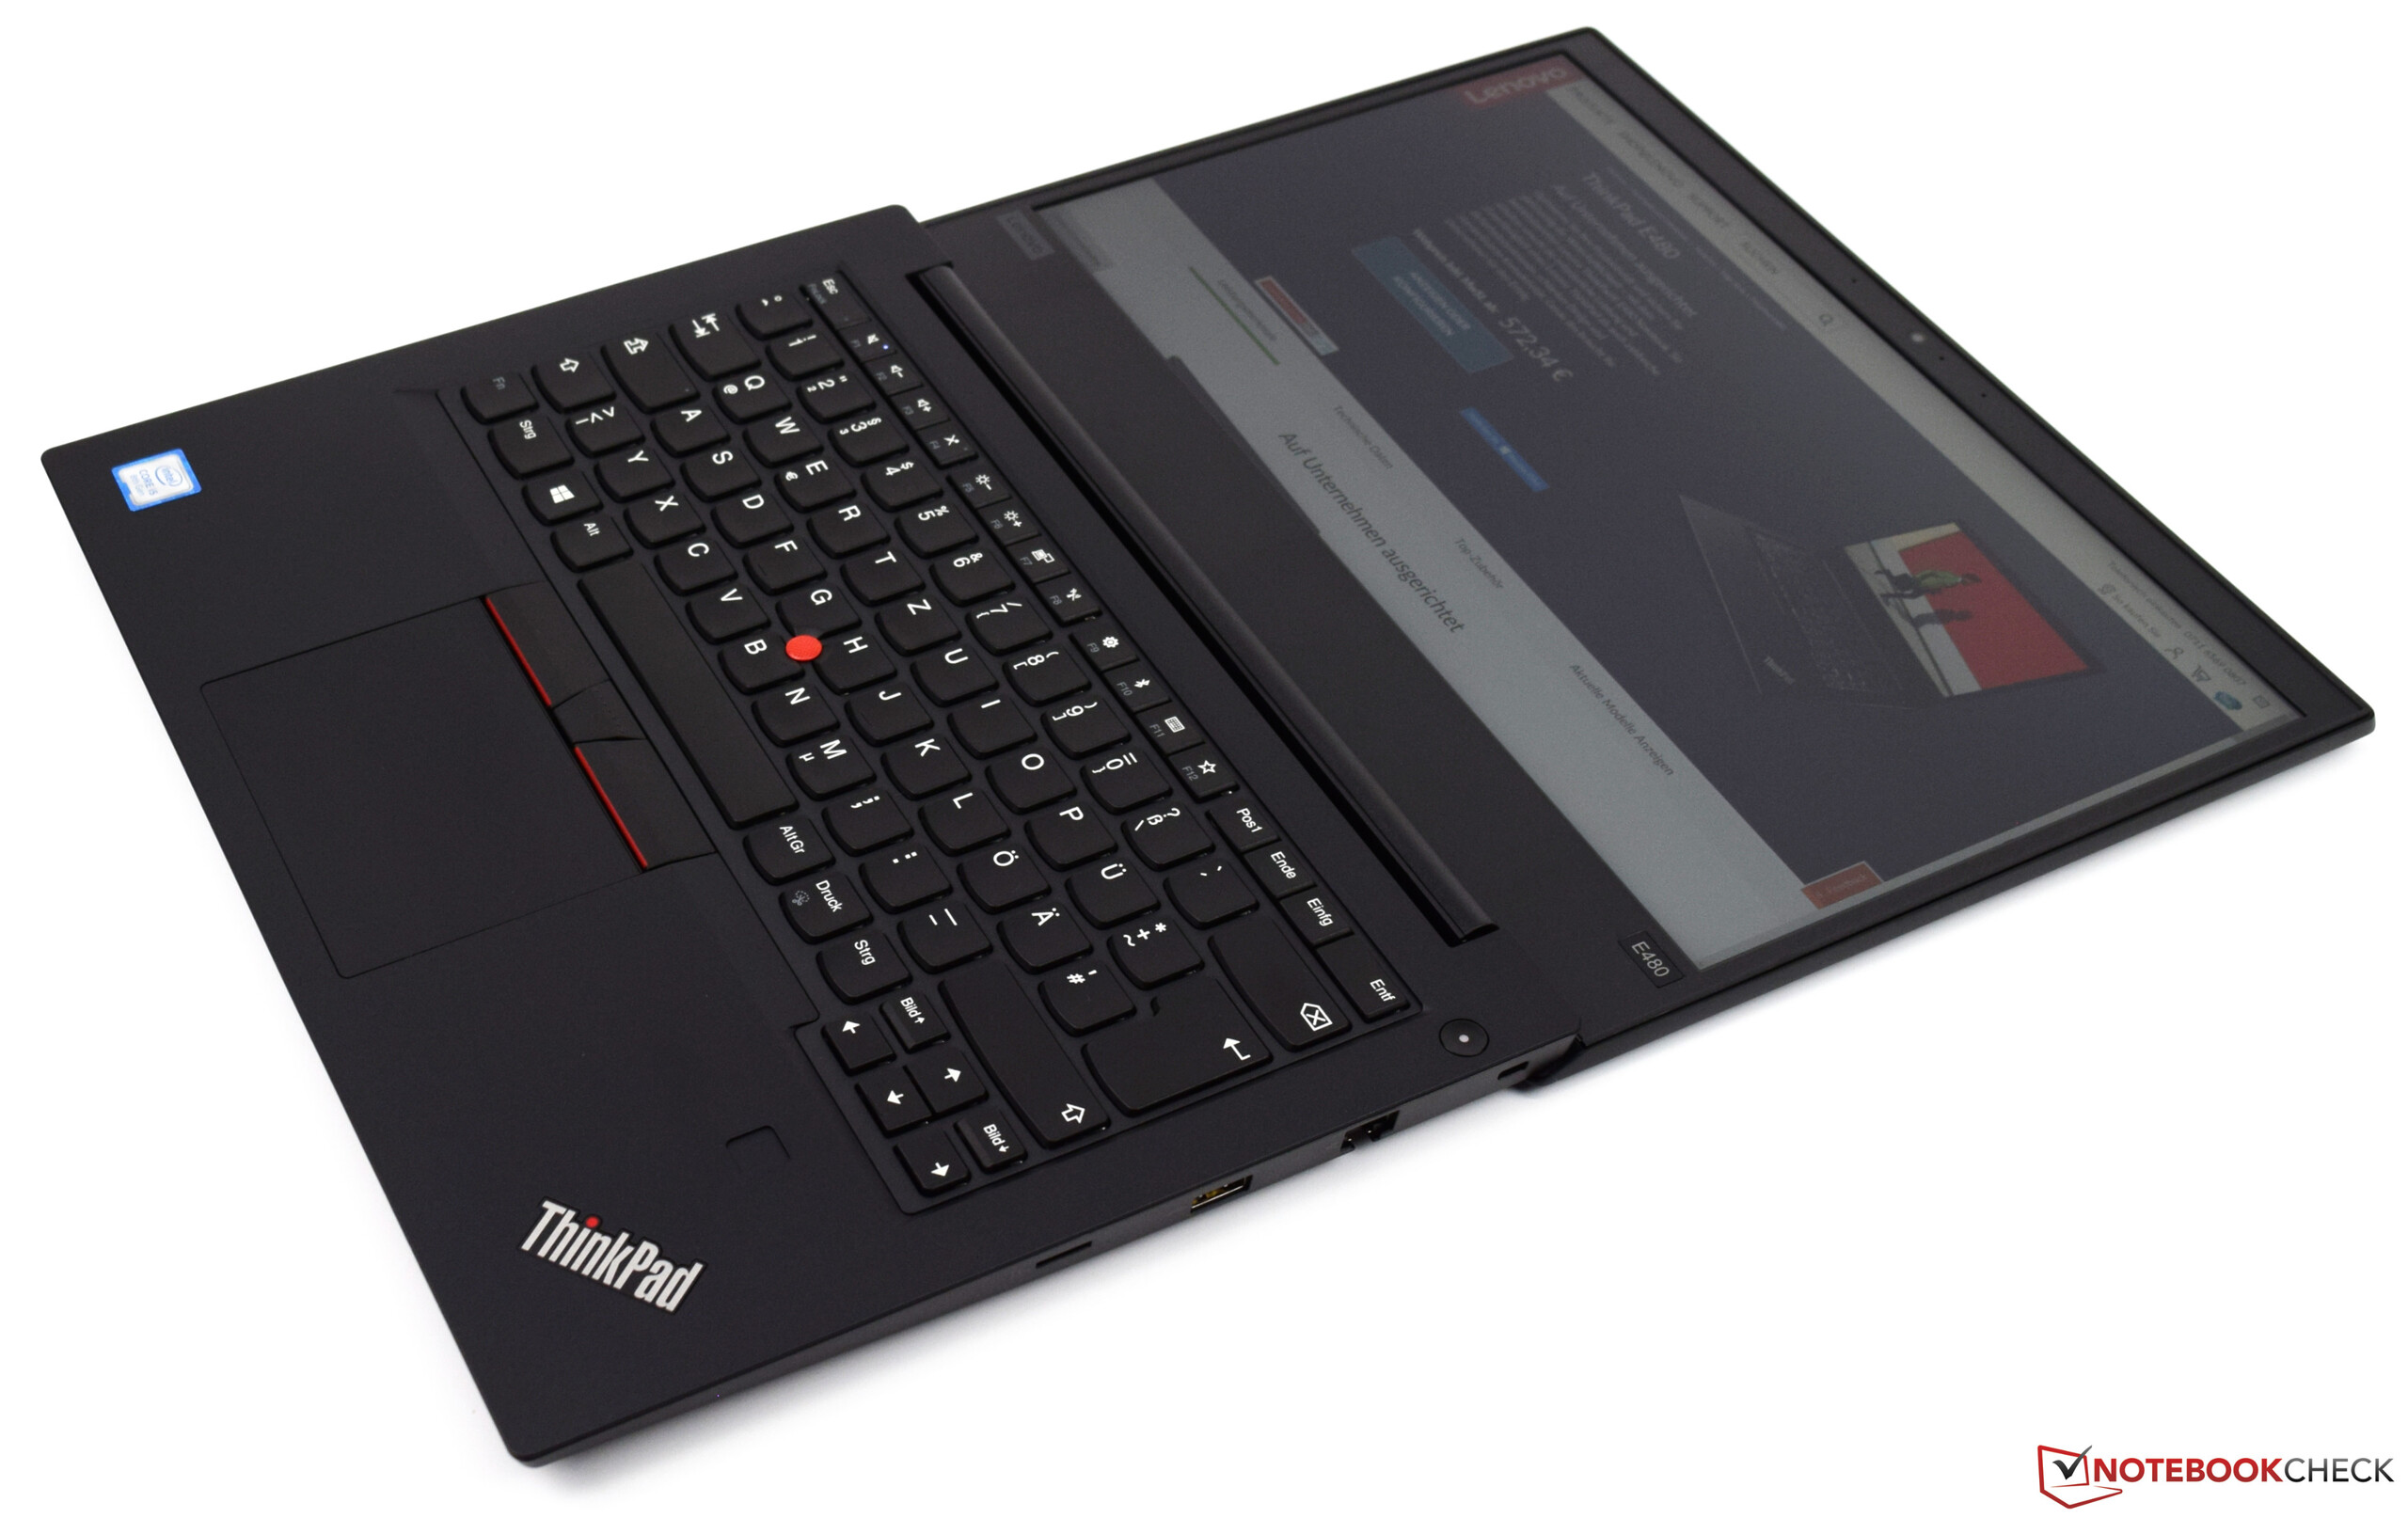
Courte critique du PC portable Lenovo ThinkPad E480 (i5-8250U, UHD 620, SSD)
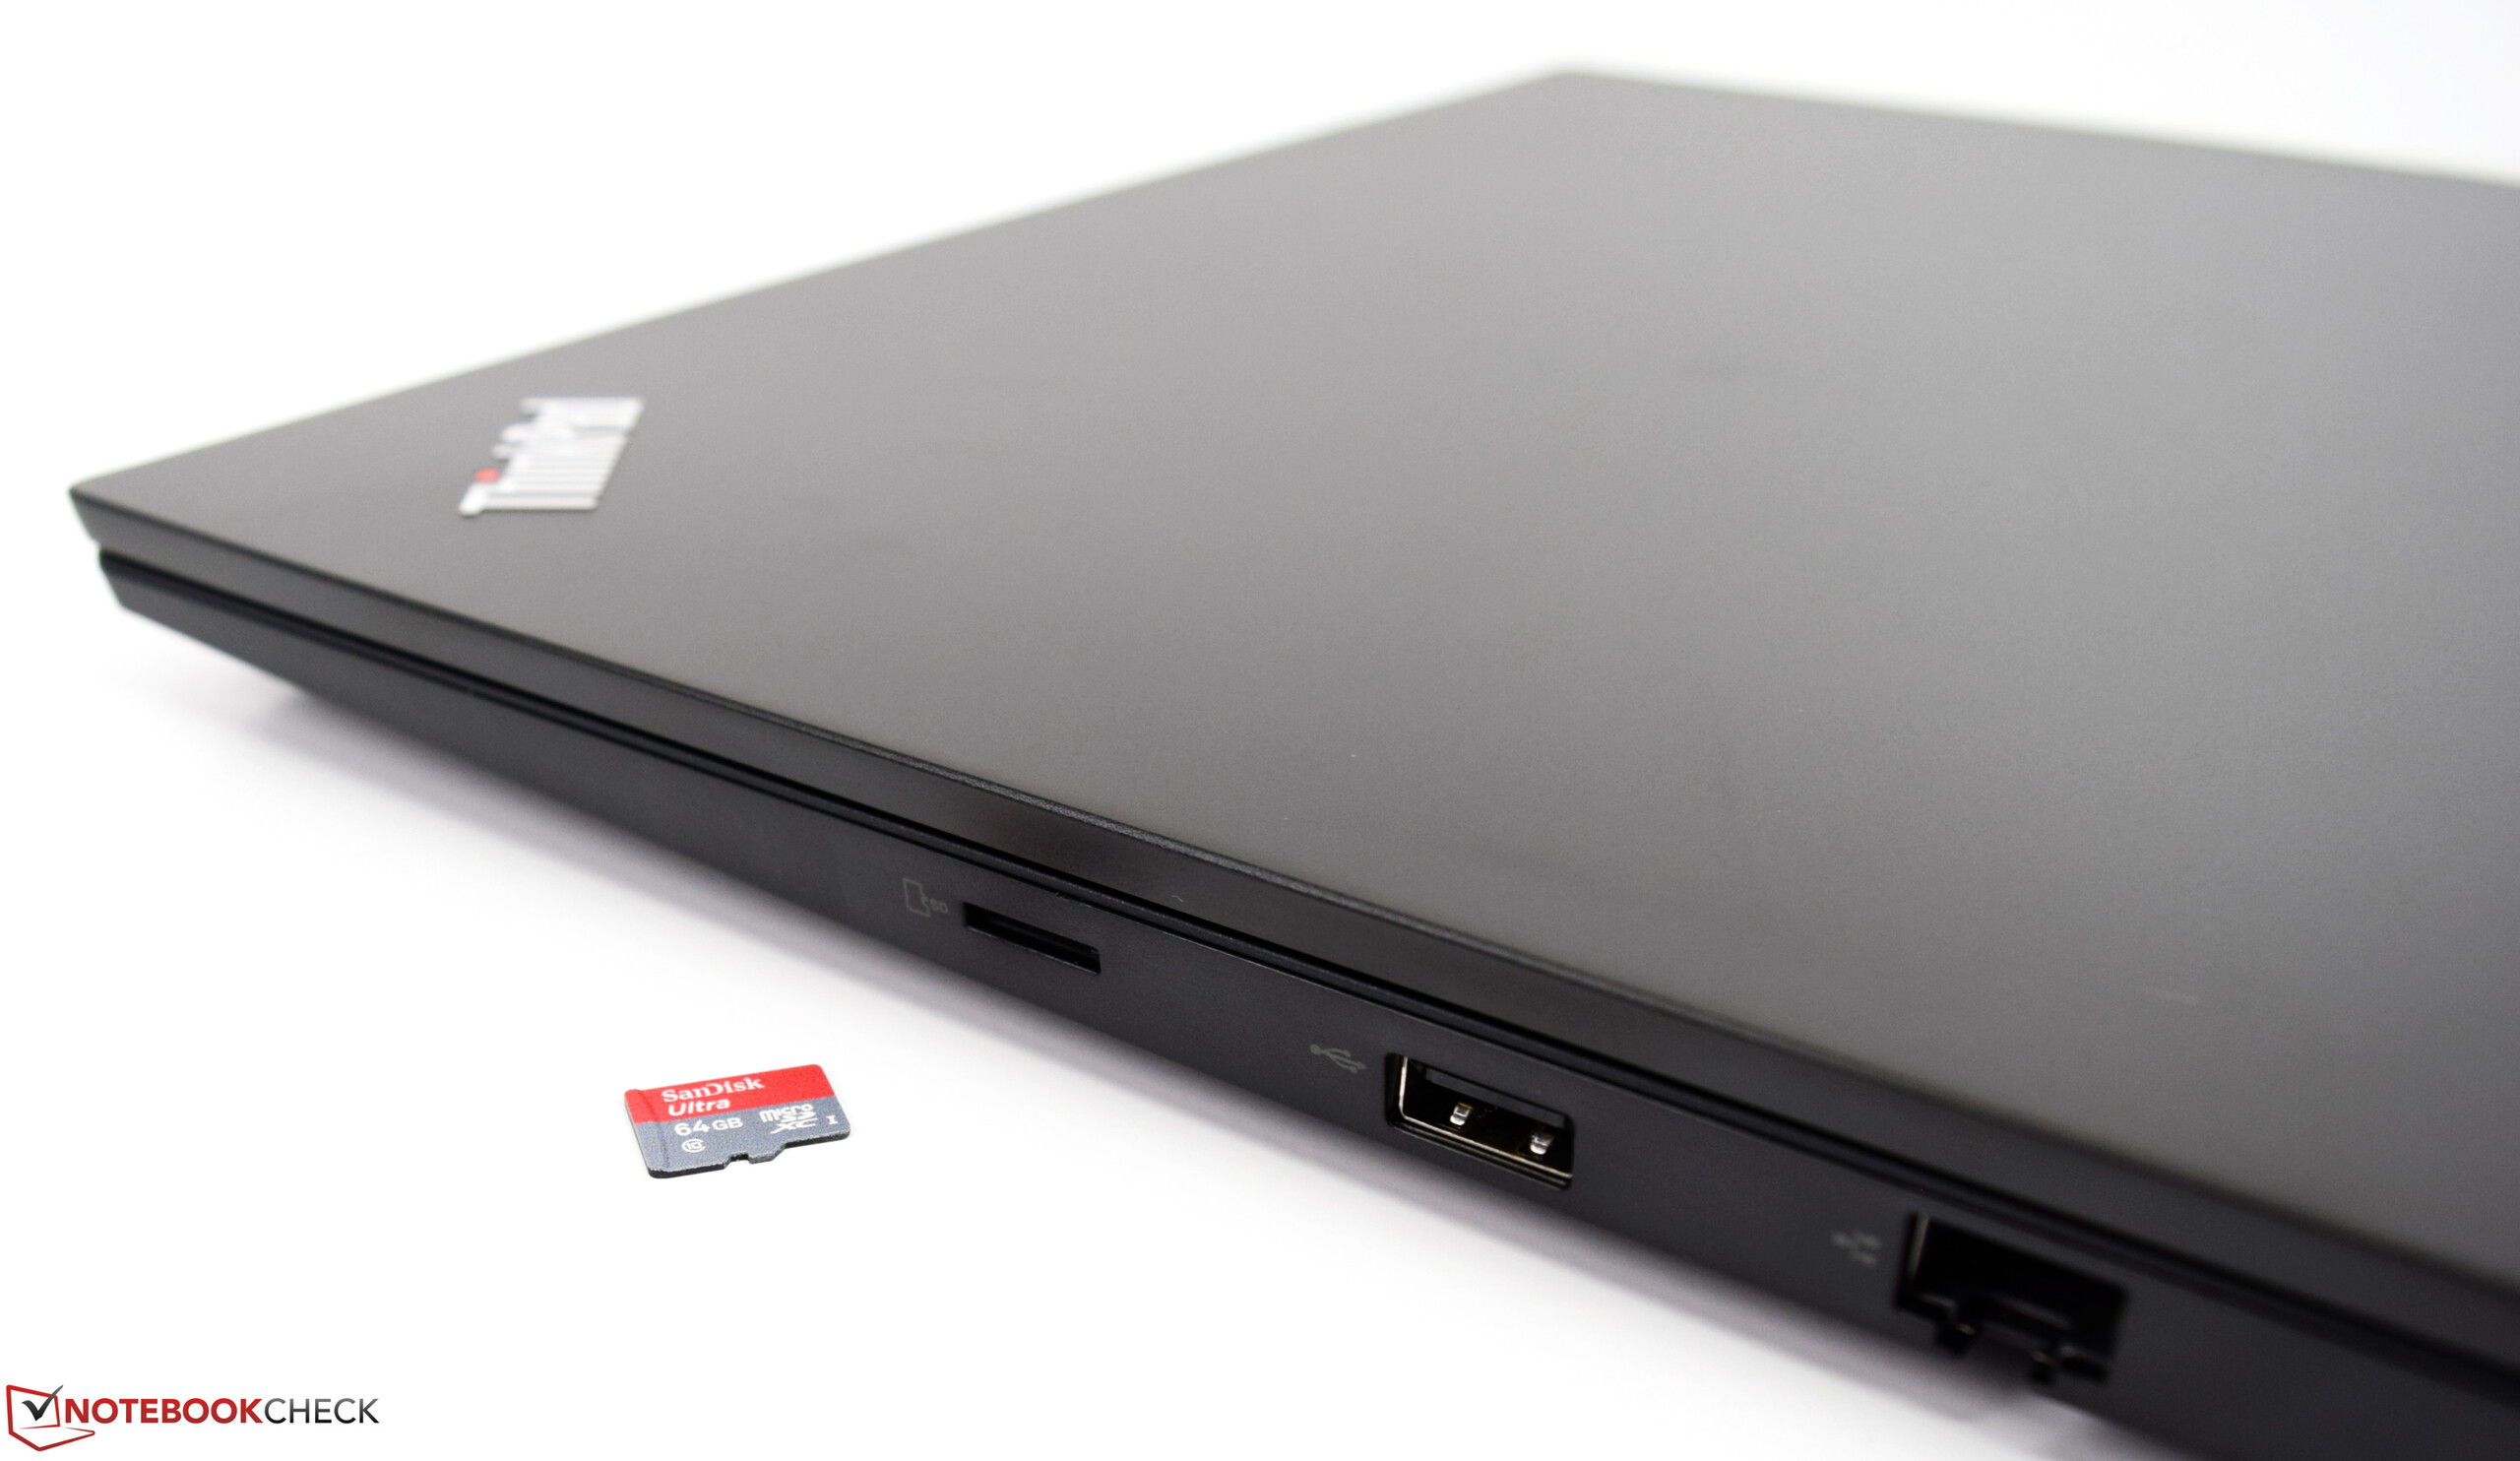
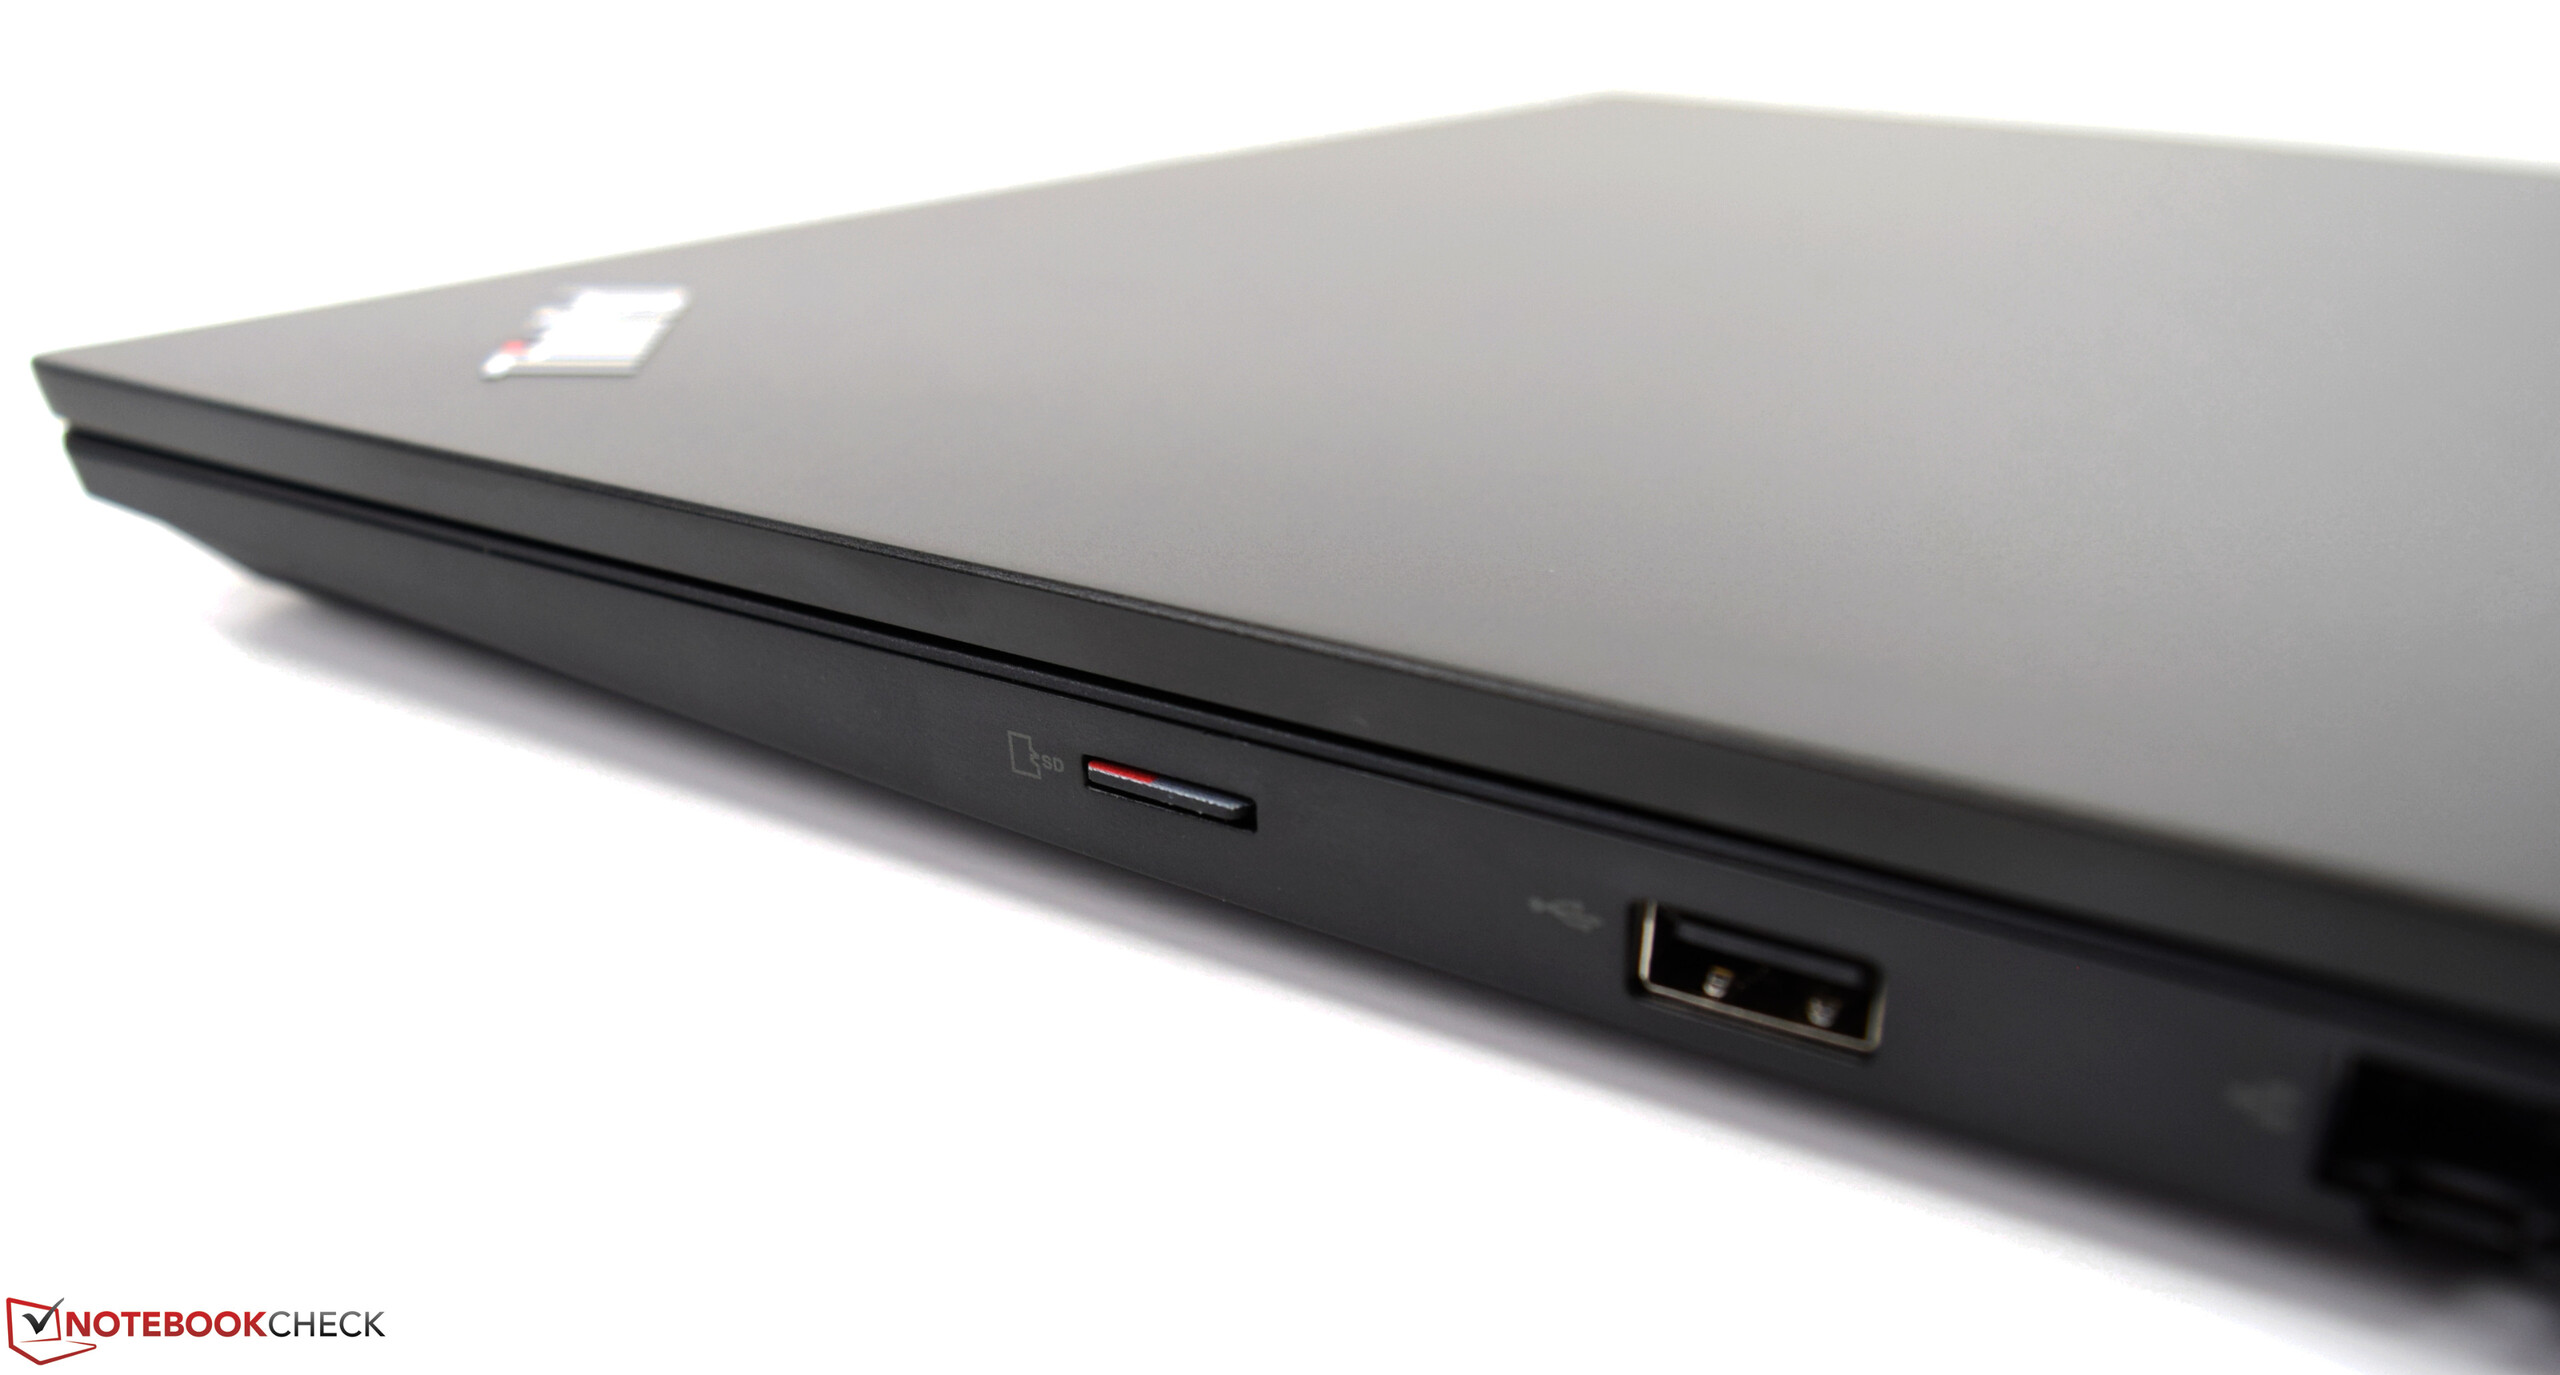
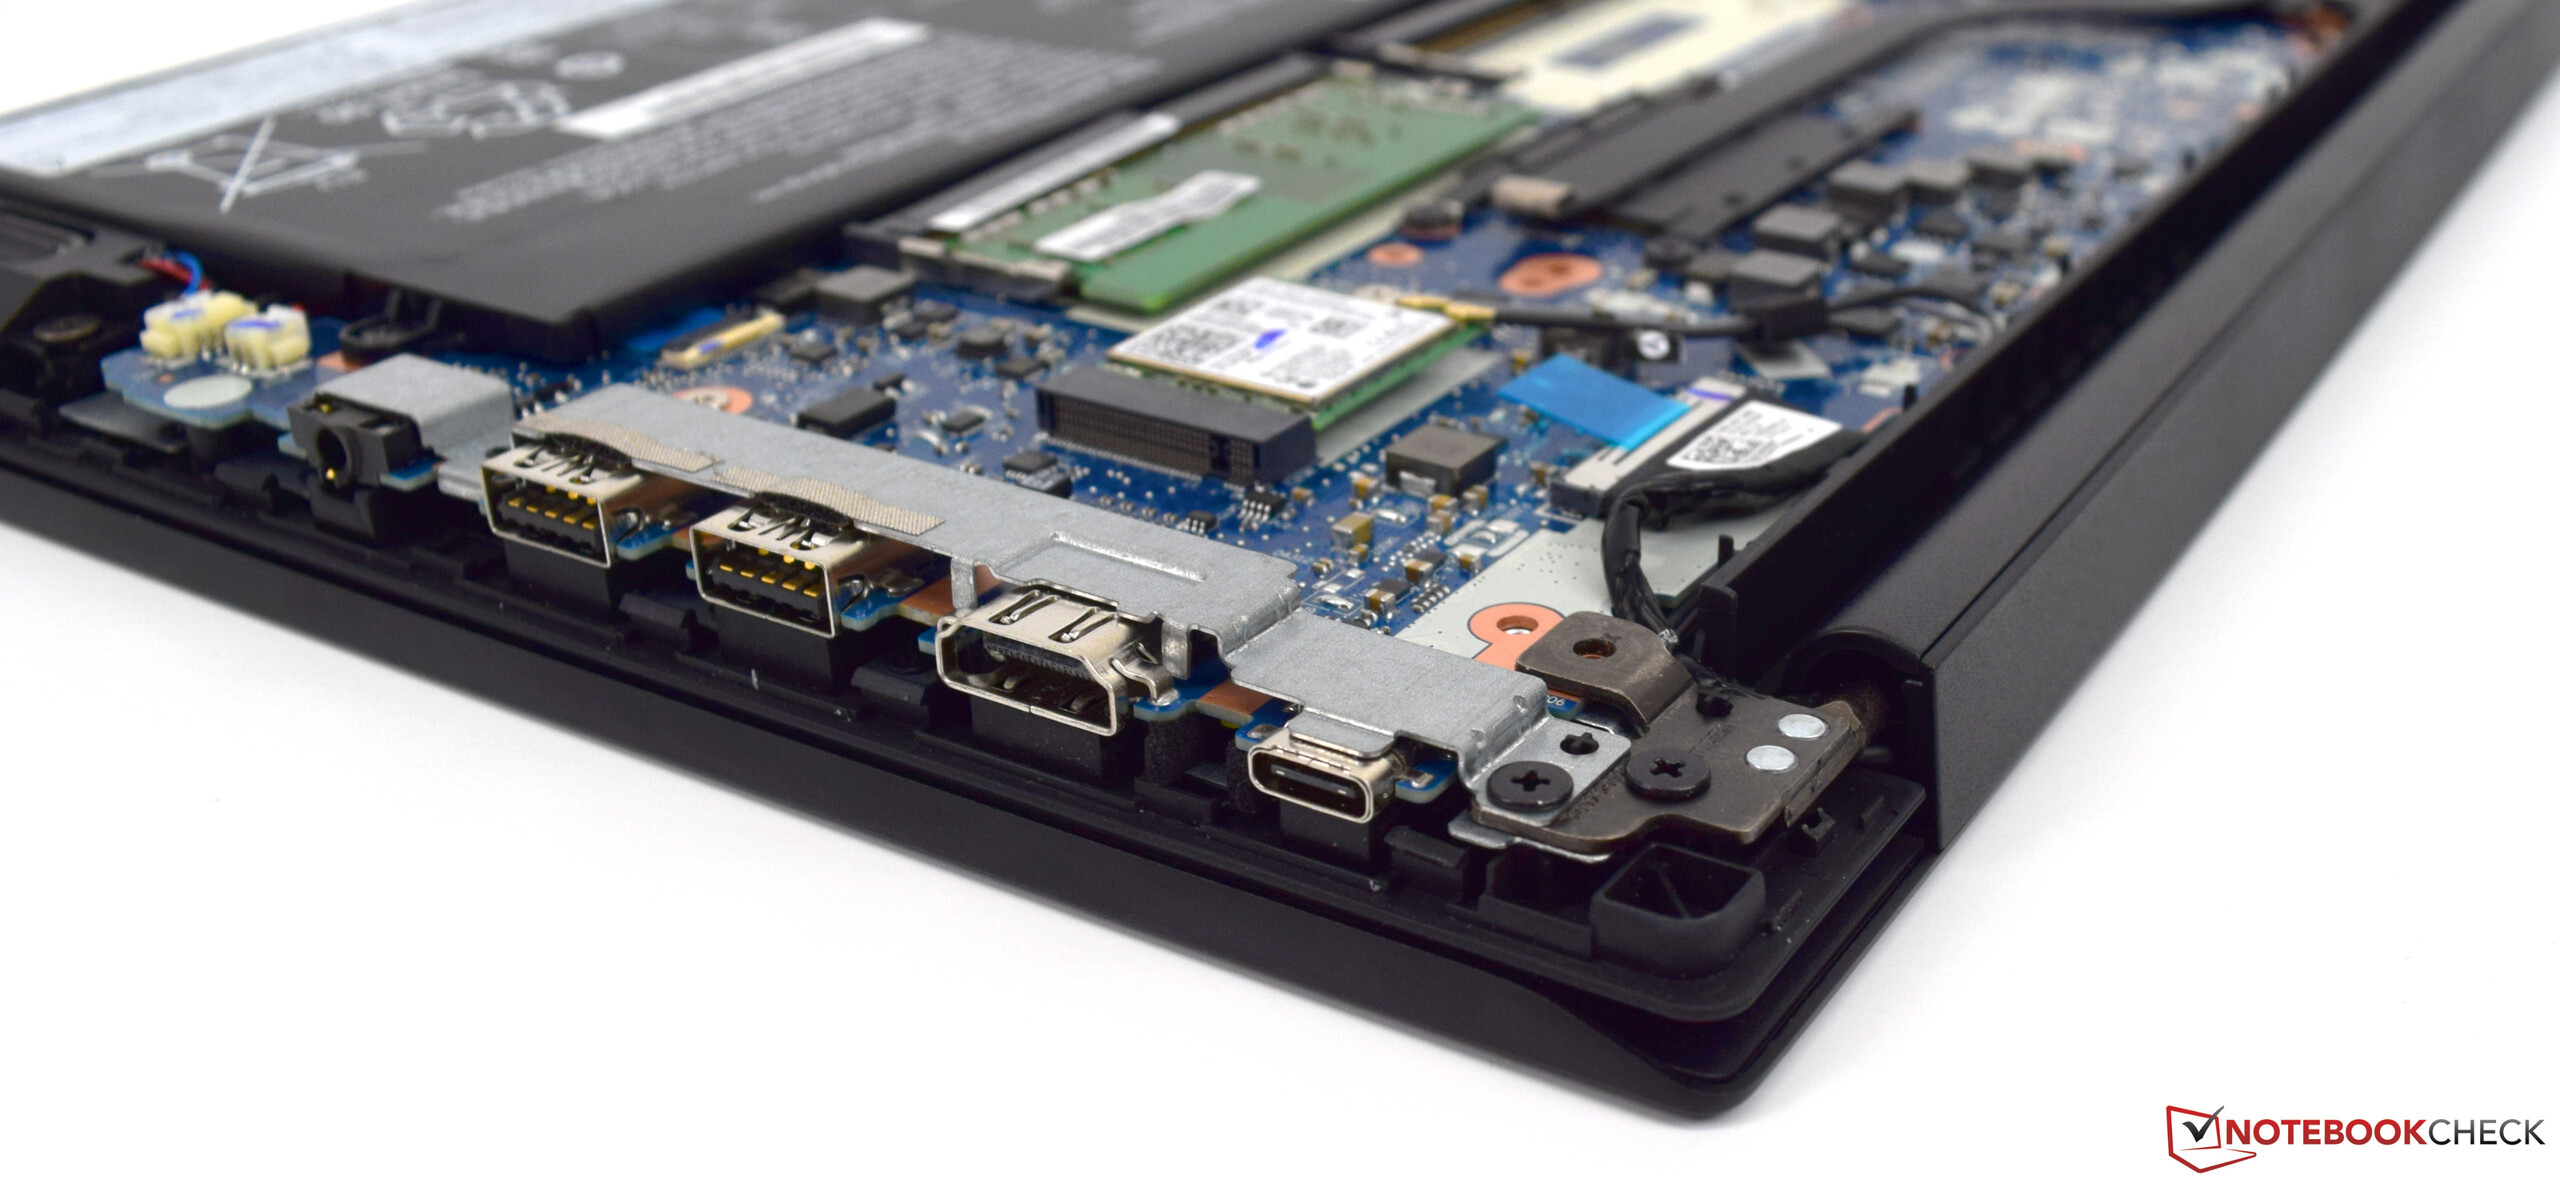
| SD Card Reader | |
| average JPG Copy Test (av. of 3 runs) | |
| HP ProBook 440 G5-3KX87ES (Toshiba Exceria Pro SDXC 64 GB UHS-II) | |
| Schenker Slim 14 L17 (Toshiba Exceria Pro SDXC 64 GB UHS-II) | |
| Lenovo ThinkPad E480-20KQS00000 (Toshiba Exceria Pro M501) | |
| Lenovo ThinkPad E480-20KNCTO1WW (Toshiba Exceria Pro M501) | |
| Moyenne de la classe Office (19.8 - 198.5, n=22, 2 dernières années) | |
| Asus VivoBook S14 S406UA-BV023T (Toshiba Exceria Pro M501 microSDXC 64GB) | |
| Acer TravelMate P449-G2-M-56CD (Toshiba Exceria Pro SDXC 64 GB UHS-II) | |
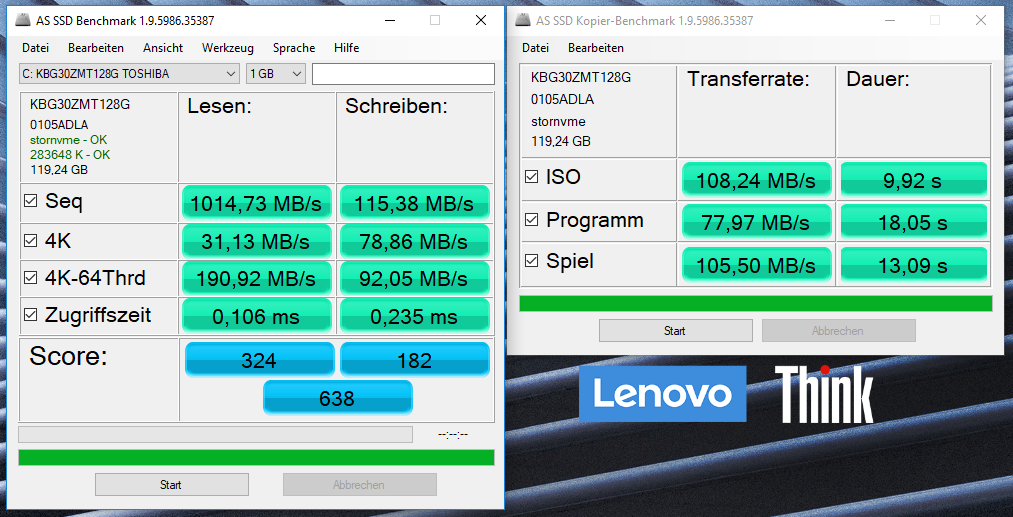
| maximum AS SSD Seq Read Test (1GB) | |
| HP ProBook 440 G5-3KX87ES (Toshiba Exceria Pro SDXC 64 GB UHS-II) | |
| Lenovo ThinkPad E480-20KNCTO1WW (Toshiba Exceria Pro M501) | |
| Schenker Slim 14 L17 (Toshiba Exceria Pro SDXC 64 GB UHS-II) | |
| Lenovo ThinkPad E480-20KQS00000 (Toshiba Exceria Pro M501) | |
| Moyenne de la classe Office (27.4 - 249, n=21, 2 dernières années) | |
| Asus VivoBook S14 S406UA-BV023T (Toshiba Exceria Pro M501 microSDXC 64GB) | |
| Acer TravelMate P449-G2-M-56CD (Toshiba Exceria Pro SDXC 64 GB UHS-II) | |
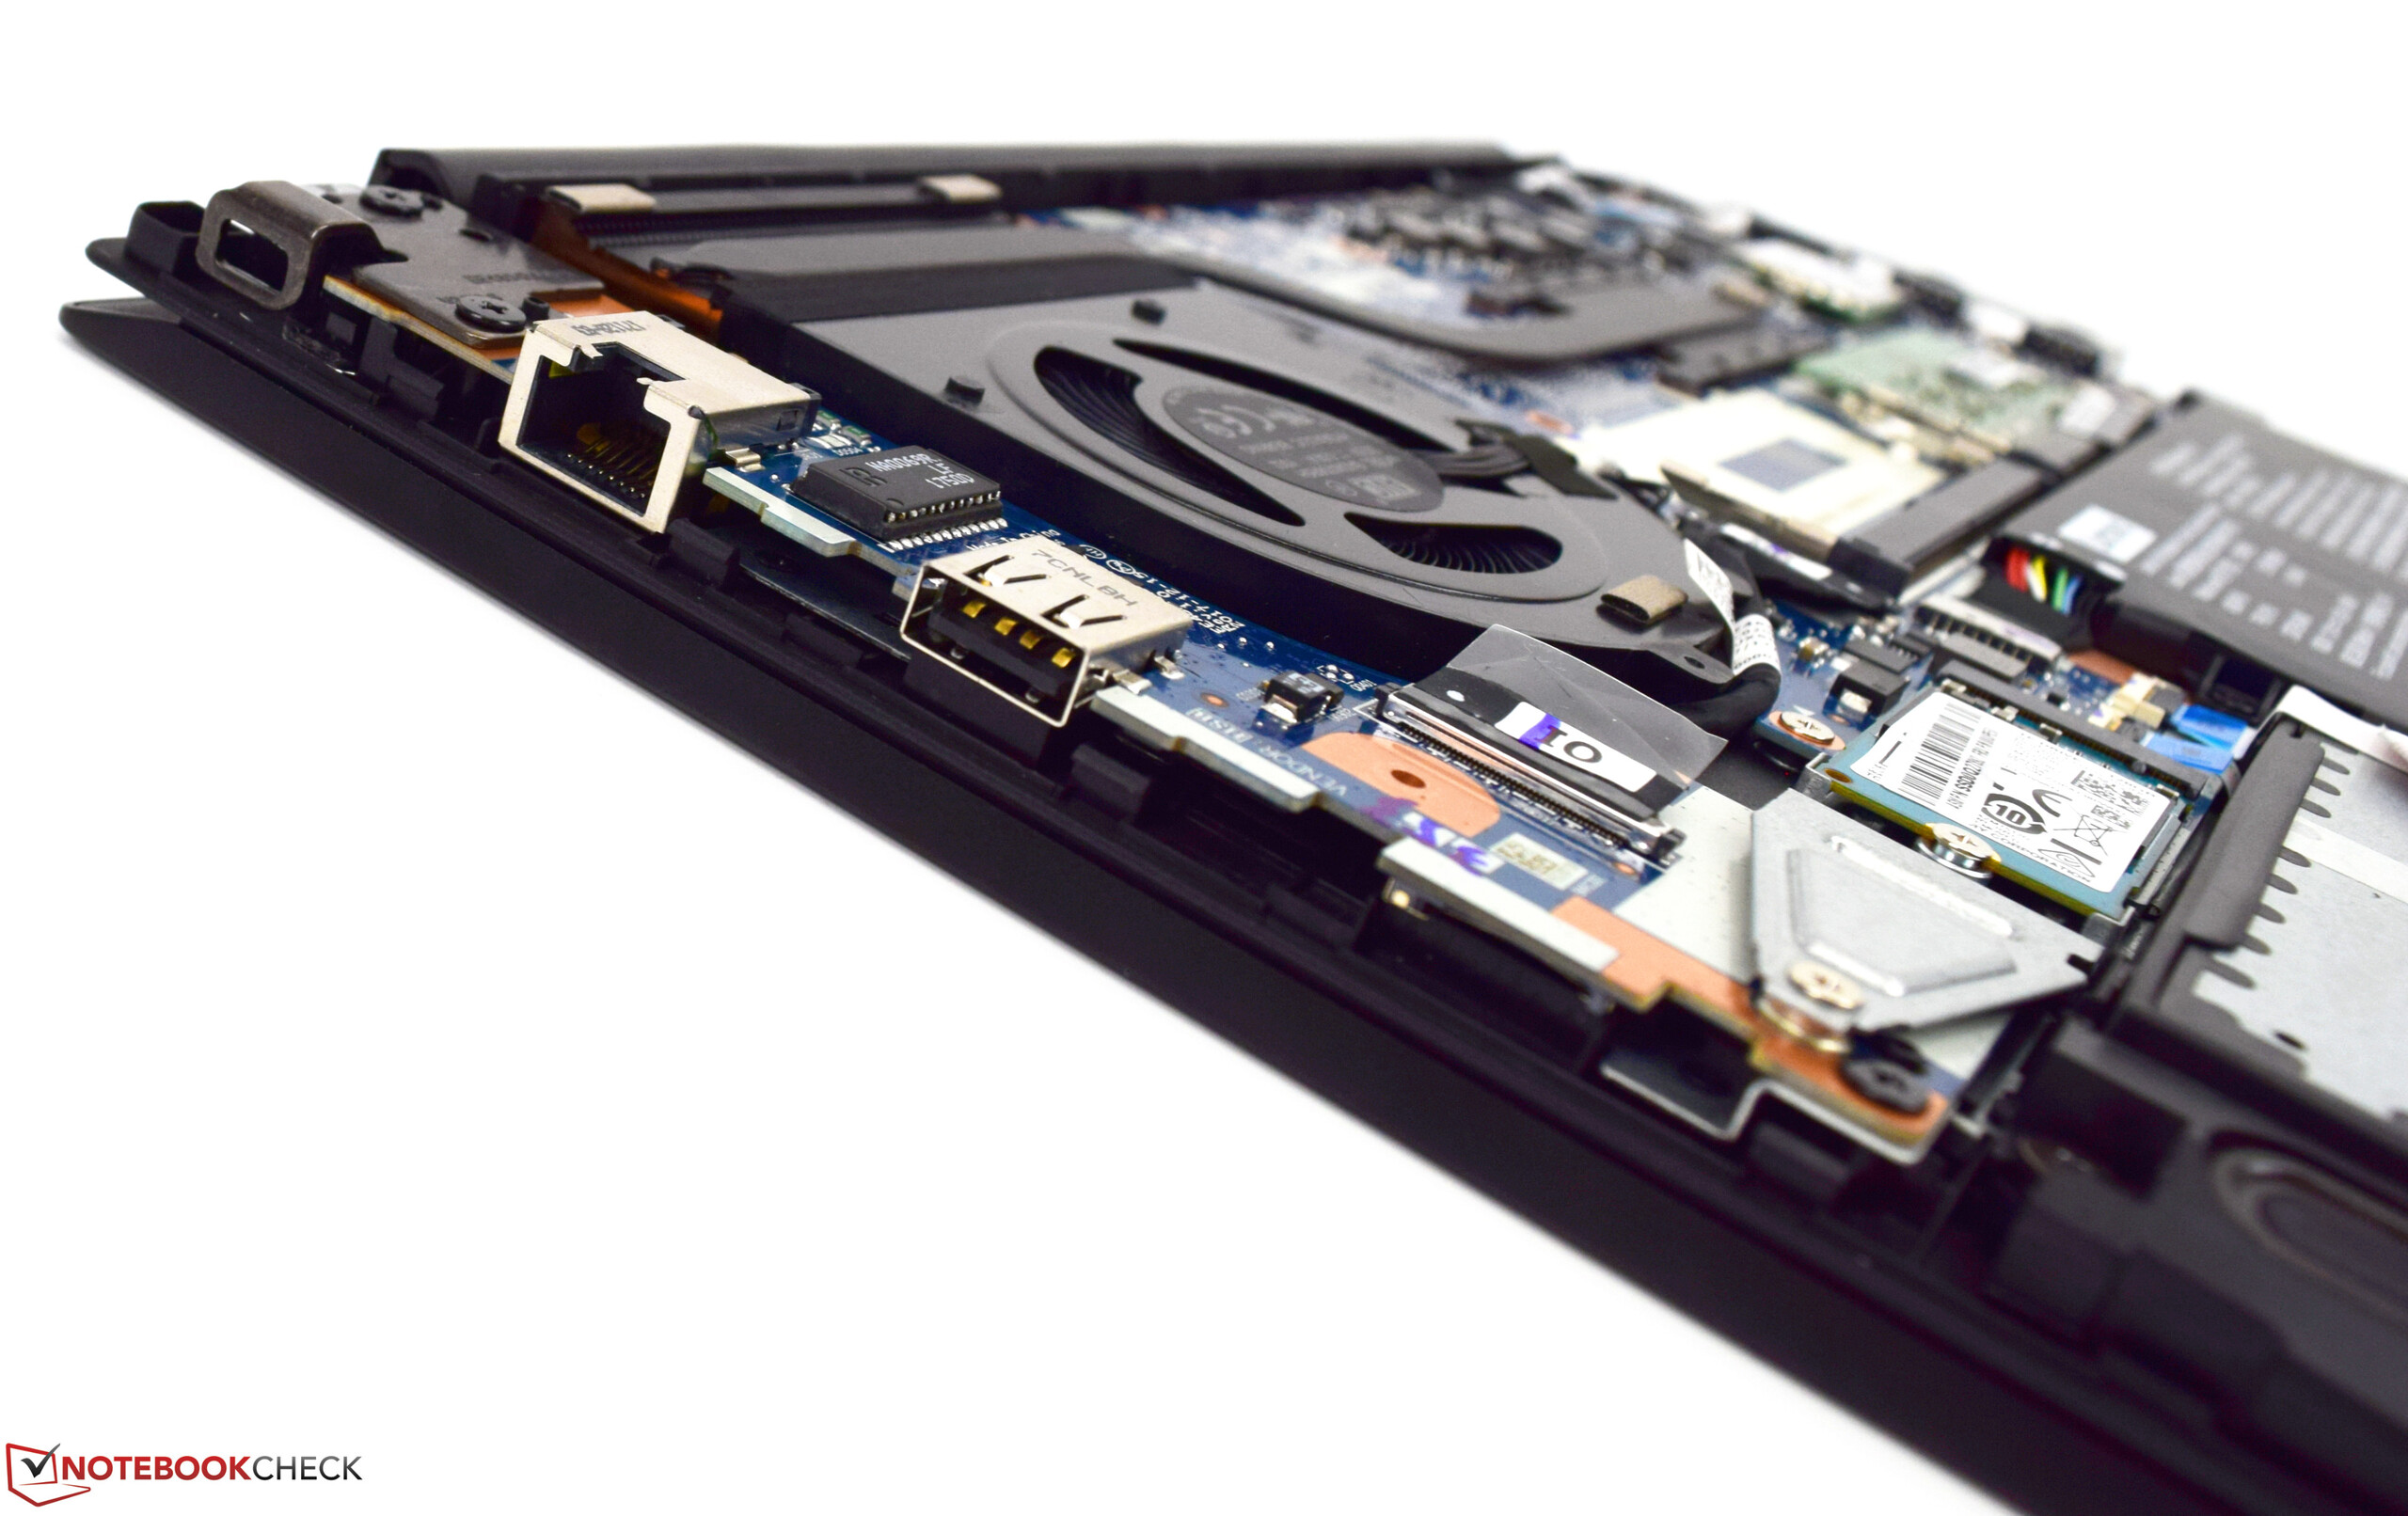
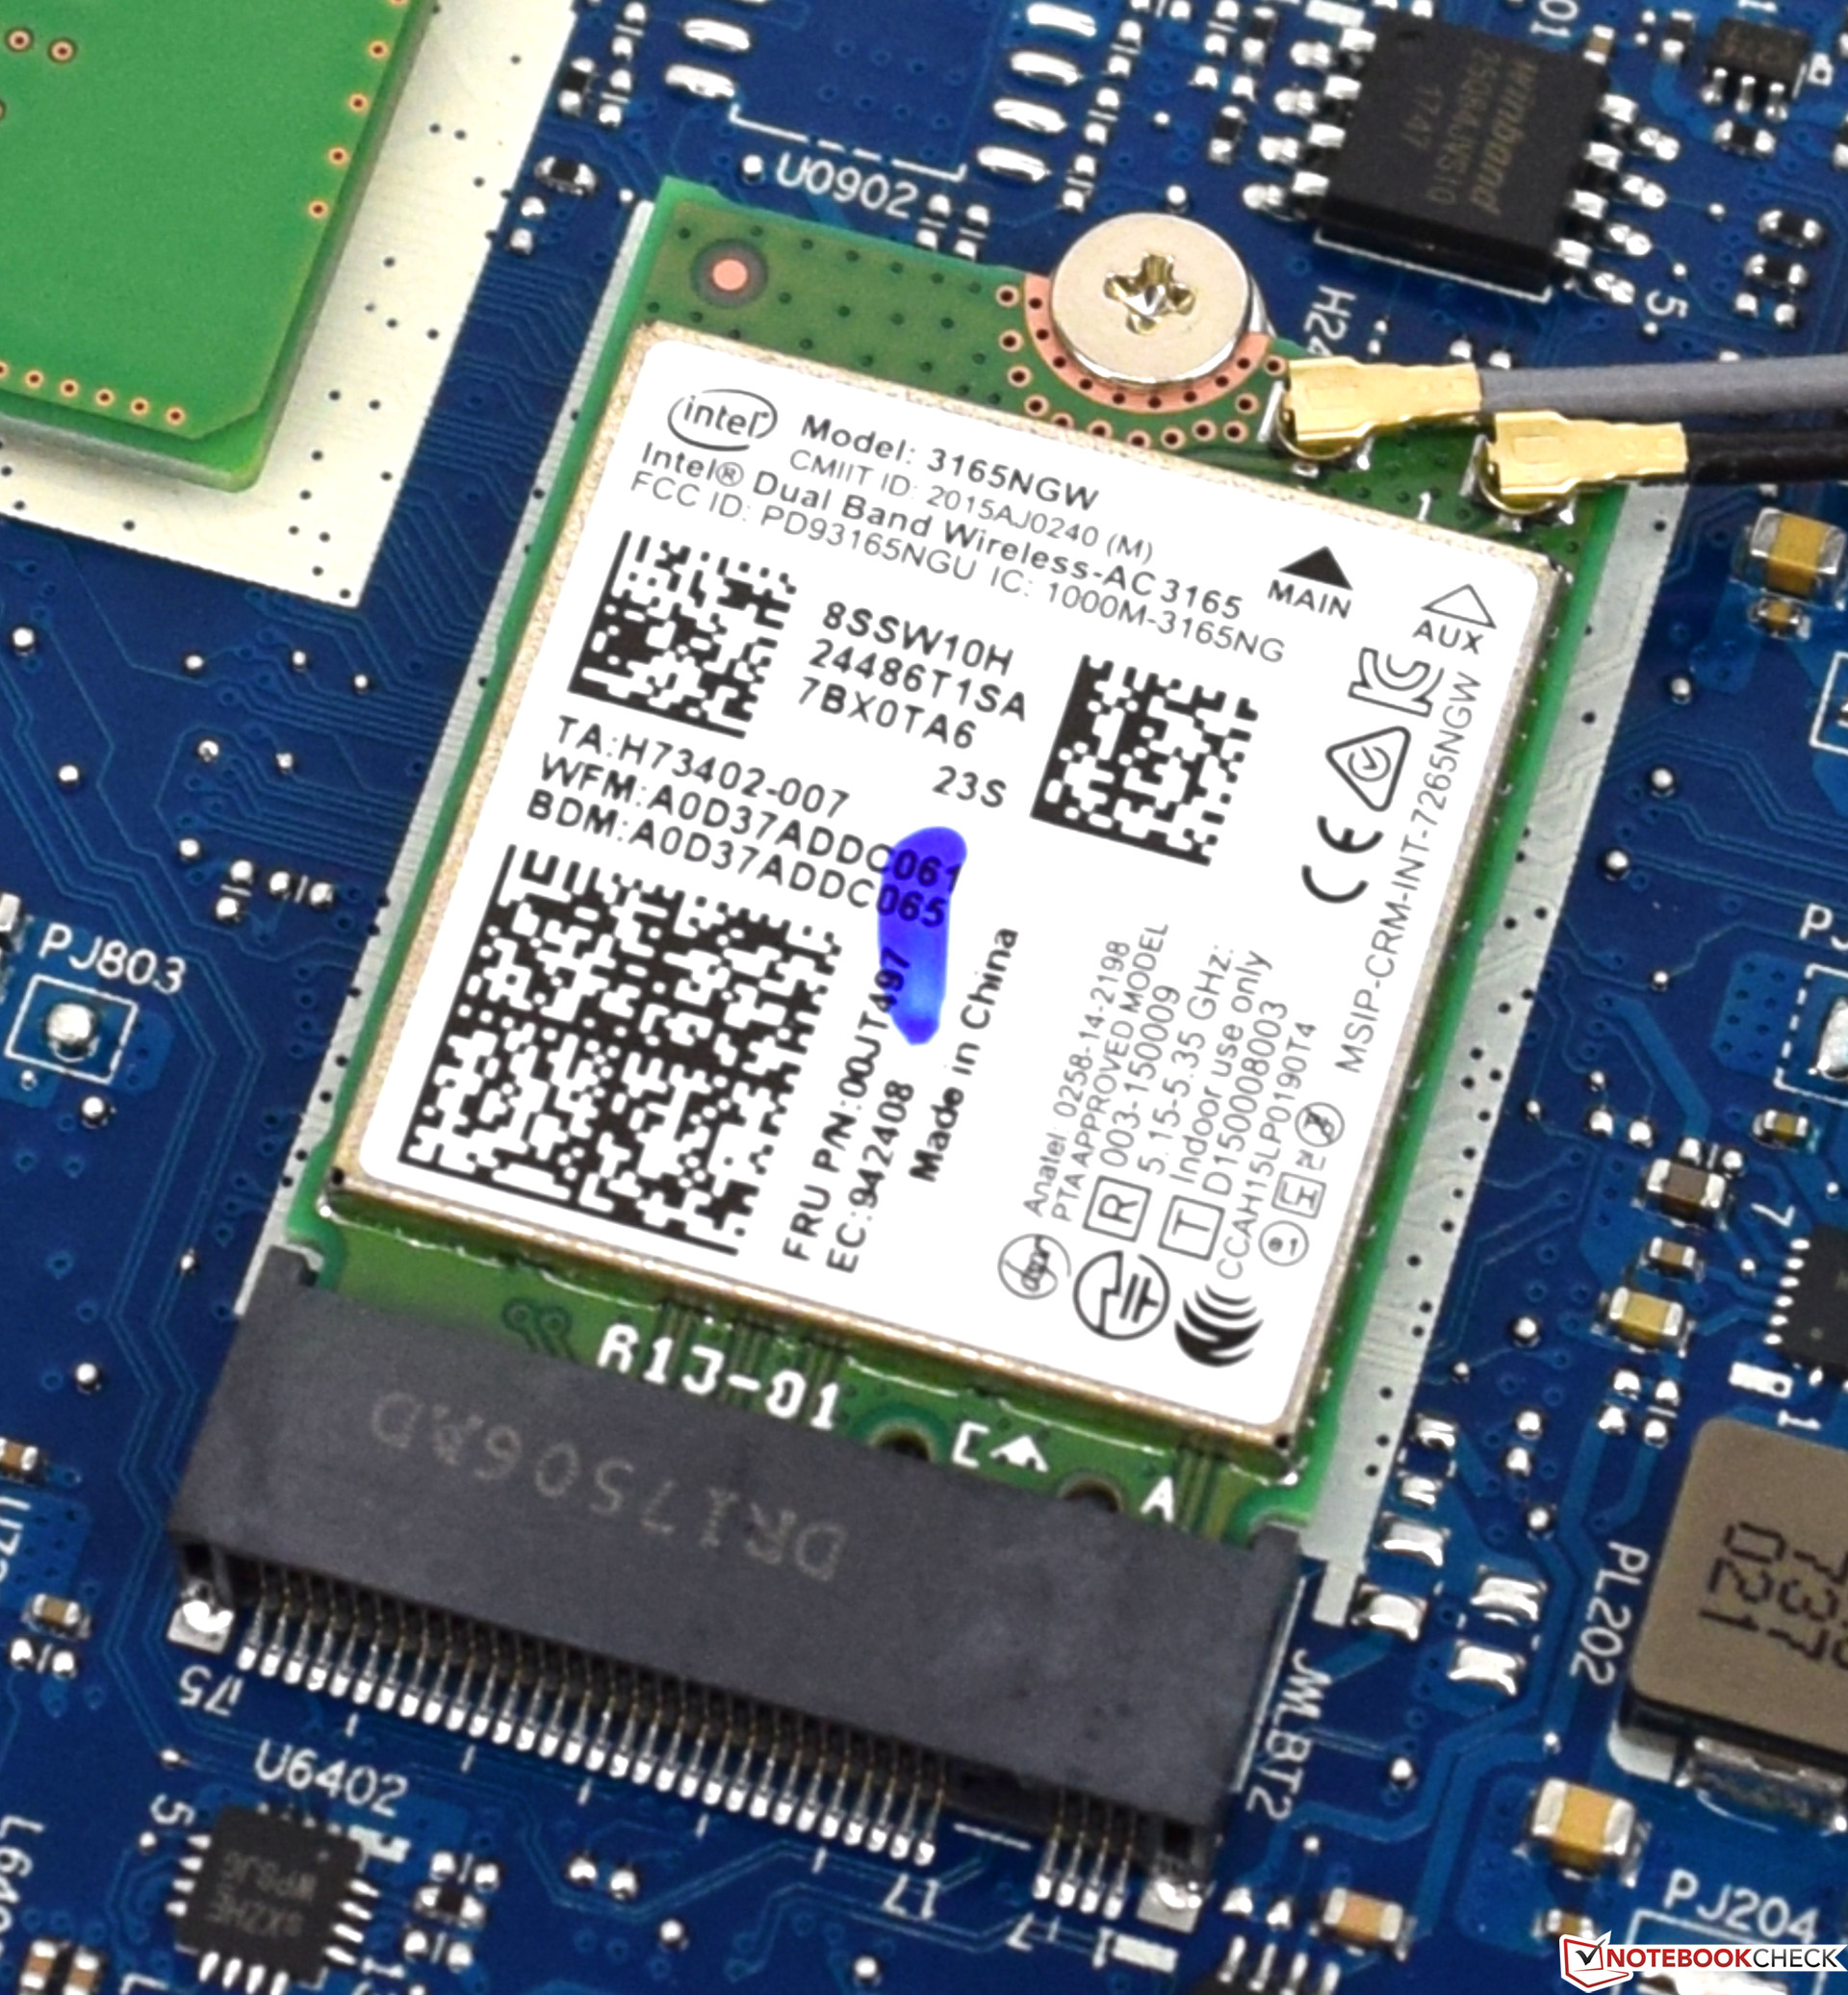
| Networking | |
| iperf3 transmit AX12 | |
| Lenovo ThinkPad E470 | |
| Acer TravelMate P449-G2-M-56CD | |
| HP ProBook 440 G5-3KX87ES | |
| Lenovo ThinkPad E480-20KQS00000 | |
| Schenker Slim 14 L17 | |
| Asus VivoBook S14 S406UA-BV023T | |
| Lenovo ThinkPad E480-20KNCTO1WW | |
| iperf3 receive AX12 | |
| Lenovo ThinkPad E480-20KQS00000 | |
| HP ProBook 440 G5-3KX87ES | |
| Schenker Slim 14 L17 | |
| Acer TravelMate P449-G2-M-56CD | |
| Lenovo ThinkPad E470 | |
| Asus VivoBook S14 S406UA-BV023T | |
| Lenovo ThinkPad E480-20KNCTO1WW | |
| |||||||||||||||||||||||||
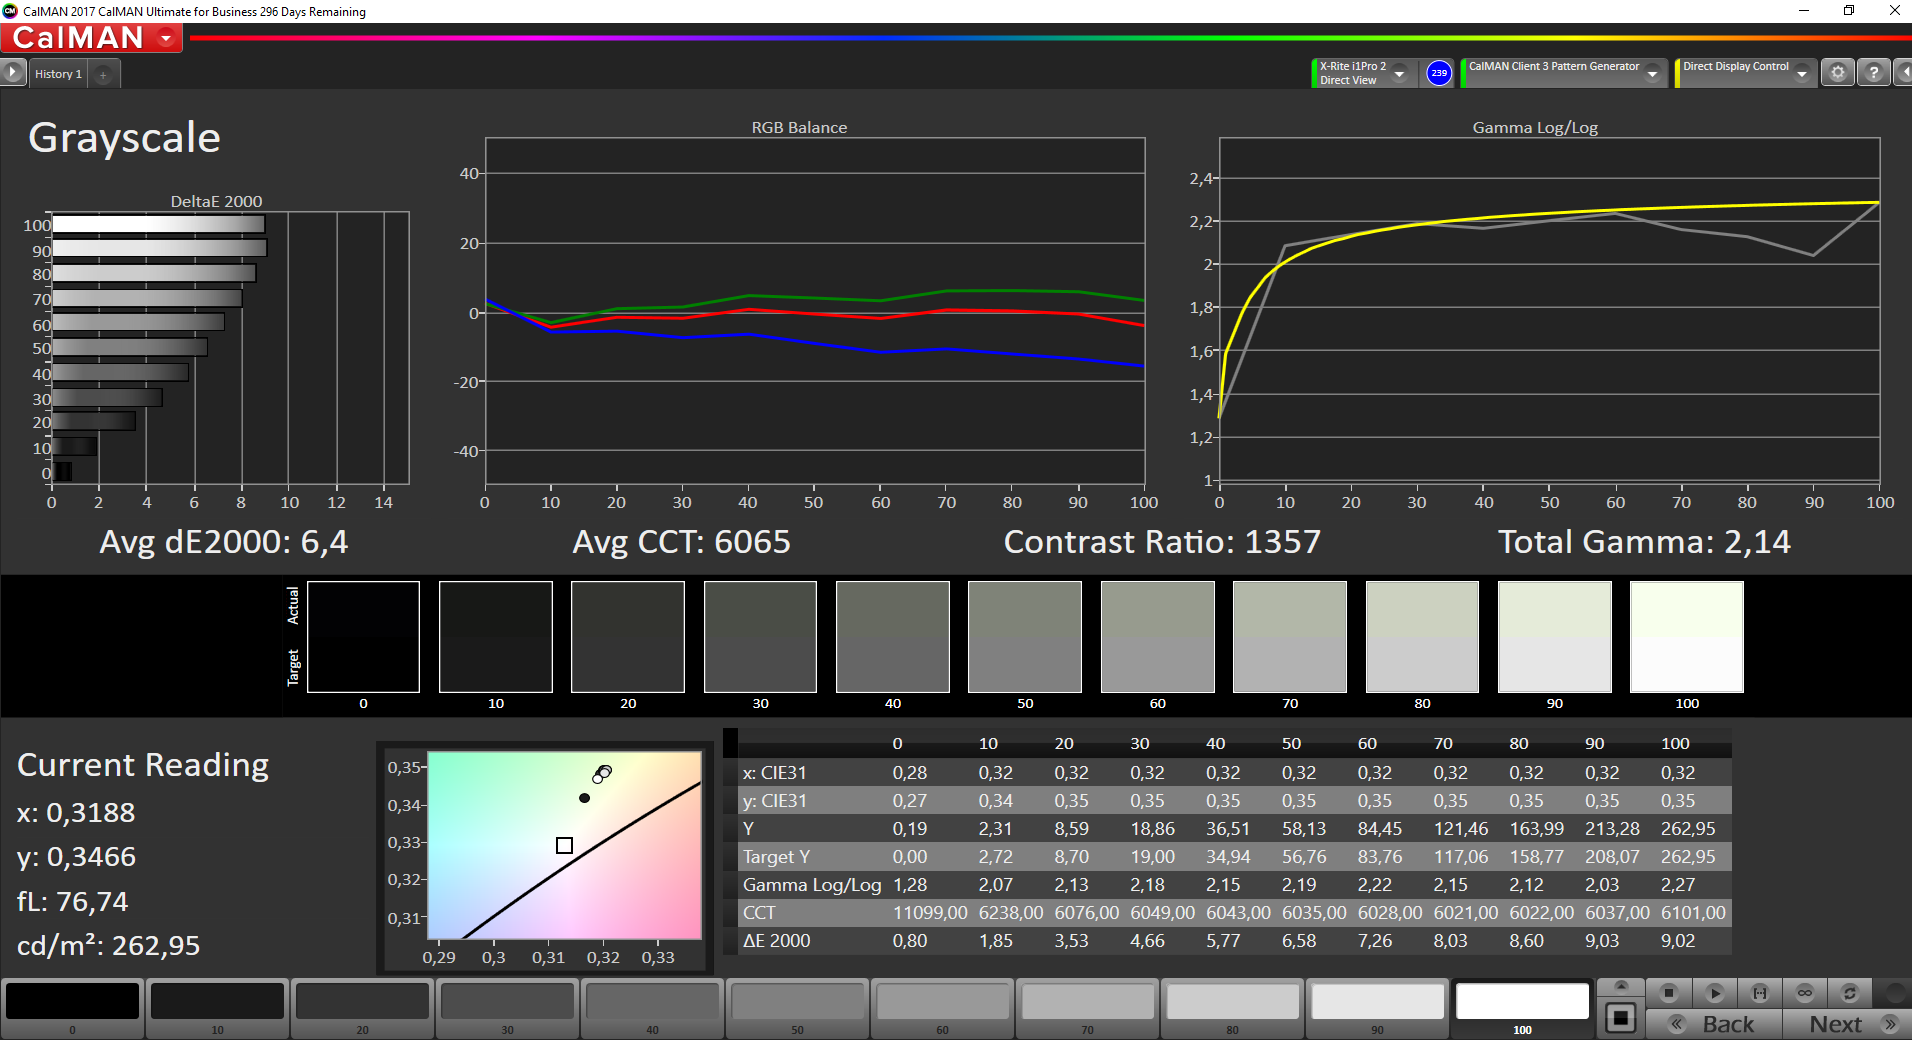
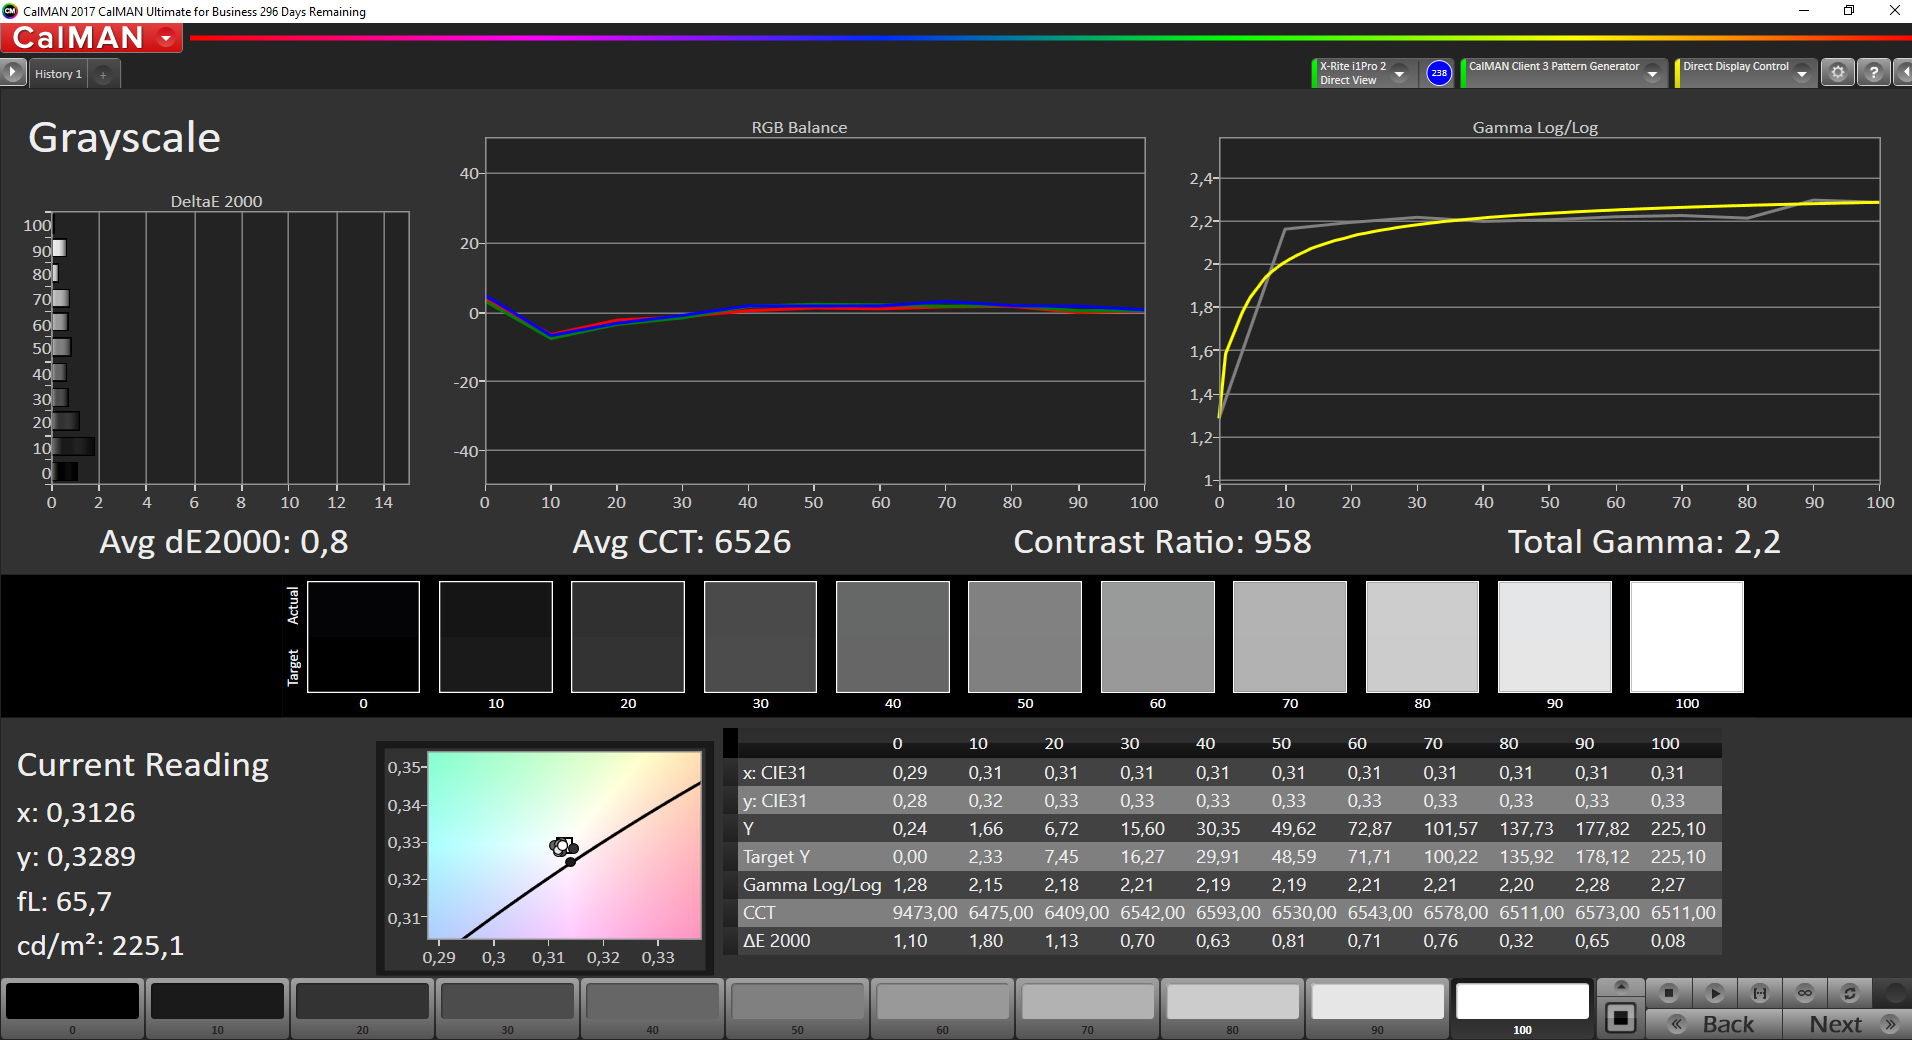
Homogénéité de la luminosité: 83 %
Valeur mesurée au centre, sur batterie: 262 cd/m²
Contraste: 1379:1 (Valeurs des noirs: 0.19 cd/m²)
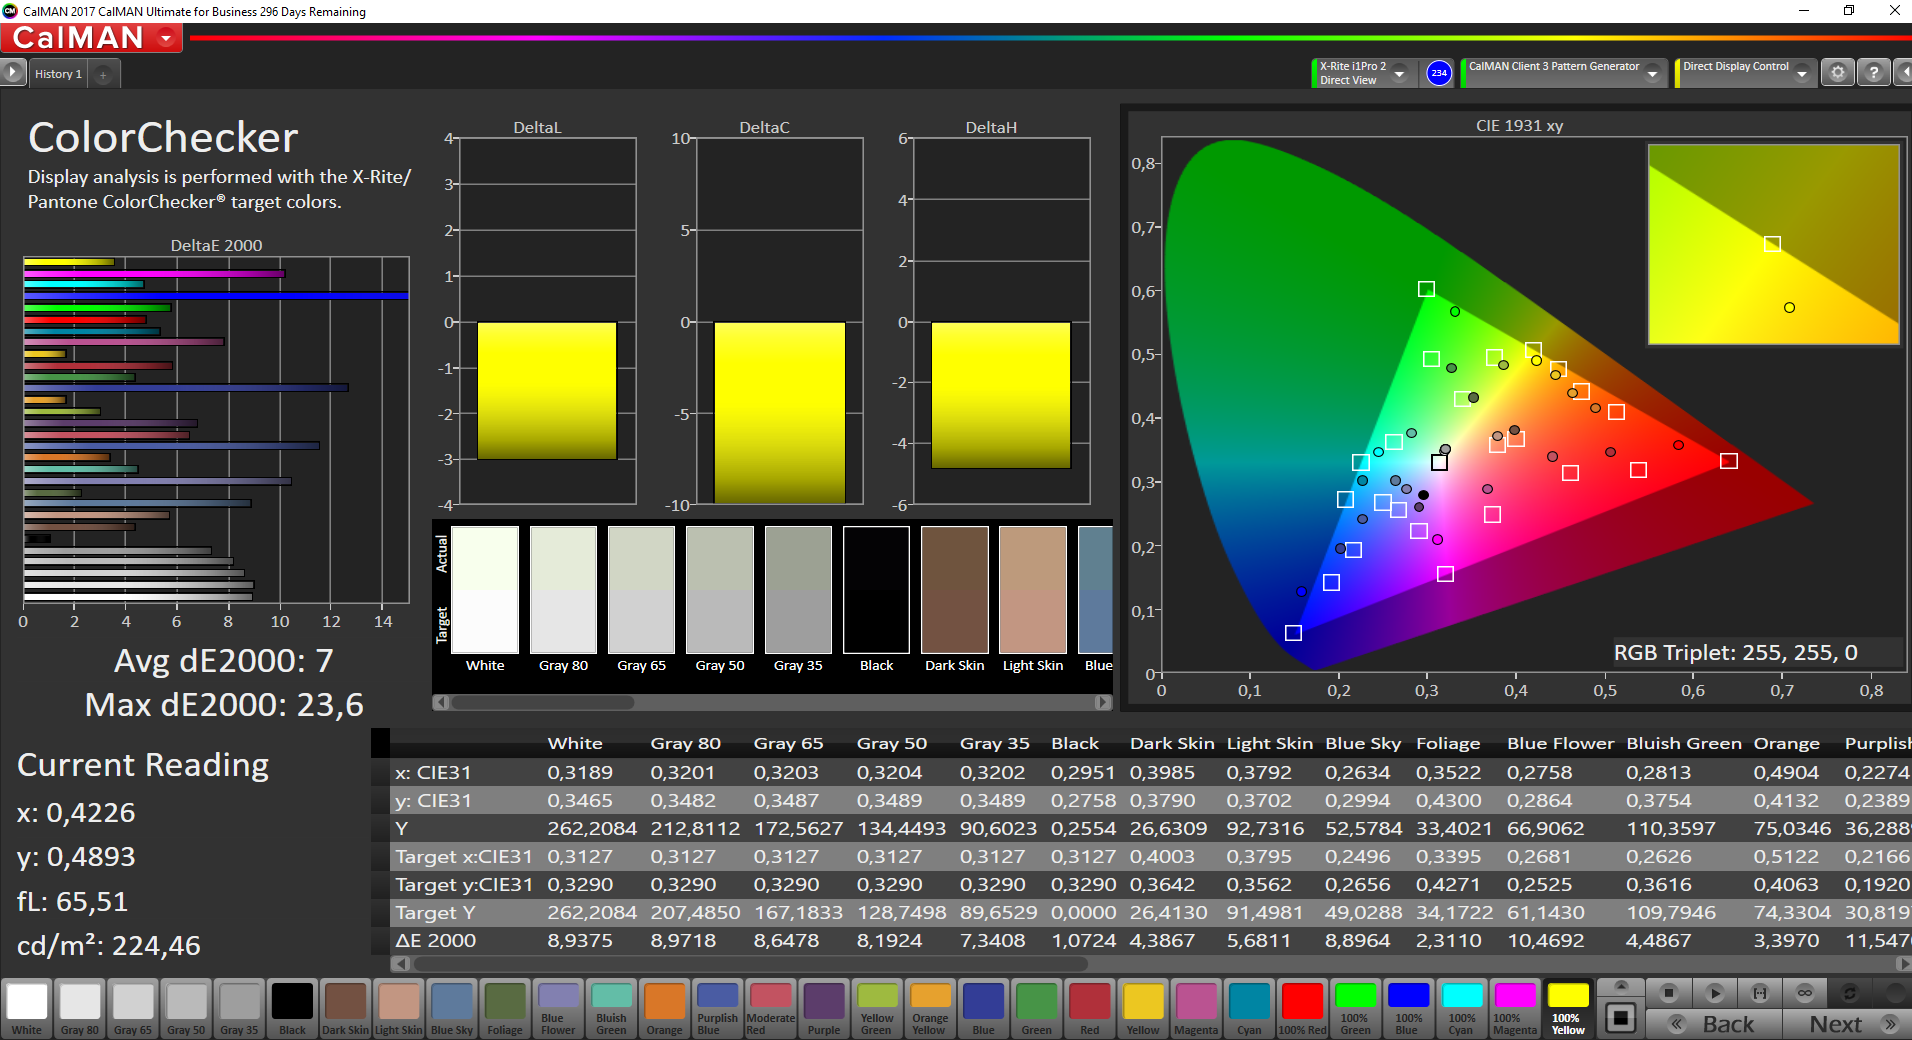
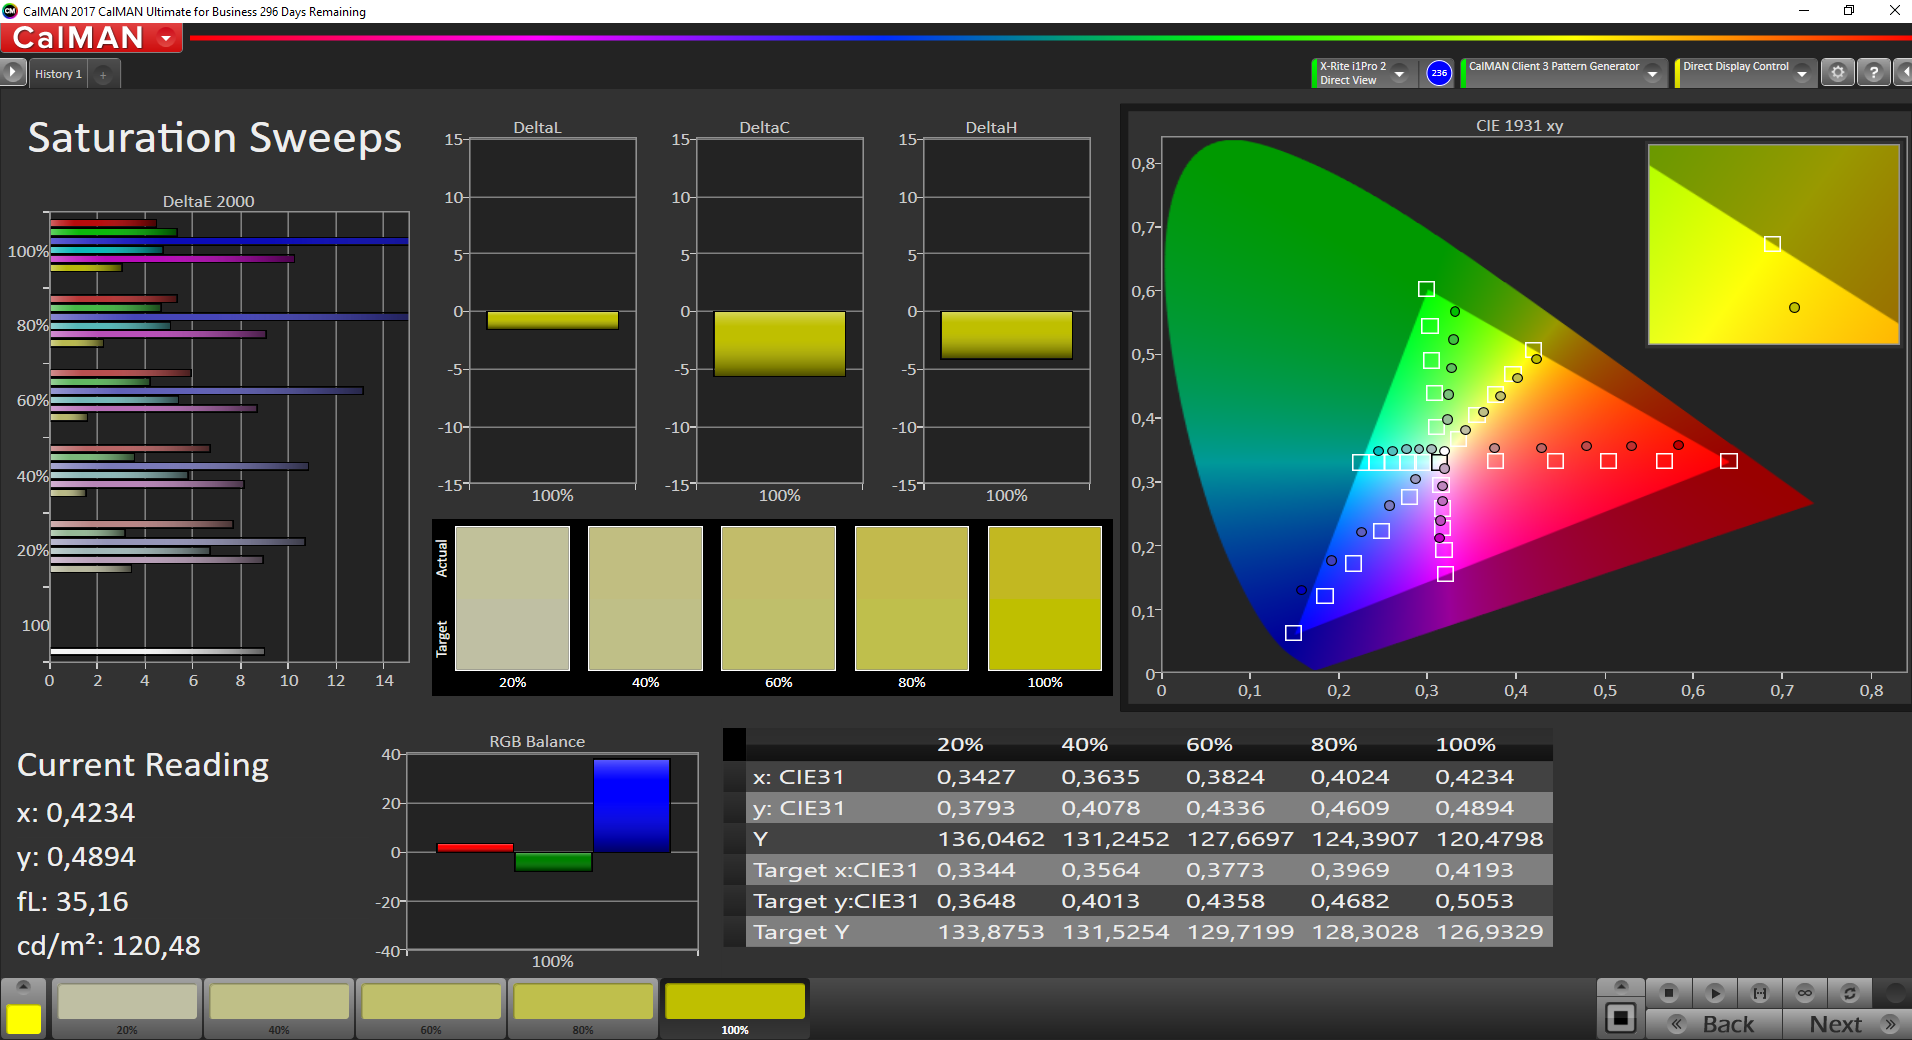
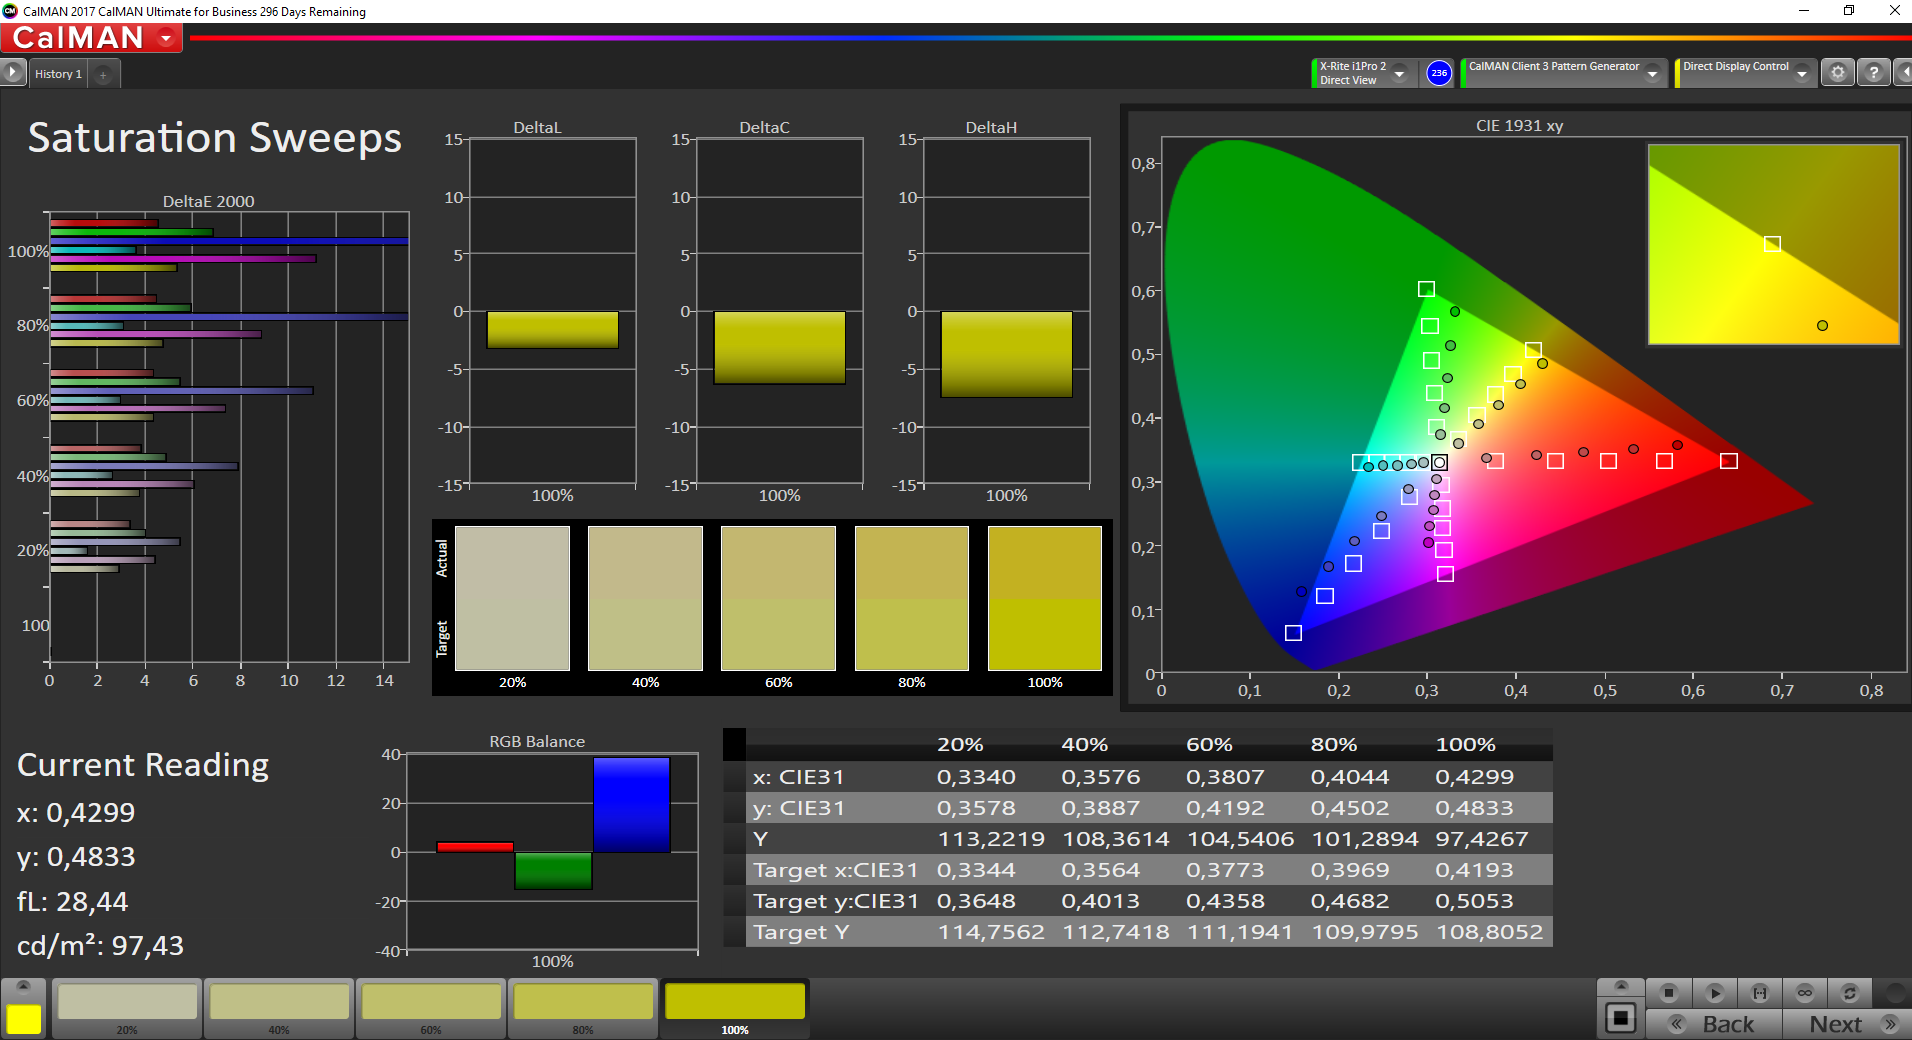
ΔE ColorChecker Calman: 7 | ∀{0.5-29.43 Ø4.72}
ΔE Greyscale Calman: 6.4 | ∀{0.09-98 Ø4.97}
61.9% sRGB (Argyll 1.6.3 3D)
39.5% AdobeRGB 1998 (Argyll 1.6.3 3D)
42.96% AdobeRGB 1998 (Argyll 3D)
62.2% sRGB (Argyll 3D)
41.56% Display P3 (Argyll 3D)
Gamma: 2.14
CCT: 6065 K
| Lenovo ThinkPad E480-20KNCTO1WW Innolux N140HCA-EAC, 1920x1080, 14" | Lenovo ThinkPad E480-20KQS00000 Innolux N140HCA-EAC, 1920x1080, 14" | HP ProBook 440 G5-3KX87ES LGD04B2, 1920x1080, 14" | Lenovo ThinkPad E470 NT140WHM-N41, 1366x768, 14" | Acer TravelMate P449-G2-M-56CD N140HCA-EAB, 1920x1080, 14" | Schenker Slim 14 L17 LG Philips LGD046D, 1920x1080, 14" | Asus VivoBook S14 S406UA-BV023T BOE CQ NT140WHM-N44, 1366x768, 14" | |
|---|---|---|---|---|---|---|---|
| Display | 1% | -5% | -6% | -1% | 47% | -7% | |
| Display P3 Coverage (%) | 41.56 | 41.88 1% | 39.56 -5% | 39.13 -6% | 41.04 -1% | 66.1 59% | 38.82 -7% |
| sRGB Coverage (%) | 62.2 | 62.8 1% | 59.3 -5% | 58.3 -6% | 61.2 -2% | 85.2 37% | 58.2 -6% |
| AdobeRGB 1998 Coverage (%) | 42.96 | 43.29 1% | 40.88 -5% | 40.43 -6% | 42.47 -1% | 62.3 45% | 40.11 -7% |
| Response Times | 1% | 10% | 29% | 12% | 13% | 32% | |
| Response Time Grey 50% / Grey 80% * (ms) | 44.8 ? | 44 ? 2% | 40 ? 11% | 44 ? 2% | 39 ? 13% | 37.6 ? 16% | 42 ? 6% |
| Response Time Black / White * (ms) | 31.2 ? | 31.2 ? -0% | 28.8 ? 8% | 14 ? 55% | 28 ? 10% | 28 ? 10% | 13 ? 58% |
| PWM Frequency (Hz) | 25000 ? | 24880 ? | 200 ? | 25000 ? | 20490 ? | 200 ? | |
| Screen | 10% | -3% | -36% | -6% | 17% | -28% | |
| Brightness middle (cd/m²) | 262 | 251 -4% | 236 -10% | 209 -20% | 271 3% | 326 24% | 215 -18% |
| Brightness (cd/m²) | 245 | 231 -6% | 221 -10% | 208 -15% | 256 4% | 320 31% | 208 -15% |
| Brightness Distribution (%) | 83 | 80 -4% | 88 6% | 81 -2% | 85 2% | 81 -2% | 81 -2% |
| Black Level * (cd/m²) | 0.19 | 0.19 -0% | 0.26 -37% | 0.58 -205% | 0.43 -126% | 0.31 -63% | 0.4 -111% |
| Contrast (:1) | 1379 | 1321 -4% | 908 -34% | 360 -74% | 630 -54% | 1052 -24% | 538 -61% |
| Colorchecker dE 2000 * | 7 | 5.1 27% | 5.7 19% | 8.12 -16% | 5.03 28% | 4.6 34% | 9.37 -34% |
| Colorchecker dE 2000 max. * | 23.6 | 10.6 55% | 22 7% | 15.18 36% | 11.9 50% | 10.3 56% | 15.84 33% |
| Greyscale dE 2000 * | 6.4 | 4.5 30% | 3.8 41% | 9.86 -54% | 4.02 37% | 4.4 31% | 10.52 -64% |
| Gamma | 2.14 103% | 2.18 101% | 2.1 105% | 2.37 93% | 2.31 95% | 2.24 98% | 2.45 90% |
| CCT | 6065 107% | 6146 106% | 7318 89% | 10218 64% | 6659 98% | 5978 109% | 11214 58% |
| Color Space (Percent of AdobeRGB 1998) (%) | 39.5 | 39.8 1% | 37.7 -5% | 37 -6% | 39 -1% | 55.8 41% | 37 -6% |
| Color Space (Percent of sRGB) (%) | 61.9 | 62.5 1% | 59.2 -4% | 58 -6% | 61 -1% | 85.1 37% | 58 -6% |
| Moyenne finale (programmes/paramètres) | 4% /
7% | 1% /
-2% | -4% /
-22% | 2% /
-3% | 26% /
22% | -1% /
-16% |
* ... Moindre est la valeur, meilleures sont les performances

Temps de réponse de l'écran
| ↔ Temps de réponse noir à blanc | ||
|---|---|---|
| 31.2 ms ... hausse ↗ et chute ↘ combinées | ↗ 17.2 ms hausse | 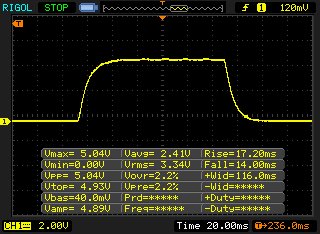 |
| ↘ 14 ms chute | ||
| L'écran souffre de latences très élevées, à éviter pour le jeu. En comparaison, tous les appareils testés affichent entre 0.1 (minimum) et 240 (maximum) ms. » 84 % des appareils testés affichent de meilleures performances. Cela signifie que les latences relevées sont moins bonnes que la moyenne (19.8 ms) de tous les appareils testés. | ||
| ↔ Temps de réponse gris 50% à gris 80% | ||
| 44.8 ms ... hausse ↗ et chute ↘ combinées | ↗ 23.6 ms hausse | 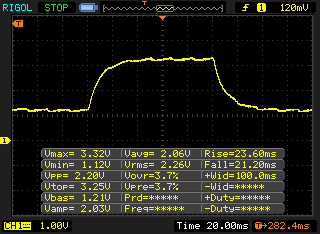 |
| ↘ 21.2 ms chute | ||
| L'écran souffre de latences très élevées, à éviter pour le jeu. En comparaison, tous les appareils testés affichent entre 0.165 (minimum) et 636 (maximum) ms. » 76 % des appareils testés affichent de meilleures performances. Cela signifie que les latences relevées sont moins bonnes que la moyenne (31 ms) de tous les appareils testés. | ||
Scintillement / MLI (Modulation de largeur d'impulsion)
| Scintillement / MLI (Modulation de largeur d'impulsion) décelé | 25000 Hz | ≤ 30 Niveau de luminosité | 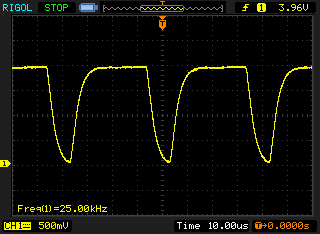 |
Le rétroéclairage de l'écran scintille à la fréquence de 25000 Hz (certainement du fait de l'utilisation d'une MDI - Modulation de largeur d'impulsion) à un niveau de luminosité inférieur ou égal à 30 % . Aucun scintillement ne devrait être perceptible au-dessus de cette valeur. La fréquence de rafraîchissement de 25000 Hz est élevée, la grande majorité des utilisateurs ne devrait pas percevoir de scintillements et être sujette à une fatigue oculaire accrue. En comparaison, 52 % des appareils testés n'emploient pas MDI pour assombrir leur écran. Nous avons relevé une moyenne à 7750 (minimum : 5 - maximum : 343500) Hz dans le cas où une MDI était active. | |||


* ... Moindre est la valeur, meilleures sont les performances


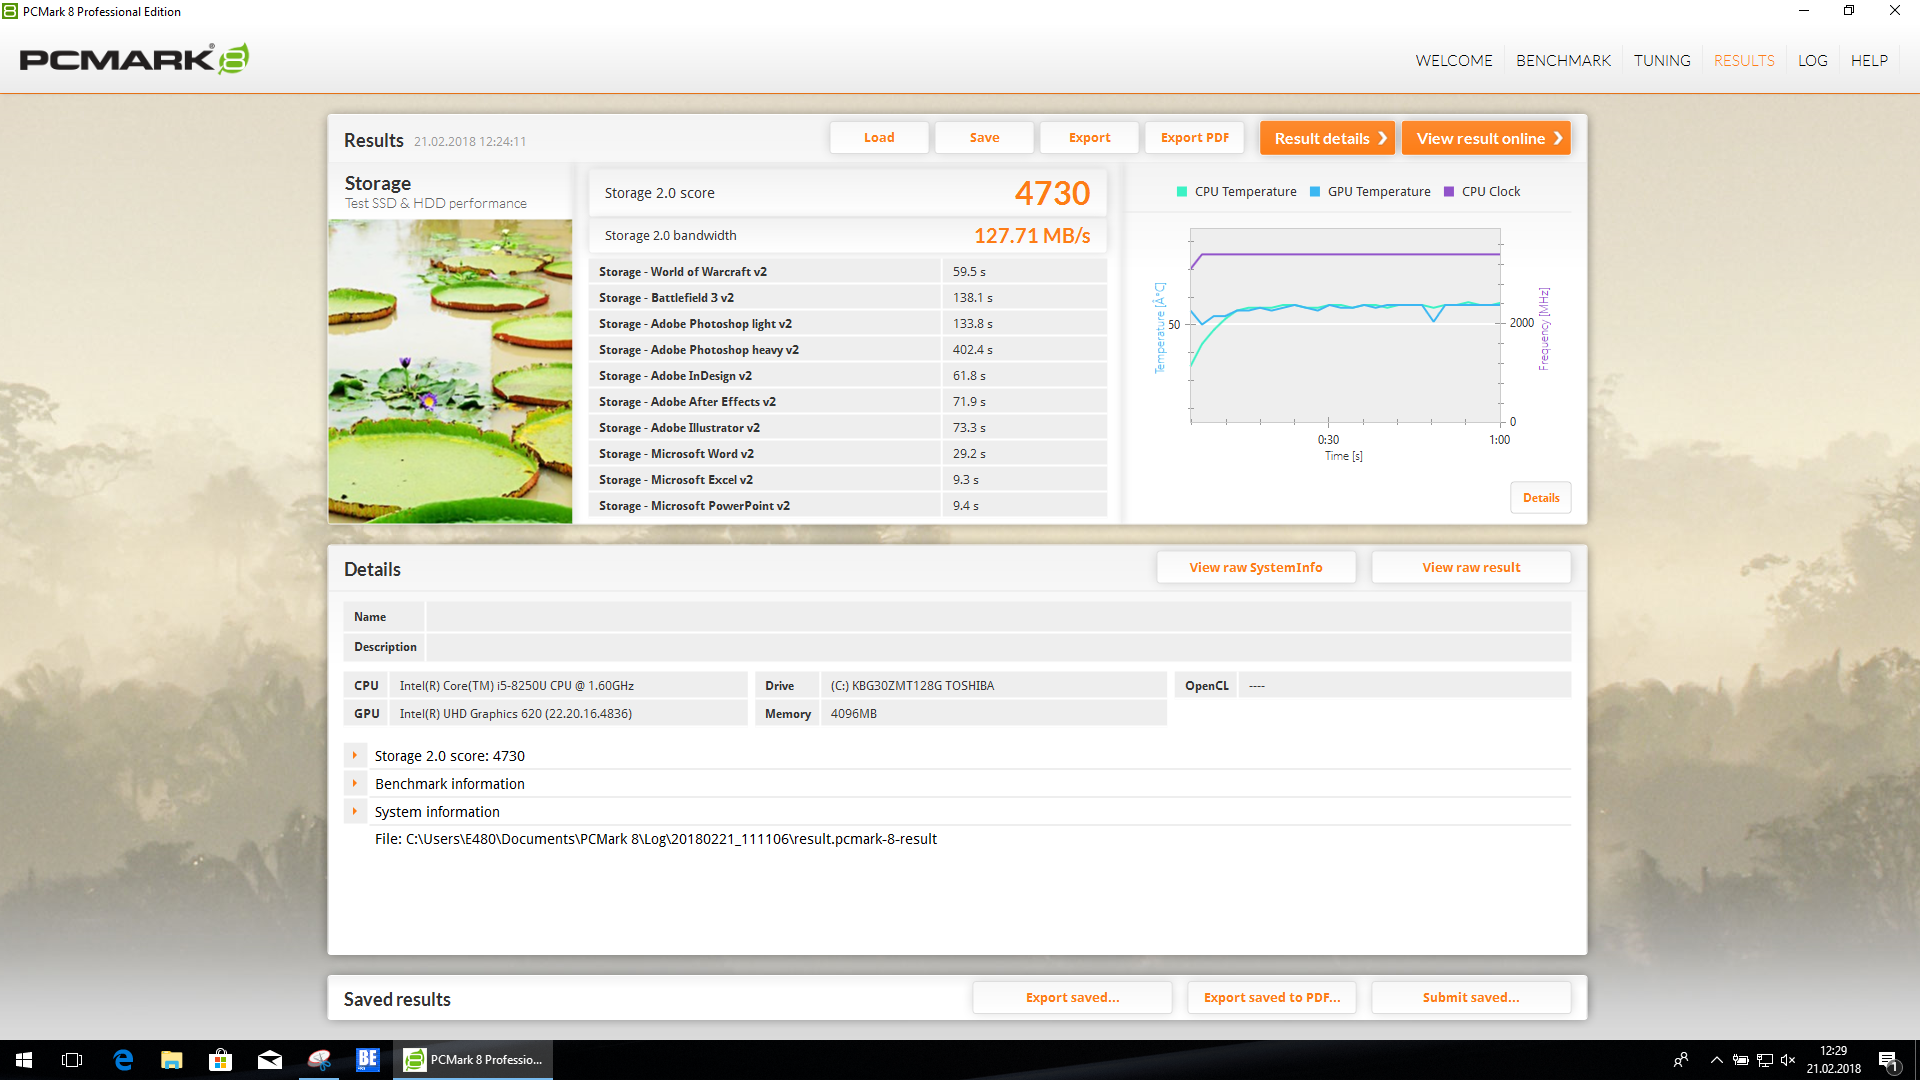
| Lenovo ThinkPad E480-20KNCTO1WW UHD Graphics 620, i5-8250U, Toshiba KBG30ZMT128G | Lenovo ThinkPad E480-20KQS00000 Radeon RX 550 (Laptop), i5-8250U, Lenovo LENSE20256GMSP34MEAT2TA | HP ProBook 440 G5-3KX87ES UHD Graphics 620, i5-8250U, Intel SSD 600p SSDPEKKW256G7 | Lenovo ThinkPad E470 HD Graphics 620, i5-7200U, SanDisk X400 SED 256GB, SATA (SD8TB8U-256G) | Acer TravelMate P449-G2-M-56CD HD Graphics 620, i5-7200U, Intel SSD 600p SSDPEKKW512G7 | Schenker Slim 14 L17 UHD Graphics 620, i5-8250U, Samsung SSD 960 Pro 512 GB m.2 | Asus VivoBook S14 S406UA-BV023T UHD Graphics 620, i5-8250U, SanDisk SD8SN8U256G1002 | Moyenne Intel Core i5-8250U, Intel UHD Graphics 620 | Moyenne de la classe Office | |
|---|---|---|---|---|---|---|---|---|---|
| PCMark 8 | 12% | 4% | 2% | -4% | 12% | 8% | -2% | 30% | |
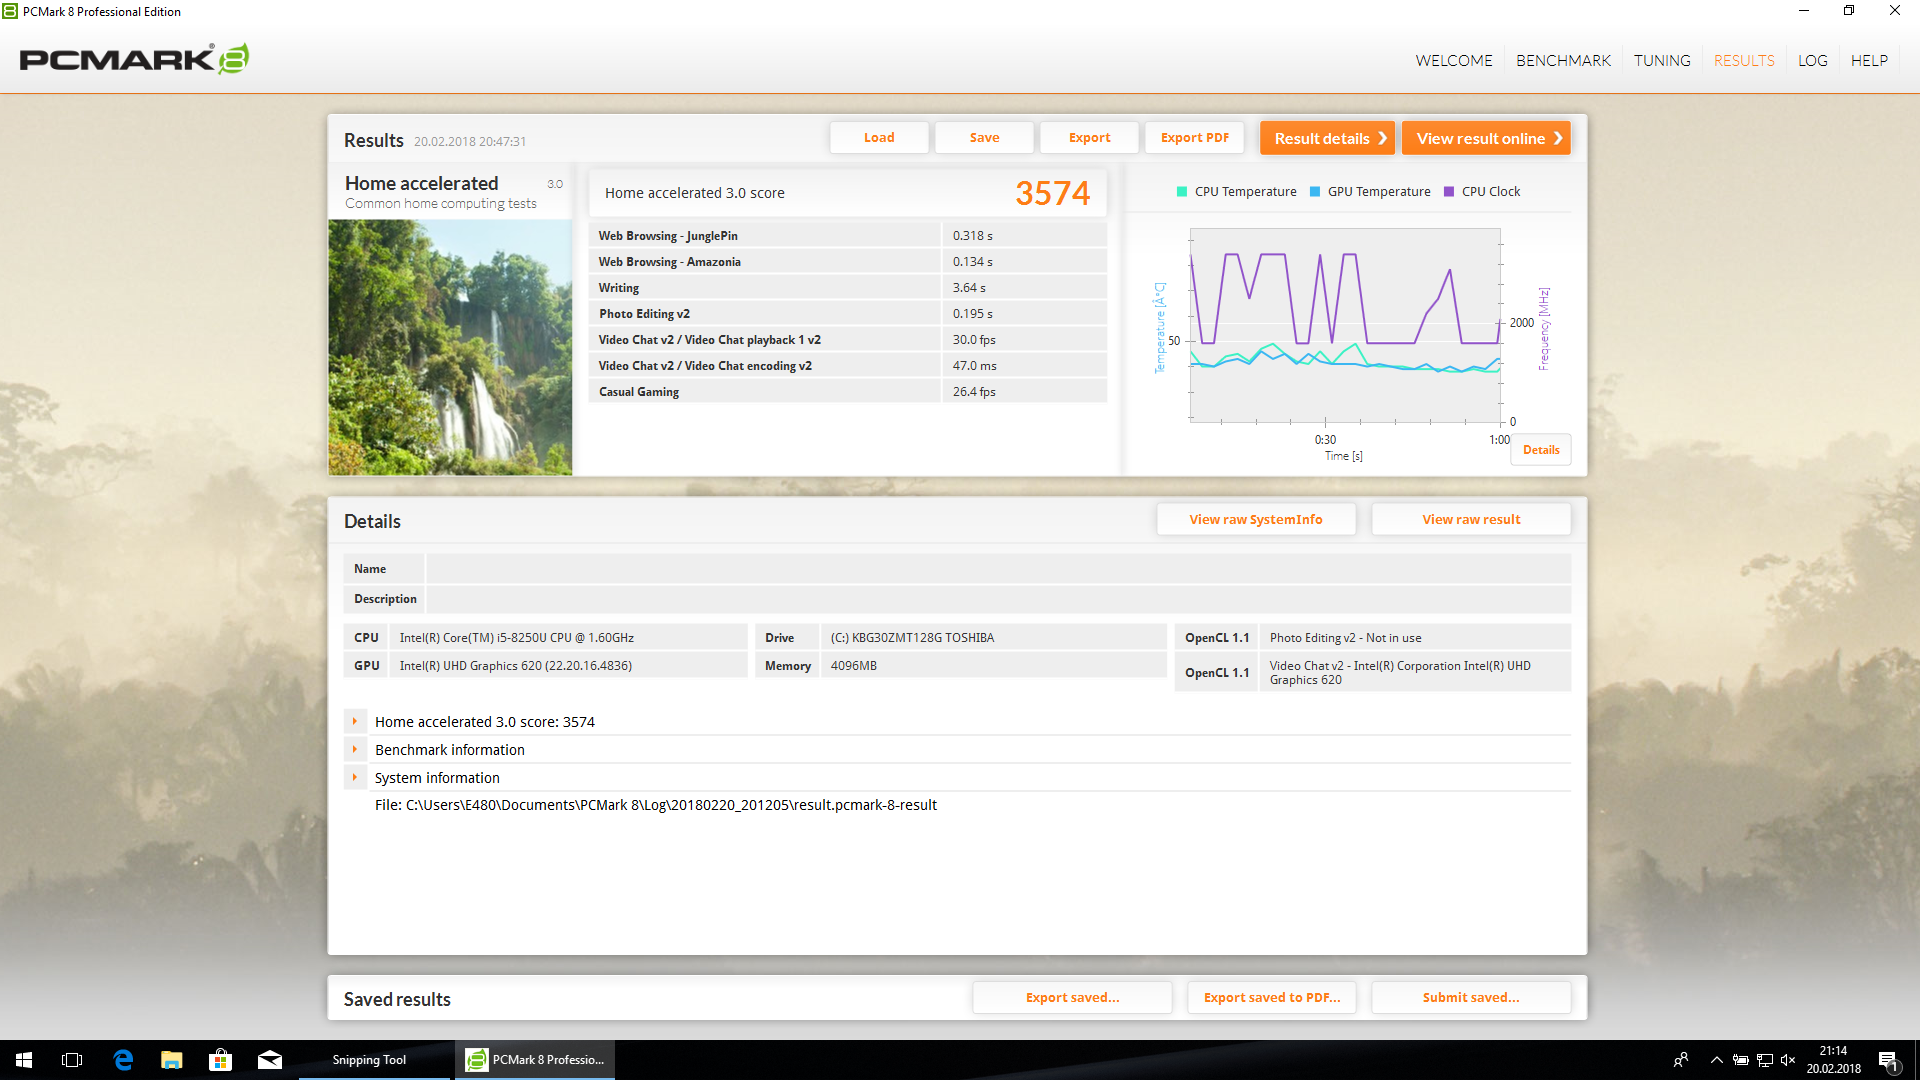
| Home Score Accelerated v2 (Points) | 3574 | 4187 17% | 3774 6% | 3674 3% | 3519 -2% | 4006 12% | 3937 10% | 3584 ? 0% | 5222 ? 46% |
| Work Score Accelerated v2 (Points) | 4849 | 5189 7% | 4922 2% | 4834 0% | 4605 -5% | 5106 5% | 4646 ? -4% | 5491 ? 13% | |
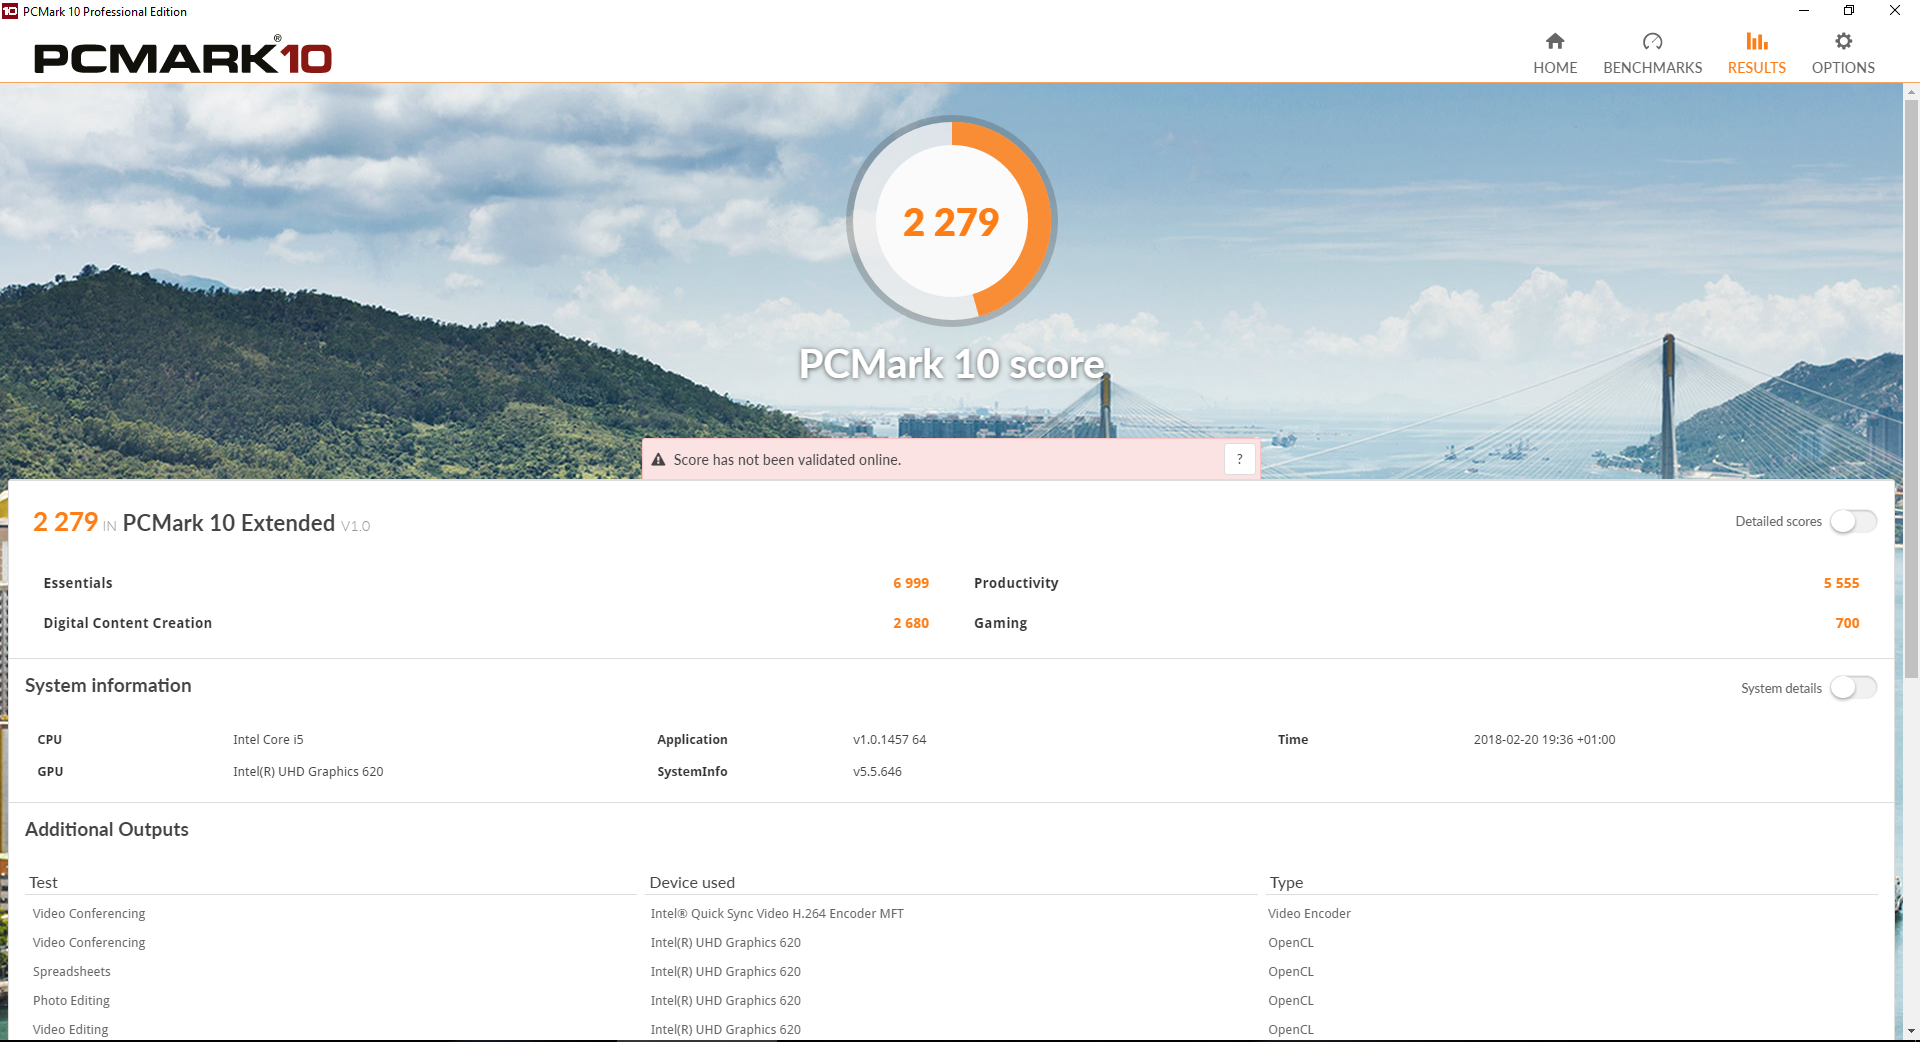
| PCMark 10 | 42% | 33% | 16% | 18% | 33% | 26% | 116% | ||
| Score (Points) | 2279 | 3954 73% | 3577 57% | 3144 38% | 3068 35% | 3612 58% | 3296 ? 45% | 6579 ? 189% | |
| Essentials (Points) | 6999 | 7722 10% | 7655 9% | 6547 -6% | 7077 1% | 7468 7% | 7398 ? 6% | 10020 ? 43% | |
| Moyenne finale (programmes/paramètres) | 27% /
27% | 19% /
19% | 9% /
9% | 7% /
7% | 12% /
12% | 21% /
20% | 12% /
12% | 73% /
73% |
| PCMark 8 Home Score Accelerated v2 | 3574 points | |
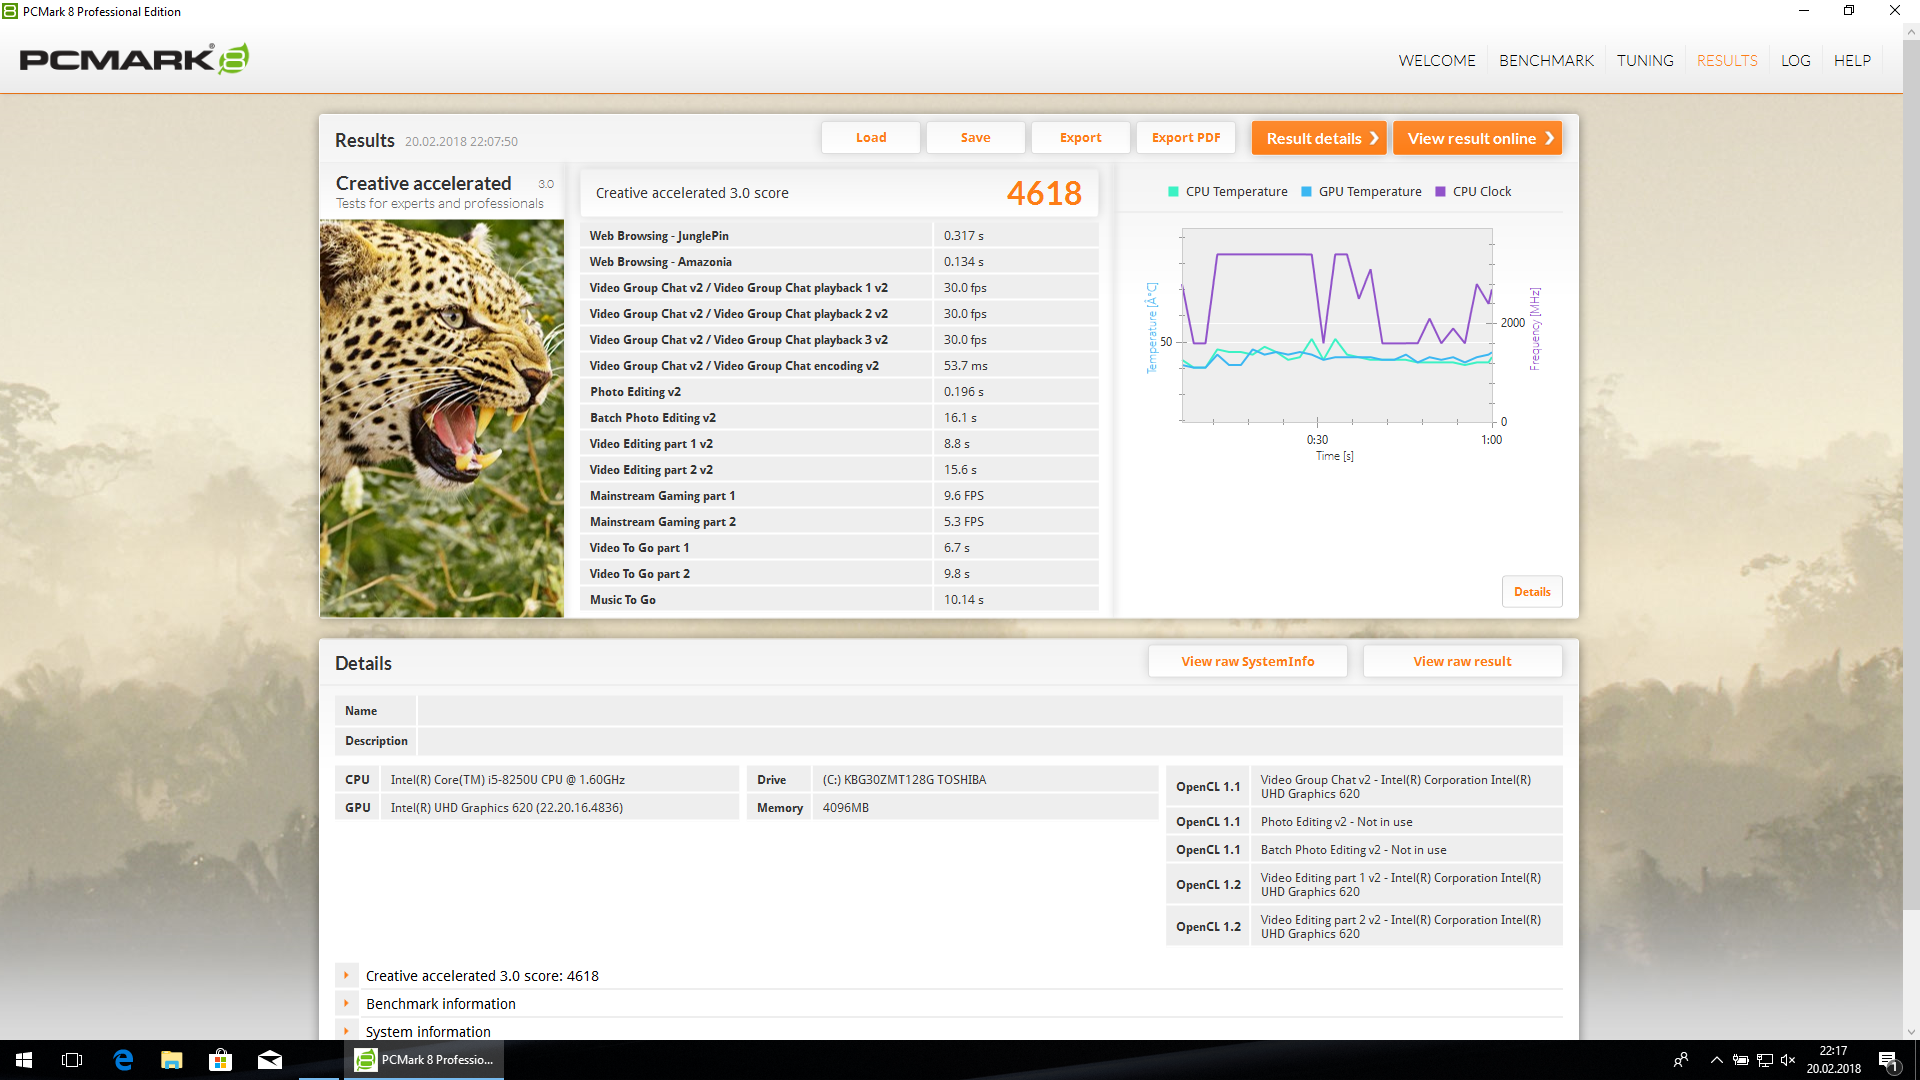
| PCMark 8 Creative Score Accelerated v2 | 4618 points | |
| PCMark 8 Work Score Accelerated v2 | 4849 points | |
| PCMark 10 Score | 2279 points | |
Aide | ||
| Lenovo ThinkPad E480-20KNCTO1WW UHD Graphics 620, i5-8250U, Toshiba KBG30ZMT128G | Lenovo ThinkPad E480-20KQS00000 Radeon RX 550 (Laptop), i5-8250U, Lenovo LENSE20256GMSP34MEAT2TA | HP ProBook 440 G5-3KX87ES UHD Graphics 620, i5-8250U, Intel SSD 600p SSDPEKKW256G7 | Lenovo ThinkPad E470 HD Graphics 620, i5-7200U, SanDisk X400 SED 256GB, SATA (SD8TB8U-256G) | Acer TravelMate P449-G2-M-56CD HD Graphics 620, i5-7200U, Intel SSD 600p SSDPEKKW512G7 | Schenker Slim 14 L17 UHD Graphics 620, i5-8250U, Samsung SSD 960 Pro 512 GB m.2 | |
|---|---|---|---|---|---|---|
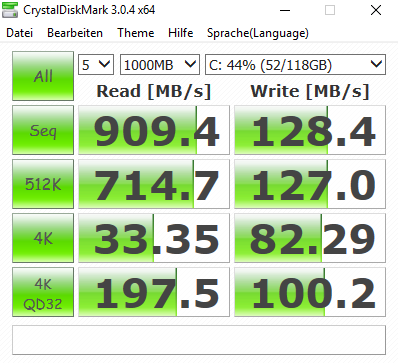
| CrystalDiskMark 3.0 | 24% | 155% | 56% | 152% | 440% | |
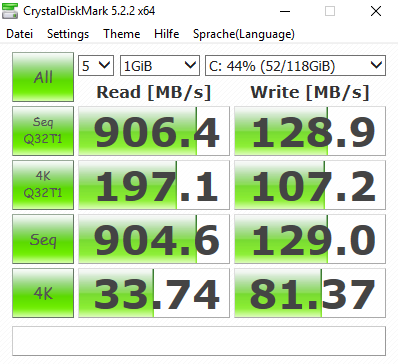
| Read Seq (MB/s) | 909 | 1295 42% | 1181 30% | 454.2 -50% | 1086 19% | 2860 215% |
| Write Seq (MB/s) | 128.4 | 160.6 25% | 602 369% | 438.1 241% | 581 352% | 1995 1454% |
| Read 512 (MB/s) | 715 | 872 22% | 923 29% | 304.6 -57% | 869 22% | 815 14% |
| Write 512 (MB/s) | 127 | 122 -4% | 600 372% | 343.7 171% | 584 360% | 1480 1065% |
| Read 4k (MB/s) | 33.35 | 25.72 -23% | 35.48 6% | 34.15 2% | 35.89 8% | 57.7 73% |
| Write 4k (MB/s) | 82.3 | 95.2 16% | 139.8 70% | 75.1 -9% | 122.4 49% | 196.7 139% |
| Read 4k QD32 (MB/s) | 197.5 | 389.9 97% | 287.8 46% | 284.2 44% | 462.9 134% | 565 186% |
| Write 4k QD32 (MB/s) | 100.2 | 118.3 18% | 417.1 316% | 208.8 108% | 370.9 270% | 475.1 374% |


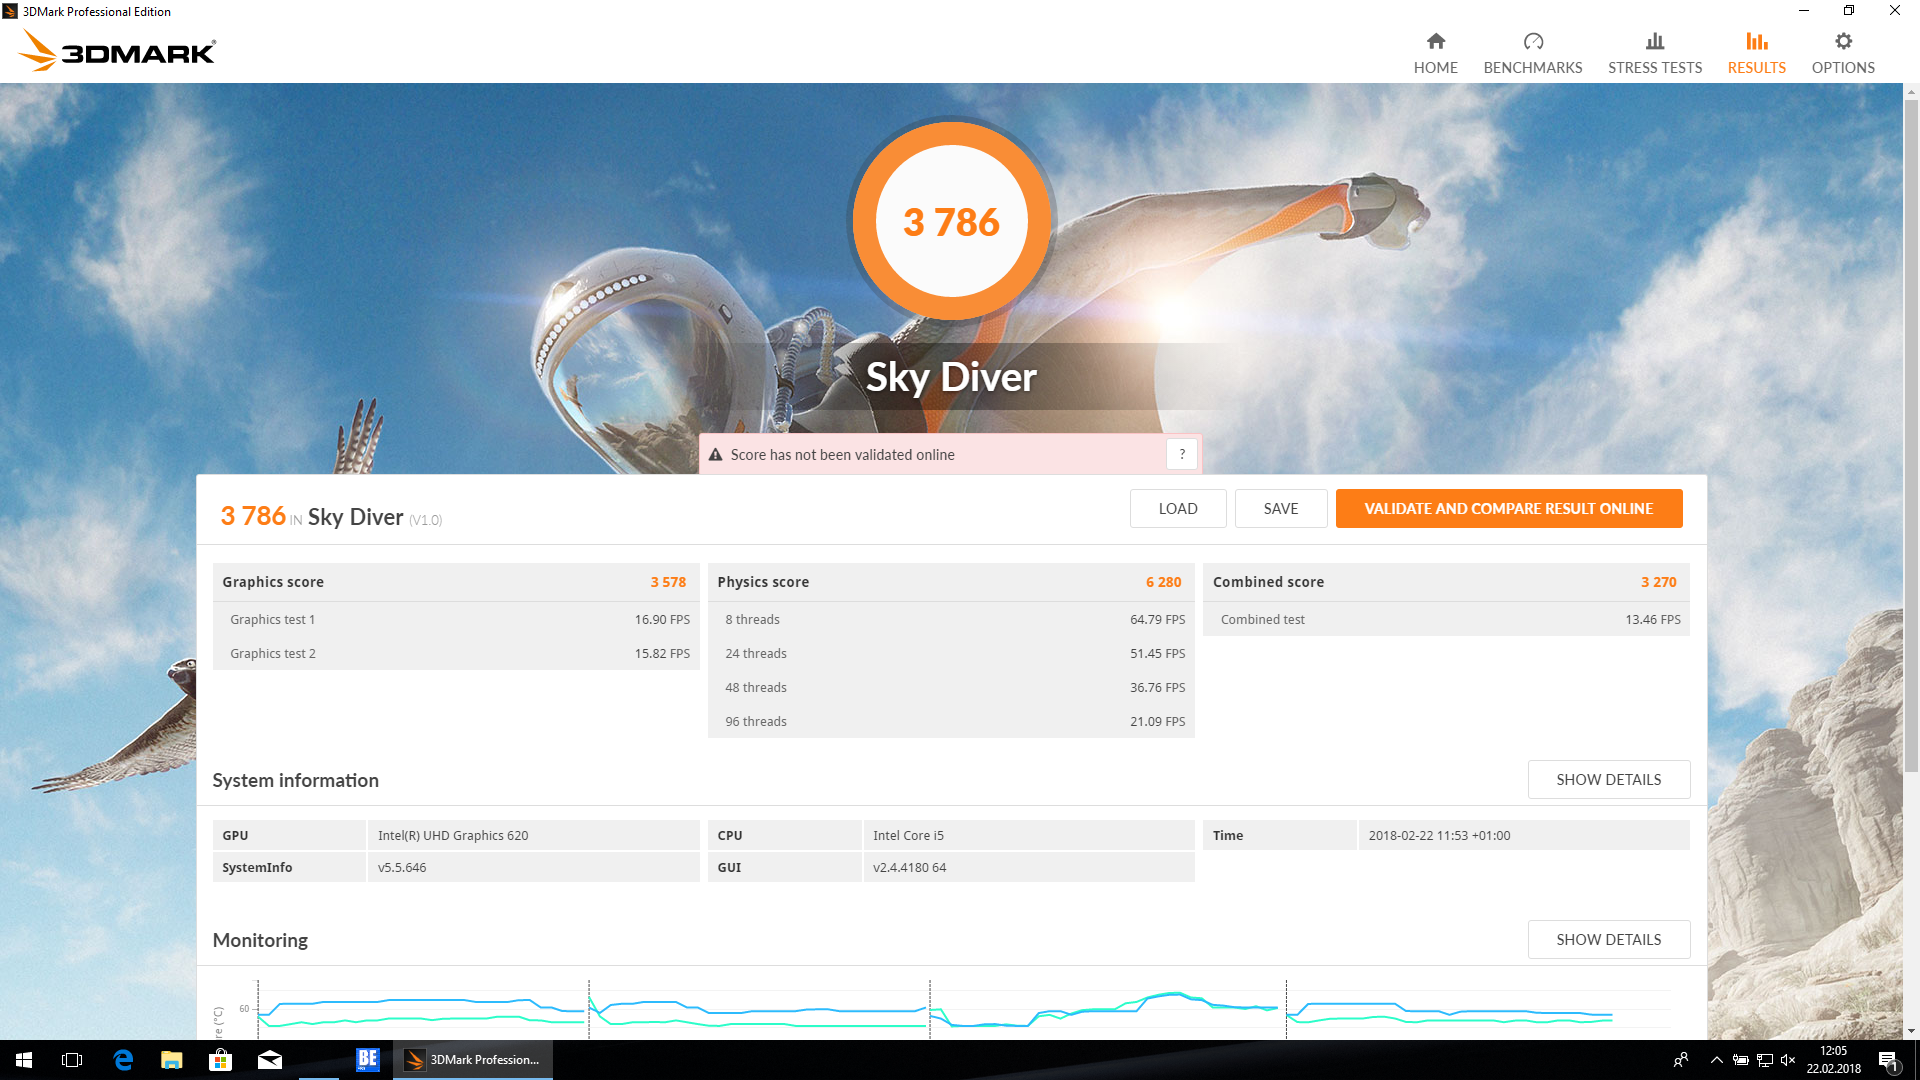


| 3DMark 11 Performance | 1591 points | |
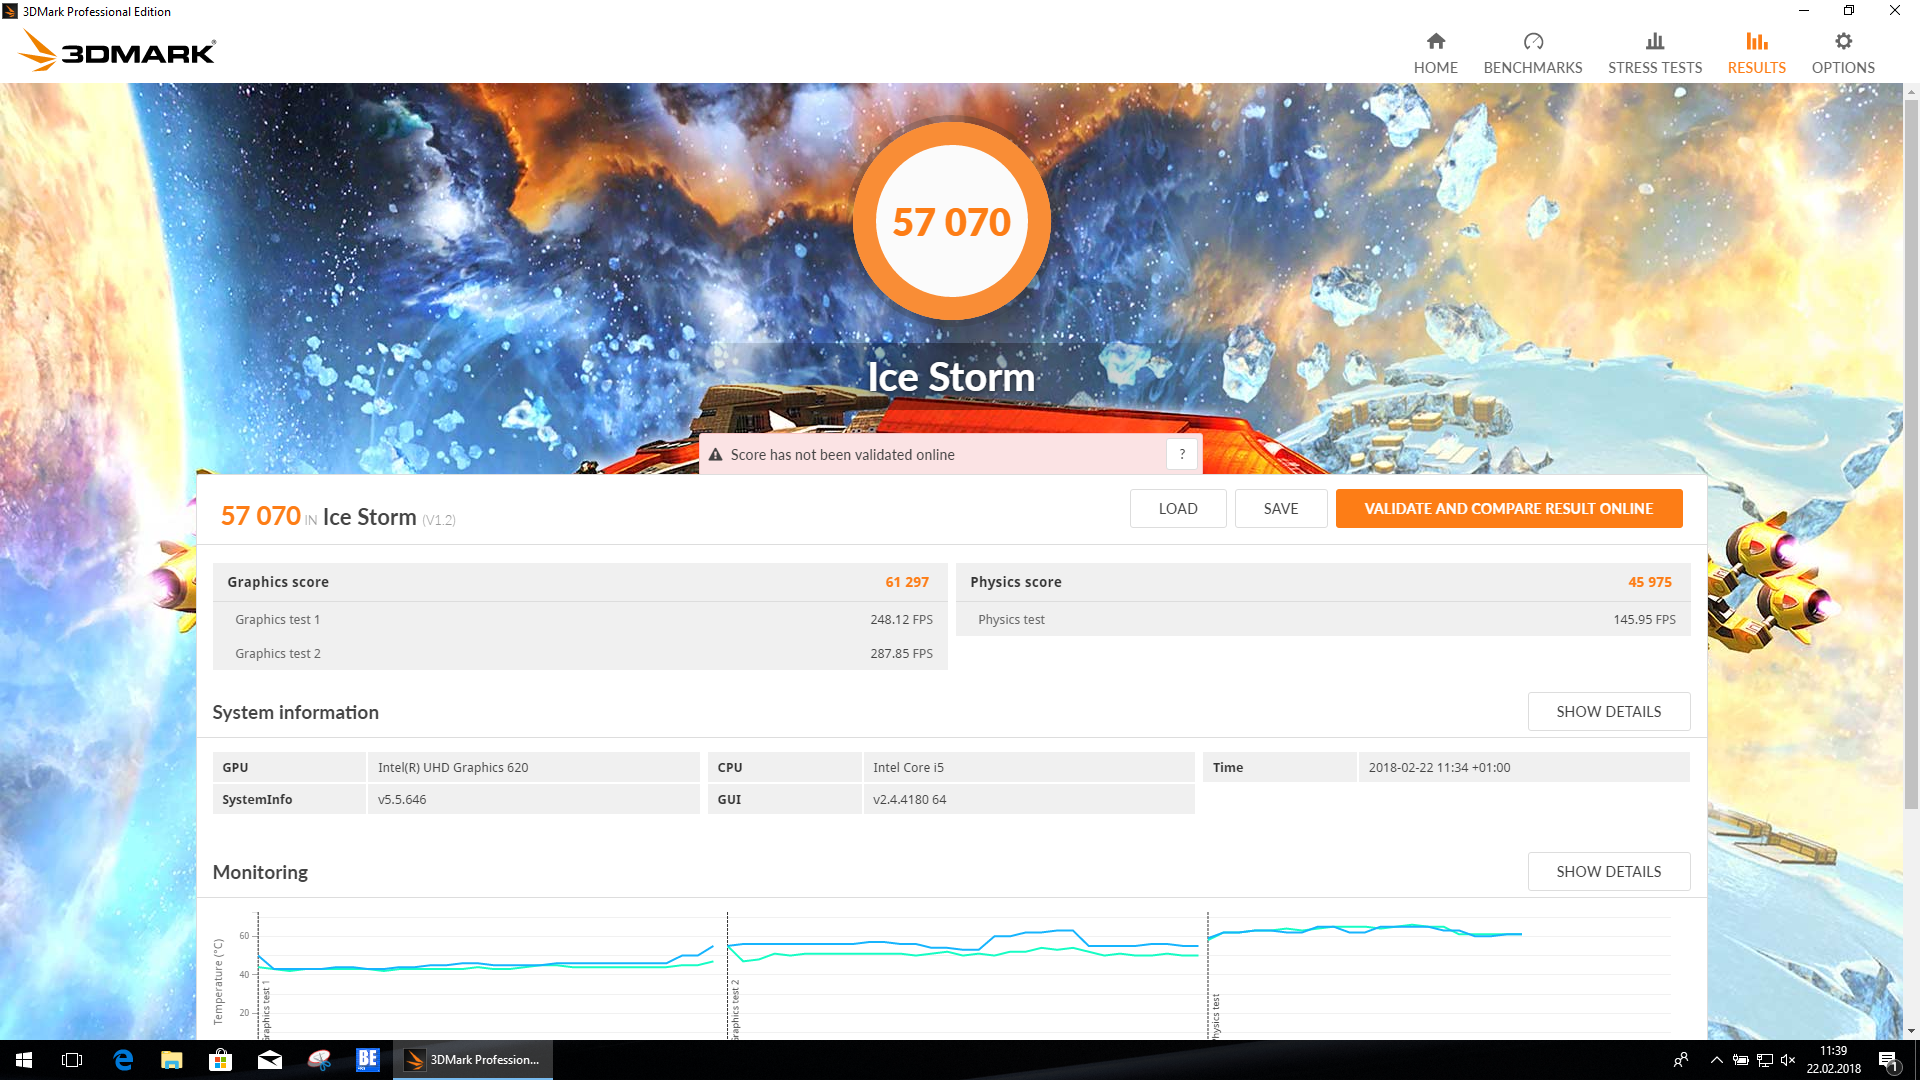
| 3DMark Ice Storm Standard Score | 57070 points | |
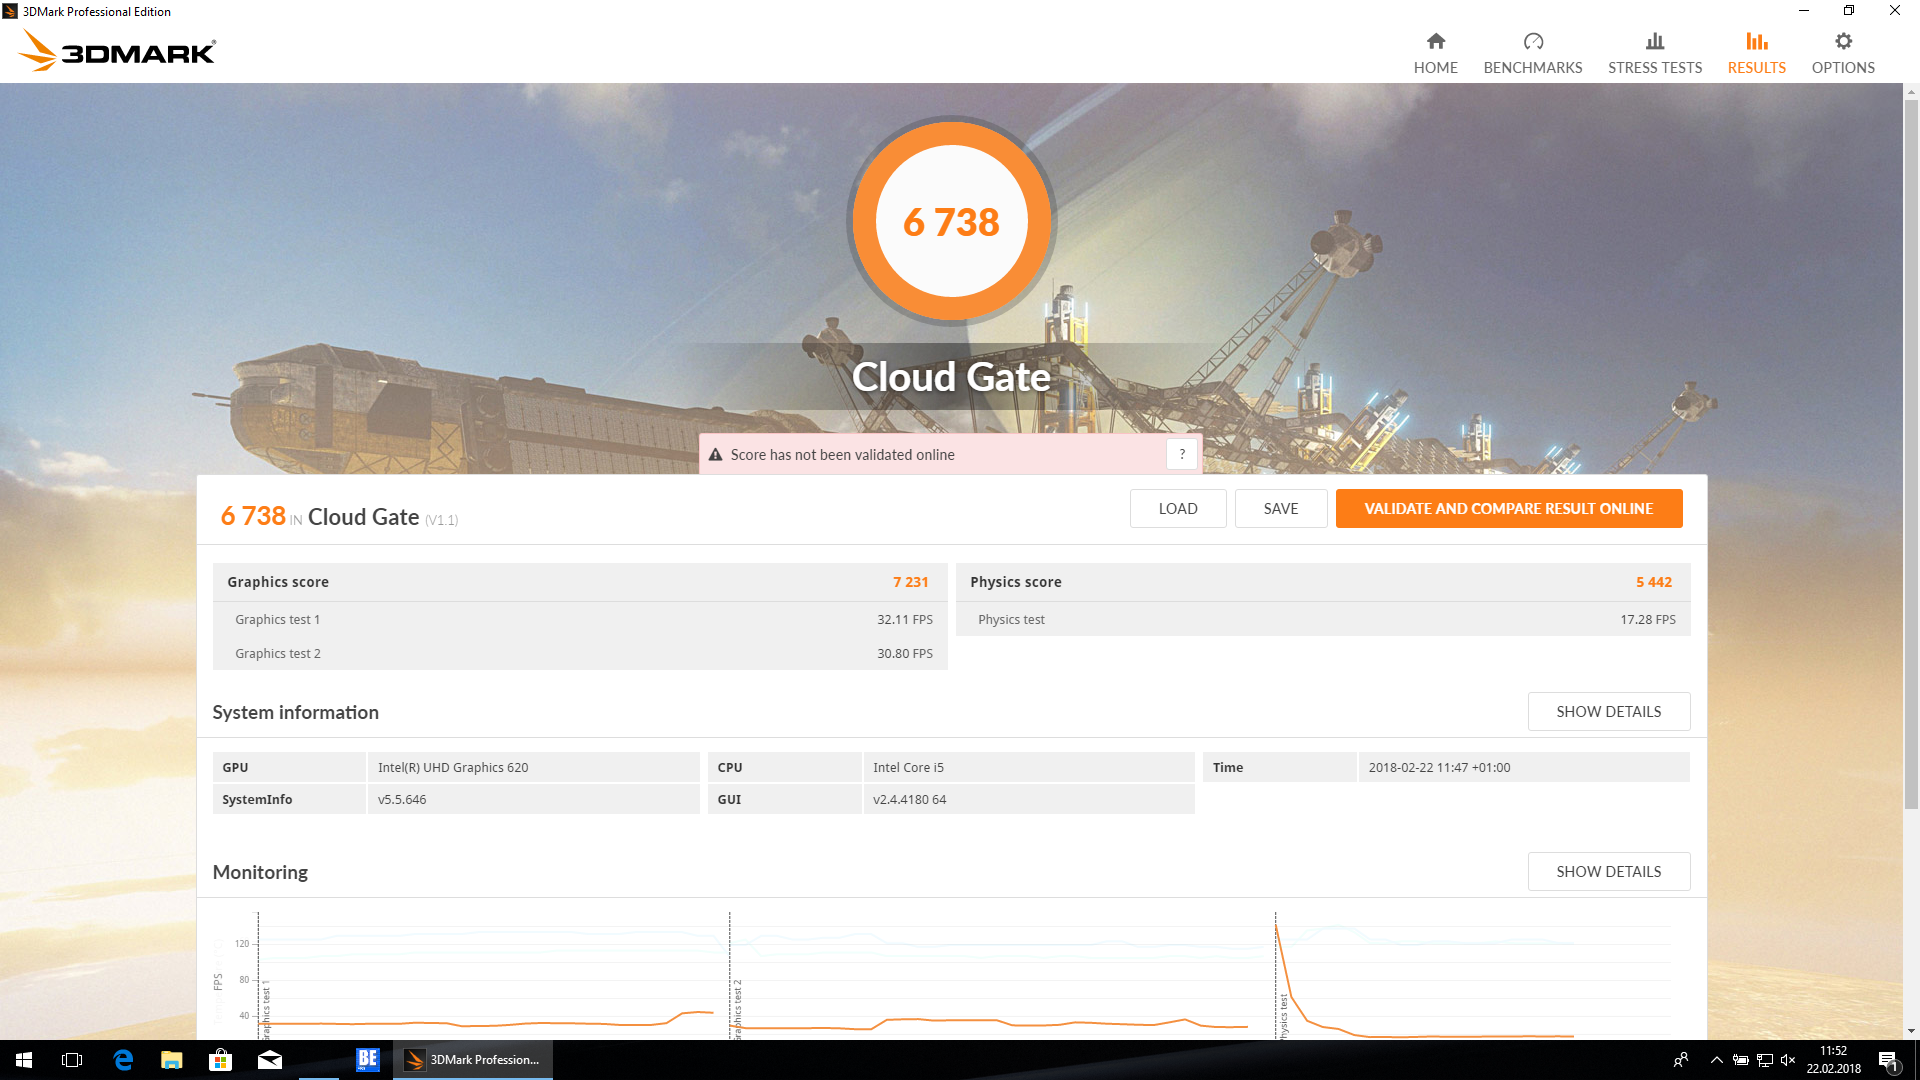
| 3DMark Cloud Gate Standard Score | 6738 points | |
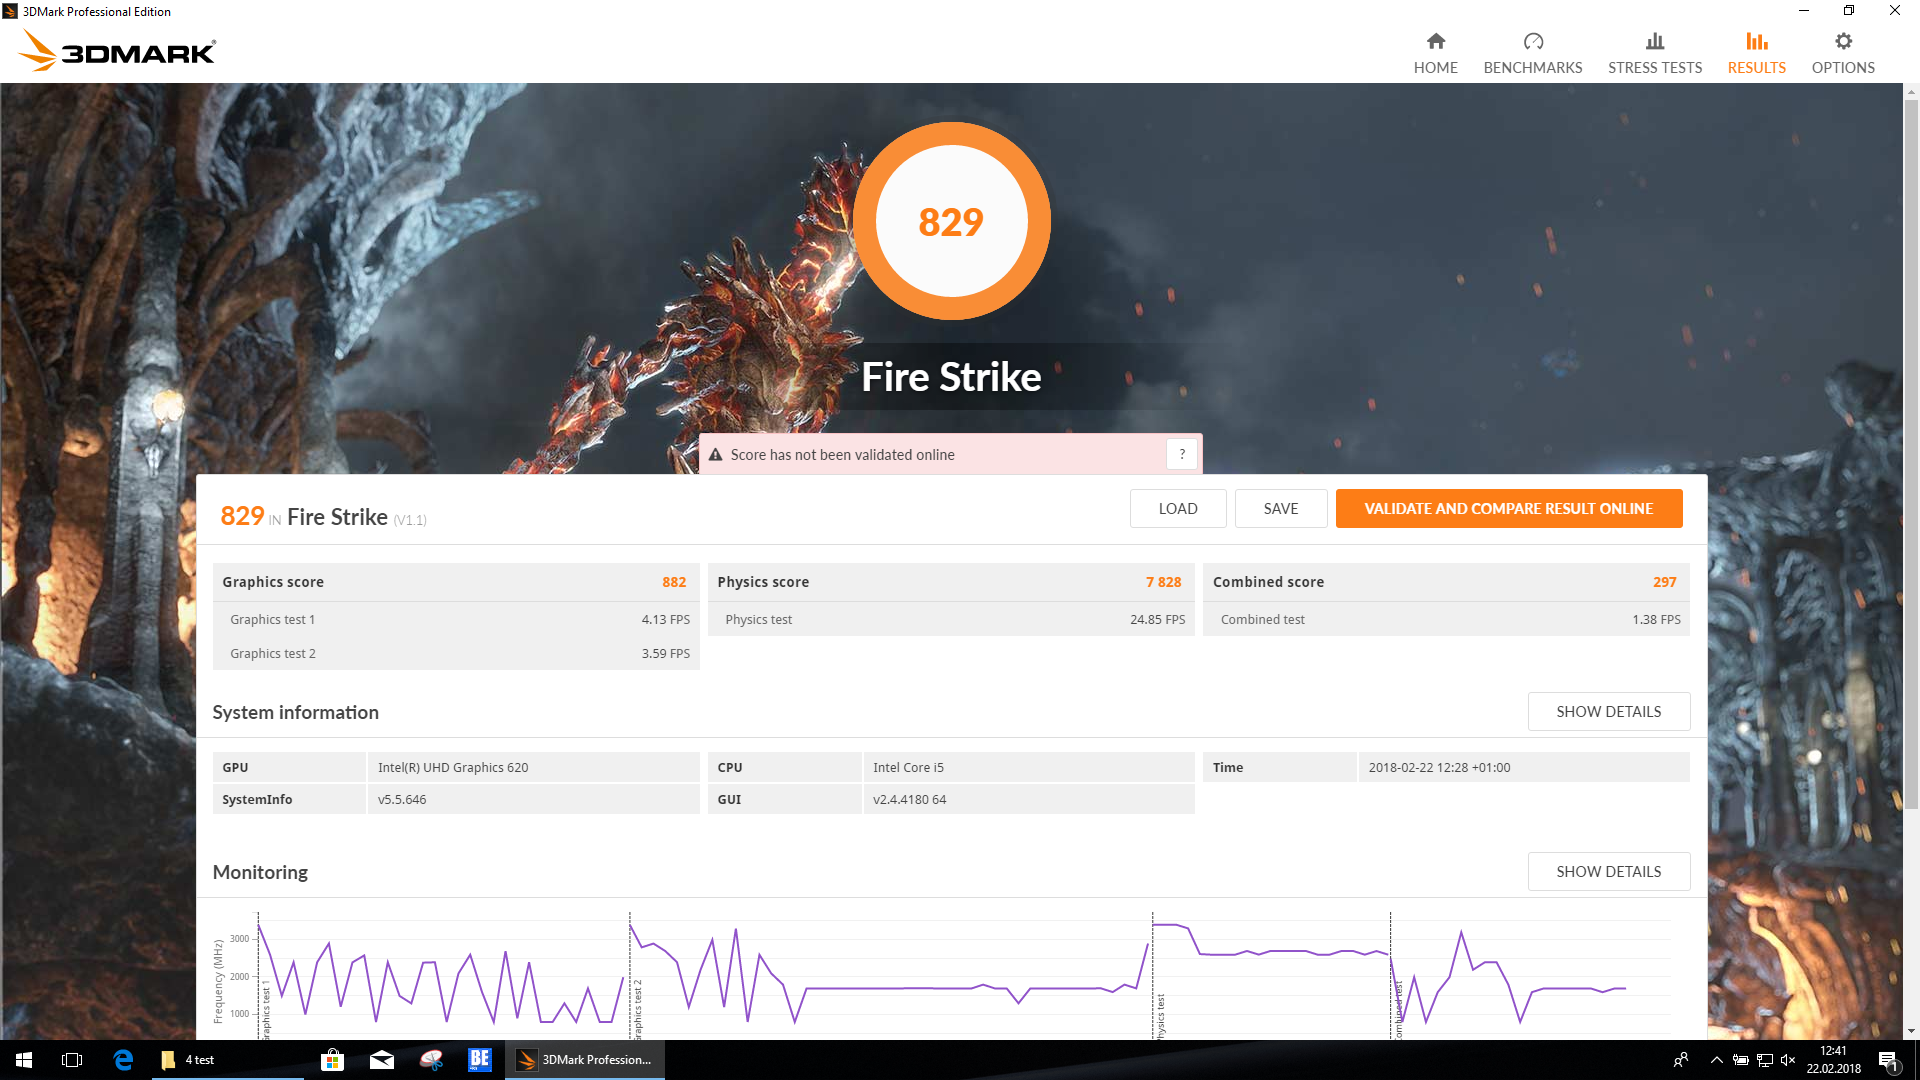
| 3DMark Fire Strike Score | 829 points | |
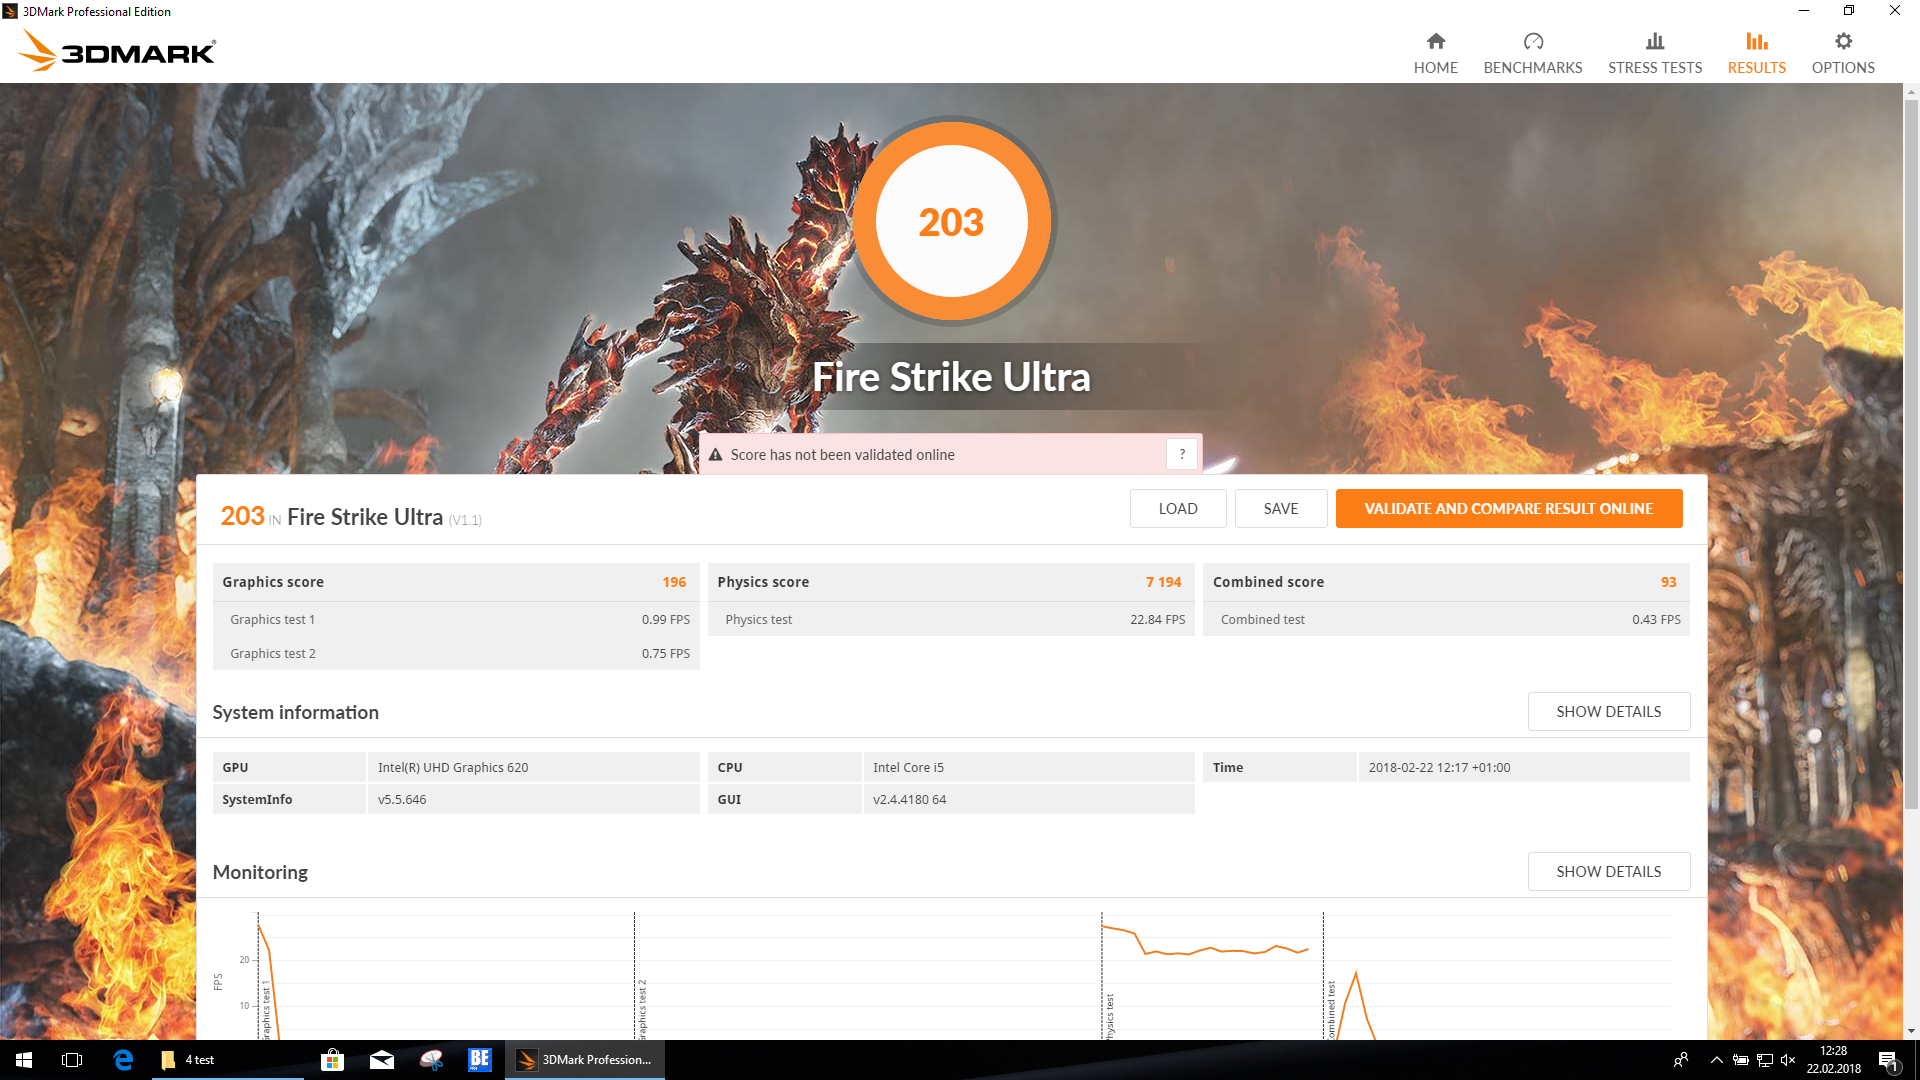
| 3DMark Fire Strike Extreme Score | 370 points | |
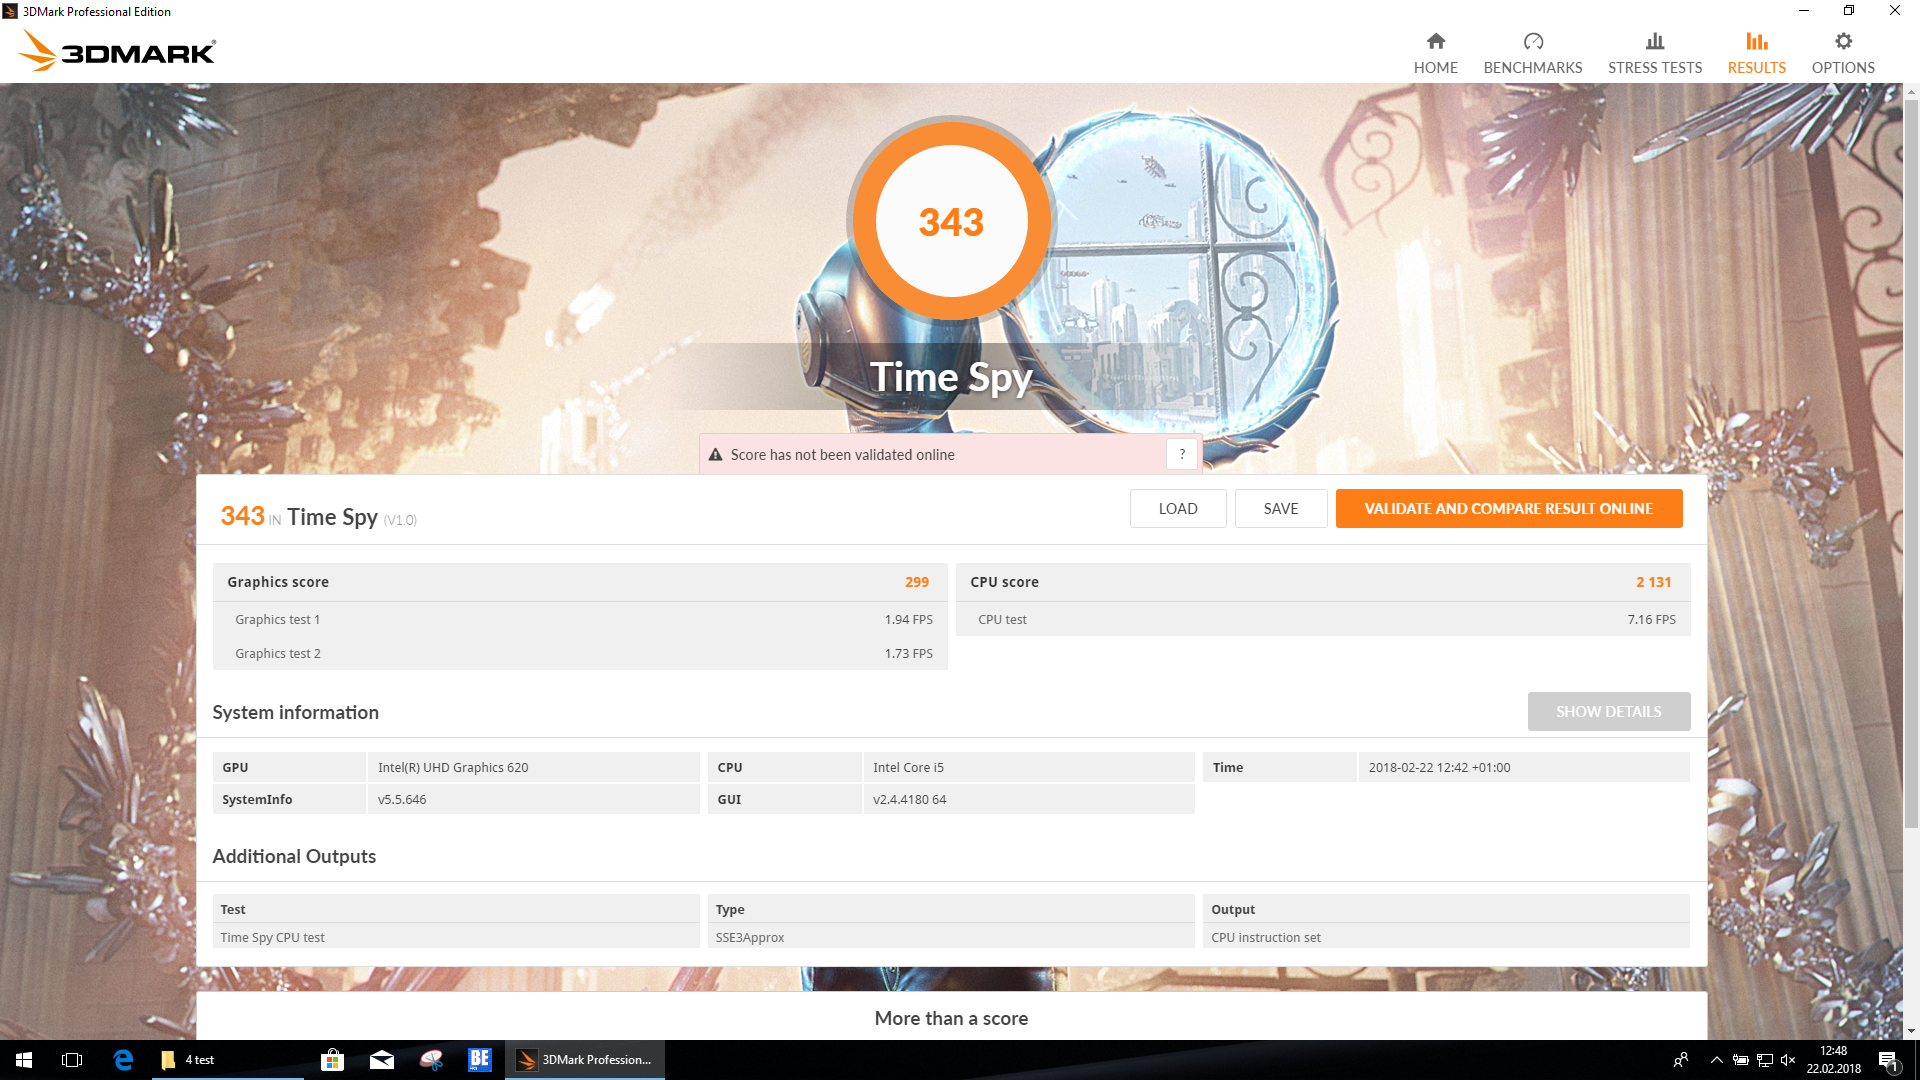
| 3DMark Time Spy Score | 343 points | |
Aide | ||
| Bas | Moyen | Élevé | Ultra | |
|---|---|---|---|---|
| BioShock Infinite (2013) | 37.8 | 24.4 | 19.9 | 6.8 |
| The Witcher 3 (2015) | 14.8 | 9.4 | 5.2 | |
| Rise of the Tomb Raider (2016) | 16.9 | 10.4 | 5.9 |
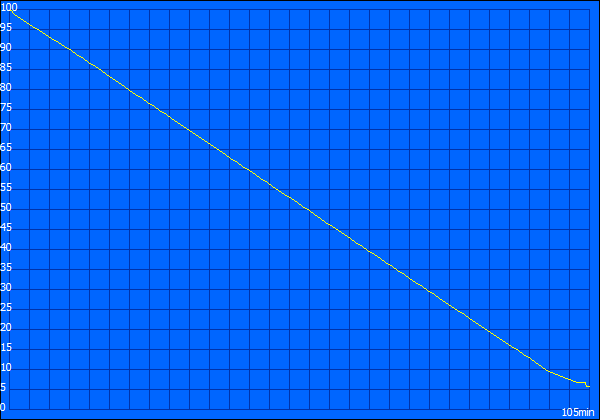
Degré de la nuisance sonore
| Au repos |
| 29.1 / 29.1 / 30.3 dB(A) |
| Fortement sollicité |
| 31.8 / 33.8 dB(A) |
 | ||
30 dB silencieux 40 dB(A) audible 50 dB(A) bruyant |
||
min: | ||
| Lenovo ThinkPad E480-20KNCTO1WW | Lenovo ThinkPad E480-20KQS00000 | HP ProBook 440 G5-3KX87ES | Lenovo ThinkPad E470 | Acer TravelMate P449-G2-M-56CD | Schenker Slim 14 L17 | Asus VivoBook S14 S406UA-BV023T | |
|---|---|---|---|---|---|---|---|
| Noise | -11% | -3% | -3% | -6% | 2% | -10% | |
| arrêt / environnement * (dB) | 29.1 | 29.8 -2% | 29.1 -0% | 30.5 -5% | 29.9 -3% | 28.7 1% | 30.2 -4% |
| Idle Minimum * (dB) | 29.1 | 29.8 -2% | 29.1 -0% | 30.5 -5% | 30.2 -4% | 28.7 1% | 30.2 -4% |
| Idle Average * (dB) | 29.1 | 31.5 -8% | 29.1 -0% | 30.5 -5% | 30.2 -4% | 29.5 -1% | 30.2 -4% |
| Idle Maximum * (dB) | 30.3 | 33.3 -10% | 30.7 -1% | 30.5 -1% | 30.2 -0% | 29.5 3% | 31.3 -3% |
| Load Average * (dB) | 31.8 | 39.1 -23% | 34.5 -8% | 32.9 -3% | 36.7 -15% | 30.5 4% | 40.1 -26% |
| Load Maximum * (dB) | 33.8 | 40.4 -20% | 36 -7% | 32.9 3% | 36.4 -8% | 33.4 1% | 40.4 -20% |
| Witcher 3 ultra * (dB) | 39.1 |
* ... Moindre est la valeur, meilleures sont les performances

(+) La température maximale du côté supérieur est de 36.7 °C / 98 F, par rapport à la moyenne de 34.3 °C / 94 F, allant de 21.2 à 62.5 °C pour la classe Office.
(±) Le fond chauffe jusqu'à un maximum de 42.8 °C / 109 F, contre une moyenne de 36.8 °C / 98 F
(+) En utilisation inactive, la température moyenne du côté supérieur est de 22.7 °C / 73 F, par rapport à la moyenne du dispositif de 29.5 °C / 85 F.
(+) Les repose-poignets et le pavé tactile sont plus froids que la température de la peau avec un maximum de 25.8 °C / 78.4 F et sont donc froids au toucher.
(±) La température moyenne de la zone de l'appui-paume de dispositifs similaires était de 27.5 °C / 81.5 F (+1.7 °C / #3.1 F).
| Lenovo ThinkPad E480-20KNCTO1WW | Lenovo ThinkPad E480-20KQS00000 | HP ProBook 440 G5-3KX87ES | Lenovo ThinkPad E470 | Acer TravelMate P449-G2-M-56CD | Schenker Slim 14 L17 | Asus VivoBook S14 S406UA-BV023T | |
|---|---|---|---|---|---|---|---|
| Heat | -37% | -7% | 0% | -5% | -12% | -13% | |
| Maximum Upper Side * (°C) | 36.7 | 51.9 -41% | 39 -6% | 35.6 3% | 36.8 -0% | 41.9 -14% | 42.2 -15% |
| Maximum Bottom * (°C) | 42.8 | 71.6 -67% | 45.5 -6% | 37.2 13% | 31.3 27% | 43.7 -2% | 39.4 8% |
| Idle Upper Side * (°C) | 23.4 | 24.8 -6% | 24.8 -6% | 24.4 -4% | 26.7 -14% | 24.8 -6% | 28.1 -20% |
| Idle Bottom * (°C) | 22.8 | 30 -32% | 25 -10% | 25.6 -12% | 30 -32% | 28.4 -25% | 28.1 -23% |
* ... Moindre est la valeur, meilleures sont les performances
| Éteint/en veille | |
| Au repos | |
| Fortement sollicité |
|
Légende:
min: | |
| Lenovo ThinkPad E480-20KNCTO1WW i5-8250U, UHD Graphics 620, IPS LED, 1920x1080, 14" | Lenovo ThinkPad E480-20KQS00000 i5-8250U, Radeon RX 550 (Laptop), IPS LED, 1920x1080, 14" | HP ProBook 440 G5-3KX87ES i5-8250U, UHD Graphics 620, IPS LED, 1920x1080, 14" | Lenovo ThinkPad E470 i5-7200U, HD Graphics 620, TN LED, 1366x768, 14" | Acer TravelMate P449-G2-M-56CD i5-7200U, HD Graphics 620, IPS, 1920x1080, 14" | Schenker Slim 14 L17 i5-8250U, UHD Graphics 620, IPS, 1920x1080, 14" | Asus VivoBook S14 S406UA-BV023T i5-8250U, UHD Graphics 620, TN LED, 1366x768, 14" | |
|---|---|---|---|---|---|---|---|
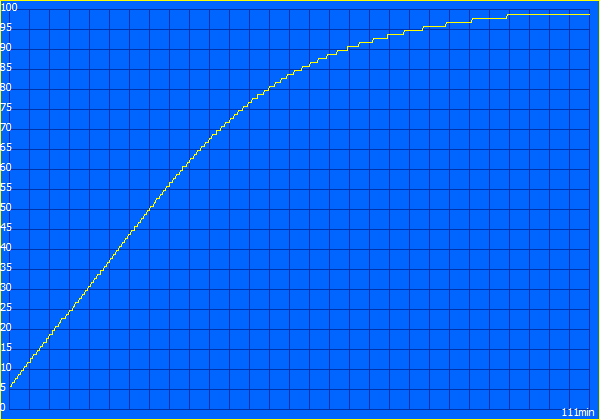
| Power Consumption | -38% | -33% | -25% | -20% | -42% | -8% | |
| Idle Minimum * (Watt) | 3.5 | 4.1 -17% | 4.4 -26% | 5.2 -49% | 4.5 -29% | 6 -71% | 3.7 -6% |
| Idle Average * (Watt) | 5.3 | 6.3 -19% | 7.1 -34% | 7.6 -43% | 7.1 -34% | 8.46 -60% | 5.6 -6% |
| Idle Maximum * (Watt) | 6.1 | 7.1 -16% | 10.2 -67% | 9.9 -62% | 10.2 -67% | 9.48 -55% | 7.6 -25% |
| Load Average * (Watt) | 30 | 54.8 -83% | 36.5 -22% | 31 -3% | 29.8 1% | 37.4 -25% | 37.4 -25% |
| Load Maximum * (Watt) | 42.3 | 66.4 -57% | 48.7 -15% | 29.7 30% | 31 27% | 41.1 3% | 33 22% |
| Witcher 3 ultra * (Watt) | 43.8 |
* ... Moindre est la valeur, meilleures sont les performances

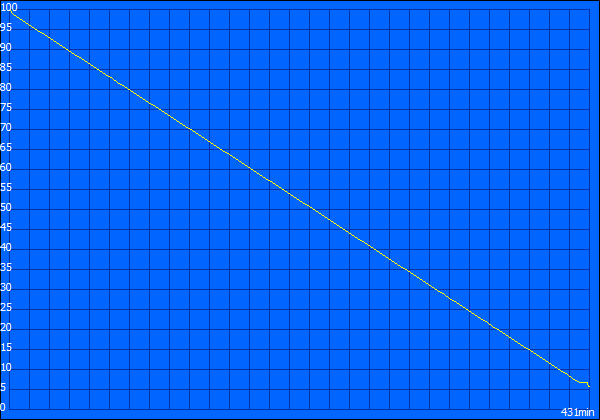
| Lenovo ThinkPad E480-20KNCTO1WW i5-8250U, UHD Graphics 620, 45 Wh | Lenovo ThinkPad E480-20KQS00000 i5-8250U, Radeon RX 550 (Laptop), 48 Wh | HP ProBook 440 G5-3KX87ES i5-8250U, UHD Graphics 620, 48 Wh | Lenovo ThinkPad E470 i5-7200U, HD Graphics 620, 45 Wh | Acer TravelMate P449-G2-M-56CD i5-7200U, HD Graphics 620, 48 Wh | Schenker Slim 14 L17 i5-8250U, UHD Graphics 620, 44 Wh | Asus VivoBook S14 S406UA-BV023T i5-8250U, UHD Graphics 620, 39 Wh | Moyenne de la classe Office | |
|---|---|---|---|---|---|---|---|---|
| Autonomie de la batterie | -5% | -5% | 7% | -8% | -39% | -5% | 51% | |
| Reader / Idle (h) | 18.4 | 19.4 5% | 13.7 -26% | 18.5 1% | 16.3 -11% | 24.5 ? 33% | ||
| H.264 (h) | 7.2 | 8.9 24% | 3.7 -49% | 9.1 26% | 8.4 17% | 15.5 ? 115% | ||
| WiFi v1.3 (h) | 8.3 | 5.7 -31% | 6.9 -17% | 8 -4% | 5.7 -31% | 5.1 -39% | 7.9 -5% | 13 ? 57% |
| Load (h) | 1.8 | 1.5 -17% | 3.1 72% | 1.9 6% | 1.7 -6% | 1.808 ? 0% |
Points positifs
Points négatifs
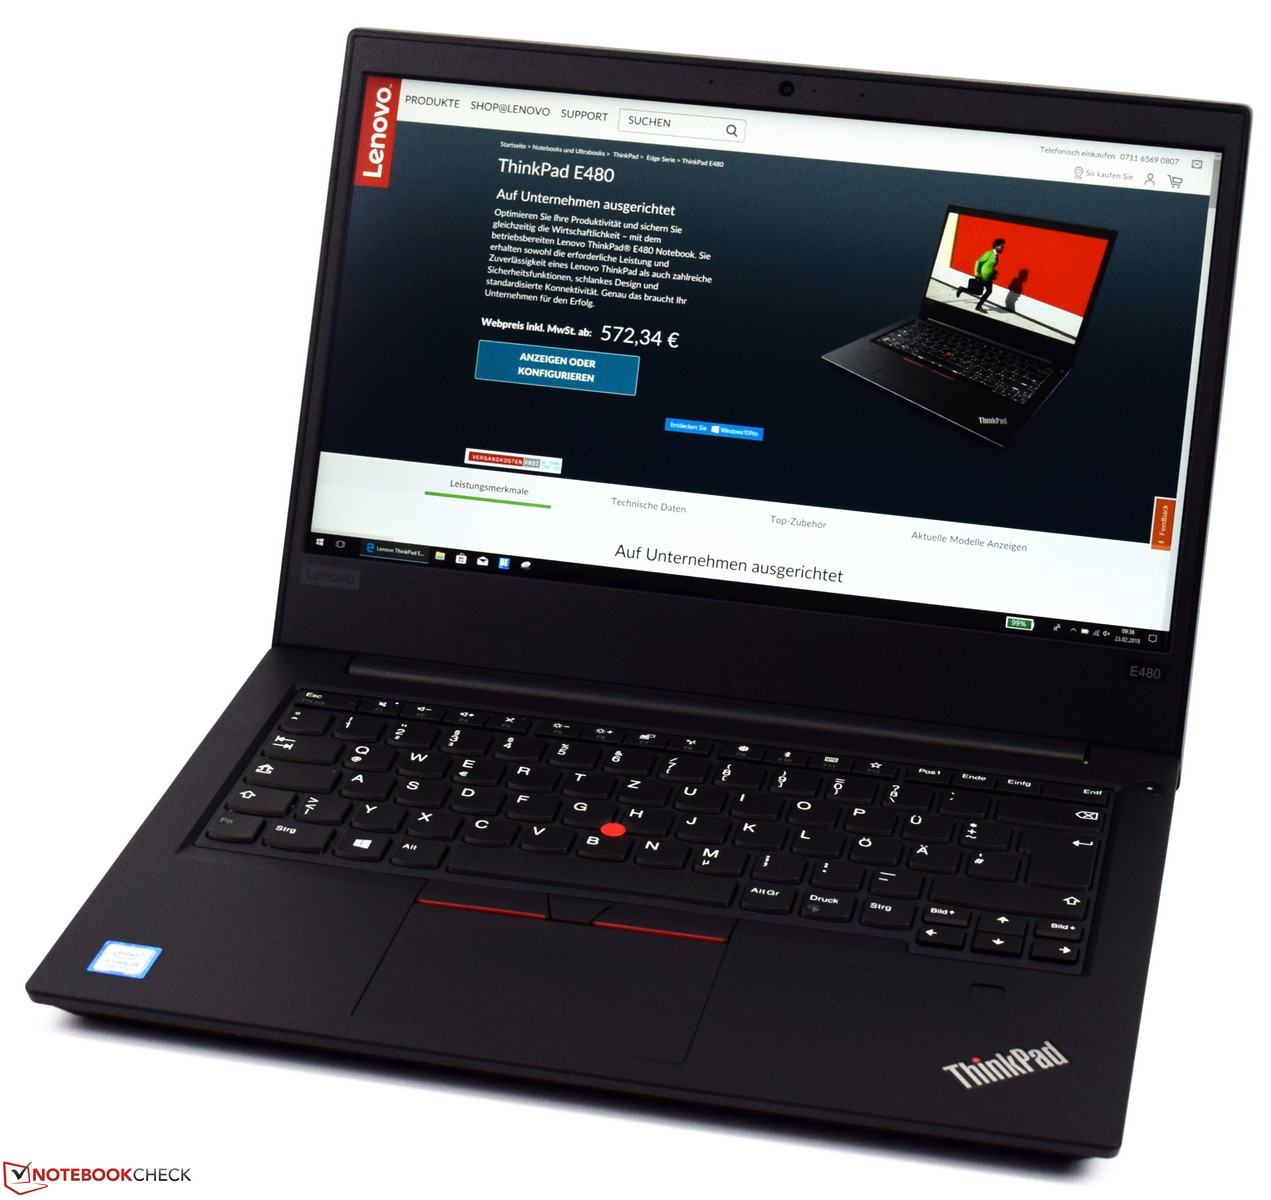
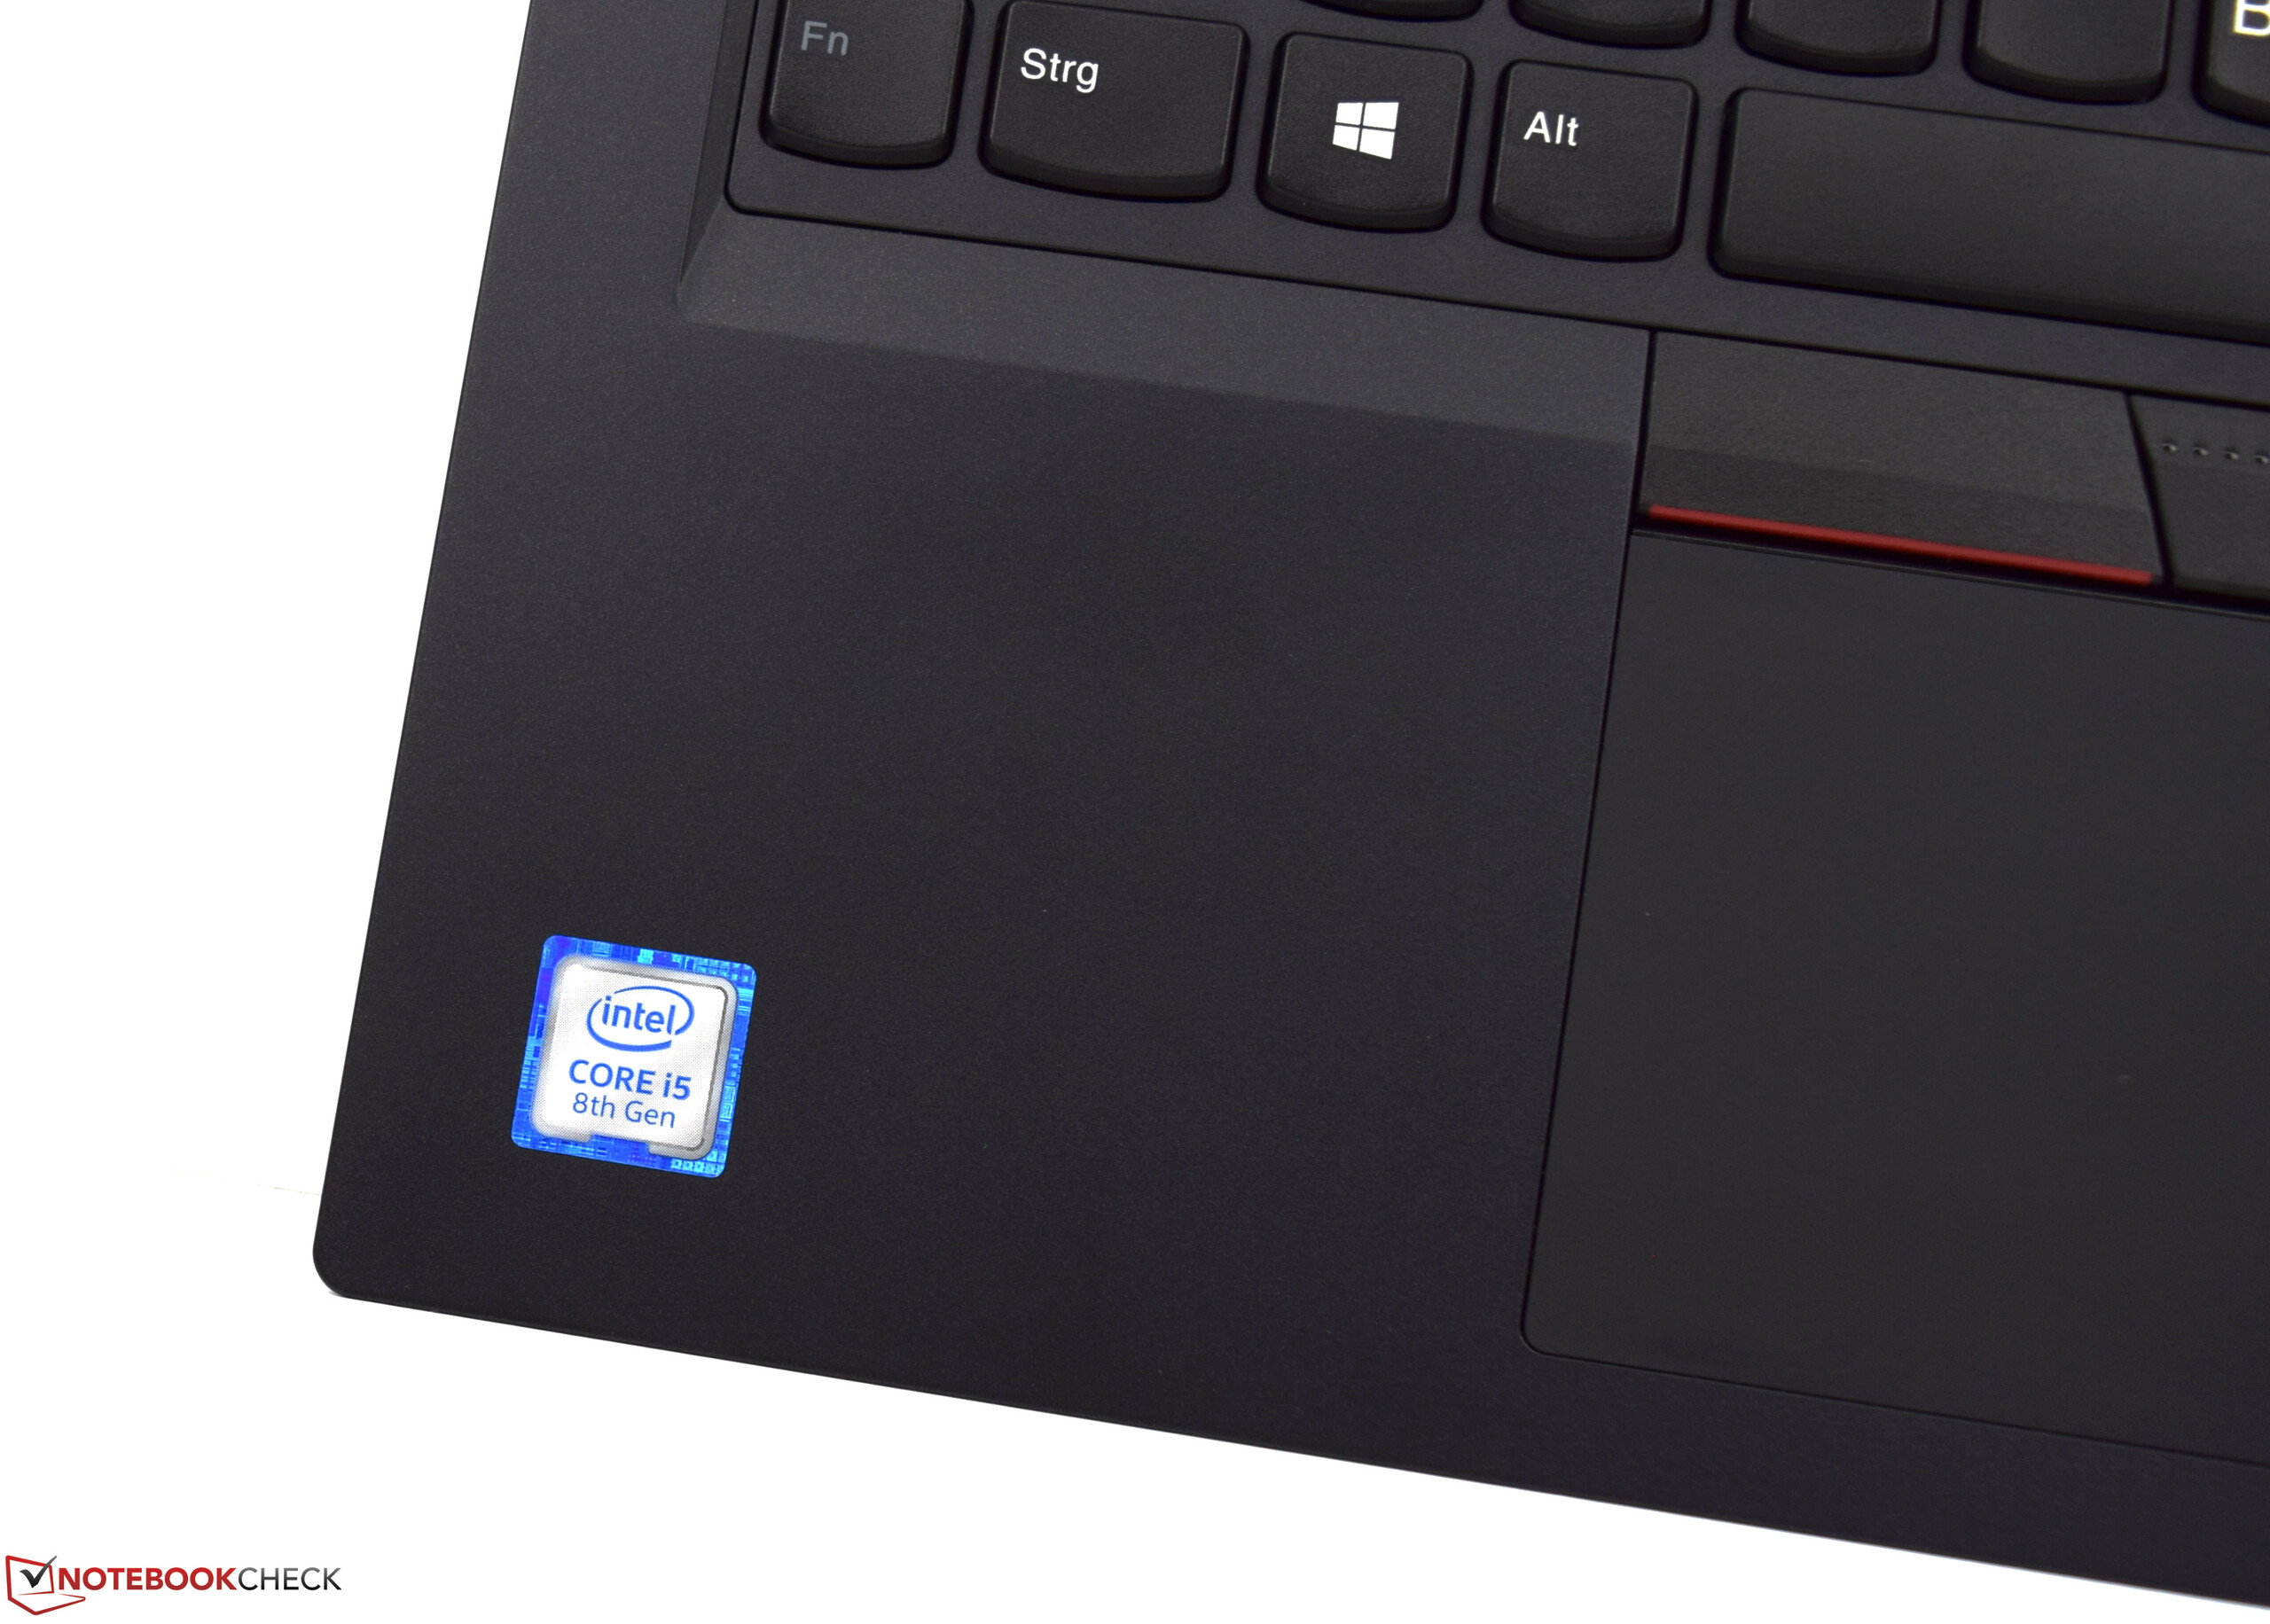
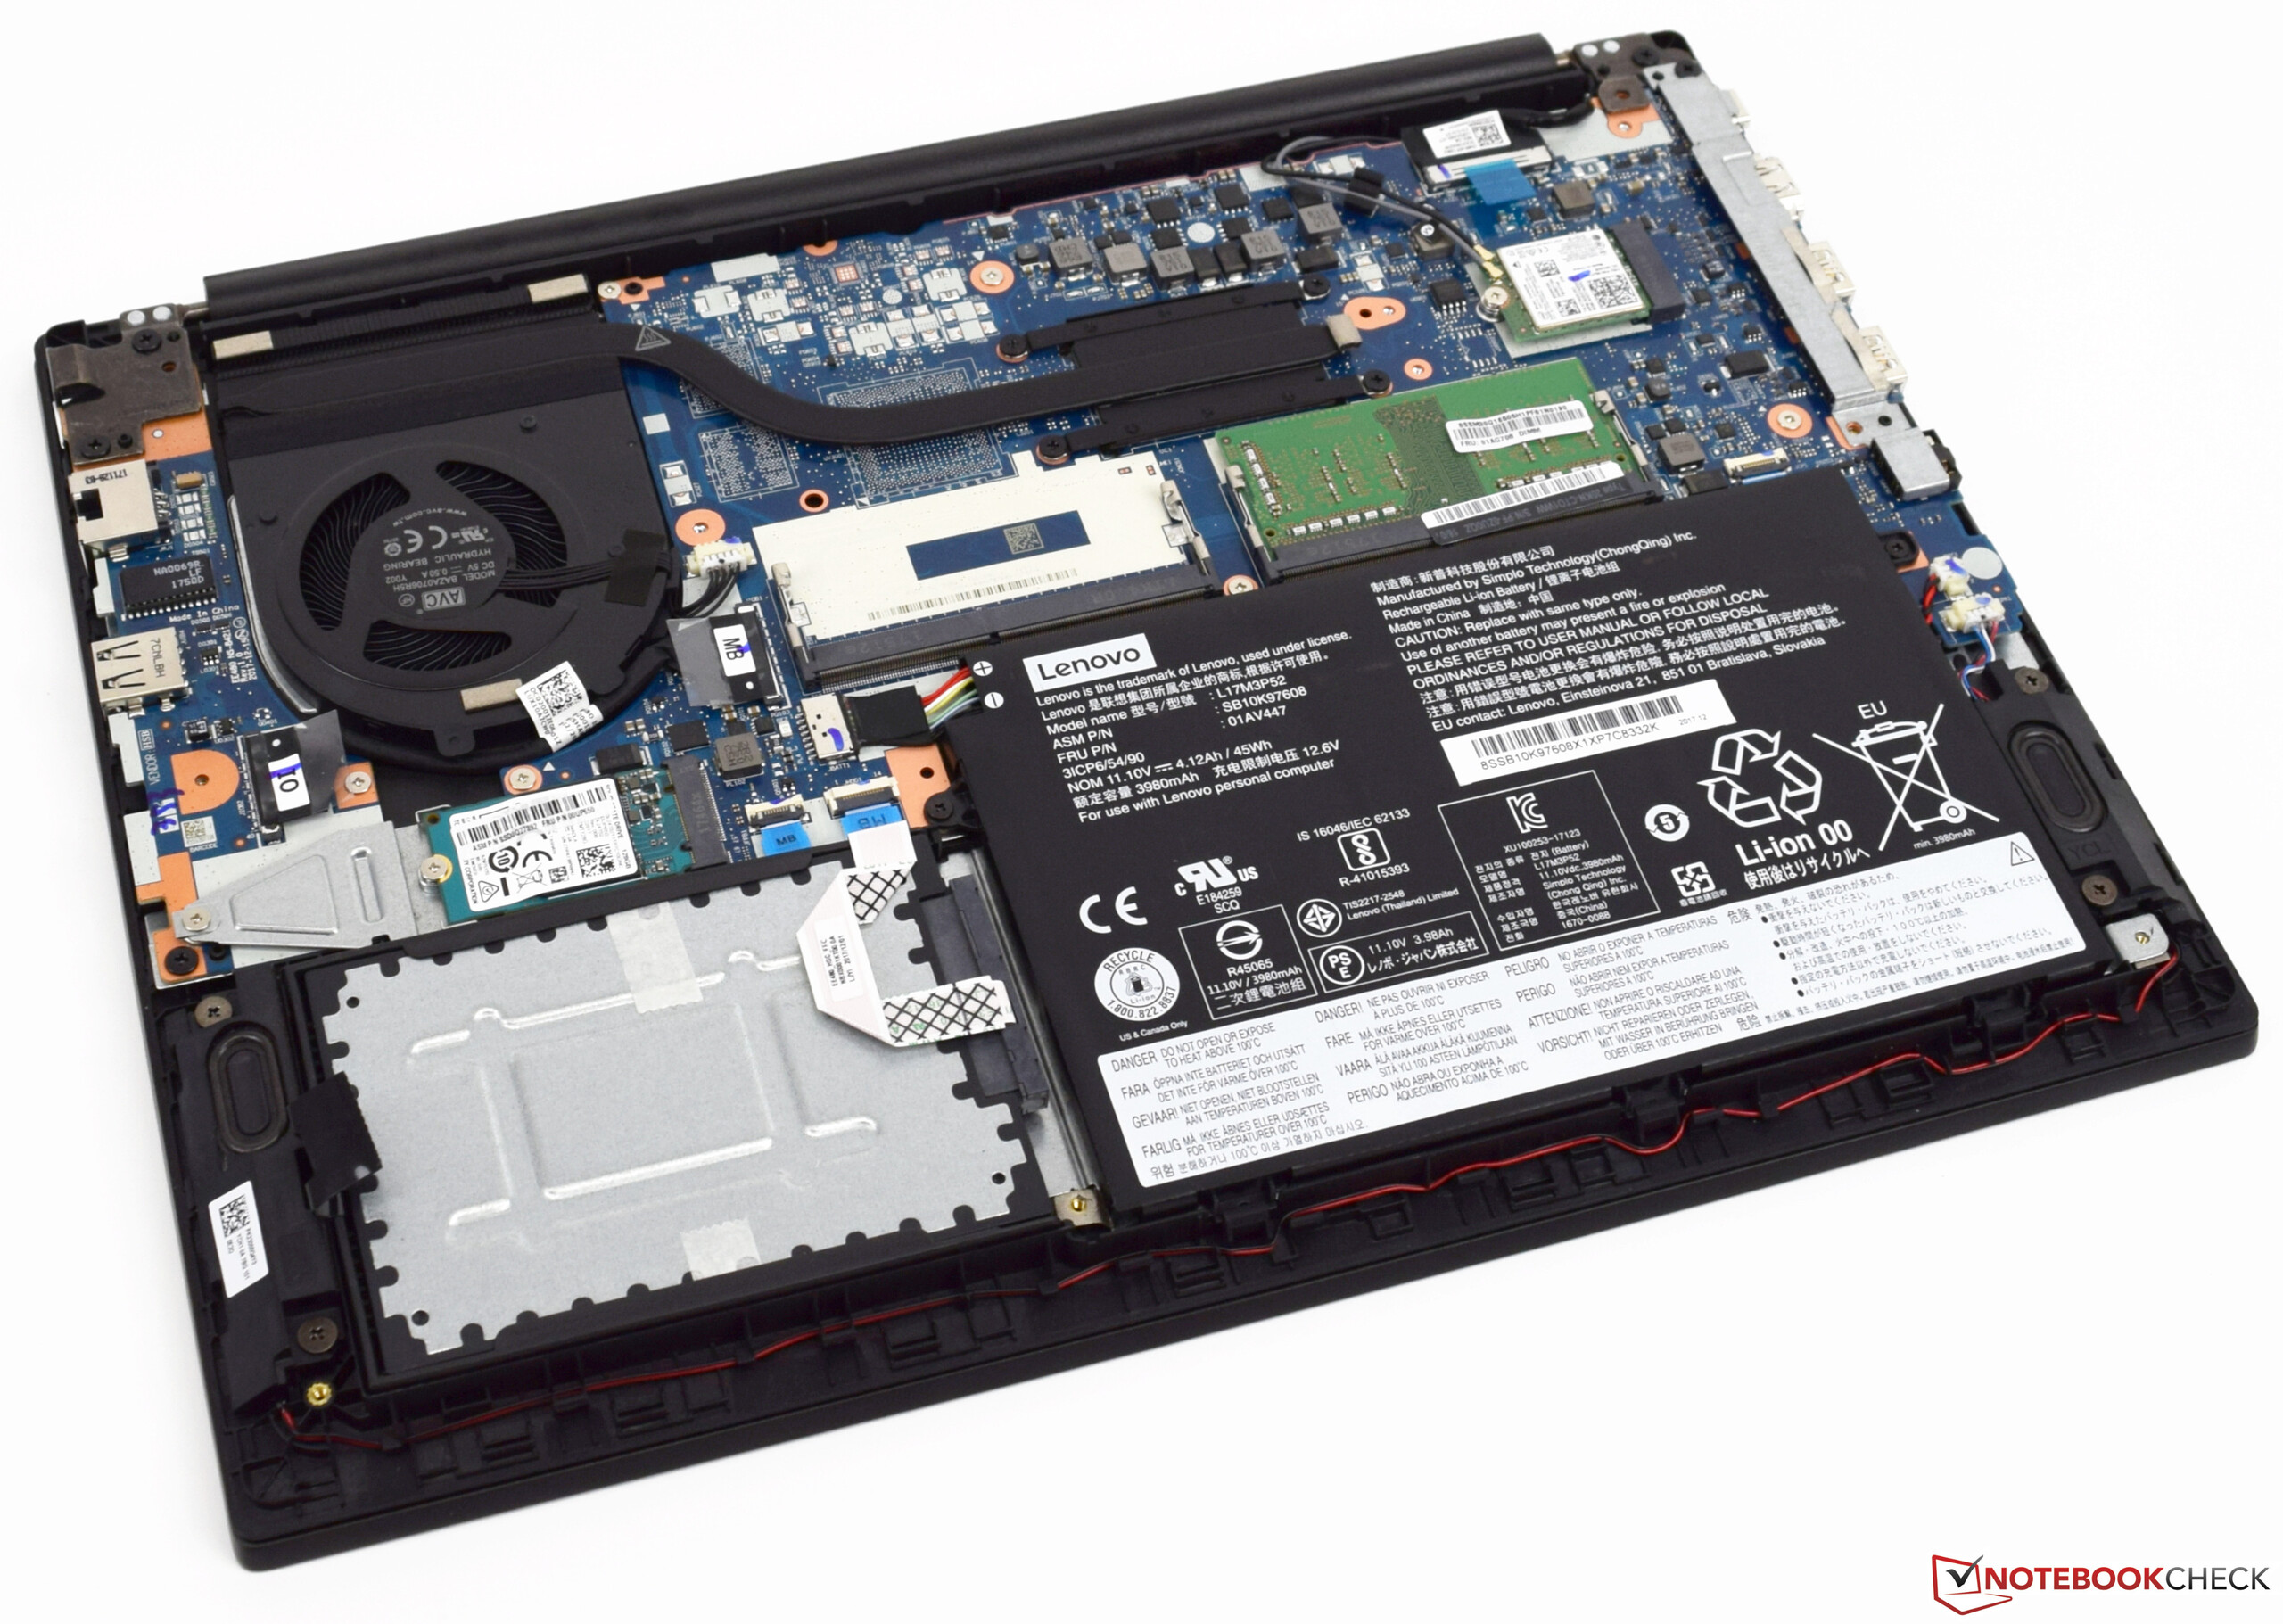
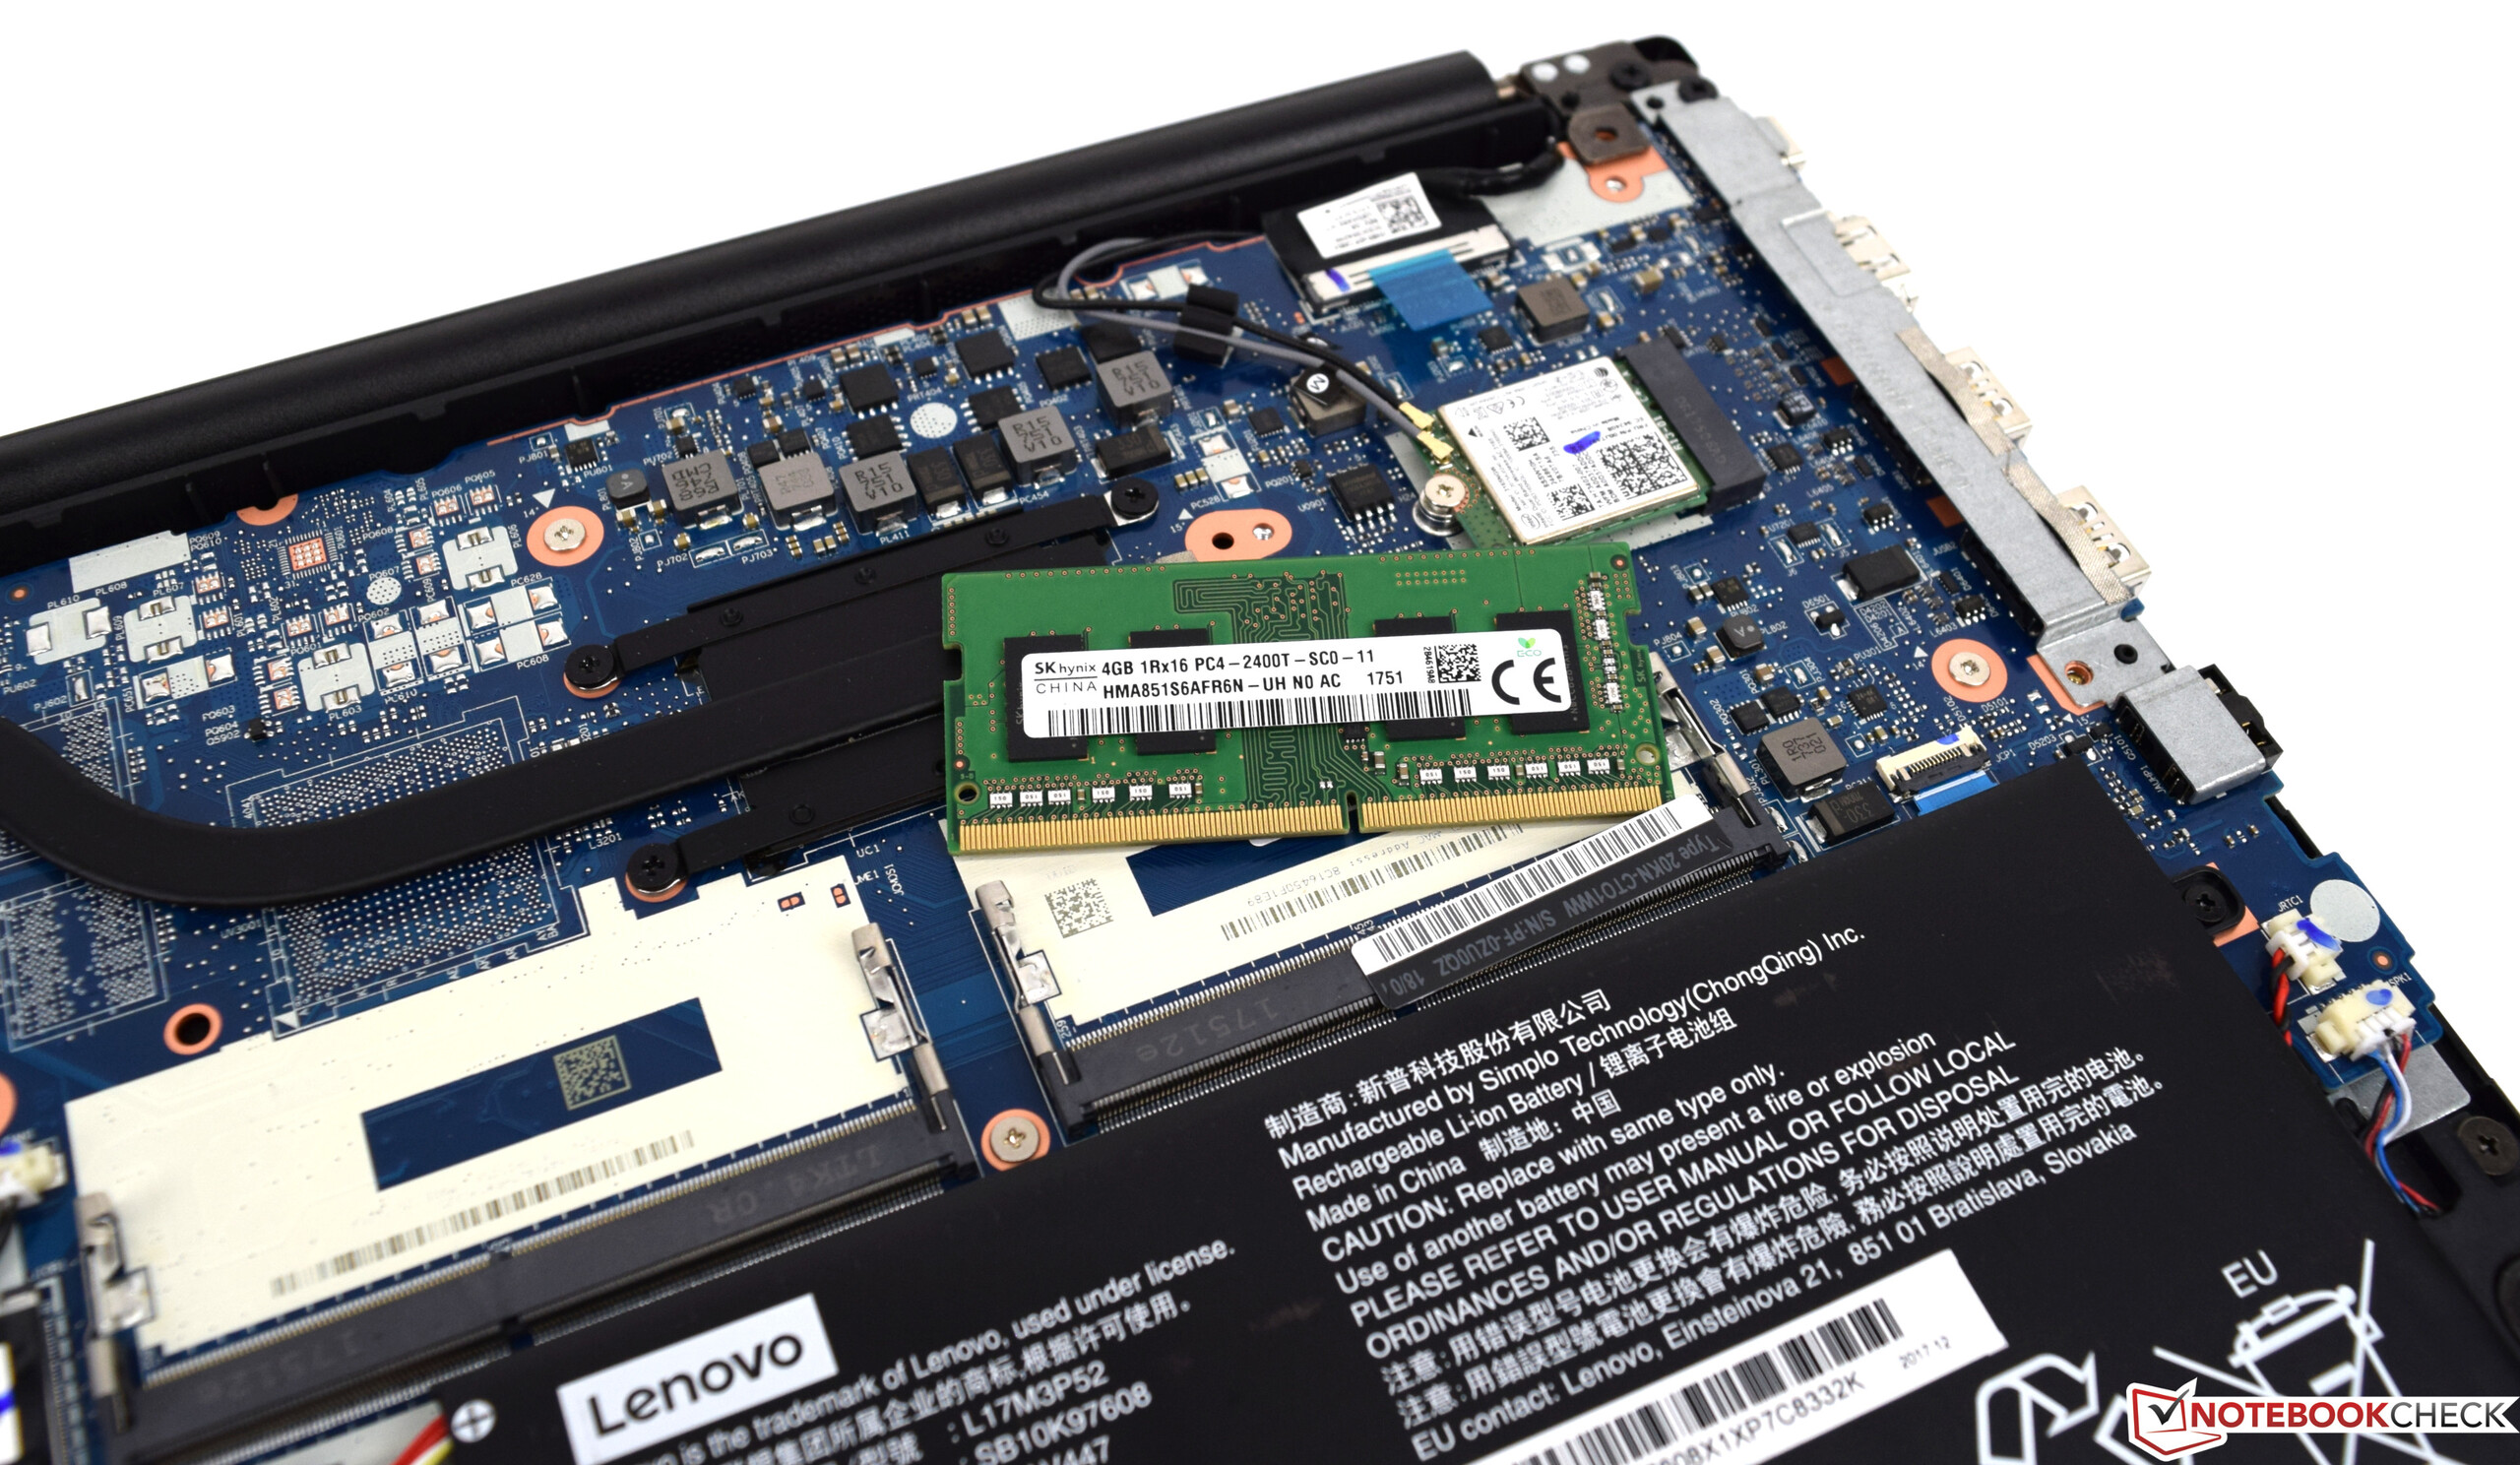
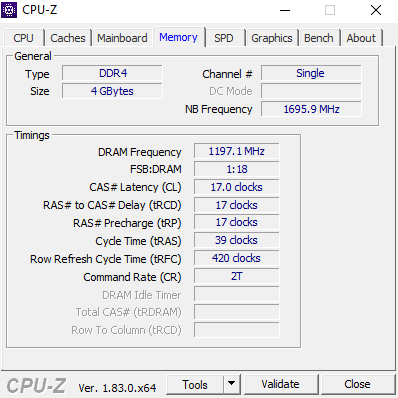
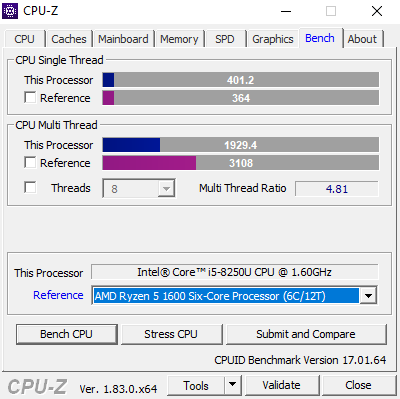
Le Lenovo ThinkPad E480 est un ordinateur de bureau abordable doté d'un équipement puissant. Son processeur Intel Core i5-8250U est puissant mais économe en énergie, permettant ainsi une meilleure consommation que la moyenne, qui bénéficiera très certainement à l’autonomie. Équipé de seulement 4 Go de RAM et de 128 Go de stockage, le ThinkPad E480 garde des prétentions modestes, mais plus que suffisantes pour les tâches de bureau classiques.
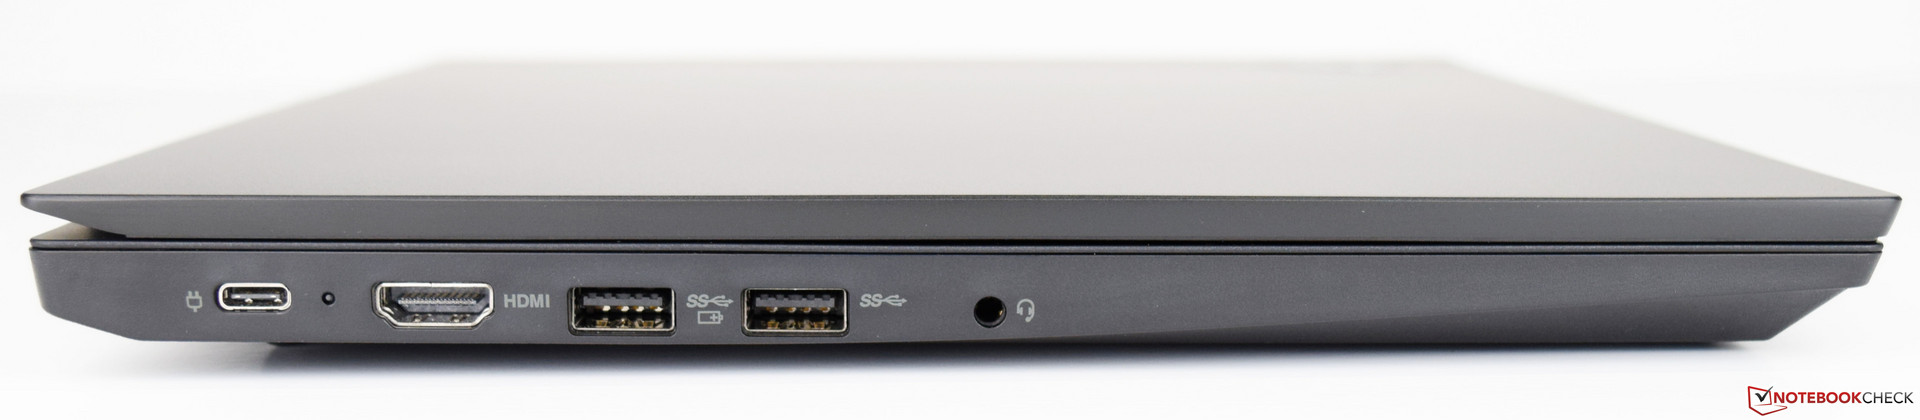
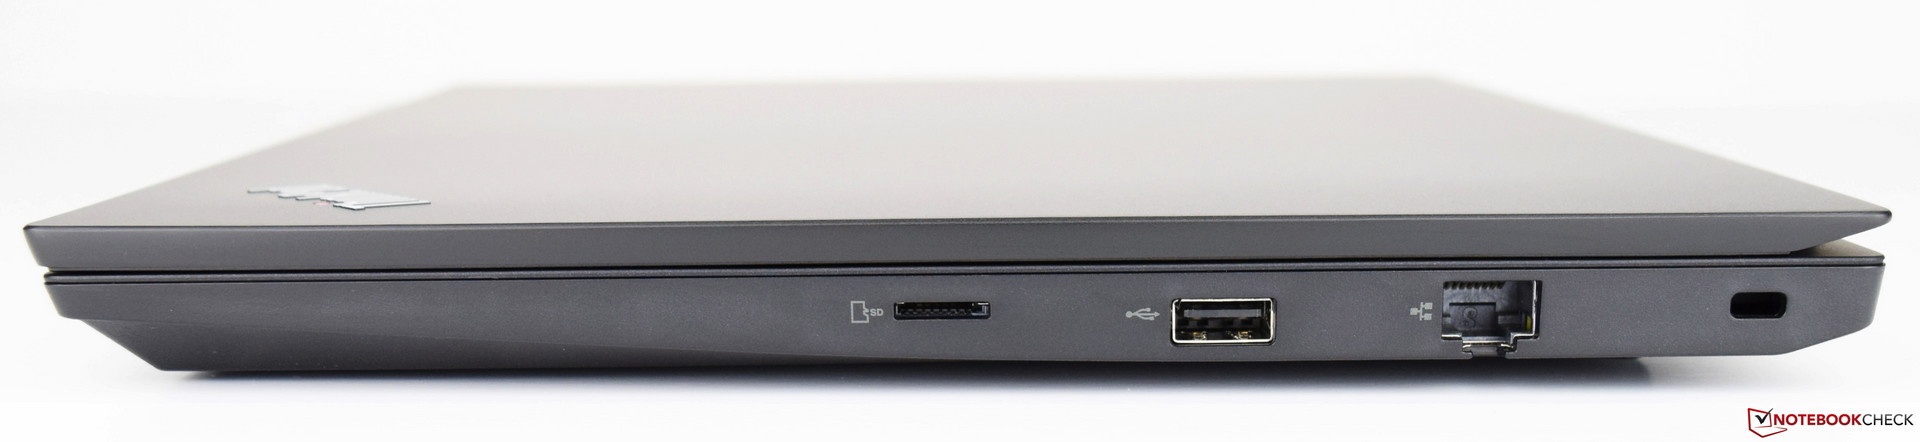
On ne peut pas trop se tromper vu le faible prix de l’E480, dans les 700 €. A la différence du E480 équipé d’une Radeon RX 550 d’AMD, le modèle ici testé mérite notre approbation. Nous avons été particulièrement impressionnés par l’écran IPS très bien contrasté – un tel écran est rarement disponible dans une machine à ce prix. Nos plus grosses critiques portent sur les performances du SSD, et sur l’absence de lecteur de carte SD (remplacé par un lecteur micro SD). Dans l’ensemble, nous avons là un solide ordinateur de bureau avec un prix honnête.
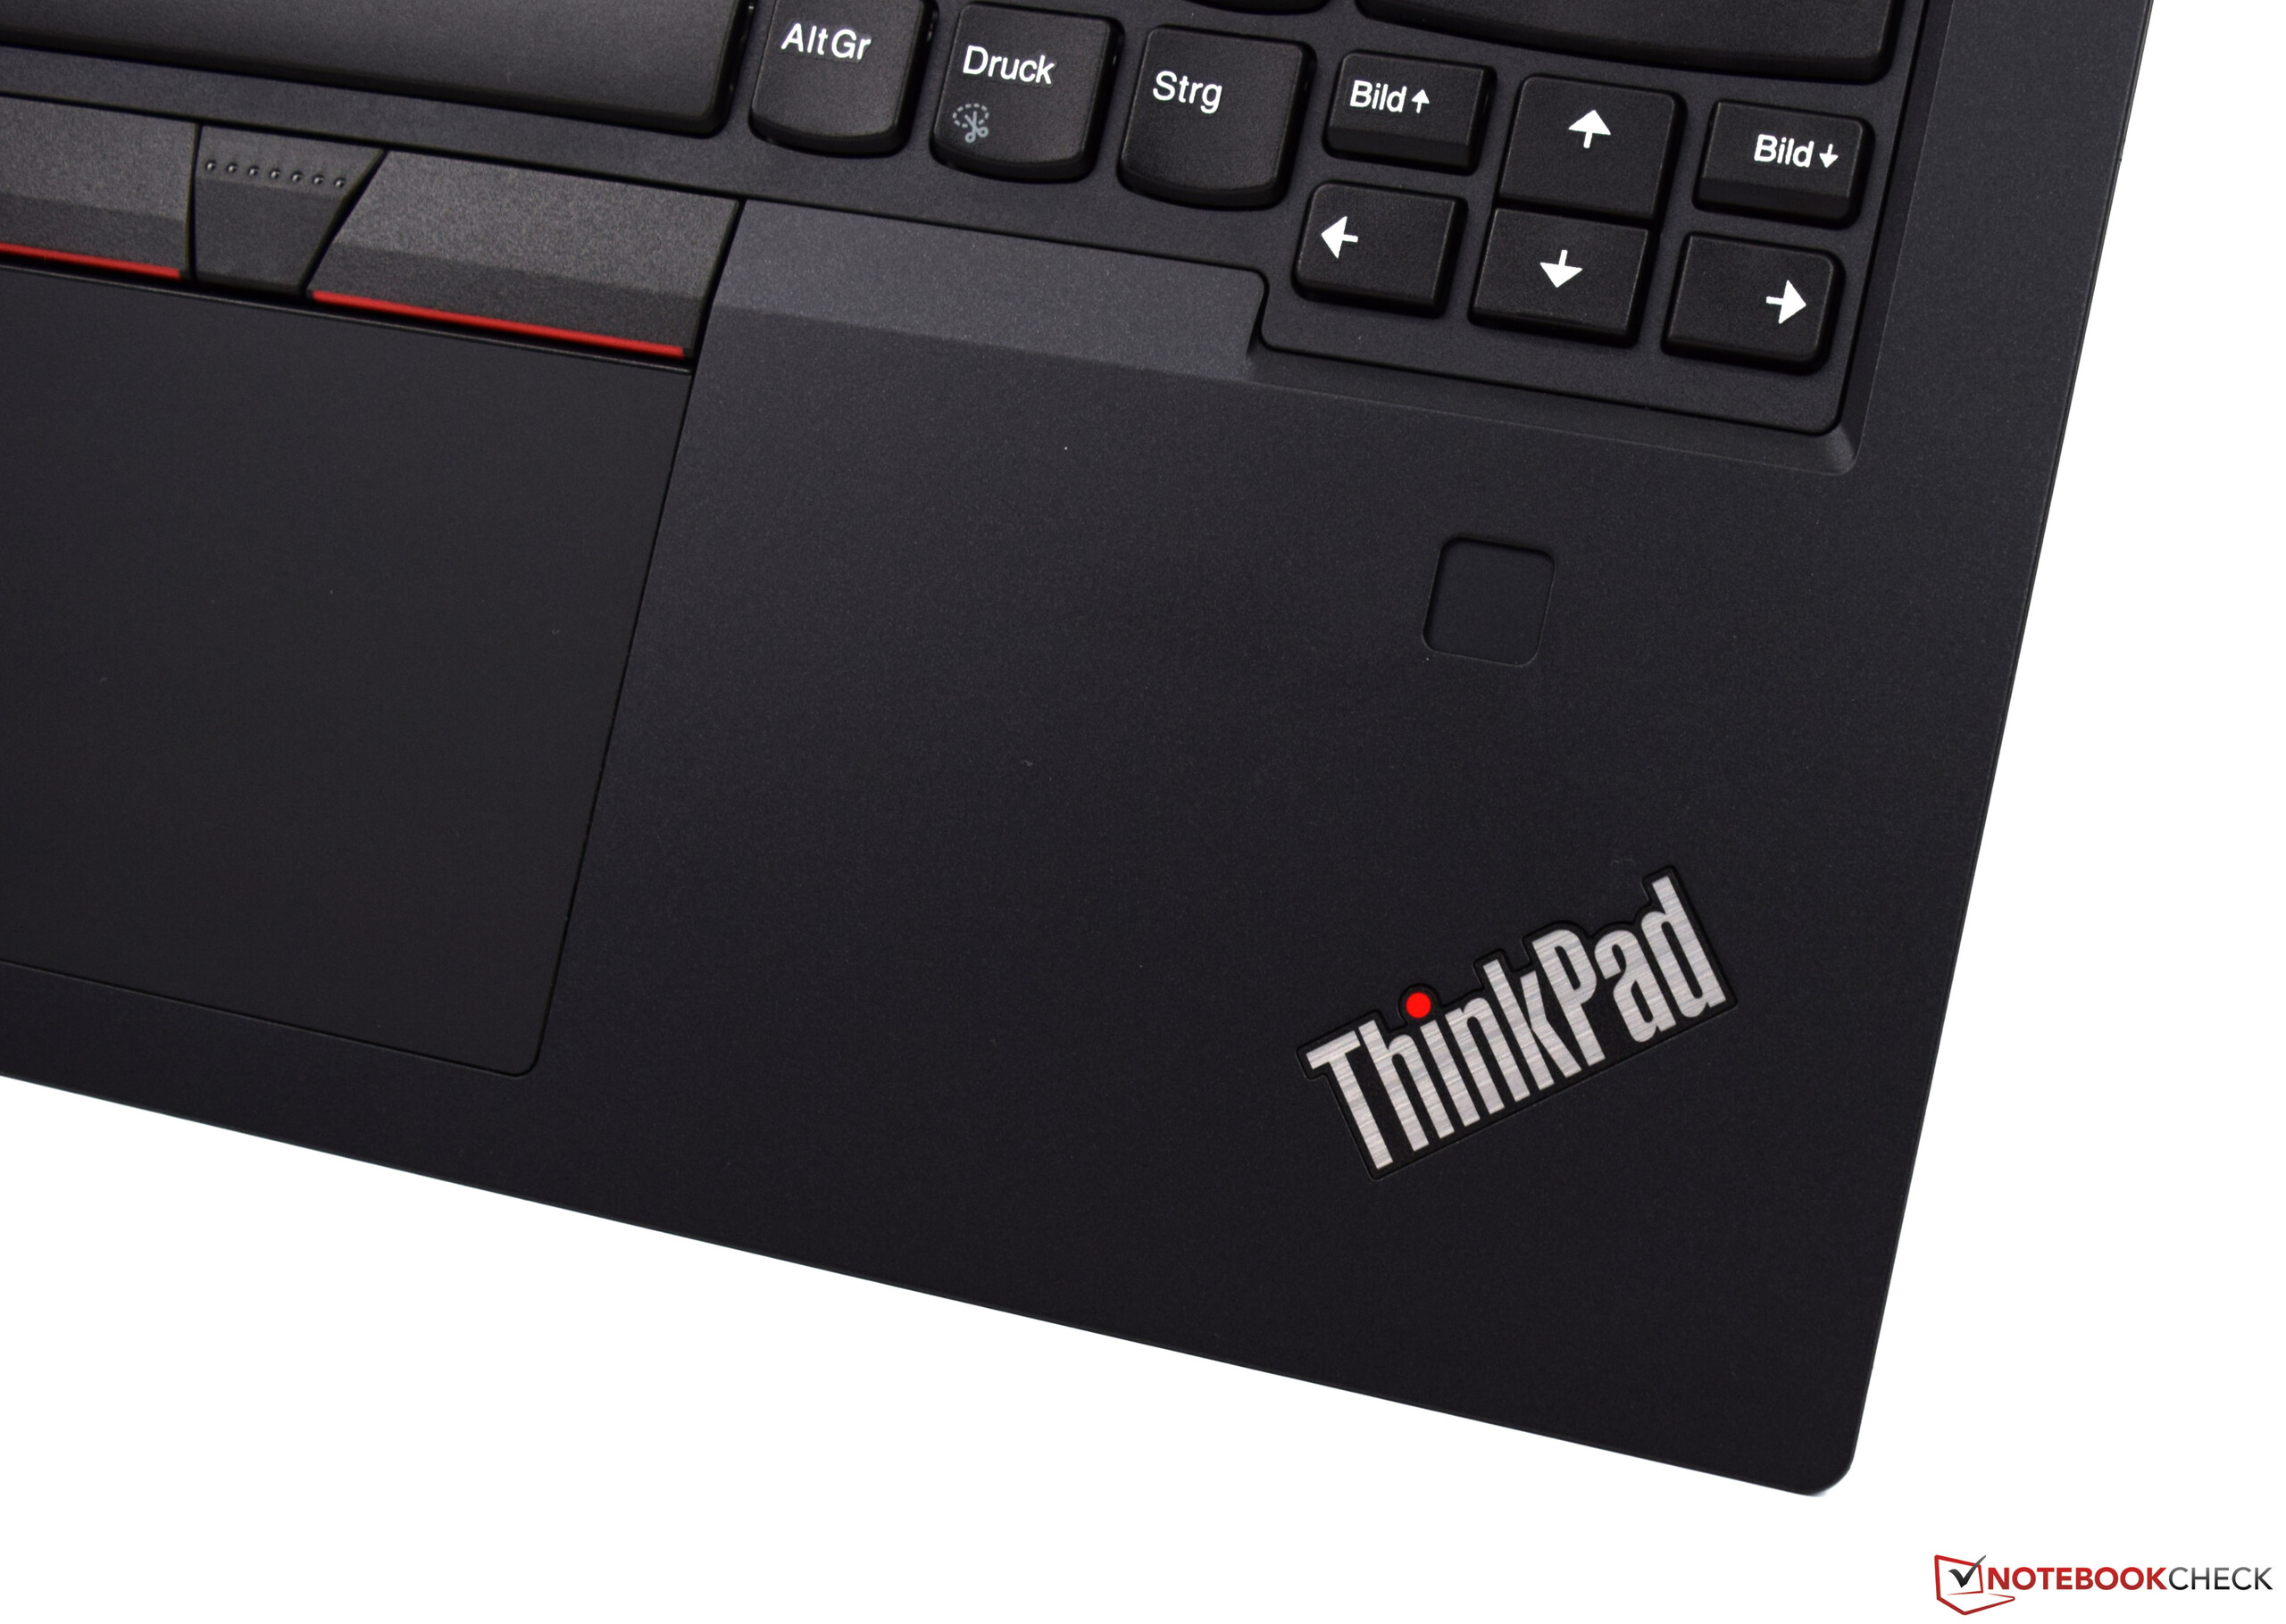
Le Lenovo ThinkPad E480 est une bonne machine, équipée de bons périphériques d’entrée dont nous avons régulièrement loué les qualités par le passé.
L’intégralité de cette critique est disponible en anglais en suivant ce lien.
Lenovo ThinkPad E480-20KNCTO1WW
- 03/13/2018 v6 (old)
Sebastian Bade
Price comparison
