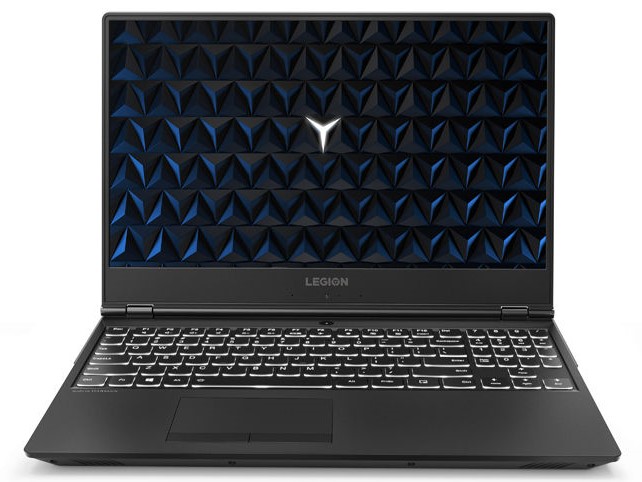
Courte critique du PC portable de jeu Lenovo Legion Y530 (i7-8750H, GTX 1060, FHD)


| Networking | |
| iperf3 transmit AX12 | |
| HP Pavilion Gaming 15-cx0003ng | |
| Razer Blade 15 Base Model | |
| Lenovo Legion Y7000P-1060 | |
| Medion Erazer P6705-MD61131 | |
| Lenovo Legion Y530-15ICH | |
| Lenovo Legion Y530-15ICH | |
| iperf3 receive AX12 | |
| Medion Erazer P6705-MD61131 | |
| Razer Blade 15 Base Model | |
| Lenovo Legion Y530-15ICH | |
| Lenovo Legion Y7000P-1060 | |
| HP Pavilion Gaming 15-cx0003ng | |
| MSI P65 8RF-451 - Creator | |
| Lenovo Legion Y530-15ICH | |
| |||||||||||||||||||||||||
Homogénéité de la luminosité: 83 %
Valeur mesurée au centre, sur batterie: 308 cd/m²
Contraste: 587:1 (Valeurs des noirs: 0.52 cd/m²)
ΔE ColorChecker Calman: 3.63 | ∀{0.5-29.43 Ø4.72}
calibrated: 1.31
ΔE Greyscale Calman: 4.77 | ∀{0.09-98 Ø4.97}
93% sRGB (Argyll 1.6.3 3D)
59% AdobeRGB 1998 (Argyll 1.6.3 3D)
63.8% AdobeRGB 1998 (Argyll 3D)
93% sRGB (Argyll 3D)
62.5% Display P3 (Argyll 3D)
Gamma: 2.54
CCT: 7500 K
| Lenovo Legion Y530-15ICH LG Display LP156WFG-SPB2, , 1920x1080, 15.6" | HP Pavilion Gaming 15-cx0003ng BOE07A1, , 1920x1080, 15.6" | Lenovo Legion Y7000P-1060 BOE NV156FHM-N61, , 1920x1080, 15.6" | Medion Erazer P6705-MD61131 AU Optronics B156HTN03.8 (AUO38ED), , 1920x1080, 15.6" | MSI P65 8RF-451 - Creator AU Optronics B156HAN08.0 (AUO80ED), , 1920x1080, 15.6" | Razer Blade 15 Base Model BOE NV156FHM-N61, , 1920x1080, 15.6" | Lenovo Legion Y530-15ICH B156HAN02.1, , 1920x1080, 15.6" | |
|---|---|---|---|---|---|---|---|
| Display | -36% | -1% | -41% | 2% | -1% | -38% | |
| Display P3 Coverage (%) | 62.5 | 39.72 -36% | 66.1 6% | 36.4 -42% | 65.1 4% | 66.3 6% | 38.31 -39% |
| sRGB Coverage (%) | 93 | 59.3 -36% | 86.4 -7% | 54.8 -41% | 91.1 -2% | 86.6 -7% | 57.3 -38% |
| AdobeRGB 1998 Coverage (%) | 63.8 | 41.04 -36% | 63.1 -1% | 37.61 -41% | 65.9 3% | 63.3 -1% | 39.58 -38% |
| Response Times | -198% | -206% | -122% | -4% | -191% | -193% | |
| Response Time Grey 50% / Grey 80% * (ms) | 15 ? | 47 ? -213% | 42.8 ? -185% | 44.8 ? -199% | 16 ? -7% | 39.2 ? -161% | 43.6 ? -191% |
| Response Time Black / White * (ms) | 11 ? | 31 ? -182% | 36 ? -227% | 16 ? -45% | 11 ? -0% | 35.2 ? -220% | 32.4 ? -195% |
| PWM Frequency (Hz) | 208 ? | 21740 ? | 21190 ? | ||||
| Screen | 7% | -17% | -71% | -5% | -5% | -36% | |
| Brightness middle (cd/m²) | 305 | 241 -21% | 312.9 3% | 200 -34% | 235 -23% | 273.6 -10% | 282.8 -7% |
| Brightness (cd/m²) | 284 | 236 -17% | 296 4% | 186 -35% | 235 -17% | 262 -8% | 264 -7% |
| Brightness Distribution (%) | 83 | 75 -10% | 88 6% | 85 2% | 85 2% | 86 4% | 88 6% |
| Black Level * (cd/m²) | 0.52 | 0.15 71% | 0.37 29% | 0.43 17% | 0.22 58% | 0.3 42% | 0.42 19% |
| Contrast (:1) | 587 | 1607 174% | 846 44% | 465 -21% | 1068 82% | 912 55% | 673 15% |
| Colorchecker dE 2000 * | 3.63 | 4.85 -34% | 5.49 -51% | 11.39 -214% | 2.82 22% | 3.22 11% | 4.93 -36% |
| Colorchecker dE 2000 max. * | 8.18 | 8.82 -8% | 8.78 -7% | 19.36 -137% | 4.82 41% | 7.61 7% | 17.65 -116% |
| Colorchecker dE 2000 calibrated * | 1.31 | 3.99 -205% | 3.05 -133% | 4.88 -273% | 4.1 -213% | 4.07 -211% | |
| Greyscale dE 2000 * | 4.77 | 5.15 -8% | 4.7 1% | 11.73 -146% | 2.32 51% | 1.4 71% | 3.8 20% |
| Gamma | 2.54 87% | 2.49 88% | 2.29 96% | 1.97 112% | 2.49 88% | 2.24 98% | 2.449 90% |
| CCT | 7500 87% | 7042 92% | 6779 96% | 12614 52% | 6310 103% | 6636 98% | 6112 106% |
| Color Space (Percent of AdobeRGB 1998) (%) | 59 | 38 -36% | 56.3 -5% | 35 -41% | 59 0% | 56.4 -4% | 36 -39% |
| Color Space (Percent of sRGB) (%) | 93 | 59 -37% | 86.1 -7% | 55 -41% | 92 -1% | 86.2 -7% | 57 -39% |
| Moyenne finale (programmes/paramètres) | -76% /
-29% | -75% /
-38% | -78% /
-72% | -2% /
-4% | -66% /
-27% | -89% /
-56% |
* ... Moindre est la valeur, meilleures sont les performances
Temps de réponse de l'écran
| ↔ Temps de réponse noir à blanc | ||
|---|---|---|
| 11 ms ... hausse ↗ et chute ↘ combinées | ↗ 7 ms hausse | 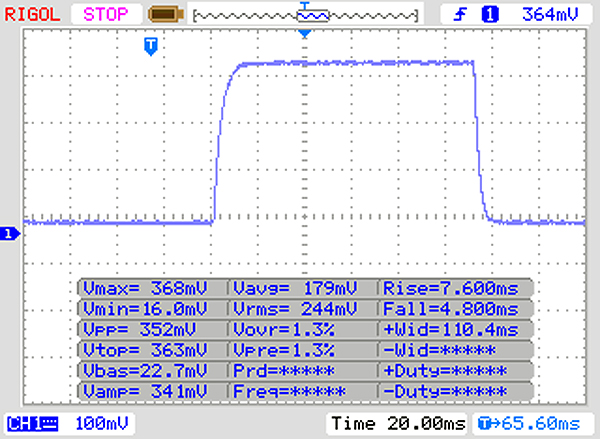 |
| ↘ 4 ms chute | ||
| L'écran montre de bons temps de réponse, mais insuffisant pour du jeu compétitif. En comparaison, tous les appareils testés affichent entre 0.1 (minimum) et 240 (maximum) ms. » 30 % des appareils testés affichent de meilleures performances. Cela signifie que les latences relevées sont meilleures que la moyenne (19.8 ms) de tous les appareils testés. | ||
| ↔ Temps de réponse gris 50% à gris 80% | ||
| 15 ms ... hausse ↗ et chute ↘ combinées | ↗ 8 ms hausse | 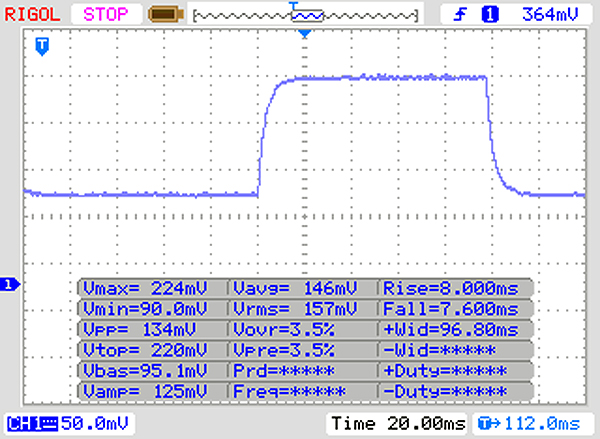 |
| ↘ 7 ms chute | ||
| L'écran montre de bons temps de réponse, mais insuffisant pour du jeu compétitif. En comparaison, tous les appareils testés affichent entre 0.165 (minimum) et 636 (maximum) ms. » 29 % des appareils testés affichent de meilleures performances. Cela signifie que les latences relevées sont meilleures que la moyenne (31 ms) de tous les appareils testés. | ||
Scintillement / MLI (Modulation de largeur d'impulsion)
| Scintillement / MLI (Modulation de largeur d'impulsion) non décelé | 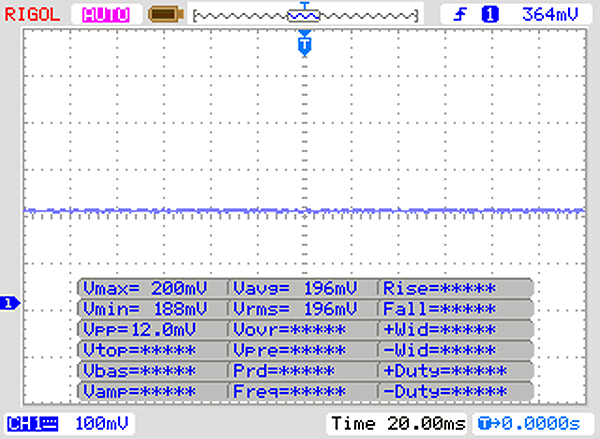 | ||
En comparaison, 52 % des appareils testés n'emploient pas MDI pour assombrir leur écran. Nous avons relevé une moyenne à 7769 (minimum : 5 - maximum : 343500) Hz dans le cas où une MDI était active. | |||
| PCMark 8 Home Score Accelerated v2 | 4440 points | |
| PCMark 8 Work Score Accelerated v2 | 5543 points | |
| PCMark 10 Score | 5125 points | |
Aide | ||
| Lenovo Legion Y530-15ICH Samsung SSD PM981 MZVLB256HAHQ | HP Pavilion Gaming 15-cx0003ng Intel Optane 16 GB MEMPEK1J016GAH + HGST HTS721010A9E630 1 TB HDD | Lenovo Legion Y7000P-1060 Samsung SSD PM981 MZVLB256HAHQ | Medion Erazer P6705-MD61131 Samsung SSD PM981 MZVLB256HAHQ | MSI P65 8RF-451 - Creator Kingston RBUSNS8154P3512GJ | Razer Blade 15 Base Model Samsung SSD PM981 MZVLB256HAHQ | Lenovo Legion Y530-15ICH Toshiba KBG30ZMT128G | Moyenne Samsung SSD PM981 MZVLB256HAHQ | |
|---|---|---|---|---|---|---|---|---|
| CrystalDiskMark 5.2 / 6 | -31% | -8% | 11% | -16% | 9% | -46% | 58% | |
| Write 4K (MB/s) | 108.9 | 59.2 -46% | 92.3 -15% | 107 -2% | 89.2 -18% | 112.5 3% | 71.8 -34% | 116.1 ? 7% |
| Read 4K (MB/s) | 40.23 | 91.3 127% | 39.04 -3% | 39.91 -1% | 34.36 -15% | 43.09 7% | 41.03 2% | 189.5 ? 371% |
| Write Seq (MB/s) | 1390 | 158.3 -89% | 1218 -12% | 1439 4% | 949 -32% | 1450 4% | 349 -75% | 1409 ? 1% |
| Read Seq (MB/s) | 964 | 880 -9% | 755 -22% | 2011 109% | 899 -7% | 1392 44% | 736 -24% | 1624 ? 68% |
| Write 4K Q32T1 (MB/s) | 314.2 | 161.8 -49% | 280.7 -11% | 282.1 -10% | 371.4 18% | 356.1 13% | 105.3 -66% | 360 ? 15% |
| Read 4K Q32T1 (MB/s) | 369.2 | 286.5 -22% | 328 -11% | 326.6 -12% | 399 8% | 406.9 10% | 308 -17% | 396 ? 7% |
| Write Seq Q32T1 (MB/s) | 1506 | 159.8 -89% | 1698 13% | 1441 -4% | 1035 -31% | 1451 -4% | 151.4 -90% | 1492 ? -1% |
| Read Seq Q32T1 (MB/s) | 3446 | 929 -73% | 3430 0% | 3516 2% | 1603 -53% | 3272 -5% | 1262 -63% | 3313 ? -4% |
| Write 4K Q8T8 (MB/s) | 760 | 1152 ? | ||||||
| Read 4K Q8T8 (MB/s) | 811 | 736 ? | ||||||
| AS SSD | -1631% | 60% | 19% | 11% | 58% | -160% | 50% | |
| Seq Read (MB/s) | 1808 | 854 -53% | 864 -52% | 2724 51% | 850 -53% | 1803 0% | 1231 -32% | 2032 ? 12% |
| Seq Write (MB/s) | 1429 | 147 -90% | 1646 15% | 1365 -4% | 869 -39% | 1367 -4% | 131.6 -91% | 1339 ? -6% |
| 4K Read (MB/s) | 46.1 | 105.1 128% | 32.4 -30% | 46.14 0% | 36.43 -21% | 40.75 -12% | 38.71 -16% | 46.1 ? 0% |
| 4K Write (MB/s) | 97 | 59.5 -39% | 88 -9% | 102.6 6% | 84.4 -13% | 93 -4% | 35.74 -63% | 107.4 ? 11% |
| 4K-64 Read (MB/s) | 536 | 42.09 -92% | 770 44% | 567 6% | 839 57% | 749 40% | 335.3 -37% | 712 ? 33% |
| 4K-64 Write (MB/s) | 273.6 | 137.3 -50% | 1392 409% | 459.8 68% | 602 120% | 1270 364% | 78.9 -71% | 999 ? 265% |
| Access Time Read * (ms) | 0.085 | 14.99 -17535% | 0.103 -21% | 0.08 6% | 0.104 -22% | 0.113 -33% | 0.626 -636% | 0.07076 ? 17% |
| Access Time Write * (ms) | 0.038 | 0.043 -13% | 0.044 -16% | 0.037 3% | 0.044 -16% | 0.04 -5% | 0.287 -655% | 0.04352 ? -15% |
| Score Read (Points) | 763 | 233 -69% | 888 16% | 886 16% | 960 26% | 970 27% | 497 -35% | 961 ? 26% |
| Score Write (Points) | 514 | 211 -59% | 1644 220% | 699 36% | 773 50% | 1499 192% | 128 -75% | 1240 ? 141% |
| Score Total (Points) | 1663 | 577 -65% | 3032 82% | 1983 19% | 2233 34% | 2952 78% | 838 -50% | 2671 ? 61% |
| Copy ISO MB/s (MB/s) | 110.1 | 1677 | 840 | 1892 | 1297 ? | |||
| Copy Program MB/s (MB/s) | 94.1 | 764 | 306.9 | 495.5 | 409 ? | |||
| Copy Game MB/s (MB/s) | 81.7 | 1298 | 622 | 1070 | 786 ? | |||
| Moyenne finale (programmes/paramètres) | -831% /
-957% | 26% /
31% | 15% /
15% | -3% /
-0% | 34% /
38% | -103% /
-112% | 54% /
53% |
* ... Moindre est la valeur, meilleures sont les performances

| 3DMark 11 - 1280x720 Performance GPU | |
| Moyenne de la classe Gaming (21841 - 80022, n=106, 2 dernières années) | |
| MSI P65 8RF-451 - Creator | |
| Moyenne NVIDIA GeForce GTX 1060 Mobile (12620 - 15607, n=77) | |
| Lenovo Legion Y530-15ICH | |
| Lenovo Legion Y7000P-1060 | |
| Razer Blade 15 Base Model | |
| Lenovo Legion Y530-15ICH | |
| Medion Erazer P6705-MD61131 | |
| HP Pavilion Gaming 15-cx0003ng | |
| 3DMark 11 Performance | 13743 points | |
| 3DMark Cloud Gate Standard Score | 34124 points | |
| 3DMark Fire Strike Score | 10389 points | |
Aide | ||
| The Witcher 3 | |
| 1920x1080 High Graphics & Postprocessing (Nvidia HairWorks Off) | |
| Moyenne de la classe Gaming (181 - 341, n=3, 2 dernières années) | |
| MSI P65 8RF-451 - Creator | |
| Lenovo Legion Y530-15ICH | |
| Lenovo Legion Y7000P-1060 | |
| Razer Blade 15 Base Model | |
| Moyenne NVIDIA GeForce GTX 1060 Mobile (52.6 - 80.6, n=49) | |
| Medion Erazer P6705-MD61131 | |
| HP Pavilion Gaming 15-cx0003ng | |
| 1920x1080 Ultra Graphics & Postprocessing (HBAO+) | |
| Moyenne de la classe Gaming (95 - 240, n=8, 2 dernières années) | |
| MSI P65 8RF-451 - Creator | |
| Lenovo Legion Y530-15ICH | |
| Moyenne NVIDIA GeForce GTX 1060 Mobile (24 - 42.3, n=60) | |
| Razer Blade 15 Base Model | |
| Lenovo Legion Y530-15ICH | |
| Lenovo Legion Y7000P-1060 | |
| Medion Erazer P6705-MD61131 | |
| HP Pavilion Gaming 15-cx0003ng | |
| Bas | Moyen | Élevé | Ultra | |
|---|---|---|---|---|
| BioShock Infinite (2013) | 280.5 | 232.6 | 224.8 | 114.2 |
| Thief (2014) | 98.4 | 77.9 | ||
| The Witcher 3 (2015) | 78 | 41.4 | ||
| Rise of the Tomb Raider (2016) | 64.8 |
Degré de la nuisance sonore
| Au repos |
| 30.9 / 30.9 / 31.6 dB(A) |
| Disque dur |
| 31.3 dB(A) |
| Fortement sollicité |
| 42.3 / 40 dB(A) |
 | ||
30 dB silencieux 40 dB(A) audible 50 dB(A) bruyant |
||
min: | ||
(-) La température maximale du côté supérieur est de 48.4 °C / 119 F, par rapport à la moyenne de 40.4 °C / 105 F, allant de 21.2 à 68.8 °C pour la classe Gaming.
(-) Le fond chauffe jusqu'à un maximum de 48 °C / 118 F, contre une moyenne de 43.2 °C / 110 F
(+) En utilisation inactive, la température moyenne du côté supérieur est de 25.8 °C / 78 F, par rapport à la moyenne du dispositif de 33.9 °C / 93 F.
(+) Les repose-poignets et le pavé tactile sont plus froids que la température de la peau avec un maximum de 29.6 °C / 85.3 F et sont donc froids au toucher.
(±) La température moyenne de la zone de l'appui-paume de dispositifs similaires était de 28.8 °C / 83.8 F (-0.8 °C / #-1.5 F).
Lenovo Legion Y530-15ICH analyse audio
(-) | haut-parleurs pas très forts (68.3 dB)
Basses 100 - 315 Hz
(±) | basse réduite - en moyenne 11.5% inférieure à la médiane
(+) | les basses sont linéaires (6.4% delta à la fréquence précédente)
Médiums 400 - 2000 Hz
(±) | médiane supérieure - en moyenne 5% supérieure à la médiane
(+) | les médiums sont linéaires (6.9% delta à la fréquence précédente)
Aiguës 2 - 16 kHz
(+) | des sommets équilibrés - à seulement 3% de la médiane
(+) | les aigus sont linéaires (4.6% delta à la fréquence précédente)
Globalement 100 - 16 000 Hz
(±) | la linéarité du son global est moyenne (16% de différence avec la médiane)
Par rapport à la même classe
» 38% de tous les appareils testés de cette catégorie étaient meilleurs, 6% similaires, 55% pires
» Le meilleur avait un delta de 6%, la moyenne était de 18%, le pire était de 132%.
Par rapport à tous les appareils testés
» 25% de tous les appareils testés étaient meilleurs, 5% similaires, 70% pires
» Le meilleur avait un delta de 4%, la moyenne était de 24%, le pire était de 134%.
| Éteint/en veille | |
| Au repos | |
| Fortement sollicité |
|
Légende:
min: | |
| Lenovo Legion Y530-15ICH i7-8750H, GeForce GTX 1060 Mobile, Samsung SSD PM981 MZVLB256HAHQ, IPS, 1920x1080, 15.6" | HP Pavilion Gaming 15-cx0003ng i7-8750H, GeForce GTX 1050 Ti Mobile, Intel Optane 16 GB MEMPEK1J016GAH + HGST HTS721010A9E630 1 TB HDD, IPS, 1920x1080, 15.6" | Lenovo Legion Y7000P-1060 i7-8750H, GeForce GTX 1060 Mobile, Samsung SSD PM981 MZVLB256HAHQ, IPS, 1920x1080, 15.6" | Medion Erazer P6705-MD61131 i7-8750H, GeForce GTX 1050 Ti Mobile, Samsung SSD PM981 MZVLB256HAHQ, TN, 1920x1080, 15.6" | MSI P65 8RF-451 - Creator i7-8750H, GeForce GTX 1070 Max-Q, Kingston RBUSNS8154P3512GJ, IPS, 1920x1080, 15.6" | Razer Blade 15 Base Model i7-8750H, GeForce GTX 1060 Max-Q, Samsung SSD PM981 MZVLB256HAHQ, IPS, 1920x1080, 15.6" | Lenovo Legion Y530-15ICH i5-8300H, GeForce GTX 1050 Ti Mobile, Toshiba KBG30ZMT128G, IPS, 1920x1080, 15.6" | Moyenne NVIDIA GeForce GTX 1060 Mobile | Moyenne de la classe Gaming | |
|---|---|---|---|---|---|---|---|---|---|
| Power Consumption | 16% | 5% | 27% | -6% | -14% | 16% | -36% | -59% | |
| Idle Minimum * (Watt) | 7.3 | 5.5 25% | 4.9 33% | 4 45% | 7.4 -1% | 10.2 -40% | 4.5 38% | 12.7 ? -74% | 13.2 ? -81% |
| Idle Average * (Watt) | 11.1 | 8.5 23% | 8.1 27% | 7 37% | 11.7 -5% | 13.2 -19% | 10 10% | 17.5 ? -58% | 18.9 ? -70% |
| Idle Maximum * (Watt) | 12.6 | 11.9 6% | 16.5 -31% | 11 13% | 16.8 -33% | 17.6 -40% | 13.8 -10% | 21.8 ? -73% | 24.5 ? -94% |
| Load Average * (Watt) | 109 | 94 14% | 109.2 -0% | 72 34% | 94 14% | 99.5 9% | 92.5 15% | 91.7 ? 16% | 108.8 ? -0% |
| Load Maximum * (Watt) | 168 | 144 14% | 175.2 -4% | 158 6% | 177 -5% | 133.3 21% | 123.2 27% | 156.4 ? 7% | 254 ? -51% |
| Witcher 3 ultra * (Watt) | 86 | 124.6 | 79 | 113.6 | 108.1 |
* ... Moindre est la valeur, meilleures sont les performances
| Lenovo Legion Y530-15ICH i7-8750H, GeForce GTX 1060 Mobile, 52 Wh | HP Pavilion Gaming 15-cx0003ng i7-8750H, GeForce GTX 1050 Ti Mobile, 52.5 Wh | Lenovo Legion Y7000P-1060 i7-8750H, GeForce GTX 1060 Mobile, 57 Wh | Medion Erazer P6705-MD61131 i7-8750H, GeForce GTX 1050 Ti Mobile, 62 Wh | MSI P65 8RF-451 - Creator i7-8750H, GeForce GTX 1070 Max-Q, 82 Wh | Razer Blade 15 Base Model i7-8750H, GeForce GTX 1060 Max-Q, 65 Wh | Lenovo Legion Y530-15ICH i5-8300H, GeForce GTX 1050 Ti Mobile, 52.5 Wh | Moyenne de la classe Gaming | |
|---|---|---|---|---|---|---|---|---|
| Autonomie de la batterie | 106% | 72% | 203% | 109% | 120% | 8% | 119% | |
| Reader / Idle (h) | 8.3 | 10.8 30% | 13.6 64% | 8.9 7% | 7.5 -10% | 11.5 39% | 8.71 ? 5% | |
| WiFi v1.3 (h) | 3.8 | 5.3 39% | 5.8 53% | 6.7 76% | 7.1 87% | 5.5 45% | 4.1 8% | 6.96 ? 83% |
| Load (h) | 0.4 | 1.4 250% | 0.8 100% | 2.5 525% | 1.4 250% | 1.5 275% | 1.47 ? 268% |
Points positifs
Points négatifs
Le Lenovo Legion Y530 est un portable de jeu puissant quelle que soit sa configuration, et qui tire le meilleur de ses composants, ce qui lui permet d’obtenir de très bons résultats dans les tests. L’écran affiche une belle image avec des couleurs fidèles.
Vu son prix peu élevé, nous pouvons recommander le Lenovo Legion Y530 avec Nvidia GeForce GTX 1060.
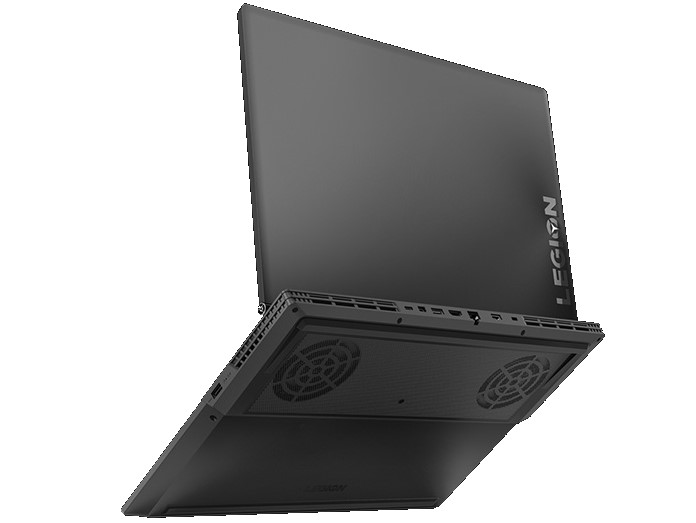
Le système de refroidissement fonctionne efficacement pour que les performances puissent se maintenir, mais cela se fait au prix du bruit - l’usage d’écouteurs est conseillé lors de sessions de jeu prolongées. L’autonomie est également plutôt courte, mais c’est plutôt habituel pour un appareil de ce secteur.
L’intégralité de cette critique est disponible en anglais en suivant ce lien.
Lenovo Legion Y530-15ICH
- 12/14/2018 v6 (old)
Mike Wobker
Price comparison
