Critiques du Intel Core i7-8750H processeur
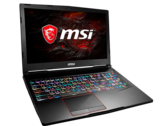
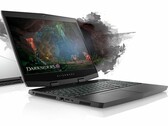
Test du MSI GE63 Raider 8SG (i7-8750H, RTX 2080, FHD) : GeForce RTX 2080 pour pas cher
Il n’a pas les bordures d’écran étroites réussies des derniers portables, mais le GE63 est équipé de l’une des cartes Graphiques Nvidia les plus puissantes actuellement disponibles, et d’un écran 144 Hz ultra fluide, avec presque aucun ghosting.
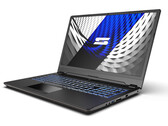
Intel Core i7-8750H, NVIDIA GeForce RTX 2080 Mobile, 15.6", 2.6 kgCourte critique du Schenker Key 16 (i7-8750H, RTX 2080 Max-Q, FHD 144 Hz ; Clevo P960EN-K) : le portable fin et puissant
Les composants puissants du Schenker Key 16 lui permettent de faire tourner tous les jeux actuels sur son écran mat de 16,1 pouces (FHD, IPS, 144 Hz). Schenker propose une machine souple, avec jusqu’à trois espaces de stockage (deux M.2 2280, un 2,5 pouces) et jusqu’à 64 Go de mémoire vive. De plus, l’undervolting du CPU et de l’iGPU est possible dans le BIOS.
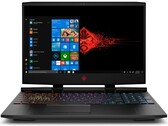
Intel Core i7-8750H, NVIDIA GeForce RTX 2080 Max-Q, 16.1", 2.2 kgCourte critique du HP Omen 15 (i7-8750H, RTX 2070 Max-Q, FHD) : un PC portable de jeu GeForce RTX 2070 Max-Q et 144 Hz
L’Omen 15 ressemble peut-être à son prédécesseur, mais HP a revu ses composants. Un CPU hexacœur et un GPU haut de gamme devraient permettre de mieux exploiter la dalle 144 Hz que le dernier Omen 15 que nous avons testé le faisait, même si la RAM mono canal devrait un peu brider les performances. Lisez notre rapport de test pour voir ce que le Core i7-8750H et la RTX 2070 Max-Q sont capables d’apporter.
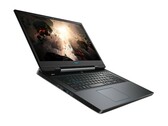
Intel Core i7-8750H, NVIDIA GeForce RTX 2070 Max-Q, 15.6", 2.4 kgCourte critique du PC portable de jeu Dell G7 17 7790 (i7-8750H, RTX 2070 Max-Q, FHD)
Le dernier portable de jeu du milieu de gamme de Dell intègre des fonctionnalités des séries G3 d'entrée de gamme, et Alienware très haut de gammes. Même ainsi, le système est plutôt lourd, et même plus lourd que l'Alienware m17 de 17,3 pouces, de plusieurs centaines de grammes.
Intel Core i7-8750H, NVIDIA GeForce RTX 2070 Max-Q, 17.3", 3.2 kgCourte critique du PC portable de jeu Alienware m15 P79F (i7-8750H, RTX 2070 Max-Q, OLED 4K UHD)
L’OLED est extraordinaire, mais ce n’est pas le graal des technologies pour écran. Quelques désavantages majeurs, en plus du prix plus élevé, font que l’IPS a toujours son mot à dire, en fonction de l’usage que l’on a de l’écran.
Intel Core i7-8750H, NVIDIA GeForce RTX 2070 Max-Q, 15.6", 2.2 kgDell G5 15 5590: NVIDIA GeForce RTX 2060 Mobile, 15.60", 2.7 kg
Critique » Courte critique du PC portable de jeu Dell G5 15 5590 (i7-8750H, RTX 2060, FHD, SSD)
MSI GF75 8RD-001: NVIDIA GeForce GTX 1050 Ti Max-Q, 17.30", 2.2 kg
Critique » Courte critique du PC portable de jeu MSI GF75 Thin 3RD (i7-8750H, GTX 1050Ti Max-Q, FHD)
Schenker Work 15: Intel UHD Graphics 630, 15.60", 2.2 kg
Critique » Courte critique du PC portable Schenker Work 15 (Core i7-8750H, UHD 630, FHD)
Aorus 15 W9: NVIDIA GeForce RTX 2060 Mobile, 15.60", 2.2 kg
Critique » Courte critique du PC portable de jeu Aorus 15-W9 (i7-8750H, RTX 2060, FHD)
MSI GS75 8SG Stealth: NVIDIA GeForce RTX 2080 Max-Q, 17.30", 2.3 kg
Critique » Critique complète du PC portable de jeu MSI GS75 8SG Stealth (i7-8750H, RTX 2080 Max-Q, FHD)
Aorus 15 X9: NVIDIA GeForce RTX 2070 Mobile, 15.60", 2.4 kg
Critique » Critique complète du PC portable de jeu Aorus 15 (i7-8750H, RTX 2070, FHD)
MSI GE75 8SG Raider: NVIDIA GeForce RTX 2080 Mobile, 17.30", 2.6 kg
Critique » Critique complète du PC portable de jeu MSI GE75 8SG Raider (i7-8750H, RTX 2080, FHD)
Schenker XMG Neo 17: NVIDIA GeForce RTX 2070 Mobile, 17.30", 2.5 kg
Critique » Critique complète du PC portable de jeu Schenker XMG Neo 17 (i7-8750H, RTX 2070, FHD) Tongfang GK7CP7S
Lenovo Legion Y740-15ICHg: NVIDIA GeForce RTX 2070 Max-Q, 15.60", 2.3 kg
Critique » Critique complète du PC portable Lenovo Legion Y740-15ICH (i7-8750H, RTX 2070 Max-Q, FHD)
MSI GE75 8SF: NVIDIA GeForce RTX 2070 Mobile, 17.30", 2.6 kg
Critique » Critique complète du PC portable de jeu MSI GE75 8SF Raider (i7-8750H, RTX 2070, FHD)
Asus Zephyrus S GX531GX: NVIDIA GeForce RTX 2080 Max-Q, 15.60", 2.1 kg
Critique » Courte critique du PC portable de jeu Asus Zephyrus S GX531GX (i7-8750H, RTX 2080 Max-Q, FHD)
Asus Zephyrus S GX701GX: NVIDIA GeForce RTX 2080 Max-Q, 17.30", 2.6 kg
Critique » Critique complète du PC portable de jeu Asus ROG Zephyrus S GX701GX (i7-8750H, RTX 2080 Max-Q, FHD)
Lenovo Legion Y740-17ICH: NVIDIA GeForce RTX 2080 Max-Q, 17.30", 2.8 kg
Critique » Critique complète du PC portable de jeu Lenovo Legion Y740-17ICH (i7-8750H, RTX 2080 Max-Q, FHD)
Schenker XMG Neo 15 Turing: NVIDIA GeForce RTX 2070 Max-Q, 15.60", 2 kg
Critique » Courte critique du PC portable de jeu Schenker XMG Neo 15 (i7-8750H, RTX 2070 Max-Q, FHD) Tongfang GK5CQ7Z
Gigabyte Aero 15-X9: NVIDIA GeForce RTX 2070 Max-Q, 15.60", 2.1 kg
Critique » Critique complète du PC portable de jeu Gigabyte Aero 15-X9 (i7-8750H, RTX 2070 Max-Q, FHD)
Asus ROG Strix Scar II GL704GW: NVIDIA GeForce RTX 2070 Mobile, 17.30", 2.9 kg
Critique » Critique complète du PC portable de jeu Asus ROG Strix Scar II GL704GW (i7-8750H, RTX 2070, FHD)
Asus ROG G703GX: NVIDIA GeForce RTX 2080 Mobile, 17.30", 4.7 kg
Critique » Critique complète du PC portable de jeu Asus ROG G703GX (i7-8750H, RTX 2080, FHD)
Acer Predator Triton 500: NVIDIA GeForce RTX 2080 Max-Q, 15.60", 2.1 kg
Critique » Critique complète du PC portable de jeu Acer Predator Triton 500 (i7-8750H, RTX 2080 Max-Q, FHD)
Razer Blade 15 RTX 2070 Max-Q: NVIDIA GeForce RTX 2070 Max-Q, 15.60", 2.1 kg
Critique » Critique complète du PC portable de jeu Razer Blade 15 Advanced Model (i7-8750H, RTX 2070 Max-Q, FHD)
HP Spectre x360 15-df0126ng: NVIDIA GeForce GTX 1050 Ti Max-Q, 15.60", 2.2 kg
Critique » Courte critique du convertible HP Spectre x360 15 (i7-8750H, GTX 1050 Ti Max-Q, 4K UHD, SSD 2 To)
Medion Erazer X6805-MD61085: NVIDIA GeForce GTX 1060 Mobile, 15.60", 2.5 kg
Critique » Critique complète du PC portable de jeu Medion Erazer X6805 (Core i7-8750H, GTX 1060, FHD)
Asus TUF FX705GE-EW096T: NVIDIA GeForce GTX 1050 Ti Mobile, 17.30", 2.6 kg
Critique » Courte critique du PC portable de jeu Asus TUF Gaming FX705GE (i7-8750H, GTX 1050 Ti, FHD, SSD)
Alienware m15 GTX 1070 Max-Q: NVIDIA GeForce GTX 1070 Max-Q, 15.60", 2.2 kg
Critique » Critique complète du PC portable de jeu Alienware m15 (i7-8750H, GTX 1070 Max-Q, FHD)
Lenovo Legion Y7000P-1060: NVIDIA GeForce GTX 1060 Mobile, 15.60", 2.4 kg
Critique » Critique complète du PC portable de jeu Lenovo Legion Y7000 (i7-8750H, GTX 1060, FHD)
MSI GL73 8SE-010US: NVIDIA GeForce RTX 2060 Mobile, 17.30", 2.7 kg
Critique » Courte critique du PC portable de jeu MSI GL73 8SE (i7-8750H, RTX 2060, FHD)
Fujitsu Celsius H980: NVIDIA Quadro P3200, 17.30", 3.5 kg
Critique » Courte critique de la station de travail Fujitsu Celsius H980 (i7-8750H, Quadro P3200, FHD)
Acer Aspire 7 A715-72G-704Q: NVIDIA GeForce GTX 1050 Ti Mobile, 15.60", 2.4 kg
Critique » Courte critique du PC portable Acer Aspire 7 A715-72G (i7-8750H, GTX 1050 Ti, FHD, SSD 256 Go)
Asus Zephyrus S GX531GS: NVIDIA GeForce GTX 1070 Max-Q, 15.60", 2.1 kg
Critique » Critique complète du PC portable de jeu Asus ROG Zephyrus S GX531GS (i7-8750H, GTX 1070 Max-Q, FHD)
Asus GL704GM-DH74: NVIDIA GeForce GTX 1060 Mobile, 17.30", 2.9 kg
Critique » Critique complète du PC portable de jeu Asus ROG Strix Scar II GL704GM (i7-8750H, GTX 1060, FHD)
Razer Blade 15 Base Model: NVIDIA GeForce GTX 1060 Max-Q, 15.60", 2 kg
Critique » Critique complète du PC portable de jeu Razer Blade 15 Base Model (i7-8750H, GTX 1060 Max-Q, FHD)
Asus Zephyrus S GX531GM: NVIDIA GeForce GTX 1060 Mobile, 15.60", 2.1 kg
Critique » Courte critique du PC portable de jeu Asus RoG Zephyrus S GX531GM (i7-8750H, GTX 1060, FHD, SSD)
Asus TUF FX705GM: NVIDIA GeForce GTX 1060 Mobile, 17.30", 2.8 kg
Critique » Critique complète du PC portable de jeu Asus TUF FX705GM (i7-8750H, GTX 1060, FHD)
Lenovo Legion Y730-17ICH, i7-8750H: NVIDIA GeForce GTX 1050 Ti Mobile, 17.30", 2.9 kg
Critique » Critique complète du PC portable de jeu Lenovo Legion Y730-17ICH (i7-8750H, GTX 1050 Ti, FHD)
Lenovo ThinkPad X1 Extreme-20MF000XGE: NVIDIA GeForce GTX 1050 Ti Max-Q, 15.60", 1.8 kg
Critique » Critique complète du PC portable Lenovo ThinkPad X1 Extreme (i7-8750H, GTX 1050 Ti Max-Q, 4K HDR)
Lenovo Legion Y530-15ICH: NVIDIA GeForce GTX 1060 Mobile, 15.60", 2.3 kg
Critique » Courte critique du PC portable de jeu Lenovo Legion Y530 (i7-8750H, GTX 1060, FHD)
HP Pavilion Gaming 15-cx0003ng: NVIDIA GeForce GTX 1050 Ti Mobile, 15.60", 2.4 kg
Critique » Courte critique du PC portable de jeu HP Pavilion Gaming 15 (i7-8750H, GTX 1050 Ti, mémoire Optane, FHD)
HP EliteBook 1050 G1-4QY20EA: NVIDIA GeForce GTX 1050 Max-Q, 15.60", 2.1 kg
Critique » Critique complète du PC portable HP EliteBook 1050 G1 (i7-8750H, GTX 1050 Max-Q, 4K)
HP Omen 15-dc0015ng: NVIDIA GeForce GTX 1070 Max-Q, 15.60", 2.5 kg
Critique » Courte critique du PC portable de jeu HP Omen 15 (i7-8750H, GTX 1070 Max-Q, FHD, SSD)
Dell XPS 15 9570 i7 UHD: NVIDIA GeForce GTX 1050 Ti Max-Q, 15.60", 2 kg
Critique » Critique complète du PC portable Dell XPS 15 9570 (i7-8750H, GTX 1050 Ti Max-Q, UHD, 97 Wh)
HP Pavilion Gaming 15t-cx0000: NVIDIA GeForce GTX 1060 Max-Q, 15.60", 2.3 kg
Critique » Critique complète du PC portable de jeu HP Pavilion Gaming 15t (i7-8750H, GTX 1060 3 Go, FHD)
HP ZBook Studio G5-4QH10EA: NVIDIA Quadro P1000, 15.60", 2.1 kg
Critique » Courte critique de la station de travail HP ZBook Studio G5 (i7-8750H, P1000, 4K)
HP ZBook Studio x360 G5-4QH13EA: NVIDIA Quadro P1000, 15.60", 2.4 kg
Critique » Courte critique de la station de travail HP ZBook Studio x360 G5 (i7-8750H, Quadro P1000, FHD)
MSI P65 8RF-451 - Creator: NVIDIA GeForce GTX 1070 Max-Q, 15.60", 1.9 kg
Critique » Courte critique du PC portable MSI P65 Creator 8RF (i7-8750H, GTX 1070 Max-Q, FHD 144 Hz)
Gigabyte Sabre 17-W8: NVIDIA GeForce GTX 1060 Mobile, 17.30", 2.9 kg
Critique » Courte critique du PC portable de jeu Gigabyte Sabre 17 (i7-8750H, GTX 1060, FHD)
MSI GT63 Titan 8RG-046: NVIDIA GeForce GTX 1080 Mobile, 15.60", 2.9 kg
Critique » Critique complète du PC portable de jeu MSI GT63 Titan 8RG-046 (i7-8750H, GTX 1080, FHD)
MSI GS65 Stealth Thin 8RE-051US: NVIDIA GeForce GTX 1060 Mobile, 15.60", 1.8 kg
Critique » Courte critique du PC portable de jeu MSI GS65 Stealth Thin 9RE-051US (i7-8750H, GTX 1060, FHD)
Monster Tulpar T5 V18.1.1: NVIDIA GeForce GTX 1060 Mobile, 15.60", 2.1 kg
Critique » Courte critique du PC portable Tulpar T5 V18.1 (i7-8750H, GTX 1060, FHD, Tongfang GK5CN6Z)
Alienware 17 R5: NVIDIA GeForce GTX 1070 Mobile, 17.30", 4.4 kg
Critique » Courte critique du PC portable de jeu Alienware 17 R5 (i7-8750H, GTX 1070, QHD)
Acer Predator Helios 500 PH517-51-79BY: NVIDIA GeForce GTX 1070 Mobile, 17.30", 3.8 kg
Critique » Critique complète du PC portable de jeu Acer Predator Helios 500 (GTX 1070, i7-8750H)
Asus Strix GL504GM: NVIDIA GeForce GTX 1060 Mobile, 15.60", 2.5 kg
Critique » Courte critique du PC portable de jeu Asus ROG Strix Hero II GL504GM (i7-8750H, GTX 1060, FHD)
HP Omen 17t-3AW55AV_1: NVIDIA GeForce GTX 1070 Mobile, 17.30", 3.7 kg
Critique » Courte critique du PC portable de jeu HP Omen 17t (i7-8750H, GTX 1070)
MSI GS73 Stealth 8RF-011: NVIDIA GeForce GTX 1070 Max-Q, 17.30", 2.4 kg
Critique » Courte critique du PC portable de jeu MSI GS73 8RF Stealth (i7-8750H, GTX 1070 Max-Q, FHD)
MSI GE63 Raider RGB 8RF-008: NVIDIA GeForce GTX 1070 Mobile, 15.60", 2.5 kg
Critique » Courte critique du PC portable de jeu MSI GE63 Raider RGB 8RF (i7-8750H, GTX 1070, FHD)
Asus GL504GS: NVIDIA GeForce GTX 1070 Mobile, 15.60", 2.5 kg
Critique » Courte critique du PC portable de jeu Asus ROG Strix Scar II GL504 (i7-8750H, GTX 1070, FHD)
Lenovo ThinkPad P52 20MAS03N00: NVIDIA Quadro P1000, 15.60", 2.6 kg
Critique » Courte critique de la station de travail Lenovo ThinkPad P52 (i7, P1000, FHD)
MSI GS65 8RF-019DE Stealth Thin: NVIDIA GeForce GTX 1070 Max-Q, 15.60", 1.8 kg
Critique » Critique complète du PC portable MSI GS65 8RF Stealth Thin (i7-8750H, GTX 1070 Max-Q, Full HD)
Acer Nitro 5 AN515-52-74DR: NVIDIA GeForce GTX 1050 Ti Mobile, 15.60", 2.3 kg
Critique » Courte critique du PC portable de jeu Acer Nitro 5 (i7-8750H, GTX 1050 Ti, FHD)
Gigabyte Aero 15X v8: NVIDIA GeForce GTX 1070 Max-Q, 15.60", 2.1 kg
Critique » Critique complète du Gigabyte Aero 15X v8 (i7-8750H, GTX 1070 Max-Q, Full-HD)
Dell G7 15-7588: NVIDIA GeForce GTX 1060 Max-Q, 15.60", 2.6 kg
Critique » Courte critique du PC portable de jeu Dell G7 15 (i7-8750H, GTX 1060 Max-Q)
Asus Zephyrus M GM501: NVIDIA GeForce GTX 1070 Mobile, 15.60", 2.5 kg
Critique » Critique complète du PC portable de jeu Asus ROG Zephyrus M GM501 (i7-8750H, GTX 1070, Full-HD)
Schenker XMG Neo 15: NVIDIA GeForce GTX 1060 Mobile, 15.60", 2 kg
Critique » Courte critique du PC gamer Schenker XMG Neo 15 (i7-8750H, GTX 1060, Full-HD)
Razer Blade 15 GTX 1060: NVIDIA GeForce GTX 1060 Max-Q, 15.60", 2.1 kg
Critique » Courte critique du PC portable de jeu Razer Blade 15 (i7-8750H, GTX 1060 Max-Q, FHD)
Asus Strix GL703GM-DS74: NVIDIA GeForce GTX 1060 Mobile, 17.30", 2.9 kg
Critique » Courte critique du PC portable Asus ROG Strix Scar GL703GM (8750H, GTX 1060, FHD 120 Hz)
Schenker XMG A707 Coffee Lake: NVIDIA GeForce GTX 1050 Ti Mobile, 17.30", 2.9 kg
Critique » Courte critique du PC portable Schenker XMG A707 (Clevo N871EK1)
Schenker XMG A517 Coffee Lake: NVIDIA GeForce GTX 1060 Mobile, 15.60", 2.3 kg
Critique » Courte critique du PC portable Schenker XMG A517 (Clevo N850EP6)
MSI GP63 Leopard 8RE-013US: NVIDIA GeForce GTX 1060 Mobile, 15.60", 2.3 kg
Critique » Courte critique du PC portable MSI GP63 Leopard 8RE (i7-8750H, GTX 1060, FHD) Xotic PC Edition
MSI GE73 8RF-008 Raider RGB: NVIDIA GeForce GTX 1070 Mobile, 17.30", 2.9 kg
Critique » Courte critique du PC portable MSI GE73 8RF Raider RGB (i7-8750H, GTX 1070, Full-HD)
Asus ROG GU501GM-BI7N8: NVIDIA GeForce GTX 1060 Mobile, 15.60", 2.5 kg
Critique » Courte critique du PC portable Asus ROG GU501GM (i7-8750H, GTX 1060)
Eurocom Q6: NVIDIA GeForce GTX 1070 Max-Q, 15.60", 2.2 kg
Critique » Courte critique du PC portable Eurocom Q6 (i7-8750H, GTX 1070 Max-Q, FHD)
Razer Blade 15 2018: NVIDIA GeForce GTX 1070 Max-Q, 15.60", 2.1 kg
Critique » Premières impressions du PC portable Razer Blade 15 (2018)
Asus GL703GE-ES73: NVIDIA GeForce GTX 1050 Ti Mobile, 17.30", 2.7 kg
Critique » Courte critique du PC portable Asus GL703GE (Core i7-8750H, GTX 1050 Ti)
Gigabyte Aero 14-K8: NVIDIA GeForce GTX 1050 Ti Mobile, 14.00", 1.9 kg
Critique » Courte critique du PC portable Gigabyte Aero 14 v8 (i7-8750H, GTX 1050 Ti, QHD)
HP Omen 15-dc1016no: NVIDIA GeForce RTX 2070 Mobile, 15.60", 2.4 kg
Autres tests » HP Omen 15-dc1016no
Asus TUF FX505GD-BQ137T: NVIDIA GeForce GTX 1050 Mobile, 15.60", 2.2 kg
Autres tests » Asus TUF FX505GD-BQ137T
MSI GE63 Raider RGB 8SF-031XES: NVIDIA GeForce RTX 2070 Mobile, 15.60", 2.4 kg
Autres tests » MSI GE63 Raider RGB 8SF-031XES
MSI GF63 8RD-028ES: NVIDIA GeForce GTX 1050 Ti Mobile, 15.60", 1.9 kg
Autres tests » MSI GF63 8RD-028ES
HP Pavilion 17-ab455nd: NVIDIA GeForce GTX 1050 Ti Mobile, 17.30", 3.1 kg
Autres tests » HP Pavilion 17-ab455nd
Acer Predator Helios 300 PH315-52-73ZX: NVIDIA GeForce RTX 2060 Mobile, 15.60", 2.5 kg
Autres tests » Acer Predator Helios 300 PH315-52-73ZX
Acer Aspire Nitro 7 AN715-51-76XG: NVIDIA GeForce GTX 1650 Mobile, 15.60", 2.5 kg
Autres tests » Acer Aspire Nitro 7 AN715-51-76XG
HP Omen 15-dc1041nl: NVIDIA GeForce RTX 2060 Mobile, 15.60", 2.4 kg
Autres tests » HP Omen 15-dc1041nl
Asus TUF FX504GM-EN479: NVIDIA GeForce GTX 1060 Mobile, 15.60", 2.2 kg
Autres tests » Asus TUF FX504GM-EN479
Acer Predator Helios 500 PH517-51-79T5: NVIDIA GeForce GTX 1070 Mobile, 17.30", 4 kg
Autres tests » Acer Predator Helios 500 PH517-51-79T5
Lenovo Ideapad 330-15ICH-81FK00EHSP: NVIDIA GeForce GTX 1050 Mobile, 15.60", 2.2 kg
Autres tests » Lenovo Ideapad 330-15ICH-81FK00EHSP
MSI GL63 8SD-269ES: NVIDIA GeForce GTX 1660 Ti Mobile, 15.60", 2.2 kg
Autres tests » MSI GL63 8SD-269ES
HP Omen 15-DC0046NS: NVIDIA GeForce GTX 1050 Ti Mobile, 15.60", 2.4 kg
Autres tests » HP Omen 15-DC0046NS
HP Omen 15-DC0014NS: NVIDIA GeForce GTX 1050 Mobile, 15.60", 2.4 kg
Autres tests » HP Omen 15-DC0014NS
MSI GP63 Leopard 8RD-694XES: NVIDIA GeForce GTX 1050 Ti Mobile, 15.60", 2.2 kg
Autres tests » MSI GP63 Leopard 8RD-694XES
HP Pavilion 15-BC410NS: NVIDIA GeForce GTX 1050 Ti Mobile, 15.60", 2.2 kg
Autres tests » HP Pavilion 15-BC410NS
MSI GE75 Raider 8SF-032ES: NVIDIA GeForce RTX 2070 Mobile, 17.30", 2.7 kg
Autres tests » MSI GE75 Raider 8SF-032ES
HP Omen 15-dc0015NS: NVIDIA GeForce GTX 1050 Ti Mobile, 15.60", 2.4 kg
Autres tests » HP Omen 15-DC0015NS
HP Omen 15-dc1002ns: NVIDIA GeForce RTX 2060 Mobile, 15.60", 2.5 kg
Autres tests » HP Omen 15-dc1002ns
Asus ROG Strix HERO II GL504GM-ES237T: NVIDIA GeForce GTX 1060 Mobile, 15.60", 2.4 kg
Autres tests » Asus ROG Strix HERO II GL504GM-ES237T
Asus TUF FX504GD-EN1354: NVIDIA GeForce GTX 1050 Mobile, 15.60", 2.3 kg
Autres tests » Asus TUF FX504GD-EN1354
MSI WE63 8SI-240XES: NVIDIA Quadro P1000, 15.60", 2.3 kg
Autres tests » MSI WE63 8SI-240XES
Asus TUF FX504GD-EN421: NVIDIA GeForce GTX 1050 Mobile, 15.60", 2.3 kg
Autres tests » Asus TUF FX504GD-EN421
HP Pavilion Gaming 15-cx0004ns : NVIDIA GeForce GTX 1050 Mobile, 15.60", 2.2 kg
Autres tests » HP Pavilion Gaming 15-cx0004ns
Asus TUF FX505GD-BQ142: NVIDIA GeForce GTX 1050 Mobile, 15.60", 2.2 kg
Autres tests » Asus TUF FX505GD-BQ142
HP Omen 17-an102nd: NVIDIA GeForce GTX 1060 Mobile, 15.60", 3.8 kg
Autres tests » HP Omen 17-an102nd
HP Omen 15-dc1303ng: NVIDIA GeForce RTX 2070 Max-Q, 15.60", 2.4 kg
Autres tests » HP Omen 15-dc1303ng
Asus ROG Zephyrus S GX701-EV020T: NVIDIA GeForce RTX 2080 Max-Q, 17.30", 2.7 kg
Autres tests » Asus ROG Zephyrus S GX701-EV020T
MSI GS63 Stealth 8RE-063XES: NVIDIA GeForce GTX 1060 Mobile, 15.60", 1.8 kg
Autres tests » MSI GS63 Stealth 8RE-063XES
Asus TUF FX504GD-EN561: NVIDIA GeForce GTX 1050 Mobile, 15.60", 2.3 kg
Autres tests » Asus TUF FX504GD-EN561
MSI GL63 8SD-270XES: NVIDIA GeForce GTX 1660 Ti Mobile, 15.60", 2.3 kg
Autres tests » MSI GL63 8SD-270XES
HP Spectre x360 15-df0500nd: NVIDIA GeForce GTX 1050 Ti Mobile, 15.60", 2.2 kg
Autres tests » HP Spectre x360 15-df0500nd
Asus TUF FX505GM-BQ189T: NVIDIA GeForce GTX 1060 Mobile, 15.60", 2.2 kg
Autres tests » Asus TUF FX505GM-BQ189T
Acer Predator Triton 500 PT515-51-74JA: NVIDIA GeForce RTX 2080 Max-Q, 15.60", 2 kg
Autres tests » Acer Predator Triton 500 PT515-51-74JA
Asus Zephyrus S GX701GW-EV047R: NVIDIA GeForce RTX 2070 Mobile, 17.30", 2.7 kg
Autres tests » Asus Zephyrus S GX701GW-EV047R
Razer Blade 15 RTX 2080 Max-Q, Core i7-8750H: NVIDIA GeForce RTX 2080 Max-Q, 15.60", 2.1 kg
Autres tests » Razer Blade 15 RTX 2080 Max-Q, Core i7-8750H
Acer Predator Triton 500 PT515-51-73G6: NVIDIA GeForce RTX 2060 Mobile, 15.60", 2.1 kg
Autres tests » Acer Predator Triton 500 PT515-51-73G6
Asus ROG Strix Hero II GL504GM-ES157T: NVIDIA GeForce GTX 1060 Mobile, 15.60", 2.4 kg
Autres tests » Asus ROG Strix Hero II GL504GM-ES157T
Asus Zenbook Pro 15 UX580GE-BO024: NVIDIA GeForce GTX 1050 Ti Mobile, 15.60", 1.4 kg
Autres tests » Asus Zenbook Pro 15 UX580GE-BO024
HP Omen 15-dc1001ns: NVIDIA GeForce RTX 2070 Mobile, 15.60", 2.5 kg
Autres tests » HP OMEN 15-dc1001ns
Asus TUF FX705GM-EV020: NVIDIA GeForce GTX 1060 Mobile, 17.30", 2.6 kg
Autres tests » Asus TUF FX705GM-EV020
Asus TUF FX505GD-BQ326T: NVIDIA GeForce GTX 1050 Mobile, 15.60", 2.2 kg
Autres tests » Asus TUF FX505GD-BQ326T
HP OMEN 15-dc0012ns: NVIDIA GeForce GTX 1060 Mobile, 15.60", 2.5 kg
Autres tests » HP OMEN 15-dc0012ns
Lenovo Legion Y530-81FV00QARU: NVIDIA GeForce GTX 1050 Mobile, 15.60", 2.3 kg
Autres tests » Lenovo Legion Y530-81FV00QARU
HP Omen 17-an105ns: NVIDIA GeForce GTX 1070 Mobile, 17.30", 3.8 kg
Autres tests » HP OMEN 17-an105ns
MSI GE63 Raider RGB-053: NVIDIA GeForce RTX 2060 Mobile, 15.60", 2.6 kg
Autres tests » MSI GE63 Raider RGB-053
MSI GE75 Raider 049-HID4-US: NVIDIA GeForce RTX 2070 Mobile, 17.30", 2.6 kg
Autres tests » MSI GE75 Raider 049-HID4-US
Asus Zephyrus S GX701GVR-EV003R: NVIDIA GeForce RTX 2060 Mobile, 17.30", 2.7 kg
Autres tests » Asus Zephyrus S GX701GVR-EV003R
Alienware m17 9JX63: NVIDIA GeForce RTX 2060 Mobile, 17.30", 2.6 kg
Autres tests » Alienware m17 9JX63
MSI GF62 8RE-041NL: NVIDIA GeForce GTX 1060 Mobile, 15.60", 2.2 kg
Autres tests » MSI GF62 8RE-041NL
MSI GS65 Stealth 8SE-037ES: NVIDIA GeForce RTX 2060 Mobile, 15.60", 1.9 kg
Autres tests » MSI GS65 Stealth 8SE-037ES
Asus Zephyrus S GX701GWR-EV021R: NVIDIA GeForce RTX 2070 Mobile, 17.30", 2.7 kg
Autres tests » Asus Zephyrus S GX701GWR-EV021R
Lenovo Legion Y740-15ICHg: NVIDIA GeForce RTX 2070 Max-Q, 15.60", 2.3 kg
Autres tests » Lenovo Legion Y740-15ICHg
HP ZBook Studio G5-4QH10EA: NVIDIA Quadro P1000, 15.60", 2.1 kg
Autres tests » HP ZBook Studio G5-4QH10EA
MSI GS65 8SF-057: NVIDIA GeForce RTX 2070 Max-Q, 15.60", 1.9 kg
Autres tests » MSI GS65 8SF-057
MSI GE65 Raider-9SF, i7-8750H: NVIDIA GeForce RTX 2070 Mobile, 15.60", 2.3 kg
Autres tests » MSI GE65 Raider-9SF, i7-8750H
Asus TUF FX705GD-EW086: NVIDIA GeForce GTX 1050 Mobile, 17.30", 2.7 kg
Autres tests » Asus TUF FX705GD-EW086
MSI P65 Creator 8RD-095XES: NVIDIA GeForce GTX 1050 Ti Mobile, 15.60", 1.9 kg
Autres tests » MSI P65 Creator 8RD-095XES
MSI GF63 8RC-069ES: NVIDIA GeForce GTX 1050 Mobile, 15.60", 1.9 kg
Autres tests » MSI GF63 8RC-069ES
MSI P65 Creator 8RE-028NL: NVIDIA GeForce GTX 1060 Max-Q, 15.60", 1.8 kg
Autres tests » MSI P65 Creator 8RE-028NL
MSI GL73 8SD-044ES: NVIDIA GeForce GTX 1660 Ti Mobile, 17.30", 2.9 kg
Autres tests » MSI GL73 8SD-044ES
Asus ROG Strix SCAR II GL504GV-ES020: NVIDIA GeForce RTX 2060 Mobile, 15.60", 2.4 kg
Autres tests » Asus ROG Strix SCAR II GL504GV-ES020
Dell G5 15 5590: NVIDIA GeForce RTX 2060 Mobile, 15.60", 2.7 kg
Autres tests » Dell G5 15 5590
Dell G7 17 7790: NVIDIA GeForce RTX 2070 Max-Q, 17.30", 3.2 kg
Autres tests » Dell G7 17 7790
MSI GS65 8SE-060: NVIDIA GeForce RTX 2060 Mobile, 15.60", 1.9 kg
Autres tests » MSI GS65 8SE-060
Dell G7 15-7590 (i7-8750H, RTX 2060): NVIDIA GeForce RTX 2060 Mobile, 15.60", 2.5 kg
Autres tests » Dell G7 15-7590 (i7-8750H, RTX 2060)
MSI GL73 8SE-010US: NVIDIA GeForce RTX 2060 Mobile, 17.30", 2.7 kg
Autres tests » MSI GL73 8SE-010US
Schenker XMG Neo 15 Turing: NVIDIA GeForce RTX 2070 Max-Q, 15.60", 2 kg
Autres tests » Schenker XMG Neo 15 Turing
HP Omen 15-dc0006ur: NVIDIA GeForce GTX 1070 Mobile, 15.60", 2.5 kg
Autres tests » HP Omen 15-dc0006ur
Lenovo Ideapad 330-15ICH-81FK00EJSP: NVIDIA GeForce GTX 1050 Mobile, 15.60", 2.2 kg
Autres tests » Lenovo Ideapad 330-15ICH-81FK00EJSP
Asus TUF FX504GM-EN480: NVIDIA GeForce GTX 1060 Mobile, 15.60", 2.3 kg
Autres tests » Asus TUF FX504GM-EN480
Lenovo Legion Y530-15ICH-81LB007CSP: NVIDIA GeForce GTX 1060 Mobile, 15.60", 2.3 kg
Autres tests » Lenovo Legion Y530-15ICH-81LB007CSP
MSI GL63 8RD-643XES: NVIDIA GeForce GTX 1050 Ti Mobile, 15.60", 2.2 kg
Autres tests » MSI GL63 8RD-643XES
Asus TUF FX504GD-DM883: NVIDIA GeForce GTX 1050 Mobile, 15.60", 2.3 kg
Autres tests » Asus TUF FX504GD-DM883
MSI GL63 8RD-675ES: NVIDIA GeForce GTX 1050 Ti Mobile, 15.60", 2.2 kg
Autres tests » MSI GL63 8RD-675ES
MSI GE75 Raider 8SE-035XES: NVIDIA GeForce RTX 2060 Mobile, 17.30", 2.7 kg
Autres tests » MSI GE75 Raider 8SE-035XES
MSI GS75 Stealth 8SF-099FR: NVIDIA GeForce RTX 2070 Mobile, 17.30", 2.3 kg
Autres tests » MSI GS75 Stealth 8SF-099FR
Lenovo ThinkPad X1 Extreme-20MF000TRT: NVIDIA GeForce GTX 1050 Ti Max-Q, 15.60", 1.8 kg
Autres tests » Lenovo ThinkPad X1 Extreme-20MF000TRT
BTO Notebooks X-Book 17X882: NVIDIA GeForce RTX 2070 Mobile, 17.30", 2.6 kg
Autres tests » BTO Notebooks X-Book 17X882
Asus ROG Strix Scar II GL504GW-ES043: NVIDIA GeForce RTX 2070 Mobile, 15.60", 2.4 kg
Autres tests » Asus ROG Strix Scar II GL504GW-ES043
MSI GL63 8SD-437ID: NVIDIA GeForce GTX 1660 Ti Mobile, 15.60", 2.2 kg
Autres tests » MSI GL63 8SD-437ID
MSI GS75 Stealth 8SF-099EN: NVIDIA GeForce RTX 2070 Mobile, 17.30", 2.3 kg
Autres tests » MSI GS75 Stealth 8SF-099EN
MSI GL73 8RD-099XES: NVIDIA GeForce GTX 1050 Ti Mobile, 17.30", 2.7 kg
Autres tests » MSI GL73 8RD-099XES
Asus ROG Strix SCAR II GL504GM-ES363T: NVIDIA GeForce GTX 1060 Mobile, 15.60", 2.4 kg
Autres tests » Asus ROG Strix SCAR II GL504GM-ES363T
Alienware m15 P79F: NVIDIA GeForce RTX 2070 Max-Q, 15.60", 2.2 kg
Autres tests » Alienware m15 P79F
Lenovo Legion Y740-15CHg-81HE0041GE: NVIDIA GeForce RTX 2070 Max-Q, 15.60", 2.2 kg
Autres tests » Lenovo Legion Y740-15CHg-81HE0041GE
Origin PC EVO16-S (i7-8750H, RTX 2080 Max-Q): NVIDIA GeForce RTX 2080 Max-Q, 16.10", 2.1 kg
Autres tests » Origin PC EVO16-S (i7-8750H, RTX 2080 Max-Q)
Aorus 15 X9: NVIDIA GeForce RTX 2070 Mobile, 15.60", 2.4 kg
Autres tests » Aorus 15 X9
Medion Erazer X15805: NVIDIA GeForce RTX 2070 Max-Q, 15.60", 2.2 kg
Autres tests » Medion Erazer X15805
Lenovo Legion Y740-15ICHg-81HE0044GE: NVIDIA GeForce RTX 2070 Max-Q, 15.60", 2.2 kg
Autres tests » Lenovo Legion Y740-15ICHg-81HE0044GE
Lenovo Legion Y740-15ICHg-81HE0004US: NVIDIA GeForce RTX 2070 Max-Q, 15.60", 2.2 kg
Autres tests » Lenovo Legion Y740-15ICHg-81HE0004US
HP Pavilion 17-ab402ng: NVIDIA GeForce GTX 1050 Mobile, 17.30", 3.1 kg
Autres tests » HP Pavilion 17-ab402ng
Asus Zephyrus S GX701GX-EV021R: NVIDIA GeForce RTX 2080 Max-Q, 17.30", 2.7 kg
Autres tests » Asus Zephyrus S GX701GX-EV021R
MSI GS75 Stealth 8SE-066ES: NVIDIA GeForce RTX 2060 Mobile, 17.30", 2.3 kg
Autres tests » MSI GS75 Stealth 8SE-066ES
Lenovo Ideapad 330-17ICH-81FL008VGE: NVIDIA GeForce GTX 1050 Mobile, 17.30", 2.8 kg
Autres tests » Lenovo Ideapad 330-17ICH-81FL008VGE
Medion Erazer P6705-MD61347: NVIDIA GeForce GTX 1050 Ti Mobile, 15.60", 2.5 kg
Autres tests » Medion Erazer P6705-MD61347
Medion Erazer P6705-MD61343: NVIDIA GeForce GTX 1050 Ti Mobile, 15.60", 2.7 kg
Autres tests » Medion Erazer P6705-MD61343
Asus TUF FX565GM-ES277T: NVIDIA GeForce GTX 1060 Mobile, 15.60", 2.3 kg
Autres tests » Asus TUF FX565GM-ES277T
BTO Notebooks X-Book 16X885: NVIDIA GeForce RTX 2060 Mobile, 16.10", 2.1 kg
Autres tests » BTO Notebooks X-Book 16X885
Acer Aspire Nitro 7 AN715-51: NVIDIA GeForce GTX 1650 Mobile, 15.60", 2.2 kg
Autres tests » Acer Aspire Nitro 7 AN715-51
MSI GS65 8SG-005: NVIDIA GeForce RTX 2080 Max-Q, 15.60", 1.9 kg
Autres tests » MSI GS65 8SG-005
Dell G5 15 5590-650GJ: NVIDIA GeForce RTX 2060 Mobile, 15.60", 2.8 kg
Autres tests » Dell G5 15 5590-650GJ
Acer Predator Triton 500 PT515-51-73G6: NVIDIA GeForce RTX 2060 Mobile, 15.60", 2.1 kg
Autres tests » Acer Predator Triton 500 PT515-51-73G6
HP Gaming Pavilion 15-cx0205ng: NVIDIA GeForce GTX 1050 Ti Mobile, 15.60", 2.3 kg
Autres tests » HP Gaming Pavilion 15-cx0205ng
Asus ROG Strix Hero II G515GV-ES048T: NVIDIA GeForce RTX 2060 Mobile, 15.60", 2.4 kg
Autres tests » Asus ROG Strix Hero II G515GV-ES048T
MSI GS75 8SF-071: NVIDIA GeForce RTX 2070 Max-Q, 17.30", 2.3 kg
Autres tests » MSI GS75 8SF-071
Lenovo Legion Y740-17ICHg-81HH001NGE: NVIDIA GeForce RTX 2080 Max-Q, 17.30", 2.9 kg
Autres tests » Lenovo Legion Y740-17ICHg-81HH001NGE
Alienware m15-KV74W: NVIDIA GeForce RTX 2070 Max-Q, 15.60", 2.2 kg
Autres tests » Alienware m15-KV74W
Dell G7 17-7790-WMGG1: NVIDIA GeForce RTX 2060 Mobile, 17.30", 3.3 kg
Autres tests » Dell G7 17-7790-WMGG1
MSI GS75 8SF-005NL: NVIDIA GeForce RTX 2070 Max-Q, 17.30", 2.3 kg
Autres tests » MSI GS75 8SF-005NL
Asus TUF FX505GE-BQ166: NVIDIA GeForce GTX 1050 Ti Mobile, 15.60", 2.2 kg
Autres tests » Asus TUF FX505GE-BQ166
Asus Zephyrus S GX531GX: NVIDIA GeForce RTX 2080 Max-Q, 15.60", 2.1 kg
Autres tests » Asus Zephyrus S GX531GX
Asus Zephyrus S GX701GX-EV064T: NVIDIA GeForce RTX 2080 Max-Q, 17.30", 2.6 kg
Autres tests » Asus Zephyrus S GX701GX-EV064T
Razer Blade 15 RTX 2060: NVIDIA GeForce RTX 2060 Mobile, 15.60", 2.1 kg
Autres tests » Razer Blade 15 RTX 2060
Lenovo Legion Y740-15ICHg-81HE0000US: NVIDIA GeForce RTX 2060 Mobile, 15.60", 2.2 kg
Autres tests » Lenovo Legion Y740-15ICHg-81HE0000US
Origin PC NT-15 Quadro: NVIDIA Quadro P4200, 15.60", 2 kg
Autres tests » Origin PC NT-15 Quadro
Lenovo Legion Y540-15ICH: NVIDIA GeForce RTX 2060 Mobile, 15.60", 2.4 kg
Autres tests » Lenovo Legion Y540-15ICH
Asus Zephyrus S GX531GW-ES035R: NVIDIA GeForce RTX 2070 Max-Q, 15.60", 2.1 kg
Autres tests » Asus Zephyrus S GX531GW-ES035R
MSI GE75 8SE-047: NVIDIA GeForce RTX 2060 Mobile, 17.30", 2.6 kg
Autres tests » MSI GE75 8SE-047
Asus ROG Strix Scar II GL704GV-EV024T: NVIDIA GeForce RTX 2060 Mobile, 17.30", 2.9 kg
Autres tests » Asus ROG Strix Scar II GL704GV-EV024T
MSI GS75 Stealth 8SG-054NE: NVIDIA GeForce RTX 2080 Mobile, 17.30", 2.3 kg
Autres tests » MSI GS75 Stealth 8SG-054NE
Acer Predator Triton 500 PT515-51-73UX: NVIDIA GeForce RTX 2080 Mobile, 15.60", 2 kg
Autres tests » Acer Predator Triton 500 PT515-51-73UX
Aorus 15 W9: NVIDIA GeForce RTX 2060 Mobile, 15.60", 2.2 kg
Autres tests » Aorus 15 W9
Dell G5 15 5590-931WJ: NVIDIA GeForce RTX 2060 Mobile, 15.60", 2.8 kg
Autres tests » Dell G5 15 5590-931WJ
Asus ROG Strix Scar II GL704GW: NVIDIA GeForce RTX 2070 Mobile, 17.30", 2.9 kg
Autres tests » Asus ROG Strix Scar II GL704GW
Lenovo Legion Y740-17ICHG-81HH0012GE: NVIDIA GeForce RTX 2070 Max-Q, 17.30", 2.9 kg
Autres tests » Lenovo Legion Y740-17ICHG-81HH0012GE
MSI GE75 8SG-042 Raider: NVIDIA GeForce RTX 2080 Mobile, 17.30", 2.7 kg
Autres tests » MSI GE75 8SG-042 Raider
MSI GE75 8SF: NVIDIA GeForce RTX 2070 Mobile, 17.30", 2.6 kg
Autres tests » MSI GE75 8SF
Asus ROG Strix Scar II GL704GW-EV042T: NVIDIA GeForce RTX 2070 Mobile, 17.00", 2.9 kg
Autres tests » Asus ROG Strix Scar II GL704GW-EV042T
MSI GE75 Raider 8SF-033XES: NVIDIA GeForce RTX 2070 Mobile, 17.30", 2.7 kg
Autres tests » MSI GE75 Raider 8SF-033XES
MSI GE63 Raider 8RF-040ES: NVIDIA GeForce GTX 1070 Mobile, 15.60", 2.4 kg
Autres tests » MSI GE63 Raider 8RF-040ES
MSI GL63 8RC-679XES: NVIDIA GeForce GTX 1050 Mobile, 15.60", 2.2 kg
Autres tests » MSI GL63 8RC-679XES
MSI GL73 8SE-008XES: NVIDIA GeForce RTX 2060 Mobile, 17.30", 2.9 kg
Autres tests » MSI GL73 8SE-008XES
MSI GP73 Leopard 8RE-658XES: NVIDIA GeForce GTX 1060 Mobile, 17.30", 2.7 kg
Autres tests » MSI GP73 Leopard 8RE-658XES
Asus TUF FX505GD-BQ137: NVIDIA GeForce GTX 1050 Mobile, 15.60", 2.3 kg
Autres tests » Asus TUF FX505GD-BQ137
BTO Notebooks X-Book 17CL875: NVIDIA GeForce GTX 1060 Mobile, 17.30", 3 kg
Autres tests » BTO Notebooks X-Book 17CL875
Asus Zephyrus S GX735GW-EV005T: NVIDIA GeForce RTX 2070 Mobile, 17.30", 2.7 kg
Autres tests » Asus Zephyrus S GX735GW-EV005T
Medion Erazer P6605-MD61232: NVIDIA GeForce GTX 1050 Mobile, 15.60", 2.7 kg
Autres tests » Medion Erazer P6605-MD61232
Medion Erazer X7861: NVIDIA GeForce GTX 1070 Mobile, 17.30", 3.4 kg
Autres tests » Medion Erazer X7861
MSI GS65 Stealth 8SF-051FR: NVIDIA GeForce RTX 2070 Max-Q, 15.60", 1.9 kg
Autres tests » MSI GS65 Stealth 8SF-051FR
MSI GS75 8SG-064ES: NVIDIA GeForce RTX 2080 Mobile, 17.30", 2.3 kg
Autres tests » MSI GS75 8SG-064ES
MSI GL63 8SE-026XES: NVIDIA GeForce RTX 2060 Mobile, 15.60", 2.3 kg
Autres tests » MSI GL63 8SE-026XES
MSI GV62 8RD-011XES: NVIDIA GeForce GTX 1050 Ti Mobile, 15.60", 2.2 kg
Autres tests » MSI GV62 8RD-011XES
MSI GL63 8RC-644XES: NVIDIA GeForce GTX 1050 Mobile, 15.60", 2.2 kg
Autres tests » MSI GL63 8RC-644XES
BTO Notebooks X-Book 17X872: NVIDIA GeForce GTX 1050 Ti Mobile, 17.20", 2.5 kg
Autres tests » BTO Notebooks X-Book 17X872
Asus ROG Strix Scar II GL504GW-ES012T: NVIDIA GeForce RTX 2070 Mobile, 15.60", 2.4 kg
Autres tests » Asus ROG Strix Scar II GL504GW-ES012T
HP ZBook Studio x360 G5-4QH13EA: NVIDIA Quadro P1000, 15.60", 2.4 kg
Autres tests » HP ZBook Studio x360 G5-4QH13EA
HP Pavilion 15-cx0510nd: NVIDIA GeForce GTX 1060 Mobile, 15.60", 2.4 kg
Autres tests » HP Pavilion 15-cx0510nd
Lenovo Legion Y740-15CHg-81HE000RCK: NVIDIA GeForce RTX 2070 Max-Q, 15.60", 2.2 kg
Autres tests » Lenovo Legion Y740-15CHg-81HE000RCK
Asus Strix Scar II GL504GV-ES087T : NVIDIA GeForce RTX 2060 Mobile, 15.60", 2.4 kg
Autres tests » Asus Strix Scar II GL504GV-ES087T
Asus ROG Strix Scar II GL504GM-ES040T: NVIDIA GeForce GTX 1060 Mobile, 15.60", 2.4 kg
Autres tests » Asus ROG Strix Scar II GL504GM-ES040T
Asus Strix GL504GW-DS74: NVIDIA GeForce RTX 2070 Mobile, 15.60", 2.5 kg
Autres tests » Asus Strix GL504GW-DS74
Alienware m17-XW6MJ: NVIDIA GeForce RTX 2070 Max-Q, 17.30", 2.6 kg
Autres tests » Alienware m17-XW6MJ
Asus Strix Scar II GL704GV-EV052T: NVIDIA GeForce RTX 2060 Mobile, 17.30", 2.9 kg
Autres tests » Asus Strix Scar II GL704GV-EV052T
MSI P65 Creator 8RF-442: NVIDIA GeForce GTX 1070 Mobile, 15.60", 1.9 kg
Autres tests » MSI P65 Creator 8RF-442
Asus Zephyrus S GX531GX-ES036R: NVIDIA GeForce RTX 2080 Max-Q, 15.60", 2.1 kg
Autres tests » Asus Zephyrus S GX531GX-ES036R
HP Omen 15-dc0010ng: NVIDIA GeForce GTX 1070 Max-Q, 15.60", 2.5 kg
Autres tests » HP Omen 15-dc0010ng
HP Spectre x360 15 (OLED 2019): NVIDIA GeForce MX150, 15.60", 2.2 kg
Autres tests » HP Spectre x360 15 (OLED 2019)
Asus TUF FX705GE-EW096T: NVIDIA GeForce GTX 1050 Ti Mobile, 17.30", 2.6 kg
Autres tests » Asus TUF FX705GE-EW096T
Lenovo ThinkPad X1 Extreme-20MF000XUK: NVIDIA GeForce GTX 1050 Ti Mobile, 15.60", 1.7 kg
Autres tests » Lenovo ThinkPad X1 Extreme-20MF000XUK
Asus TUF FX504GE-E4183T: NVIDIA GeForce GTX 1050 Ti Mobile, 15.60", 2.3 kg
Autres tests » Asus TUF FX504GE-E4183T
Asus ROG G703GX: NVIDIA GeForce RTX 2080 Mobile, 17.30", 4.7 kg
Autres tests » Asus ROG G703GX
Asus TUF FX705GM-BI7N5: NVIDIA GeForce GTX 1060 Mobile, 17.30", 2.8 kg
Autres tests » Asus TUF FX705GM-BI7N5
Lenovo Legion Y7000P-1060: NVIDIA GeForce GTX 1060 Mobile, 15.60", 2.4 kg
Autres tests » Lenovo Legion Y7000P-1060
MSI GL63 8SE-071: NVIDIA GeForce RTX 2060 Mobile, 15.60", 2.3 kg
Autres tests » MSI GL63 8SE-071
Acer Predator Triton 500: NVIDIA GeForce RTX 2080 Max-Q, 15.60", 2.1 kg
Autres tests » Acer Predator Triton 500
Lenovo Legion Y740-17ICH: NVIDIA GeForce RTX 2080 Max-Q, 17.30", 2.8 kg
Autres tests » Lenovo Legion Y740-17ICH
Asus TUF FX505GM-ES011T: NVIDIA GeForce GTX 1060 Mobile, 15.60", 2.3 kg
Autres tests » Asus TUF FX505GM-ES011T
Asus Zephyrus M GM501GM-EI005T: NVIDIA GeForce GTX 1060 Max-Q, 15.60", 2.5 kg
Autres tests » Asus Zephyrus M GM501GM-EI005T
MSI GS75 8SE-073: NVIDIA GeForce RTX 2060 Mobile, 17.30", 2.3 kg
Autres tests » MSI GS75 8SE-073
MSI Creator P65 8RF-453NE: NVIDIA GeForce GTX 1070 Max-Q, 15.60", 1.9 kg
Autres tests » MSI Creator P65 8RF-453NE
HP Omen 15-dc0805no: NVIDIA GeForce GTX 1070 Mobile, 15.60", 2.5 kg
Autres tests » HP Omen 15-dc0805no
Lenovo ThinkPad X1 Extreme-20MF000TMD: NVIDIA GeForce GTX 1050 Ti Mobile, 15.60", 1.8 kg
Autres tests » Lenovo ThinkPad X1 Extreme-20MF000TMD
Acer Predator Helios 500 517-51-59BH: NVIDIA GeForce GTX 1070 Mobile, 17.30", 4 kg
Autres tests » Acer Predator Helios 500 517-51-59BH
Asus Zephyrus S GX701GX: NVIDIA GeForce RTX 2080 Max-Q, 17.30", 2.6 kg
Autres tests » Asus Zephyrus S GX701GX
Gigabyte Sabre 15-K v8: NVIDIA GeForce GTX 1060 Mobile, 15.60", 2.5 kg
Autres tests » Gigabyte Sabre 15-K v8
Gigabyte Aero 15-X9: NVIDIA GeForce RTX 2070 Max-Q, 15.60", 2.1 kg
Autres tests » Gigabyte Aero 15-X9
MSI GS65 8SG-055: NVIDIA GeForce RTX 2080 Max-Q, 15.60", 1.9 kg
Autres tests » MSI GS65 8SG-055
MSI GF72 8RD-081XES: NVIDIA GeForce GTX 1050 Ti Mobile, 17.30", 2.7 kg
Autres tests » MSI GF72 8RD-081XES
MSI GE73 Raider 8RF-029ES: NVIDIA GeForce GTX 1070 Mobile, 17.30", 2.8 kg
Autres tests » MSI GE73 Raider 8RF-029ES
Dell G3 15 3579-CN35713: NVIDIA GeForce GTX 1060 Max-Q, 15.60", 2.5 kg
Autres tests » Dell G3 15 3579-CN35713
Asus TUF FX504GD-DM030T : NVIDIA GeForce GTX 1050 Mobile, 15.60", 2.3 kg
Autres tests » Asus TUF FX504GD-DM030T
Asus ZenBook Pro 15 UX550GD-BN026T: NVIDIA GeForce GTX 1050 Mobile, 15.60", 1.9 kg
Autres tests » Asus ZenBook Pro 15 UX550GD-BN026T
Lenovo Ideapad 330-15ICH-81FK006YSP: NVIDIA GeForce GTX 1050 Mobile, 15.60", 2.2 kg
Autres tests » Lenovo Ideapad 330-15ICH-81FK006YSP
Asus ROG Strix Scar II GL704GW-EV005T: NVIDIA GeForce RTX 2070 Mobile, 17.30", 2.9 kg
Autres tests » Asus ROG Strix Scar II GL704GW-EV005T
Razer Blade 15 RTX 2070 Max-Q: NVIDIA GeForce RTX 2070 Max-Q, 15.60", 2.1 kg
Autres tests » Razer Blade 15 RTX 2070 Max-Q
MSI GS75 8SG Stealth: NVIDIA GeForce RTX 2080 Max-Q, 17.30", 2.3 kg
Autres tests » MSI GS75 8SG Stealth
HP Spectre x360 15-df0004: NVIDIA GeForce GTX 1050 Ti Mobile, 15.60", 2.2 kg
Autres tests » HP Spectre x360 15-df0004
MSI GE75 Raider 8RF-012XES: NVIDIA GeForce GTX 1070 Mobile, 17.30", 2.6 kg
Autres tests » MSI GE75 Raider 8RF-012XES
Lenovo Legion Y530-15ICH-81FV001MTX: NVIDIA GeForce GTX 1050 Ti Mobile, 15.60", 2.3 kg
Autres tests » Lenovo Legion Y530-15ICH-81FV001MTX
Alienware M15, GTX 1070: NVIDIA GeForce GTX 1070 Mobile, 15.60", 2.2 kg
Autres tests » Alienware M15, GTX 1070
Asus TUF FX504GE-DM286: NVIDIA GeForce GTX 1050 Ti Mobile, 15.60", 2.3 kg
Autres tests » Asus TUF FX504GE-DM286
Asus ROG Strix GL504GM-ES158T: NVIDIA GeForce GTX 1060 Mobile, 15.60", 2.4 kg
Autres tests » Asus ROG Strix GL504GM-ES158T
Asus G703GI-E5013T: NVIDIA GeForce GTX 1080 Mobile, 17.30", 4.7 kg
Autres tests » Asus G703GI-E5013T
Asus Strix GL504GM-ES157T: NVIDIA GeForce GTX 1060 Mobile, 15.60", 2.4 kg
Autres tests » Asus Strix GL504GM-ES157T
Asus Zephyrus S GX531GM-ES037T: NVIDIA GeForce GTX 1060 Mobile, 15.60", 2.1 kg
Autres tests » Asus Zephyrus S GX531GM-ES037T
Lenovo Legion Y730-15ICH-81HD001LSP: NVIDIA GeForce GTX 1050 Ti Mobile, 15.60", 2.2 kg
Autres tests » Lenovo Legion Y730-15ICH-81HD001LSP
Lenovo Legion Y530-15ICH-81FV00E2SP: NVIDIA GeForce GTX 1050 Mobile, 15.60", 2.3 kg
Autres tests » Lenovo Legion Y530-15ICH-81FV00E2SP
Medion Erazer P6705-MD61204: NVIDIA GeForce GTX 1050 Ti Mobile, 15.60", 2.5 kg
Autres tests » Medion Erazer P6705-MD61204
Lenovo Ideapad 330-15ICH-81FK00ADGE: NVIDIA GeForce GTX 1050 Mobile, 15.60", 2.2 kg
Autres tests » Lenovo Ideapad 330-15ICH-81FK00ADGE
Medion Erazer X6807-i7-512F16: NVIDIA GeForce GTX 1060 Mobile, 15.60", 2 kg
Autres tests » Medion Erazer X6807-i7-512F16
Alienware m15 GTX 1070 Max-Q: NVIDIA GeForce GTX 1070 Max-Q, 15.60", 2.2 kg
Autres tests » Alienware m15 GTX 1070 Max-Q
MSI P65 8RF-451 - Creator: NVIDIA GeForce GTX 1070 Max-Q, 15.60", 1.9 kg
Autres tests » MSI P65 8RF-451 - Creator
MSI GS65 8RF-233NL: NVIDIA GeForce GTX 1070 Max-Q, 15.60", 1.9 kg
Autres tests » MSI GS65 8RF-233NL
MSI GE63 8RE-021XES: NVIDIA GeForce GTX 1060 Mobile, 15.60", 2.4 kg
Autres tests » MSI GE63 8RE-021XES
HP Omen 15-dc0024nl: NVIDIA GeForce GTX 1060 Mobile, 15.60", 2.5 kg
Autres tests » HP Omen 15-dc0024nl
HP Pavilion Gaming 15-cx0000ns : NVIDIA GeForce GTX 1050 Ti Mobile, 15.60", 2.3 kg
Autres tests » HP Pavilion Gaming 15-cx0000ns
Xiaomi Mi Gaming Laptop 8750H 1060: NVIDIA GeForce GTX 1060 Mobile, 15.60", 2.7 kg
Autres tests » Xiaomi Mi Gaming Laptop 8750H 1060
MSI GF72 8RE-062XES: NVIDIA GeForce GTX 1060 Mobile, 17.30", 2.8 kg
Autres tests » MSI GF72 8RE-062XES
Asus TUF FX705GM: NVIDIA GeForce GTX 1060 Mobile, 17.30", 2.8 kg
Autres tests » Asus TUF FX705GM
Asus TUF FX765GM-EV191T: NVIDIA GeForce GTX 1060 Mobile, 17.30", 2.7 kg
Autres tests » Asus TUF FX765GM-EV191T
MSI P65 8RE-042CZ: NVIDIA GeForce GTX 1060 Max-Q, 15.60", 1.8 kg
Autres tests » MSI P65 8RE-042CZ
Lenovo ThinkPad P72-20MB0005GE: NVIDIA Quadro P2000, 17.30", 3.4 kg
Autres tests » Lenovo ThinkPad P72-20MB0005GE
Lenovo Legion Y530-15ICH: NVIDIA GeForce GTX 1060 Mobile, 15.60", 2.3 kg
Autres tests » Lenovo Legion Y530-15ICH
MSI GF63 8RD-254UK: NVIDIA GeForce GTX 1050 Ti Mobile, 15.60", 1.9 kg
Autres tests » MSI GF63 8RD-254UK
Razer Blade 15 Base Model: NVIDIA GeForce GTX 1060 Max-Q, 15.60", 2 kg
Autres tests » Razer Blade 15 Base Model
Lenovo Legion Y530-15ICH-81LB0033GE: NVIDIA GeForce GTX 1060 Mobile, 15.60", 2.3 kg
Autres tests » Lenovo Legion Y530-15ICH-81LB0033GE
Asus ROG Strix Scar II GL704GM-EV027T: NVIDIA GeForce GTX 1060 Mobile, 17.30", 2.9 kg
Autres tests » Asus ROG Strix Scar II GL704GM-EV027T
MSI P65 8RE-005ES: NVIDIA GeForce GTX 1060 Mobile, 15.60", 1.9 kg
Autres tests » MSI P65 8RE-005ES
MSI P65 8RE-006ES: NVIDIA GeForce GTX 1060 Mobile, 15.60", 1.9 kg
Autres tests » MSI P65 8RE-006ES
Lenovo Thinkpad P52-20M9001FSP: NVIDIA Quadro P1000, 15.60", 2.5 kg
Autres tests » Lenovo Thinkpad P52-20M9001FSP
Medion Erazer P6705-MD61203: NVIDIA GeForce GTX 1050 Ti Mobile, 15.60", 2.7 kg
Autres tests » Medion Erazer P6705-MD61203
MSI GF63 8RC-457XES: NVIDIA GeForce GTX 1050 Mobile, 15.60", 1.9 kg
Autres tests » MSI GF63 8RC-457XES
MSI GS73 Stealth 8RD-006XES: NVIDIA GeForce GTX 1050 Ti Mobile, 17.30", 2.4 kg
Autres tests » MSI GS73 Stealth 8RD-006XES
Acer Predator Helios 300 PH315-51-762W: NVIDIA GeForce GTX 1060 Mobile, 15.60", 2.7 kg
Autres tests » Acer Predator Helios 300 PH315-51-762W
Asus FX504GD-DM473: NVIDIA GeForce GTX 1050 Mobile, 15.60", 2.3 kg
Autres tests » Asus FX504GD-DM473
Lenovo Ideapad 330-15ICH-81FK0072SP: NVIDIA GeForce GTX 1050 Mobile, 15.60", 2.2 kg
Autres tests » Lenovo Ideapad 330-15ICH-81FK0072SP
Asus ROG Strix GL504GM-ES070T: NVIDIA GeForce GTX 1060 Mobile, 15.60", 2.4 kg
Autres tests » Asus ROG Strix GL504GM-ES070T
Asus Strix Scar II GL504GS-ES082T: NVIDIA GeForce GTX 1070 Mobile, 15.60", 2.5 kg
Autres tests » Asus Strix Scar II GL504GS-ES082T
MSI GF63 8RC-230CH: NVIDIA GeForce GTX 1050 Mobile, 15.60", 1.9 kg
Autres tests » MSI GF63 8RC-230CH
Dell XPS 15 9575-Y4H2V: NVIDIA GeForce GTX 1050 Mobile, 15.60", 2 kg
Autres tests » Dell XPS 15 9575-Y4H2V
MSI GF63 8RD-291XES: NVIDIA GeForce GTX 1050 Ti Max-Q, 15.60", 1.9 kg
Autres tests » MSI GF63 8RD-291XES
Asus ZenBook Pro 15 UX550GD-BN015T: NVIDIA GeForce GTX 1050 Mobile, 15.60", 1.9 kg
Autres tests » Asus ZenBook Pro 15 UX550GD-BN015T
Asus TUF FX705GE-EW103: NVIDIA GeForce GTX 1050 Ti Mobile, 17.30", 2.7 kg
Autres tests » Asus TUF FX705GE-EW103
MSI GF63 8RD-010ES: NVIDIA GeForce GTX 1050 Ti Max-Q, 15.60", 1.9 kg
Autres tests » MSI GF63 8RD-010ES
Asus TUF FX505GE-BQ159T: NVIDIA GeForce GTX 1050 Ti Mobile, 15.60", 2.2 kg
Autres tests » Asus TUF FX505GE-BQ159T
Asus TUF FX505GM-ES088T: NVIDIA GeForce GTX 1060 Mobile, 15.60", 2.3 kg
Autres tests » Asus TUF FX505GM-ES088T
Lenovo ThinkPad X1 Extreme-20MF000TGE: NVIDIA GeForce GTX 1050 Ti Mobile, 15.60", 1.8 kg
Autres tests » Lenovo ThinkPad X1 Extreme-20MF000TGE
Lenovo Legion Y530-15ICH-81FV00L5TX: NVIDIA GeForce GTX 1050 Ti Mobile, 15.60", 2.8 kg
Autres tests » Lenovo Legion Y530-15ICH-81FV00L5TX
MSI P65 Creator 8RF-456NL: NVIDIA GeForce GTX 1070 Max-Q, 15.60", 1.9 kg
Autres tests » MSI P65 Creator 8RF-456NL
HP 15-dc0036TX: NVIDIA GeForce GTX 1050 Ti Mobile, 15.60", 2.3 kg
Autres tests » HP 15-dc0036TX
Lenovo Legion Y530-81FV00JQPB: NVIDIA GeForce GTX 1050 Ti Mobile, 15.60", 2.2 kg
Autres tests » Lenovo Legion Y530-81FV00JQPB
Acer Predator Helios 300 Special Edition PH315-51-78UA: NVIDIA GeForce GTX 1060 Mobile, 15.60", 2.7 kg
Autres tests » Acer Predator Helios 300 Special Edition PH315-51-78UA
Acer Predator Helios 300 PH315-51-78NP: NVIDIA GeForce GTX 1060 Mobile, 15.60", 2.7 kg
Autres tests » Acer Predator Helios 300 PH315-51-78NP
Acer Predator Helios 300 PH315-51-757A: NVIDIA GeForce GTX 1060 Mobile, 15.60", 2.7 kg
Autres tests » Acer Predator Helios 300 PH315-51-757A
Asus GL704GM-DH74: NVIDIA GeForce GTX 1060 Mobile, 17.30", 2.9 kg
Autres tests » Asus GL704GM-DH74
HP Omen 15-dc0029na: NVIDIA GeForce GTX 1060 Mobile, 15.60", 2.5 kg
Autres tests » HP Omen 15-dc0029na
HP Pavilion 15-cx0004ng: NVIDIA GeForce GTX 1050 Ti Mobile, 15.60", 2.3 kg
Autres tests » HP Pavilion 15-cx0004ng
Acer Predator Helios 300 PH315-51-76VB: NVIDIA GeForce GTX 1060 Mobile, 15.60", 2.7 kg
Autres tests » Acer Predator Helios 300 PH315-51-76VB
Acer Predator Helios 300 PH315-51-7581: NVIDIA GeForce GTX 1060 Mobile, 15.60", 2.7 kg
Autres tests » Acer Predator Helios 300 PH315-51-7581
MSI GF63 8RD-010XES: NVIDIA GeForce GTX 1050 Ti Max-Q, 15.60", 1.9 kg
Autres tests » MSI GF63 8RD-010XES
MSI P65 Creator 8RF-445ES: NVIDIA GeForce GTX 1070 Max-Q, 15.60", 1.9 kg
Autres tests » MSI P65 Creator 8RF-445ES
MSI GE73 Raider 8RE-023XES: NVIDIA GeForce GTX 1060 Mobile, 17.30", 2.8 kg
Autres tests » MSI GE73 Raider 8RE-023XES
Asus Strix Scar II GL704GM-DH74: NVIDIA GeForce GTX 1060 Mobile, 17.30", 3 kg
Autres tests » Asus Strix Scar II GL704GM-DH74
HP Omen 15-dc0096nd: NVIDIA GeForce GTX 1060 Mobile, 15.60", 2.5 kg
Autres tests » HP Omen 15-dc0096nd
MSI GE63 8RE-045NL: NVIDIA GeForce GTX 1060 Mobile, 15.60", 2.5 kg
Autres tests » MSI GE63 8RE-045NL
MSI GF63 8RD-050NL: NVIDIA GeForce GTX 1050 Ti Mobile, 15.60", 1.9 kg
Autres tests » MSI GF63 8RD-050NL
MSI GS65 Stealth Thin 8RE-051US: NVIDIA GeForce GTX 1060 Mobile, 15.60", 1.8 kg
Autres tests » MSI GS65 Stealth Thin 8RE-051US
Acer Nitro 5 AN515-52-73Y8: NVIDIA GeForce GTX 1060 Mobile, 15.60", 2.7 kg
Autres tests » Acer Nitro 5 AN515-52-73Y8
Alienware m15, GTX 1070 Max-Q: NVIDIA GeForce GTX 1070 Max-Q, 15.60", 2.2 kg
Autres tests » Alienware m15, GTX 1070 Max-Q
Asus TUF FX504GM-E4326T: NVIDIA GeForce GTX 1060 Mobile, 15.60", 2.3 kg
Autres tests » Asus TUF FX504GM-E4326T
Alienware 17 R5: NVIDIA GeForce GTX 1070 Mobile, 17.30", 4.4 kg
Autres tests » Alienware 17 R5
Asus Strix Scar II GL504GM-ES155T: NVIDIA GeForce GTX 1060 Mobile, 15.60", 2.4 kg
Autres tests » Asus Strix Scar II GL504GM-ES155T
Asus ROG Strix Scar II GL504GS-ES056T: NVIDIA GeForce GTX 1070 Mobile, 15.60", 2.4 kg
Autres tests » Asus ROG Strix Scar II GL504GS-ES056T
Asus FX504GE-E4063: NVIDIA GeForce GTX 1050 Ti Mobile, 15.60", 2.3 kg
Autres tests » Asus FX504GE-E4063
Asus Zephyrus GX501GI: NVIDIA GeForce GTX 1080 Max-Q, 15.60", 2.3 kg
Autres tests » Asus Zephyrus GX501GI
MSI WS63 8SJ-047ES: NVIDIA Quadro P2000, 15.60", 1.9 kg
Autres tests » MSI WS63 8SJ-047ES
MSI GF62 8RD-010XES: NVIDIA GeForce GTX 1050 Ti Mobile, 15.60", 2.2 kg
Autres tests » MSI GF62 8RD-010XES
MSI GV62 8RC-012XES: NVIDIA GeForce GTX 1050 Mobile, 15.60", 2.2 kg
Autres tests » MSI GV62 8RC-012XES
Dell G3 15 3579-CN35712: NVIDIA GeForce GTX 1050 Ti Mobile, 15.60", 2.5 kg
Autres tests » Dell G3 15 3579-CN35712
Asus STRIX GL503GE-RS71 SCAR Edition: NVIDIA GeForce GTX 1050 Ti Mobile, 15.60", 2.6 kg
Autres tests » Asus STRIX GL503GE-RS71 SCAR Edition
Asus Vivobook Pro N580GD-E4189T: NVIDIA GeForce GTX 1050 Mobile, 15.60", 2 kg
Autres tests » Asus Vivobook Pro N580GD-E4189T
Asus Vivobook R570ZD-DM107: NVIDIA GeForce GTX 1050 Mobile, 15.60", 2 kg
Autres tests » Asus Vivobook R570ZD-DM107
HP EliteBook 1050 G1-4QY21EA: NVIDIA GeForce GTX 1050 Mobile, 15.60", 2.1 kg
Autres tests » HP EliteBook 1050 G1-4QY21EA
HP Gaming Pavilion 15-cx0144tx: NVIDIA GeForce GTX 1050 Ti Mobile, 15.60", 2.2 kg
Autres tests » HP Gaming Pavilion 15-cx0144tx
Asus ZenBook Pro 15 UX550GD: NVIDIA GeForce GTX 1050 Mobile, 15.60", 1.9 kg
Autres tests » Asus ZenBook Pro 15 UX550GD
Asus TUF FX705GM-EW019T: NVIDIA GeForce GTX 1060 Mobile, 17.30", 2.8 kg
Autres tests » Asus TUF FX705GM-EW019T
MSI GT63 Titan 8RG-048: NVIDIA GeForce GTX 1080 Mobile, 15.60", 2.9 kg
Autres tests » MSI GT63 Titan 8RG-048
MSI GP63 8RD-409MY Leopard: NVIDIA GeForce GTX 1050 Ti Mobile, 15.60", 2.3 kg
Autres tests » MSI GP63 8RD-409MY Leopard
Dell XPS 15 9570 i7 FHD, GTX 1050 Ti Max-Q: NVIDIA GeForce GTX 1050 Ti Max-Q, 15.60", 2 kg
Autres tests » Dell XPS 15 9570 i7 FHD, GTX 1050 Ti Max-Q
Lenovo Legion Y530-15ICH-81FV008SGE: NVIDIA GeForce GTX 1050 Ti Mobile, 15.60", 2.3 kg
Autres tests » Lenovo Legion Y530-15ICH-81FV008SGE
Asus TUF FX505GE-BQ153T: NVIDIA GeForce GTX 1050 Ti Mobile, 15.60", 2.2 kg
Autres tests » Asus TUF FX505GE-BQ153T
MSI GF63 8RD-251: NVIDIA GeForce GTX 1050 Ti Max-Q, 15.60", 1.9 kg
Autres tests » MSI GF63 8RD-251
HP EliteBook 1050 G1-4QY20EA: NVIDIA GeForce GTX 1050 Max-Q, 15.60", 2.1 kg
Autres tests » HP EliteBook 1050 G1-4QY20EA
Asus TUF FX504GD-EN579T: NVIDIA GeForce GTX 1050 Mobile, 15.60", 2.3 kg
Autres tests » Asus TUF FX504GD-EN579T
Medion Erazer X6805-MD61085: NVIDIA GeForce GTX 1060 Mobile, 15.60", 2.5 kg
Autres tests » Medion Erazer X6805-MD61085
MSI GS65 Stealth Thin 8RF-086TR: NVIDIA GeForce GTX 1070 Mobile, 15.60", 1.9 kg
Autres tests » MSI GS65 Stealth Thin 8RF-086TR
Lenovo Legion Y530-15ICH-81FV00GFMH: NVIDIA GeForce GTX 1050 Mobile, 15.60", 2.3 kg
Autres tests » Lenovo Legion Y530-15ICH-81FV00GFMH
HP Pavilion 15-cx0815no: NVIDIA GeForce GTX 1060 Mobile, 15.60", 2.4 kg
Autres tests » HP Pavilion 15-cx0815no
Lenovo ThinkPad X1 Extreme-20MF000XGE: NVIDIA GeForce GTX 1050 Ti Max-Q, 15.60", 1.8 kg
Autres tests » Lenovo ThinkPad X1 Extreme-20MF000XGE
HP Omen 17-an113NS: NVIDIA GeForce GTX 1070 Mobile, 17.30", 3.8 kg
Autres tests » HP Omen 17-AN113NS
MSI GE63 Raider 8RE-020ES: NVIDIA GeForce GTX 1060 Mobile, 15.60", 2.3 kg
Autres tests » MSI GE63 Raider 8RE-020ES
Acer Aspire 7 A715-72G-75AN: NVIDIA GeForce GTX 1050 Mobile, 15.60", 2.4 kg
Autres tests » Acer Aspire 7 A715-72G-75AN
Acer Predator Helios 300 PH317-52-78X3: NVIDIA GeForce GTX 1050 Ti Mobile, 17.30", 3 kg
Autres tests » Acer Predator Helios 300 PH317-52-78X3
Apple MacBook Pro 15 2018 (2.2 GHz, 555X): AMD Radeon Pro 555X, 15.60", 1.8 kg
Autres tests » Apple MacBook Pro 15 2018 (2.2 GHz, 555X)
Asus Strix GL504GM: NVIDIA GeForce GTX 1060 Mobile, 15.60", 2.5 kg
Autres tests » Asus Strix GL504GM
MSI GS65 Stealth Thin 8RF-038NL: NVIDIA GeForce GTX 1070 Max-Q, 15.60", 1.9 kg
Autres tests » MSI GS65 Stealth Thin 8RF-038NL
HP Pavilion 15-cx0670nd: NVIDIA GeForce GTX 1050 Ti Mobile, 15.60", 2.4 kg
Autres tests » HP Pavilion 15-cx0670nd
HP Omen 15-dc0850nd: NVIDIA GeForce GTX 1050 Ti Mobile, 15.60", 2.4 kg
Autres tests » HP Omen 15-dc0850nd
HP Omen 17-an104nd: NVIDIA GeForce GTX 1070 Mobile, 17.30", 3.8 kg
Autres tests » HP Omen 17-an104nd
HP Omen 15-dc0982nd: NVIDIA GeForce GTX 1070 Mobile, 15.60", 2.4 kg
Autres tests » HP Omen 15-dc0982nd
Dell XPS 15 9570 CNX97009: NVIDIA GeForce GTX 1050 Ti Mobile, 15.60", 1.8 kg
Autres tests » Dell XPS 15 9570 CNX97009
Asus Zenbook Pro 15 UX580GD-E2006T: NVIDIA GeForce GTX 1050 Mobile, 15.60", 1.9 kg
Autres tests » Asus Zenbook Pro 15 UX580GD-E2006T
Dell XPS 15 9570-CPC1J: NVIDIA GeForce GTX 1050 Ti Mobile, 15.60", 1.9 kg
Autres tests » Dell XPS 15 9570-CPC1J
Acer Predator Helios 500 PH517-51-72NU: NVIDIA GeForce GTX 1070 Mobile, 17.30", 3.8 kg
Autres tests » Acer Predator Helios 500 PH517-51-72NU
Xiaomi Mi Notebook Pro GTX-G58725D6D/CN: NVIDIA GeForce GTX 1060 Mobile, 15.60", 2.7 kg
Autres tests » Xiaomi Mi Notebook Pro GTX-G58725D6D/CN
HP Pavilion 15-bc451ns: NVIDIA GeForce GTX 1050 Mobile, 15.60", 2.2 kg
Autres tests » HP Pavilion 15-bc451ns
Acer Aspire Nitro 5 AN515-52-76N6: NVIDIA GeForce GTX 1050 Mobile, 15.60", 2.7 kg
Autres tests » Acer Aspire Nitro 5 AN515-52-76N6
Acer Aspire 7 A717-72G-7600: NVIDIA GeForce GTX 1050 Mobile, 17.30", 3 kg
Autres tests » Acer Aspire 7 A717-72G-7600
Asus Zephyrus M GM501GS-EI004T: NVIDIA GeForce GTX 1070 Mobile, 15.60", 2.5 kg
Autres tests » Asus Zephyrus M GM501GS-EI004T
HP Pavilion 15-cx001nl: NVIDIA GeForce GTX 1050 Mobile, 15.60", 2.6 kg
Autres tests » HP Pavilion 15-cx001nl
MSI GL73 8RD-019XES: NVIDIA GeForce GTX 1050 Ti Mobile, 17.30", 2.7 kg
Autres tests » MSI GL73 8RD-019XES
MSI GS63 Stealth 8RE-012XES: NVIDIA GeForce GTX 1060 Mobile, 15.60", 1.8 kg
Autres tests » MSI GS63 Stealth 8RE-012XES
HP ZBook Studio G5-2ZC50EA: NVIDIA Quadro P1000, 15.60", 2 kg
Autres tests » HP ZBook Studio G5-2ZC50EA
HP Omen 15-dc0980nd: NVIDIA GeForce GTX 1060 Mobile, 15.60", 2.5 kg
Autres tests » HP Omen 15-dc0980nd
MSI GP63 8RD-008BE: NVIDIA GeForce GTX 1050 Ti Mobile, 15.60", 2.2 kg
Autres tests » MSI GP63 8RD-008BE
BTO Notebooks X-Book 15CL875: NVIDIA GeForce GTX 1060 Mobile, 15.60", 2 kg
Autres tests » BTO Notebooks X-Book 15CL875
Asus ROG Strix G703GI-E5026R: NVIDIA GeForce GTX 1080 Mobile, 17.30", 4.7 kg
Autres tests » Asus ROG Strix G703GI-E5026R
Asus ROG Strix GL504GM Scar II Edition: NVIDIA GeForce GTX 1070 Mobile, 15.60", 2.4 kg
Autres tests » Asus ROG Strix GL504GM Scar II Edition
HP Gaming Pavilion 15-cx0005ng: NVIDIA GeForce GTX 1060 Max-Q, 15.60", 2.3 kg
Autres tests » HP Gaming Pavilion 15-cx0005ng
HP Omen 15-dc0015ng: NVIDIA GeForce GTX 1070 Mobile, 15.60", 2.5 kg
Autres tests » HP Omen 15-dc0015ng
Dell XPS 15 9570-CTXKW: NVIDIA GeForce GTX 1050 Ti Mobile, 15.60", 1.8 kg
Autres tests » Dell XPS 15 9570-CTXKW
Dell G3 15 3579-7972BLK: NVIDIA GeForce GTX 1050 Ti Mobile, 15.60", 2.5 kg
Autres tests » Dell G3 15 3579-7972BLK
Acer Predator Helios 300 PH315-51-73C5: NVIDIA GeForce GTX 1060 Mobile, 15.60", 2.7 kg
Autres tests » Acer Predator Helios 300 PH315-51-73C5
HP EliteBook 1050 G1-4NC55UT: NVIDIA GeForce GTX 1050 Mobile, 15.60", 2.1 kg
Autres tests » HP EliteBook 1050 G1-4NC55UT
Asus Zephyrus M GM501GS-90NR0031-M00420: NVIDIA GeForce GTX 1070 Mobile, 15.60", 2.5 kg
Autres tests » Asus Zephyrus M GM501GS-90NR0031-M00420
Asus Zephyrus S GX531GS: NVIDIA GeForce GTX 1070 Max-Q, 15.60", 2.1 kg
Autres tests » Asus GX531GS (Zephyrus S)
Asus Zephyrus S GX531GM: NVIDIA GeForce GTX 1060 Mobile, 15.60", 2.1 kg
Autres tests » Asus GX531GM (Zephyrus S)
MSI GE63 Raider RGB-010: NVIDIA GeForce GTX 1070 Mobile, 15.60", 2.5 kg
Autres tests » MSI GE63 Raider RGB-010
Lenovo Legion Y730-17ICH, i7-8750H: NVIDIA GeForce GTX 1050 Ti Mobile, 17.30", 2.9 kg
Autres tests » Lenovo Legion Y730-17ICH, i7-8750H
Lenovo Legion Y730-15ICH, i7-8750H: NVIDIA GeForce GTX 1050 Ti Mobile, 15.60", 2.2 kg
Autres tests » Lenovo Legion Y730-15ICH, i7-8750H
Dell XPS 15 9570 i7 UHD: NVIDIA GeForce GTX 1050 Ti Max-Q, 15.60", 2 kg
Autres tests » Dell XPS 15 9570 i7 UHD
Dell G7 15-7588: NVIDIA GeForce GTX 1060 Max-Q, 15.60", 2.6 kg
Autres tests » Dell G7 15-7588
Gigabyte Sabre 17-W8: NVIDIA GeForce GTX 1060 Mobile, 17.30", 2.8 kg
Autres tests » Gigabyte Sabre 17-W8
Dell G5 15 5587-M36TX: NVIDIA GeForce GTX 1060 Max-Q, 15.60", 2.9 kg
Autres tests » Dell G5 15 5587-M36TX
Alienware 15 R4-9PTN3: NVIDIA GeForce GTX 1070 Mobile, 15.60", 3.5 kg
Autres tests » Alienware 15 R4-9PTN3
Asus GL504GM-DS74 Strix Hero II: NVIDIA GeForce GTX 1060 Mobile, 15.60", 2.4 kg
Autres tests » Asus GL504GM-DS74 Strix Hero II
Origin PC EVO15-S 2018, 8750H: NVIDIA GeForce GTX 1070 Max-Q, 15.60", 2 kg
Autres tests » Origin PC EVO15-S 2018, 8750H
Lenovo Legion Y530-15ICH-81FV008RGE: NVIDIA GeForce GTX 1050 Ti Mobile, 15.60", 2.3 kg
Autres tests » Lenovo Legion Y530-15ICH-81FV008RGE
Acer Predator Helios 300 PH317-52-75L8: NVIDIA GeForce GTX 1060 Mobile, 17.30", 2.9 kg
Autres tests » Acer Predator Helios 300 PH317-52-75L8
Acer Nitro 5 AN515-52-74DR: NVIDIA GeForce GTX 1050 Ti Mobile, 15.60", 2.3 kg
Autres tests » Acer Nitro 5 AN515-52-74DR
Asus GL504GS: NVIDIA GeForce GTX 1070 Mobile, 15.60", 2.5 kg
Autres tests » Asus GL504
Lenovo ThinkPad P52 20MAS03N00: NVIDIA Quadro P1000, 15.60", 2.6 kg
Autres tests » Lenovo ThinkPad P52 20MAS03N00
HP Pavilion Gaming 15-cx0003ng: NVIDIA GeForce GTX 1050 Ti Mobile, 15.60", 2.3 kg
Autres tests » HP Pavilion Gaming 15-cx0003ng
Schenker XMG Neo 15: NVIDIA GeForce GTX 1060 Mobile, 15.60", 2 kg
Autres tests » Schenker XMG Neo 15
MSI GP73 Leopard 8RE-039XES: NVIDIA GeForce GTX 1060 Mobile, 17.30", 2.7 kg
Autres tests » MSI GP73 Leopard 8RE-039XES
HP Omen 15-dc0005NS: NVIDIA GeForce GTX 1050 Mobile, 15.60", 2.4 kg
Autres tests » HP Omen 15-DC0005NS
MSI GT63 Titan 8RG-060XES: NVIDIA GeForce GTX 1080 Mobile, 15.60", 3 kg
Autres tests » MSI GT63 Titan 8RG-060XES
MSI GP73 Leopard 8RF-415XES: NVIDIA GeForce GTX 1070 Mobile, 17.30", 2.2 kg
Autres tests » MSI GP73 Leopard 8RF-415XES
HP Pavilion 15-cx0675nd: NVIDIA GeForce GTX 1060 Mobile, 15.60", 2.4 kg
Autres tests » HP Pavilion 15-cx0675nd
Asus Zenbook Pro 15 UX580GE-E2005T: NVIDIA GeForce GTX 1050 Ti Mobile, 15.60", 1.9 kg
Autres tests » Asus Zenbook Pro 15 UX580GE-E2005T
Gigabyte Aero 14-K8: NVIDIA GeForce GTX 1050 Ti Mobile, 14.00", 1.9 kg
Autres tests » Gigabyte Aero 14-K8
Dell G5 15 5587 CN55815: NVIDIA GeForce GTX 1050 Ti Mobile, 15.60", 2.7 kg
Autres tests » Dell G5 15 5587 CN55815
Hyperbook Pulsar Z15: NVIDIA GeForce GTX 1060 Mobile, 15.60", 2 kg
Autres tests » Hyperbook Pulsar Z15
Asus TUF FX504GD-E4075: NVIDIA GeForce GTX 1050 Mobile, 15.60", 2.3 kg
Autres tests » Asus TUF FX504GD-E4075
MSI GS65 Stealth Thin 8RE-016NE: NVIDIA GeForce GTX 1070 Mobile, 15.60", 1.8 kg
Autres tests » MSI GS65 Stealth Thin 8RE-016NE
Asus Strix GL703GM-DS74: NVIDIA GeForce GTX 1060 Mobile, 17.30", 2.9 kg
Autres tests » Asus Strix GL703GM-DS74
Hyperbook SL950VR2: NVIDIA GeForce GTX 1070 Max-Q, 15.60", 1.9 kg
Autres tests » Hyperbook SL950VR2
MSI GT63 Titan 8RG-046: NVIDIA GeForce GTX 1080 Mobile, 15.60", 2.9 kg
Autres tests » MSI GT63 Titan 8RG-046
MSI GT75 Titan 8RG, i7-8750H: NVIDIA GeForce GTX 1080 Mobile, 17.30", 4.6 kg
Autres tests » MSI GT75 Titan 8RG, i7-8750H
Cyberpower Tracer III, i7-8750H, GTX 1060: NVIDIA GeForce GTX 1060 Mobile, 15.60"
Autres tests » Cyberpower Tracer III, i7-8750H, GTX 1060
Asus GL703GS Strix Scar Edition 90NR00E1-M00160: NVIDIA GeForce GTX 1070 Mobile, 17.30", 2.9 kg
Autres tests » Asus GL703GS Strix Scar Edition 90NR00E1-M00160
HP Pavilion 17-ab404ng: NVIDIA GeForce GTX 1050 Ti Mobile, 17.30", 3.1 kg
Autres tests » HP Pavilion 17-ab404ng
MSI GL63 8RD-407XES: NVIDIA GeForce GTX 1050 Ti Mobile, 15.60", 2.2 kg
Autres tests » MSI GL63 8RD-407XES
Asus Rog Strix Scar Edition GL703GM-E5016: NVIDIA GeForce GTX 1060 Mobile, 17.30", 3 kg
Autres tests » Asus Rog Strix Scar Edition GL703GM-E5016
MSI GE63 Raider RGB 8RF-039XES: NVIDIA GeForce GTX 1070 Mobile, 15.60", 2.5 kg
Autres tests » MSI GE63 Raider RGB 8RF-039XES
Asus FX504GE-DM198T: NVIDIA GeForce GTX 1050 Ti Mobile, 15.60", 2.3 kg
Autres tests » Asus FX504GE-DM198T
MSI GL63 8RC-015XES: NVIDIA GeForce GTX 1050 Mobile, 15.60", 2.2 kg
Autres tests » MSI GL63 8RC-015XES
MSI GP63 8RE-041XES: NVIDIA GeForce GTX 1060 Mobile, 15.60", 2.2 kg
Autres tests » MSI GP63 8RE-041XES
Asus TUF FX504GE-EN088T: NVIDIA GeForce GTX 1050 Ti Mobile, 15.60", 2.3 kg
Autres tests » Asus TUF FX504GE-EN088T
MSI GS65 8RF-040NL: NVIDIA GeForce GTX 1070 Mobile, 15.60", 1.9 kg
Autres tests » MSI GS65 8RF-040NL
MSI GP63 Leopard 8RE-013US: NVIDIA GeForce GTX 1060 Mobile, 15.60", 2.3 kg
Autres tests » MSI GP63 Leopard 8RE-013US
Asus Zephyrus GM501G: NVIDIA GeForce GTX 1070 Mobile, 15.60", 2.5 kg
Autres tests » Asus Zephyrus GM501G
Asus ROG GU501GM-BI7N8: NVIDIA GeForce GTX 1060 Mobile, 15.60", 2.5 kg
Autres tests » Asus ROG GU501GM-BI7N8
Acer Aspire 7 A717-72G-71PM: NVIDIA GeForce GTX 1050 Mobile, 17.30", 3 kg
Autres tests » Acer Aspire 7 A717-72G-71PM
Asus Zenbook Pro 15 UX550GE-BN026R: NVIDIA GeForce GTX 1050 Ti Mobile, 15.60", 2 kg
Autres tests » Asus Zenbook Pro 15 UX550GE-BN026R
Razer Blade 15 2018: NVIDIA GeForce GTX 1070 Max-Q, 15.60", 2.1 kg
Autres tests » Razer Blade 15 2018
MSI GE73 8RF-211DE - Raider RGB: NVIDIA GeForce GTX 1070 Mobile, 17.30", 2.9 kg
Autres tests » MSI GE73 8RF-211DE - Raider RGB
MSI GE63 8RE-222DE: NVIDIA GeForce GTX 1060 Mobile, 15.60", 2.5 kg
Autres tests » MSI GE63 8RE-222DE
Acer Predator Helios 500 PH517-51-79BY: NVIDIA GeForce GTX 1070 Mobile, 17.30", 3.8 kg
Autres tests » Acer Predator Helios 500 PH517-51-79BY
MSI GE73 8RF-008 Raider RGB: NVIDIA GeForce GTX 1070 Mobile, 17.30", 2.9 kg
Autres tests » MSI GE73 8RF-008 Raider RGB
MSI GS65 8RF-019DE Stealth Thin: NVIDIA GeForce GTX 1070 Max-Q, 15.60", 1.8 kg
Autres tests » MSI GS65 8RF-019DE Stealth Thin
Acer Predator Helios 300 PH315-51-78TP: NVIDIA GeForce GTX 1060 Mobile, 15.60", 2.7 kg
Autres tests » Acer Predator Helios 300 PH315-51-78TP
Gigabyte Aero 14 v8: NVIDIA GeForce GTX 1050 Ti Mobile, 14.00", 1.9 kg
Autres tests » Gigabyte Aero 14 v8
MSI GE73-008 8RF Raider RGB: NVIDIA GeForce GTX 1070 Mobile, 17.30", 2.9 kg
Autres tests » MSI GE73-008 8RF Raider RGB
Gigabyte Aero 15W v8-DE025PB: NVIDIA GeForce GTX 1060 Mobile, 15.60", 2 kg
Autres tests » Gigabyte Aero 15W v8-DE025PB
MSI GL63 8RD-014XES: NVIDIA GeForce GTX 1050 Ti Mobile, 15.60", 2.2 kg
Autres tests » MSI GL63 8RD-014XES
MSI GE63 Raider RGB 8RF-008: NVIDIA GeForce GTX 1070 Mobile, 15.60", 2.5 kg
Autres tests » MSI GE63 Raider 8RF-008
MSI GT63 8RG-018-Titan 4K: NVIDIA GeForce GTX 1080 Mobile, 15.60", 2.9 kg
Autres tests » MSI GT63 8RG-018-Titan 4K
Asus Zephyrus M GM501: NVIDIA GeForce GTX 1070 Mobile, 15.60", 2.5 kg
Autres tests » Asus Zephyrus M GM501
MSI GS65 8RF-078 Stealth Thin: NVIDIA GeForce GTX 1070 Max-Q, 15.60", 1.8 kg
Autres tests » MSI GS65 8RF-078 Stealth Thin
MSI GS65 8RE-079 Stealth Thin: NVIDIA GeForce GTX 1060 Mobile, 15.60", 1.8 kg
Autres tests » MSI GS65 8RE-079 Stealth Thin
Gigabyte Aero 15X v8: NVIDIA GeForce GTX 1070 Max-Q, 15.60", 2.1 kg
Autres tests » Gigabyte Aero 15X v8