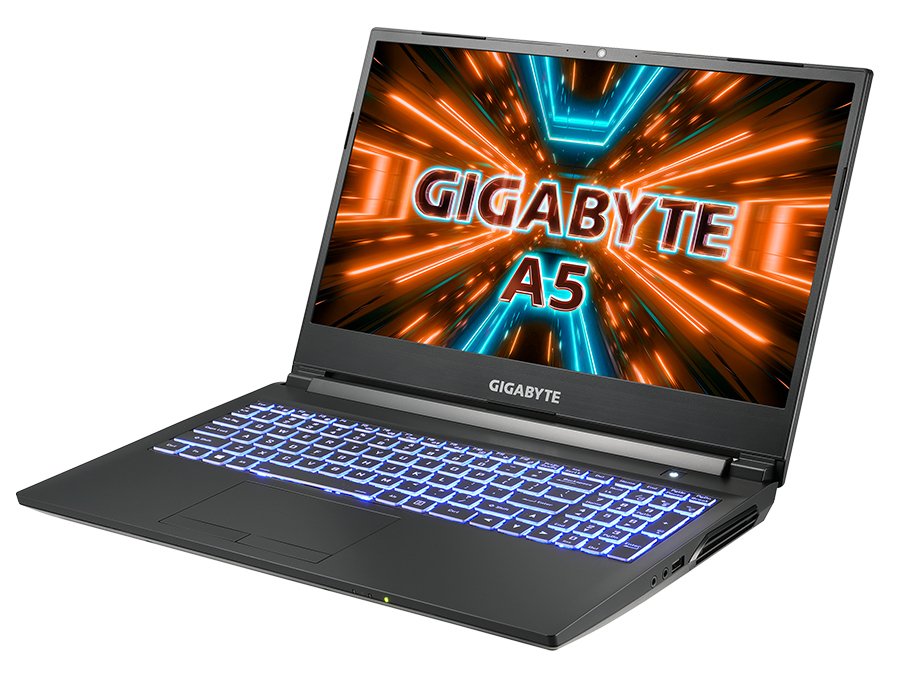
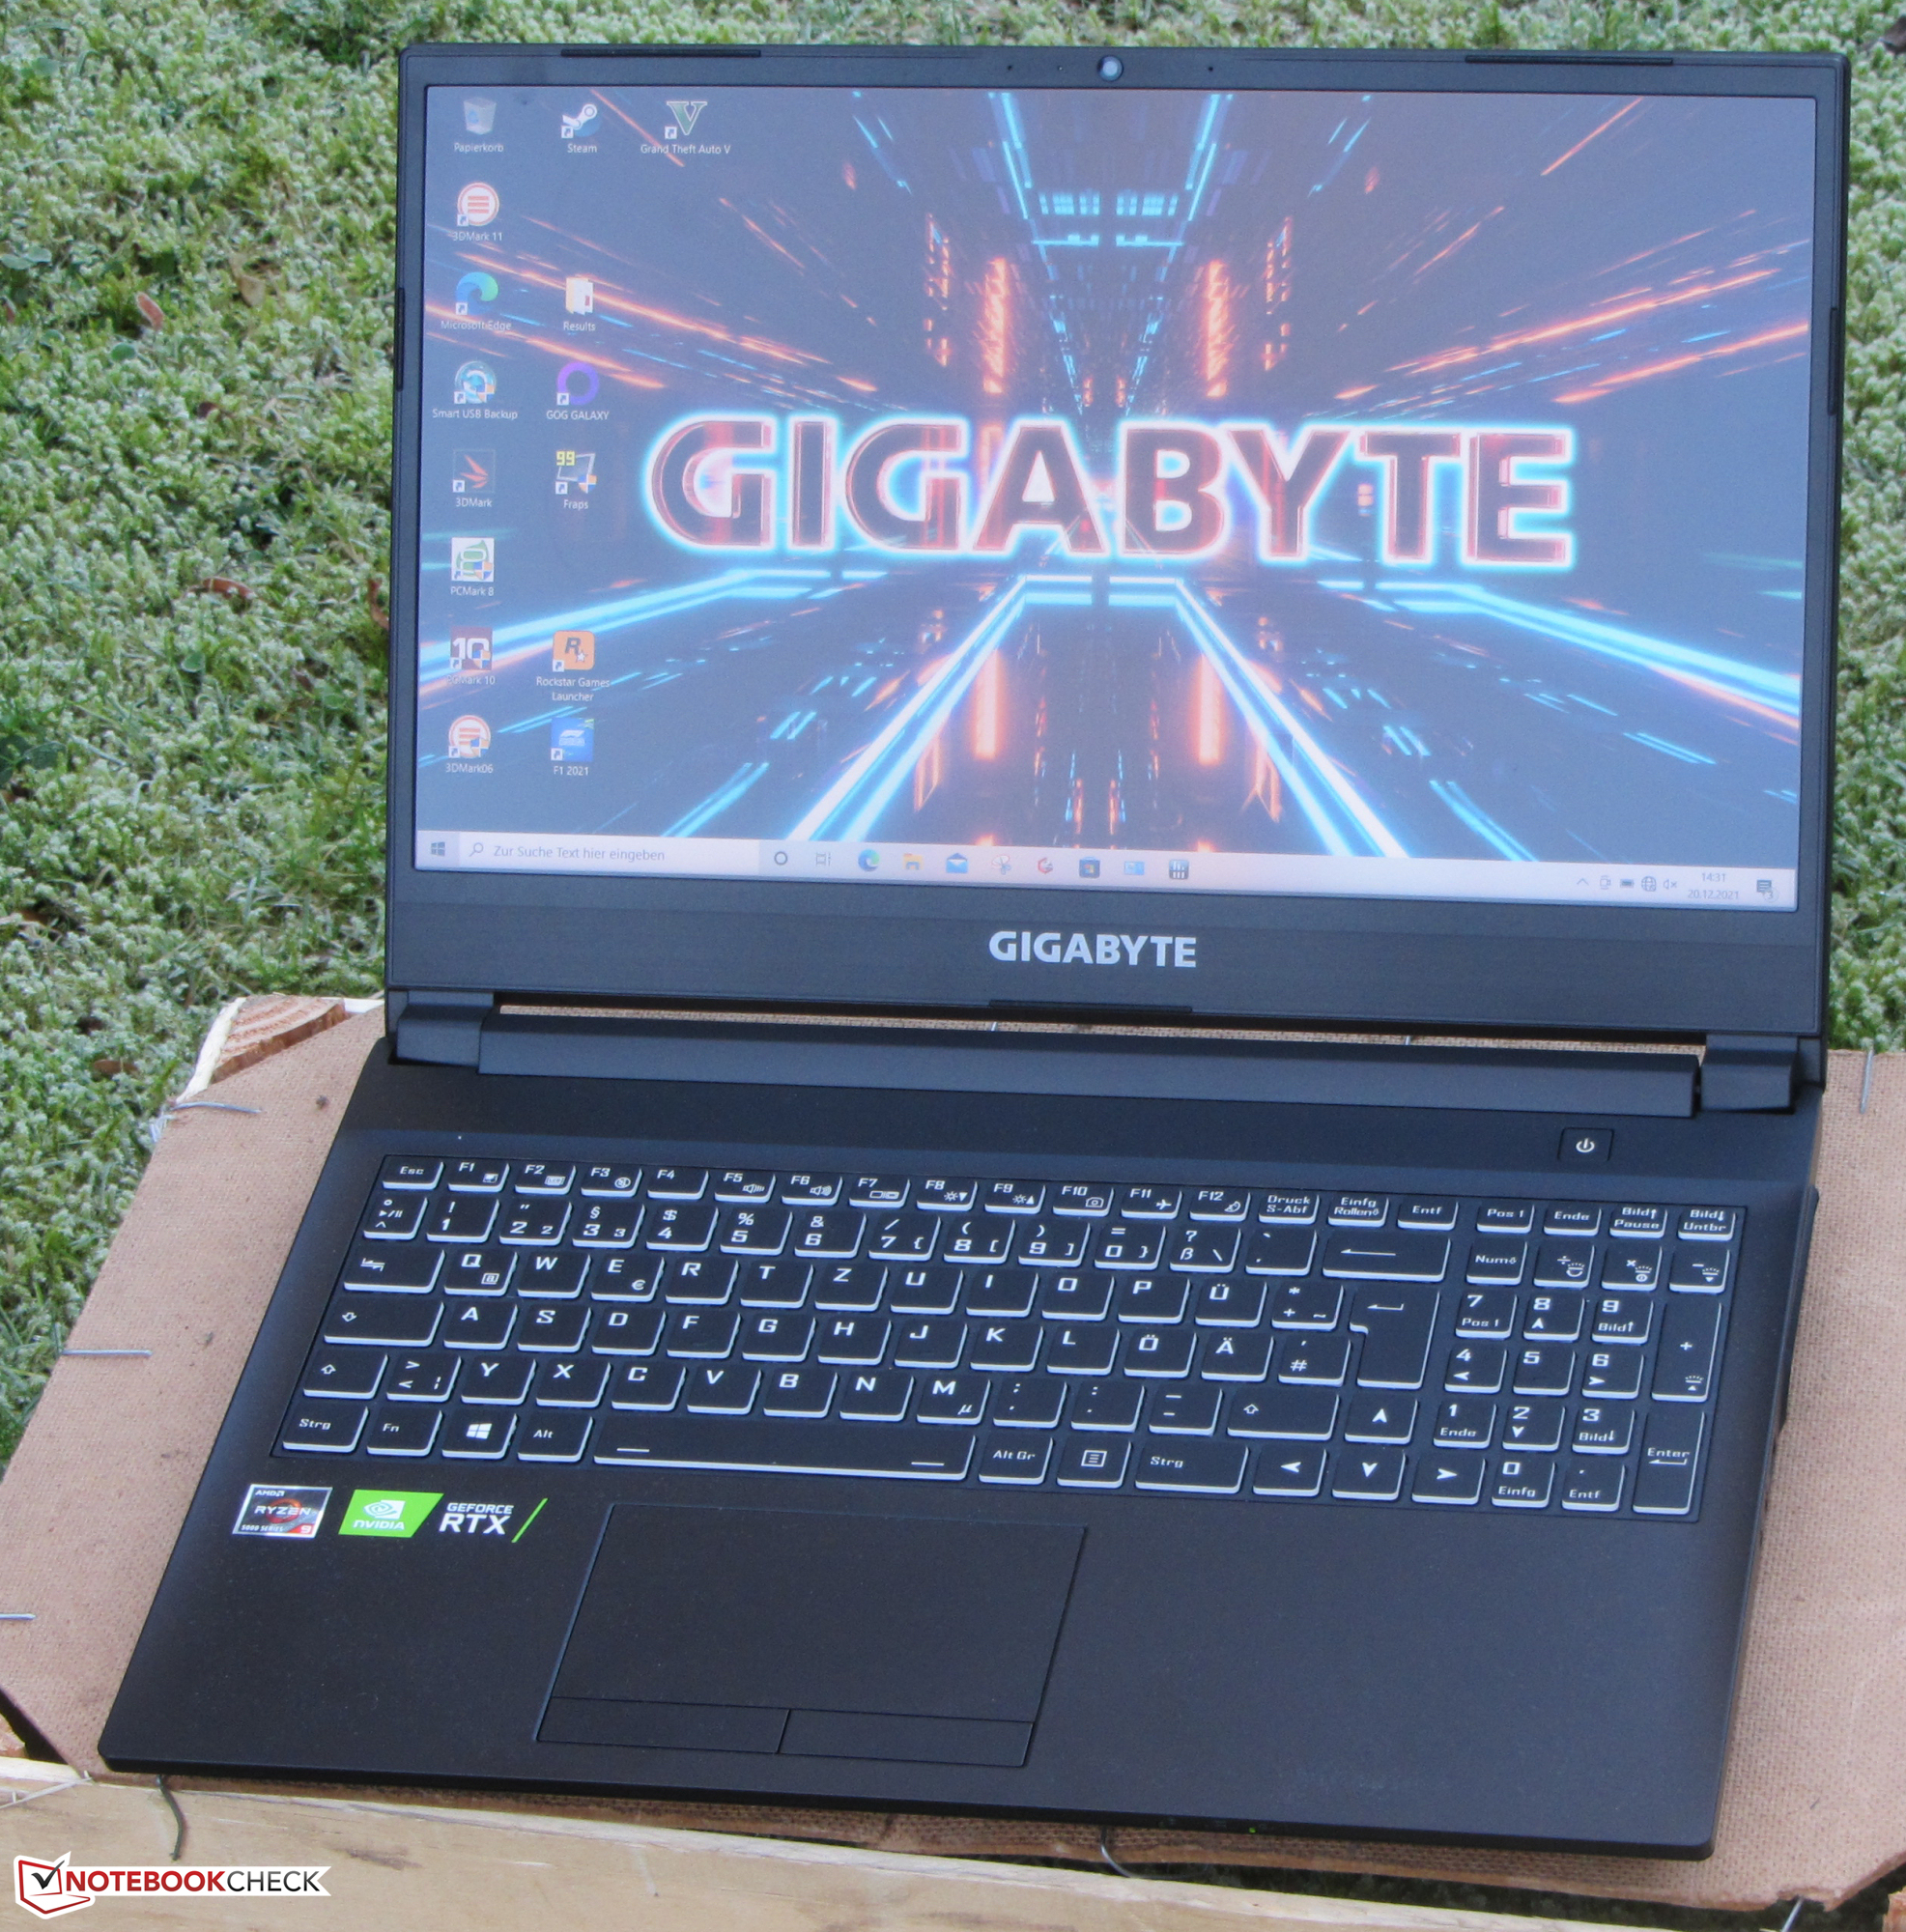
Test du Gigabyte A5 X1 un ordinateur portable puissant pour les jeux

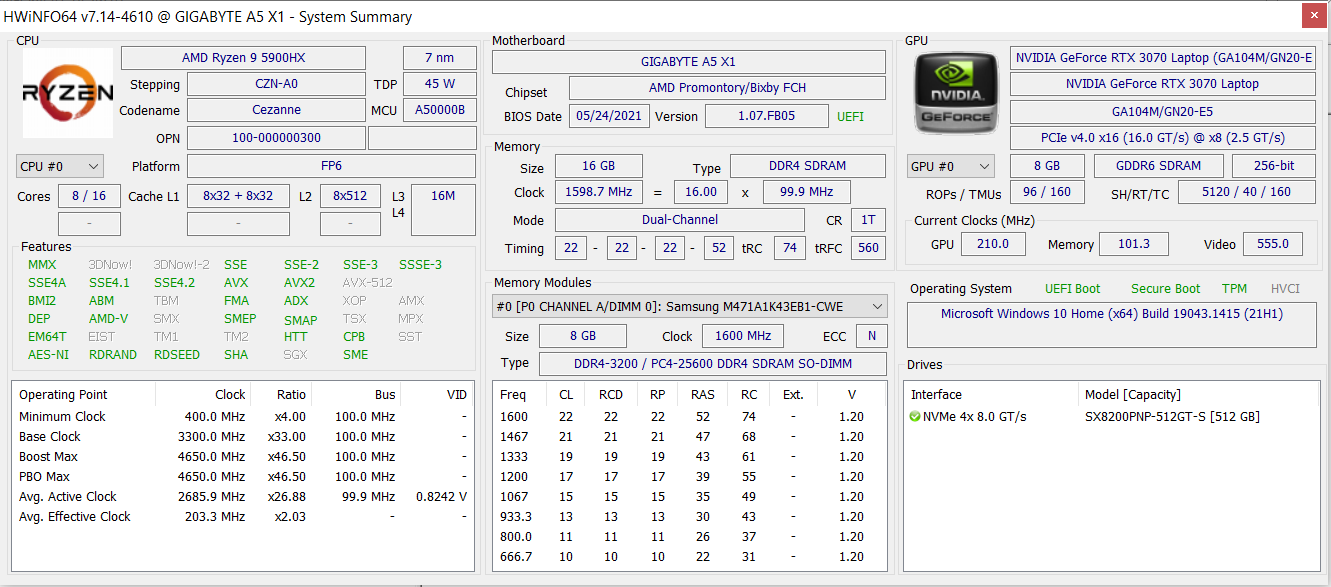
L'ordinateur portable de 15,6 pouces de Gigabyte est propulsé par un processeurRyzen 9 5900HX-APU et d'unGeForce RTX 3070 laptop GPU. Notre modèle peut être acheté pour un peu moins de 1 800 euros (~2 032 $). Parmi les concurrents, on trouve des appareils comme le MSI Katana GF66 11UGleAcer Nitro 5 AN515-45leSchenker XMG Apex 15et le HP Omen 16
Possible contenders in comparison
Note | Date | Modèle | Poids | Épaisseur | Taille | Résolution | Prix |
|---|---|---|---|---|---|---|---|
| 84.1 % v7 (old) | 01/22 | Gigabyte A5 X1 R9 5900HX, GeForce RTX 3070 Laptop GPU | 2.2 kg | 25.3 mm | 15.60" | 1920x1080 | |
| 86.6 % v7 (old) | 10/21 | HP Omen 16-b0085ng i7-11800H, GeForce RTX 3070 Laptop GPU | 2.4 kg | 23 mm | 16.10" | 1920x1080 | |
| 79.2 % v7 (old) | 09/21 | MSI Katana GF66 11UG-220 i7-11800H, GeForce RTX 3070 Laptop GPU | 2.3 kg | 25 mm | 15.60" | 1920x1080 | |
| 82.2 % v7 (old) | 08/21 | Acer Nitro 5 AN515-45-R1JH R7 5800H, GeForce RTX 3070 Laptop GPU | 2.3 kg | 23.9 mm | 15.60" | 2560x1440 | |
| 84.4 % v7 (old) | 11/21 | Schenker XMG Apex 15 NH57E PS R7 5800H, GeForce RTX 3060 Laptop GPU | 2.1 kg | 29 mm | 15.60" | 1920x1080 |
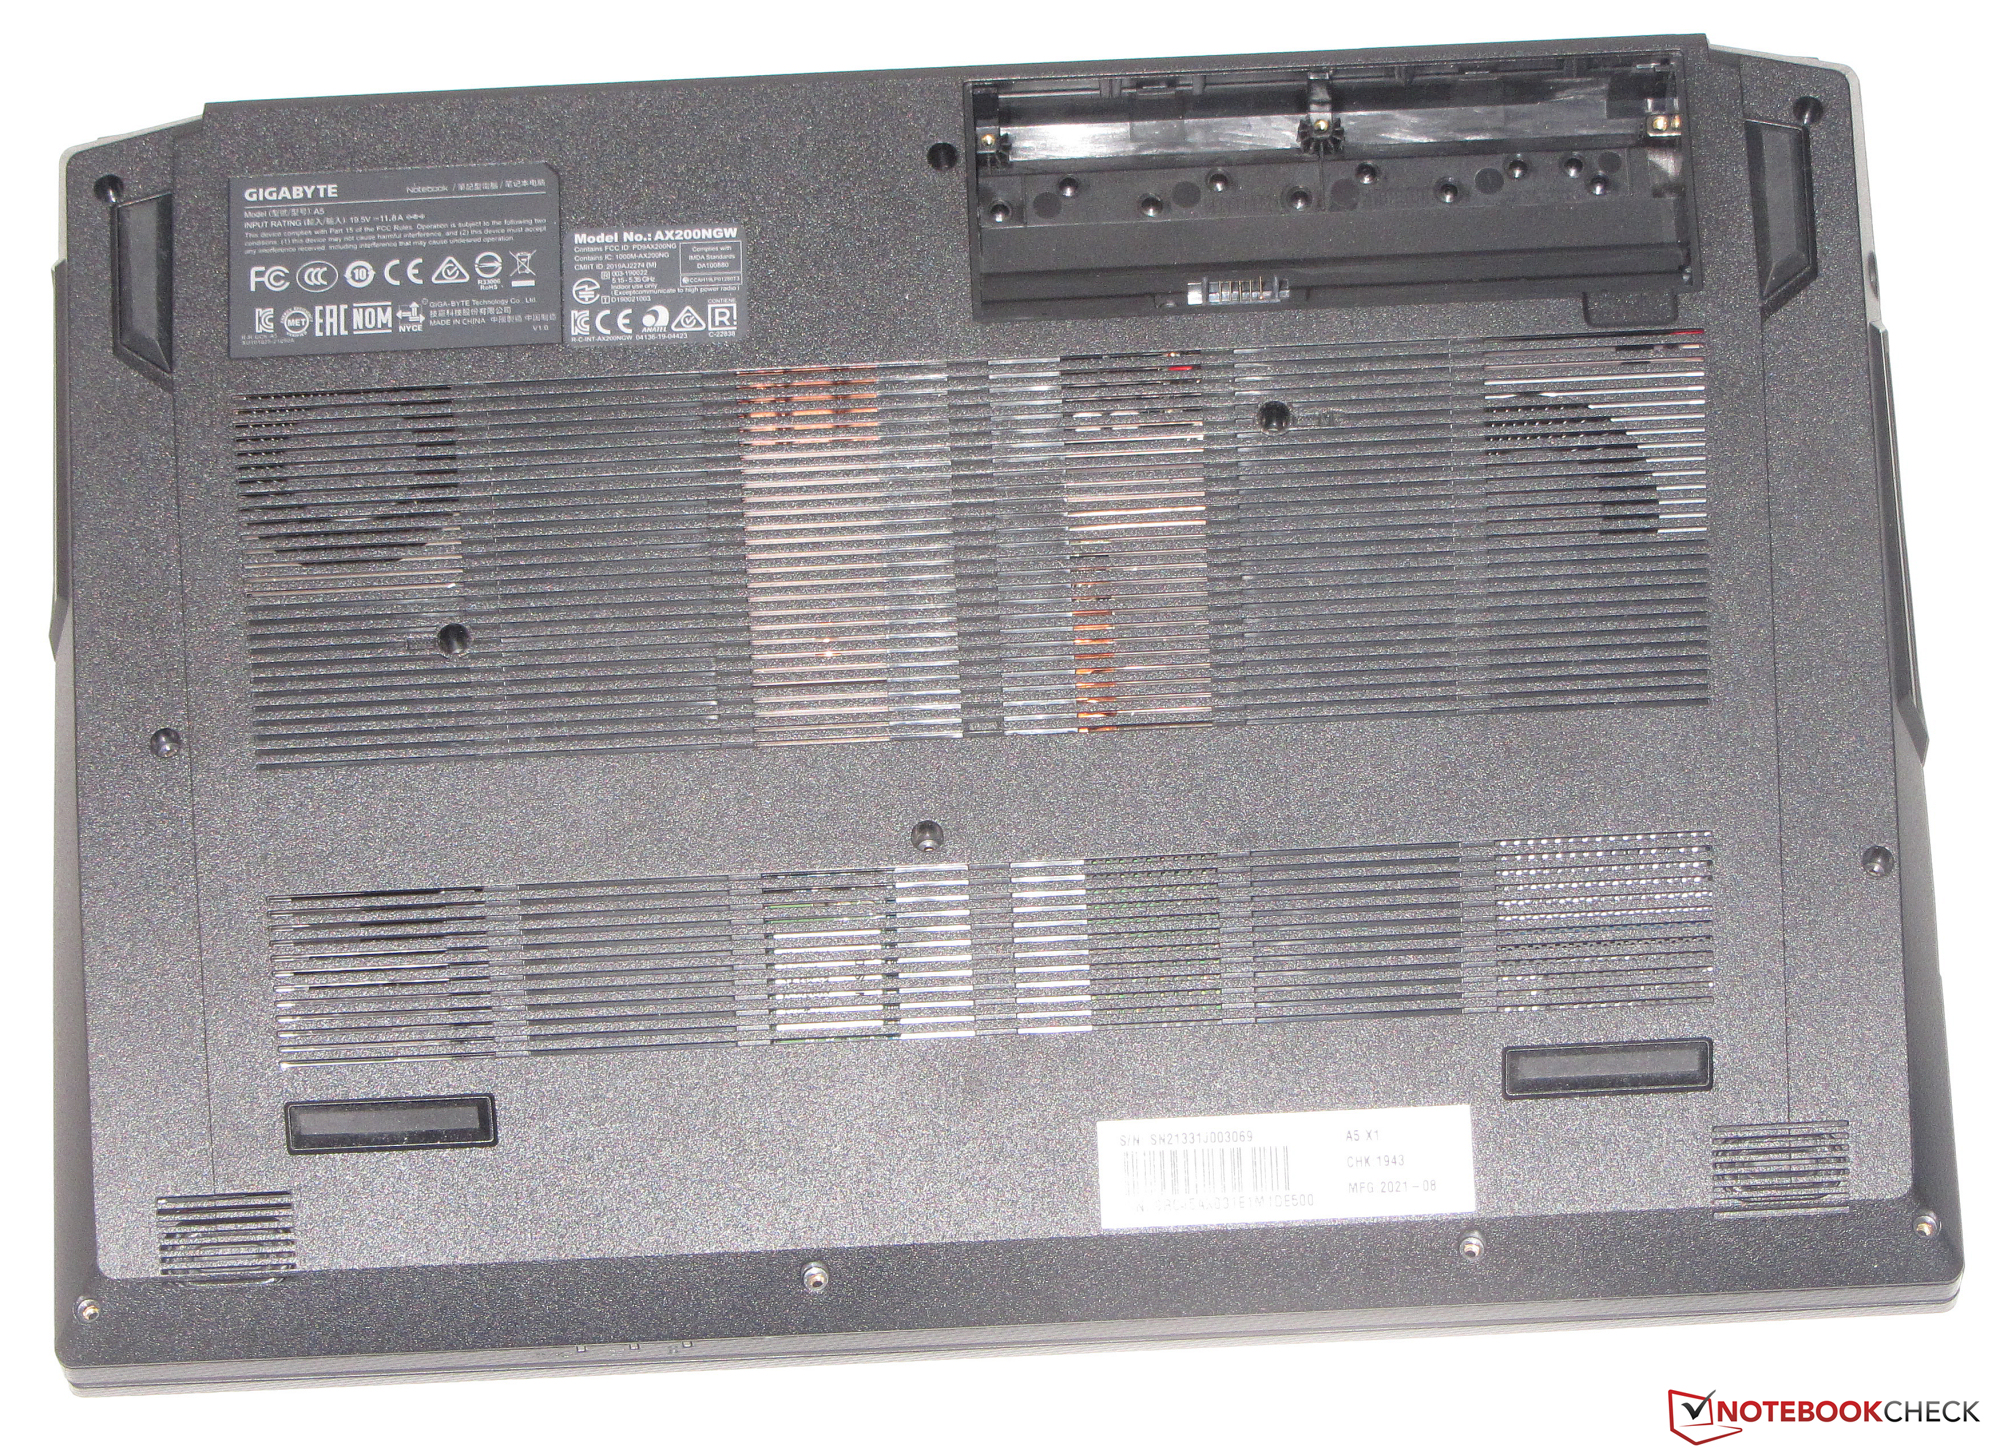
Boîtier - L'A5 est livré dans un châssis en plastique
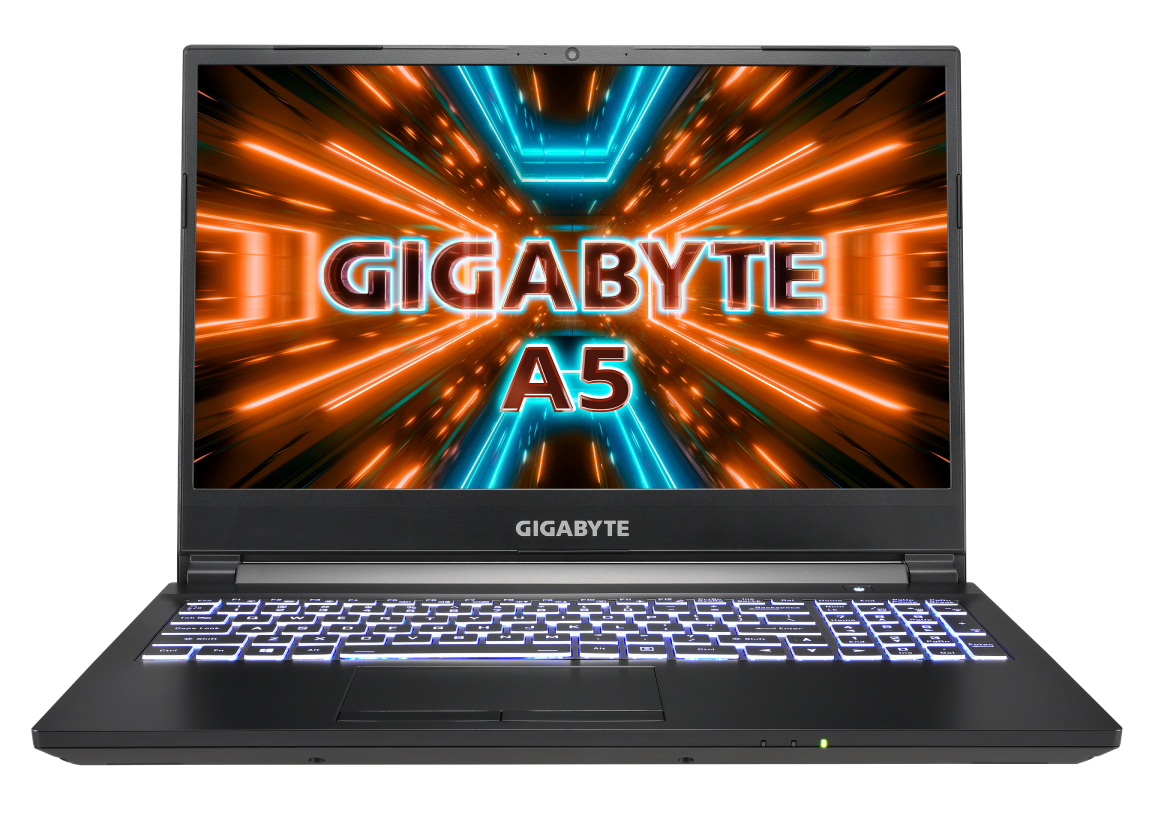
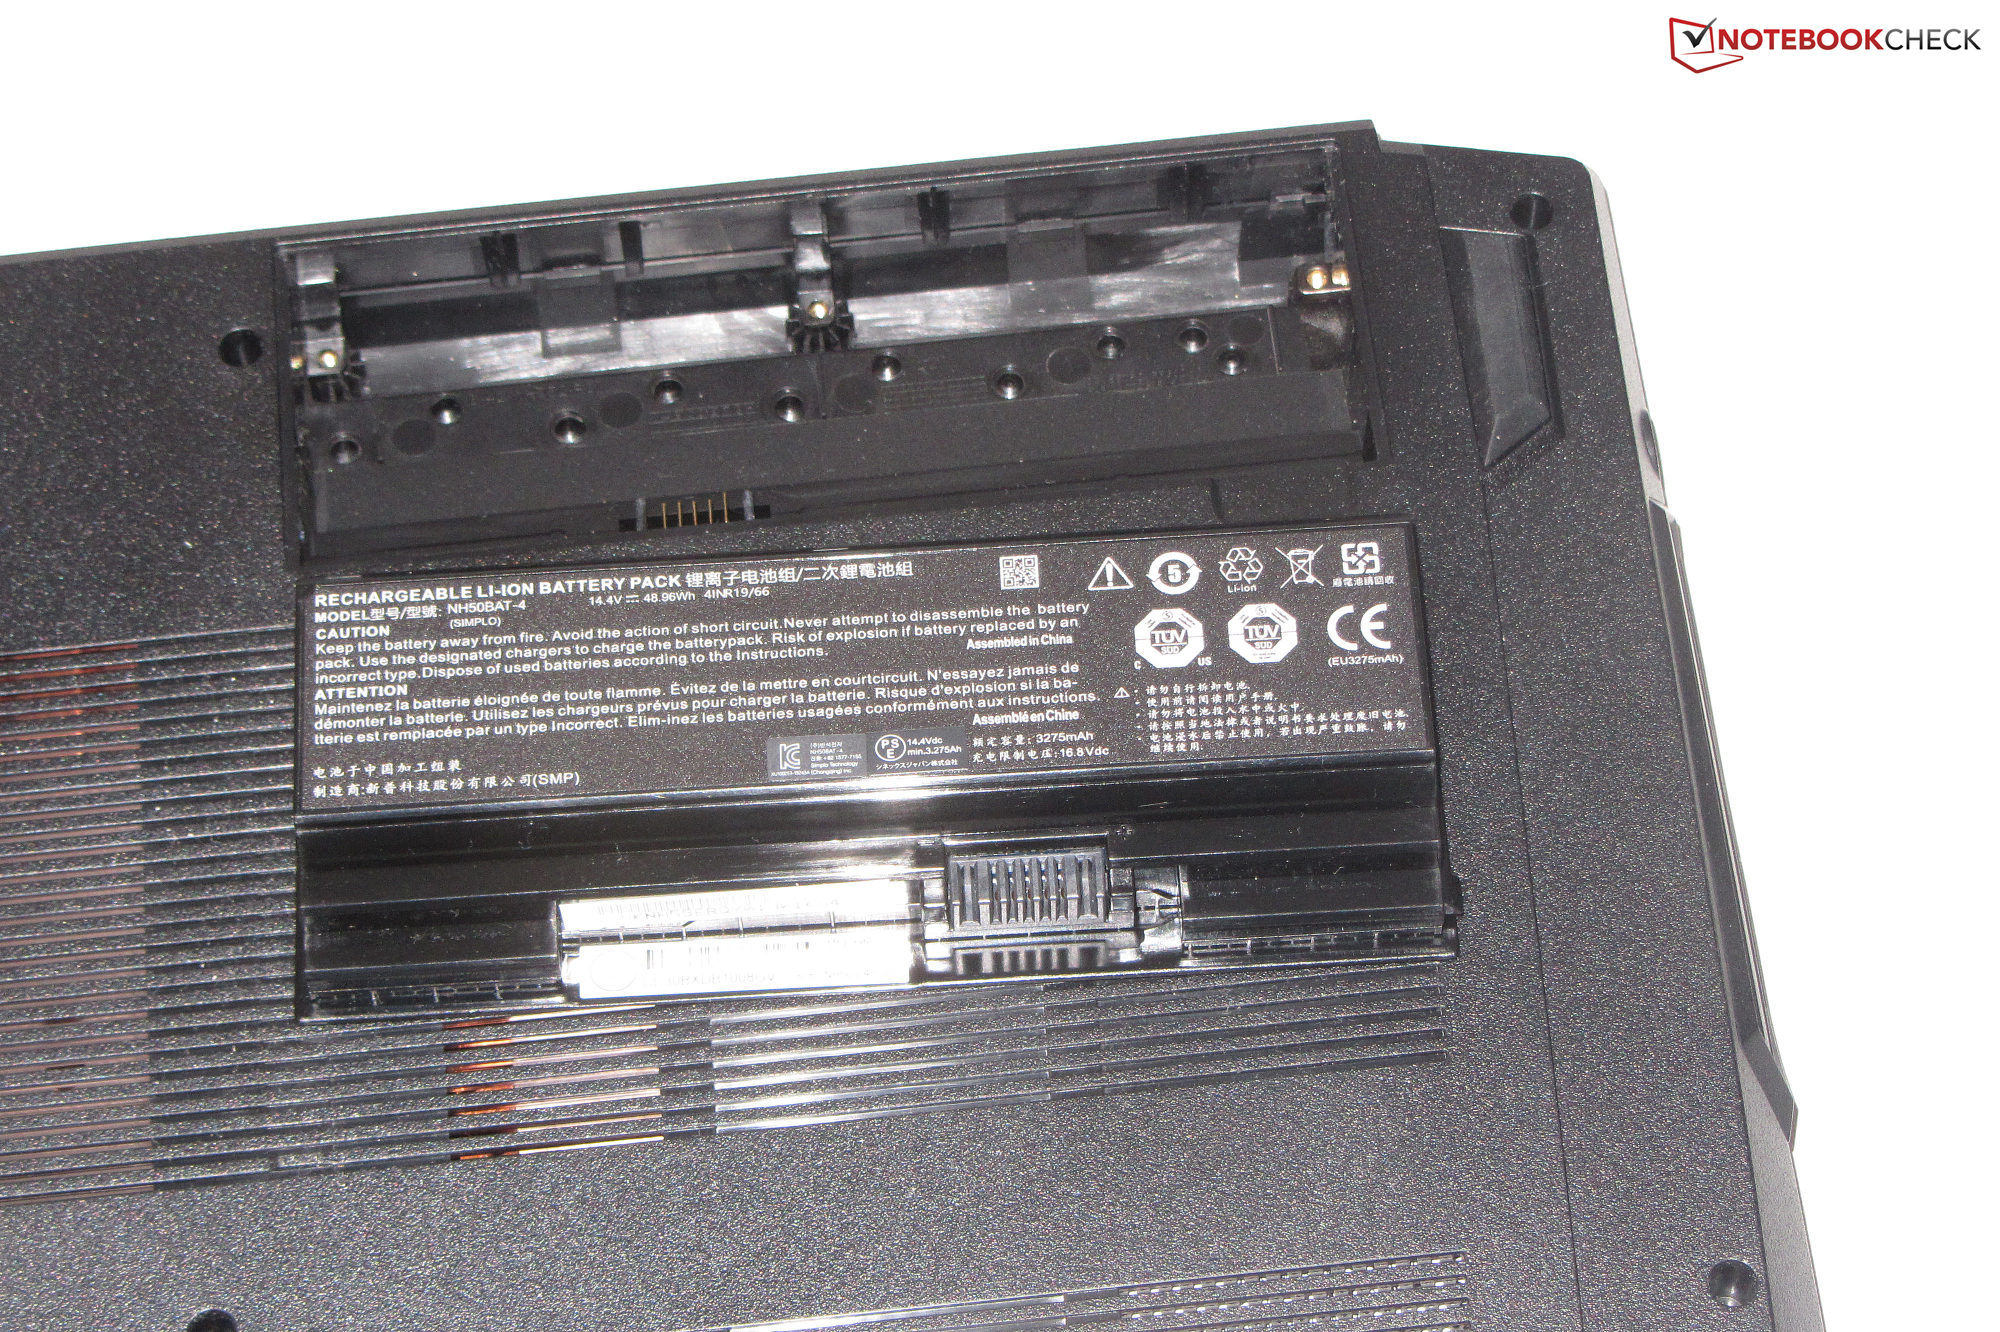
Le boîtier de l'A5 n'offre pas de matériaux de haute qualité. Gigabyte opte pour un boîtier en plastique noir dont le design peut être qualifié de sobre et fonctionnel - l'ordinateur portable n'attire pas l'attention. L'arrière du couvercle et le haut de l'unité de base ont des surfaces mates et lisses, tandis que les surfaces du couvercle inférieur et les bords étroits du couvercle sont rugueux. L'ordinateur portable n'est pas livré avec une trappe de maintenance. La batterie peut être retirée de l'extérieur.
Le châssis ne révèle aucun défaut de fabrication. Les dimensions de l'espace sont précises, et il n'y a pas de protubérances matérielles. Bien que l'unité de base puisse être un peu tordue, l'ensemble reste dans les limites. En revanche, le couvercle manque de rigidité. Les charnières maintiennent fermement le couvercle en position et ne lui permettent que d'osciller légèrement. L'angle d'ouverture maximal est d'environ 120 degrés. Il est possible d'ouvrir le couvercle d'une seule main
En termes de poids et de taille, les ordinateurs portables de notre comparatif ne diffèrent pas beaucoup. L'A5 est l'un des appareils les plus légers
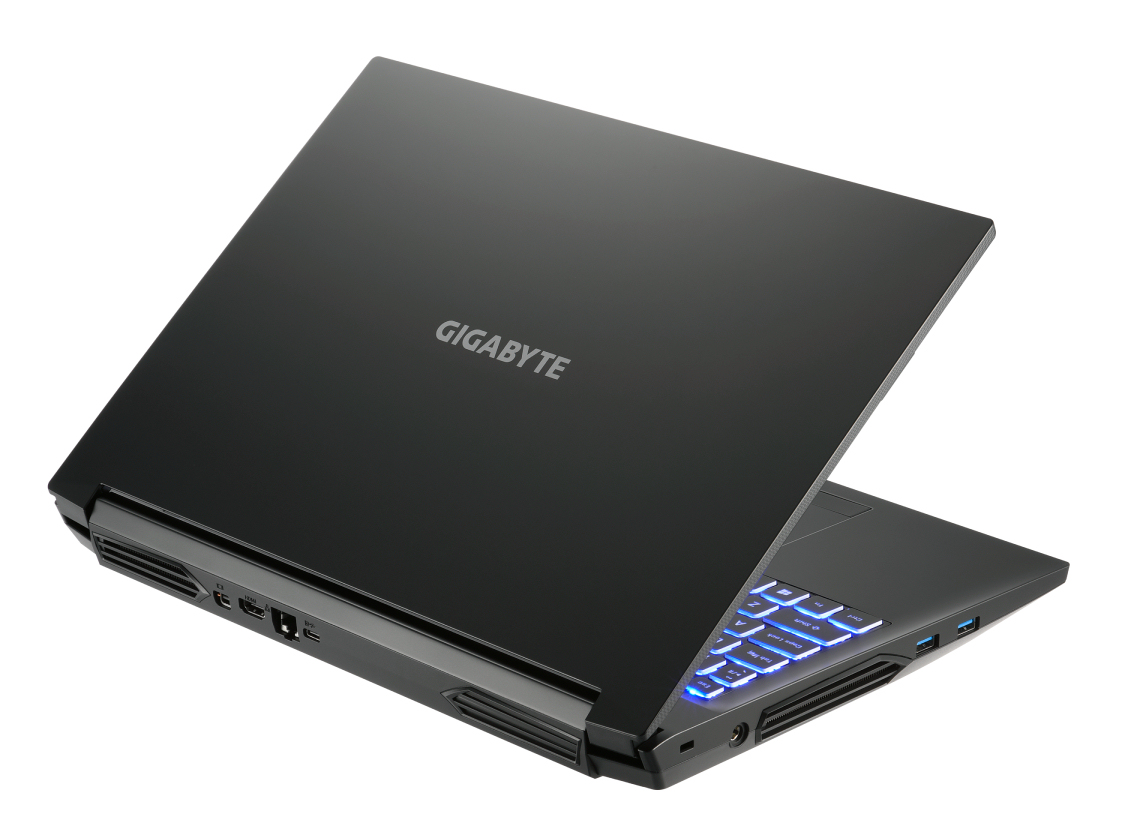
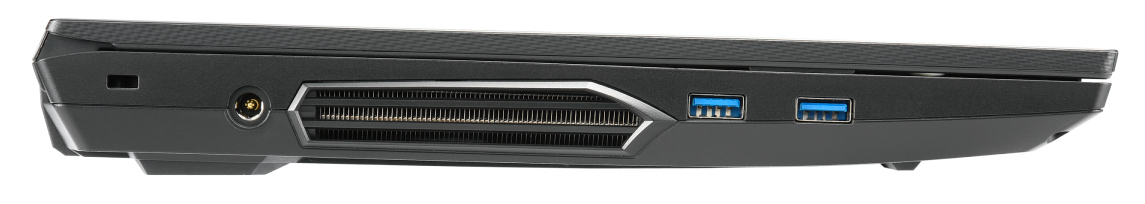
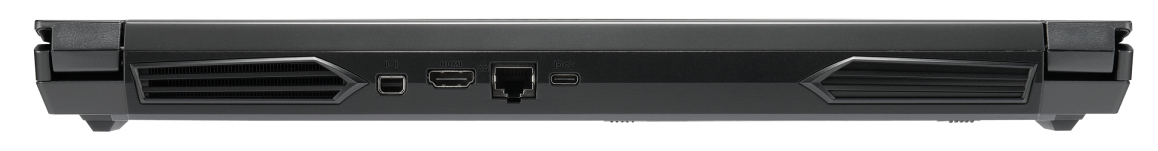
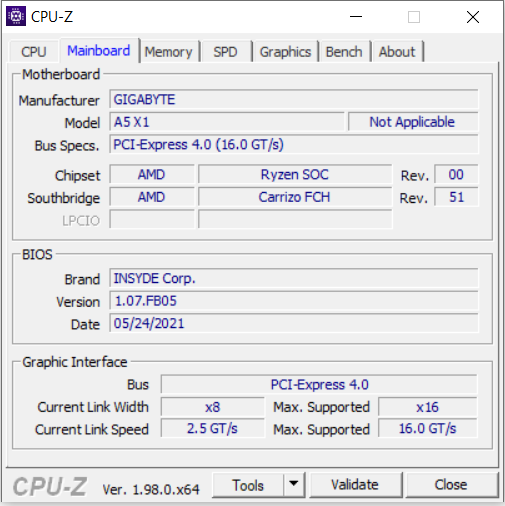
Connectivité - Ordinateur portable Gigabyte sans Thunderbolt
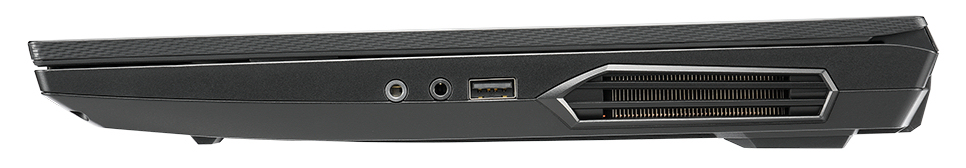
L'A5 est équipé de trois ports USB-A (1x USB 2.0, 1x USB 3.2 Gen 1, 1x USB 3.2 Gen 2) et d'un port USB-C (USB 3.2 Gen 2). Ce dernier prend en charge DisplayPort via USB-C. Cela signifie qu'il y a trois sorties vidéo avec le port HDMI et le Mini DisplayPort dédié. Gigabyte n'a pas fourni à l'ordinateur portable de jeu un lecteur de carte mémoire.
Les ports sont répartis le long de trois des côtés de l'ordinateur portable. Les trois sorties vidéo ainsi que le port Ethernet sont situés à l'arrière de l'appareil. Par conséquent, les câbles correspondants passent vers l'arrière sans se gêner
Communication
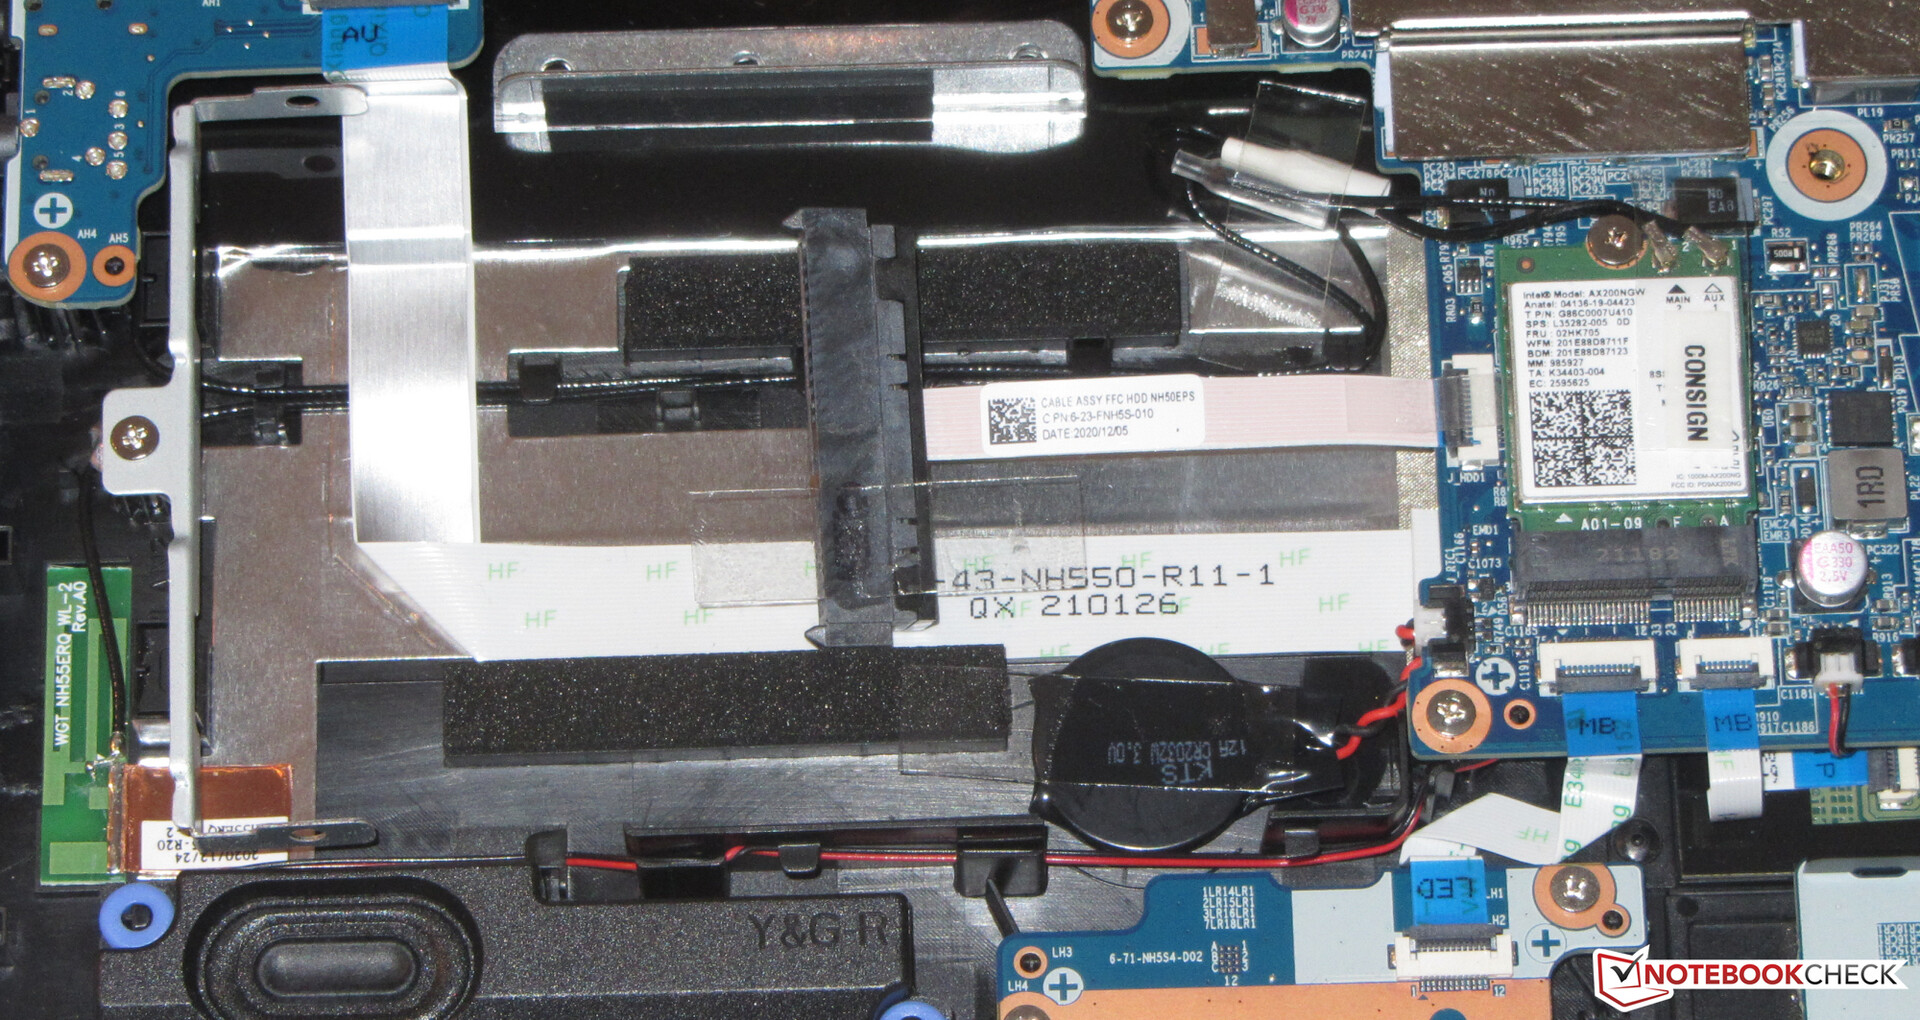
Le module WLAN est équipé d'une puce (AX200) d'Intel qui prend en charge les normes 802.11a/b/g/n/ac/ax. Les vitesses de transmission déterminées dans des conditions optimales (aucun autre appareil WLAN à proximité, courte distance entre l'ordinateur portable et le PC serveur) sont excellentes. Le contrôleur Realtek RTL8125 Gigabit Ethernet se charge des connexions réseau filaires. Il s'acquitte de ses tâches sans aucun problème
Webcam
La webcam intégrée (0,9 MP) est une bonne surprise : Les couleurs des photos prises ne s'écartent que très peu de la cible - on voit rarement cela. Sinon, l'appareil photo offre une qualité standard

")
")
Accessoires
Outre les documents habituels (guide de démarrage rapide et informations sur la garantie), l'ordinateur portable est livré avec des vis (pour la connexion d'un disque de stockage de 2,5 pouces au cadre de montage), et une plaque thermique (pour un deuxième SSD)
Maintenance
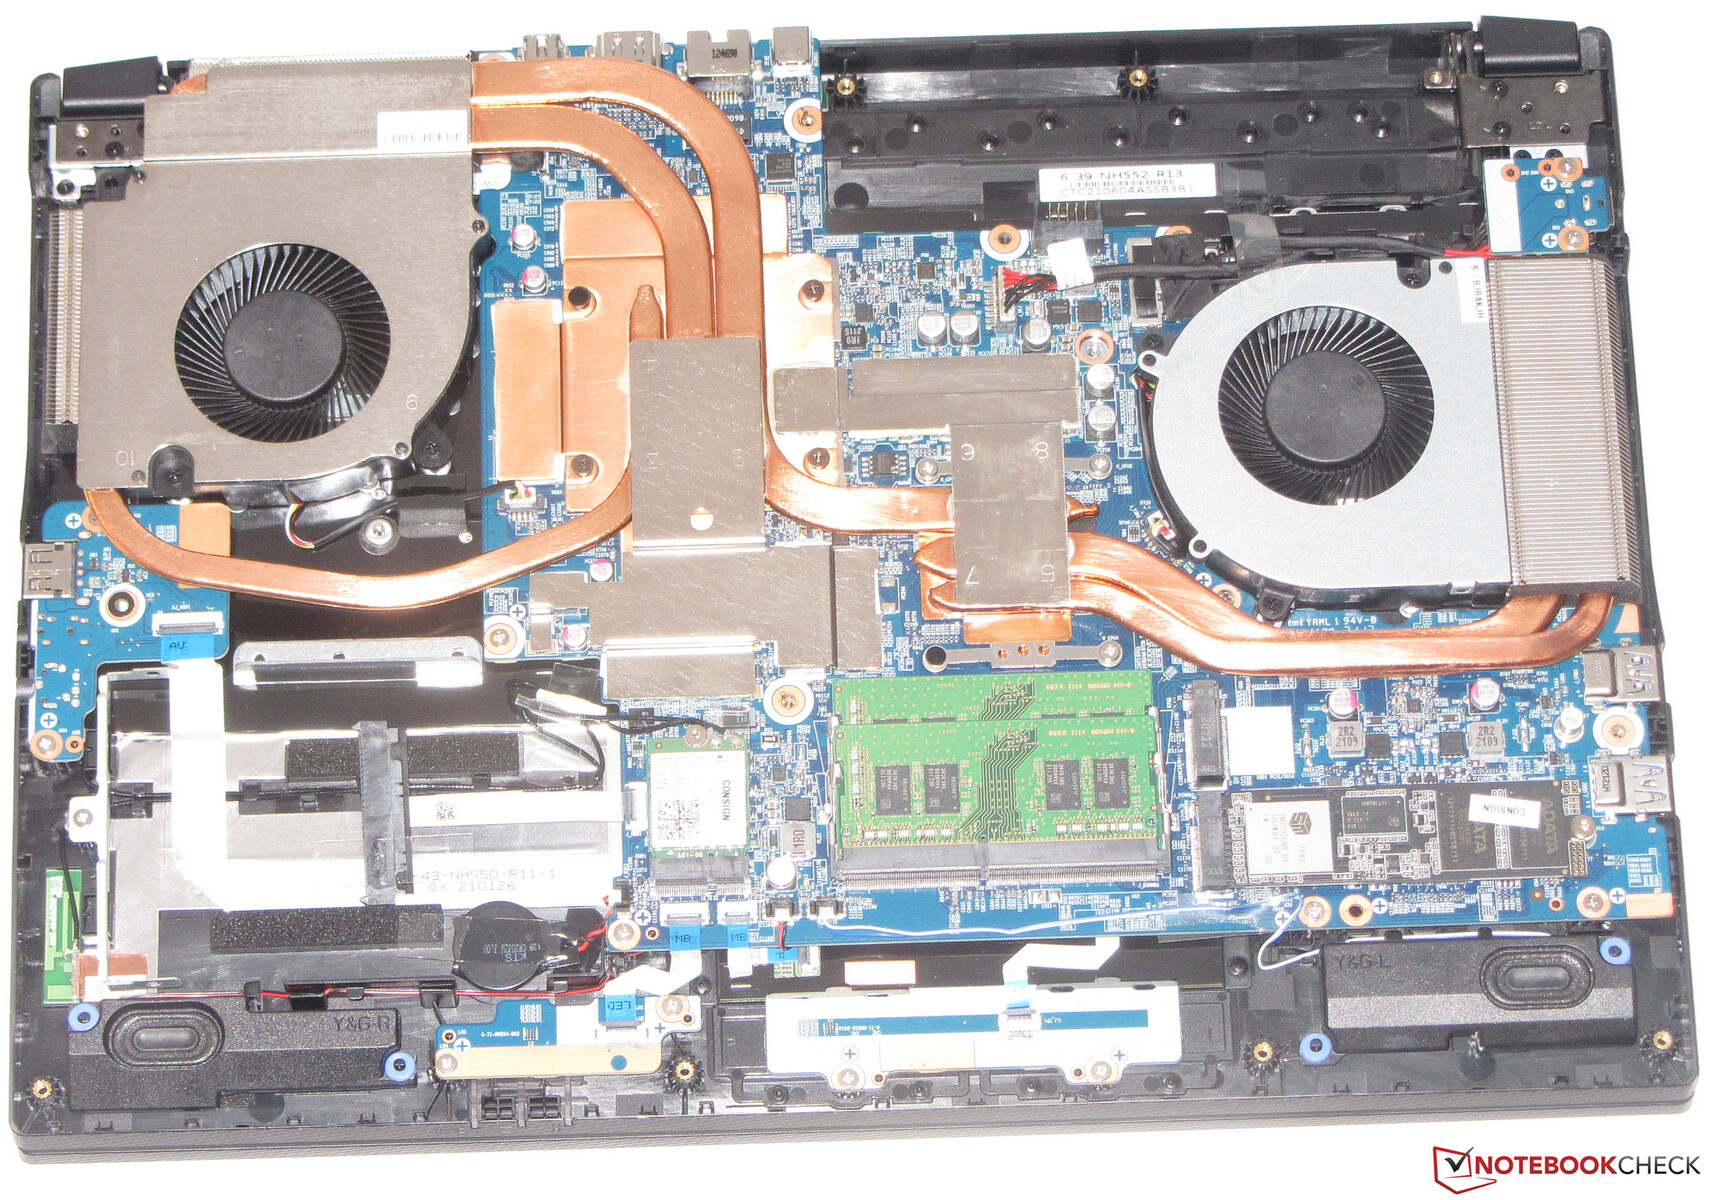
Après avoir desserré toutes les vis situées au bas de l'appareil (il y a également des vis dans le compartiment de la batterie), le couvercle inférieur peut être retiré à l'aide d'une spatule plate ou d'un outil de finition de joint - le couvercle inférieur est assez serré à certains endroits. Après cela, vous pouvez accéder au SSD, au deuxième emplacement M.2, au port SATA, au module WLAN, à la RAM, à la batterie du BIOS et aux ventilateurs
Garantie
Gigabyte accorde à ce 15,6 pouces une garantie de deux ans. Les extensions de garantie ne sont pas disponibles
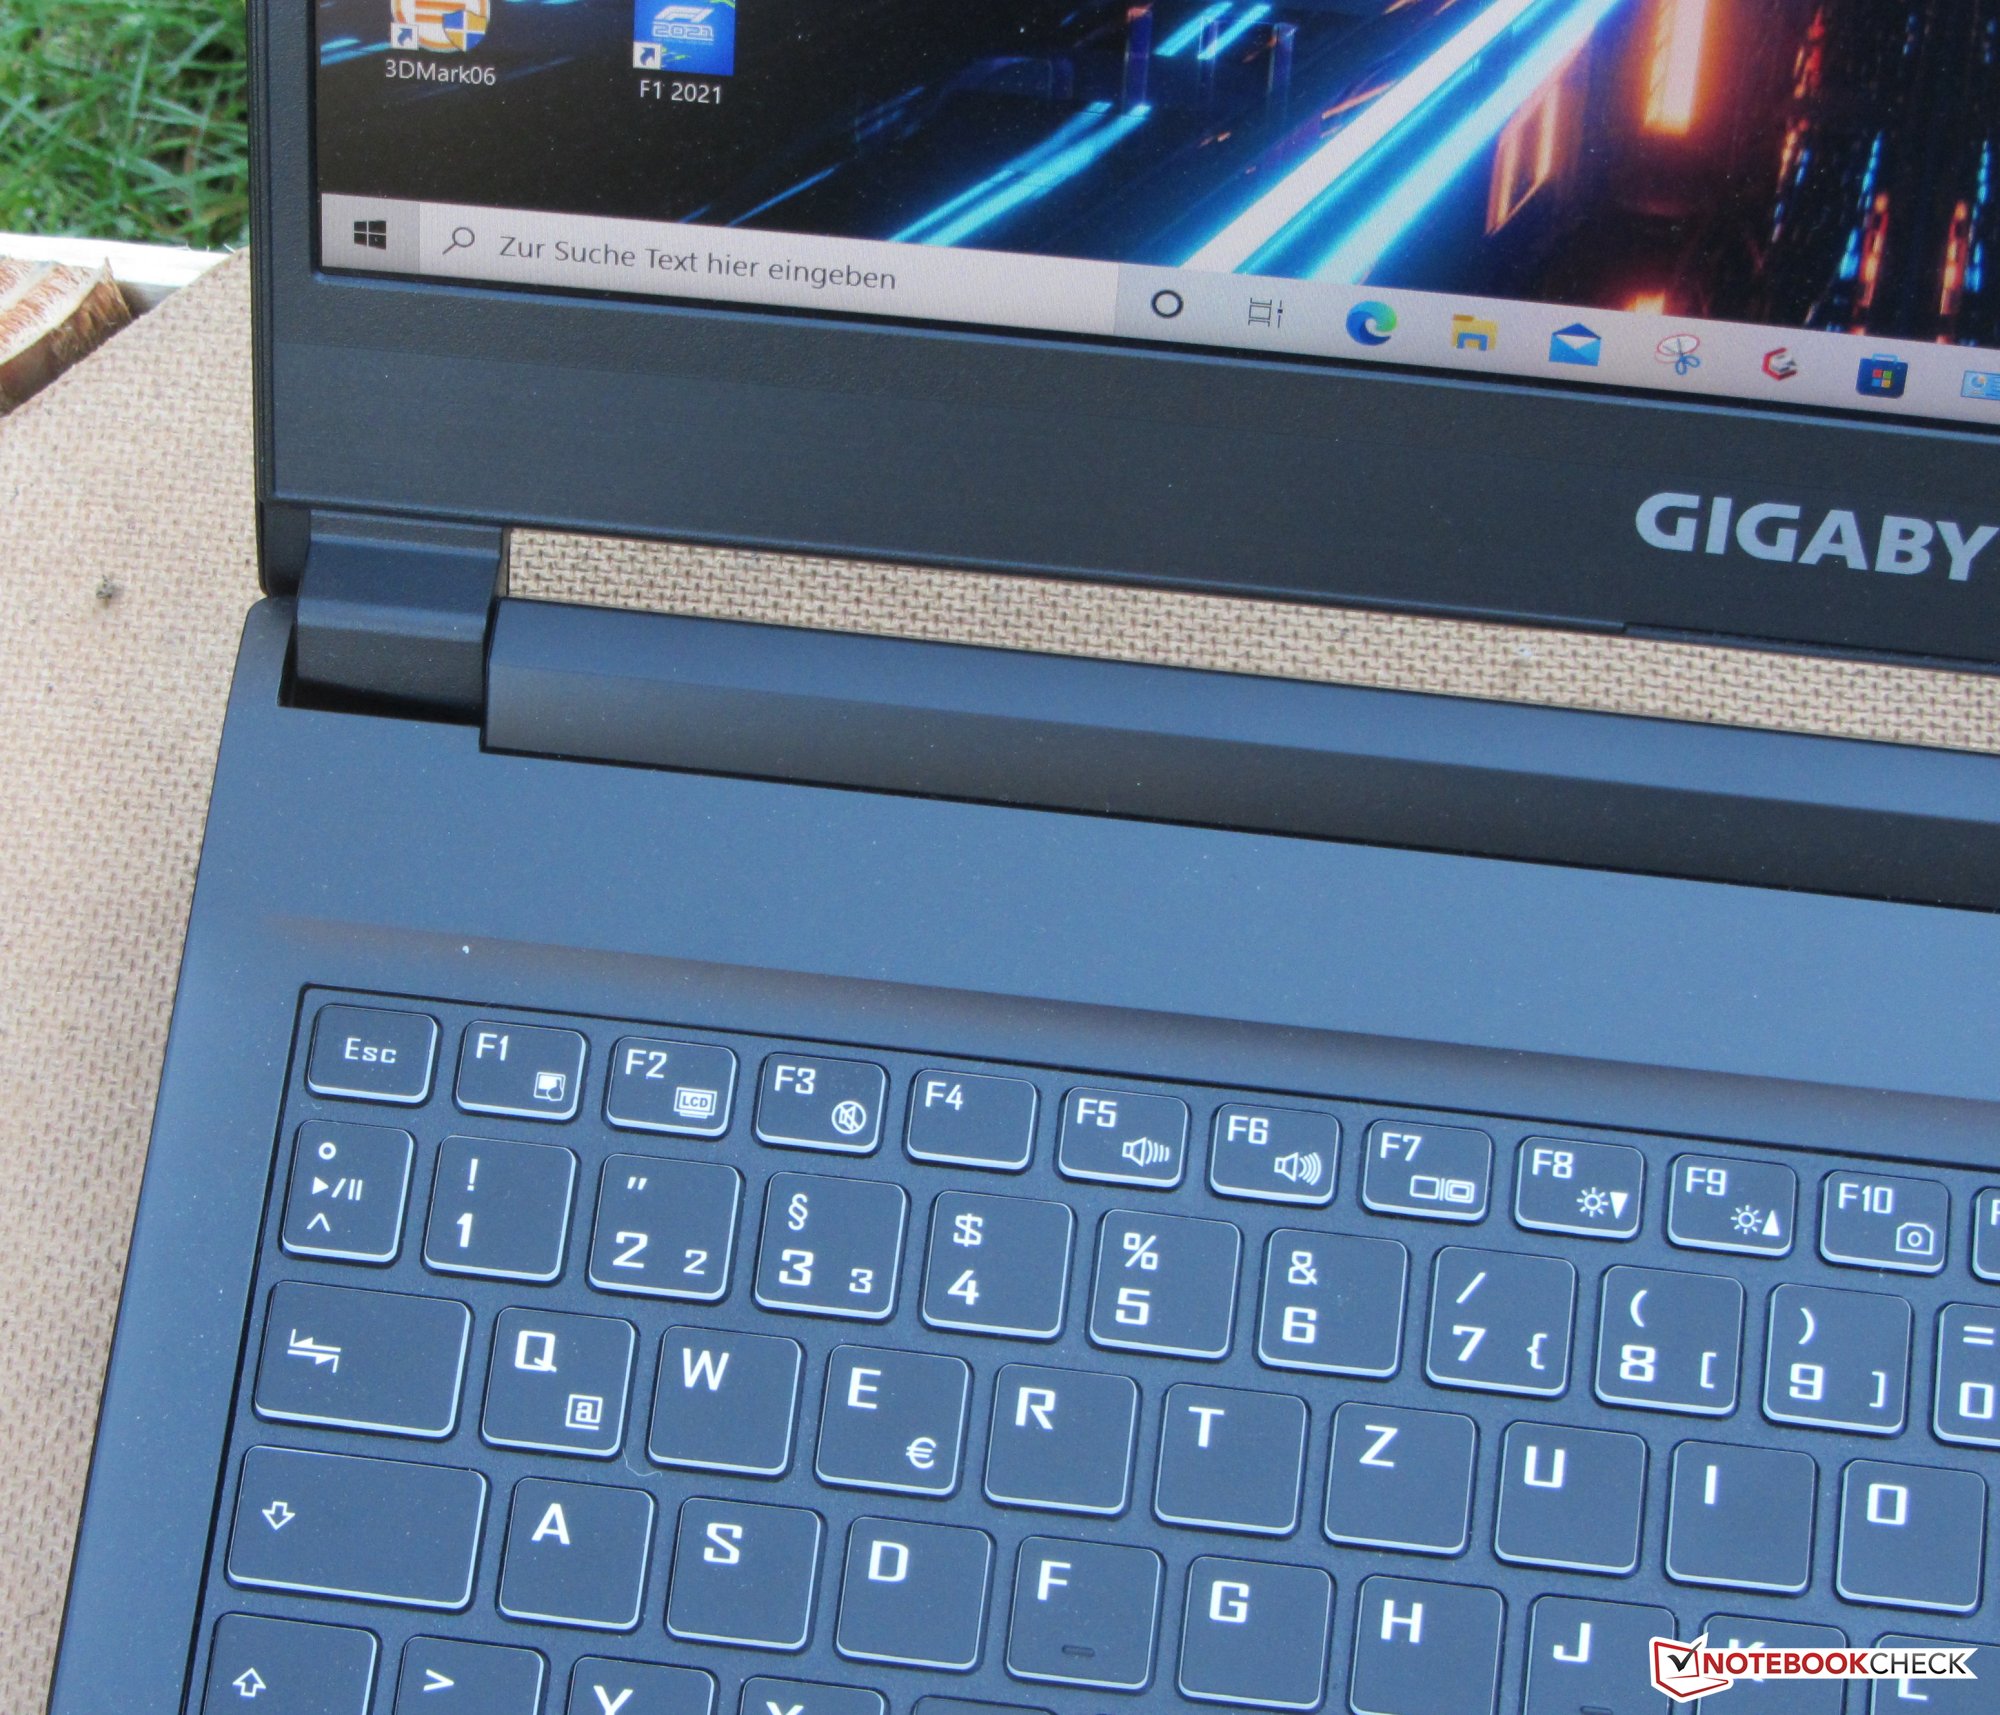
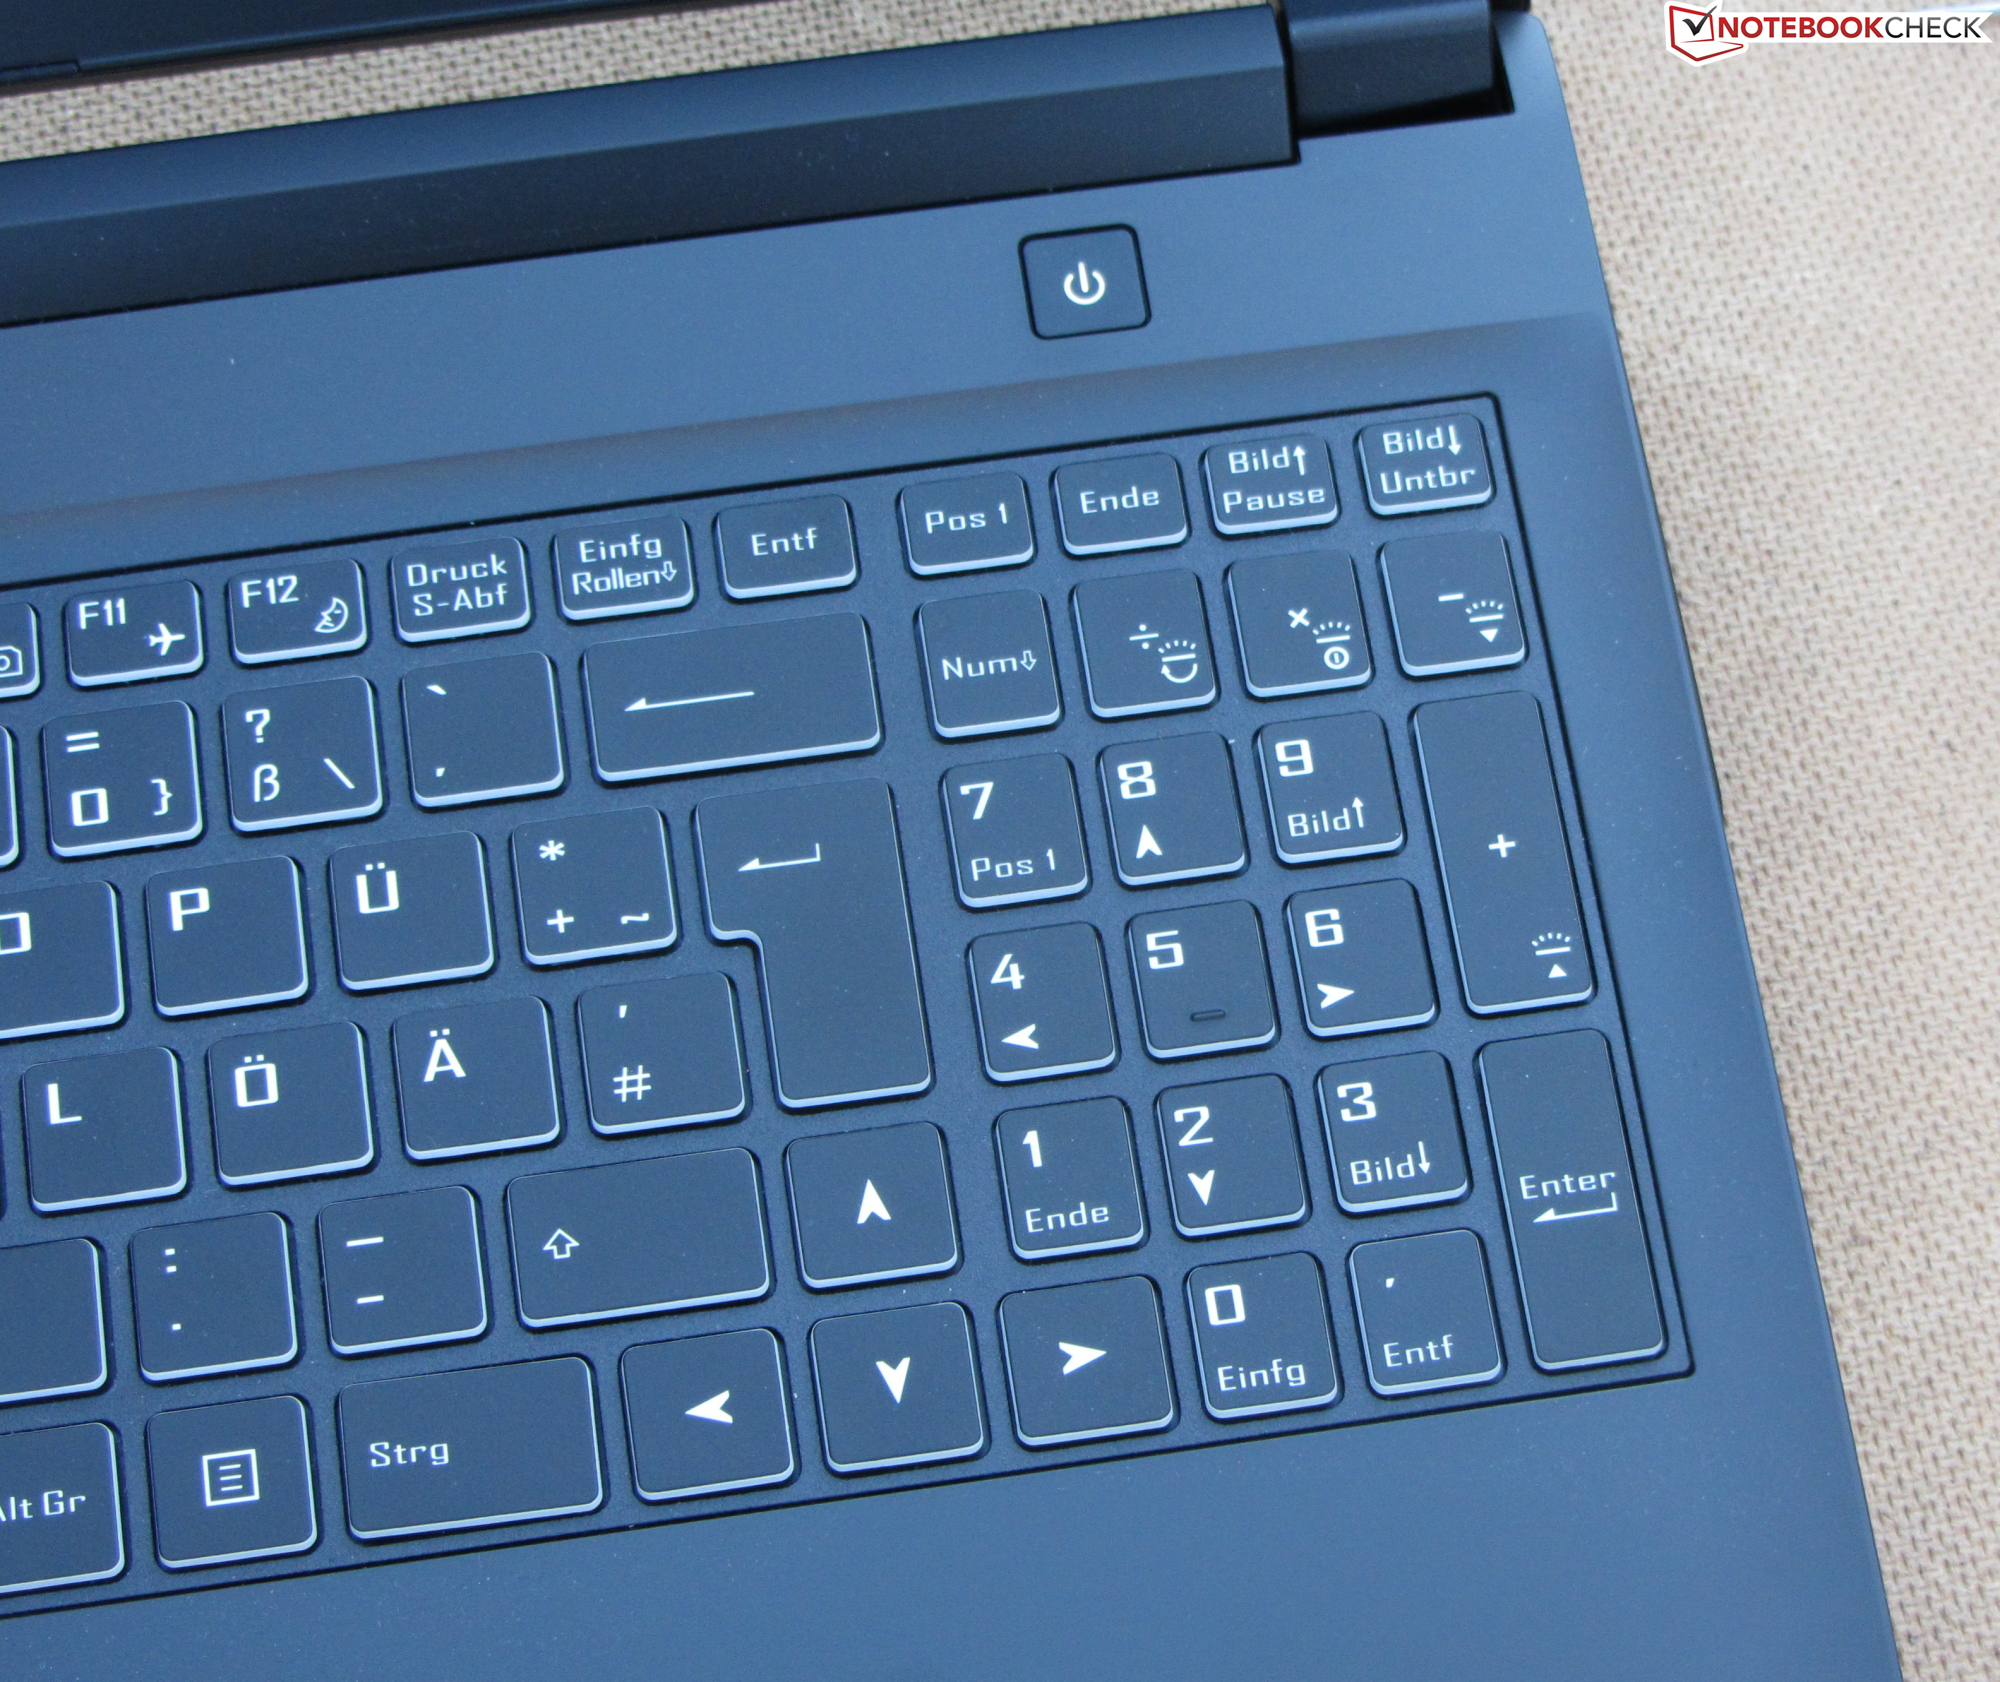
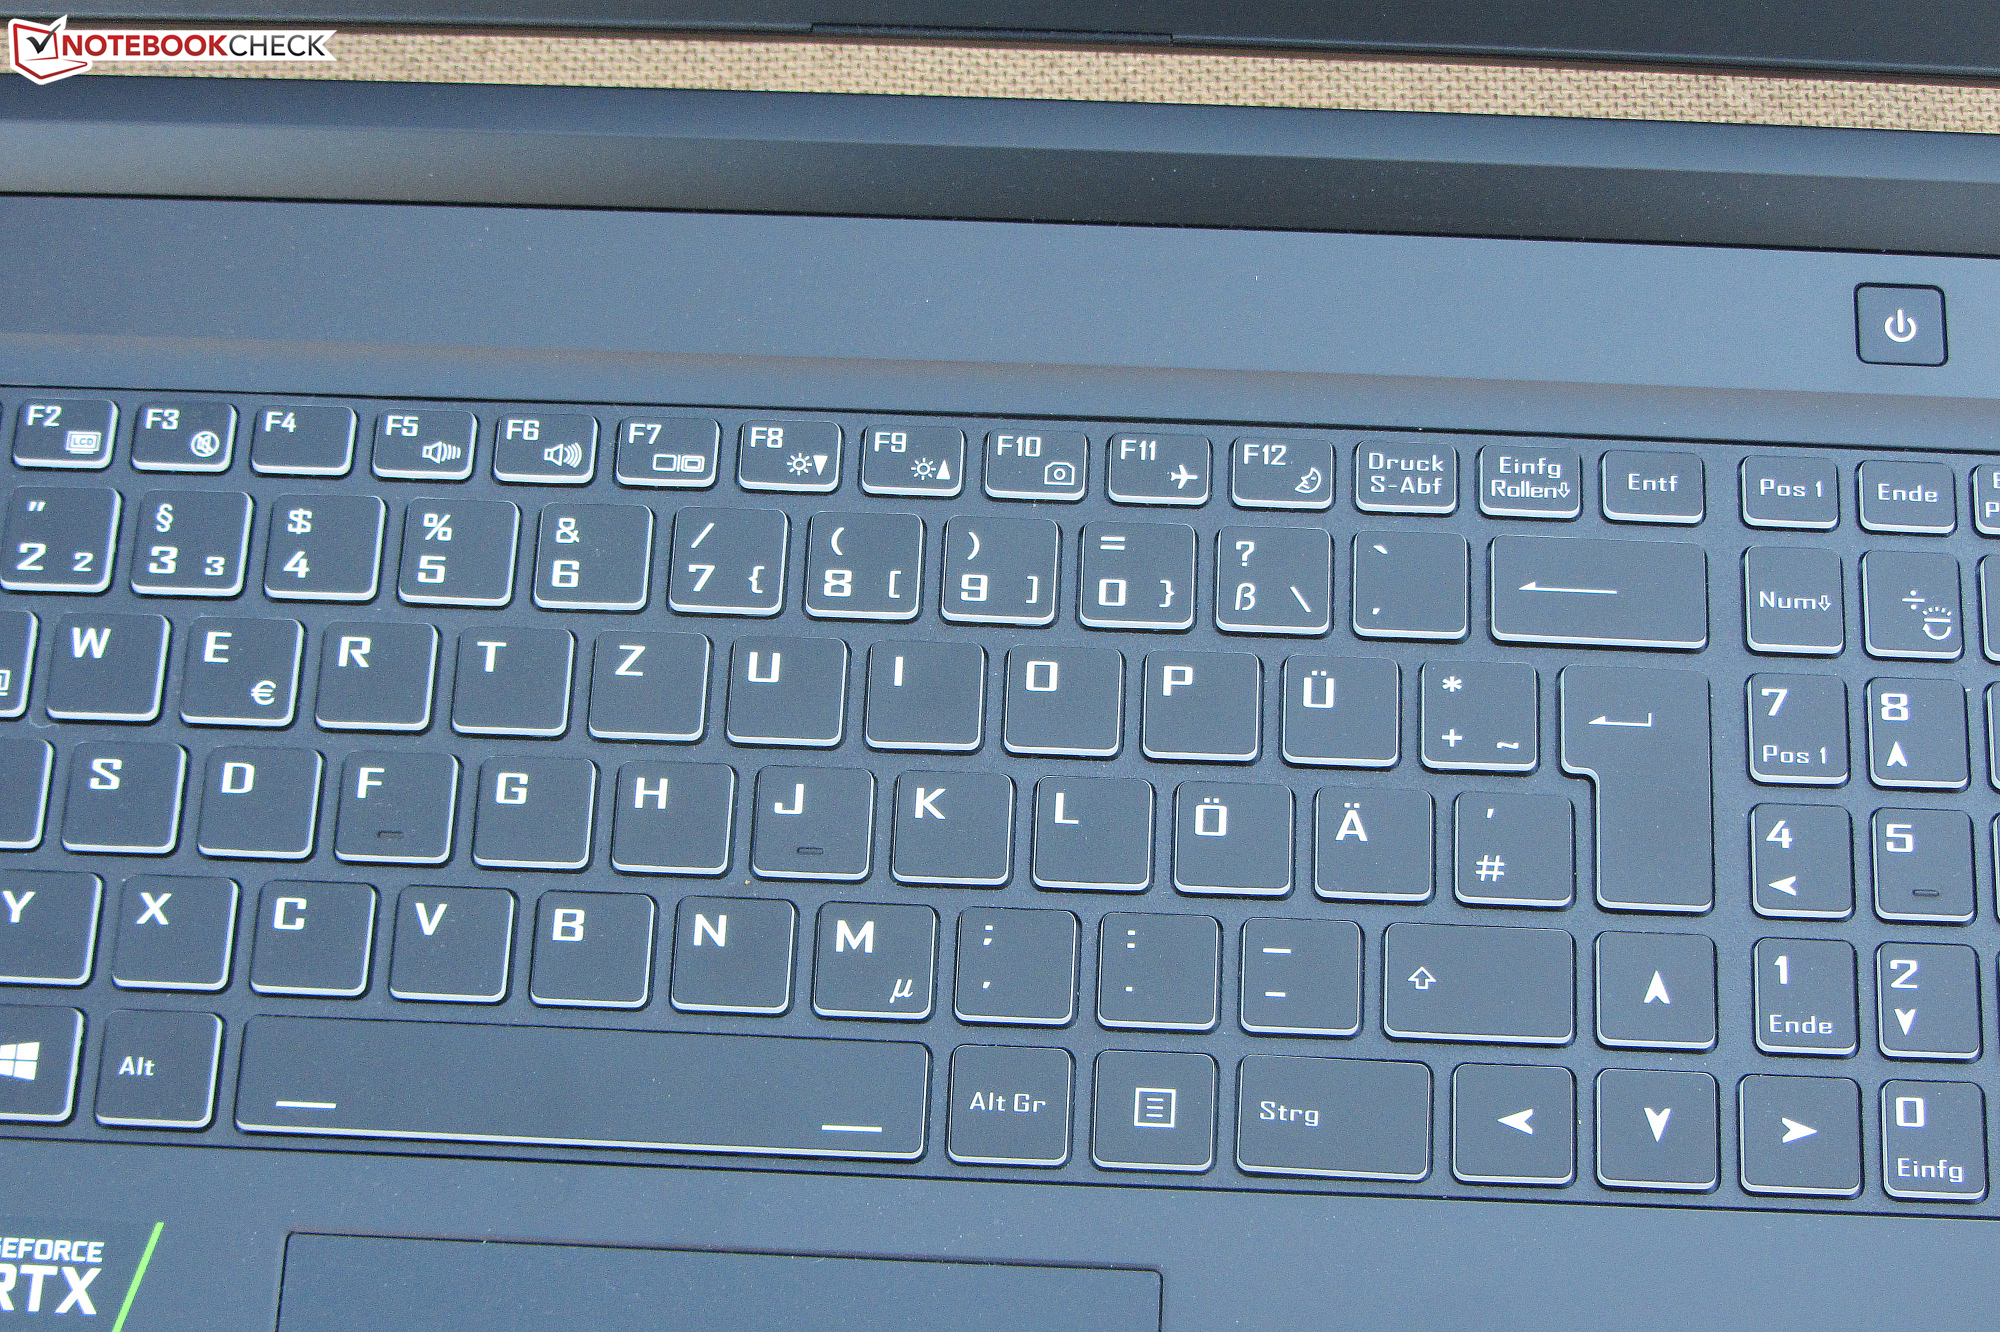
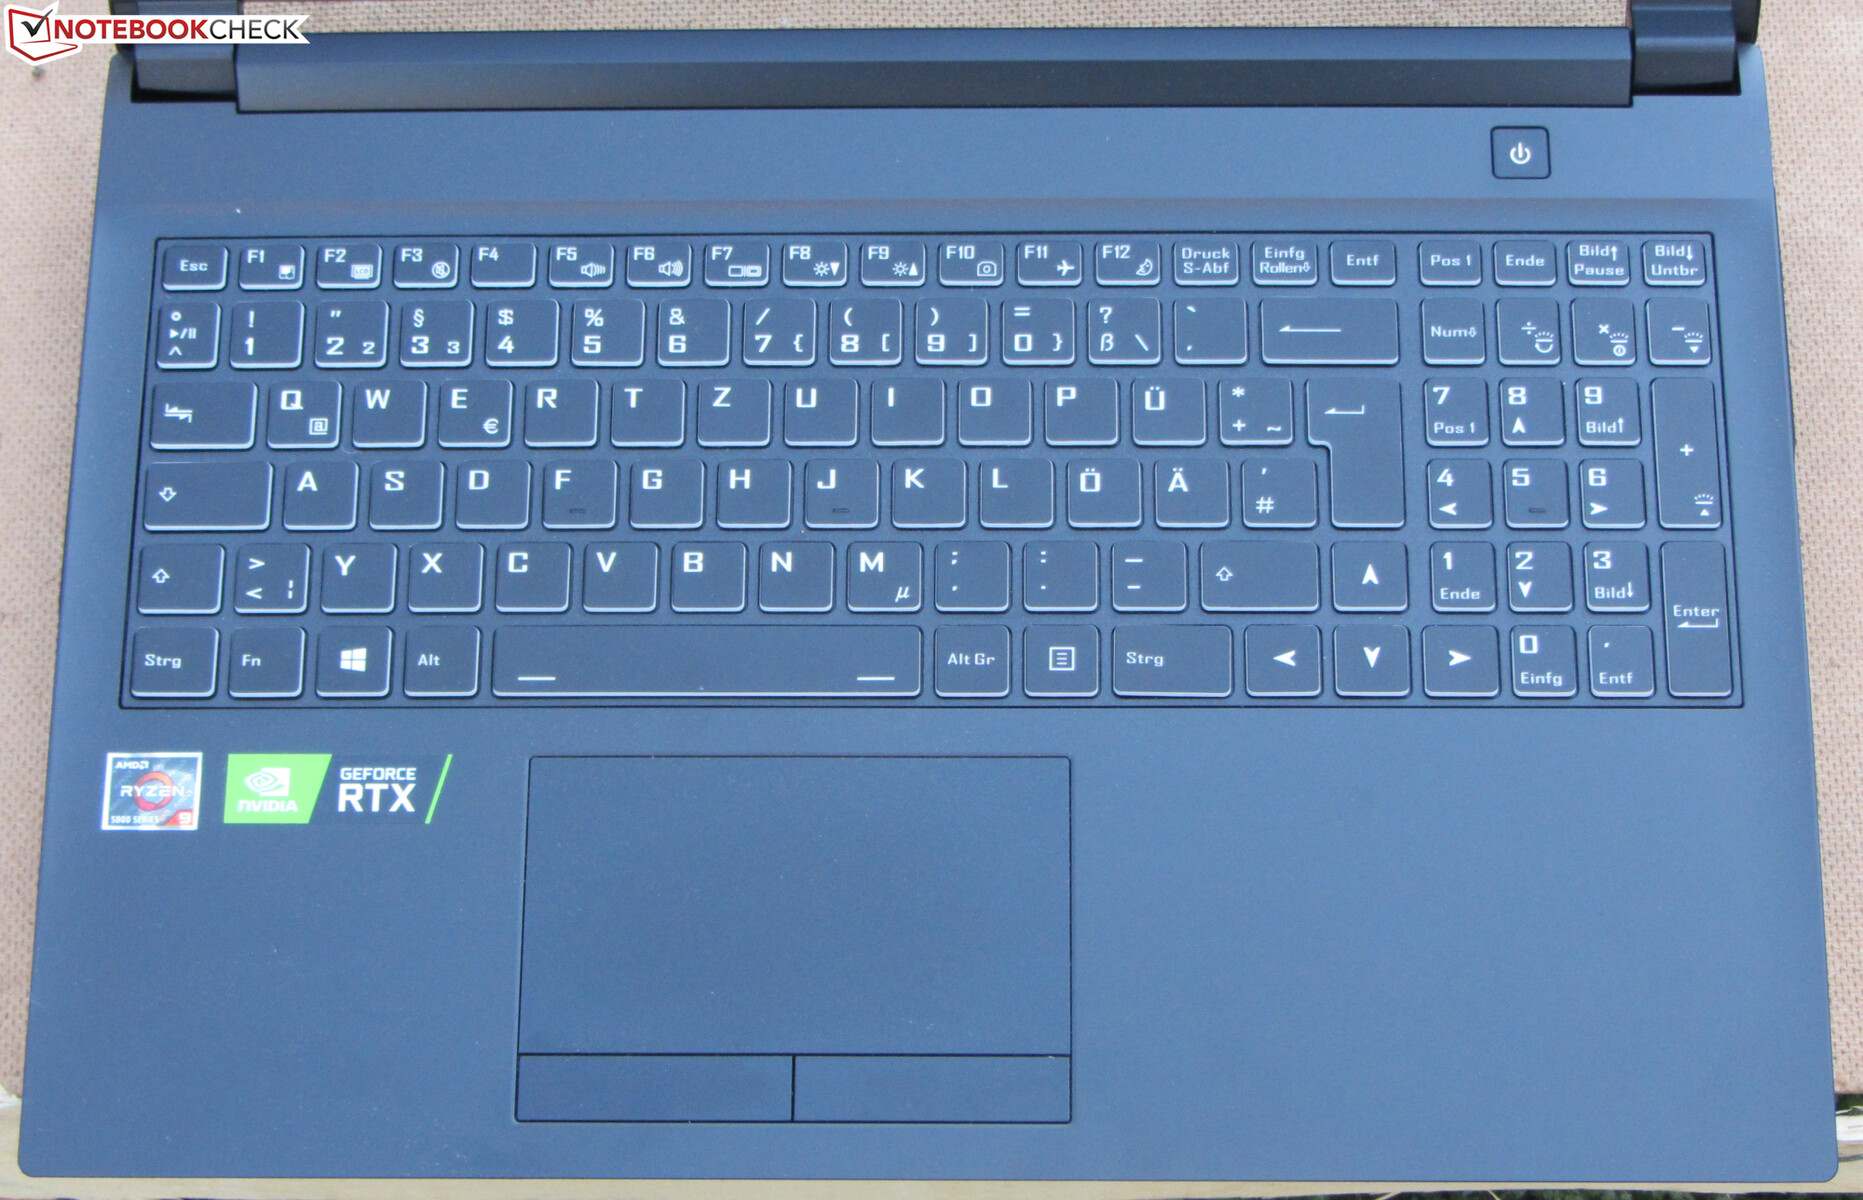
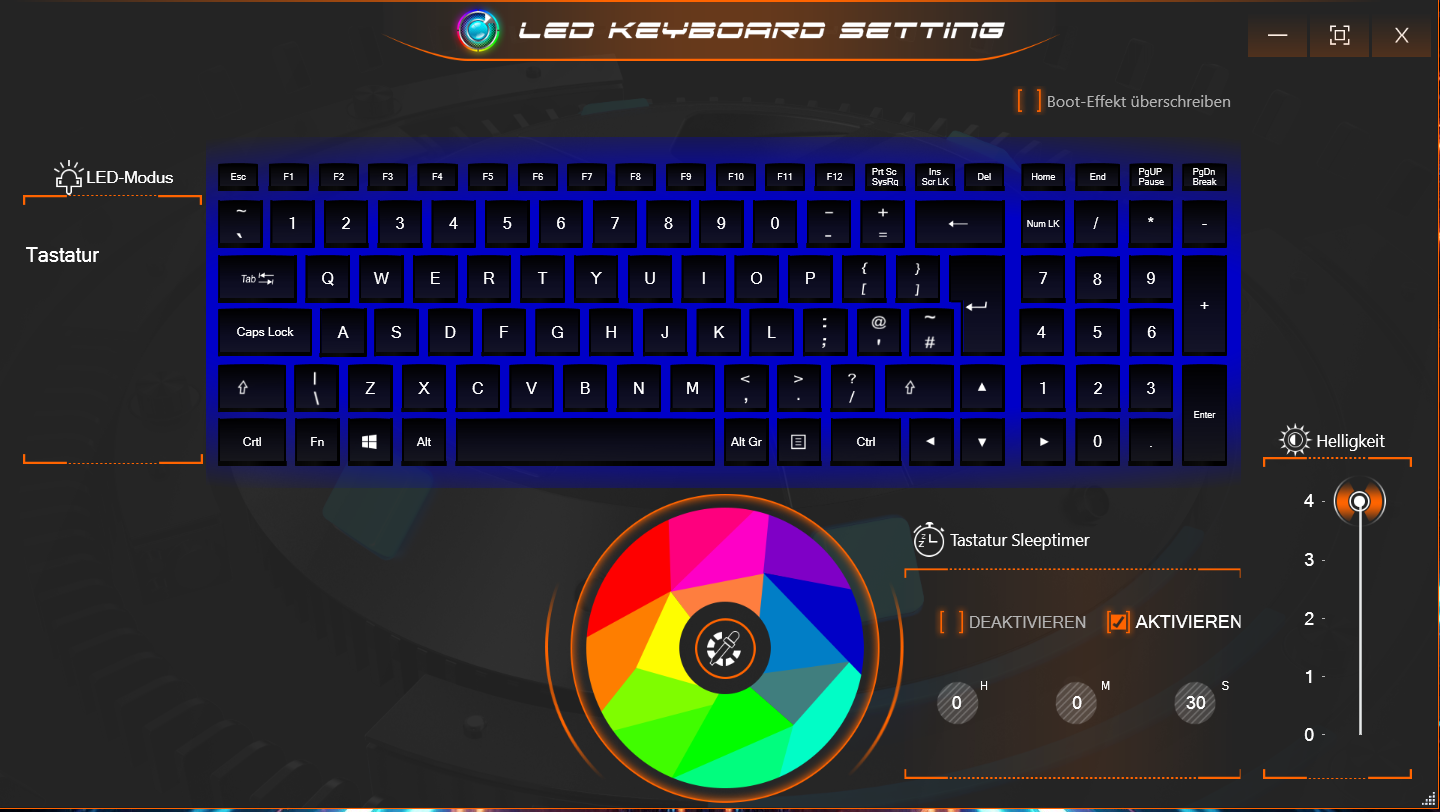
Dispositifs d'entrée - Le clavier est rétroéclairé
Clavier
L'A5 est équipé d'un clavier chiclet rétroéclairé comprenant un pavé numérique. Les touches plates et lisses offrent une course moyenne et un point de pression clair. La résistance fournie par les touches pourrait être plus nette, cependant. Le clavier cède légèrement pendant la frappe. Cela ne s'est pas avéré être trop gênant, cependant. Dans l'ensemble, Gigabyte propose ici un clavier qui convient à une utilisation quotidienne
Pavé tactile
Un pavé tactile multitouch (environ 11 x 6,3 cm) sert de remplacement à la souris. Sa surface lisse permet aux doigts de glisser facilement dessus. Il réagit également aux entrées dans les coins. Les deux boutons de la souris offrent une course courte, mais un point de pression très clair
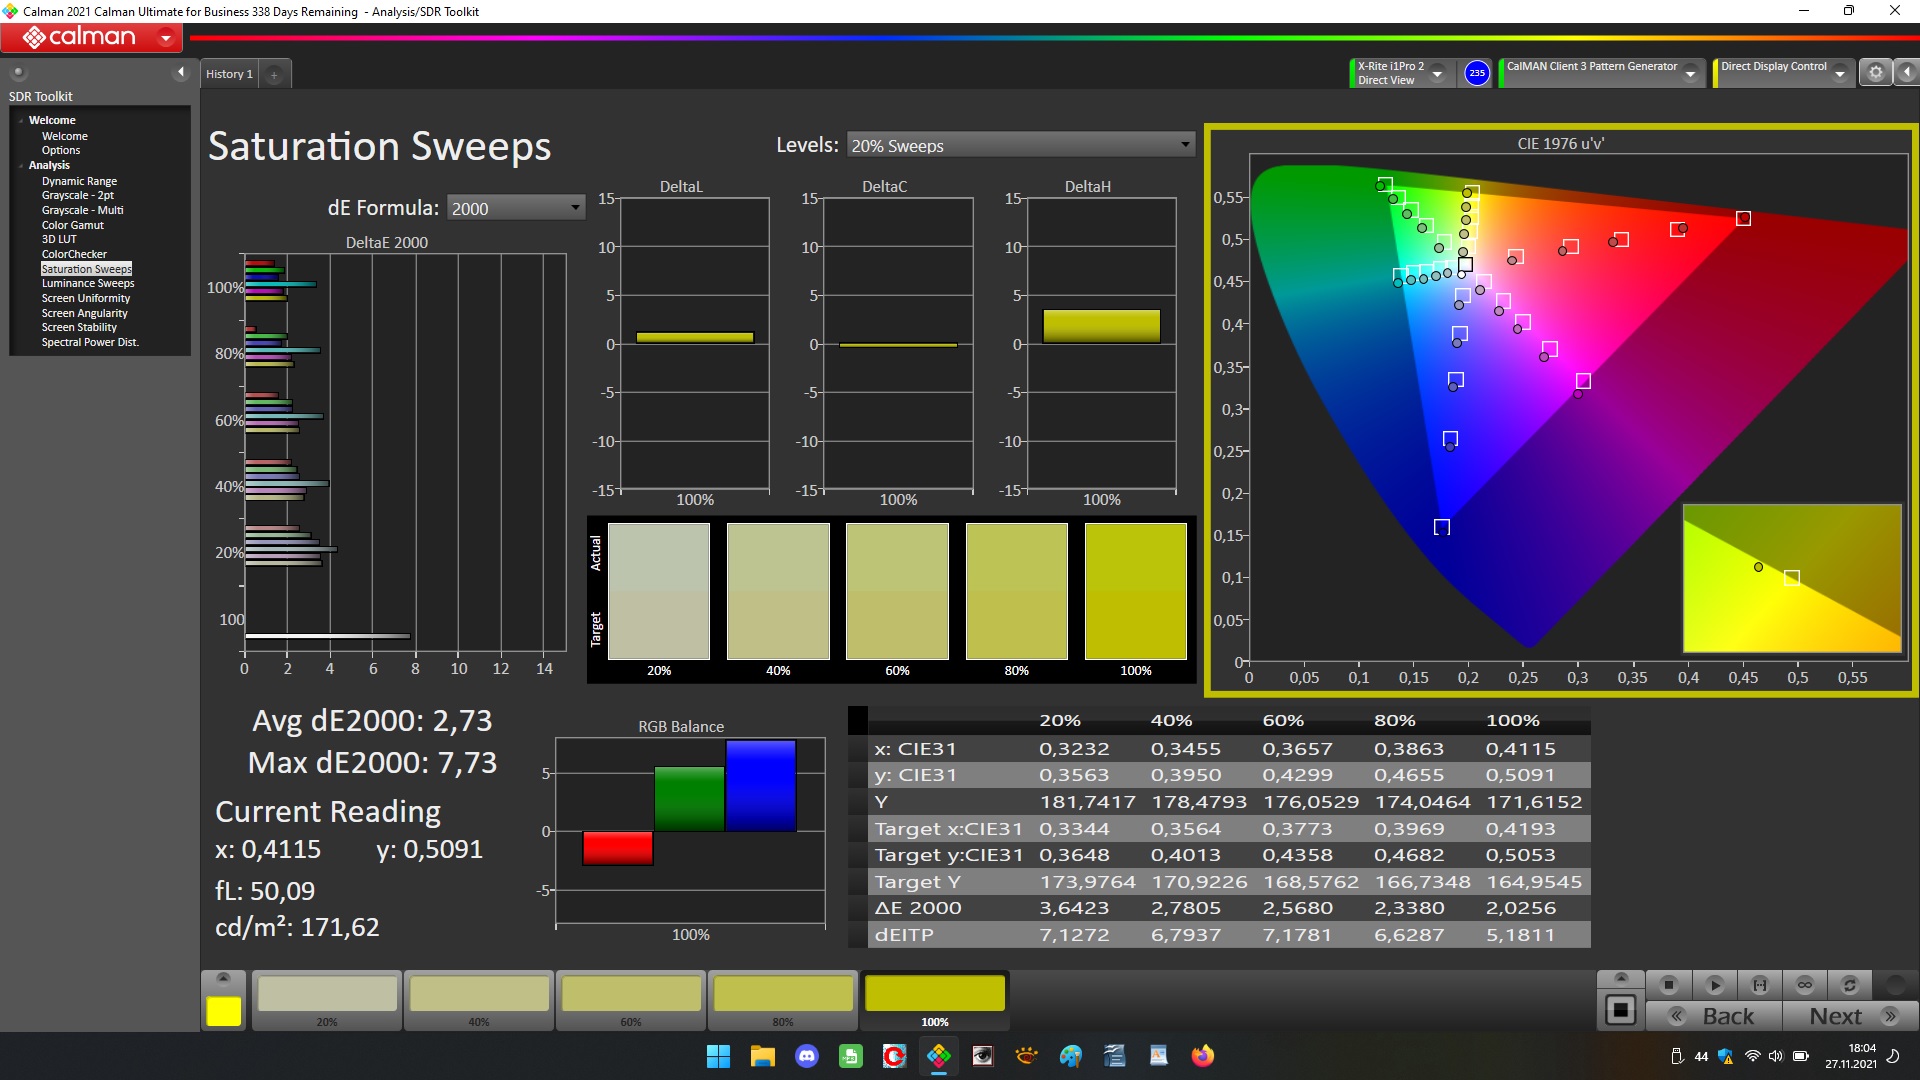
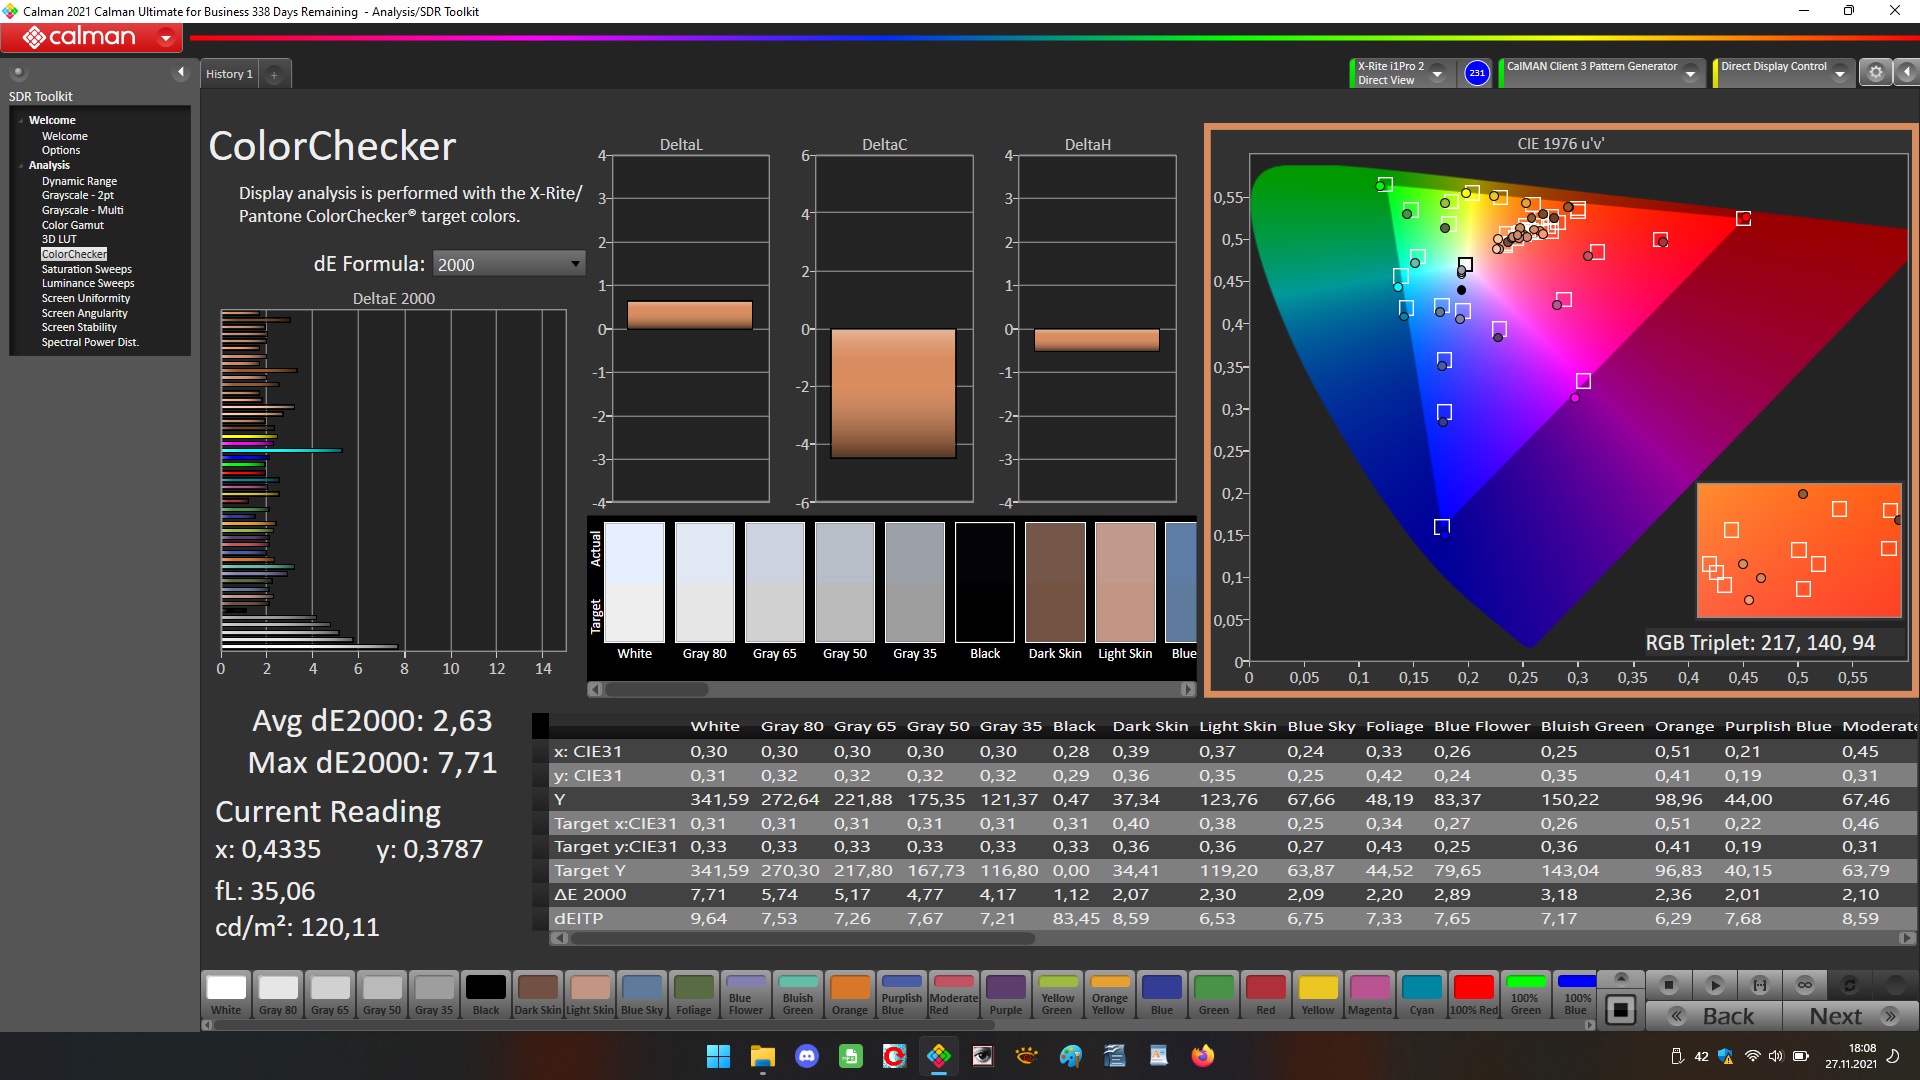
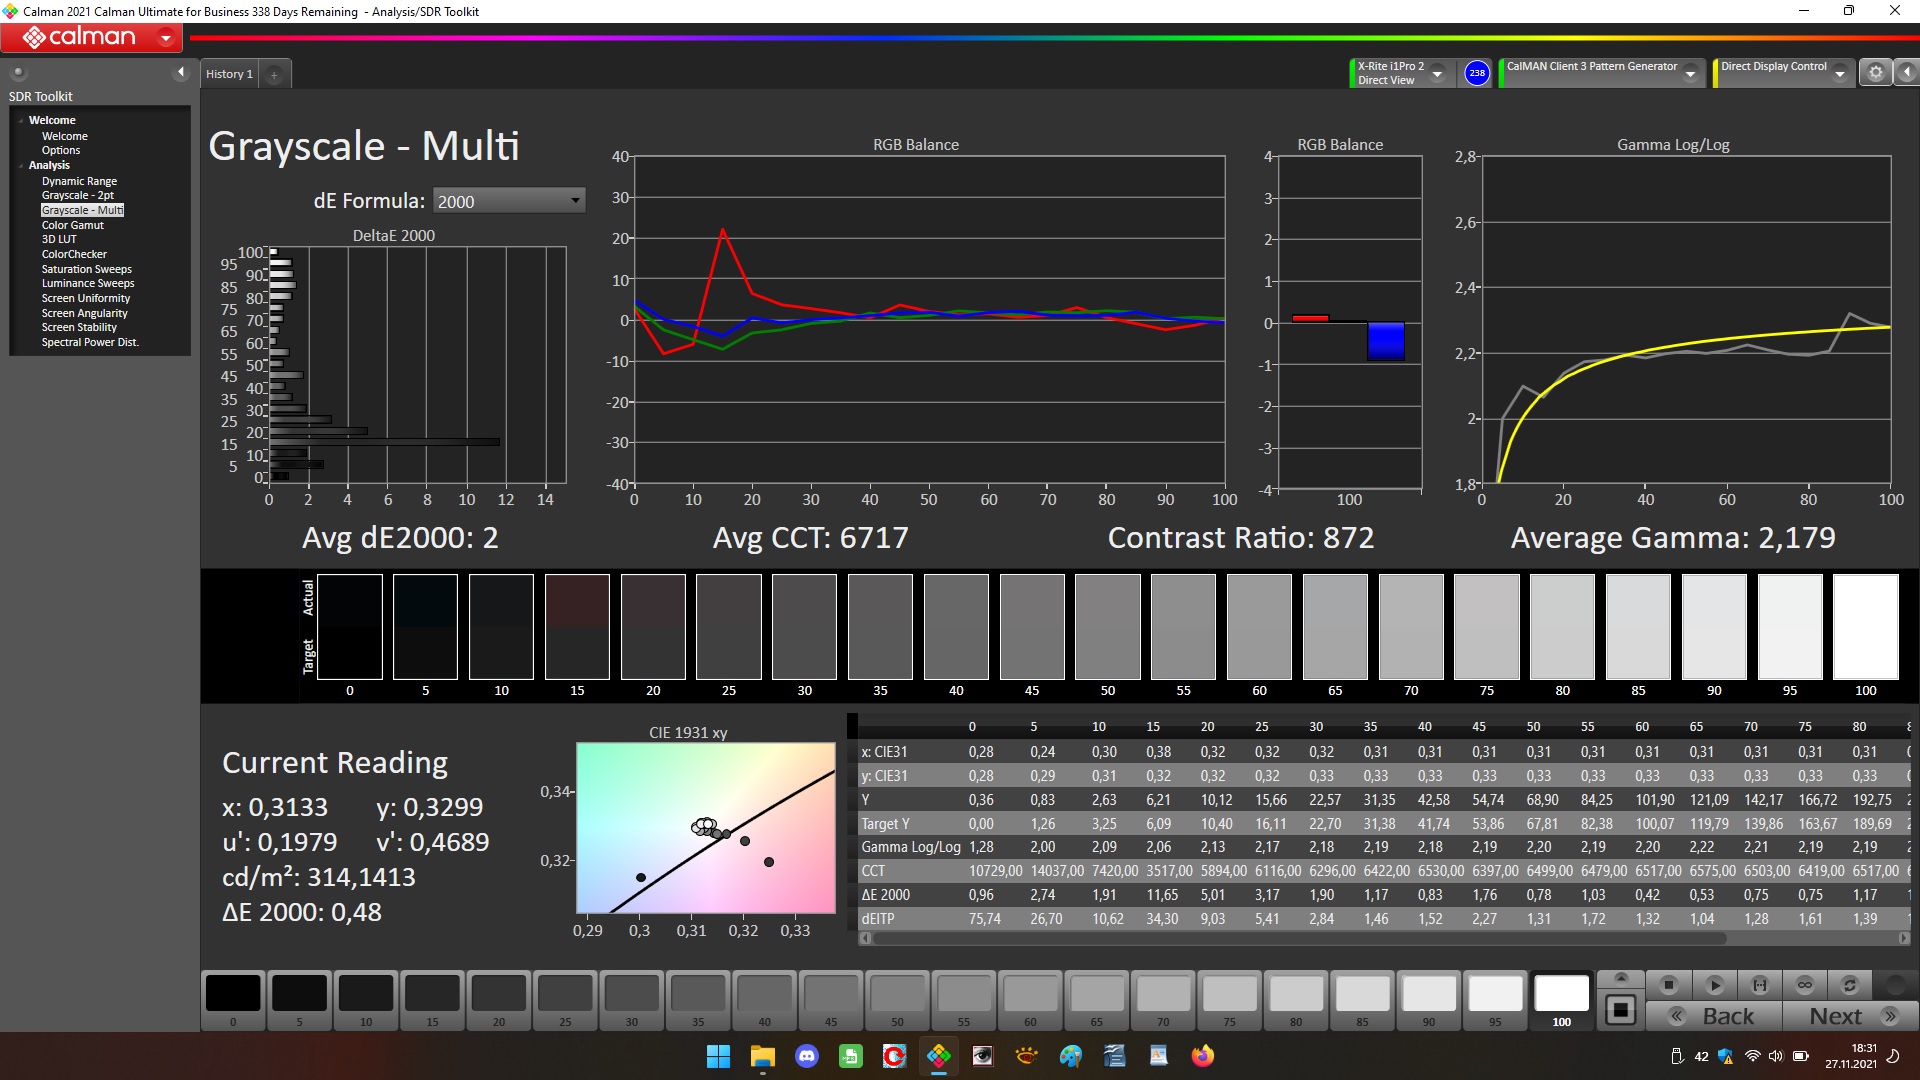
Affichage - 240 Hz IPS
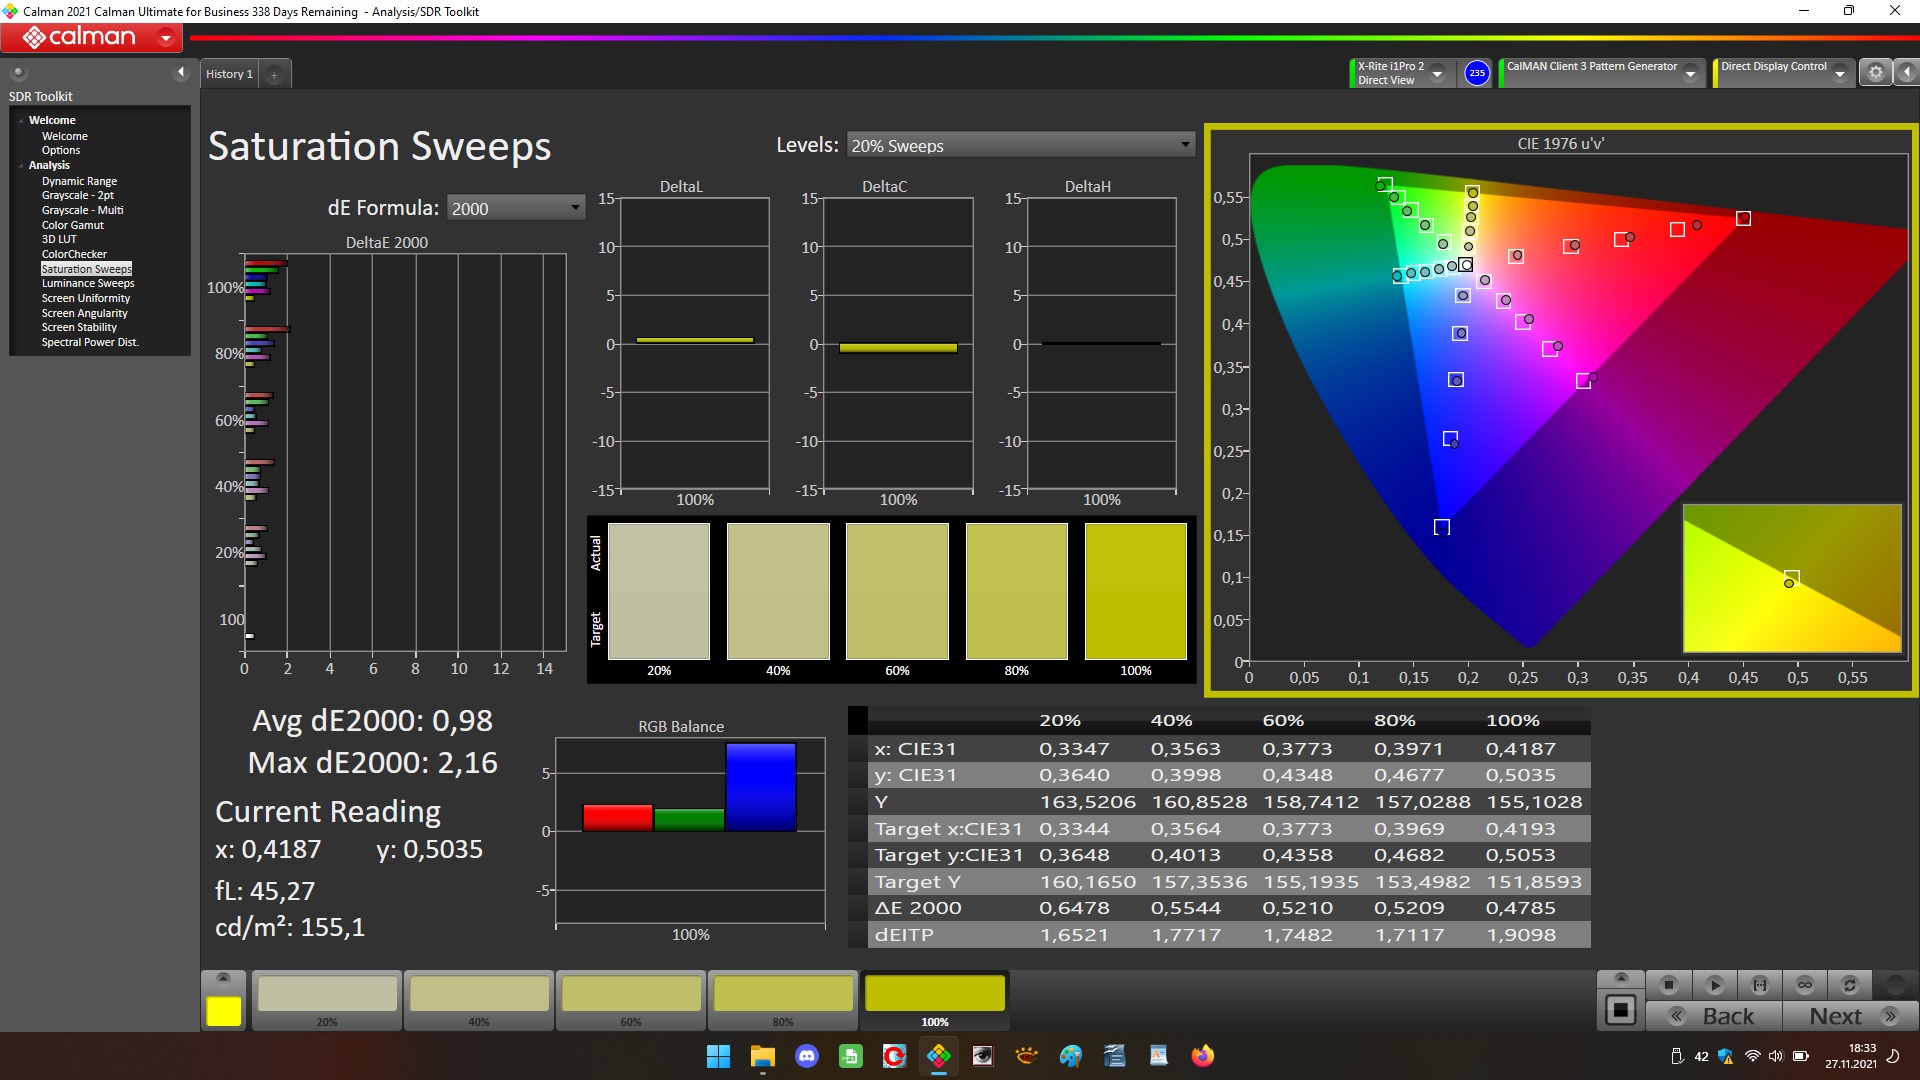
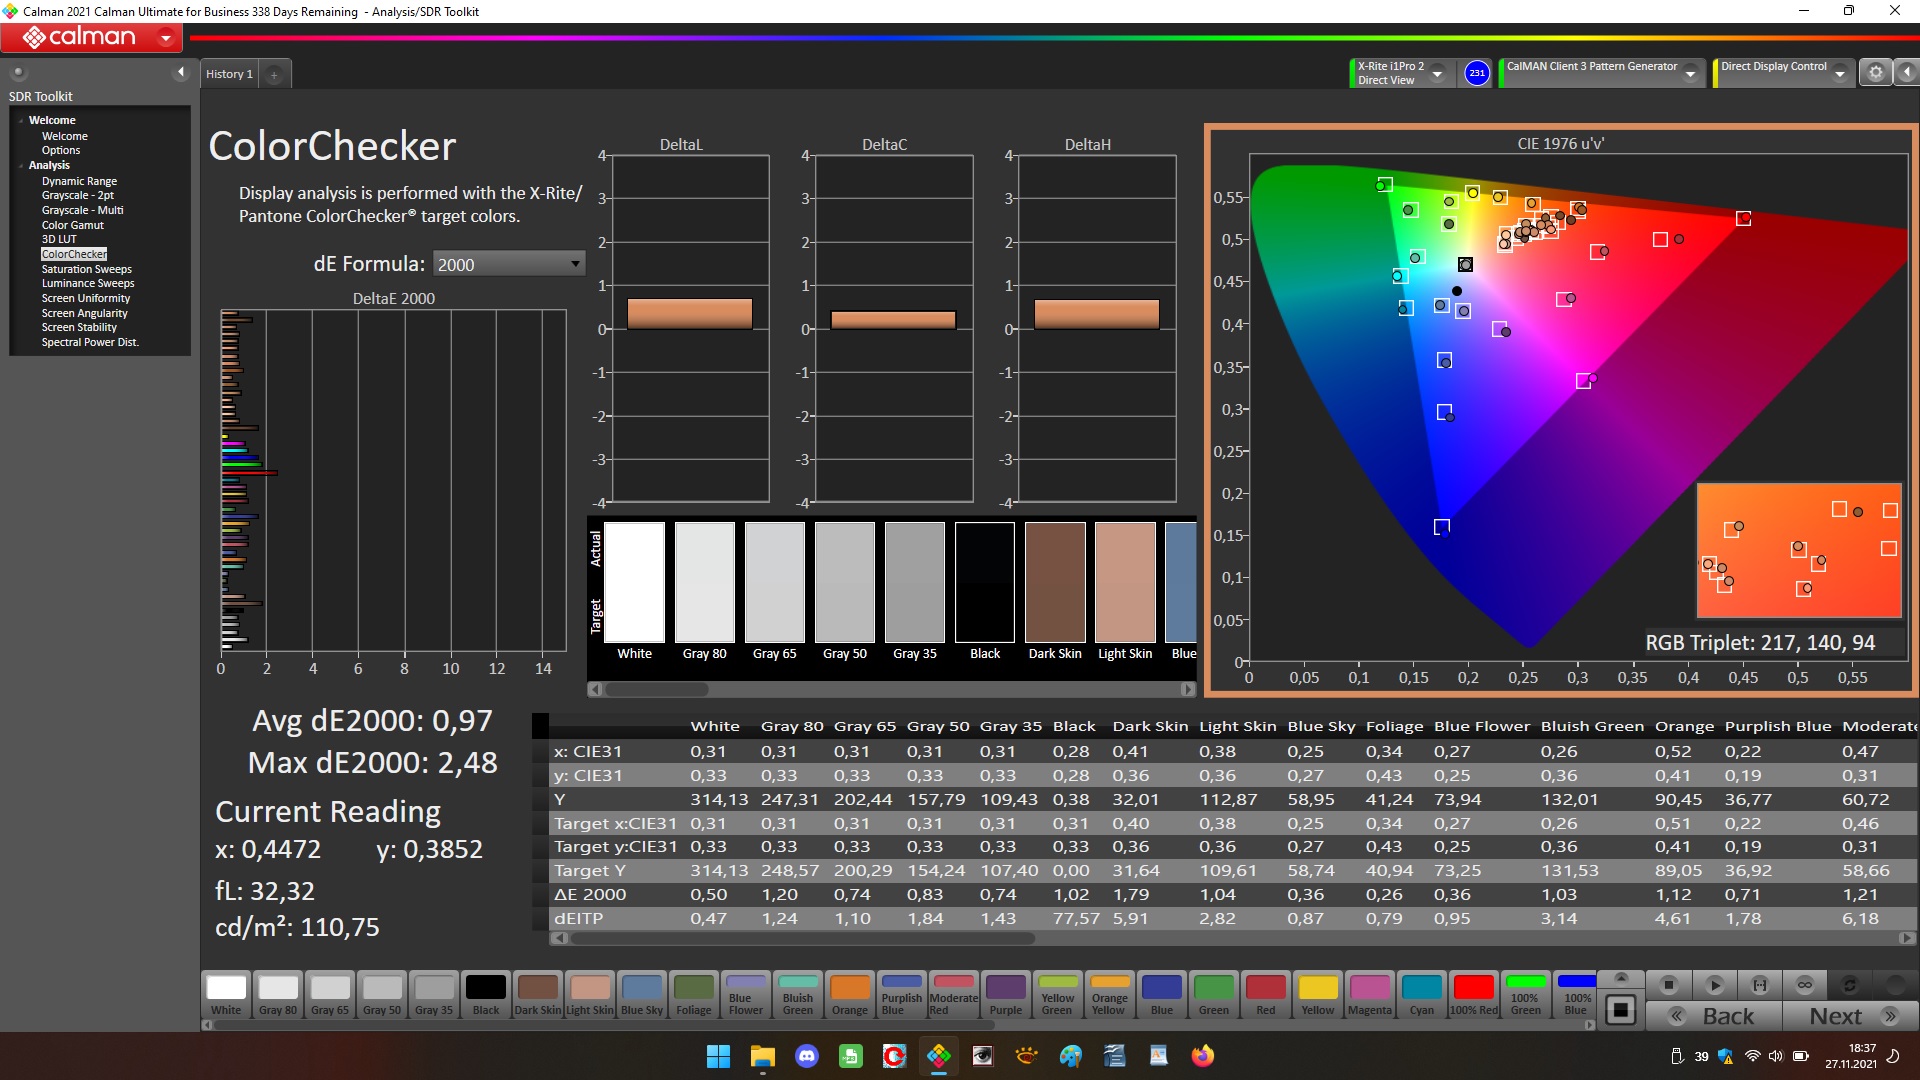
Si la luminosité (324,7 cd/m²) de l'écran mat de 15,6 pouces (1920x1080 pixels) atteint l'objectif (> 300 cd/m²), le contraste (838:1) est trop faible. Nous considérons que les valeurs supérieures à 1 000:1 sont bonnes. Le panneau 240 Hz offre des temps de réponse rapides. Aucun scintillement PWM n'a été détecté
| |||||||||||||||||||||||||
Homogénéité de la luminosité: 90 %
Valeur mesurée au centre, sur batterie: 335 cd/m²
Contraste: 838:1 (Valeurs des noirs: 0.4 cd/m²)
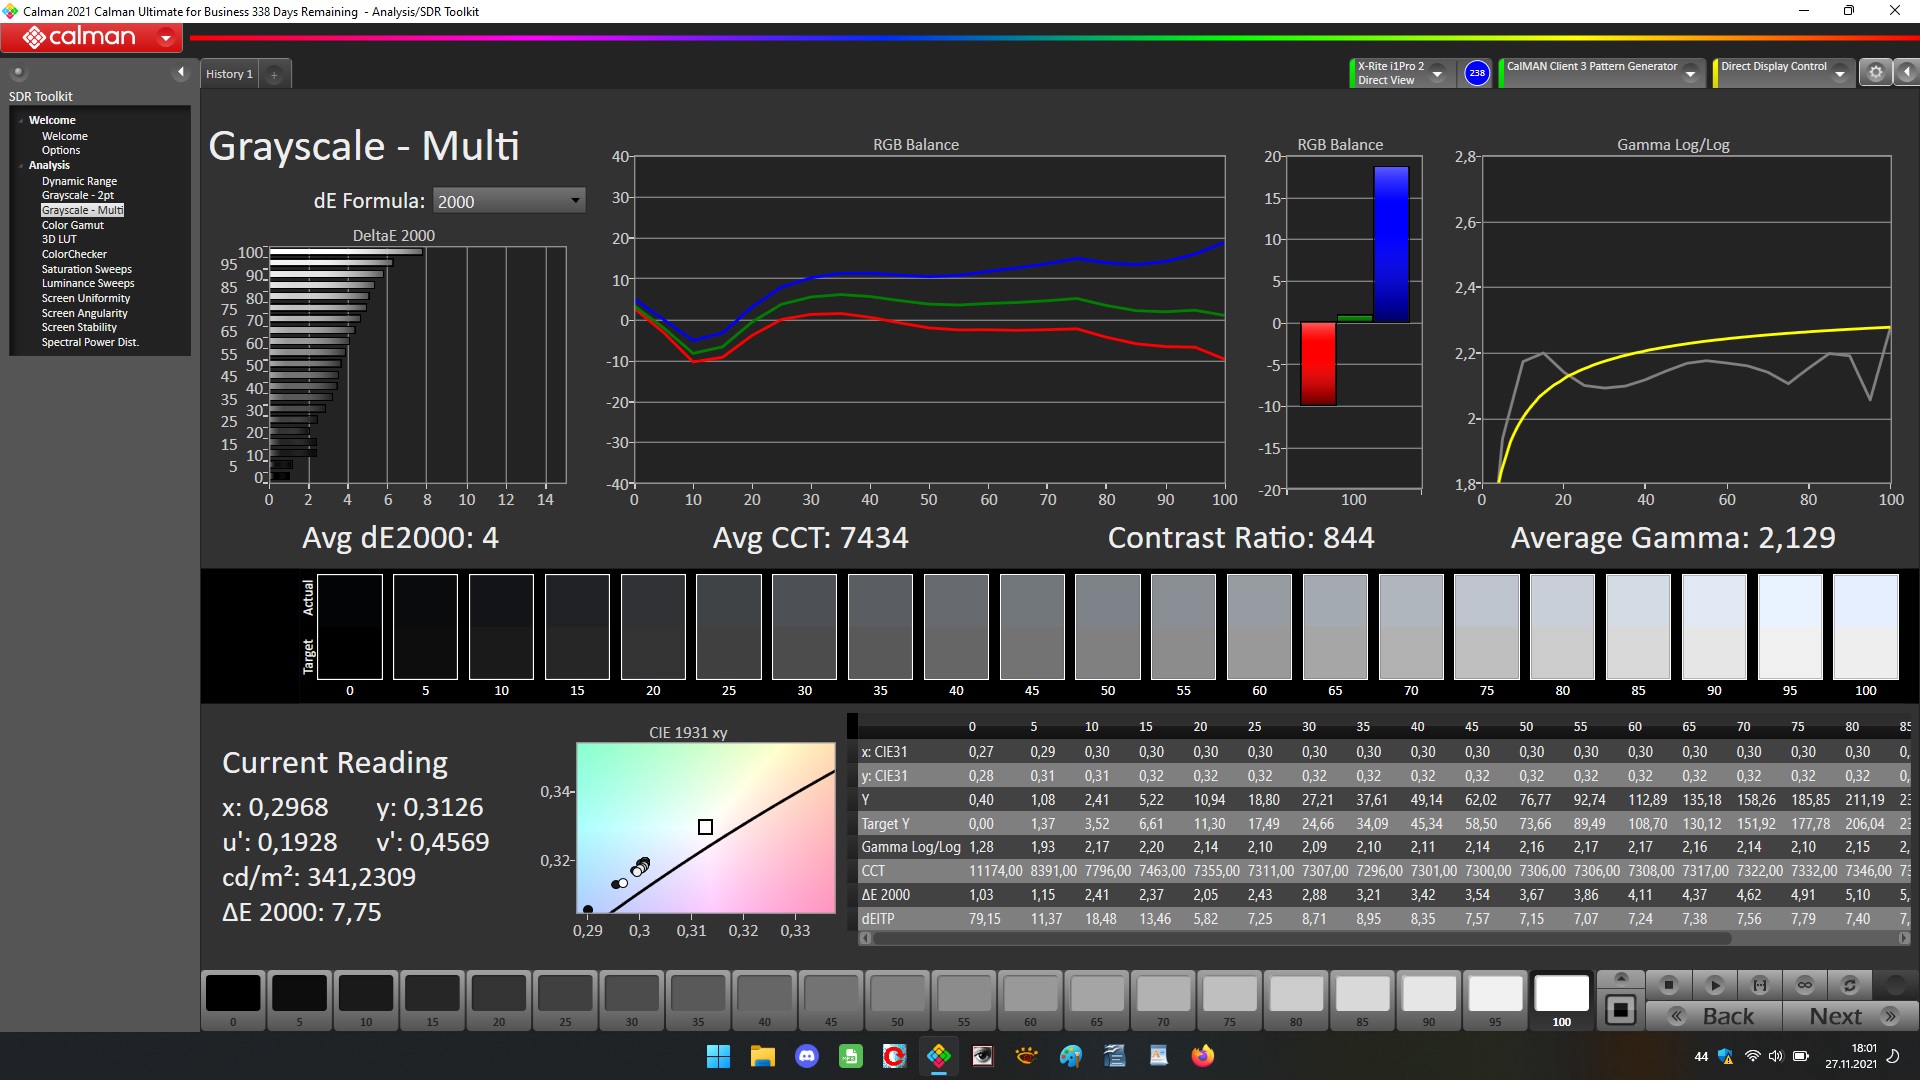
ΔE ColorChecker Calman: 2.63 | ∀{0.5-29.43 Ø4.74}
calibrated: 0.97
ΔE Greyscale Calman: 4 | ∀{0.09-98 Ø4.99}
70.8% AdobeRGB 1998 (Argyll 3D)
98.6% sRGB (Argyll 3D)
69.6% Display P3 (Argyll 3D)
Gamma: 2.129
CCT: 7434 K
| Gigabyte A5 X1 AU Optronics B156HAN12.0, IPS, 1920x1080, 15.6" | HP Omen 16-b0085ng BOE09BE, IPS, 1920x1080, 16.1" | MSI Katana GF66 11UG-220 AU Optronics B156HAN08.0, IPS, 1920x1080, 15.6" | Acer Nitro 5 AN515-45-R1JH BOE BOE09B8, IPS, 2560x1440, 15.6" | Schenker XMG Apex 15 NH57E PS LG Philips LGD0625 (LP156WFG-SPB3), IPS, 1920x1080, 15.6" | |
|---|---|---|---|---|---|
| Display | 3% | -6% | -4% | -6% | |
| Display P3 Coverage (%) | 69.6 | 72.3 4% | 65.4 -6% | 66.2 -5% | 64.5 -7% |
| sRGB Coverage (%) | 98.6 | 99.5 1% | 91.3 -7% | 96.3 -2% | 95.9 -3% |
| AdobeRGB 1998 Coverage (%) | 70.8 | 73.8 4% | 66.7 -6% | 67.1 -5% | 65.8 -7% |
| Response Times | -39% | -27% | -82% | -109% | |
| Response Time Grey 50% / Grey 80% * (ms) | 4.8 ? | 8 ? -67% | 7.4 ? -54% | 14 ? -192% | 15 -213% |
| Response Time Black / White * (ms) | 11.2 ? | 12.4 ? -11% | 11.2 ? -0% | 8 ? 29% | 11.6 -4% |
| PWM Frequency (Hz) | |||||
| Screen | -29% | -21% | -17% | 4% | |
| Brightness middle (cd/m²) | 335 | 405 21% | 307 -8% | 349 4% | 393 17% |
| Brightness (cd/m²) | 325 | 378 16% | 321 -1% | 304 -6% | 353 9% |
| Brightness Distribution (%) | 90 | 87 -3% | 83 -8% | 79 -12% | 83 -8% |
| Black Level * (cd/m²) | 0.4 | 0.34 15% | 0.27 32% | 0.535 -34% | 0.47 -17% |
| Contrast (:1) | 838 | 1191 42% | 1137 36% | 652 -22% | 836 0% |
| Colorchecker dE 2000 * | 2.63 | 3.7 -41% | 4.67 -78% | 3.11 -18% | 2.84 -8% |
| Colorchecker dE 2000 max. * | 7.71 | 7.77 -1% | 7.53 2% | 9.57 -24% | 7.15 7% |
| Colorchecker dE 2000 calibrated * | 0.97 | 3.49 -260% | 2.41 -148% | 0.67 31% | |
| Greyscale dE 2000 * | 4 | 5.88 -47% | 4.5 -13% | 5 -25% | 3.73 7% |
| Gamma | 2.129 103% | 2.57 86% | 2.276 97% | 2.36 93% | 2.53 87% |
| CCT | 7434 87% | 6342 102% | 6824 95% | 6976 93% | 7312 89% |
| Color Space (Percent of AdobeRGB 1998) (%) | 73.76 | ||||
| Color Space (Percent of sRGB) (%) | 99.47 | ||||
| Moyenne finale (programmes/paramètres) | -22% /
-23% | -18% /
-19% | -34% /
-24% | -37% /
-14% |
* ... Moindre est la valeur, meilleures sont les performances
L'écran présente déjà une bonne reproduction des couleurs et l'écart de couleur est conforme à l'objectif. Cependant, l'étalonnage de l'écran apporte encore des améliorations significatives. L'écran n'est pas capable de reproduire entièrement les espaces couleur AdobeRGB (71%) et DCI-P3 (70%), l'espace couleur sRGB est reproduit à 99%
Temps de réponse de l'écran
| ↔ Temps de réponse noir à blanc | ||
|---|---|---|
| 11.2 ms ... hausse ↗ et chute ↘ combinées | ↗ 5.2 ms hausse | 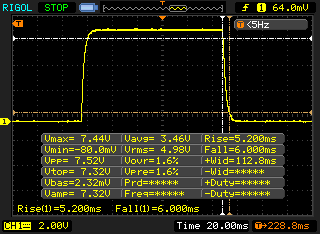 |
| ↘ 6 ms chute | ||
| L'écran montre de bons temps de réponse, mais insuffisant pour du jeu compétitif. En comparaison, tous les appareils testés affichent entre 0.1 (minimum) et 240 (maximum) ms. » 30 % des appareils testés affichent de meilleures performances. Cela signifie que les latences relevées sont meilleures que la moyenne (20 ms) de tous les appareils testés. | ||
| ↔ Temps de réponse gris 50% à gris 80% | ||
| 4.8 ms ... hausse ↗ et chute ↘ combinées | ↗ 1.4 ms hausse | 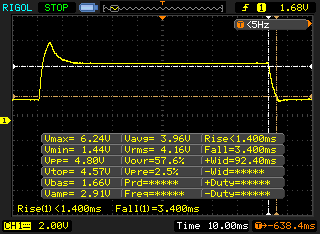 |
| ↘ 3.4 ms chute | ||
| L'écran montre de très faibles temps de réponse, parfait pour le jeu. En comparaison, tous les appareils testés affichent entre 0.165 (minimum) et 636 (maximum) ms. » 16 % des appareils testés affichent de meilleures performances. Cela signifie que les latences relevées sont meilleures que la moyenne (31.3 ms) de tous les appareils testés. | ||
Scintillement / MLI (Modulation de largeur d'impulsion)
| Scintillement / MLI (Modulation de largeur d'impulsion) non décelé | 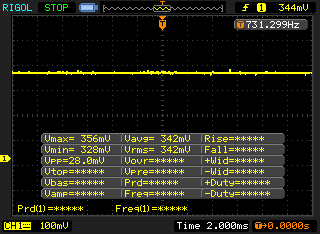 | ||
En comparaison, 53 % des appareils testés n'emploient pas MDI pour assombrir leur écran. Nous avons relevé une moyenne à 7920 (minimum : 5 - maximum : 343500) Hz dans le cas où une MDI était active. | |||
L'écran IPS à angle de vision stable peut être lu depuis n'importe quelle position. La lecture de l'écran en extérieur est possible lorsque le soleil ne brille pas trop fort

Performances - Le Gigabyte A5 est une bête de course
Avec le A5 X1, Gigabyte dispose d'un ordinateur portable de 15,6 pouces pour le jeu, qui permet d'afficher tous les jeux modernes à l'écran
Conditions d'essai
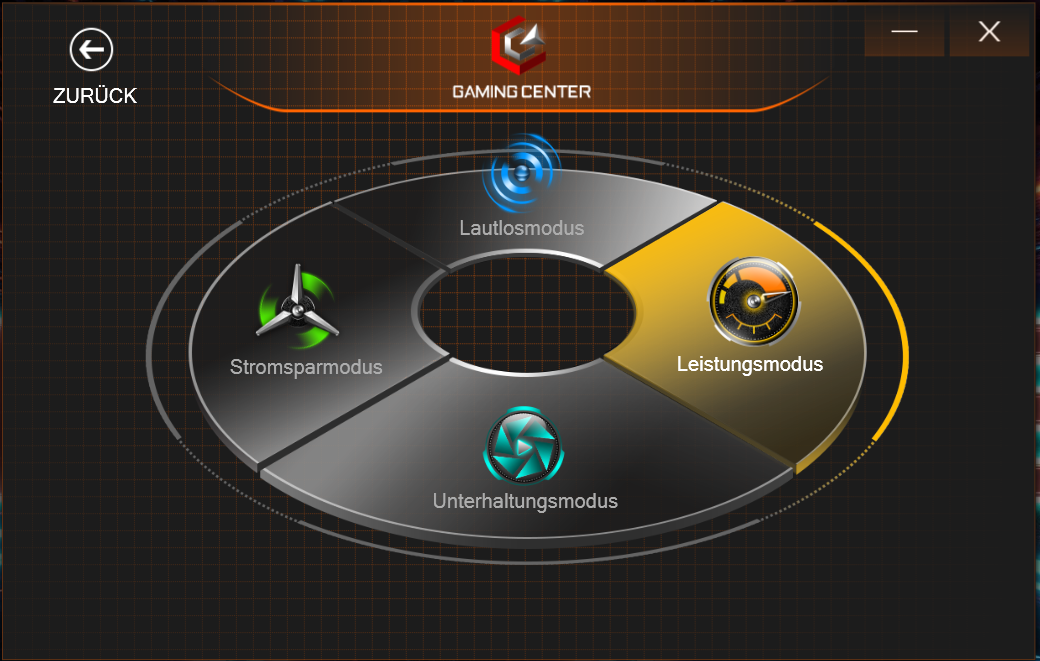
Le centre de contrôle préinstallé permet, entre autres, de choisir un profil de performance (voir tableau). Les benchmarks ont été exécutés en utilisant le profil "Performance Mode" incluant le contrôle automatique du ventilateur. Certains benchmarks ont également été exécutés sous les trois autres profils. Les résultats se trouvent dans les tableaux de comparaison. Le profil "Entertainment Mode" a été utilisé pour les tests de batterie
| Mode Performance | Mode Divertissement | Mode Economie d'énergie | Mode Silence | |
|---|---|---|---|---|
| Limite de puissance 1 | 54 watts | 52 watts | 25 watts | 42 watts |
| Limite de puissance 2 | 65 watts | 63 watts | 30 watts | 60 watts |
Processeur
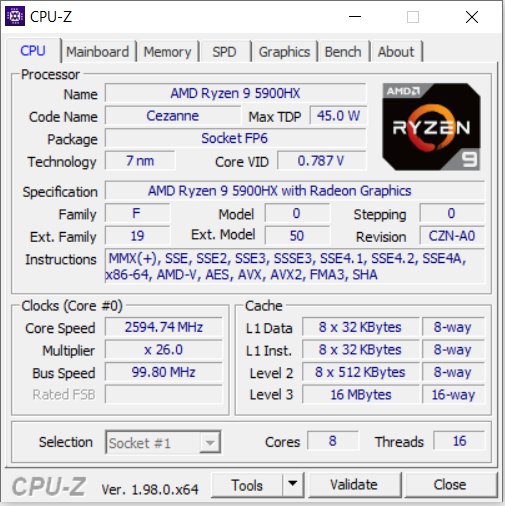
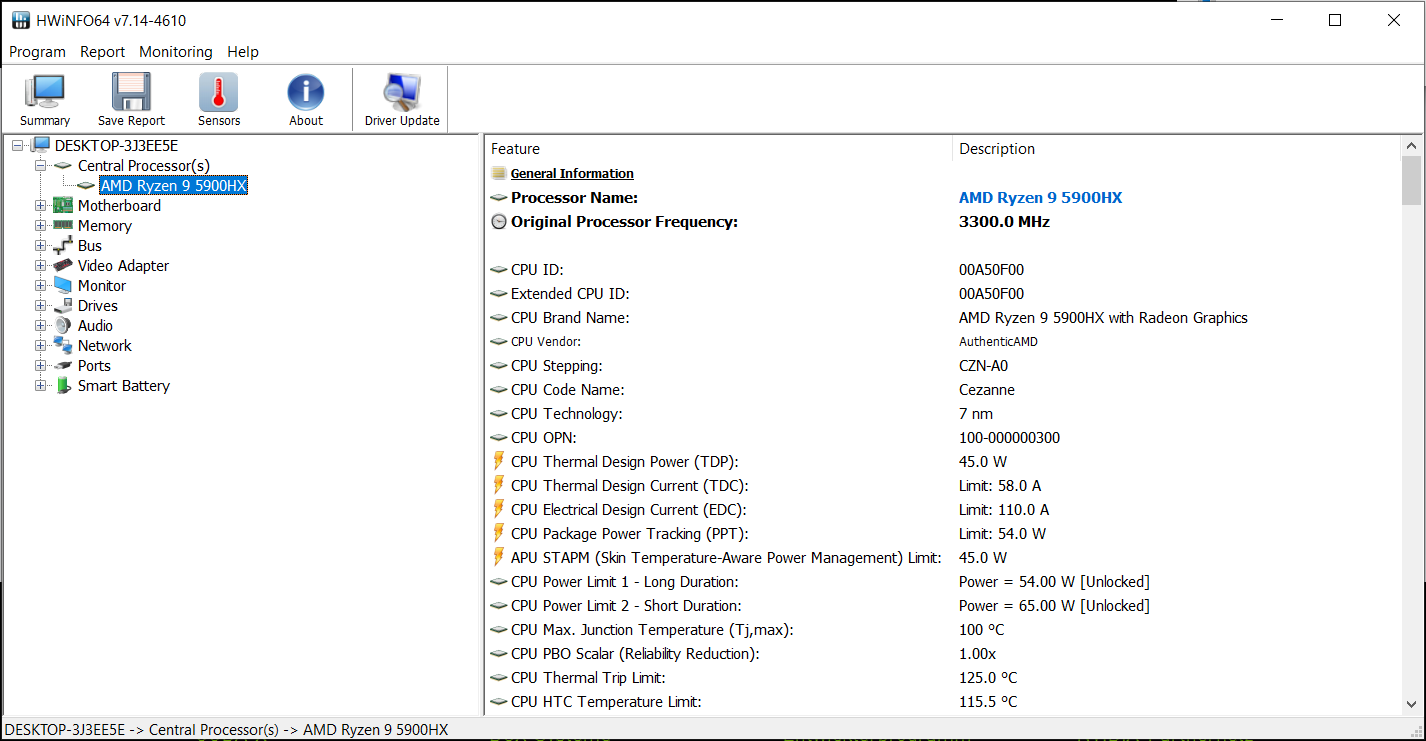
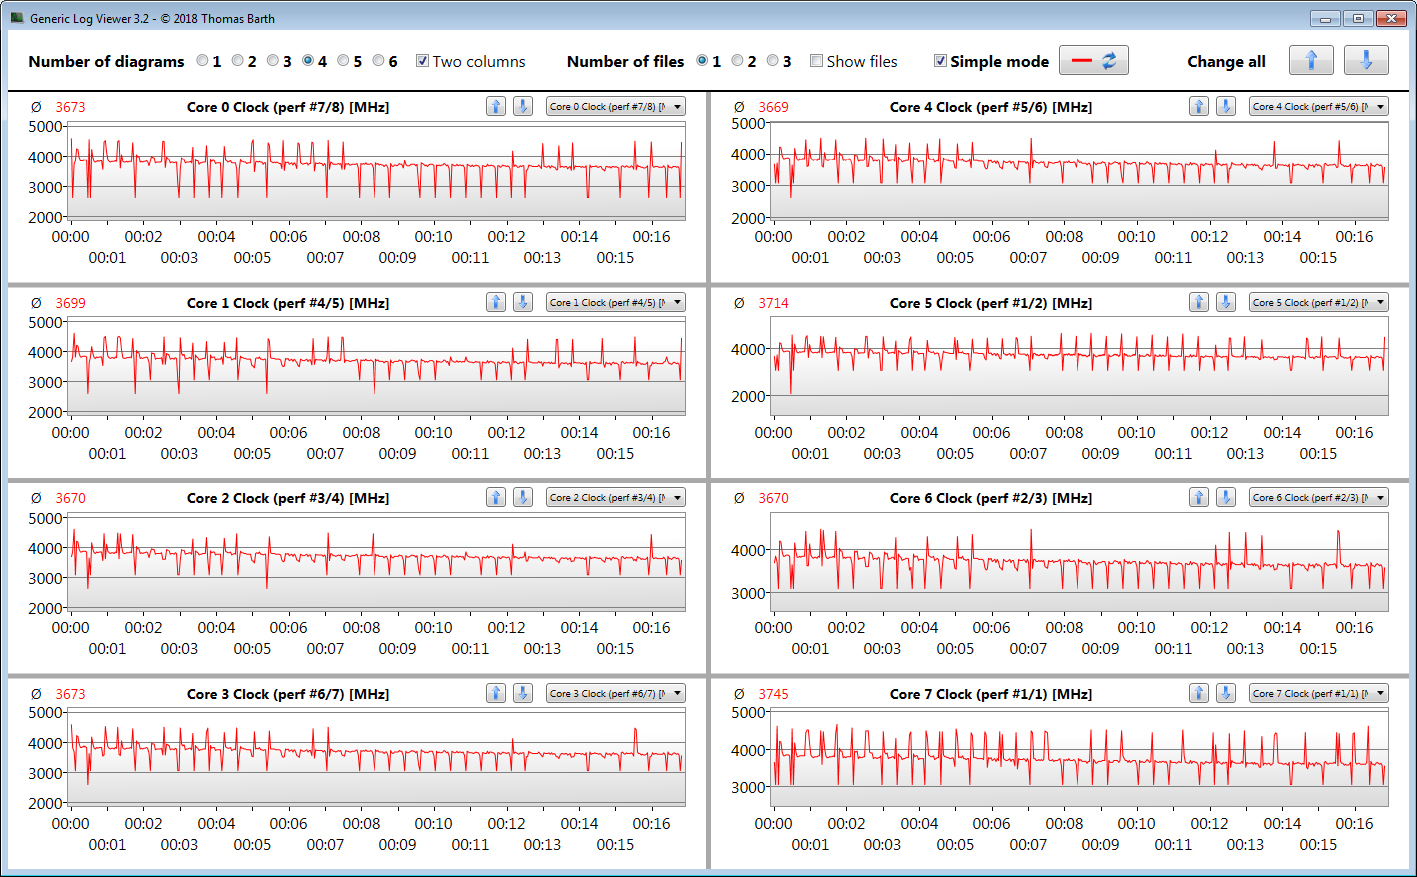
La partie CPU duRyzen 9 5900HX APU (Cezanne) consiste en un processeur octa-core qui fonctionne à une vitesse d'horloge de base de 3,3 GHz. Une augmentation jusqu'à 4,65 GHz est possible via Turbo. Le multithreading simultané (deux threads par cœur) est pris en charge.
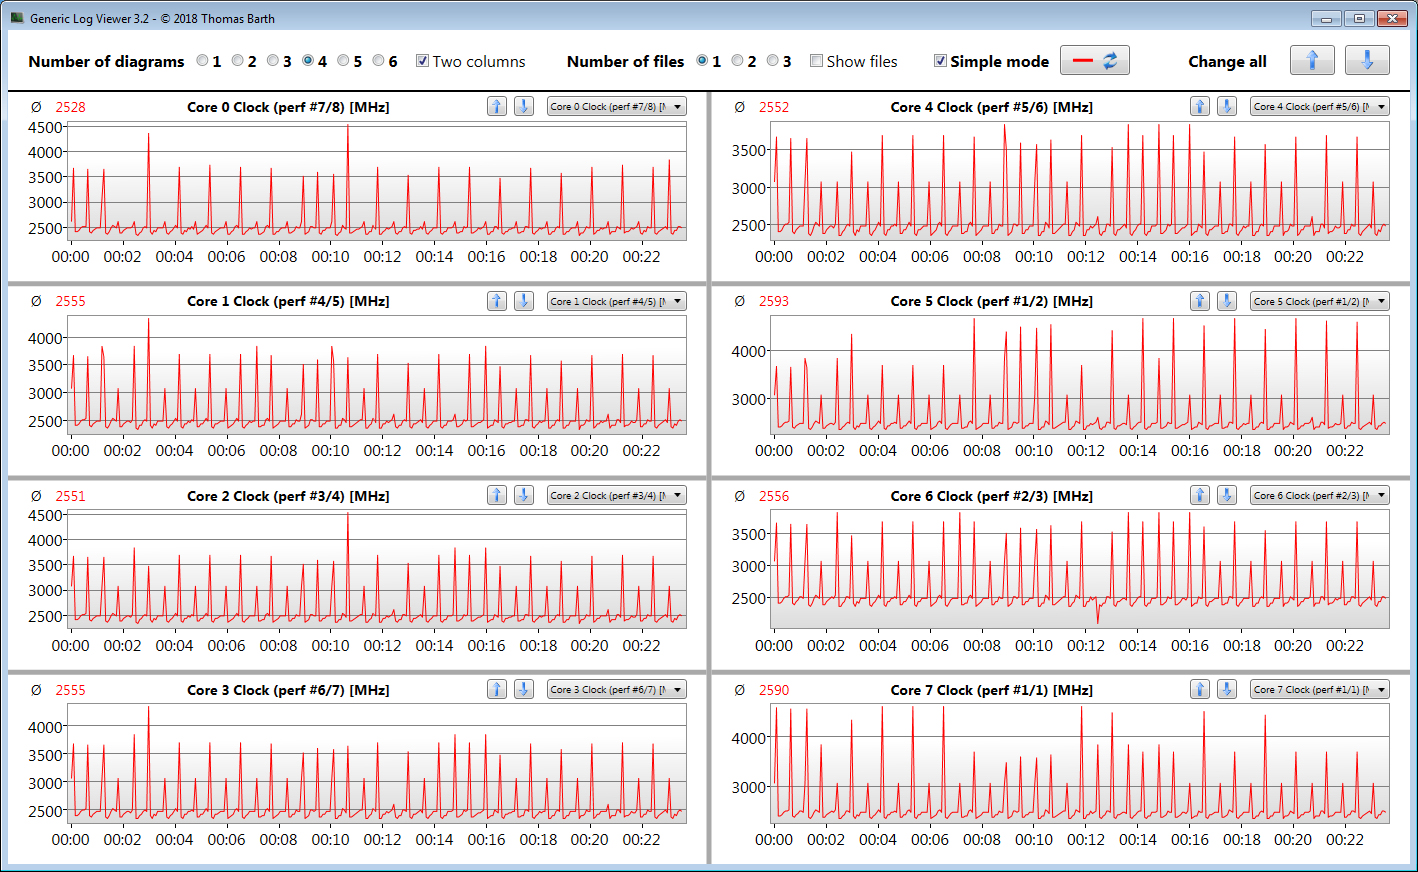
Le test multithread du benchmark Cinebench R15 est traité à 4,2 GHz pendant une courte période, après quoi la fréquence d'horloge chute entre 4 et 4,1 GHz. Le test single-thread est exécuté entre 3,6 et 4,65 GHz. Sur batterie, le processeur fonctionne respectivement entre 2,4 et 2,5 GHz (multithread) et entre 2,2 et 3,5 GHz (single-thread).
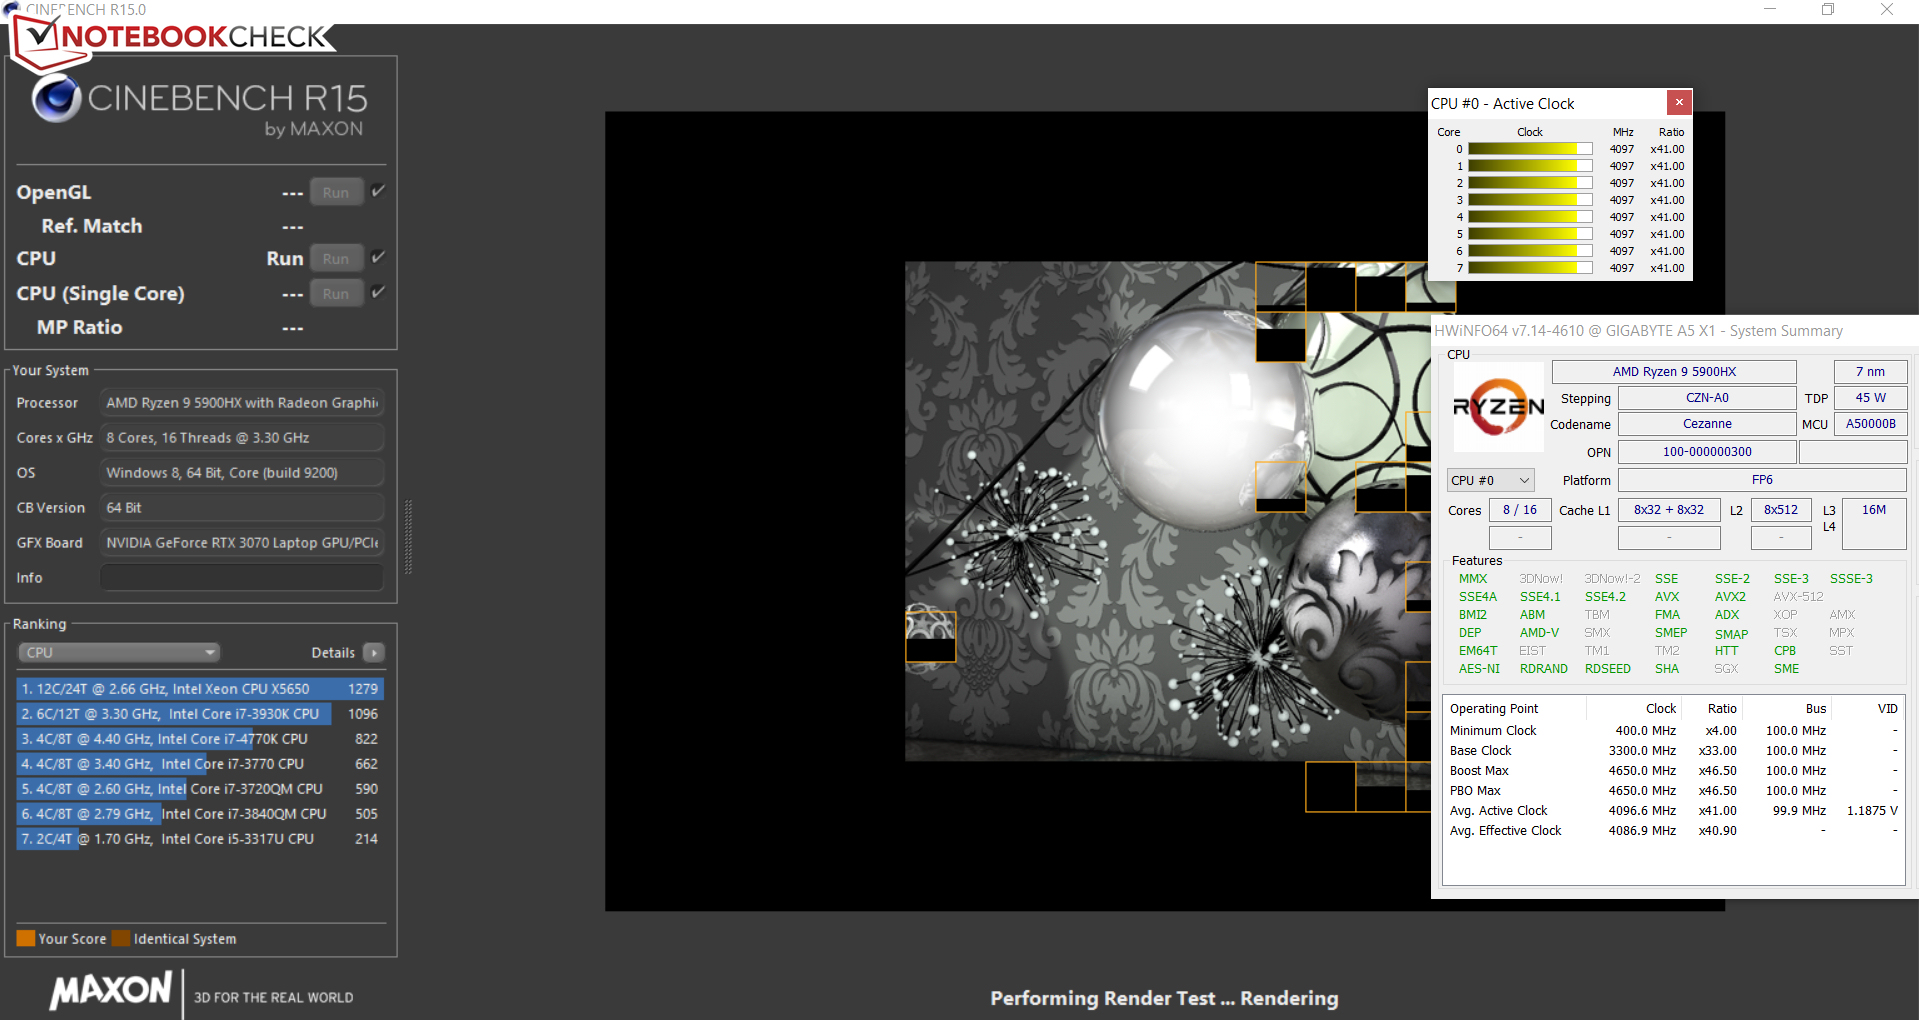
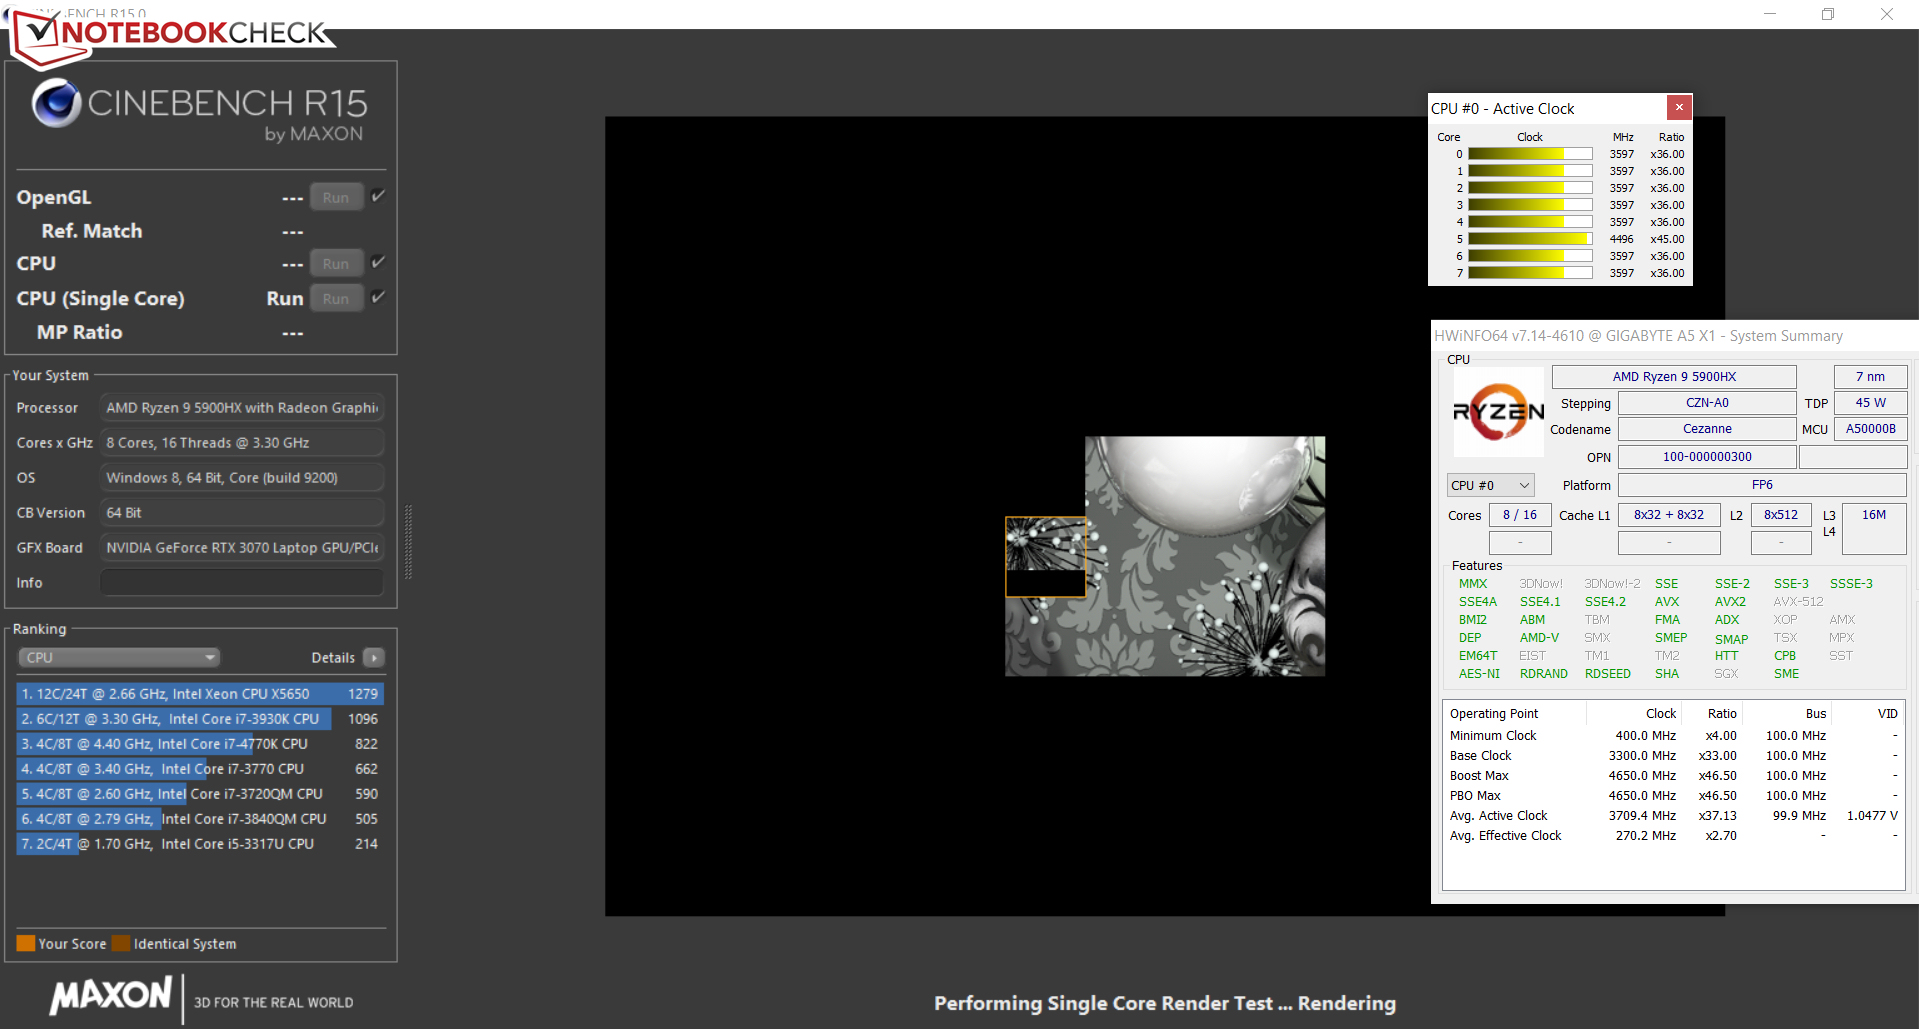
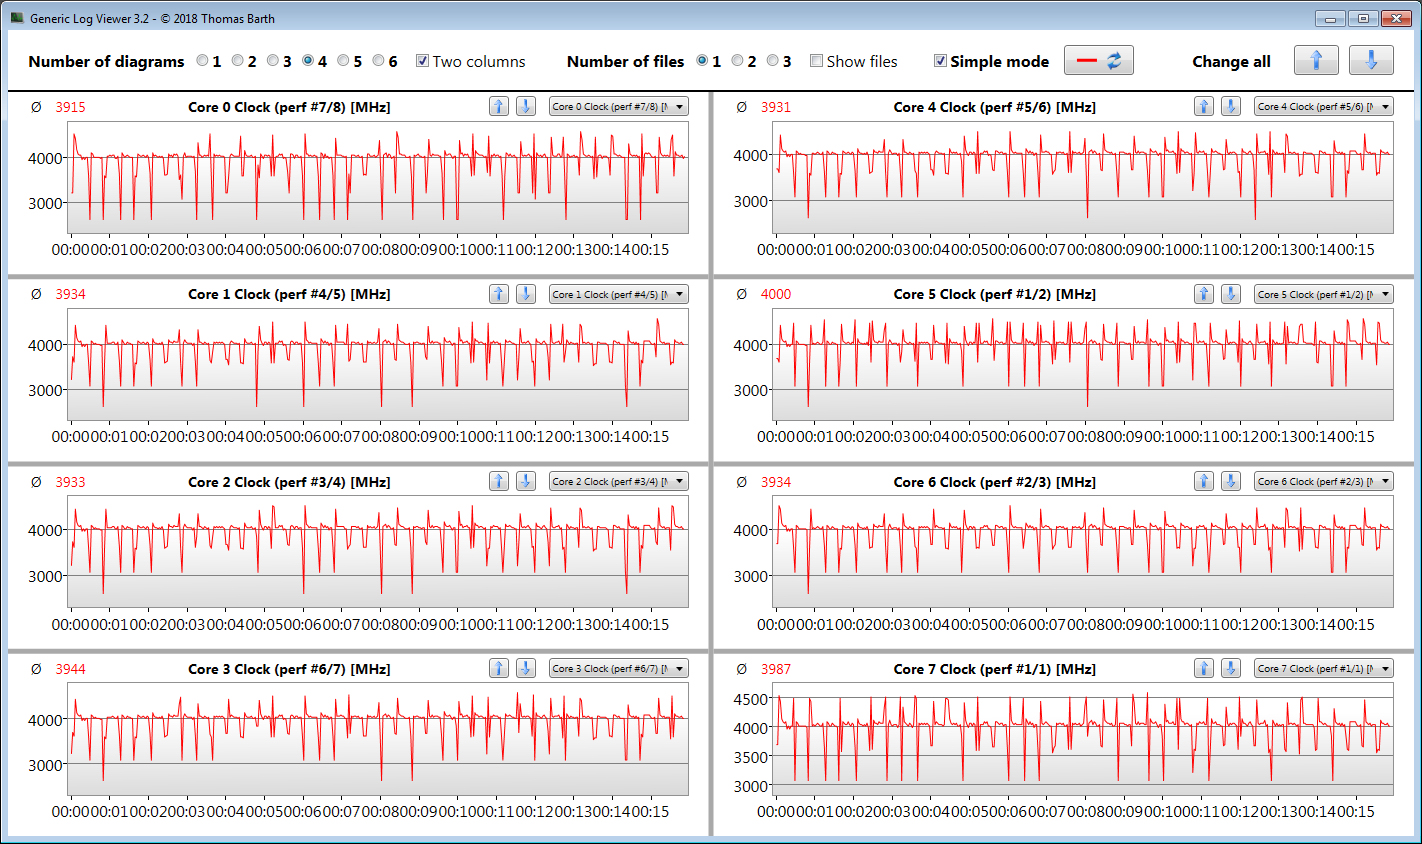
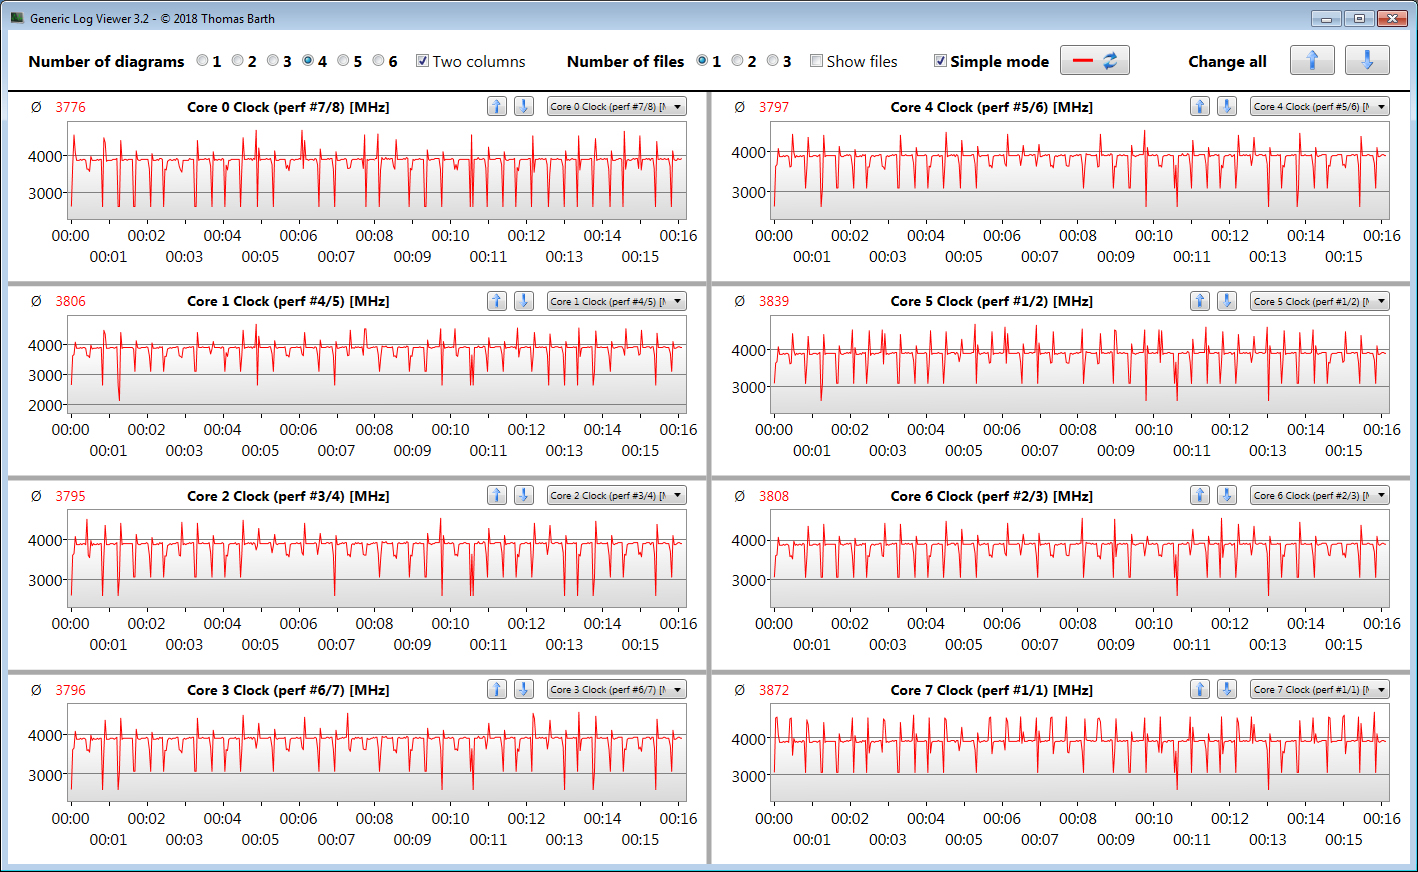
Nous vérifions si le CPU Turbo est constamment utilisé lorsqu'il est branché en exécutant le test multithread du benchmark Cinebench R15 en boucle continue pendant au moins 30 minutes. Le Turbo est utilisé dans une large mesure.
Cinebench R15 Multi endurance test
| CPU Performance rating - Percent | |
| Moyenne de la classe Gaming | |
| Gigabyte A5 X1 | |
| HP Omen 16-b0085ng | |
| Gigabyte A5 X1 | |
| Moyenne AMD Ryzen 9 5900HX | |
| Schenker XMG Apex 15 NH57E PS | |
| Gigabyte A5 X1 | |
| Gigabyte A5 X1 | |
| Acer Nitro 5 AN515-45-R1JH | |
| MSI Katana GF66 11UG-220 | |
| Cinebench R23 | |
| Multi Core | |
| Moyenne de la classe Gaming (10488 - 40970, n=125, 2 dernières années) | |
| Gigabyte A5 X1 | |
| Gigabyte A5 X1 (Unterhaltungsmodus) | |
| Gigabyte A5 X1 (Lautlosmodus) | |
| Schenker XMG Apex 15 NH57E PS | |
| Moyenne AMD Ryzen 9 5900HX (6622 - 14363, n=30) | |
| HP Omen 16-b0085ng | |
| Acer Nitro 5 AN515-45-R1JH | |
| Gigabyte A5 X1 (Stromsparmodus) | |
| MSI Katana GF66 11UG-220 | |
| Single Core | |
| Moyenne de la classe Gaming (1166 - 2267, n=125, 2 dernières années) | |
| MSI Katana GF66 11UG-220 | |
| HP Omen 16-b0085ng | |
| Gigabyte A5 X1 | |
| Gigabyte A5 X1 (Stromsparmodus) | |
| Gigabyte A5 X1 (Unterhaltungsmodus) | |
| Moyenne AMD Ryzen 9 5900HX (1218 - 1499, n=29) | |
| Gigabyte A5 X1 (Lautlosmodus) | |
| Acer Nitro 5 AN515-45-R1JH | |
| Schenker XMG Apex 15 NH57E PS | |
| Cinebench R20 | |
| CPU (Multi Core) | |
| Moyenne de la classe Gaming (4029 - 16108, n=124, 2 dernières années) | |
| Gigabyte A5 X1 | |
| Gigabyte A5 X1 (Unterhaltungsmodus) | |
| Schenker XMG Apex 15 NH57E PS | |
| Moyenne AMD Ryzen 9 5900HX (2242 - 5476, n=30) | |
| HP Omen 16-b0085ng | |
| Gigabyte A5 X1 (Lautlosmodus) | |
| Acer Nitro 5 AN515-45-R1JH | |
| Gigabyte A5 X1 (Stromsparmodus) | |
| MSI Katana GF66 11UG-220 | |
| CPU (Single Core) | |
| Moyenne de la classe Gaming (442 - 870, n=124, 2 dernières années) | |
| HP Omen 16-b0085ng | |
| MSI Katana GF66 11UG-220 | |
| Gigabyte A5 X1 | |
| Gigabyte A5 X1 (Stromsparmodus) | |
| Gigabyte A5 X1 (Unterhaltungsmodus) | |
| Moyenne AMD Ryzen 9 5900HX (471 - 584, n=29) | |
| Gigabyte A5 X1 (Lautlosmodus) | |
| Acer Nitro 5 AN515-45-R1JH | |
| Schenker XMG Apex 15 NH57E PS | |
| Cinebench R15 | |
| CPU Multi 64Bit | |
| Moyenne de la classe Gaming (1578 - 6271, n=125, 2 dernières années) | |
| Gigabyte A5 X1 | |
| HP Omen 16-b0085ng | |
| MSI Katana GF66 11UG-220 (fan in full speed) | |
| MSI Katana GF66 11UG-220 (Factory settings) | |
| Gigabyte A5 X1 (Unterhaltungsmodus) | |
| Schenker XMG Apex 15 NH57E PS | |
| Gigabyte A5 X1 (Lautlosmodus) | |
| Moyenne AMD Ryzen 9 5900HX (1076 - 2267, n=29) | |
| Acer Nitro 5 AN515-45-R1JH | |
| Gigabyte A5 X1 (Stromsparmodus) | |
| CPU Single 64Bit | |
| Moyenne de la classe Gaming (188.8 - 343, n=124, 2 dernières années) | |
| Gigabyte A5 X1 (Stromsparmodus) | |
| Gigabyte A5 X1 (Unterhaltungsmodus) | |
| Gigabyte A5 X1 (Lautlosmodus) | |
| Moyenne AMD Ryzen 9 5900HX (197 - 243, n=25) | |
| Gigabyte A5 X1 | |
| Acer Nitro 5 AN515-45-R1JH | |
| Schenker XMG Apex 15 NH57E PS | |
| MSI Katana GF66 11UG-220 | |
| MSI Katana GF66 11UG-220 | |
| HP Omen 16-b0085ng | |
| Blender - v2.79 BMW27 CPU | |
| MSI Katana GF66 11UG-220 | |
| Gigabyte A5 X1 (Stromsparmodus) | |
| Acer Nitro 5 AN515-45-R1JH | |
| Moyenne AMD Ryzen 9 5900HX (219 - 442, n=29) | |
| Gigabyte A5 X1 (Lautlosmodus) | |
| Schenker XMG Apex 15 NH57E PS | |
| Gigabyte A5 X1 (Unterhaltungsmodus) | |
| Gigabyte A5 X1 | |
| HP Omen 16-b0085ng | |
| Moyenne de la classe Gaming (80 - 330, n=121, 2 dernières années) | |
| 7-Zip 18.03 | |
| 7z b 4 | |
| Moyenne de la classe Gaming (33491 - 148086, n=122, 2 dernières années) | |
| Gigabyte A5 X1 | |
| Gigabyte A5 X1 (Unterhaltungsmodus) | |
| Gigabyte A5 X1 (Lautlosmodus) | |
| Schenker XMG Apex 15 NH57E PS | |
| Moyenne AMD Ryzen 9 5900HX (36011 - 62503, n=29) | |
| HP Omen 16-b0085ng | |
| Acer Nitro 5 AN515-45-R1JH | |
| Gigabyte A5 X1 (Stromsparmodus) | |
| MSI Katana GF66 11UG-220 | |
| 7z b 4 -mmt1 | |
| Moyenne de la classe Gaming (4199 - 7508, n=122, 2 dernières années) | |
| Gigabyte A5 X1 (Stromsparmodus) | |
| Gigabyte A5 X1 (Unterhaltungsmodus) | |
| Gigabyte A5 X1 (Lautlosmodus) | |
| Gigabyte A5 X1 | |
| Moyenne AMD Ryzen 9 5900HX (4791 - 5905, n=29) | |
| HP Omen 16-b0085ng | |
| Schenker XMG Apex 15 NH57E PS | |
| MSI Katana GF66 11UG-220 | |
| Acer Nitro 5 AN515-45-R1JH | |
| Geekbench 5.5 | |
| Multi-Core | |
| Moyenne de la classe Gaming (6460 - 27010, n=122, 2 dernières années) | |
| HP Omen 16-b0085ng | |
| Gigabyte A5 X1 | |
| Gigabyte A5 X1 (Unterhaltungsmodus) | |
| Schenker XMG Apex 15 NH57E PS | |
| Moyenne AMD Ryzen 9 5900HX (5057 - 9294, n=27) | |
| Gigabyte A5 X1 (Lautlosmodus) | |
| Gigabyte A5 X1 (Stromsparmodus) | |
| Acer Nitro 5 AN515-45-R1JH | |
| MSI Katana GF66 11UG-220 | |
| Single-Core | |
| Moyenne de la classe Gaming (986 - 2474, n=122, 2 dernières années) | |
| HP Omen 16-b0085ng | |
| MSI Katana GF66 11UG-220 | |
| Gigabyte A5 X1 (Stromsparmodus) | |
| Gigabyte A5 X1 | |
| Moyenne AMD Ryzen 9 5900HX (1271 - 1574, n=27) | |
| Gigabyte A5 X1 (Unterhaltungsmodus) | |
| Schenker XMG Apex 15 NH57E PS | |
| Acer Nitro 5 AN515-45-R1JH | |
| Gigabyte A5 X1 (Lautlosmodus) | |
| HWBOT x265 Benchmark v2.2 - 4k Preset | |
| Moyenne de la classe Gaming (11.5 - 44.3, n=122, 2 dernières années) | |
| HP Omen 16-b0085ng | |
| Gigabyte A5 X1 | |
| Gigabyte A5 X1 (Unterhaltungsmodus) | |
| Schenker XMG Apex 15 NH57E PS | |
| Moyenne AMD Ryzen 9 5900HX (8.26 - 17.1, n=29) | |
| Gigabyte A5 X1 (Lautlosmodus) | |
| Acer Nitro 5 AN515-45-R1JH | |
| Gigabyte A5 X1 (Stromsparmodus) | |
| MSI Katana GF66 11UG-220 | |
| LibreOffice - 20 Documents To PDF | |
| Gigabyte A5 X1 | |
| Acer Nitro 5 AN515-45-R1JH | |
| Schenker XMG Apex 15 NH57E PS | |
| Moyenne AMD Ryzen 9 5900HX (44.1 - 87.4, n=29) | |
| Gigabyte A5 X1 (Stromsparmodus) | |
| Gigabyte A5 X1 (Lautlosmodus) | |
| Gigabyte A5 X1 (Unterhaltungsmodus) | |
| MSI Katana GF66 11UG-220 | |
| Moyenne de la classe Gaming (19 - 88.8, n=122, 2 dernières années) | |
| HP Omen 16-b0085ng | |
| R Benchmark 2.5 - Overall mean | |
| HP Omen 16-b0085ng | |
| MSI Katana GF66 11UG-220 | |
| Acer Nitro 5 AN515-45-R1JH | |
| Schenker XMG Apex 15 NH57E PS | |
| Gigabyte A5 X1 (Unterhaltungsmodus) | |
| Moyenne AMD Ryzen 9 5900HX (0.48 - 0.599, n=29) | |
| Gigabyte A5 X1 (Lautlosmodus) | |
| Gigabyte A5 X1 | |
| Gigabyte A5 X1 (Stromsparmodus) | |
| Moyenne de la classe Gaming (0.3439 - 0.759, n=123, 2 dernières années) | |
* ... Moindre est la valeur, meilleures sont les performances
AIDA64: FP32 Ray-Trace | FPU Julia | CPU SHA3 | CPU Queen | FPU SinJulia | FPU Mandel | CPU AES | CPU ZLib | FP64 Ray-Trace | CPU PhotoWorxx
| Performance rating | |
| Moyenne de la classe Gaming | |
| Gigabyte A5 X1 | |
| Gigabyte A5 X1 | |
| Gigabyte A5 X1 | |
| Moyenne AMD Ryzen 9 5900HX | |
| Schenker XMG Apex 15 NH57E PS | |
| Acer Nitro 5 AN515-45-R1JH | |
| Gigabyte A5 X1 | |
| HP Omen 16-b0085ng -9! | |
| MSI Katana GF66 11UG-220 -9! | |
| AIDA64 / FP32 Ray-Trace | |
| Moyenne de la classe Gaming (10227 - 85542, n=122, 2 dernières années) | |
| Gigabyte A5 X1 (v6.50.5800) | |
| Gigabyte A5 X1 (v6.50.5800, Unterhaltungsmodus) | |
| Gigabyte A5 X1 (v6.50.5800, Lautlosmodus) | |
| Moyenne AMD Ryzen 9 5900HX (12470 - 16014, n=26) | |
| Schenker XMG Apex 15 NH57E PS (v6.50.5800) | |
| Acer Nitro 5 AN515-45-R1JH (v6.33.5700) | |
| Gigabyte A5 X1 (v6.50.5800, Stromsparmodus) | |
| AIDA64 / FPU Julia | |
| Moyenne de la classe Gaming (51376 - 238426, n=122, 2 dernières années) | |
| Gigabyte A5 X1 (v6.50.5800) | |
| Gigabyte A5 X1 (v6.50.5800, Unterhaltungsmodus) | |
| Schenker XMG Apex 15 NH57E PS (v6.50.5800) | |
| Moyenne AMD Ryzen 9 5900HX (79554 - 101008, n=26) | |
| Gigabyte A5 X1 (v6.50.5800, Lautlosmodus) | |
| Acer Nitro 5 AN515-45-R1JH (v6.33.5700) | |
| Gigabyte A5 X1 (v6.50.5800, Stromsparmodus) | |
| AIDA64 / CPU SHA3 | |
| Moyenne de la classe Gaming (2180 - 9817, n=122, 2 dernières années) | |
| Gigabyte A5 X1 (v6.50.5800) | |
| Gigabyte A5 X1 (v6.50.5800, Unterhaltungsmodus) | |
| Moyenne AMD Ryzen 9 5900HX (2754 - 3444, n=26) | |
| Schenker XMG Apex 15 NH57E PS (v6.50.5800) | |
| Gigabyte A5 X1 (v6.50.5800, Lautlosmodus) | |
| Acer Nitro 5 AN515-45-R1JH (v6.33.5700) | |
| Gigabyte A5 X1 (v6.50.5800, Stromsparmodus) | |
| AIDA64 / CPU Queen | |
| Moyenne de la classe Gaming (49785 - 173351, n=119, 2 dernières années) | |
| Gigabyte A5 X1 (v6.50.5800, Unterhaltungsmodus) | |
| Gigabyte A5 X1 (v6.50.5800) | |
| Gigabyte A5 X1 (v6.50.5800, Lautlosmodus) | |
| Moyenne AMD Ryzen 9 5900HX (87865 - 105123, n=26) | |
| Schenker XMG Apex 15 NH57E PS (v6.50.5800) | |
| Acer Nitro 5 AN515-45-R1JH (v6.33.5700) | |
| Gigabyte A5 X1 (v6.50.5800, Stromsparmodus) | |
| AIDA64 / FPU SinJulia | |
| Moyenne de la classe Gaming (4424 - 33636, n=122, 2 dernières années) | |
| Gigabyte A5 X1 (v6.50.5800, Unterhaltungsmodus) | |
| Gigabyte A5 X1 (v6.50.5800) | |
| Moyenne AMD Ryzen 9 5900HX (10899 - 12806, n=26) | |
| Gigabyte A5 X1 (v6.50.5800, Lautlosmodus) | |
| Schenker XMG Apex 15 NH57E PS (v6.50.5800) | |
| Acer Nitro 5 AN515-45-R1JH (v6.33.5700) | |
| Gigabyte A5 X1 (v6.50.5800, Stromsparmodus) | |
| AIDA64 / FPU Mandel | |
| Moyenne de la classe Gaming (25115 - 128721, n=122, 2 dernières années) | |
| Gigabyte A5 X1 (v6.50.5800) | |
| Gigabyte A5 X1 (v6.50.5800, Unterhaltungsmodus) | |
| Schenker XMG Apex 15 NH57E PS (v6.50.5800) | |
| Moyenne AMD Ryzen 9 5900HX (43685 - 55702, n=26) | |
| Gigabyte A5 X1 (v6.50.5800, Lautlosmodus) | |
| Acer Nitro 5 AN515-45-R1JH (v6.33.5700) | |
| Gigabyte A5 X1 (v6.50.5800, Stromsparmodus) | |
| AIDA64 / CPU AES | |
| Gigabyte A5 X1 (v6.50.5800) | |
| Gigabyte A5 X1 (v6.50.5800, Unterhaltungsmodus) | |
| Moyenne AMD Ryzen 9 5900HX (109927 - 137901, n=26) | |
| Gigabyte A5 X1 (v6.50.5800, Lautlosmodus) | |
| Schenker XMG Apex 15 NH57E PS (v6.50.5800) | |
| Acer Nitro 5 AN515-45-R1JH (v6.33.5700) | |
| Gigabyte A5 X1 (v6.50.5800, Stromsparmodus) | |
| Moyenne de la classe Gaming (39258 - 247074, n=122, 2 dernières années) | |
| AIDA64 / CPU ZLib | |
| Moyenne de la classe Gaming (574 - 2531, n=122, 2 dernières années) | |
| Gigabyte A5 X1 (v6.50.5800) | |
| Gigabyte A5 X1 (v6.50.5800, Unterhaltungsmodus) | |
| Moyenne AMD Ryzen 9 5900HX (706 - 878, n=26) | |
| Gigabyte A5 X1 (v6.50.5800, Lautlosmodus) | |
| Schenker XMG Apex 15 NH57E PS (v6.50.5800) | |
| Acer Nitro 5 AN515-45-R1JH (v6.33.5700) | |
| Gigabyte A5 X1 (v6.50.5800, Stromsparmodus) | |
| MSI Katana GF66 11UG-220 (v6.33.5700) | |
| HP Omen 16-b0085ng (v6.33.5700) | |
| AIDA64 / FP64 Ray-Trace | |
| Moyenne de la classe Gaming (5509 - 45446, n=122, 2 dernières années) | |
| Gigabyte A5 X1 (v6.50.5800) | |
| Gigabyte A5 X1 (v6.50.5800, Unterhaltungsmodus) | |
| Gigabyte A5 X1 (v6.50.5800, Lautlosmodus) | |
| Moyenne AMD Ryzen 9 5900HX (6664 - 8644, n=26) | |
| Schenker XMG Apex 15 NH57E PS (v6.50.5800) | |
| Acer Nitro 5 AN515-45-R1JH (v6.33.5700) | |
| Gigabyte A5 X1 (v6.50.5800, Stromsparmodus) | |
| AIDA64 / CPU PhotoWorxx | |
| Moyenne de la classe Gaming (12271 - 62916, n=122, 2 dernières années) | |
| Gigabyte A5 X1 (v6.50.5800, Lautlosmodus) | |
| Gigabyte A5 X1 (v6.50.5800, Unterhaltungsmodus) | |
| Gigabyte A5 X1 (v6.50.5800, Stromsparmodus) | |
| Schenker XMG Apex 15 NH57E PS (v6.50.5800) | |
| Gigabyte A5 X1 (v6.50.5800) | |
| Moyenne AMD Ryzen 9 5900HX (14344 - 25533, n=26) | |
| Acer Nitro 5 AN515-45-R1JH (v6.33.5700) | |
Performance du système
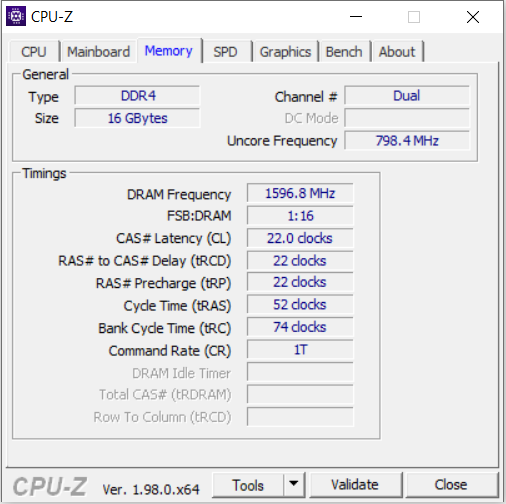
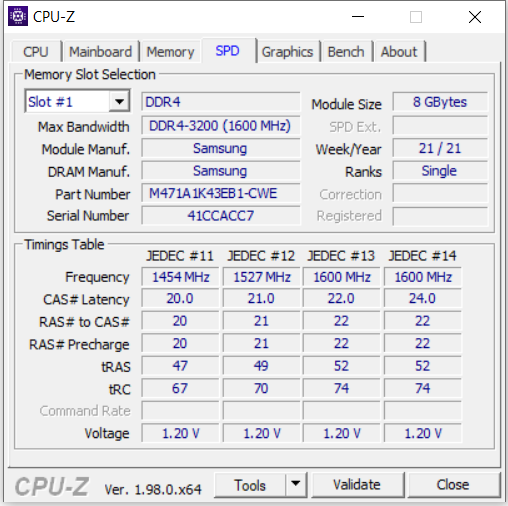
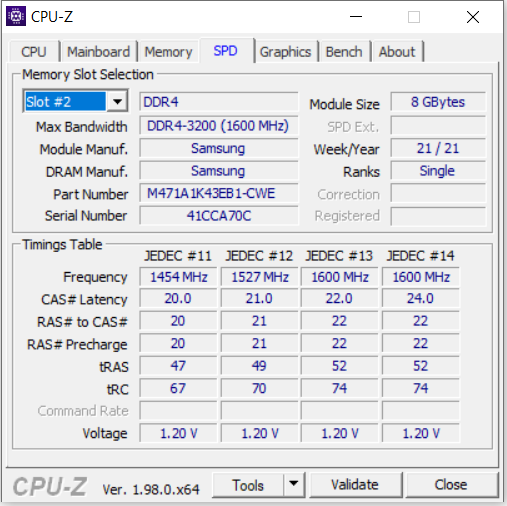
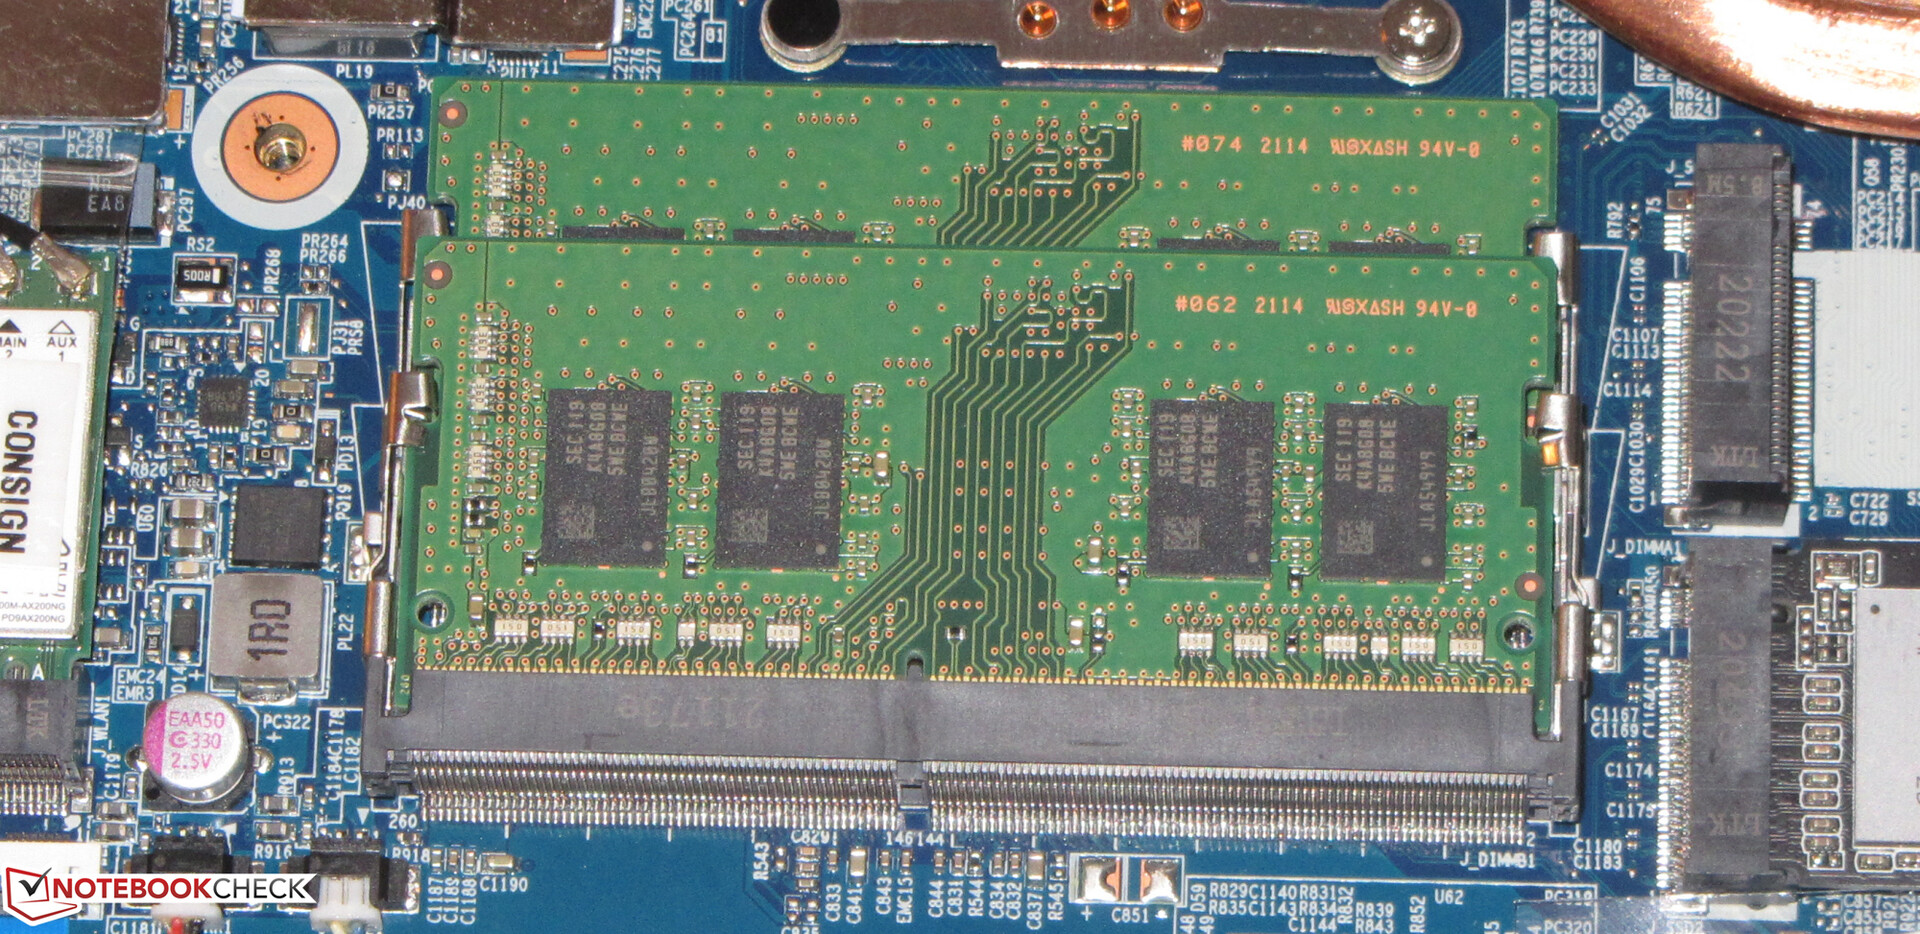
Ce système rapide et fluide offre suffisamment de puissance de calcul pour les jeux, le montage vidéo et le traitement d'images pendant des années. Les taux de transfert de la RAM intégrée sont à un niveau normal pour une mémoire DDR4-3200. Ces résultats sont complétés par de très bons résultats PCMark
| PCMark 8 Home Score Accelerated v2 | 5419 points | |
| PCMark 8 Creative Score Accelerated v2 | 6593 points | |
| PCMark 8 Work Score Accelerated v2 | 6263 points | |
| PCMark 10 Score | 6875 points | |
Aide | ||
| PCMark 10 / Score | |
| Moyenne de la classe Gaming (5828 - 10060, n=104, 2 dernières années) | |
| HP Omen 16-b0085ng | |
| Moyenne AMD Ryzen 9 5900HX, NVIDIA GeForce RTX 3070 Laptop GPU (6875 - 6967, n=4) | |
| Gigabyte A5 X1 | |
| Acer Nitro 5 AN515-45-R1JH | |
| Schenker XMG Apex 15 NH57E PS | |
| MSI Katana GF66 11UG-220 | |
| PCMark 10 / Essentials | |
| HP Omen 16-b0085ng | |
| Moyenne de la classe Gaming (8810 - 12600, n=108, 2 dernières années) | |
| Moyenne AMD Ryzen 9 5900HX, NVIDIA GeForce RTX 3070 Laptop GPU (9991 - 10413, n=3) | |
| Gigabyte A5 X1 | |
| Acer Nitro 5 AN515-45-R1JH | |
| Schenker XMG Apex 15 NH57E PS | |
| MSI Katana GF66 11UG-220 | |
| PCMark 10 / Productivity | |
| Moyenne de la classe Gaming (6662 - 16716, n=106, 2 dernières années) | |
| Moyenne AMD Ryzen 9 5900HX, NVIDIA GeForce RTX 3070 Laptop GPU (9301 - 9381, n=3) | |
| Gigabyte A5 X1 | |
| Acer Nitro 5 AN515-45-R1JH | |
| MSI Katana GF66 11UG-220 | |
| HP Omen 16-b0085ng | |
| Schenker XMG Apex 15 NH57E PS | |
| PCMark 10 / Digital Content Creation | |
| Moyenne de la classe Gaming (7602 - 19351, n=106, 2 dernières années) | |
| HP Omen 16-b0085ng | |
| Moyenne AMD Ryzen 9 5900HX, NVIDIA GeForce RTX 3070 Laptop GPU (9383 - 9561, n=3) | |
| MSI Katana GF66 11UG-220 | |
| Gigabyte A5 X1 | |
| Schenker XMG Apex 15 NH57E PS | |
| Acer Nitro 5 AN515-45-R1JH | |
| AIDA64 / Memory Copy | |
| Moyenne de la classe Gaming (21750 - 108104, n=122, 2 dernières années) | |
| Schenker XMG Apex 15 NH57E PS (v6.50.5800) | |
| Gigabyte A5 X1 (v6.50.5800) | |
| Moyenne AMD Ryzen 9 5900HX (36725 - 43318, n=26) | |
| Acer Nitro 5 AN515-45-R1JH (v6.33.5700) | |
| AIDA64 / Memory Read | |
| Moyenne de la classe Gaming (22956 - 104349, n=122, 2 dernières années) | |
| Schenker XMG Apex 15 NH57E PS (v6.50.5800) | |
| Gigabyte A5 X1 (v6.50.5800) | |
| Moyenne AMD Ryzen 9 5900HX (41378 - 47593, n=26) | |
| Acer Nitro 5 AN515-45-R1JH (v6.33.5700) | |
| AIDA64 / Memory Write | |
| Moyenne de la classe Gaming (22297 - 133486, n=122, 2 dernières années) | |
| Schenker XMG Apex 15 NH57E PS (v6.50.5800) | |
| Gigabyte A5 X1 (v6.50.5800) | |
| Moyenne AMD Ryzen 9 5900HX (32536 - 46718, n=26) | |
| Acer Nitro 5 AN515-45-R1JH (v6.33.5700) | |
| AIDA64 / Memory Latency | |
| Moyenne de la classe Gaming (75.3 - 259, n=122, 2 dernières années) | |
| Moyenne AMD Ryzen 9 5900HX (73.5 - 97.1, n=26) | |
| Schenker XMG Apex 15 NH57E PS (v6.50.5800) | |
| Gigabyte A5 X1 (v6.50.5800) | |
| Acer Nitro 5 AN515-45-R1JH (v6.33.5700) | |
| MSI Katana GF66 11UG-220 (v6.33.5700) | |
| MSI Katana GF66 11UG-220 (v6.33.5700) | |
| HP Omen 16-b0085ng (v6.33.5700) | |
* ... Moindre est la valeur, meilleures sont les performances
Latences DPC
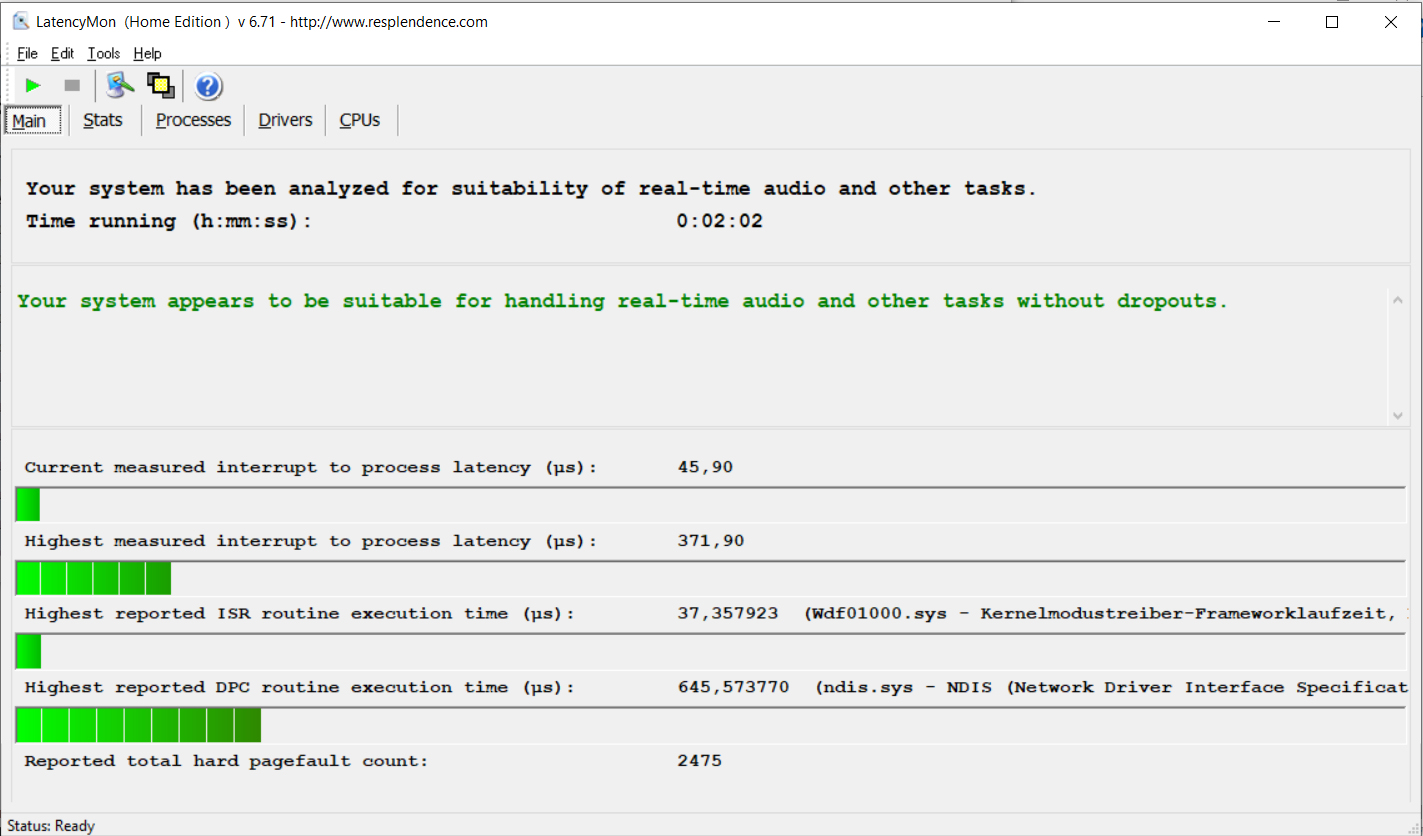
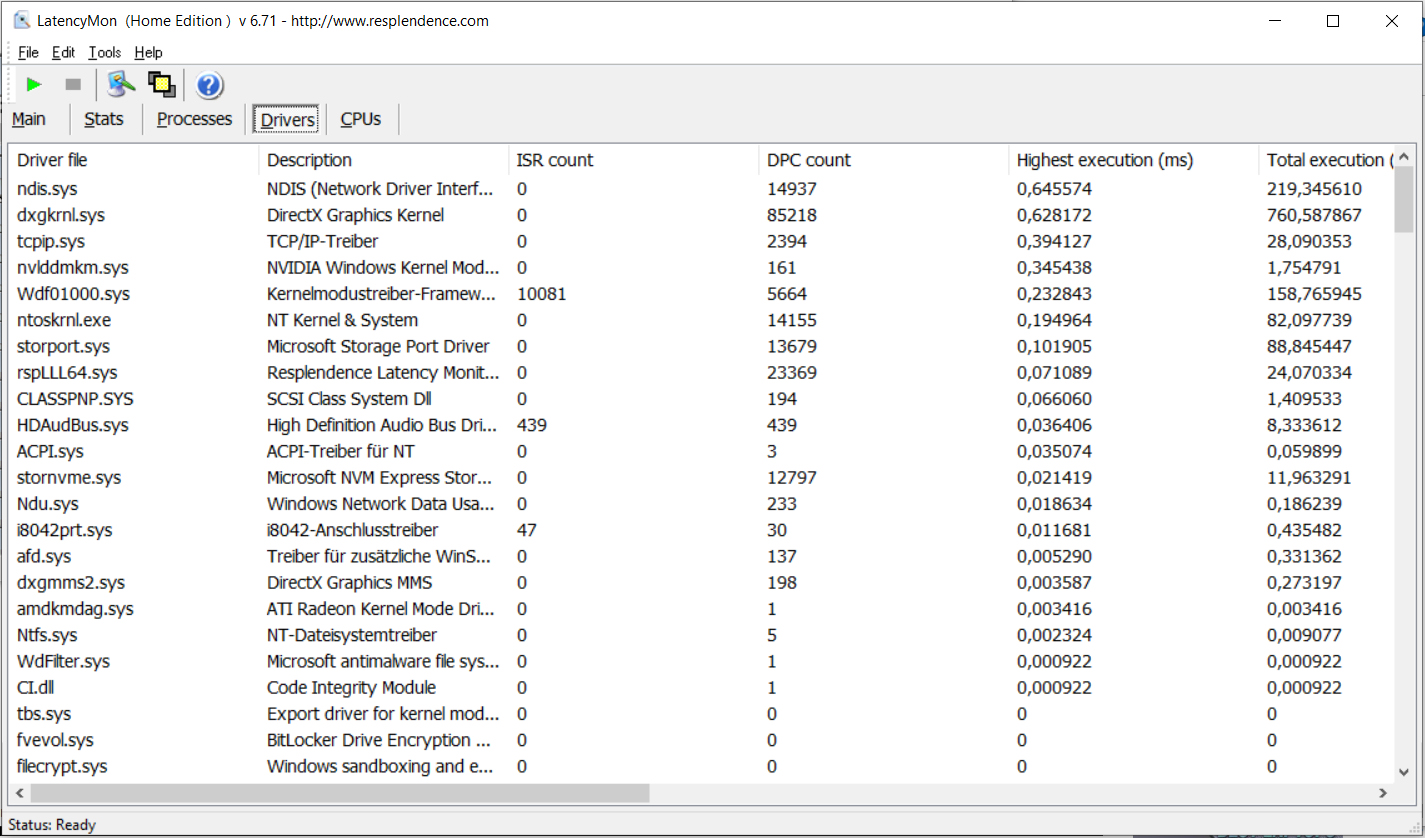
Notre test de contrôle de latence standardisé (navigation web, lecture vidéo 4K, Prime95 à forte charge) n'a pas révélé de problèmes de latences DPC. Le système semble être adapté à l'édition vidéo et audio en temps réel. Les futures mises à jour logicielles pourraient conduire à des améliorations ou même à une dégradation des performances
| DPC Latencies / LatencyMon - interrupt to process latency (max), Web, Youtube, Prime95 | |
| Schenker XMG Apex 15 NH57E PS | |
| MSI Katana GF66 11UG-220 | |
| HP Omen 16-b0085ng | |
| Acer Nitro 5 AN515-45-R1JH | |
| Gigabyte A5 X1 | |
* ... Moindre est la valeur, meilleures sont les performances
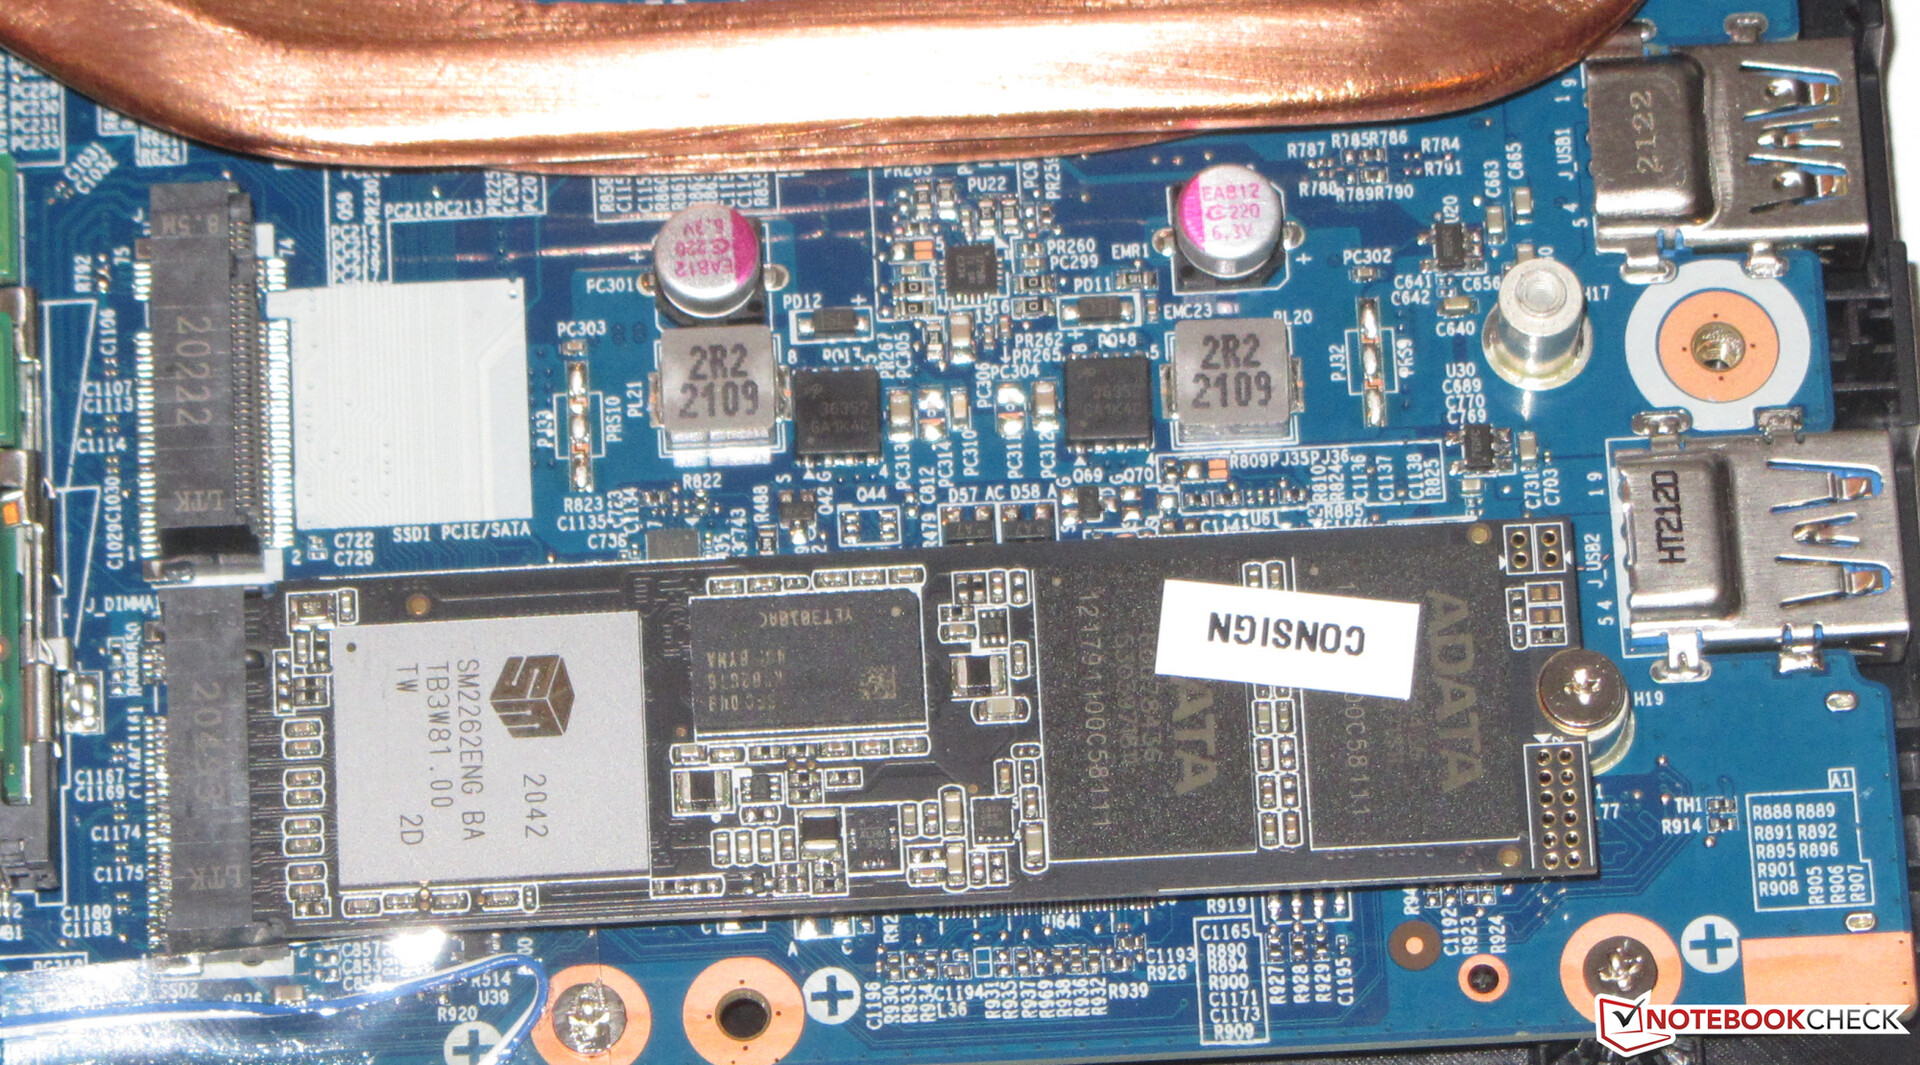
Stockage
Un SSD NVMe (M.2-2280) d'Adata sert de disque système. Il offre 512 Go d'espace de stockage et fournit de bons taux de transfert - cependant, il ne fait pas partie des meilleurs modèles de SSD. L'ordinateur portable peut accueillir un deuxième SSD NVMe (M.2-2280). Les deux emplacements M.2 prennent en charge PCIe Gen 4. En outre, il y a également de la place pour un disque de stockage de 2,5 pouces (l'emplacement SATA et le cadre de montage se trouvent à l'intérieur de l'ordinateur portable, les vis sont dans la boîte)

* ... Moindre est la valeur, meilleures sont les performances
Continuous load read: DiskSpd Read Loop, Queue Depth 8
Carte graphique
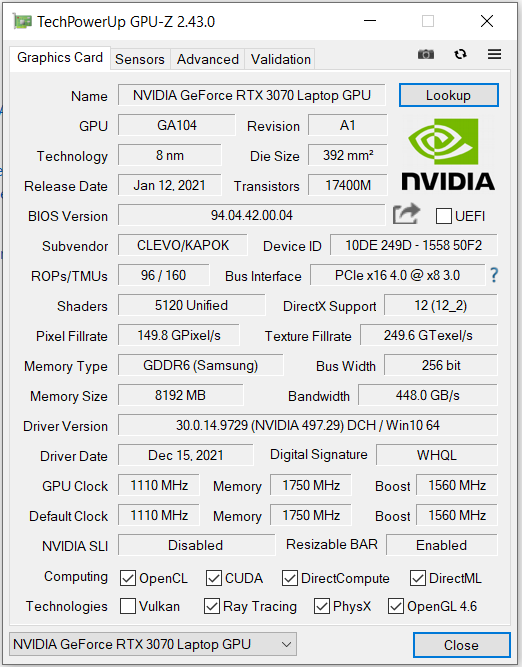
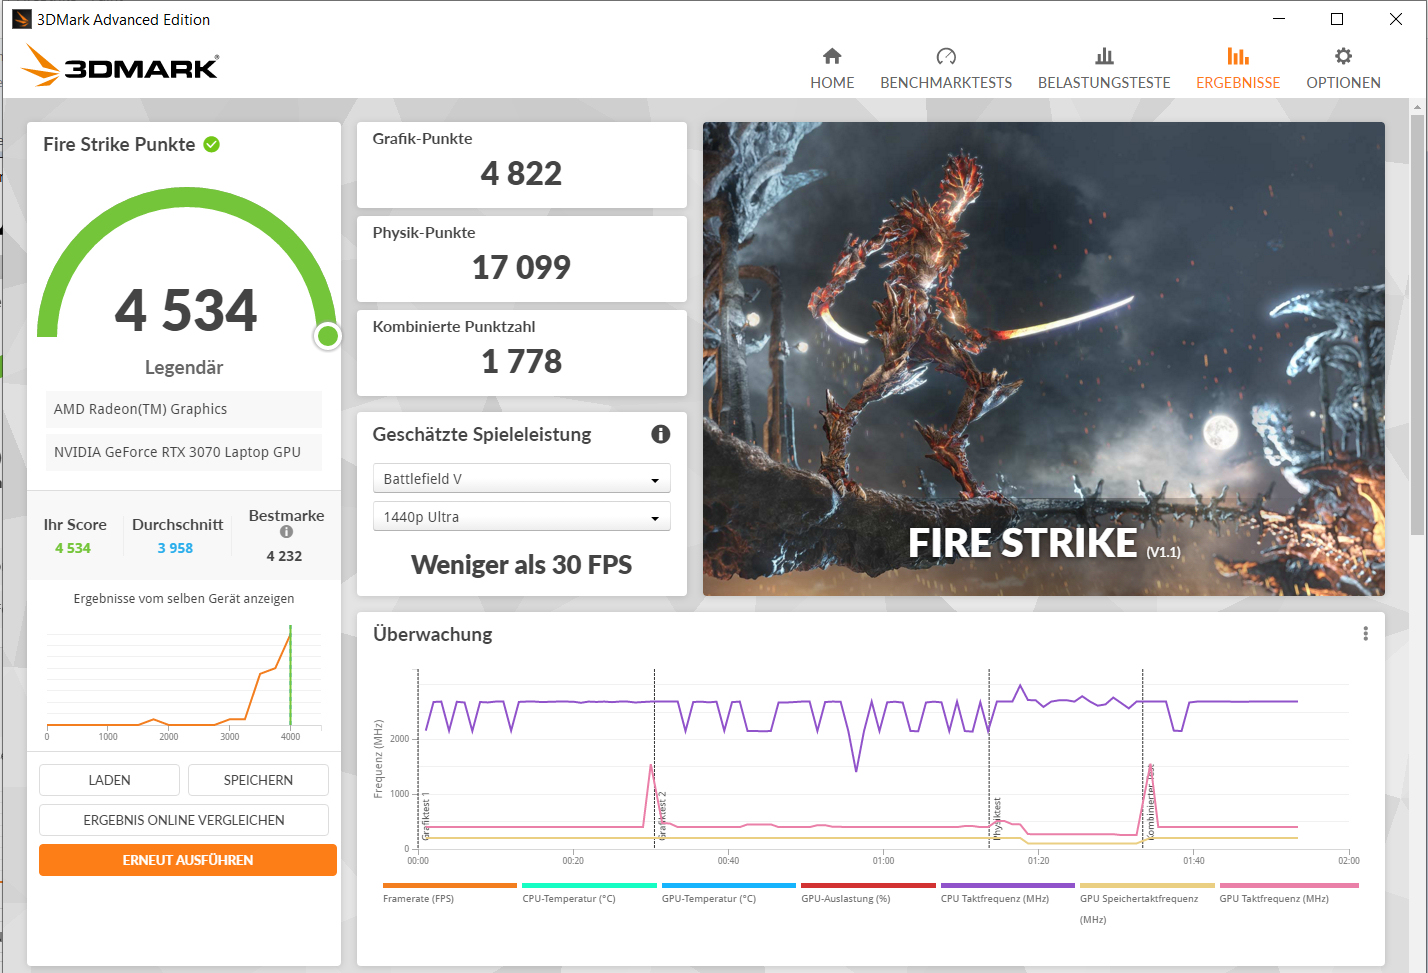
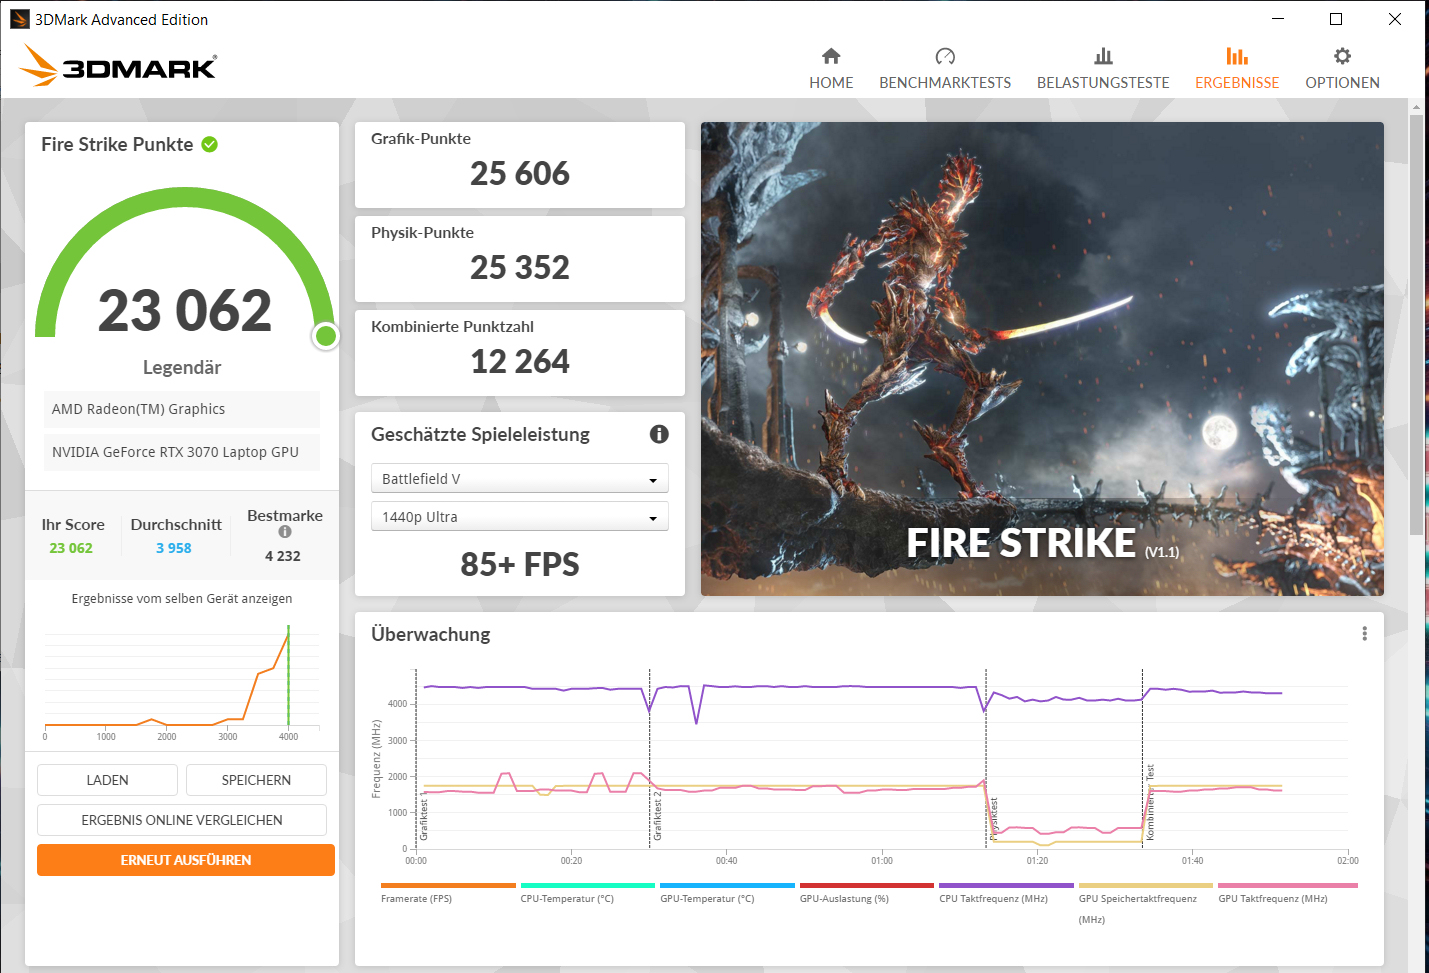
Les performances réelles d'un GPU RTX 3000 dépendent de quelques facteurs : Le refroidissement, la configuration de la mémoire, et le TGP maximal que le fabricant d'un ordinateur portable choisit dans les limites définies par Nvidia. Gigabyte accorde le GeForce RTX 3070(aperçu de tous les ordinateurs portables RTX 3070, y compris leurs TGP) un TGP maximum de 140 watts (125 watts + 15 watts Dynamic Boost).
Les résultats de 3DMark dépassent la moyenne des RTX 3070 qui a été déterminée jusqu'à présent. Les taux de laHP Omen 16 concurrent immédiat sont souvent à égalité - malgré son TGP inférieur. Cela pourrait être une indication que l'A5 n'est pas toujours capable d'exploiter son TGP maximum. Cependant, notre test The Witcher 3 prouve son potentiel fondamental.
Le GPU peut accéder à la mémoire graphique rapide GDDR6 (8 192 Mo). Le cœur graphique Vega 8 intégré au processeur est actif, et l'ordinateur portable fonctionne avec la solution de commutation graphique Optimus de Nvidia.


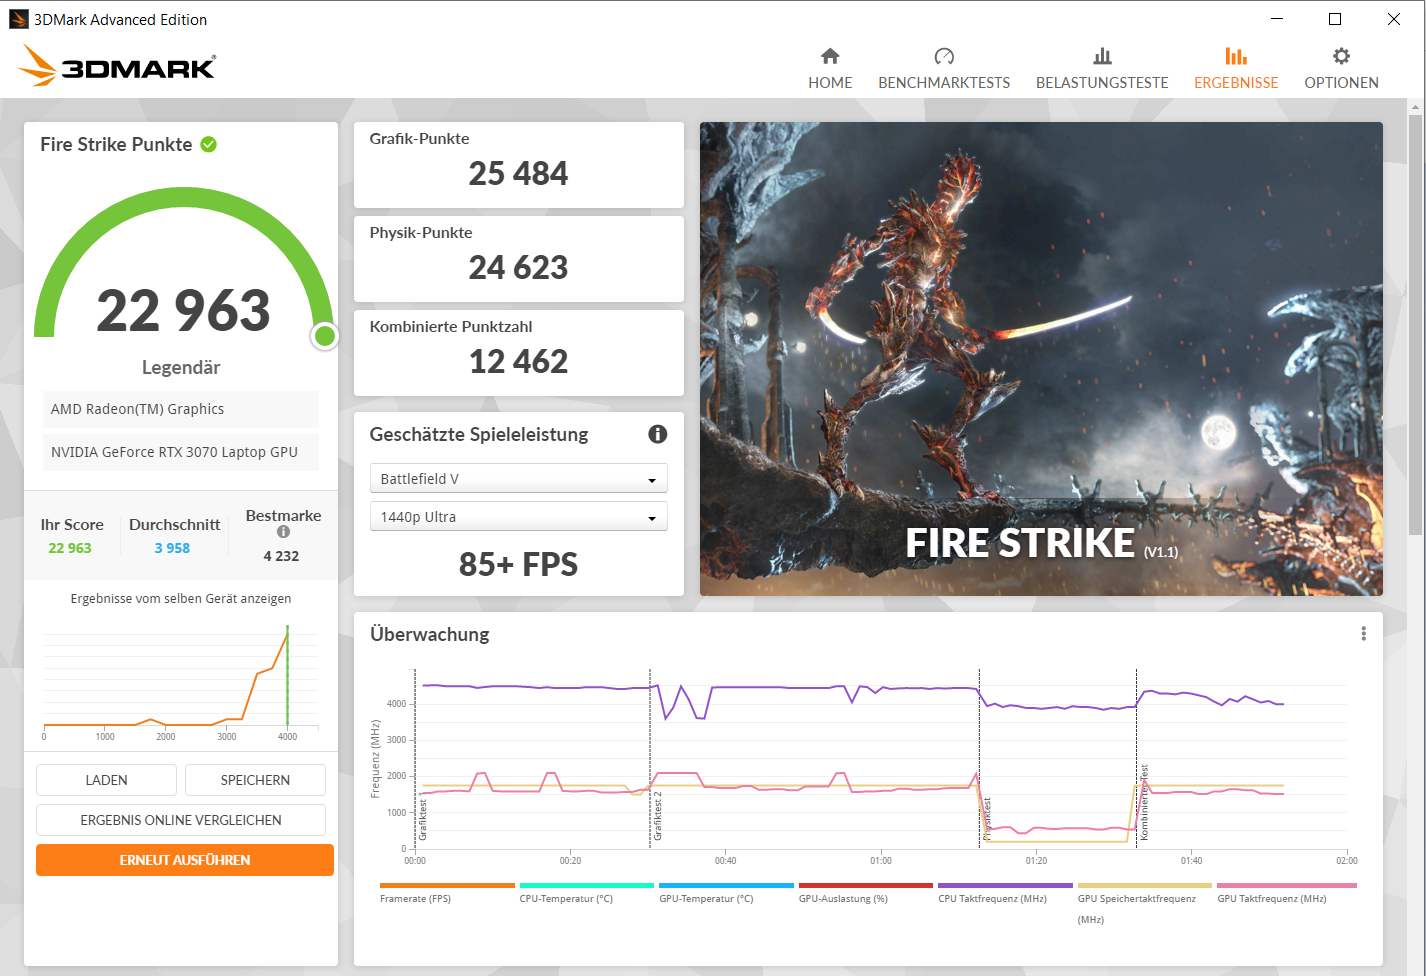
| 3DMark 06 Standard Score | 45160 points | |
| 3DMark 11 Performance | 27915 points | |
| 3DMark Cloud Gate Standard Score | 50228 points | |
| 3DMark Fire Strike Score | 24068 points | |
| 3DMark Time Spy Score | 10535 points | |
Aide | ||
| 3DMark Performance rating - Percent | |
| Moyenne de la classe Gaming | |
| Gigabyte A5 X1 | |
| Gigabyte A5 X1 | |
| Gigabyte A5 X1 | |
| HP Omen 16-b0085ng | |
| Moyenne NVIDIA GeForce RTX 3070 Laptop GPU | |
| Schenker XMG Apex 15 NH57E PS | |
| MSI Katana GF66 11UG-220 -1! | |
| Acer Nitro 5 AN515-45-R1JH | |
| Gigabyte A5 X1 | |
| 3DMark 11 - 1280x720 Performance GPU | |
| Moyenne de la classe Gaming (21841 - 80022, n=120, 2 dernières années) | |
| Gigabyte A5 X1 | |
| HP Omen 16-b0085ng | |
| Gigabyte A5 X1 (Unterhaltungsmodus) | |
| Gigabyte A5 X1 (Lautlosmodus) | |
| Moyenne NVIDIA GeForce RTX 3070 Laptop GPU (12535 - 38275, n=54) | |
| MSI Katana GF66 11UG-220 | |
| Schenker XMG Apex 15 NH57E PS | |
| Acer Nitro 5 AN515-45-R1JH | |
| Gigabyte A5 X1 (Stromsparmodus) | |
| 3DMark | |
| 1920x1080 Fire Strike Graphics | |
| Moyenne de la classe Gaming (12242 - 62849, n=132, 2 dernières années) | |
| Gigabyte A5 X1 | |
| Gigabyte A5 X1 (Unterhaltungsmodus) | |
| Gigabyte A5 X1 (Lautlosmodus) | |
| HP Omen 16-b0085ng | |
| Moyenne NVIDIA GeForce RTX 3070 Laptop GPU (7178 - 29128, n=52) | |
| Schenker XMG Apex 15 NH57E PS | |
| Acer Nitro 5 AN515-45-R1JH | |
| Gigabyte A5 X1 (Stromsparmodus) | |
| 2560x1440 Time Spy Graphics | |
| Moyenne de la classe Gaming (5012 - 25984, n=130, 2 dernières années) | |
| Gigabyte A5 X1 | |
| HP Omen 16-b0085ng | |
| Gigabyte A5 X1 (Unterhaltungsmodus) | |
| Gigabyte A5 X1 (Lautlosmodus) | |
| Moyenne NVIDIA GeForce RTX 3070 Laptop GPU (2644 - 11019, n=53) | |
| Schenker XMG Apex 15 NH57E PS | |
| MSI Katana GF66 11UG-220 | |
| Acer Nitro 5 AN515-45-R1JH | |
| Gigabyte A5 X1 (Stromsparmodus) | |
Performances de jeu
L'ordinateur portable affiche tous les derniers jeux sans problème à la résolution Full HD (1920x1080 pixels) et aux paramètres de qualité maximum. Il serait également possible d'utiliser des résolutions plus élevées en connectant un moniteur adapté. Les fréquences d'images sont supérieures à la moyenne dans la comparaison avec la RTX 3070
| The Witcher 3 - 1920x1080 Ultra Graphics & Postprocessing (HBAO+) | |
| Moyenne de la classe Gaming (83.7 - 240, n=25, 2 dernières années) | |
| Gigabyte A5 X1 | |
| Gigabyte A5 X1 (Lautlosmodus) | |
| HP Omen 16-b0085ng | |
| Moyenne NVIDIA GeForce RTX 3070 Laptop GPU (34.9 - 109, n=52) | |
| Schenker XMG Apex 15 NH57E PS | |
| Acer Nitro 5 AN515-45-R1JH | |
| MSI Katana GF66 11UG-220 | |
| Gigabyte A5 X1 (Stromsparmodus) | |
| Dota 2 Reborn - 1920x1080 ultra (3/3) best looking | |
| Moyenne de la classe Gaming (84.8 - 248, n=124, 2 dernières années) | |
| HP Omen 16-b0085ng | |
| Gigabyte A5 X1 | |
| MSI Katana GF66 11UG-220 | |
| Moyenne NVIDIA GeForce RTX 3070 Laptop GPU (26.9 - 163.9, n=58) | |
| Schenker XMG Apex 15 NH57E PS | |
| Gigabyte A5 X1 (Lautlosmodus) | |
| Gigabyte A5 X1 (Unterhaltungsmodus) | |
| Gigabyte A5 X1 (Stromsparmodus) | |
| Acer Nitro 5 AN515-45-R1JH | |
| X-Plane 11.11 - 1920x1080 high (fps_test=3) | |
| Moyenne de la classe Gaming (52.1 - 144.5, n=127, 2 dernières années) | |
| HP Omen 16-b0085ng | |
| Moyenne NVIDIA GeForce RTX 3070 Laptop GPU (12.4 - 118.8, n=61) | |
| MSI Katana GF66 11UG-220 | |
| MSI Katana GF66 11UG-220 | |
| Schenker XMG Apex 15 NH57E PS | |
| Gigabyte A5 X1 | |
| Gigabyte A5 X1 (Unterhaltungsmodus) | |
| Gigabyte A5 X1 (Lautlosmodus) | |
| Gigabyte A5 X1 (Stromsparmodus) | |
| Acer Nitro 5 AN515-45-R1JH | |
| Final Fantasy XV Benchmark - 1920x1080 High Quality | |
| Moyenne de la classe Gaming (41 - 215, n=116, 2 dernières années) | |
| Gigabyte A5 X1 (1.3) | |
| Gigabyte A5 X1 (1.3, Unterhaltungsmodus) | |
| Moyenne NVIDIA GeForce RTX 3070 Laptop GPU (27.9 - 107, n=49) | |
| Acer Nitro 5 AN515-45-R1JH (1.3) | |
| Gigabyte A5 X1 (1.3, Lautlosmodus) | |
| MSI Katana GF66 11UG-220 (1.3) | |
| Gigabyte A5 X1 (1.3, Stromsparmodus) | |
| GTA V - 1920x1080 Highest AA:4xMSAA + FX AF:16x | |
| Moyenne de la classe Gaming (48.3 - 186.9, n=112, 2 dernières années) | |
| HP Omen 16-b0085ng | |
| Gigabyte A5 X1 | |
| MSI Katana GF66 11UG-220 | |
| Gigabyte A5 X1 (Unterhaltungsmodus) | |
| Gigabyte A5 X1 (Lautlosmodus) | |
| Moyenne NVIDIA GeForce RTX 3070 Laptop GPU (21.7 - 125.8, n=50) | |
| Gigabyte A5 X1 (Stromsparmodus) | |
| Schenker XMG Apex 15 NH57E PS | |
| Acer Nitro 5 AN515-45-R1JH | |
| Strange Brigade - 1920x1080 ultra AA:ultra AF:16 | |
| Moyenne de la classe Gaming (76.3 - 456, n=106, 2 dernières années) | |
| HP Omen 16-b0085ng (1.47.22.14 D3D12) | |
| Gigabyte A5 X1 (1.47.22.14 D3D12, Lautlosmodus) | |
| Gigabyte A5 X1 (1.47.22.14 D3D12) | |
| Moyenne NVIDIA GeForce RTX 3070 Laptop GPU (36.2 - 194, n=46) | |
| Schenker XMG Apex 15 NH57E PS (1.47.22.14 D3D12) | |
| MSI Katana GF66 11UG-220 (1.47.22.14 D3D12) | |
| Acer Nitro 5 AN515-45-R1JH (1.47.22.14 D3D12) | |
| F1 2021 - 1920x1080 Ultra High Preset + Raytracing AA:T AF:16x | |
| Gigabyte A5 X1 (831795) | |
| Gigabyte A5 X1 (831795, Unterhaltungsmodus) | |
| Gigabyte A5 X1 (831795, Lautlosmodus) | |
| Moyenne NVIDIA GeForce RTX 3070 Laptop GPU (33.1 - 123.1, n=23) | |
| MSI Katana GF66 11UG-220 (800360) | |
| Gigabyte A5 X1 (831795, Stromsparmodus) | |
| Far Cry 6 | |
| 1920x1080 Ultra Graphics Quality + HD Textures AA:T | |
| Moyenne de la classe Gaming (96.3 - 156, n=4, 2 dernières années) | |
| Moyenne NVIDIA GeForce RTX 3070 Laptop GPU (74 - 102.3, n=5) | |
| Gigabyte A5 X1 | |
| 1920x1080 Ultra Graphics Quality + HD Textures + DXR AA:T | |
| Moyenne de la classe Gaming (n=12 dernières années) | |
| Gigabyte A5 X1 | |
| Moyenne NVIDIA GeForce RTX 3070 Laptop GPU (19.1 - 69, n=3) | |
| Riders Republic - 1920x1080 Ultra Preset | |
| Moyenne NVIDIA GeForce RTX 3070 Laptop GPU (98 - 111, n=4) | |
| Gigabyte A5 X1 | |
| Forza Horizon 5 - 1920x1080 Extreme Preset | |
| Moyenne NVIDIA GeForce RTX 3070 Laptop GPU (75 - 86, n=5) | |
| Gigabyte A5 X1 | |
| Battlefield 2042 | |
| 1920x1080 Ultra Preset | |
| Moyenne NVIDIA GeForce RTX 3070 Laptop GPU (86.6 - 102, n=2) | |
| Gigabyte A5 X1 | |
| 1920x1080 Ultra Preset + Ray Tracing | |
| Moyenne NVIDIA GeForce RTX 3070 Laptop GPU (69.3 - 81.7, n=2) | |
| Gigabyte A5 X1 | |
| Halo Infinite - 1920x1080 Ultra Preset | |
| Moyenne NVIDIA GeForce RTX 3070 Laptop GPU (90.1 - 102, n=2) | |
| Gigabyte A5 X1 | |
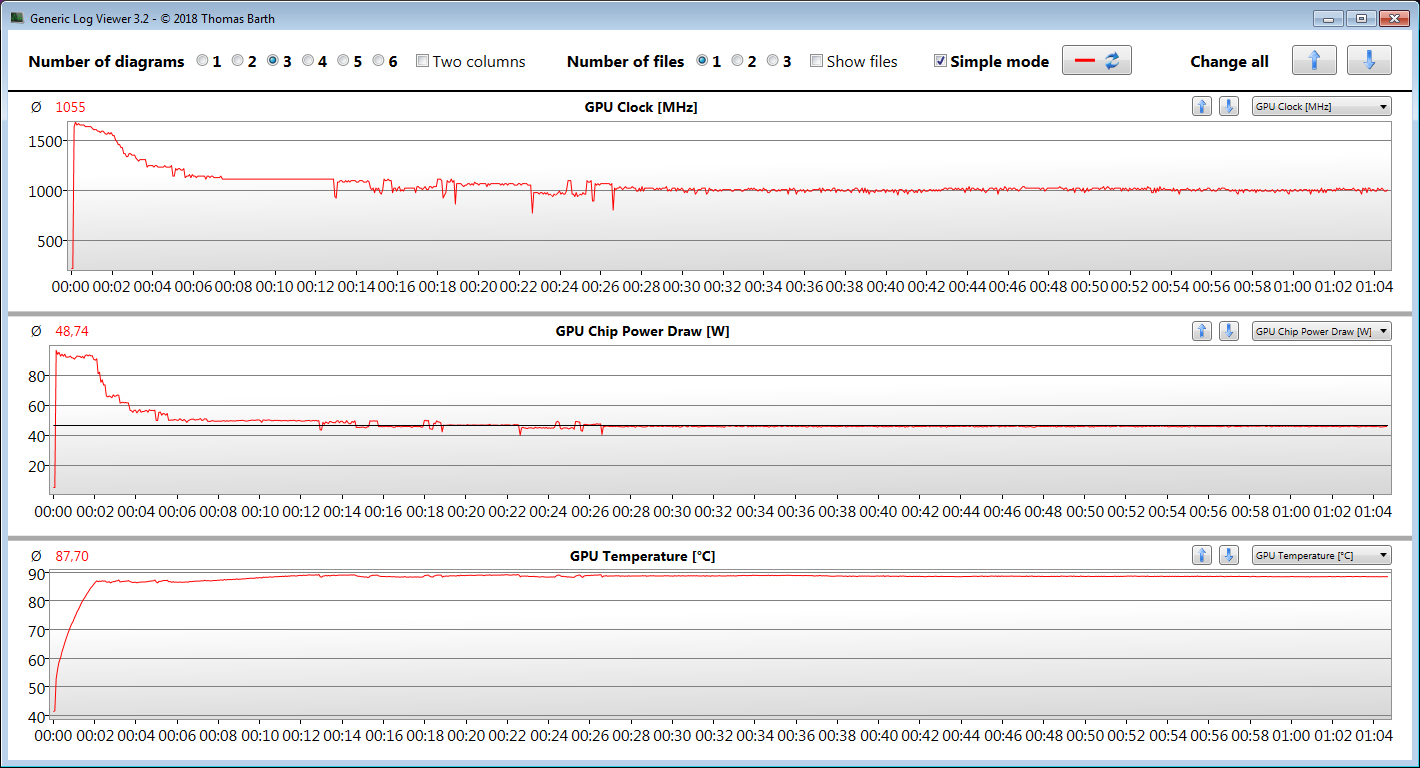
Afin de vérifier si les fréquences d'images restent largement constantes sur une période prolongée, nous avons laissé le jeu The Witcher 3 tourner pendant environ 60 minutes en résolution Full HD et avec les paramètres de qualité maximum. Le personnage n'est pas déplacé. Une baisse des taux d'images n'a pas été constatée
The Witcher 3 FPS diagram
| Bas | Moyen | Élevé | Ultra | |
|---|---|---|---|---|
| GTA V (2015) | 179 | 172 | 155 | 94.7 |
| The Witcher 3 (2015) | 309 | 261 | 171 | 101 |
| Dota 2 Reborn (2015) | 152 | 146 | 131 | 124 |
| Final Fantasy XV Benchmark (2018) | 170 | 127 | 95.4 | |
| X-Plane 11.11 (2018) | 103 | 90 | 75.7 | |
| Far Cry 5 (2018) | 137 | 118 | 114 | 107 |
| Strange Brigade (2018) | 334 | 195 | 179 | 169 |
| F1 2021 (2021) | 291 | 199 | 171 | 114 |
| Far Cry 6 (2021) | 119 | 101 | 91 | 84 |
| Riders Republic (2021) | 163 | 122 | 106 | 98 |
| Forza Horizon 5 (2021) | 191 | 120 | 109 | 75 |
| Battlefield 2042 (2021) | 134 | 107 | 95.5 | 86.6 |
| Halo Infinite (2021) | 106 | 93.9 | 90.1 |
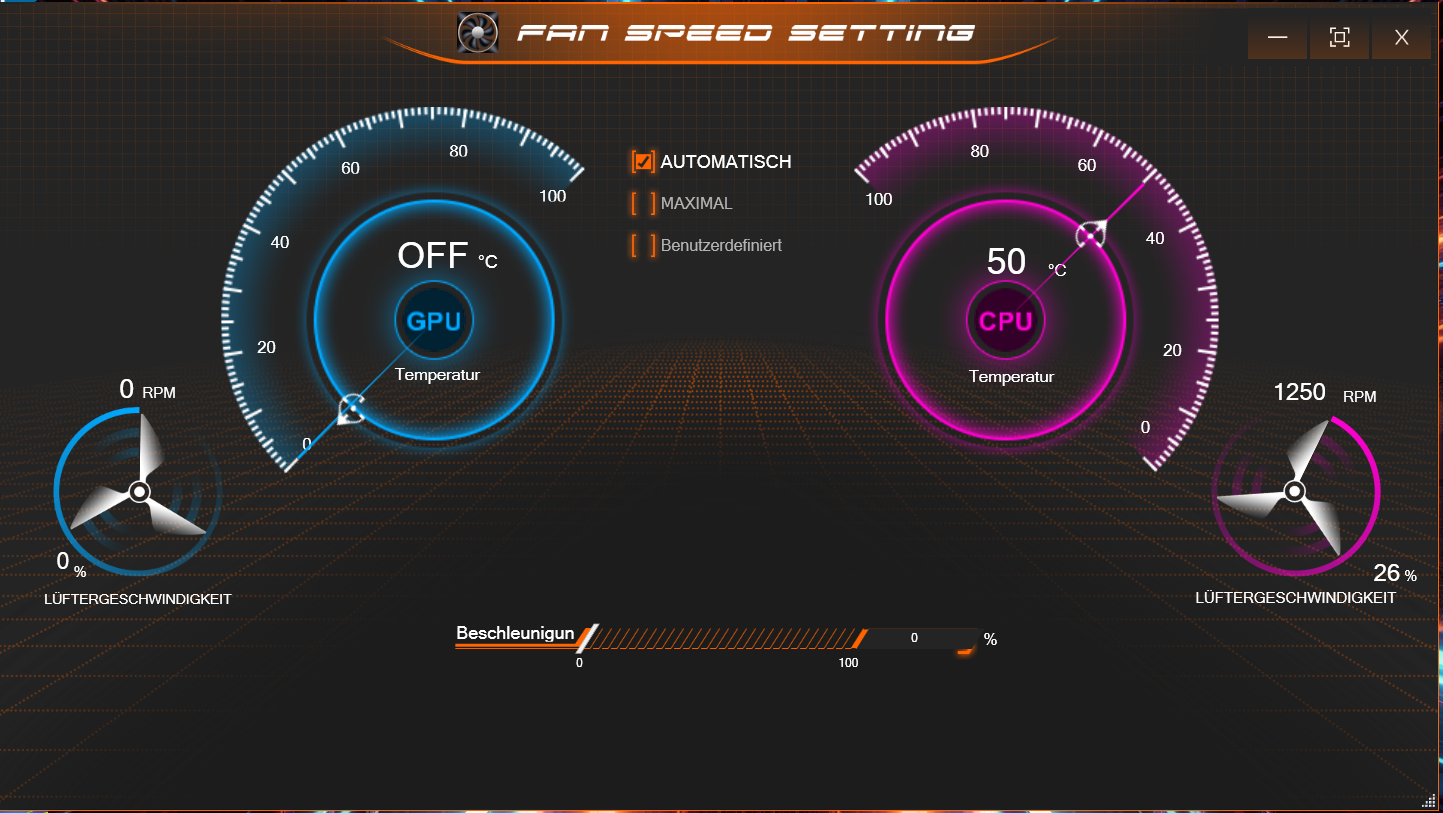
Émissions - Le X1 produit beaucoup de bruit en charge
Émissions sonores
Les deux ventilateurs ne génèrent normalement que peu de bruit dans l'utilisation quotidienne (bureau, Internet). Cependant, ils se mettent parfois en marche inutilement - le niveau de pression acoustique peut atteindre des valeurs supérieures à 40 dB(A). Gigabyte devrait procéder à des ajustements supplémentaires à cet égard. Avec un maximum de 58 dB(A) (test de stress) et 56 dB(A) (notre test The Witcher 3 ), les choses deviennent assez bruyantes sous charge. LeOmen 16 ne fait que légèrement mieux que le A5. LeMSI Katana GF66 est considérablement plus silencieux.
Le niveau sonore en charge peut être réduit de manière significative en utilisant le profil de performance "Silent Mode". Dans ce cas, les ventilateurs tournent à très basse vitesse et n'émettent qu'un léger sifflement. Alors que le CPU peut encore fonctionner à des fréquences d'horloge élevées en continu dans ce scénario, la vitesse d'horloge du GPU est réduite assez rapidement pour des raisons thermiques. C'est ce qu'illustre notre test The Witcher 3. Néanmoins, les jeux sont toujours possibles, mais avec des paramètres réduits.
Degré de la nuisance sonore
| Au repos |
| 27 / 29 / 32 dB(A) |
| Fortement sollicité |
| 57 / 58 dB(A) |
 | ||
30 dB silencieux 40 dB(A) audible 50 dB(A) bruyant |
||
min: | ||
| Gigabyte A5 X1 GeForce RTX 3070 Laptop GPU, R9 5900HX | HP Omen 16-b0085ng GeForce RTX 3070 Laptop GPU, i7-11800H | MSI Katana GF66 11UG-220 GeForce RTX 3070 Laptop GPU, i7-11800H | Acer Nitro 5 AN515-45-R1JH GeForce RTX 3070 Laptop GPU, R7 5800H | Schenker XMG Apex 15 NH57E PS GeForce RTX 3060 Laptop GPU, R7 5800H | |
|---|---|---|---|---|---|
| Noise | 12% | -1% | 9% | 14% | |
| arrêt / environnement * (dB) | 25 | 23 8% | 25 -0% | 25 -0% | 23 8% |
| Idle Minimum * (dB) | 27 | 23 15% | 34 -26% | 25 7% | 23 15% |
| Idle Average * (dB) | 29 | 23 21% | 35 -21% | 25 14% | 23 21% |
| Idle Maximum * (dB) | 32 | 34.81 -9% | 36 -13% | 32.2 -1% | 26.4 17% |
| Load Average * (dB) | 57 | 35.02 39% | 48 16% | 45.8 20% | 34.25 40% |
| Witcher 3 ultra * (dB) | 56 | 52 7% | 46 18% | 58.4 -4% | |
| Load Maximum * (dB) | 58 | 56 3% | 49 16% | 49.1 15% | 58.42 -1% |
* ... Moindre est la valeur, meilleures sont les performances
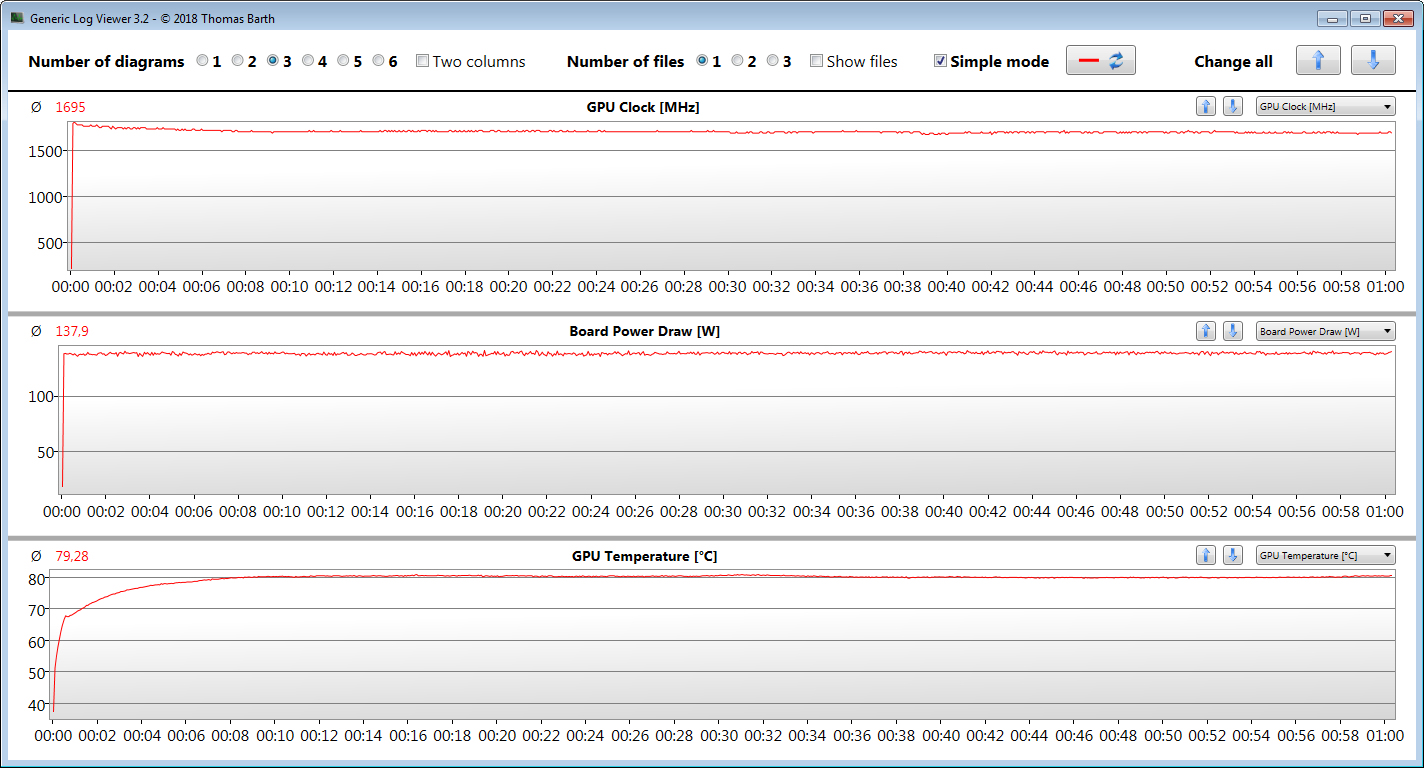
Température
Les températures du boîtier restent dans la zone verte en utilisation quotidienne (bureau, Internet). Sous charge (test de stress, notre test The Witcher 3 ), l'ordinateur portable chauffe sensiblement, mais pas excessivement. Dans les cas extrêmes, le processeur chauffe à plus de 90 °C (~194 °F)
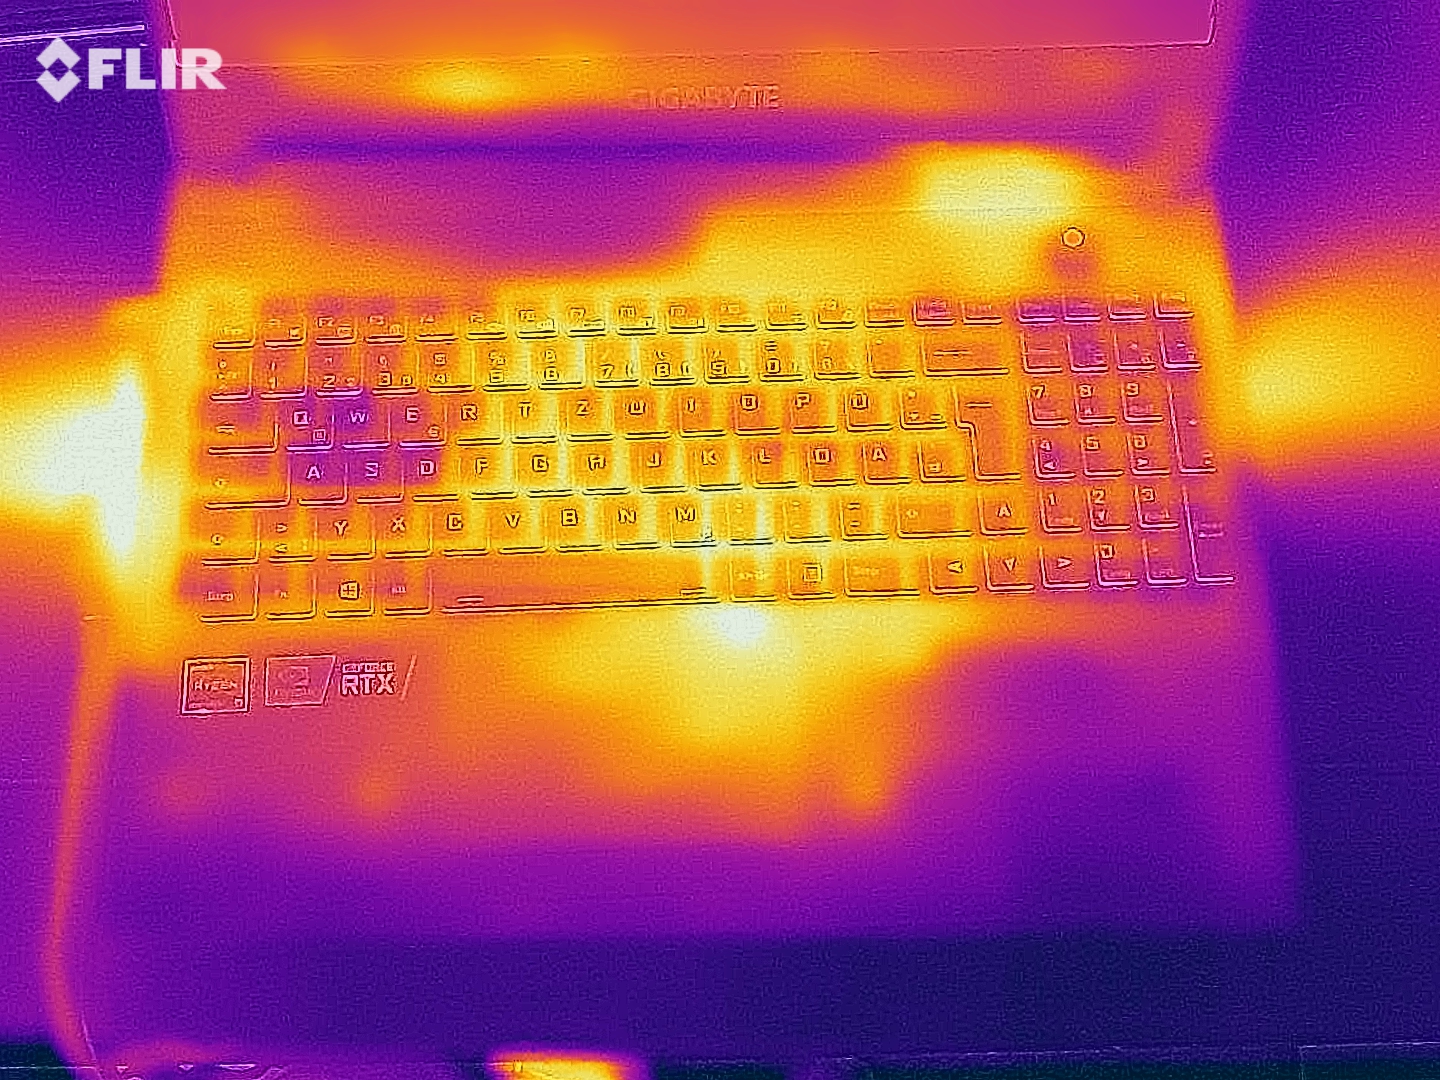
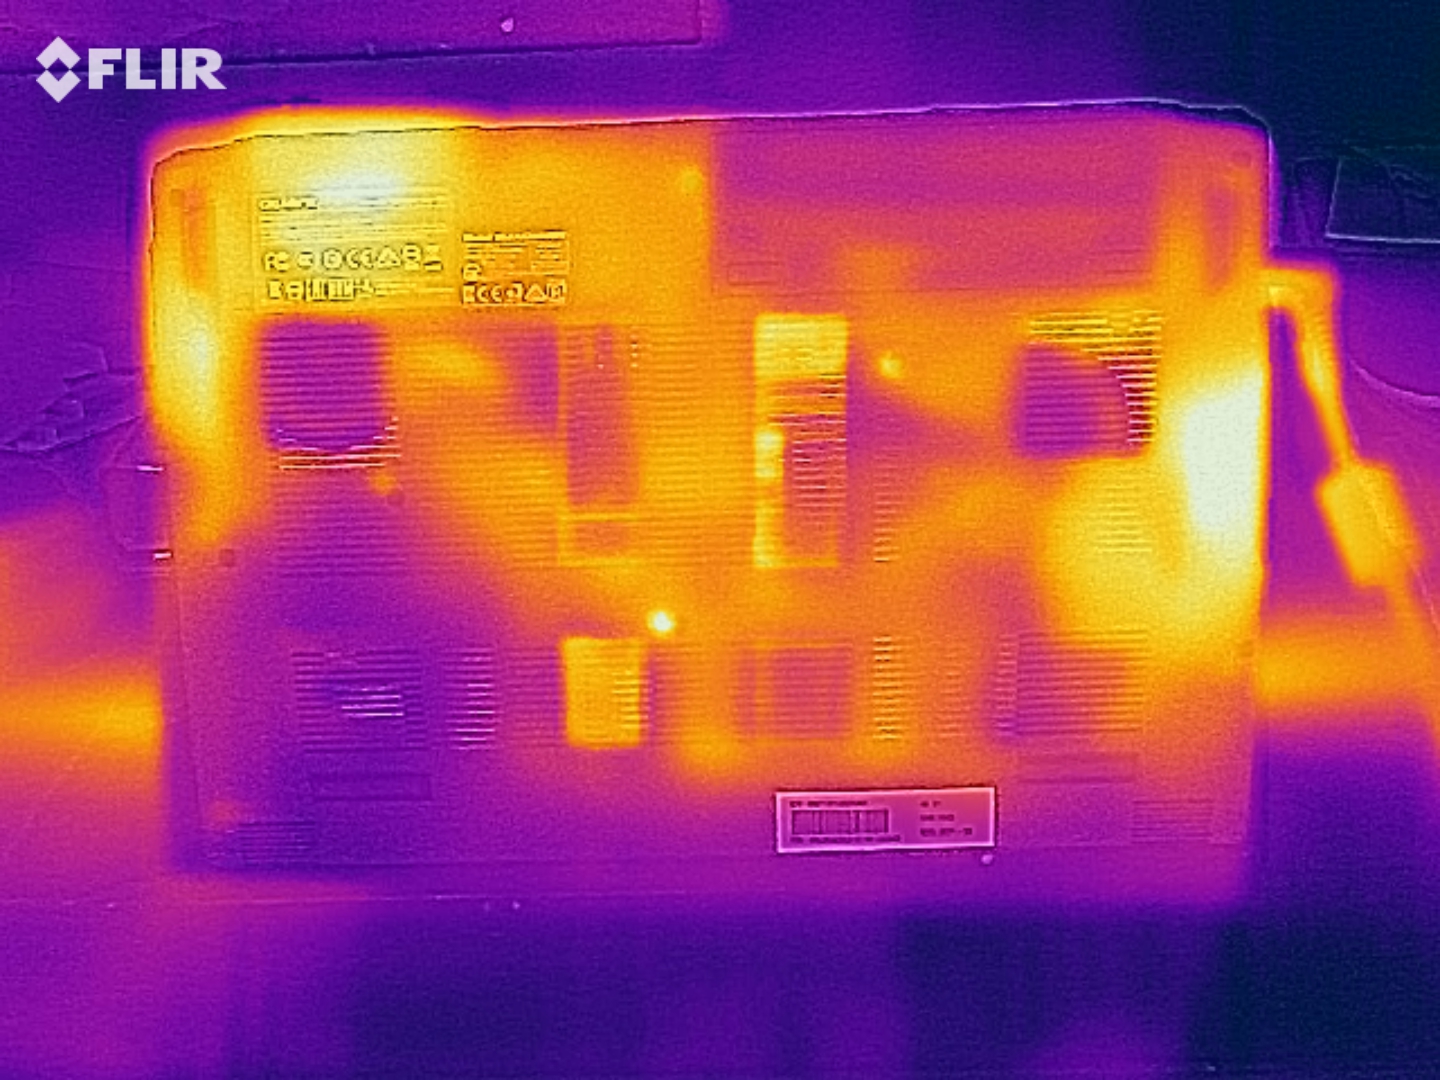
(-) La température maximale du côté supérieur est de 47 °C / 117 F, par rapport à la moyenne de 40.4 °C / 105 F, allant de 21.2 à 68.8 °C pour la classe Gaming.
(-) Le fond chauffe jusqu'à un maximum de 51 °C / 124 F, contre une moyenne de 43.3 °C / 110 F
(+) En utilisation inactive, la température moyenne du côté supérieur est de 25.9 °C / 79 F, par rapport à la moyenne du dispositif de 33.9 °C / 93 F.
(-) En jouant à The Witcher 3, la température moyenne du côté supérieur est de 44.4 °C / 112 F, alors que la moyenne de l'appareil est de 33.9 °C / 93 F.
(-) Les repose-poignets et le pavé tactile peuvent devenir très chauds au toucher, avec un maximum de 47 °C / 116.6# F.
(-) La température moyenne de la zone de l'appui-paume de dispositifs similaires était de 28.8 °C / 83.8 F (-18.2 °C / #-32.8 F).
| Gigabyte A5 X1 AMD Ryzen 9 5900HX, NVIDIA GeForce RTX 3070 Laptop GPU | HP Omen 16-b0085ng Intel Core i7-11800H, NVIDIA GeForce RTX 3070 Laptop GPU | MSI Katana GF66 11UG-220 Intel Core i7-11800H, NVIDIA GeForce RTX 3070 Laptop GPU | Acer Nitro 5 AN515-45-R1JH AMD Ryzen 7 5800H, NVIDIA GeForce RTX 3070 Laptop GPU | Schenker XMG Apex 15 NH57E PS AMD Ryzen 7 5800H, NVIDIA GeForce RTX 3060 Laptop GPU | |
|---|---|---|---|---|---|
| Heat | -16% | -10% | -10% | 6% | |
| Maximum Upper Side * (°C) | 47 | 48 -2% | 56 -19% | 53.2 -13% | 36 23% |
| Maximum Bottom * (°C) | 51 | 55 -8% | 49 4% | 58.2 -14% | 38 25% |
| Idle Upper Side * (°C) | 27 | 33 -22% | 36 -33% | 29.5 -9% | 31 -15% |
| Idle Bottom * (°C) | 30 | 39 -30% | 28 7% | 31.2 -4% | 33 -10% |
* ... Moindre est la valeur, meilleures sont les performances
Test de stress
Le CPU et le GPU terminent le test de résistance (Prime95 et FurMark fonctionnent pendant au moins une heure) à 3,8 GHz et environ 1 755 MHz, respectivement. Le test de stress représente un scénario extrême. Avec ce test, nous vérifions si le système reste stable à pleine charge
Haut-parleurs
Les haut-parleurs stéréo produisent un son décent qui manque de basses. Le volume maximal devrait cependant être plus élevé. Des écouteurs ou des haut-parleurs externes sont recommandés pour une meilleure expérience sonore
Gigabyte A5 X1 analyse audio
(±) | le niveau sonore du haut-parleur est moyen mais bon (80# dB)
Basses 100 - 315 Hz
(-) | presque aucune basse - en moyenne 22% plus bas que la médiane
(±) | la linéarité des basses est moyenne (12.5% delta à la fréquence précédente)
Médiums 400 - 2000 Hz
(+) | médiane équilibrée - seulement 1.9% de la médiane
(+) | les médiums sont linéaires (6% delta à la fréquence précédente)
Aiguës 2 - 16 kHz
(+) | des sommets équilibrés - à seulement 4.2% de la médiane
(+) | les aigus sont linéaires (6% delta à la fréquence précédente)
Globalement 100 - 16 000 Hz
(±) | la linéarité du son global est moyenne (17% de différence avec la médiane)
Par rapport à la même classe
» 44% de tous les appareils testés de cette catégorie étaient meilleurs, 12% similaires, 44% pires
» Le meilleur avait un delta de 6%, la moyenne était de 18%, le pire était de 132%.
Par rapport à tous les appareils testés
» 30% de tous les appareils testés étaient meilleurs, 8% similaires, 62% pires
» Le meilleur avait un delta de 4%, la moyenne était de 24%, le pire était de 134%.
Gestion de l'énergie - L'ordinateur portable Gigabyte offre une autonomie de batterie décente
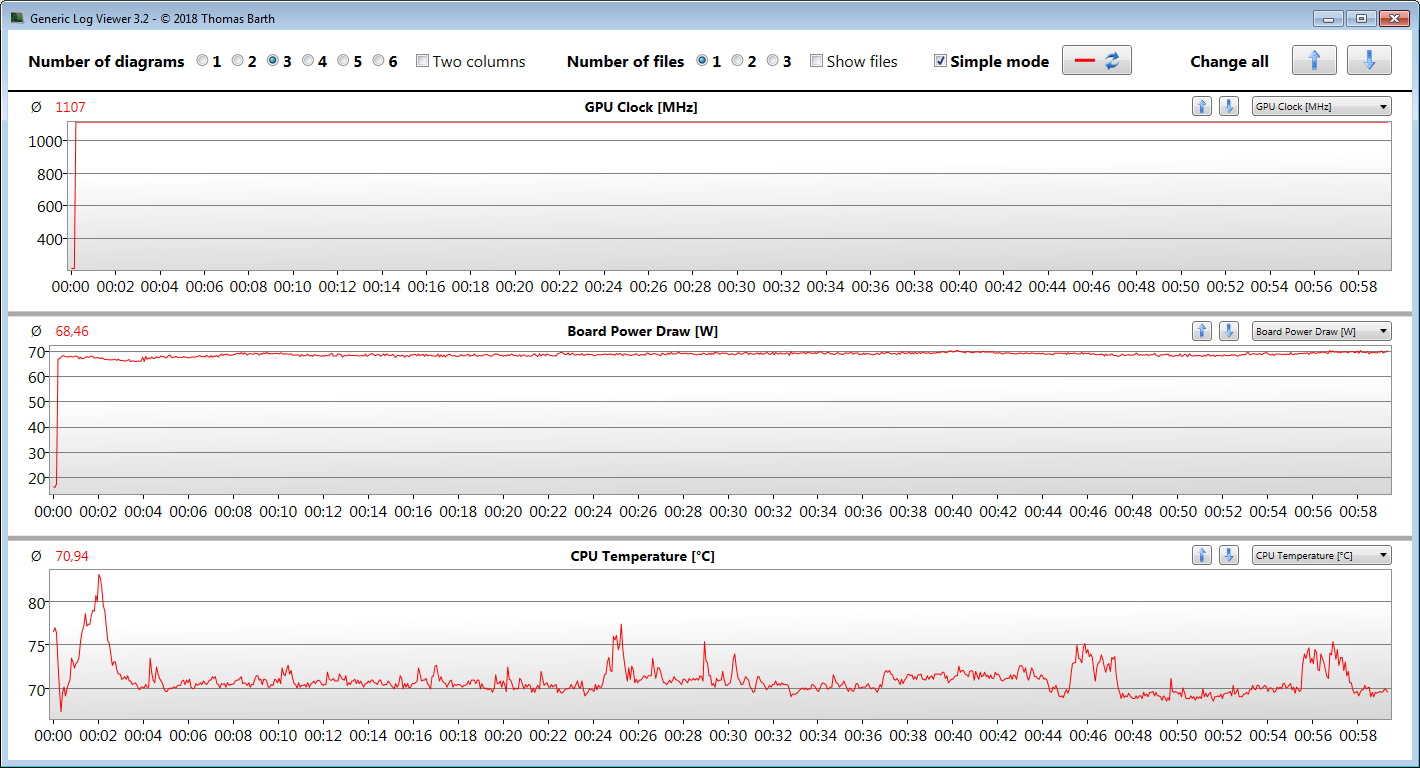
Consommation d'énergie
En utilisation inactive ou sous faible charge, la consommation d'énergie de l'A5 est normale pour le matériel installé ici - la concurrence basée sur Intel exige un peu plus d'énergie dans certains cas. Le test de stress et notre test The Witcher 3 augmentent la consommation d'énergie de l'ordinateur portable Gigabyte jusqu'à 272 watts et une moyenne de 204 watts, respectivement. Cela en fait l'appareil le plus gourmand en énergie dans notre champ de comparaison. Comme la batterie ne s'est pas vidée, l'adaptateur secteur fourni (puissance nominale : 230 watts) semble être d'une capacité suffisante. Les graphiques suivants illustrent la consommation d'énergie relativement constante de l'ordinateur portable pendant le test de stress et notre test The Witcher 3
| Éteint/en veille | |
| Au repos | |
| Fortement sollicité |
|
Légende:
min: | |
| Gigabyte A5 X1 R9 5900HX, GeForce RTX 3070 Laptop GPU | HP Omen 16-b0085ng i7-11800H, GeForce RTX 3070 Laptop GPU | MSI Katana GF66 11UG-220 i7-11800H, GeForce RTX 3070 Laptop GPU | Acer Nitro 5 AN515-45-R1JH R7 5800H, GeForce RTX 3070 Laptop GPU | Schenker XMG Apex 15 NH57E PS R7 5800H, GeForce RTX 3060 Laptop GPU | Moyenne NVIDIA GeForce RTX 3070 Laptop GPU | Moyenne de la classe Gaming | |
|---|---|---|---|---|---|---|---|
| Power Consumption | -4% | 11% | 13% | 3% | -35% | -26% | |
| Idle Minimum * (Watt) | 10 | 12 -20% | 8 20% | 8.8 12% | 10.5 -5% | 15.6 ? -56% | 13.5 ? -35% |
| Idle Average * (Watt) | 12 | 18 -50% | 12 -0% | 13 -8% | 15 -25% | 20.1 ? -68% | 19.2 ? -60% |
| Idle Maximum * (Watt) | 16 | 21 -31% | 22 -38% | 14.6 9% | 17 -6% | 29.4 ? -84% | 24.6 ? -54% |
| Load Average * (Watt) | 124 | 94 24% | 98 21% | 133 -7% | 109 12% | 110.8 ? 11% | 108.4 ? 13% |
| Witcher 3 ultra * (Watt) | 204 | 147 28% | 152 25% | 134 34% | 186 9% | ||
| Load Maximum * (Watt) | 272 | 199 27% | 162 40% | 164 40% | 186 32% | 214 ? 21% | 254 ? 7% |
* ... Moindre est la valeur, meilleures sont les performances
The Witcher 3 energy consumption
Energy consumption with an external monitor
Durée de vie de la batterie
L'ordinateur de 15,6 pouces atteint des durées d'exécution de 6:21 heures et 7:15 heures dans le test Wi-Fi (accès à des sites Web via un script) et le test vidéo (court-métrage Big Buck Bunny (encodage H.264, Full HD) tournant en boucle), respectivement. Les fonctions d'économie d'énergie de l'ordinateur portable sont désactivées pendant les deux tests, et la luminosité de l'écran est réglée à environ 150 cd/m². En outre, les modules sans fil sont désactivés pour le test vidéo
| Gigabyte A5 X1 R9 5900HX, GeForce RTX 3070 Laptop GPU, 48.96 Wh | HP Omen 16-b0085ng i7-11800H, GeForce RTX 3070 Laptop GPU, 83 Wh | MSI Katana GF66 11UG-220 i7-11800H, GeForce RTX 3070 Laptop GPU, 90 Wh | Acer Nitro 5 AN515-45-R1JH R7 5800H, GeForce RTX 3070 Laptop GPU, 57.5 Wh | Schenker XMG Apex 15 NH57E PS R7 5800H, GeForce RTX 3060 Laptop GPU, 49 Wh | Moyenne de la classe Gaming | |
|---|---|---|---|---|---|---|
| Autonomie de la batterie | 0% | -12% | -12% | -9% | 6% | |
| Reader / Idle (h) | 10.1 | 9.1 -10% | 9.2 -9% | 9.1 ? -10% | ||
| H.264 (h) | 7.3 | 5.4 -26% | 6.9 -5% | 4.6 -37% | 8.02 ? 10% | |
| WiFi v1.3 (h) | 6.4 | 7.6 19% | 5.3 -17% | 5.7 -11% | 6.5 2% | 6.83 ? 7% |
| Load (h) | 1.3 | 1.4 8% | 1.2 -8% | 1 -23% | 1.4 8% | 1.512 ? 16% |
Points positifs
Points négatifs
Verdict - L'A5 X1 fait ce qu'il est censé faire
Le siteAPU Ryzen 9 5900HXet leGeForce RTX 3070 laptop GPU (TGP max. : 140 watts) permettent aux jeux les plus récents de s'afficher en douceur sur l'écran Full HD avec tous les détails. Des résolutions supérieures à Full HD sont également possibles si un moniteur approprié est connecté. Le CPU et le GPU fonctionnent à des fréquences d'horloge élevées et constantes
Avec le A5 X1, Gigabyte propose un ordinateur portable de jeu solide.
Le portable chauffe sensiblement sous charge, mais pas de manière excessive. Le développement du bruit est en ligne avec la classe : L'ordinateur portable est bruyant sous charge. Le profil énergétique "Silent Mode" permet de réduire considérablement le bruit. La puissance de calcul réduite qui en résulte est encore suffisante pour les jeux - avec quelques compromis
La faible capacité de stockage (512 Go) peut être étendue avec un deuxième SSD M.2 et/ou un disque dur de 2,5 pouces. L'écran mat et stable en angle de vision (Full HD, IPS, 240 Hz) marque des points en termes de luminosité, de reproduction des couleurs et de couverture de l'espace coloré. En revanche, son contraste est trop faible. L'autonomie de la batterie est parfaite. Il est dommage que la batterie ne puisse pas être chargée via l'USB-C
Une alternative au A5 X1 serait le HP Omen 16. Il offre un écran légèrement plus grand et Thunderbolt 4, mais l'ordinateur portable HP peut à peine tirer parti de sa batterie beaucoup plus grande (83 Wh).
Prix et disponibilité
Au moment d'écrire ces lignes, le Gigabyte A5 X1 est disponible sur Amazon dans la configuration que nous avons testée (Ryzen 9 5900HX, GeForce RTX 3070, 16 Go de RAM, 512 Go SSD) au prix actuellement réduit de 1699 $ sur https://www.amazon.com/GIGABYTE-A5-SSD-Windows-Home-Gaming-X1-CUS2130SH/dp/B09GP88NBY/?tag=nbcreviewsnet-20
Gigabyte A5 X1
- 01/03/2022 v7 (old)
Sascha Mölck
Price comparison

