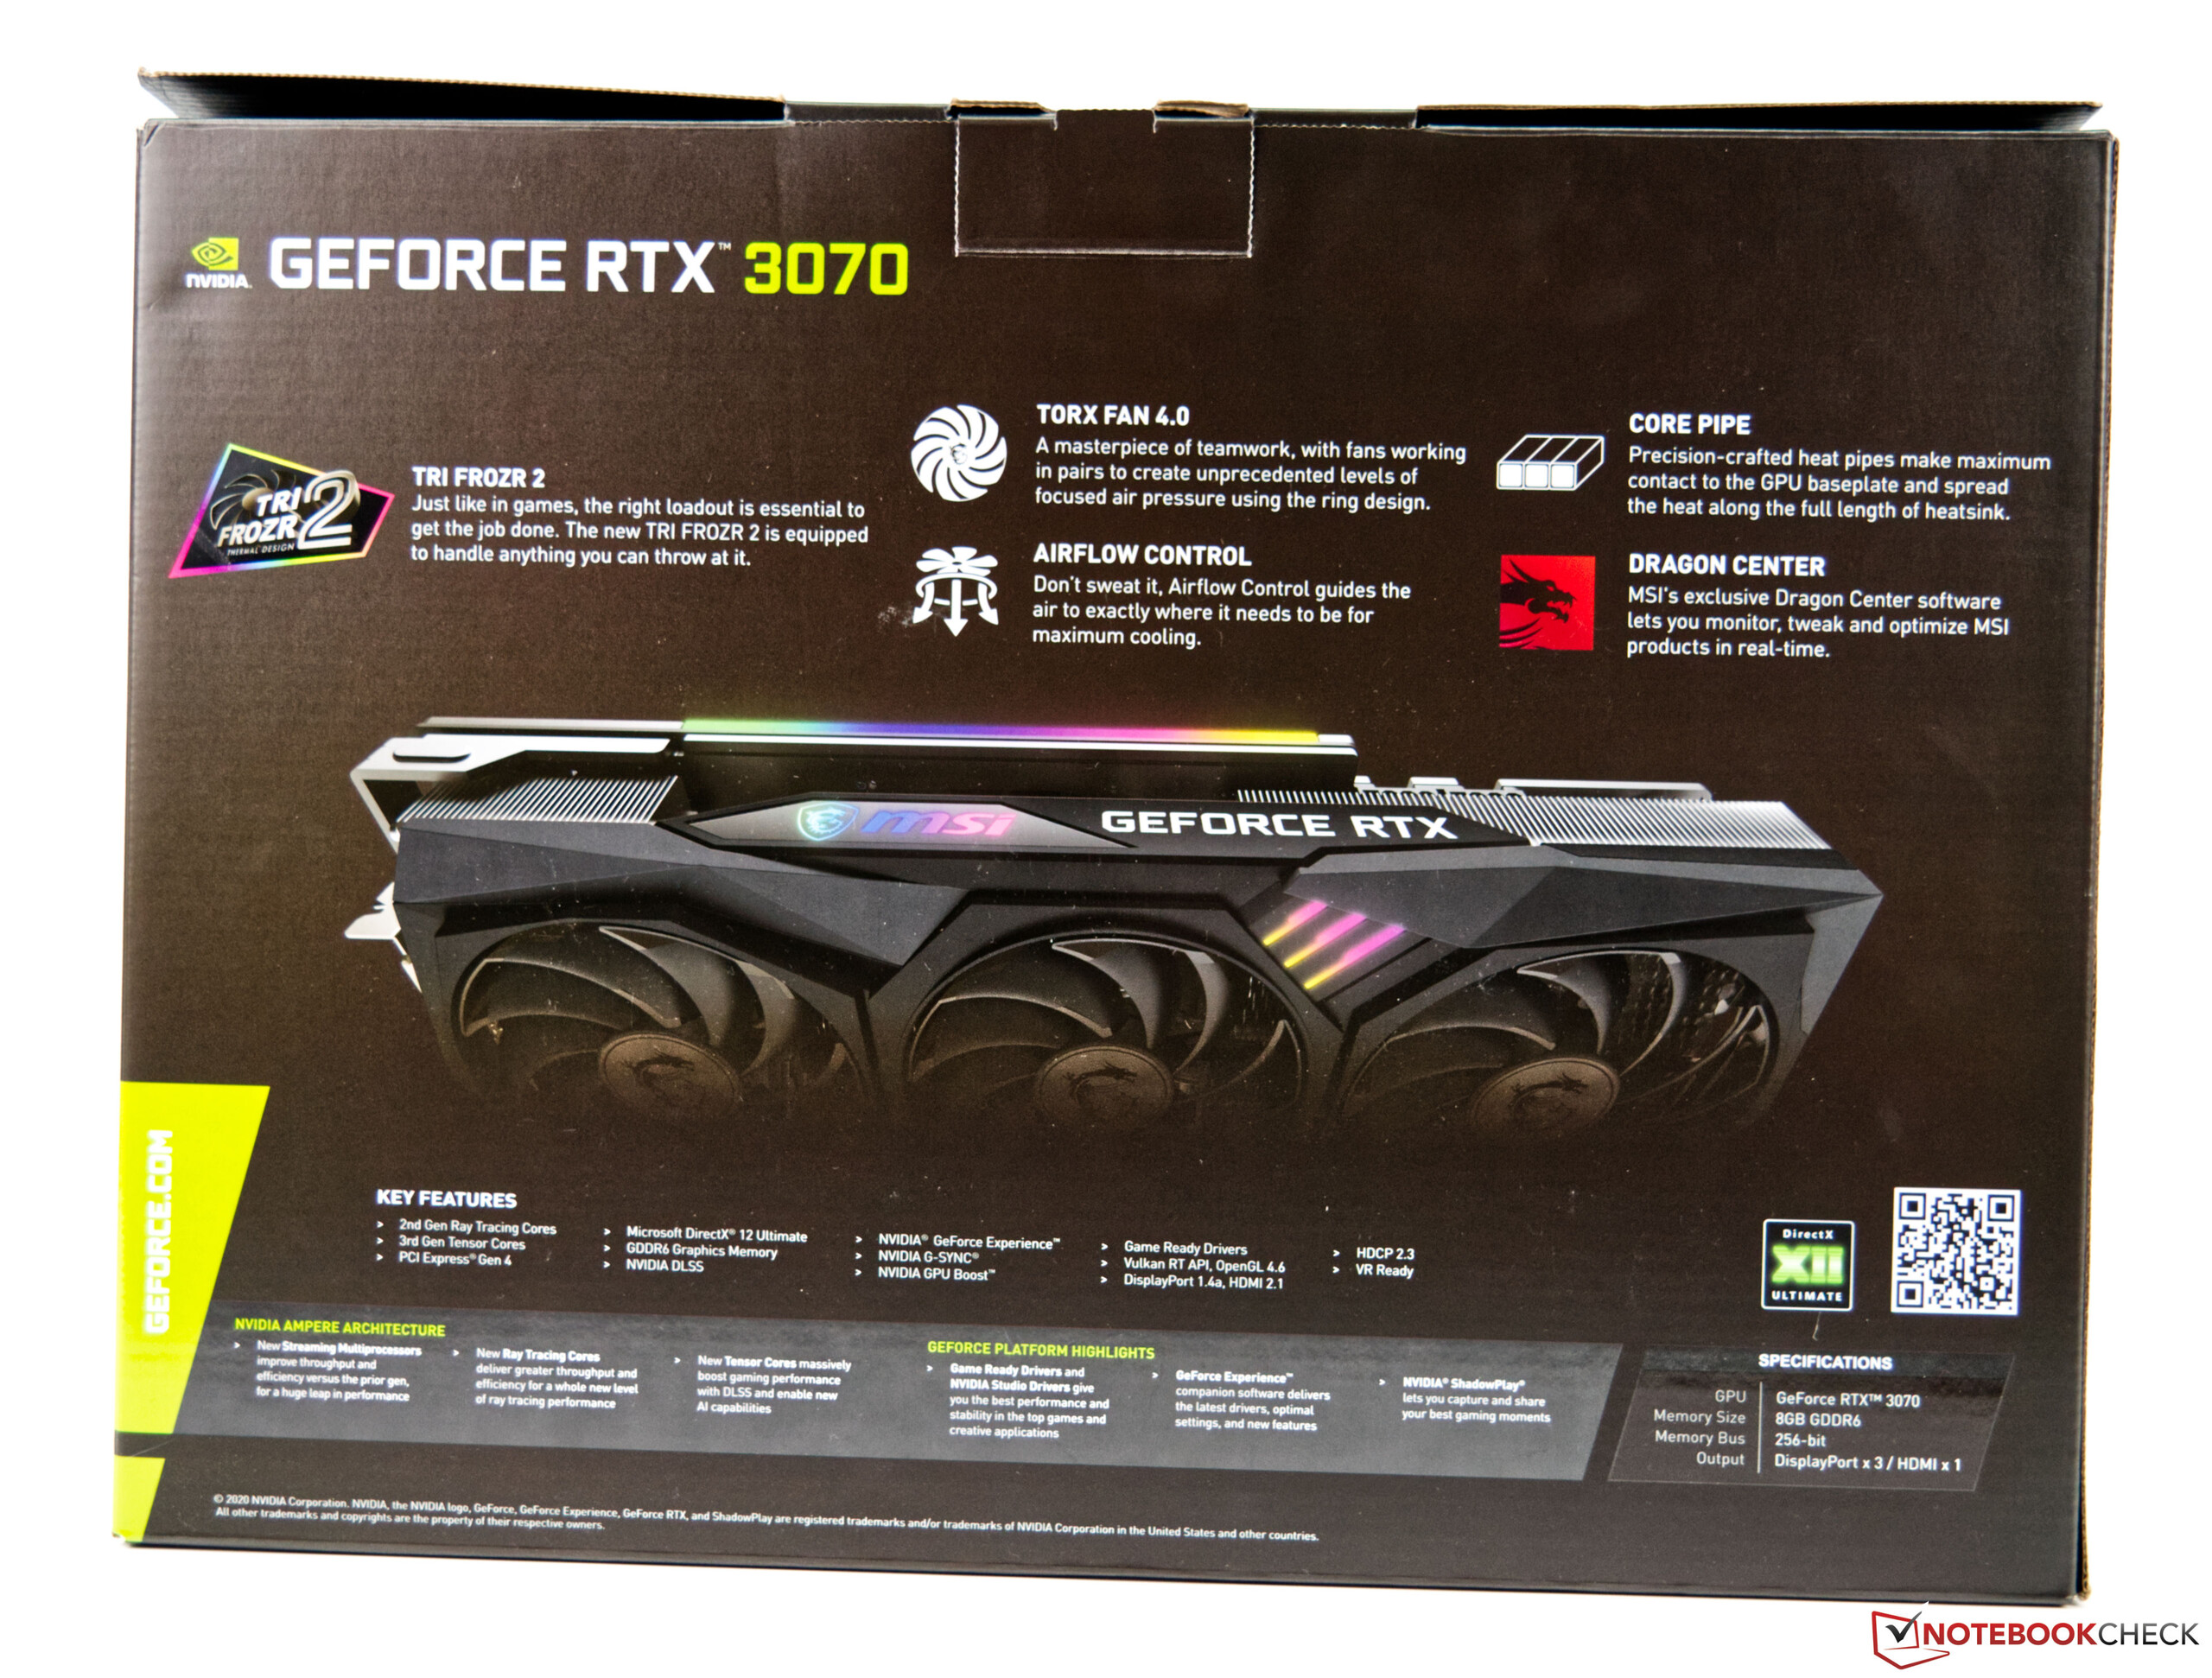
La carte graphique de bureau MSI GeForce RTX 3070 Gaming X Trio en test

L'architecture Ampère a fait ses débuts au début de l'année, bien qu'initialement seulement pour le marché des serveurs. Les appareils de jeu basés sur les nouvelles puces fabriquées en 8 nm sont arrivés ensuite. Après les premiers tests, certains d'entre eux ont largement dépassé les performances des cartes graphiques de Turing. Selon le cas d'application, Ampere offre jusqu'à 30% de performances en plus que Turing.
Ainsi, la GeForce RTX 3070, en tant que successeur de la GeForce 2070 SuperLe système de gestion de l'information, qui est un système de gestion de l'information, est relativement léger, car les performances sont nettement supérieures et comparables à celles d'un système de gestion de l'information de l GeForce RTX 2080 Ti. Inversement, cela signifie plus de performances pour un prix plus bas pour les clients, car le GeForce RTX 2080 Ti coûte 999 euros (~1 189 $) à la sortie, tandis que Nvidia facture 499 euros (~594 $) pour le RTX 3070 Founders Edition. Selon le modèle personnalisé, les prix ont augmenté en raison de meilleures solutions de refroidissement. Cela s'applique également à la génération actuelle, car notre GeForce RTX 3070 Gaming X Trio de MSI coûte actuellement un peu moins de 720 euros (~$857), alors qu'il est encore disponible. Cela nous amène directement au sujet suivant, car la rareté des stocks a provoqué une augmentation supplémentaire des prix depuis la sortie. Mais il n'y a pas que Nvidia qui ressent le mécontentement des clients, puisque AMD est également aux prises avec ce problème. Malheureusement, il est actuellement impossible de dire quand cette situation va s'améliorer.
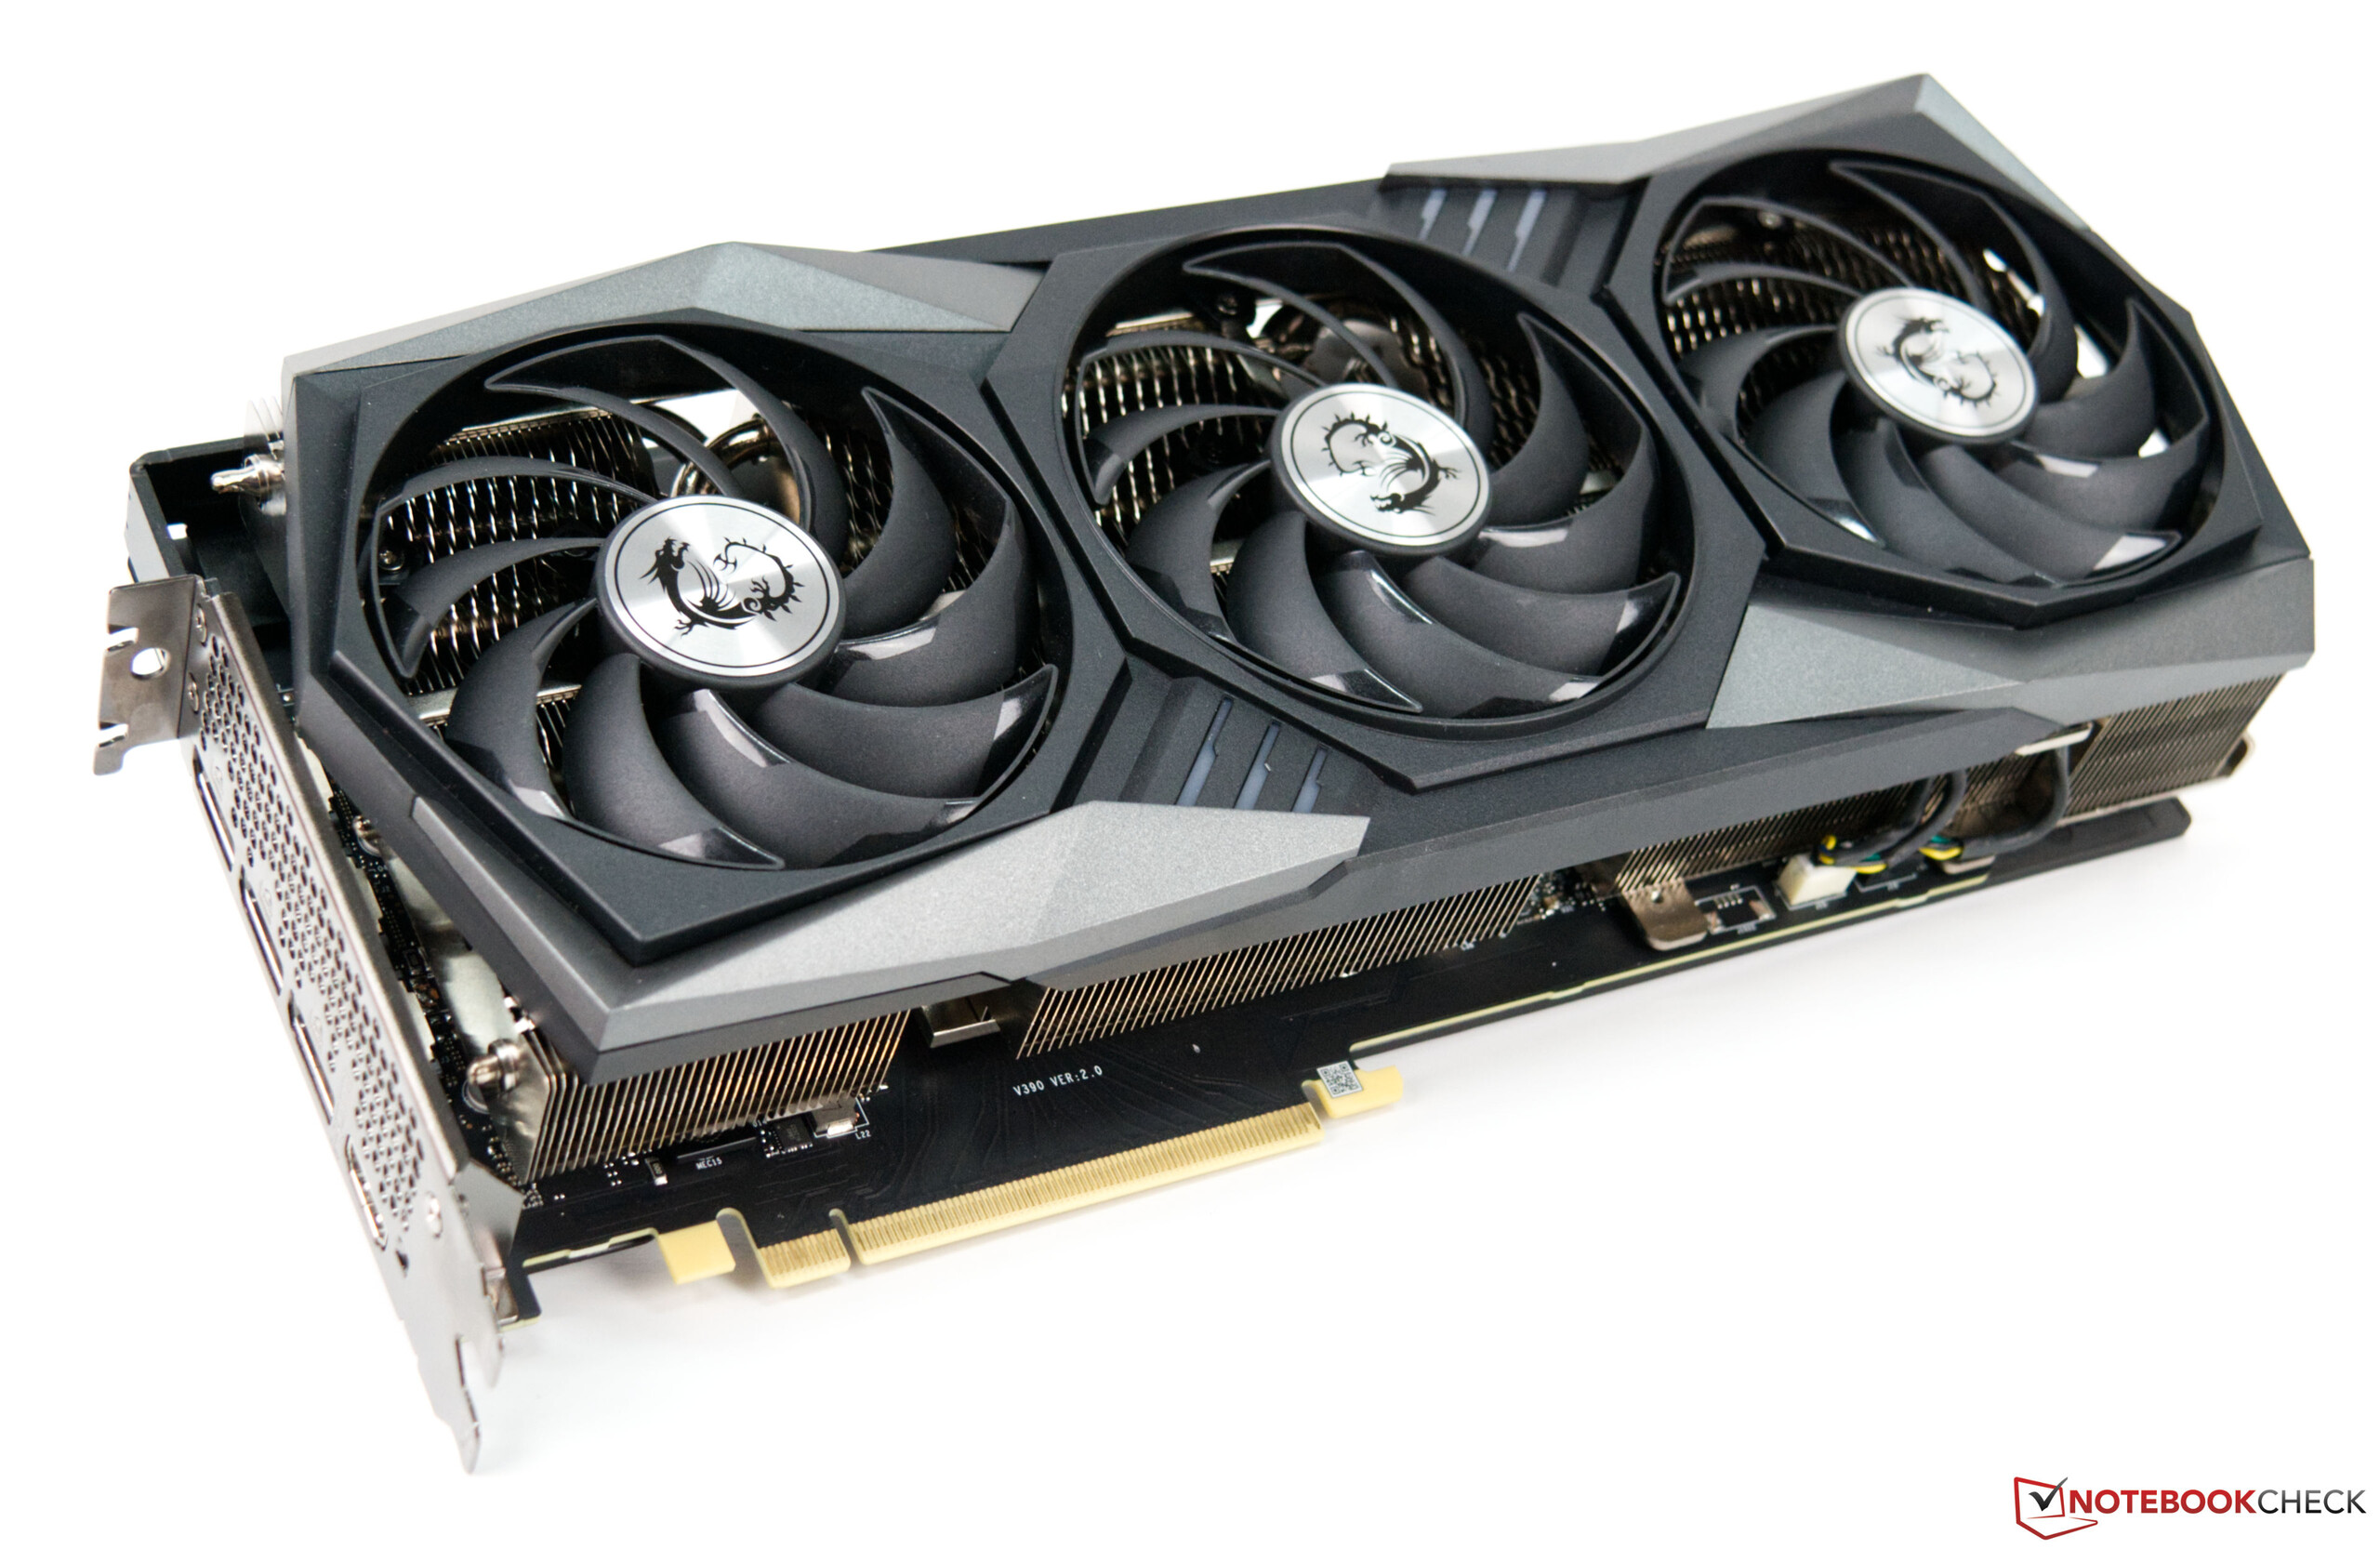
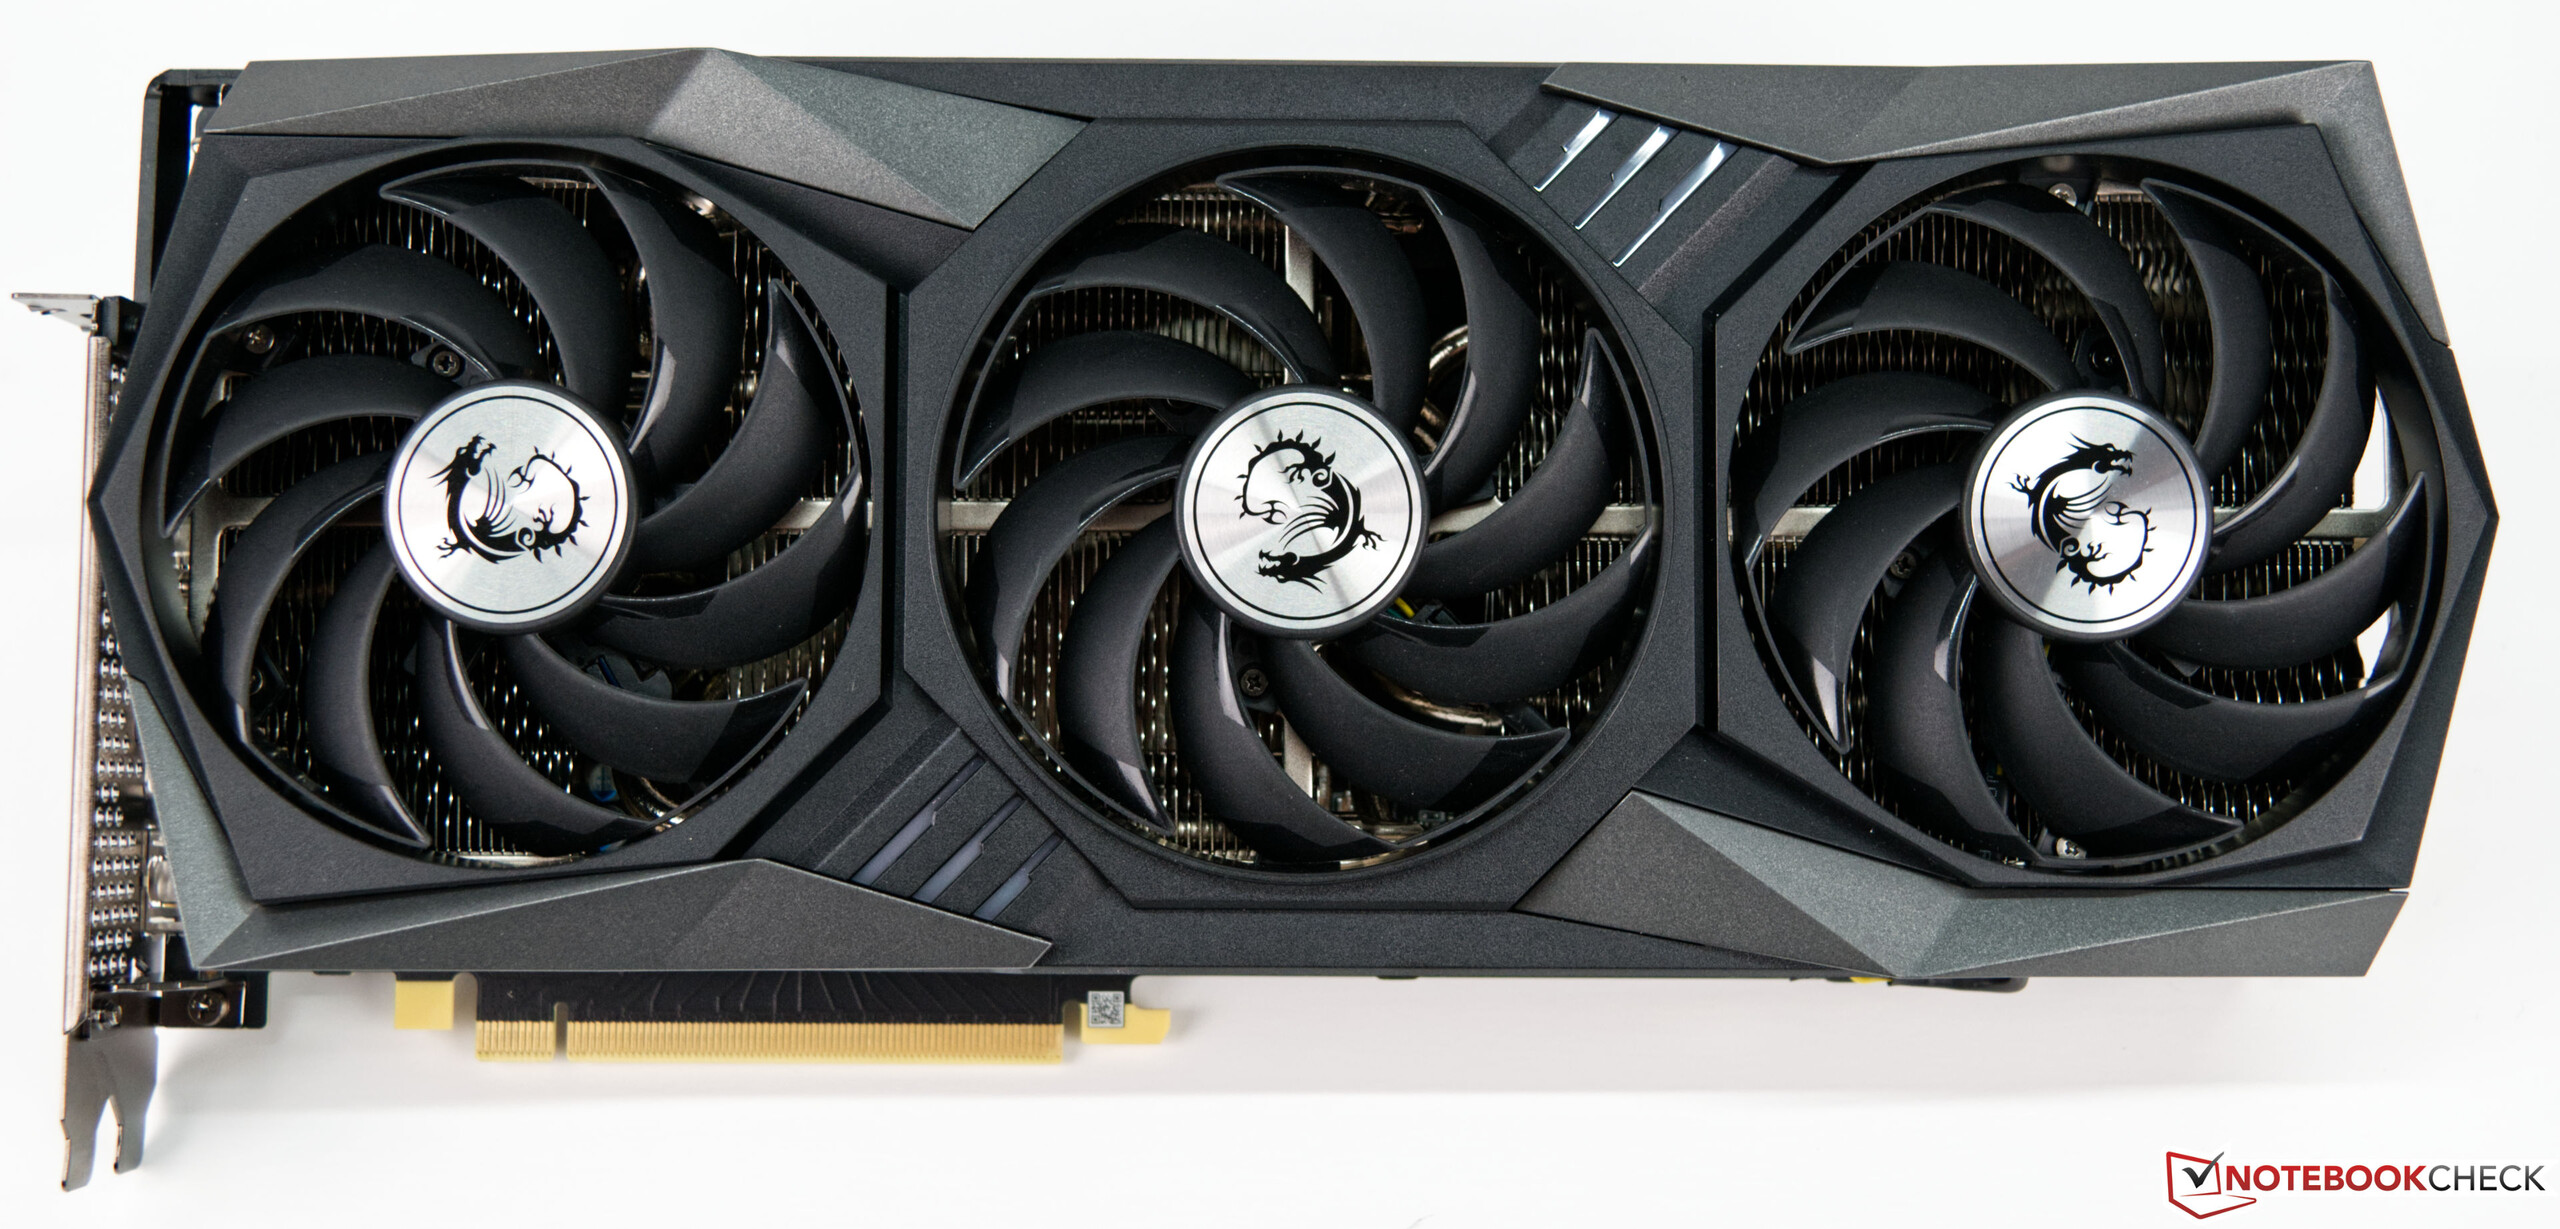
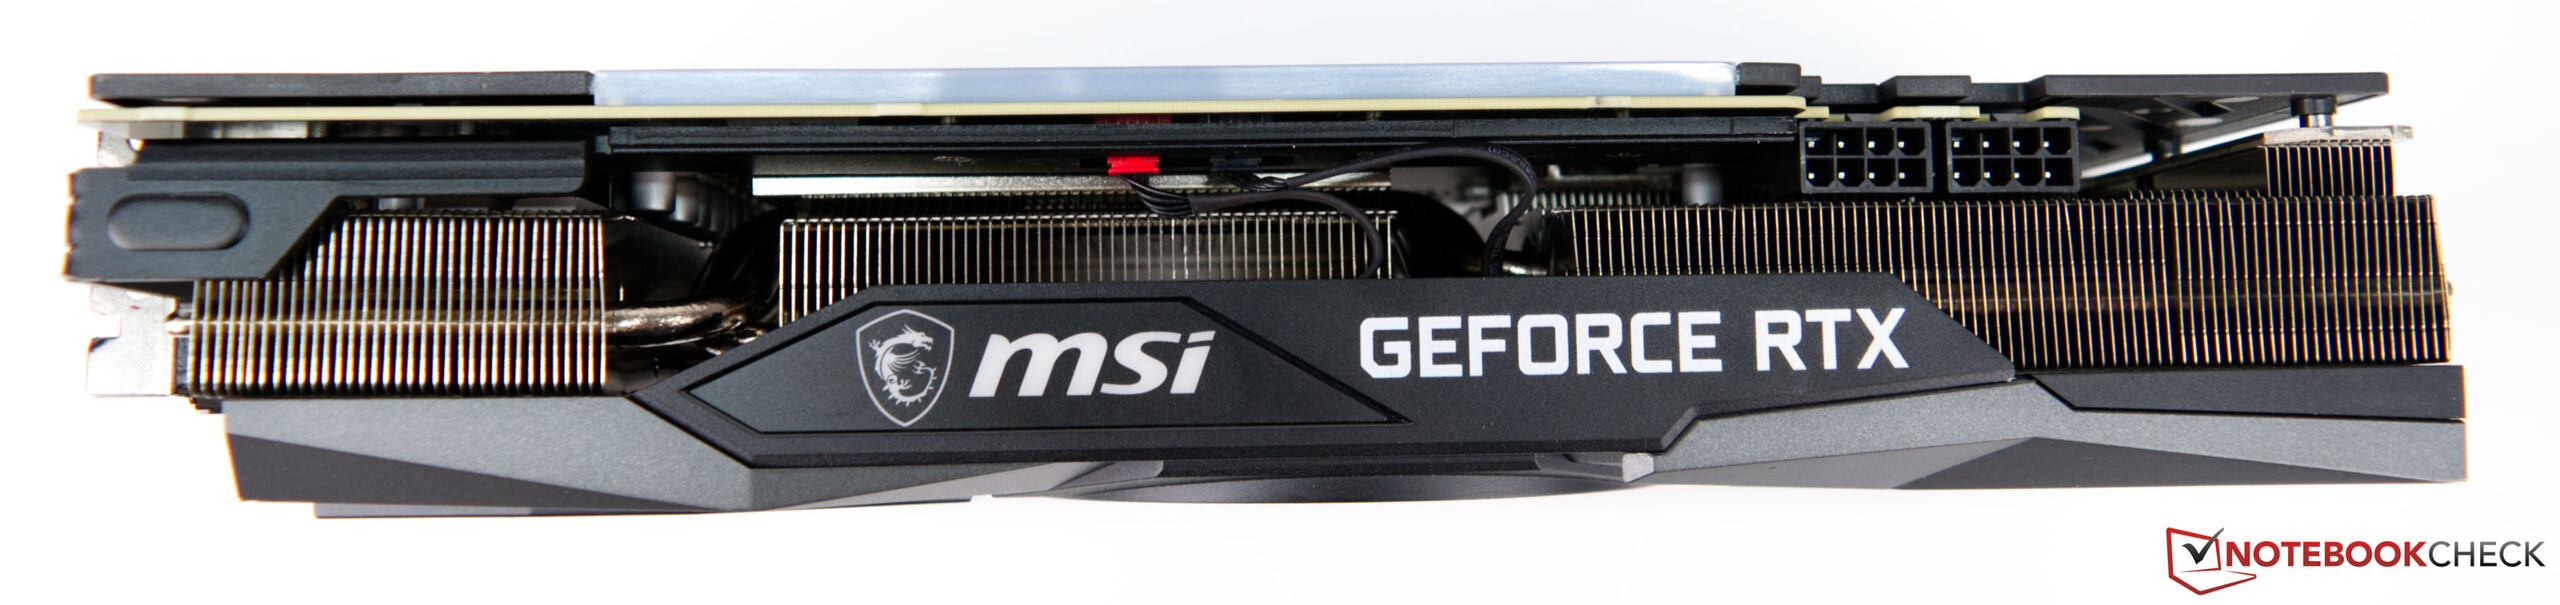
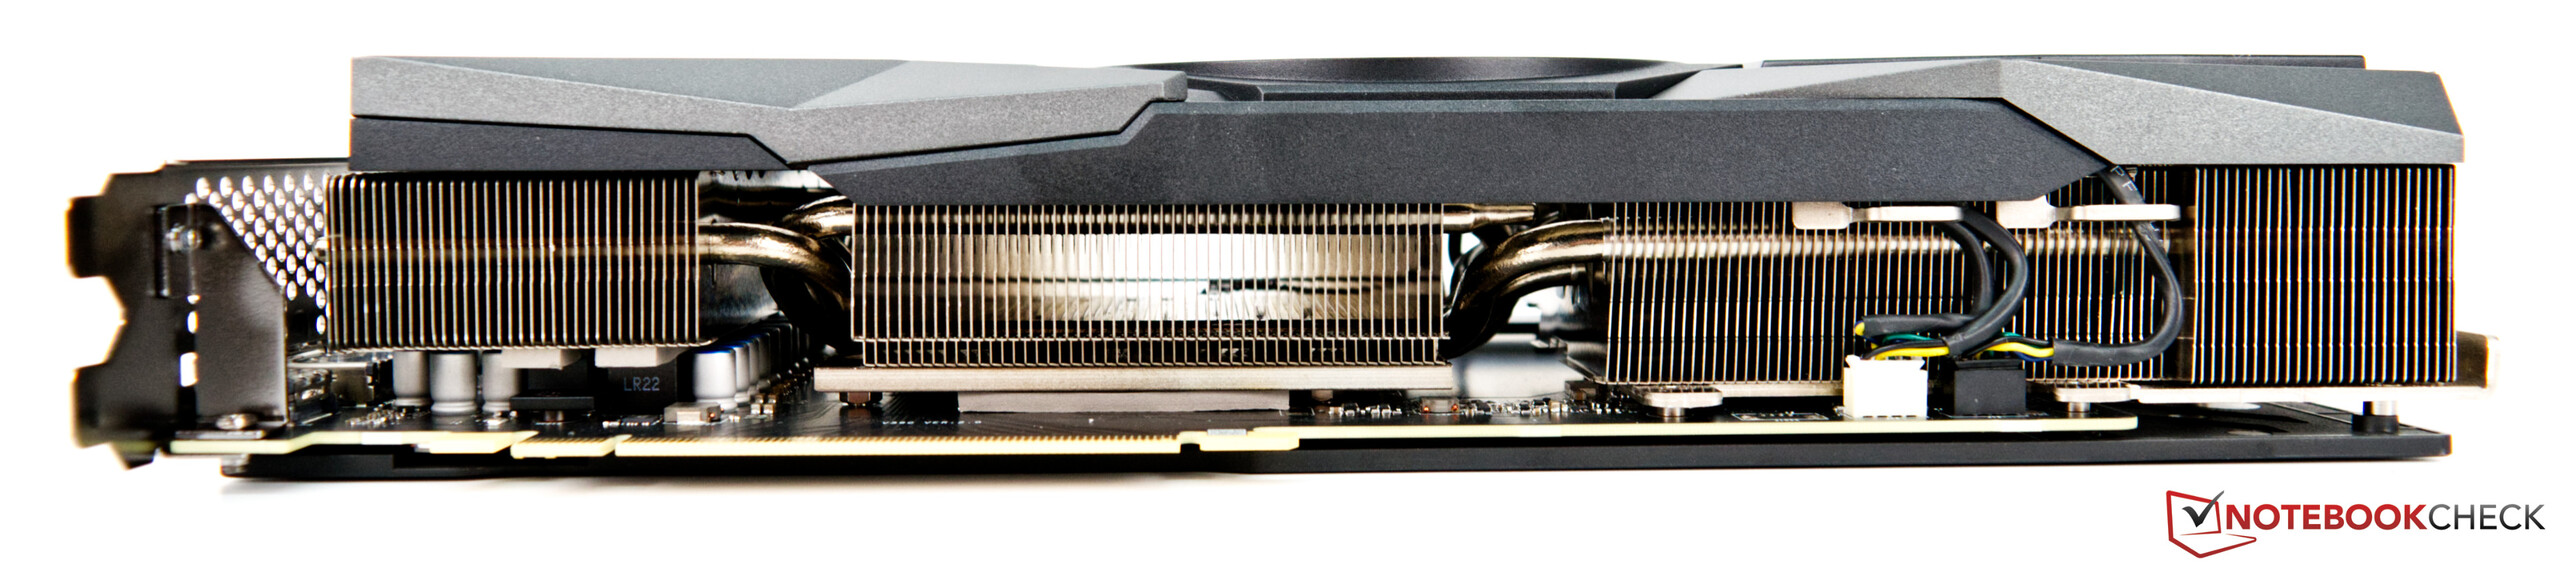
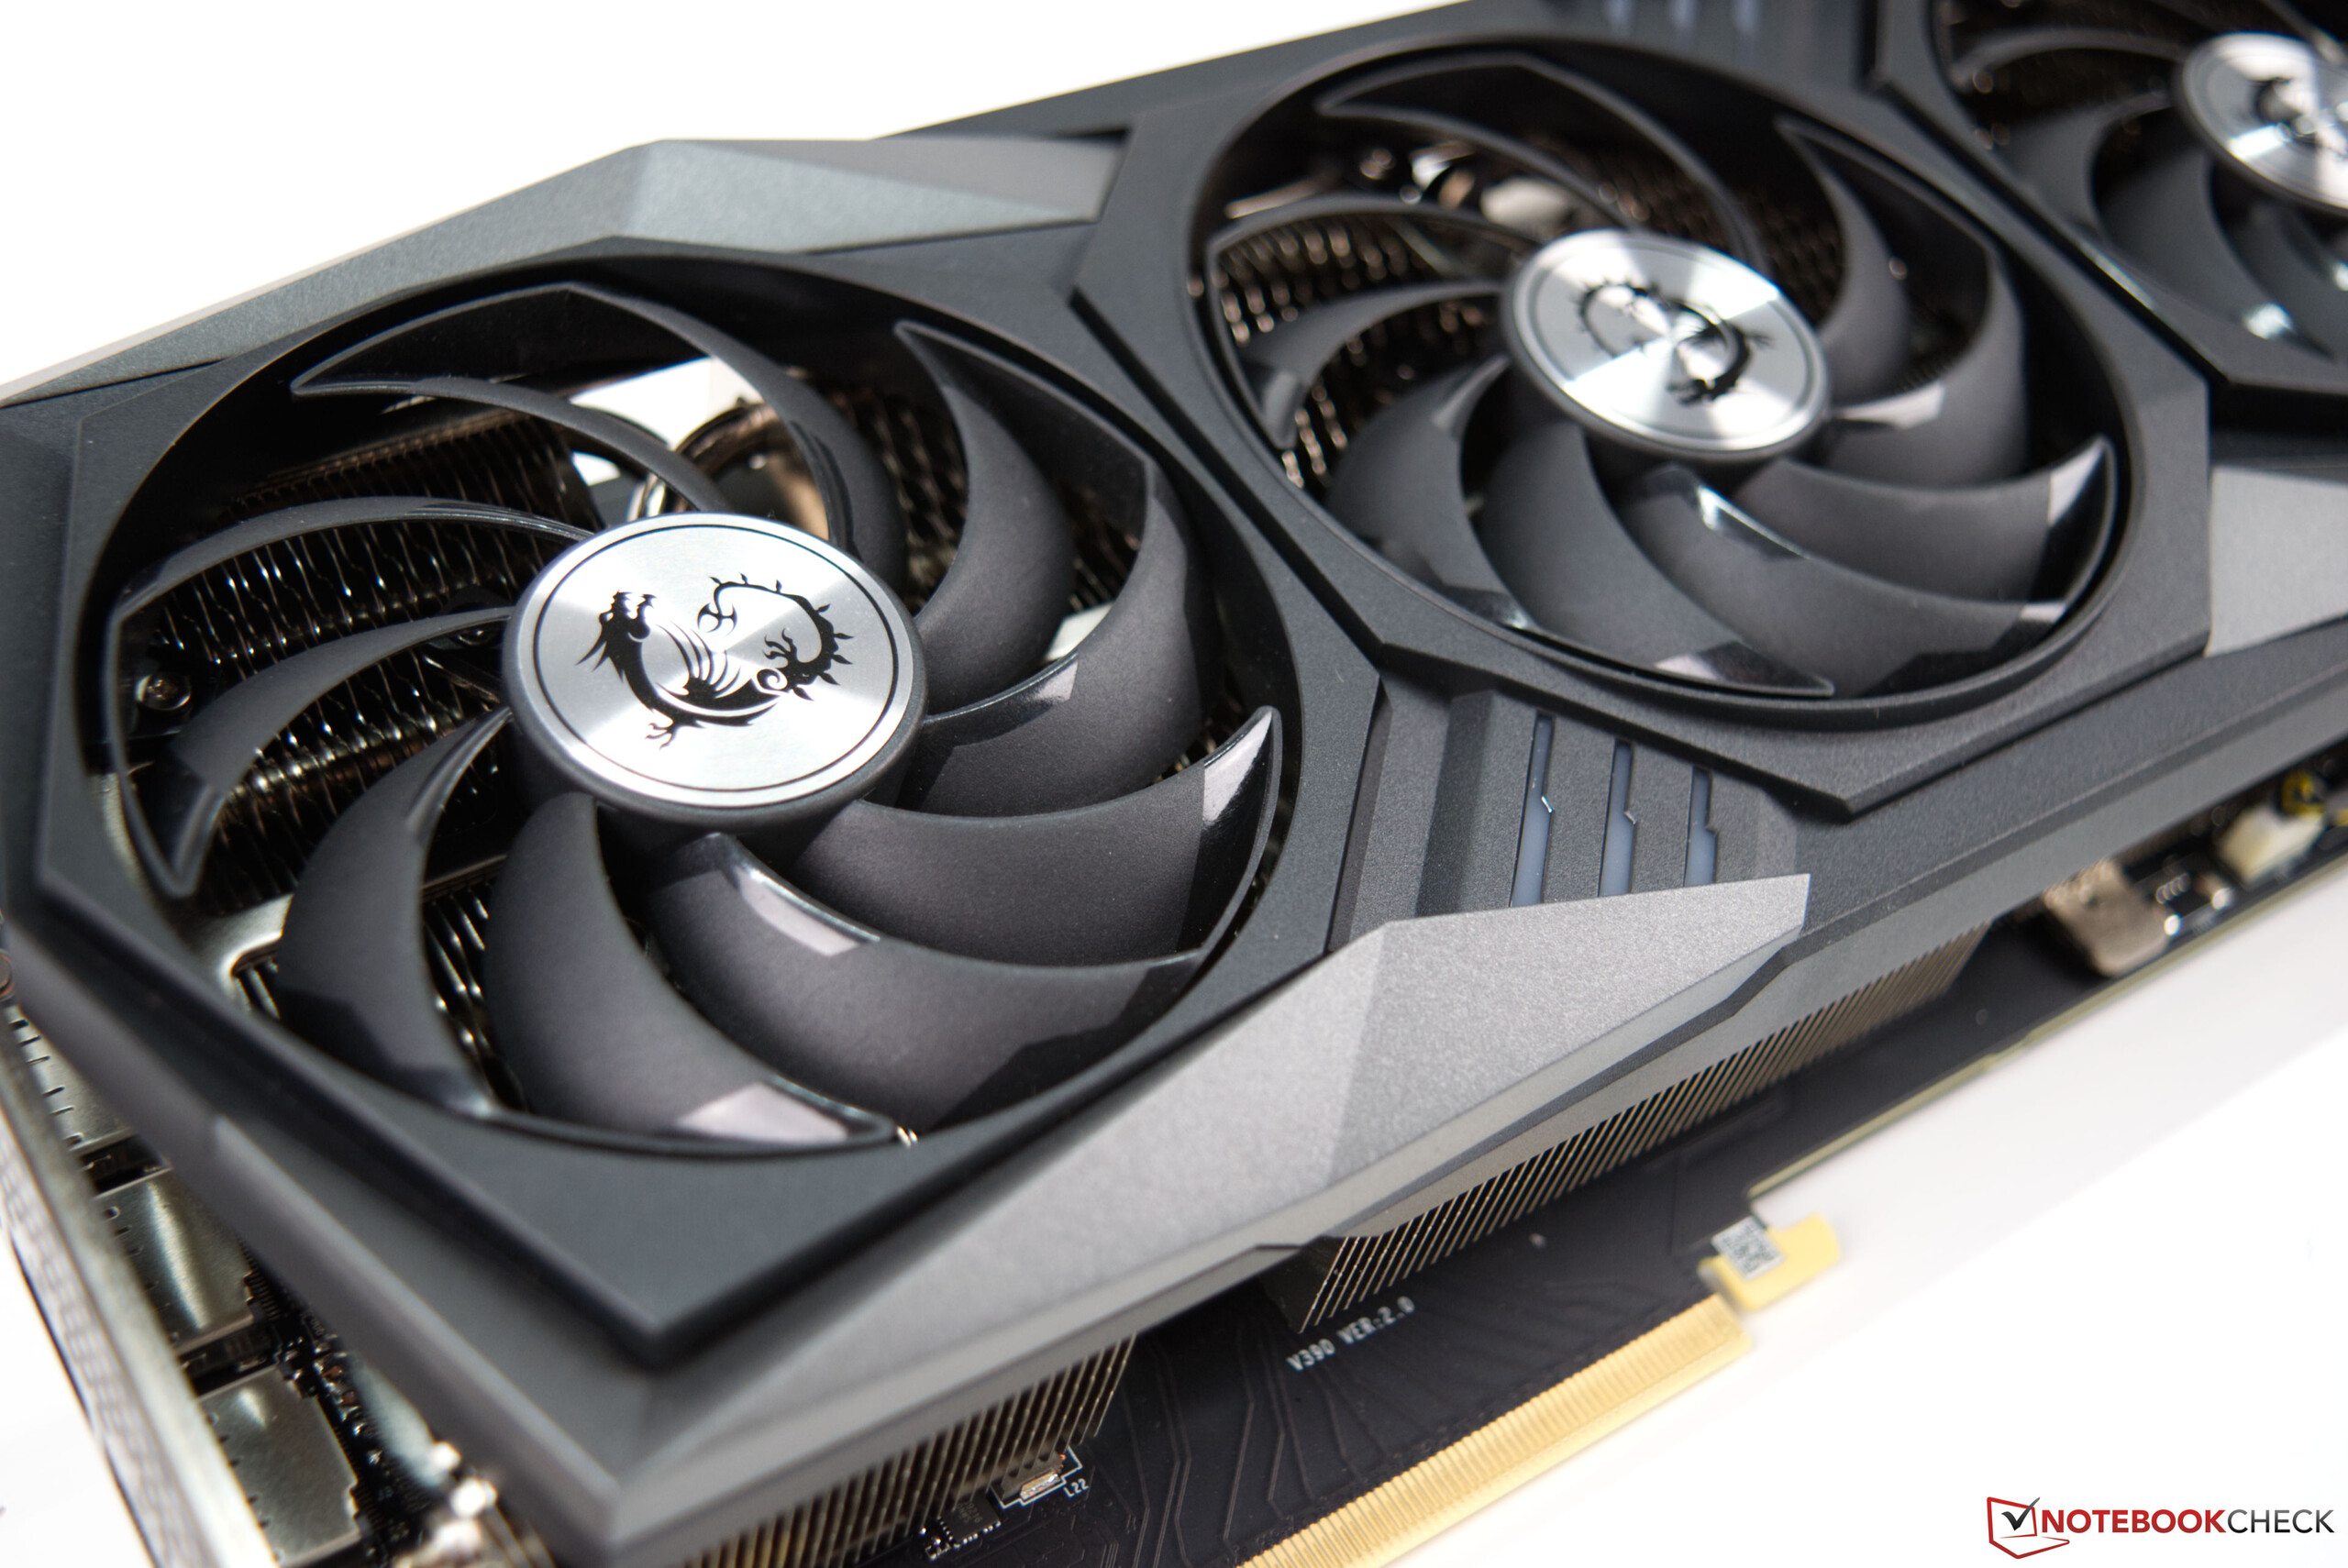
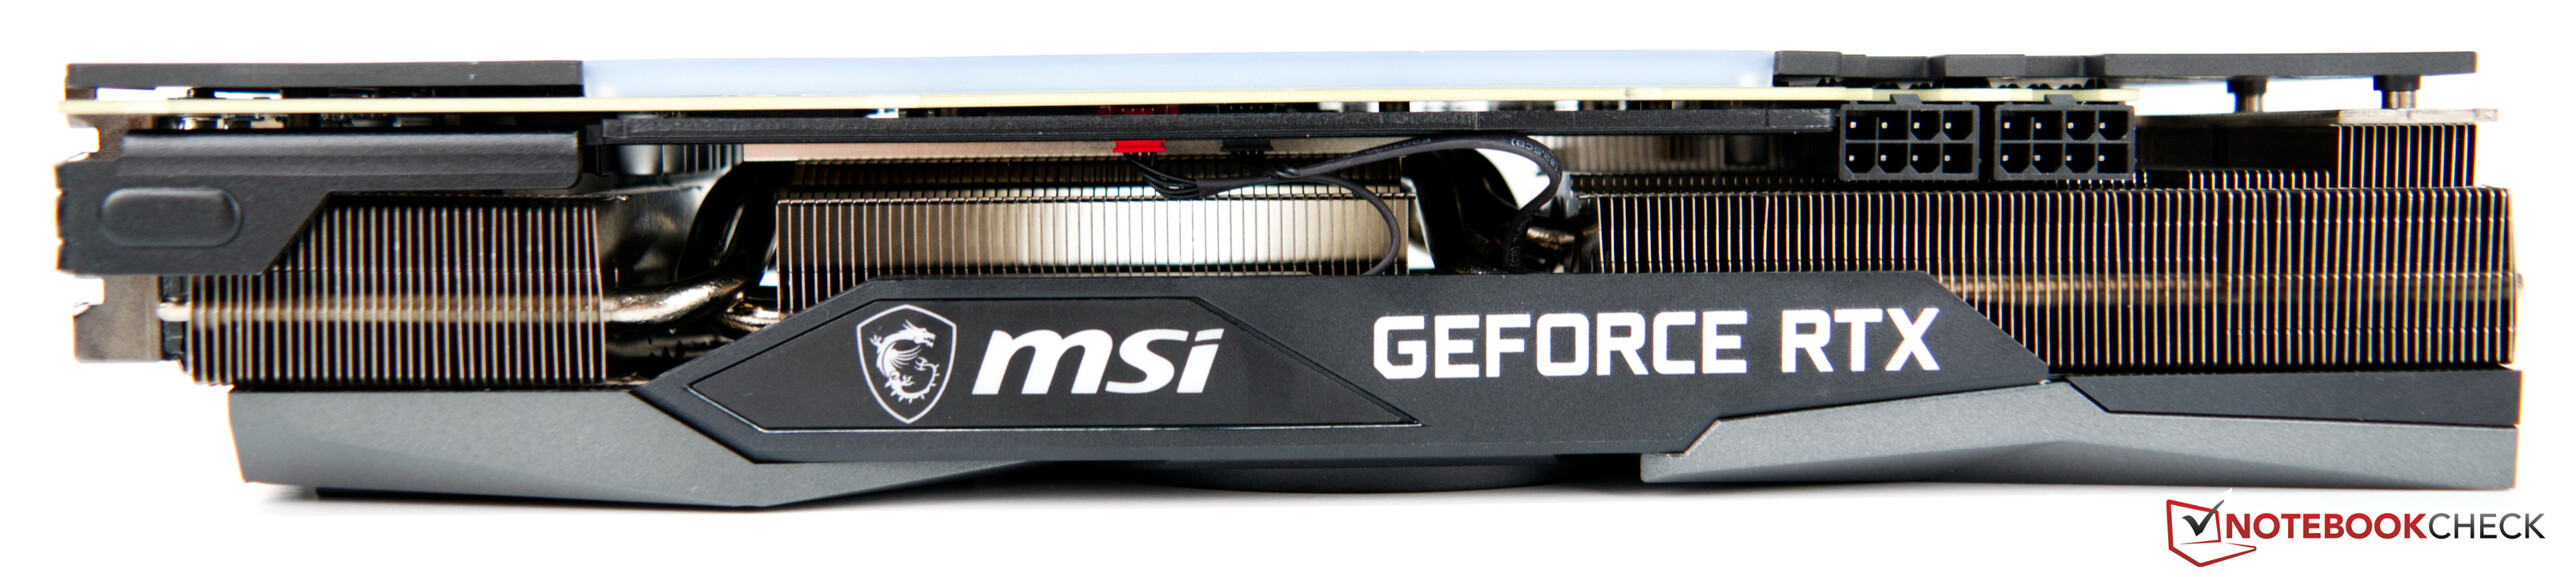
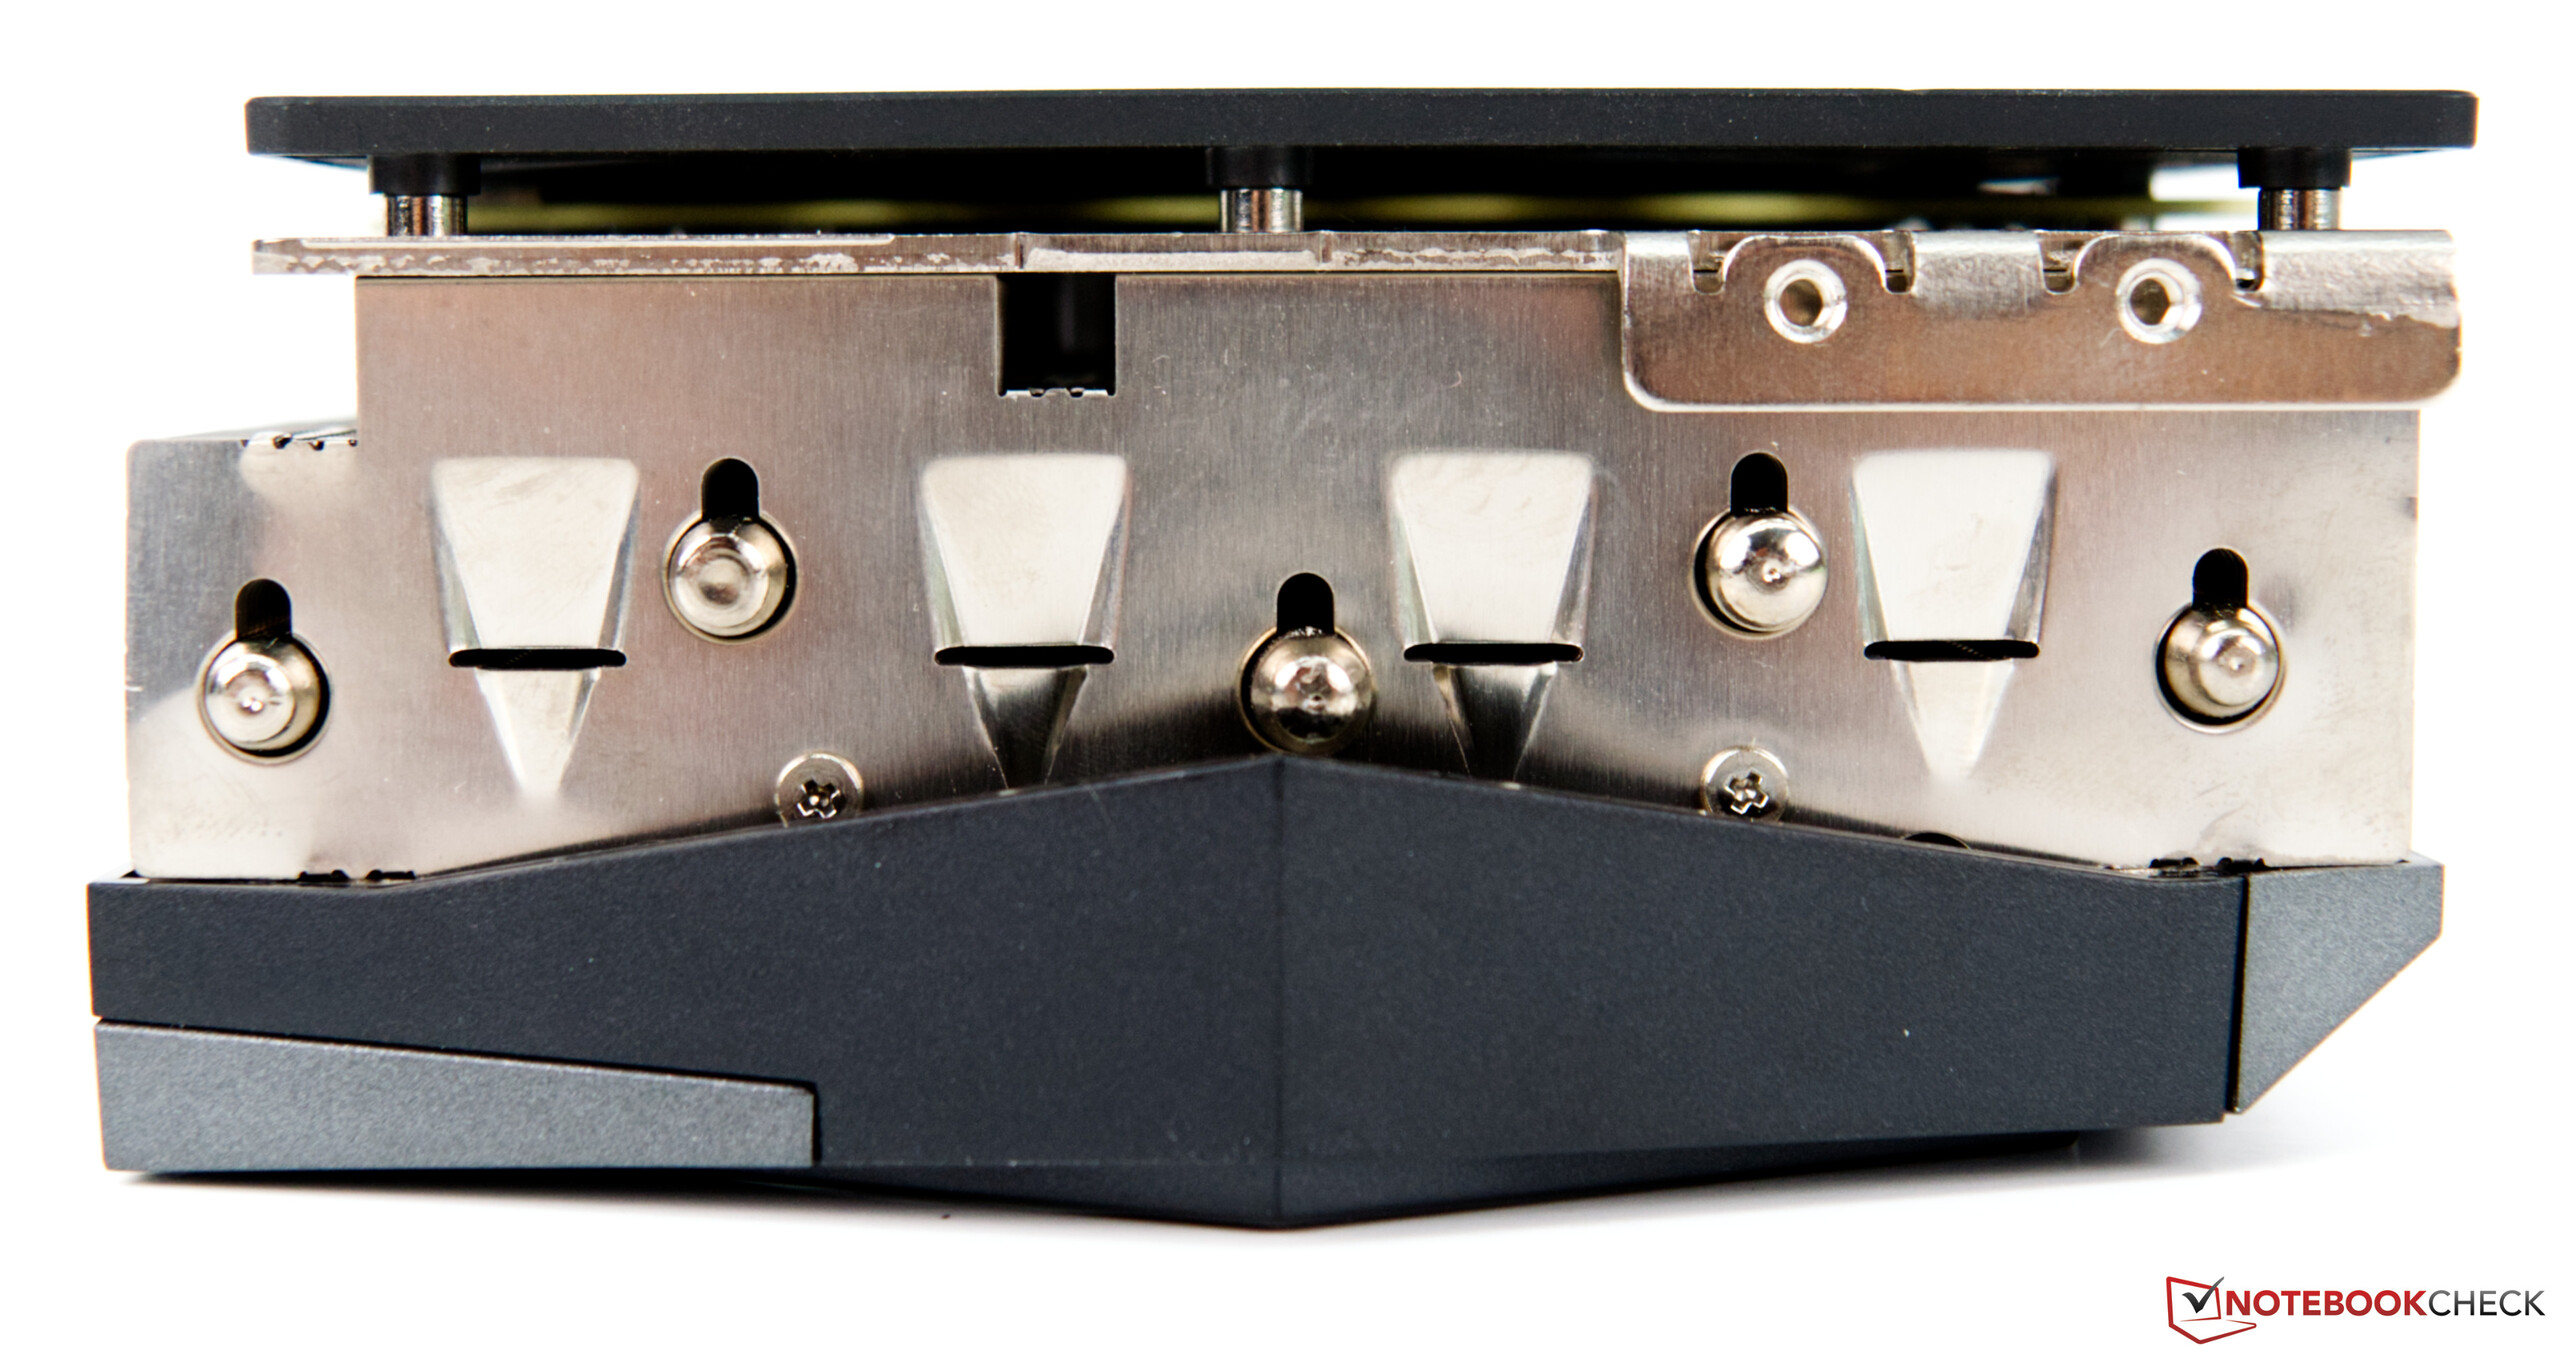
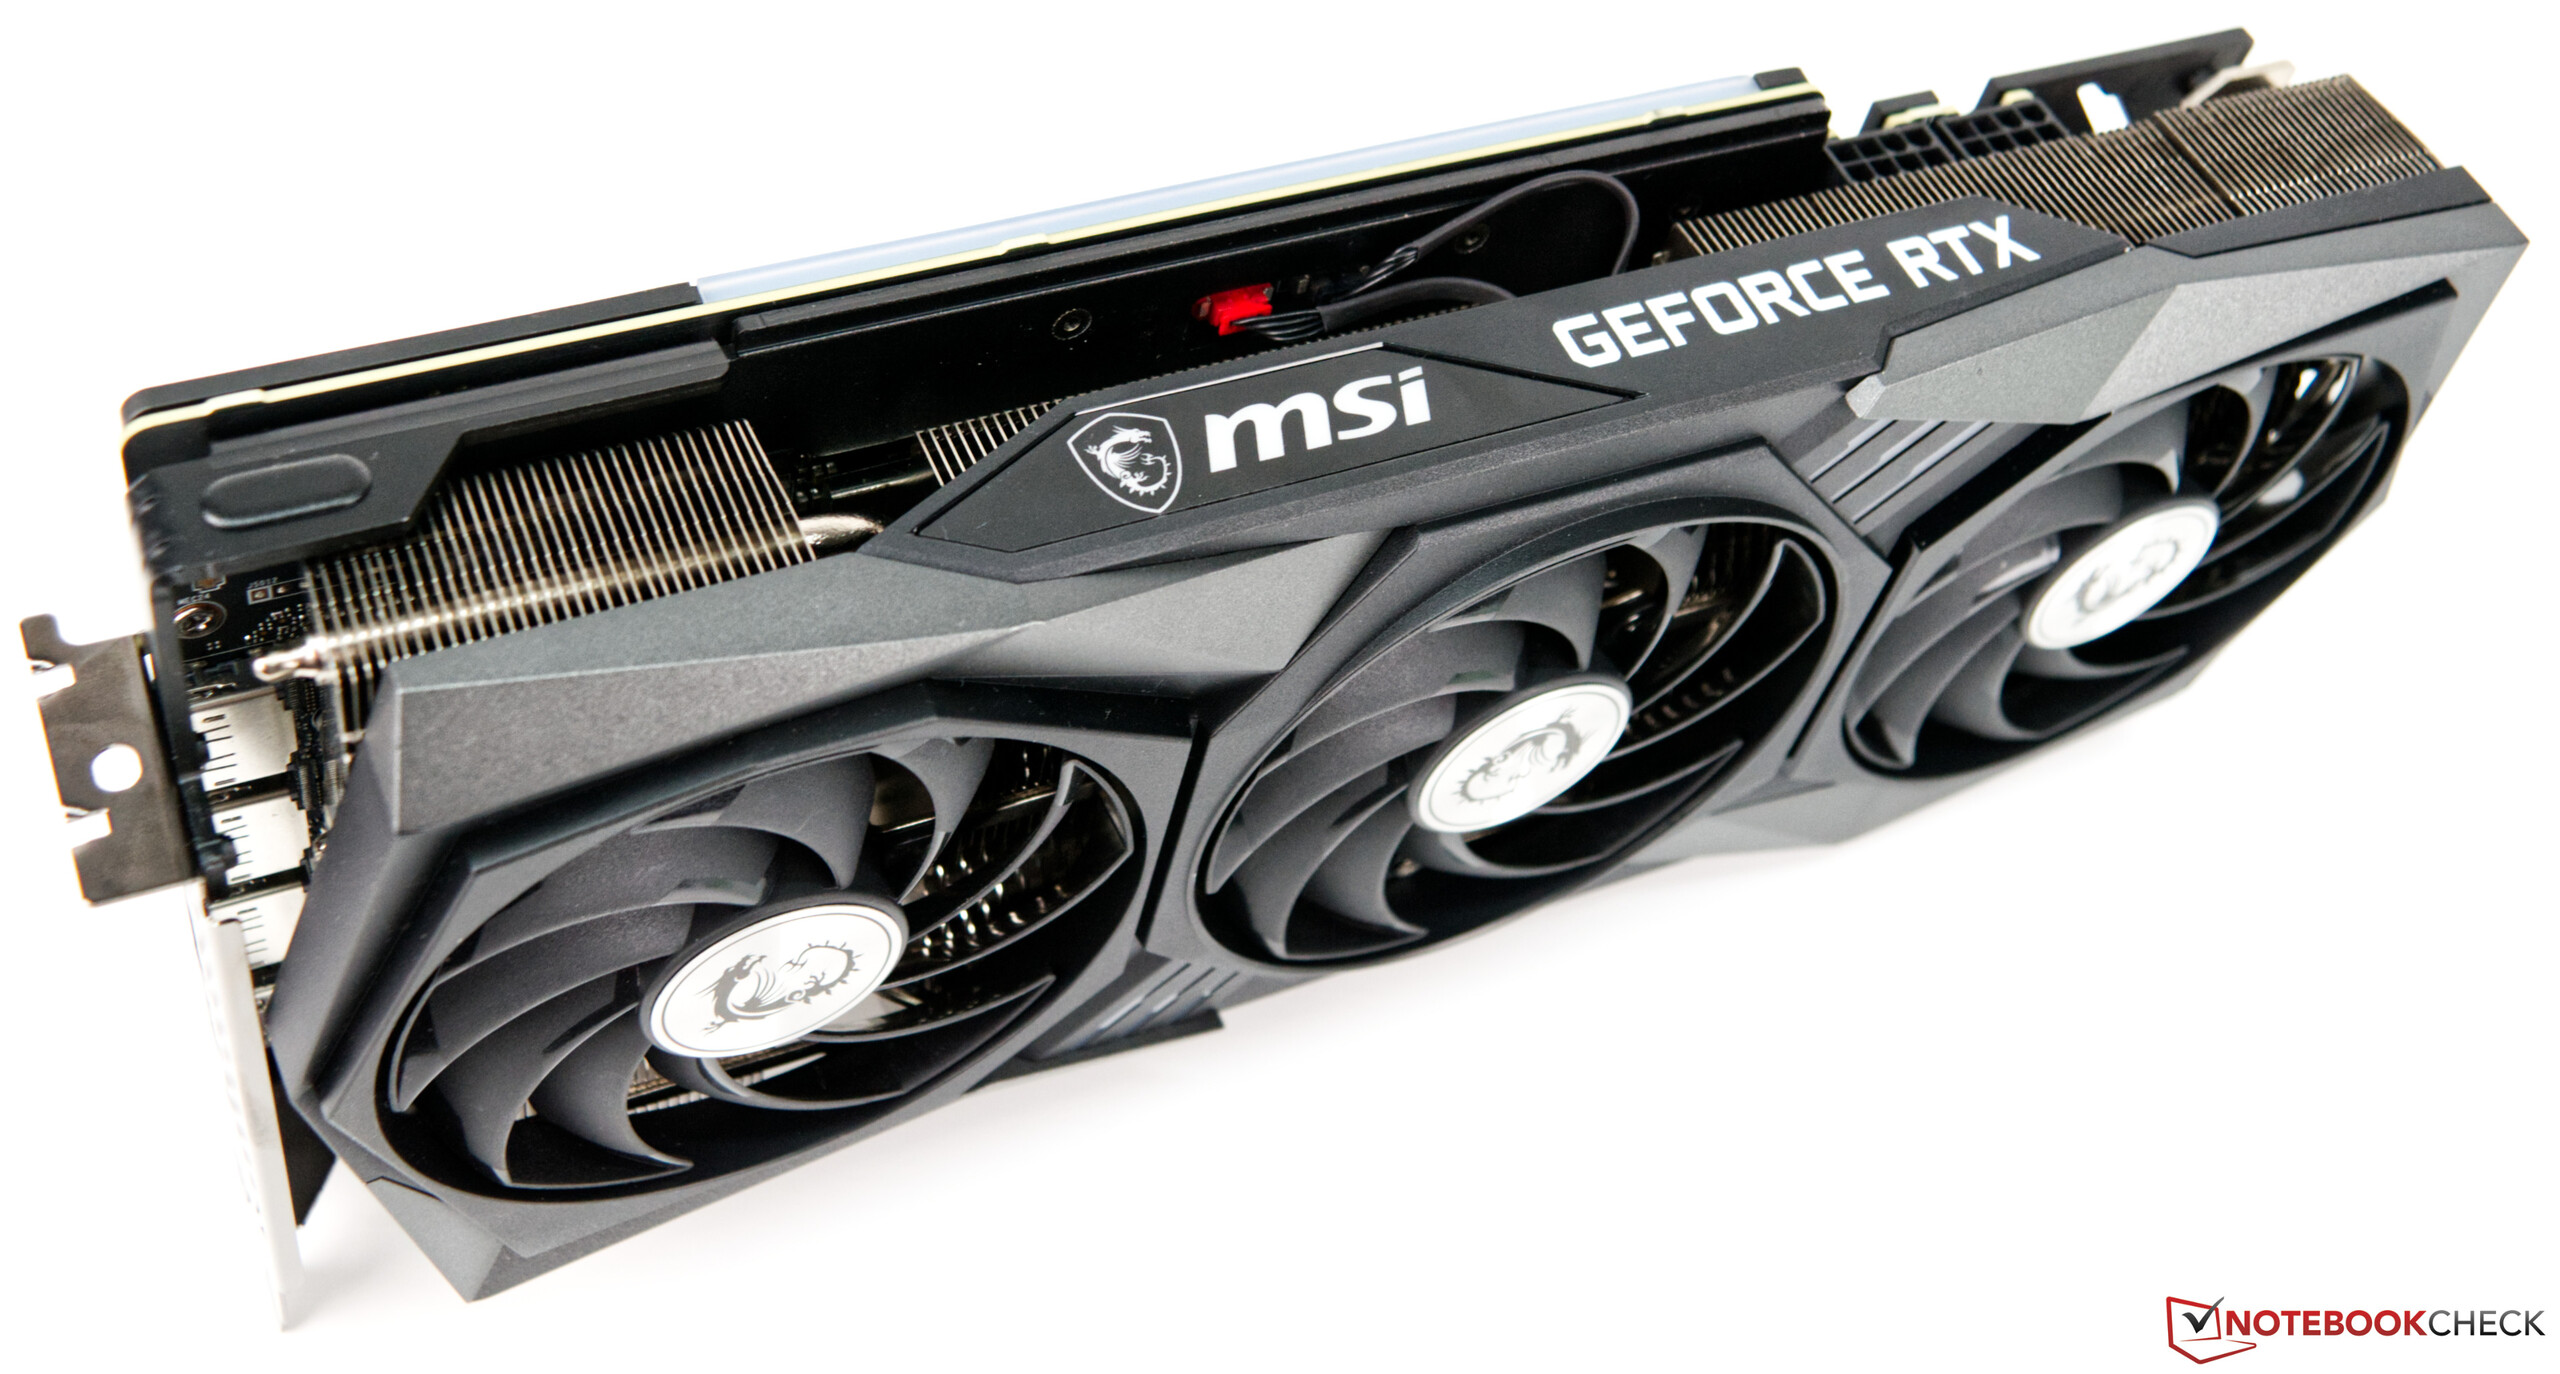
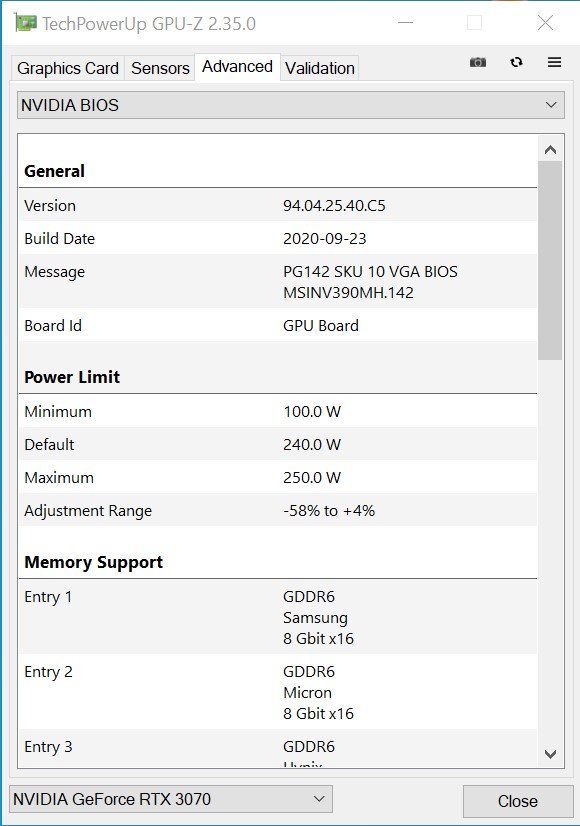
La MSI GeForce RTX 3070 Gaming X Trio est sans aucun doute une carte graphique très rapide et très bien conçue. De plus, elle est livrée avec un BIOS de 240 watts. L'édition Founders, en revanche, doit se contenter de 220 watts. Le très bon et massif dissipateur de chaleur, qui est équipé de trois ventilateurs axiaux, prend en charge la chaleur développée. Le dissipateur ne se met jamais vraiment en marche, même sous charge, comme nous pouvons déjà le révéler à ce stade.
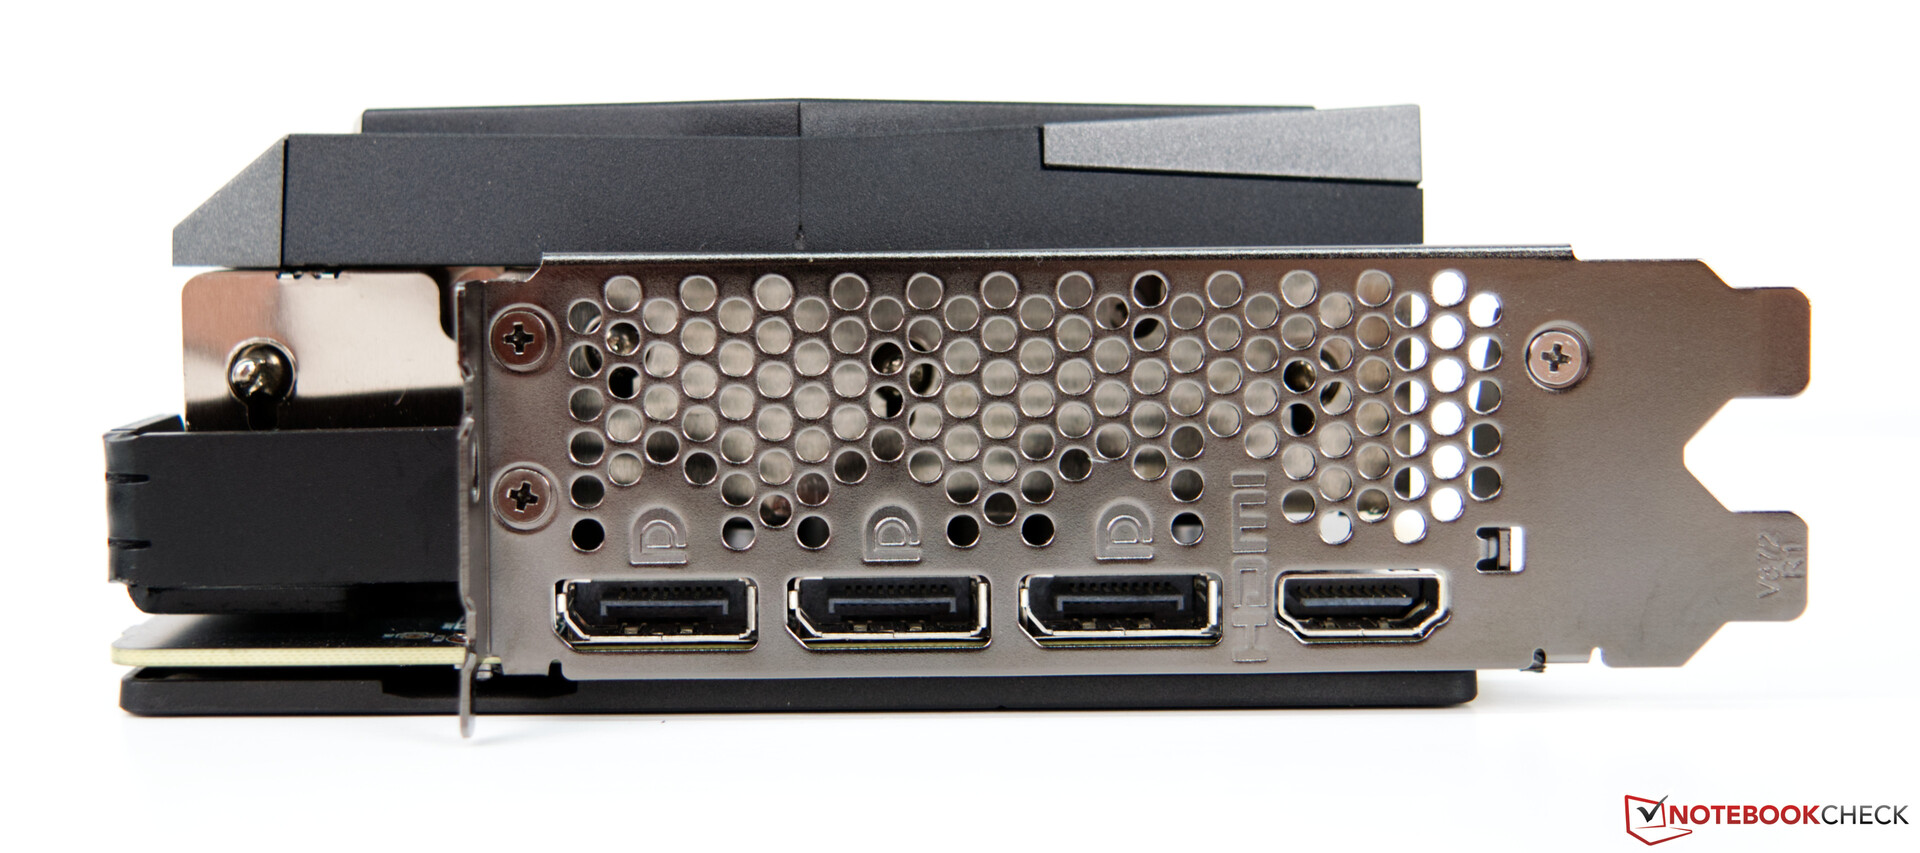
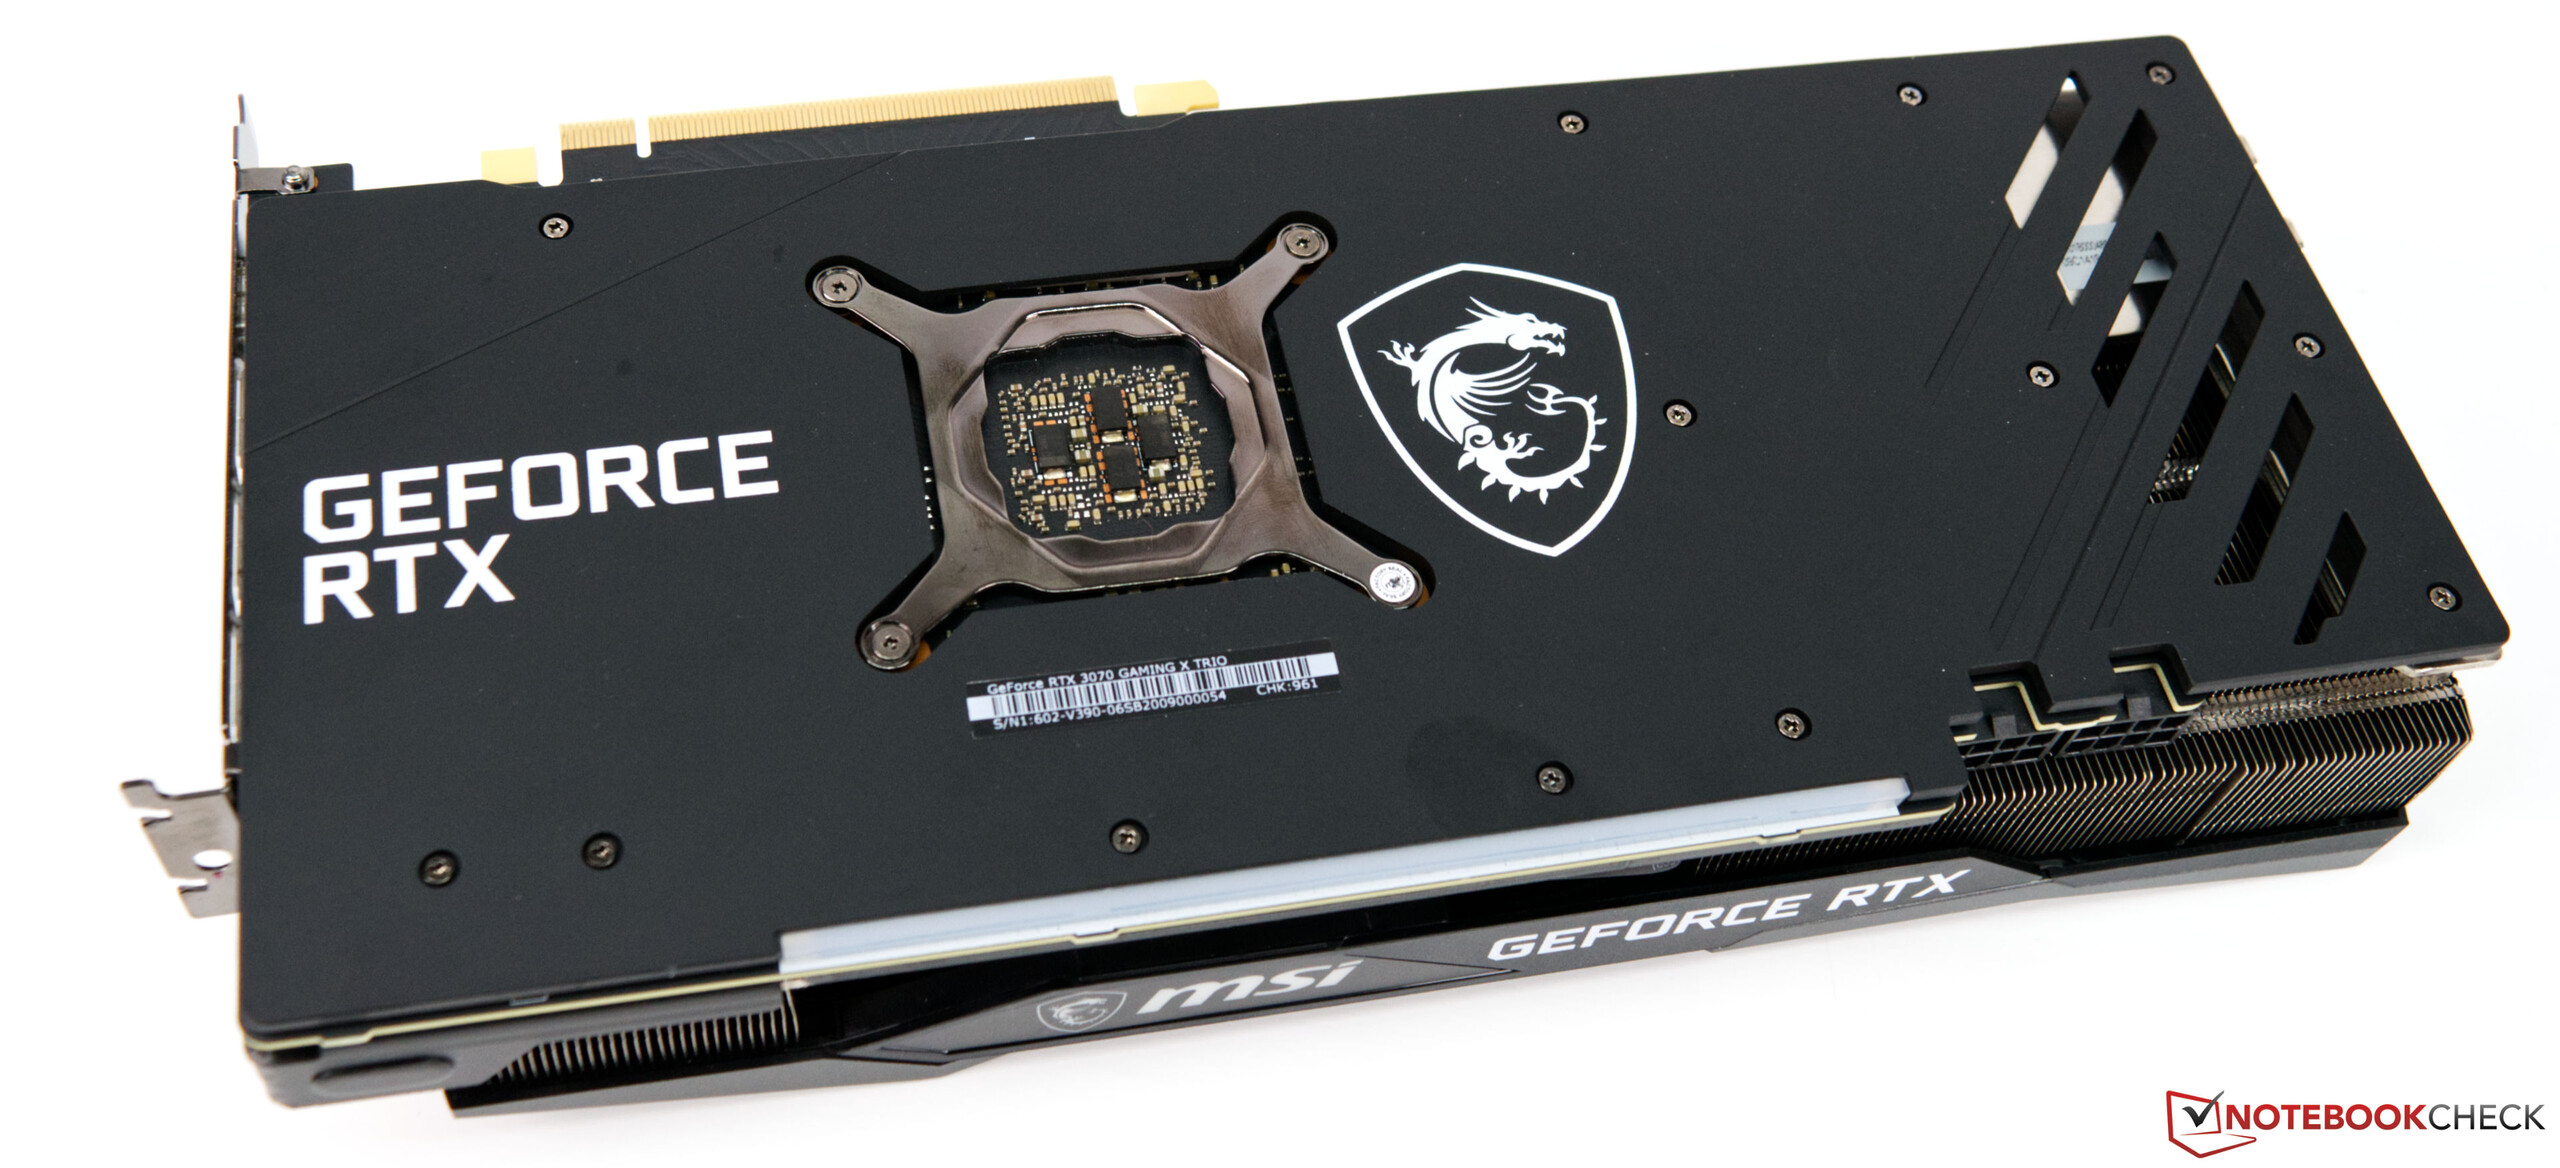
Pour l'alimentation électrique, MSI se passe du connecteur 12 broches que Nvidia utilise avec ses cartes Founders Edition et reste avec le classique. La GeForce RTX 3070 Gaming X Trio nécessite deux connecteurs d'alimentation à 8 broches. En externe, il est possible de faire fonctionner jusqu'à quatre moniteurs simultanément. Pour cela, il y a une sortie HDMI avec le dernier standard (2.1) et trois connexions DisplayPort (1.4a).
Comparaison du RTX 3070 avec d'autres GPU NVIDIA
| Spécification | RTX 3090 | RTX 3080 FE | MSIRTX 3070 | RTX 3070 FE | Titan RTX | TITAN X Pascal | RTX 2080 Ti | RTX 2080 | RTX 2070 S |
| Chip | GA102 | GA102 | GA104 | GA104 | TU102 | GP102 | TU102 | TU104 | TU104 |
| Processus FinFET | 8 nm | 8 nm | 8nm | 8 nm | 12 nm | 16 nm | 12 nm | 12 nm | 12 nm |
| CUDA cores | 10,496 | 8,704 | 5,888 | 5,888 | 4,608 | 3,584 | 4,352 | 2,944 | 2,560 |
| Textureunits | 328 | 272 | 184 | 184 | 288 | 224 | 272 | 184 | 160 |
| Noyaux tenseurs | 328 3ème gén. | 272 3ème gén. | 184 3ème gén. | 1843ème gén. | 576 2ème gén. | - | 544 2ème gén. | 368 2ème gén. | 320 2ème gén. |
| RTcores | 82 | 68 | 46 | 46 | 72 | - | 68 | 46 | 40 |
| Horloge de base GPU | 1,395 MHz | 1,440 MHz | 1,500 MHz | 1,350 MHz | 1,417 MHz | 1,350 MHz | 1,515 MHz | 1,605 MHz | |
| Horloge de boost GPU | 1,695 MHz | 1,710 MHz | 1,830 MHz | 1,750 MHz | 1,770 MHz | 1,531 MHz | 1,545 MHz | 1,710 MHz | 1,770 MHz |
| Memorybus | 384-bit | 320-bit | 256-bit | 256-bit | 384-bit | 384-bit | 352-bit | 256-bit | 256-bit |
| Bande passante mémoire | 936 GB/s | 760 GB/s | 448GB/s | 448 GB/s | 672 GB/s | 480.4 GB/s | 616 GB/s | 448 GB/s | 448 GB/s |
| Mémoire vidéo | 24 GB GDDR6X | 10 GB GDDR6X | 8 GBGDDR6 | 8 GB GDDR6 | 24 GB GDDR6 | 12 GB GDDR5X | 11 GB GDDR6 | 8 GB GDDR6 | 8 GB GDDR6 |
| Consommation d'énergie | 350 W | 320 W | 240W | 220 W | 280 W | 250 W | 250 W | 215 W | 215 W |
Notre système de test avec l'AMD Ryzen 9 3900X comme base
Une plateforme AMD actuelle basée sur le Crosshair VIII de l'Asus X570 ROG sert de système de test. L'unité centrale(AMD Ryzen 9 5900X) offre de bonnes performances, et nous avons utilisé un AIO(Alphacool Eisbaer 280 mm) comme système de refroidissement. La mémoire vive de 32 Go provient de Corsair et fonctionne à 4 000 MHz. Nous utilisons l'Acer Predator XB321HK comme moniteur. Cela ne nous limite pas grâce à sa compatibilité UHD. A ce stade, nous voudrions remercier AMD pour avoir fourni la plate-forme de test et Corsair pour le kit de RAM
Pour les tests et les évaluations ultérieurs, nous utilisons le système suivant :
- Corsair Carbide Air 540 ATX Cube
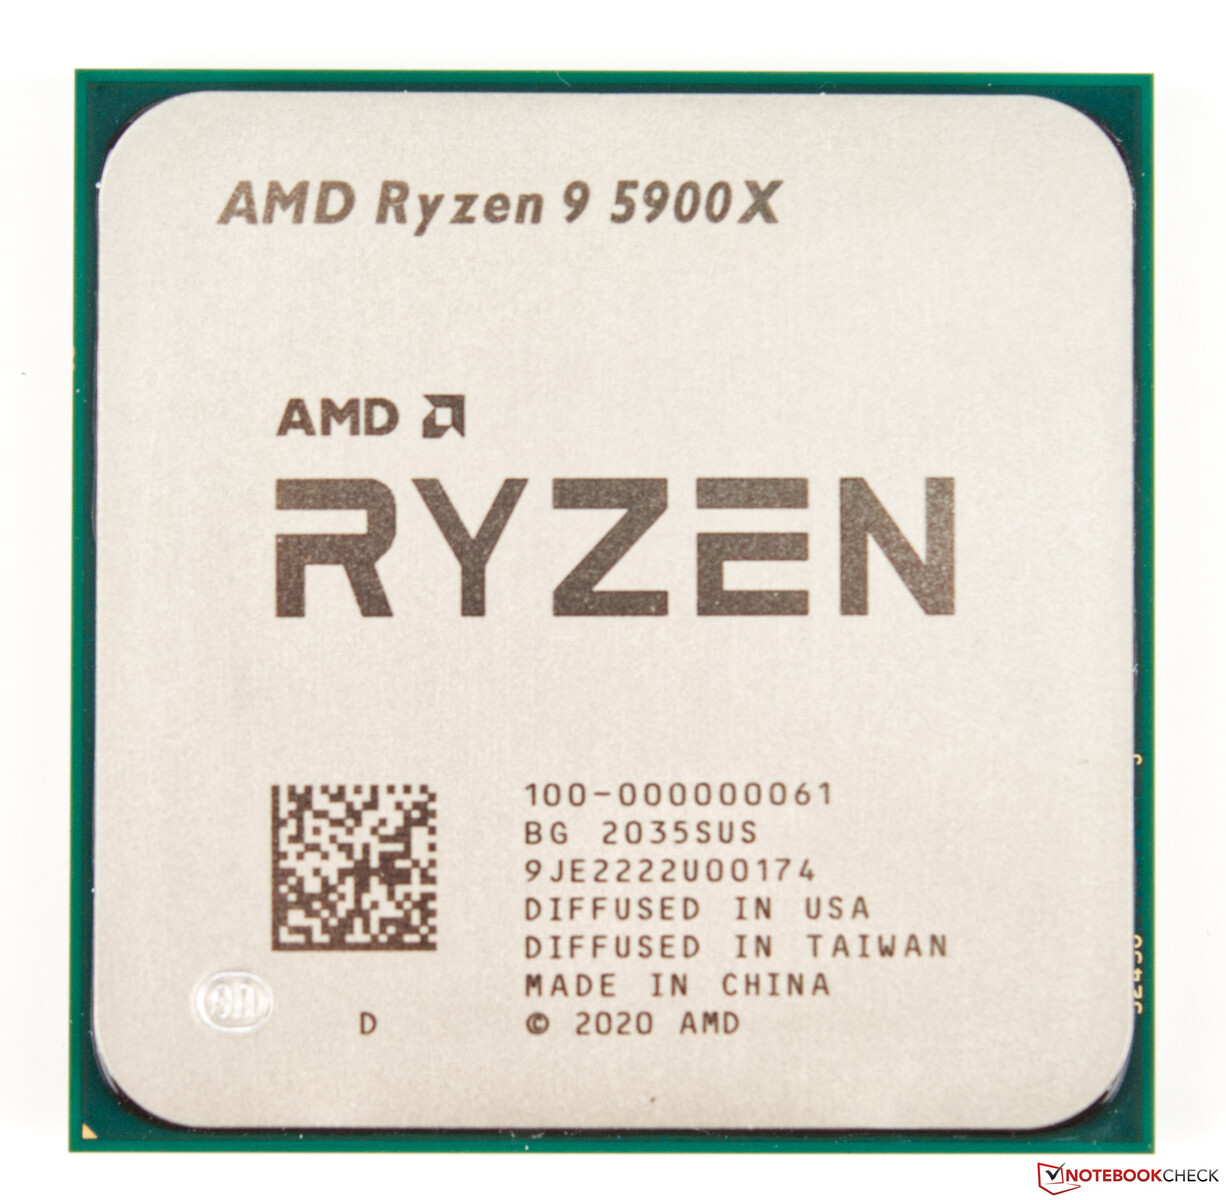
- AMD Ryzen 9 5900X
- MSI GeForce RTX 3070 Gaming X Trio(pilote Nvidia 457.30)
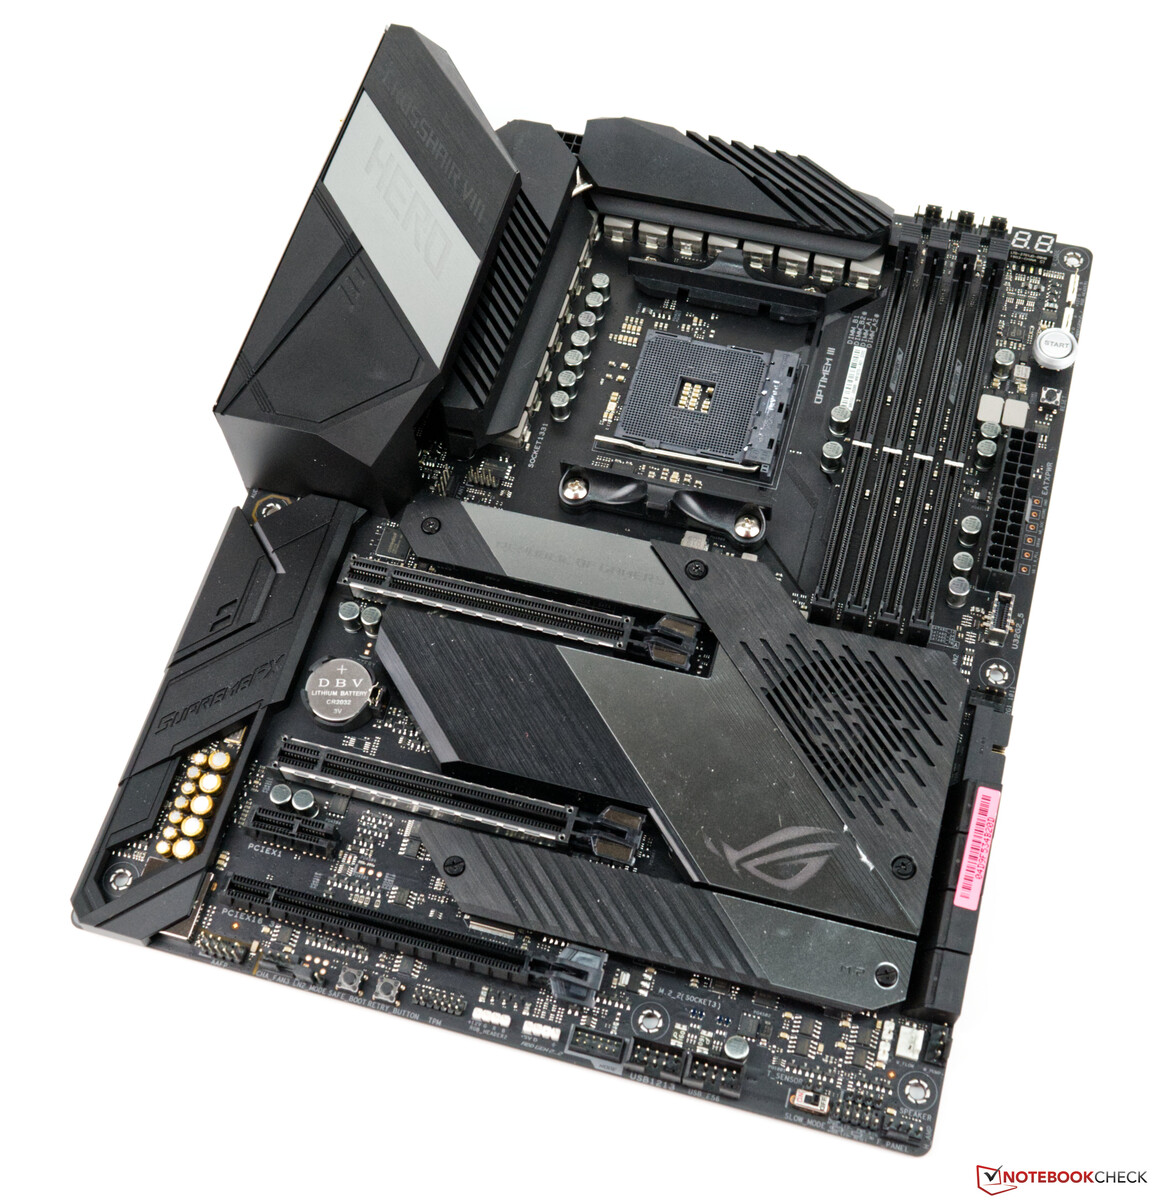
- Asus X570 ROG Crosshair VIII Hero Wi-Fi (BIOS 2402, paramètres par défaut, XMP 1 - DDR4 4000)
- Bloc d'alimentation Corsair RM1000X de 1000 watts
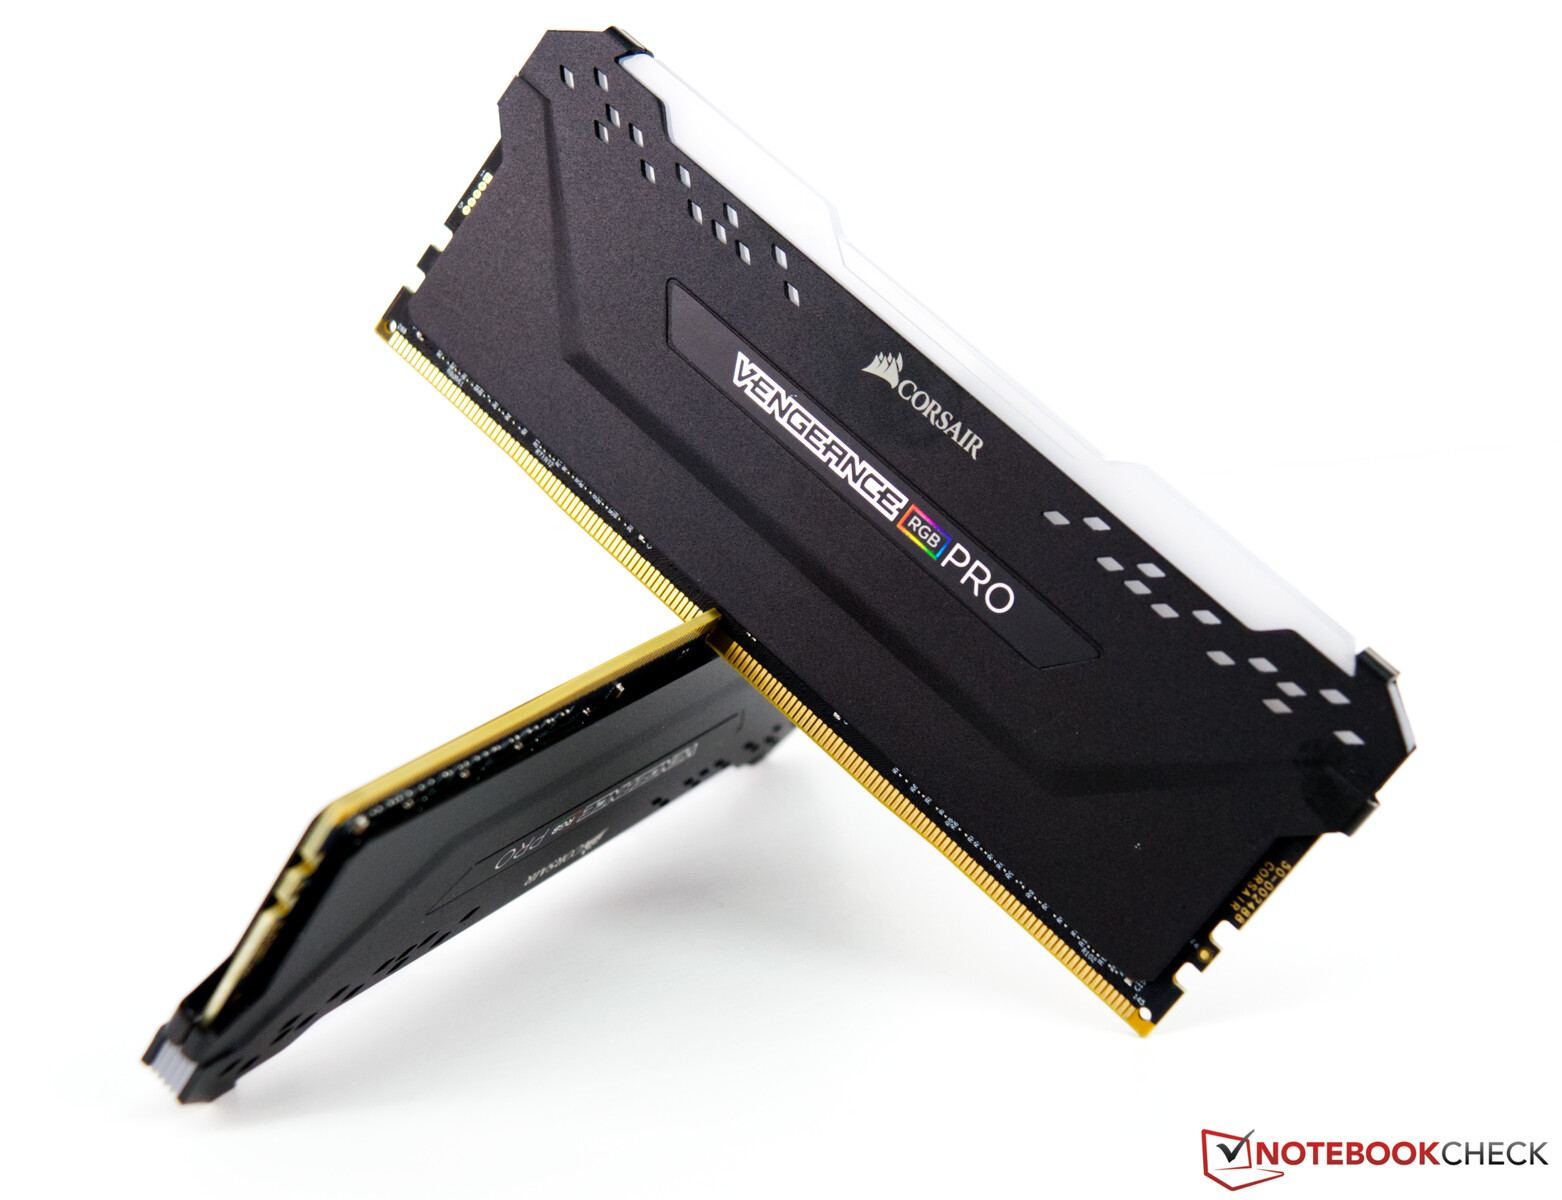
- Corsair Vengeance RGB Pro DDR4 4000 2x 16 GBmemory kit
- Corsair MP600 2 TB M.2 PCIe 4.0 SSD
- Crucial MX500 2 TB (pour les jeux)
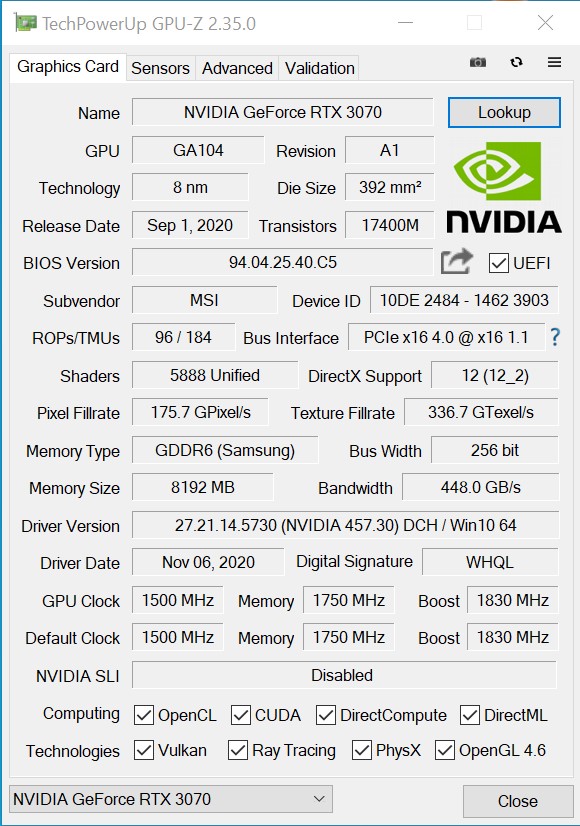
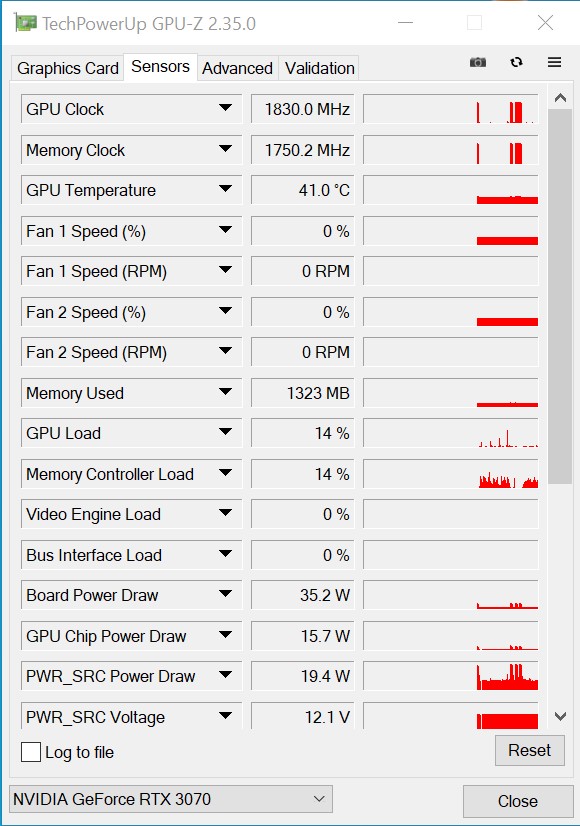
Les vitesses d'horloge du MSI GeForce RTX 3070 Gaming X Trio
Par rapport au modèle de référence, le MSI n'a pas touché à la vitesse de l'horloge de base, ce qui s'applique également à la vitesse de fonctionnement de la VRAM. Seule la vitesse d'horloge maximale du turbo est un peu plus élevée à 1 830 MHz (+6%). En contrepartie, la GeForce RTX 3070 Gaming X Trio peut également utiliser 20 watts d'énergie en plus. Mais cela ne sera probablement pas tout à fait bénéfique pour la puce graphique, car le ventilateur supplémentaire et le spectacle RGB nécessitent également de l'énergie.
En général, cependant, la vitesse de boost est presque toujours dépassée pendant le jeu, ce qui est dû à la très bonne solution de refroidissement. Même en charge, elle assure des températures bien en dessous de la limite de température.
Repères synthétiques
Pour une première comparaison des performances, examinons les résultats des indices de référence synthétiques. Ici, la GeForce RTX 3070 Gaming X Trio de MSI est à peu près aussi rapide qu'une GeForce RTX 2080 Ti. Les performances du Nvidia Titan RTX ne peuvent pas être atteintes, mais elles sont presque à portée de main. Par rapport à la GeForce RTX 2070 SuperSi l'on se base sur le modèle de Turing, notre échantillon d'essai peut clairement se démarquer d'environ 40 %. Le GeForce RTX 3070 n'a besoin que d'environ 10 % d'énergie en plus pour y parvenir
| Unigine Superposition | |
| 1280x720 720p Low | |
| Titan RTX | |
| MSI GeForce RTX 3070 Gaming X Trio | |
| GeForce RTX 3080 | |
| 1920x1080 1080p High | |
| GeForce RTX 3090 | |
| GeForce RTX 3080 | |
| Titan RTX | |
| MSI GeForce RTX 3070 Gaming X Trio | |
| 1920x1080 1080p Extreme | |
| GeForce RTX 3090 | |
| GeForce RTX 3080 | |
| Titan RTX | |
| MSI GeForce RTX 3070 Gaming X Trio | |
| 3840x2160 4k Optimized | |
| GeForce RTX 3090 | |
| GeForce RTX 3080 | |
| Titan RTX | |
| MSI GeForce RTX 3070 Gaming X Trio | |
| 7680x4320 8k Optimized | |
| GeForce RTX 3090 | |
| GeForce RTX 3080 | |
| Titan RTX | |
| MSI GeForce RTX 3070 Gaming X Trio | |
| 3DMark 05 Standard | 51451 points | |
| 3DMark 06 Standard Score | 42108 points | |
| 3DMark Vantage P Result | 85505 points | |
| 3DMark 11 Performance | 28358 points | |
| 3DMark Ice Storm Standard Score | 201360 points | |
| 3DMark Cloud Gate Standard Score | 59414 points | |
| 3DMark Fire Strike Score | 26306 points | |
| 3DMark Fire Strike Extreme Score | 15681 points | |
| 3DMark Time Spy Score | 12889 points | |
Aide | ||
Repères de jeu
Nous avons testé la MSI GeForce RTX 3070 Gaming X Trio avec une variété de jeux et pouvons confirmer que la carte graphique a de très bonnes performances de jeu en Full HD et en WQHD. Cependant, la GeForce RTX 3070 maîtrise également de nombreux jeux en 4K, bien que certains jeux n'atteignent que 40 FPS. Même dans cette résolution, les jeux qui ne sont pas si gourmands en matériel ne posent pas de problème au MSI GeForce RTX 3070 Gaming X Trio
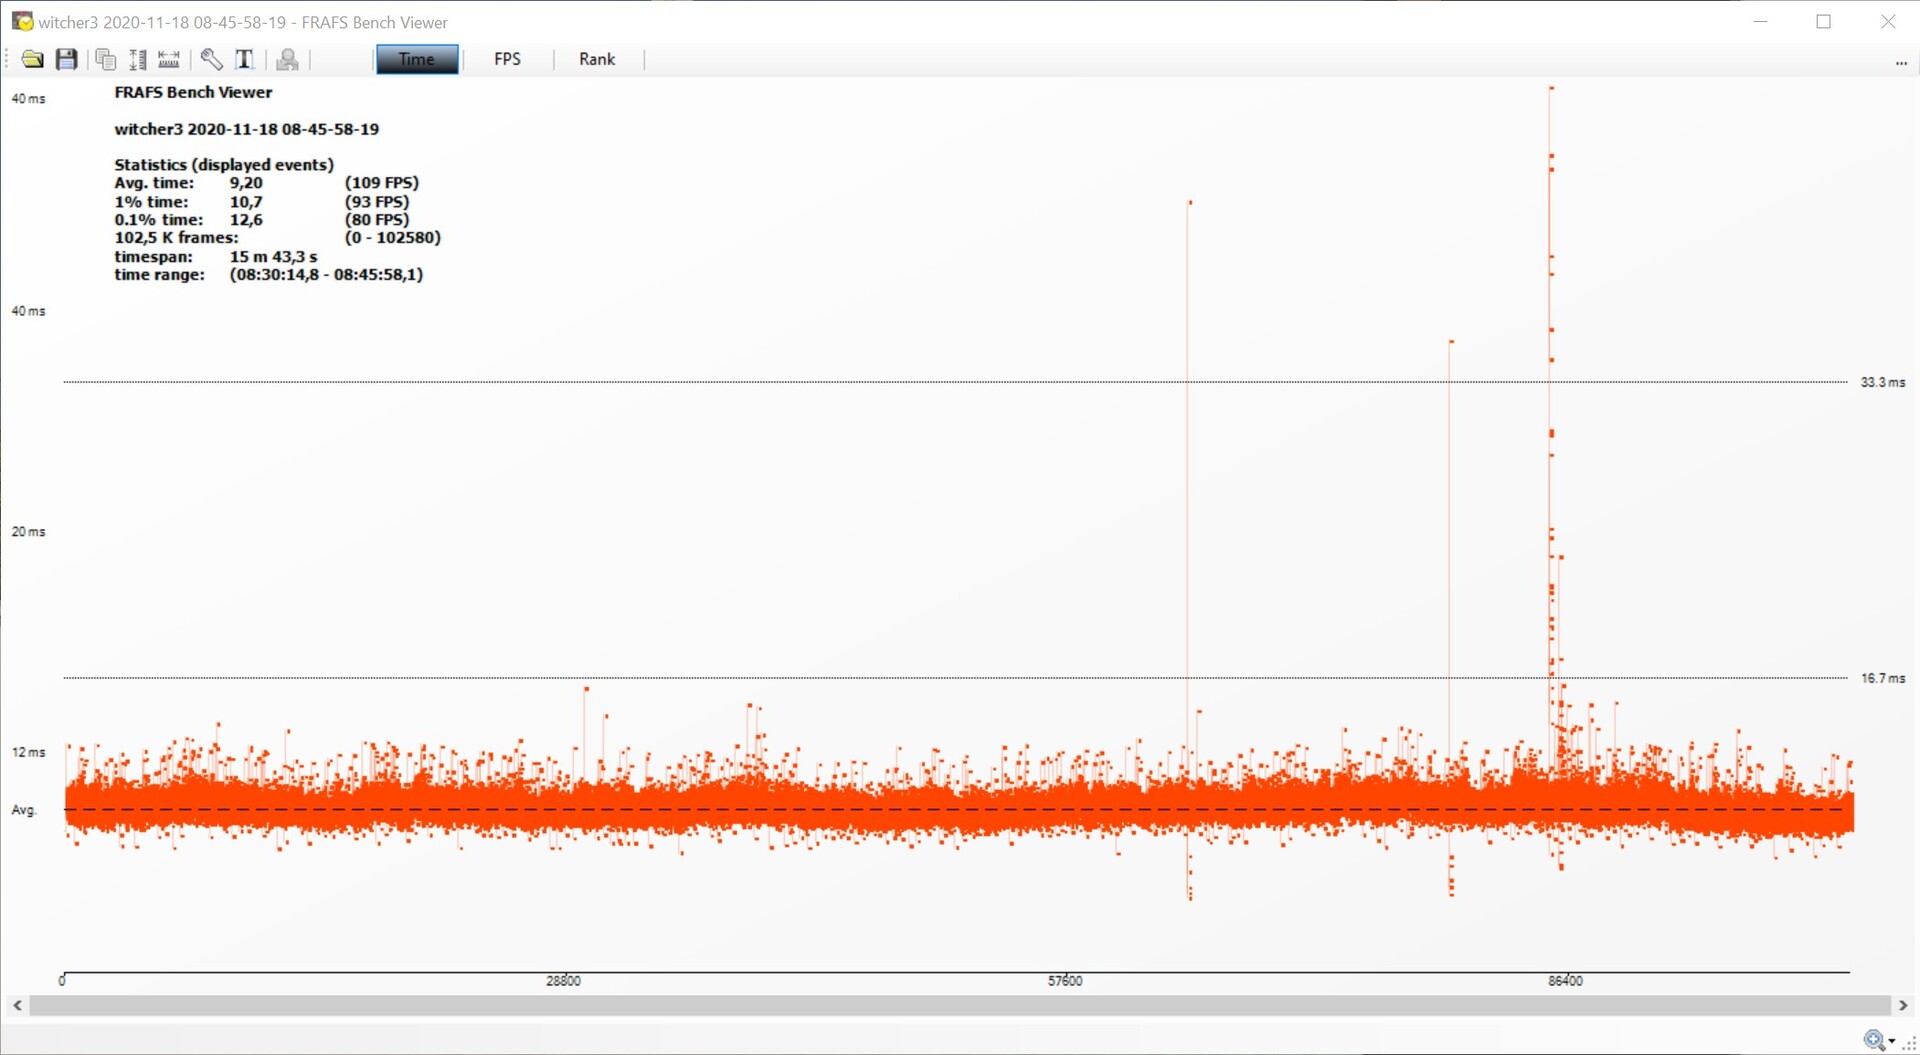
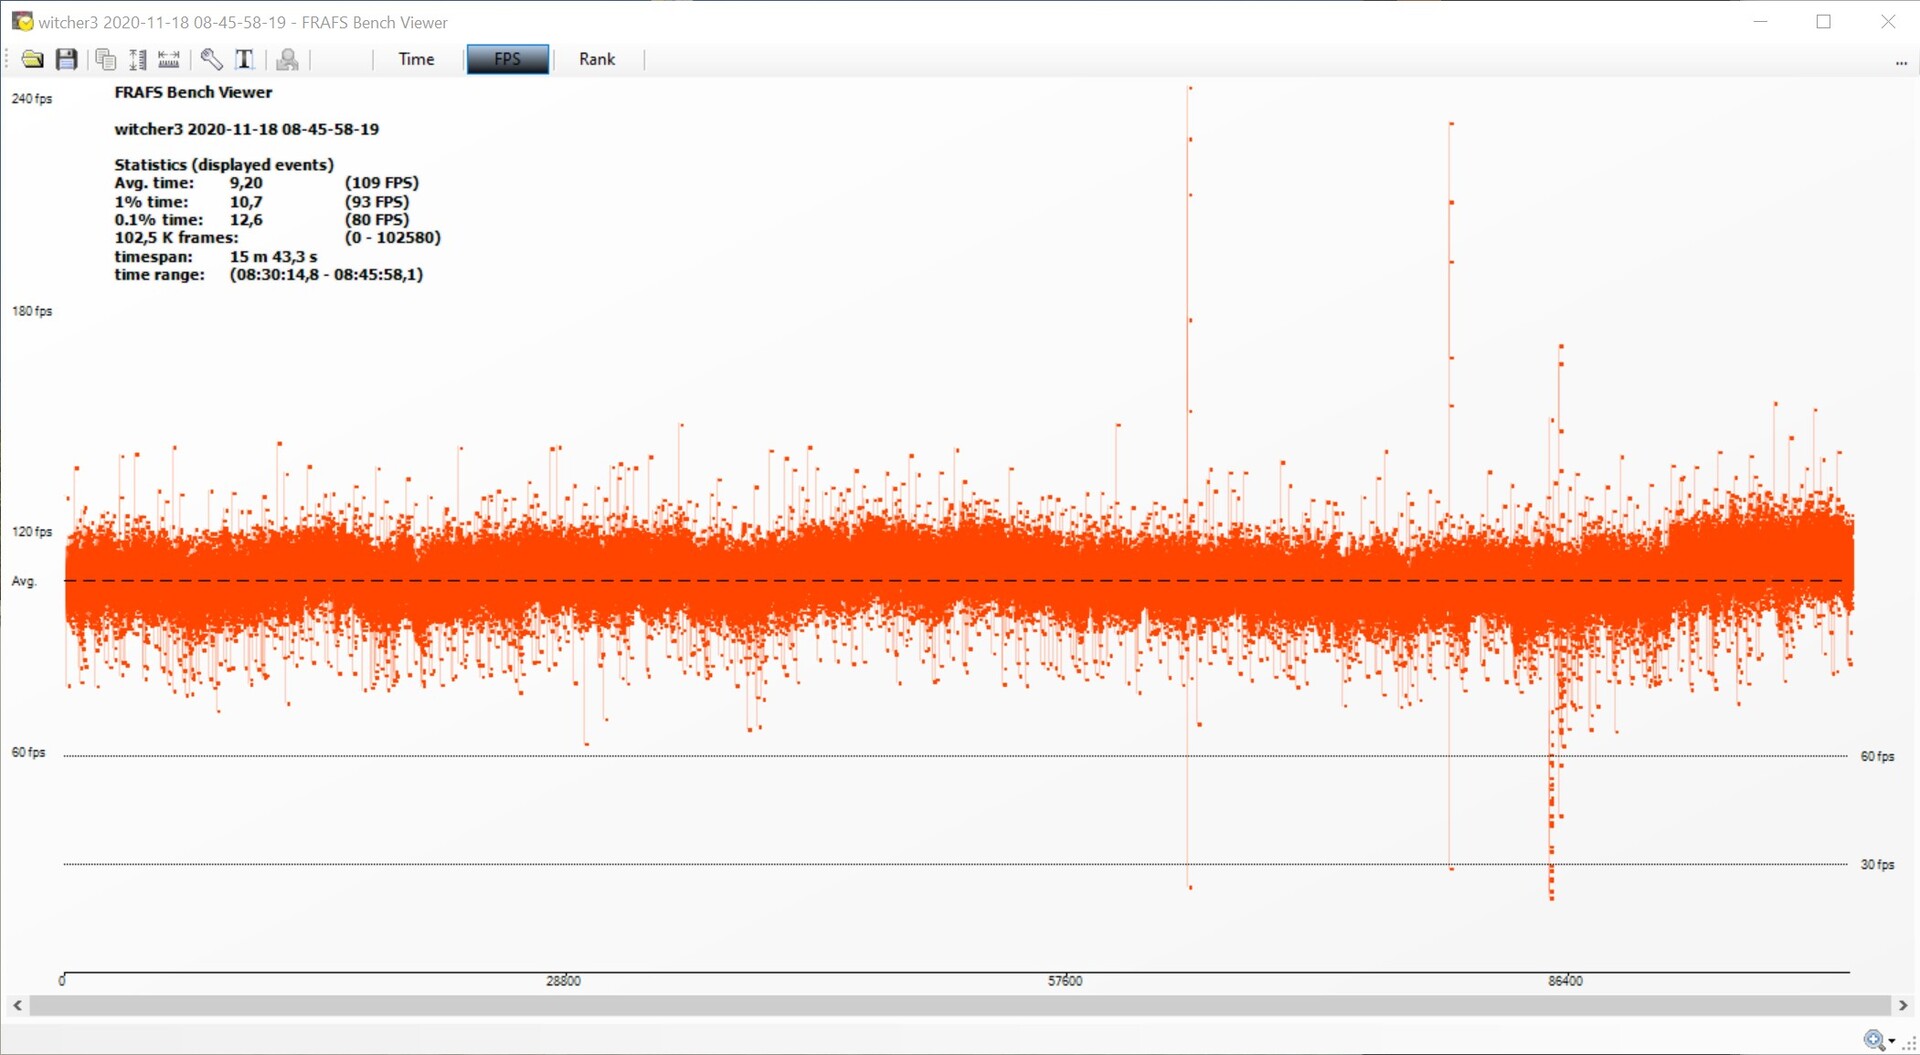
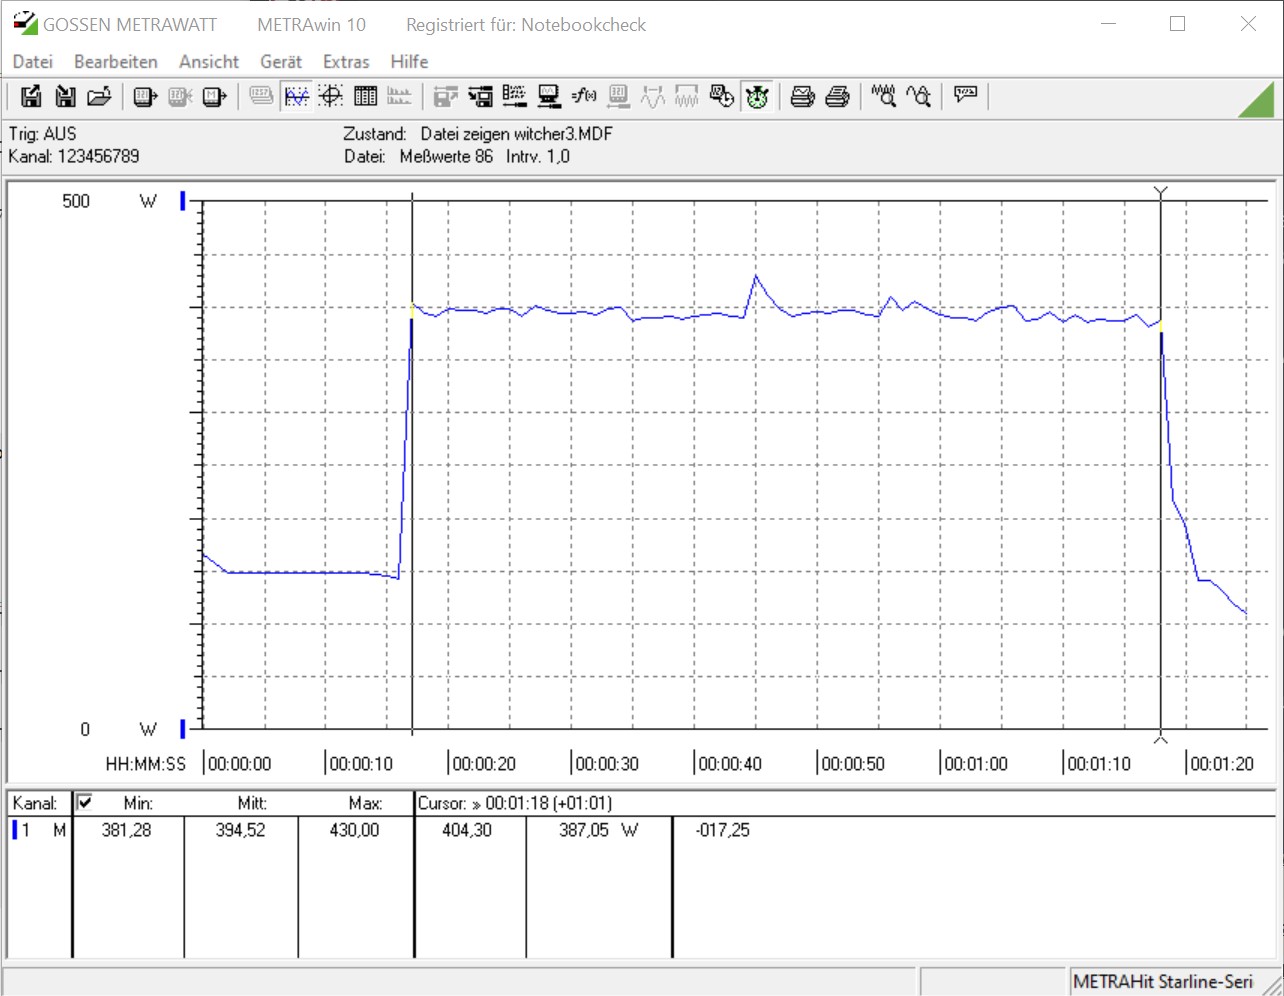
Si vous jouez principalement en 1080p ou 1440p, vous serez entièrement satisfait des performances du MSI GeForce RTX 3070 Gaming X Trio. Les 8 Go de VRAM peuvent sembler un peu limités à première vue. Néanmoins, c'est suffisant pour les jeux modernes. Avec les temps de trame et la progression des trames que nous avons enregistrés avec le jeu The Witcher 3 (Ultra preset), certaines latences plus élevées n'apparaissent que de temps en temps, mais elles n'affectent pas l'expérience de jeu de façon notable. La progression des images est également constante sur le long terme, ce qui montre une fois de plus que le système de refroidissement est efficace
Notre GeForce RTX 3070 de MSI perd à peine contre la GeForce RTX 2080 Ti dans cette comparaison. La différence de performance par rapport à la GeForce RTX 3080, plus rapide, est d'environ 25 à 30% en haute résolution (2160p).
The Witcher 3 frame progression Ultra preset
| F1 2020 - 3840x2160 Ultra High Preset AA:T AF:16x | |
| GeForce RTX 3090 | |
| GeForce RTX 3080 | |
| Titan RTX | |
| MSI GeForce RTX 3070 Gaming X Trio | |
| Borderlands 3 - 3840x2160 Badass Overall Quality (DX11) | |
| GeForce RTX 3090 | |
| GeForce RTX 3080 | |
| Titan RTX | |
| Titan RTX | |
| MSI GeForce RTX 3070 Gaming X Trio | |
| GeForce RTX 2080 Ti (Desktop) | |
| Red Dead Redemption 2 - 3840x2160 Maximum Settings | |
| GeForce RTX 3090 | |
| GeForce RTX 3080 | |
| MSI GeForce RTX 3070 Gaming X Trio | |
| Titan RTX | |
| Rise of the Tomb Raider - 3840x2160 High Preset AA:FX AF:4x | |
| GeForce RTX 3080 | |
| GeForce RTX 2080 Ti (Desktop) | |
| MSI GeForce RTX 3070 Gaming X Trio | |
| GeForce RTX 2080 Super (Desktop) | |
| GeForce RTX 2080 (Desktop) | |
| GeForce RTX 2070 Super (Desktop) | |
| GeForce RTX 2070 (Desktop) | |
| Radeon VII | |
| GeForce RTX 2060 Super (Desktop) | |
| RX Vega 64 | |
| GeForce RTX 2060 (Desktop) | |
| Shadow of the Tomb Raider - 3840x2160 Highest Preset AA:T | |
| GeForce RTX 3090 | |
| GeForce RTX 3080 | |
| Titan RTX | |
| Titan RTX | |
| MSI GeForce RTX 3070 Gaming X Trio | |
| GeForce RTX 2080 Ti (Desktop) | |
| GeForce RTX 2080 Super (Desktop) | |
| GeForce RTX 2080 (Desktop) | |
| Radeon VII | |
| GeForce RTX 2070 Super (Desktop) | |
| GeForce RTX 2070 (Desktop) | |
| Radeon RX 5700 XT (Desktop) | |
| GeForce RTX 2060 Super (Desktop) | |
| Radeon RX 5700 (Desktop) | |
| GeForce RTX 2060 (Desktop) | |
| RX Vega 64 | |
| The Witcher 3 - 3840x2160 High Graphics & Postprocessing (Nvidia HairWorks Off) | |
| GeForce RTX 3080 | |
| Titan RTX | |
| Titan RTX | |
| GeForce RTX 2080 Ti (Desktop) | |
| MSI GeForce RTX 3070 Gaming X Trio | |
| GeForce RTX 2080 Super (Desktop) | |
| GeForce RTX 2080 (Desktop) | |
| GeForce RTX 2070 Super (Desktop) | |
| GeForce RTX 2070 (Desktop) | |
| GeForce RTX 2060 Super (Desktop) | |
| Radeon VII | |
| Radeon RX 5700 XT (Desktop) | |
| GeForce RTX 2060 (Desktop) | |
| RX Vega 64 | |
| Radeon RX 5700 (Desktop) | |
| Bas | Moyen | Élevé | Ultra | QHD | 4K | |
|---|---|---|---|---|---|---|
| GTA V (2015) | 182 | 172 | 157 | 91.1 | 86.5 | 112 |
| The Witcher 3 (2015) | 451 | 350 | 224 | 122 | 88.2 | |
| Dota 2 Reborn (2015) | 162.9 | 140.5 | 137.6 | 128.6 | 123.4 | |
| Rise of the Tomb Raider (2016) | 336 | 252 | 197 | 169 | 83.8 | |
| Final Fantasy XV Benchmark (2018) | 190 | 148 | 115 | 93.9 | 56.9 | |
| X-Plane 11.11 (2018) | 143 | 117 | 95.4 | 81.1 | ||
| Far Cry 5 (2018) | 159 | 139 | 133 | 127 | 113 | 69 |
| Strange Brigade (2018) | 439 | 311 | 256 | 223 | 166 | 97.6 |
| Shadow of the Tomb Raider (2018) | 155 | 143 | 143 | 138 | 108 | 61 |
| Battlefield V (2018) | 177.5 | 144.3 | 125.8 | 113.6 | 98.8 | 69 |
| Apex Legends (2019) | 144 | 144 | 144 | 144 | 144 | 107 |
| Far Cry New Dawn (2019) | 131 | 112 | 112 | 97 | 94 | 70 |
| Metro Exodus (2019) | 156 | 136 | 113 | 91.3 | 74.4 | 49.1 |
| The Division 2 (2019) | 220 | 173 | 142 | 112 | 82 | 49 |
| Anno 1800 (2019) | 115 | 112 | 82.7 | 46.5 | 46.2 | 34.3 |
| Rage 2 (2019) | 264 | 192 | 168 | 163 | 110 | 56.7 |
| Control (2019) | 238 | 147 | 122 | 82.5 | 42.3 | |
| Borderlands 3 (2019) | 142 | 129 | 111 | 95.8 | 75.9 | 44.2 |
| Star Wars Jedi Fallen Order (2019) | 106 | 106 | 104 | 102 | 67.6 | |
| Red Dead Redemption 2 (2019) | 168 | 156 | 119 | 78 | 65 | 44 |
| Hunt Showdown (2020) | 216 | 192 | 180 | 138 | 70.2 | |
| Doom Eternal (2020) | 246 | 246 | 244 | 237 | 208 | 116 |
| F1 2020 (2020) | 321 | 288 | 249 | 179 | 146 | 89.2 |
| Horizon Zero Dawn (2020) | 172 | 152 | 132 | 125 | 109 | 77 |
| Flight Simulator 2020 (2020) | 115 | 97.4 | 79.9 | 62.8 | 55.6 | 37.3 |
| Serious Sam 4 (2020) | 161.2 | 130.6 | 121.3 | 104.2 | 91.3 | 67.6 |
| Mafia Definitive Edition (2020) | 152 | 128 | 124 | 98.7 | 56.6 | |
| Star Wars Squadrons (2020) | 382 | 316 | 292 | 268 | 207 | 128 |
| FIFA 21 (2020) | 150 | 152 | 156 | 152 | 156 | 160 |
| Watch Dogs Legion (2020) | 100 | 100 | 88.9 | 79 | 65.7 | 37 |
| Dirt 5 (2020) | 169 | 119 | 102 | 86 | 74 | 52.9 |
| Assassin´s Creed Valhalla (2020) | 125 | 100 | 87 | 78 | 67 | 47 |
| Call of Duty Black Ops Cold War (2020) | 205 | 186 | 132 | 122 | 107 | 74 |
Calcul des performances
Dans LuxMark et ComputeMark, le MSI GeForce RTX 3070 Gaming X Trio est de nouveau en compétition avec leGeForce RTX 2080 Ti et peut donc aussi clairement surpasser leGeForce RTX 2070 Super. Cependant, la différence avec la GeForce RTX 3080, plus rapide, est ici plus faible que dans les benchmarks de jeux purs. Par rapport aux cartes graphiques pour stations de travail, les cartes GeForce ne sont pas optimisées au niveau des pilotes.
Émissions du MSI GeForce RTX 3070 Gaming X Trio
La GeForce RTX 3070 Gaming X Trio de MSI est dotée d'un BIOS de 240 watts, dans lequel la carte graphique se laisse également aller sous charge. C'est un peu moins que sur la GeForce RTX 2080 Ti, tout aussi rapide, mais aussi un peu plus que sur le modèle de référence de Nvidia.
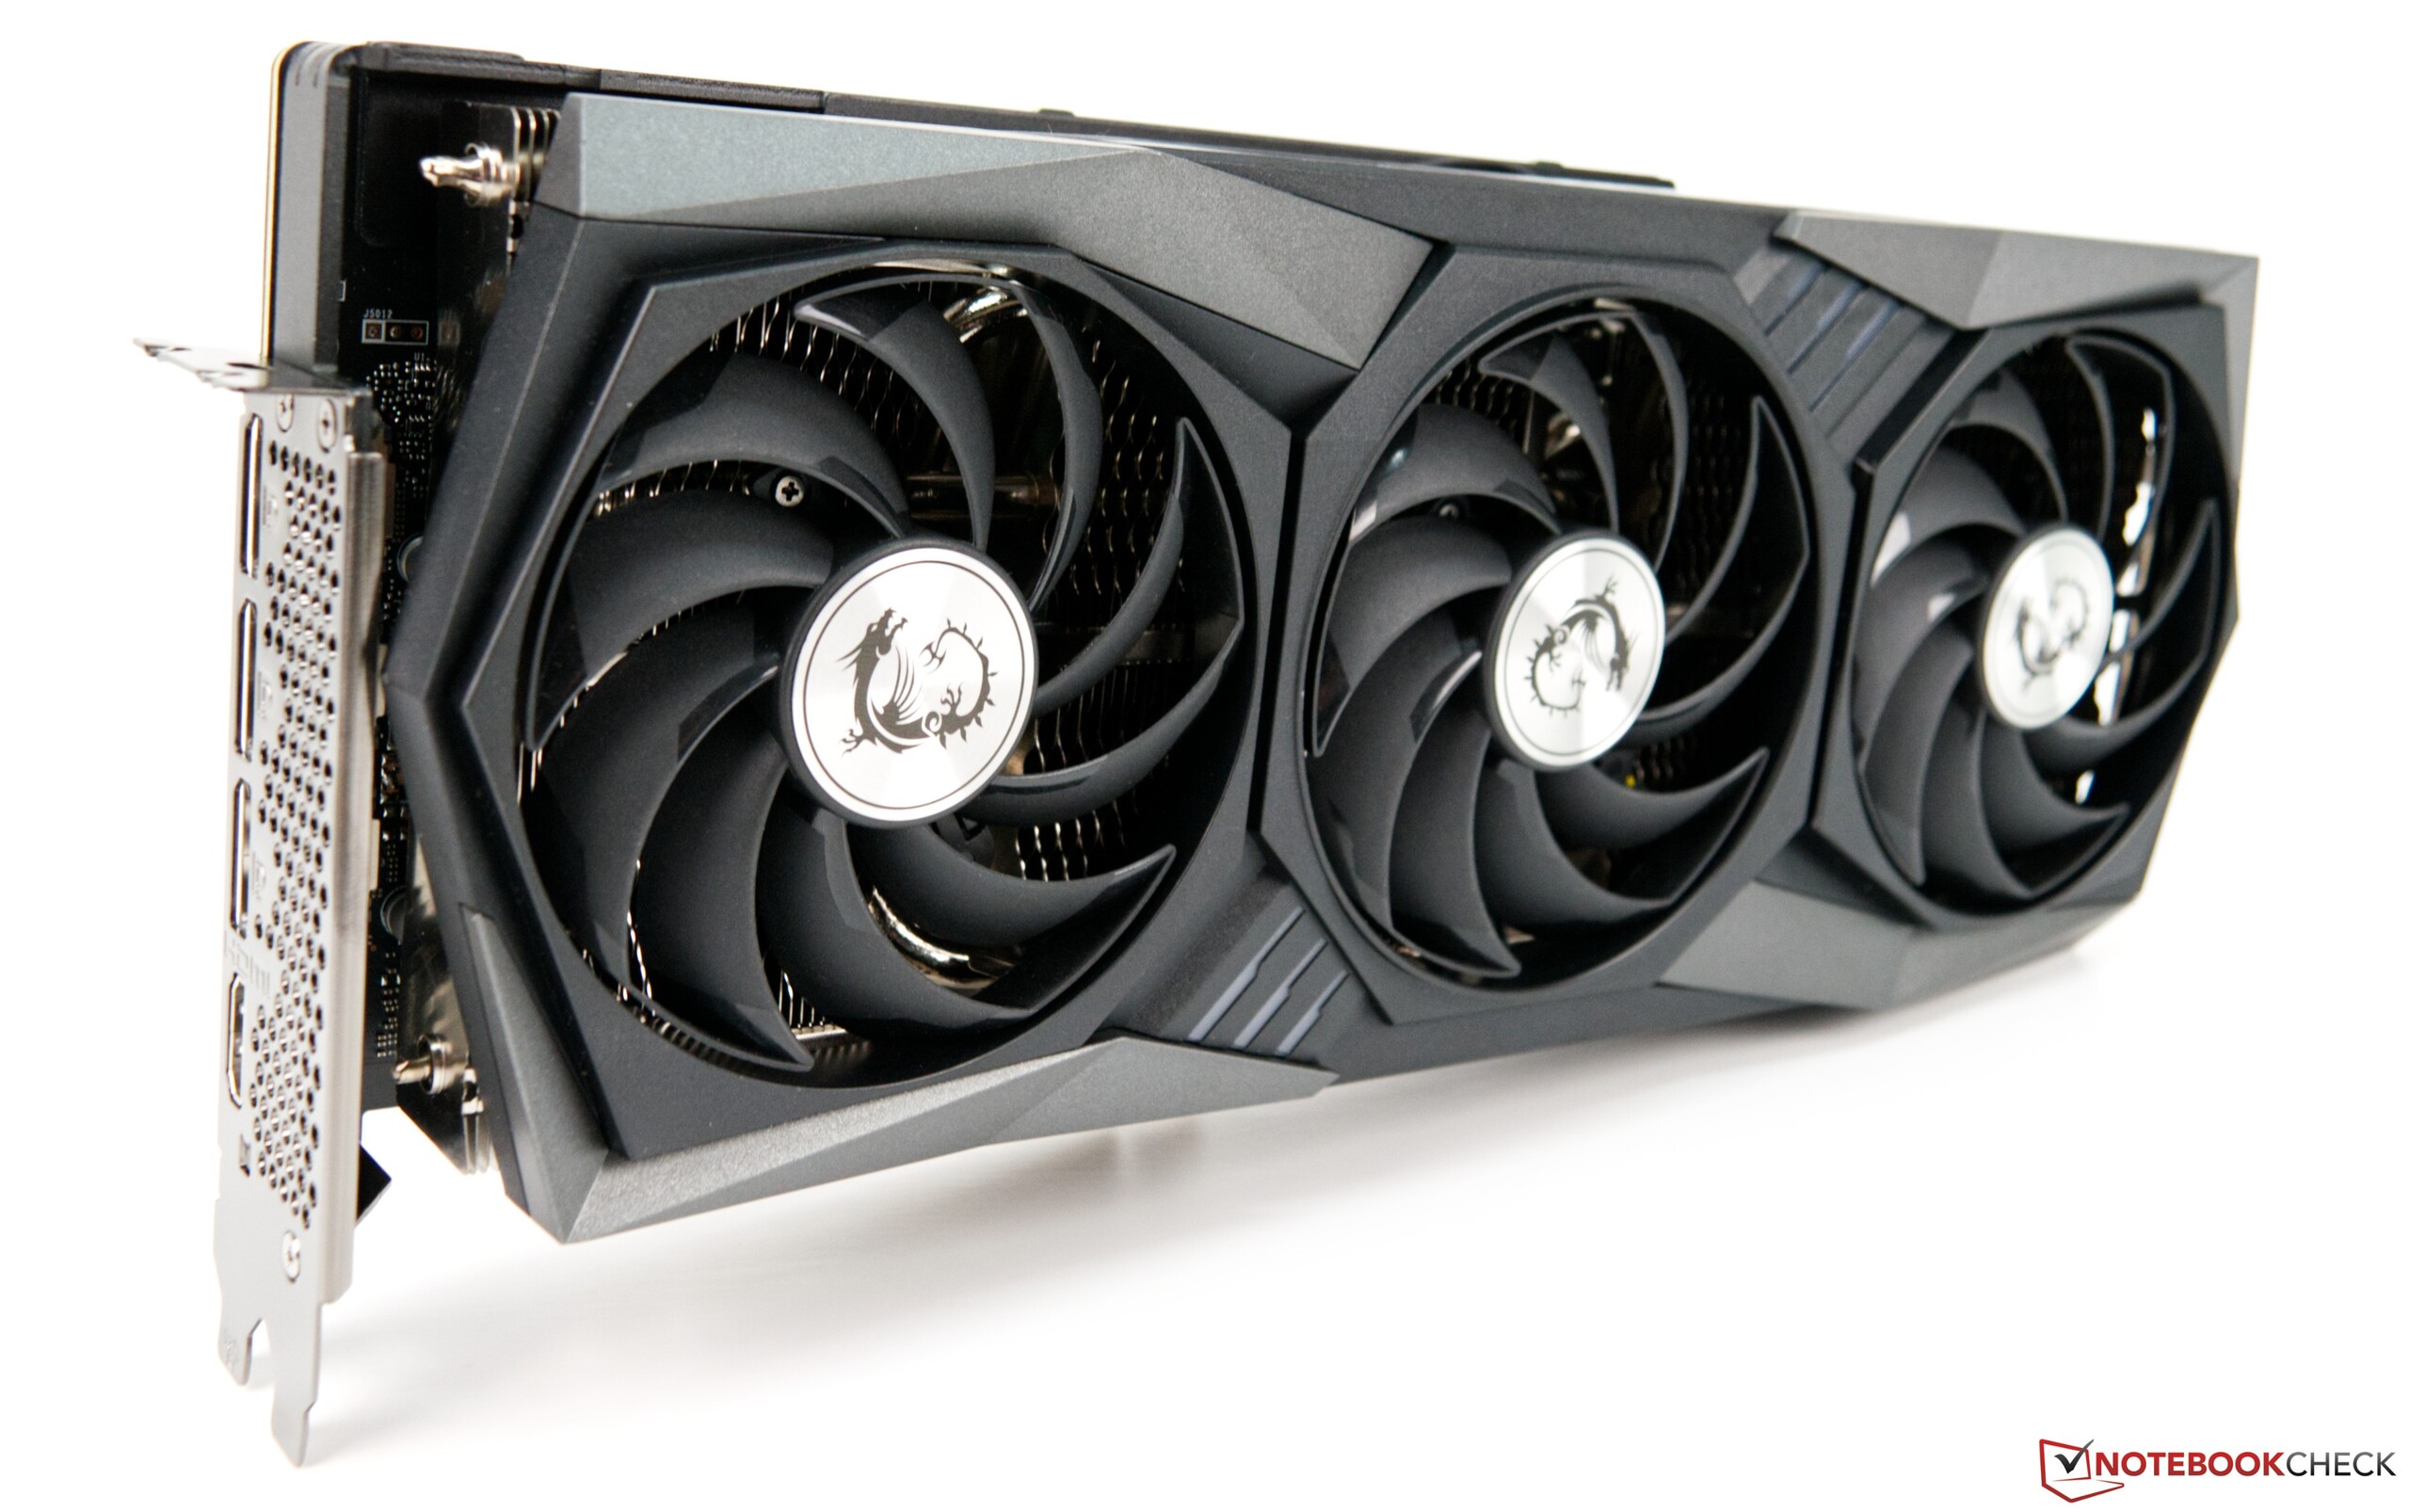
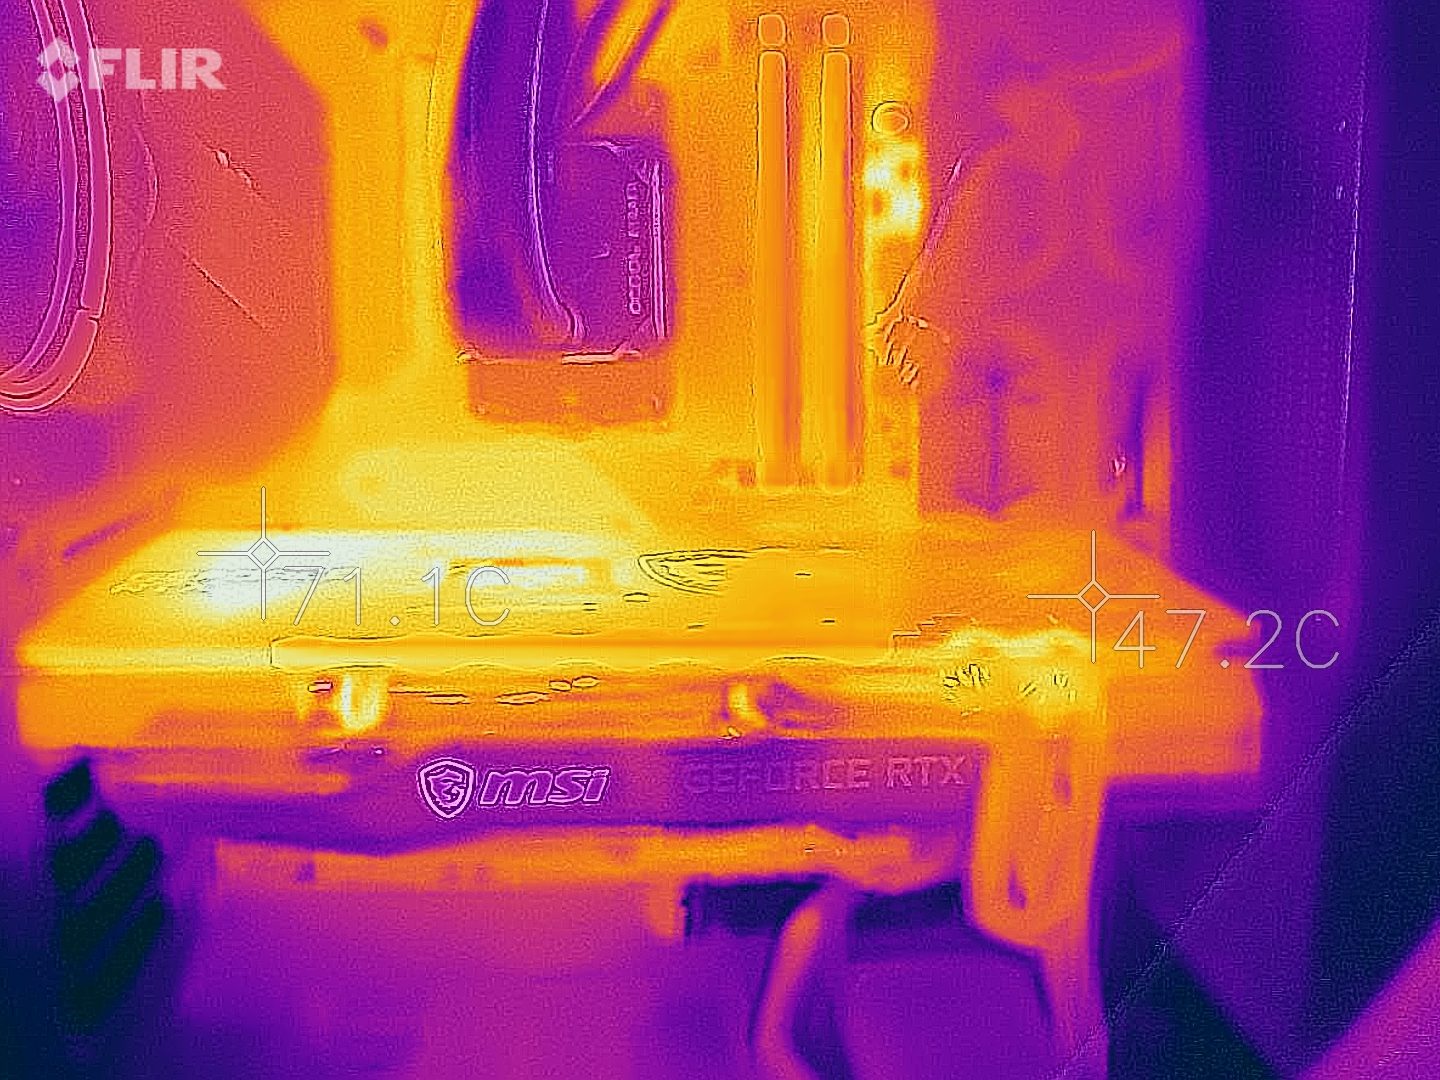
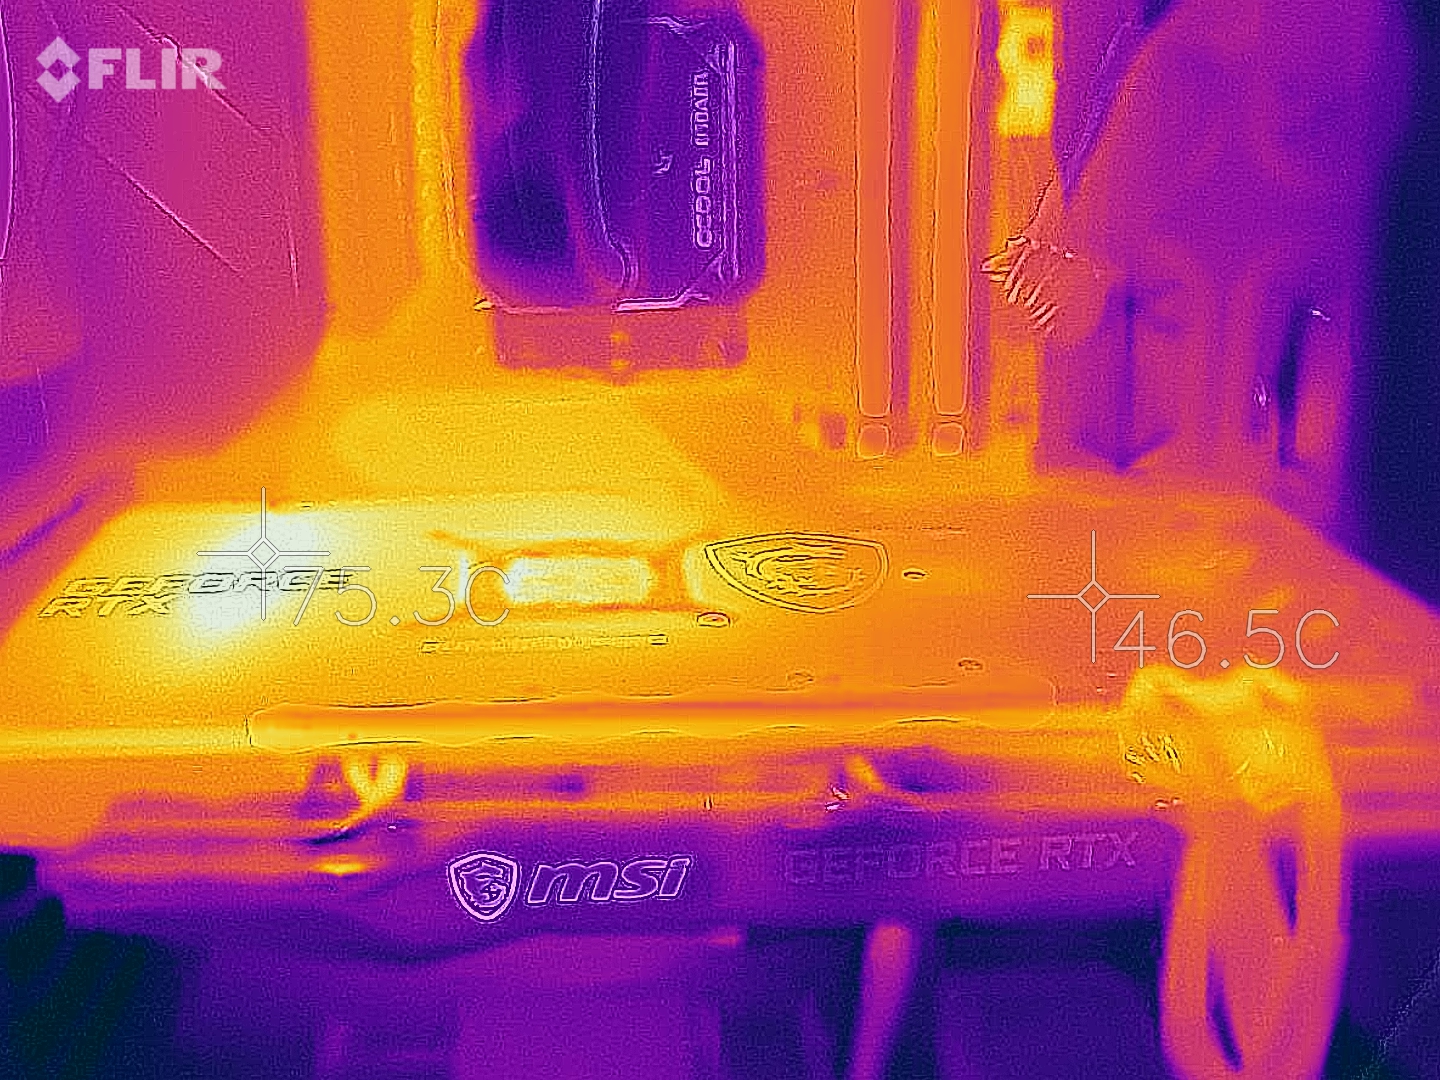
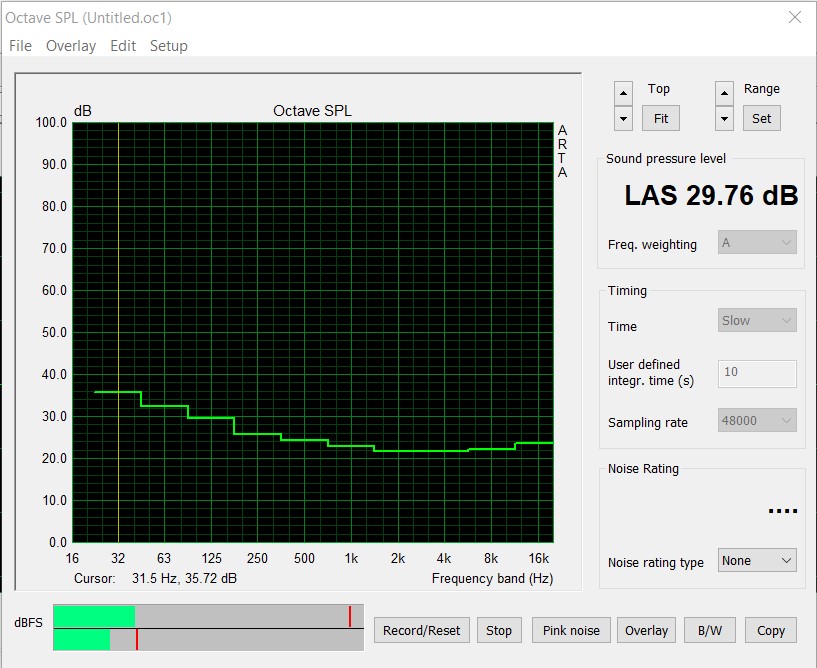
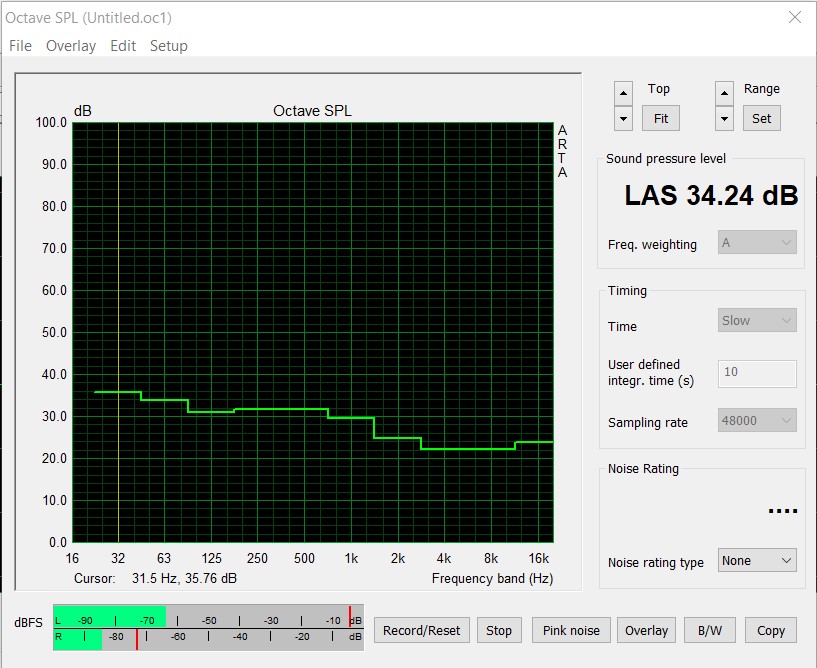
L'unité de refroidissement de la carte graphique Gaming X Trio est très grande, ce dont il faut tenir compte lors du choix d'un boîtier. En retour, le refroidisseur intégré fait un excellent travail et refroidit la carte graphique de manière fiable et silencieuse. Sans charge, les ventilateurs restent immobiles, de sorte qu'aucun bruit n'est généré. Ce n'est qu'en charge que les trois ventilateurs axiaux se mettent en marche un peu. Nous n'avons cependant pu mesurer qu'un maximum de 34,24 dB(A) dans le test de stress. Par conséquent, cette carte graphique est très silencieuse, même sous charge. Néanmoins, la température du GPU reste très éloignée des niveaux critiques à un maximum de 67 °C (~153 °F).
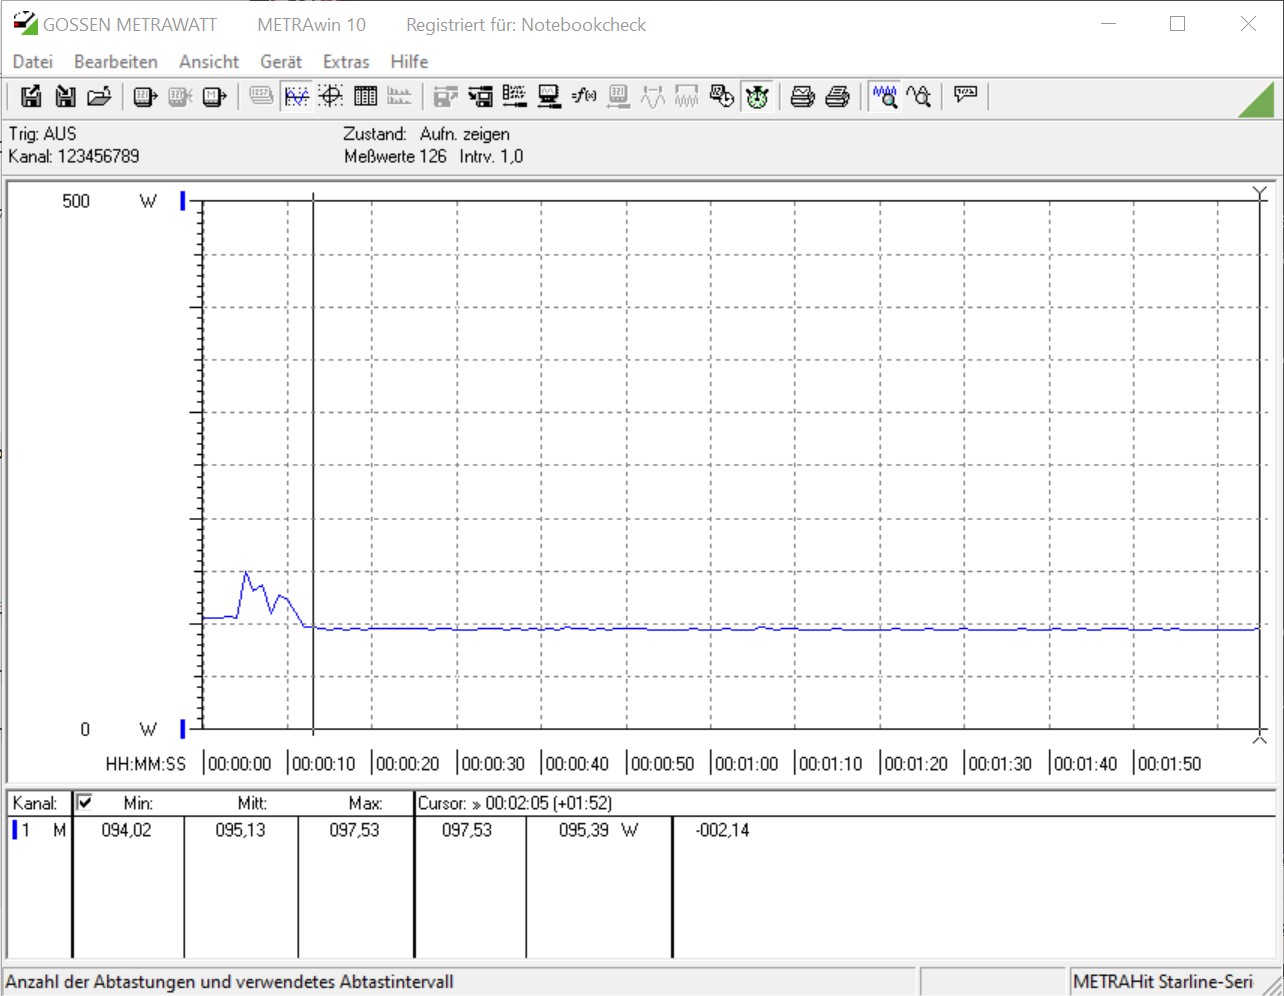
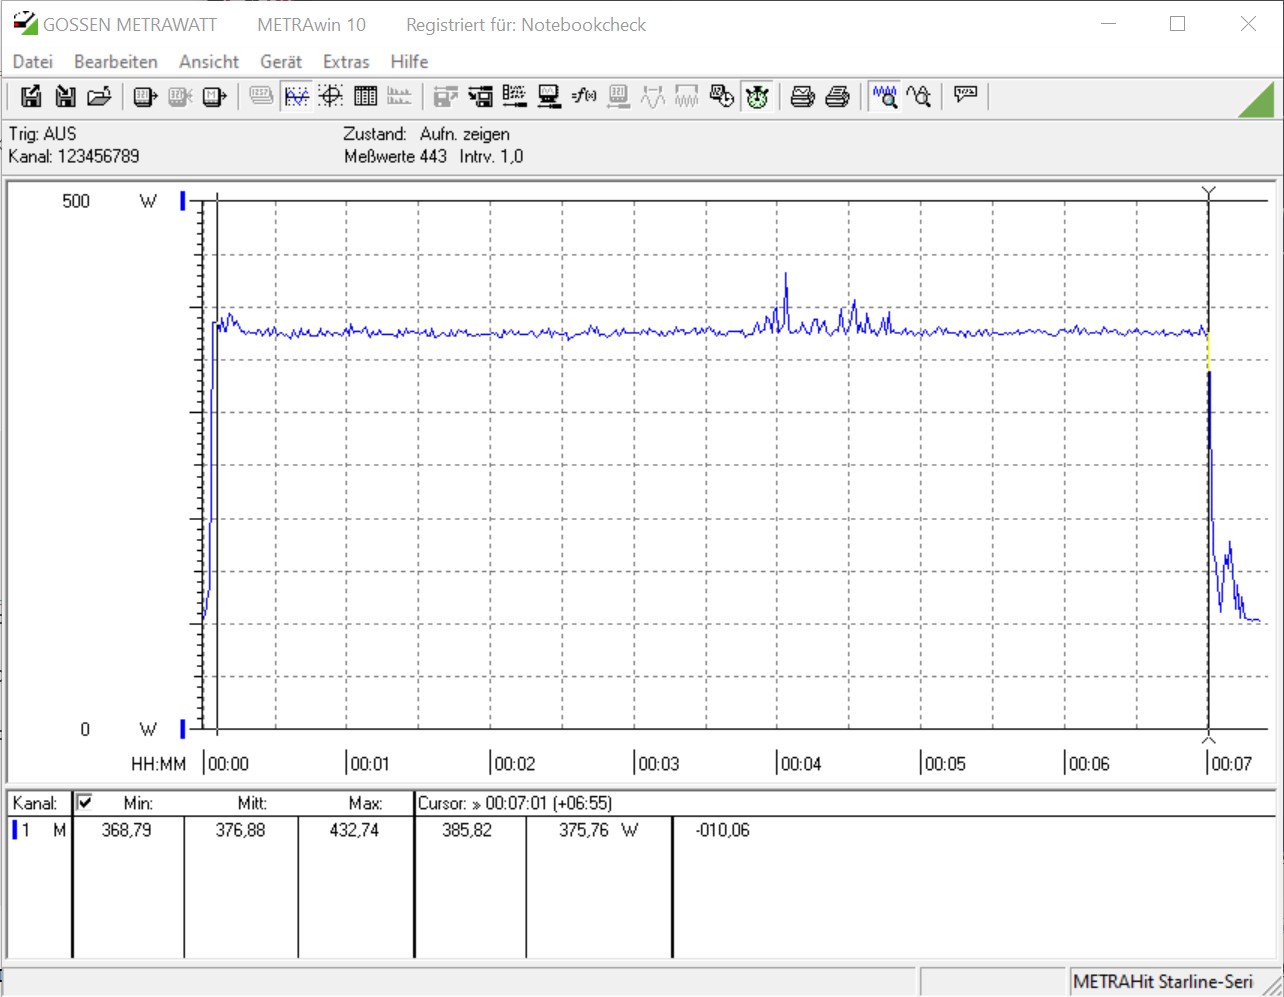
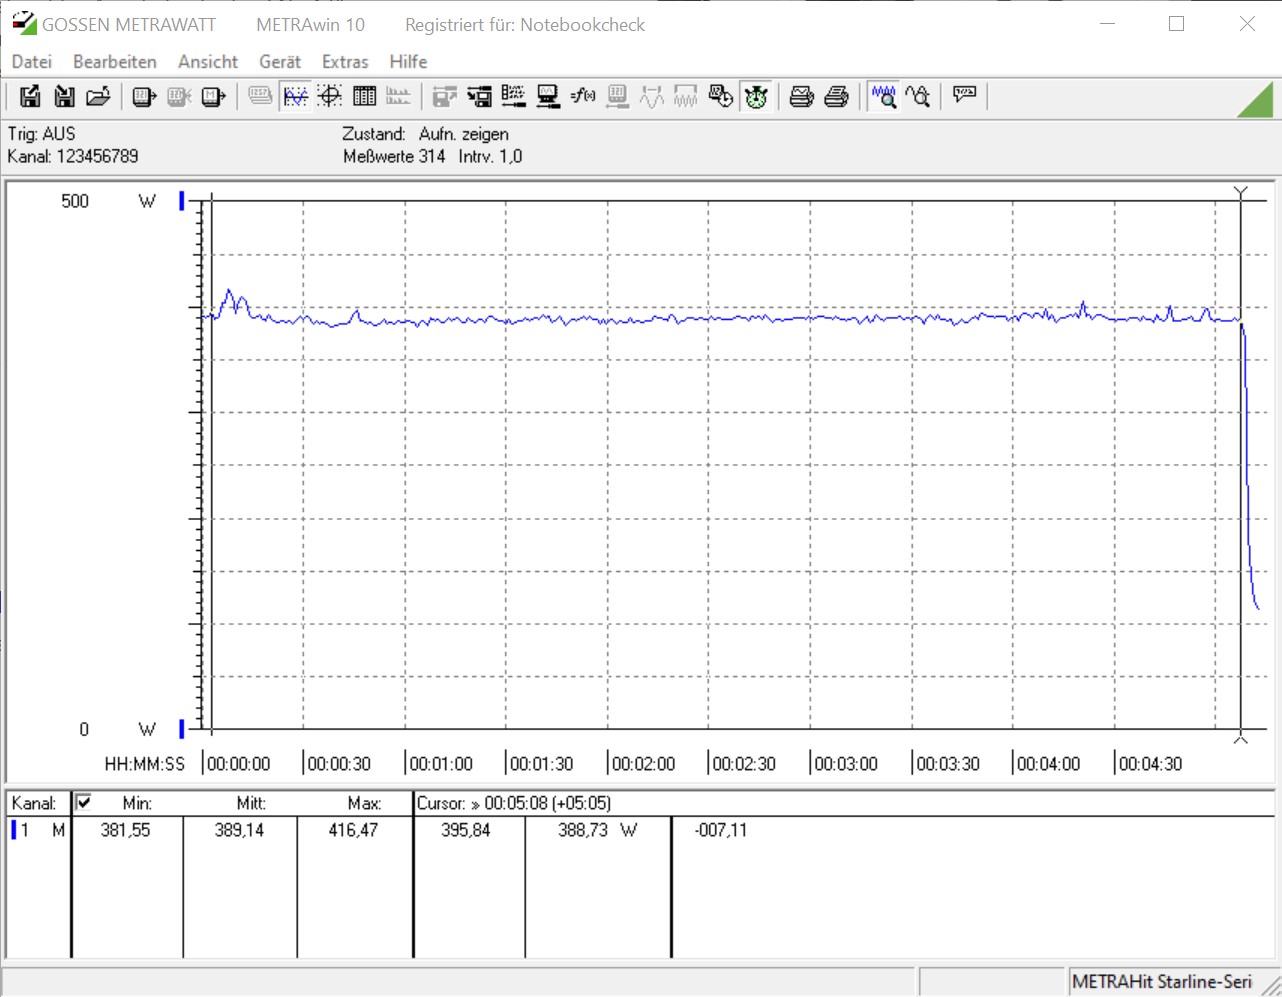
En ce qui concerne la consommation d'énergie, la GeForce RTX 3070 Gaming X Trio de MSI se comporte assez bien. Le système de test nécessite environ 95 watts en mode veille. Mais en même temps, 394 watts sont prélevés sur la prise de courant pendant le jeu. Mais le résultat est quand même bon au final, car le GeForce RTX 2080 Ti a toujours eu besoin d'un peu plus d'énergie dans notre test. La différence avec la GeForce RTX 2070 Super est relativement faible.
* ... Moindre est la valeur, meilleures sont les performances
Points positifs
Points négatifs
Verdict - Presque inaudible malgré un TDP plus élevé


Le GeForce RTX 3070 est toujours le plus petit GPU en ampères pour le marché grand public à ce jour. Avec le GeForce RTX 3070 Gaming X Trio, MSI continue de développer très bien la série Gaming X Trio. L'échantillon testé offre plus de performances grâce à un TDP plus élevé, ce qui se traduit par une vitesse de boost légèrement supérieure. Mais le très bon refroidisseur contribue également à ne pas avoir à sacrifier les performances sous charge. En outre, le GPU n'a jamais atteint les températures critiques. Néanmoins, la carte graphique est à peine audible dans un boîtier fermé.
Lorsque la carte graphique sera disponible, elle vous rapportera actuellement près de 720 euros (~857 dollars). C'est nettement supérieur au prix de vente conseillé que MSI a fixé pour le GeForce Gaming X Trio. Selon le fabricant, cette valeur est de 559 euros (~$665). Il est compréhensible que ces cartes partenaires coûtent un peu plus cher que les modèles de référence en raison du très bon refroidisseur et de l'éclairage RGB. Mais pour l'instant, les stocks très rares font grimper le prix encore plus.
Les propriétaires d'uneGeForce RTX 2080 Ti peuvent rester immobiles et se détendre, car une mise à niveau ne vaut pas la peine dans ce cas. Les utilisateurs qui jouent encore avec un GPU Pascal tel que le GTX 1070ou leGTX 1080peuvent cependant envisager une mise à niveau, car l'augmentation des performances est ici notablement perceptible.
Avec la GeForce RTX 3070 Gaming X Trio, MSI dispose non seulement d'une carte graphique très silencieuse avec un GPU Ampère sur le marché, mais il augmente également la limite TDP pour obtenir des performances légèrement supérieures.
Outre le prix, qui est le seul point de critique que l'on peut mentionner actuellement, la taille de la carte graphique pourrait également être incluse à ce stade. Mais en même temps, la taille de la carte est également responsable du faible niveau de bruit sous charge, car une carte de grande taille permet une meilleure répartition de la chaleur. Donc, si vous voulez acheter le GeForce RTX 3070 Gaming X Trio, vous devez en tenir compte lors du choix du boîtier. En ce qui concerne le choix de l'alimentation électrique, vous êtes bien servi avec un bloc d'alimentation de 650 watts.
Tous les repères et valeurs de test pour le RTX 3070 sont disponibles sur lesite de la carte graphique pour la GeForce RTX 3070 (régulièrement mis à jour).

