Verdict - Un hybride jeu-créateur réussi
Comme il sied à un ordinateur portable "pro", le design gaming un peu plus simple peut également séduire les créateurs de contenu. En outre, nous avons été particulièrement impressionnés par l'excellent écran OLED du Legion Pro 5 16 et par ses puissantes performances 3D. Dans la catégorie des ordinateurs portables 16 pouces, RTX 5070 Ti, le Legion Pro est certainement l'un des meilleurs représentants en termes de performances et de qualité de construction. En outre, les critiques de son prédécesseur ont été éliminées, ce qui signifie que la question initiale de savoir si Lenovo a travaillé sur les faiblesses tout en conservant les forces peut être répondue par l'affirmative.
Cependant, on a l'impression que Lenovo, peut-être à cause de l'OLED, a dû faire des économies sur d'autres points. C'est particulièrement vrai pour le matériel, dont certains éléments ne sont plus tout à fait à jour. Deux des trois ports USB-A ne transmettent qu'à 5 Gbps au lieu de 10 Gbps, il n'y a pas de Thunderbolt 5 (seulement 4 Gbps), pas de Wi-Fi 6E, ni de Wi-Fi 7. Il n'y a pas non plus de lecteur de carte SD, ce qui risque d'agacer les créateurs. Les chutes d'images lors de la lecture d'une vidéo YouTube en haute résolution ou le volume relativement élevé à haute performance posent également problème. Un autre point négatif est la quantité croissante de publicité que Lenovo inclut dans ses diverses solutions logicielles plus ou moins obligatoires. C'est un domaine où Lenovo devrait faire un pas en arrière pour le bien de ses clients !
Points positifs
Points négatifs
Prix et disponibilité
Ce modèle est encore difficile à trouver et n'est pas listé sur les différents portails de comparaison. En Allemagne, seul le modèle avec la RTX 5070 (sans le "Ti") est disponible à partir de 2 400 € (environ 2 880 $).
Table des matières
- Verdict - Un hybride jeu-créateur réussi
- Spécifications
- Etui - Un élégant aimant à empreintes digitales
- Caractéristiques - Une version un peu ancienne de Legion Pro
- Périphériques d'entrée - Bon pour un joueur
- Écran - Un OLED éblouissant
- Performance - Une performance 3D puissante
- Emissions - Un ordinateur portable professionnel très bruyant
- Gestion de l'énergie - La batterie pourrait être plus grande
- Notebookcheck note globale
- Comparaison des alternatives possibles
L'année dernière, le Legion Pro 5 16 ou le Legion Pro 5i figuraient parmi les meilleurs et les plus populaires ordinateurs portables de jeu. Les principales critiques concernaient le SSD qui s'étrangle thermiquement, le poids et le système de refroidissement quelque peu inégal. Cependant, les performances du CPU et du GPU étaient supérieures à la moyenne. Quels sont les changements apportés par Lenovo à son successeur ?
Spécifications
Etui - Un élégant aimant à empreintes digitales
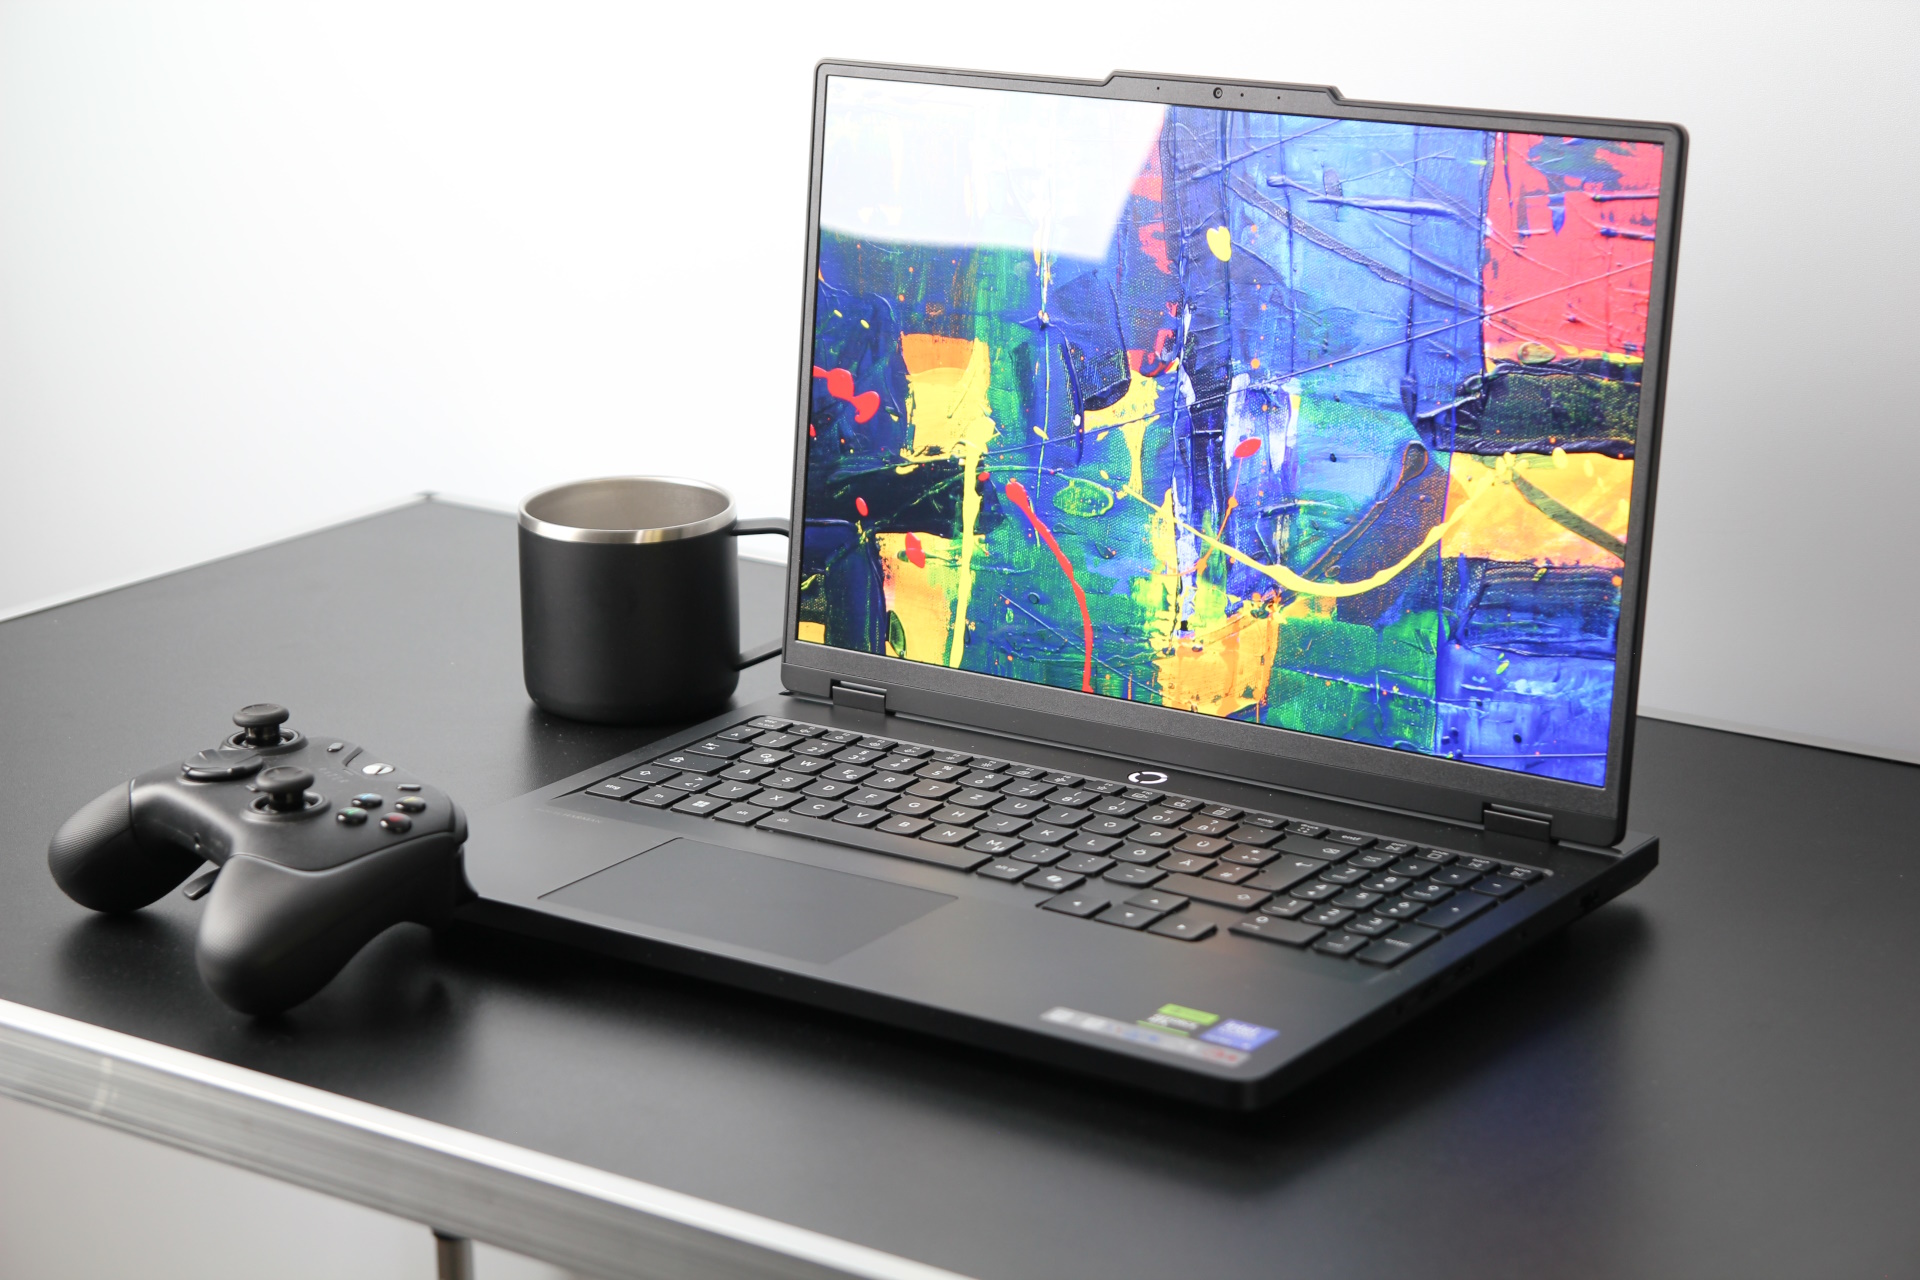
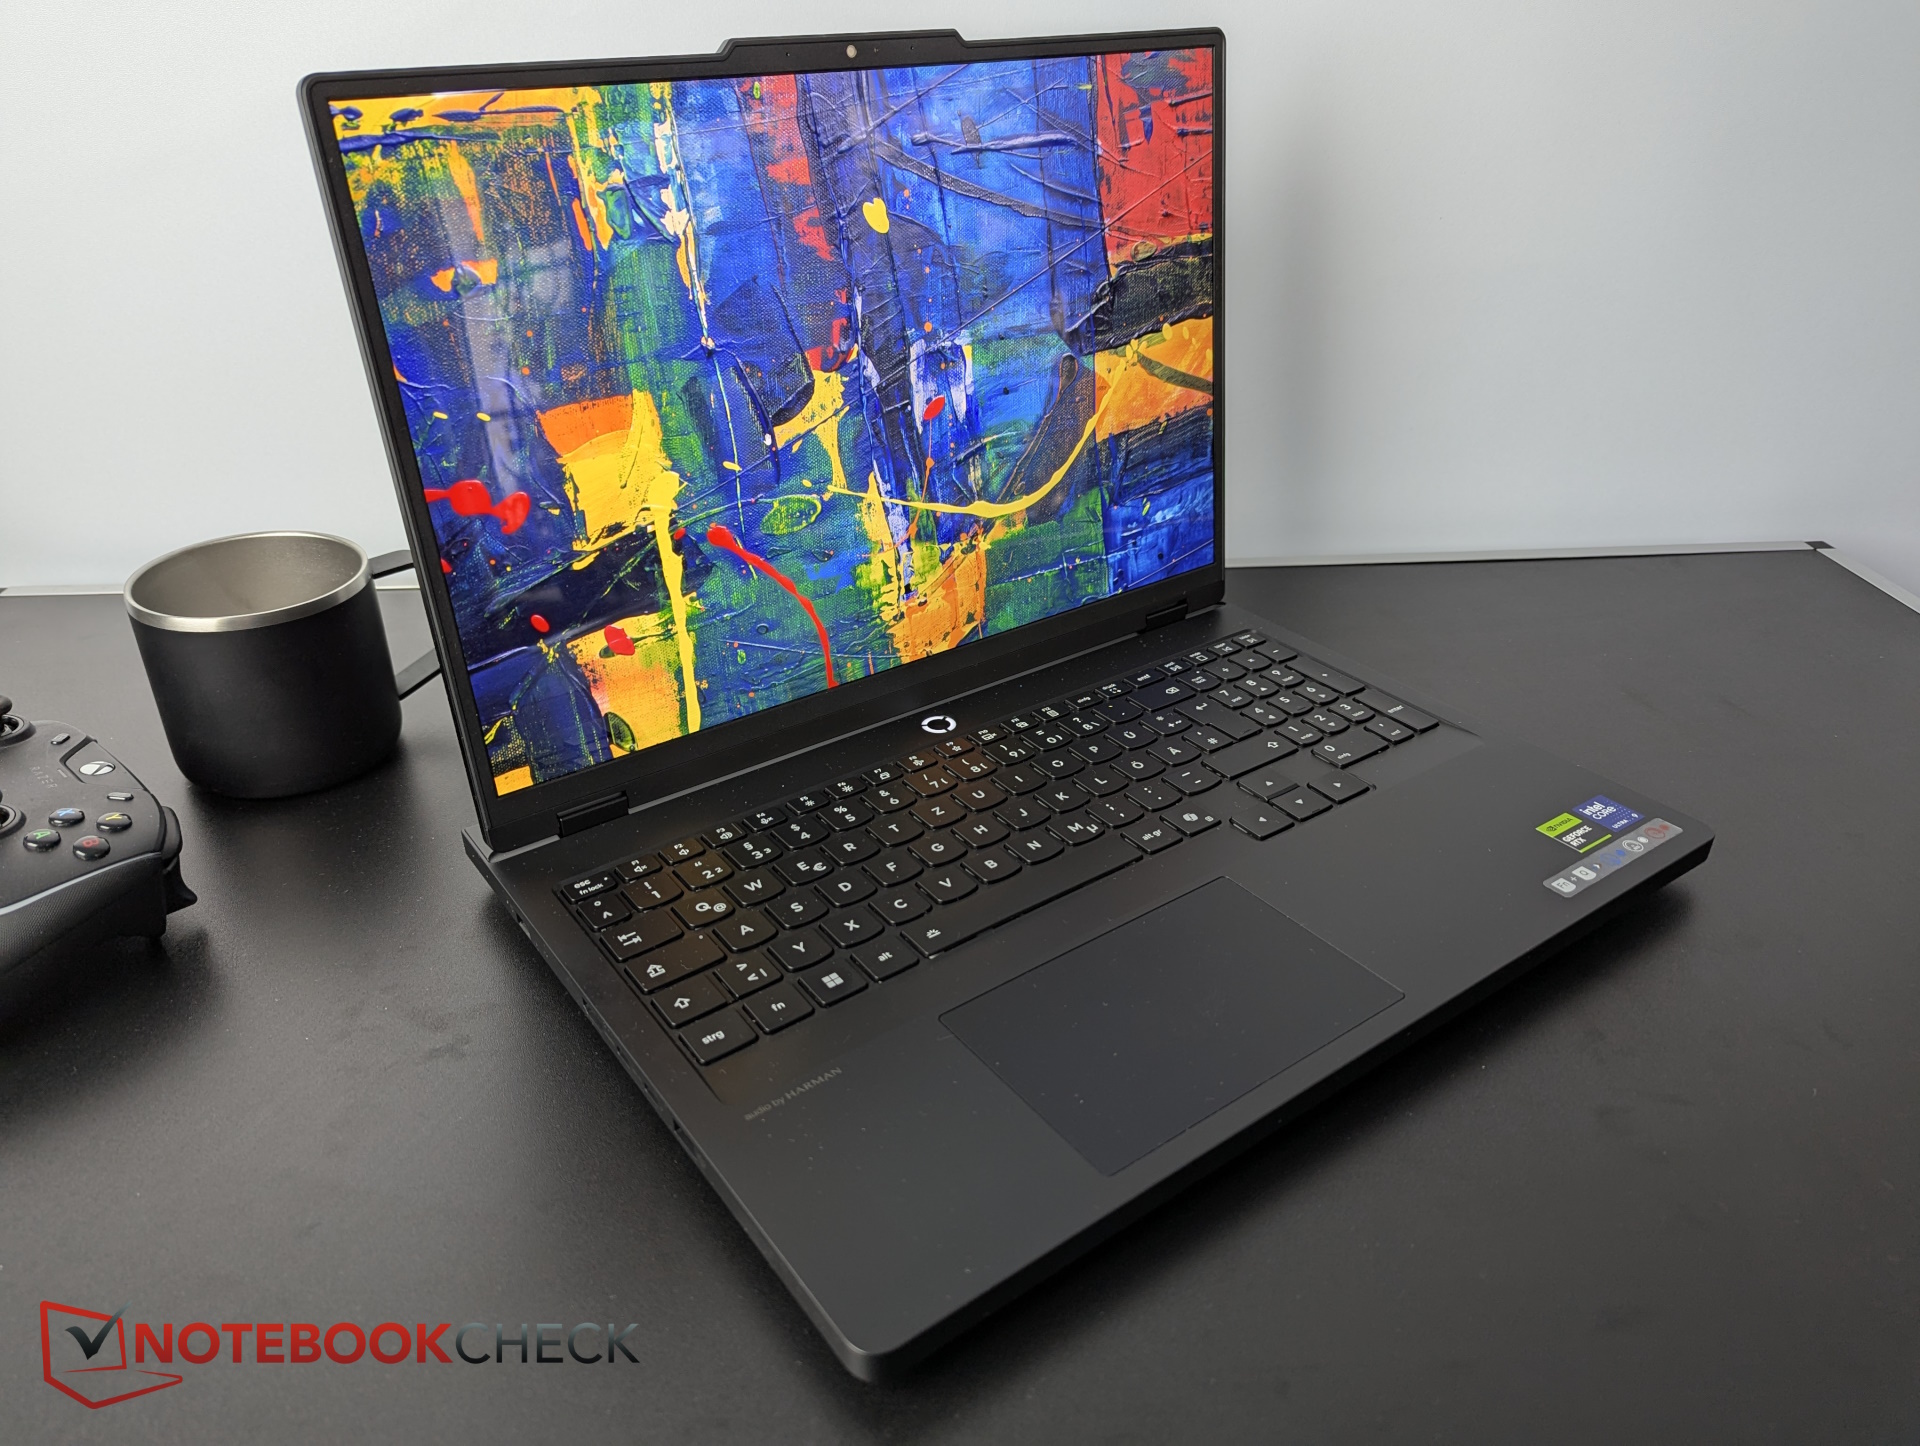
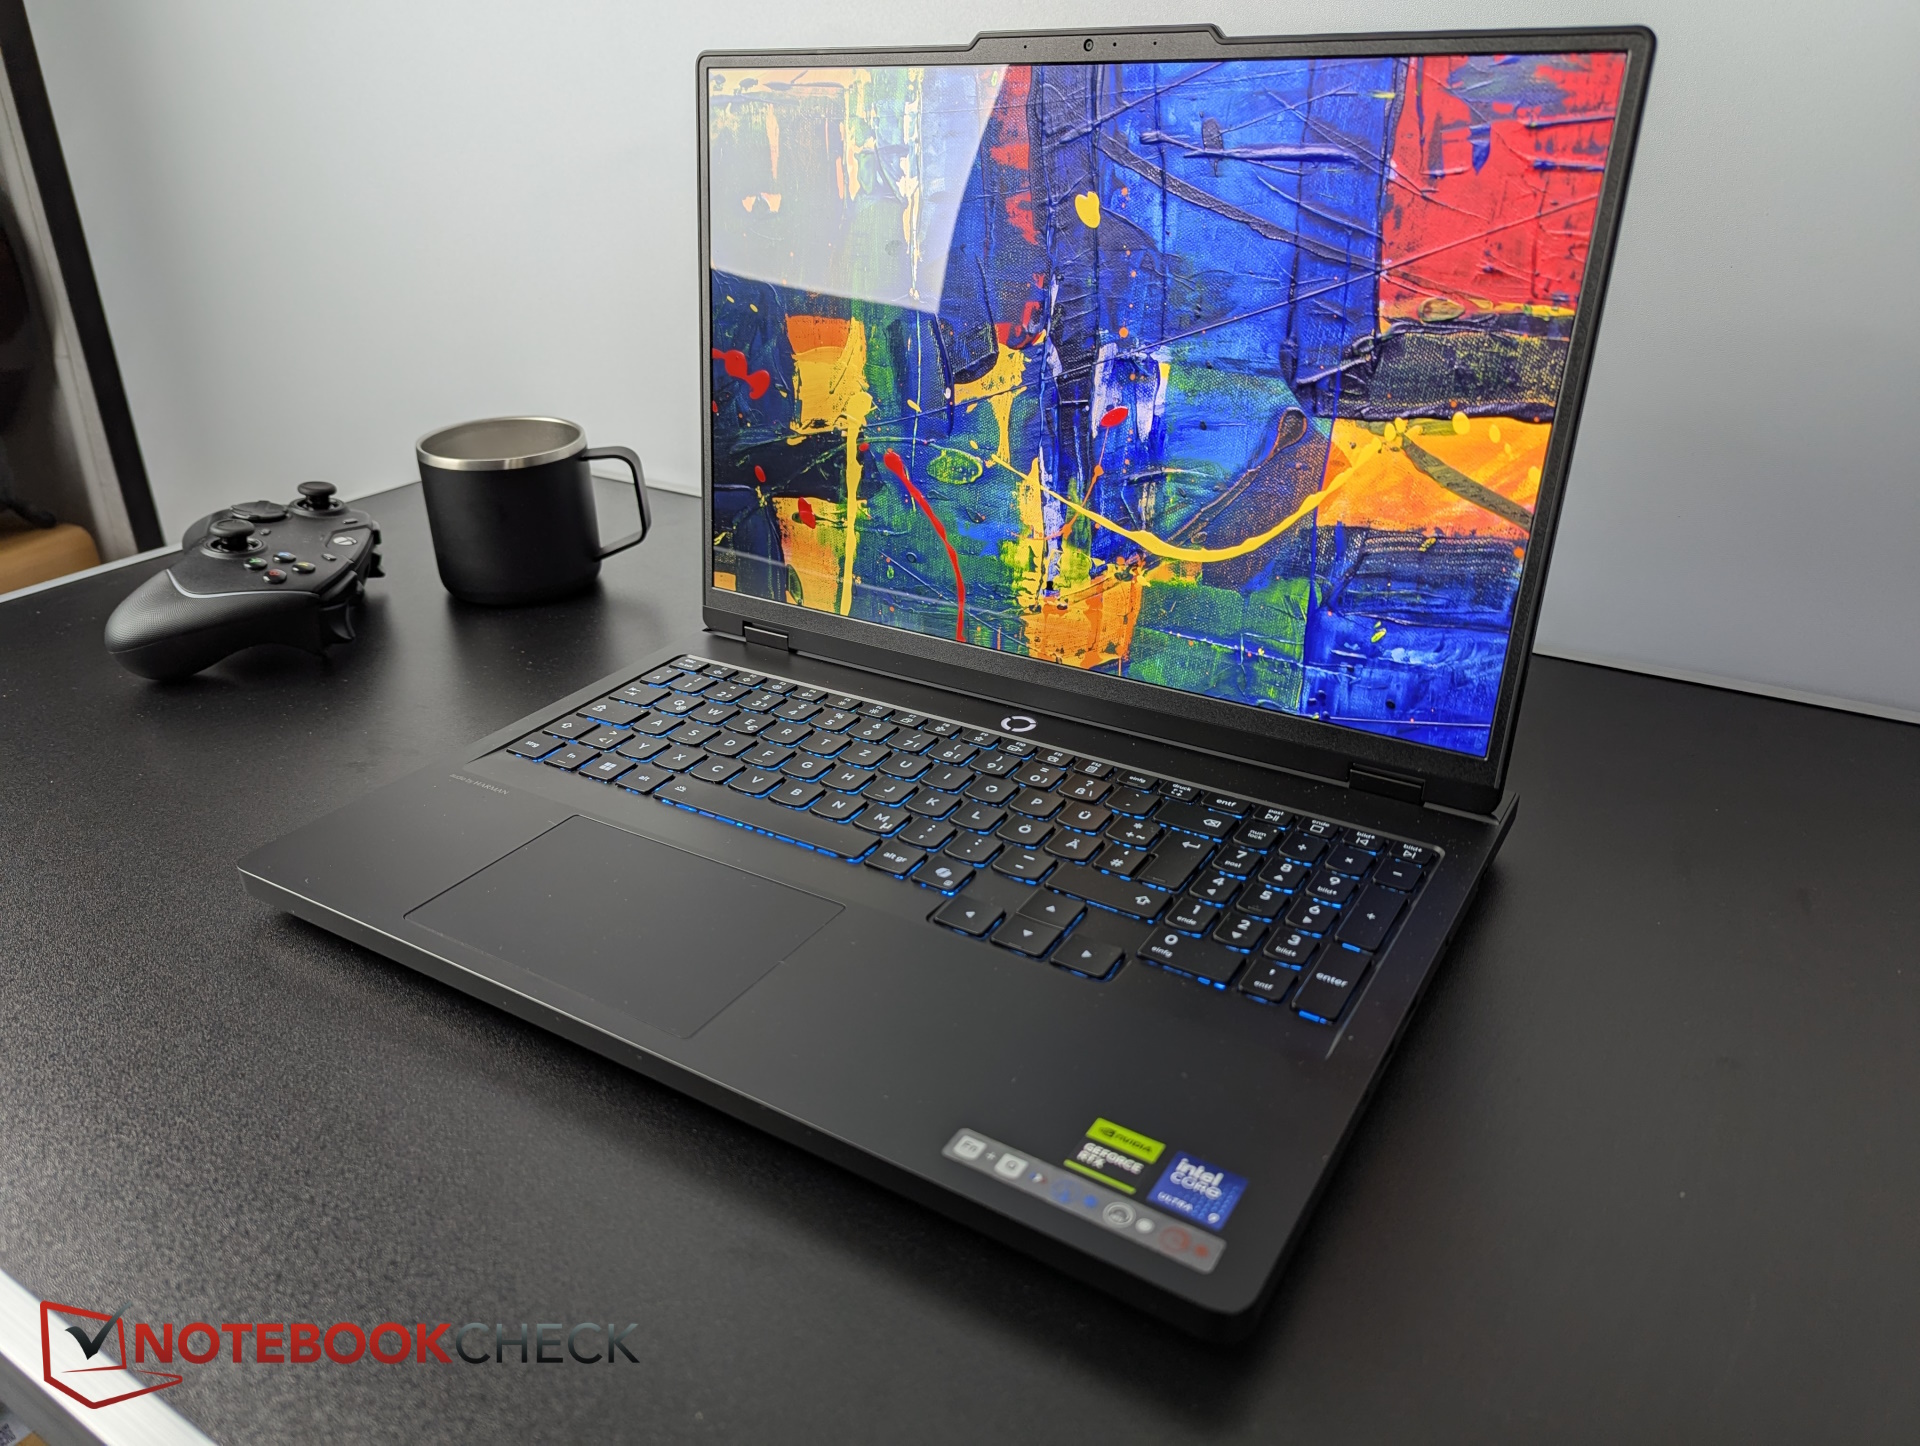
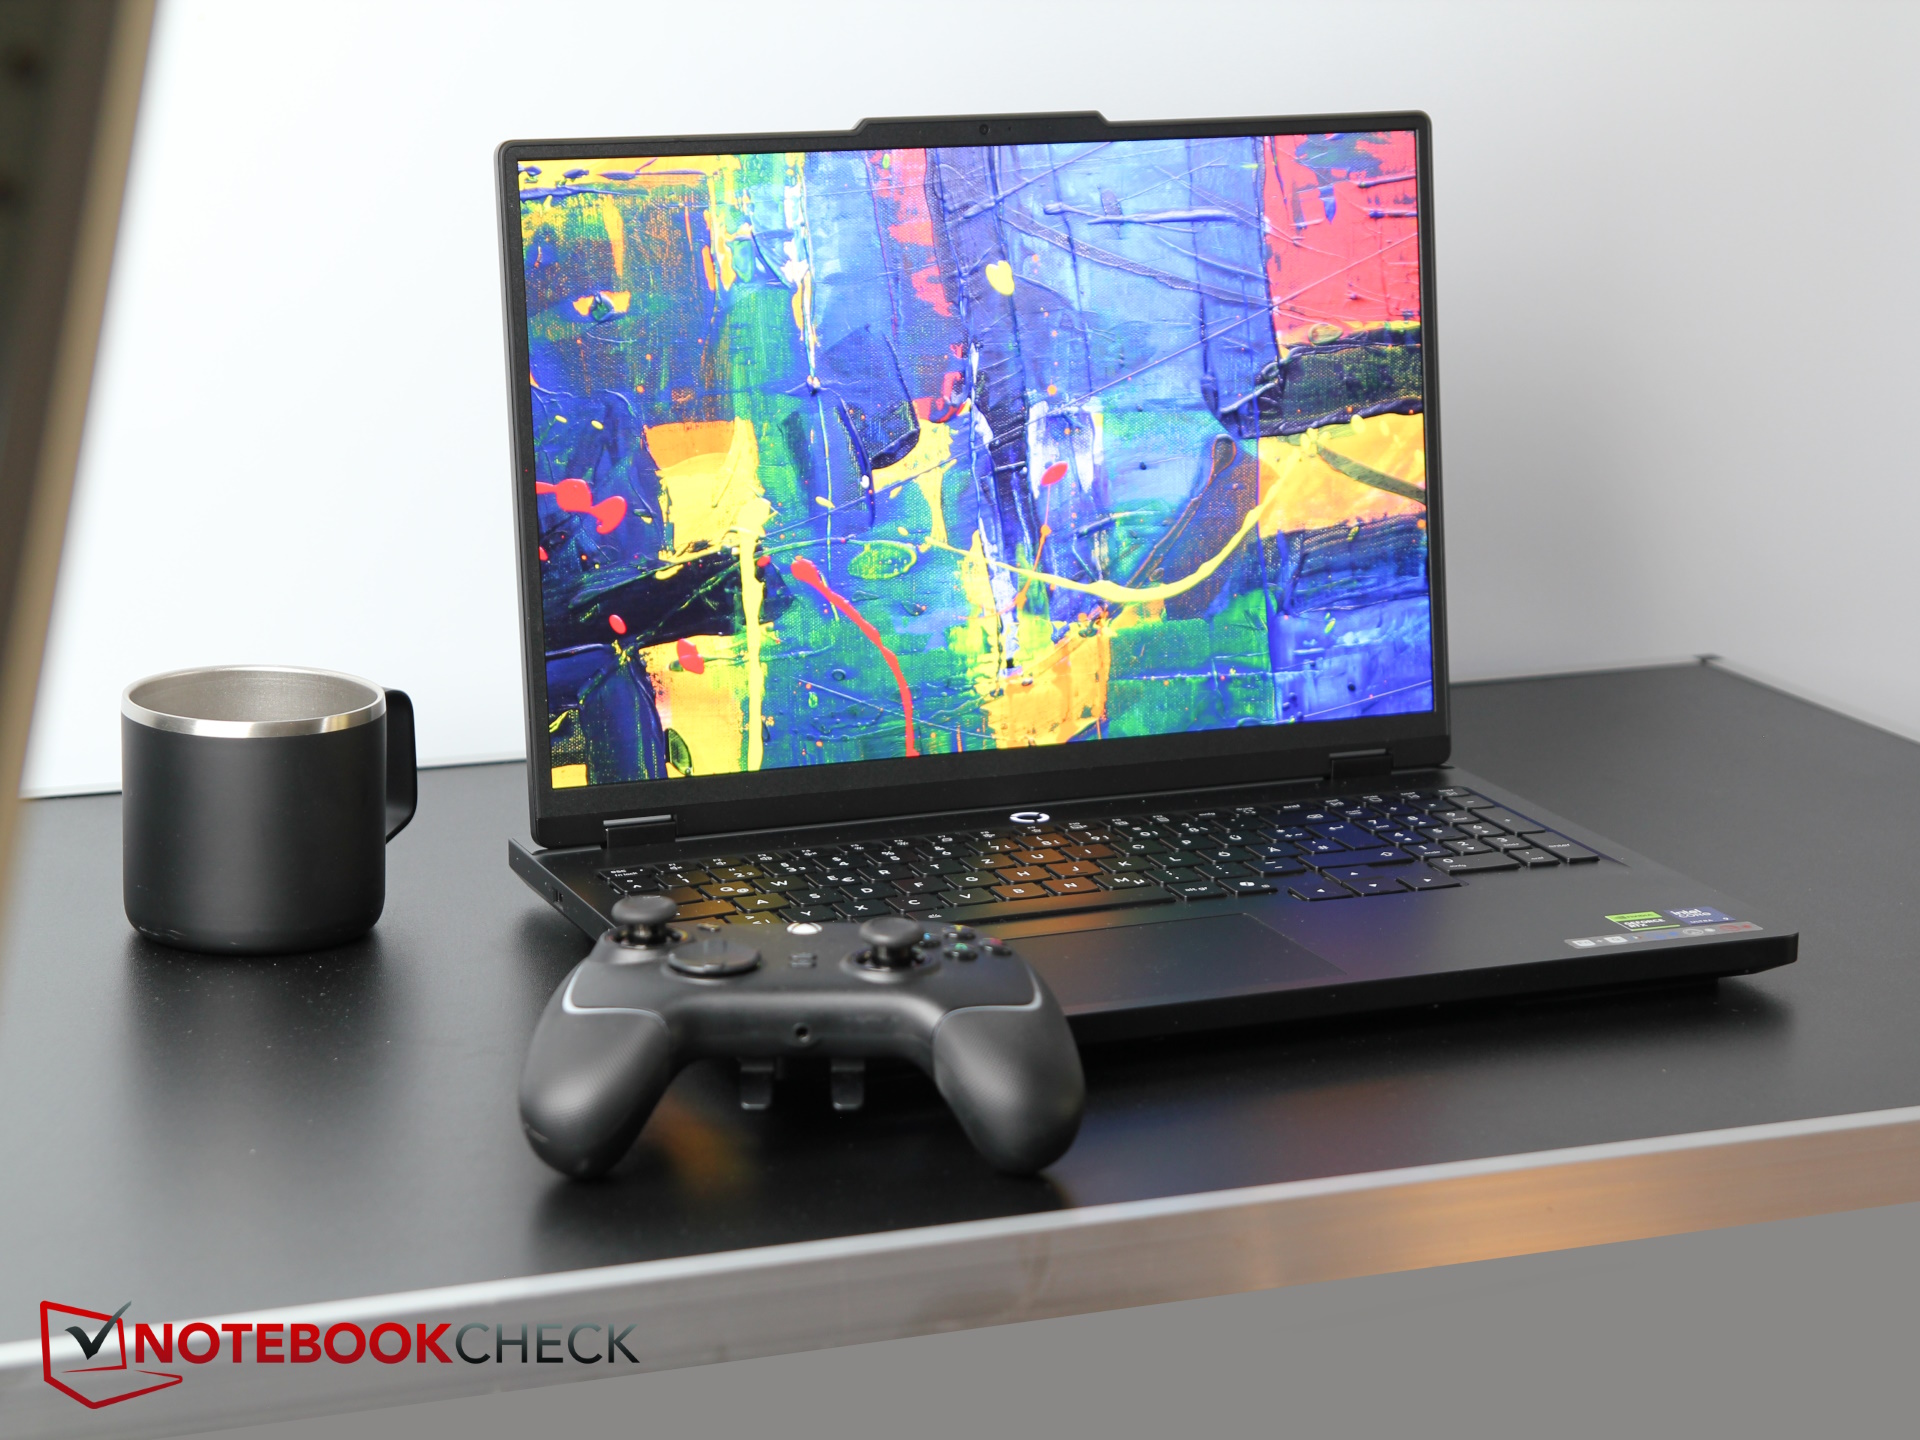
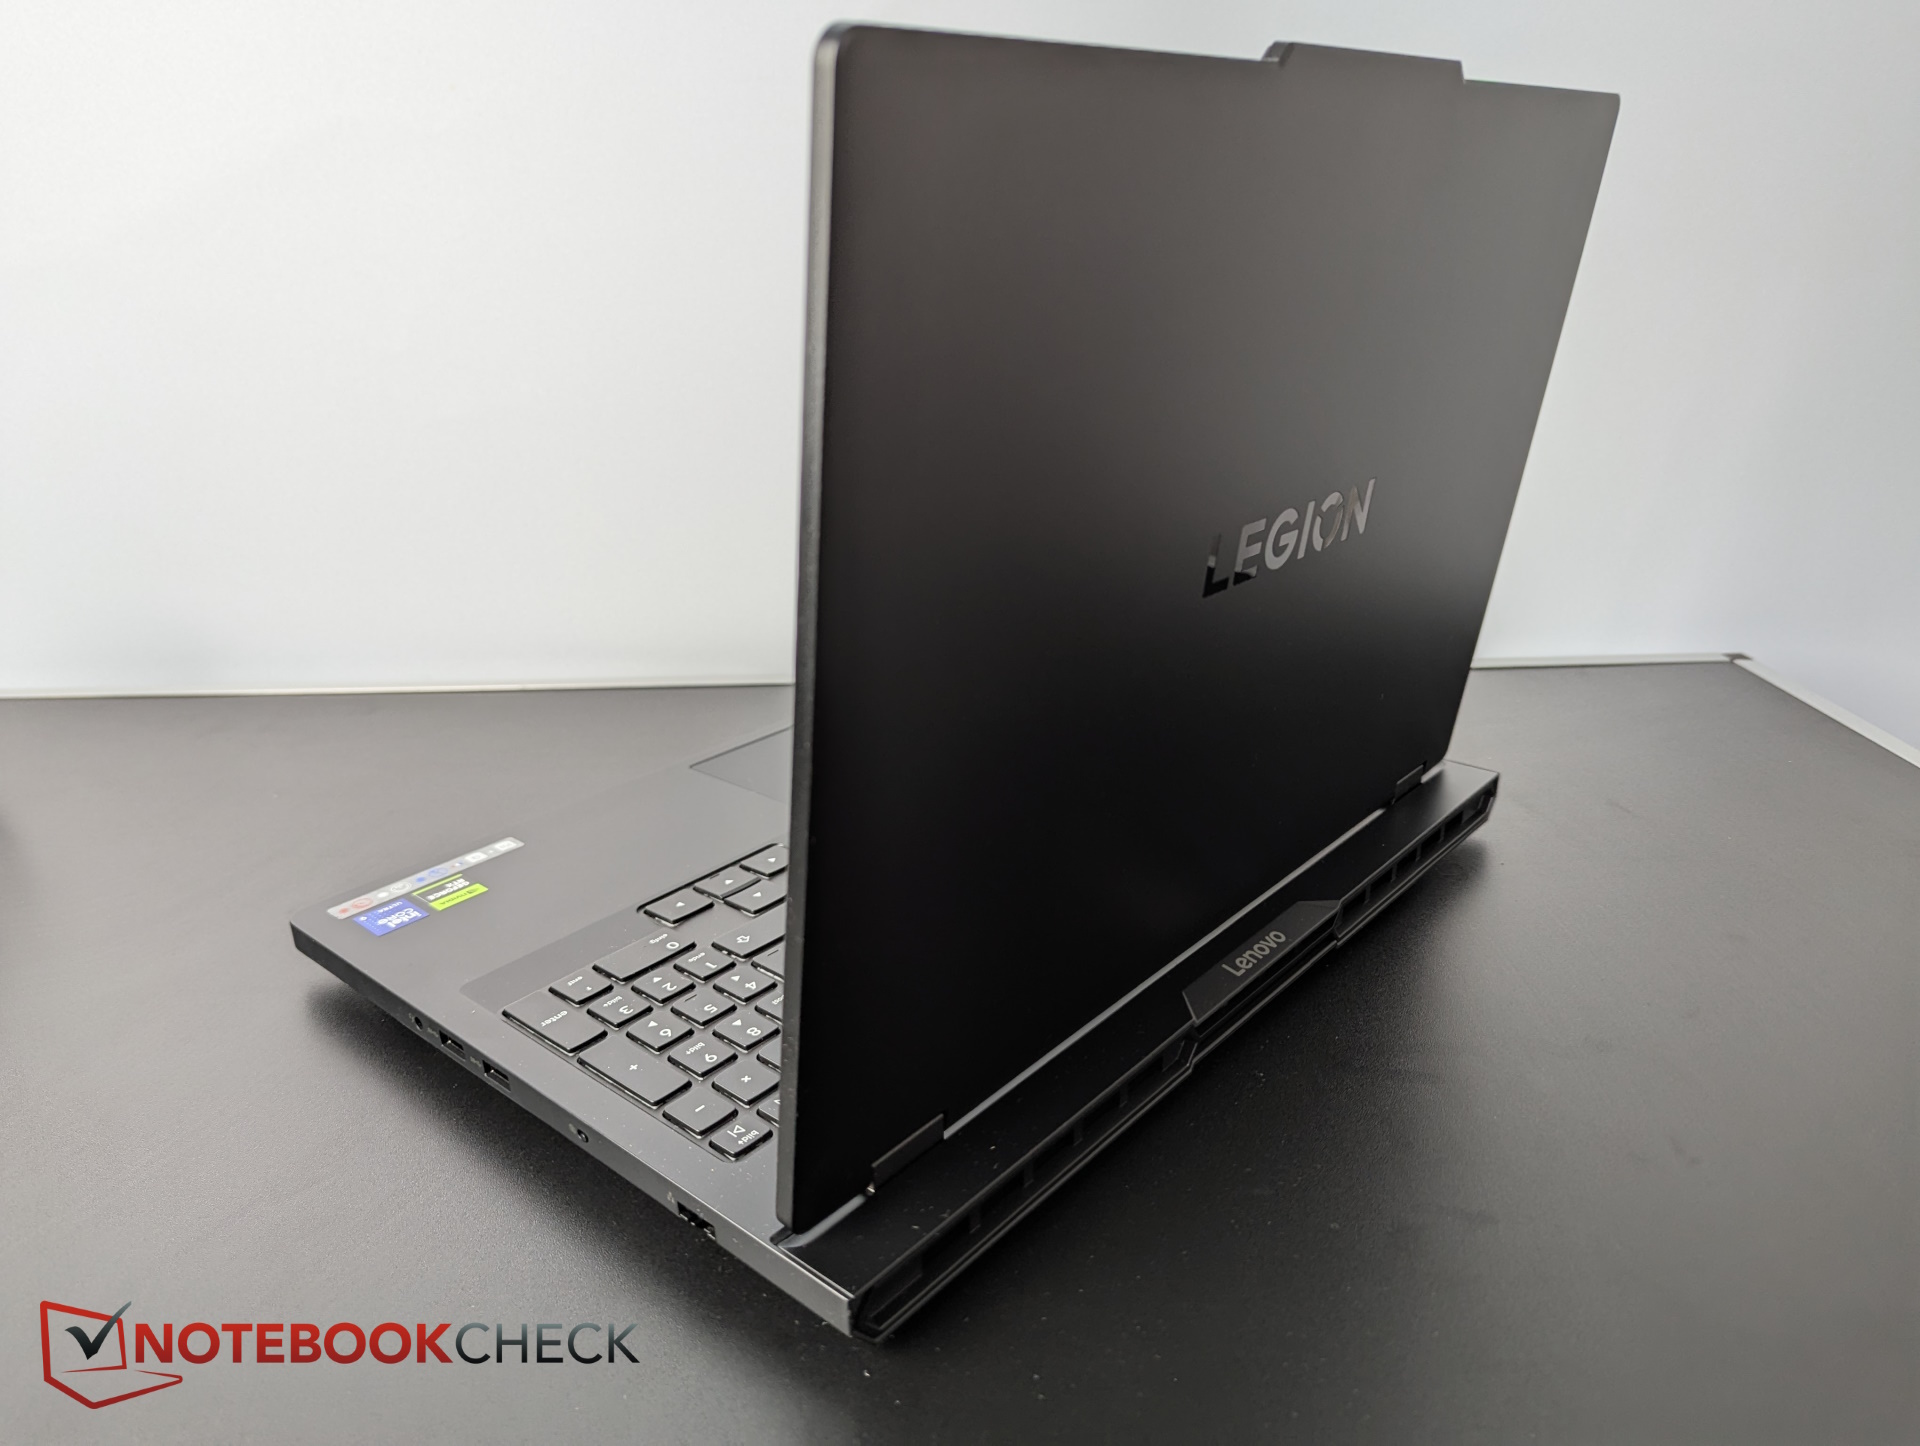
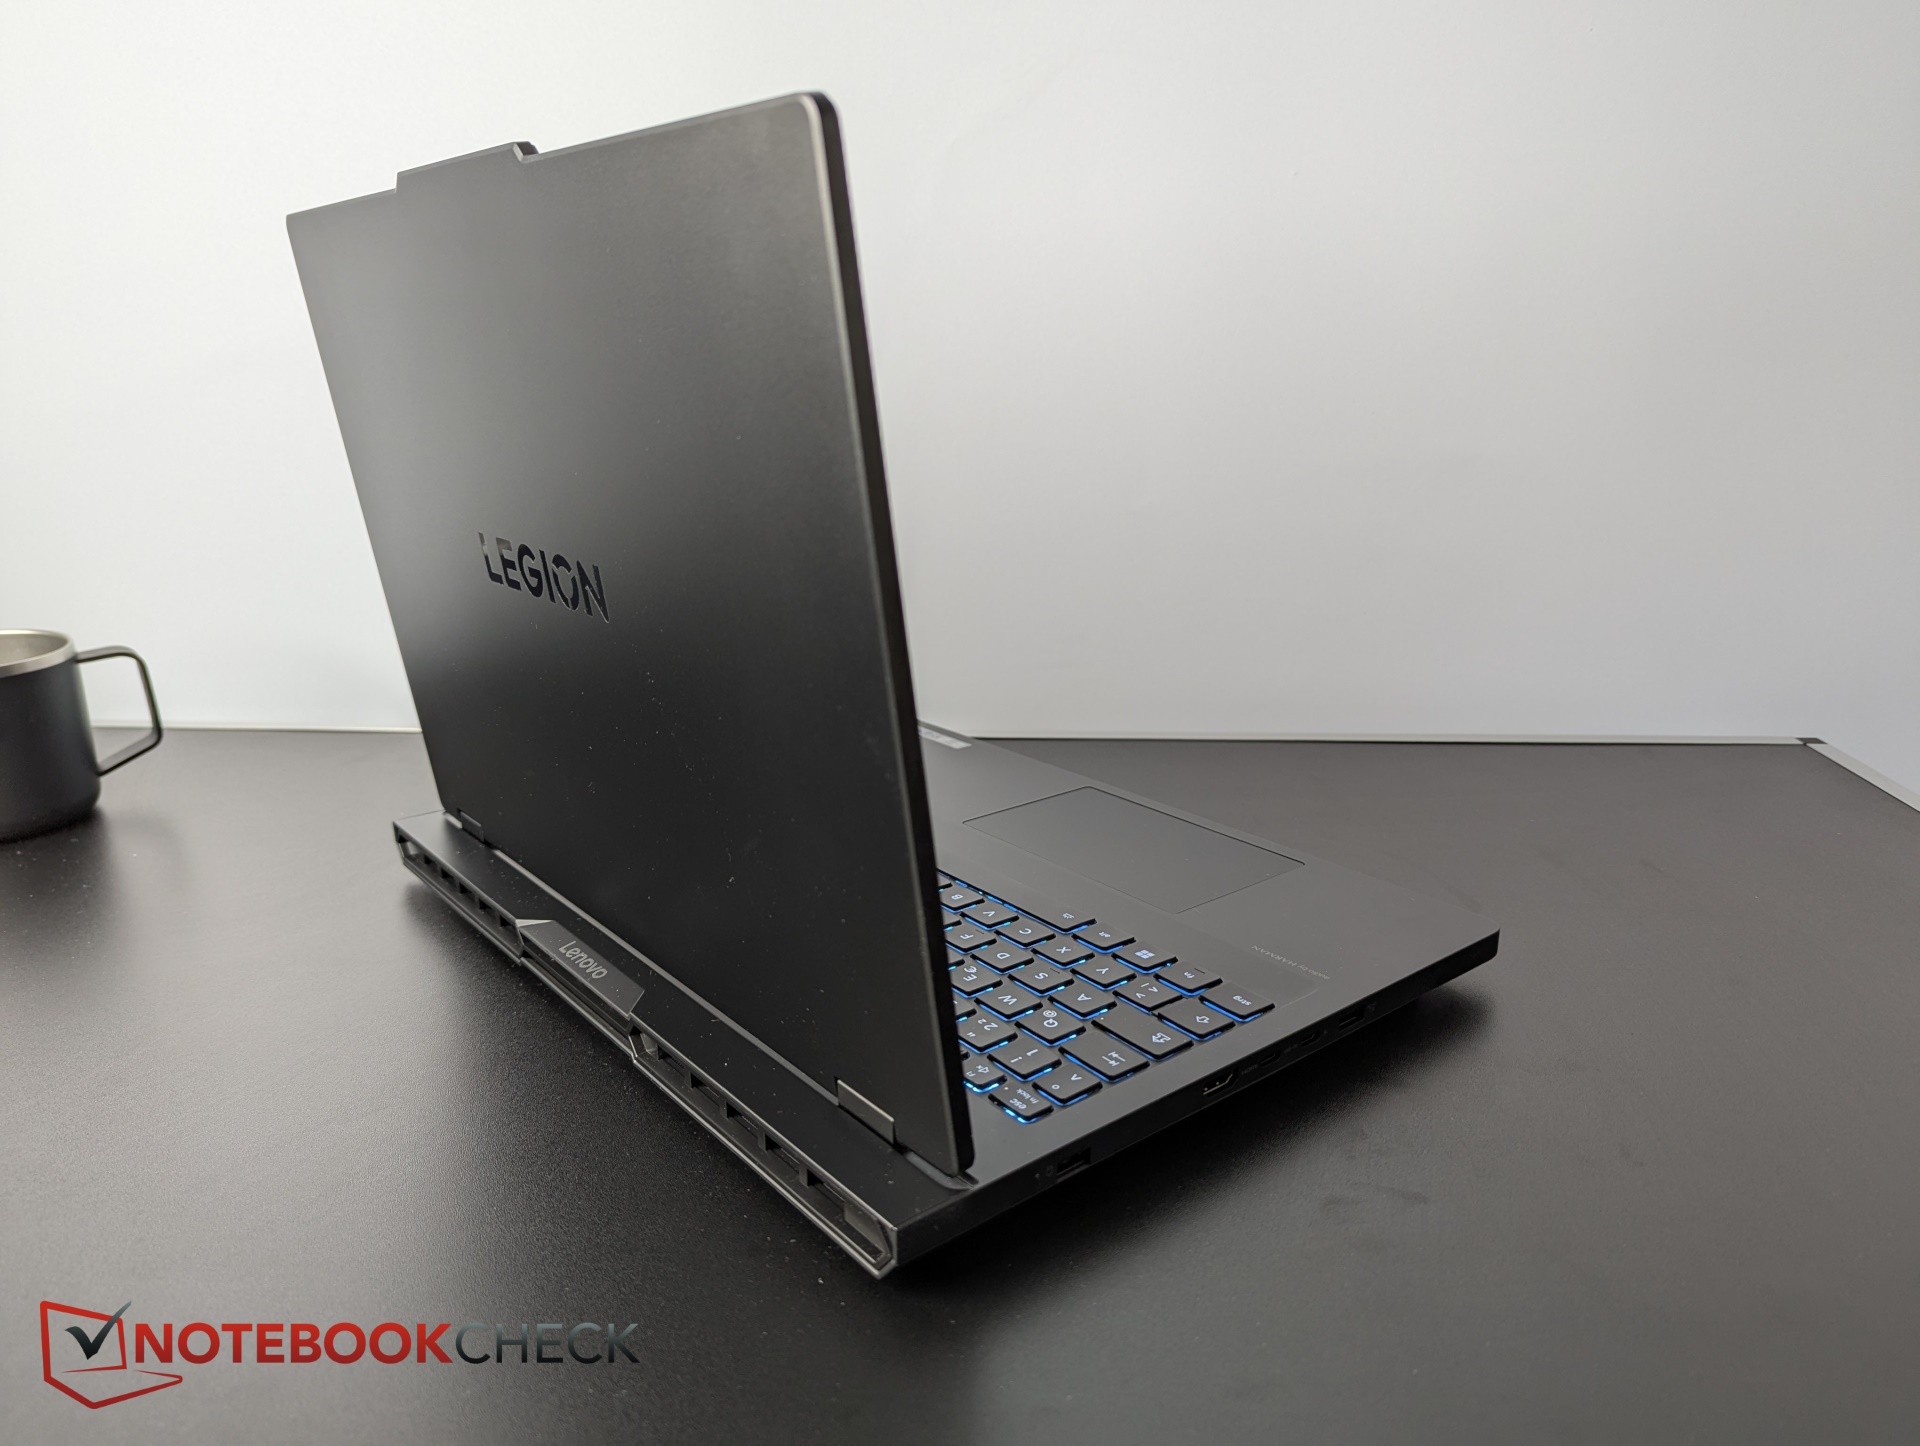
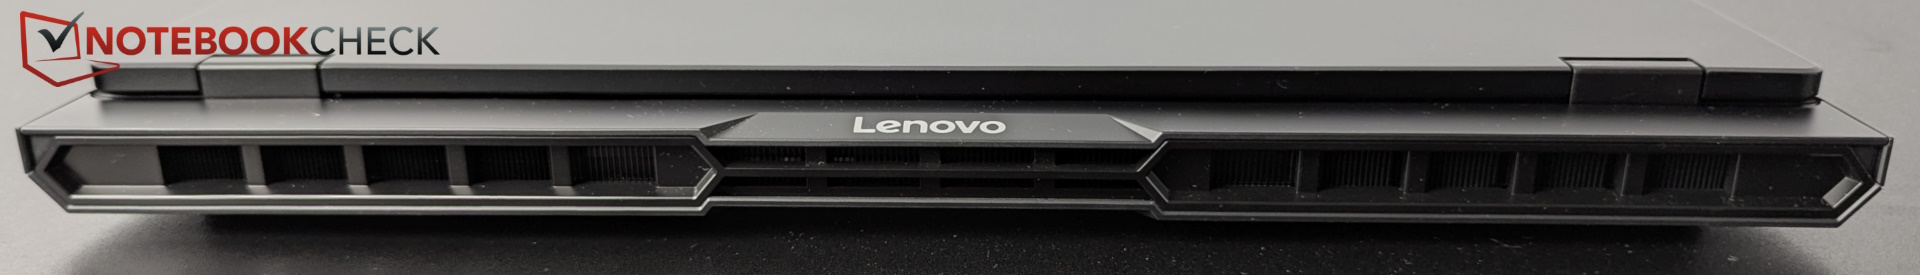
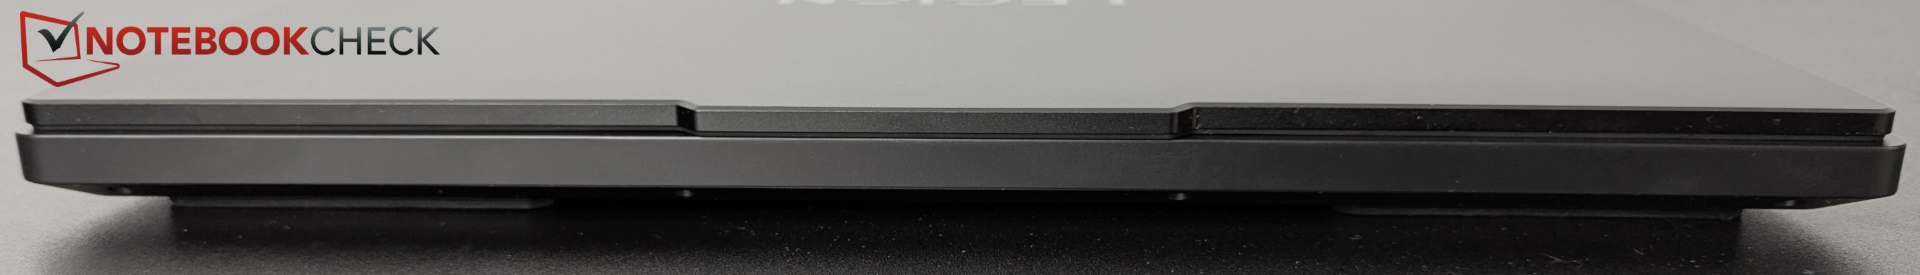
L'élégant boîtier en plastique noir et son solide couvercle en métal ont été redessinés pour cette année. Le "volet de l'appareil photo" supérieur subsiste, mais beaucoup d'autres choses ont changé. Il n'y a plus de ports à l'arrière, puisqu'ils ont tous été déplacés sur les côtés, et l'arrière est réservé à la circulation de l'air. Dans l'ensemble, nous apprécions le design, car il offre un bon équilibre entre le jeu et l'aspect créatif.
La base peut être légèrement tordue, ce qui provoque un léger grincement sur le côté droit, et les charnières à 180 degrés pourraient être un peu plus serrées. Les traces de doigts s'accumulent rapidement sur les surfaces.
Par rapport à son prédécesseur, le nouveau châssis est plus fin d'environ 1 mm, mais plus profond de 1 mm et plus large de 6 mm. Tous les autres ordinateurs portables de cette catégorie sont plus étroits, mais notre Legion Pro 5 est le plus fin, si l'on exclut les Blade 16 et G16. Il pèse également 100 g de moins.

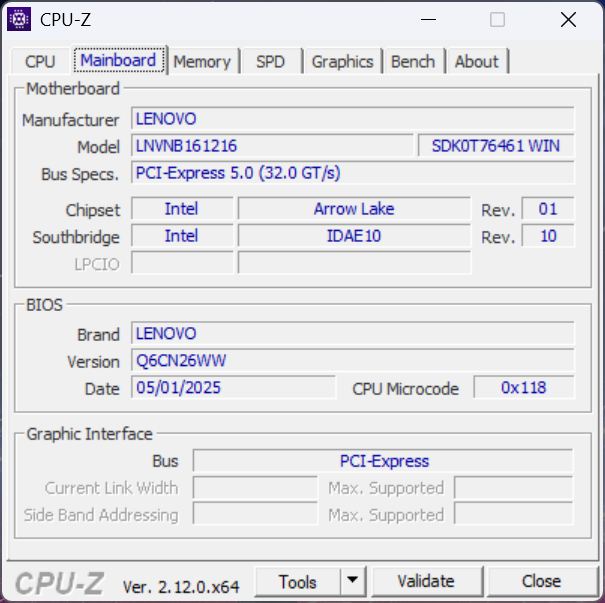
Caractéristiques - Une version un peu ancienne de Legion Pro
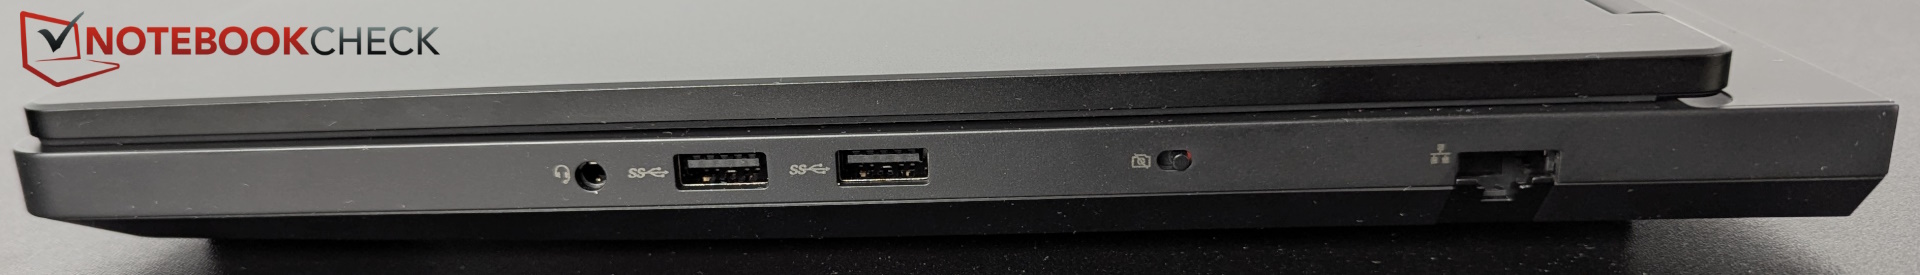
Le connecteur d'alimentation et le port HDMI se trouvent désormais à gauche, le port LAN et un port USB-A à droite, et d'autres ports ont été déplacés de l'arrière vers les côtés.
Cependant, les ports USB en particulier ne sont plus aussi modernes. Il n'y a pas de Thunderbolt 5, seulement la version 4, et le deuxième emplacement USB-C n'est pas compatible avec Thunderbolt. Deux des trois emplacements USB-A (les deux de droite) ne fonctionnent qu'à 5 Gbps, et le lecteur SD est totalement absent.
La disposition des ports est satisfaisante, même si les côtés sont désormais plus encombrés qu'auparavant.

Communication
Le Wi-Fi 6 et le Bluetooth 5.2 ne font plus recette à l'heure du Wi-Fi 7 ou même du Wi-Fi 6E, d'autant plus que le Bluetooth 6 est disponible depuis septembre 2024 et que le Bluetooth 5.4 n'est plus la norme. Le prédécesseur disposait déjà du Wi-Fi 6E, et la concurrence directe est plus rapide, mais au moins le module est remplaçable.
Webcam
Lenovo a intégré un appareil photo de 5 mégapixels dans la large encoche située sur le dessus du boîtier. Les images sont nettes et la précision des couleurs est acceptable. Sur le côté droit, vous trouverez un bouton coulissant pour l'obturateur électronique.


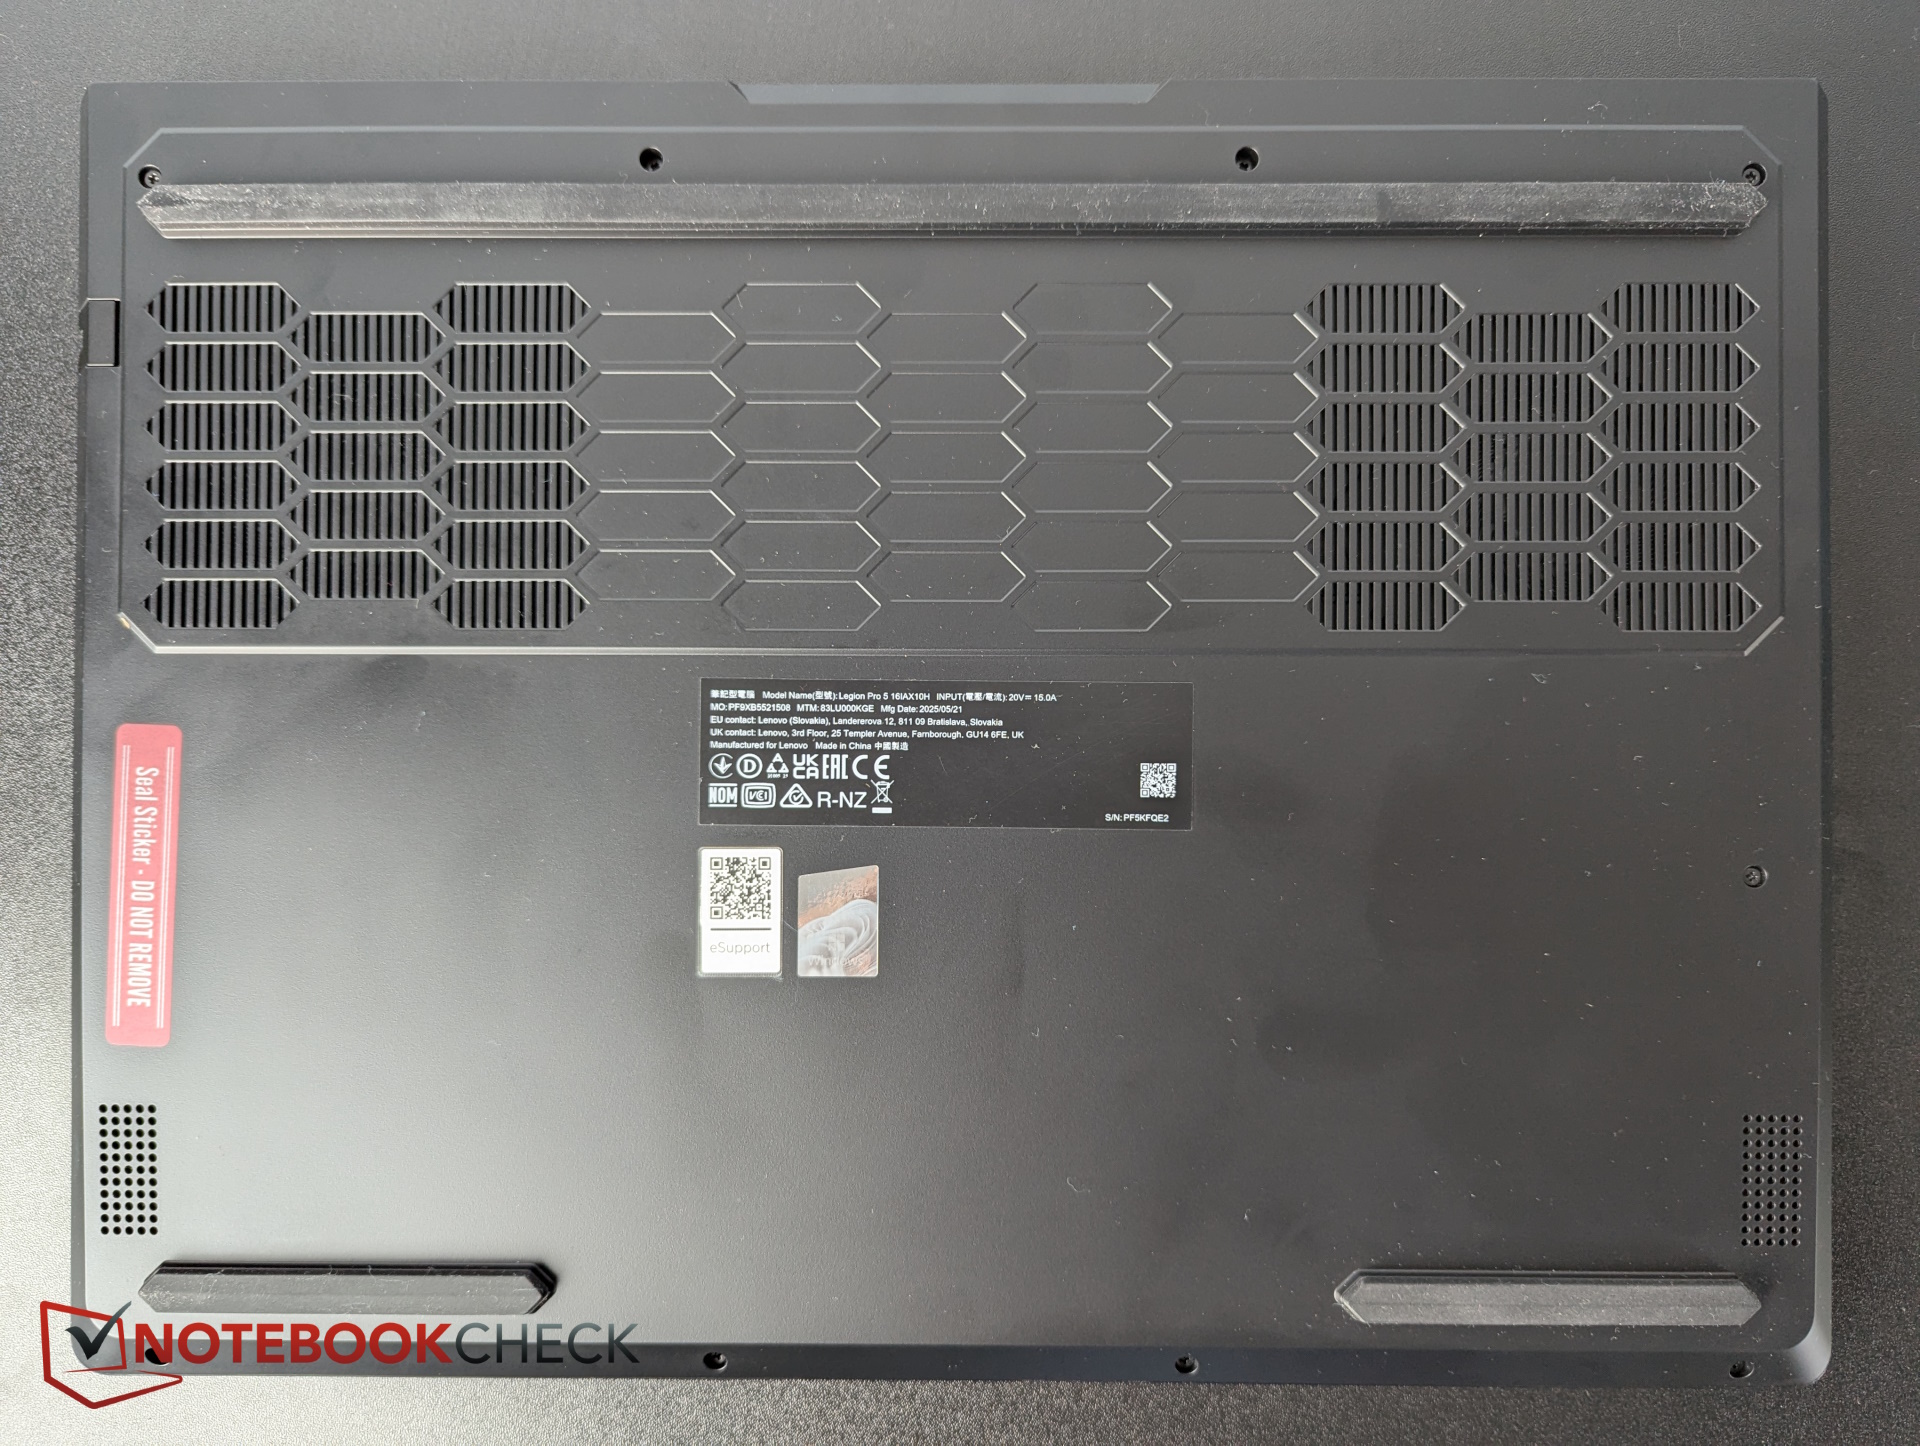
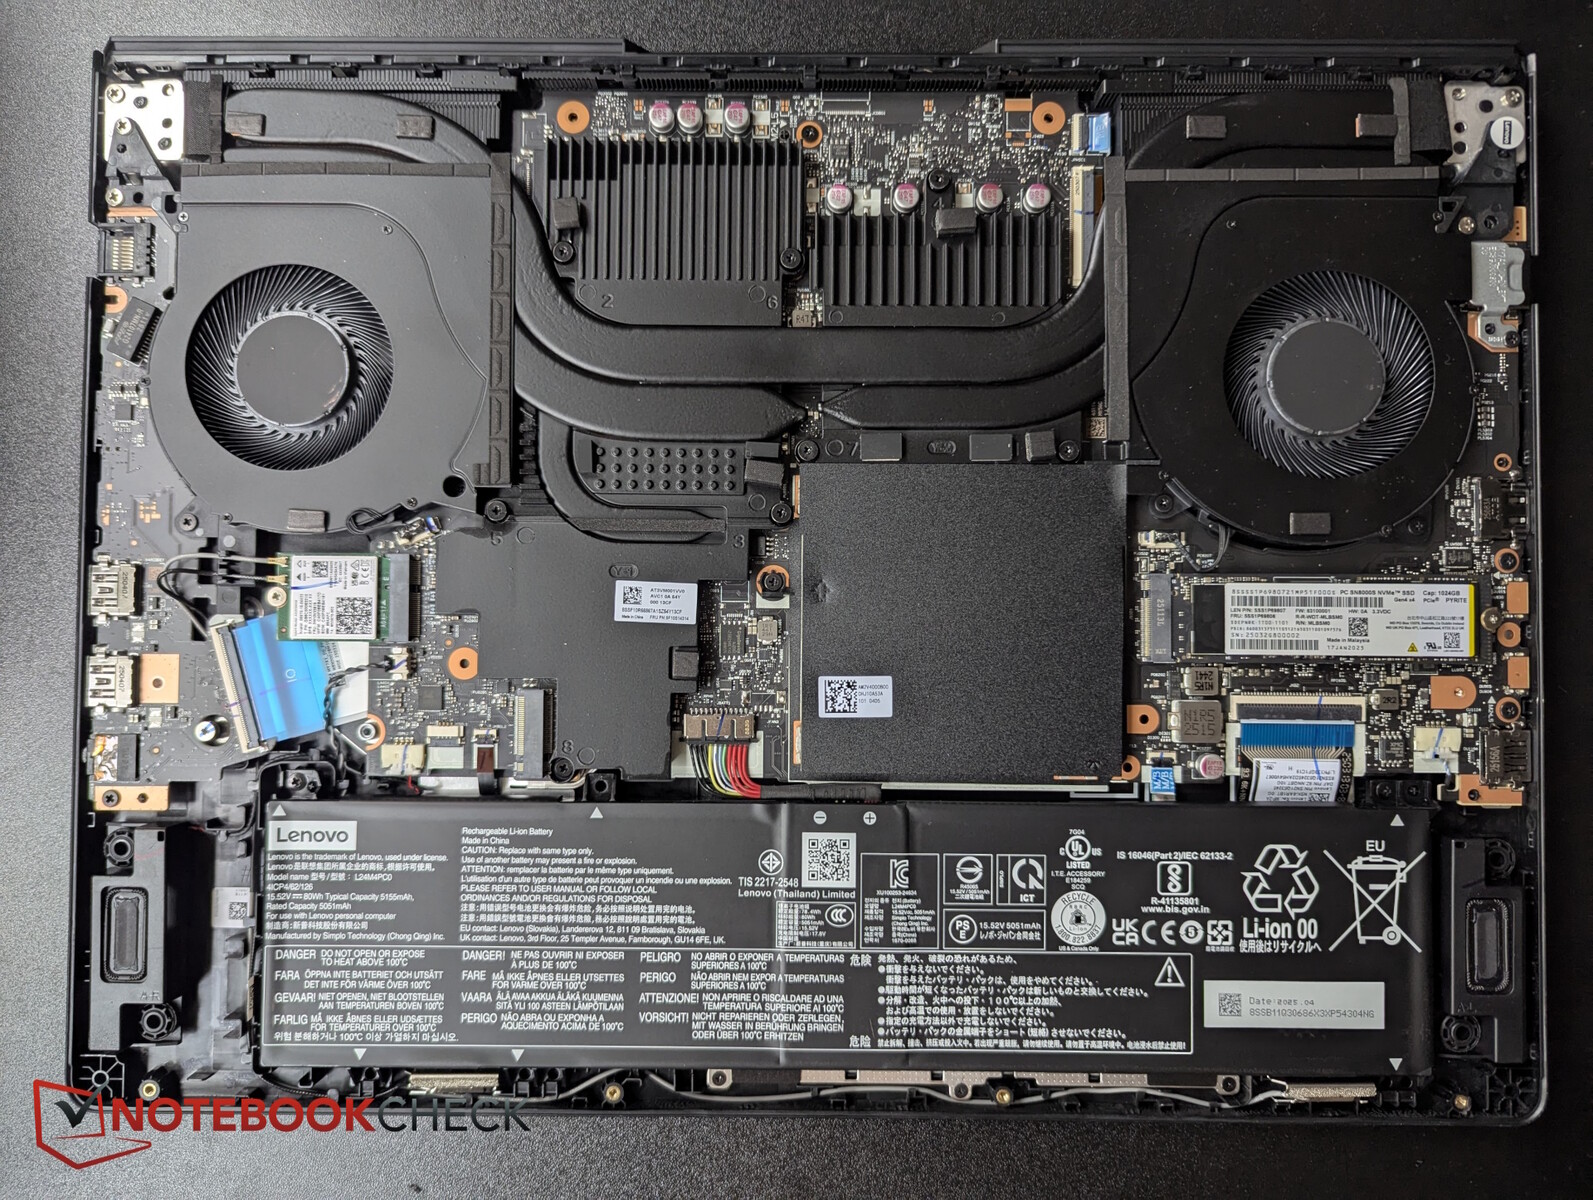
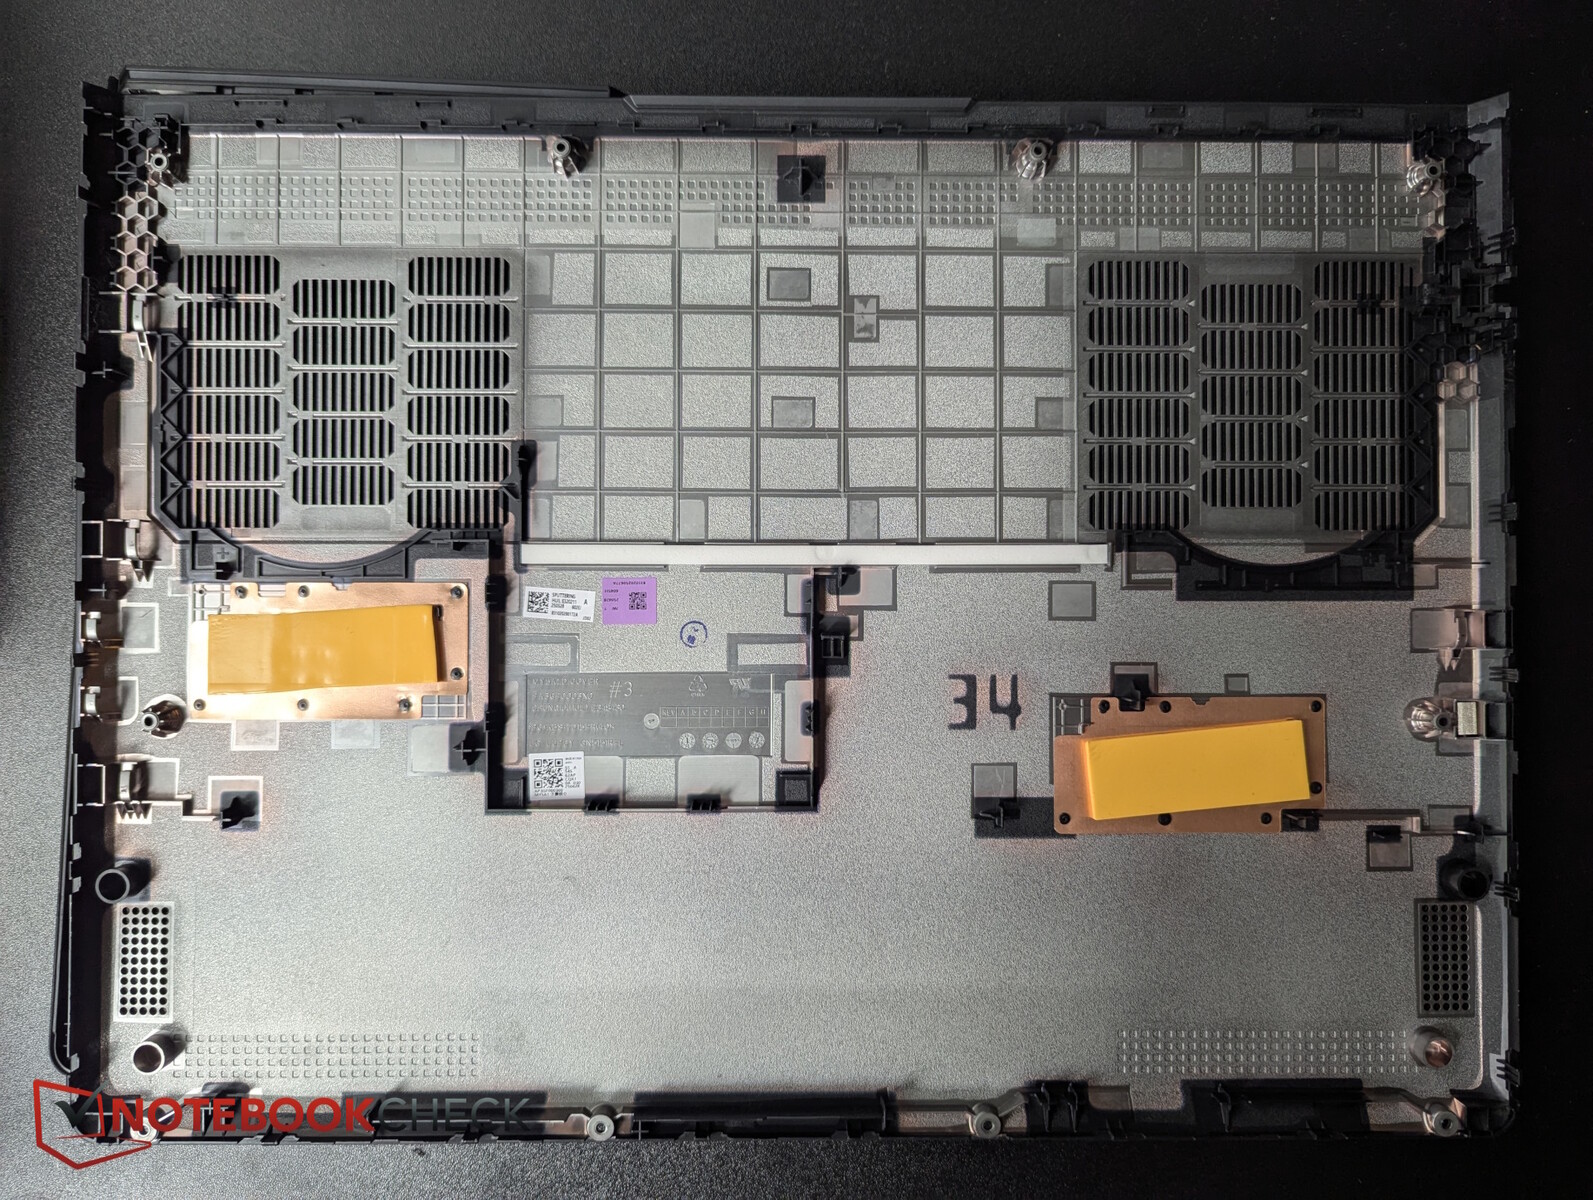
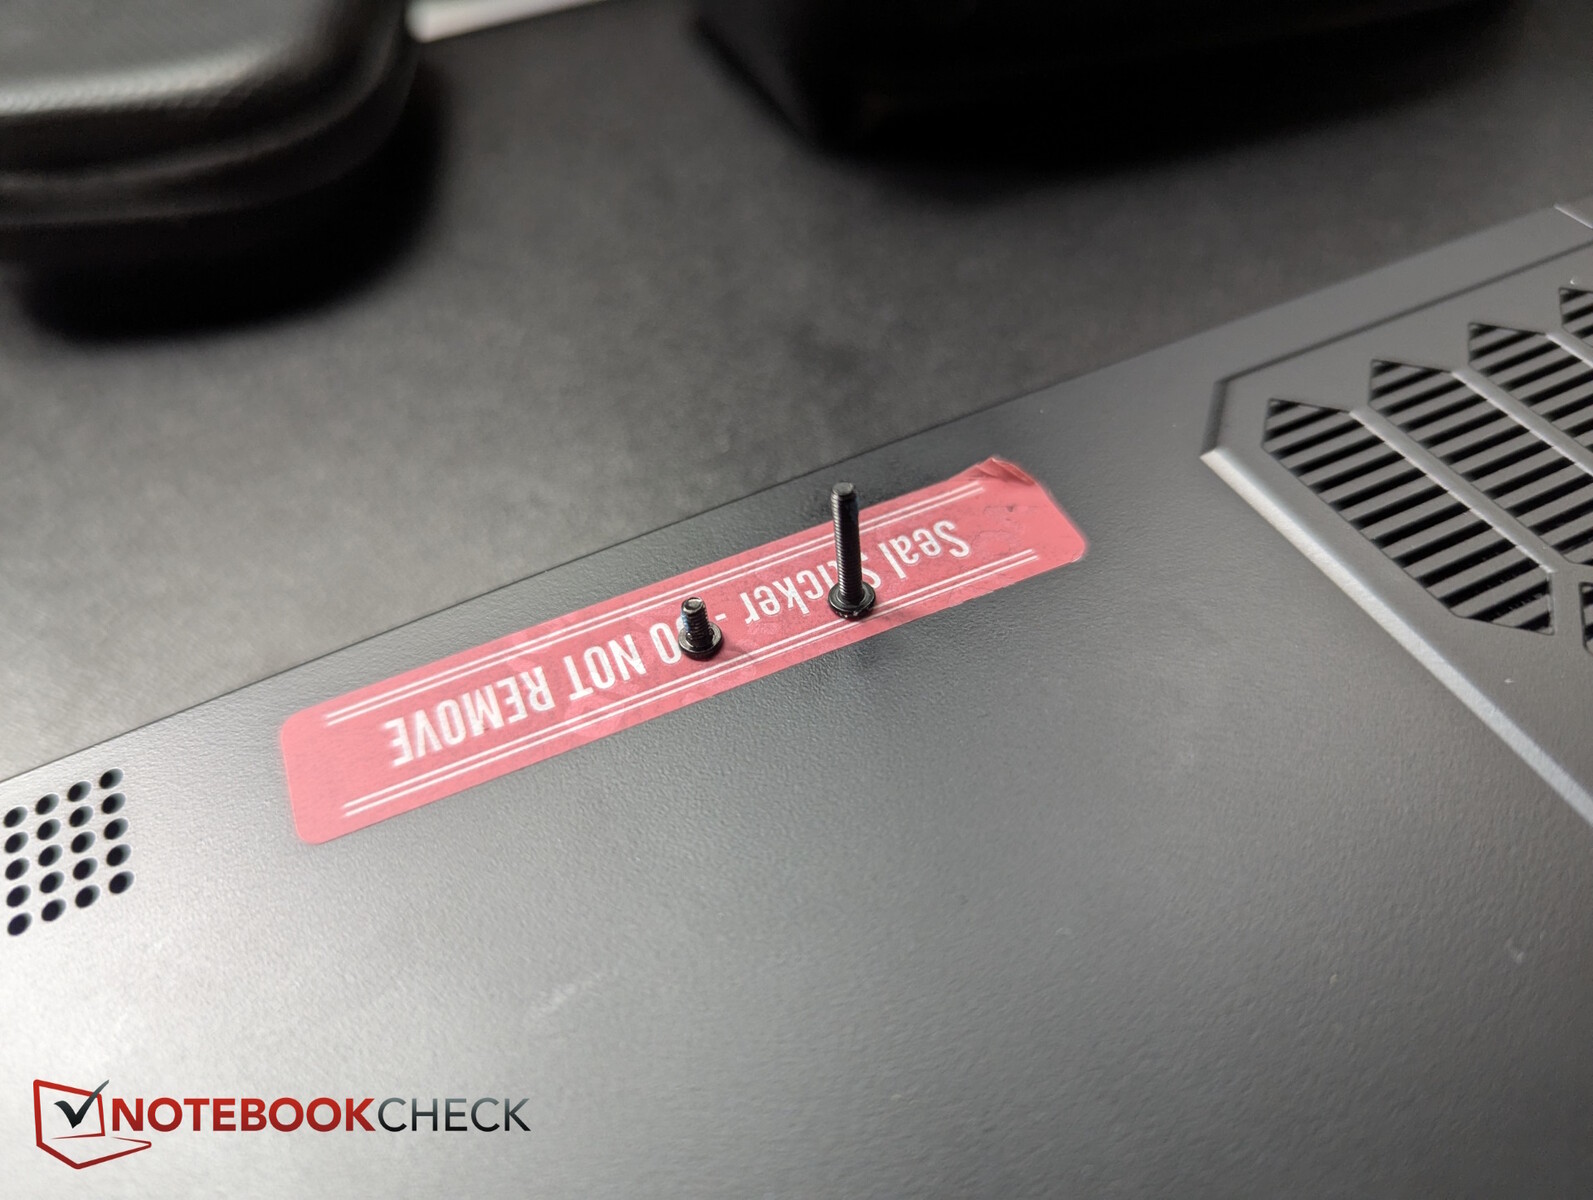
Maintenance
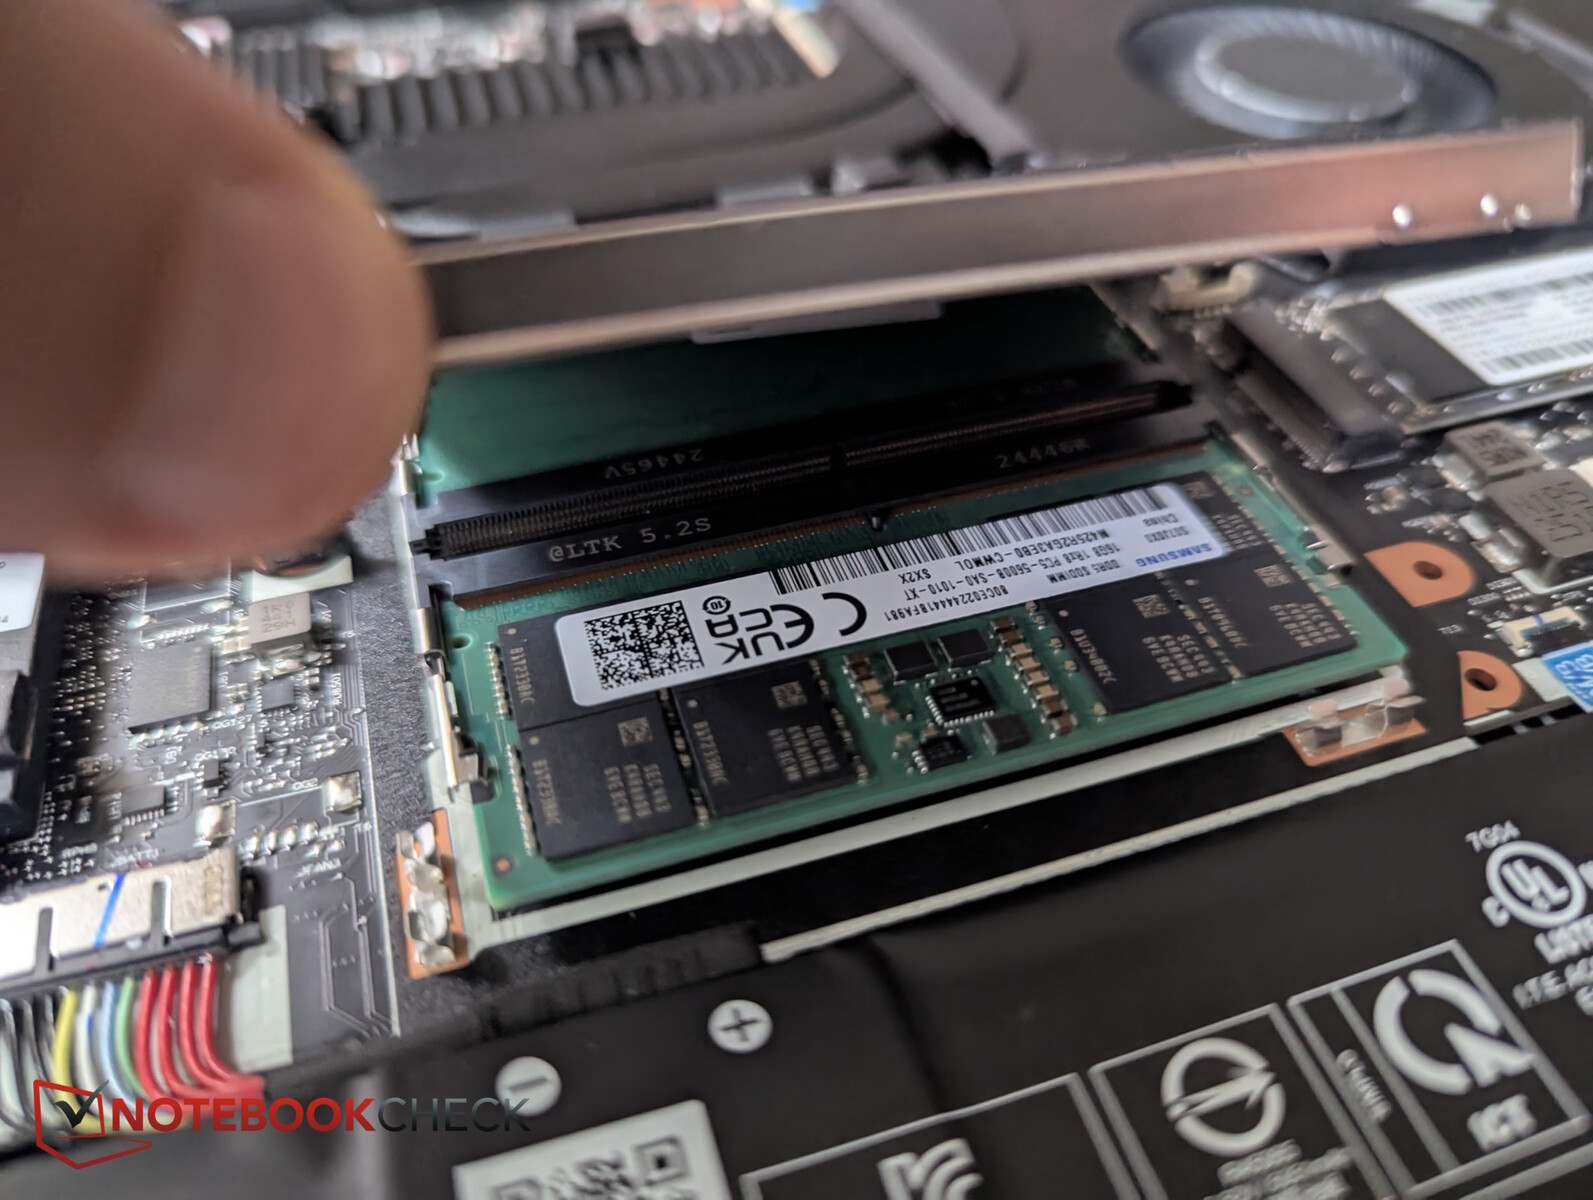
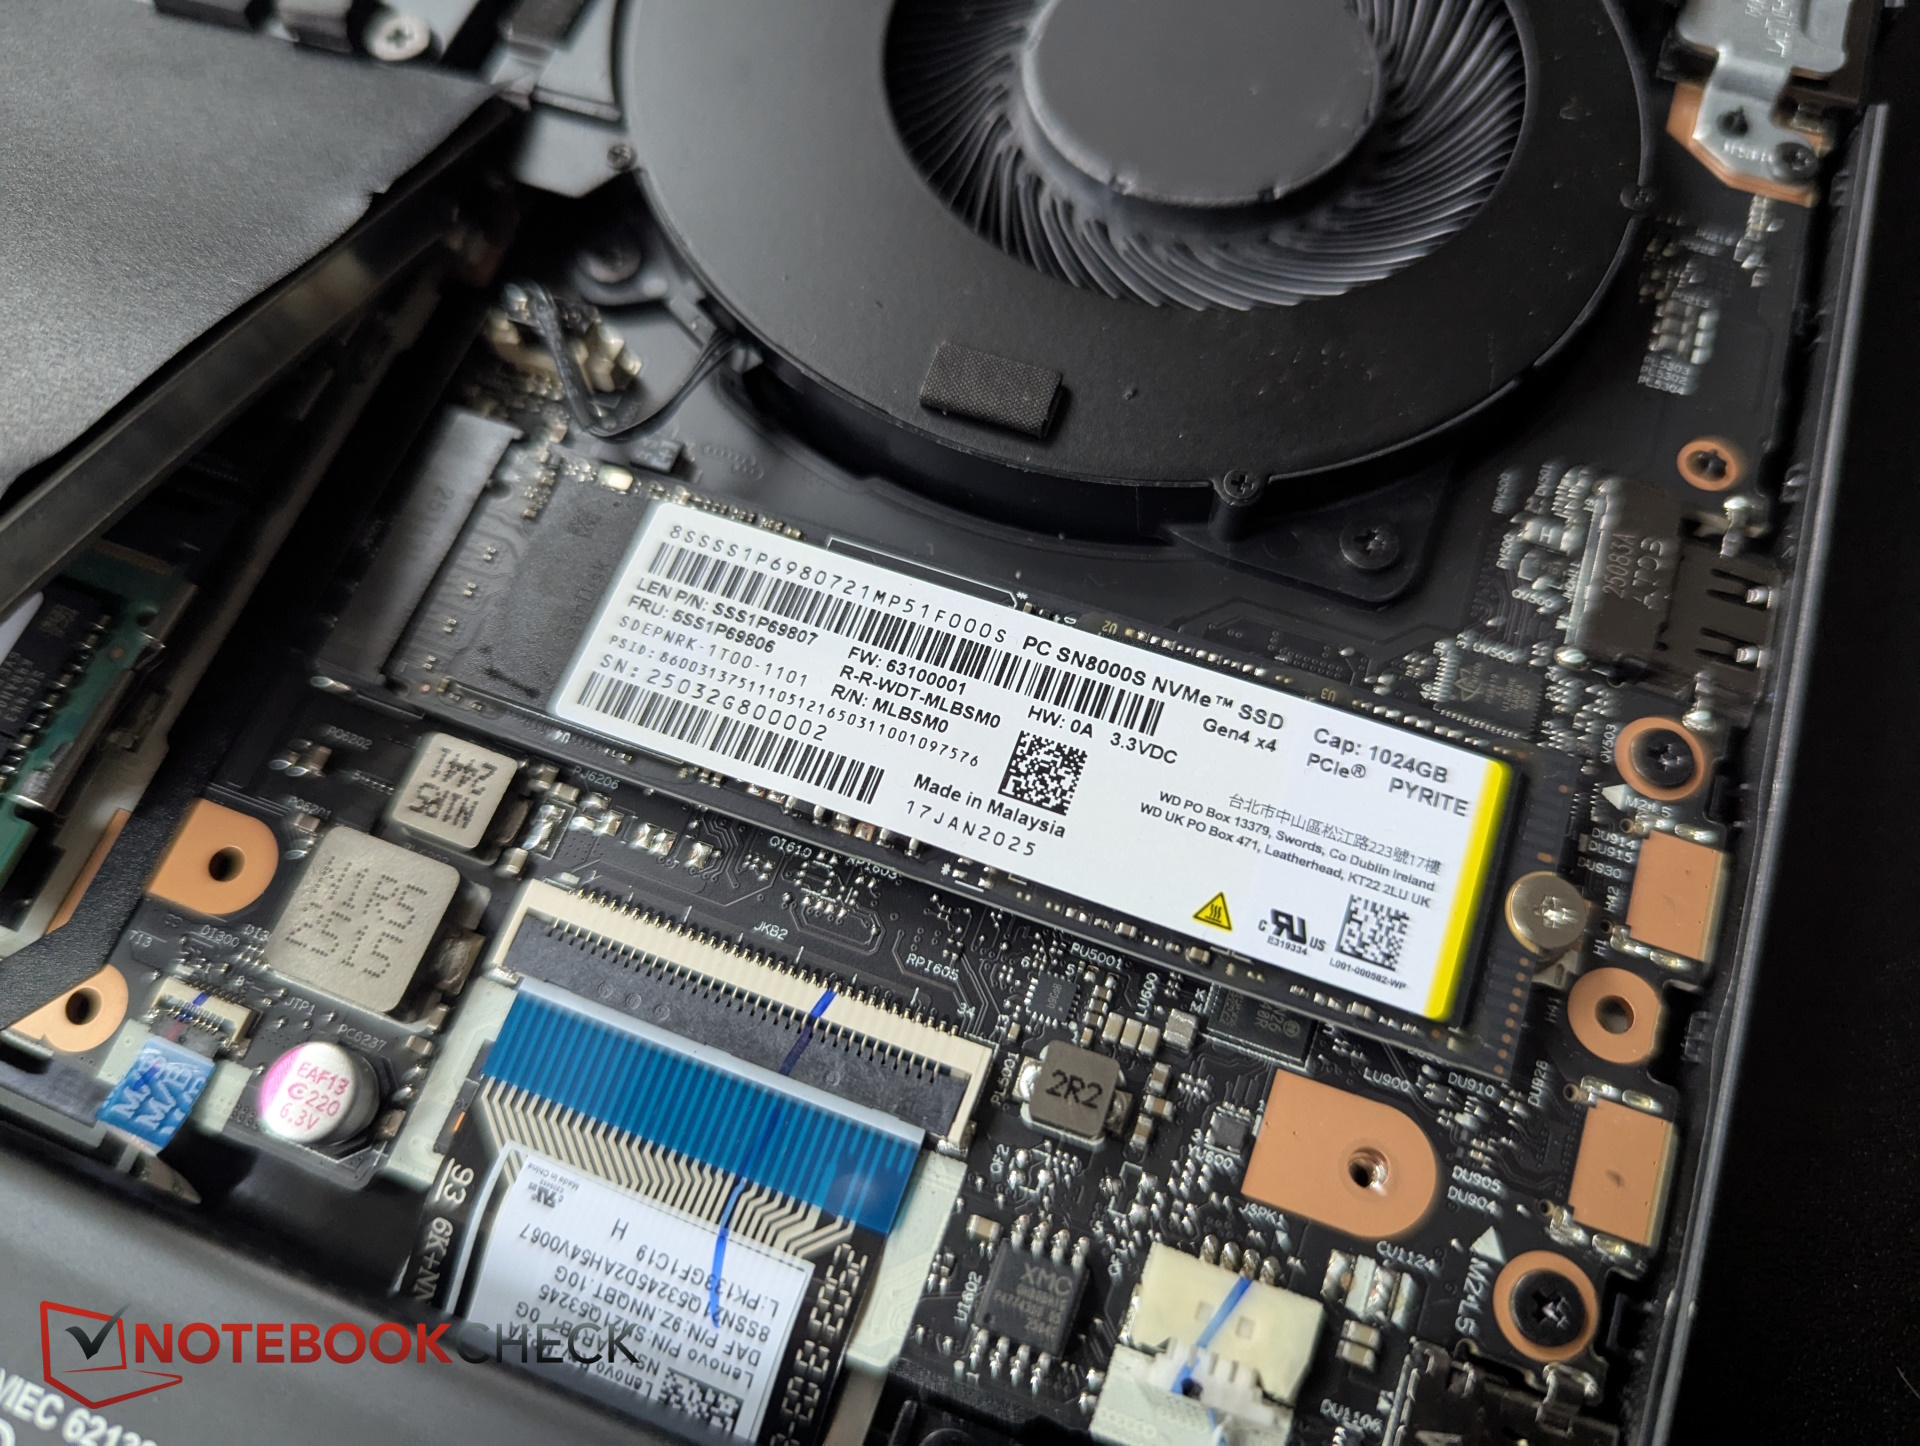
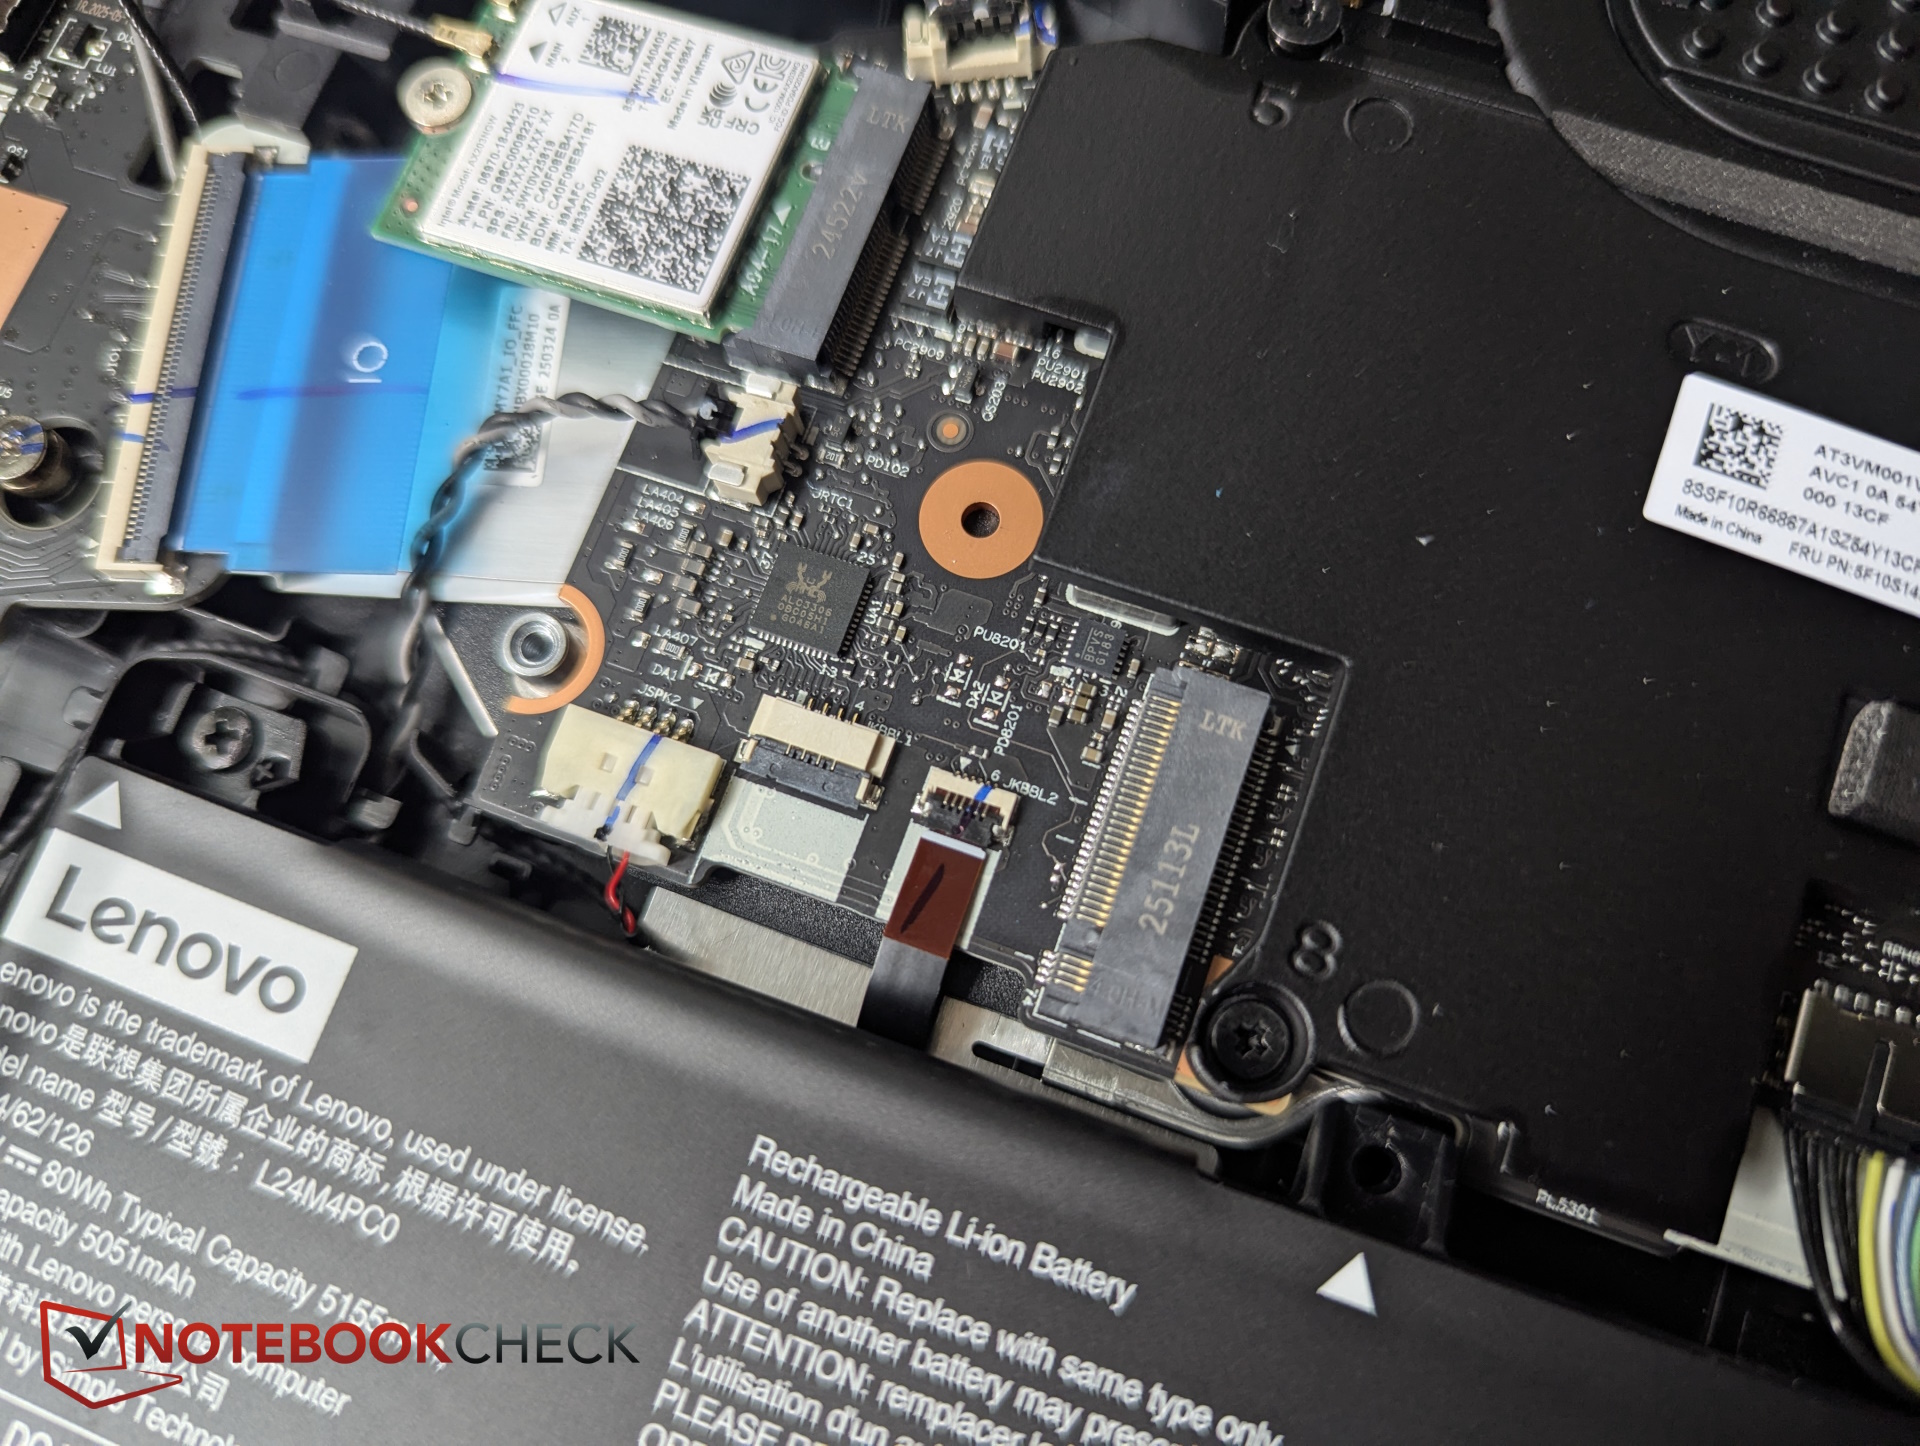
Le panneau inférieur est fixé par 10 vis (2 longueurs). Il est assez facile de l'ouvrir, même sans outil. À l'intérieur, vous avez accès aux deux emplacements SSD M.2, au module Wi-Fi amovible, aux deux emplacements RAM, à la batterie et au système de refroidissement.
Durabilité
L'emballage est un mélange de carton et de plastique, ce dernier étant utilisé comme sac plastique qui non seulement enveloppe le site Legion et le bloc d'alimentation, mais sert également de bandes adhésives sur les bords du site Legion, et de mousse pour l'isolation.
Accessoires et garantie
Lenovo offre une garantie de deux ans, y compris le service de messagerie ou de portage. Les accessoires ne sont pas inclus dans l'emballage.
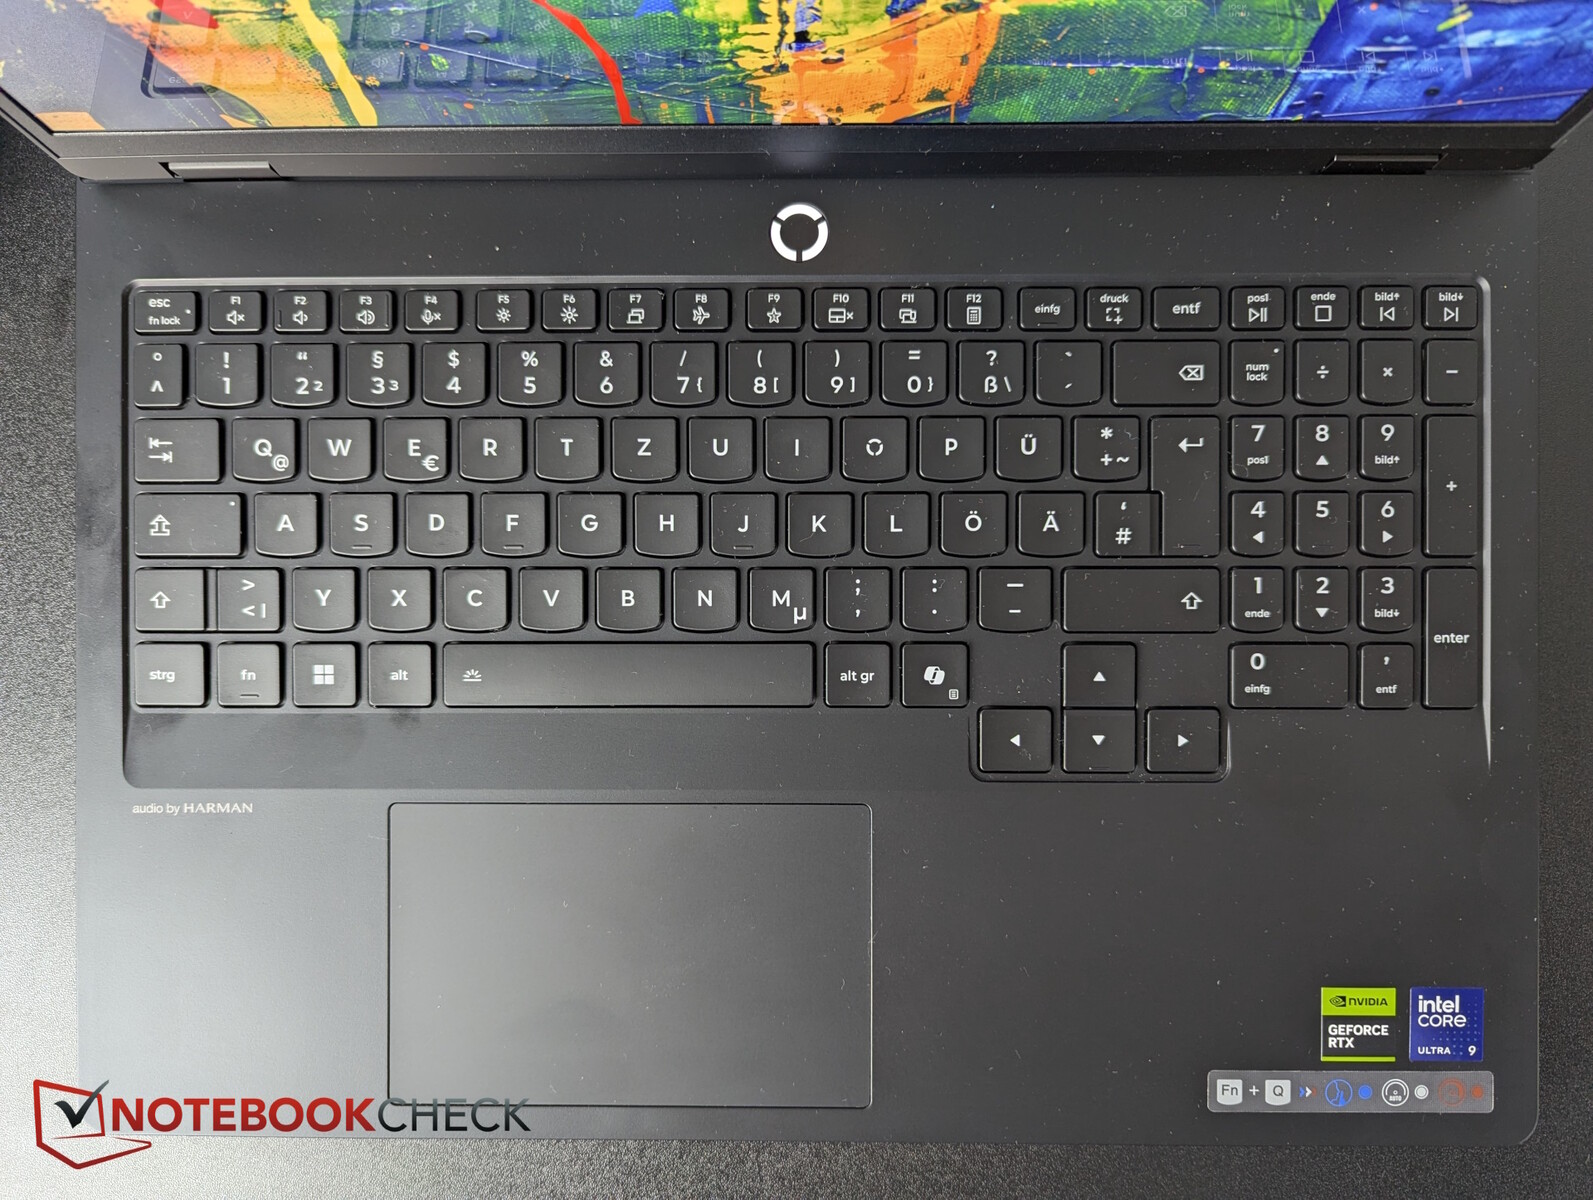
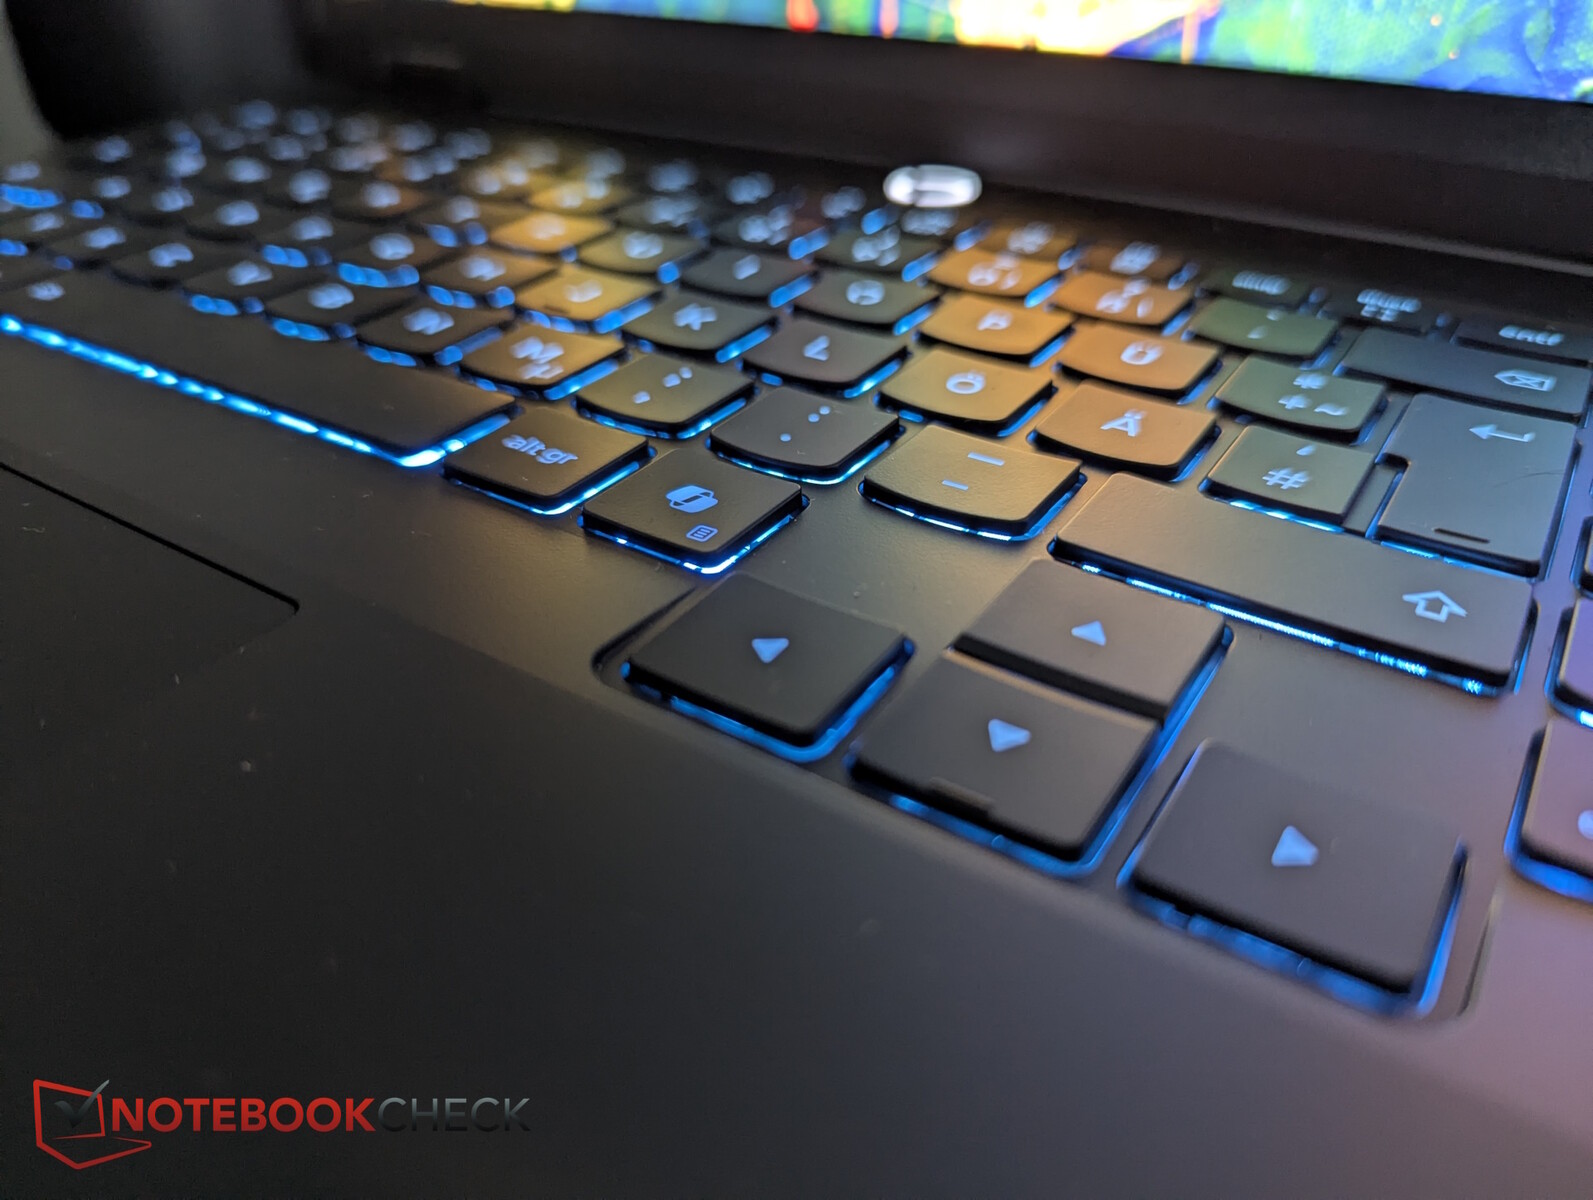
Périphériques d'entrée - Bon pour un joueur
Clavier
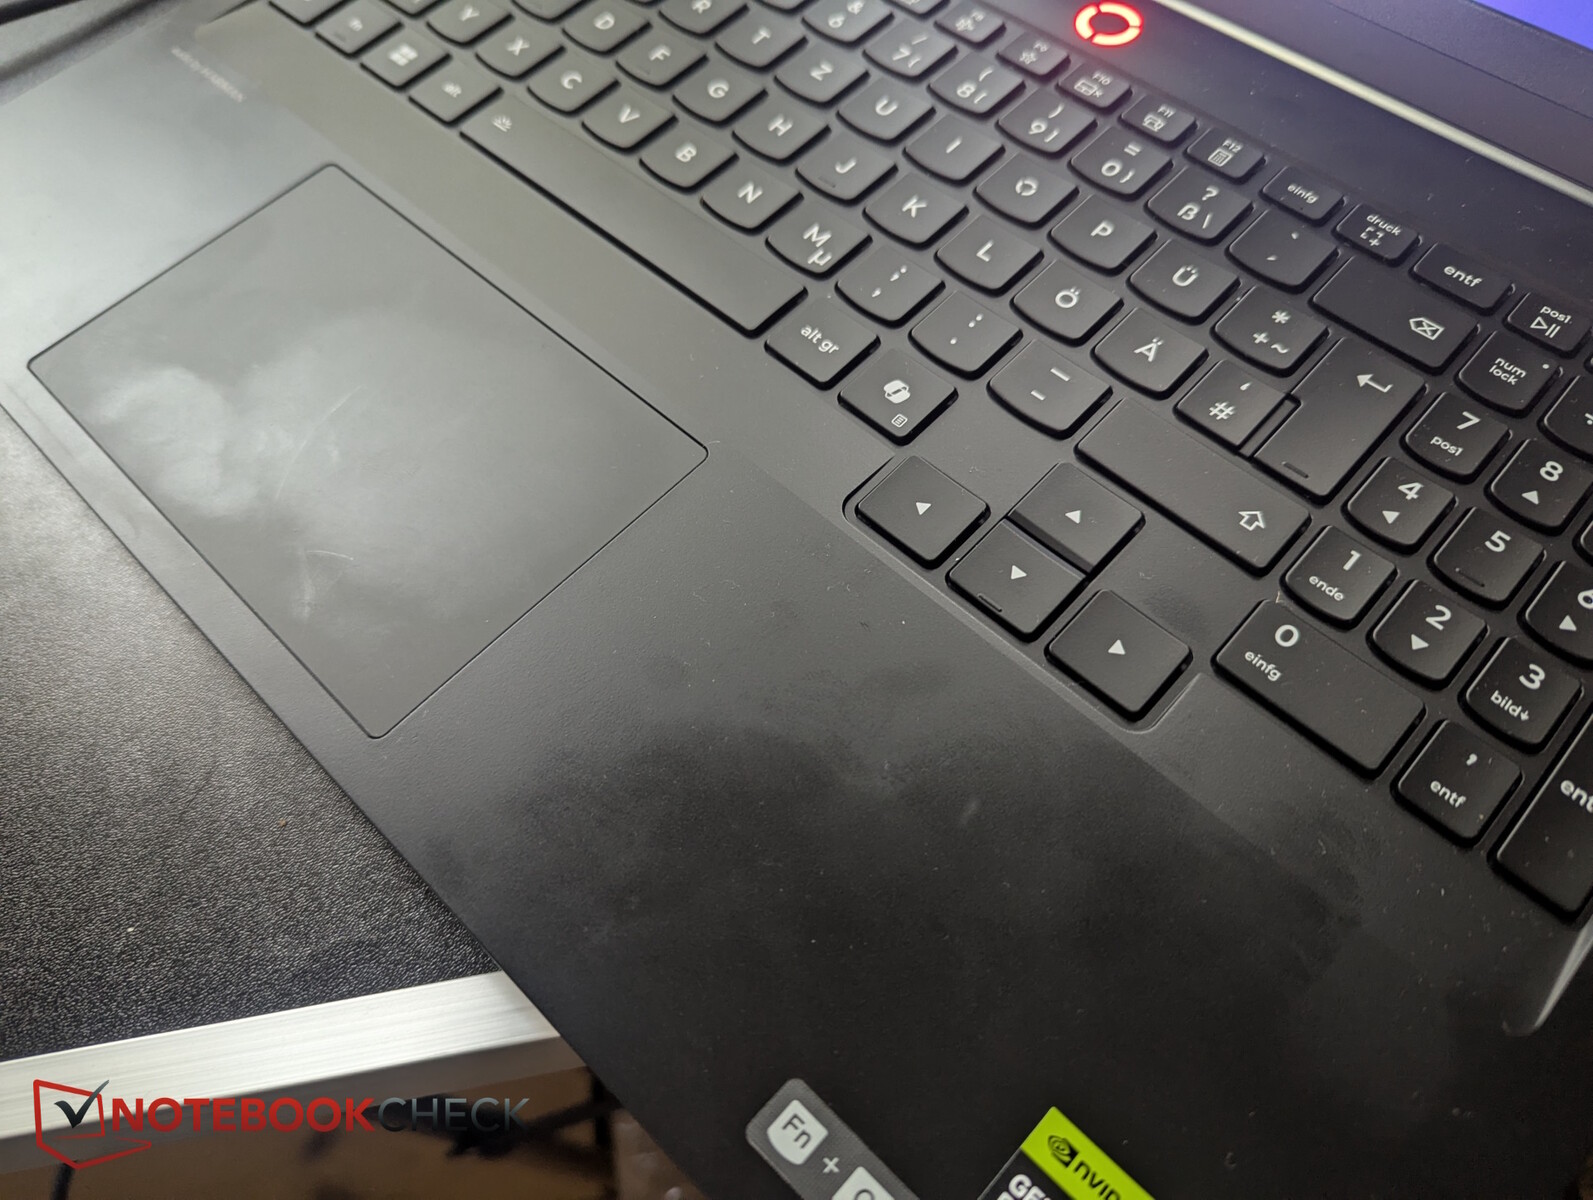
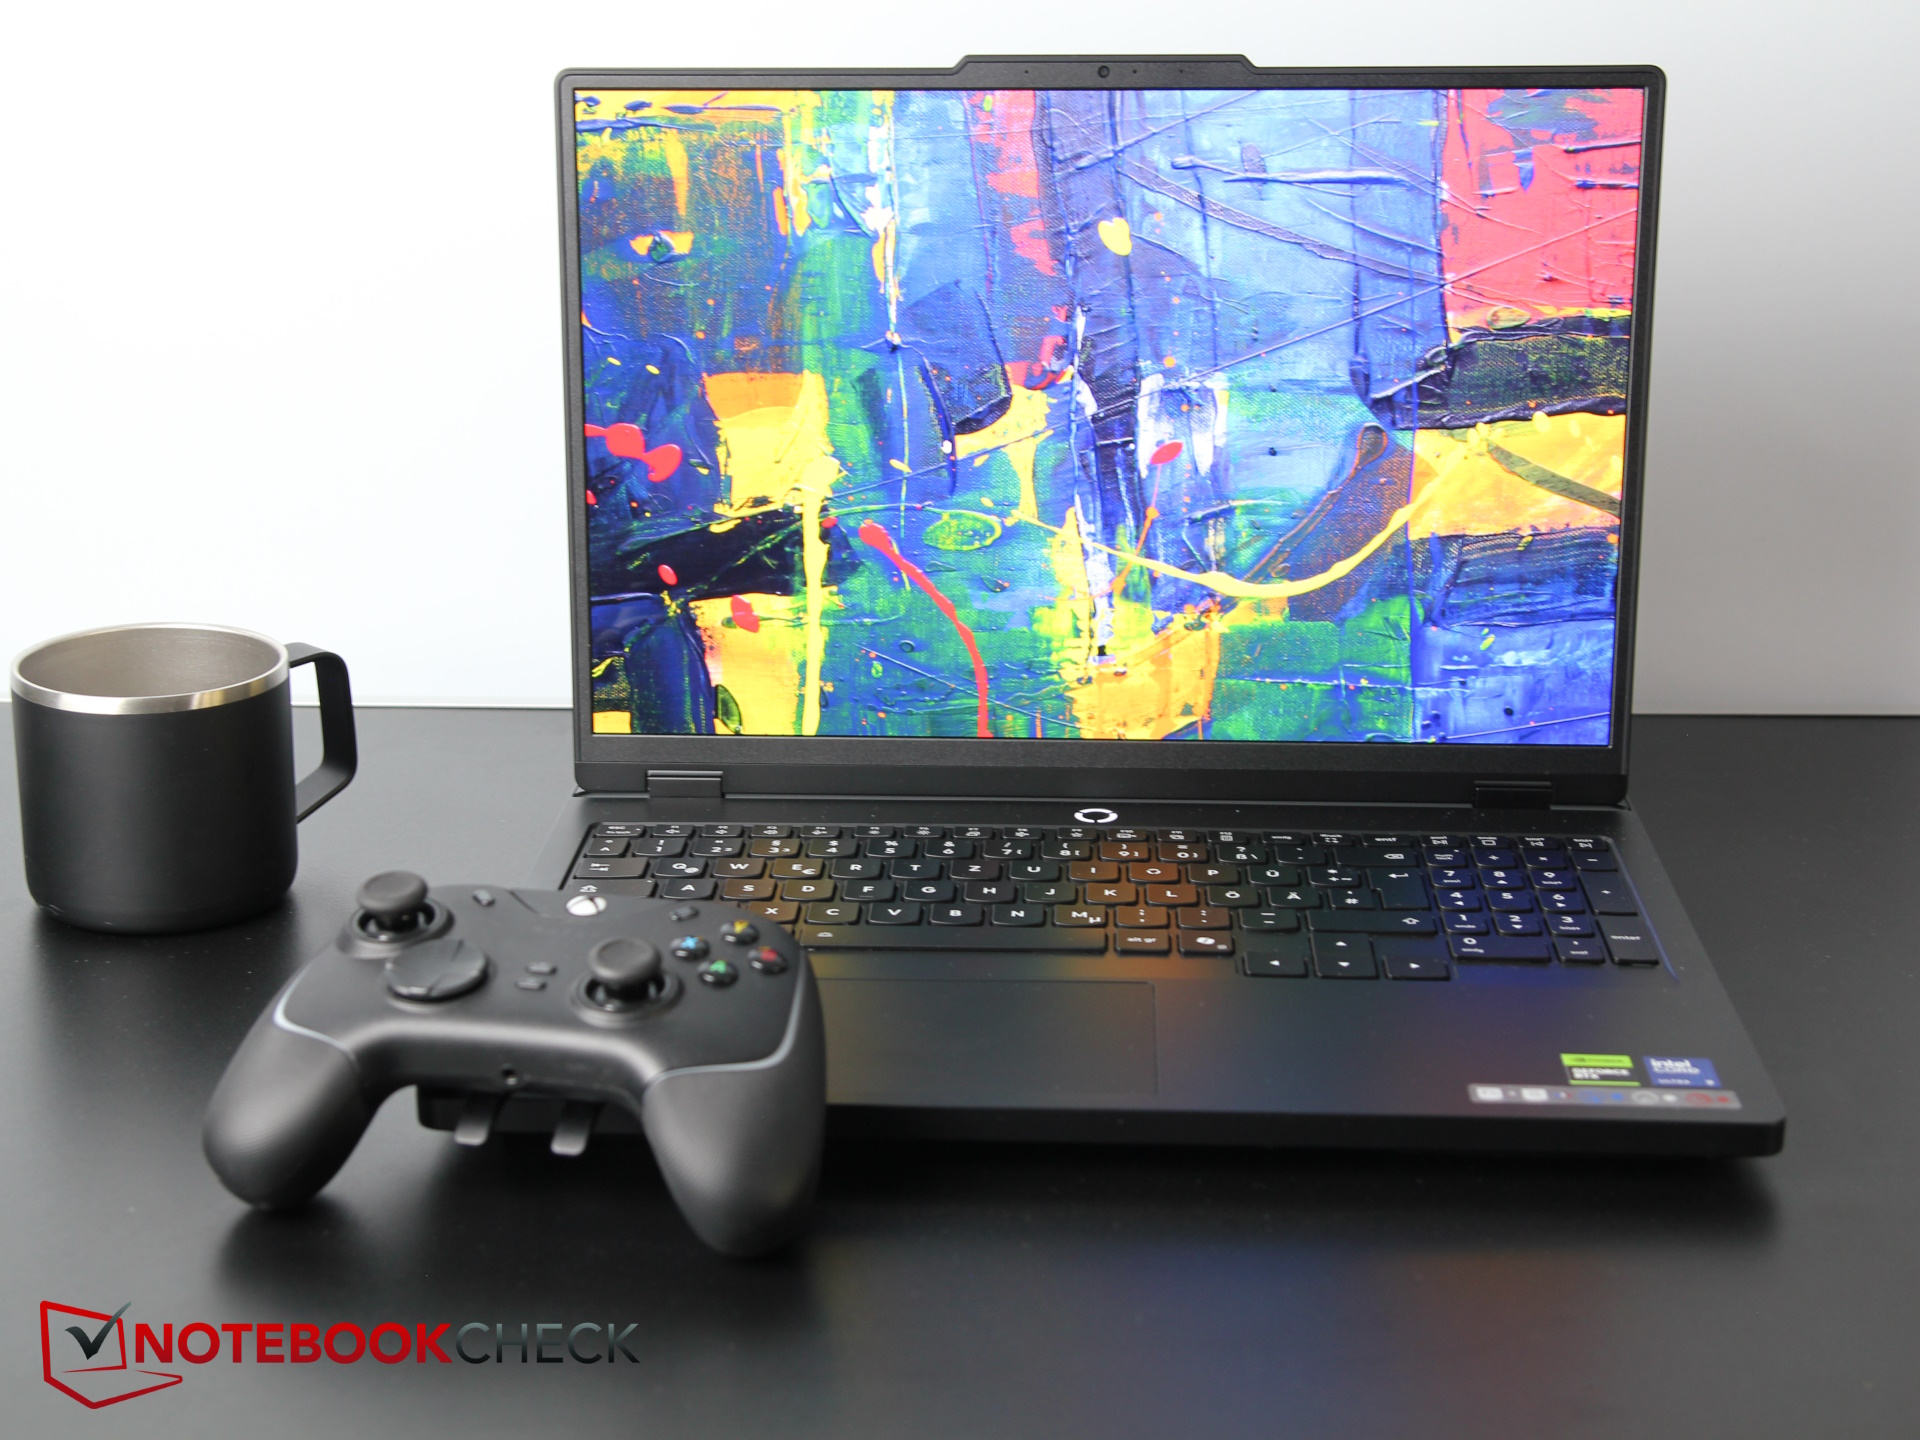
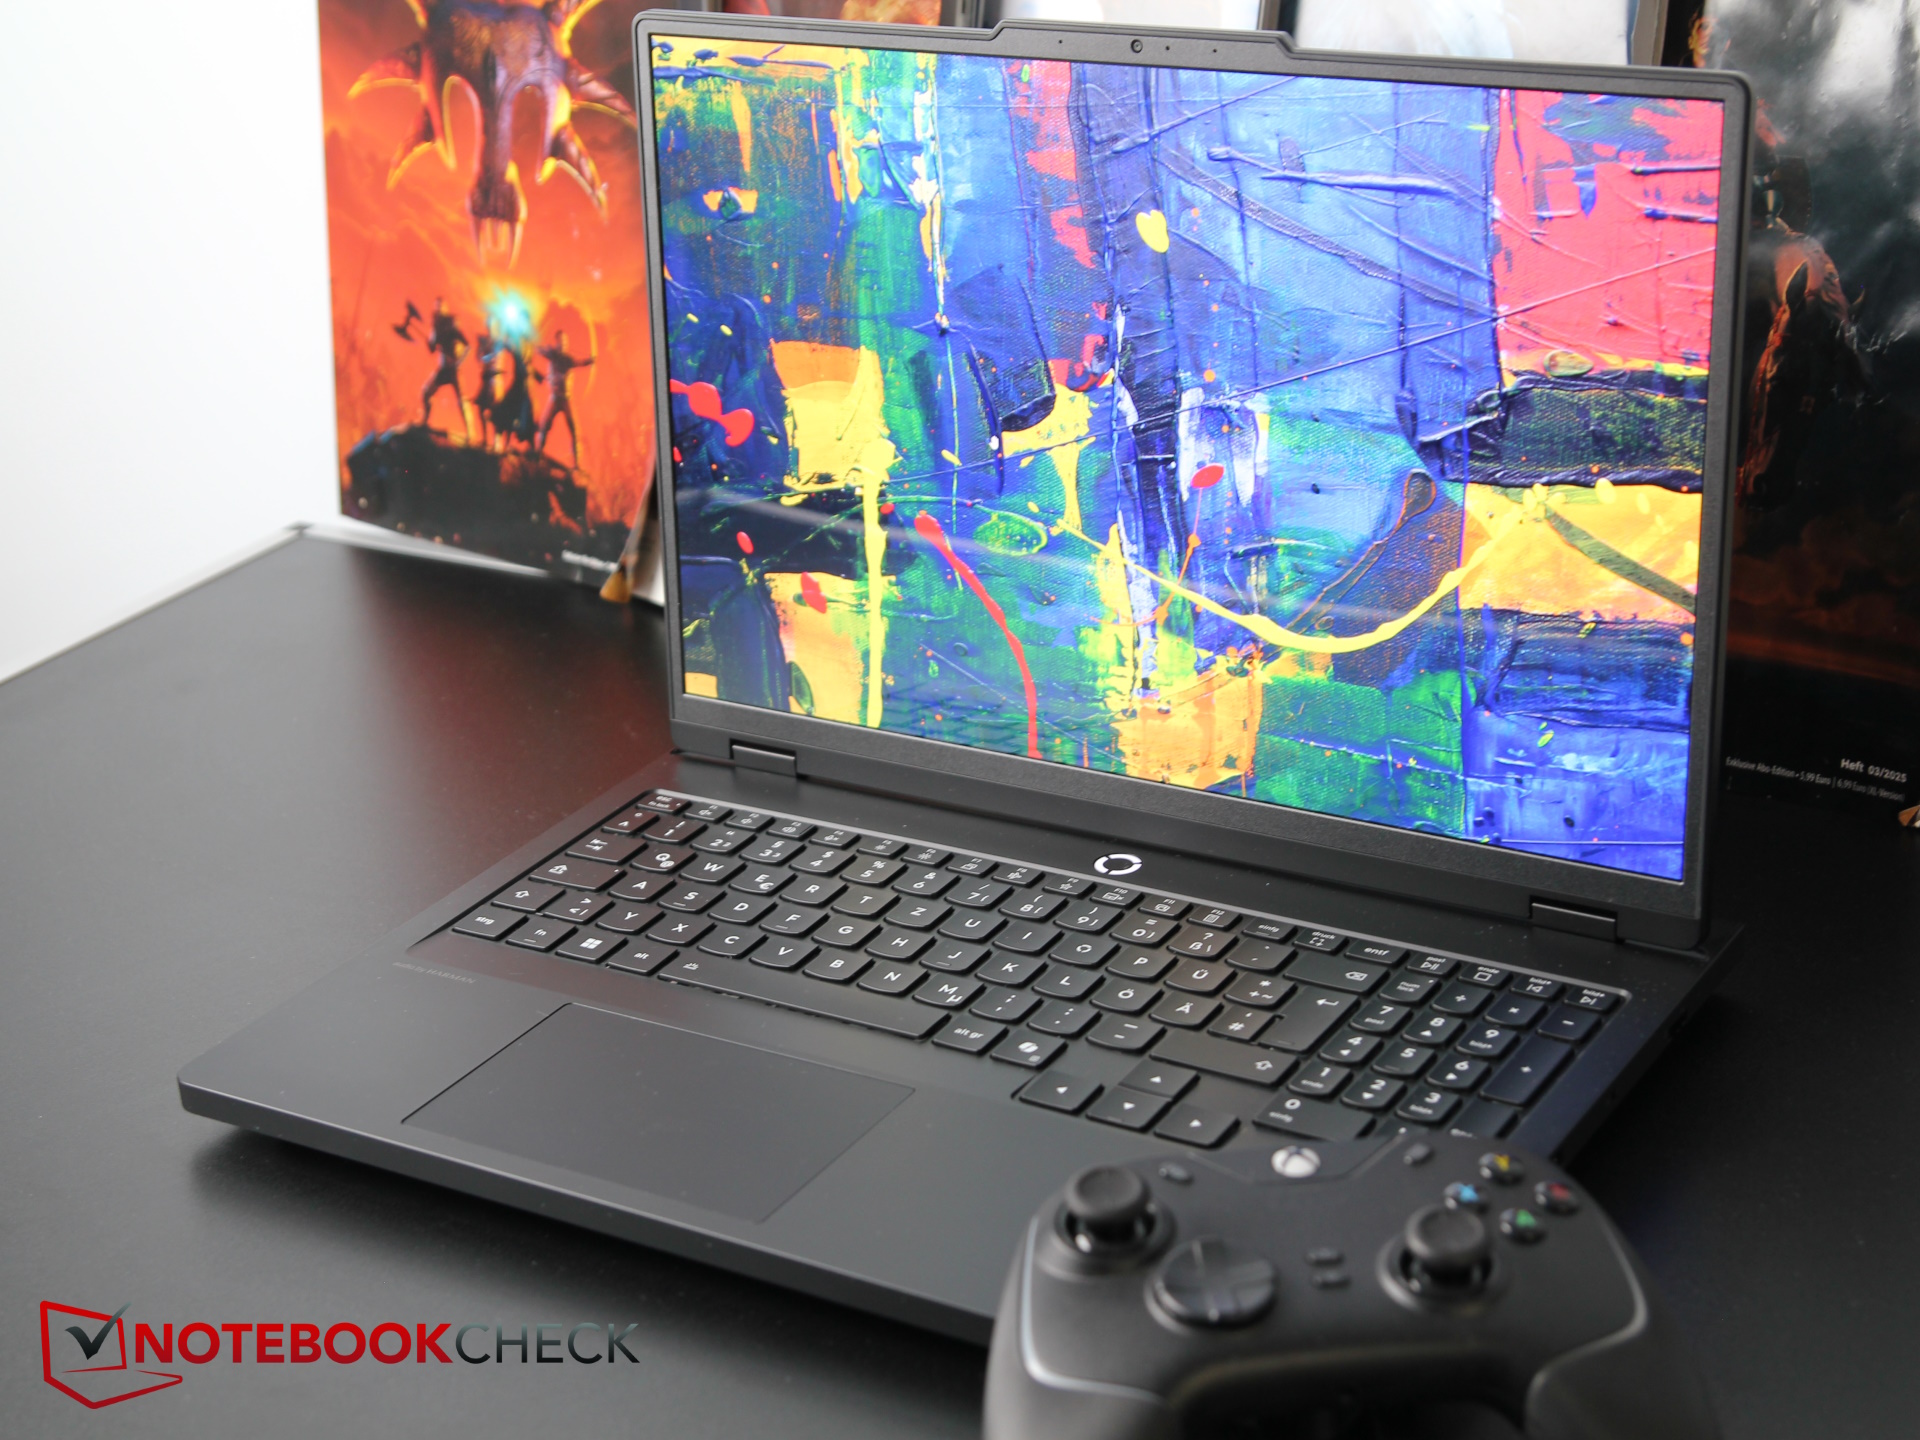
Toutes les touches sont espacées, avec un pavé numérique étroit sur la droite. Les touches fléchées de taille normale sont légèrement décalées et le bouton d'alimentation est conçu comme un bouton séparé au-dessus du clavier - tout cela est très bien. Le rétroéclairage RVB peut être configuré en 24 zones différentes.
Les touches sont impressionnantes, avec un point de pression clair et donc un bon retour d'information, même si la course est moyenne à courte. Dans l'ensemble, le clavier est très confortable à utiliser et rapide à taper, et le bruit de la frappe peut être qualifié de faible à modéré.
Pavé tactile
Le pavé tactile mesure 12 x 7,5 cm et est recouvert d'une surface lisse en Mylar. Les entrées multi-touch sont implémentées sans problème, et les boutons intégrés répondent de manière fiable et avec un clic modéré. Cependant, lors de nos tests, les clics n'ont pas toujours été reconnus correctement.
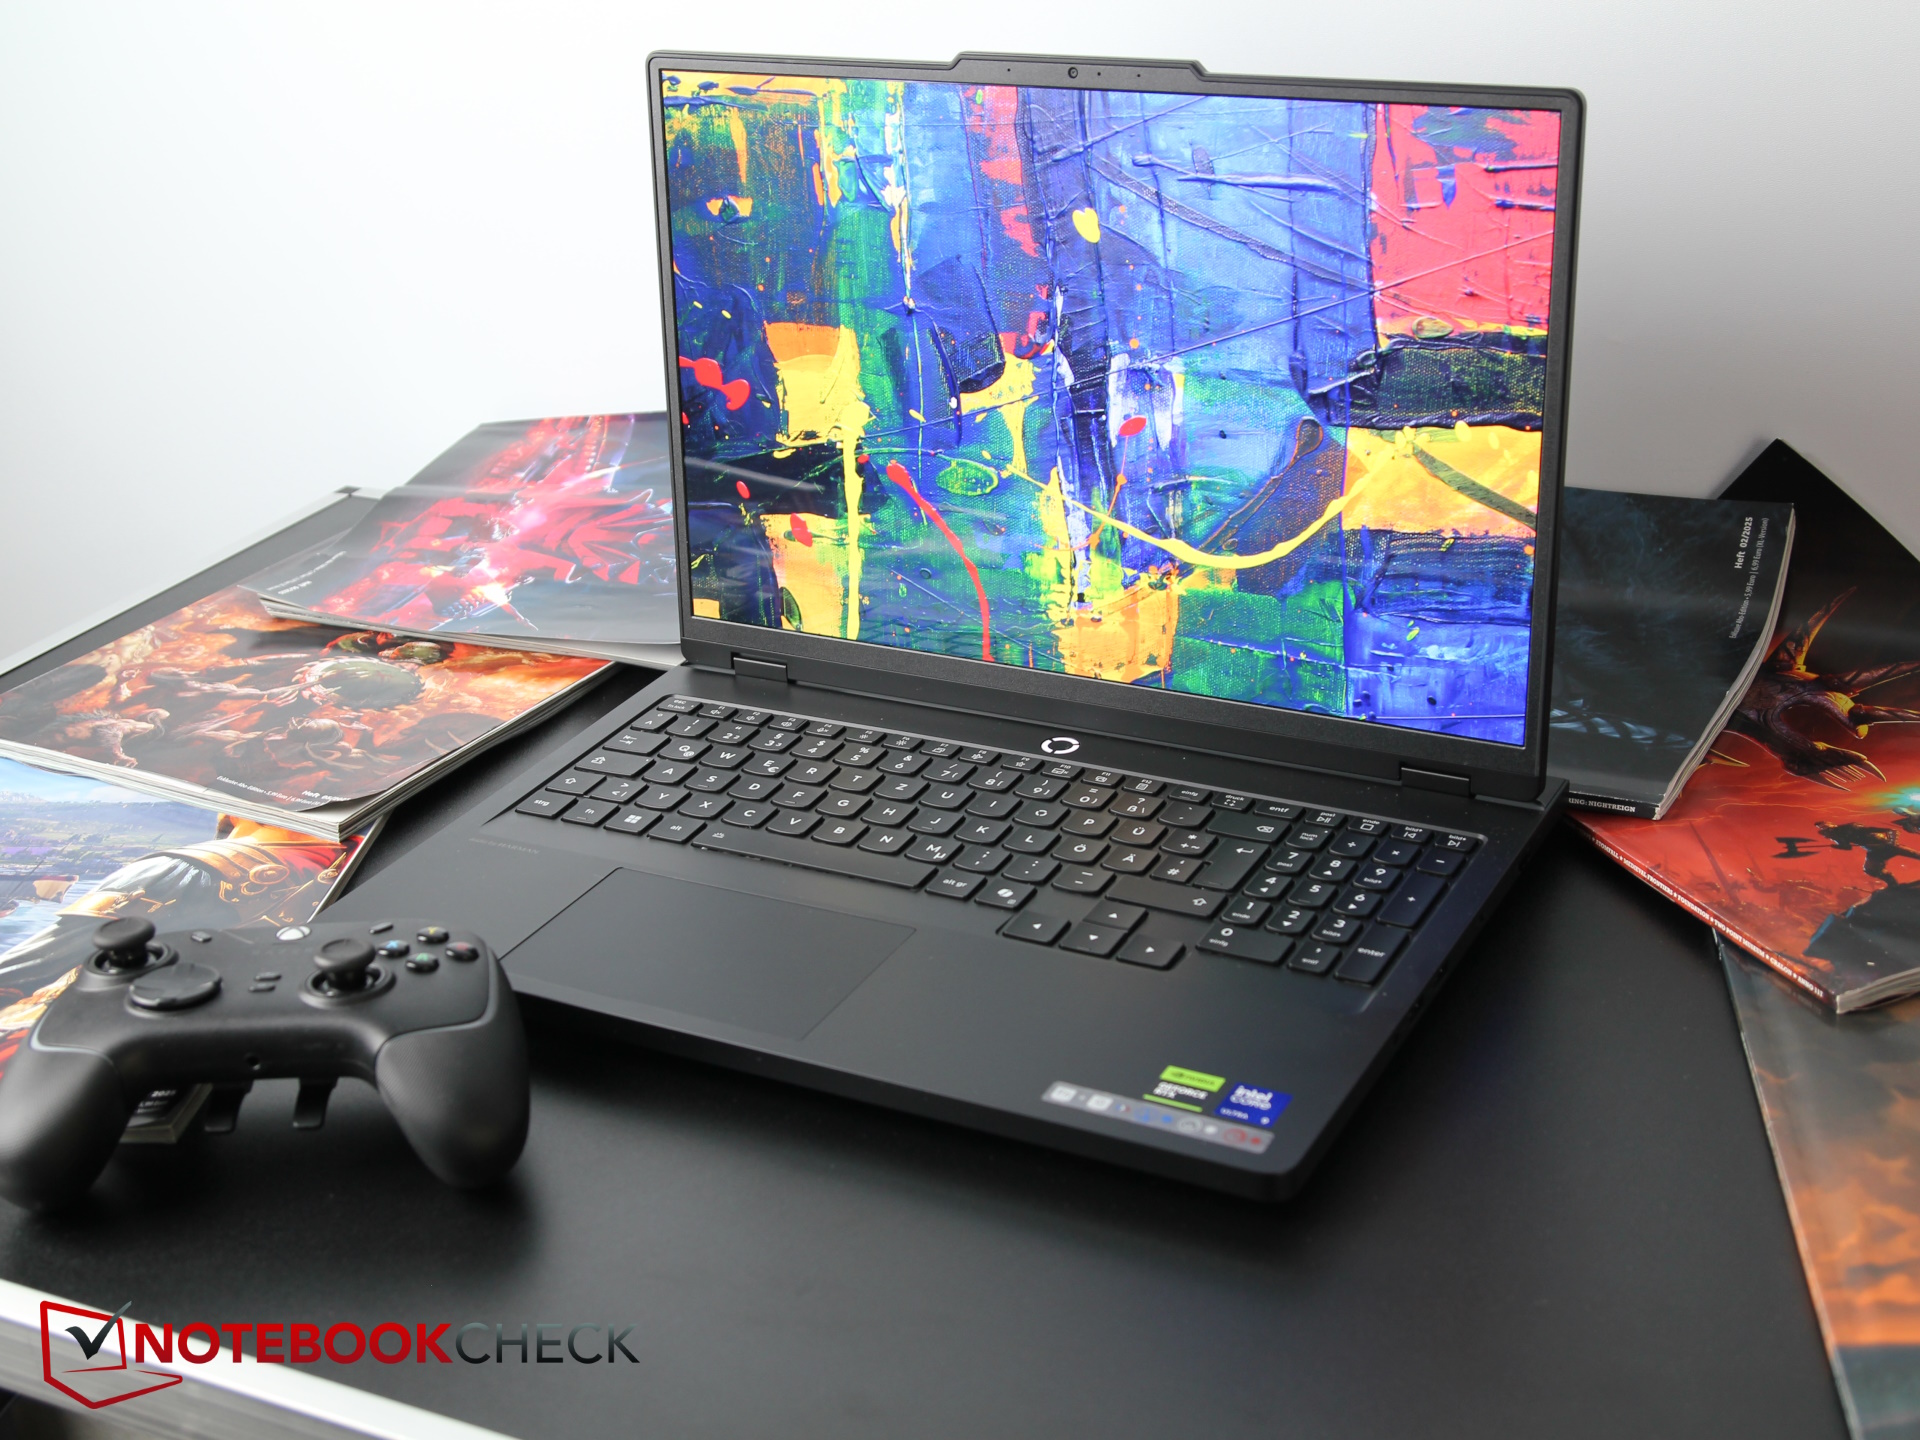
Écran - Un OLED éblouissant
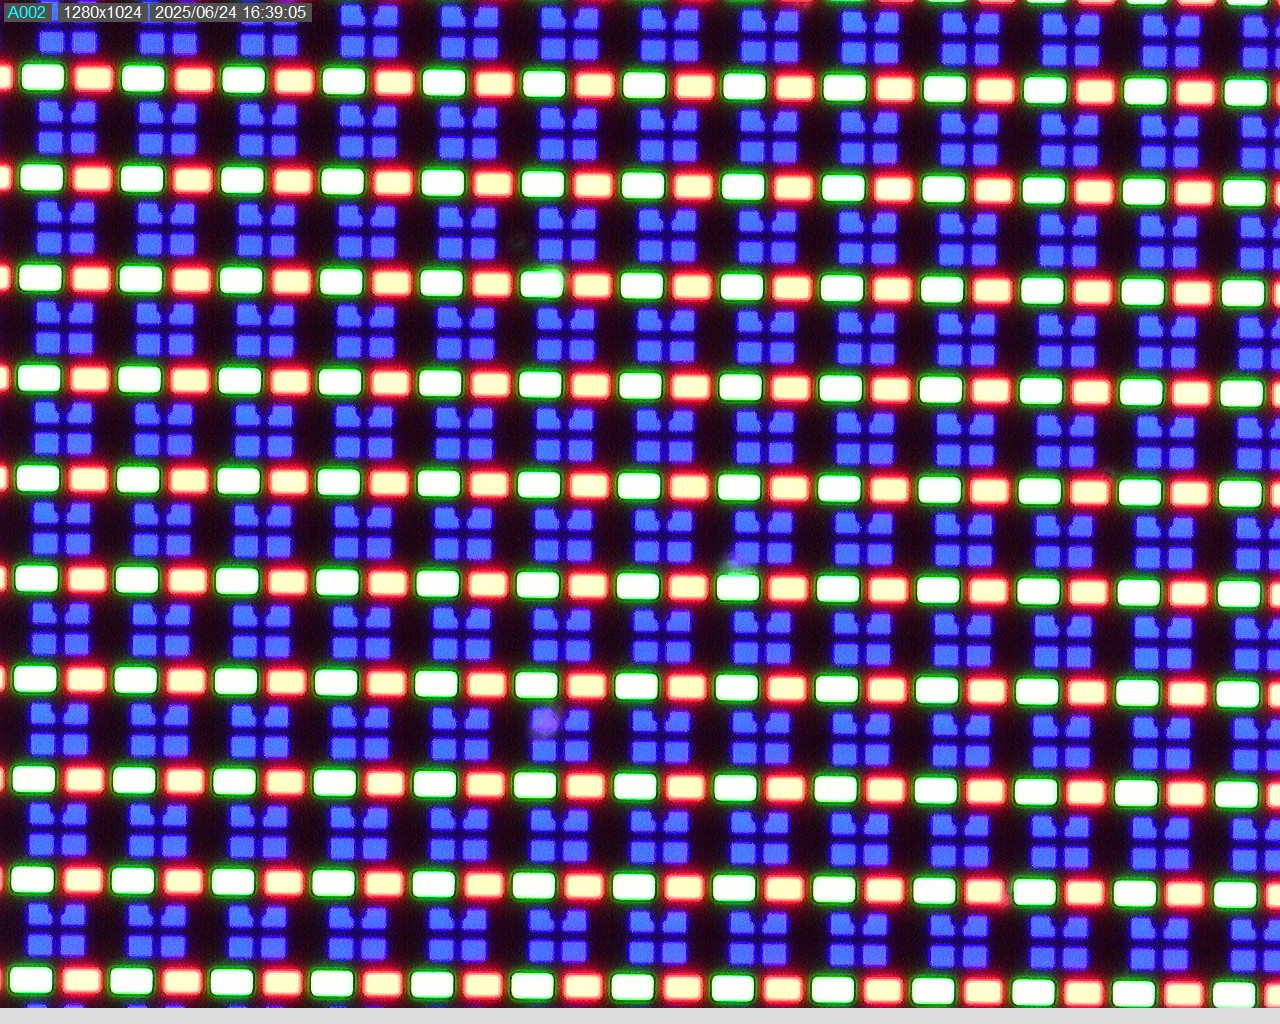
Lenovo a équipé le Pro 5 d'un écran OLED brillant de 16 pouces, d'une résolution de 2 560 x 1 600 pixels. L'écran prend en charge DisplayHDR True Black 1000, Dolby Vision et G-Sync.
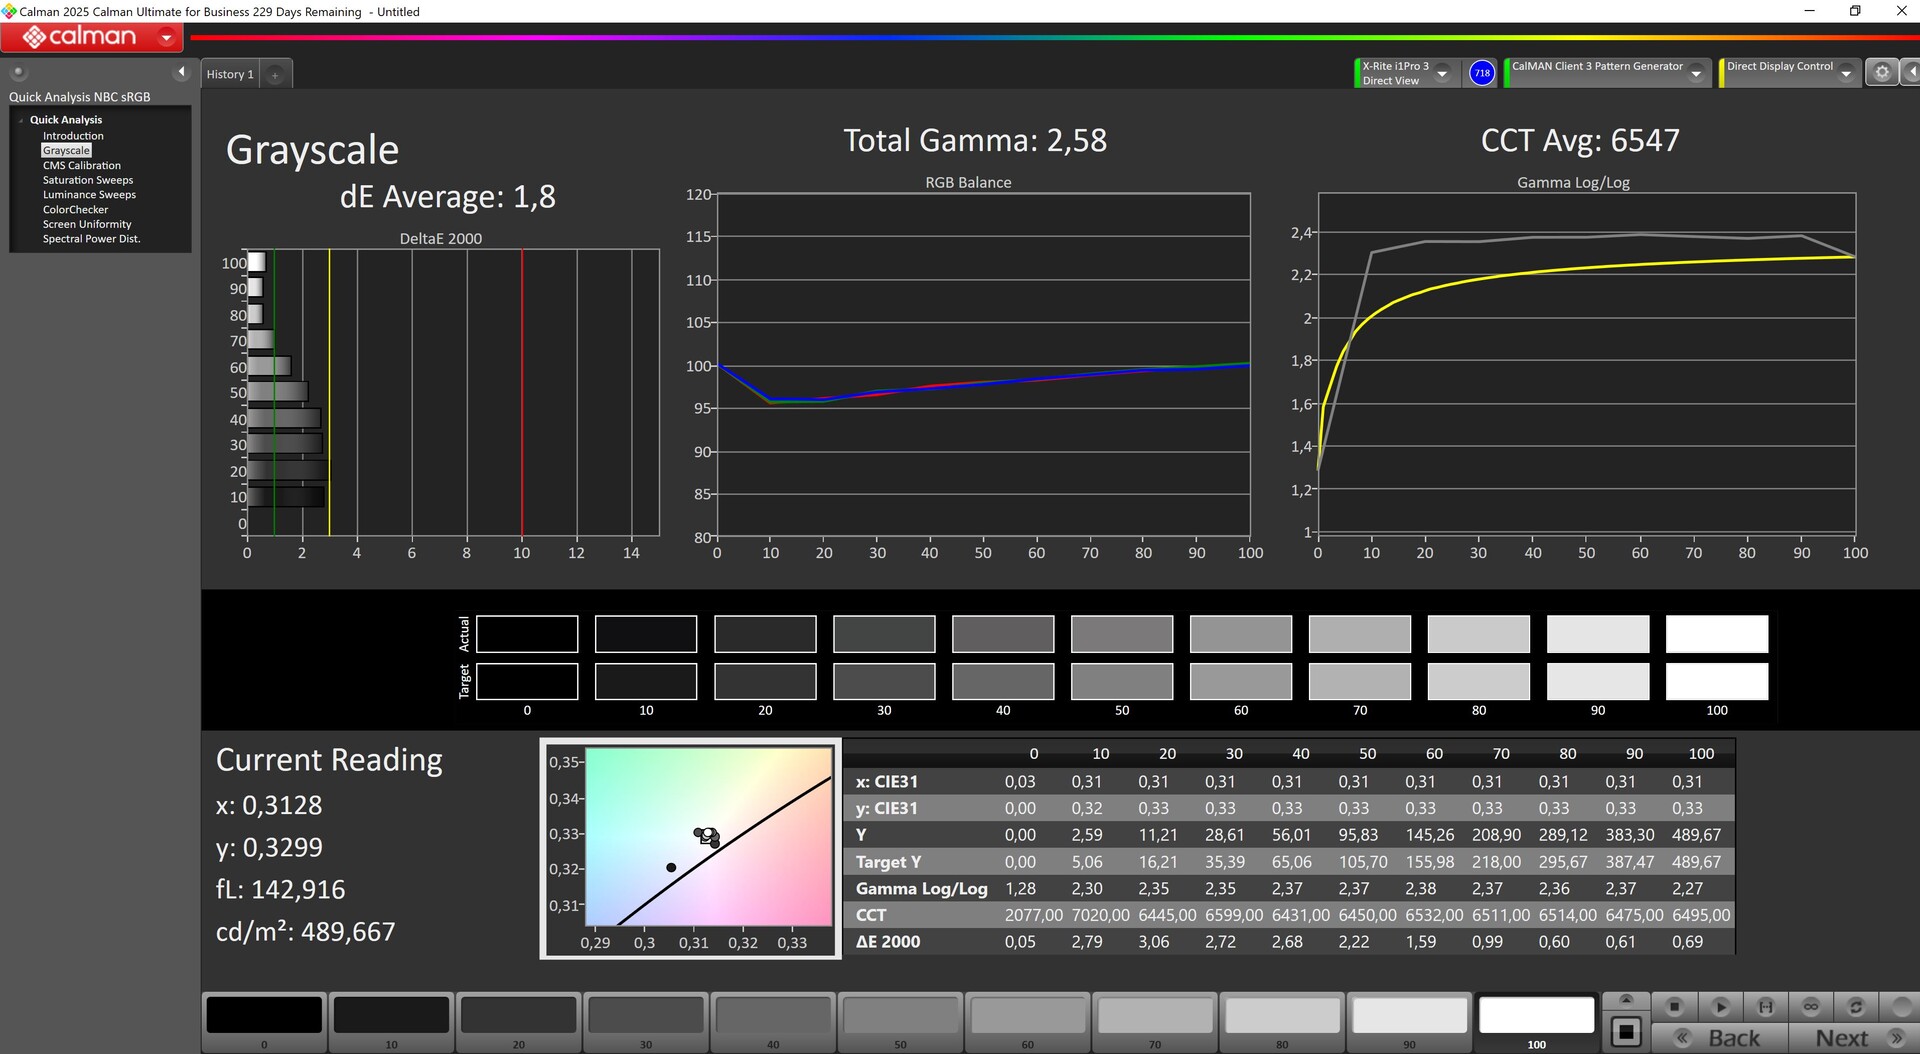
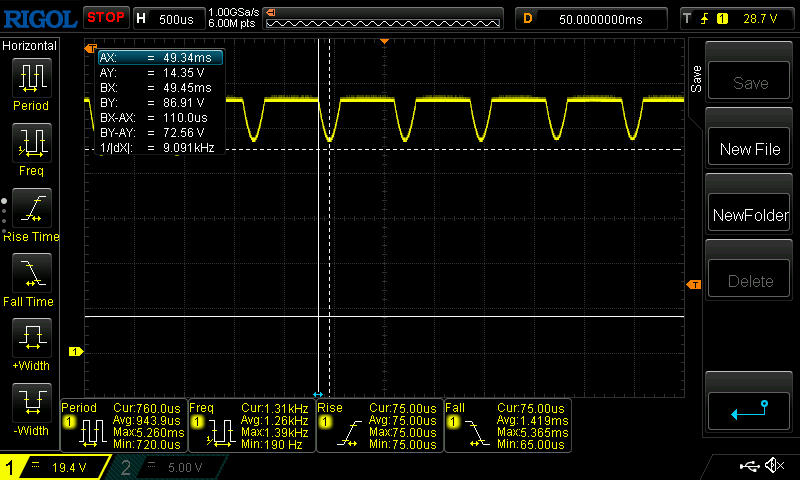
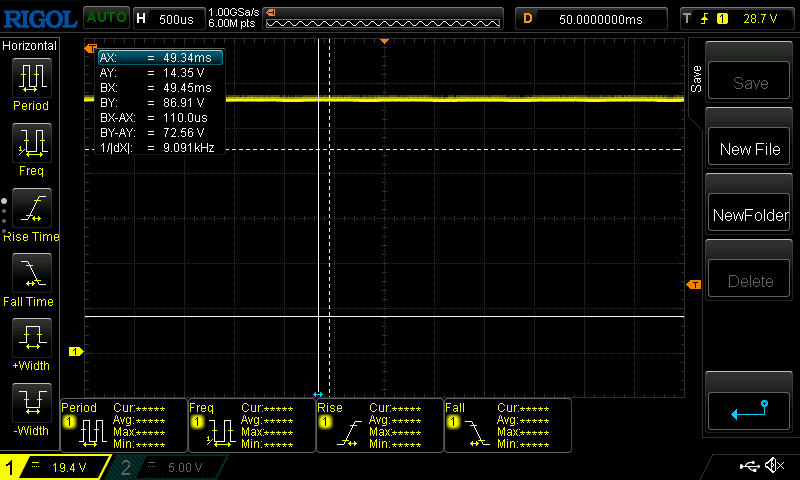
Nous avons mesuré une luminosité moyenne de 522 nits et un excellent éclairage de 97 %. Comme c'est le cas pour les OLED, le niveau de noir est pratiquement nul, ce qui se traduit par un excellent contraste. L'affichage est extrêmement rapide (environ 2 ms). L'écran scintille, mais à une fréquence élevée de 1,3 kHz, ce que même les utilisateurs sensibles ne devraient pas remarquer.
| |||||||||||||||||||||||||
Homogénéité de la luminosité: 97 %
Valeur mesurée au centre, sur batterie: 518 cd/m²
Contraste: ∞:1 (Valeurs des noirs: 0 cd/m²)
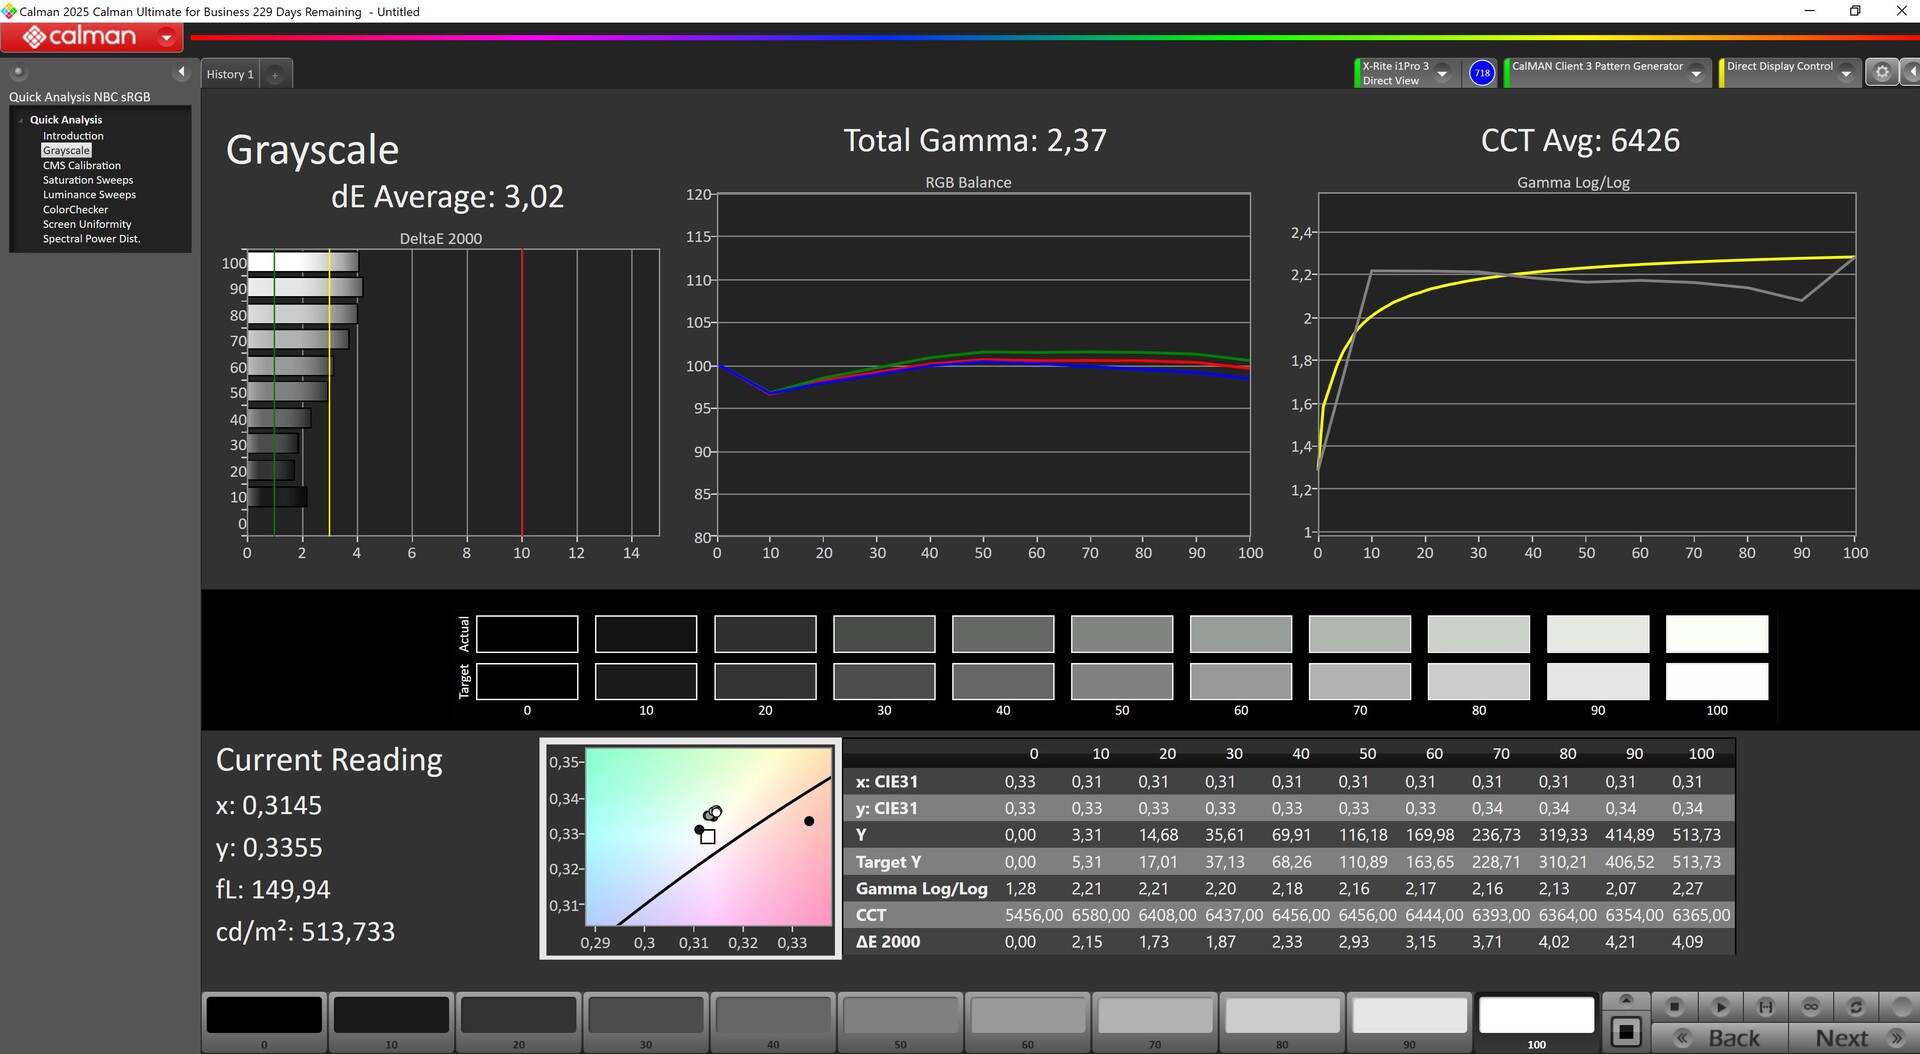
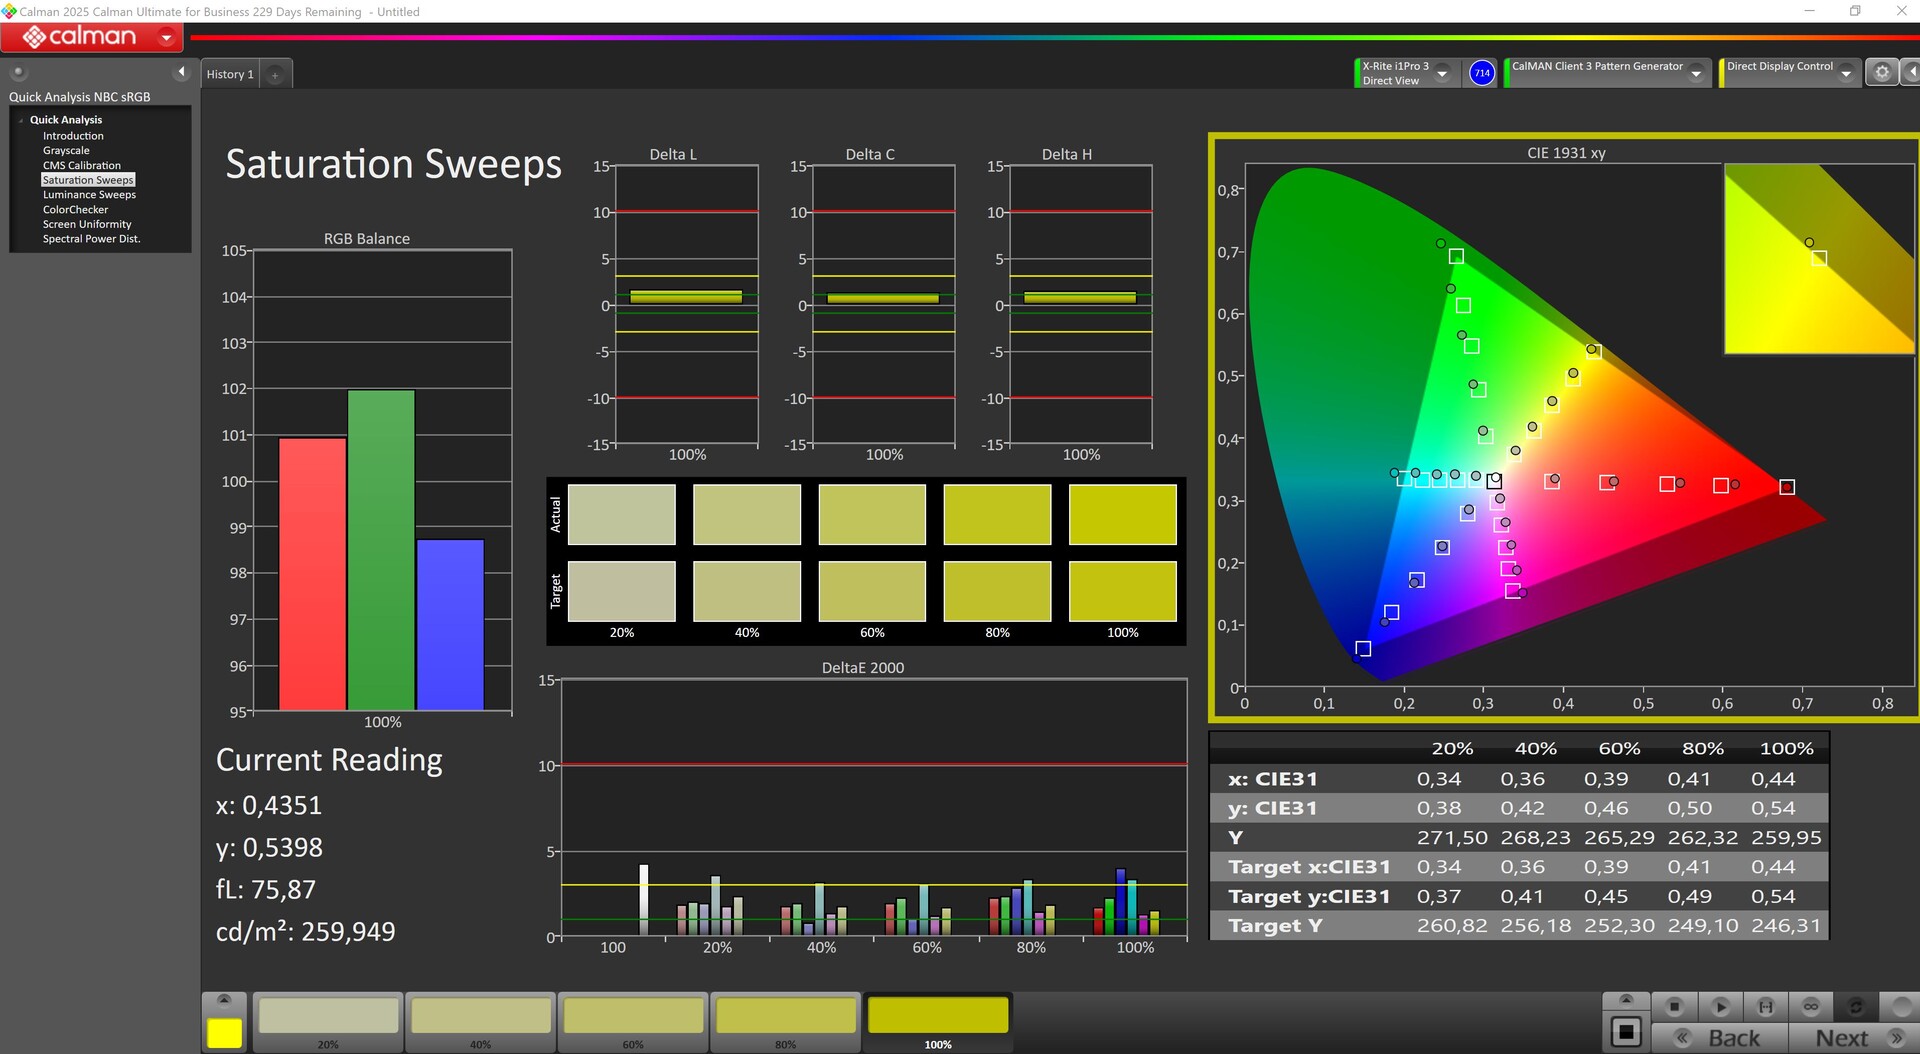
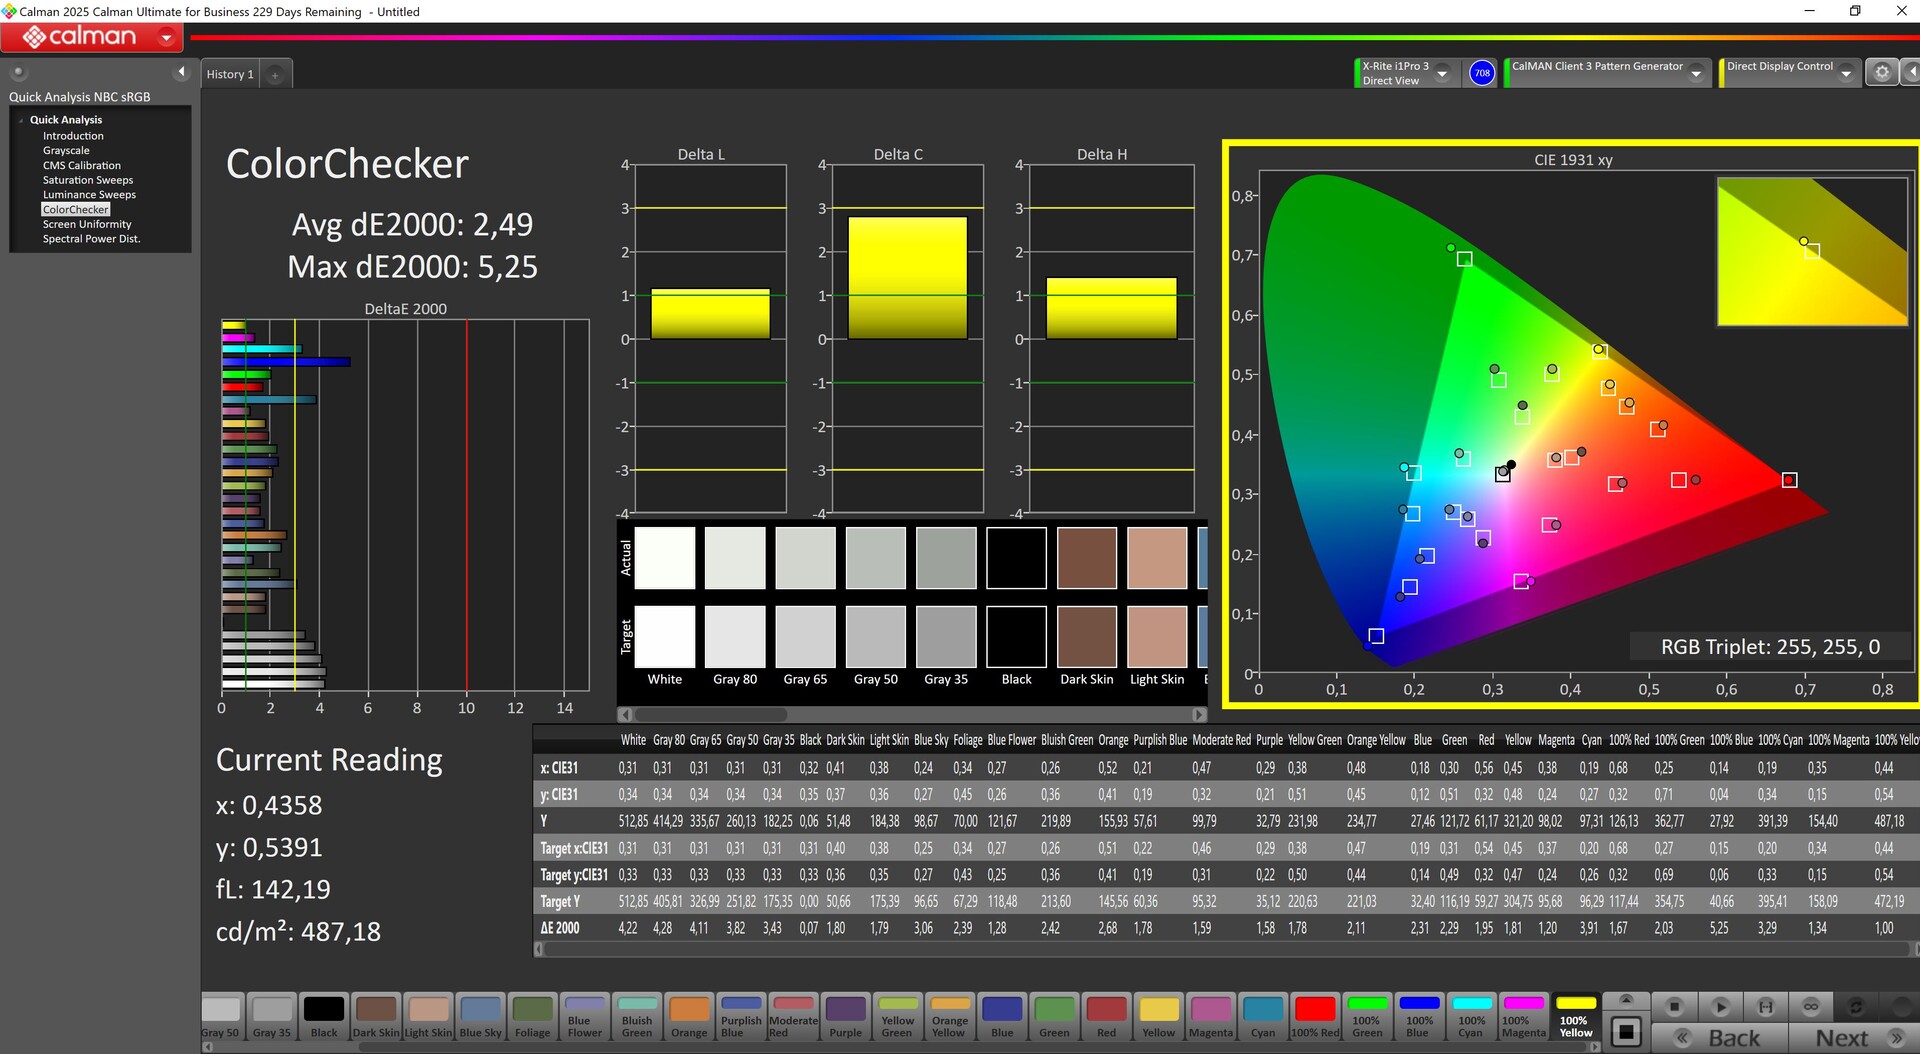
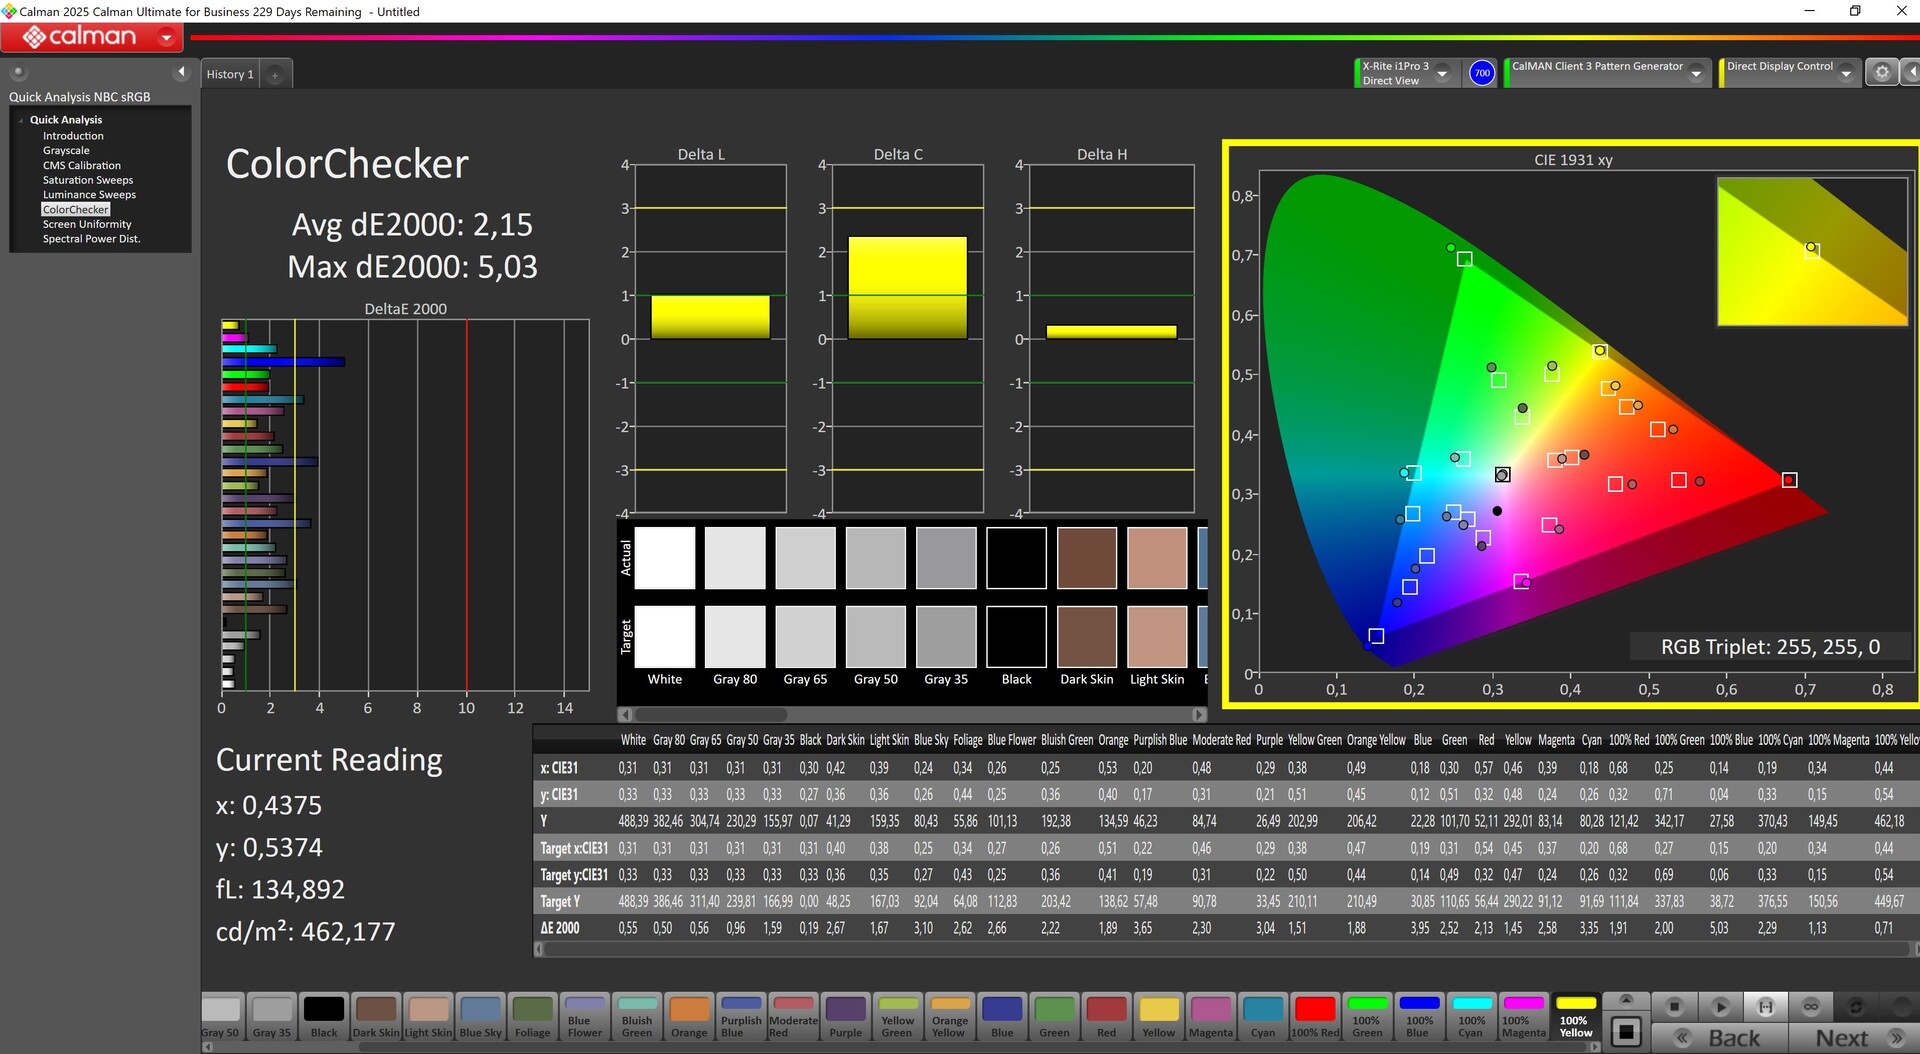
ΔE ColorChecker Calman: 2.49 | ∀{0.5-29.43 Ø4.72}
calibrated: 2.15
ΔE Greyscale Calman: 3.02 | ∀{0.09-98 Ø4.97}
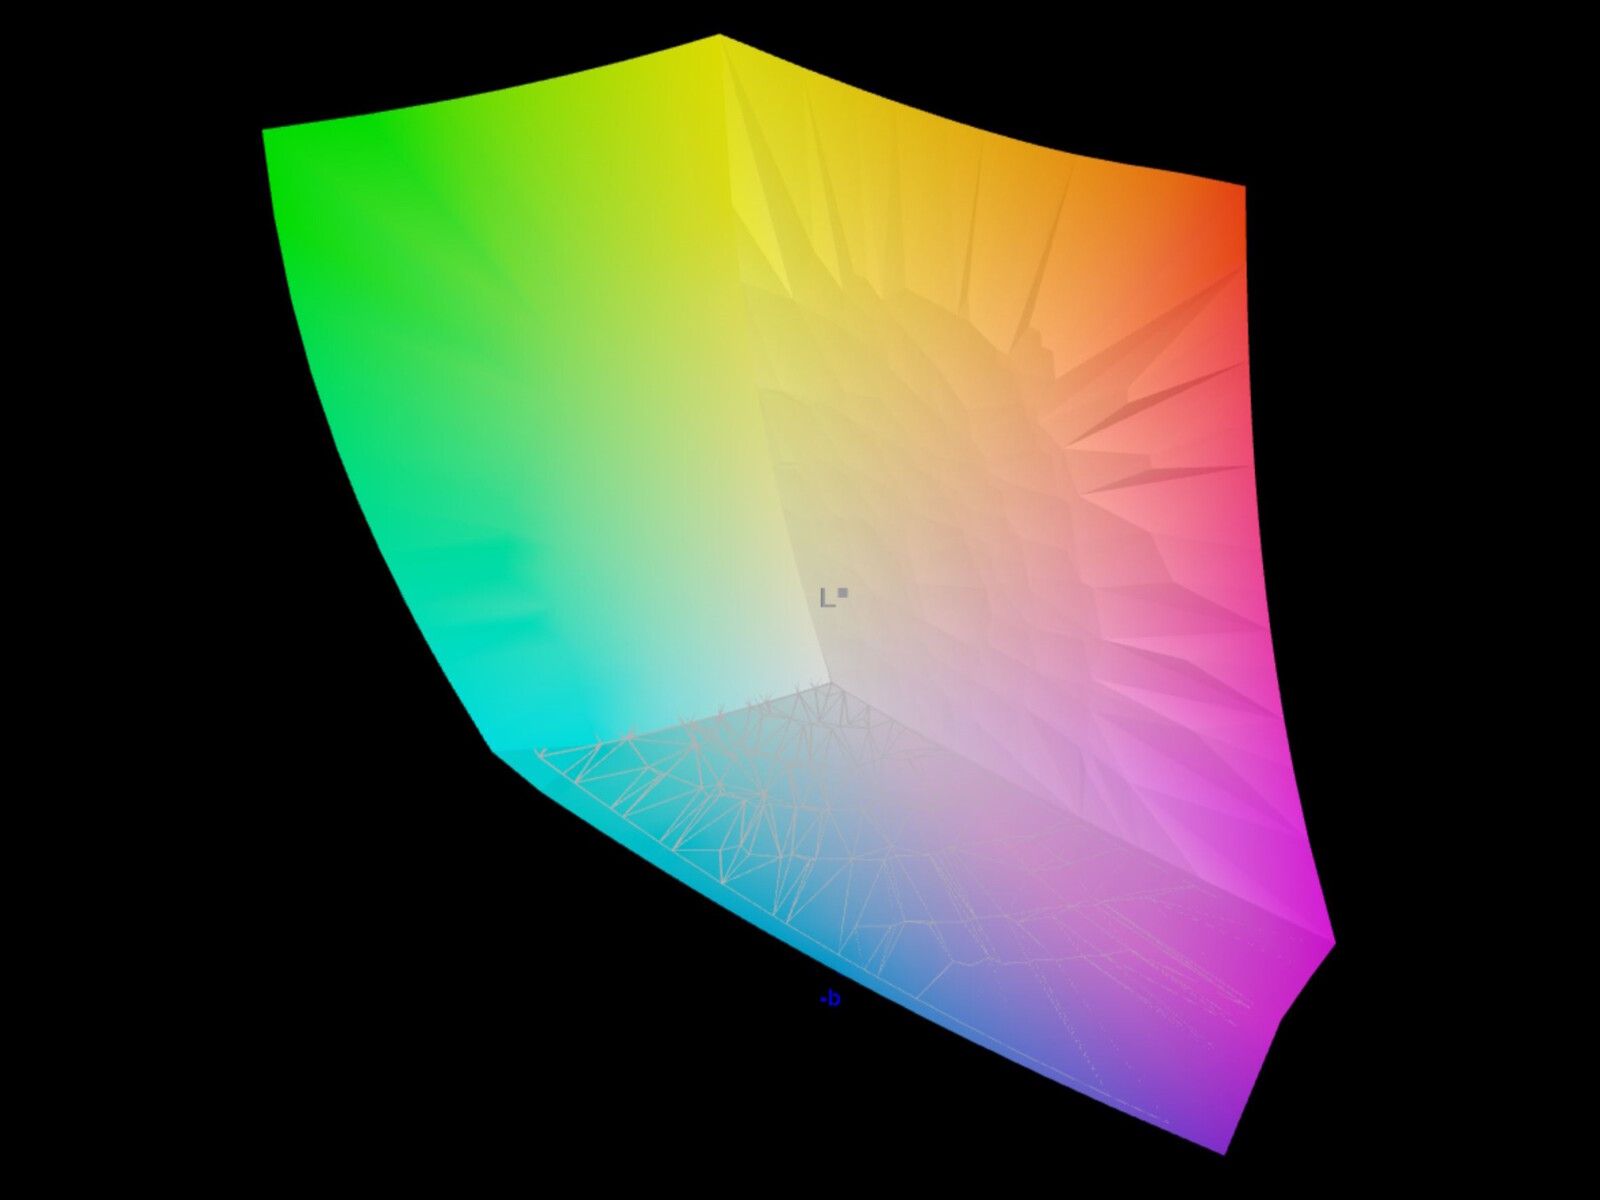
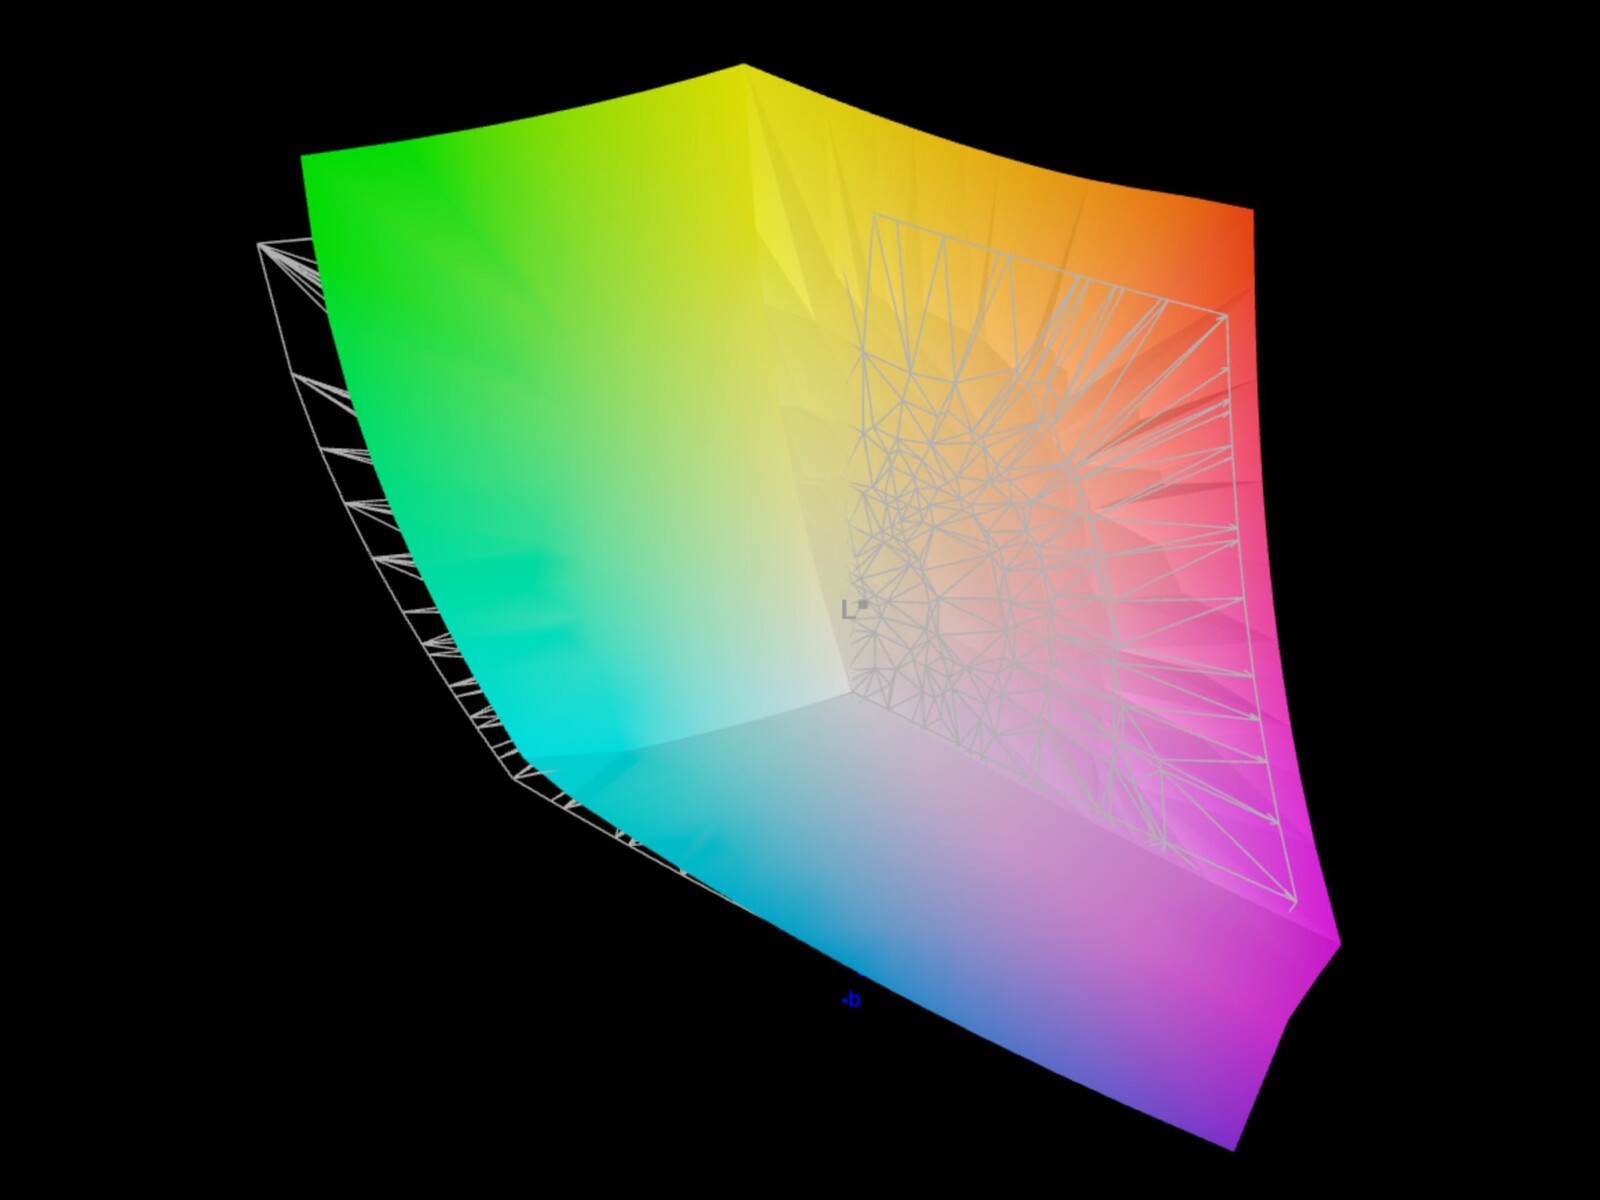
94.1% AdobeRGB 1998 (Argyll 3D)
100% sRGB (Argyll 3D)
99.9% Display P3 (Argyll 3D)
Gamma: 2.37
CCT: 6426 K
| Lenovo Legion 5 Pro 16IAX10H ATNA60HS01-0 (Samsung SDC420A), OLED, 2560x1600, 16", 165 Hz | Lenovo Legion Pro 5 16IRX9 BOE NE160QDM-NYC, IPS, 2560x1600, 16", 165 Hz | Schenker XMG Neo 16 E25 RTX 5090 Laptop NE160QDM-NM9, Mini-LED, 2560x1600, 16", 300 Hz | Aorus MASTER 16 AM6H ATNA60DL03-0 (SDC41AB), OLED, 2560x1600, 16", 240 Hz | Schenker XMG Pro 16 (E25) NE160QDM-NZL, IPS, 2560x1600, 16", 300 Hz | Asus ROG Strix Scar 16 2025 NE160QDM-NM8, Mini-LED, 2560x1600, 16", 240 Hz | Lenovo Legion Pro 7i 16 Gen 10 Samsung ATNA60HU01-0, OLED, 2560x1600, 16", 240 Hz | |
|---|---|---|---|---|---|---|---|
| Display | -19% | -2% | -2% | -15% | -2% | 0% | |
| Display P3 Coverage (%) | 99.9 | 69.3 -31% | 99.9 0% | 95.3 -5% | 74.7 -25% | 99.9 0% | 99.5 0% |
| sRGB Coverage (%) | 100 | 99.4 -1% | 100 0% | 98.8 -1% | 99.8 0% | 100 0% | 100 0% |
| AdobeRGB 1998 Coverage (%) | 94.1 | 70.1 -26% | 88.5 -6% | 94.1 0% | 75.4 -20% | 88.4 -6% | 94.4 0% |
| Response Times | -516% | -649% | -8% | -356% | -375% | 27% | |
| Response Time Grey 50% / Grey 80% * (ms) | 2 ? | 11.9 ? -495% | 17.4 ? -770% | 0.24 ? 88% | 10.5 ? -425% | 7 ? -250% | 0.28 ? 86% |
| Response Time Black / White * (ms) | 1.4 ? | 8.9 ? -536% | 13 ? -829% | 0.43 ? 69% | 5.4 ? -286% | 8.4 ? -500% | 0.43 ? 69% |
| PWM Frequency (Hz) | 1300 | 20253 | 960 | 20555 ? | 1438 ? | ||
| PWM Amplitude * (%) | 16.7 | 75 -349% | 47 -181% | 29 -74% | |||
| Screen | 21% | 14% | -3% | 9% | 46% | 11% | |
| Brightness middle (cd/m²) | 518 | 384 -26% | 888 71% | 435 -16% | 538 4% | 754 46% | 490.4 -5% |
| Brightness (cd/m²) | 522 | 366 -30% | 859 65% | 437 -16% | 508 -3% | 773 48% | 498 -5% |
| Brightness Distribution (%) | 97 | 91 -6% | 94 -3% | 96 -1% | 88 -9% | 91 -6% | 97 0% |
| Black Level * (cd/m²) | 0.35 | 0.08 | 0.47 | 0.07 | |||
| Colorchecker dE 2000 * | 2.49 | 0.97 61% | 3.3 -33% | 2.42 3% | 1.9 24% | 1 60% | 3.2 -29% |
| Colorchecker dE 2000 max. * | 5.25 | 3.57 32% | 5.5 -5% | 4.81 8% | 4 24% | 2 62% | 6.04 -15% |
| Colorchecker dE 2000 calibrated * | 2.15 | 0.77 64% | 1.5 30% | 2.03 6% | 0.84 61% | ||
| Greyscale dE 2000 * | 3.02 | 1.5 50% | 3.8 -26% | 3.11 -3% | 2.7 11% | 1 67% | 1 67% |
| Gamma | 2.37 93% | 2.24 98% | 2.46 89% | 2.48 89% | 2.24 98% | 2.14 103% | 2.24 98% |
| CCT | 6426 101% | 6709 97% | 6267 104% | 6270 104% | 7027 93% | 6493 100% | 6373 102% |
| Contrast (:1) | 1097 | 5438 | 1145 | 10771 | |||
| Moyenne finale (programmes/paramètres) | -171% /
-79% | -212% /
-143% | -4% /
-4% | -121% /
-64% | -110% /
-44% | 13% /
12% |
* ... Moindre est la valeur, meilleures sont les performances
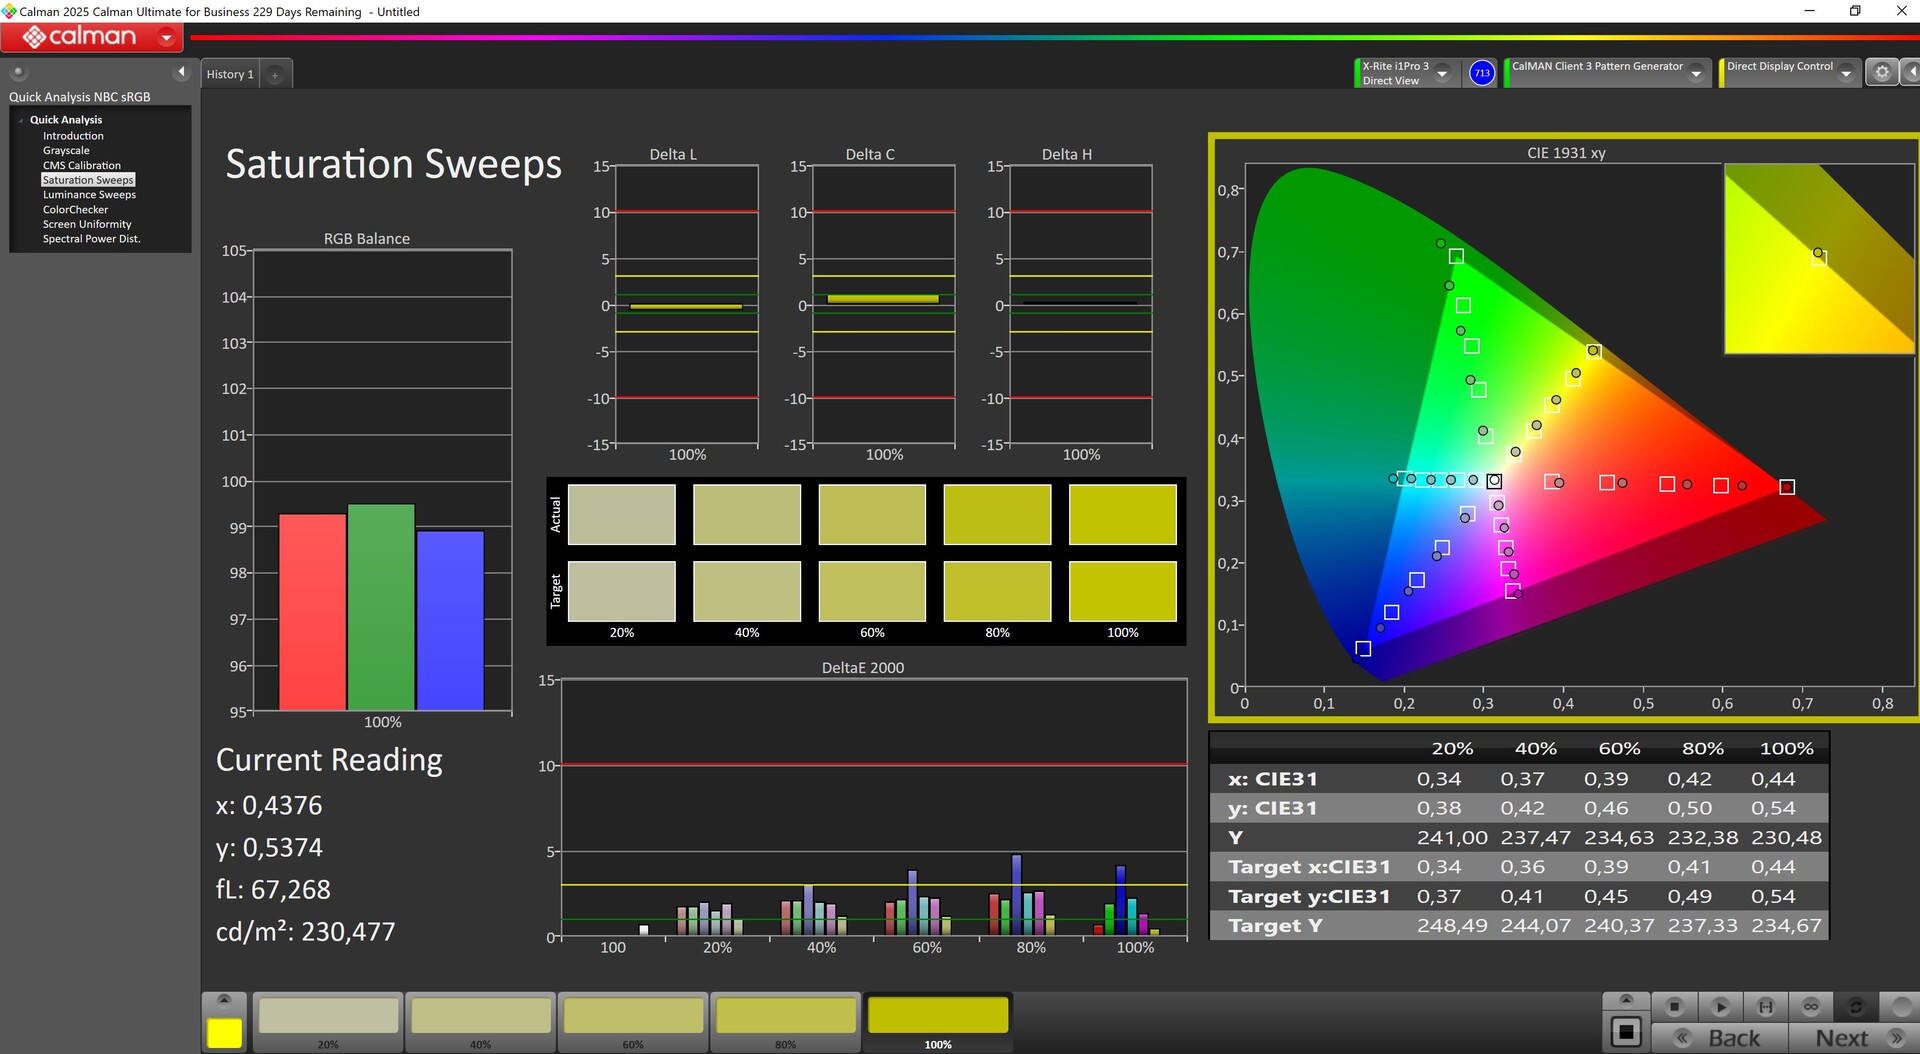
L'OLED affiche pleinement sRGB et Display P3, et même AdobeRGB est encore affiché à 94 %.

Le Legion Pro 5 est livré avec un écran calibré en usine. À pleine luminosité, les écarts sont encore de 2,49 (couleurs) et d'un peu plus de 3 (niveaux de gris). Notre étalonnage manuel a légèrement réduit les valeurs DeltaE.
Temps de réponse de l'écran
| ↔ Temps de réponse noir à blanc | ||
|---|---|---|
| 1.4 ms ... hausse ↗ et chute ↘ combinées | ↗ 0.8 ms hausse | 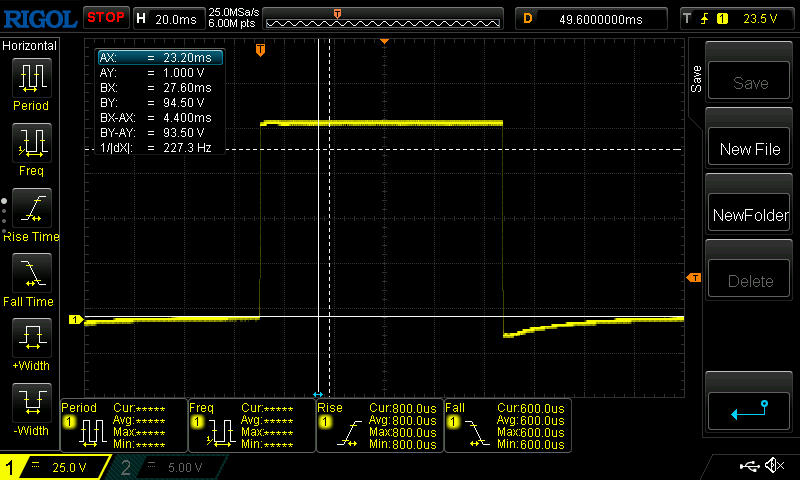 |
| ↘ 0.6 ms chute | ||
| L'écran montre de très faibles temps de réponse, parfait pour le jeu. En comparaison, tous les appareils testés affichent entre 0.1 (minimum) et 240 (maximum) ms. » 8 % des appareils testés affichent de meilleures performances. Cela signifie que les latences relevées sont meilleures que la moyenne (19.8 ms) de tous les appareils testés. | ||
| ↔ Temps de réponse gris 50% à gris 80% | ||
| 2 ms ... hausse ↗ et chute ↘ combinées | ↗ 1 ms hausse | 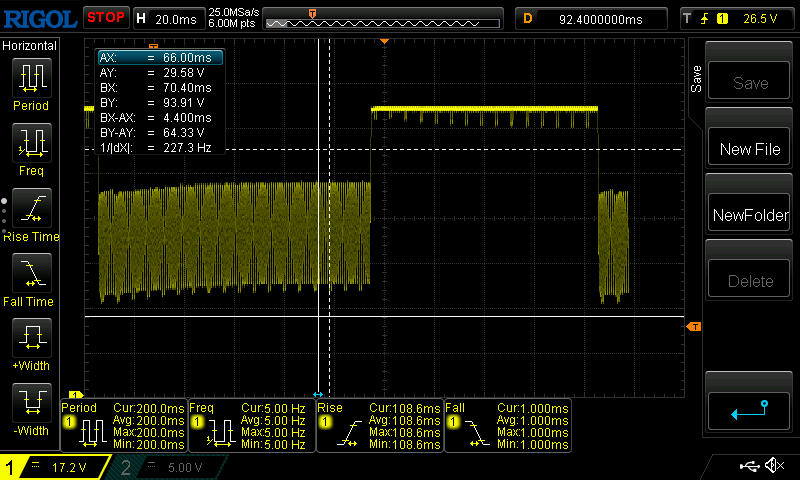 |
| ↘ 1 ms chute | ||
| L'écran montre de très faibles temps de réponse, parfait pour le jeu. En comparaison, tous les appareils testés affichent entre 0.165 (minimum) et 636 (maximum) ms. » 10 % des appareils testés affichent de meilleures performances. Cela signifie que les latences relevées sont meilleures que la moyenne (31 ms) de tous les appareils testés. | ||
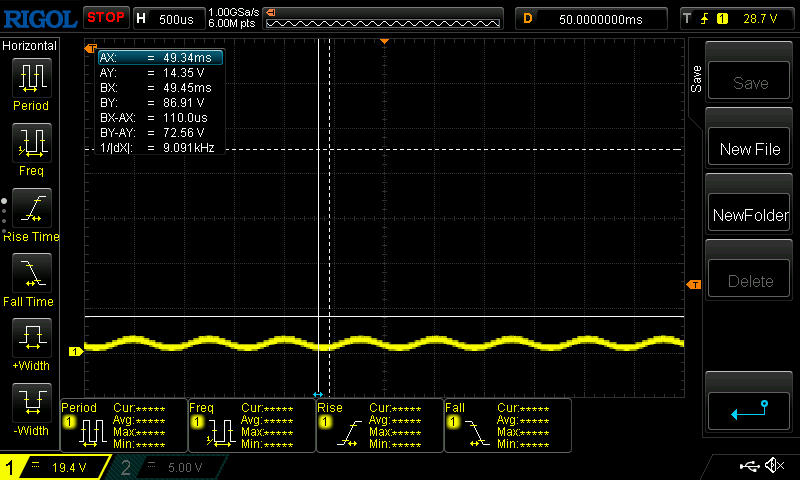
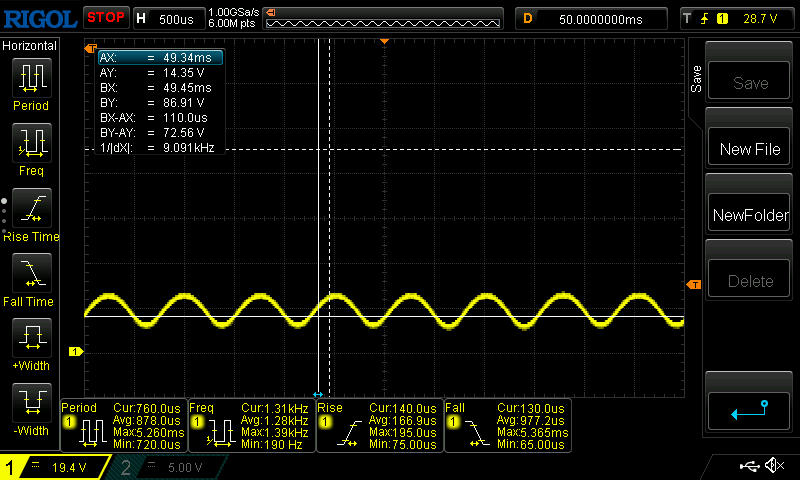
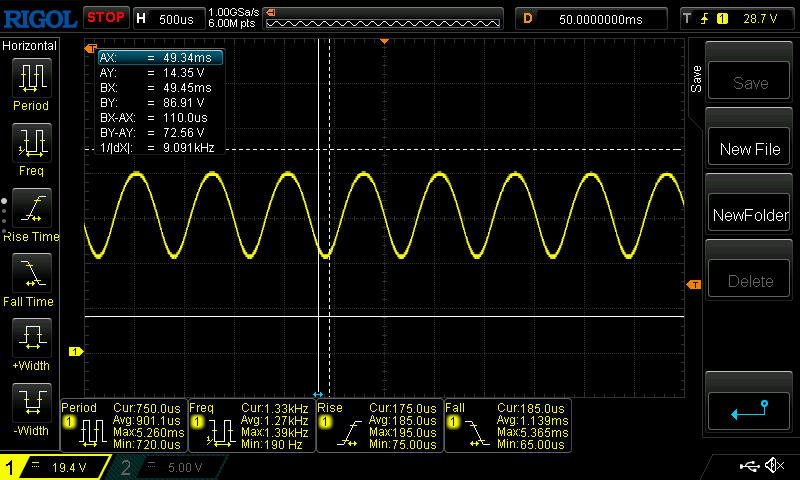
Scintillement / MLI (Modulation de largeur d'impulsion)
| Scintillement / MLI (Modulation de largeur d'impulsion) décelé | 1300 Hz Amplitude: 16.7 % |  | |
Le rétroéclairage de l'écran scintille à la fréquence de 1300 Hz (certainement du fait de l'utilisation d'une MDI - Modulation de largeur d'impulsion) . La fréquence de rafraîchissement de 1300 Hz est élevée, la grande majorité des utilisateurs ne devrait pas percevoir de scintillements et être sujette à une fatigue oculaire accrue. En comparaison, 52 % des appareils testés n'emploient pas MDI pour assombrir leur écran. Nous avons relevé une moyenne à 7763 (minimum : 5 - maximum : 343500) Hz dans le cas où une MDI était active. | |||
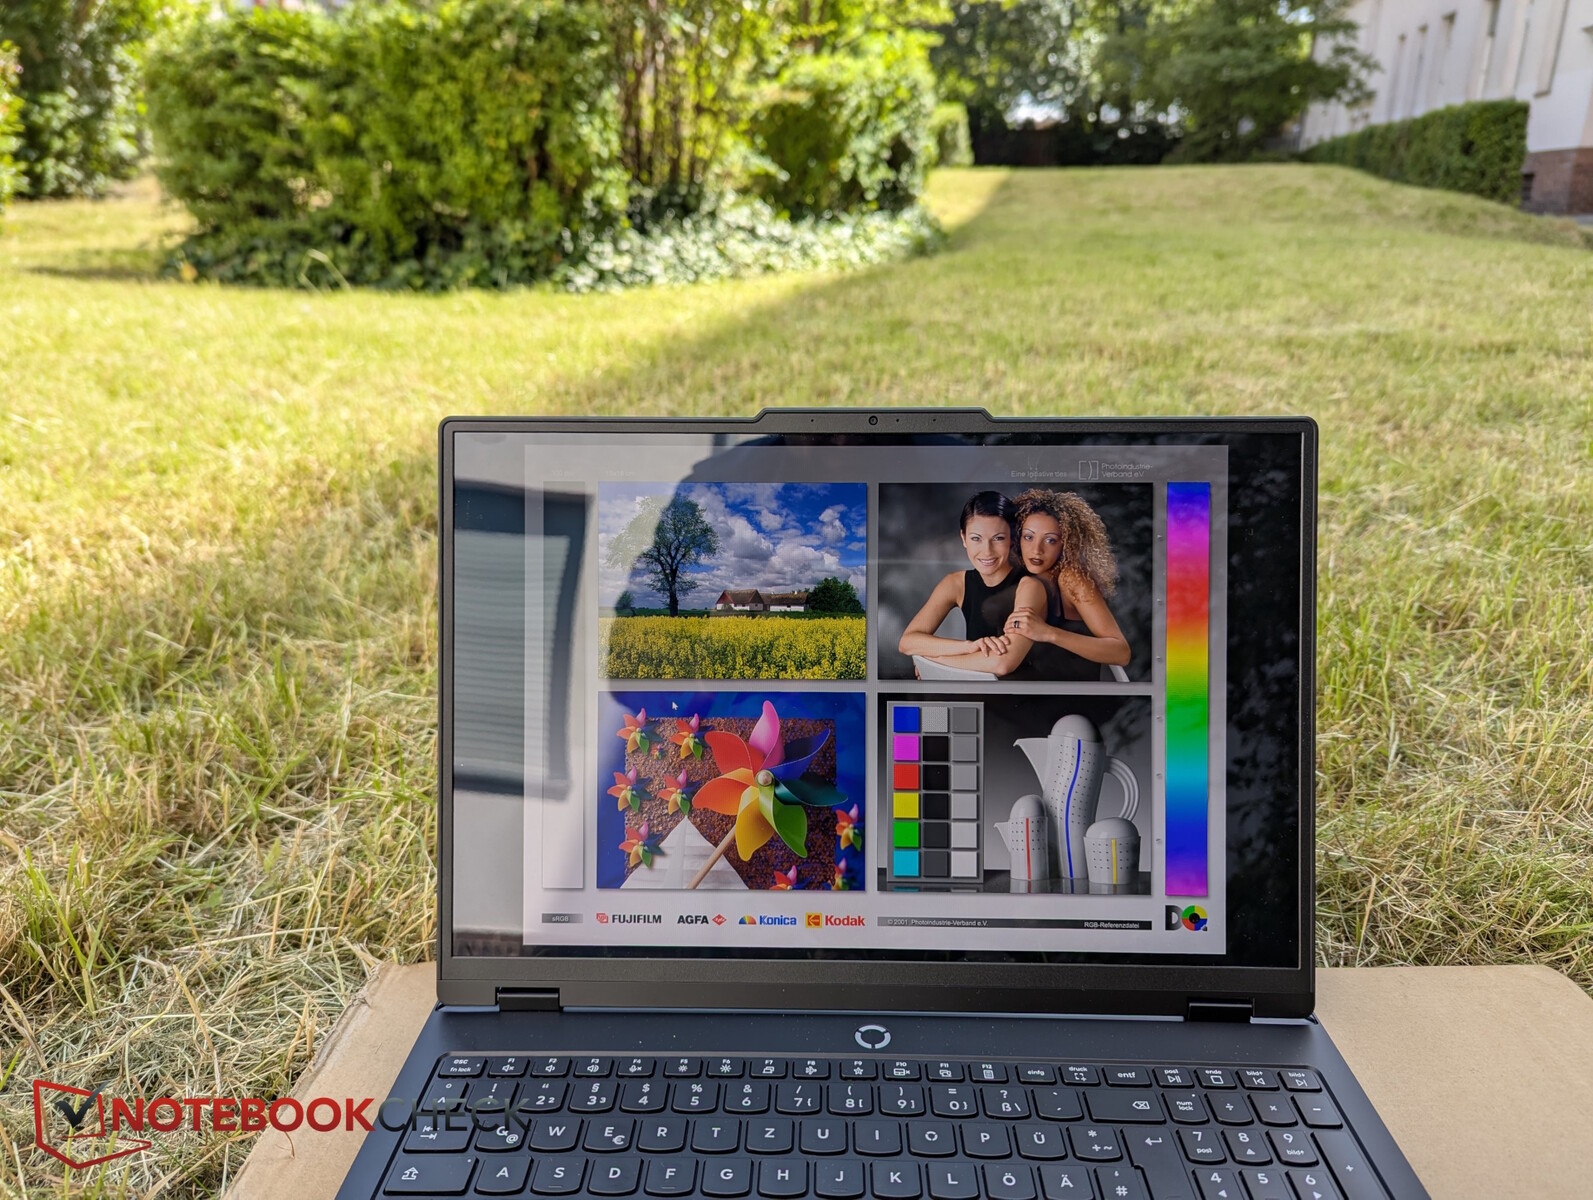
Théoriquement, le panneau réfléchissant pourrait être gênant à l'extérieur, mais comme il est lumineux et très contrasté, il reste très utilisable à condition de s'assurer d'une vue directe et d'un endroit ombragé.


Performance - Une performance 3D puissante
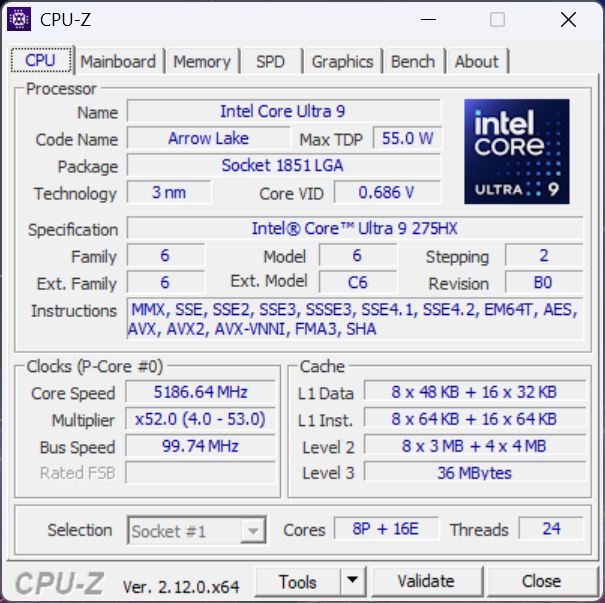
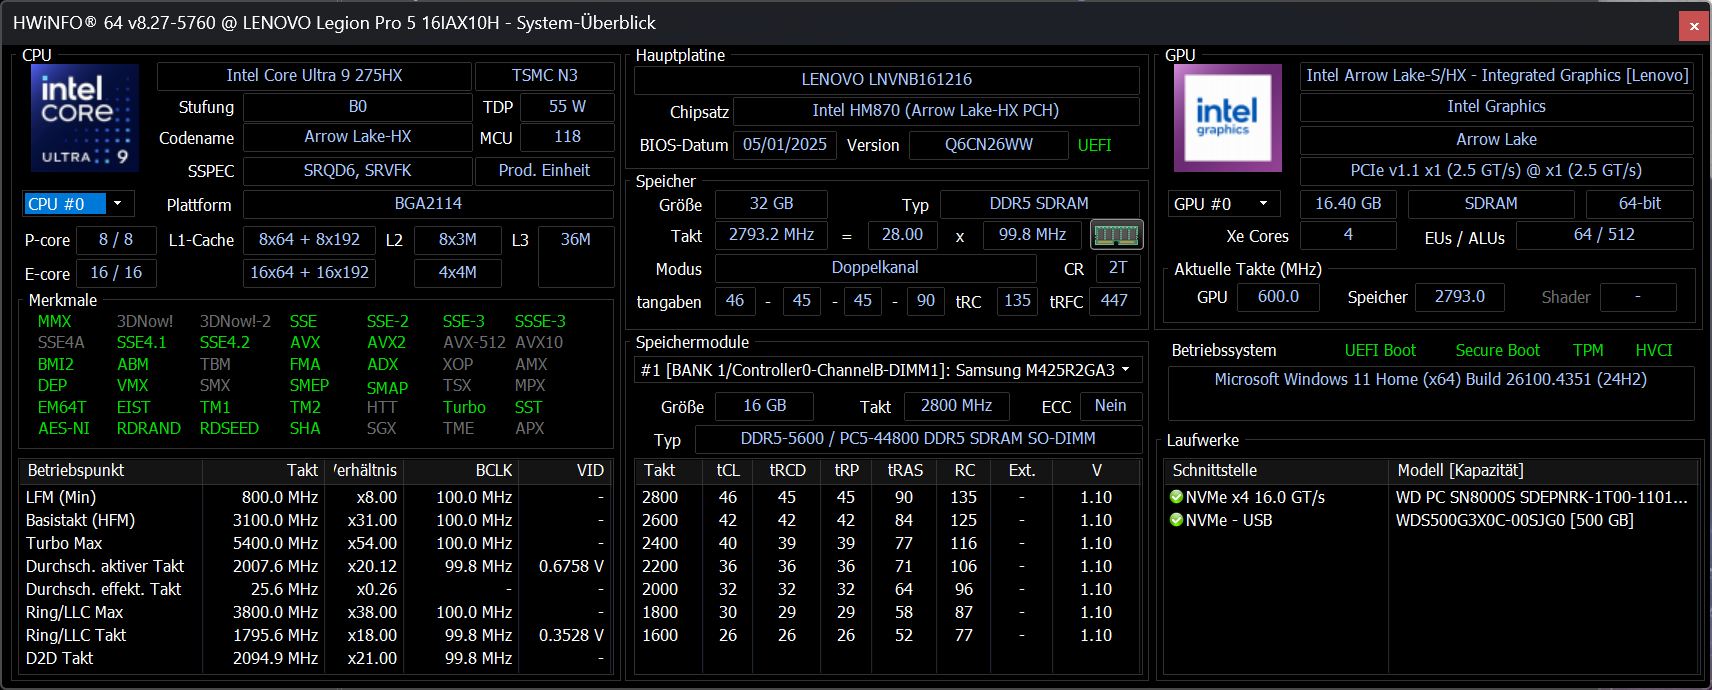
Avec le Intel Core Ultra 9 275HXun RTX 5070 Ti Laptop32 Go de RAM et un SSD de 1 To, le Legion se positionne comme un gamer. D'autre part, l'appareil "pro" (fessional) s'adresse également aux créateurs de contenu avec son design et son écran OLED brillant.
Conditions d'essai
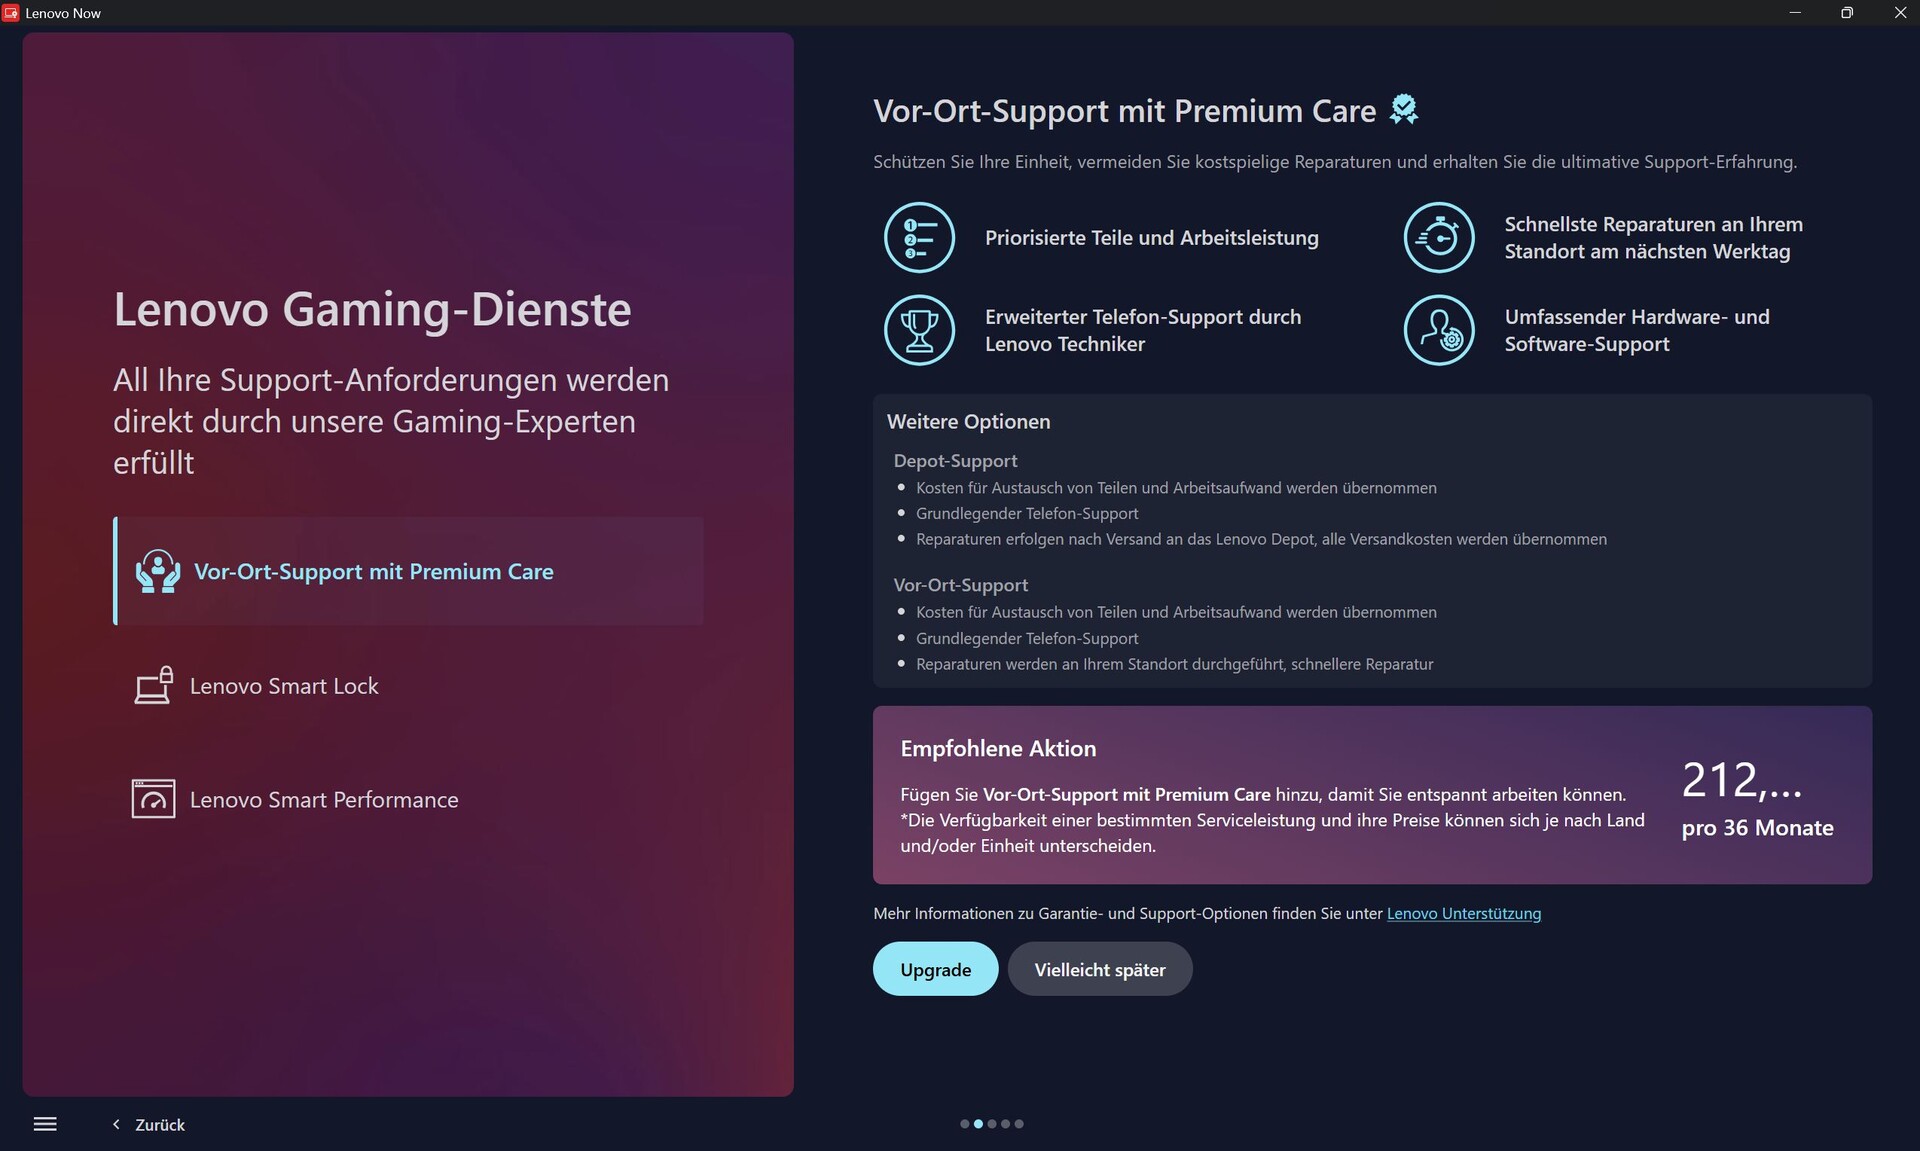
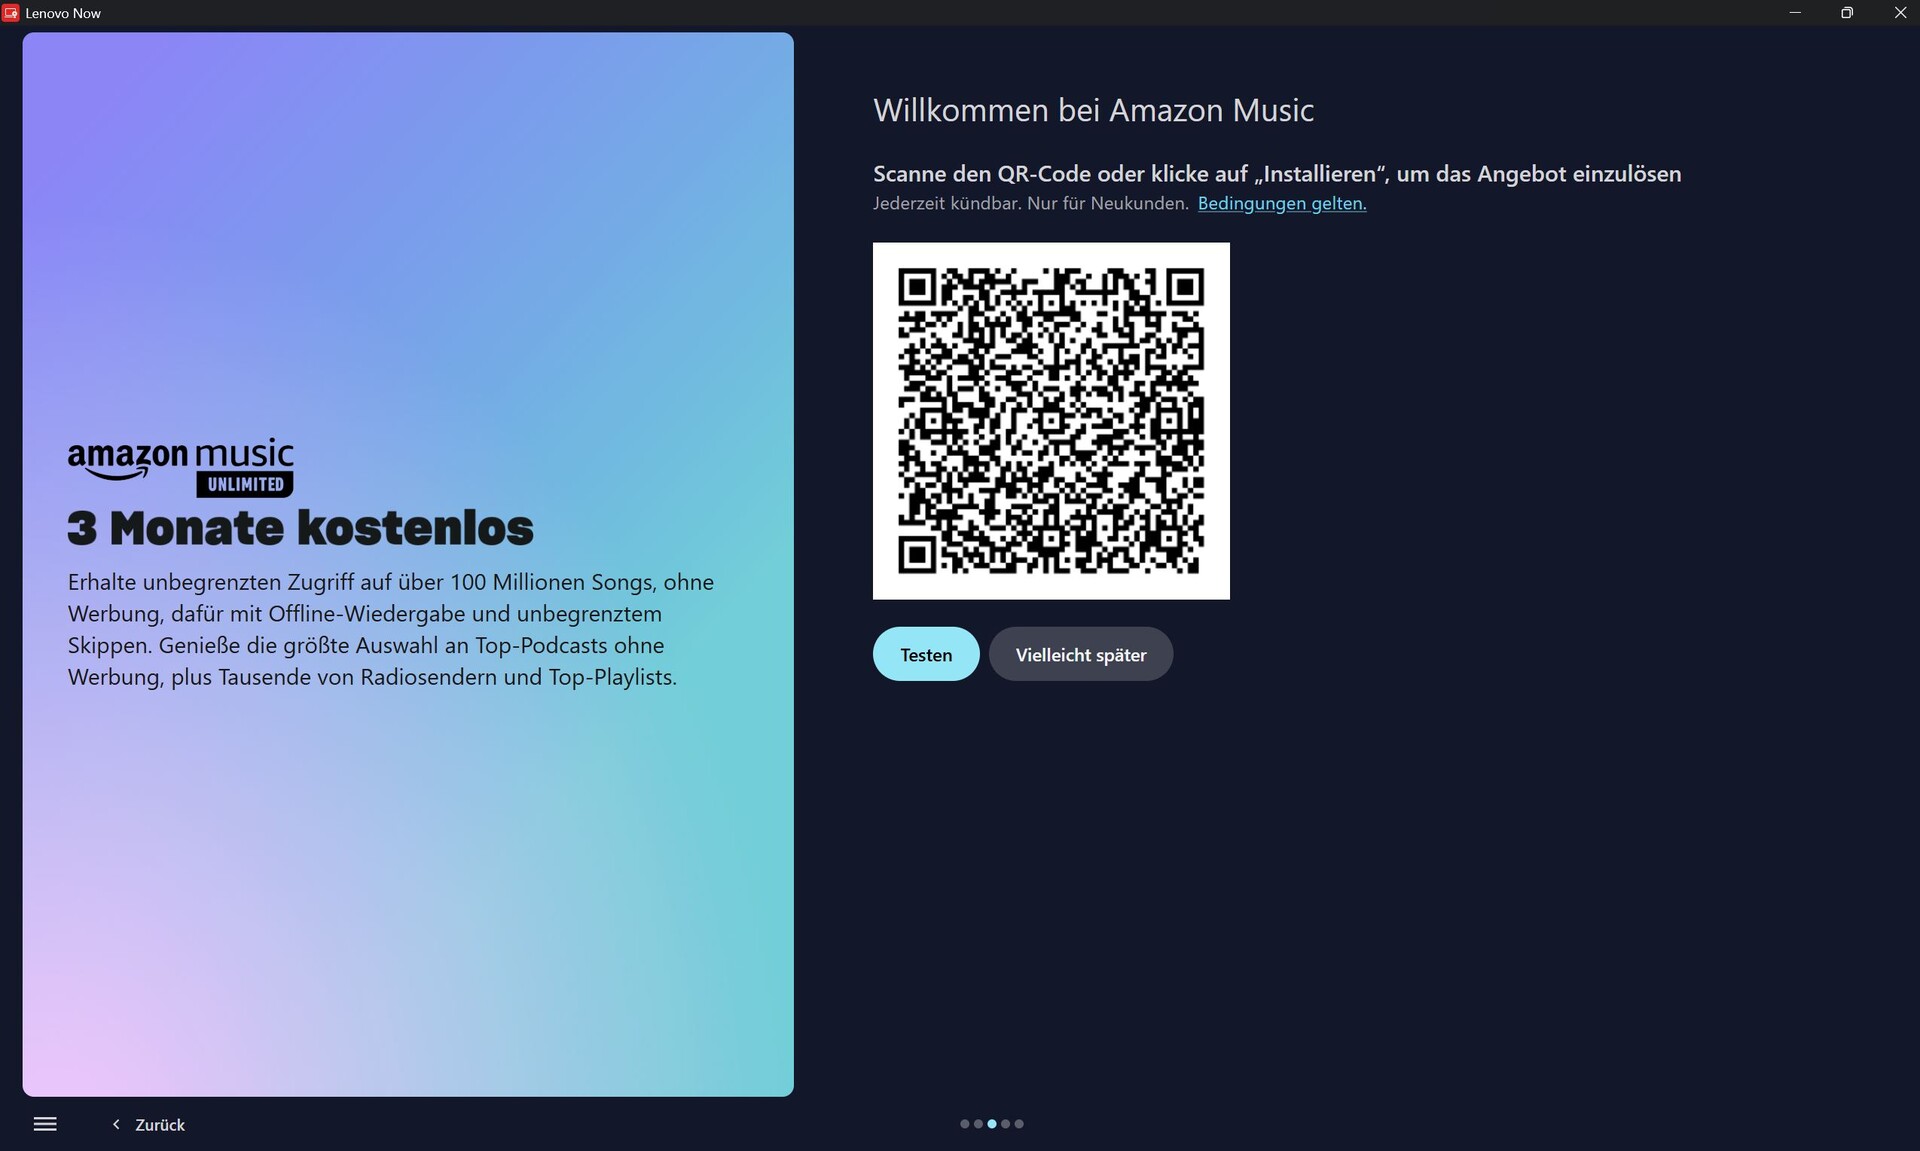
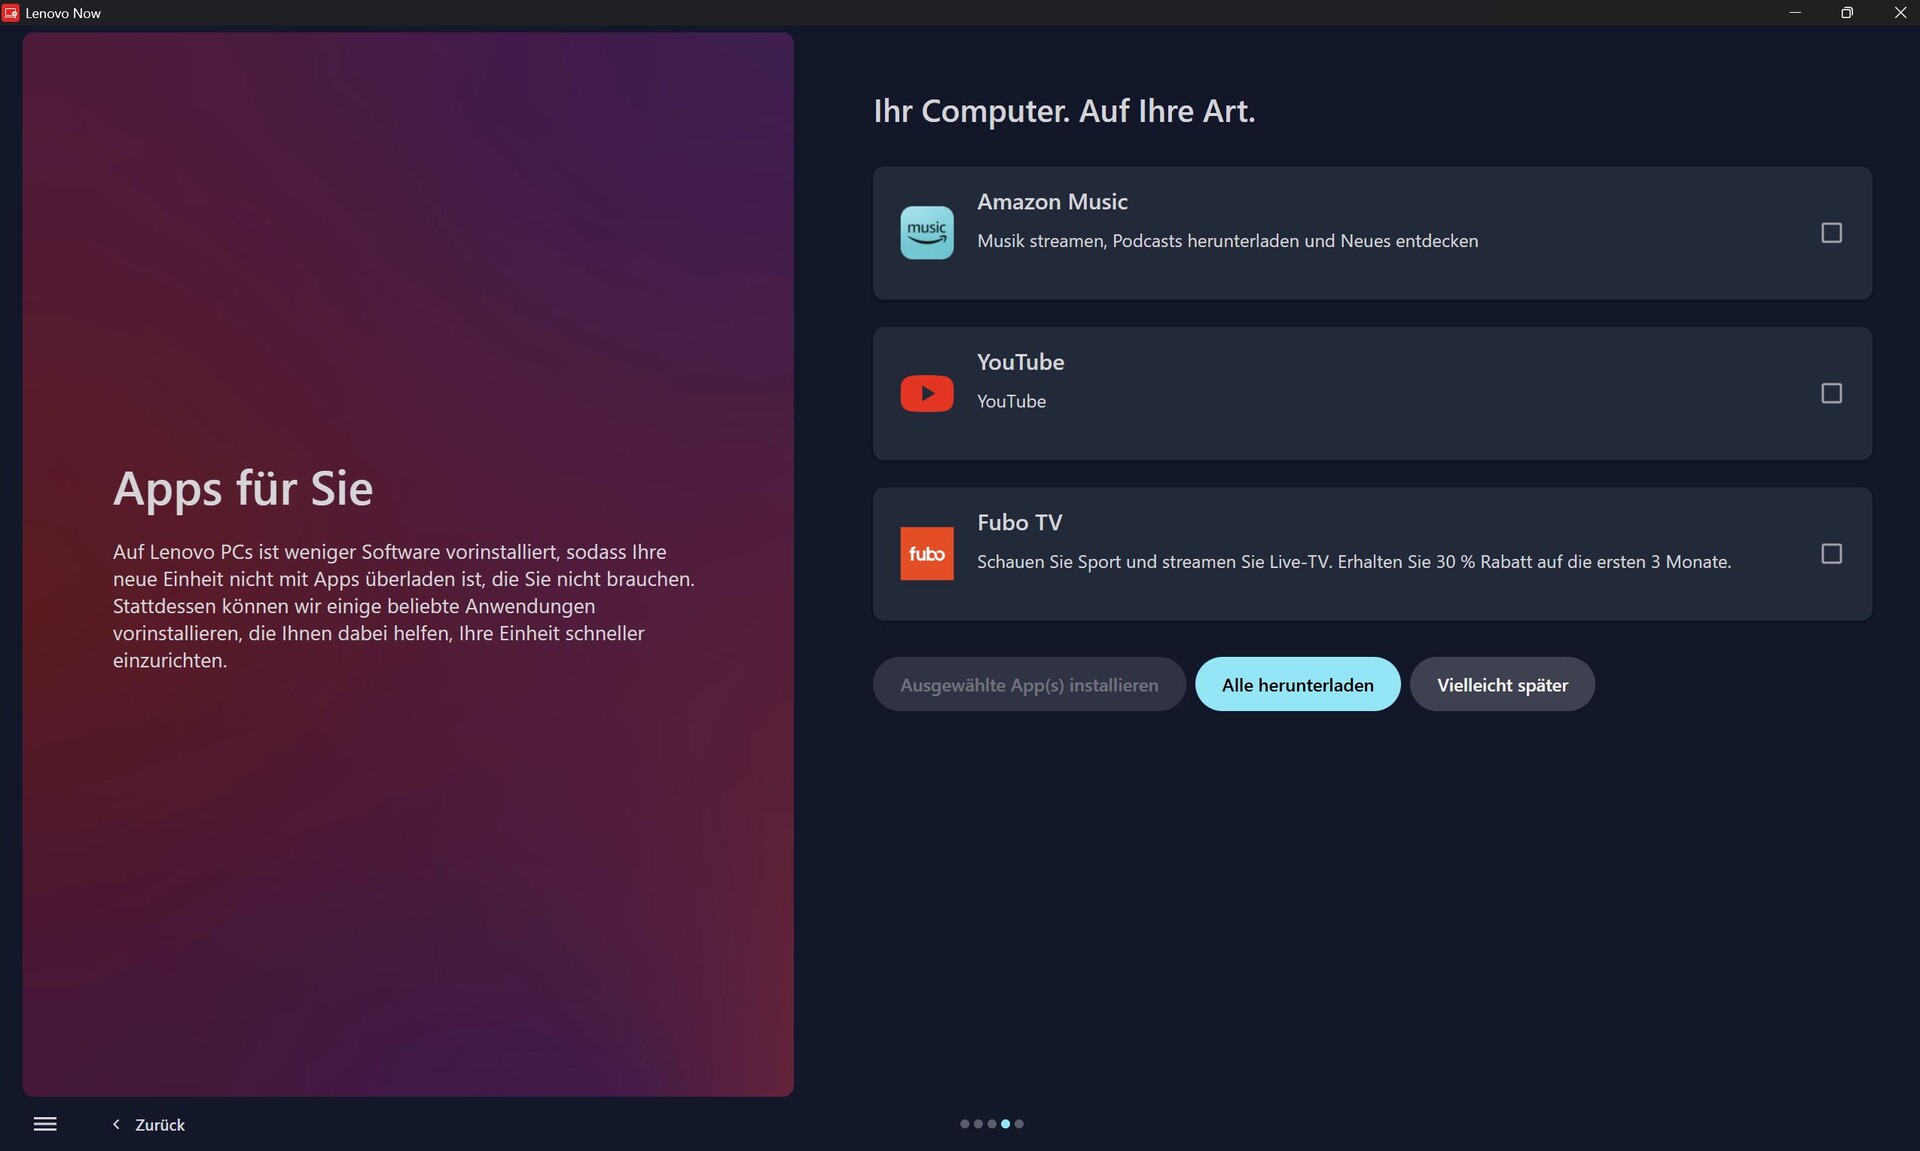
Malheureusement, Lenovo utilise également ses logiciels pour faire de la publicité aux utilisateurs de jeux. Par exemple, Lenovo LegionSpace, qui est nécessaire pour définir les modes de performance, se lance toujours sur l'écran d'accueil "Game Store" avec les dernières offres de jeux. Le second logiciel, Lenovo Vantage, est responsable des mises à jour et de l'assistance, mais il harcèle régulièrement les utilisateurs en leur demandant de répondre à des sondages ou en faisant de la publicité pour lui-même. Une version d'essai de McAfee est également préinstallée.
Les utilisateurs intéressés se voient proposer un lien vers la politique générale de Lenovo en matière de protection de la vie privée. Les données exactes que LegionSpace et Vantage collectent ne sont pas claires pour l'utilisateur moyen.
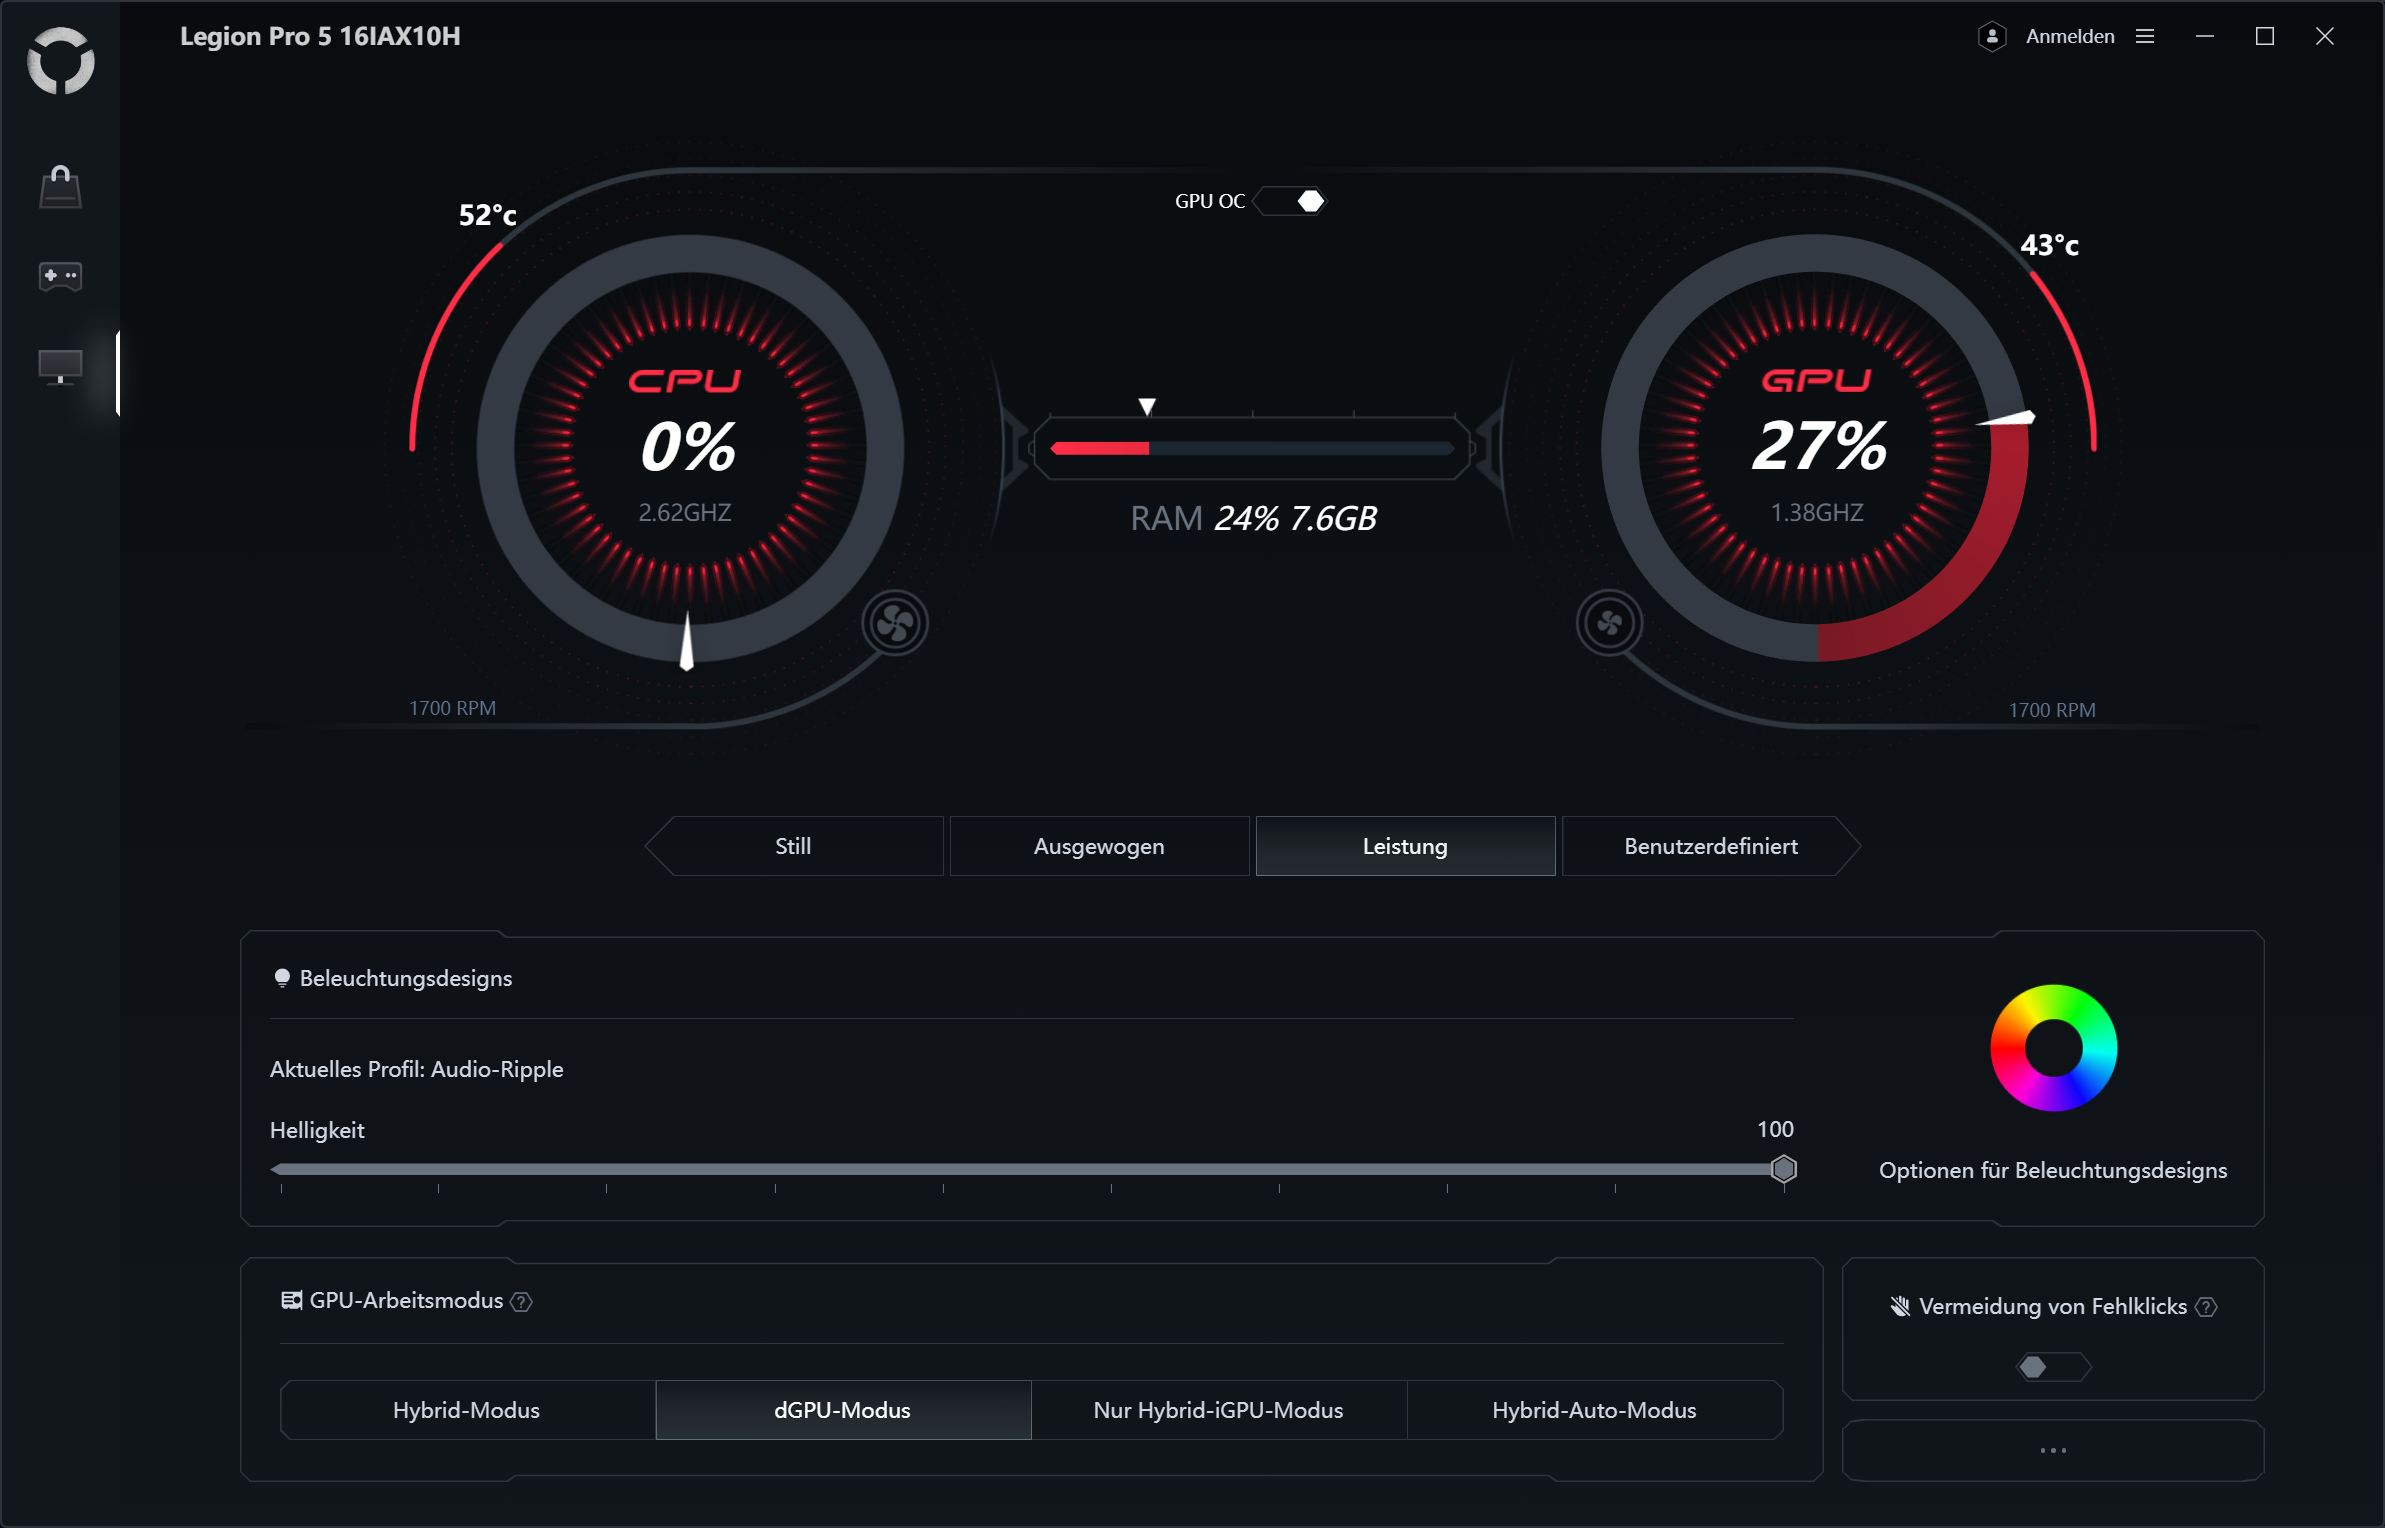
LegionSpace propose trois modes de performance automatiques (Silencieux, Équilibré, Performance) ainsi qu'un mode personnalisé, qui peut être configuré de manière approfondie. Vous pouvez passer d'un mode à l'autre en utilisant les touches fn + "Q" Nous avons utilisé le mode Performance pour nos tests. Le système dispose d'un commutateur graphique MUX, qui nécessite un redémarrage.


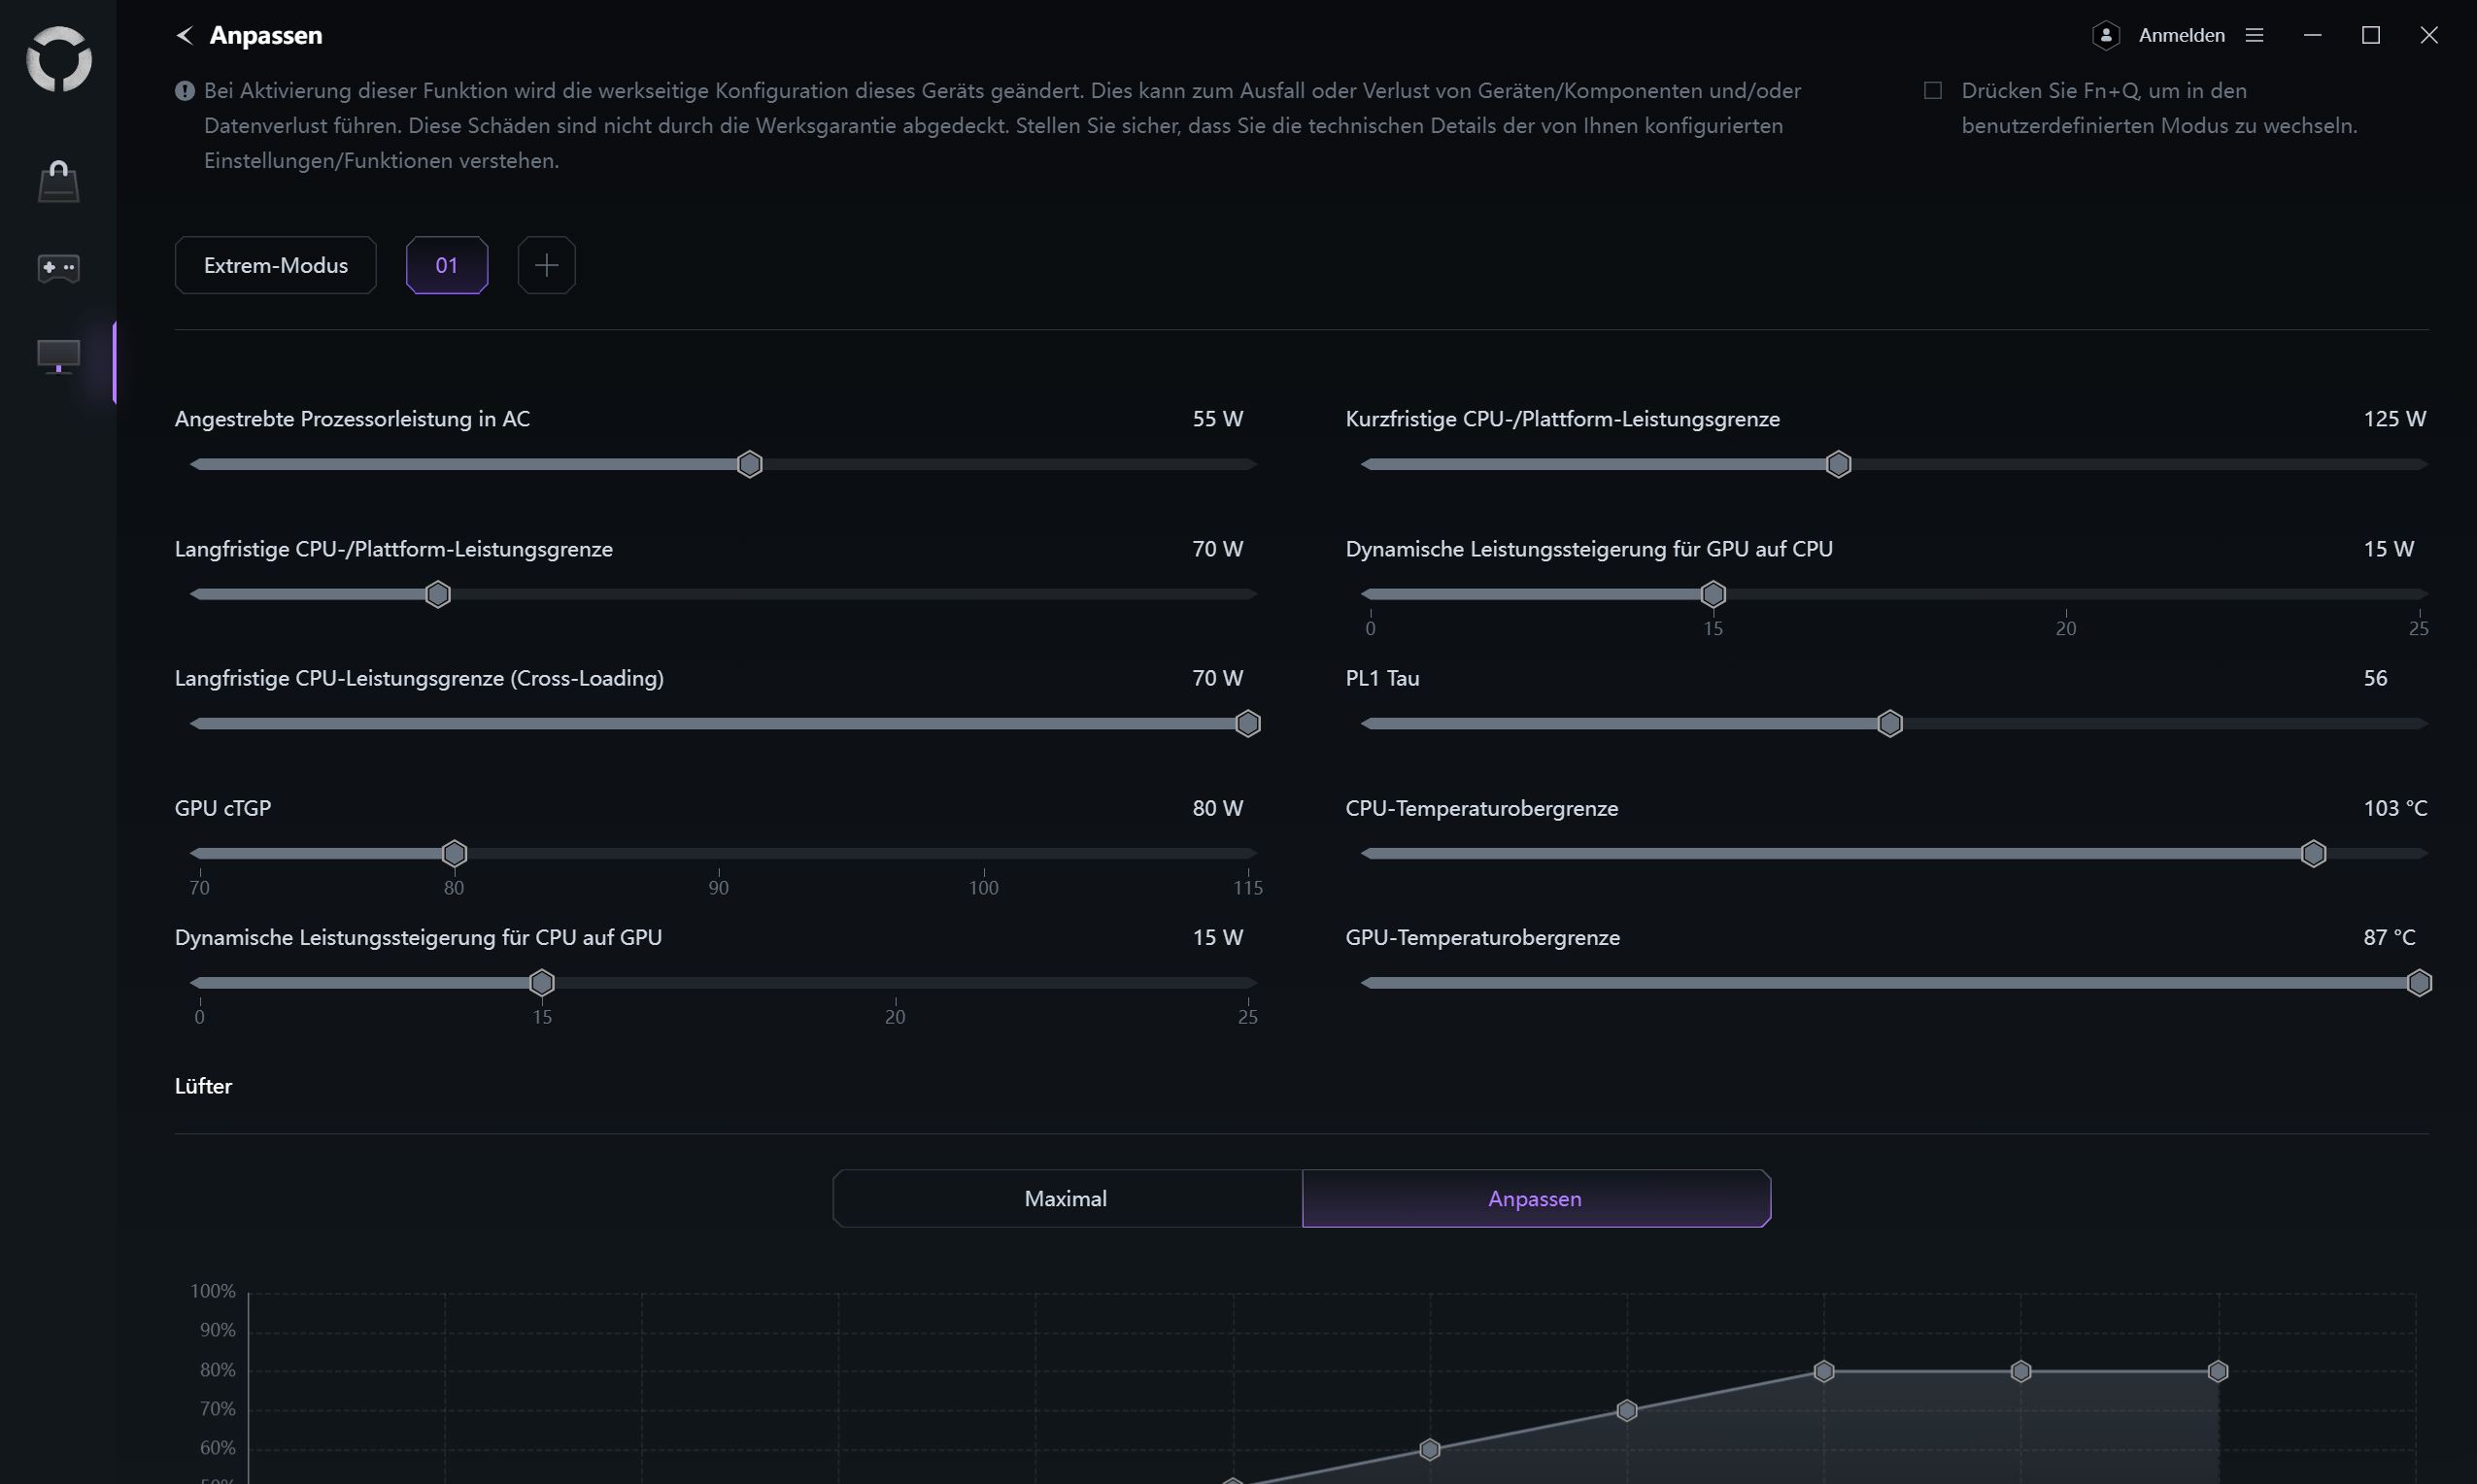
| Profil énergétique | CPU TDP | CB 15 Multi | CP 2077 FHD Ultra | Assassin's Creed : Shadows FHD Ultra | volume max. du ventilateur |
|---|---|---|---|---|---|
| Silencieux | 65/35 watts | 4 076 points | 90,6 fps | 43fps | 40,68 dB(A) |
| Équilibré | 130/70 watts | 5,141 points | 103fps | 47fps | 46.37 dB(A) |
| Performance | 185/125 watts | 5,885 points | 132fps | 53fps | 56.72 dB(A) |
| Extrême (défini par l'utilisateur) | 202/135 watts | 5,867 points | 142fps | 50fps | 58.48 dB(A) |
| Batterie (équilibrée) | 55/45 watts | 3,563 points | 30fps | 30fps | 29 dB(A) |
Processeur
Le Intel Core Ultra 9 275HX est un processeur mobile haut de gamme. Ses 24 cœurs (8 cœurs P et 16 cœurs E) cadencent jusqu'à 5,4 GHz. Il intègre un petit NPU avec 13 TOP et un iGPU avec quatre cœurs Xe.
Dans la boucle Cinebench R15, notre Legion Pro 5 a démontré des performances élevées, comparables à celles d'un Asus Scar Strix 16 ou même un Neo 16 A25. Cependant, contrairement à la concurrence RTX 5090, les performances ne sont pas aussi constantes et chutent d'environ 8 % en l'espace de 5 à 6 exécutions, pour se stabiliser au niveau de celles du XMG Pro 16.
Sur l'ensemble des tests CPU, la Legion se situe juste entre l'Asus Strix Scar 16 (+1%) et la XMG Pro 16 (-1%). L'écart entre les concurrents est faible, l'appareil le plus rapide (Neo 16 E25) bénéficiant d'un avantage de 5 %.
Lorsque vous êtes loin d'une prise de courant, le mode Performance n'est pas sélectionnable et le mode Équilibre est actif. Dans Cinebench R15 Multi, le score a chuté d'environ 37 %.
Cinebench R15 Multi Continuous Test
Cinebench R23: Multi Core | Single Core
Cinebench R20: CPU (Multi Core) | CPU (Single Core)
Cinebench R15: CPU Multi 64Bit | CPU Single 64Bit
Blender: v2.79 BMW27 CPU
7-Zip 18.03: 7z b 4 | 7z b 4 -mmt1
Geekbench 6.7: Multi-Core | Single-Core
Geekbench 5.5: Multi-Core | Single-Core
HWBOT x265 Benchmark v2.2: 4k Preset
LibreOffice : 20 Documents To PDF
R Benchmark 2.5: Overall mean
| CPU Performance rating | |
| Schenker XMG Neo 16 E25 RTX 5090 Laptop | |
| Asus ROG Strix Scar 16 2025 | |
| Lenovo Legion 5 Pro 16IAX10H | |
| Schenker XMG Pro 16 (E25) | |
| Lenovo Legion Pro 7i 16 Gen 10 | |
| Aorus MASTER 16 AM6H | |
| Moyenne Intel Core Ultra 9 275HX | |
| Lenovo Legion Pro 5 16IRX9 | |
| MSI Vector 16 HX AI A2XWHG | |
| Moyenne de la classe Gaming | |
| Cinebench R23 / Multi Core | |
| Schenker XMG Neo 16 E25 RTX 5090 Laptop | |
| Asus ROG Strix Scar 16 2025 | |
| Lenovo Legion 5 Pro 16IAX10H | |
| Lenovo Legion Pro 7i 16 Gen 10 | |
| Schenker XMG Pro 16 (E25) | |
| Aorus MASTER 16 AM6H | |
| Moyenne Intel Core Ultra 9 275HX (30712 - 40970, n=31) | |
| Lenovo Legion Pro 5 16IRX9 | |
| MSI Vector 16 HX AI A2XWHG | |
| Moyenne de la classe Gaming (10488 - 40970, n=110, 2 dernières années) | |
| Cinebench R23 / Single Core | |
| Schenker XMG Neo 16 E25 RTX 5090 Laptop | |
| Lenovo Legion 5 Pro 16IAX10H | |
| Schenker XMG Pro 16 (E25) | |
| Aorus MASTER 16 AM6H | |
| Lenovo Legion Pro 7i 16 Gen 10 | |
| Moyenne Intel Core Ultra 9 275HX (2009 - 2267, n=31) | |
| MSI Vector 16 HX AI A2XWHG | |
| Asus ROG Strix Scar 16 2025 | |
| Lenovo Legion Pro 5 16IRX9 | |
| Moyenne de la classe Gaming (1166 - 2356, n=110, 2 dernières années) | |
| Cinebench R20 / CPU (Multi Core) | |
| Schenker XMG Neo 16 E25 RTX 5090 Laptop | |
| Asus ROG Strix Scar 16 2025 | |
| Lenovo Legion 5 Pro 16IAX10H | |
| Schenker XMG Pro 16 (E25) | |
| Aorus MASTER 16 AM6H | |
| Lenovo Legion Pro 7i 16 Gen 10 | |
| Moyenne Intel Core Ultra 9 275HX (12026 - 16108, n=30) | |
| Lenovo Legion Pro 5 16IRX9 | |
| MSI Vector 16 HX AI A2XWHG | |
| Moyenne de la classe Gaming (4029 - 16108, n=109, 2 dernières années) | |
| Cinebench R20 / CPU (Single Core) | |
| Schenker XMG Neo 16 E25 RTX 5090 Laptop | |
| Lenovo Legion 5 Pro 16IAX10H | |
| Schenker XMG Pro 16 (E25) | |
| Aorus MASTER 16 AM6H | |
| Moyenne Intel Core Ultra 9 275HX (774 - 870, n=30) | |
| Asus ROG Strix Scar 16 2025 | |
| MSI Vector 16 HX AI A2XWHG | |
| Lenovo Legion Pro 7i 16 Gen 10 | |
| Lenovo Legion Pro 5 16IRX9 | |
| Moyenne de la classe Gaming (442 - 895, n=109, 2 dernières années) | |
| Cinebench R15 / CPU Multi 64Bit | |
| Schenker XMG Neo 16 E25 RTX 5090 Laptop | |
| Asus ROG Strix Scar 16 2025 | |
| Lenovo Legion 5 Pro 16IAX10H | |
| Lenovo Legion Pro 7i 16 Gen 10 | |
| Aorus MASTER 16 AM6H | |
| Schenker XMG Pro 16 (E25) | |
| Moyenne Intel Core Ultra 9 275HX (4737 - 6271, n=30) | |
| Lenovo Legion Pro 5 16IRX9 | |
| MSI Vector 16 HX AI A2XWHG | |
| Moyenne de la classe Gaming (1578 - 6271, n=108, 2 dernières années) | |
| Cinebench R15 / CPU Single 64Bit | |
| Asus ROG Strix Scar 16 2025 | |
| Schenker XMG Neo 16 E25 RTX 5090 Laptop | |
| Lenovo Legion Pro 7i 16 Gen 10 | |
| Schenker XMG Pro 16 (E25) | |
| Lenovo Legion 5 Pro 16IAX10H | |
| Aorus MASTER 16 AM6H | |
| Moyenne Intel Core Ultra 9 275HX (306 - 343, n=31) | |
| MSI Vector 16 HX AI A2XWHG | |
| Lenovo Legion Pro 5 16IRX9 | |
| Moyenne de la classe Gaming (188.8 - 343, n=109, 2 dernières années) | |
| Blender / v2.79 BMW27 CPU | |
| Moyenne de la classe Gaming (80 - 330, n=107, 2 dernières années) | |
| MSI Vector 16 HX AI A2XWHG | |
| Lenovo Legion Pro 5 16IRX9 | |
| Lenovo Legion 5 Pro 16IAX10H | |
| Moyenne Intel Core Ultra 9 275HX (82 - 116, n=29) | |
| Aorus MASTER 16 AM6H | |
| Schenker XMG Pro 16 (E25) | |
| Lenovo Legion Pro 7i 16 Gen 10 | |
| Asus ROG Strix Scar 16 2025 | |
| Schenker XMG Neo 16 E25 RTX 5090 Laptop | |
| 7-Zip 18.03 / 7z b 4 | |
| Schenker XMG Neo 16 E25 RTX 5090 Laptop | |
| Asus ROG Strix Scar 16 2025 | |
| Lenovo Legion Pro 7i 16 Gen 10 | |
| Schenker XMG Pro 16 (E25) | |
| Lenovo Legion Pro 5 16IRX9 | |
| Moyenne Intel Core Ultra 9 275HX (98236 - 124155, n=30) | |
| Lenovo Legion 5 Pro 16IAX10H | |
| Aorus MASTER 16 AM6H | |
| Moyenne de la classe Gaming (33491 - 148086, n=108, 2 dernières années) | |
| MSI Vector 16 HX AI A2XWHG | |
| 7-Zip 18.03 / 7z b 4 -mmt1 | |
| Schenker XMG Neo 16 E25 RTX 5090 Laptop | |
| Schenker XMG Pro 16 (E25) | |
| Lenovo Legion Pro 5 16IRX9 | |
| Moyenne Intel Core Ultra 9 275HX (6026 - 7149, n=30) | |
| Lenovo Legion 5 Pro 16IAX10H | |
| Aorus MASTER 16 AM6H | |
| Asus ROG Strix Scar 16 2025 | |
| Lenovo Legion Pro 7i 16 Gen 10 | |
| MSI Vector 16 HX AI A2XWHG | |
| Moyenne de la classe Gaming (4199 - 7436, n=108, 2 dernières années) | |
| Geekbench 6.7 / Multi-Core | |
| Asus ROG Strix Scar 16 2025 | |
| Schenker XMG Neo 16 E25 RTX 5090 Laptop | |
| Schenker XMG Pro 16 (E25) | |
| Lenovo Legion 5 Pro 16IAX10H | |
| Moyenne Intel Core Ultra 9 275HX (16033 - 21668, n=33) | |
| Aorus MASTER 16 AM6H | |
| Lenovo Legion Pro 7i 16 Gen 10 | |
| Lenovo Legion Pro 5 16IRX9 | |
| MSI Vector 16 HX AI A2XWHG | |
| Moyenne de la classe Gaming (6625 - 22104, n=109, 2 dernières années) | |
| Geekbench 6.7 / Single-Core | |
| Schenker XMG Pro 16 (E25) | |
| Schenker XMG Neo 16 E25 RTX 5090 Laptop | |
| Lenovo Legion 5 Pro 16IAX10H | |
| Asus ROG Strix Scar 16 2025 | |
| Lenovo Legion Pro 7i 16 Gen 10 | |
| Aorus MASTER 16 AM6H | |
| Moyenne Intel Core Ultra 9 275HX (2843 - 3160, n=33) | |
| MSI Vector 16 HX AI A2XWHG | |
| Lenovo Legion Pro 5 16IRX9 | |
| Moyenne de la classe Gaming (1490 - 3259, n=109, 2 dernières années) | |
| Geekbench 5.5 / Multi-Core | |
| Schenker XMG Neo 16 E25 RTX 5090 Laptop | |
| Asus ROG Strix Scar 16 2025 | |
| Schenker XMG Pro 16 (E25) | |
| Moyenne Intel Core Ultra 9 275HX (19105 - 25855, n=31) | |
| Lenovo Legion Pro 7i 16 Gen 10 | |
| Lenovo Legion 5 Pro 16IAX10H | |
| Aorus MASTER 16 AM6H | |
| Lenovo Legion Pro 5 16IRX9 | |
| MSI Vector 16 HX AI A2XWHG | |
| Moyenne de la classe Gaming (6460 - 27010, n=108, 2 dernières années) | |
| Geekbench 5.5 / Single-Core | |
| Schenker XMG Neo 16 E25 RTX 5090 Laptop | |
| Schenker XMG Pro 16 (E25) | |
| Lenovo Legion 5 Pro 16IAX10H | |
| Asus ROG Strix Scar 16 2025 | |
| Aorus MASTER 16 AM6H | |
| Moyenne Intel Core Ultra 9 275HX (2033 - 2292, n=31) | |
| Lenovo Legion Pro 7i 16 Gen 10 | |
| MSI Vector 16 HX AI A2XWHG | |
| Moyenne de la classe Gaming (986 - 2474, n=108, 2 dernières années) | |
| Lenovo Legion Pro 5 16IRX9 | |
| HWBOT x265 Benchmark v2.2 / 4k Preset | |
| Schenker XMG Neo 16 E25 RTX 5090 Laptop | |
| Asus ROG Strix Scar 16 2025 | |
| Schenker XMG Pro 16 (E25) | |
| Lenovo Legion 5 Pro 16IAX10H | |
| Lenovo Legion Pro 7i 16 Gen 10 | |
| Moyenne Intel Core Ultra 9 275HX (30.7 - 43.8, n=30) | |
| Aorus MASTER 16 AM6H | |
| MSI Vector 16 HX AI A2XWHG | |
| Lenovo Legion Pro 5 16IRX9 | |
| Moyenne de la classe Gaming (11.5 - 44.3, n=108, 2 dernières années) | |
| LibreOffice / 20 Documents To PDF | |
| Moyenne de la classe Gaming (19 - 88.8, n=108, 2 dernières années) | |
| Schenker XMG Pro 16 (E25) | |
| Moyenne Intel Core Ultra 9 275HX (33.2 - 62.1, n=30) | |
| Lenovo Legion Pro 5 16IRX9 | |
| Schenker XMG Neo 16 E25 RTX 5090 Laptop | |
| Asus ROG Strix Scar 16 2025 | |
| Aorus MASTER 16 AM6H | |
| MSI Vector 16 HX AI A2XWHG | |
| Lenovo Legion Pro 7i 16 Gen 10 | |
| Lenovo Legion 5 Pro 16IAX10H | |
| R Benchmark 2.5 / Overall mean | |
| Aorus MASTER 16 AM6H | |
| Moyenne de la classe Gaming (0.3439 - 0.759, n=109, 2 dernières années) | |
| MSI Vector 16 HX AI A2XWHG | |
| Moyenne Intel Core Ultra 9 275HX (0.3943 - 0.4568, n=30) | |
| Asus ROG Strix Scar 16 2025 | |
| Lenovo Legion Pro 7i 16 Gen 10 | |
| Lenovo Legion 5 Pro 16IAX10H | |
| Schenker XMG Neo 16 E25 RTX 5090 Laptop | |
| Schenker XMG Pro 16 (E25) | |
| Lenovo Legion Pro 5 16IRX9 | |
* ... Moindre est la valeur, meilleures sont les performances
AIDA64: FP32 Ray-Trace | FPU Julia | CPU SHA3 | CPU Queen | FPU SinJulia | FPU Mandel | CPU AES | CPU ZLib | FP64 Ray-Trace | CPU PhotoWorxx
| Performance rating | |
| Schenker XMG Neo 16 A25 5090 | |
| Schenker XMG Neo 16 E25 RTX 5090 Laptop | |
| Asus ROG Strix Scar 16 2025 | |
| Aorus MASTER 16 AM6H | |
| Lenovo Legion 5 Pro 16IAX10H | |
| Moyenne Intel Core Ultra 9 275HX | |
| Schenker XMG Pro 16 (E25) | |
| Lenovo Legion Pro 5 16IRX9 | |
| Moyenne de la classe Gaming | |
| AIDA64 / FP32 Ray-Trace | |
| Schenker XMG Neo 16 A25 5090 | |
| Schenker XMG Neo 16 E25 RTX 5090 Laptop | |
| Asus ROG Strix Scar 16 2025 | |
| Aorus MASTER 16 AM6H | |
| Moyenne Intel Core Ultra 9 275HX (28039 - 39895, n=30) | |
| Lenovo Legion 5 Pro 16IAX10H | |
| Schenker XMG Pro 16 (E25) | |
| Moyenne de la classe Gaming (10227 - 85542, n=107, 2 dernières années) | |
| Lenovo Legion Pro 5 16IRX9 | |
| AIDA64 / FPU Julia | |
| Schenker XMG Neo 16 A25 5090 | |
| Schenker XMG Neo 16 E25 RTX 5090 Laptop | |
| Asus ROG Strix Scar 16 2025 | |
| Aorus MASTER 16 AM6H | |
| Lenovo Legion 5 Pro 16IAX10H | |
| Moyenne Intel Core Ultra 9 275HX (140254 - 200744, n=30) | |
| Schenker XMG Pro 16 (E25) | |
| Moyenne de la classe Gaming (51376 - 238426, n=107, 2 dernières années) | |
| Lenovo Legion Pro 5 16IRX9 | |
| AIDA64 / CPU SHA3 | |
| Schenker XMG Neo 16 E25 RTX 5090 Laptop | |
| Schenker XMG Neo 16 A25 5090 | |
| Asus ROG Strix Scar 16 2025 | |
| Aorus MASTER 16 AM6H | |
| Moyenne Intel Core Ultra 9 275HX (6710 - 9817, n=30) | |
| Schenker XMG Pro 16 (E25) | |
| Lenovo Legion 5 Pro 16IAX10H | |
| Lenovo Legion Pro 5 16IRX9 | |
| Moyenne de la classe Gaming (2180 - 9817, n=107, 2 dernières années) | |
| AIDA64 / CPU Queen | |
| Schenker XMG Neo 16 A25 5090 | |
| Lenovo Legion Pro 5 16IRX9 | |
| Schenker XMG Neo 16 E25 RTX 5090 Laptop | |
| Lenovo Legion 5 Pro 16IAX10H | |
| Asus ROG Strix Scar 16 2025 | |
| Aorus MASTER 16 AM6H | |
| Moyenne Intel Core Ultra 9 275HX (113887 - 140937, n=30) | |
| Schenker XMG Pro 16 (E25) | |
| Moyenne de la classe Gaming (49785 - 173351, n=94, 2 dernières années) | |
| AIDA64 / FPU SinJulia | |
| Schenker XMG Neo 16 A25 5090 | |
| Lenovo Legion Pro 5 16IRX9 | |
| Moyenne de la classe Gaming (4424 - 33636, n=107, 2 dernières années) | |
| Schenker XMG Neo 16 E25 RTX 5090 Laptop | |
| Schenker XMG Pro 16 (E25) | |
| Asus ROG Strix Scar 16 2025 | |
| Lenovo Legion 5 Pro 16IAX10H | |
| Aorus MASTER 16 AM6H | |
| Moyenne Intel Core Ultra 9 275HX (11172 - 14425, n=30) | |
| AIDA64 / FPU Mandel | |
| Schenker XMG Neo 16 A25 5090 | |
| Asus ROG Strix Scar 16 2025 | |
| Schenker XMG Neo 16 E25 RTX 5090 Laptop | |
| Aorus MASTER 16 AM6H | |
| Moyenne Intel Core Ultra 9 275HX (72596 - 104508, n=30) | |
| Schenker XMG Pro 16 (E25) | |
| Lenovo Legion 5 Pro 16IAX10H | |
| Moyenne de la classe Gaming (25115 - 128721, n=107, 2 dernières années) | |
| Lenovo Legion Pro 5 16IRX9 | |
| AIDA64 / CPU AES | |
| Schenker XMG Neo 16 A25 5090 | |
| Schenker XMG Neo 16 E25 RTX 5090 Laptop | |
| Asus ROG Strix Scar 16 2025 | |
| Lenovo Legion 5 Pro 16IAX10H | |
| Moyenne Intel Core Ultra 9 275HX (105608 - 247074, n=30) | |
| Aorus MASTER 16 AM6H | |
| Schenker XMG Pro 16 (E25) | |
| Lenovo Legion Pro 5 16IRX9 | |
| Moyenne de la classe Gaming (39258 - 247074, n=107, 2 dernières années) | |
| AIDA64 / CPU ZLib | |
| Schenker XMG Neo 16 A25 5090 | |
| Schenker XMG Neo 16 E25 RTX 5090 Laptop | |
| Asus ROG Strix Scar 16 2025 | |
| Lenovo Legion 5 Pro 16IAX10H | |
| Aorus MASTER 16 AM6H | |
| Moyenne Intel Core Ultra 9 275HX (1582 - 2263, n=30) | |
| Schenker XMG Pro 16 (E25) | |
| Lenovo Legion Pro 5 16IRX9 | |
| Moyenne de la classe Gaming (574 - 2531, n=107, 2 dernières années) | |
| AIDA64 / FP64 Ray-Trace | |
| Schenker XMG Neo 16 A25 5090 | |
| Asus ROG Strix Scar 16 2025 | |
| Schenker XMG Neo 16 E25 RTX 5090 Laptop | |
| Aorus MASTER 16 AM6H | |
| Moyenne Intel Core Ultra 9 275HX (14847 - 21854, n=30) | |
| Lenovo Legion 5 Pro 16IAX10H | |
| Schenker XMG Pro 16 (E25) | |
| Moyenne de la classe Gaming (5509 - 45446, n=107, 2 dernières années) | |
| Lenovo Legion Pro 5 16IRX9 | |
| AIDA64 / CPU PhotoWorxx | |
| Asus ROG Strix Scar 16 2025 | |
| Schenker XMG Neo 16 E25 RTX 5090 Laptop | |
| Schenker XMG Pro 16 (E25) | |
| Moyenne Intel Core Ultra 9 275HX (37482 - 62916, n=30) | |
| Lenovo Legion Pro 5 16IRX9 | |
| Lenovo Legion 5 Pro 16IAX10H | |
| Aorus MASTER 16 AM6H | |
| Moyenne de la classe Gaming (12271 - 89891, n=107, 2 dernières années) | |
| Schenker XMG Neo 16 A25 5090 | |
Performance du système
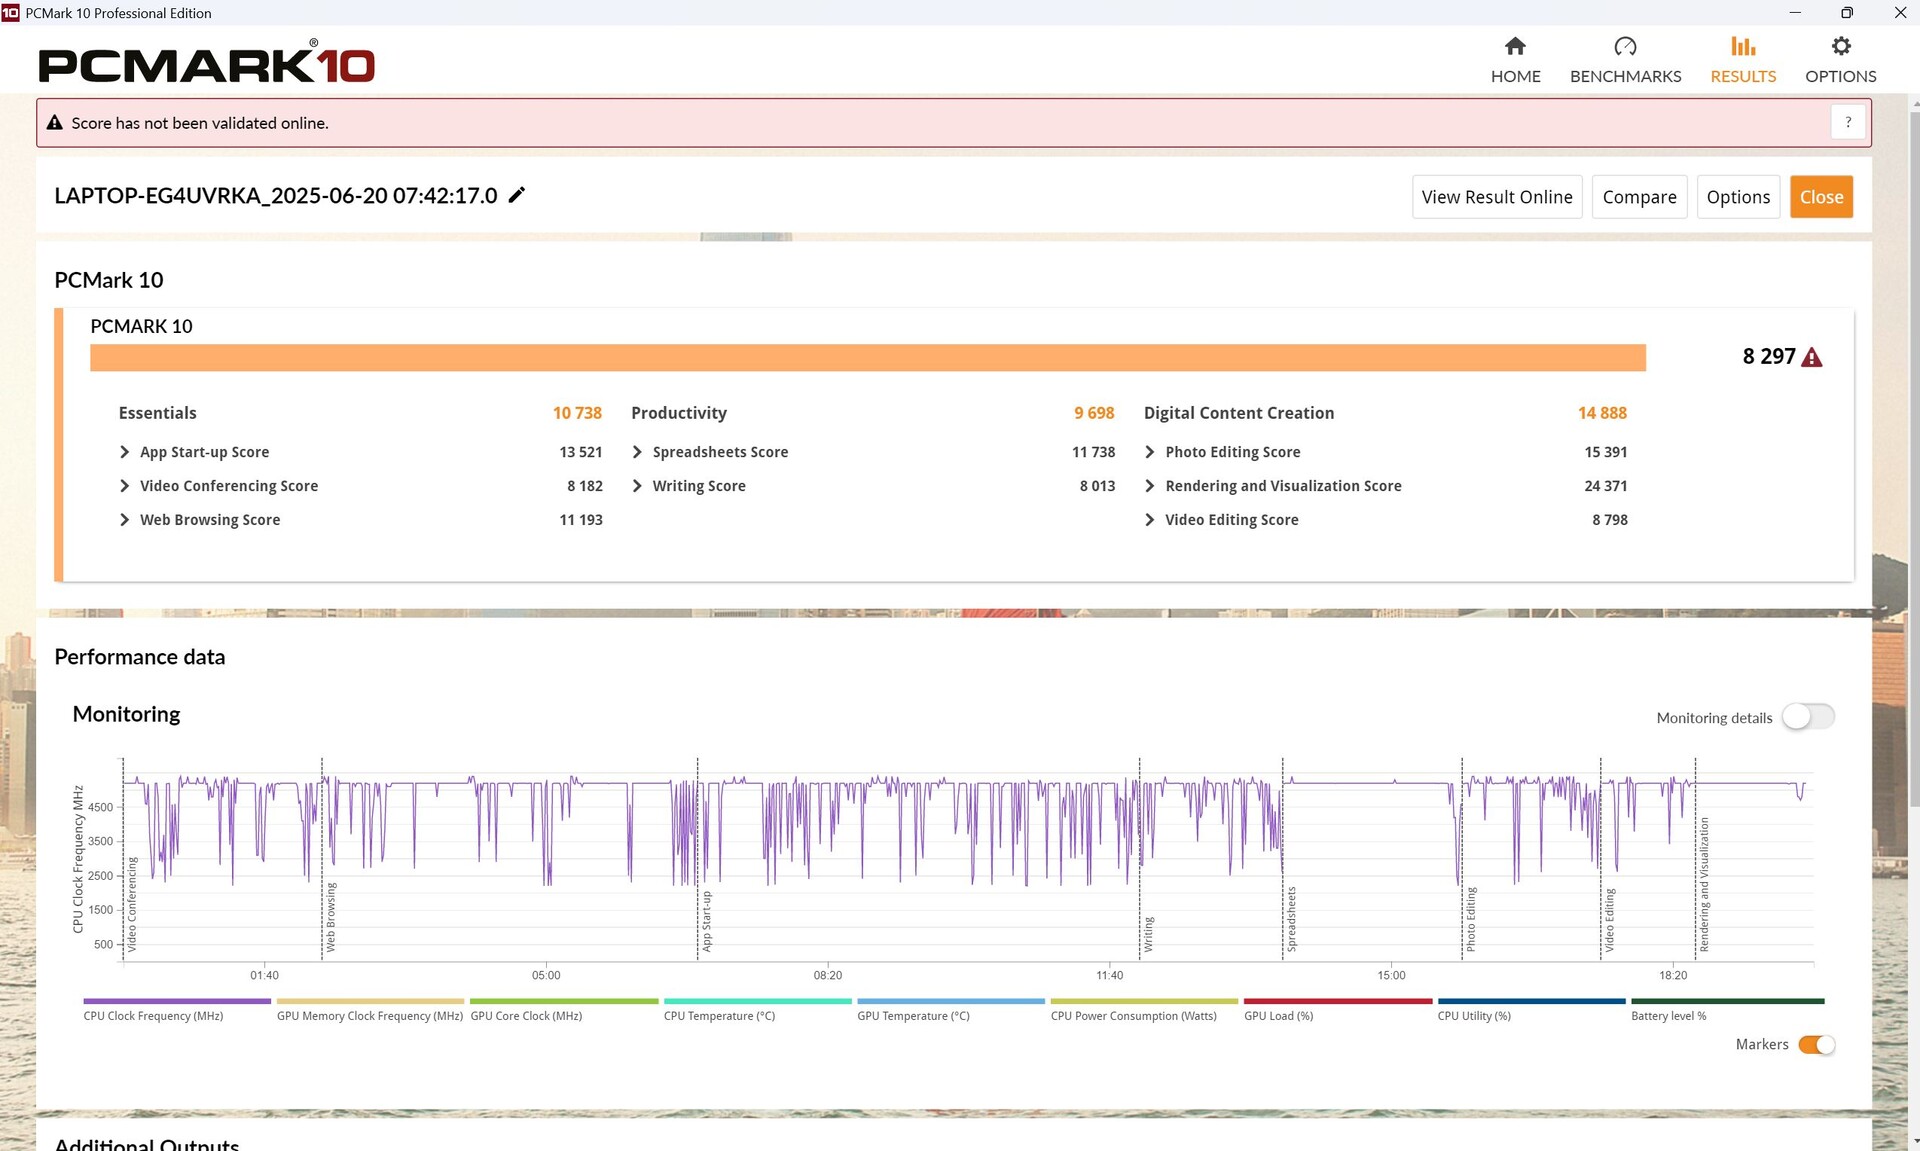
Dans PCMark 10 et CrossMark, la différence avec les concurrents est négligeable. Les bons résultats de CrossMark ont compensé le léger désavantage dans PCMark 10, ce qui a permis à notre Legion Pro d'avoir le nez devant dans l'ensemble.
PCMark 10: Score | Essentials | Productivity | Digital Content Creation
CrossMark: Overall | Productivity | Creativity | Responsiveness
WebXPRT 3: Overall
WebXPRT 4: Overall
Mozilla Kraken 1.1: Total
| Performance rating | |
| Lenovo Legion 5 Pro 16IAX10H | |
| Schenker XMG Pro 16 (E25) | |
| Moyenne Intel Core Ultra 9 275HX, NVIDIA GeForce RTX 5070 Ti Laptop | |
| Lenovo Legion Pro 5 16IRX9 | |
| Medion Erazer Major 16 X1 MD62736 | |
| Moyenne de la classe Gaming | |
| MSI Vector 16 HX AI A2XWHG | |
| PCMark 10 / Score | |
| Lenovo Legion Pro 5 16IRX9 | |
| Schenker XMG Pro 16 (E25) | |
| Moyenne Intel Core Ultra 9 275HX, NVIDIA GeForce RTX 5070 Ti Laptop (8297 - 8550, n=3) | |
| Moyenne de la classe Gaming (5828 - 11574, n=95, 2 dernières années) | |
| Lenovo Legion 5 Pro 16IAX10H | |
| Medion Erazer Major 16 X1 MD62736 | |
| MSI Vector 16 HX AI A2XWHG | |
| PCMark 10 / Essentials | |
| Schenker XMG Pro 16 (E25) | |
| Lenovo Legion Pro 5 16IRX9 | |
| Moyenne Intel Core Ultra 9 275HX, NVIDIA GeForce RTX 5070 Ti Laptop (10738 - 11290, n=3) | |
| Medion Erazer Major 16 X1 MD62736 | |
| Lenovo Legion 5 Pro 16IAX10H | |
| MSI Vector 16 HX AI A2XWHG | |
| Moyenne de la classe Gaming (8810 - 12600, n=99, 2 dernières années) | |
| PCMark 10 / Productivity | |
| Moyenne de la classe Gaming (6845 - 21327, n=97, 2 dernières années) | |
| Lenovo Legion Pro 5 16IRX9 | |
| Lenovo Legion 5 Pro 16IAX10H | |
| Moyenne Intel Core Ultra 9 275HX, NVIDIA GeForce RTX 5070 Ti Laptop (9591 - 9771, n=3) | |
| Schenker XMG Pro 16 (E25) | |
| MSI Vector 16 HX AI A2XWHG | |
| Medion Erazer Major 16 X1 MD62736 | |
| PCMark 10 / Digital Content Creation | |
| Schenker XMG Pro 16 (E25) | |
| Moyenne Intel Core Ultra 9 275HX, NVIDIA GeForce RTX 5070 Ti Laptop (14812 - 15662, n=3) | |
| Lenovo Legion 5 Pro 16IAX10H | |
| Lenovo Legion Pro 5 16IRX9 | |
| Moyenne de la classe Gaming (7602 - 19657, n=97, 2 dernières années) | |
| Medion Erazer Major 16 X1 MD62736 | |
| MSI Vector 16 HX AI A2XWHG | |
| CrossMark / Overall | |
| Schenker XMG Pro 16 (E25) | |
| Lenovo Legion 5 Pro 16IAX10H | |
| Moyenne Intel Core Ultra 9 275HX, NVIDIA GeForce RTX 5070 Ti Laptop (2116 - 2193, n=3) | |
| Medion Erazer Major 16 X1 MD62736 | |
| Lenovo Legion Pro 5 16IRX9 | |
| Moyenne de la classe Gaming (1366 - 2409, n=96, 2 dernières années) | |
| MSI Vector 16 HX AI A2XWHG | |
| CrossMark / Productivity | |
| Lenovo Legion 5 Pro 16IAX10H | |
| Schenker XMG Pro 16 (E25) | |
| Moyenne Intel Core Ultra 9 275HX, NVIDIA GeForce RTX 5070 Ti Laptop (1967 - 2038, n=3) | |
| Medion Erazer Major 16 X1 MD62736 | |
| Moyenne de la classe Gaming (1386 - 2254, n=96, 2 dernières années) | |
| MSI Vector 16 HX AI A2XWHG | |
| Lenovo Legion Pro 5 16IRX9 | |
| CrossMark / Creativity | |
| Schenker XMG Pro 16 (E25) | |
| Moyenne Intel Core Ultra 9 275HX, NVIDIA GeForce RTX 5070 Ti Laptop (2430 - 2531, n=3) | |
| Lenovo Legion 5 Pro 16IAX10H | |
| Medion Erazer Major 16 X1 MD62736 | |
| Lenovo Legion Pro 5 16IRX9 | |
| MSI Vector 16 HX AI A2XWHG | |
| Moyenne de la classe Gaming (1343 - 2729, n=96, 2 dernières années) | |
| CrossMark / Responsiveness | |
| Lenovo Legion 5 Pro 16IAX10H | |
| Schenker XMG Pro 16 (E25) | |
| Moyenne Intel Core Ultra 9 275HX, NVIDIA GeForce RTX 5070 Ti Laptop (1740 - 1844, n=3) | |
| Lenovo Legion Pro 5 16IRX9 | |
| Medion Erazer Major 16 X1 MD62736 | |
| Moyenne de la classe Gaming (1226 - 2334, n=96, 2 dernières années) | |
| MSI Vector 16 HX AI A2XWHG | |
| WebXPRT 3 / Overall | |
| Lenovo Legion 5 Pro 16IAX10H | |
| Moyenne Intel Core Ultra 9 275HX, NVIDIA GeForce RTX 5070 Ti Laptop (328 - 532, n=3) | |
| Schenker XMG Pro 16 (E25) | |
| Medion Erazer Major 16 X1 MD62736 | |
| Lenovo Legion Pro 5 16IRX9 | |
| MSI Vector 16 HX AI A2XWHG | |
| Moyenne de la classe Gaming (220 - 532, n=100, 2 dernières années) | |
| WebXPRT 4 / Overall | |
| Schenker XMG Pro 16 (E25) | |
| Lenovo Legion 5 Pro 16IAX10H | |
| Moyenne Intel Core Ultra 9 275HX, NVIDIA GeForce RTX 5070 Ti Laptop (306 - 341, n=3) | |
| Medion Erazer Major 16 X1 MD62736 | |
| MSI Vector 16 HX AI A2XWHG | |
| Lenovo Legion Pro 5 16IRX9 | |
| Moyenne de la classe Gaming (165 - 354, n=101, 2 dernières années) | |
| Mozilla Kraken 1.1 / Total | |
| Moyenne de la classe Gaming (391 - 590, n=104, 2 dernières années) | |
| Lenovo Legion Pro 5 16IRX9 | |
| MSI Vector 16 HX AI A2XWHG | |
| Medion Erazer Major 16 X1 MD62736 | |
| Lenovo Legion 5 Pro 16IAX10H | |
| Moyenne Intel Core Ultra 9 275HX, NVIDIA GeForce RTX 5070 Ti Laptop (405 - 414, n=3) | |
| Schenker XMG Pro 16 (E25) | |
* ... Moindre est la valeur, meilleures sont les performances
| PCMark 10 Score | 8297 points | |
Aide | ||
| AIDA64 / Memory Copy | |
| Schenker XMG Pro 16 (E25) | |
| Moyenne Intel Core Ultra 9 275HX (56003 - 94460, n=30) | |
| Lenovo Legion Pro 5 16IRX9 | |
| Lenovo Legion 5 Pro 16IAX10H | |
| Medion Erazer Major 16 X1 MD62736 | |
| Moyenne de la classe Gaming (21750 - 129946, n=107, 2 dernières années) | |
| MSI Vector 16 HX AI A2XWHG | |
| AIDA64 / Memory Read | |
| Schenker XMG Pro 16 (E25) | |
| Lenovo Legion 5 Pro 16IAX10H | |
| Lenovo Legion Pro 5 16IRX9 | |
| Medion Erazer Major 16 X1 MD62736 | |
| Moyenne Intel Core Ultra 9 275HX (55795 - 97151, n=30) | |
| MSI Vector 16 HX AI A2XWHG | |
| Moyenne de la classe Gaming (22956 - 118858, n=107, 2 dernières années) | |
| AIDA64 / Memory Write | |
| Medion Erazer Major 16 X1 MD62736 | |
| Schenker XMG Pro 16 (E25) | |
| Moyenne Intel Core Ultra 9 275HX (55663 - 116129, n=30) | |
| Lenovo Legion 5 Pro 16IAX10H | |
| Lenovo Legion Pro 5 16IRX9 | |
| Moyenne de la classe Gaming (22297 - 135096, n=107, 2 dernières années) | |
| MSI Vector 16 HX AI A2XWHG | |
| AIDA64 / Memory Latency | |
| Moyenne Intel Core Ultra 9 275HX (105.8 - 161.6, n=30) | |
| Lenovo Legion 5 Pro 16IAX10H | |
| Medion Erazer Major 16 X1 MD62736 | |
| Moyenne de la classe Gaming (75.3 - 259, n=107, 2 dernières années) | |
| MSI Vector 16 HX AI A2XWHG | |
| Schenker XMG Pro 16 (E25) | |
| Lenovo Legion Pro 5 16IRX9 | |
* ... Moindre est la valeur, meilleures sont les performances
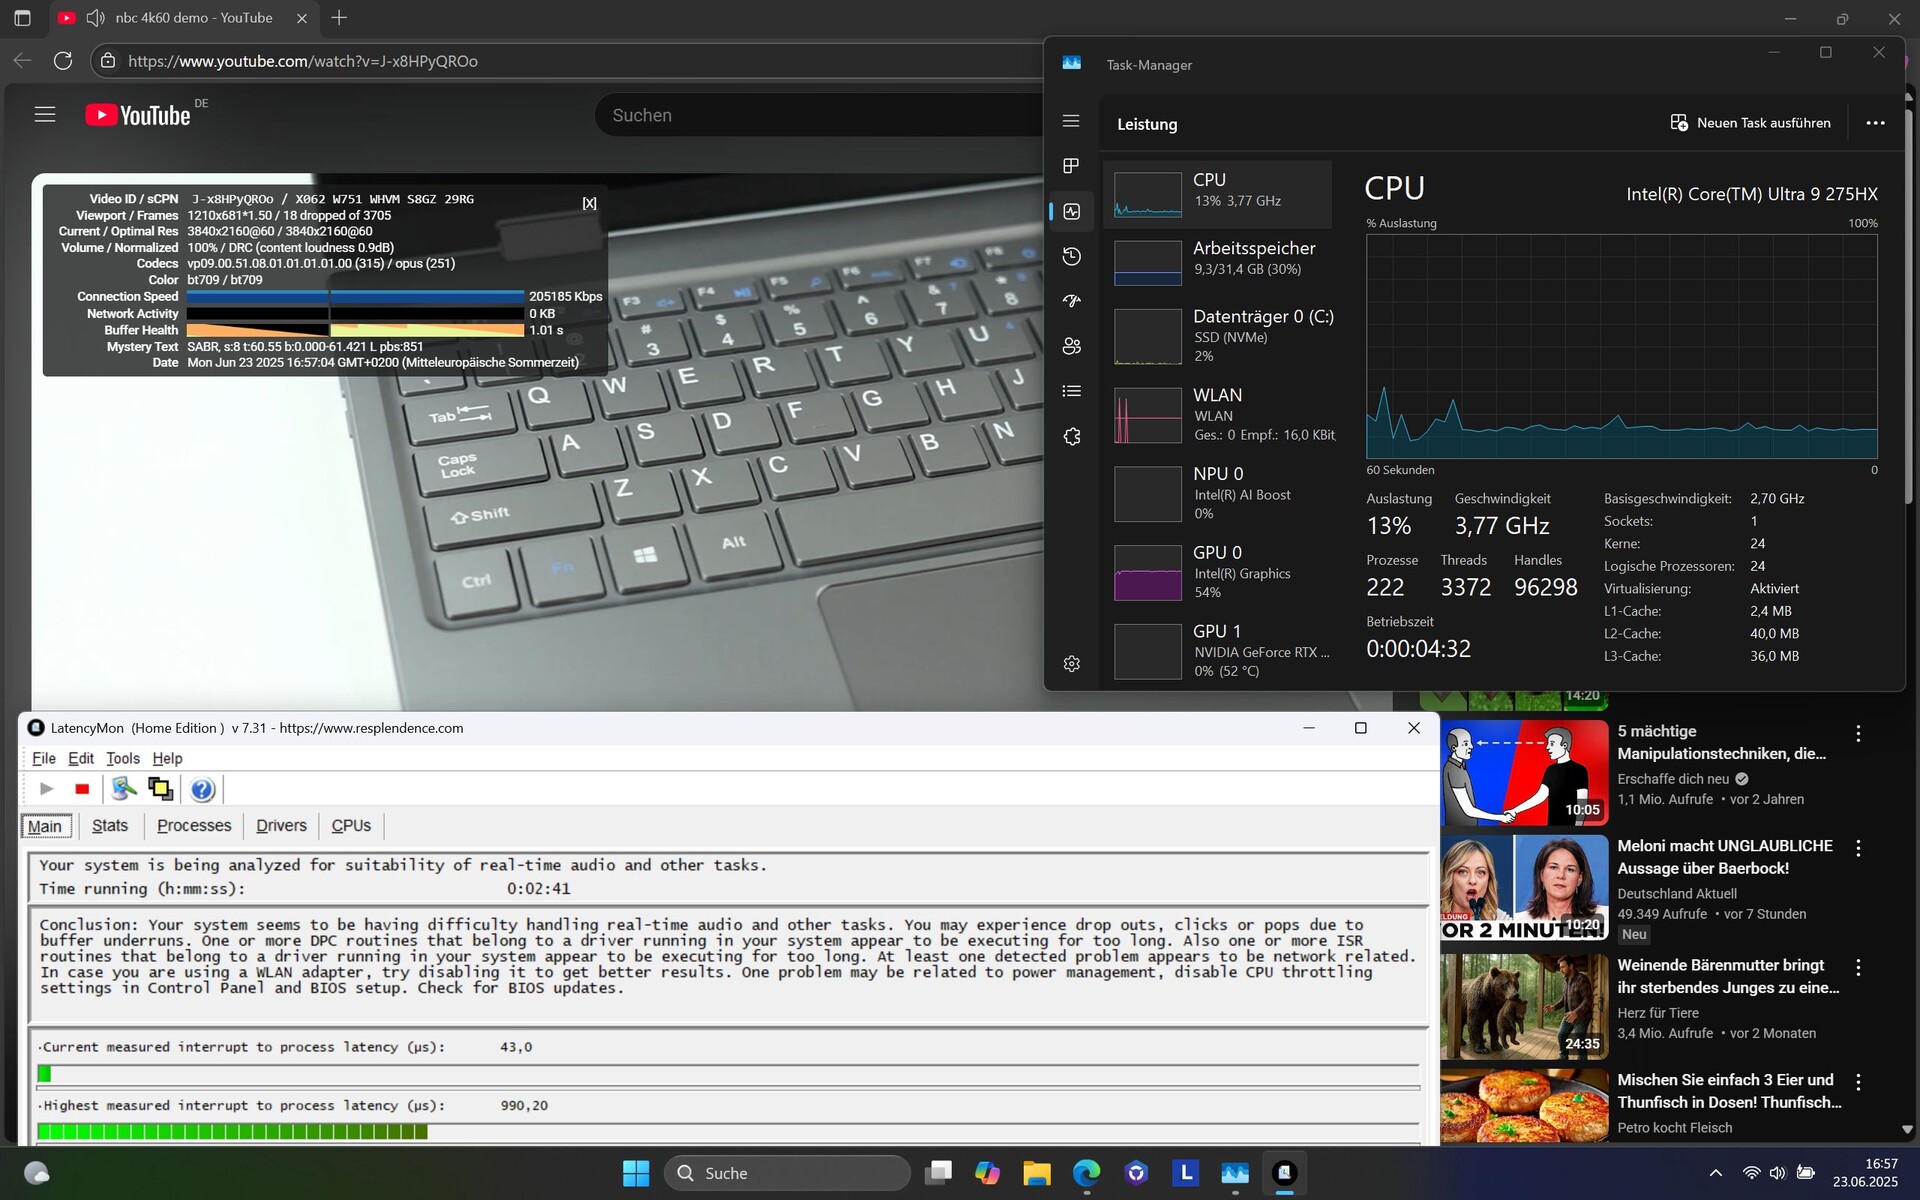
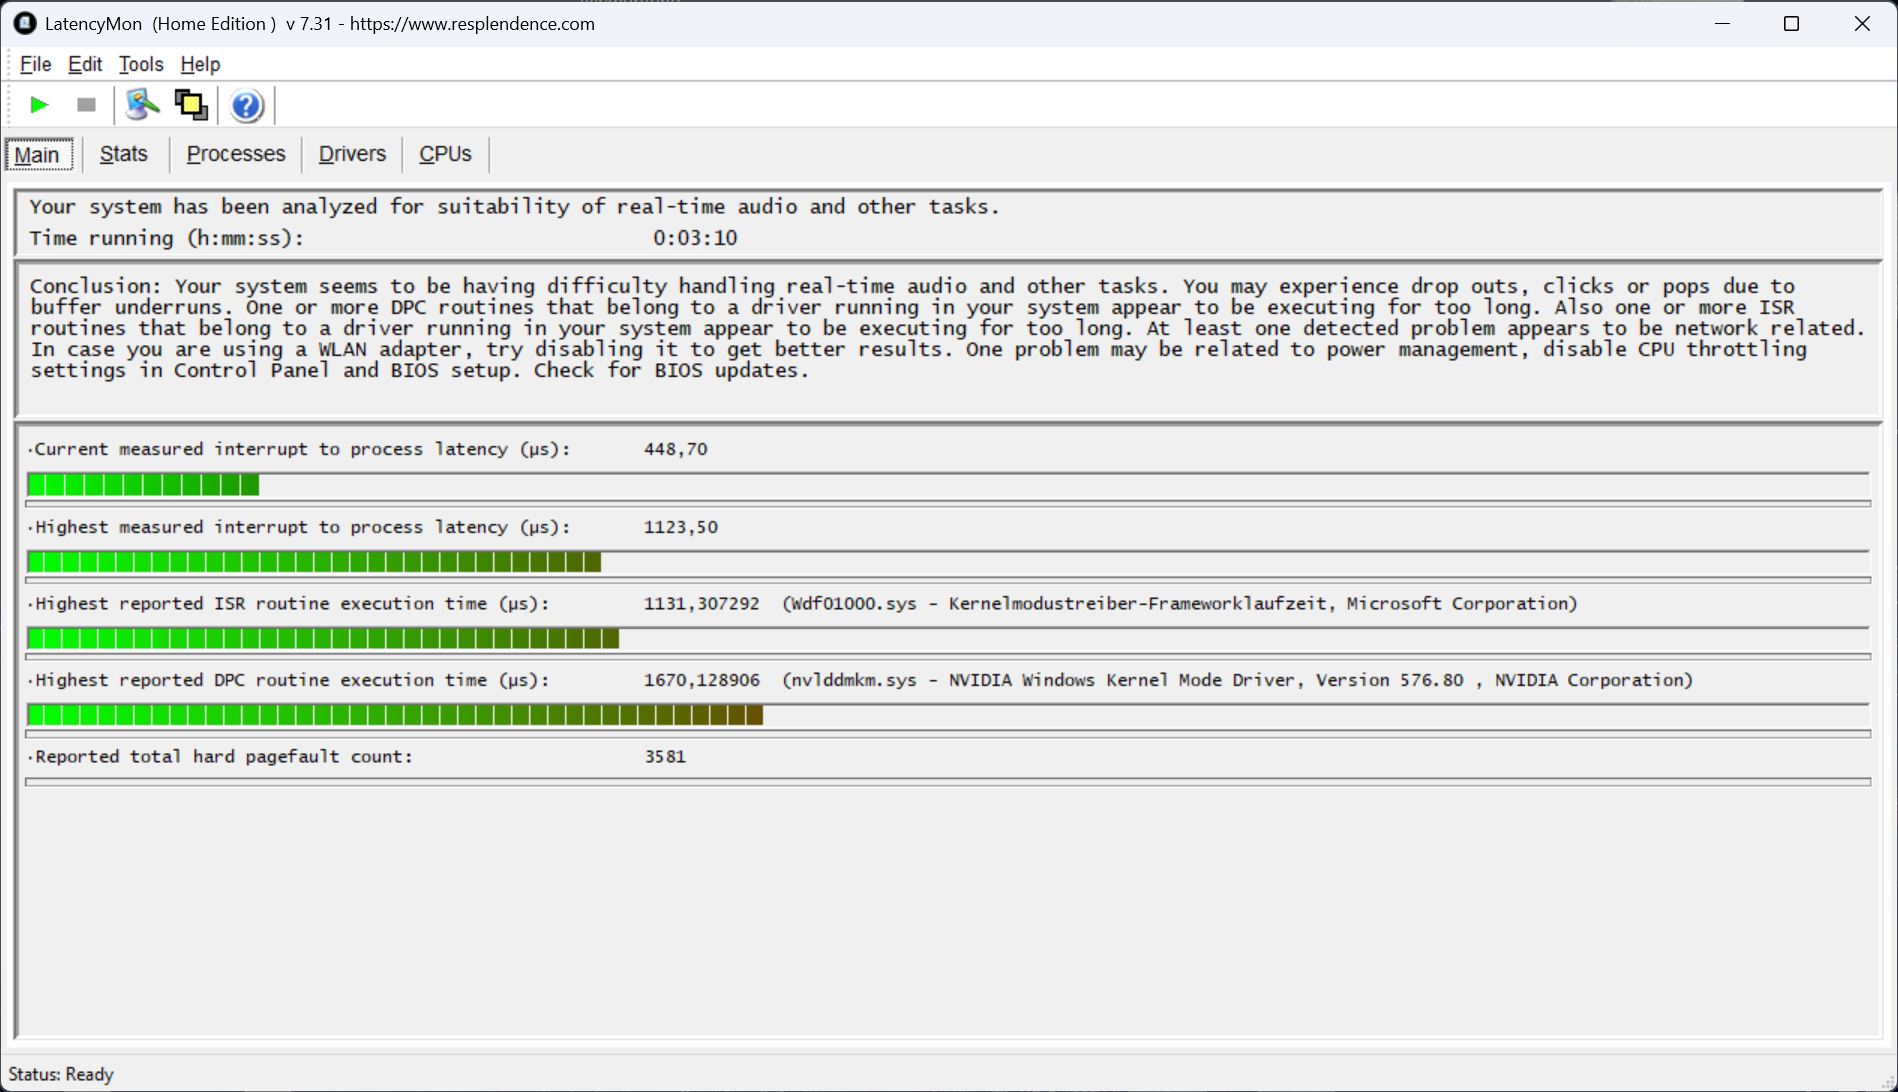
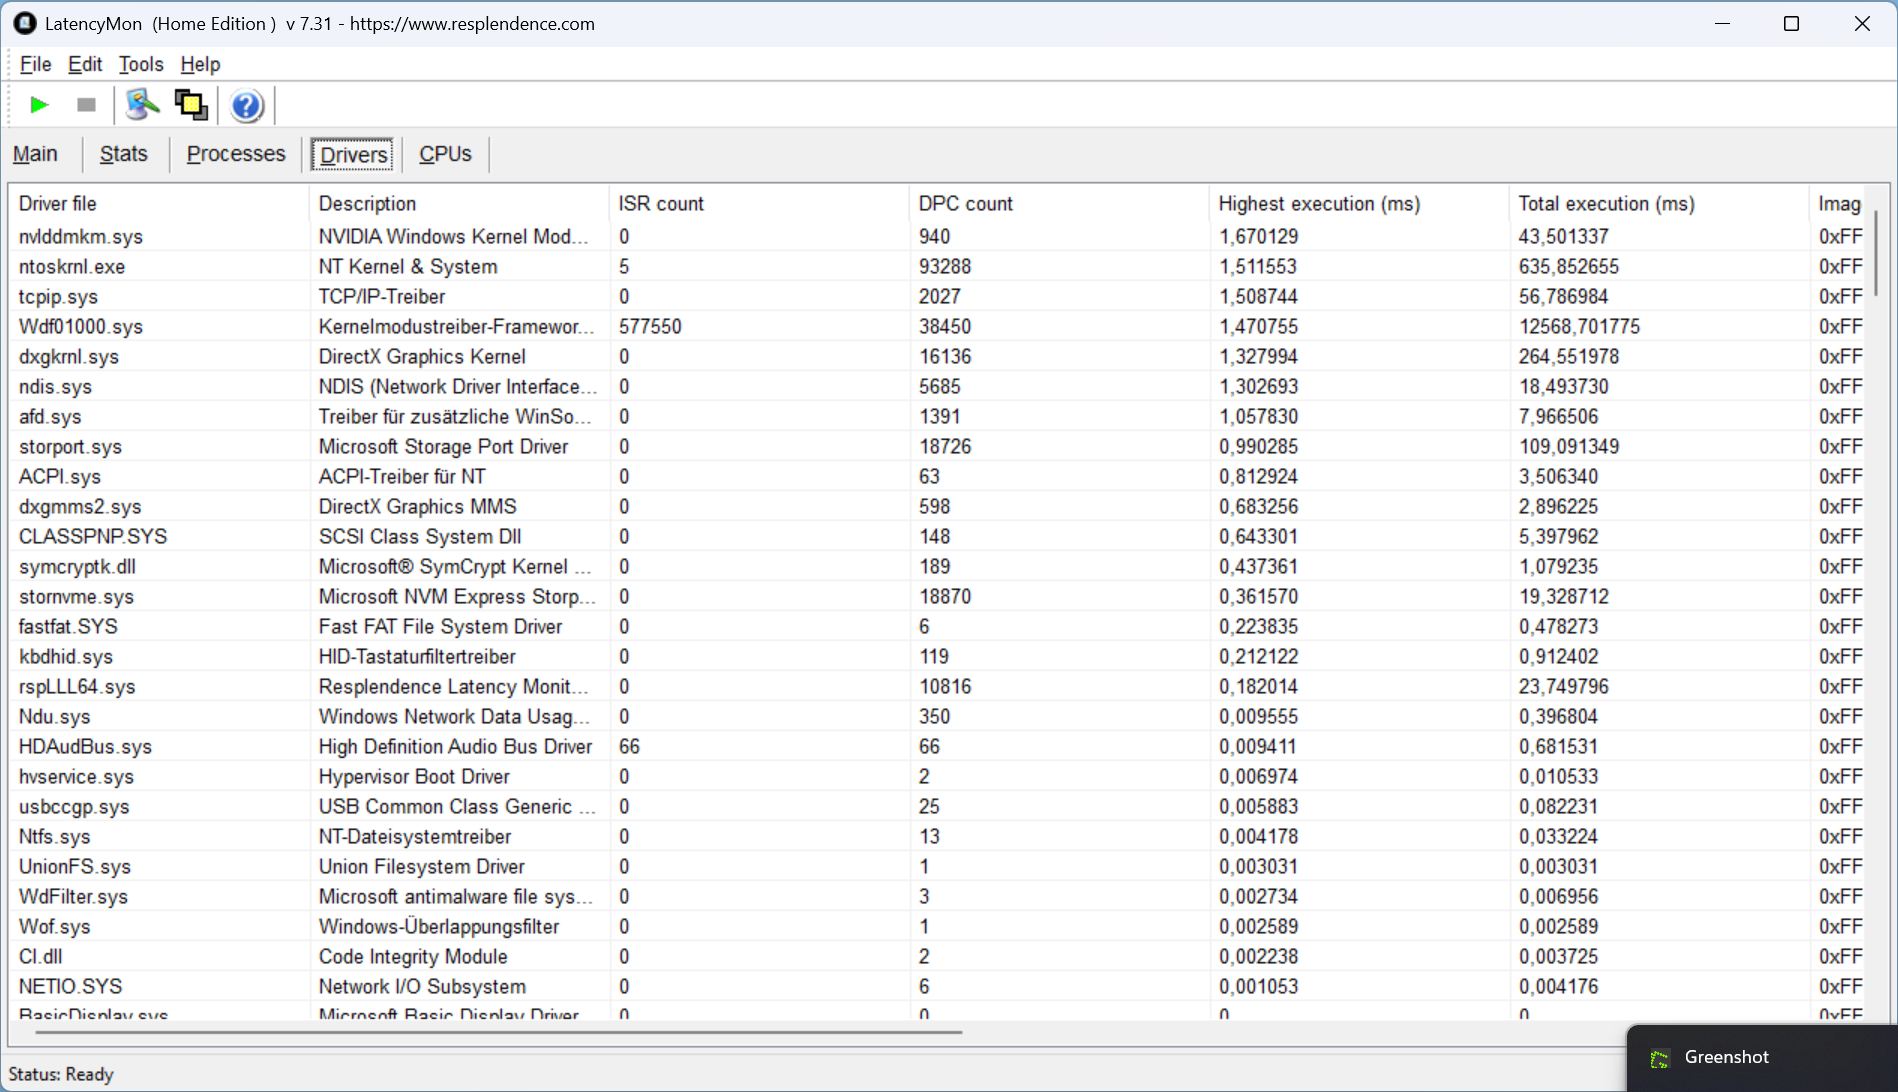
Latences DPC
LatencyMon a détecté une latence initiale au démarrage, qui s'est accrue lors du lancement du navigateur, de l'ouverture de plusieurs onglets et de l'exécution de Prime95. Malheureusement, notre vidéo de test 4K/60fps n'a pas pu être lue sans perte d'images (18 images perdues).
Dans l'ensemble, cependant, la valeur de latence est relativement faible en comparaison, et la concurrence atteint des valeurs encore plus élevées. Cependant, les images perdues pourraient être un facteur négatif pour les créateurs de contenu.
| DPC Latencies / LatencyMon - interrupt to process latency (max), Web, Youtube, Prime95 | |
| MSI Vector 16 HX AI A2XWHG | |
| Medion Erazer Major 16 X1 MD62736 | |
| Schenker XMG Pro 16 (E25) | |
| Lenovo Legion 5 Pro 16IAX10H | |
| Lenovo Legion Pro 5 16IRX9 | |
* ... Moindre est la valeur, meilleures sont les performances
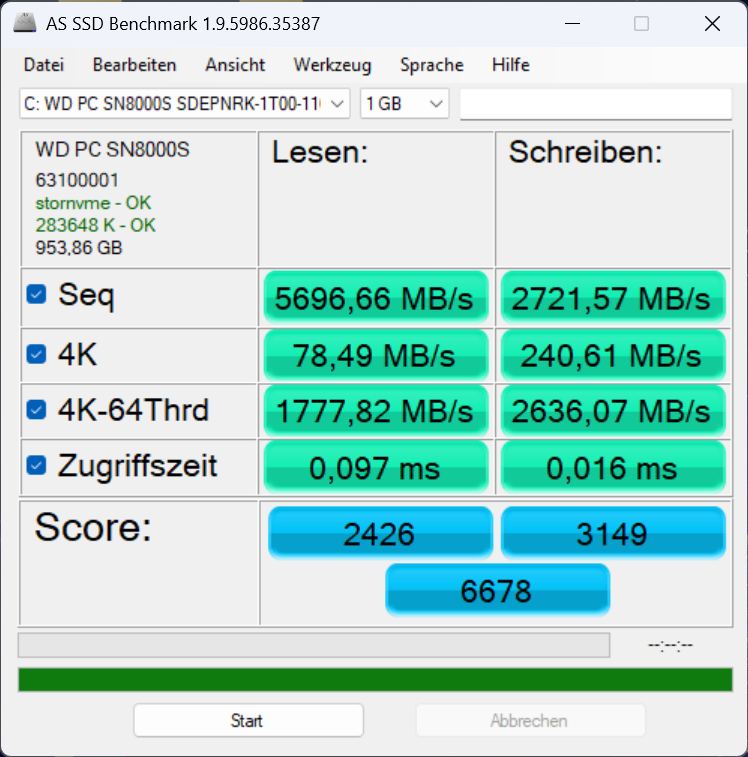
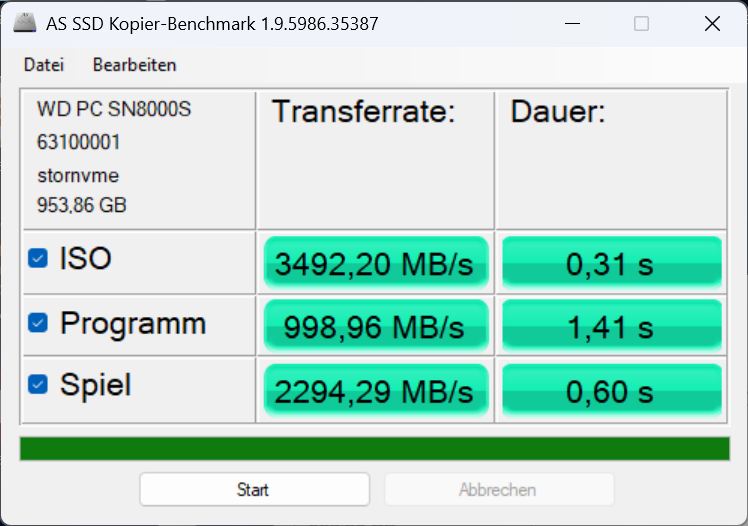
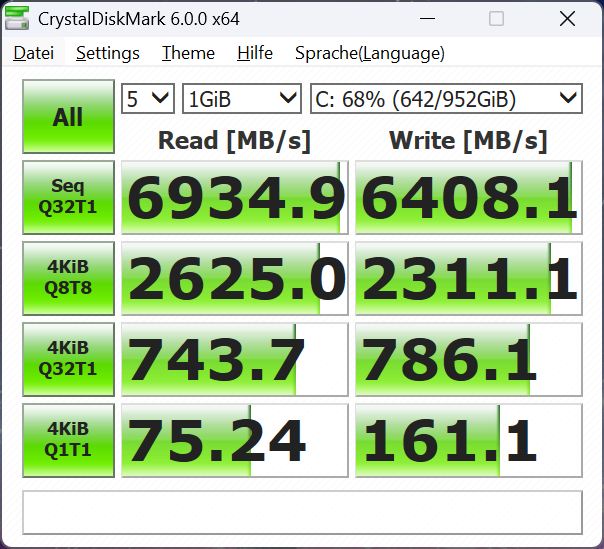
Mémoire de masse
Il y a deux slots SSD M.2, mais seul le slot principal est connecté via PCIe 5.0 x4, tandis que le second slot inoccupé est connecté via PCIe 4.0 x4. Le périphérique de stockage Western Digital de 1 To a atteint des vitesses de transfert décentes, bien qu'il ne fasse pas partie des modèles les plus rapides. Contrairement à son prédécesseurle SSD n'a pas été gêné lors de notre test d'endurance

* ... Moindre est la valeur, meilleures sont les performances
Continuous Performance Read: DiskSpd Read Loop, Queue Depth 8
Performance du GPU
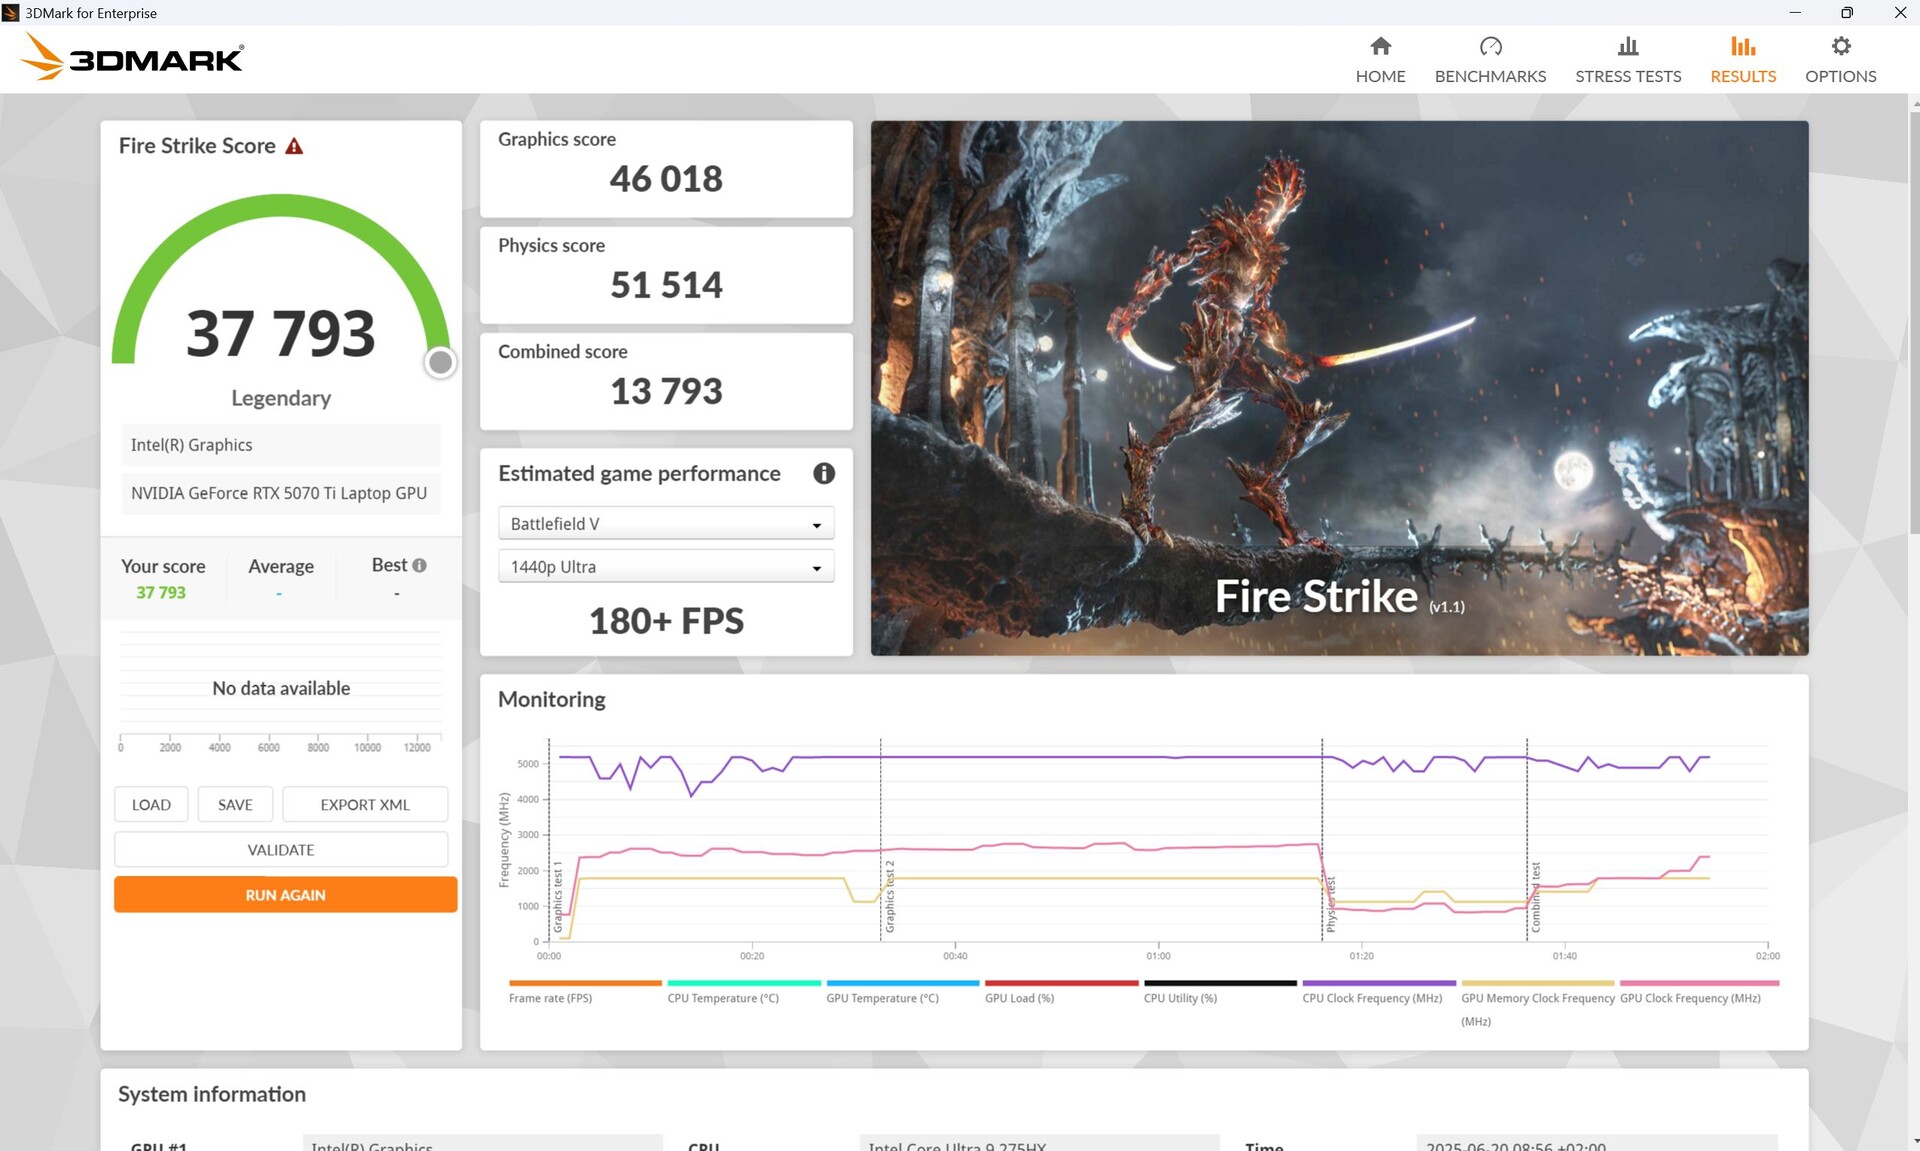
La RTX 5070 Ti est issue de la famille Blackwell, prend en charge la génération d'images multiples et est équipée de 12 Go de GDDR7 (bus mémoire de 192 bits).
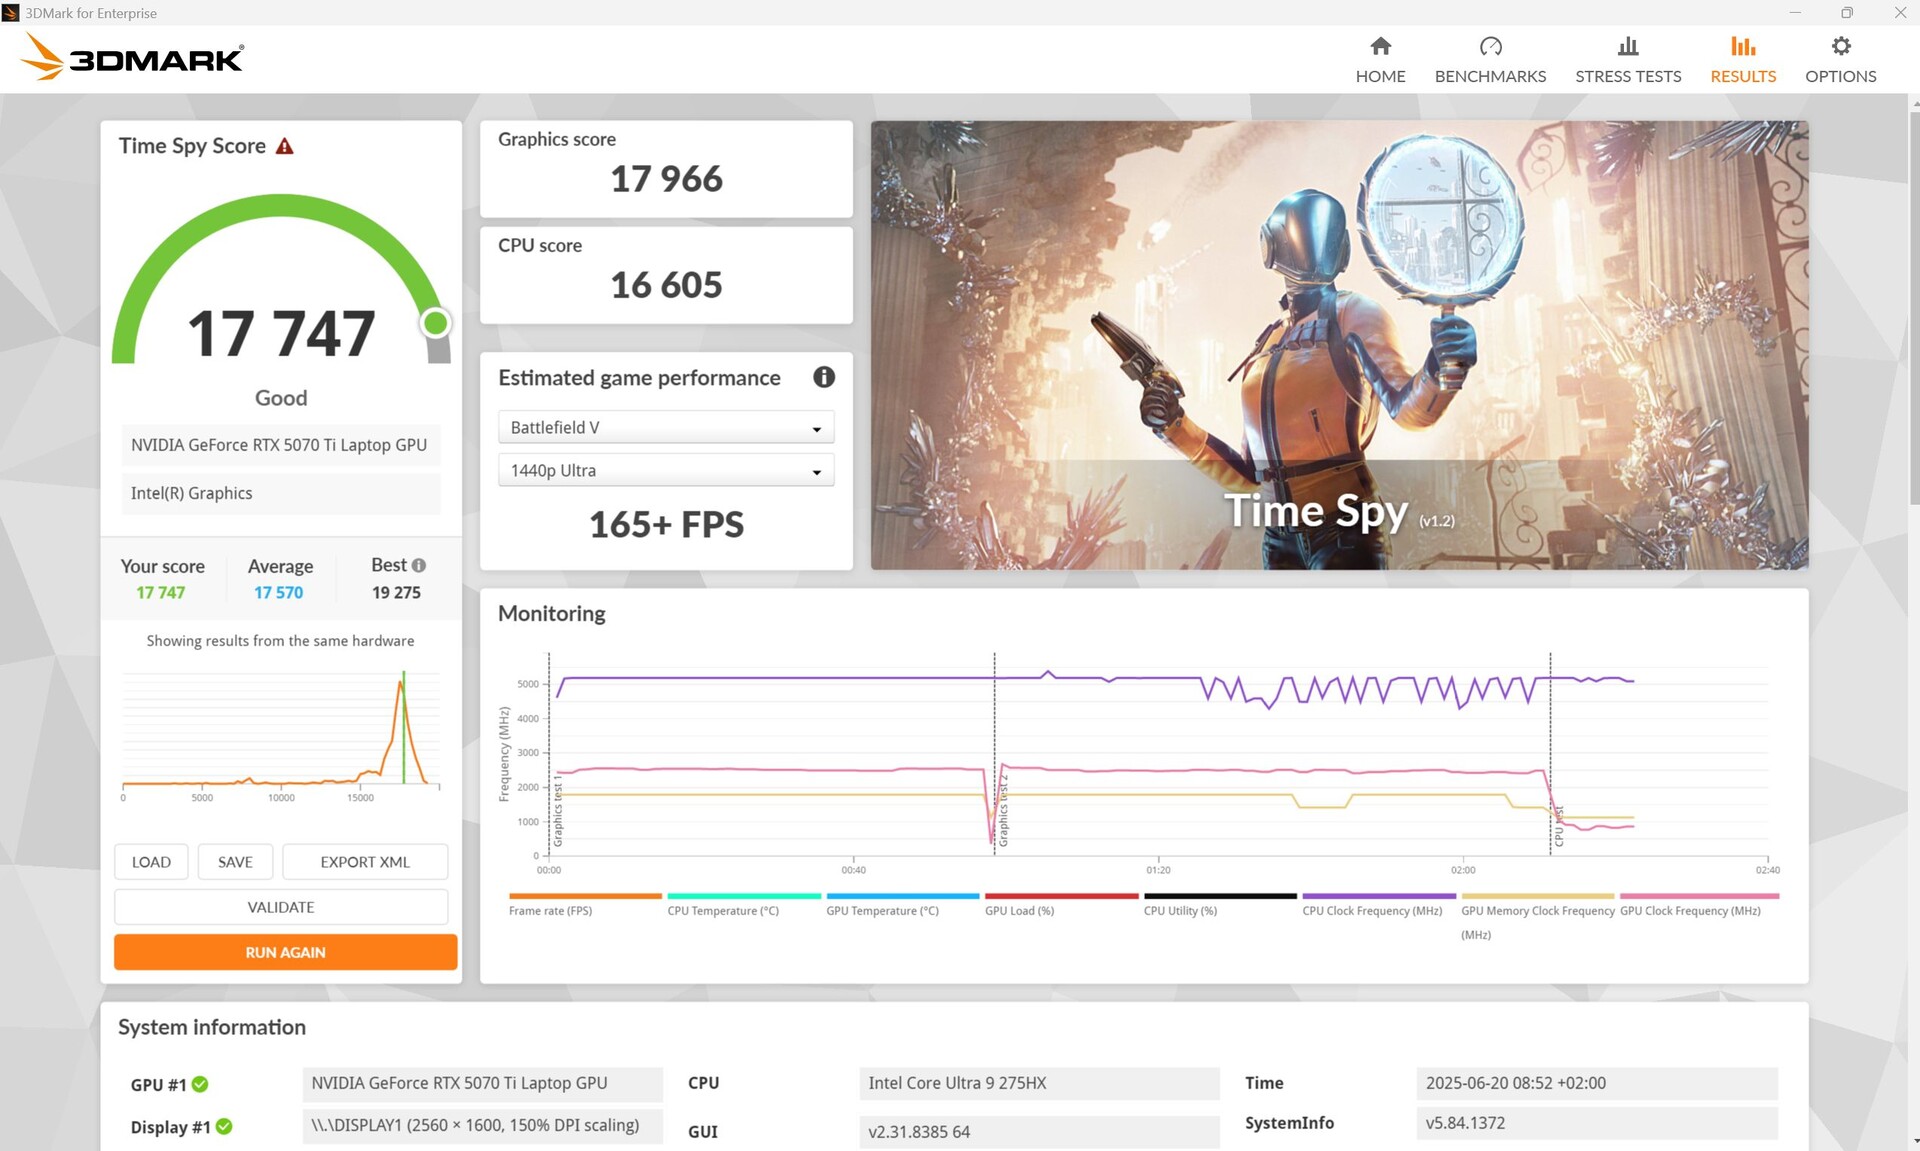
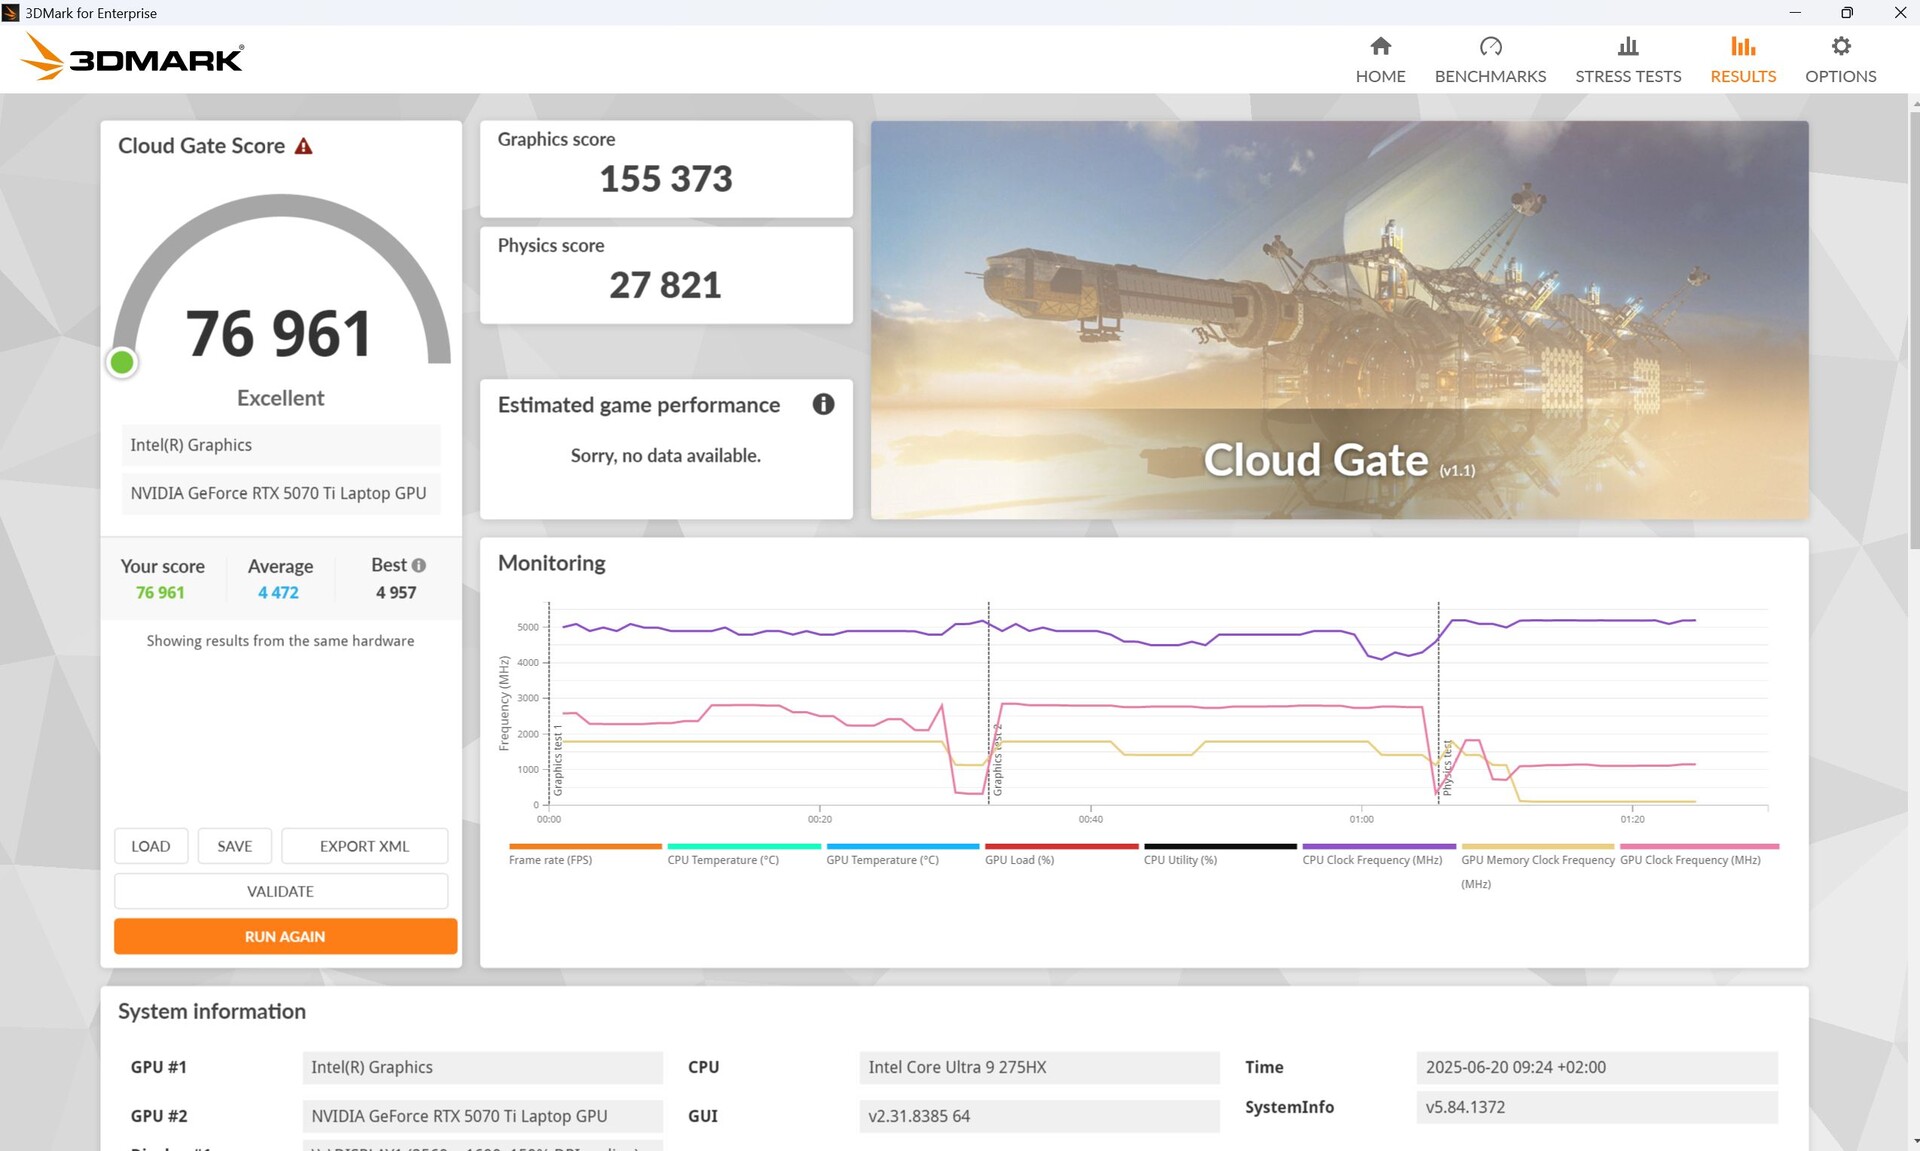
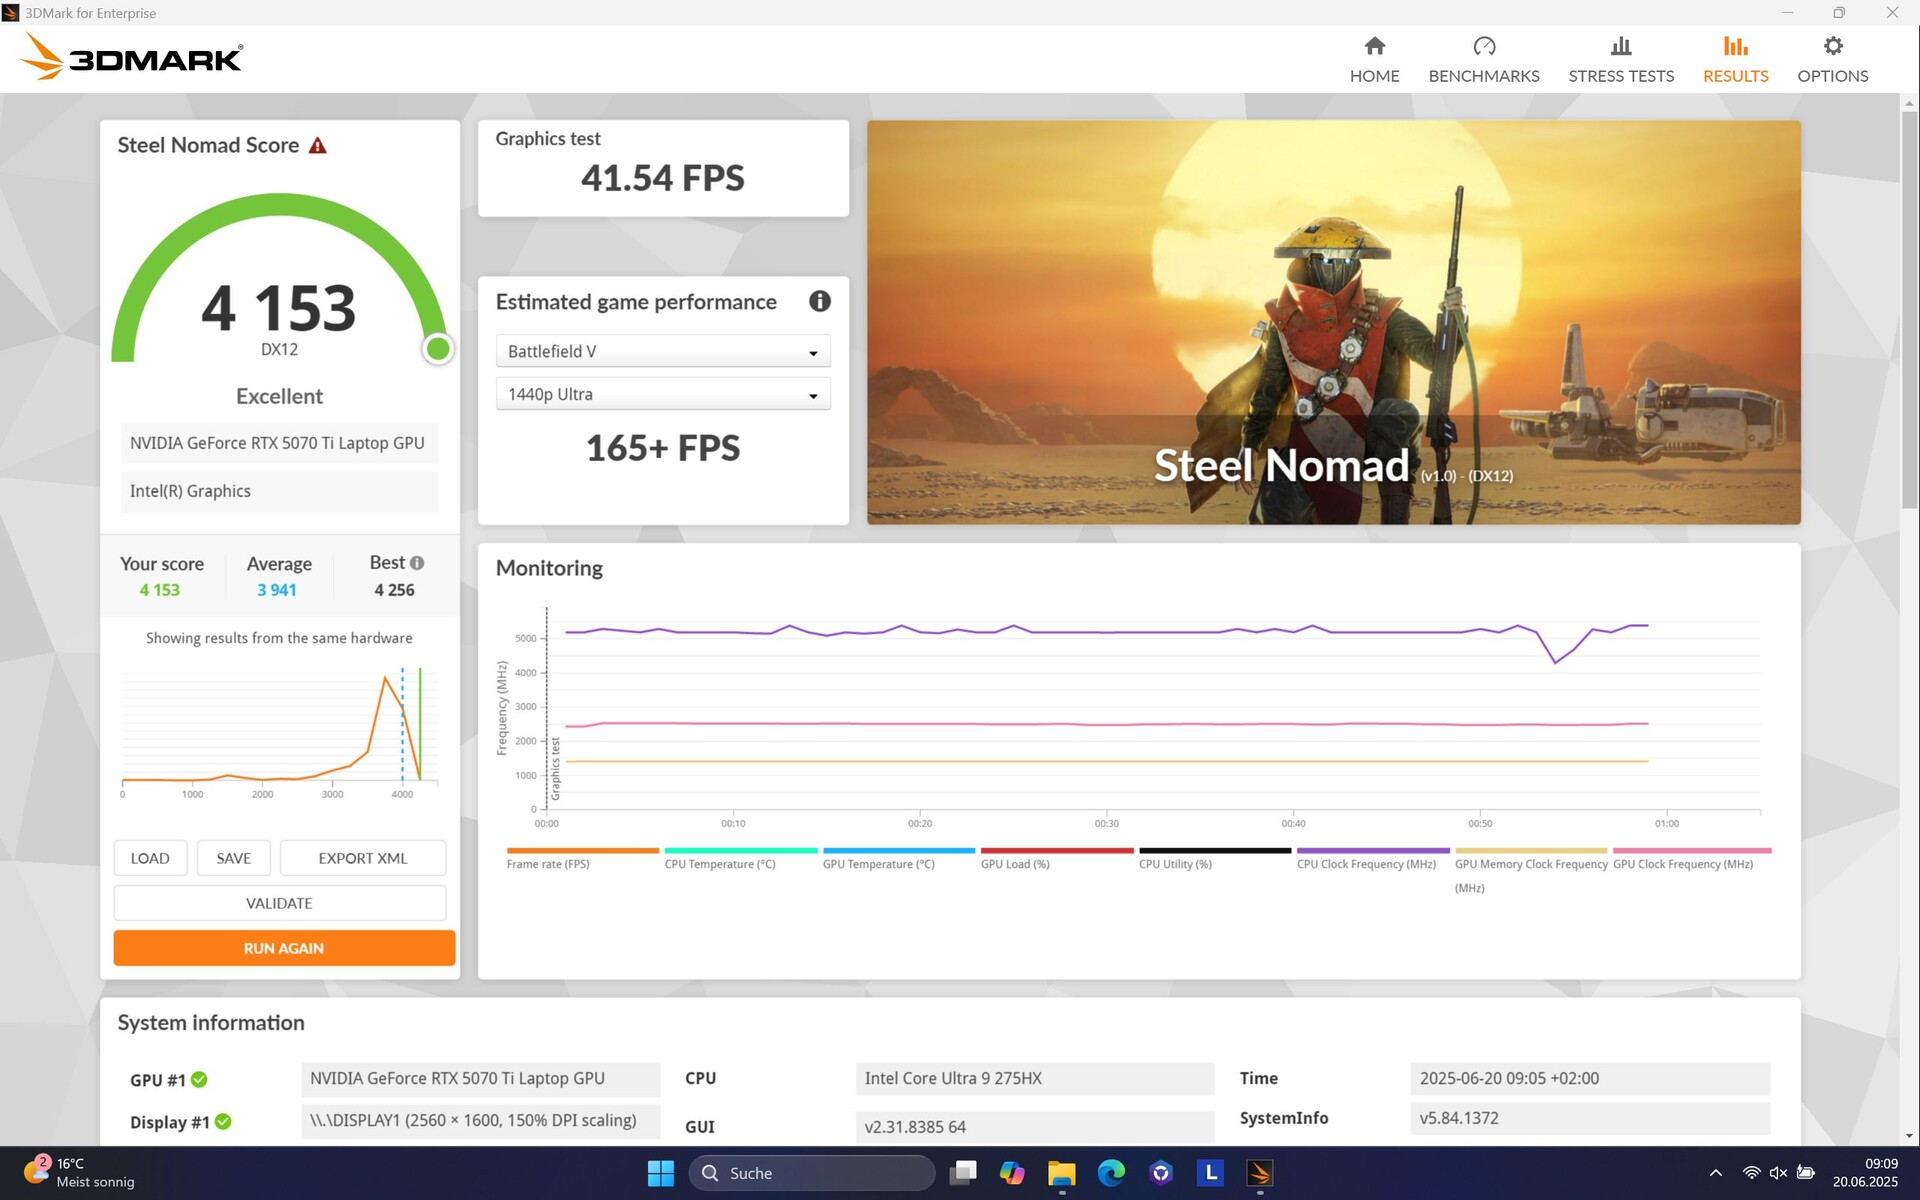
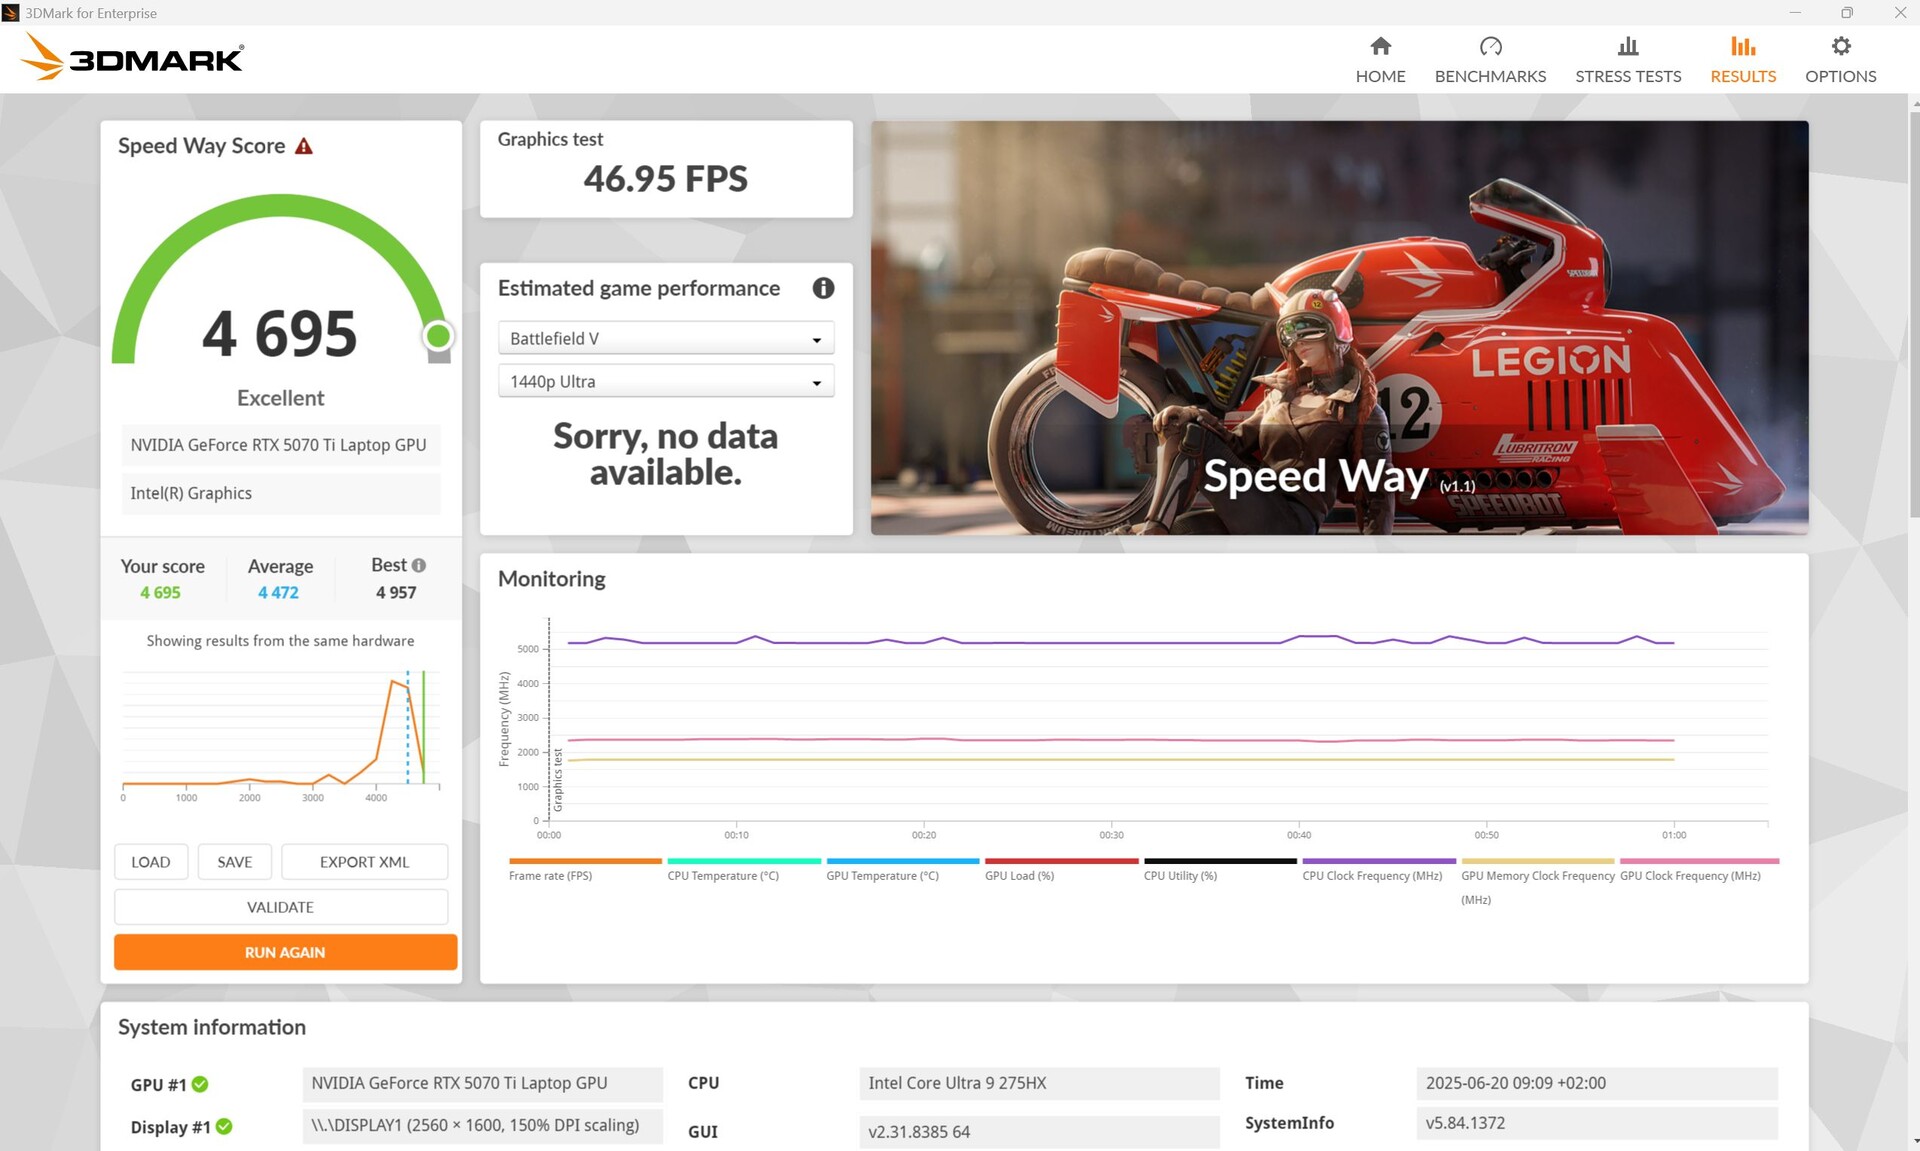
Dans les tests 3DMark, ses performances sont supérieures d'environ 5 % à celles d'un ordinateur portable moyen équipé du même GPU, ce qui lui permet de ravir de justesse la couronne des performances à ses concurrents directs. Le Alienware 16 Area 51 avec une RTX 5080 affiche des performances supérieures d'environ 9 %.
Si le Legion Pro n'est pas connecté à l'alimentation, il perd 85 % de ses performances 3D sur le site Fire Strike!
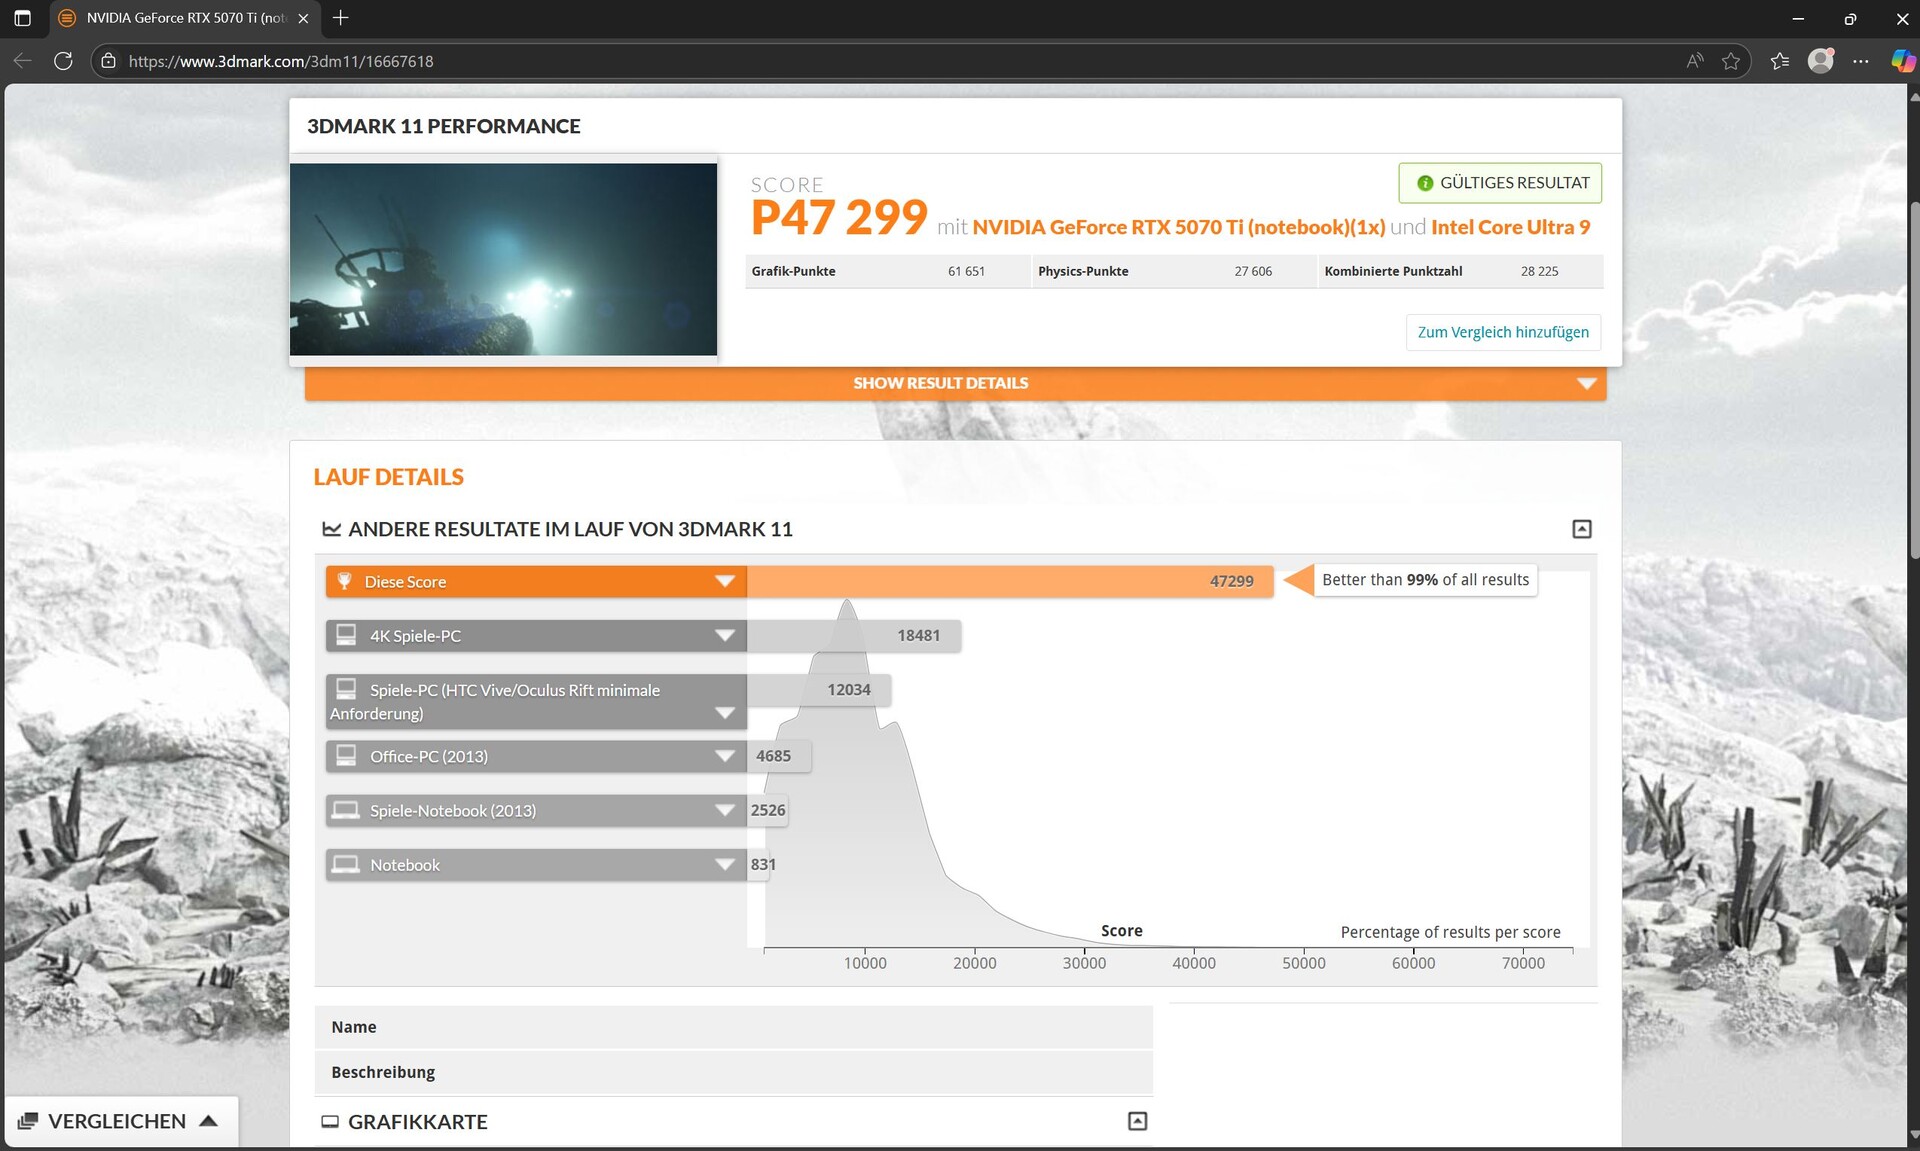
| 3DMark 11 Performance | 47299 points | |
| 3DMark Cloud Gate Standard Score | 76961 points | |
| 3DMark Fire Strike Score | 37793 points | |
| 3DMark Time Spy Score | 17747 points | |
| 3DMark Steel Nomad Score | 4153 points | |
Aide | ||
* ... Moindre est la valeur, meilleures sont les performances
Performances des jeux
La Legion Pro 5 avec une RTX 5070 Ti est plus à l'aise en FHD et QHD. Jouer en 4K est également possible dans de nombreux titres, mais dans les jeux plus exigeants tels que Cyberpunk 2077, cela peut être difficile, même avec DLSS. Cependant, si vous souhaitez maximiser la fréquence d'images de votre moniteur, vous devrez recourir à la Full HD dans de nombreux titres.
Seuls les titres particulièrement exigeants, tels que F1 25même en Full HD Ultra, le DLSS est nécessaire. Dans ce jeu, le nombre d'images par seconde passe de 35 à 52. Nous n'avons détecté aucune erreur d'affichage lors des scènes de conduite trépidantes. Lors de l'interview qui a suivi, nous avons remarqué un scintillement des bords autour du personnage. Grâce à DLSS et à Frame Generation x4 (FG), dans Doom : The Dark Agesle nombre d'images par seconde passe de 46 à 148, et sans FG, il atteint encore 61, et nous n'avons pas remarqué de latence gênante.
En comparaison directe, le Legion délivre une performance solide et prend la tête des appareils 16 pouces avec écran RTX 5070 Ti, avec le SCHENKER XMG Pro 16 (E25) est à 10 % derrière.
| GTA V - 1920x1080 Highest AA:4xMSAA + FX AF:16x | |
| Schenker XMG Pro 16 (E25) | |
| Medion Erazer Major 16 X1 MD62736 | |
| Lenovo Legion 5 Pro 16IAX10H | |
| MSI Vector 16 HX AI A2XWHG | |
| Moyenne de la classe Gaming (48.3 - 186.9, n=97, 2 dernières années) | |
| Lenovo Legion Pro 5 16IRX9 | |
| Strange Brigade - 1920x1080 ultra AA:ultra AF:16 | |
| Alienware 16 Area-51 | |
| Lenovo Legion 5 Pro 16IAX10H | |
| Moyenne de la classe Gaming (76.3 - 456, n=88, 2 dernières années) | |
| Asus ROG Zephyrus G16 2025 5070 Ti | |
| Lenovo Legion Pro 5 16IRX9 | |
| Schenker XMG Pro 16 (E25) | |
Notre graphique Cyberpunk 2077 est très cohérent, sans aucune baisse de performance. En termes de performances, la carte Legion Pro 5 surpasse la carte légèrement plus lente XMG Pro 16 et le reste de la concurrence RTX 5070 Ti.
Cyberpunk 2077 ultra FPS diagram
| Bas | Moyen | Élevé | Ultra | QHD DLSS | QHD | 4K DLSS | 4K | |
|---|---|---|---|---|---|---|---|---|
| GTA V (2015) | 185.8 | 185.4 | 180.2 | 147.6 | 123.8 | 124.2 | ||
| Dota 2 Reborn (2015) | 228 | 198.2 | 189.7 | 174 | 173.1 | |||
| Final Fantasy XV Benchmark (2018) | 234 | 230 | 181.4 | 139.2 | 78.8 | |||
| X-Plane 11.11 (2018) | 155.8 | 140.1 | 116 | 108.2 | ||||
| Strange Brigade (2018) | 643 | 479 | 403 | 353 | 250 | 138.1 | ||
| Baldur's Gate 3 (2023) | 167.7 | 131.1 | 108.1 | 138.9 | 130 | 91 | 72.4 | 46.6 |
| Cyberpunk 2077 (2023) | 175.1 | 133.9 | 132.4 | 91.2 | 84.3 | 35.9 | ||
| Assassin's Creed Shadows (2025) | 81 | 77 | 63 | 53 | 49 | 44 | ||
| Doom: The Dark Ages (2025) | 93 | 77.5 | 67.3 | 65 | 61 | 45.7 | ||
| F1 25 (2025) | 242 | 217 | 171.9 | 35 | 32 | 18 |
Emissions - Un ordinateur portable professionnel très bruyant
Émissions sonores
Les ventilateurs sont généralement éteints lorsqu'ils tournent au ralenti, mais en mode Performance, ils peuvent parfois se mettre à tourner bruyamment pendant un court instant.
Sous charge, les ventilateurs sont flexibles et réactifs, ce qui signifie qu'ils se calment rapidement après une charge, mais qu'ils montent aussi rapidement en régime même sous des charges moyennes telles que 3DMark06. En charge maximale et en jouant, nous avons mesuré plus de 56 dB en mode Performance, ce qui est assez bruyant en comparaison. En mode Extrême, nous avons même dépassé les 58 dB. Le SCHENKER XMG Pro 16 (E25) ou encore le MSI Vector 16 sont nettement plus silencieux. Les créateurs de contenu sont plus enclins à passer en mode équilibré, ce qui se traduit toutefois par des performances inférieures de 13 (CPU) à 22 % (GPU).
Degré de la nuisance sonore
| Au repos |
| 24 / 24 / 30.9 dB(A) |
| Fortement sollicité |
| 55.9 / 56.72 dB(A) |
 | ||
30 dB silencieux 40 dB(A) audible 50 dB(A) bruyant |
||
min: | ||
| Lenovo Legion 5 Pro 16IAX10H GeForce RTX 5070 Ti Laptop, Ultra 9 275HX, Western Digital PC SN8000S SDEPNRK-1T00 | Lenovo Legion Pro 5 16IRX9 GeForce RTX 4070 Laptop GPU, i9-14900HX, Samsung PM9A1 MZVL21T0HCLR | Schenker XMG Pro 16 (E25) GeForce RTX 5070 Ti Laptop, Ultra 9 275HX, Samsung 9100 Pro 1 TB | MSI Vector 16 HX AI A2XWHG GeForce RTX 5070 Ti Laptop, Ultra 7 255HX, Micron 2400 MTFDKBA512QFM | MSI Vector A18 HX A9W GeForce RTX 5070 Ti Laptop, R9 9955HX | Lenovo Legion Pro 7i 16 Gen 10 GeForce RTX 5080 Laptop, Ultra 9 275HX, SK Hynix HFS001TEJ9X115N | |
|---|---|---|---|---|---|---|
| Noise | 4% | 6% | -8% | 1% | 13% | |
| arrêt / environnement * (dB) | 24 | 23.9 -0% | 23.3 3% | 25 -4% | 22.5 6% | 22.9 5% |
| Idle Minimum * (dB) | 24 | 24.3 -1% | 25 -4% | 33 -38% | 26 -8% | 22.9 5% |
| Idle Average * (dB) | 24 | 24.3 -1% | 25 -4% | 34 -42% | 26 -8% | 22.9 5% |
| Idle Maximum * (dB) | 30.9 | 28.9 6% | 25 19% | 38 -23% | 32 -4% | 26.3 15% |
| Load Average * (dB) | 55.9 | 45.8 18% | 45.5 19% | 46 18% | 44.4 21% | 27.8 50% |
| Cyberpunk 2077 ultra * (dB) | 56.72 | 53.3 6% | 47 17% | 49.8 12% | 54.2 4% | |
| Load Maximum * (dB) | 56.72 | 56.6 -0% | 53.3 6% | 49 14% | 61.6 -9% | 53.9 5% |
| Witcher 3 ultra * (dB) | 51 |
* ... Moindre est la valeur, meilleures sont les performances
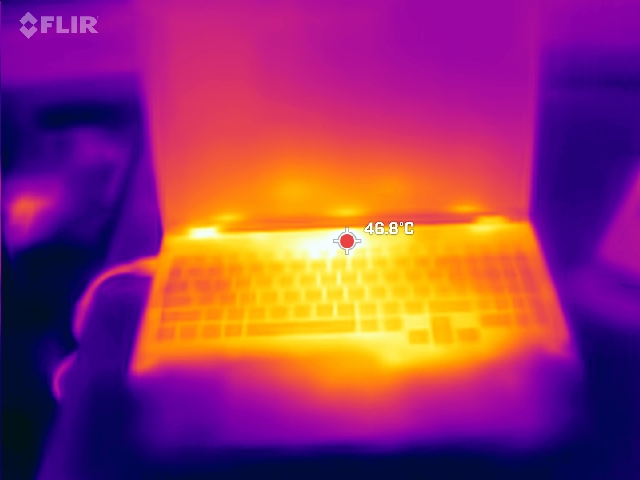
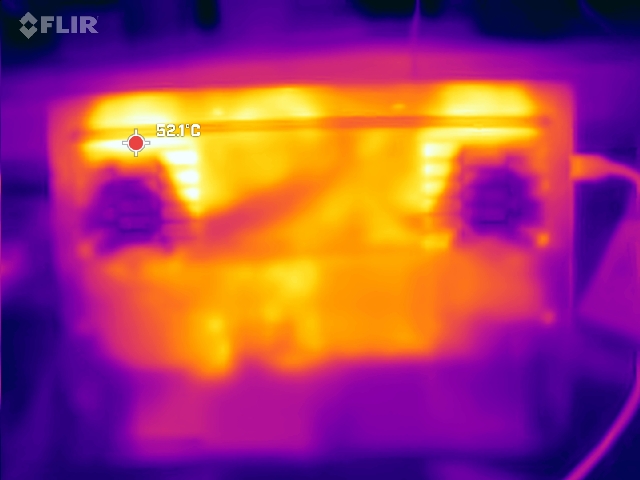
Température
En cas de forte charge, les températures de surface peuvent atteindre environ 50°C, en particulier sur le dessous de l'appareil, tandis que les touches WASD restent relativement froides (jusqu'à 39°C). Les ventilateurs semblent refroidir de manière beaucoup plus homogène que leur prédécesseur.
(-) La température maximale du côté supérieur est de 48 °C / 118 F, par rapport à la moyenne de 40.4 °C / 105 F, allant de 21.2 à 68.8 °C pour la classe Gaming.
(-) Le fond chauffe jusqu'à un maximum de 50 °C / 122 F, contre une moyenne de 43.2 °C / 110 F
(±) En utilisation inactive, la température moyenne du côté supérieur est de 33.6 °C / 92 F, par rapport à la moyenne du dispositif de 33.9 °C / 93 F.
(-) 3: The average temperature for the upper side is 38.2 °C / 101 F, compared to the average of 33.9 °C / 93 F for the class Gaming.
(±) Les repose-poignets et le pavé tactile peuvent devenir très chauds au toucher, avec un maximum de 37 °C / 98.6# F.
(-) La température moyenne de la zone de l'appui-paume de dispositifs similaires était de 28.8 °C / 83.8 F (-8.2 °C / #-14.8 F).
| Lenovo Legion 5 Pro 16IAX10H Intel Core Ultra 9 275HX, NVIDIA GeForce RTX 5070 Ti Laptop | Lenovo Legion Pro 5 16IRX9 Intel Core i9-14900HX, NVIDIA GeForce RTX 4070 Laptop GPU | Schenker XMG Pro 16 (E25) Intel Core Ultra 9 275HX, NVIDIA GeForce RTX 5070 Ti Laptop | Medion Erazer Major 16 X1 MD62736 Intel Core Ultra 7 255HX, NVIDIA GeForce RTX 5070 Ti Laptop | MSI Vector 16 HX AI A2XWHG Intel Core Ultra 7 255HX, NVIDIA GeForce RTX 5070 Ti Laptop | MSI Vector A18 HX A9W AMD Ryzen 9 9955HX, NVIDIA GeForce RTX 5070 Ti Laptop | Lenovo Legion Pro 7i 16 Gen 10 Intel Core Ultra 9 275HX, NVIDIA GeForce RTX 5080 Laptop | |
|---|---|---|---|---|---|---|---|
| Heat | 7% | -121% | 4% | 8% | 16% | 17% | |
| Maximum Upper Side * (°C) | 48 | 43.8 9% | 43.2 10% | 49 -2% | 53 -10% | 46.6 3% | 42.6 11% |
| Maximum Bottom * (°C) | 50 | 55.4 -11% | 46 8% | 50 -0% | 52 -4% | 45.6 9% | 41.2 18% |
| Idle Upper Side * (°C) | 38 | 32.8 14% | 27.7 27% | 36 5% | 33 13% | 31.2 18% | 32.6 14% |
| Idle Bottom * (°C) | 42 | 36 14% | 264 -529% | 37 12% | 29 31% | 28.6 32% | 32.4 23% |
* ... Moindre est la valeur, meilleures sont les performances
Épreuve d'effort
Les cœurs de l'unité centrale ont brièvement commencé le test de stress d'une heure à 4,1 GHz (195 W). Le CPU a dépassé le seuil de température de 100°C, après quoi la vitesse d'horloge et la consommation d'énergie ont chuté à environ 2,3 GHz et 60 W, respectivement, puis sont restées relativement constantes. La température s'est ensuite stabilisée autour de 82°C.
Pendant ce temps, la vitesse d'horloge du GPU a fluctué approximativement entre 2,2 et 2,5 GHz, tandis que la vitesse d'horloge de la mémoire a fait des sauts plus importants entre 1,1 et 1,8 GHz. La température était d'environ 85°C, et le GPU tirait environ 125 W de l'alimentation.
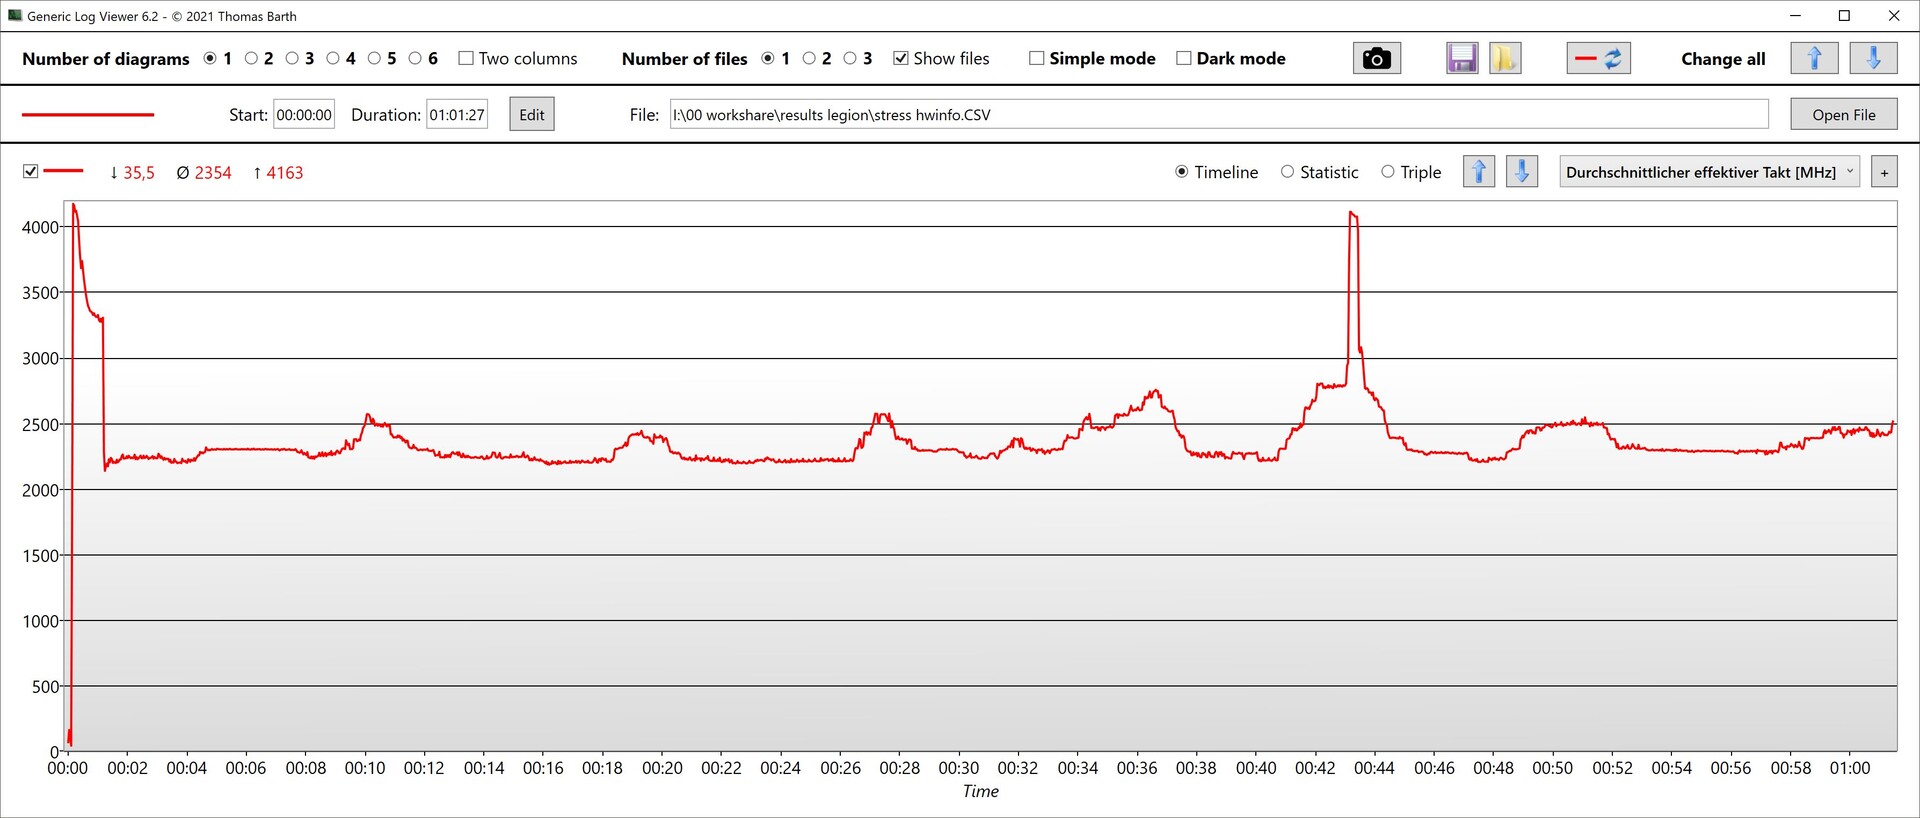
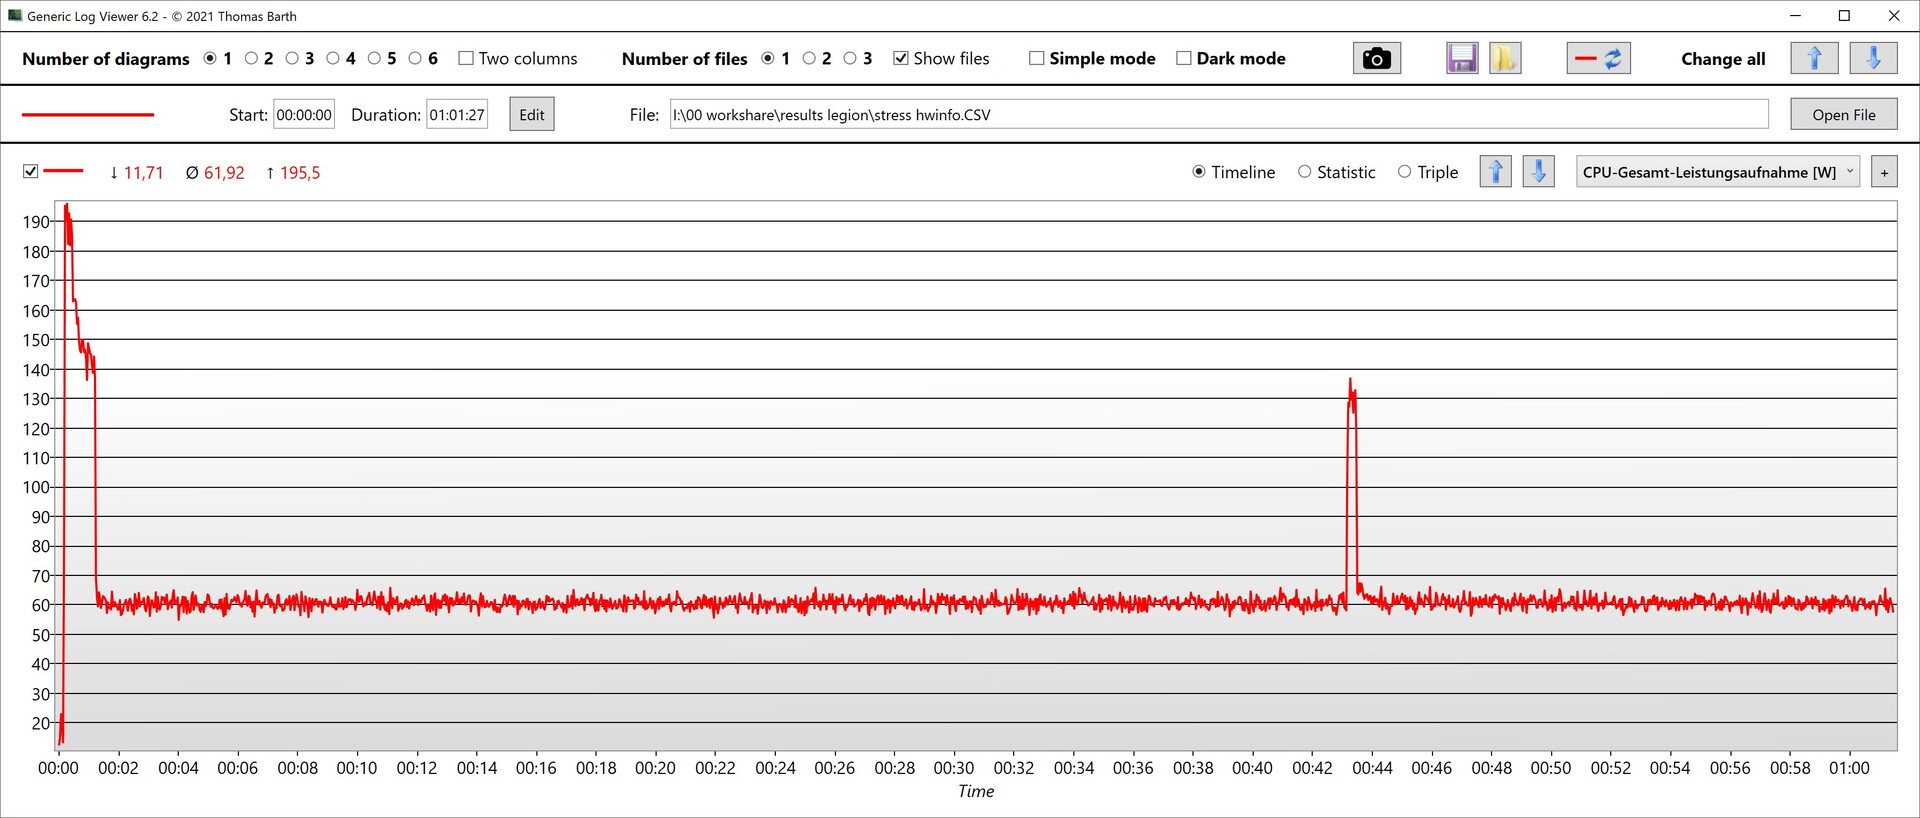

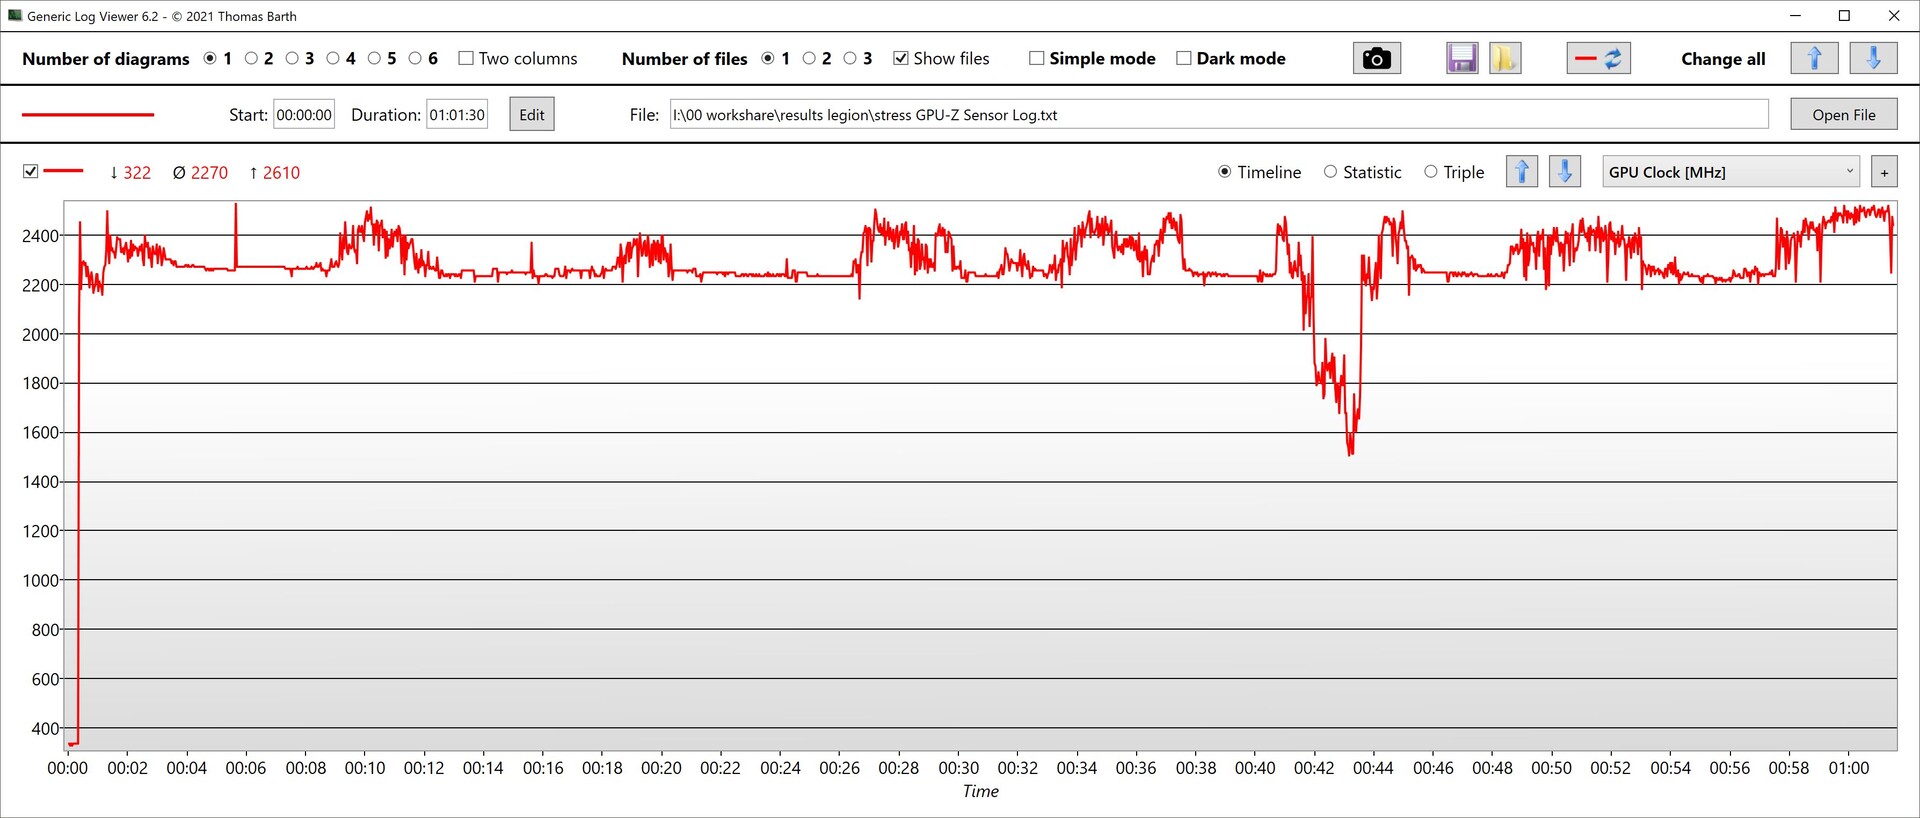
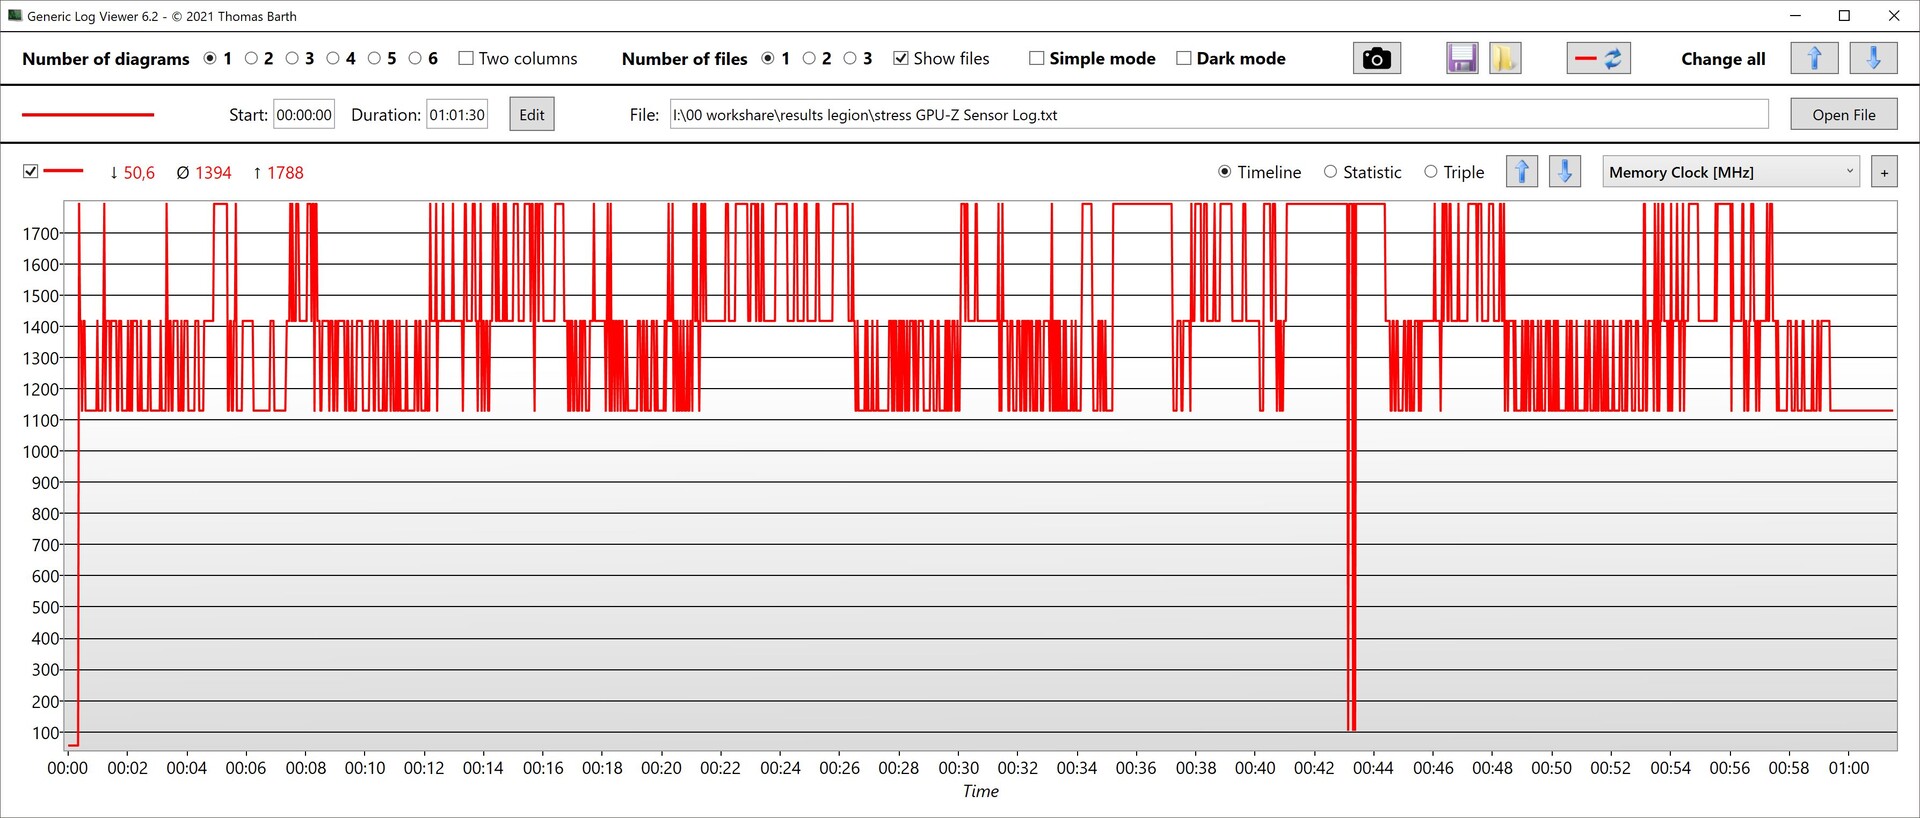
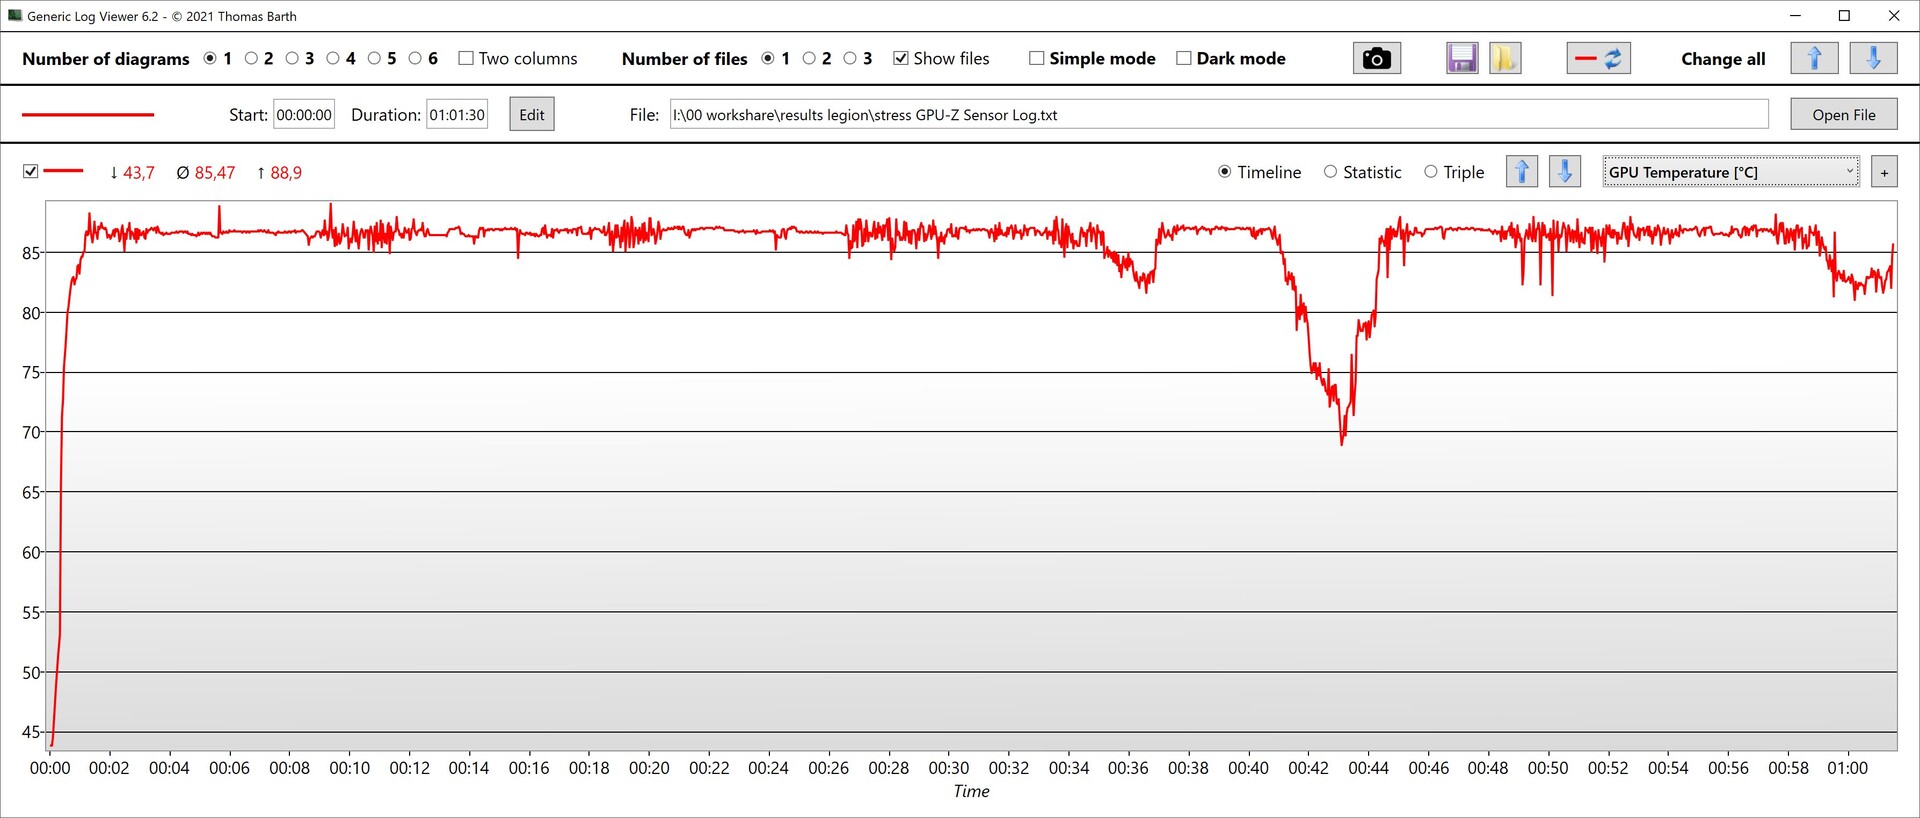
| Horloge du CPU (GHz) | Horloge du GPU (MHz) | Température moyenne du CPU (°C) | Température moyenne du GPU (°C) | |
| Prime95 + FurMark Stress | 2 354 | 2270 | 82 | 85 |
| Cyberpunk 2077 Stress | 1 862 | 2572 | 83 | 86 |
Intervenants
Les deux haut-parleurs stéréo sont plutôt fonctionnels, offrant des aigus équilibrés, mais ne sont pas particulièrement puissants et manquent de basses. Une prise casque est disponible pour connecter des écouteurs et d'autres appareils audio analogiques.
Lenovo Legion 5 Pro 16IAX10H analyse audio
(±) | le niveau sonore du haut-parleur est moyen mais bon (78.2# dB)
Basses 100 - 315 Hz
(-) | presque aucune basse - en moyenne 21.1% plus bas que la médiane
(±) | la linéarité des basses est moyenne (8% delta à la fréquence précédente)
Médiums 400 - 2000 Hz
(±) | médiane supérieure - en moyenne 6.3% supérieure à la médiane
(+) | les médiums sont linéaires (6.5% delta à la fréquence précédente)
Aiguës 2 - 16 kHz
(+) | des sommets équilibrés - à seulement 1.6% de la médiane
(+) | les aigus sont linéaires (4.9% delta à la fréquence précédente)
Globalement 100 - 16 000 Hz
(±) | la linéarité du son global est moyenne (18.3% de différence avec la médiane)
Par rapport à la même classe
» 58% de tous les appareils testés de cette catégorie étaient meilleurs, 9% similaires, 33% pires
» Le meilleur avait un delta de 6%, la moyenne était de 18%, le pire était de 132%.
Par rapport à tous les appareils testés
» 40% de tous les appareils testés étaient meilleurs, 8% similaires, 52% pires
» Le meilleur avait un delta de 4%, la moyenne était de 24%, le pire était de 134%.
Schenker XMG Pro 16 (E25) analyse audio
(±) | le niveau sonore du haut-parleur est moyen mais bon (79.2# dB)
Basses 100 - 315 Hz
(±) | basse réduite - en moyenne 14.2% inférieure à la médiane
(±) | la linéarité des basses est moyenne (10.6% delta à la fréquence précédente)
Médiums 400 - 2000 Hz
(±) | médiane supérieure - en moyenne 8.2% supérieure à la médiane
(±) | la linéarité des médiums est moyenne (9.9% delta à la fréquence précédente)
Aiguës 2 - 16 kHz
(+) | des sommets équilibrés - à seulement 3.8% de la médiane
(+) | les aigus sont linéaires (5.9% delta à la fréquence précédente)
Globalement 100 - 16 000 Hz
(±) | la linéarité du son global est moyenne (18.5% de différence avec la médiane)
Par rapport à la même classe
» 60% de tous les appareils testés de cette catégorie étaient meilleurs, 8% similaires, 32% pires
» Le meilleur avait un delta de 6%, la moyenne était de 18%, le pire était de 132%.
Par rapport à tous les appareils testés
» 41% de tous les appareils testés étaient meilleurs, 8% similaires, 51% pires
» Le meilleur avait un delta de 4%, la moyenne était de 24%, le pire était de 134%.
Gestion de l'énergie - La batterie pourrait être plus grande
Consommation électrique
Idéalement, le Legion Pro 5 consomme très peu d'énergie lorsqu'il tourne au ralenti. Cependant, il y a des sauts répétés vers le haut sur une période plus longue. C'est un domaine dans lequel la plupart des ordinateurs portables RTX 5000 sont encore confrontés à une consommation excessive au ralenti. Avec un moniteur externe connecté à la sortie HDMI, le dGPU est actif.
Dans les jeux, il est évident que le Legion Pro 5 consomme un peu plus d'énergie que la plupart de ses concurrents, compte tenu de ses performances élevées. Cependant, la différence est assez faible, et le MSI Vector 16 HX AI A2XWHG est encore plus gourmand.
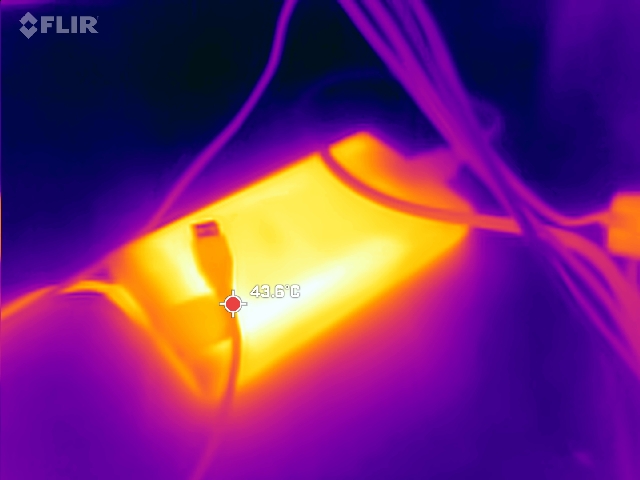
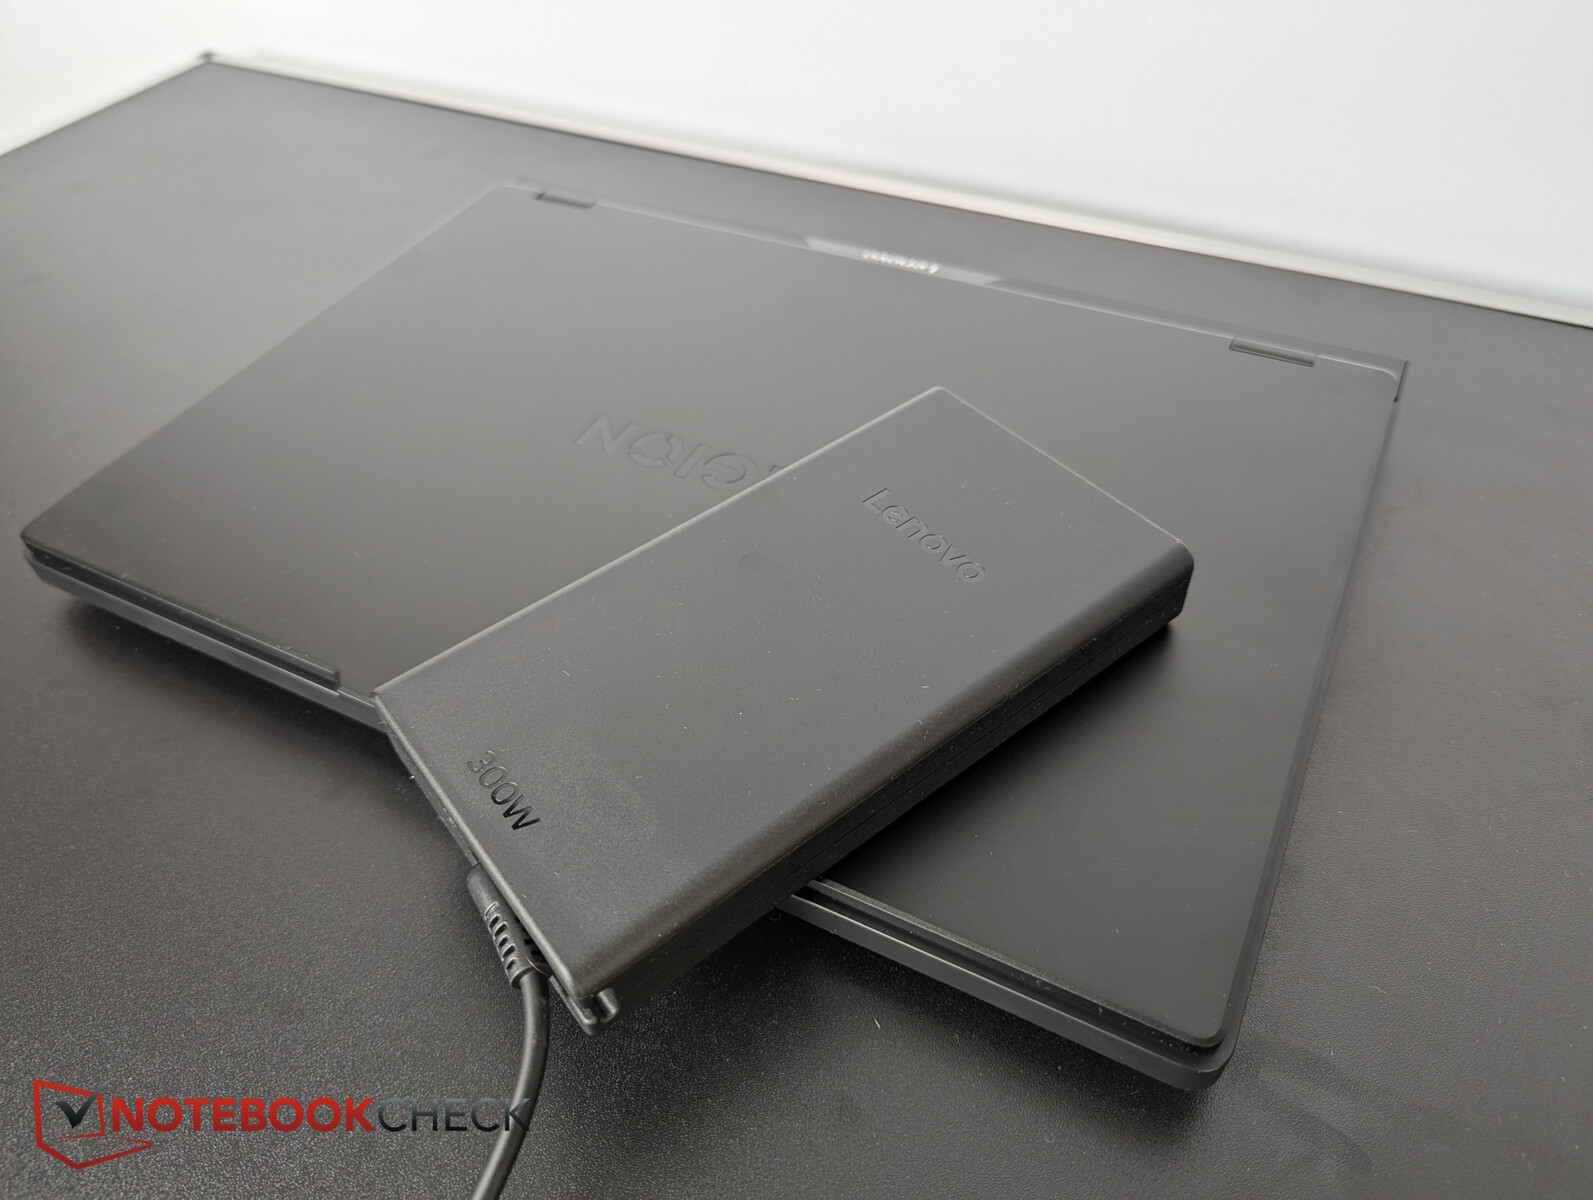
Nous avons mesuré des charges de pointe à court terme allant jusqu'à 294 watts à partir de l'adaptateur d'alimentation Lenovo, à la fois grand et mince. Cet adaptateur est conçu pour une puissance de 300 watts et devrait donc être en mesure de charger l'ordinateur portable correctement, quelle que soit la situation.
| Éteint/en veille | |
| Au repos | |
| Fortement sollicité |
|
Légende:
min: | |
| Lenovo Legion 5 Pro 16IAX10H Ultra 9 275HX, GeForce RTX 5070 Ti Laptop, Western Digital PC SN8000S SDEPNRK-1T00, OLED, 2560x1600, 16" | Lenovo Legion Pro 5 16IRX9 i9-14900HX, GeForce RTX 4070 Laptop GPU, Samsung PM9A1 MZVL21T0HCLR, IPS, 2560x1600, 16" | Schenker XMG Pro 16 (E25) Ultra 9 275HX, GeForce RTX 5070 Ti Laptop, Samsung 9100 Pro 1 TB, IPS, 2560x1600, 16" | Medion Erazer Major 16 X1 MD62736 Ultra 7 255HX, GeForce RTX 5070 Ti Laptop, Phison E31 2 TB, IPS, 2560x1600, 16" | MSI Vector 16 HX AI A2XWHG Ultra 7 255HX, GeForce RTX 5070 Ti Laptop, Micron 2400 MTFDKBA512QFM, IPS, 2560x1600, 16" | MSI Vector A18 HX A9W R9 9955HX, GeForce RTX 5070 Ti Laptop, , IPS, 2560x1600, 18" | Lenovo Legion Pro 7i 16 Gen 10 Ultra 9 275HX, GeForce RTX 5080 Laptop, SK Hynix HFS001TEJ9X115N, OLED, 2560x1600, 16" | Moyenne NVIDIA GeForce RTX 5070 Ti Laptop | Moyenne de la classe Gaming | |
|---|---|---|---|---|---|---|---|---|---|
| Power Consumption | -9% | 8% | -5% | 5% | -71% | -65% | -3% | 2% | |
| Idle Minimum * (Watt) | 14 | 12.5 11% | 11.7 16% | 17.8 -27% | 7.1 49% | 20.8 -49% | 28.5 -104% | 12.4 ? 11% | 13 ? 7% |
| Idle Average * (Watt) | 14.3 | 24.6 -72% | 16.6 -16% | 20.7 -45% | 15.9 -11% | 52.8 -269% | 38.8 -171% | 19.7 ? -38% | 18.7 ? -31% |
| Idle Maximum * (Watt) | 20.1 | 24.8 -23% | 17.1 15% | 23.4 -16% | 29.5 -47% | 54.5 -171% | 45.6 -127% | 24.9 ? -24% | 24.3 ? -21% |
| Load Average * (Watt) | 177 | 109.6 38% | 122.4 31% | 110 38% | 124 30% | 146.6 17% | 132.2 25% | 123.6 ? 30% | 108.2 ? 39% |
| Cyberpunk 2077 ultra * (Watt) | 255 | 245 4% | 233 9% | 222 13% | 285 -12% | 318 -25% | |||
| Cyberpunk 2077 ultra external monitor * (Watt) | 255 | 241 5% | 232 9% | 217 15% | 278 -9% | 319 -25% | |||
| Load Maximum * (Watt) | 294 | 284.9 3% | 291.5 1% | 297 -1% | 336 -14% | 297.3 -1% | 384 -31% | 272 ? 7% | 254 ? 14% |
| Witcher 3 ultra * (Watt) | 218 |
* ... Moindre est la valeur, meilleures sont les performances
Power consumption Cyberpunk / stress test
Power consumption with an external monitor
Durée de vie de la batterie
Malheureusement, si vous débranchez le Legion Pro 5, la fréquence de rafraîchissement de l'OLED ne passe pas automatiquement à 60 Hz, plus économe en énergie. En passant manuellement à 60 Hz, vous obtenez une autonomie de près de 5 heures pour la vidéo et le Wi-Fi, avec une luminosité réduite à 150 nits. La batterie de 80 Wh est souvent dépassée par les concurrents qui ont une batterie de 90 Wh ou plus.
| Lenovo Legion 5 Pro 16IAX10H Ultra 9 275HX, GeForce RTX 5070 Ti Laptop, 80 Wh | Lenovo Legion Pro 5 16IRX9 i9-14900HX, GeForce RTX 4070 Laptop GPU, 80 Wh | Schenker XMG Pro 16 (E25) Ultra 9 275HX, GeForce RTX 5070 Ti Laptop, 99.8 Wh | Medion Erazer Major 16 X1 MD62736 Ultra 7 255HX, GeForce RTX 5070 Ti Laptop, 80 Wh | MSI Vector 16 HX AI A2XWHG Ultra 7 255HX, GeForce RTX 5070 Ti Laptop, 90 Wh | Asus ROG Zephyrus G16 2025 5070 Ti Ultra 9 285H, GeForce RTX 5070 Ti Laptop, 90 Wh | Alienware 16 Area-51 Ultra 9 275HX, GeForce RTX 5080 Laptop, 96 Wh | Lenovo Legion Pro 7i 16 Gen 10 Ultra 9 275HX, GeForce RTX 5080 Laptop, 99 Wh | Moyenne de la classe Gaming | |
|---|---|---|---|---|---|---|---|---|---|
| Autonomie de la batterie | -19% | 86% | 29% | 43% | -43% | -22% | 39% | ||
| H.264 (h) | 4.8 | 8.9 ? 85% | |||||||
| WiFi v1.3 (h) | 4.9 | 4.8 -2% | 9.1 86% | 6.3 29% | 7 43% | 2.8 -43% | 5.4 10% | 7 ? 43% | |
| Load (h) | 1.7 | 1.1 -35% | 0.8 -53% | 1.51 ? -11% | |||||
| Reader / Idle (h) | 6.7 | 3.1 | 8.71 ? |
Notebookcheck note globale
En matière de jeu, la Legion Pro 5, avec sa RTX 5070 Ti et son OLED brillant, fait preuve de muscles, mais pour les créateurs de contenu, la Legion 5 risque d'être un peu trop bruyante.
Lenovo Legion 5 Pro 16IAX10H
- 06/24/2025 v8
Christian Hintze
 Total Sustainability Score:
 Comparaison des alternatives possibles
Transparency
La sélection des appareils à examiner est effectuée par notre équipe éditoriale. L'échantillon de test a été prêté à l'auteur par le fabricant ou le détaillant pour les besoins de cet examen. Le prêteur n'a pas eu d'influence sur cette évaluation et le fabricant n'a pas reçu de copie de cette évaluation avant sa publication. Il n'y avait aucune obligation de publier cet article. En tant que média indépendant, Notebookcheck n'est pas soumis à l'autorité des fabricants, des détaillants ou des éditeurs.
Voici comment Notebookcheck teste
Chaque année, Notebookcheck examine de manière indépendante des centaines d'ordinateurs portables et de smartphones en utilisant des procédures standardisées afin de garantir que tous les résultats sont comparables. Nous avons continuellement développé nos méthodes de test depuis environ 20 ans et avons établi des normes industrielles dans le processus. Dans nos laboratoires de test, des équipements de mesure de haute qualité sont utilisés par des techniciens et des rédacteurs expérimentés. Ces tests impliquent un processus de validation en plusieurs étapes. Notre système d'évaluation complexe repose sur des centaines de mesures et de points de référence bien fondés, ce qui garantit l'objectivité.
