Testés dans les ordinateurs portables : NVIDIA GeForce RTX 5070 Ti Laptop carte graphique
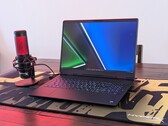
Test de l'Asus ROG Zephyrus G14 2026 : un des meilleurs PC portables multimédia s'équipe d'un écran OLED plus lumineux
Asus a opté pour des processeurs Intel sur le nouveau ROG Zephyrus G14 et, équipé de la carte graphique RTX 5070 Ti d'GeForce, il reste l'un des ordinateurs portables 14 pouces les plus puissants du marché. Vous bénéficiez également d’un écran OLED 120 Hz amélioré, qui atteint désormais des niveaux de luminosité supérieurs à 1 000 nits.
Intel Core Ultra 9 386H, NVIDIA GeForce RTX 5070 Ti Laptop, 14", 1.6 kgTest de l'Alienware 16X Aurora 2026 : de nouvelles fonctionnalités pour un prix plus élevé
Le 16X Aurora peut maintenant être configuré avec des caractéristiques plus sophistiquées comme l'OLED et la GeForce RTX 5070 Ti. Cependant, préparez-vous à payer plus de 3 000 $ pour cet ordinateur portable de jeu de milieu de gamme.
Intel Core Ultra 9 290HX Plus, NVIDIA GeForce RTX 5070 Ti Laptop, 16", 2.6 kgTest du Gigabyte Gaming A18 Pro : jouer sans compromis avec grand écran
Malgré son design relativement fin, le Gigabyte Gaming A18 Pro est l'un des plus gros ordinateurs portables de jeu du marché. Nous avons testé une configuration équipée d'un Core 7 240H et d'une GeForce RTX 5070 Ti pour voir comment il se positionne par rapport à la concurrence. Le concurrent de Gigabyte peut-il tenir la route ?
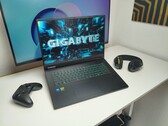
Intel Core 7 240H, NVIDIA GeForce RTX 5070 Ti Laptop, 18", 2.9 kgTest du Gigabyte Gaming A16 Pro : La RTX 5070 Ti rencontre un châssis fin et des priorités inhabituelles
Avec un Core 7 240H, une RTX 5070 Ti et un écran lumineux de 165 Hz, l'A16 Pro ressemble sur le papier à un ordinateur portable gaming typique de milieu et de haut de gamme. Mais malgré l'étiquette "gaming", cet ordinateur portable de 23 mm d'épaisseur semble viser un public différent.
Intel Core 7 240H, NVIDIA GeForce RTX 5070 Ti Laptop, 16", 2.4 kgTest du XMG Apex 16 Max : Ryzen 9 9955HX, RTX 5070 Ti et mini LED pour ce PC portable de jeu
Avec l'Apex 16 Max, XMG propose un ordinateur portable de jeu équipé de la GeForce RTX 5070 Ti, d'un processeur AMD Fire Range HX rapide et d'un écran Mini-LED de 300 Hz. Si les performances de jeu sont excellentes, l'autonomie de la batterie est malheureusement très limitée.
AMD Ryzen 9 9955HX, NVIDIA GeForce RTX 5070 Ti Laptop, 16", 2.7 kgAcer Predator Helios Neo 16S AI PHN16S-71-94L9: Intel Core Ultra 9 275HX, 16.00", 2.2 kg
Critique » Test de l'Acer Predator Helios Neo 16S AI : étoile filante ou flop ?
Schenker XMG Focus 17 M25: Intel Core i9-13900HX, 17.30", 2.8 kg
Critique » Test du XMG Focus 17 M25 : le GPU pour PC portable Nvidia RTX 5070 Ti le moins cher
Chuwi Gamebook, R9 9955HX: AMD Ryzen 9 9955HX, 16.00", 2.5 kg
Critique » Test du Chuwi Gamebook : PC de jeu avec Ryzen 9955HX et GPU RTX 5070 Ti pour PC portable
Medion Erazer Major 16 X1 MD62736: Intel Core Ultra 7 255HX, 16.00", 2.5 kg
Critique » Test du Medion Erazer Major 16 X1 : PC portable de jeu avec une RTX 5070 Ti optimisée
Lenovo Legion 5 Pro 16IAX10H: Intel Core Ultra 9 275HX, 16.00", 2.4 kg
Critique » Test du Lenovo Legion Pro 5 16IAX10H OLED : le joueur RTX 5070 Ti le plus puissant à ce jour
MSI Vector 16 HX AI A2XWHG: Intel Core Ultra 7 255HX, 16.00", 2.6 kg
Critique » Test du MSI Vector 16 HX AI : PC portable de jeu riche en fonctionnalités avec RTX 5070 Ti
Asus ROG Zephyrus G16 2025 5070 Ti: Intel Core Ultra 9 285H, 16.00", 1.9 kg
Critique » Test de l'Asus ROG Zephyrus G16 2025 : le PC portable de jeu fin avec RTX 5070 Ti impressionne
Asus ROG Zephyrus G14 2025 5070 Ti: AMD Ryzen AI 9 HX 370, 14.00", 1.6 kg
Critique » Test de l'Asus ROG Zephyrus G14 2025 : un PC RTX 5070 Ti presque aussi rapide qu'un PC RTX 5080
MSI Vector A18 HX A9W: AMD Ryzen 9 9955HX, 18.00", 3.5 kg
Critique » Test du MSI Vector A18 HX A9W : la GeForce RTX 5070 Ti représente la voie à suivre
Schenker XMG Pro 16 (E25): Intel Core Ultra 9 275HX, 16.00", 2.5 kg
Critique » Test du XMG Pro 16 (E25) : RTX 5070 Ti et RAM 128 Go pour un PC jeu / station de travail
Schenker XMG Pro 16 (E25) Engineering Sample: Intel Core Ultra 9 275HX
Critique » Test de la Nvidia GeForce RTX 5070 Ti : haut de gamme avec seulement 12 Go de VRAM ?
MSI Stealth 16 AI+ B3WH: Intel Core Ultra 9 386H, 16.00", 2 kg
Autres tests » MSI Stealth 16 AI+ B3WH - Tests et Caractéristiques
Alienware 16X Aurora Core Ultra 9 290HX Plus: Intel Core Ultra 9 290HX Plus, 16.00", 2.6 kg
Autres tests » Alienware 16X Aurora Core Ultra 9 290HX Plus
Asus ROG Zephyrus G14 GU405AR: Intel Core Ultra 9 386H, 14.00", 1.6 kg
Autres tests » Asus ROG Zephyrus G14 GU405AR
Gigabyte Gaming A18 Pro: Intel Core 7 240H, 18.00", 2.9 kg
Autres tests » Gigabyte Gaming A18 Pro
Medion Erazer Major 16 X1 MD62736: Intel Core Ultra 7 255HX, 16.00", 2.5 kg
Autres tests » Medion Erazer Major 16 X1 MD62736
Asus ROG Strix G16 G615LR, Core 7 255HX: Intel Core Ultra 7 255HX, 16.00", 2.7 kg
Autres tests » Asus ROG Strix G16 G615LR, Core 7 255HX
MSI Vector A16 HX A8W: AMD Ryzen 9 7945HX, 16.00", 2.7 kg
Autres tests » MSI Vector A16 HX A8W
Razer Blade 16 2025, RTX 5070 Ti: AMD Ryzen AI 9 365, 16.00", 2.1 kg
Autres tests » Razer Blade 16 2025, RTX 5070 Ti
HP Omen Max 16-ah0000: Intel Core Ultra 9 275HX, 16.00", 2.7 kg
Autres tests » HP Omen Max 16-ah0000
Acer Predator Helios Neo 16 AI PHN16-73: Intel Core Ultra 9 275HX, 16.00", 2.7 kg
Autres tests » Acer Predator Helios Neo 16 AI PHN16-73
Asus ROG Strix G18 G815LR: Intel Core Ultra 9 275HX, 18.00", 3.2 kg
Autres tests » Asus ROG Strix G18 G815LR
Alienware 16 Area-51, RTX 5070 Ti: Intel Core Ultra 9 275HX, 16.00", 3.4 kg
Autres tests » Alienware 16 Area-51, RTX 5070 Ti
Lenovo Legion Pro 5 16IAX10, RTX 5070 Ti: Intel Core Ultra 9 275HX, 16.00", 2.4 kg
Autres tests » Lenovo Legion Pro 5 16IAX10, RTX 5070 Ti
Asus ROG Zephyrus G16 2025 5070 Ti: Intel Core Ultra 9 285H, 16.00", 1.9 kg
Autres tests » Asus ROG Zephyrus G16 2025 5070 Ti
Chuwi Gamebook, R9 9955HX: AMD Ryzen 9 9955HX, 16.00", 2.5 kg
Autres tests » Chuwi Gamebook, R9 9955HX
Asus ROG Zephyrus G16 GU605CR: Intel Core Ultra 9 285H, 16.00", 2 kg
Autres tests » Asus ROG Zephyrus G16 GU605CR
Asus ROG Strix G16 G615LR: Intel Core Ultra 9 275HX, 16.00", 2.7 kg
Autres tests » Asus ROG Strix G16 G615LR
Asus ROG Zephyrus G14 2025 5070 Ti: AMD Ryzen AI 9 HX 370, 14.00", 1.6 kg
Autres tests » Asus ROG Zephyrus G14 2025 5070 Ti
MSI Vector 16 HX AI A2XWHG, Ultra 9 275HX: Intel Core Ultra 9 275HX, 16.00", 2.7 kg
Autres tests » MSI Vector 16 HX AI A2XWHG, Ultra 9 275HX
Asus ROG Strix G16 G614FR: AMD Ryzen 9 9955HX3D, 16.00", 2.5 kg
Autres tests » Asus ROG Strix G16 G614FR
MSI Stealth A18 AI+ A3XWHG: AMD Ryzen AI 9 HX 370, 18.00", 2.9 kg
Autres tests » MSI Stealth A18 AI+ A3XWHG
Asus ROG Zephyrus G14 GA403WR: AMD Ryzen AI 9 HX 370, 14.00", 1.6 kg
Autres tests » Asus ROG Zephyrus G14 GA403WR
MSI Vector 16 HX AI A2XWHG: Intel Core Ultra 7 255HX, 16.00", 2.6 kg
Autres tests » MSI Vector 16 HX AI A2XWHG
Acer Predator Helios Neo 18 AI PHN18-72: Intel Core Ultra 9 275HX, 18.00", 3.3 kg
Autres tests » Acer Predator Helios Neo 18 AI PHN18-72
Asus ROG Zephyrus G14 GU405AR: Intel Core Ultra 9 386H, 14.00", 1.6 kg
» Verdict de notre test de l'Asus ROG Zephyrus G14 : un ordinateur polyvalent, puissant et efficace
» Le modèle 2026 de l'Asus ROG Zephyrus G14 est un appareil plus polyvalent, équipé d'un processeur Intel Panther Lake.
» Le ROG Zephyrus G14 2026 constitue une amélioration, mais le modèle 2025, qui coûte 600 $ de moins, reste un très bon choix
» L'Asus ROG Zephyrus G14 2026 reste l'ordinateur portable de jeu 14 pouces le plus puissant grâce à la RTX 5070 Ti
Alienware 16X Aurora Core Ultra 9 290HX Plus: Intel Core Ultra 9 290HX Plus, 16.00", 2.6 kg
» Pourquoi jouer en mode équilibré plutôt qu'en mode performance est intéressant sur l'Alienware 16X Aurora
» 2026 L'Alienware 16X Aurora est si cher qu'il rivalise désormais avec la série Area-51 en termes de prix
» L'Alienware 16X Aurora est enfin livré avec la GeForce RTX 5070 Ti, mais les configurations peuvent être frustrantes
Gigabyte Gaming A16 Pro GA6DH (Core 7 240H, RTX 5070 Ti): Intel Core 7 240H, 16.00", 2.4 kg
» RTX 5070 en moins, RTX 5070 Ti en plus - et soudainement le Gigabyte A16 devient le A16 Pro
» Fin, efficace, durable et abordable - le Gigabyte A16 Pro surprend
» Cet ordinateur portable "pro" a un problème : le Gigabyte A16 Pro à l'épreuve de la réalité
Schenker XMG APEX 16 MAX: AMD Ryzen 9 9955HX, 16.00", 2.7 kg
» XMG Apex 16 Max vs. XMG Pro 16 - RTX 5070 Ti meilleure avec AMD ou Intel ?
» L'Apex 16 Max de XMG avec la GeForce RTX 5070 Ti est entièrement axée sur les performances de jeu
Lenovo Legion Pro 5 16IAX10, RTX 5070 Ti: Intel Core Ultra 9 275HX, 16.00", 2.4 kg
» Plus pour moins : combien de performances perdez-vous vraiment avec l'Ultra 7 au lieu de l'Ultra 9 dans le Legion Pro de Lenovo ?
Schenker XMG Focus 17 M25: Intel Core i9-13900HX, 17.30", 2.8 kg
» Le Focus 17 M25 de XMG avec la RTX 5070 Ti est actuellement l'ordinateur portable de jeu au meilleur rapport qualité-prix
Chuwi Gamebook, R9 9955HX: AMD Ryzen 9 9955HX, 16.00", 2.5 kg
» Chuwi se lance dans le jeu - un puissant ordinateur portable avec AMD Ryzen 9 et GPU Nvidia GeForce RTX 5070 Ti pour ordinateur portable
MSI Vector A18 HX A9W: AMD Ryzen 9 9955HX, 18.00", 3.5 kg
» Voici les ordinateurs portables les plus lents et les plus rapides dotés d'une carte graphique GeForce RTX 5070 actuellement disponibles
Lenovo Legion 5 Pro 16IAX10H: Intel Core Ultra 9 275HX, 16.00", 2.4 kg
» Lenovo Legion Pro 5i 16 vs Legion Pro 7i 16 : nous les avons tous deux examinés
Asus ROG Zephyrus G14 2025 5070 Ti: AMD Ryzen AI 9 HX 370, 14.00", 1.6 kg
» Verdict sur le Asus ROG Zephyrus G16 : puissant, mais toujours plus lent que son petit frère G14
Asus ROG Zephyrus G16 2025 5070 Ti: Intel Core Ultra 9 285H, 16.00", 1.9 kg
» Verdict sur le Asus ROG Zephyrus G16 : puissant, mais toujours plus lent que son petit frère G14
Asus ROG Zephyrus G14 2025 5070 Ti: AMD Ryzen AI 9 HX 370, 14.00", 1.6 kg
» L'Asus ROG Zephyrus G14 est inégalé puisque le Razer Blade 14 est limité à l'ordinateur portable RTX 5070
Schenker XMG Pro 16 (E25): Intel Core Ultra 9 275HX, 16.00", 2.5 kg
» RTX 4080 Laptop performance for RTX 4070 Laptop money - XMG Pro 16 avec le nouveau 5070 Ti Laptop montre de fortes performances dans notre revue