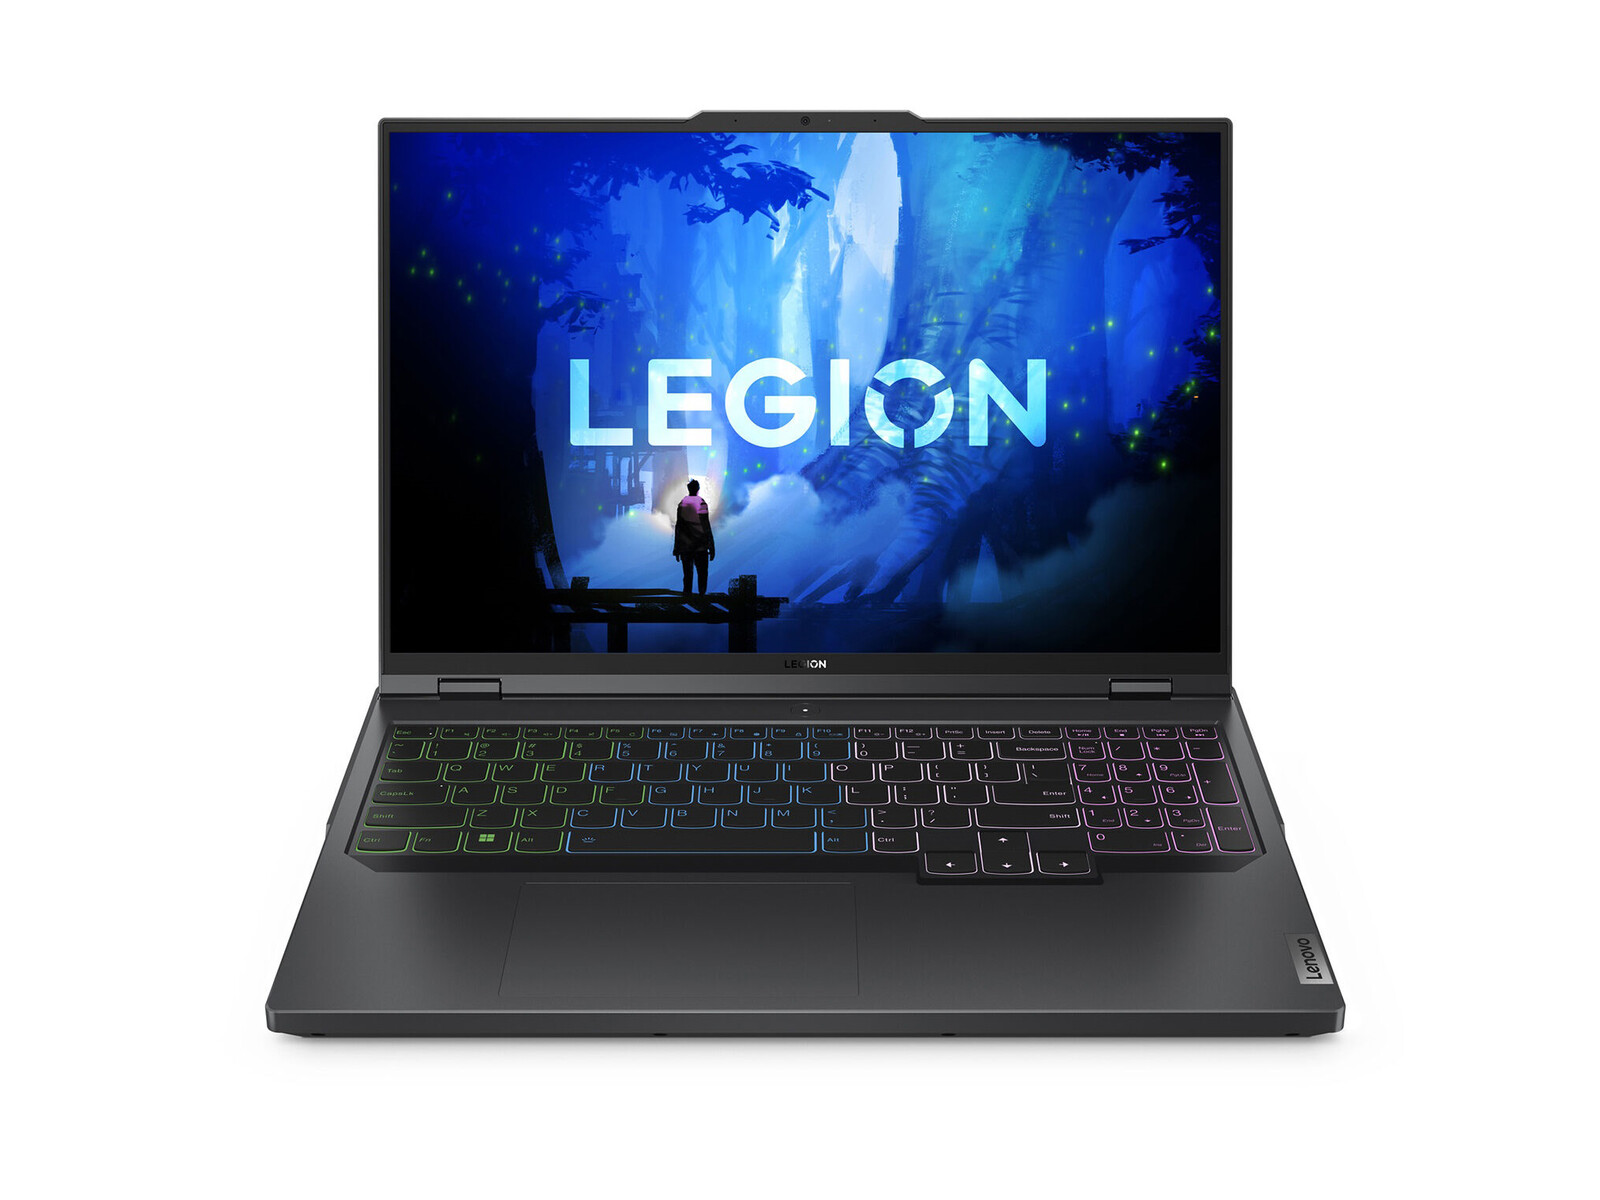
Test du Lenovo Legion Pro 5 16IRX9 : de bonnes performances, mais un peu lourd

A ne pas confondre avec le produit visuellement différent Legion 5 16IRX9le Legion Pro 5 16IRX9 succède directement au Pro 5 16 IRX8 de l'année dernière Legion Pro 5 16 IRX8. Il remplace les CPU Raptor Lake-HX 2023 par la gamme de rafraîchissement Raptor Lake-HX 2024 tout en introduisant de légères modifications visuelles et une nouvelle troisième option d'affichage.
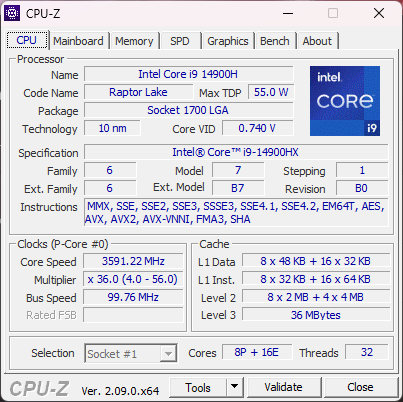
Notre appareil est une configuration haut de gamme avec le CPU Core i9-14900HX, le GPU RTX 4070 de 140 W GeForce et un écran IPS sRGB 1600p 165 Hz pour environ 1900 à 2100 $ au détail. D'autres SKUs commencent avec le Core i5-14500HX et la RTX 4050 avec des couleurs DCI-P3 complètes, mais la résolution native de 1600p est la même pour tout le monde.
Les alternatives au Legion Pro 5 16 IRX9 comprennent d'autres ordinateurs portables de jeu de 16 pouces de milieu de gamme supérieur comme le HP Omen Transcend 16,Asus ROG Zephyrus G16ou le MSI Stealth 16.
Plus de commentaires sur Lenovo :
Comparaison avec les concurrents potentiels
Note | Date | Modèle | Poids | Épaisseur | Taille | Résolution | Prix |
|---|---|---|---|---|---|---|---|
| 89.3 % v7 (old) | 04/24 | Lenovo Legion Pro 5 16IRX9 i9-14900HX, GeForce RTX 4070 Laptop GPU | 2.5 kg | 26.95 mm | 16.00" | 2560x1600 | |
| 87.9 % v7 (old) | 05/23 | Lenovo Legion Pro 5 16IRX8 i7-13700HX, GeForce RTX 4060 Laptop GPU | 2.5 kg | 26.8 mm | 16.00" | 2560x1600 | |
| 90.2 % v7 (old) | 03/24 | Alienware m16 R2 Ultra 7 155H, GeForce RTX 4070 Laptop GPU | 2.5 kg | 23.5 mm | 16.00" | 2560x1600 | |
| 88.4 % v7 (old) | 02/24 | HP Omen Transcend 16-u1095ng i9-14900HX, GeForce RTX 4070 Laptop GPU | 2.3 kg | 20 mm | 16.00" | 2560x1600 | |
| 92.3 % v7 (old) | 02/24 | Asus ROG Zephyrus G16 2024 GU605M Ultra 7 155H, GeForce RTX 4070 Laptop GPU | 1.8 kg | 16.4 mm | 16.00" | 2560x1600 | |
| 89.1 % v7 (old) | 11/23 | MSI Stealth 16 Mercedes-AMG Motorsport A13VG i9-13900H, GeForce RTX 4070 Laptop GPU | 1.9 kg | 20 mm | 16.00" | 3840x2400 |
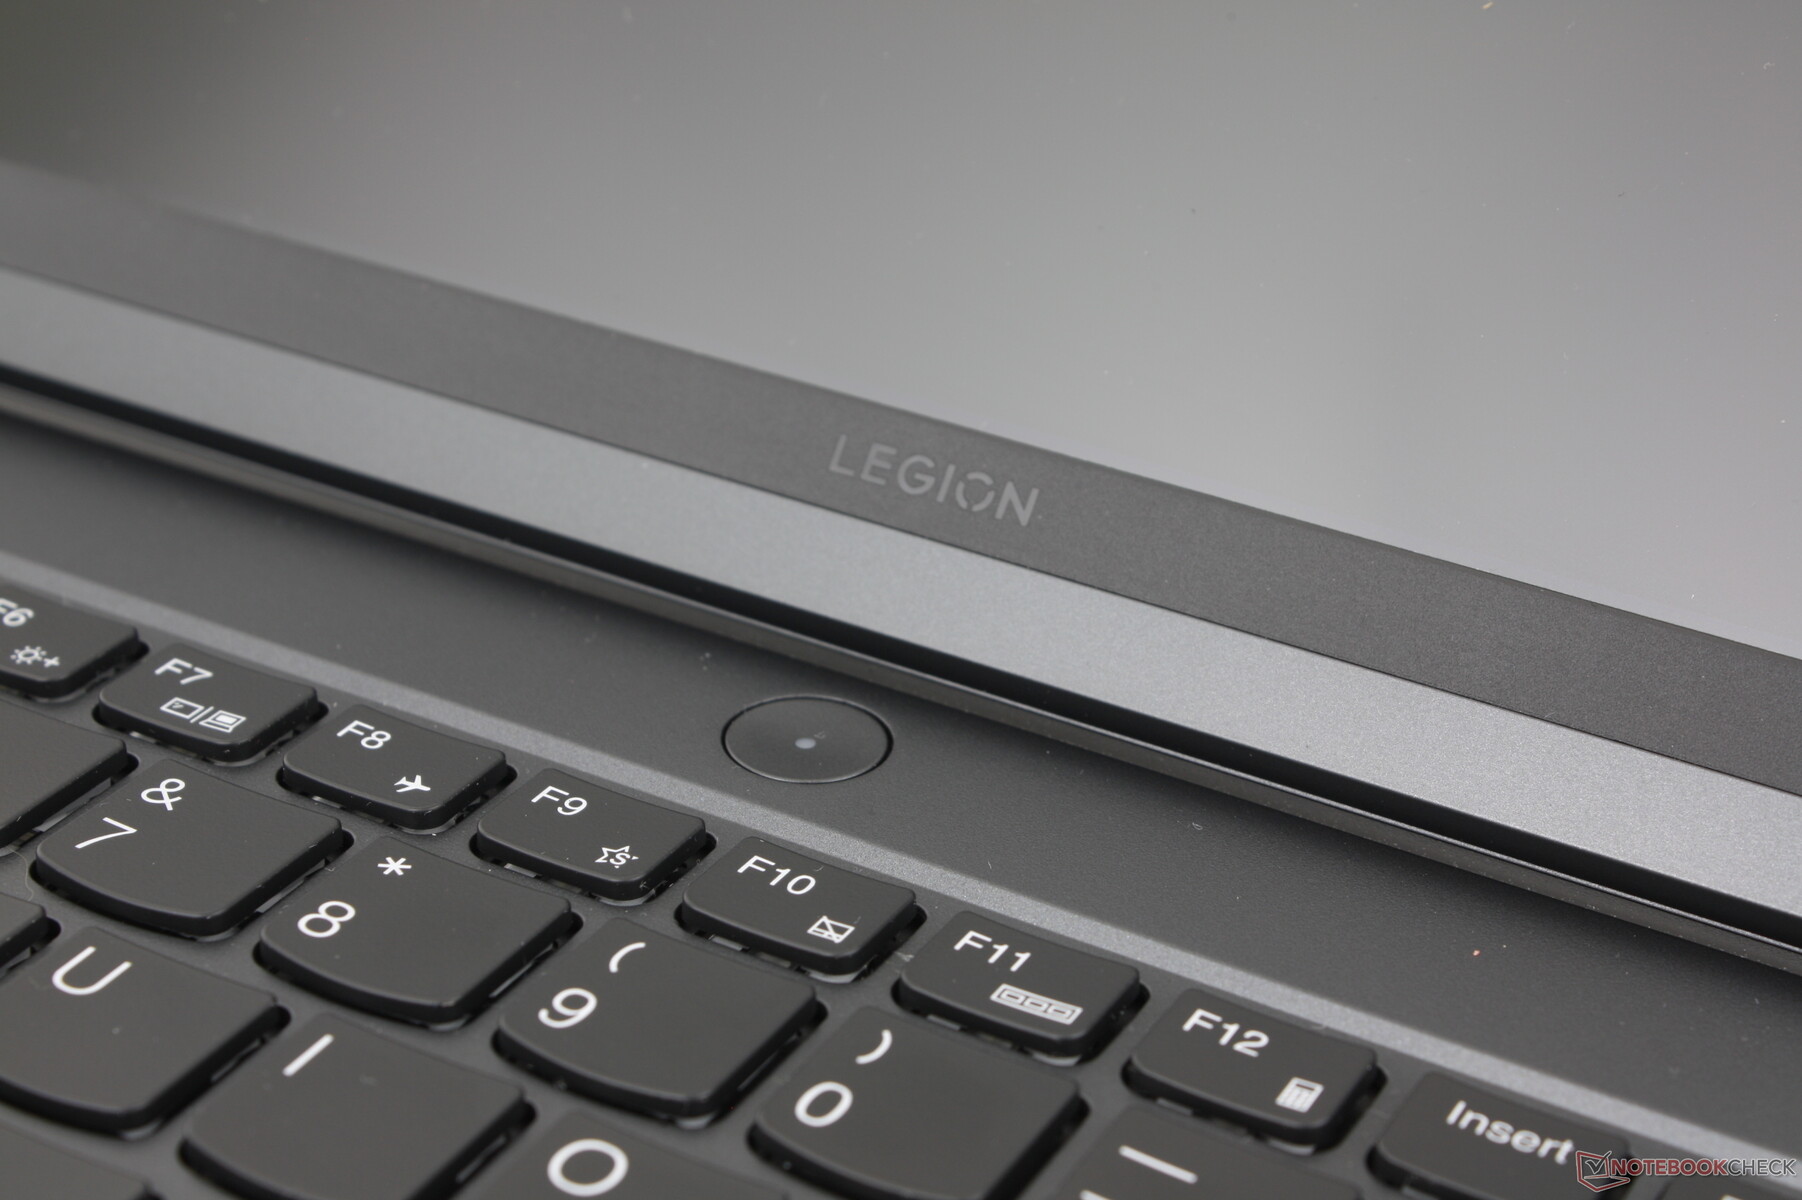
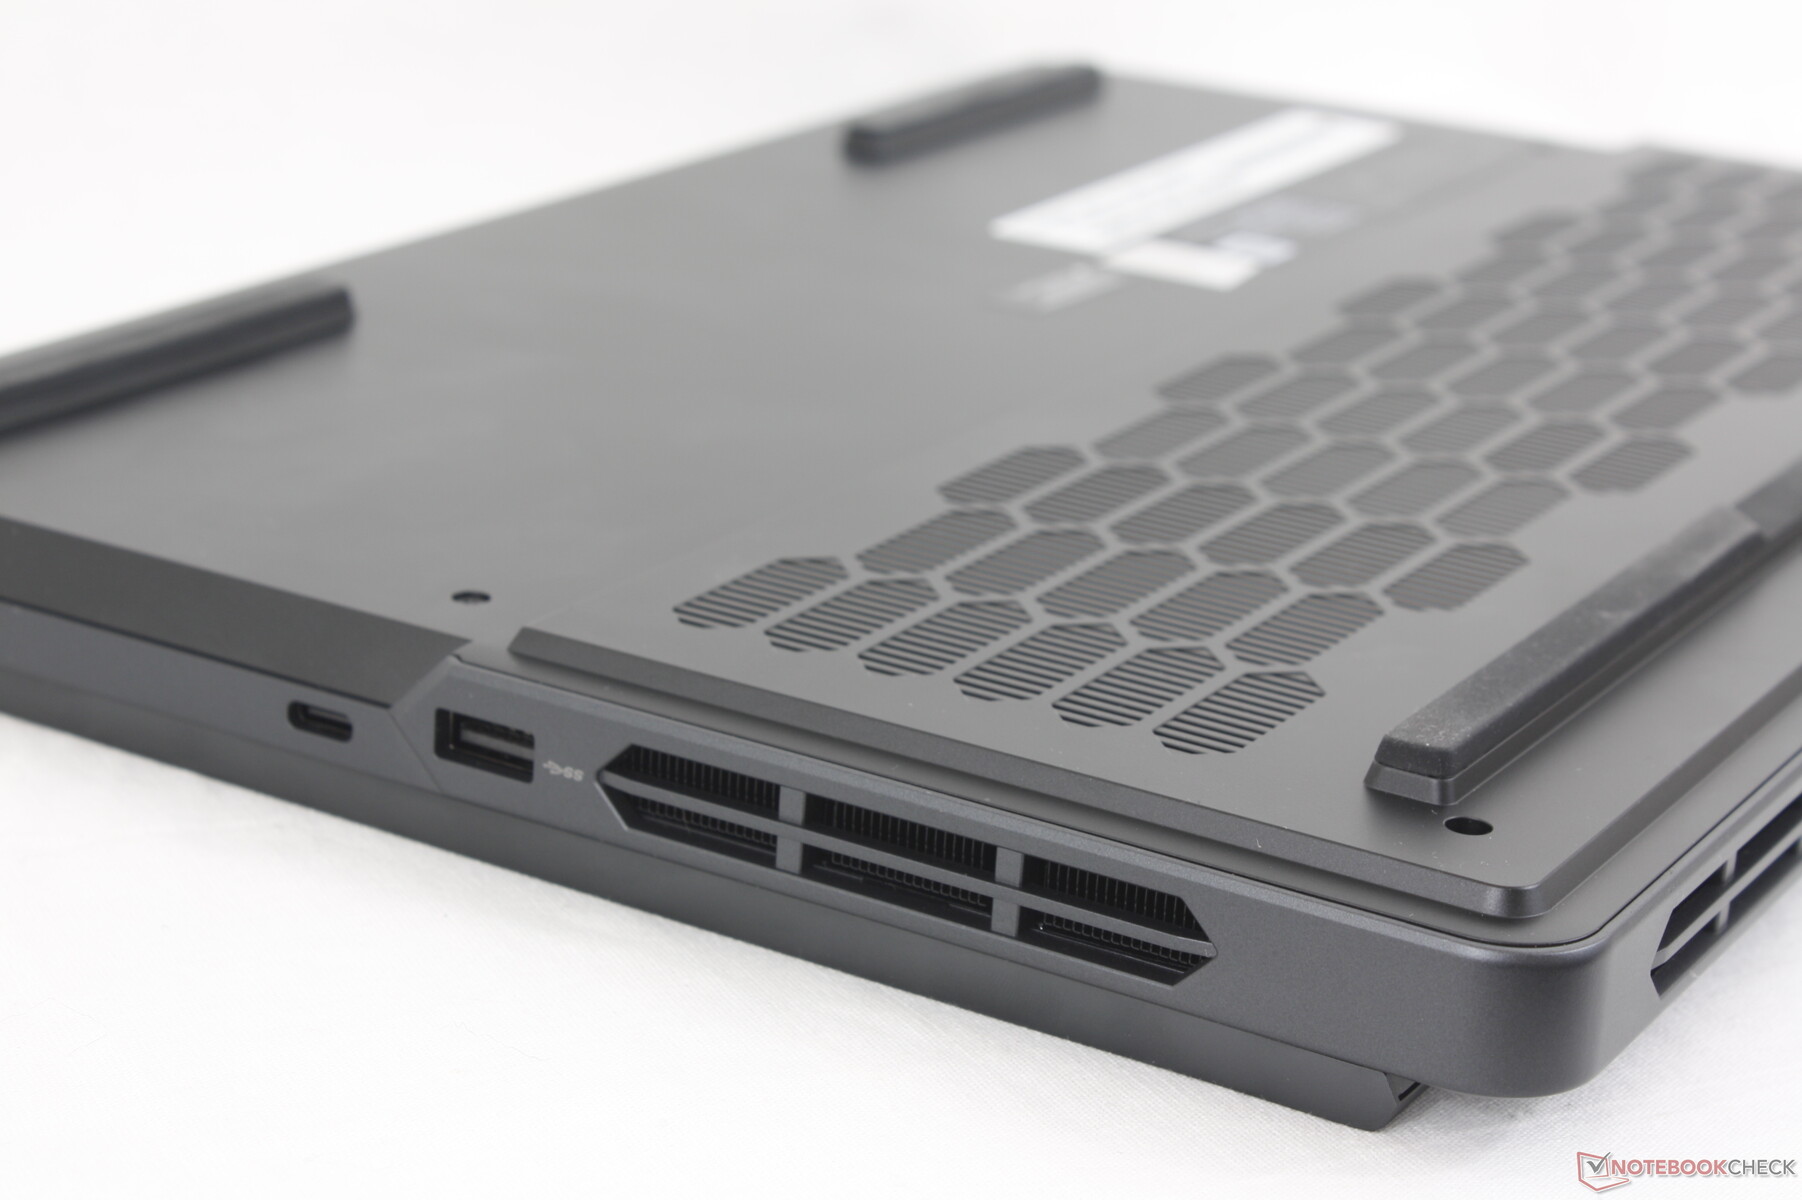
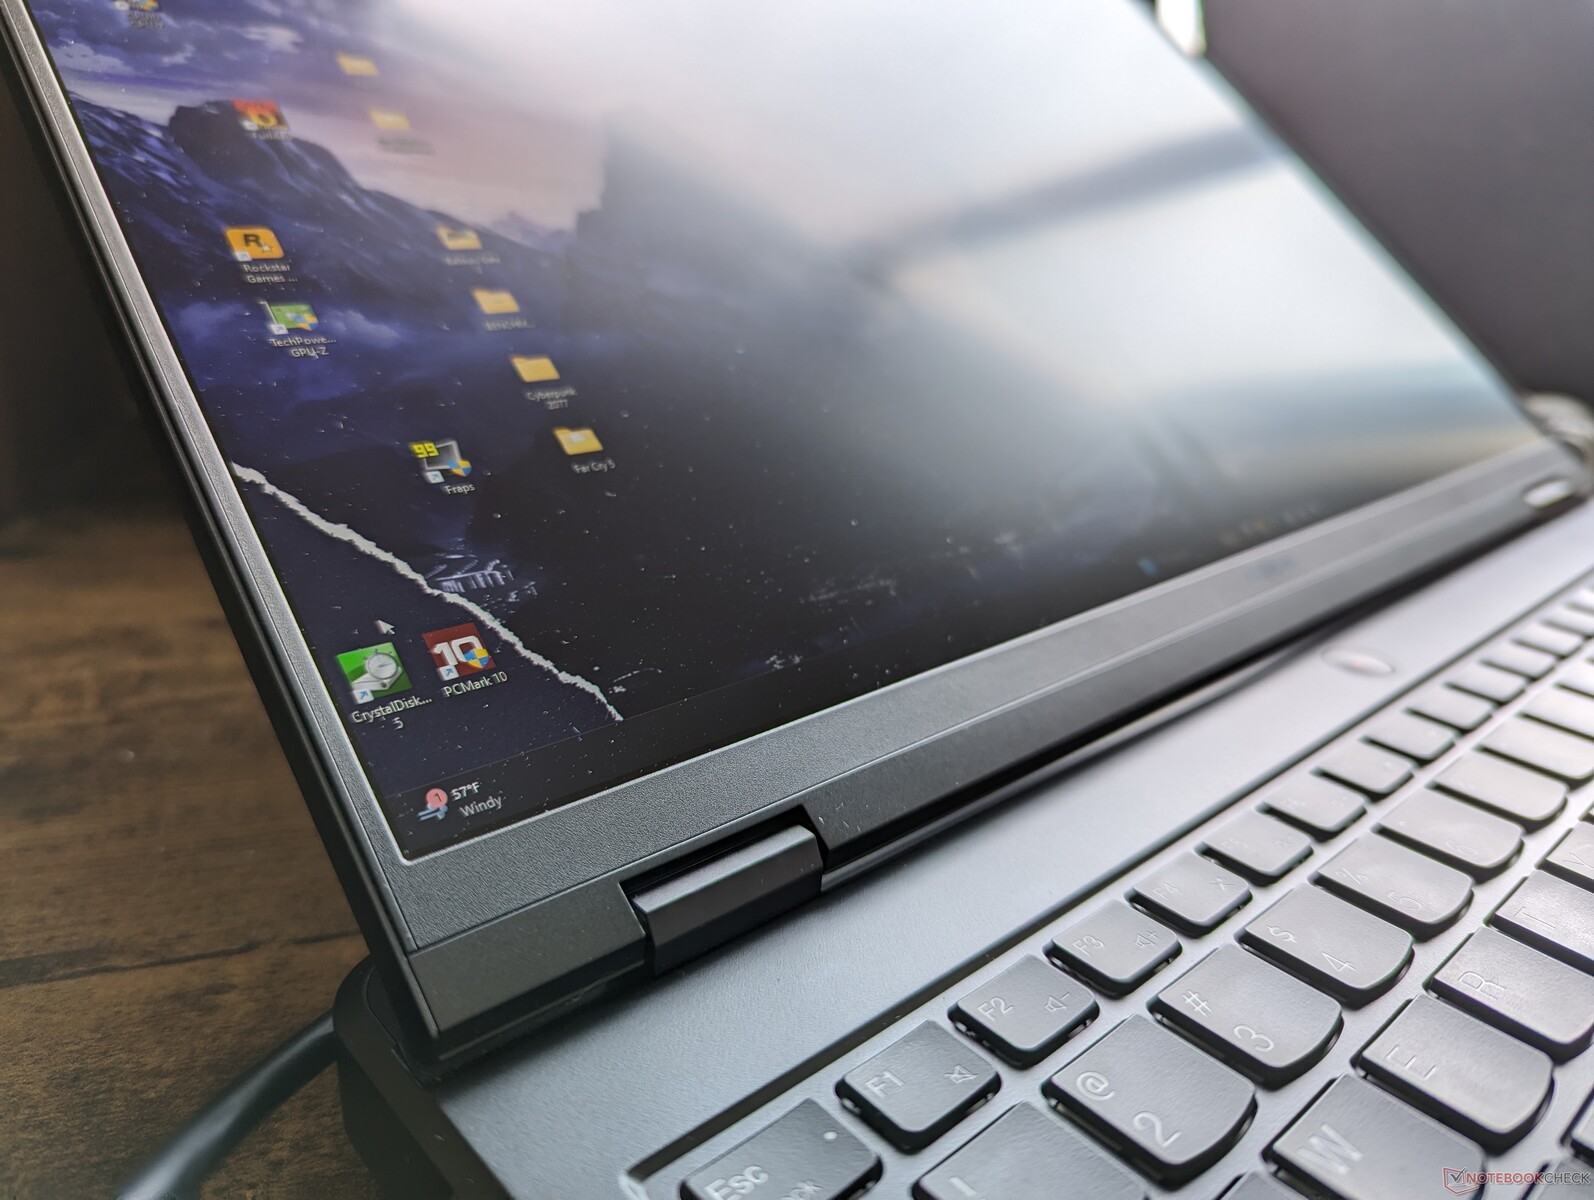
Cas - Petites modifications externes
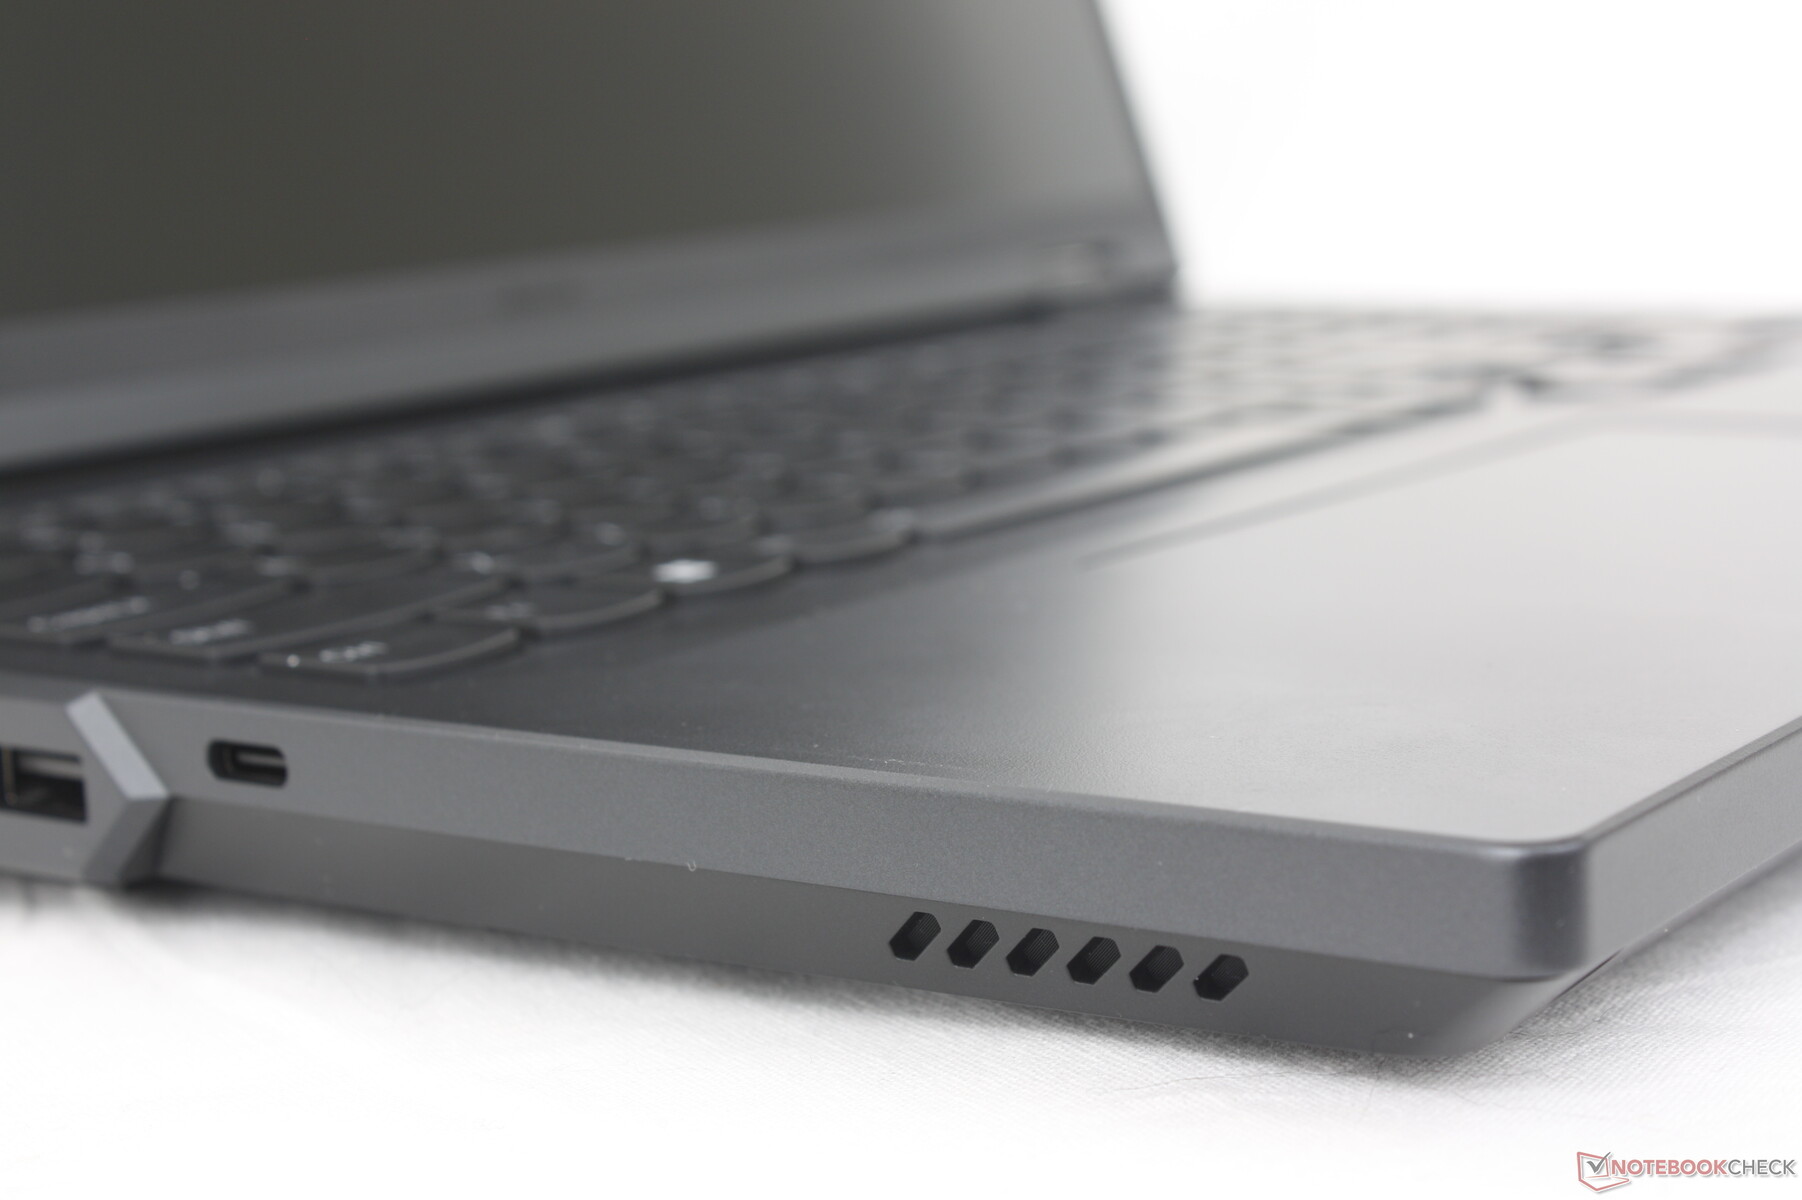
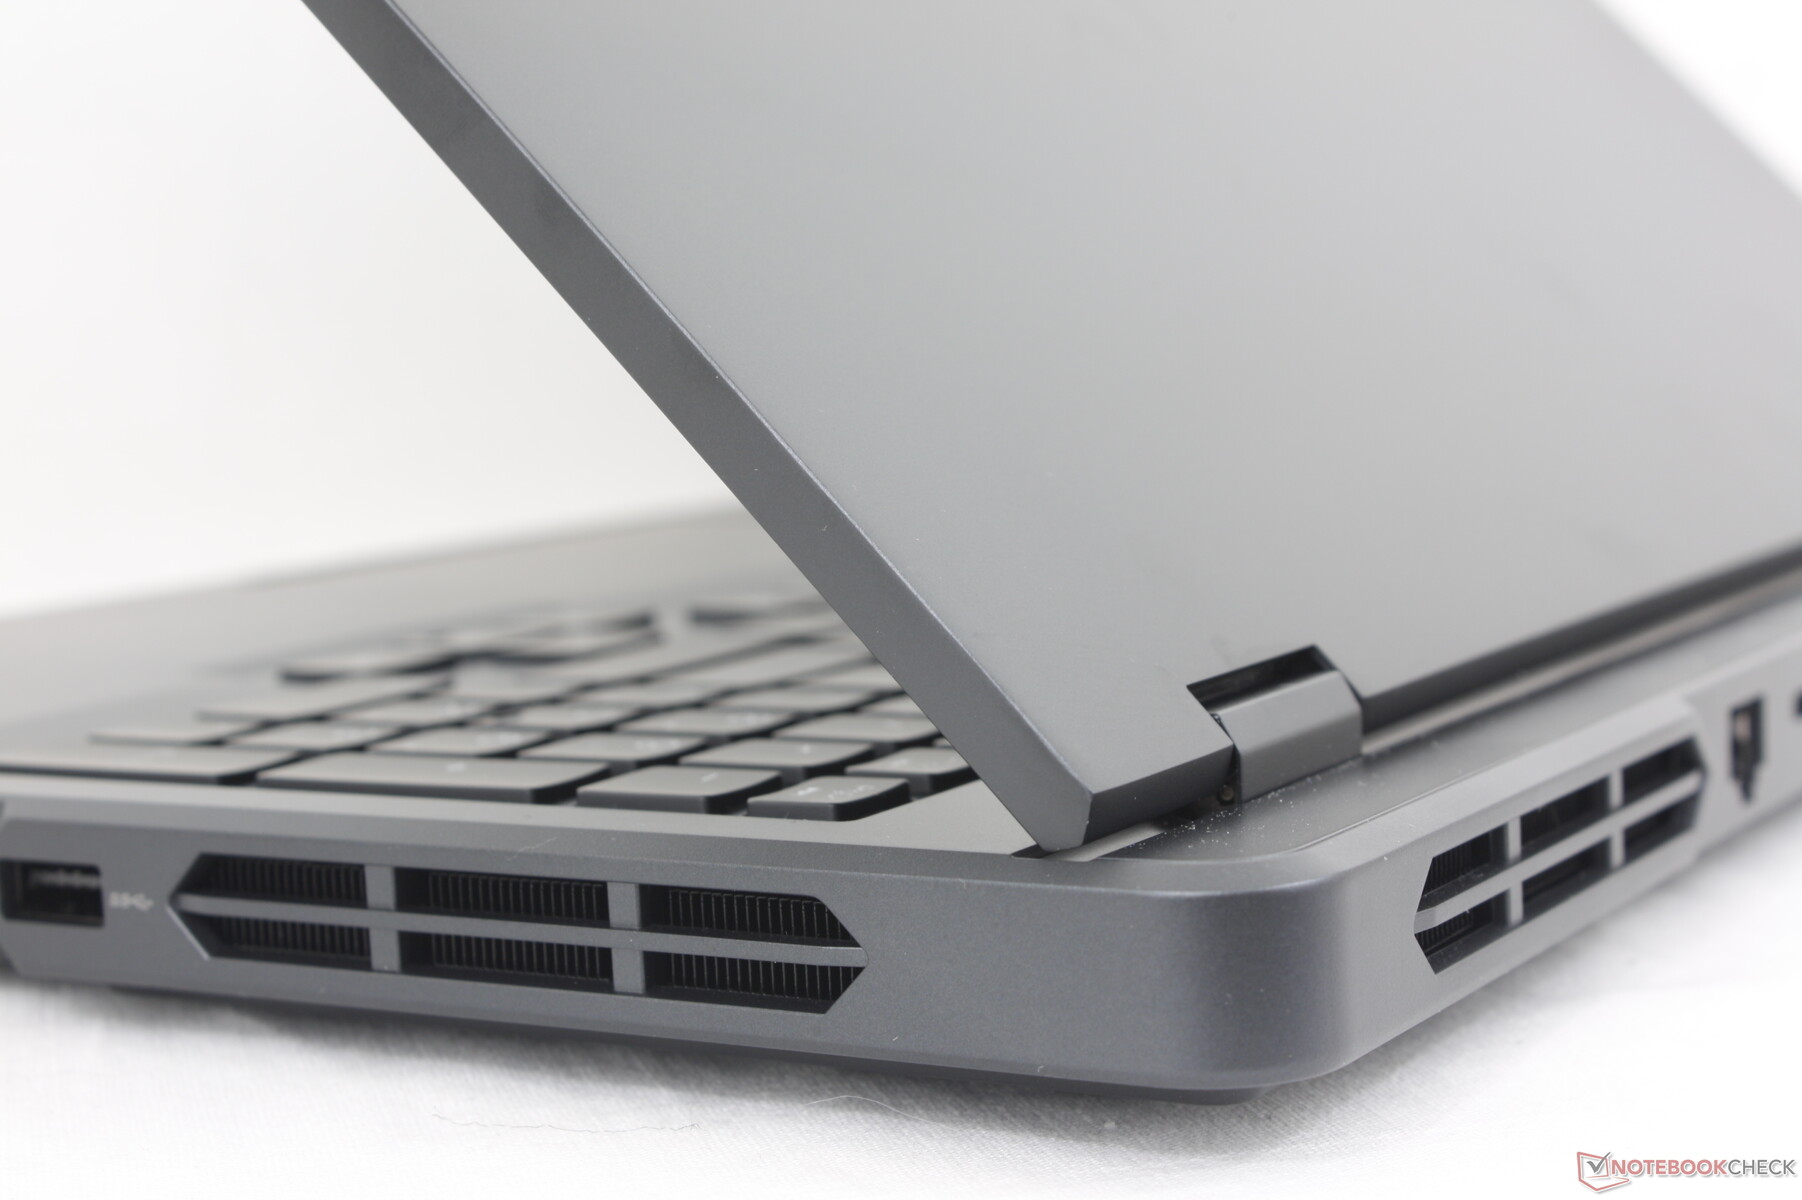
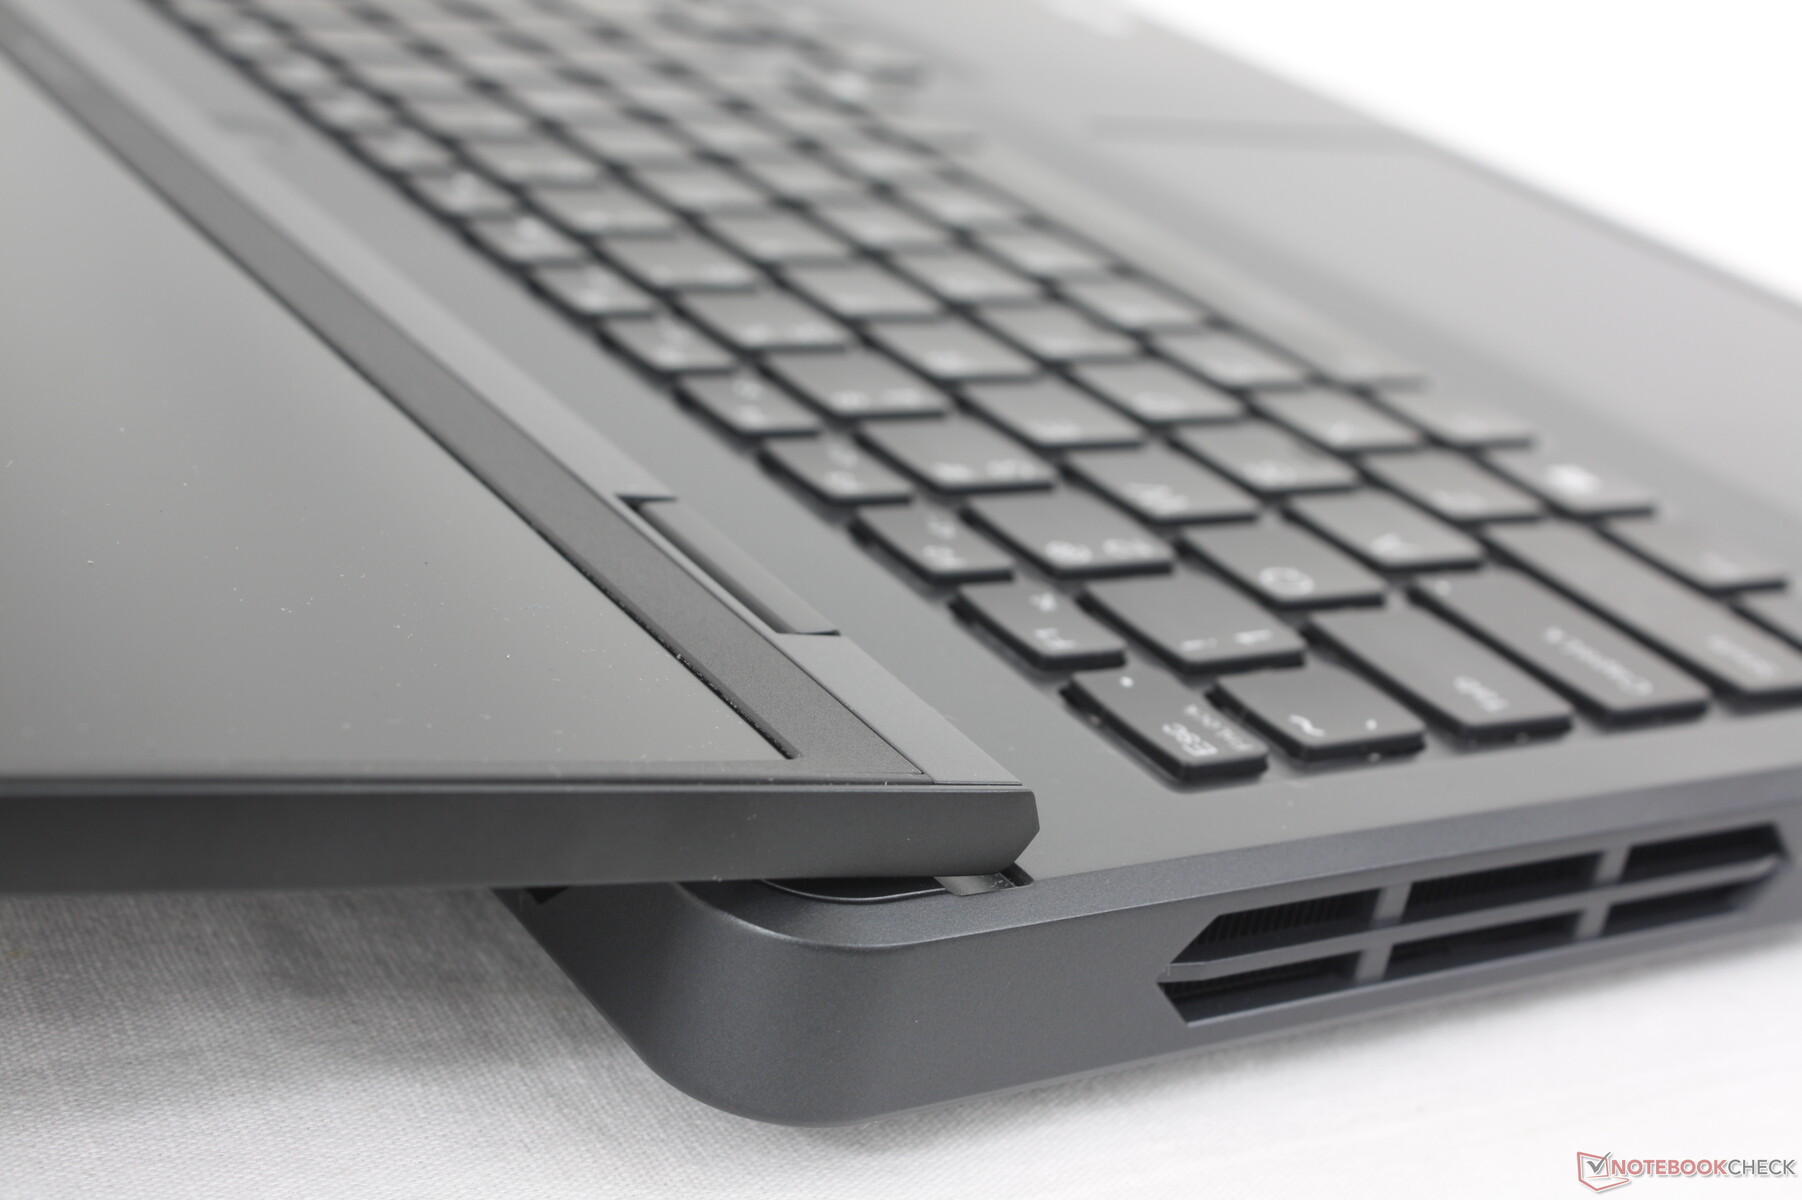
Lenovo utilise des matériaux similaires en aluminium gris dans sa gamme Legion et le Legion Pro 5 16IRX9 n'est pas différent. La nouveauté de cette année réside dans les grilles d'aération redessinées le long du panneau inférieur (côté D), qui sont désormais des hexagones allongés et non plus des rectangles. Le changement est essentiellement superficiel et le reste du châssis est identique à celui du Legion Pro 5 16IRX8.
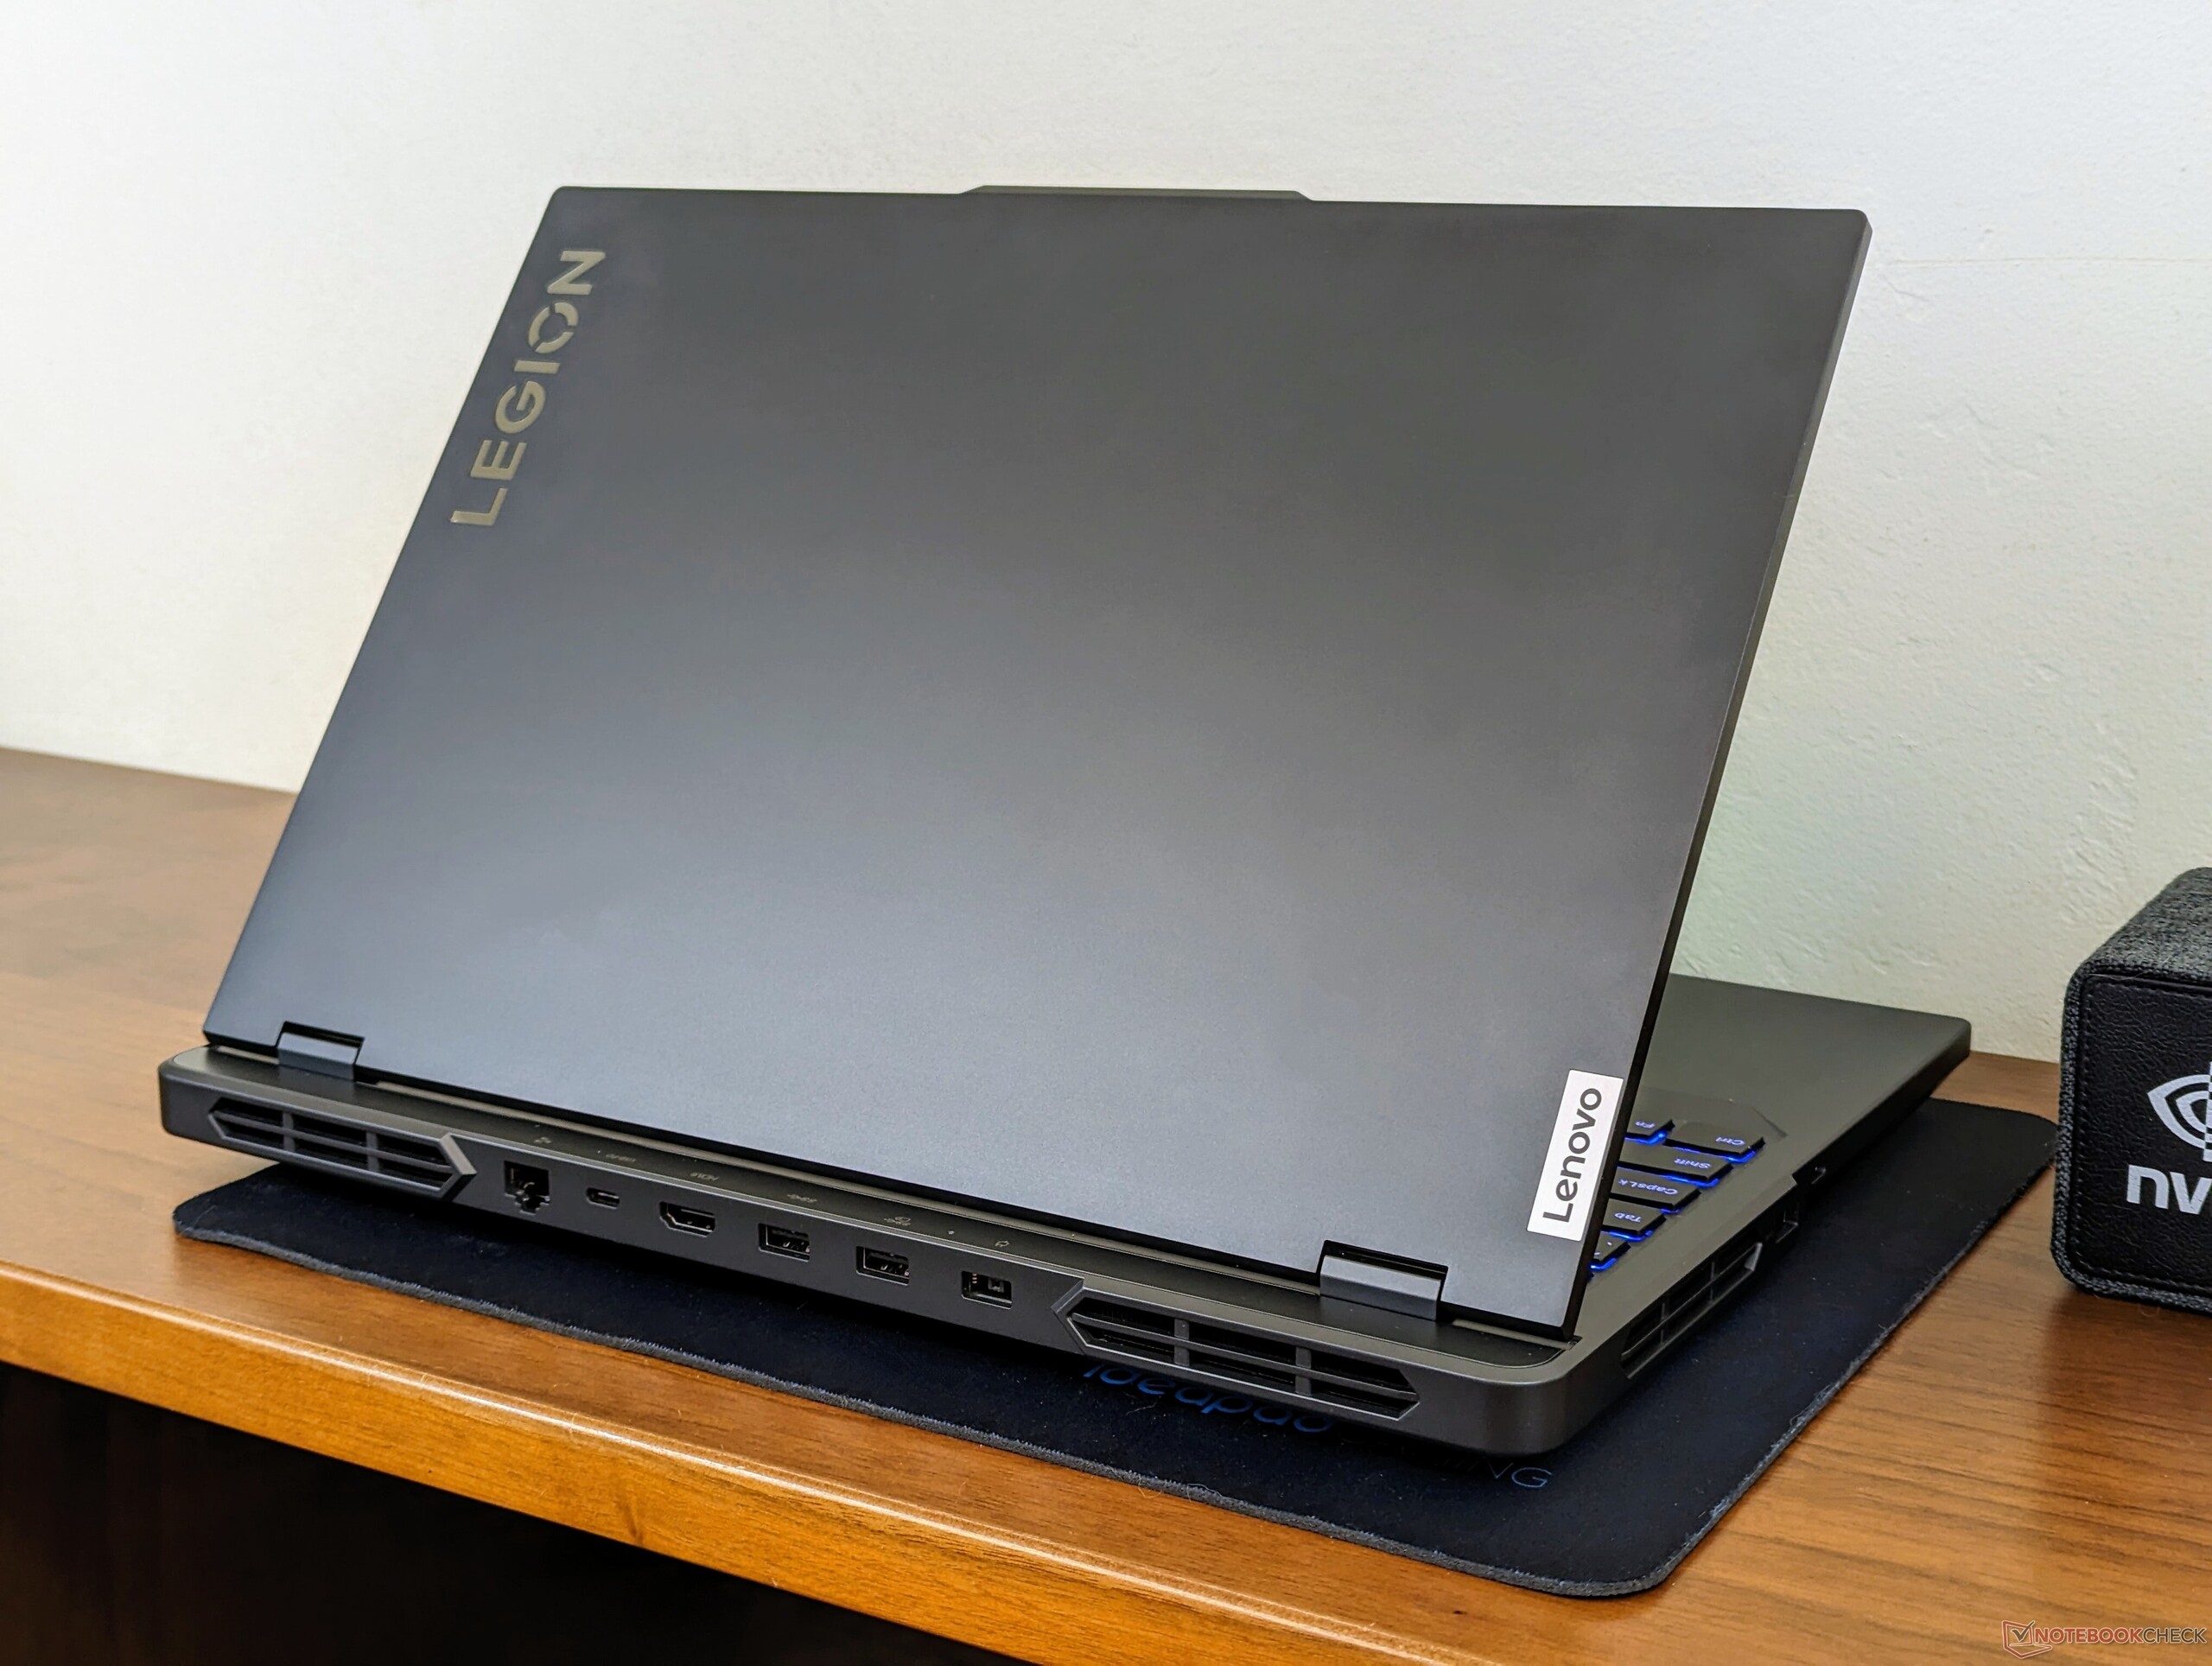
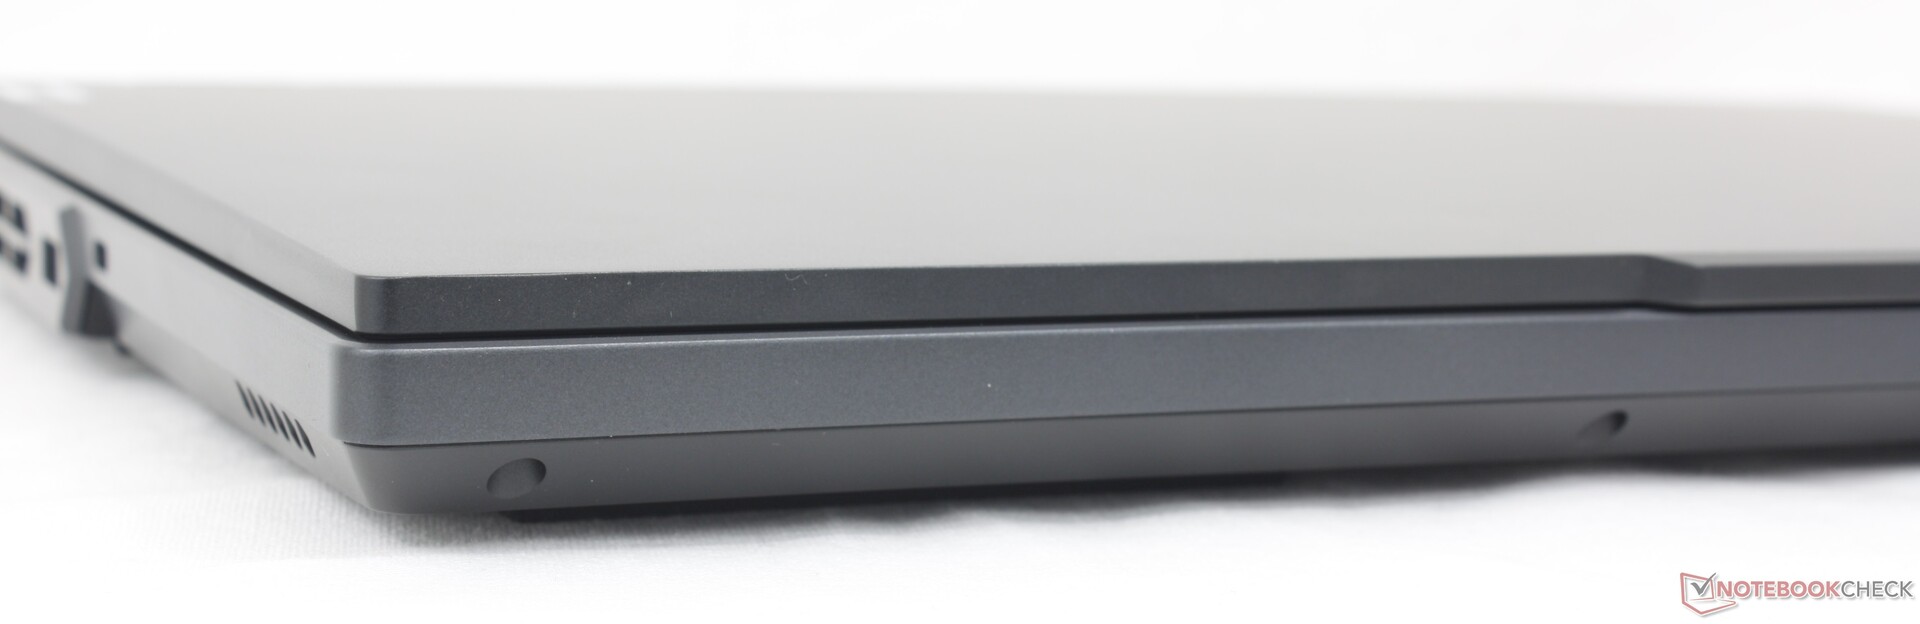
Le Legion Pro 5 16 reste l'un des ordinateurs portables de jeu de 16 pouces les plus grands et les plus lourds, avec plus de 600 grammes dans certains cas. Cependant, cette taille n'est pas inutile car le Lenovo est équipé de processeurs Core-HX, alors que des alternatives plus petites et plus légères comme le Alienware m16 R2 peuvent être livrés avec des processeurs Core Ultra plus lents.
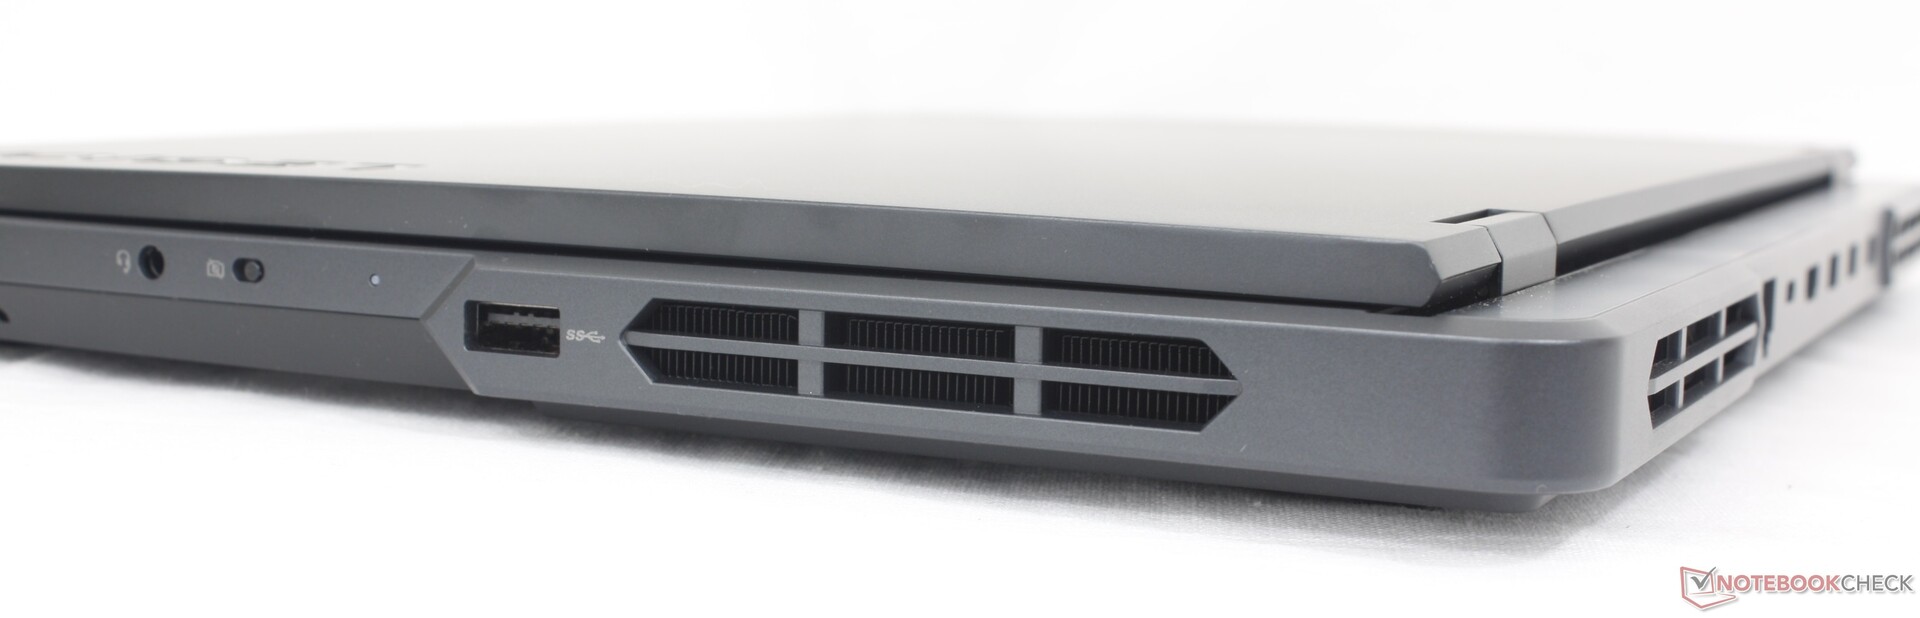
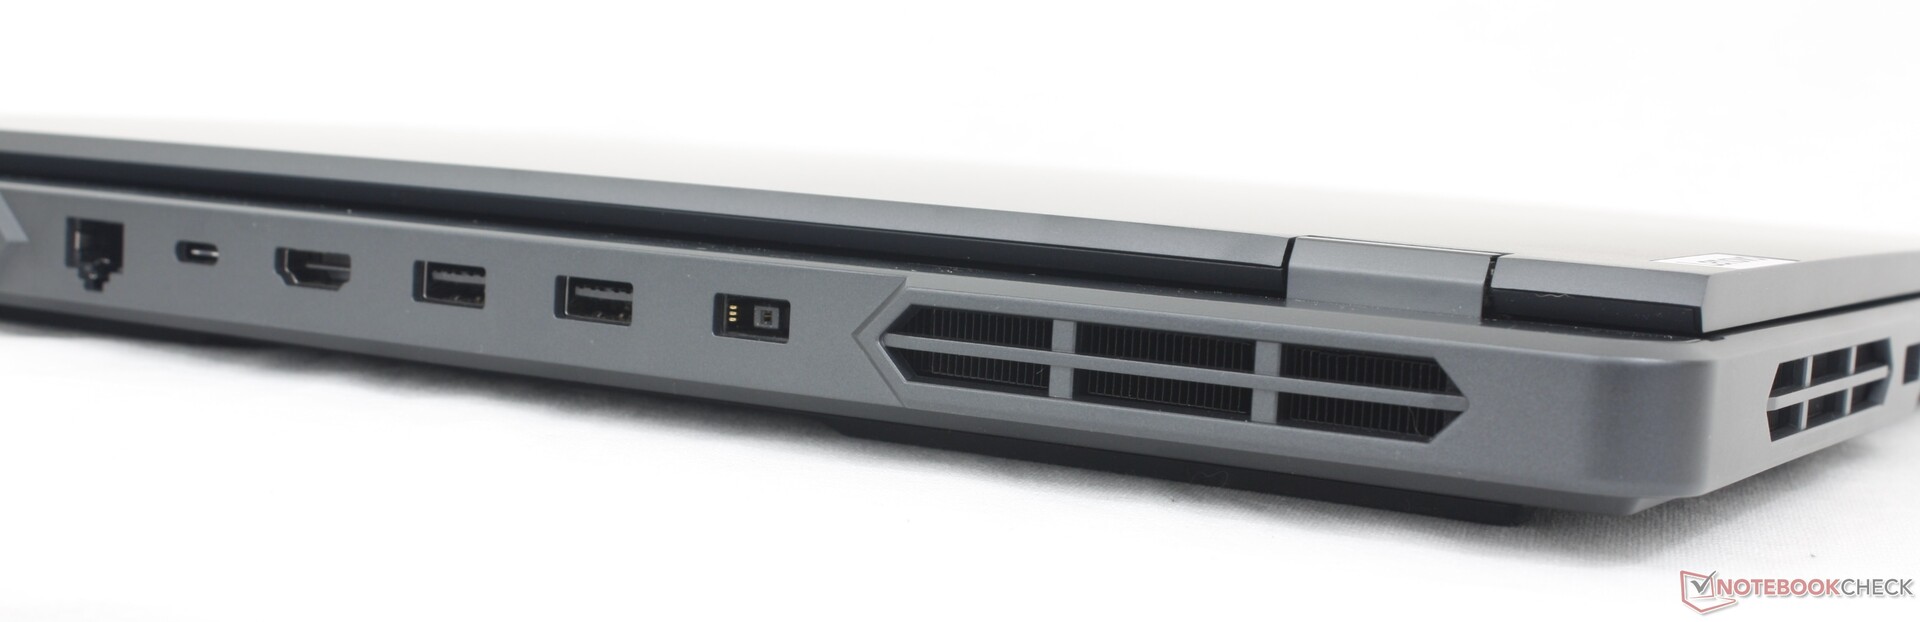
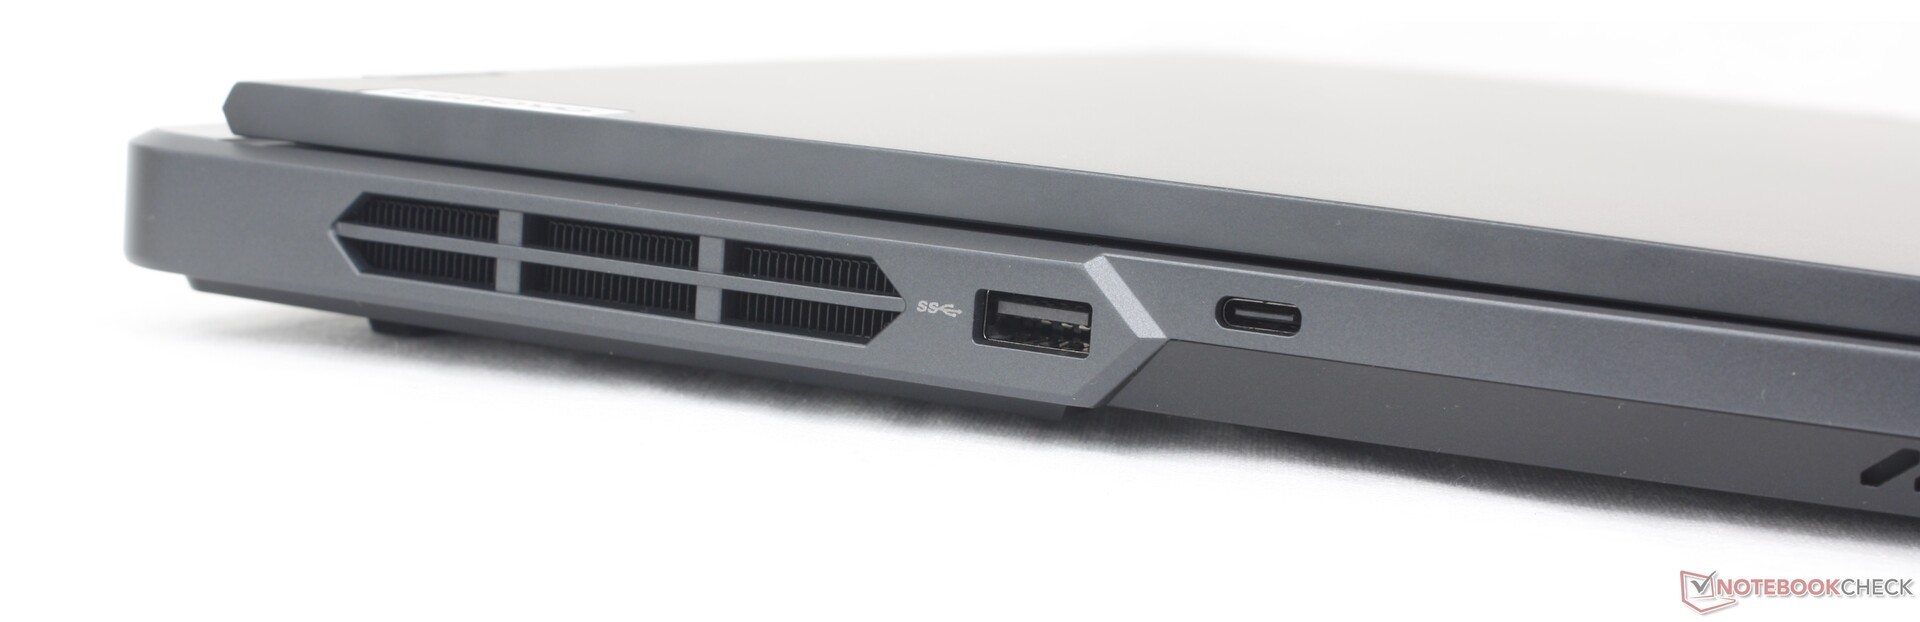
Connectivité
Les options de port restent compétitives, bien que l'absence d'un lecteur de carte SD intégré puisse irriter certains créateurs de contenu. Les symboles de ports imprimés le long de la platine thermique facilitent l'identification visuelle des ports arrière par rapport à des ordinateurs portables tels que l'Alienware m16 R2 ou l'HP Omen Transcend 16.. HP Omen Transcend 16. Cependant, les symboles ne sont pas éclairés, contrairement aux ordinateurs portables de la série Legion Série Pro 7.
Alors que les ordinateurs portables compatibles avec Thunderbolt 5 commencent à peine à arriver sur le marché, le Legion Pro 5 16 n'est toujours compatible qu'avec Thunderbolt 4.
Communication
Un Intel AX211 est fourni en standard pour la connectivité Wi-Fi 6E et Bluetooth 5.2. Nous n'avons rencontré aucun problème lorsque nous l'avons couplé à notre routeur de test Asus AXE11000.
Webcam
Notre appareil de test est équipé d'une webcam de 2 mégapixels, mais certains modèles ne disposent que d'une webcam de 1 mégapixel. Un obturateur électronique est fourni en standard, sans option IR.


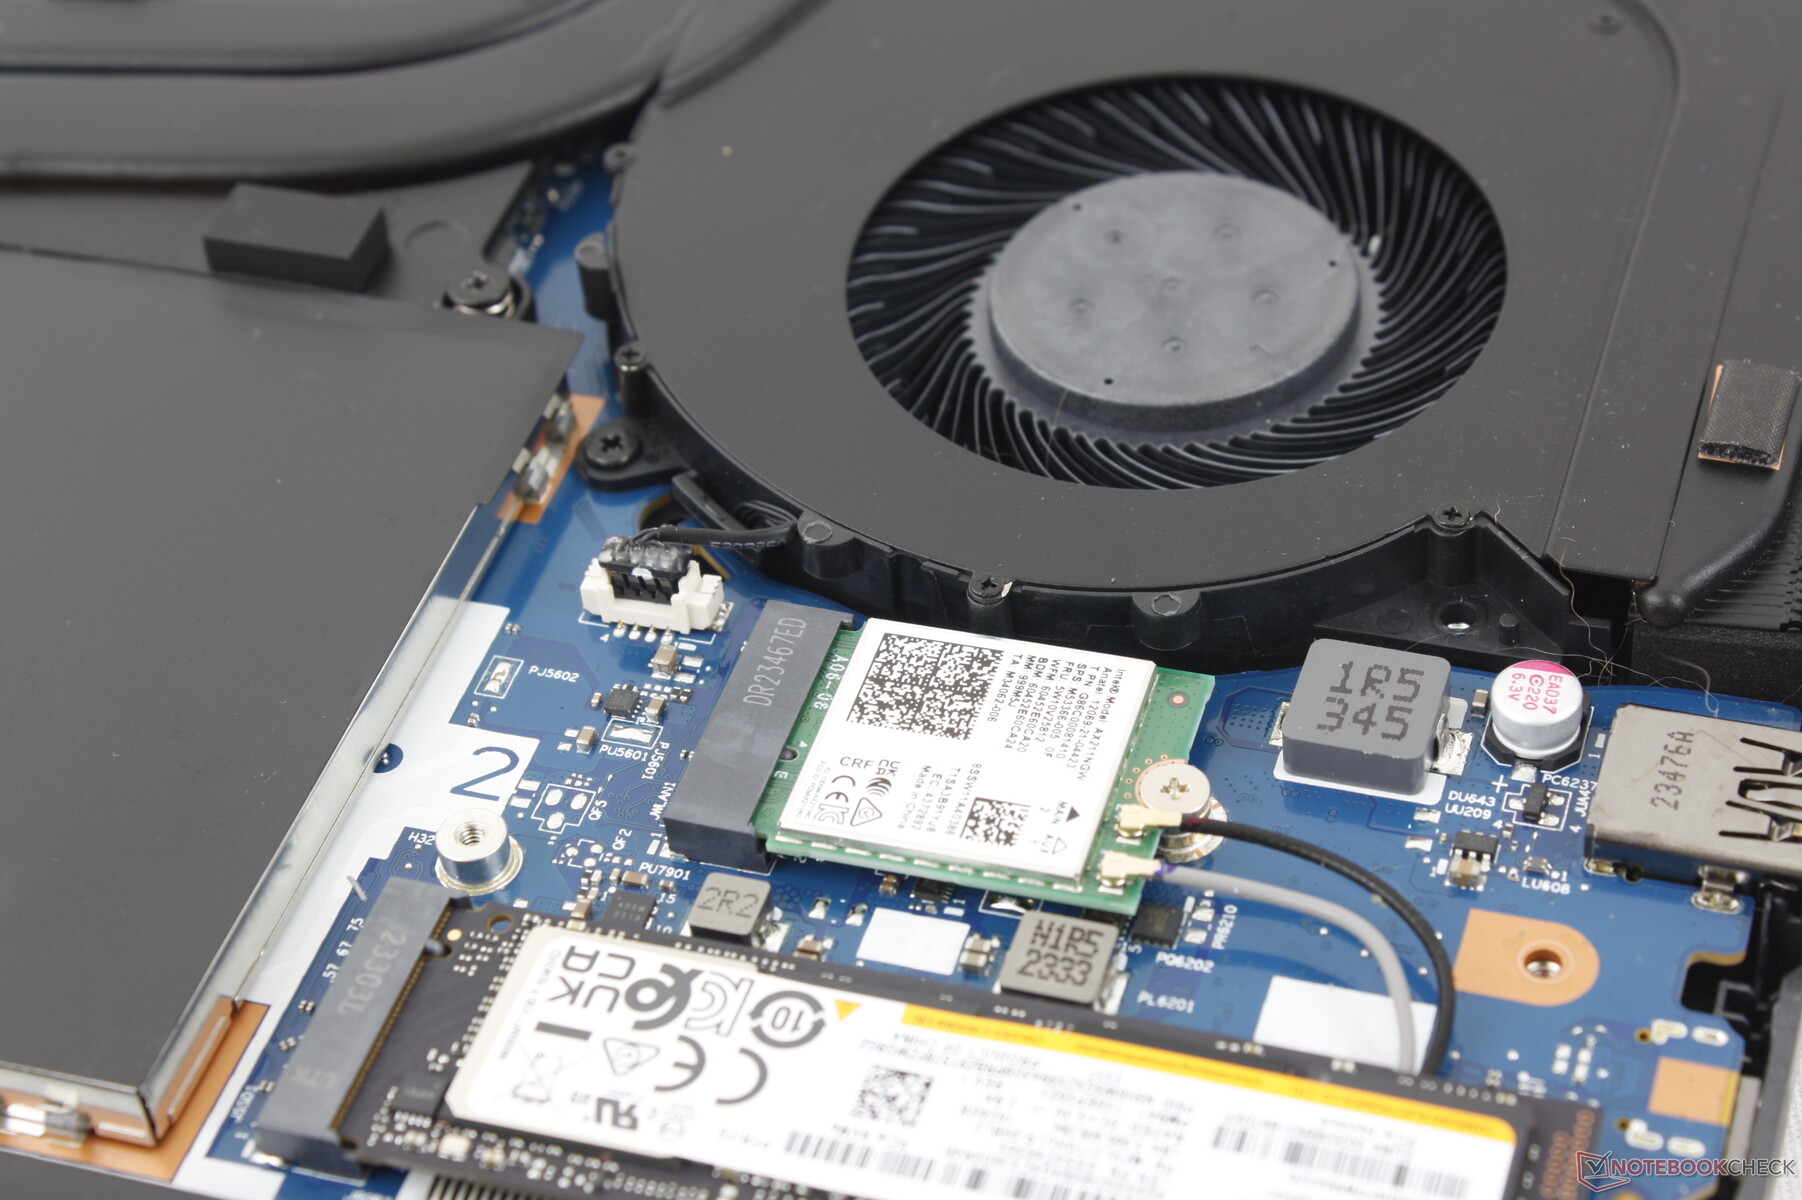
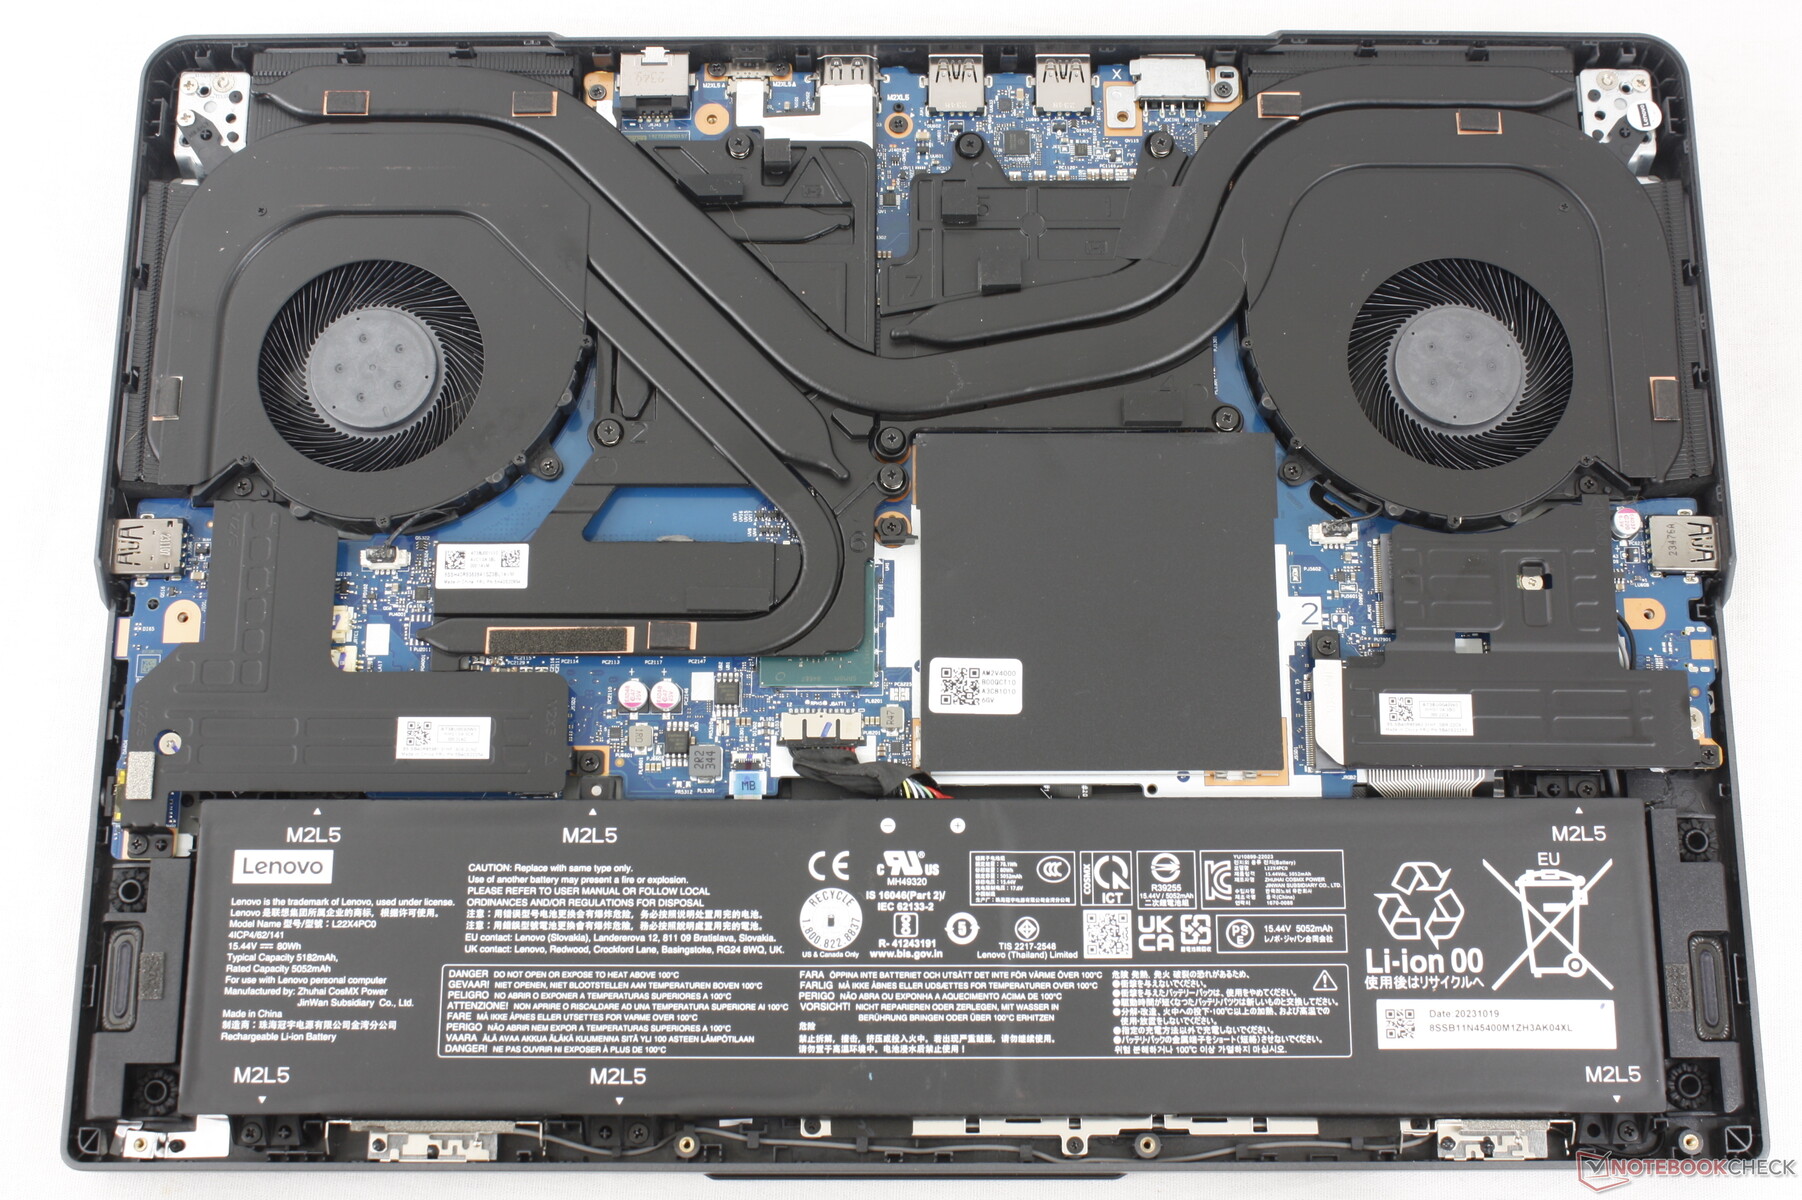
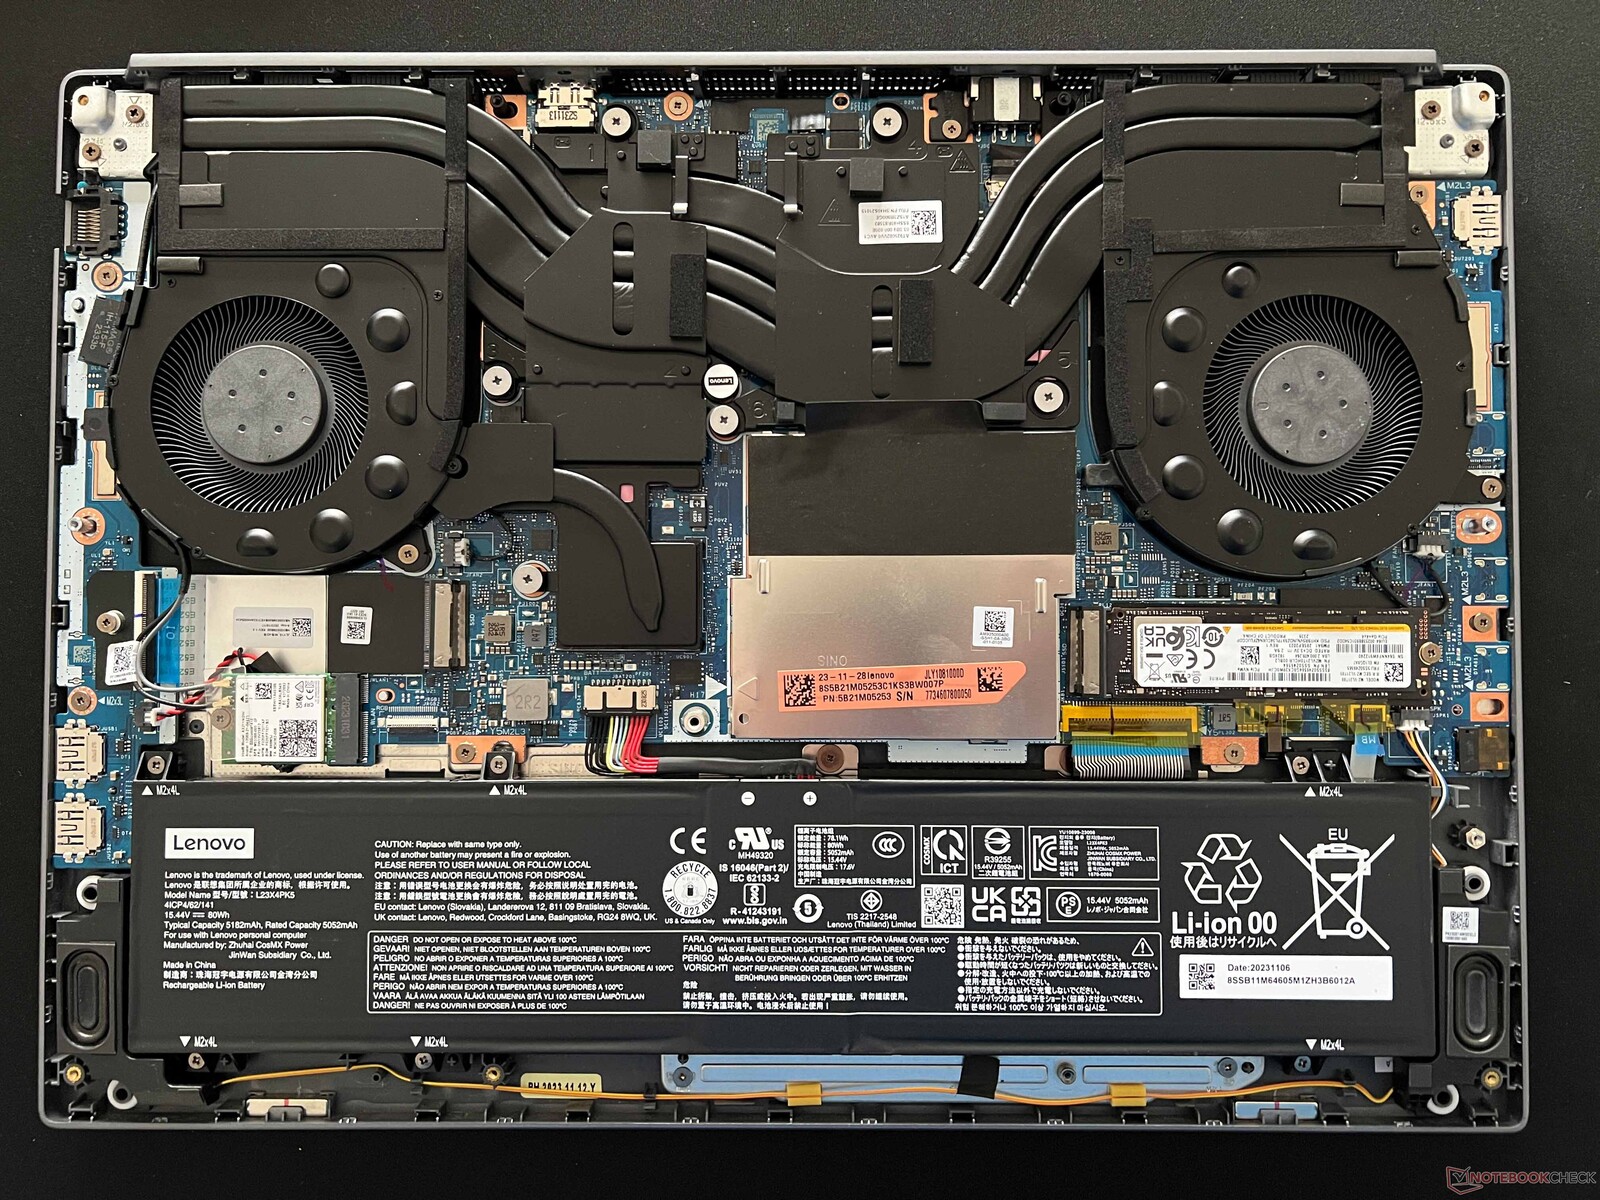
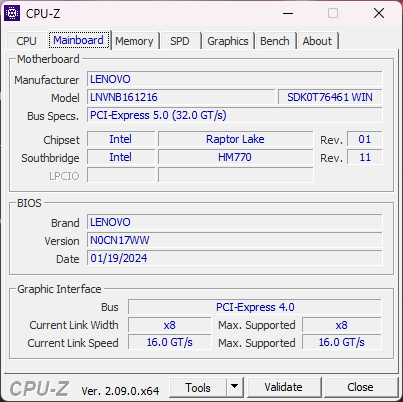
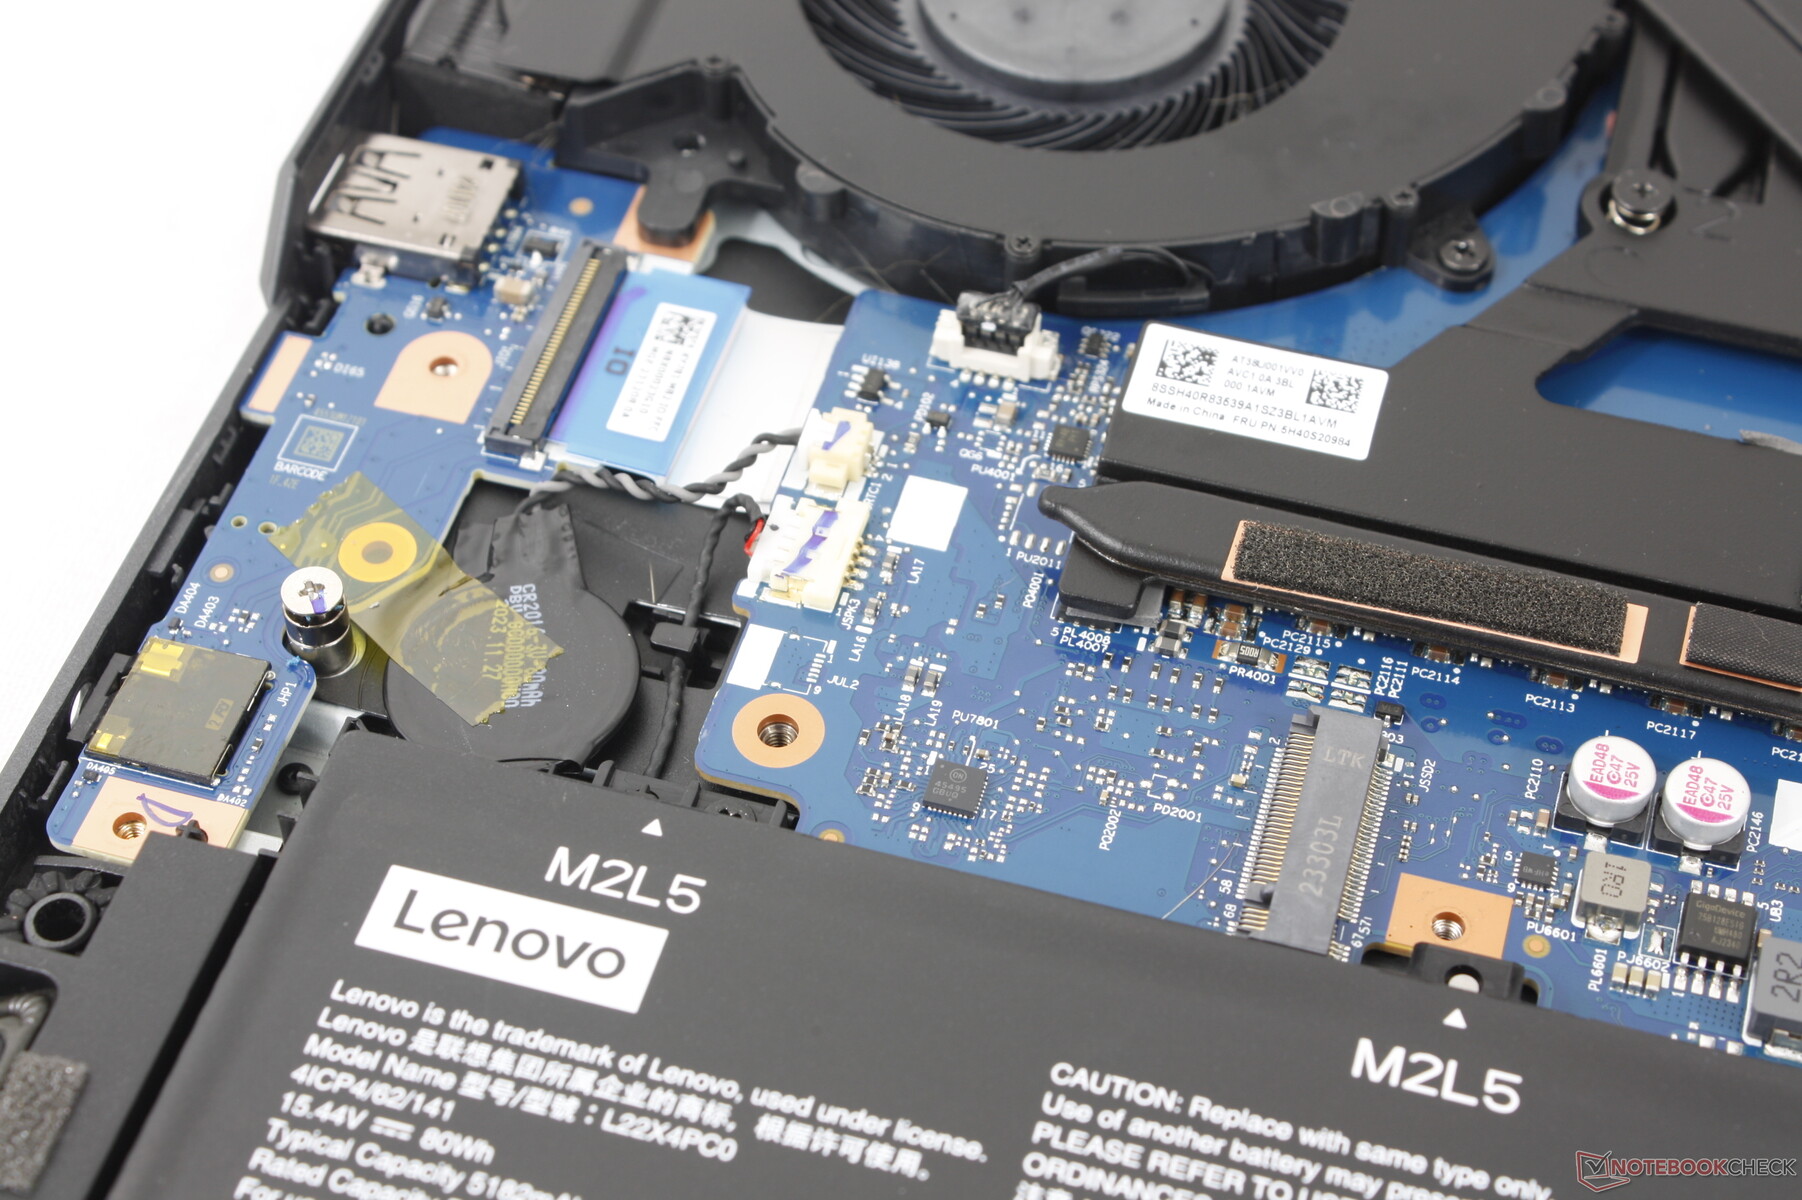
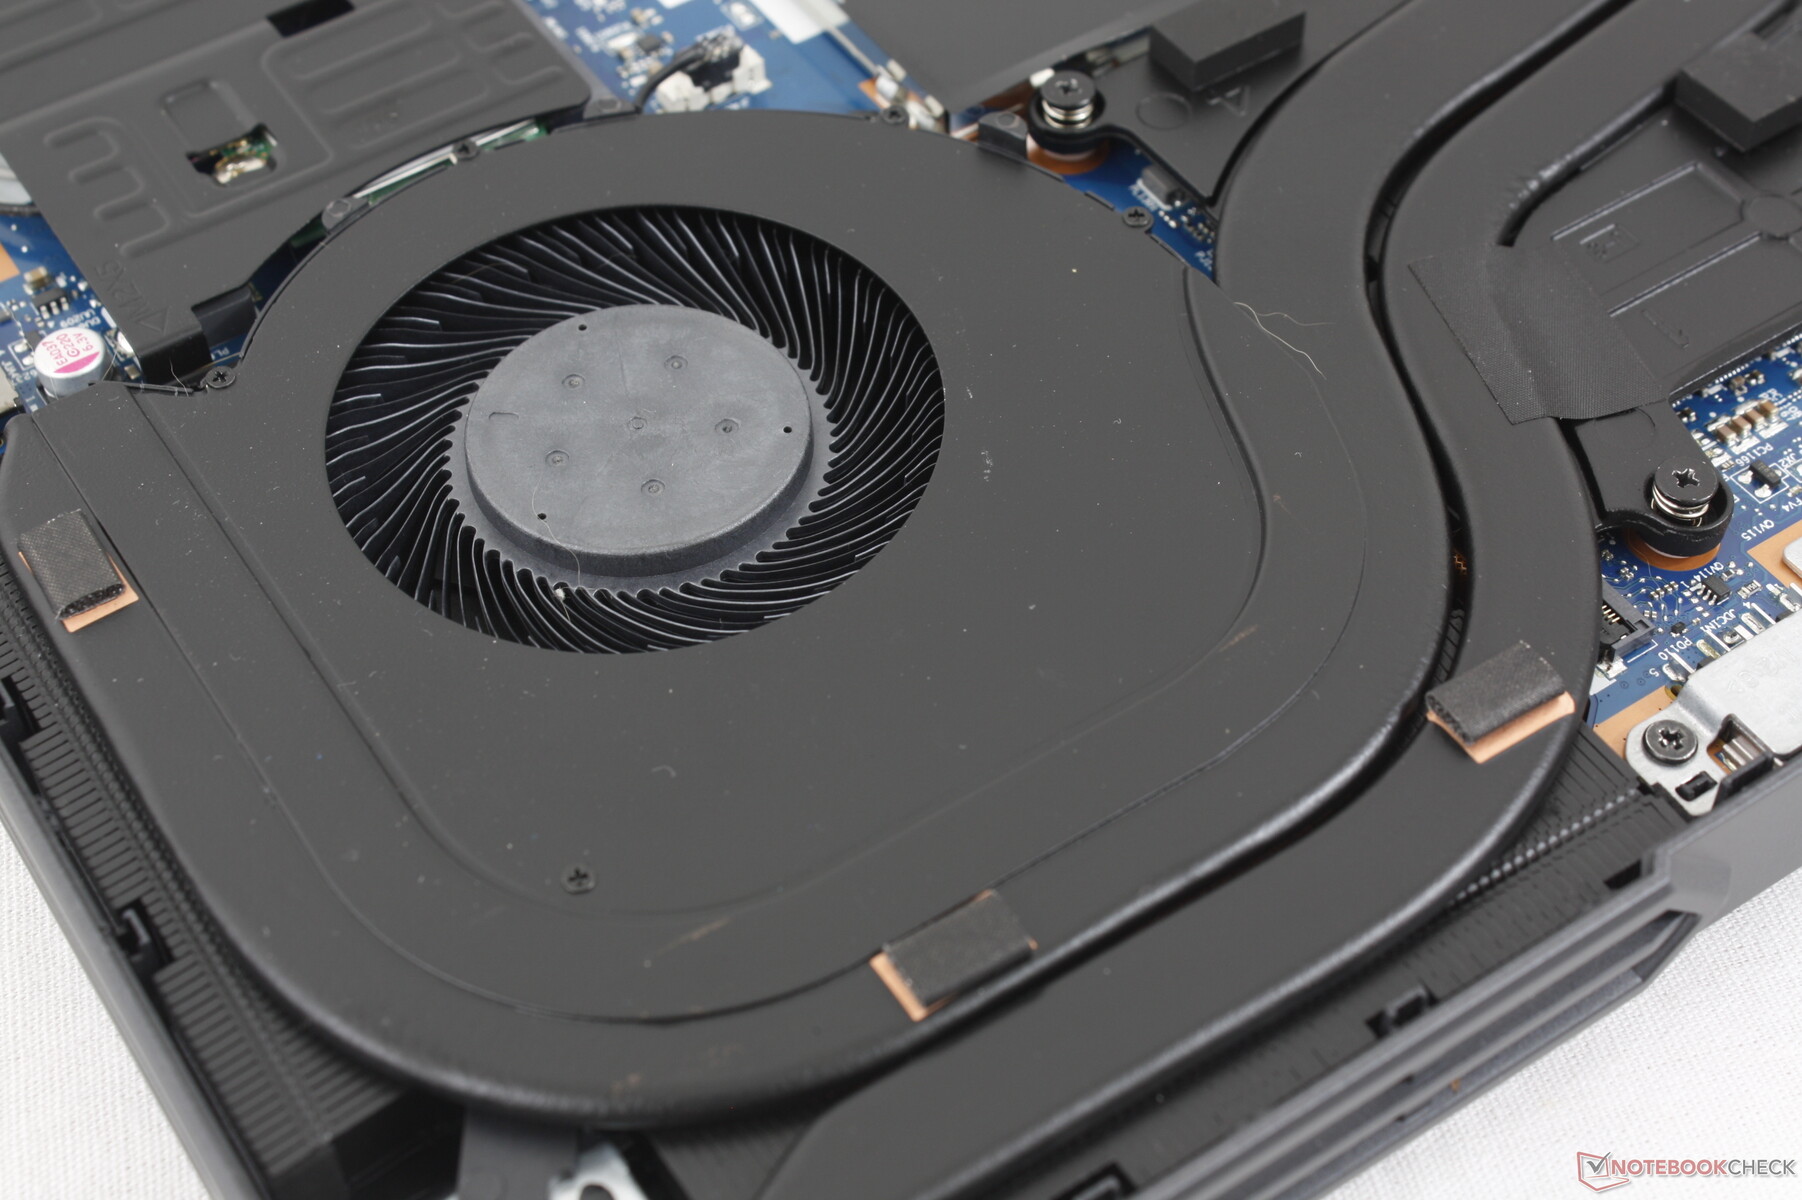
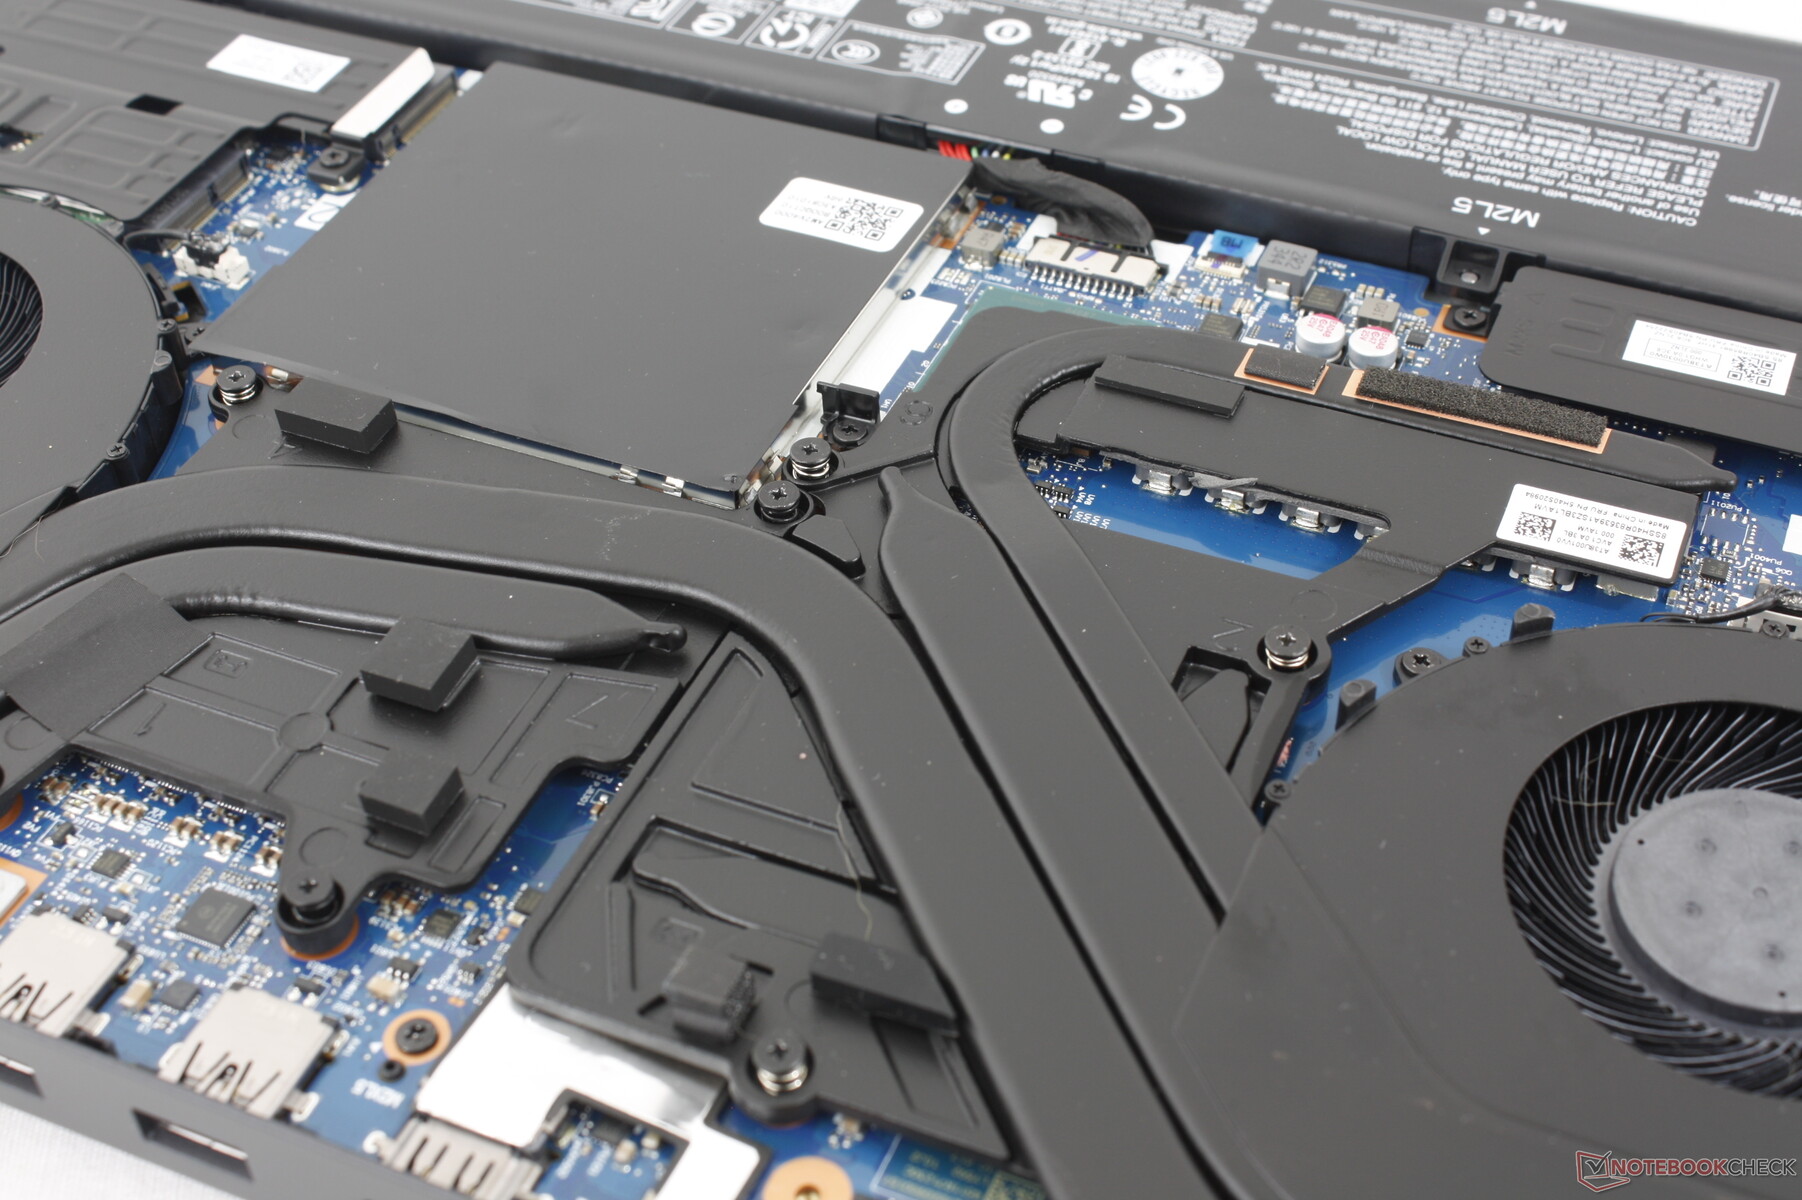
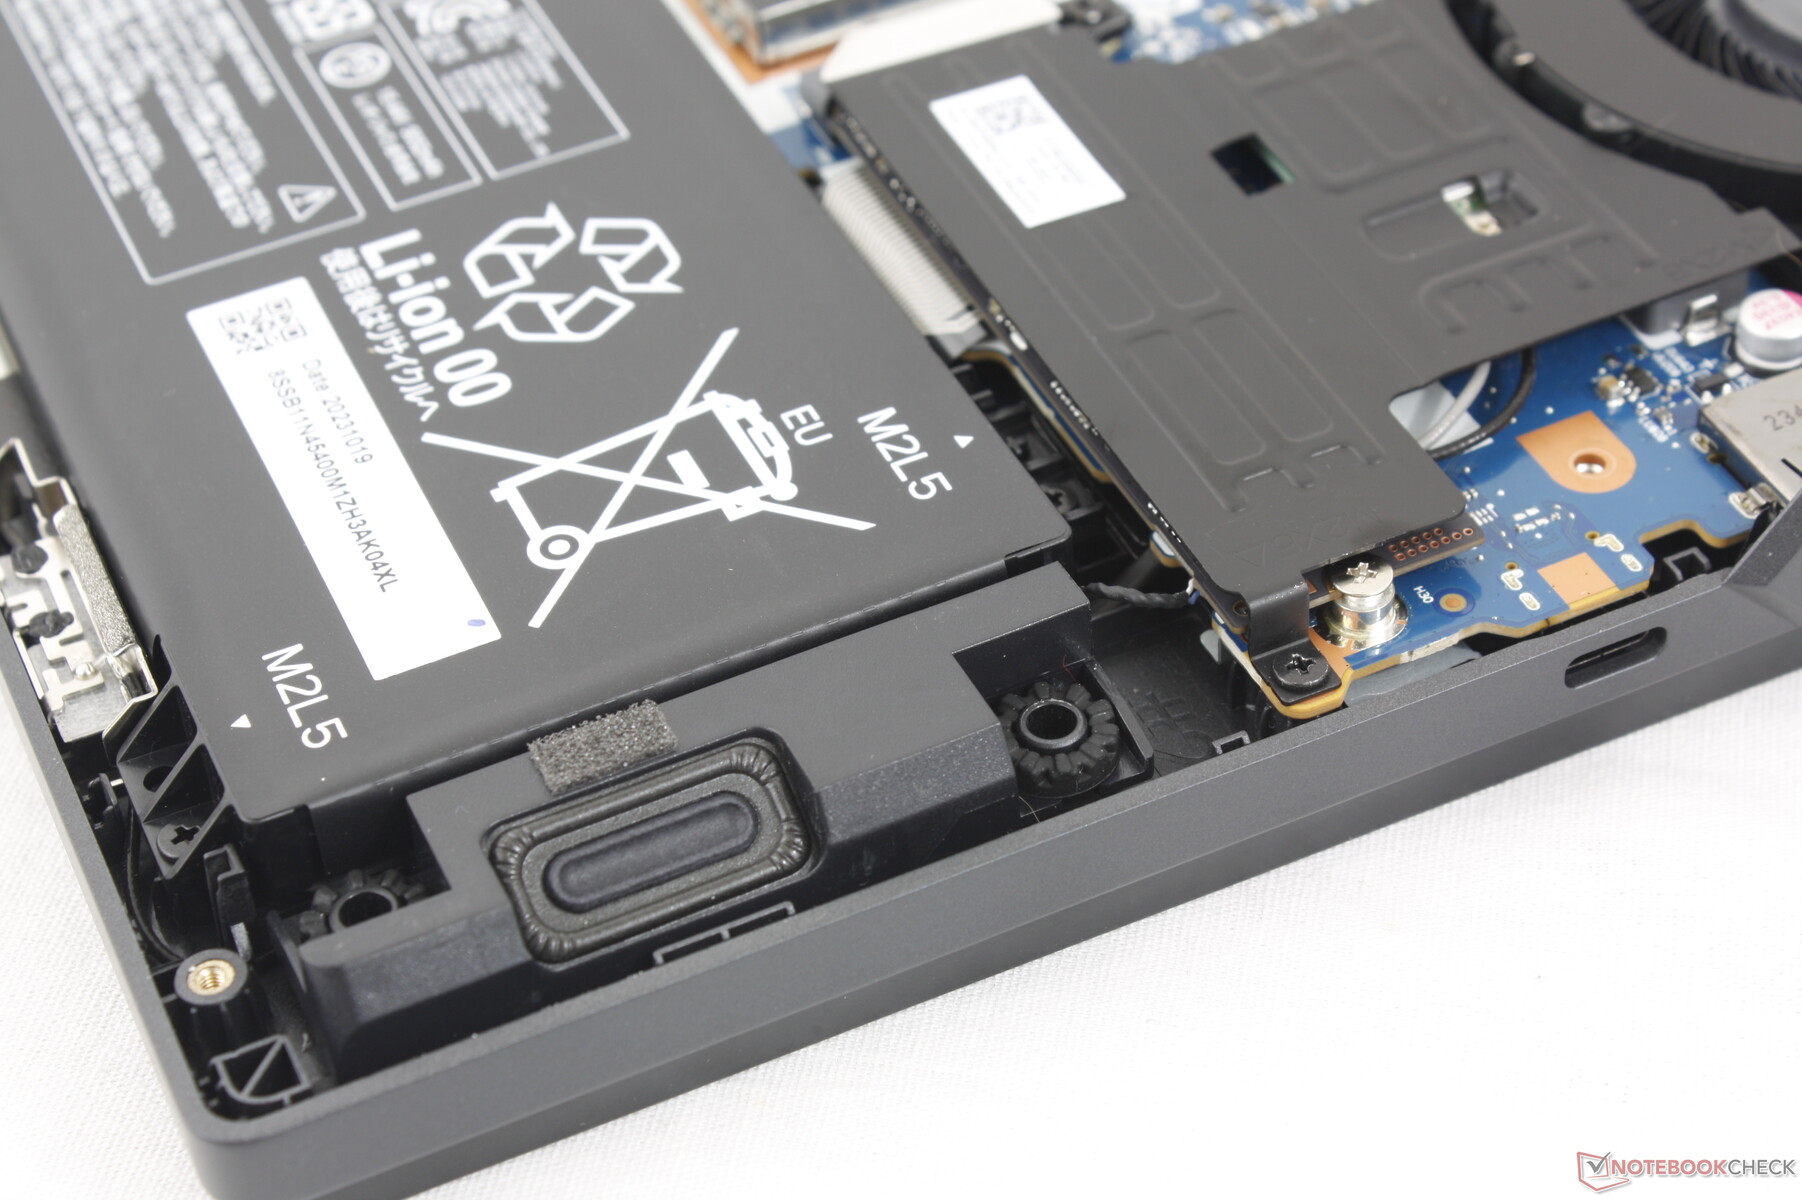
Maintenance
La carte mère ne comporte que des changements mineurs par rapport au design de l'année dernière. Le WLAN, la RAM et les deux slots SSD sont protégés par des plaques d'aluminium supplémentaires. Il est intéressant de noter que la carte Legion Pro 5 16 utilise moins de caloducs en cuivre, mais plus épais, que la carte Legion 5 16.
Accessoires et garantie
La boîte ne contient pas d'autres éléments que l'adaptateur secteur et la documentation. La garantie limitée habituelle d'un an du fabricant s'applique si l'appareil est acheté aux États-Unis.
Dispositifs d'entrée - Expérience familière Legion
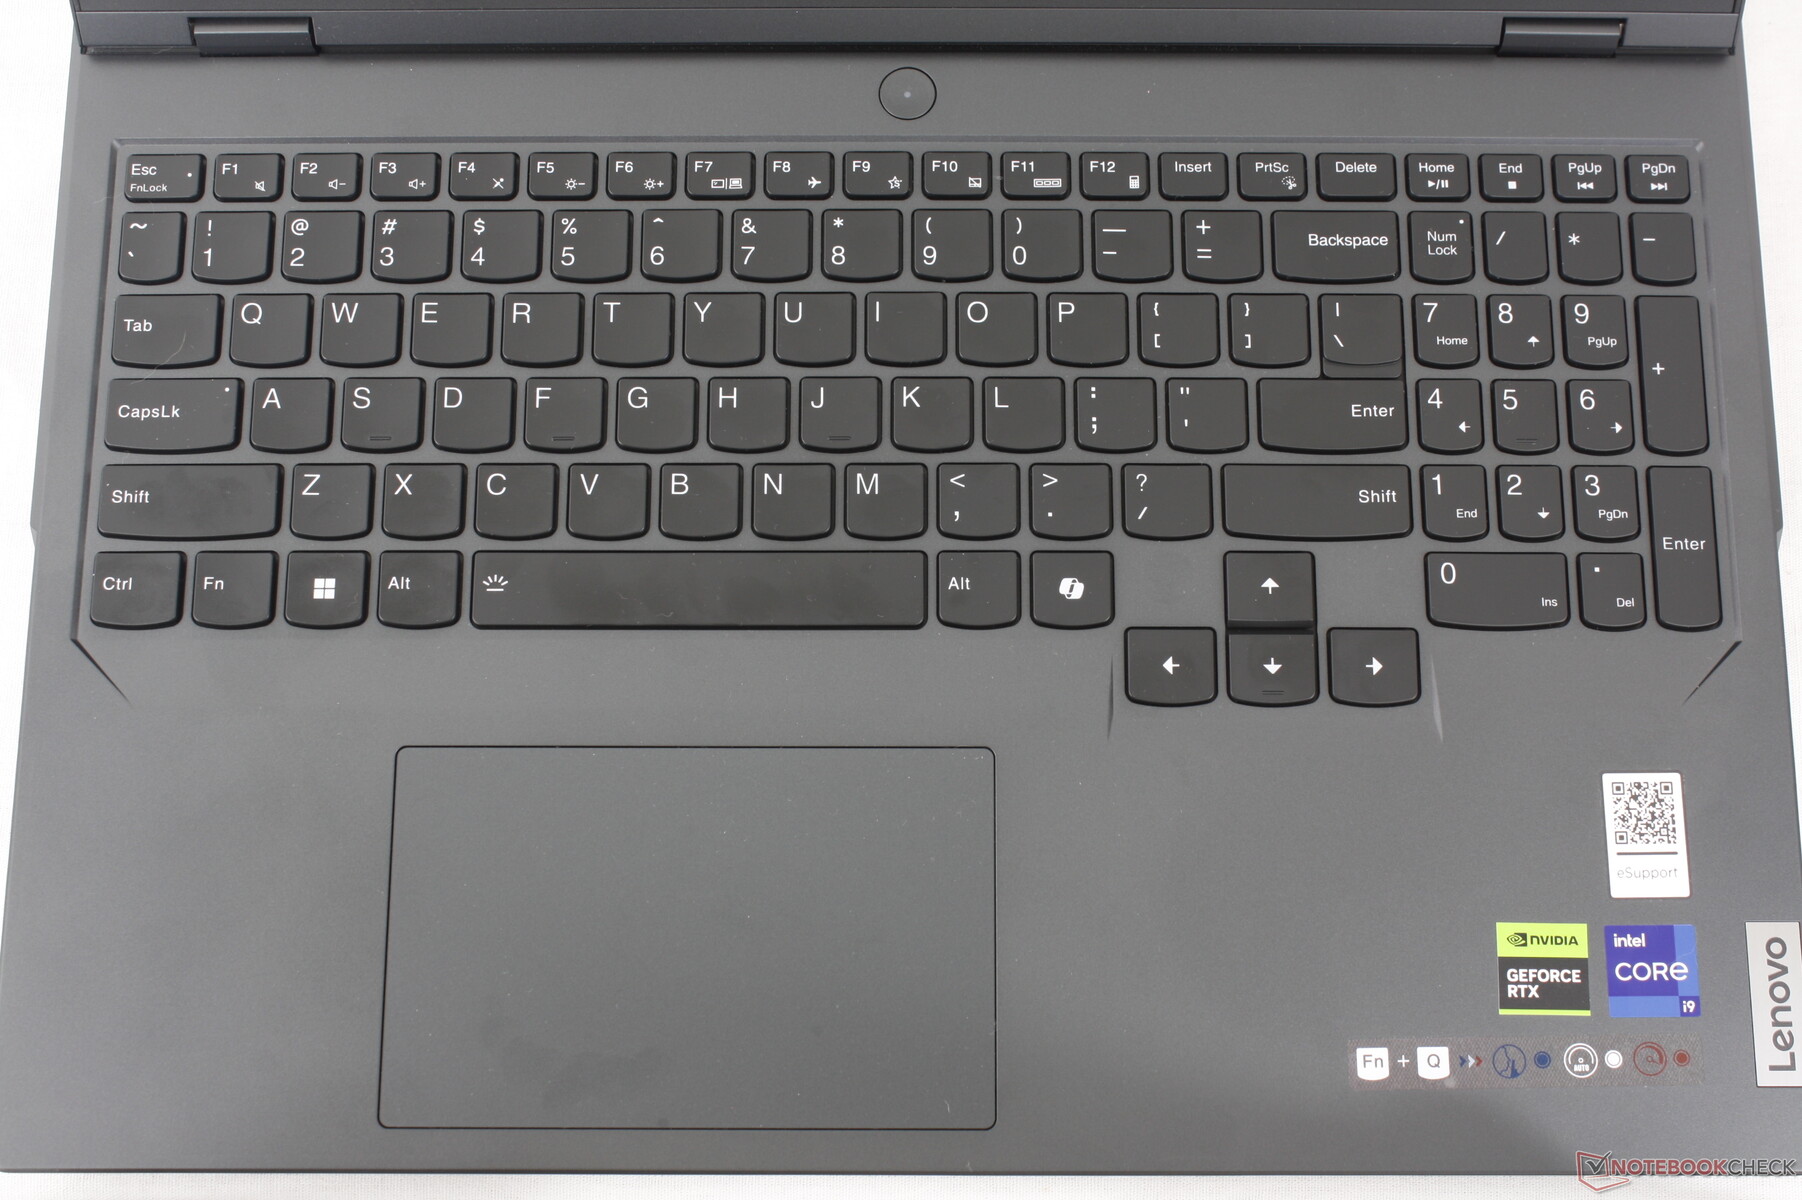
Clavier
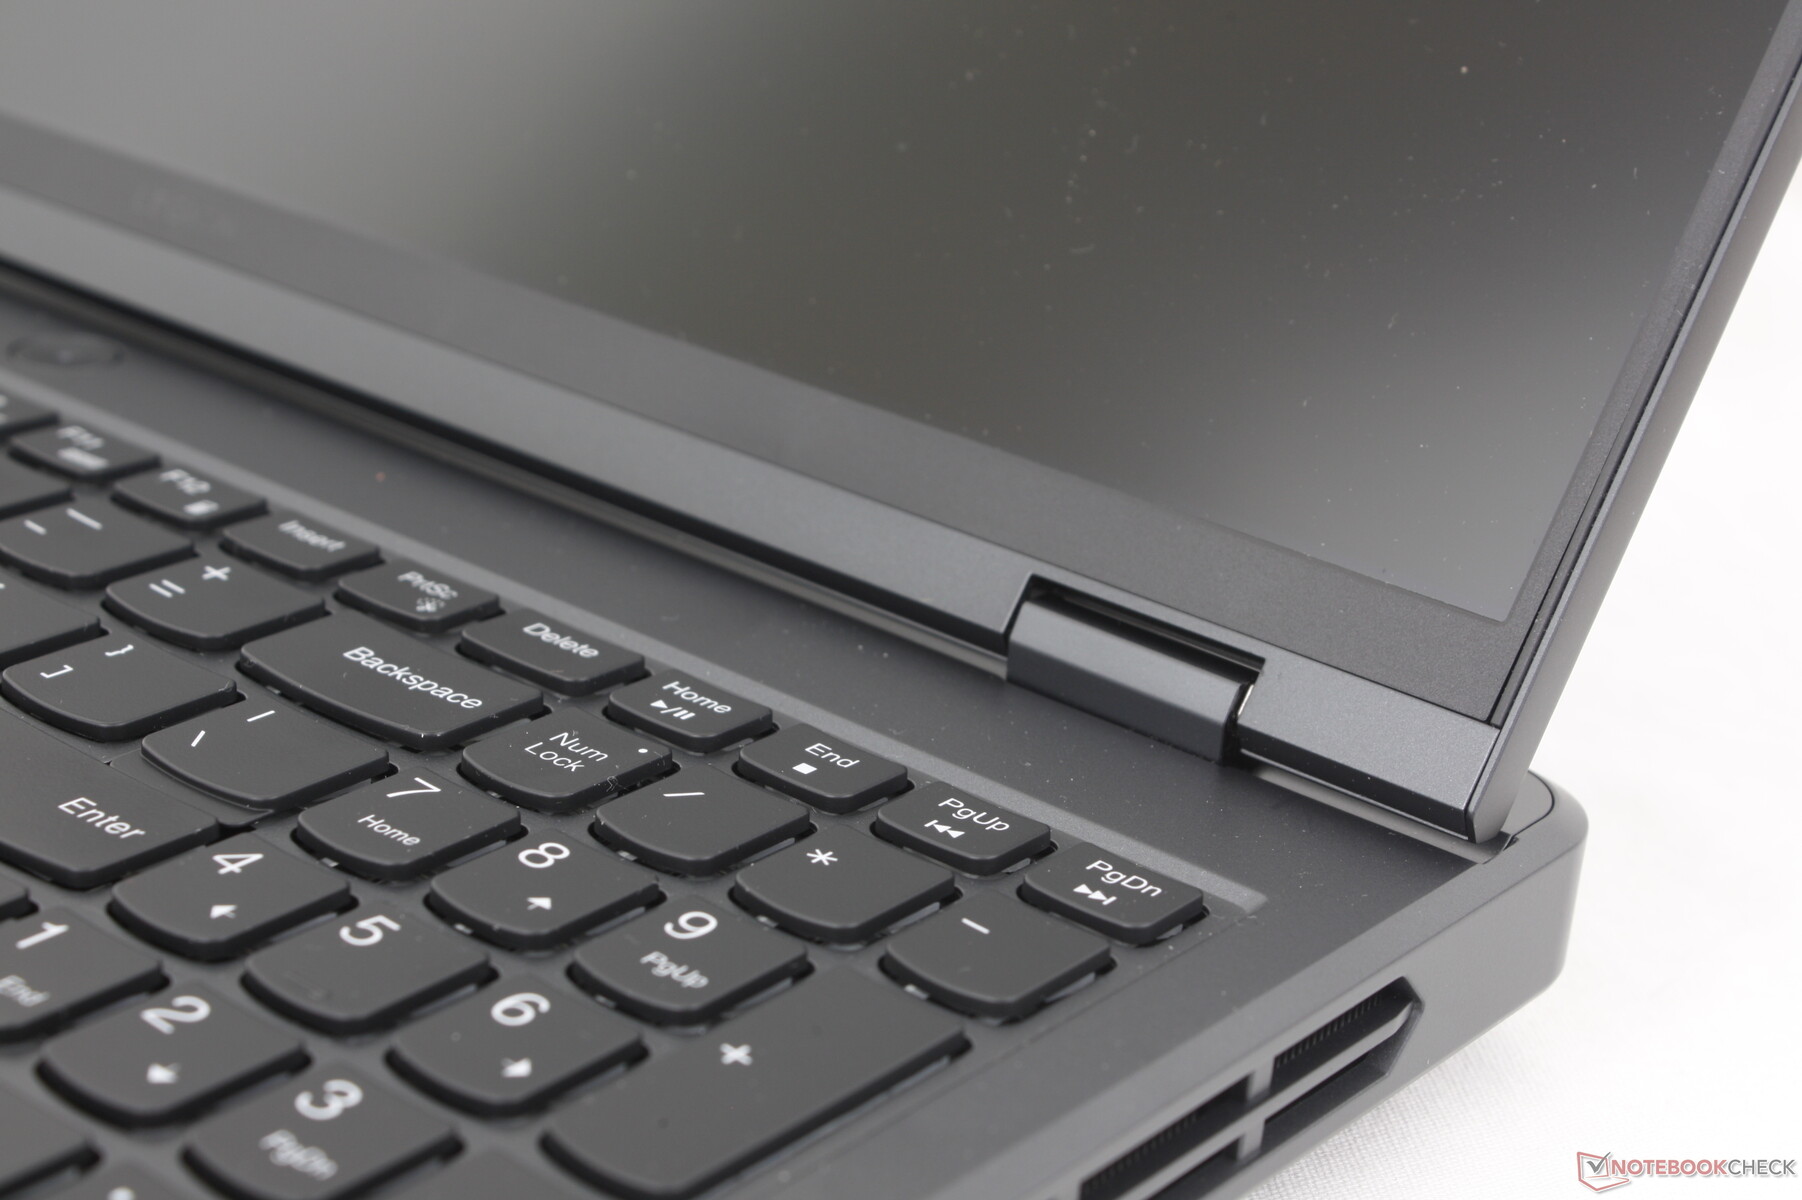
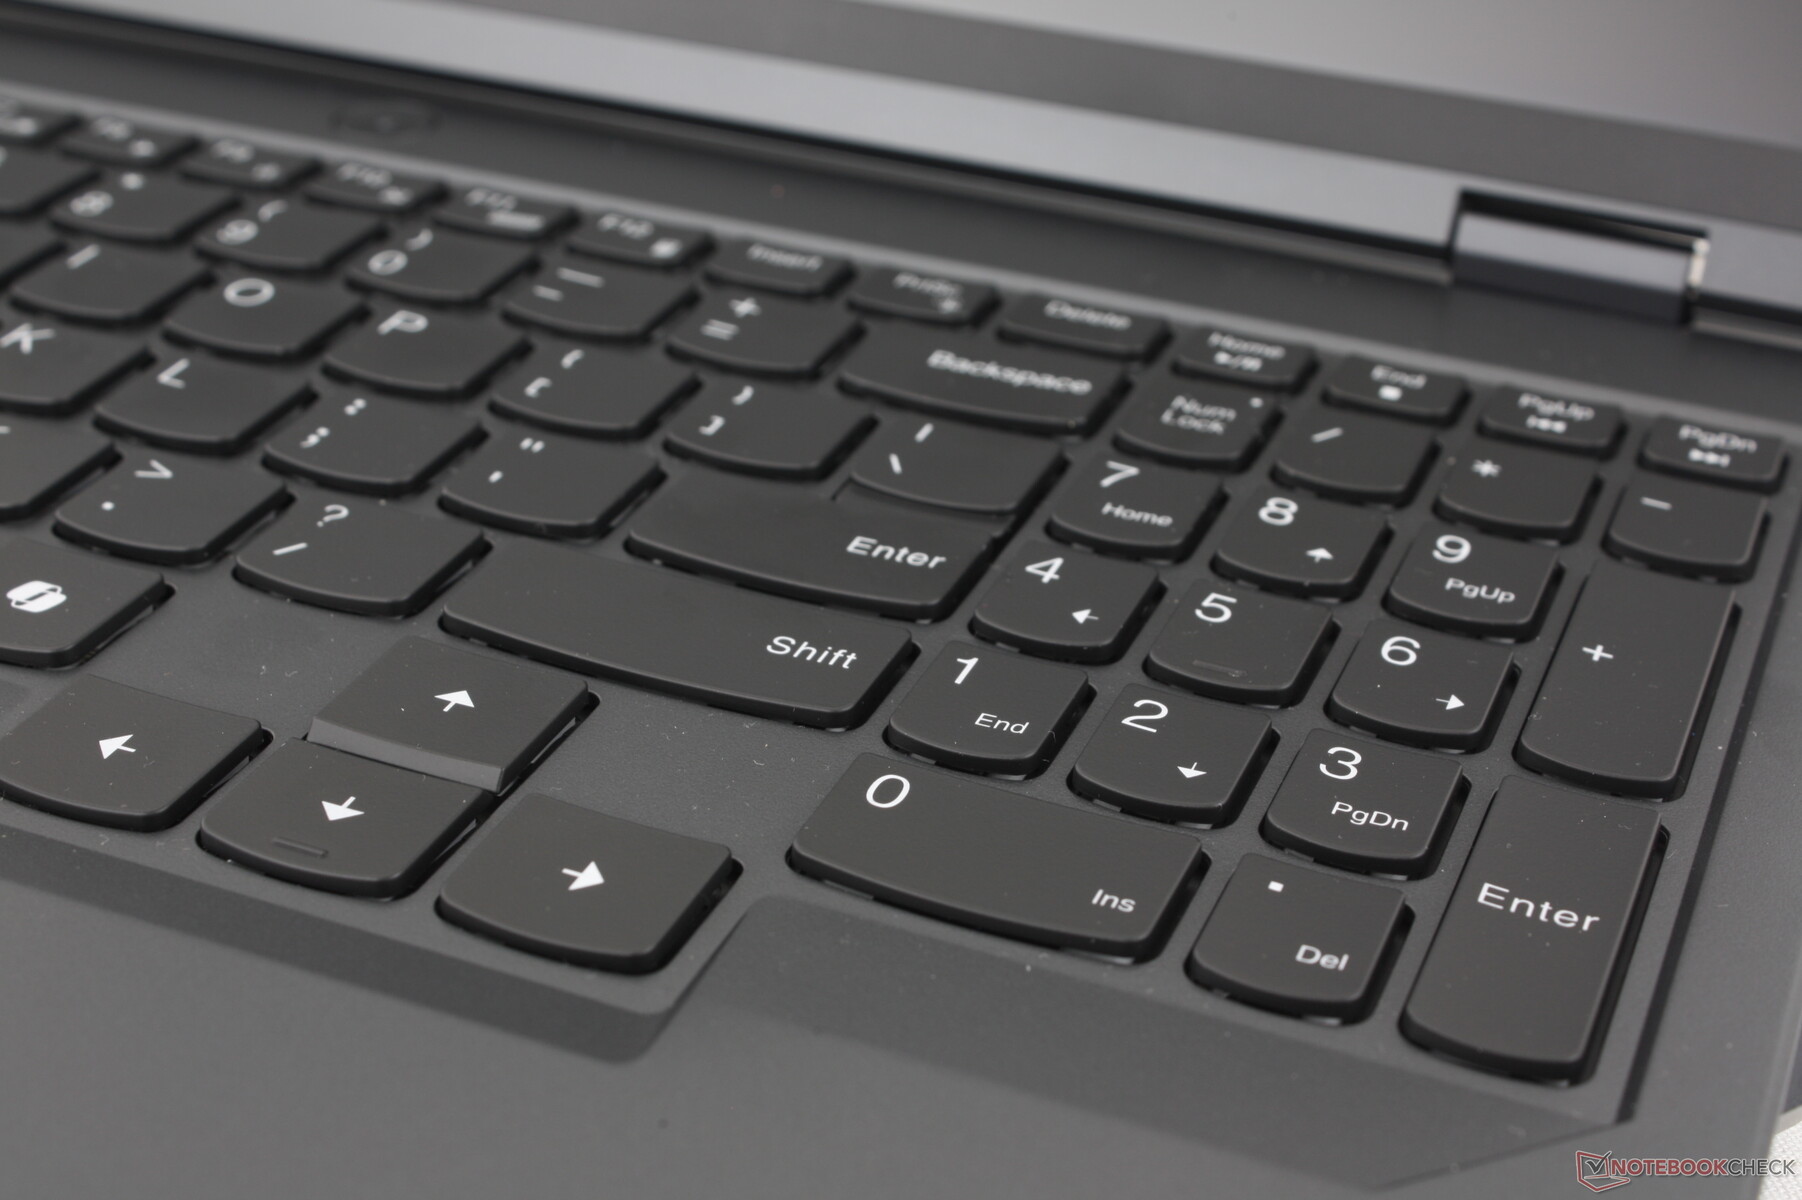
Comme sur le récent Yoga Slim 7 14 G9le Legion Pro 5 16 G9 a remplacé la seconde touche Ctrl par une touche Co-Pilot dédiée. Microsoft devrait lancer cette année une mise à jour importante de Windows autour de l'IA et la nouvelle touche est donc une façon pour Lenovo de préparer l'ordinateur portable à l'avenir.
Pour le reste, l'expérience de frappe est la même que sur le Legion Pro 5 16 G8, la taille des touches et les symboles n'ayant pas changé. Les modèles Legion restent l'un des rares ordinateurs portables de jeu à disposer à la fois d'un pavé numérique et de touches fléchées de taille normale.
Le rétroéclairage du clavier peut être configuré avec un éclairage RGB à une zone ou à quatre zones. Pour un éclairage RGB par touche, les utilisateurs devront se tourner vers la série Legion Pro 7, plus onéreuse.
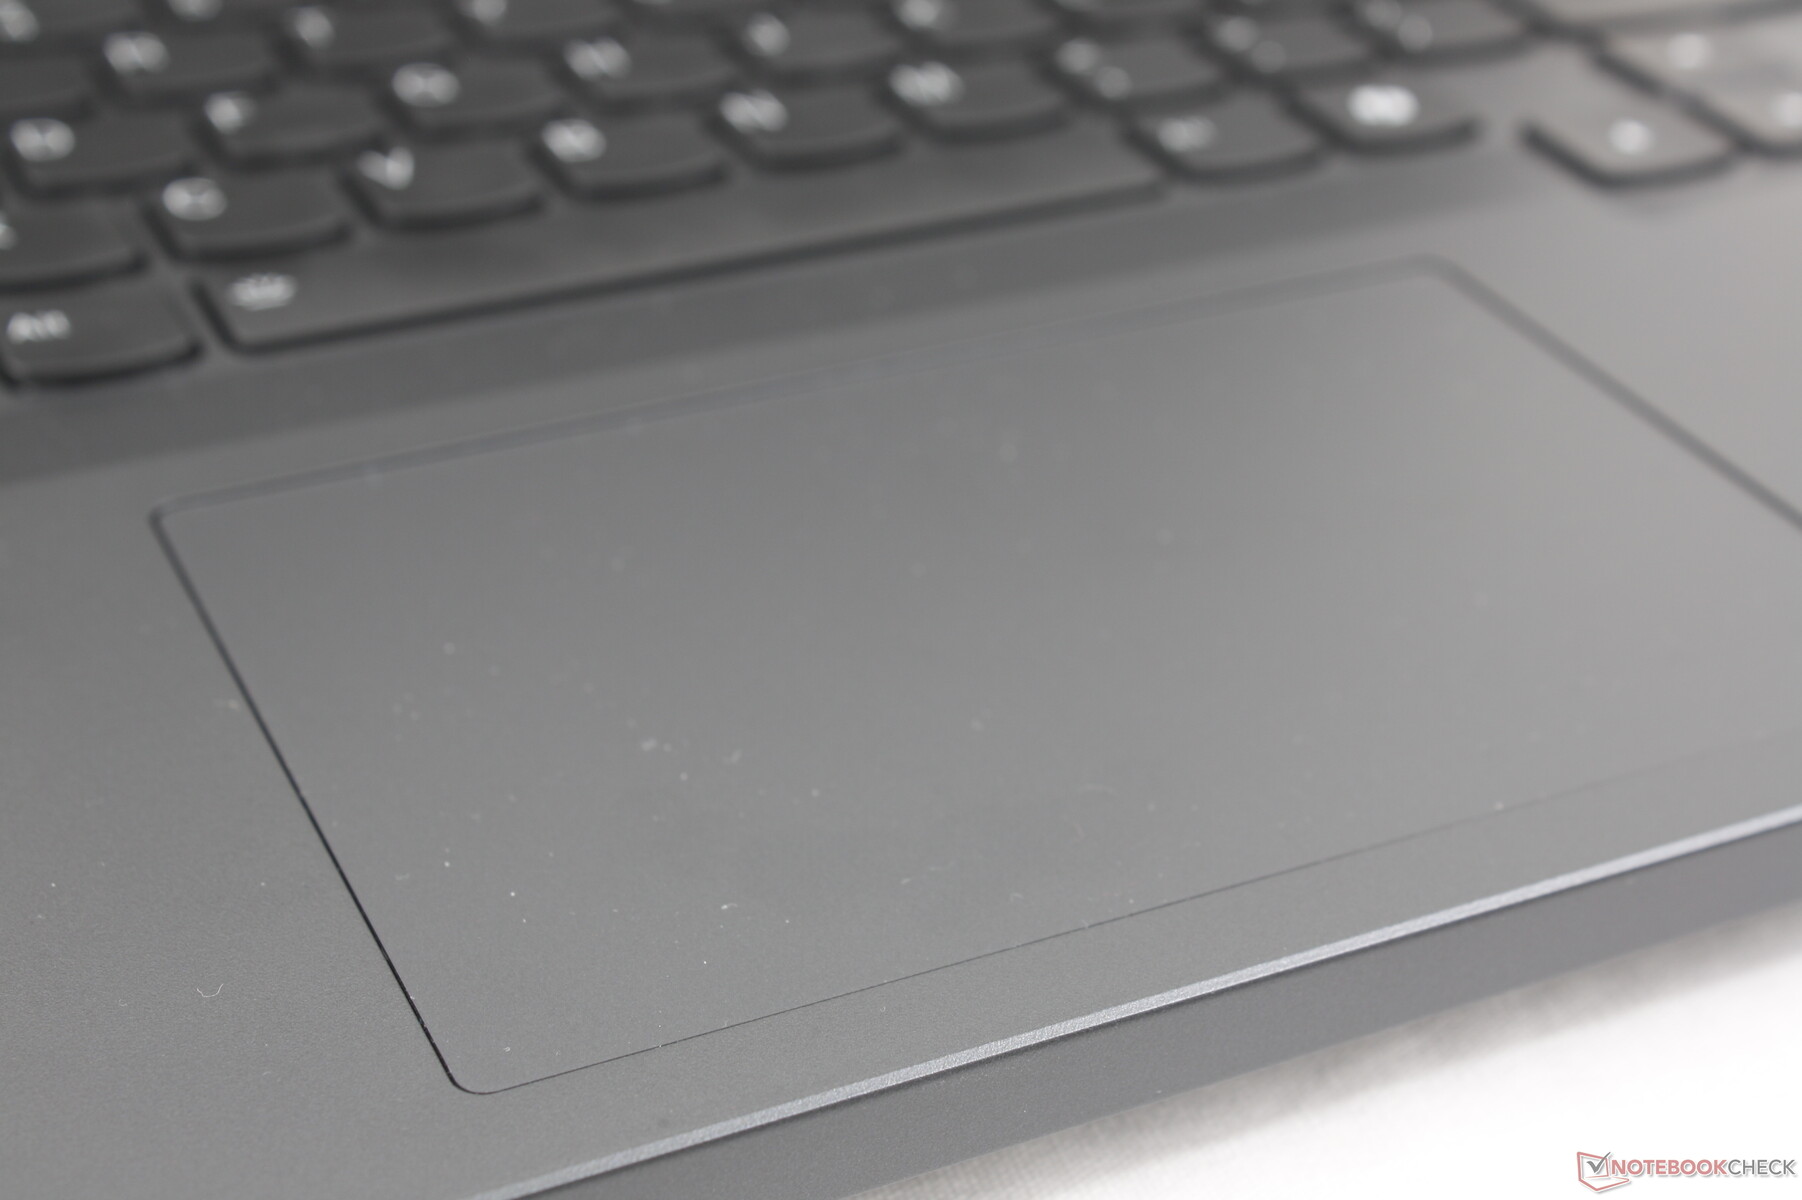
Pavé tactile
Le pavé tactile en Mylar est plus petit que celui du Razer Blade 16 (12 x 7,5 cm contre 17 x 9,7 cm), mais il reste suffisamment spacieux pour des tâches simples comme la navigation. Le clic reste superficiel et le retour d'information insuffisant, ce qui donne une sensation spongieuse peu satisfaisante.

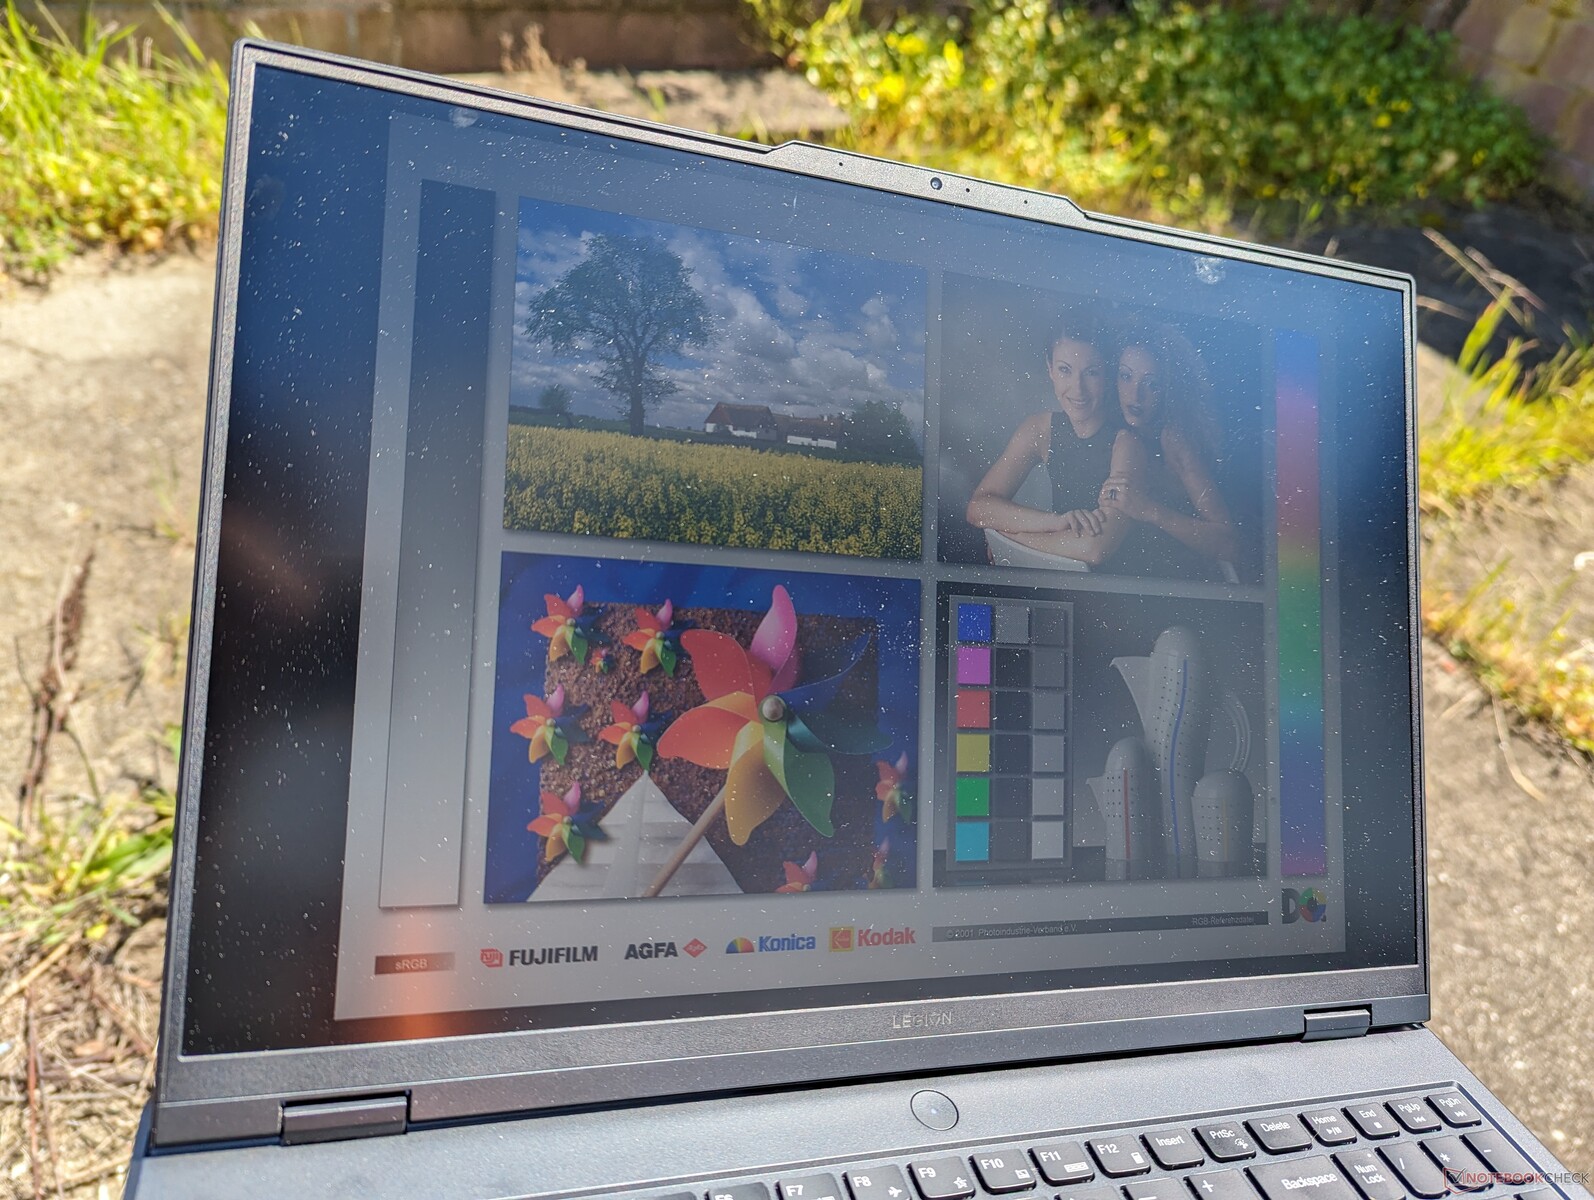
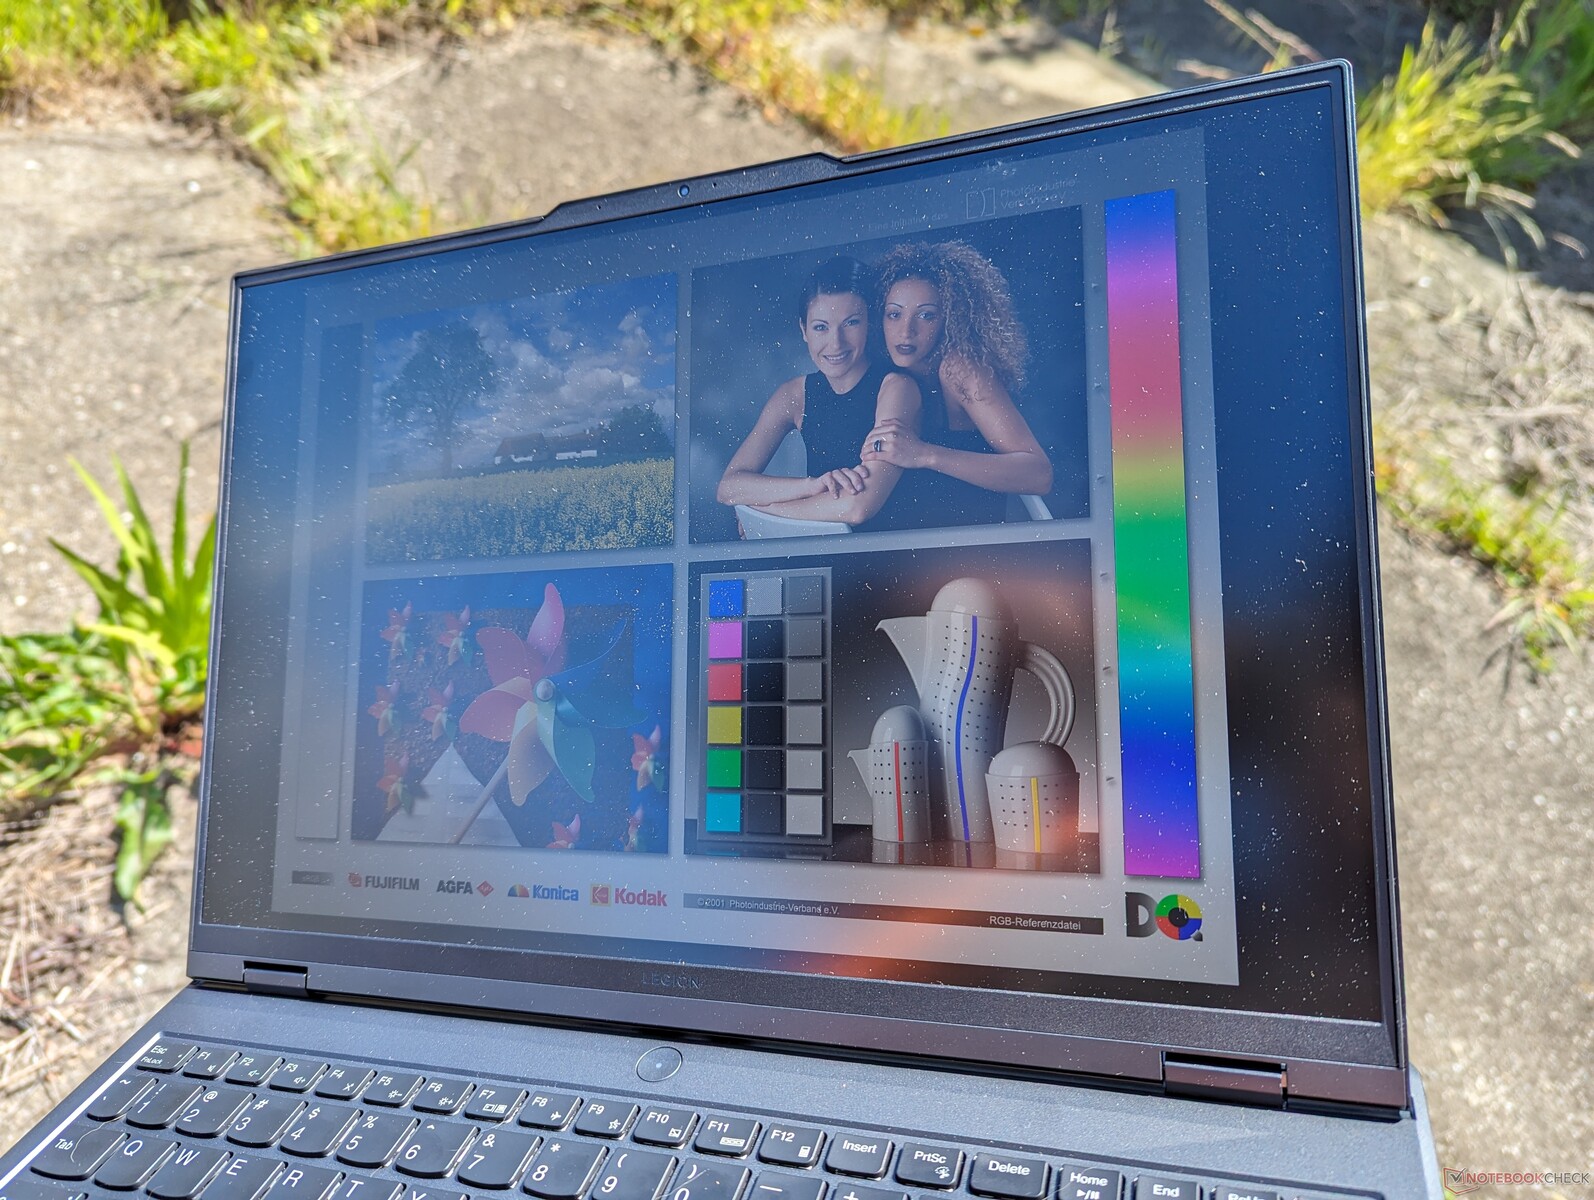
Affichage - sRGB complet et rafraîchissement rapide en standard
Trois options d'affichage sont désormais disponibles, alors que le modèle de l'année dernière n'en proposait que deux. Tous les écrans sont de type IPS mat avec prise en charge Advanced Optimus, mais seuls deux d'entre eux prennent en charge le HDR. Notre appareil de test est équipé de l'écran mis en évidence ci-dessous.
- 2560 x 1600, 300 nits, 100% sRGB, 165 Hz
- 2560 x 1600, 500 nits, 100% DCI-P3, 240 Hz, HDR400
- 2560 x 1600, 500 nits, 100% sRGB, 240 Hz, HDR400
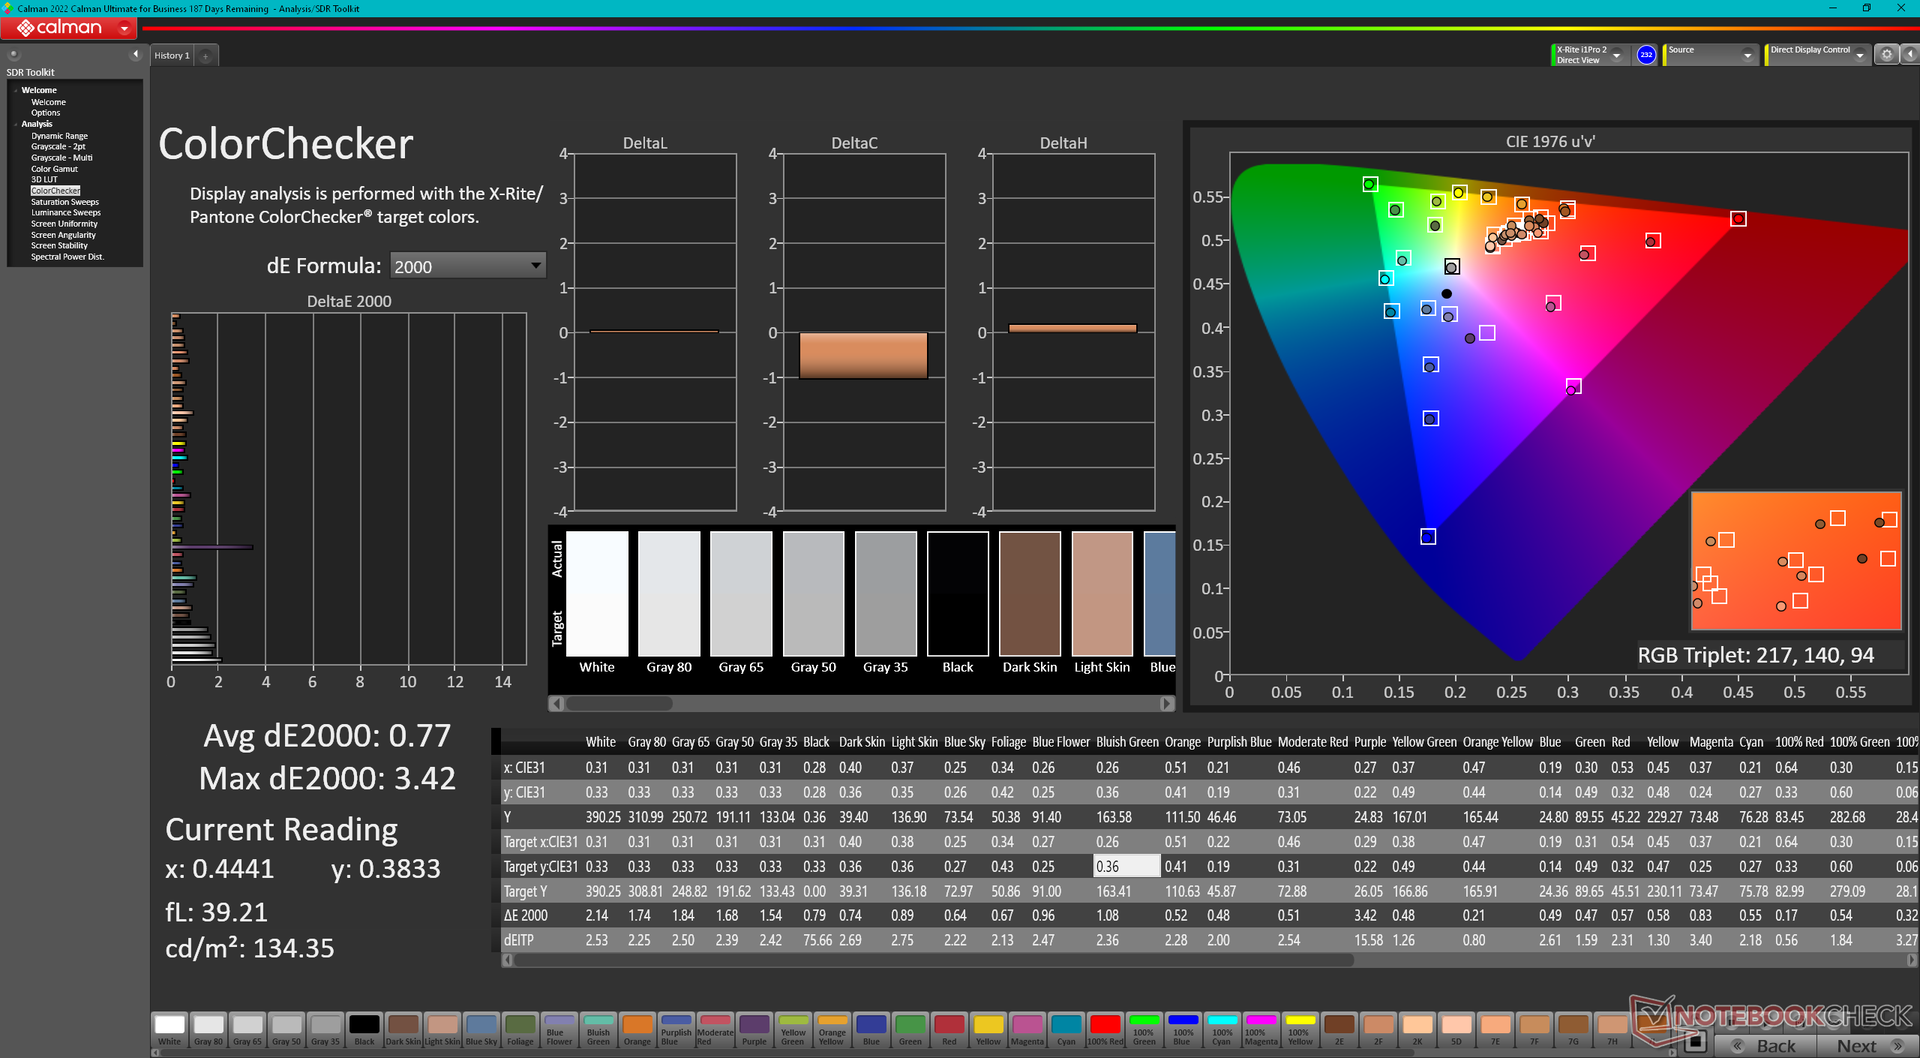
Il est intéressant de noter que notre unité de test utilise le BOE NE160QDM-NYC alors que le modèle de l'année dernière était équipé du AU Optronics B160QAN03.1. Les deux écrans offrent le même taux de rafraîchissement de 165 Hz, des temps de réponse noir-blanc rapides et des couleurs sRGB complètes pour une expérience visuelle similaire. Bien qu'il s'agisse d'un excellent écran pour les jeux et l'édition occasionnelle, il ne prend pas en charge la fréquence de rafraîchissement variable de Windows, une nouvelle fonctionnalité sur d'autres ordinateurs portables tels que le Framework Laptop 16. En outre, le HDR sur les panneaux IPS n'est pas aussi impressionnant que le HDR sur les panneaux OLED ou mini-LED en raison de leurs niveaux de noir plus profonds et de leurs blancs plus lumineux. Les utilisateurs devront plutôt passer à la série Legion Pro 9, plus onéreuse, pour bénéficier de ces fonctions d'affichage haut de gamme.


| |||||||||||||||||||||||||
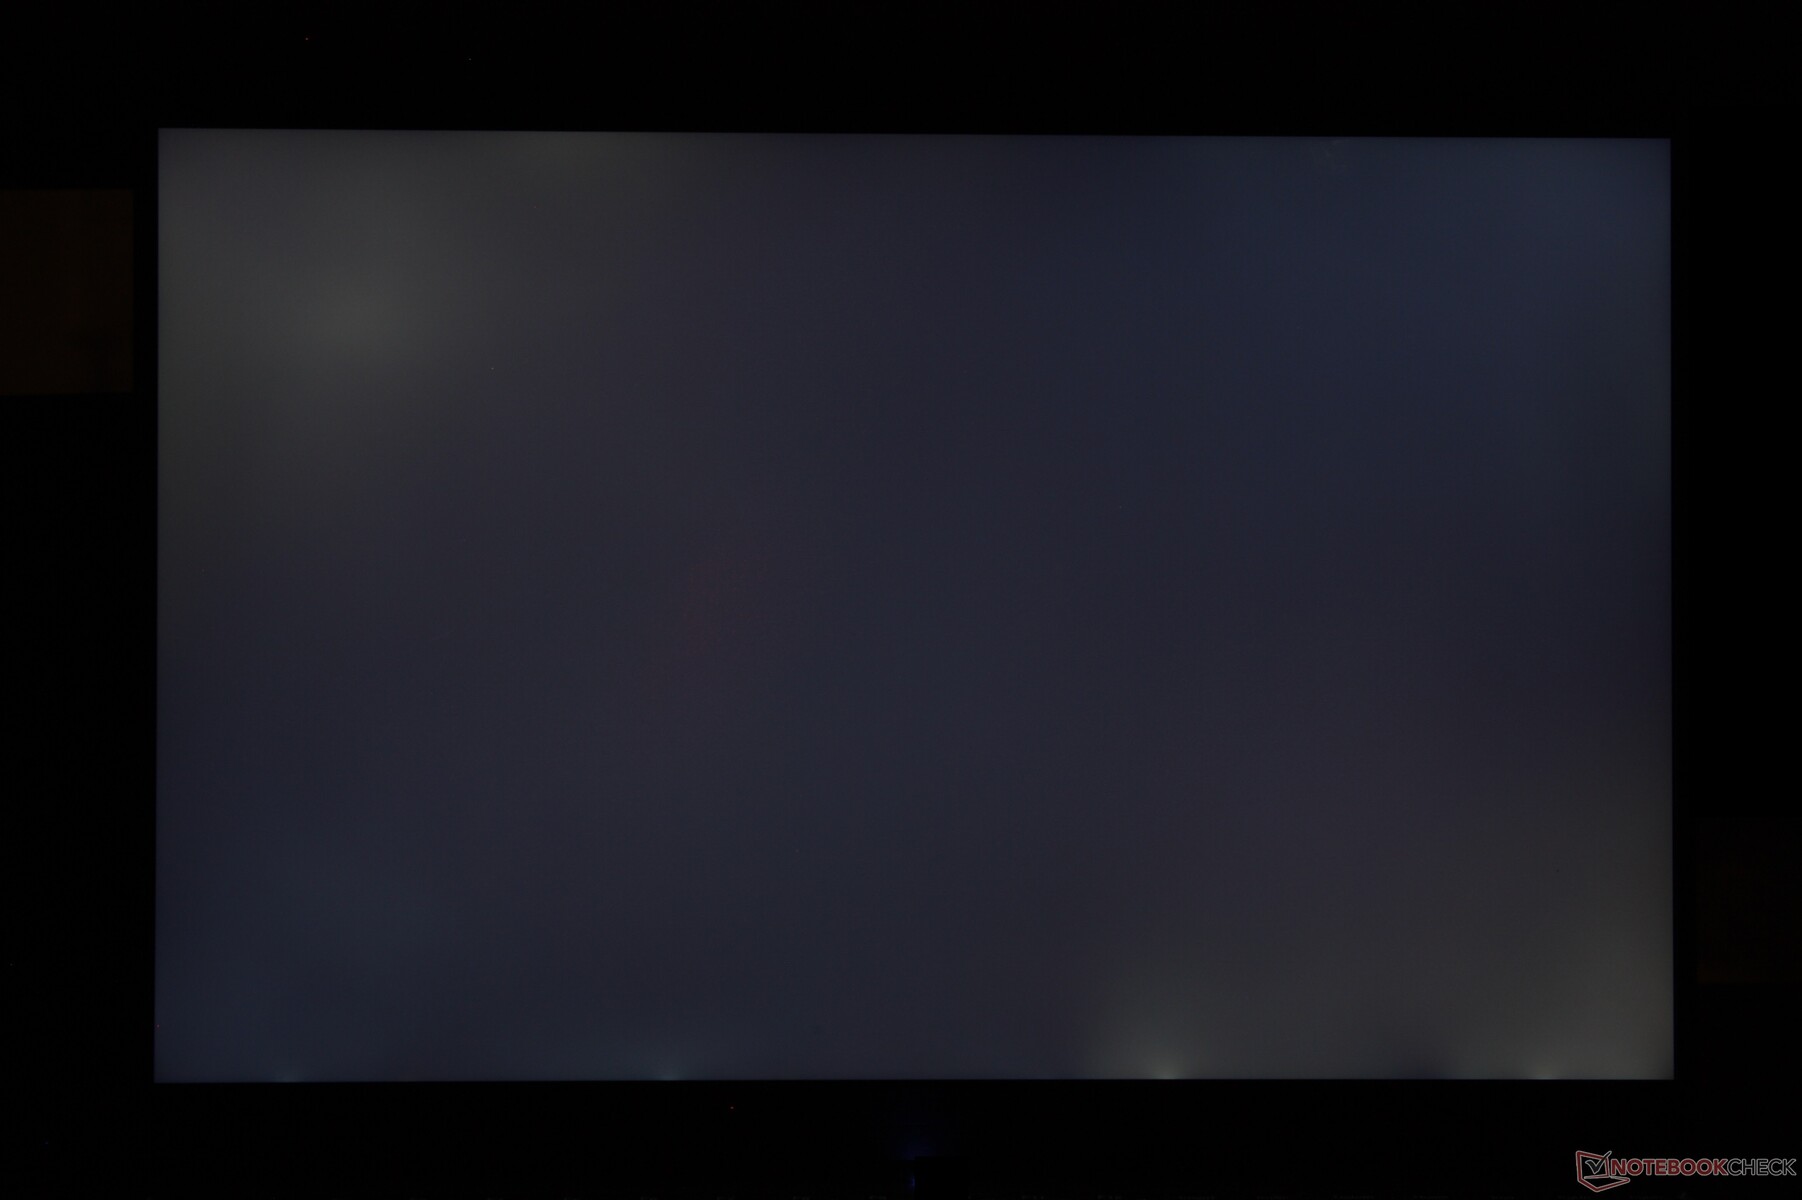
Homogénéité de la luminosité: 91 %
Valeur mesurée au centre, sur batterie: 384 cd/m²
Contraste: 1097:1 (Valeurs des noirs: 0.35 cd/m²)
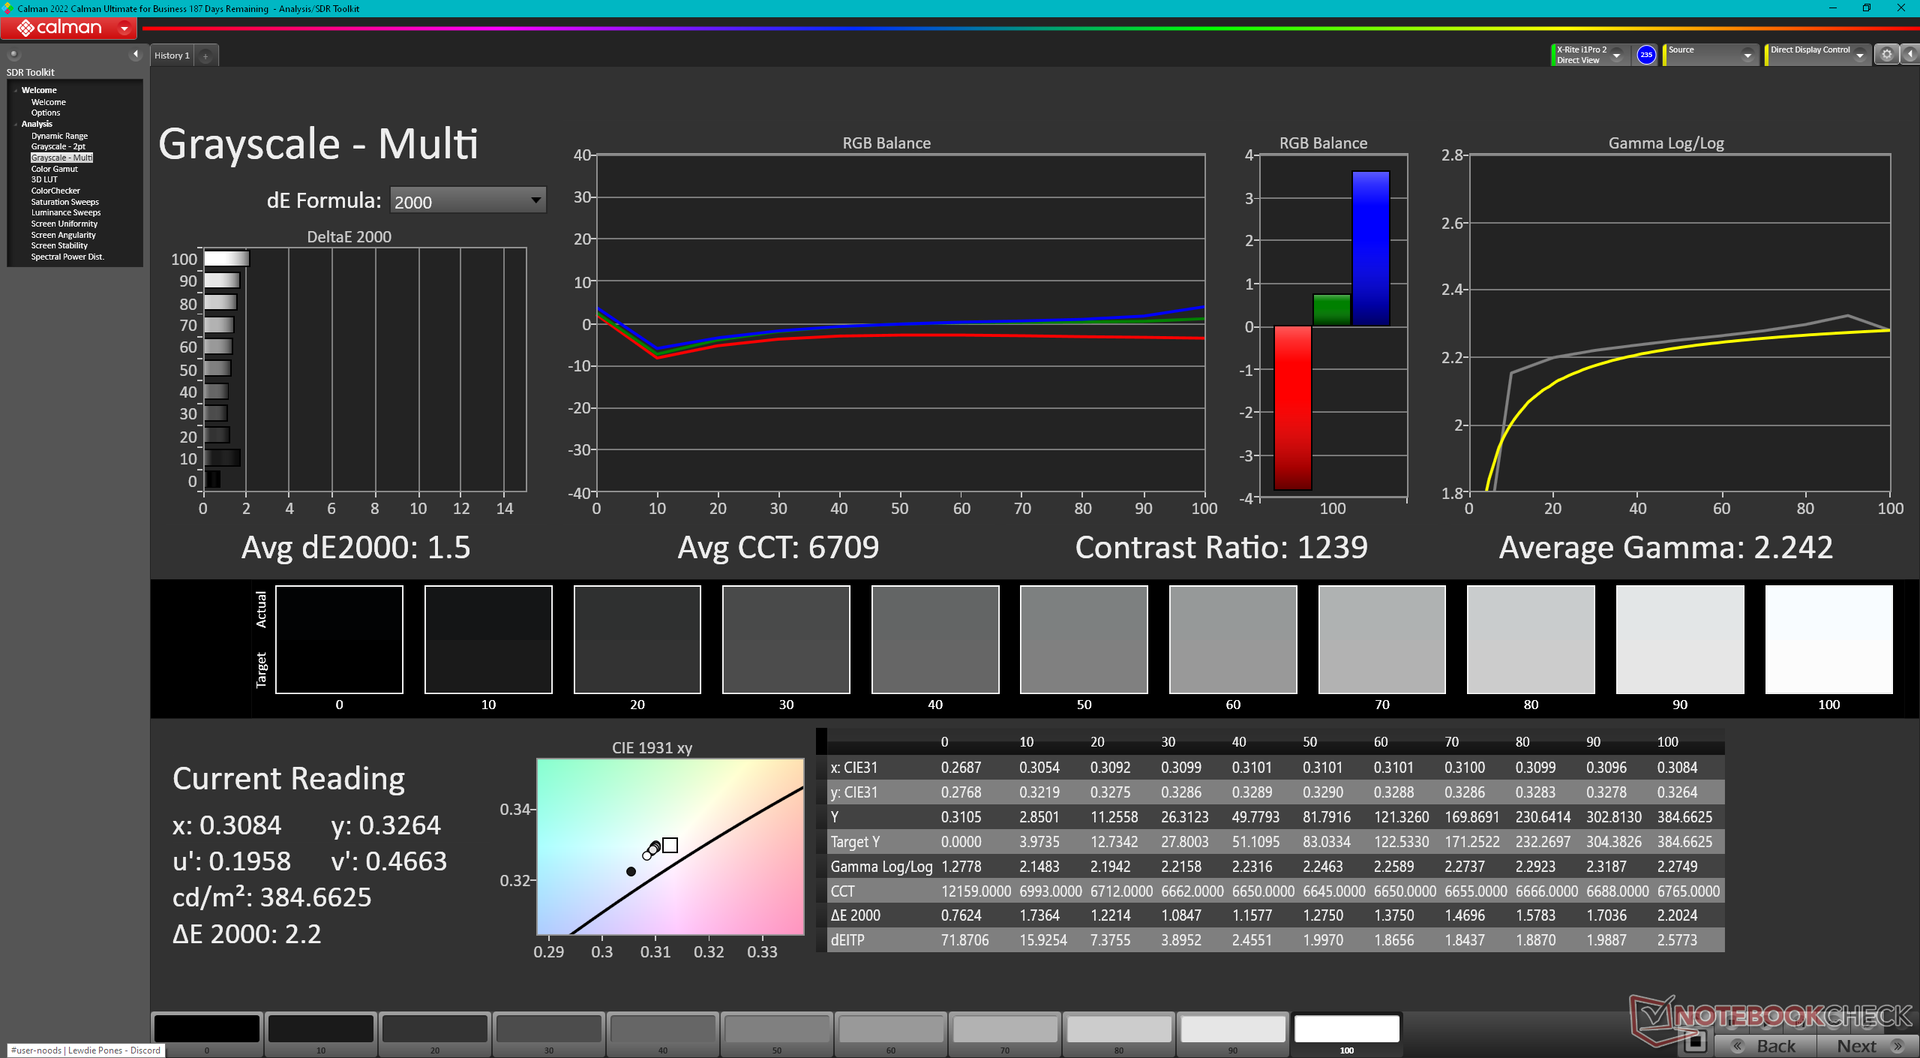
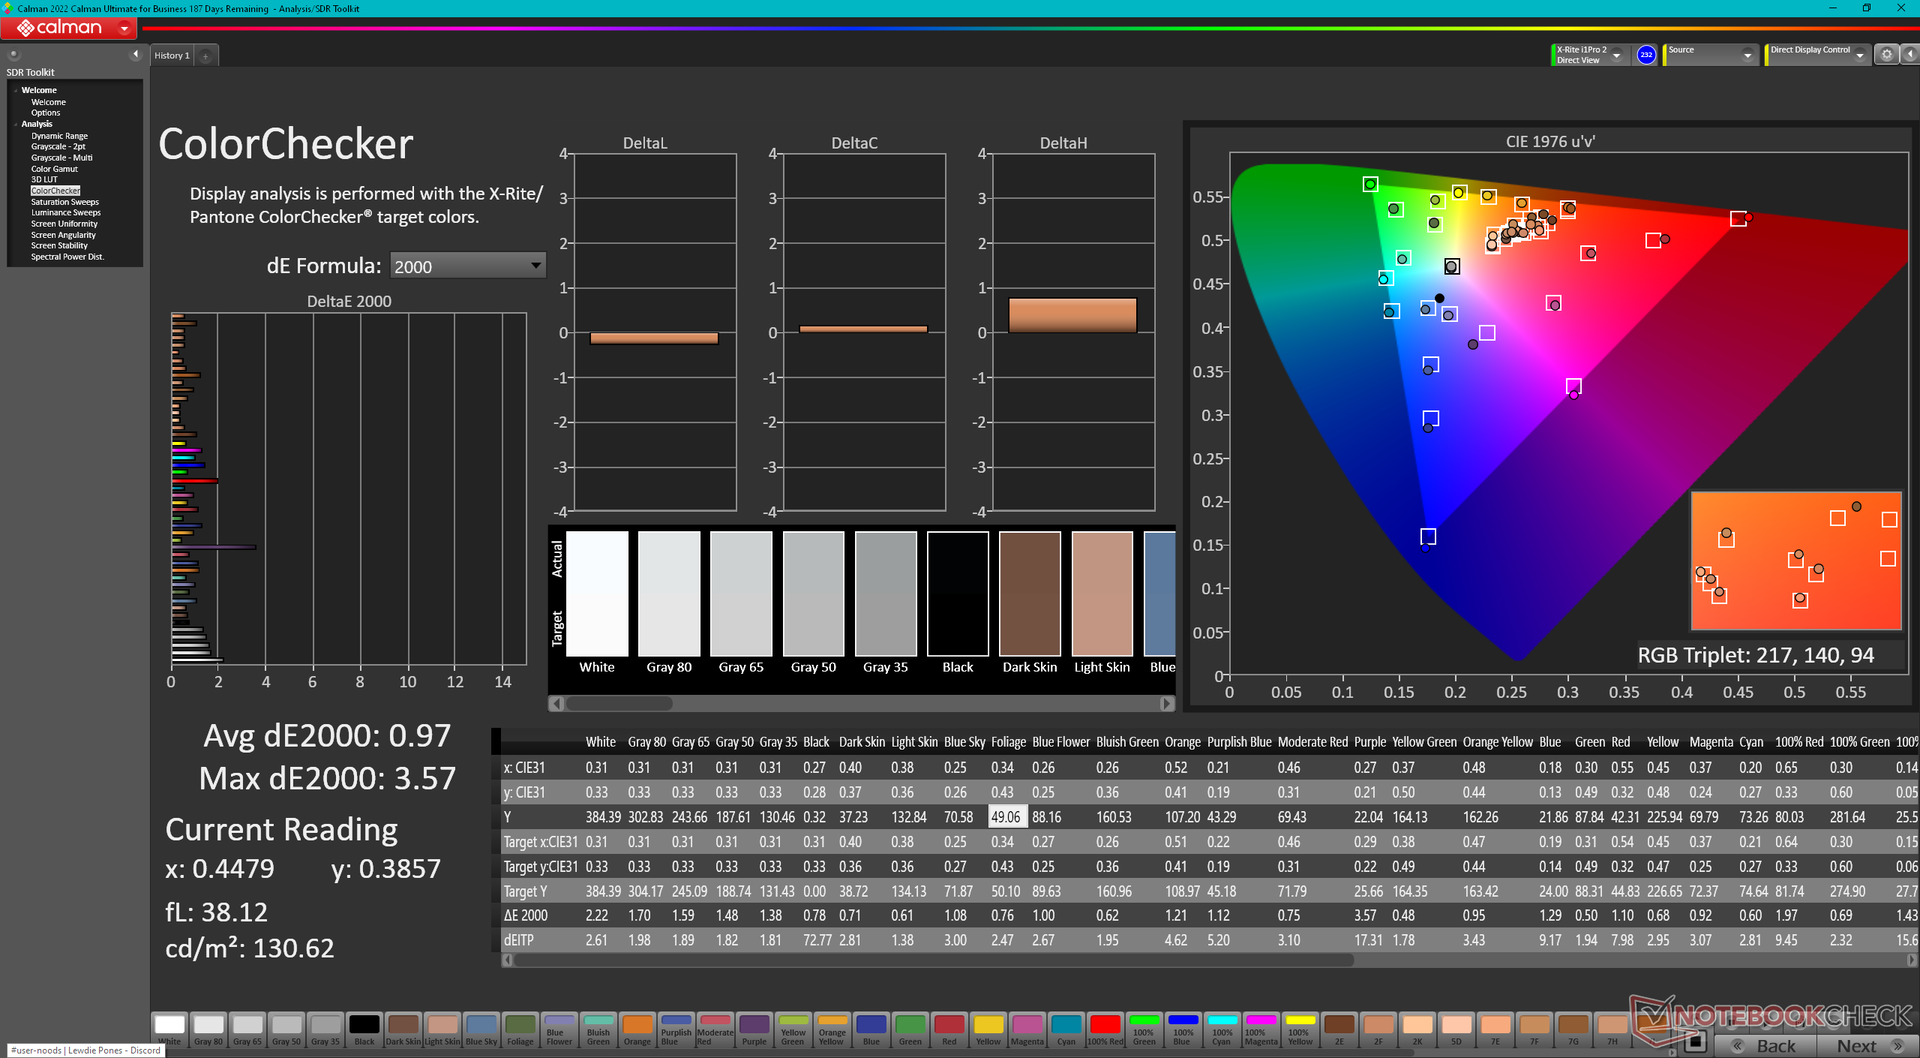
ΔE ColorChecker Calman: 0.97 | ∀{0.5-29.43 Ø4.71}
calibrated: 0.77
ΔE Greyscale Calman: 1.5 | ∀{0.09-98 Ø4.96}
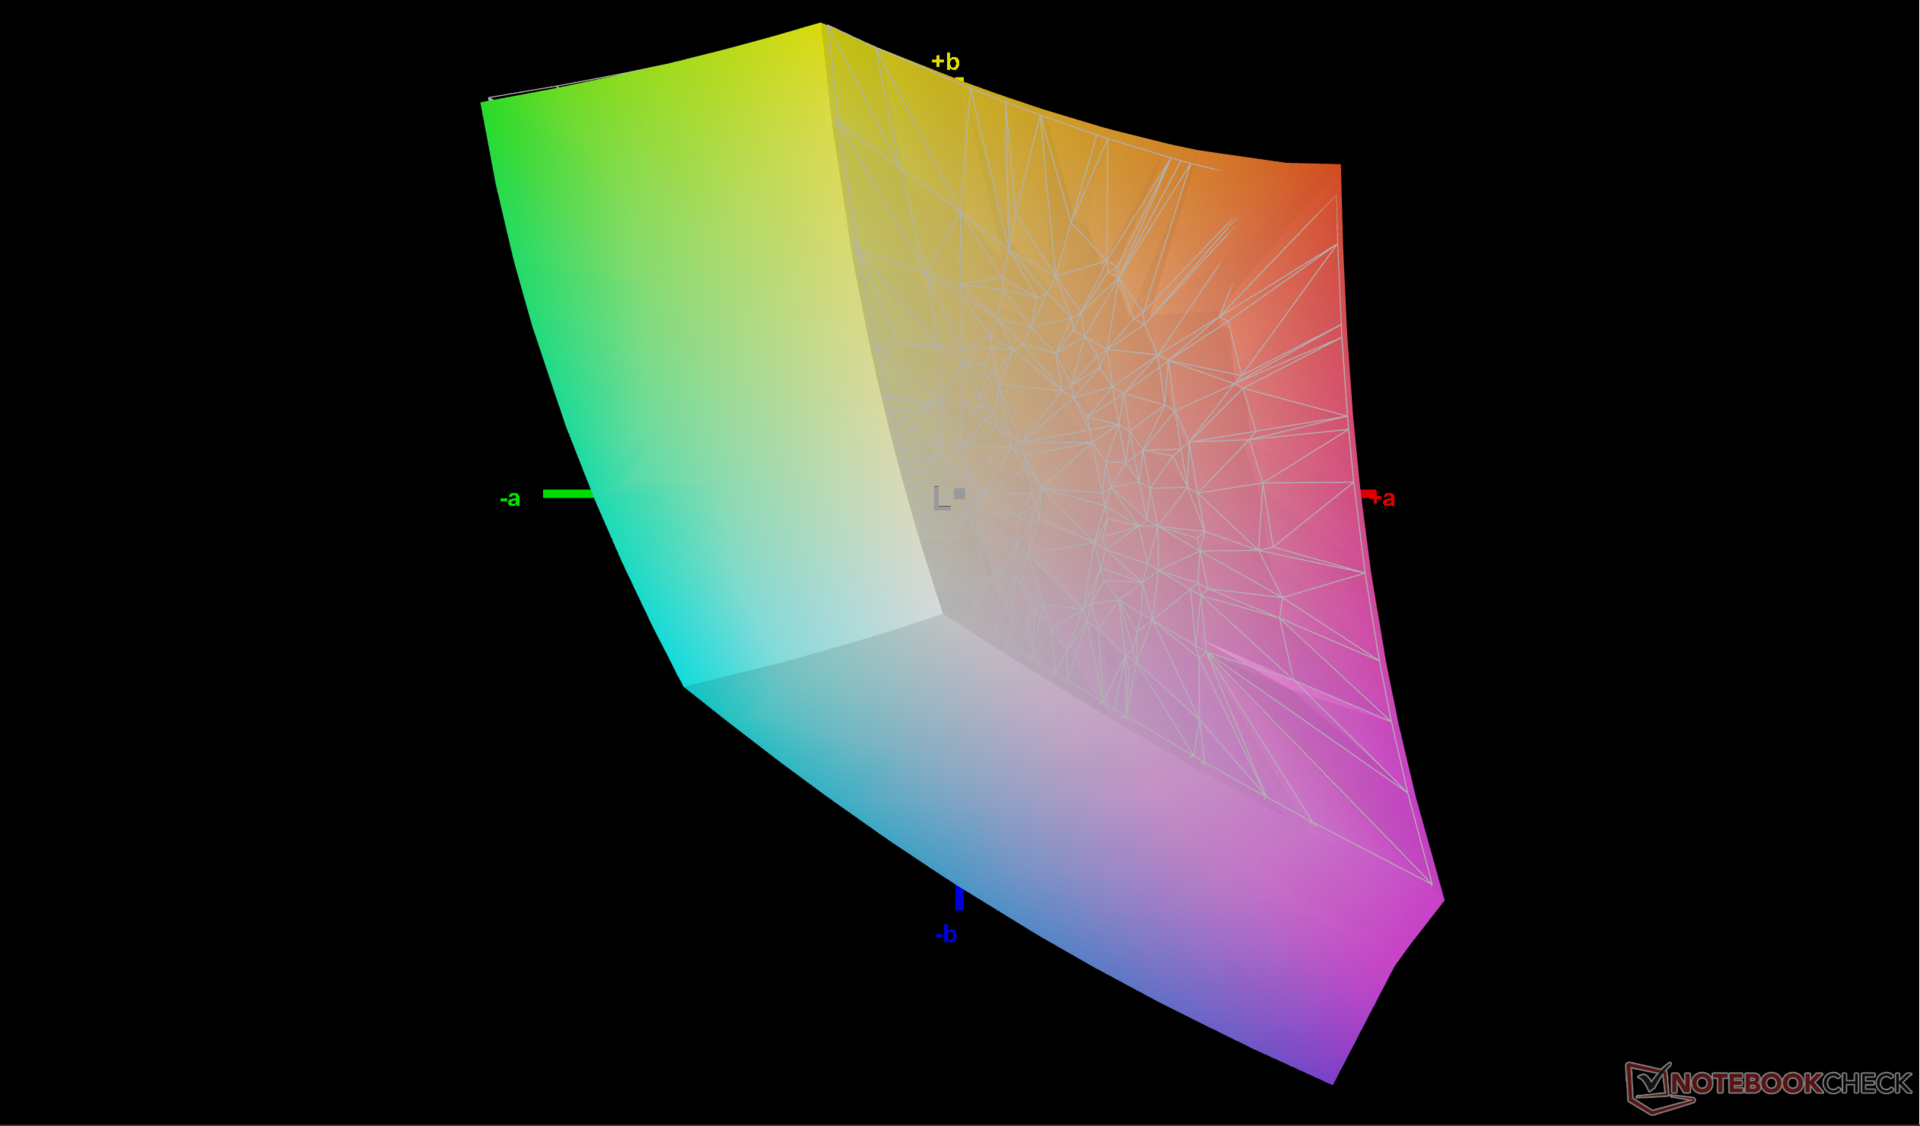
70.1% AdobeRGB 1998 (Argyll 3D)
99.4% sRGB (Argyll 3D)
69.3% Display P3 (Argyll 3D)
Gamma: 2.24
CCT: 6709 K
| Lenovo Legion Pro 5 16IRX9 BOE NE160QDM-NYC, IPS, 2560x1600, 16" | Lenovo Legion Pro 5 16IRX8 AU Optronics B160QAN03.1, IPS, 2560x1600, 16" | Alienware m16 R2 BOE NE16NYH, IPS, 2560x1600, 16" | HP Omen Transcend 16-u1095ng ATNA60DL02-0 (SDC41A4), OLED, 2560x1600, 16" | Asus ROG Zephyrus G16 2024 GU605M ATNA60DL01-0, OLED, 2560x1600, 16" | MSI Stealth 16 Mercedes-AMG Motorsport A13VG ATNA60YV09-0 (SDC4191), OLED, 3840x2400, 16" | |
|---|---|---|---|---|---|---|
| Display | 2% | 2% | 28% | 28% | 23% | |
| Display P3 Coverage (%) | 69.3 | 71.2 3% | 71 2% | 99.8 44% | 99.9 44% | 99.2 43% |
| sRGB Coverage (%) | 99.4 | 98.8 -1% | 100 1% | 100 1% | 100 1% | 99.9 1% |
| AdobeRGB 1998 Coverage (%) | 70.1 | 73.3 5% | 71.4 2% | 97 38% | 96.9 38% | 88.4 26% |
| Response Times | -20% | 27% | 98% | 98% | 87% | |
| Response Time Grey 50% / Grey 80% * (ms) | 11.9 ? | 14.5 ? -22% | 5.7 ? 52% | 0.2 ? 98% | 0.22 ? 98% | 1.5 ? 87% |
| Response Time Black / White * (ms) | 8.9 ? | 10.4 ? -17% | 8.7 ? 2% | 0.2 ? 98% | 0.25 ? 97% | 1.2 ? 87% |
| PWM Frequency (Hz) | 120 ? | 960 ? | 60 ? | |||
| Screen | -5% | -14% | 136% | -13% | 5% | |
| Brightness middle (cd/m²) | 384 | 405.7 6% | 345.8 -10% | 390 2% | 416 8% | 382 -1% |
| Brightness (cd/m²) | 366 | 368 1% | 337 -8% | 392 7% | 418 14% | 383 5% |
| Brightness Distribution (%) | 91 | 87 -4% | 87 -4% | 98 8% | 96 5% | 96 5% |
| Black Level * (cd/m²) | 0.35 | 0.38 -9% | 0.3 14% | 0.02 94% | ||
| Contrast (:1) | 1097 | 1068 -3% | 1153 5% | 19500 1678% | ||
| Colorchecker dE 2000 * | 0.97 | 1.65 -70% | 1.99 -105% | 1.94 -100% | 1.6 -65% | 0.84 13% |
| Colorchecker dE 2000 max. * | 3.57 | 4.2 -18% | 3.52 1% | 4.26 -19% | 2.1 41% | 3.39 5% |
| Colorchecker dE 2000 calibrated * | 0.77 | 0.53 31% | 0.62 19% | 4.21 -447% | 0.8 -4% | |
| Greyscale dE 2000 * | 1.5 | 1.2 20% | 2.1 -40% | 1.5 -0% | 2.7 -80% | 1.3 13% |
| Gamma | 2.24 98% | 2.3 96% | 2.32 95% | 2.221 99% | 2.16 102% | 2.166 102% |
| CCT | 6709 97% | 6453 101% | 6369 102% | 6395 102% | 6331 103% | 6550 99% |
| Moyenne finale (programmes/paramètres) | -8% /
-6% | 5% /
-5% | 87% /
107% | 38% /
18% | 38% /
23% |
* ... Moindre est la valeur, meilleures sont les performances
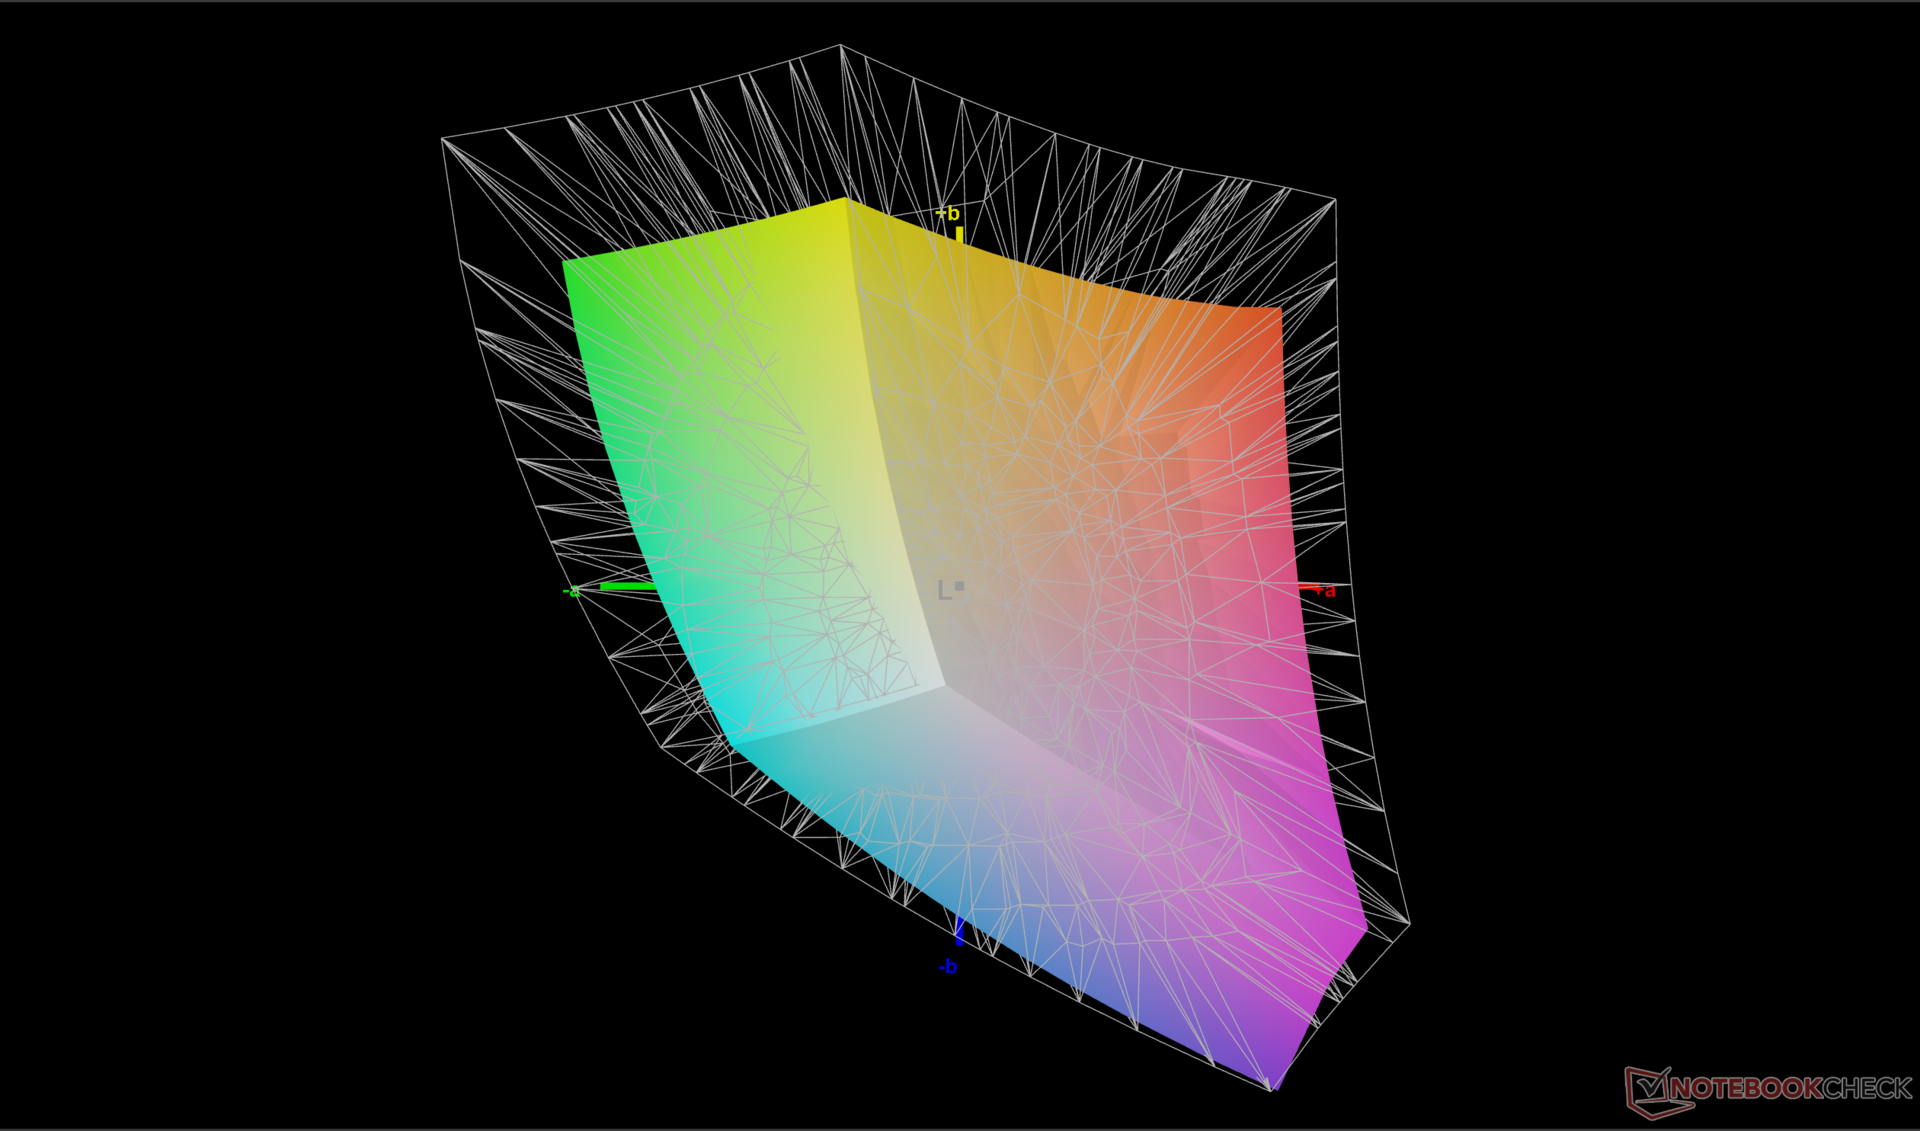
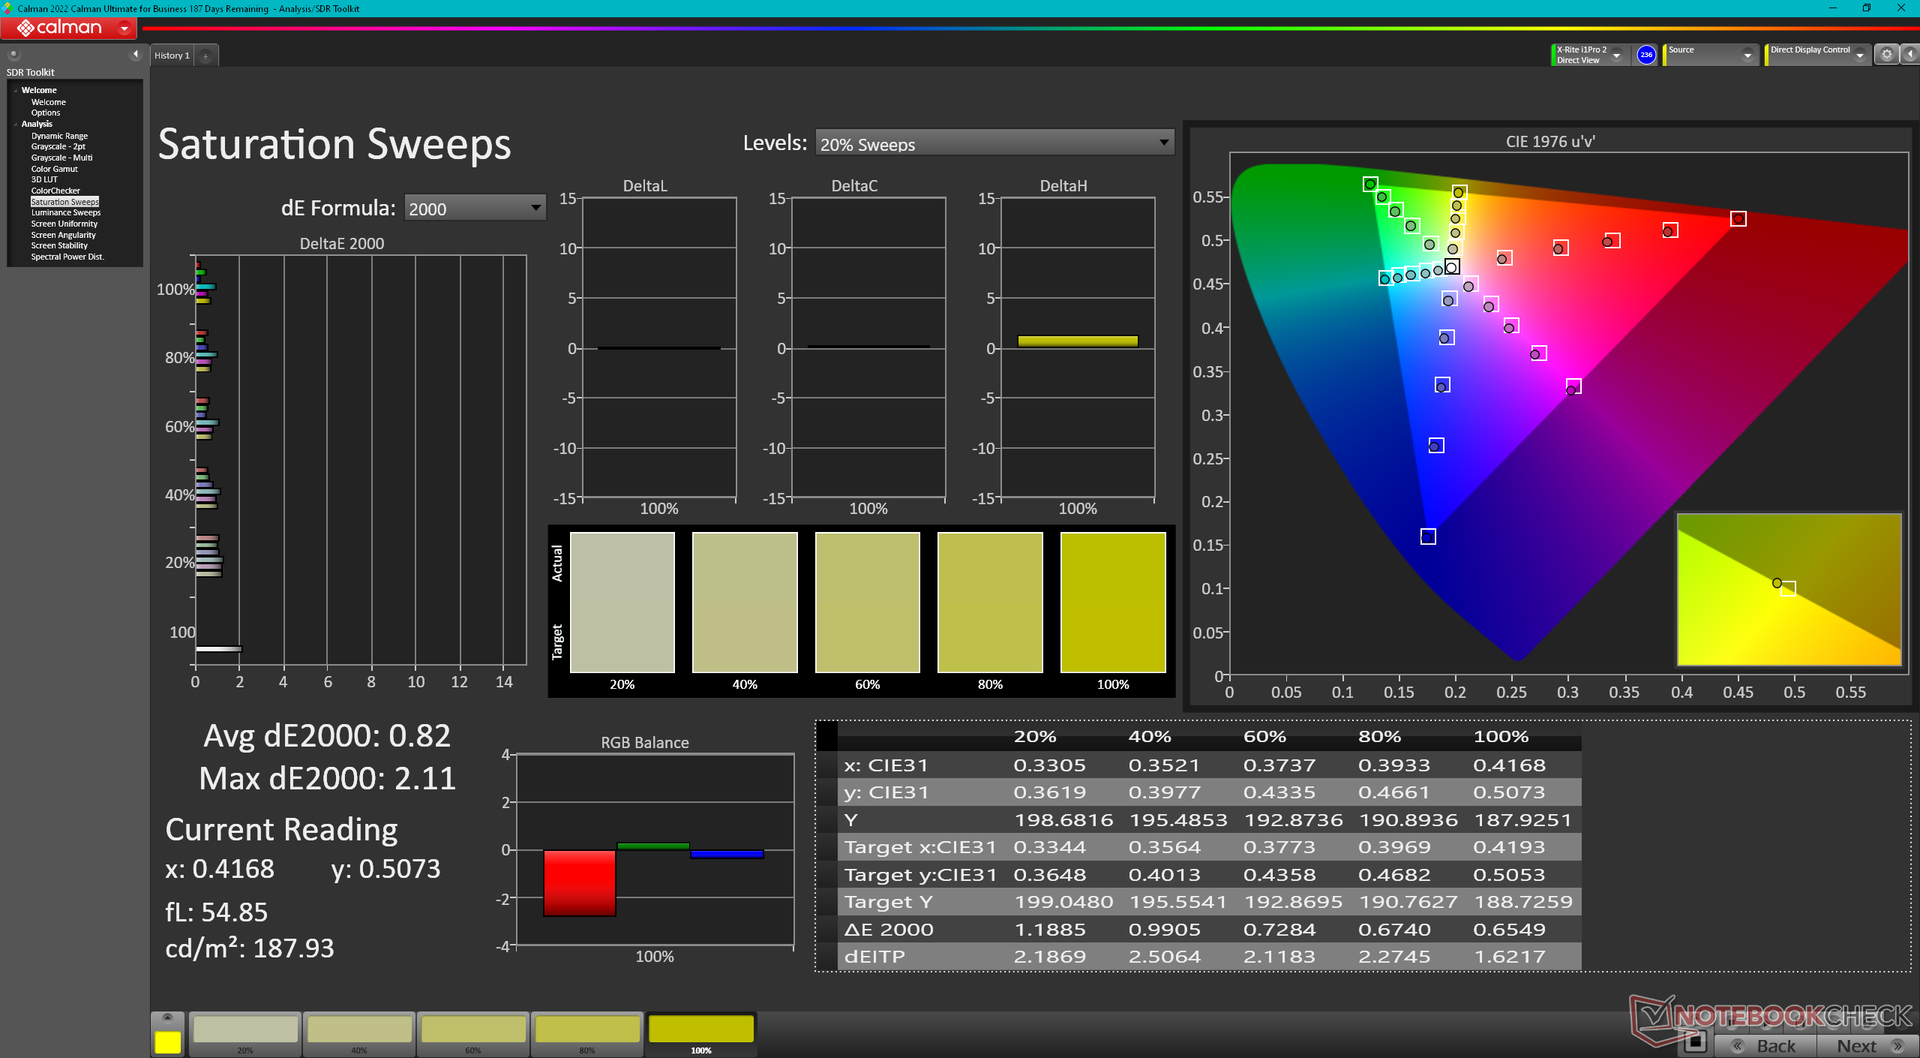
L'écran est pré-calibré avec des valeurs moyennes d'échelle de gris et de couleur deltaE de seulement 1,5 et 0,97, respectivement, ce qui est surprenant pour un ordinateur portable de jeu de milieu de gamme. La plupart des utilisateurs n'ont donc pas besoin de calibrer l'écran.


Temps de réponse de l'écran
| ↔ Temps de réponse noir à blanc | ||
|---|---|---|
| 8.9 ms ... hausse ↗ et chute ↘ combinées | ↗ 4.8 ms hausse | 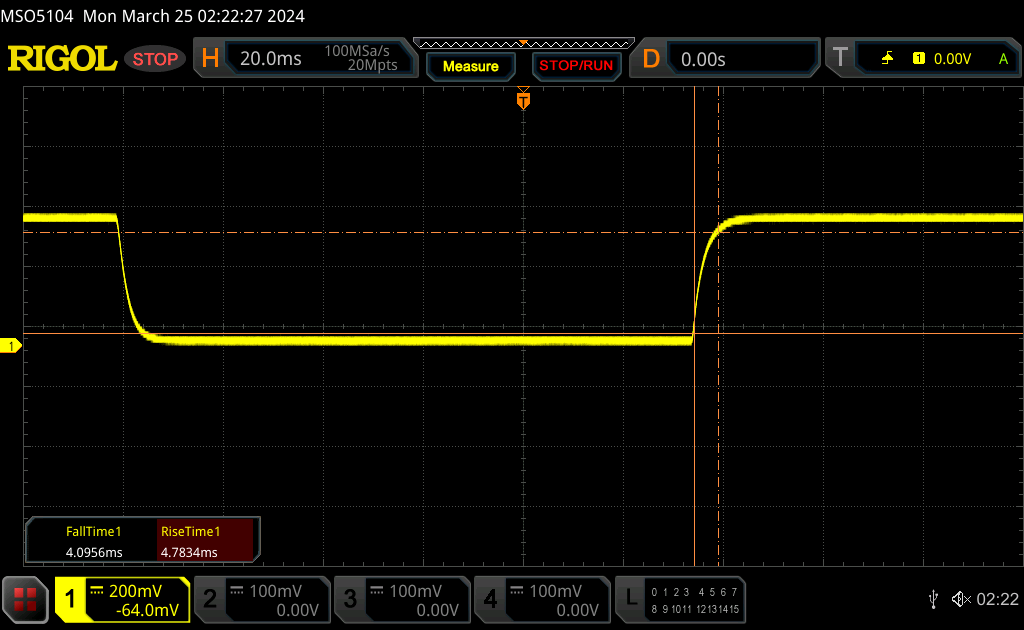 |
| ↘ 4.1 ms chute | ||
| L'écran montre de faibles temps de réponse, un bon écran pour jouer. En comparaison, tous les appareils testés affichent entre 0.1 (minimum) et 240 (maximum) ms. » 25 % des appareils testés affichent de meilleures performances. Cela signifie que les latences relevées sont meilleures que la moyenne (19.8 ms) de tous les appareils testés. | ||
| ↔ Temps de réponse gris 50% à gris 80% | ||
| 11.9 ms ... hausse ↗ et chute ↘ combinées | ↗ 5.5 ms hausse | 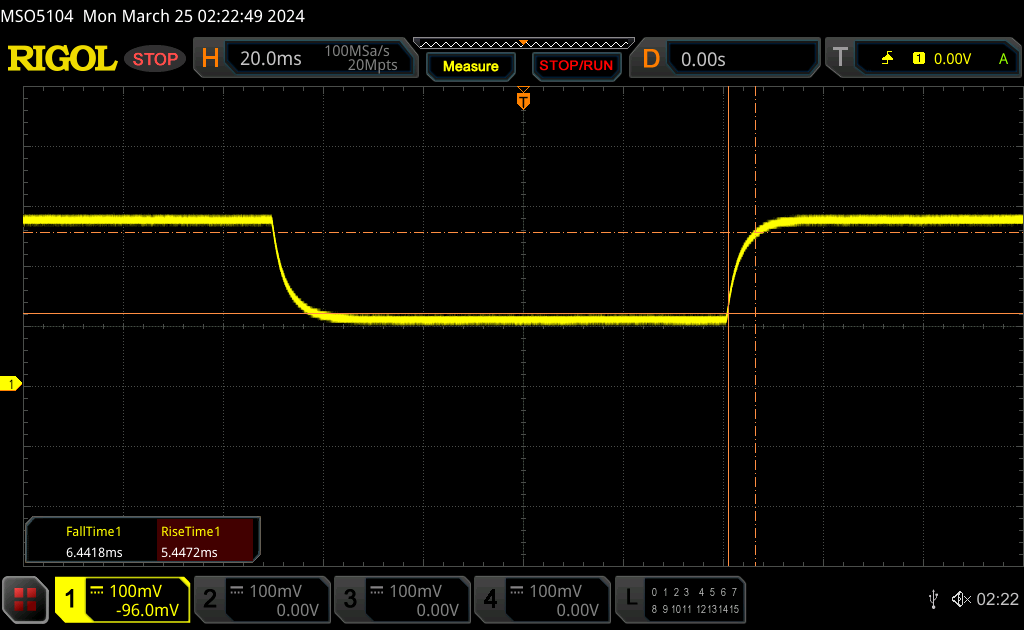 |
| ↘ 6.4 ms chute | ||
| L'écran montre de bons temps de réponse, mais insuffisant pour du jeu compétitif. En comparaison, tous les appareils testés affichent entre 0.165 (minimum) et 636 (maximum) ms. » 25 % des appareils testés affichent de meilleures performances. Cela signifie que les latences relevées sont meilleures que la moyenne (30.9 ms) de tous les appareils testés. | ||
Scintillement / MLI (Modulation de largeur d'impulsion)
| Scintillement / MLI (Modulation de largeur d'impulsion) non décelé | 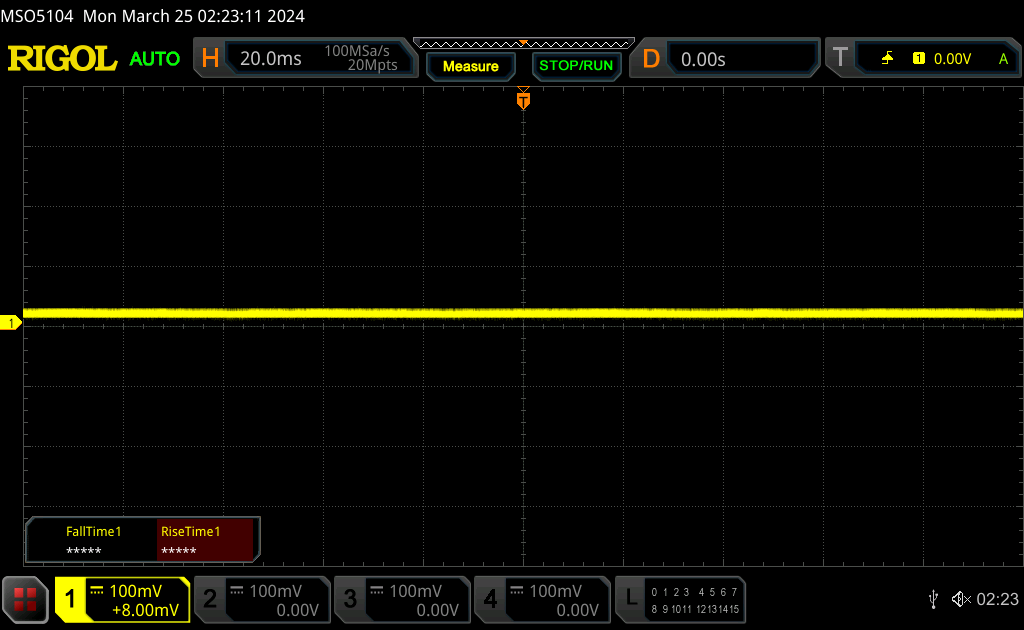 | ||
En comparaison, 52 % des appareils testés n'emploient pas MDI pour assombrir leur écran. Nous avons relevé une moyenne à 7744 (minimum : 5 - maximum : 343500) Hz dans le cas où une MDI était active. | |||
La visibilité extérieure n'a pas beaucoup changé par rapport au modèle de l'année dernière, puisque la luminosité maximale est à peu près la même. Bien que le modèle offre des panneaux plus lumineux, l'augmentation n'est pas assez importante pour faire une différence notable à l'extérieur.


Performance - Un nom différent, une performance identique
Conditions d'essai
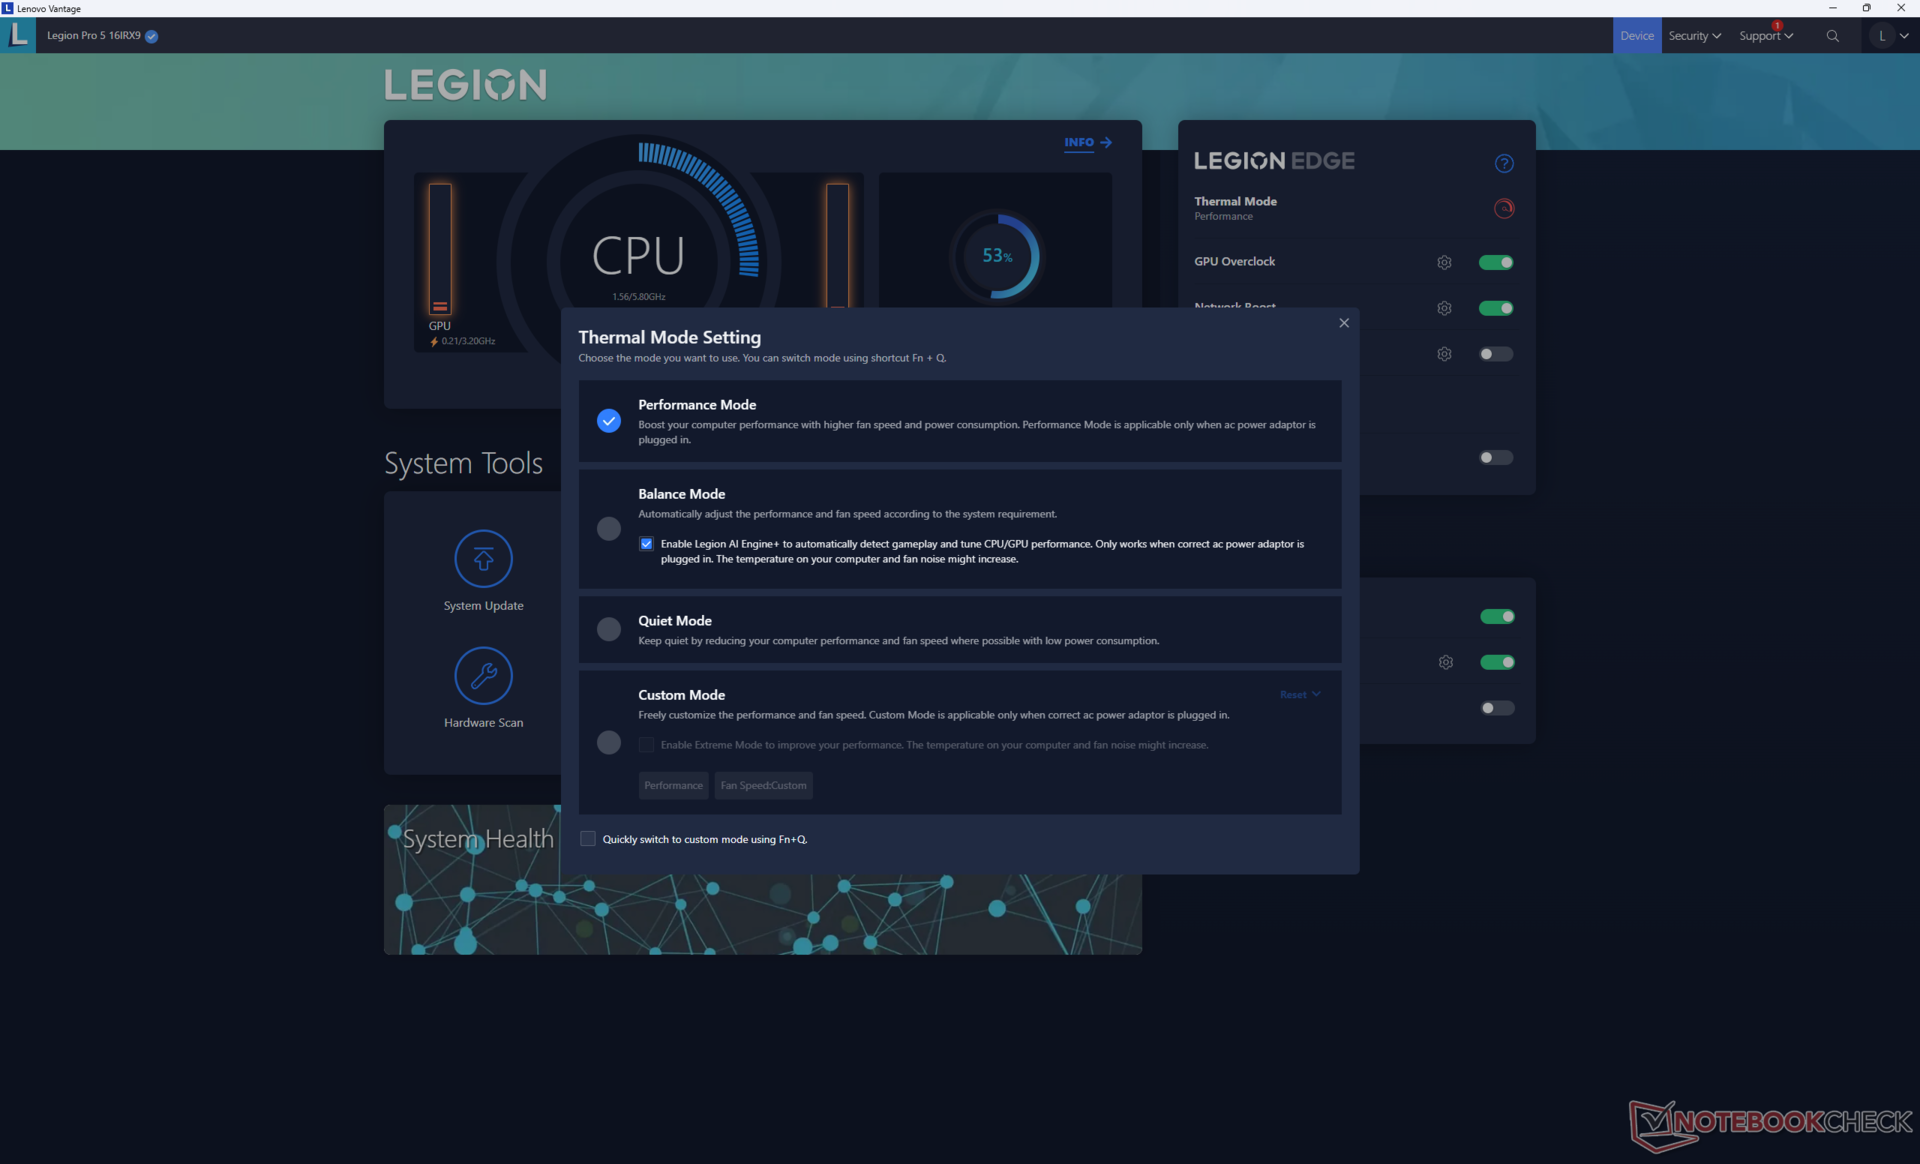
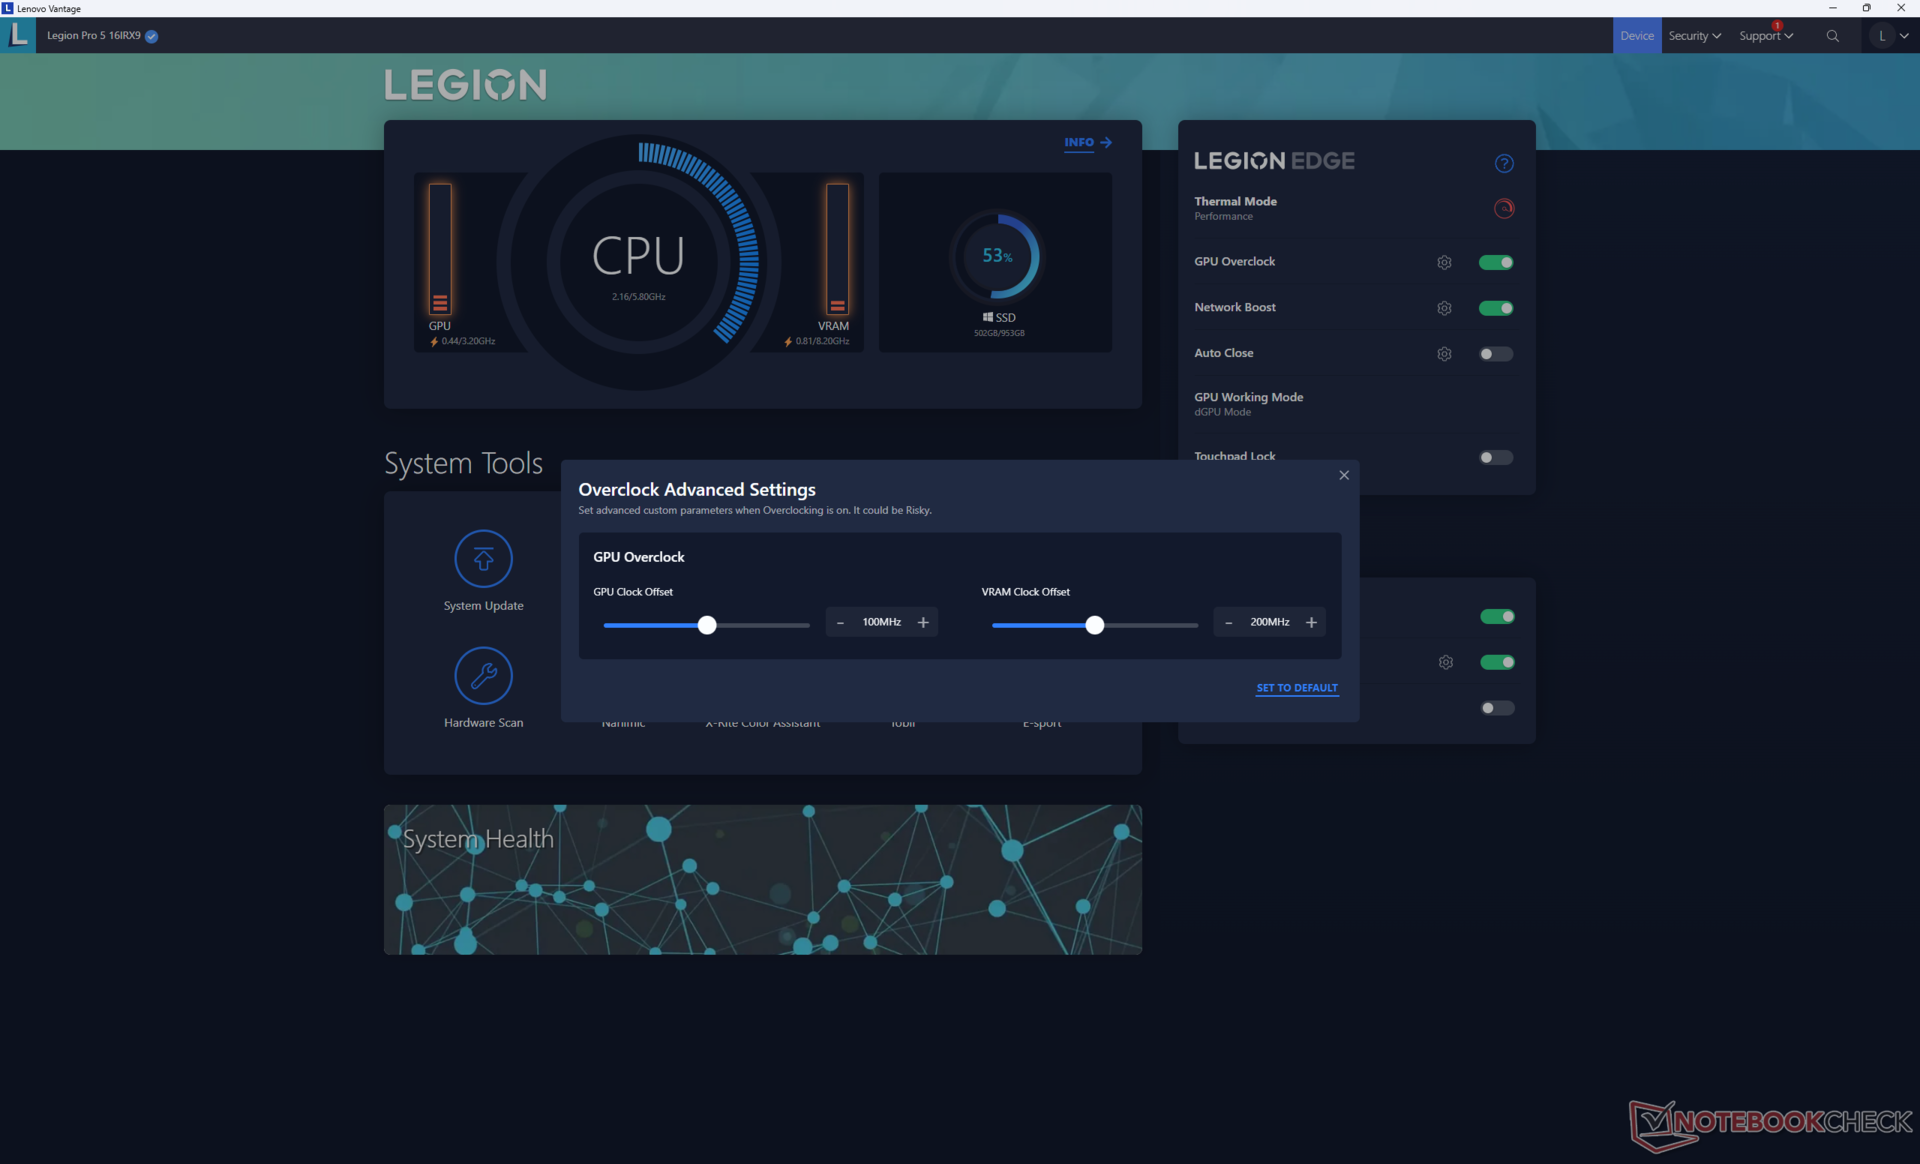
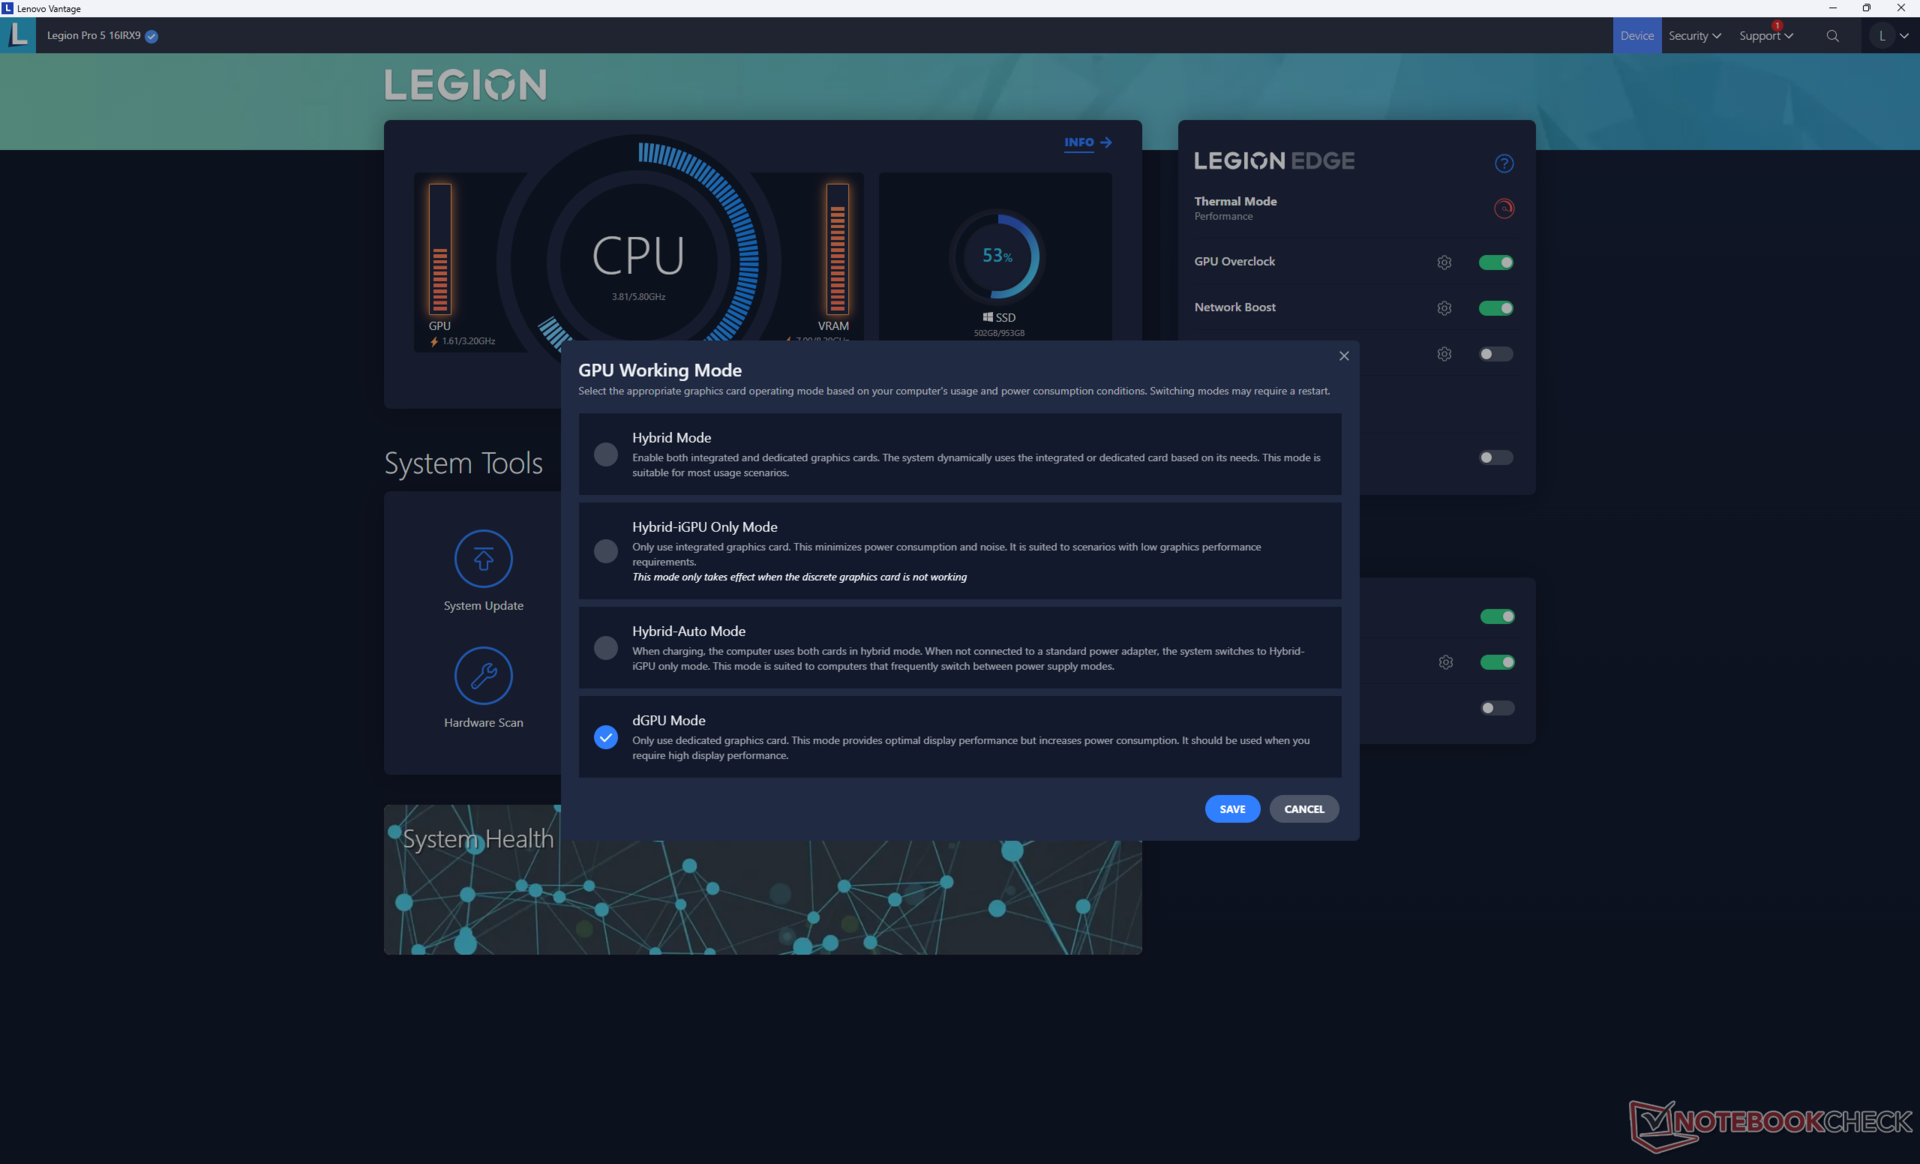
Nous avons mis Lenovo Vantage en mode Performance, en mode dGPU et Windows en mode Performance avant d'effectuer les tests ci-dessous. L'overclockage du GPU est également activé par défaut à +100/+200 MHz horloge/VRAM.
La fonction Advanced Optimus est prise en charge. Comme d'habitude, G-Sync n'est actif que pour l'écran principal en mode dGPU.
Processeur
Les performances du processeur sont excellentes, surtout si on les compare à celles du HP Omen Transcend 16 qui est équipé du même Core i9-14900HX mais qui est plus fortement bridé. Il offre également un gain de performance très respectable de près de 50 % par rapport au processeur Core i7-13700HX dans notre ancienne unité de test Legion 5 Pro 16IRX8. Malgré cela, les performances globales sont comparables à celles du Core i9-13900HX, moins cher Core i9-13900HX moins cher, puisque le i9-14900HX n'est qu'un changement de marque.
La durabilité des performances est bonne, mais pas parfaite. Par exemple, les performances diminuent d'environ 6 % au fil du temps lors de l'exécution en boucle de CineBench R15 xT. Cette baisse n'est heureusement pas aussi importante que celle que nous avons observée sur l'ordinateur portable HP susmentionné, comme le montre le graphique ci-dessous.
En rétrogradant vers le processeur i7-14700HX ou i5-14500HX devrait réduire les performances d'environ 35 à 45 %, étant donné qu'il s'agit également de rebrands des anciens i7-13700HX et i5-13500HX, respectivement.
Cinebench R15 Multi Loop
Cinebench R23: Multi Core | Single Core
Cinebench R20: CPU (Multi Core) | CPU (Single Core)
Cinebench R15: CPU Multi 64Bit | CPU Single 64Bit
Blender: v2.79 BMW27 CPU
7-Zip 18.03: 7z b 4 | 7z b 4 -mmt1
Geekbench 6.7: Multi-Core | Single-Core
Geekbench 5.5: Multi-Core | Single-Core
HWBOT x265 Benchmark v2.2: 4k Preset
LibreOffice : 20 Documents To PDF
R Benchmark 2.5: Overall mean
* ... Moindre est la valeur, meilleures sont les performances
AIDA64: FP32 Ray-Trace | FPU Julia | CPU SHA3 | CPU Queen | FPU SinJulia | FPU Mandel | CPU AES | CPU ZLib | FP64 Ray-Trace | CPU PhotoWorxx
| Performance rating | |
| Lenovo Legion Pro 5 16IRX9 | |
| Moyenne Intel Core i9-14900HX | |
| Lenovo Legion Pro 5 16IRX8 | |
| HP Omen Transcend 16-u1095ng | |
| MSI Stealth 16 Mercedes-AMG Motorsport A13VG | |
| Alienware m16 R2 | |
| Asus ROG Zephyrus G16 2024 GU605M | |
| AIDA64 / FP32 Ray-Trace | |
| Lenovo Legion Pro 5 16IRX9 | |
| Moyenne Intel Core i9-14900HX (13098 - 33474, n=36) | |
| Lenovo Legion Pro 5 16IRX8 | |
| MSI Stealth 16 Mercedes-AMG Motorsport A13VG | |
| Alienware m16 R2 | |
| HP Omen Transcend 16-u1095ng | |
| Asus ROG Zephyrus G16 2024 GU605M | |
| AIDA64 / FPU Julia | |
| Lenovo Legion Pro 5 16IRX9 | |
| Moyenne Intel Core i9-14900HX (67573 - 166040, n=36) | |
| Lenovo Legion Pro 5 16IRX8 | |
| Alienware m16 R2 | |
| MSI Stealth 16 Mercedes-AMG Motorsport A13VG | |
| HP Omen Transcend 16-u1095ng | |
| Asus ROG Zephyrus G16 2024 GU605M | |
| AIDA64 / CPU SHA3 | |
| Lenovo Legion Pro 5 16IRX9 | |
| Moyenne Intel Core i9-14900HX (3589 - 7979, n=36) | |
| Lenovo Legion Pro 5 16IRX8 | |
| HP Omen Transcend 16-u1095ng | |
| Alienware m16 R2 | |
| MSI Stealth 16 Mercedes-AMG Motorsport A13VG | |
| Asus ROG Zephyrus G16 2024 GU605M | |
| AIDA64 / CPU Queen | |
| Lenovo Legion Pro 5 16IRX9 | |
| Moyenne Intel Core i9-14900HX (118405 - 148966, n=36) | |
| HP Omen Transcend 16-u1095ng | |
| MSI Stealth 16 Mercedes-AMG Motorsport A13VG | |
| Lenovo Legion Pro 5 16IRX8 | |
| Asus ROG Zephyrus G16 2024 GU605M | |
| Alienware m16 R2 | |
| AIDA64 / FPU SinJulia | |
| Lenovo Legion Pro 5 16IRX9 | |
| Moyenne Intel Core i9-14900HX (10475 - 18517, n=36) | |
| Lenovo Legion Pro 5 16IRX8 | |
| HP Omen Transcend 16-u1095ng | |
| MSI Stealth 16 Mercedes-AMG Motorsport A13VG | |
| Asus ROG Zephyrus G16 2024 GU605M | |
| Alienware m16 R2 | |
| AIDA64 / FPU Mandel | |
| Lenovo Legion Pro 5 16IRX9 | |
| Moyenne Intel Core i9-14900HX (32543 - 83662, n=36) | |
| Lenovo Legion Pro 5 16IRX8 | |
| Alienware m16 R2 | |
| MSI Stealth 16 Mercedes-AMG Motorsport A13VG | |
| HP Omen Transcend 16-u1095ng | |
| Asus ROG Zephyrus G16 2024 GU605M | |
| AIDA64 / CPU AES | |
| Moyenne Intel Core i9-14900HX (86964 - 241777, n=36) | |
| Lenovo Legion Pro 5 16IRX9 | |
| Lenovo Legion Pro 5 16IRX8 | |
| HP Omen Transcend 16-u1095ng | |
| MSI Stealth 16 Mercedes-AMG Motorsport A13VG | |
| Alienware m16 R2 | |
| Asus ROG Zephyrus G16 2024 GU605M | |
| AIDA64 / CPU ZLib | |
| Lenovo Legion Pro 5 16IRX9 | |
| Moyenne Intel Core i9-14900HX (1054 - 2292, n=36) | |
| Lenovo Legion Pro 5 16IRX8 | |
| HP Omen Transcend 16-u1095ng | |
| Alienware m16 R2 | |
| MSI Stealth 16 Mercedes-AMG Motorsport A13VG | |
| Asus ROG Zephyrus G16 2024 GU605M | |
| AIDA64 / FP64 Ray-Trace | |
| Lenovo Legion Pro 5 16IRX9 | |
| Moyenne Intel Core i9-14900HX (6809 - 18349, n=36) | |
| Lenovo Legion Pro 5 16IRX8 | |
| MSI Stealth 16 Mercedes-AMG Motorsport A13VG | |
| Alienware m16 R2 | |
| HP Omen Transcend 16-u1095ng | |
| Asus ROG Zephyrus G16 2024 GU605M | |
| AIDA64 / CPU PhotoWorxx | |
| Lenovo Legion Pro 5 16IRX9 | |
| HP Omen Transcend 16-u1095ng | |
| Asus ROG Zephyrus G16 2024 GU605M | |
| MSI Stealth 16 Mercedes-AMG Motorsport A13VG | |
| Moyenne Intel Core i9-14900HX (23903 - 54702, n=36) | |
| Alienware m16 R2 | |
| Lenovo Legion Pro 5 16IRX8 | |
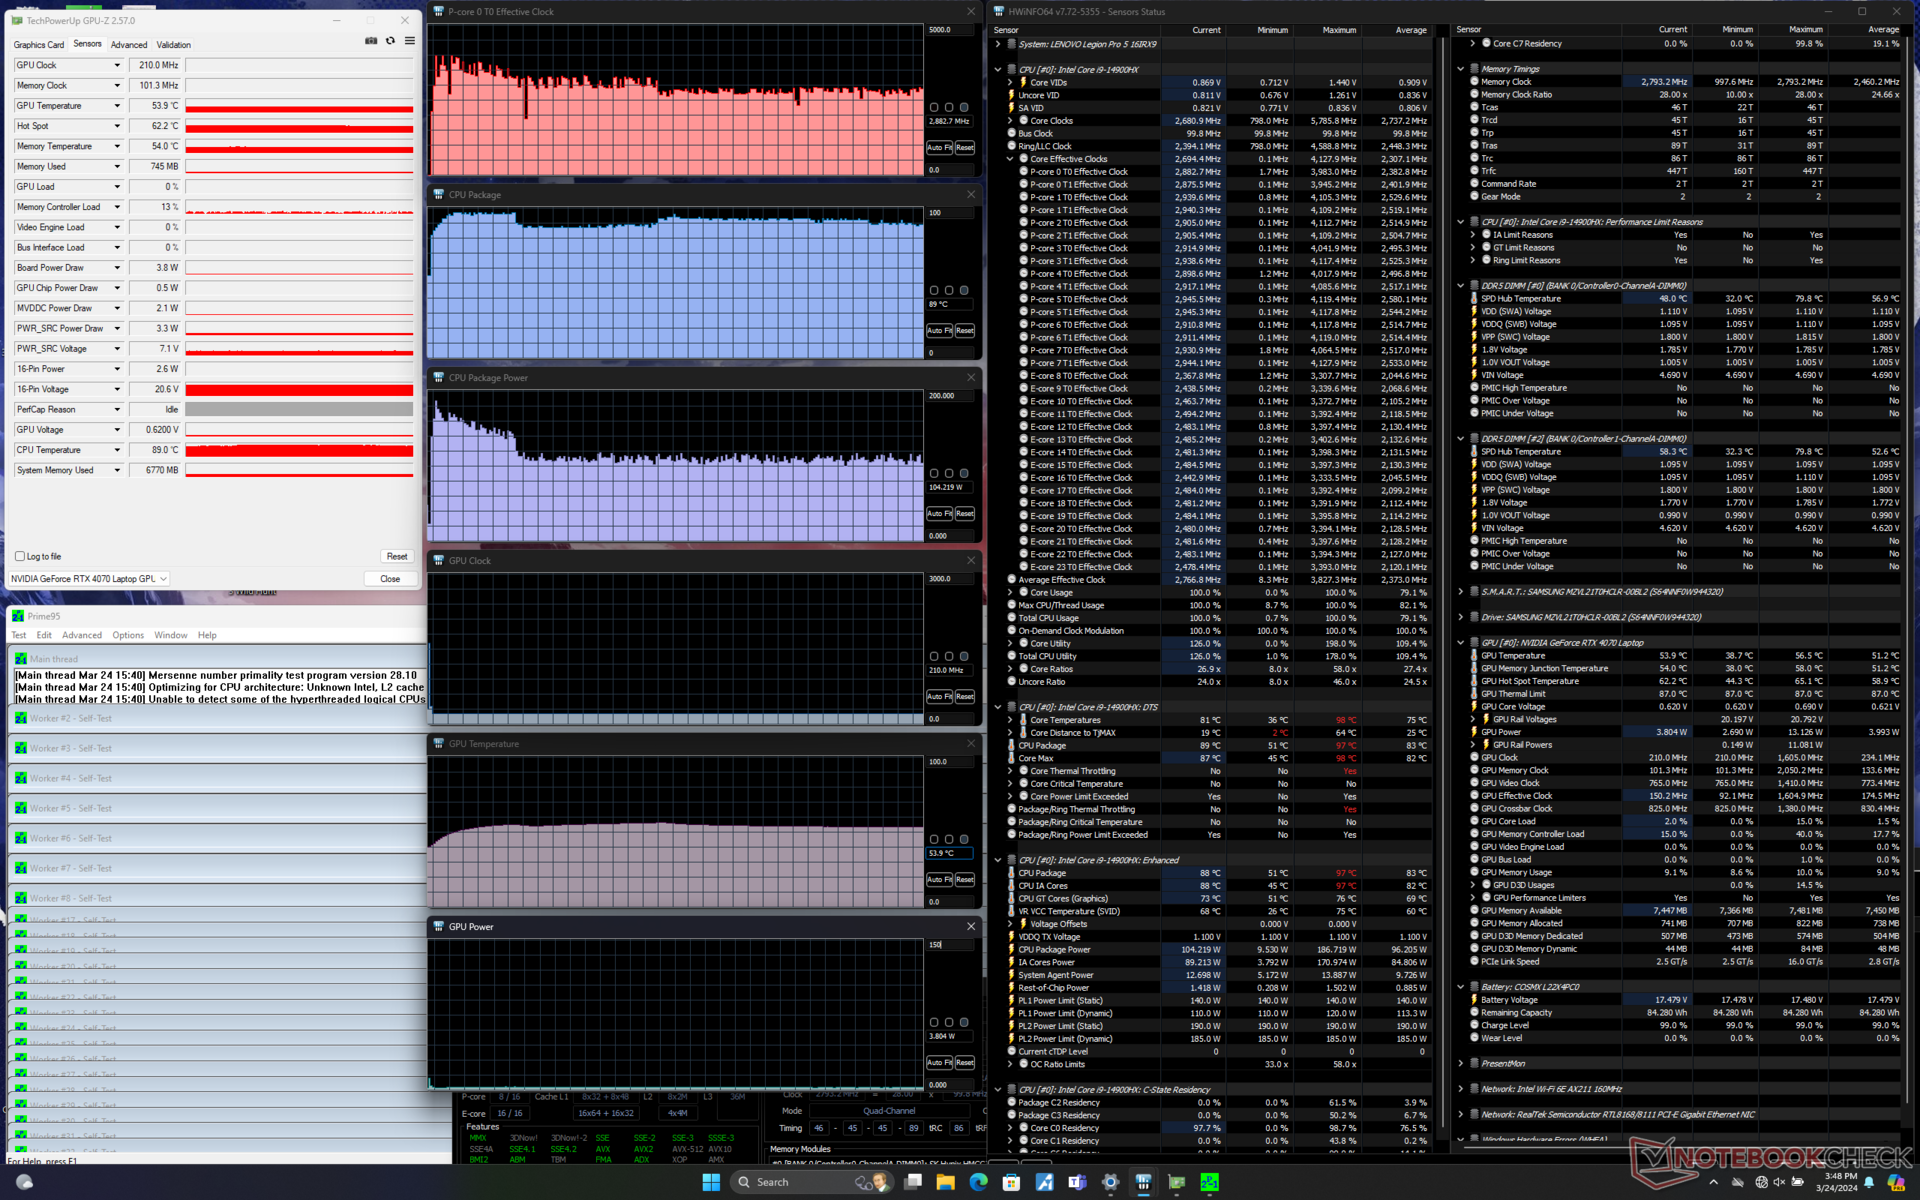
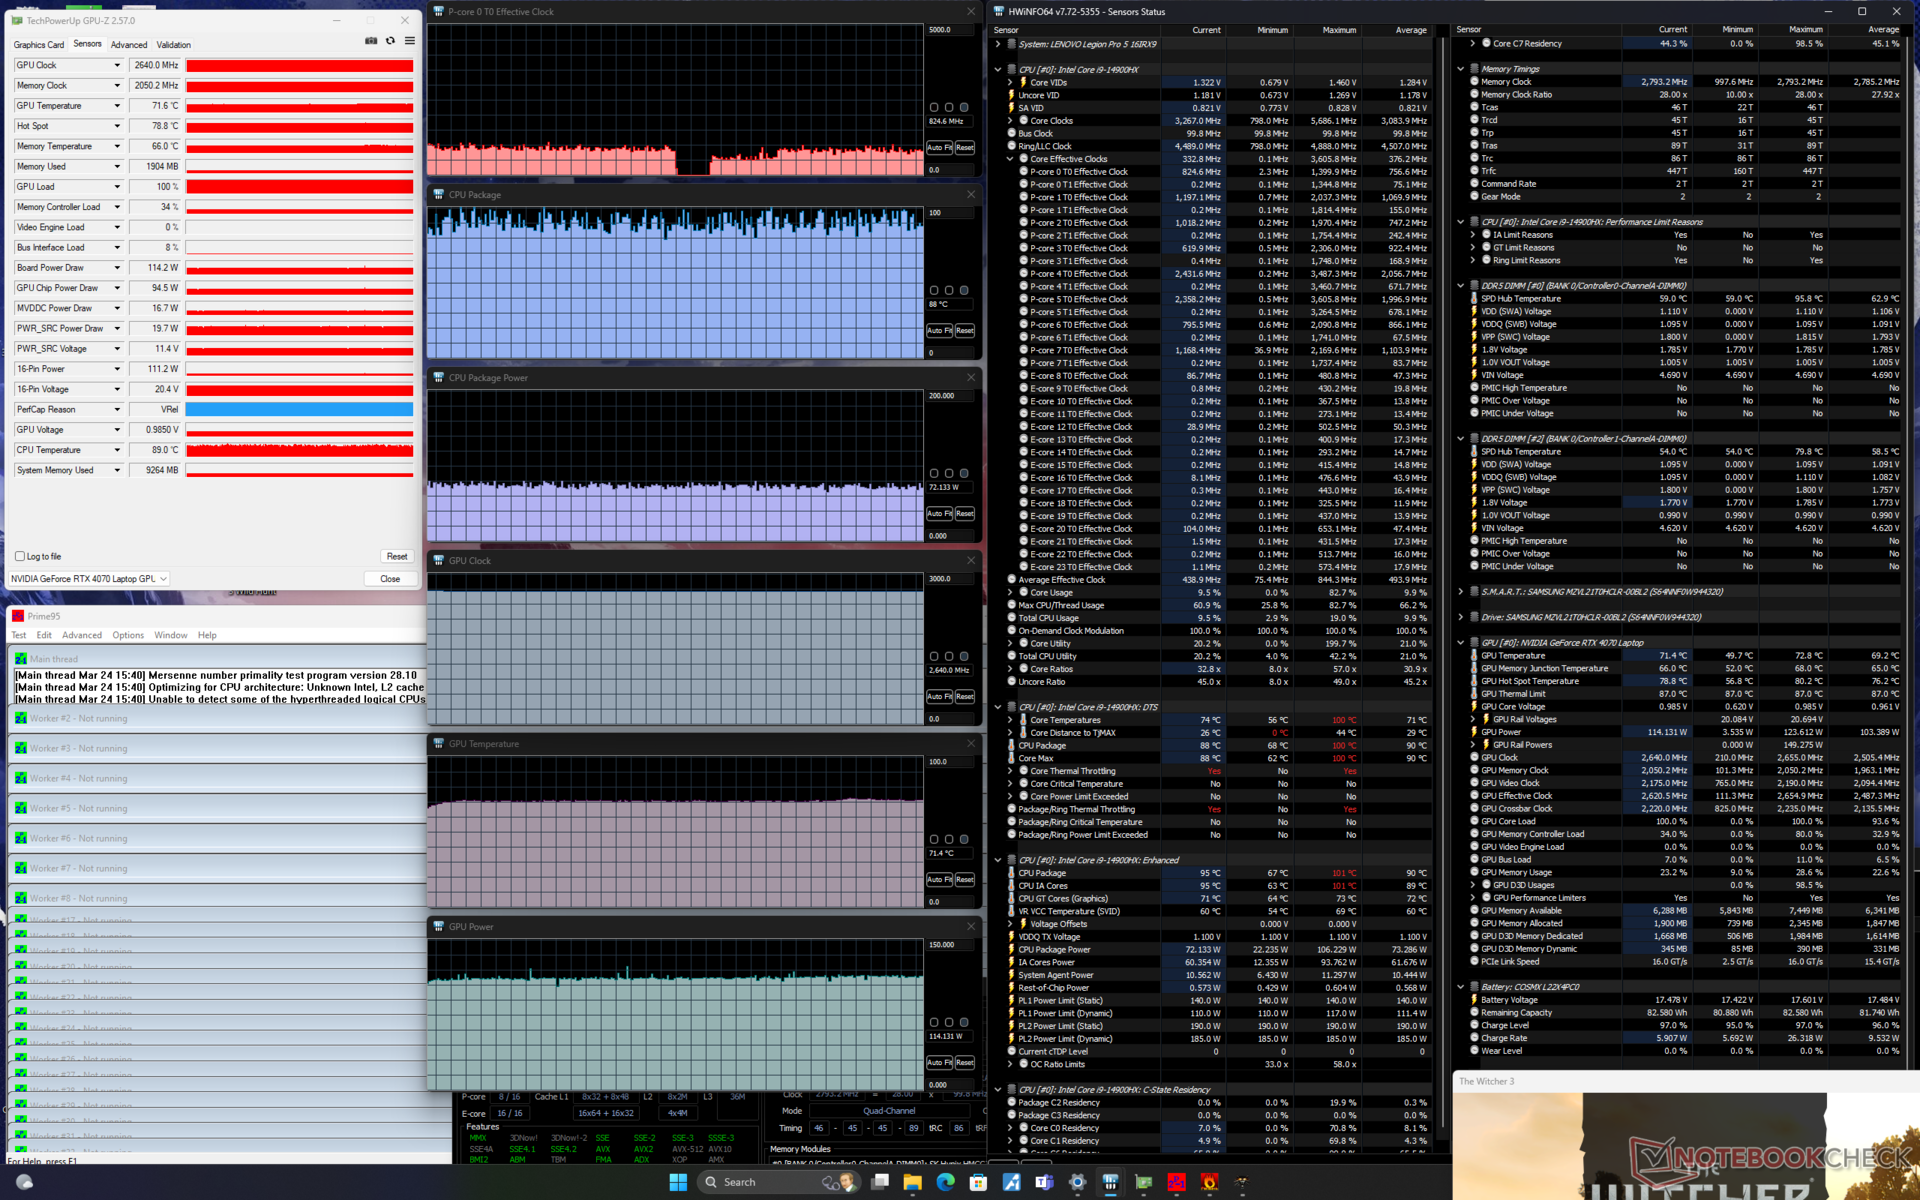
Test de stress
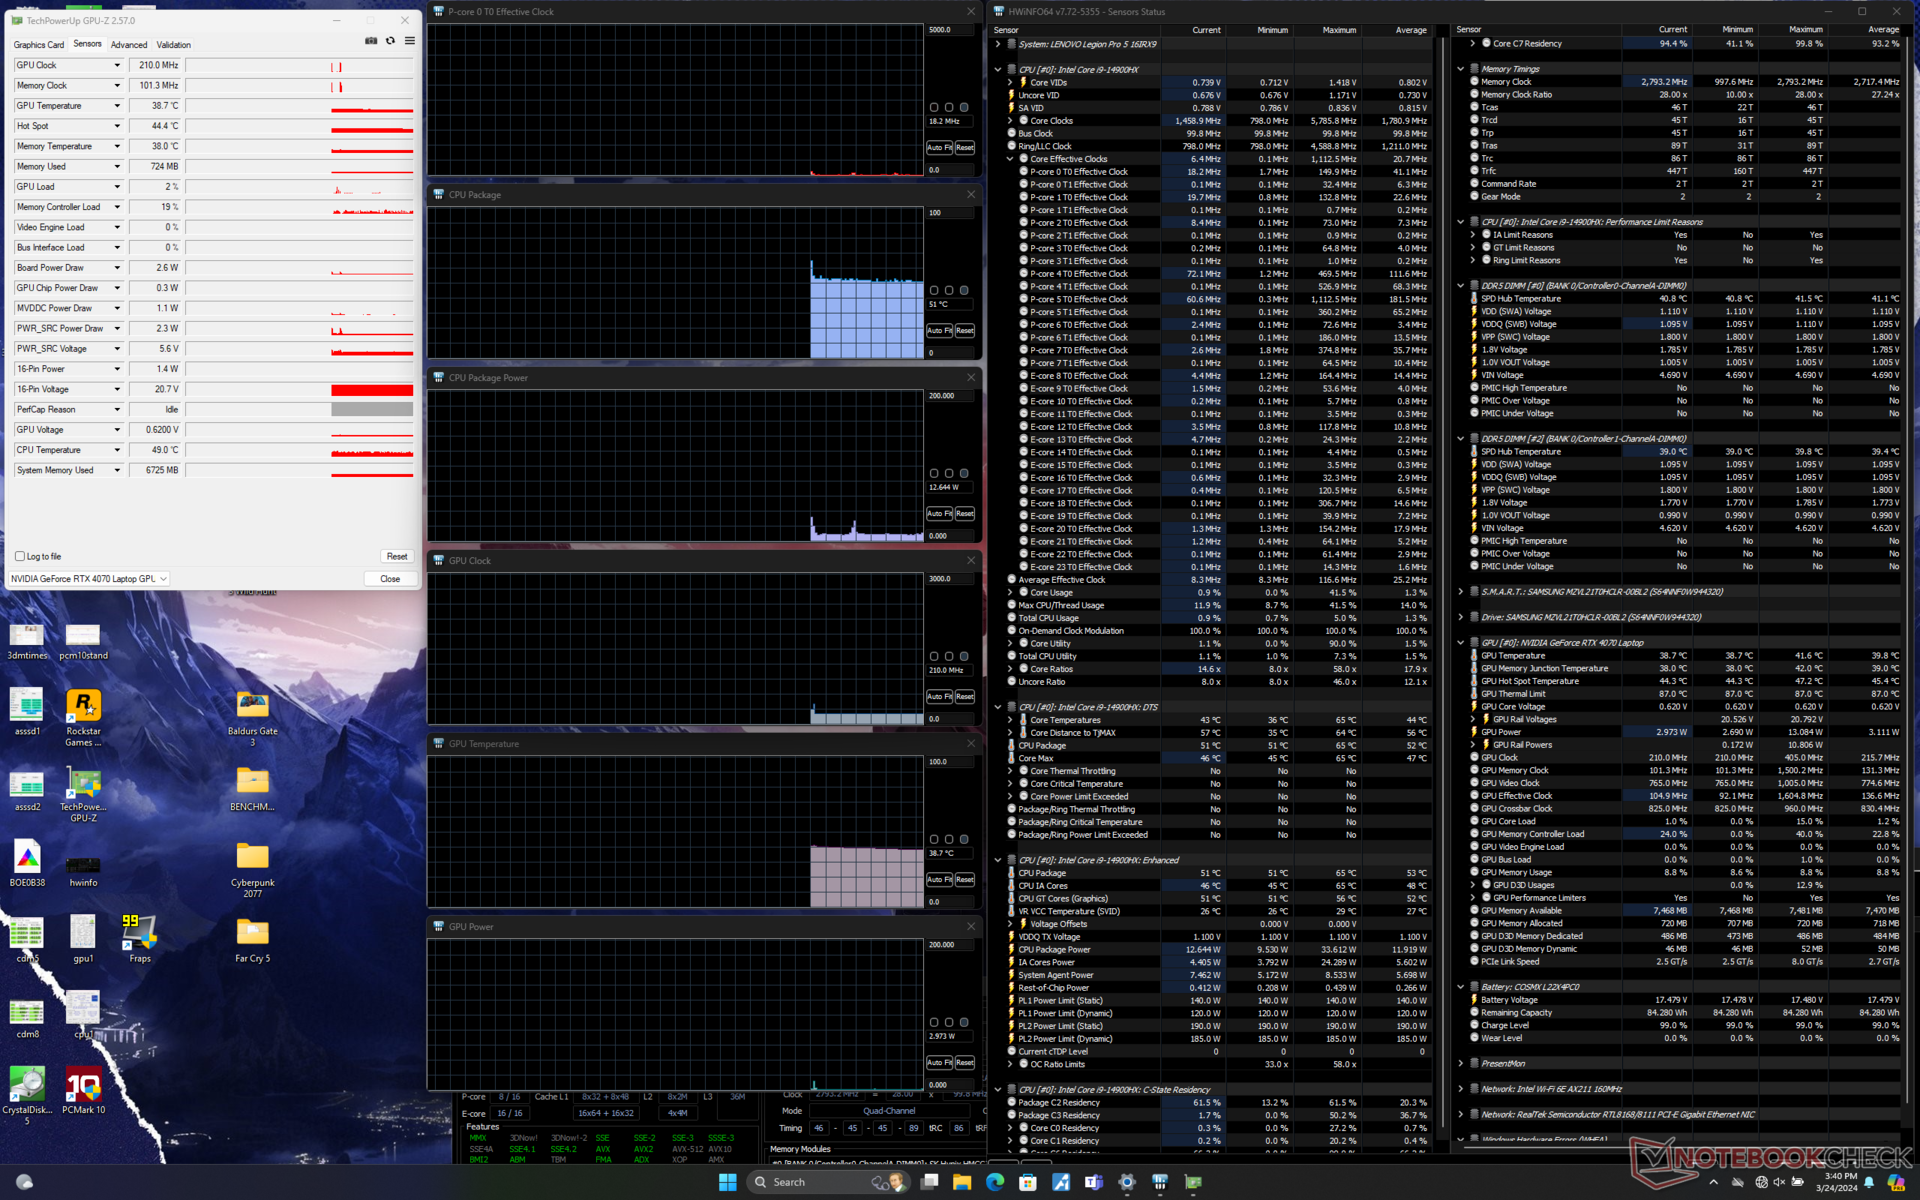
Le processeur atteint 4 GHz et 187 W lors de l'exécution de Prime95. Une fois que la température du cœur atteint 97°C quelques secondes plus tard, le CPU se stabilise rapidement à 2,8 GHz et 104 W afin de maintenir une température plus gérable de 89°C. Bien que légèrement plus chaud que sur le modèle de l'année dernière, il est au moins plus frais que sur l'Alienware m16 R2 avec le CPU Core Ultra 7 plus lent dans des conditions similaires.
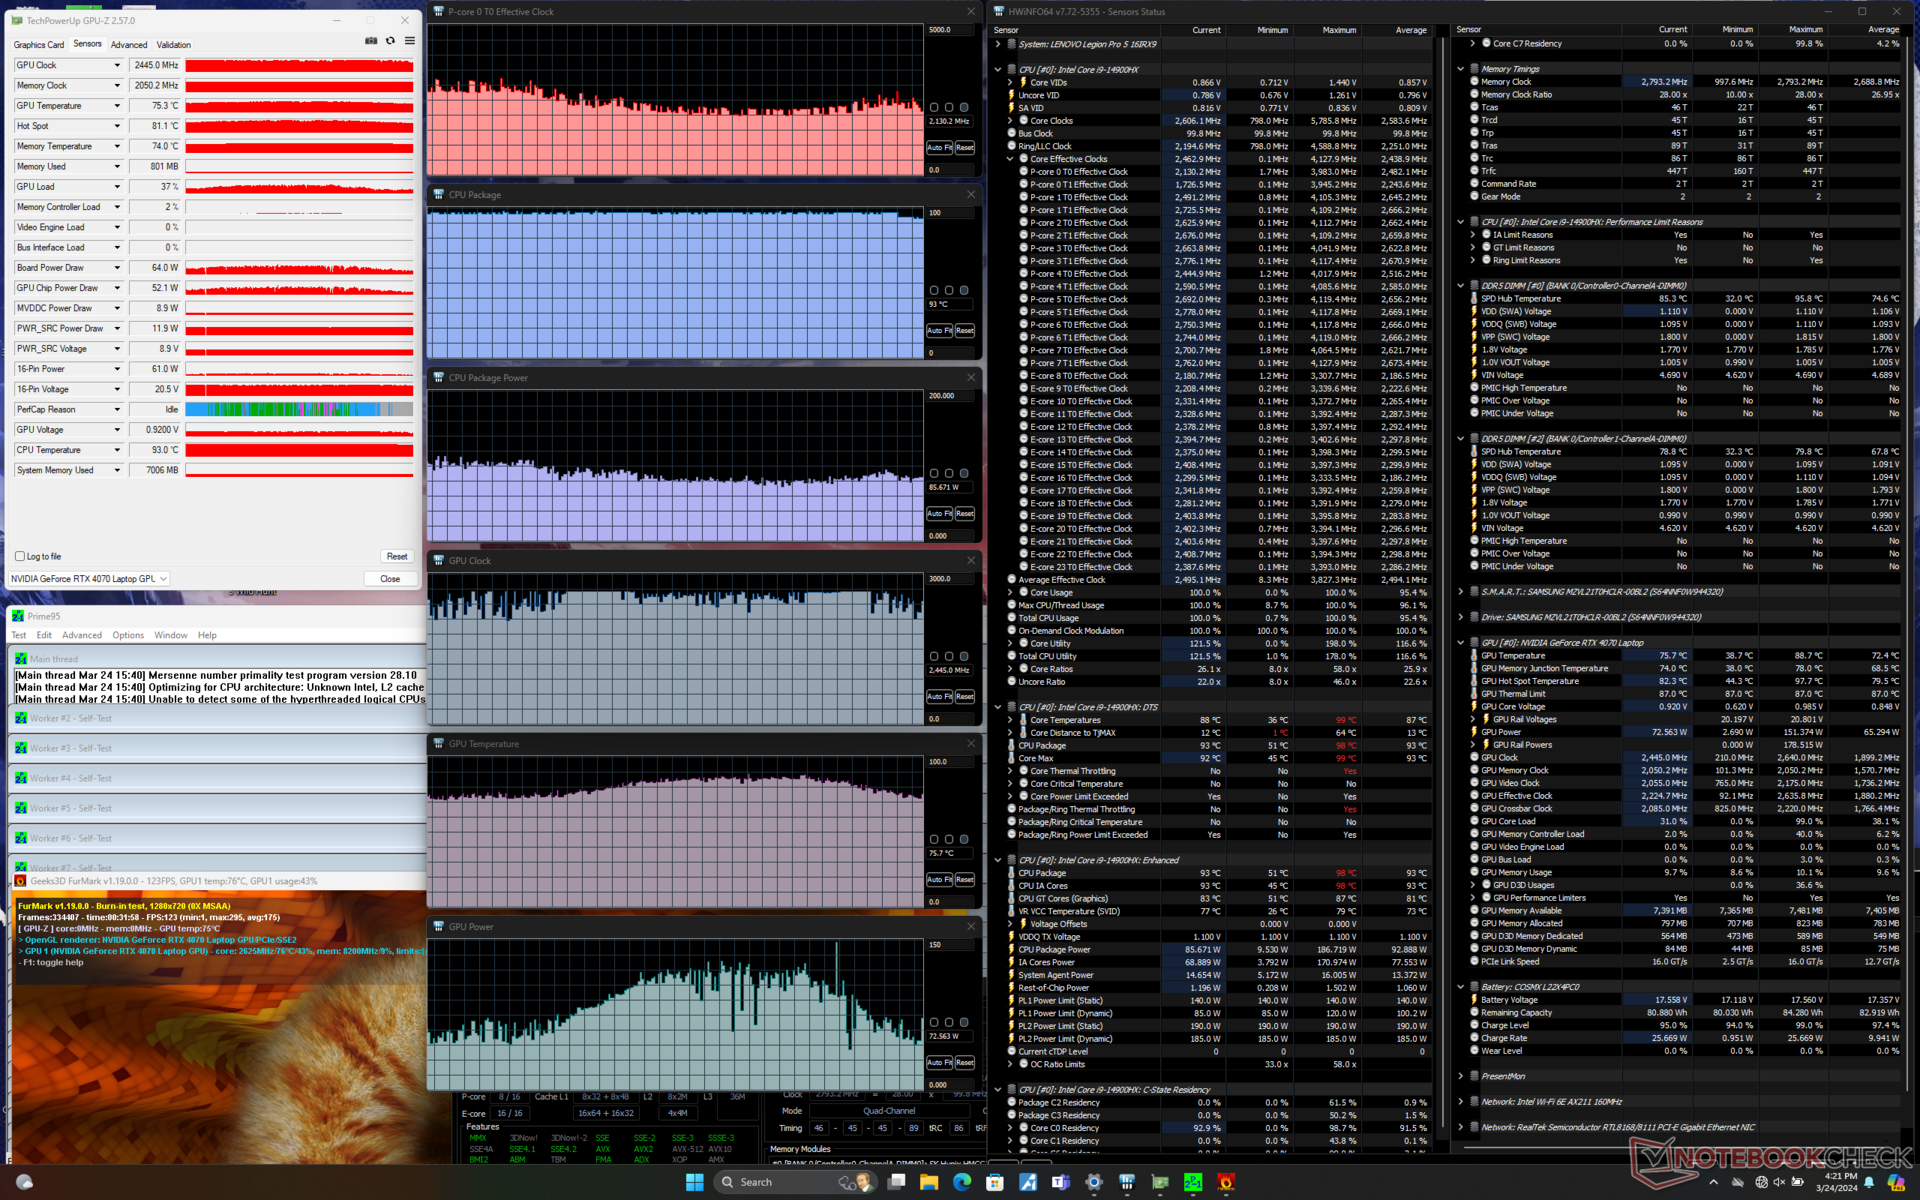
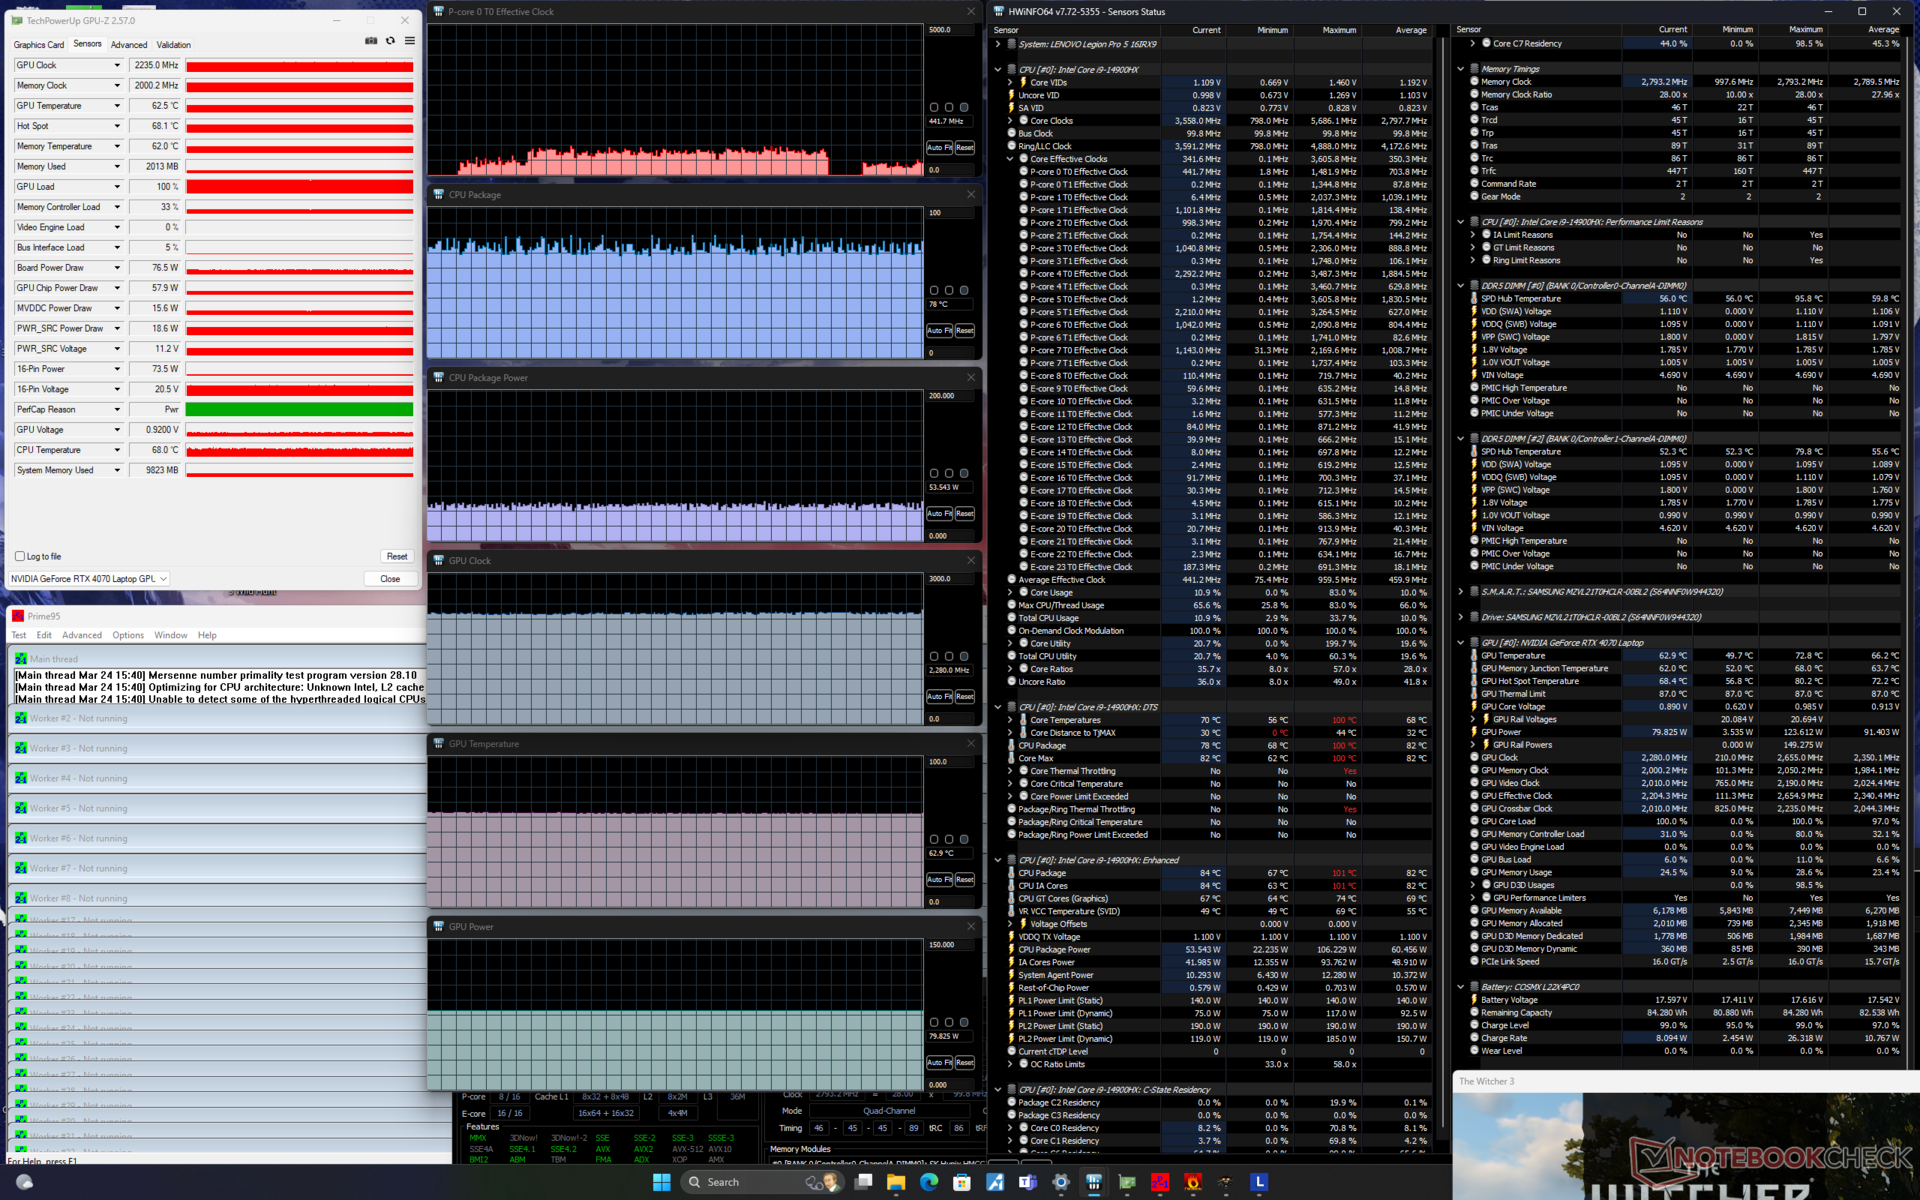
Les performances graphiques sont réduites lorsque l'on passe du mode Performance au mode Equilibré, comme indiqué dans la section Performances du GPU ci-dessous. La consommation de la carte graphique et la fréquence d'horloge en mode Performance passent respectivement de 114 W et 2640 MHz à 2280 MHz et 77 W en mode Equilibré. D'autre part, la température du cœur est nettement plus basse, d'environ 10 °C, en mode équilibré, car les performances globales sont plus lentes.
| Horloge du CPU (GHz) | Horloge du GPU (MHz) | Température moyenne du CPU (°C) | Température moyenne du GPU (°C) | |
| Système en veille | -- | -- | 51 | 39 |
| Prime95 Stress | 2.8 | -- | 89 | 54 |
| Prime95 + FurMark Stress | ~2.1 | 2100 - 2700 | 95 | 70 - 88 |
| Witcher 3 Stress(mode équilibré) | ~0.5 | 2280 | ~78 | 63 |
| Witcher 3 Stress (mode Performance) | ~0,9 | 2640 | ~88 | 72 |
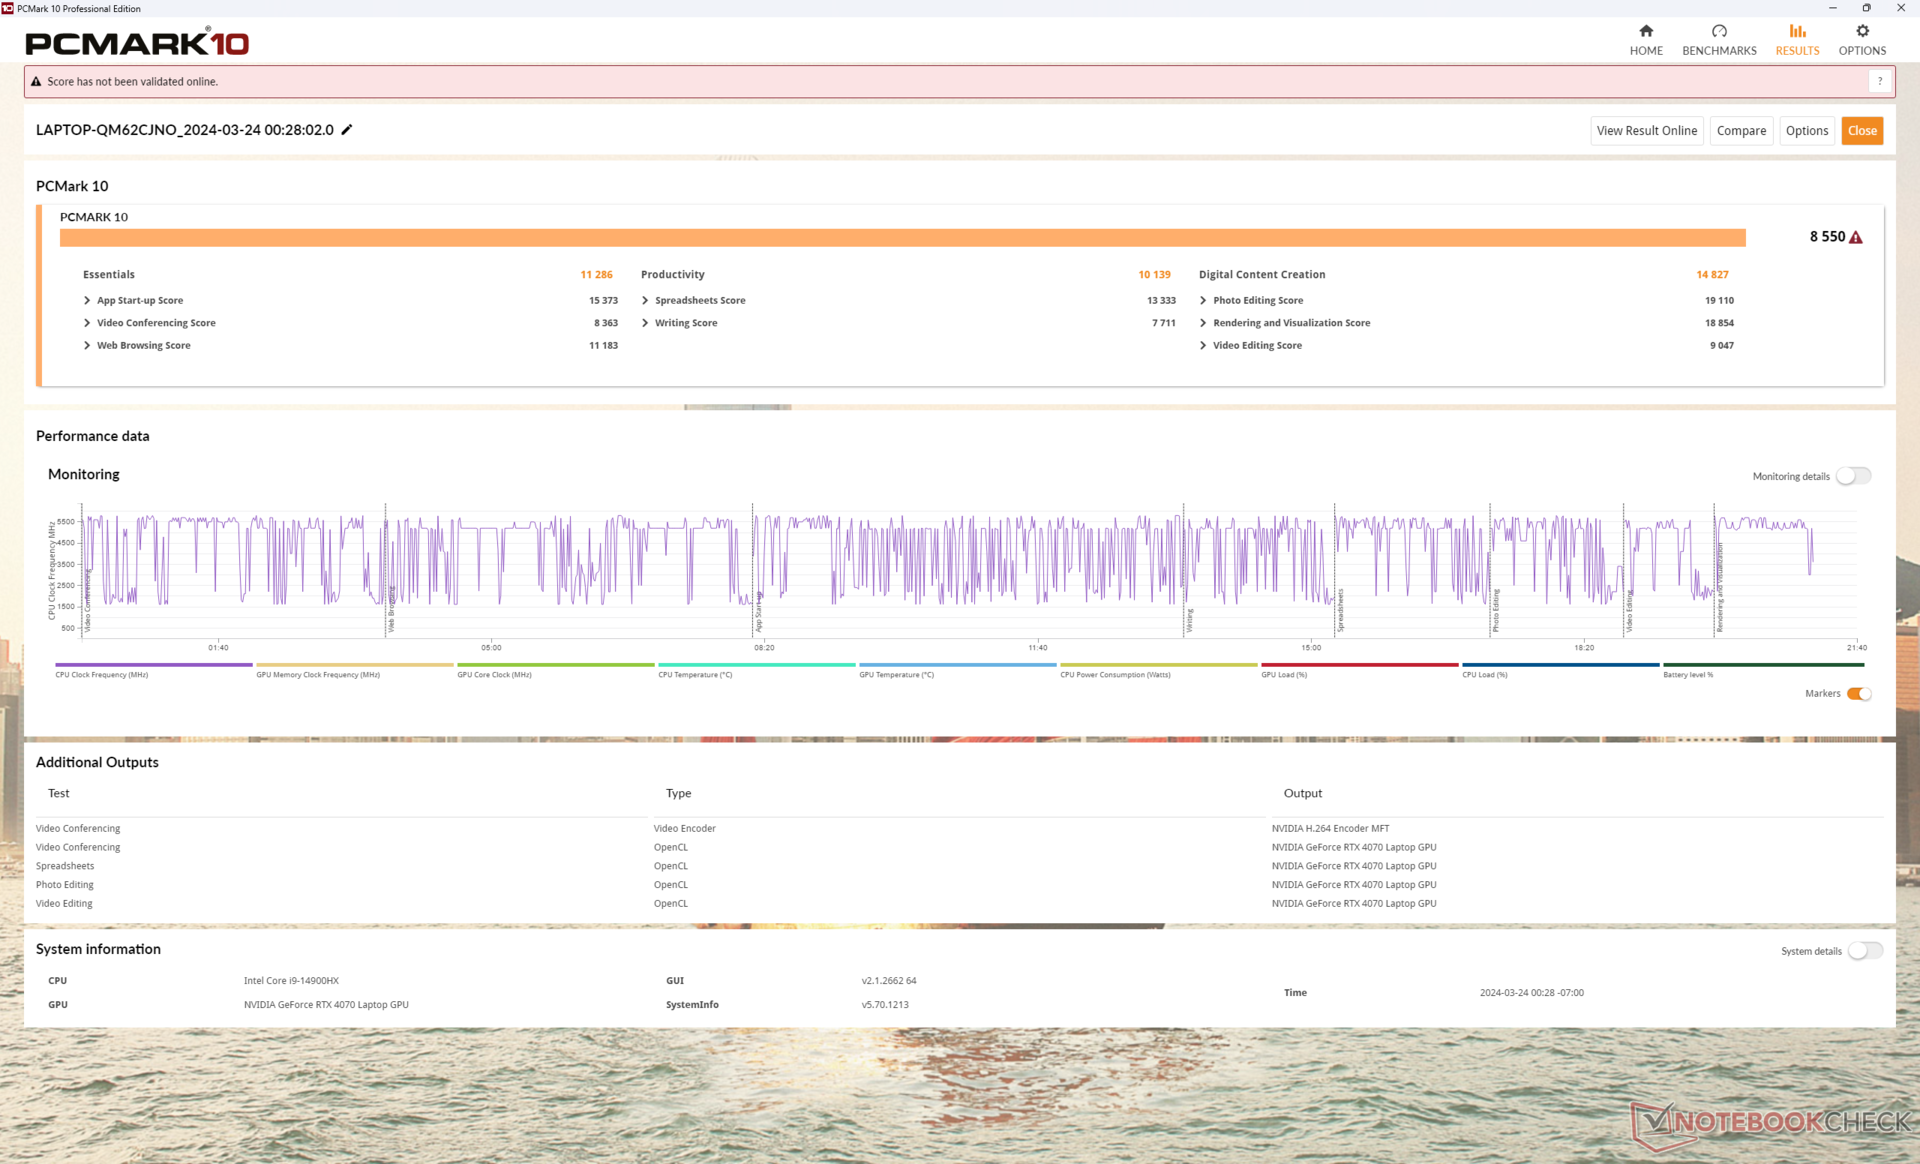
Performance du système
Les scores PCMark sont systématiquement supérieurs à ceux de l'ancienne Legion Pro 5 16IRX8, car notre machine est configurée avec des composants Core i9 et GeForce RTX plus haut de gamme. Nous n'avons pas non plus rencontré les mêmes problèmes de réveil que sur le récent Alienware m16 R2.
CrossMark: Overall | Productivity | Creativity | Responsiveness
WebXPRT 3: Overall
WebXPRT 4: Overall
Mozilla Kraken 1.1: Total
| PCMark 10 / Score | |
| Lenovo Legion Pro 5 16IRX9 | |
| Moyenne Intel Core i9-14900HX, NVIDIA GeForce RTX 4070 Laptop GPU (7768 - 8550, n=8) | |
| HP Omen Transcend 16-u1095ng | |
| Alienware m16 R2 | |
| Lenovo Legion Pro 5 16IRX8 | |
| MSI Stealth 16 Mercedes-AMG Motorsport A13VG | |
| Asus ROG Zephyrus G16 2024 GU605M | |
| PCMark 10 / Essentials | |
| Lenovo Legion Pro 5 16IRX9 | |
| Moyenne Intel Core i9-14900HX, NVIDIA GeForce RTX 4070 Laptop GPU (10104 - 11815, n=8) | |
| Lenovo Legion Pro 5 16IRX8 | |
| MSI Stealth 16 Mercedes-AMG Motorsport A13VG | |
| HP Omen Transcend 16-u1095ng | |
| Alienware m16 R2 | |
| Asus ROG Zephyrus G16 2024 GU605M | |
| PCMark 10 / Productivity | |
| Moyenne Intel Core i9-14900HX, NVIDIA GeForce RTX 4070 Laptop GPU (9577 - 11103, n=8) | |
| HP Omen Transcend 16-u1095ng | |
| Lenovo Legion Pro 5 16IRX9 | |
| MSI Stealth 16 Mercedes-AMG Motorsport A13VG | |
| Alienware m16 R2 | |
| Asus ROG Zephyrus G16 2024 GU605M | |
| Lenovo Legion Pro 5 16IRX8 | |
| PCMark 10 / Digital Content Creation | |
| Lenovo Legion Pro 5 16IRX9 | |
| Moyenne Intel Core i9-14900HX, NVIDIA GeForce RTX 4070 Laptop GPU (12114 - 14827, n=8) | |
| Alienware m16 R2 | |
| Lenovo Legion Pro 5 16IRX8 | |
| HP Omen Transcend 16-u1095ng | |
| Asus ROG Zephyrus G16 2024 GU605M | |
| MSI Stealth 16 Mercedes-AMG Motorsport A13VG | |
| CrossMark / Overall | |
| Moyenne Intel Core i9-14900HX, NVIDIA GeForce RTX 4070 Laptop GPU (2002 - 2312, n=7) | |
| Lenovo Legion Pro 5 16IRX9 | |
| Alienware m16 R2 | |
| Asus ROG Zephyrus G16 2024 GU605M | |
| Lenovo Legion Pro 5 16IRX8 | |
| CrossMark / Productivity | |
| Moyenne Intel Core i9-14900HX, NVIDIA GeForce RTX 4070 Laptop GPU (1827 - 2191, n=7) | |
| Lenovo Legion Pro 5 16IRX9 | |
| Alienware m16 R2 | |
| Asus ROG Zephyrus G16 2024 GU605M | |
| Lenovo Legion Pro 5 16IRX8 | |
| CrossMark / Creativity | |
| Moyenne Intel Core i9-14900HX, NVIDIA GeForce RTX 4070 Laptop GPU (2258 - 2458, n=7) | |
| Lenovo Legion Pro 5 16IRX9 | |
| Asus ROG Zephyrus G16 2024 GU605M | |
| Alienware m16 R2 | |
| Lenovo Legion Pro 5 16IRX8 | |
| CrossMark / Responsiveness | |
| Moyenne Intel Core i9-14900HX, NVIDIA GeForce RTX 4070 Laptop GPU (1734 - 2330, n=7) | |
| Lenovo Legion Pro 5 16IRX9 | |
| Lenovo Legion Pro 5 16IRX8 | |
| Alienware m16 R2 | |
| Asus ROG Zephyrus G16 2024 GU605M | |
| WebXPRT 3 / Overall | |
| HP Omen Transcend 16-u1095ng | |
| Lenovo Legion Pro 5 16IRX9 | |
| Moyenne Intel Core i9-14900HX, NVIDIA GeForce RTX 4070 Laptop GPU (269 - 342, n=8) | |
| Alienware m16 R2 | |
| Asus ROG Zephyrus G16 2024 GU605M | |
| Lenovo Legion Pro 5 16IRX8 | |
| WebXPRT 4 / Overall | |
| Moyenne Intel Core i9-14900HX, NVIDIA GeForce RTX 4070 Laptop GPU (291 - 304, n=6) | |
| Lenovo Legion Pro 5 16IRX9 | |
| Alienware m16 R2 | |
| Asus ROG Zephyrus G16 2024 GU605M | |
| Lenovo Legion Pro 5 16IRX8 | |
| Mozilla Kraken 1.1 / Total | |
| Asus ROG Zephyrus G16 2024 GU605M | |
| Alienware m16 R2 | |
| Lenovo Legion Pro 5 16IRX8 | |
| Lenovo Legion Pro 5 16IRX9 | |
| Moyenne Intel Core i9-14900HX, NVIDIA GeForce RTX 4070 Laptop GPU (431 - 469, n=8) | |
| HP Omen Transcend 16-u1095ng | |
* ... Moindre est la valeur, meilleures sont les performances
| PCMark 10 Score | 8550 points | |
Aide | ||
| AIDA64 / Memory Copy | |
| Asus ROG Zephyrus G16 2024 GU605M | |
| Lenovo Legion Pro 5 16IRX9 | |
| HP Omen Transcend 16-u1095ng | |
| Moyenne Intel Core i9-14900HX (38028 - 83392, n=36) | |
| MSI Stealth 16 Mercedes-AMG Motorsport A13VG | |
| Alienware m16 R2 | |
| Lenovo Legion Pro 5 16IRX8 | |
| AIDA64 / Memory Read | |
| Asus ROG Zephyrus G16 2024 GU605M | |
| Lenovo Legion Pro 5 16IRX9 | |
| HP Omen Transcend 16-u1095ng | |
| Moyenne Intel Core i9-14900HX (43306 - 87568, n=36) | |
| Alienware m16 R2 | |
| MSI Stealth 16 Mercedes-AMG Motorsport A13VG | |
| Lenovo Legion Pro 5 16IRX8 | |
| AIDA64 / Memory Write | |
| HP Omen Transcend 16-u1095ng | |
| Lenovo Legion Pro 5 16IRX9 | |
| Asus ROG Zephyrus G16 2024 GU605M | |
| MSI Stealth 16 Mercedes-AMG Motorsport A13VG | |
| Moyenne Intel Core i9-14900HX (37146 - 80589, n=36) | |
| Alienware m16 R2 | |
| Lenovo Legion Pro 5 16IRX8 | |
| AIDA64 / Memory Latency | |
| Asus ROG Zephyrus G16 2024 GU605M | |
| Alienware m16 R2 | |
| MSI Stealth 16 Mercedes-AMG Motorsport A13VG | |
| HP Omen Transcend 16-u1095ng | |
| Moyenne Intel Core i9-14900HX (76.1 - 105, n=36) | |
| Lenovo Legion Pro 5 16IRX9 | |
| Lenovo Legion Pro 5 16IRX8 | |
* ... Moindre est la valeur, meilleures sont les performances
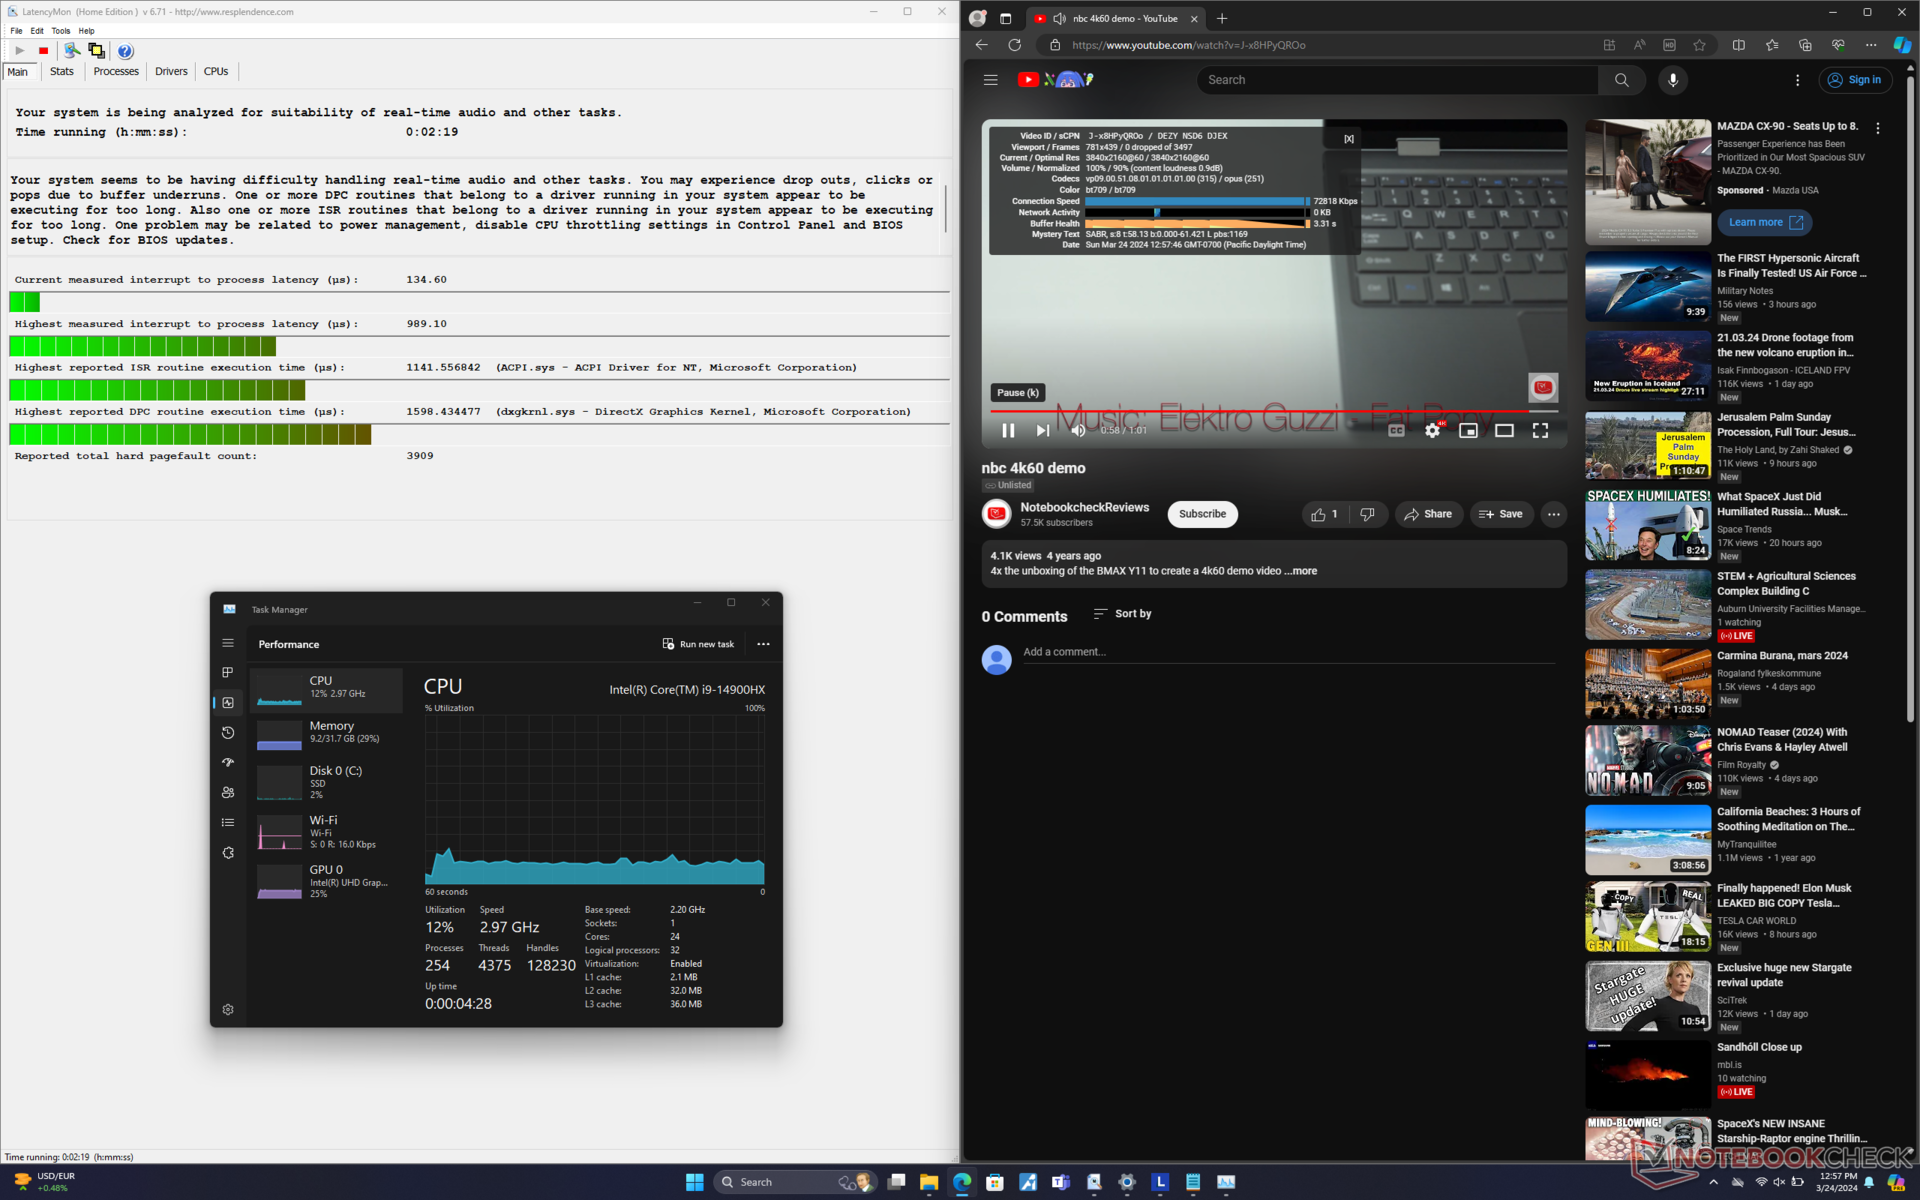
Latence DPC
LatencyMon montre des problèmes de DPC lors de l'ouverture de plusieurs onglets de notre page d'accueil. la lecture de vidéos 4K à 60 FPS est parfaite en mode iGPU, sans aucune perte d'images.

| DPC Latencies / LatencyMon - interrupt to process latency (max), Web, Youtube, Prime95 | |
| MSI Stealth 16 Mercedes-AMG Motorsport A13VG | |
| Asus ROG Zephyrus G16 2024 GU605M | |
| Alienware m16 R2 | |
| HP Omen Transcend 16-u1095ng | |
| Lenovo Legion Pro 5 16IRX9 | |
| Lenovo Legion Pro 5 16IRX8 | |
* ... Moindre est la valeur, meilleures sont les performances
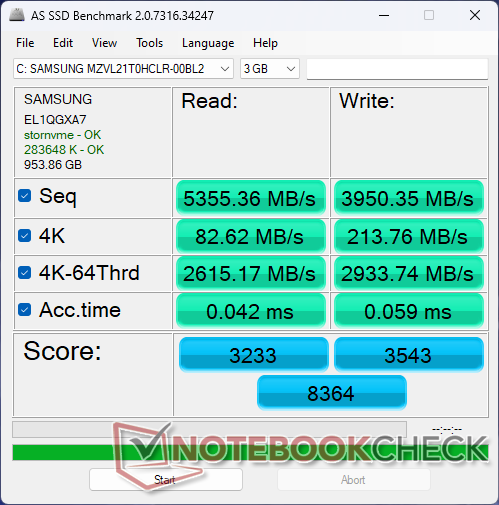
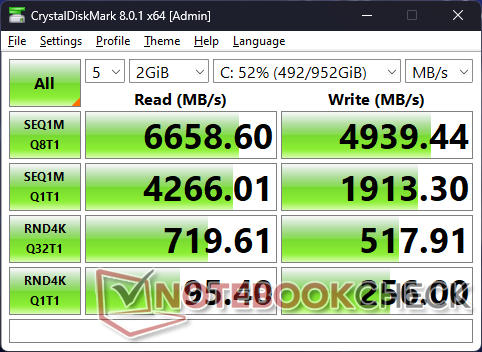
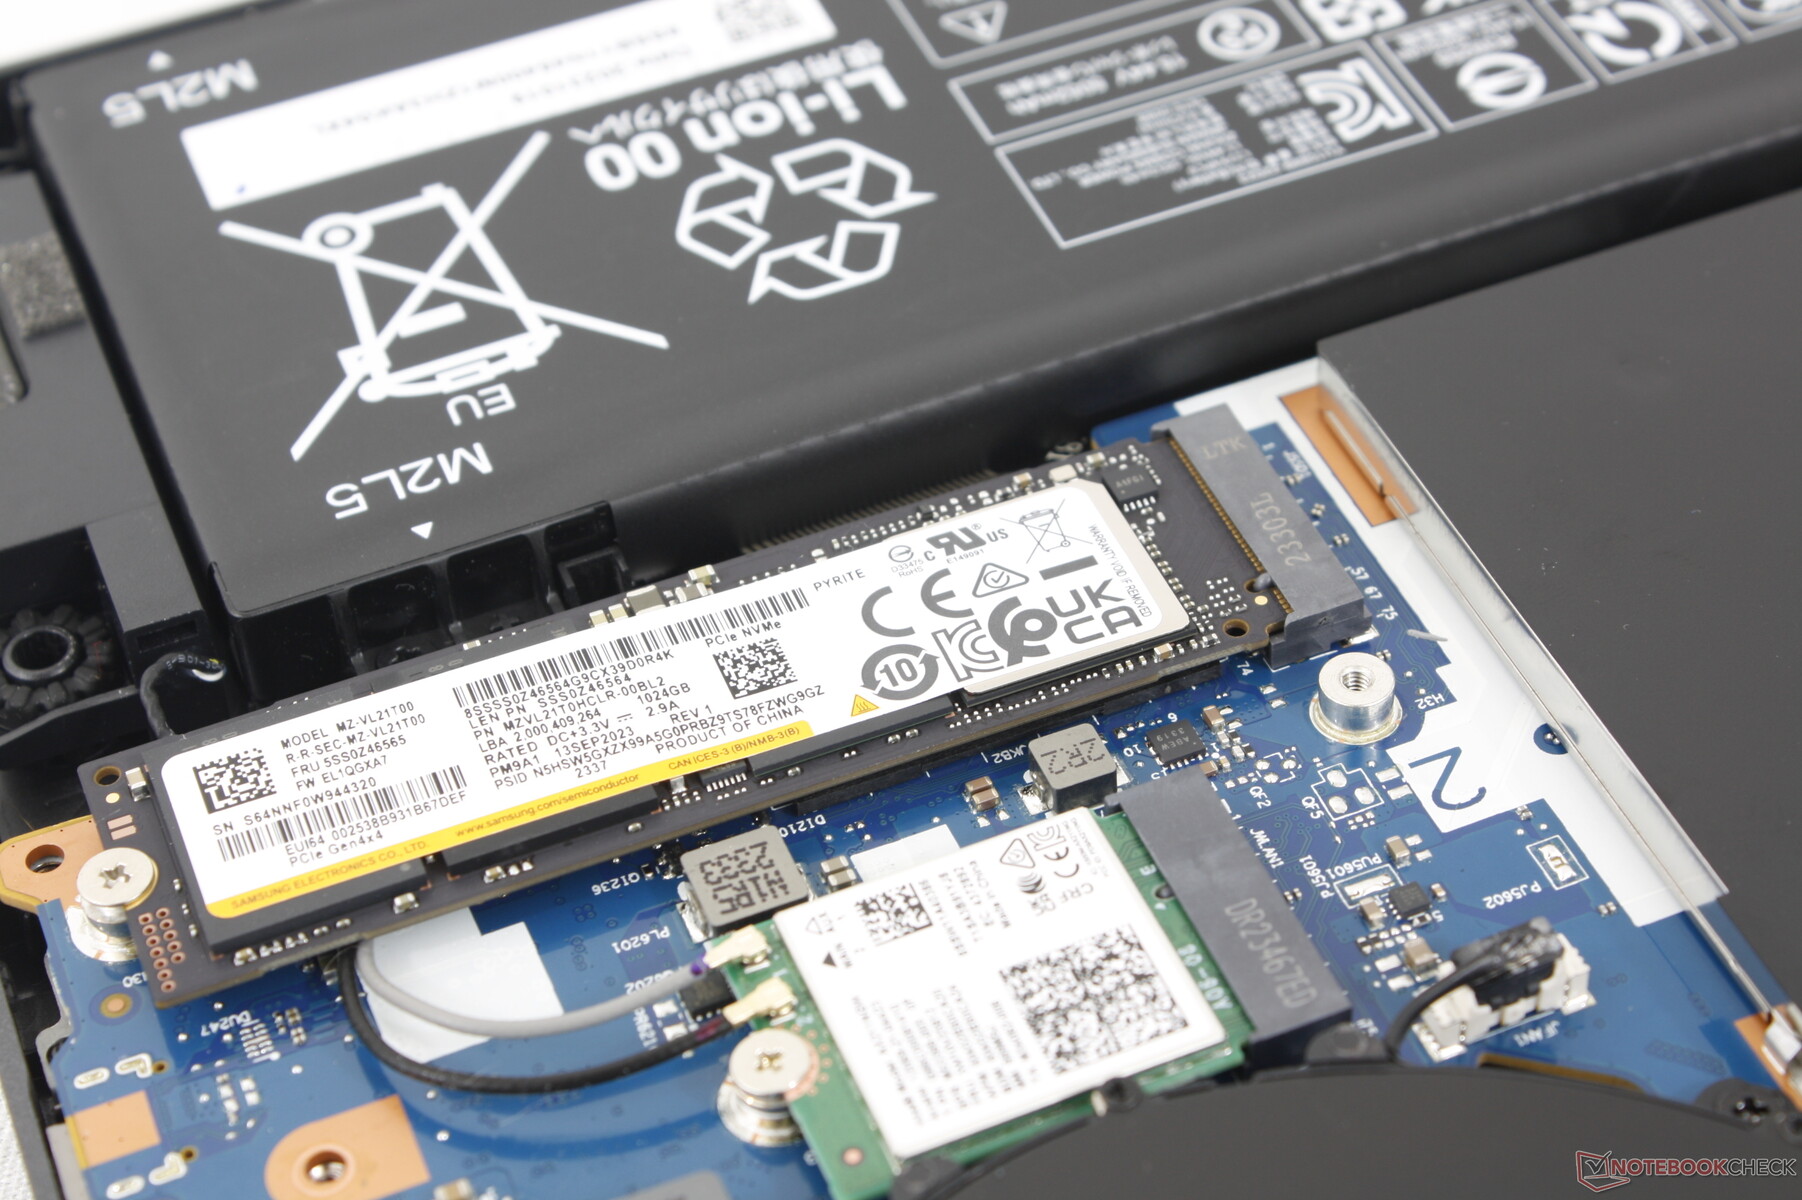
Dispositifs de stockage
Notre appareil est livré avec le Samsung PM9A1 au lieu du SK Hynix PC801 qui équipait le Legion Pro 5 16IRX8 de l'année dernière. Il est intéressant de noter que notre disque Samsung a montré des signes d'étranglement avec des taux de transfert passant de 6600 Mo/s à seulement 3300 Mo/s à la moitié de notre test en boucle DiskSpd. En revanche, le disque SK Hynix du modèle de l'année dernière n'a eu aucun mal à maintenir des taux de transfert bien plus élevés dans des conditions similaires, comme le montre notre graphique de comparaison ci-dessous. Il n'y a malheureusement pas de moyen facile de savoir quel SSD sera livré avec le modèle avant de l'acheter.

* ... Moindre est la valeur, meilleures sont les performances
Disk Throttling: DiskSpd Read Loop, Queue Depth 8
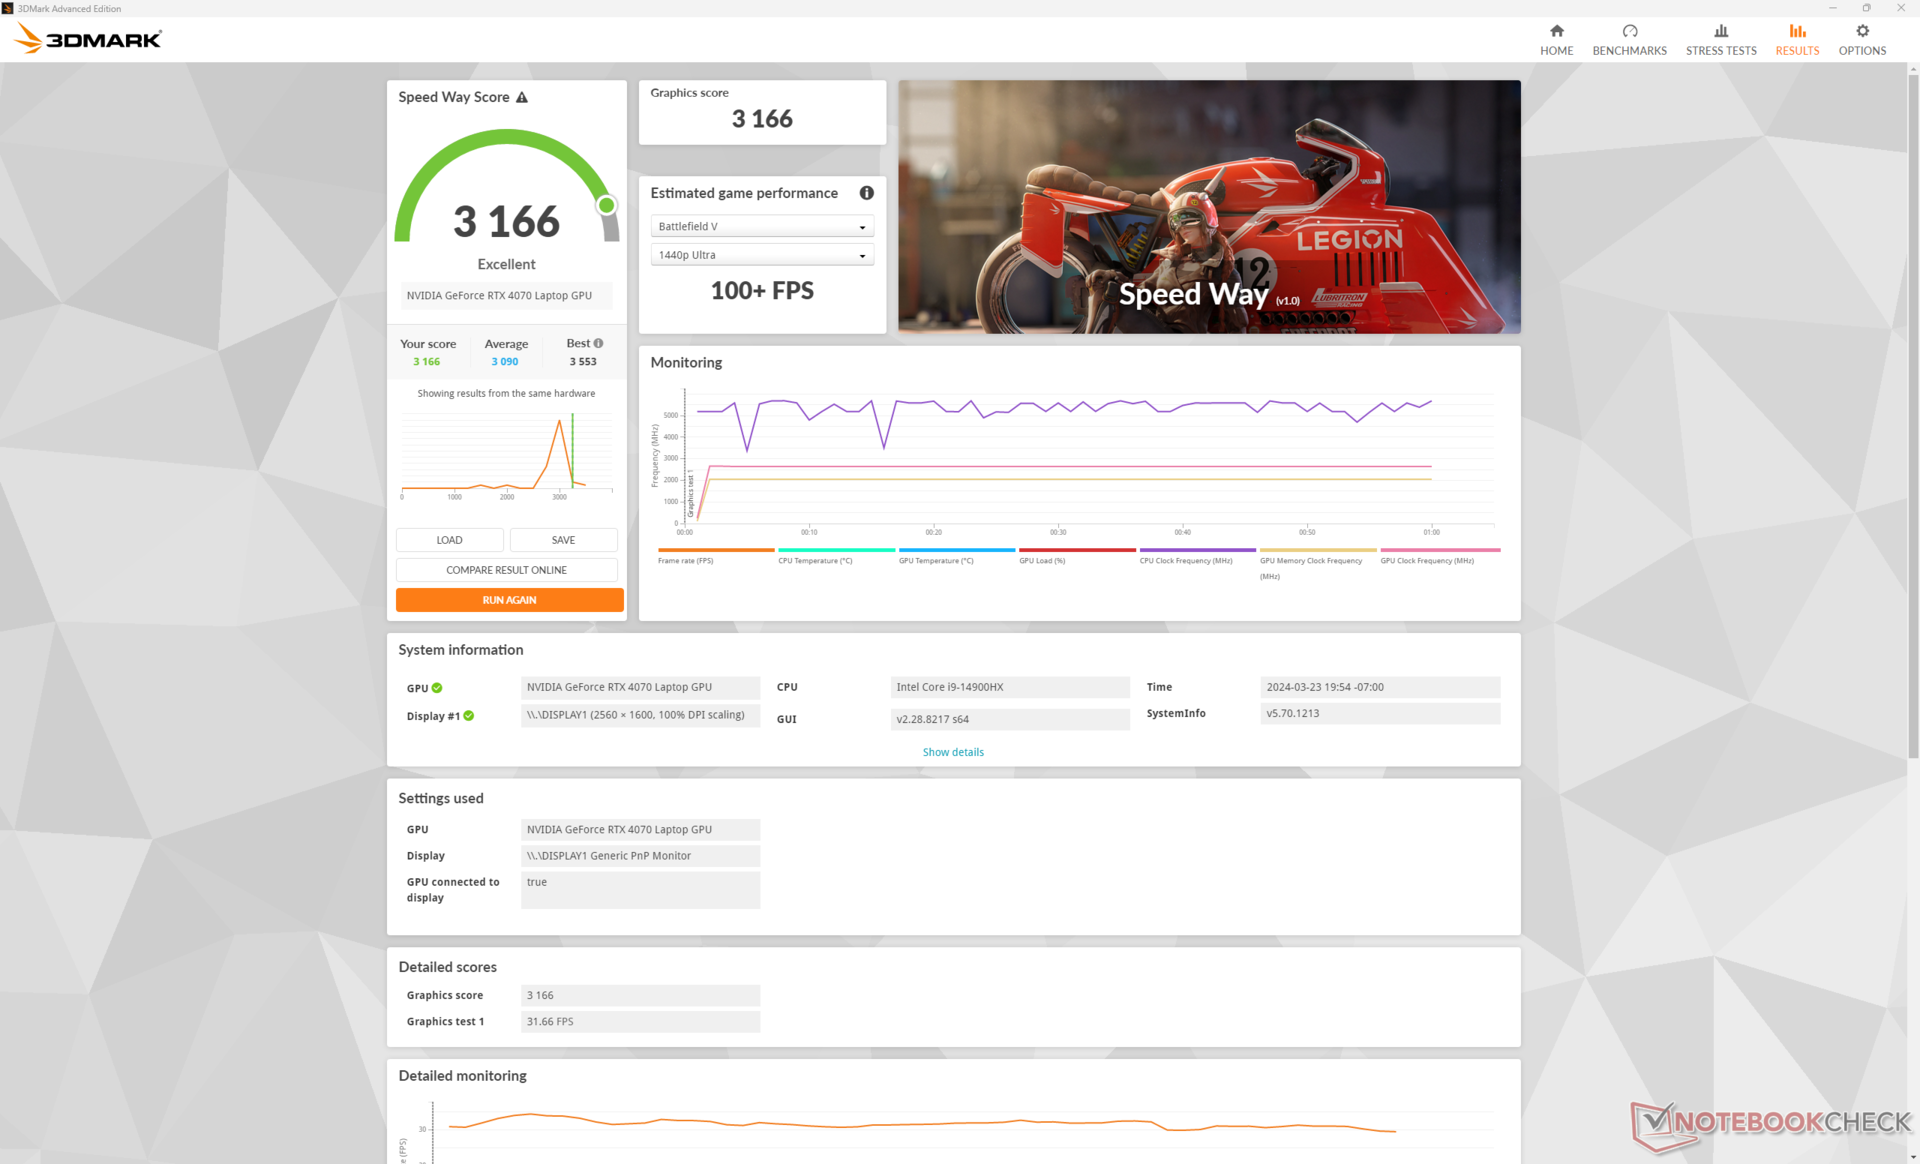
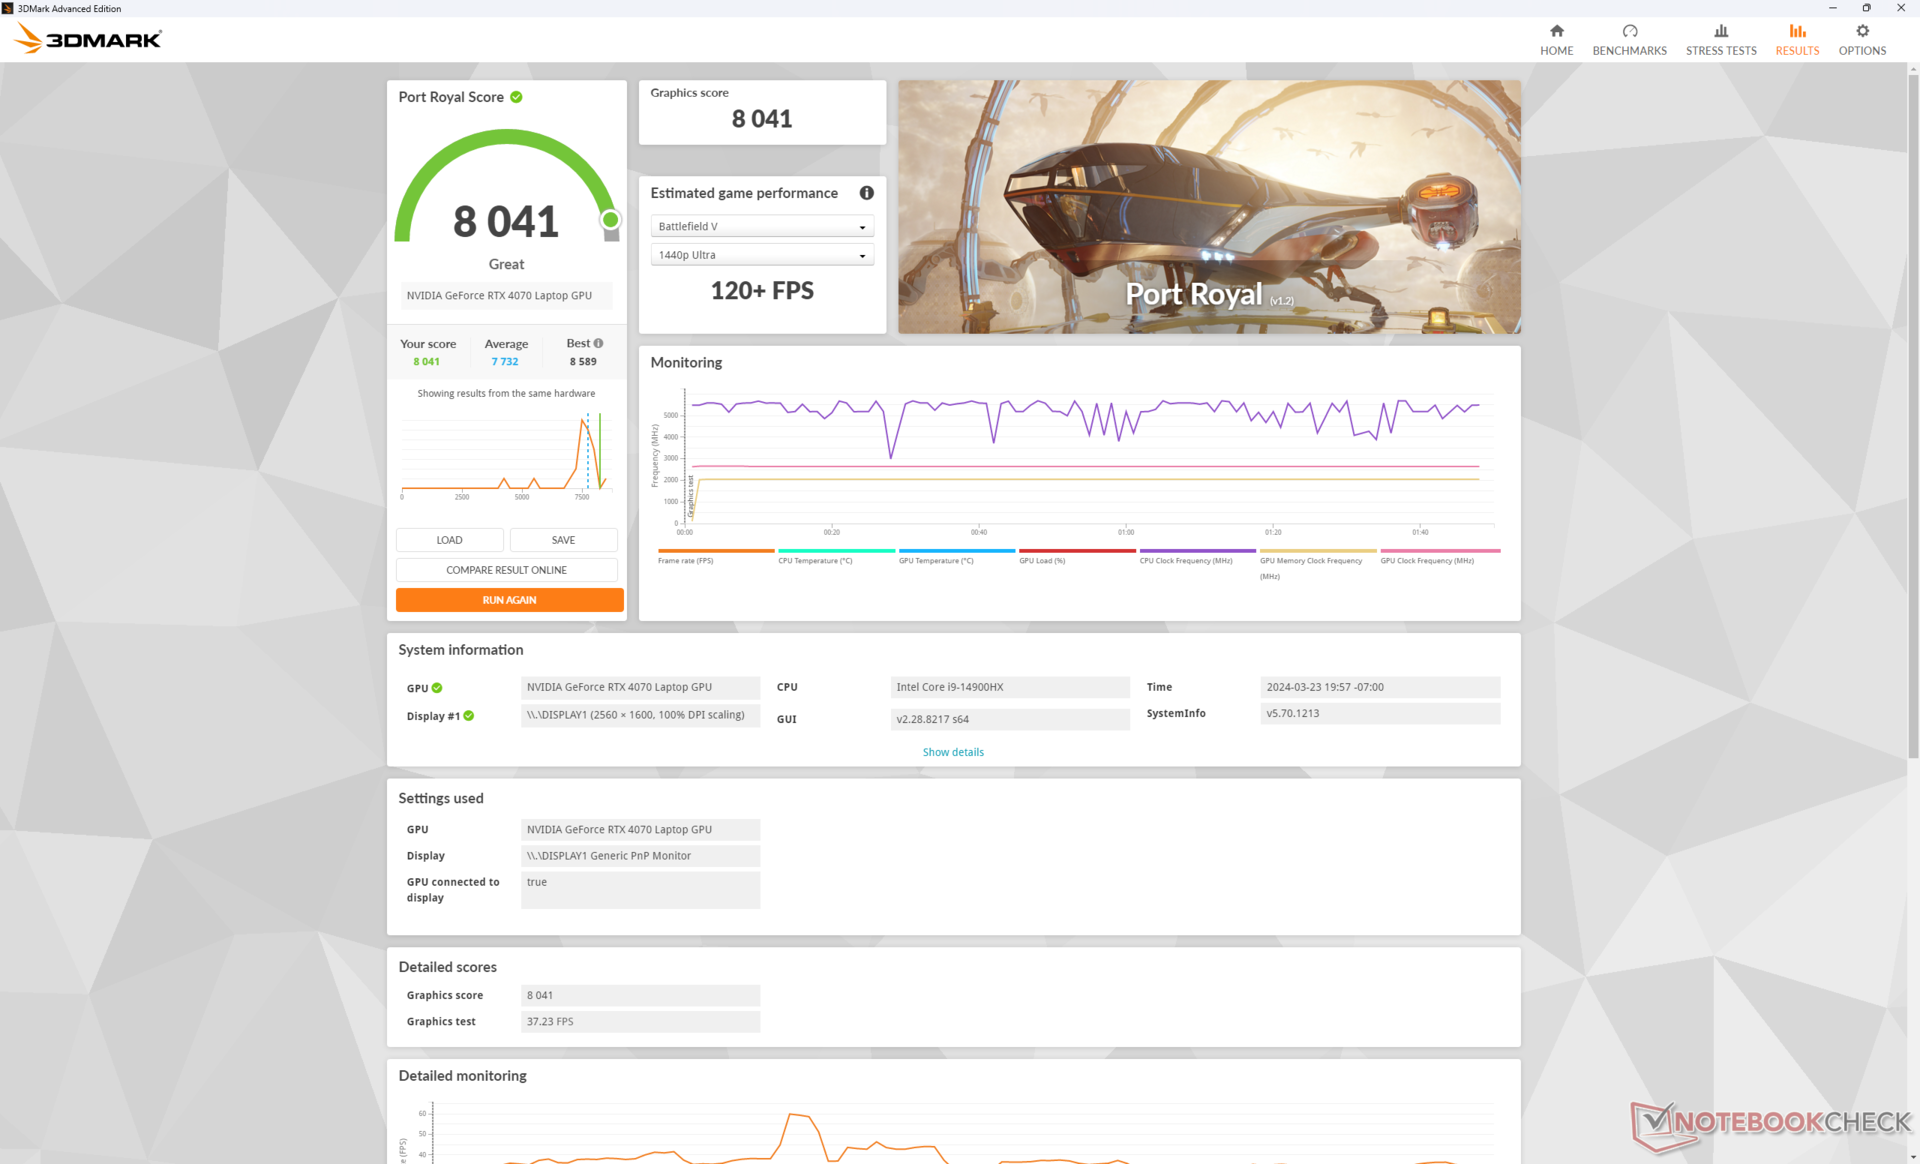
Performance du GPU
Les options graphiques incluent les GeForce RTX 4050, 4060 et 4070 avec le même objectif de 140 W TGP. Nous sommes prêts à parier que le modèle peut prendre en charge les cartes plus rapides RTX 4080 et 4090 plus rapides compte tenu de sa taille et de son poids, mais Lenovo souhaite réserver ces options haut de gamme à la série Legion Pro 7, plus coûteuse. Quoi qu'il en soit, la RTX 4070 de notre Legion Pro 5 16 fonctionne très bien avec des résultats de benchmark qui sont jusqu'à 15% plus rapides que la moyenne des ordinateurs portables de notre base de données avec la même option GPU.
En rétrogradant vers la RTX 4060 ou 4050 devrait avoir un impact sur les performances graphiques d'environ 10 à 20 % et 25 à 35 %, respectivement. Les utilisateurs qui passent d'une ancienne RTX 3070 Ti ne verront pas d'avantages significatifs, sauf si le titre prend en charge DLSS 3, car cette fonctionnalité reste exclusive aux GPU RTX 40 Ada Lovelace.
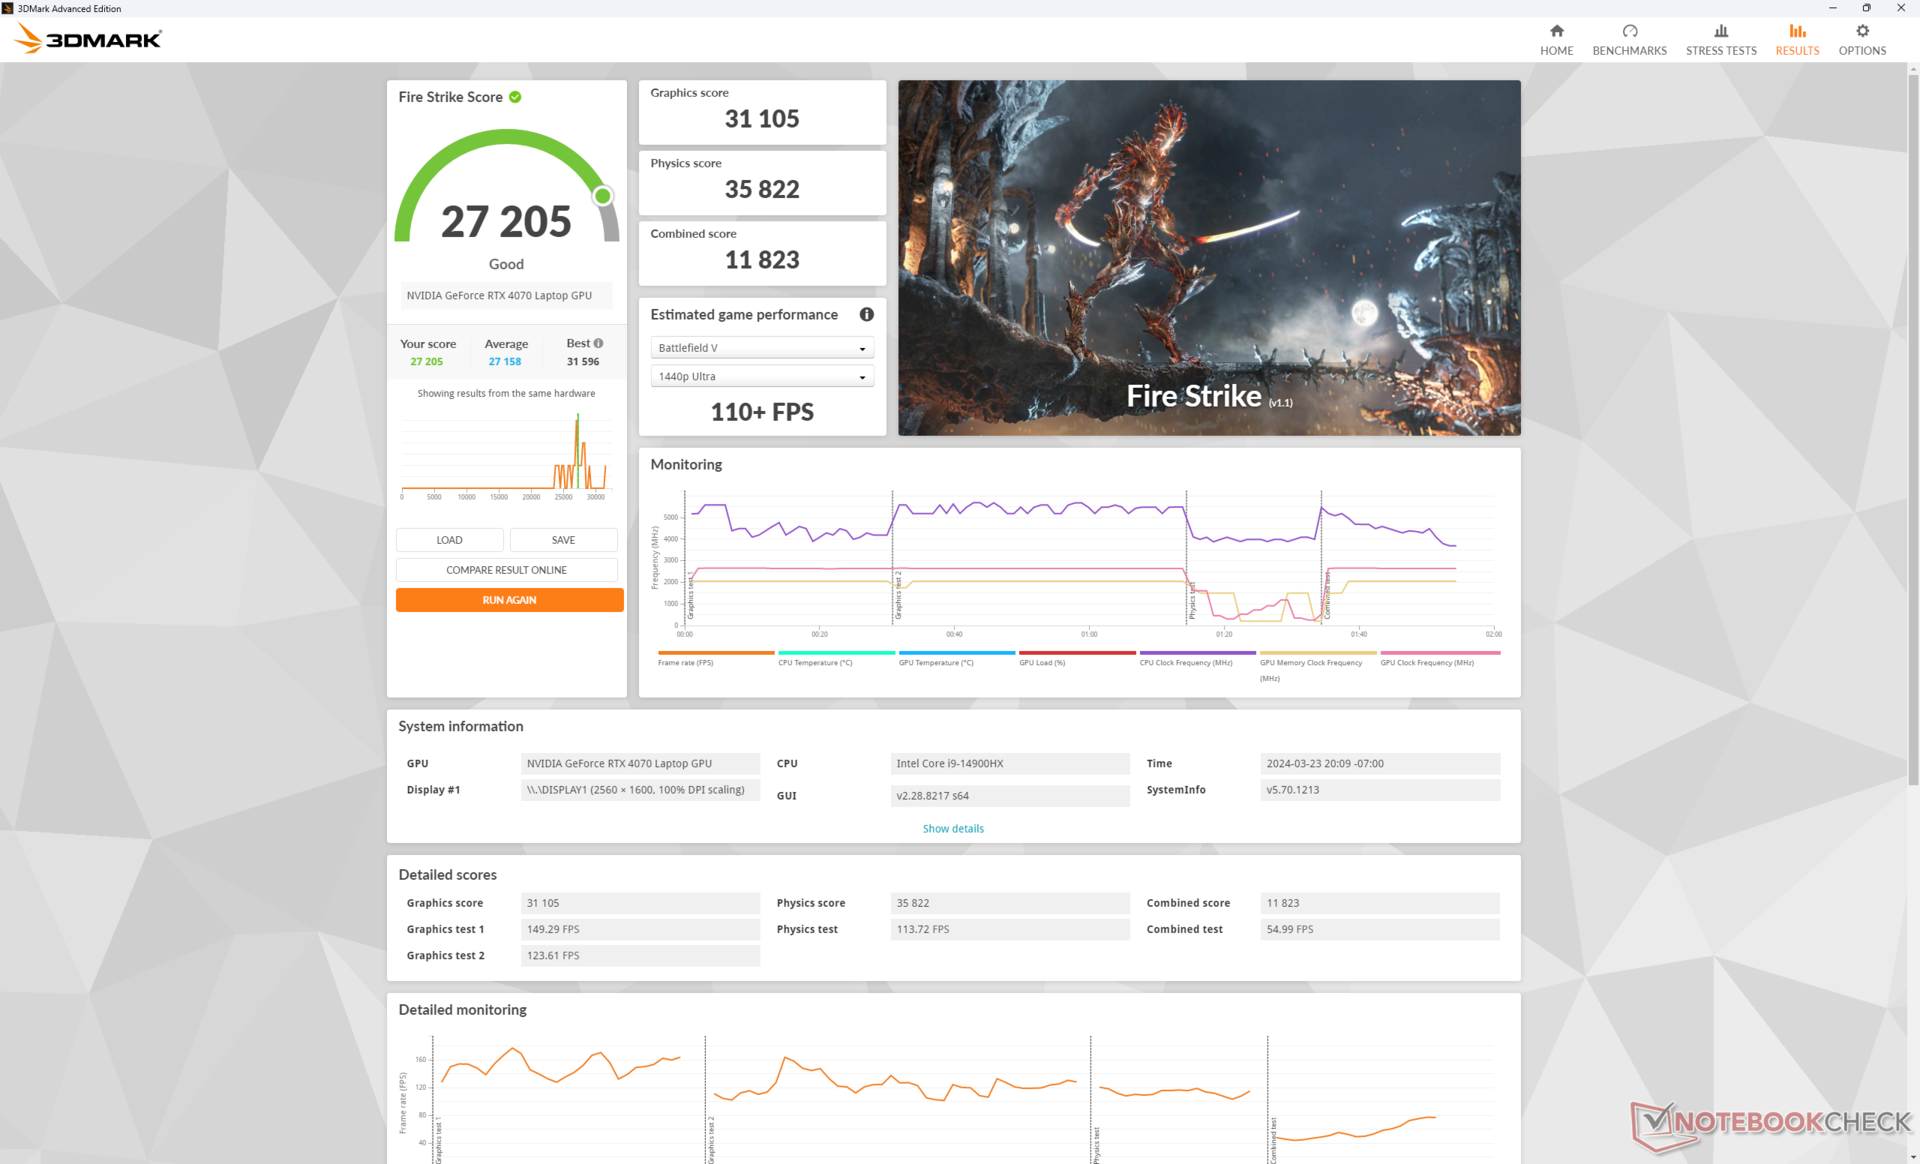
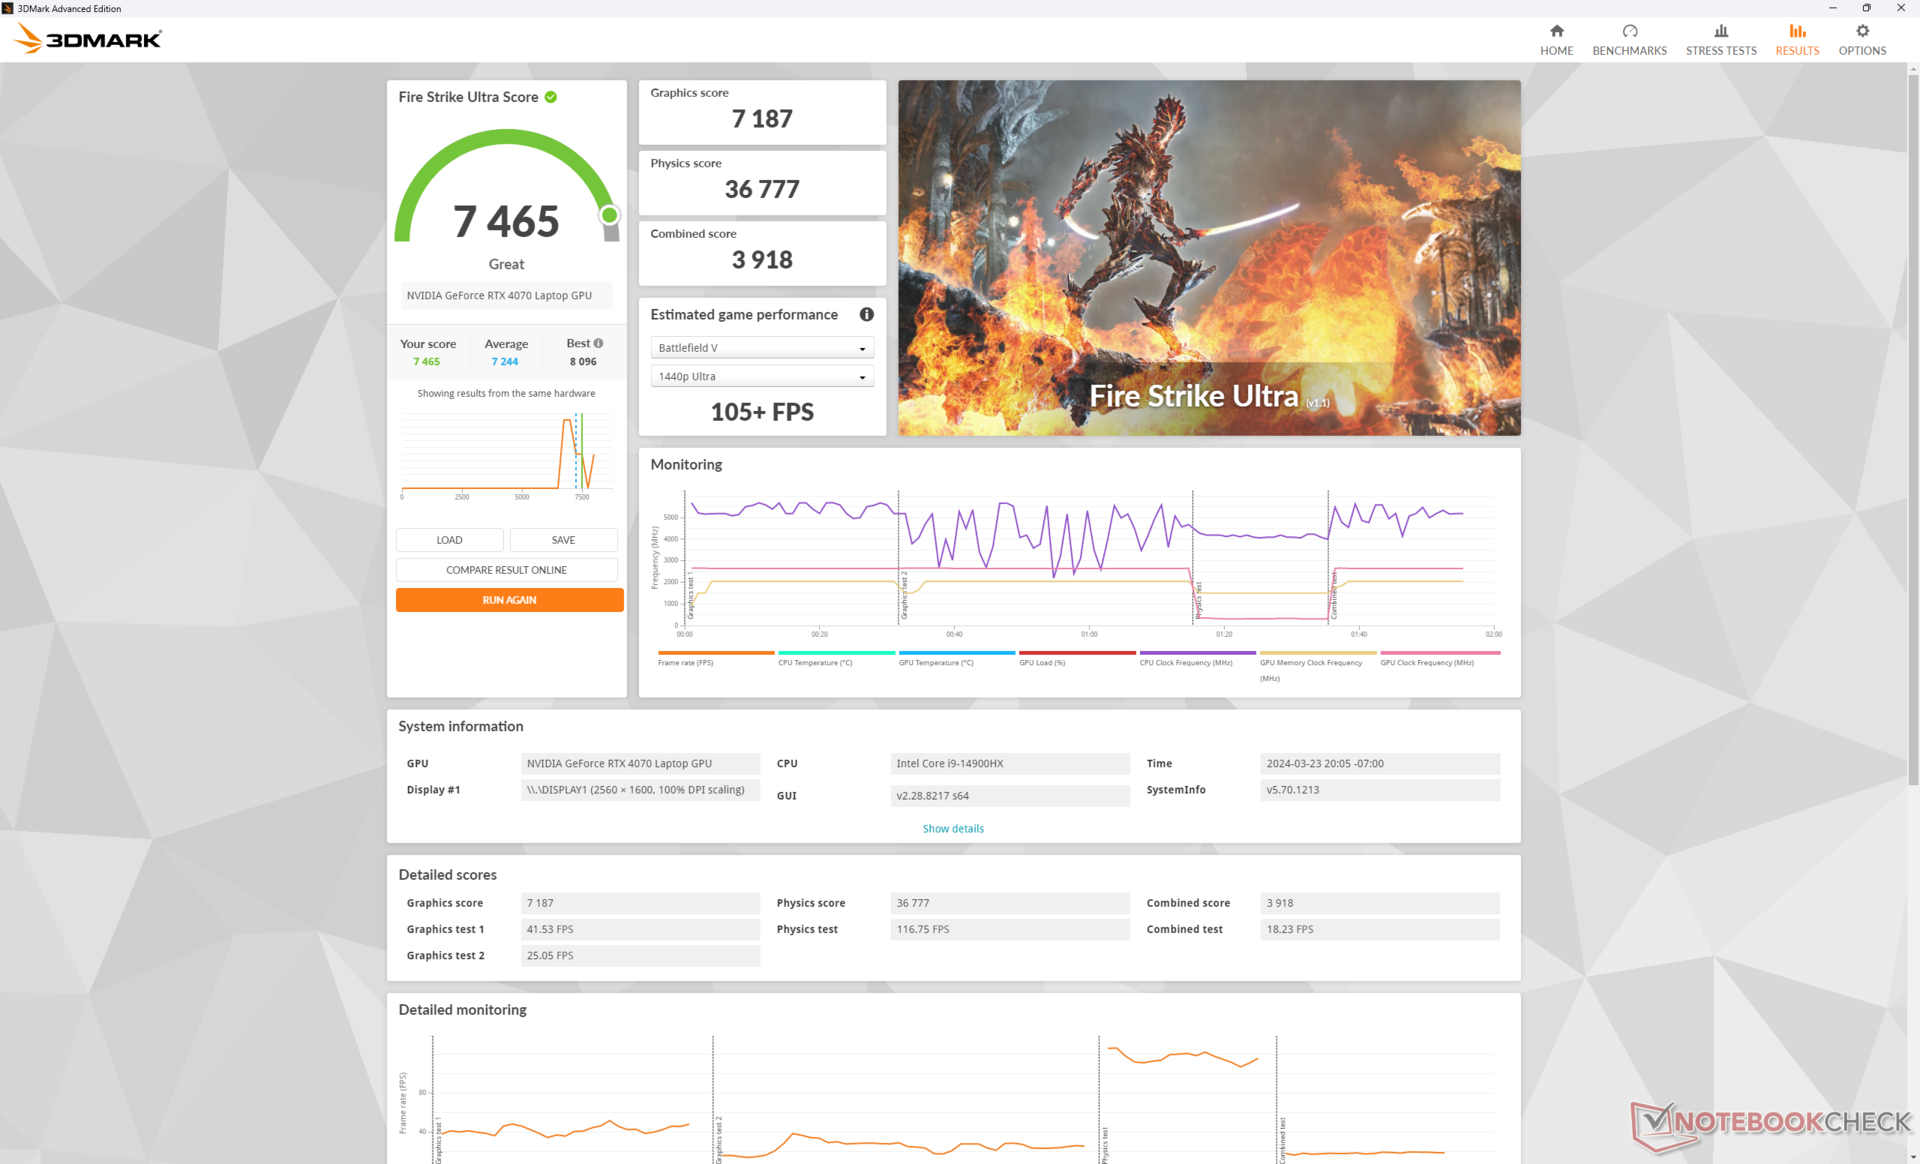
| Profil de puissance | Score graphique | Score physique | Score combiné |
| Mode Performance | 31105 | 35822 | 11823 |
| Mode équilibré | 29127 (-6%) | 37119 (+4%) | 11040 (-7%) |
| Alimentation par batterie | 21813 (-29%) | 21747 (-39%) | 6324 (-47%) |
Le réglage du système en mode équilibré au lieu du mode performance réduira légèrement les performances du GPU d'environ 6 %, tandis que les performances du CPU ne seront pas affectées.
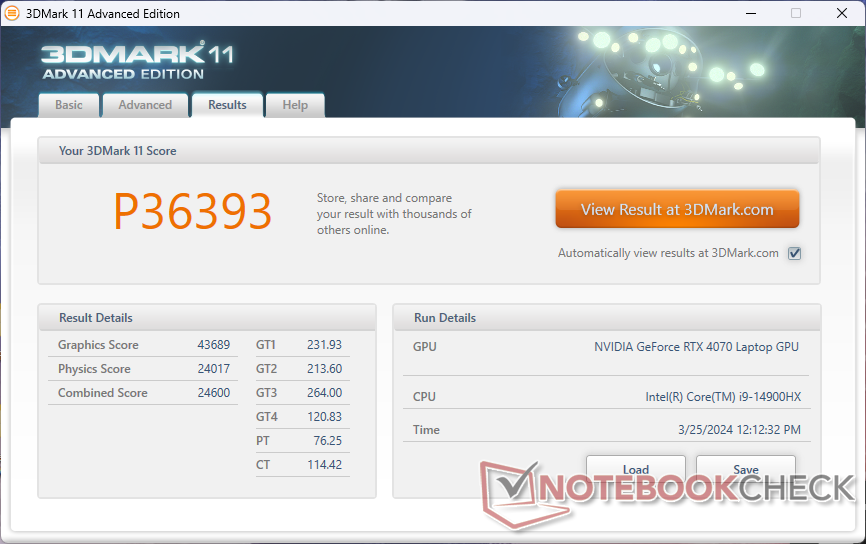
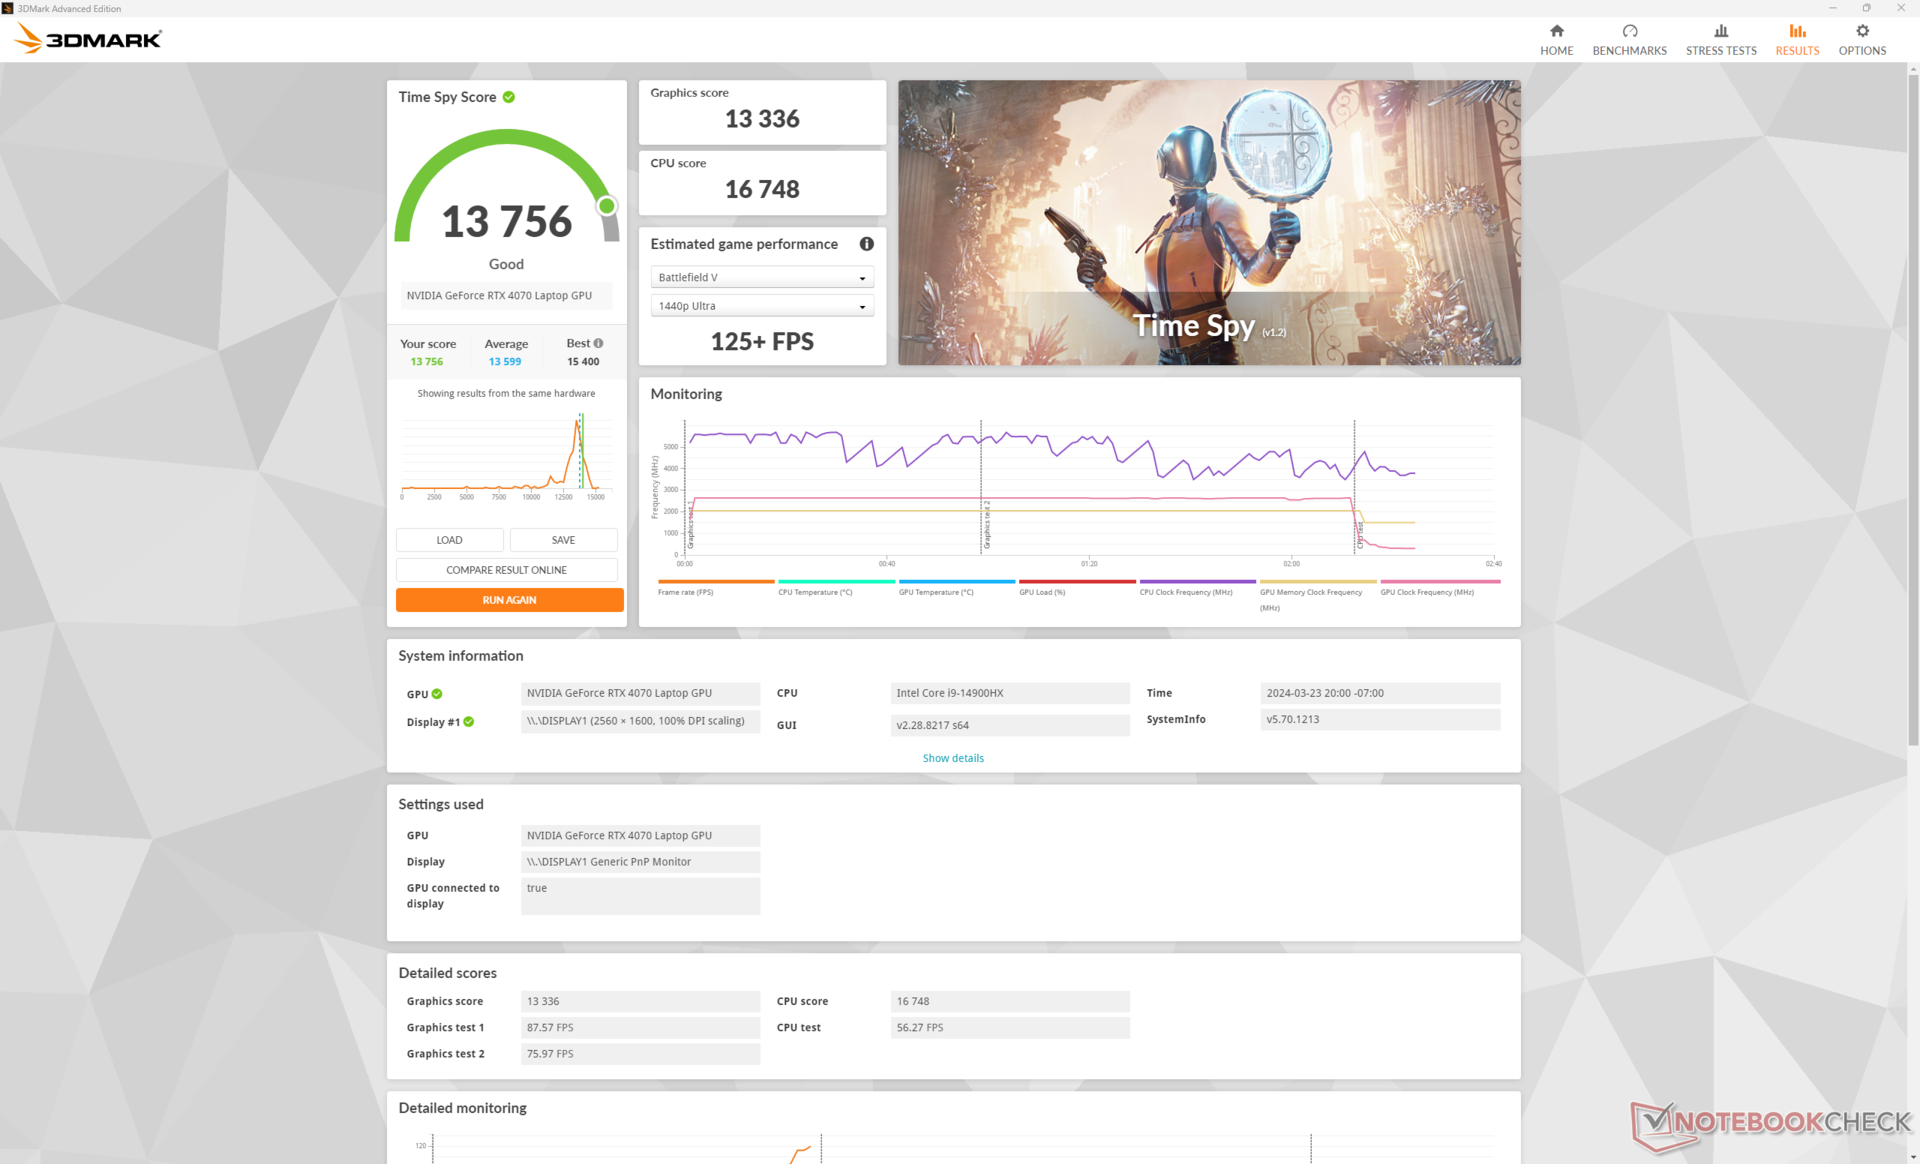
| 3DMark 11 Performance | 36393 points | |
| 3DMark Fire Strike Score | 27205 points | |
| 3DMark Time Spy Score | 13756 points | |
Aide | ||
* ... Moindre est la valeur, meilleures sont les performances
Performances des jeux
Notre Lenovo surpasse presque systématiquement l'Alienware m16 R2 de 5 à 10 %, même si tous deux sont équipés du même GPU RTX 4070 de 140 W GeForce. La différence est probablement due à notre CPU Core i9-14900HX plus rapide, alors que l'Alienware est équipé d'un Core Ultra 7 155H.
La RTX 4070 mobile n'est pas très performante aux résolutions 4K car elle est beaucoup plus faible qu'une RTX 4070 de bureau "normale". Pour ces scénarios, vous devrez activer DLSS 2 et/ou la génération d'images chaque fois que cela est possible pour obtenir des taux de rafraîchissement plus fluides. Par exemple, l'exécution de Cyberpunk 2077 en 4K natif avec les paramètres Ultra et sans RT se traduirait par un taux de rafraîchissement moyen de seulement 21. Cependant, si DLSS 3 est activé sur Balanced, le taux de rafraîchissement moyen passe à 64.
Witcher 3 FPS Chart
| Bas | Moyen | Élevé | Ultra | QHD | 4K | |
|---|---|---|---|---|---|---|
| GTA V (2015) | 186.7 | 184.9 | 181.7 | 127.2 | 100.1 | 99.8 |
| The Witcher 3 (2015) | 607.3 | 448.7 | 268.3 | 133.7 | 83.5 | |
| Dota 2 Reborn (2015) | 231 | 205 | 196.7 | 185.3 | 153.3 | |
| Final Fantasy XV Benchmark (2018) | 205 | 185.9 | 131 | 95.1 | 52.8 | |
| X-Plane 11.11 (2018) | 188.3 | 173.3 | 137.6 | 120.3 | ||
| Far Cry 5 (2018) | 191 | 183 | 170 | 158 | 128 | 65 |
| Strange Brigade (2018) | 496 | 340 | 268 | 234 | 150.9 | 77.9 |
| Tiny Tina's Wonderlands (2022) | 283.4 | 230.6 | 151.4 | 115.9 | 79.5 | 36.9 |
| F1 22 (2022) | 320 | 312 | 245 | 88.7 | 58.8 | 27.6 |
| Baldur's Gate 3 (2023) | 176 | 150.8 | 128.5 | 125.6 | 89.6 | 45.2 |
| Cyberpunk 2077 (2023) | 143.4 | 124 | 102.2 | 87.1 | 52.8 | 23.5 |
Émissions
Bruit du système
Le bruit du ventilateur est généralement plus fort que ce que nous avons enregistré sur le modèle Core i7 et RTX 4060 de l'année dernière, potentiellement en raison de notre configuration Core i9 et RTX 4070 plus rapide. Lors de l'exécution de charges peu exigeantes comme les navigateurs ou la vidéo, le bruit du ventilateur se situe généralement juste en dessous de 30 dB(A), ce qui est largement inaudible dans la plupart des scénarios. Cependant, lors de l'exécution de 3DMark 06, les ventilateurs prennent de la vitesse assez rapidement, même en mode équilibré.
Il est intéressant de noter que le bruit des ventilateurs en mode équilibré est identique à celui du mode performance (51 dB(A)). Ceci est confirmé par nos mesures de test de stress ci-dessus, où les températures du cœur sont nettement plus basses en mode équilibré. Par conséquent, nous vous recommandons de jouer en mode Performance, car le mode Équilibré n'offre pas une expérience nettement plus silencieuse. Avec plus de 50 dB(A), le Lenovo sera plus bruyant que la plupart des autres ordinateurs portables de jeu.
Degré de la nuisance sonore
| Au repos |
| 24.3 / 24.3 / 28.9 dB(A) |
| Fortement sollicité |
| 45.8 / 56.6 dB(A) |
 | ||
30 dB silencieux 40 dB(A) audible 50 dB(A) bruyant |
||
min: | ||
| Lenovo Legion Pro 5 16IRX9 GeForce RTX 4070 Laptop GPU, i9-14900HX, Samsung PM9A1 MZVL21T0HCLR | Lenovo Legion Pro 5 16IRX8 GeForce RTX 4060 Laptop GPU, i7-13700HX, SK hynix PC801 HFS512GEJ9X115N | Alienware m16 R2 GeForce RTX 4070 Laptop GPU, Ultra 7 155H, Samsung PM9A1 MZVL21T0HCLR | HP Omen Transcend 16-u1095ng GeForce RTX 4070 Laptop GPU, i9-14900HX, Kioxia XG8 KXG80ZNV1T02 | Asus ROG Zephyrus G16 2024 GU605M GeForce RTX 4070 Laptop GPU, Ultra 7 155H, WD PC SN560 SDDPNQE-1T00 | MSI Stealth 16 Mercedes-AMG Motorsport A13VG GeForce RTX 4070 Laptop GPU, i9-13900H, Samsung PM9A1 MZVL22T0HBLB | |
|---|---|---|---|---|---|---|
| Noise | 8% | 2% | -2% | 5% | 4% | |
| arrêt / environnement * (dB) | 23.9 | 23 4% | 24.7 -3% | 24 -0% | 23.9 -0% | 25 -5% |
| Idle Minimum * (dB) | 24.3 | 23.1 5% | 25.3 -4% | 29 -19% | 23.9 2% | 25 -3% |
| Idle Average * (dB) | 24.3 | 23.1 5% | 25.3 -4% | 30 -23% | 27.8 -14% | 26 -7% |
| Idle Maximum * (dB) | 28.9 | 26.6 8% | 25.3 12% | 31 -7% | 30.1 -4% | 27 7% |
| Load Average * (dB) | 45.8 | 34.7 24% | 31.7 31% | 45 2% | 34.2 25% | 39 15% |
| Witcher 3 ultra * (dB) | 51 | 47.6 7% | 53.8 -5% | 44 14% | 46.4 9% | 45 12% |
| Load Maximum * (dB) | 56.6 | 54.8 3% | 62 -10% | 47 17% | 46.4 18% | 51 10% |
* ... Moindre est la valeur, meilleures sont les performances
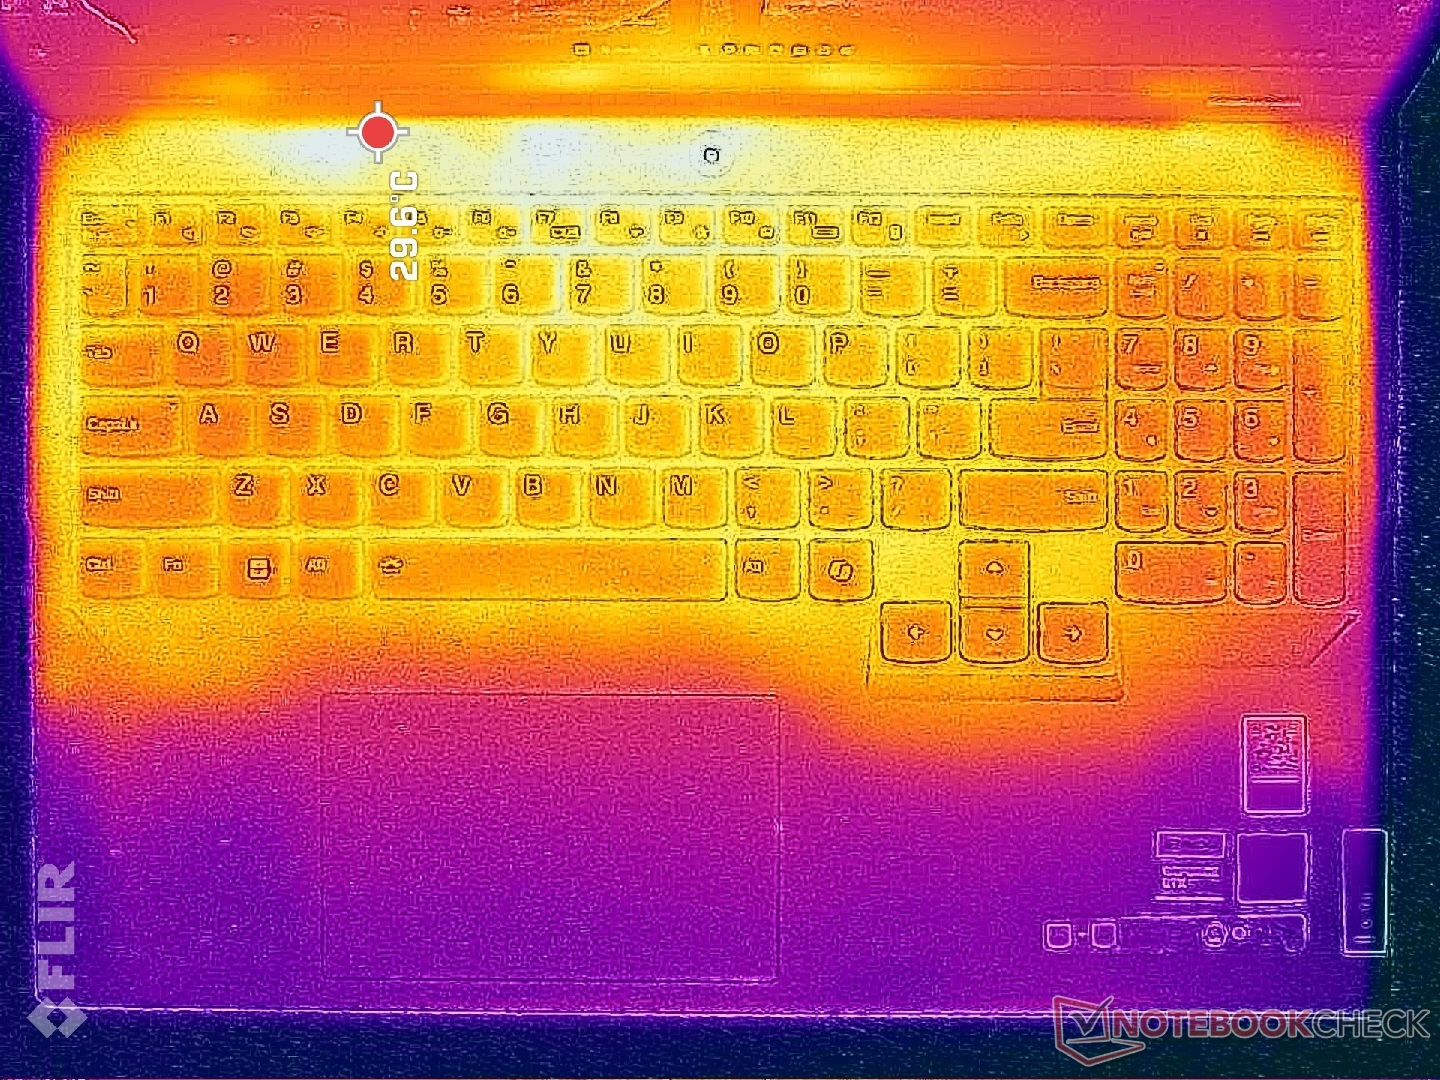
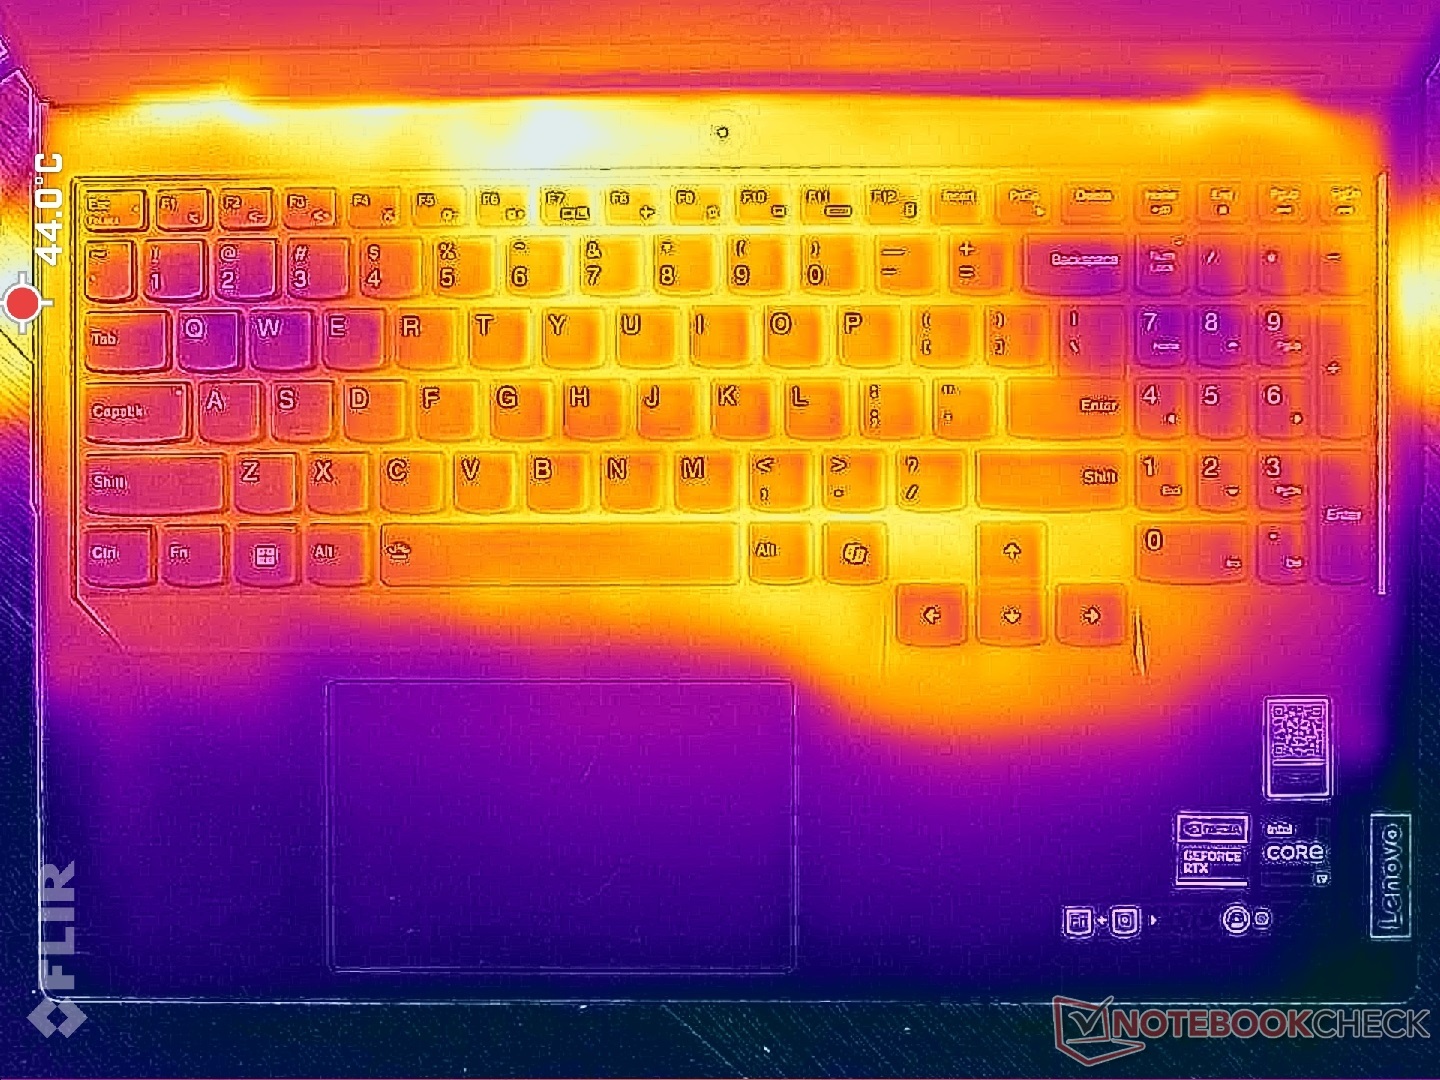
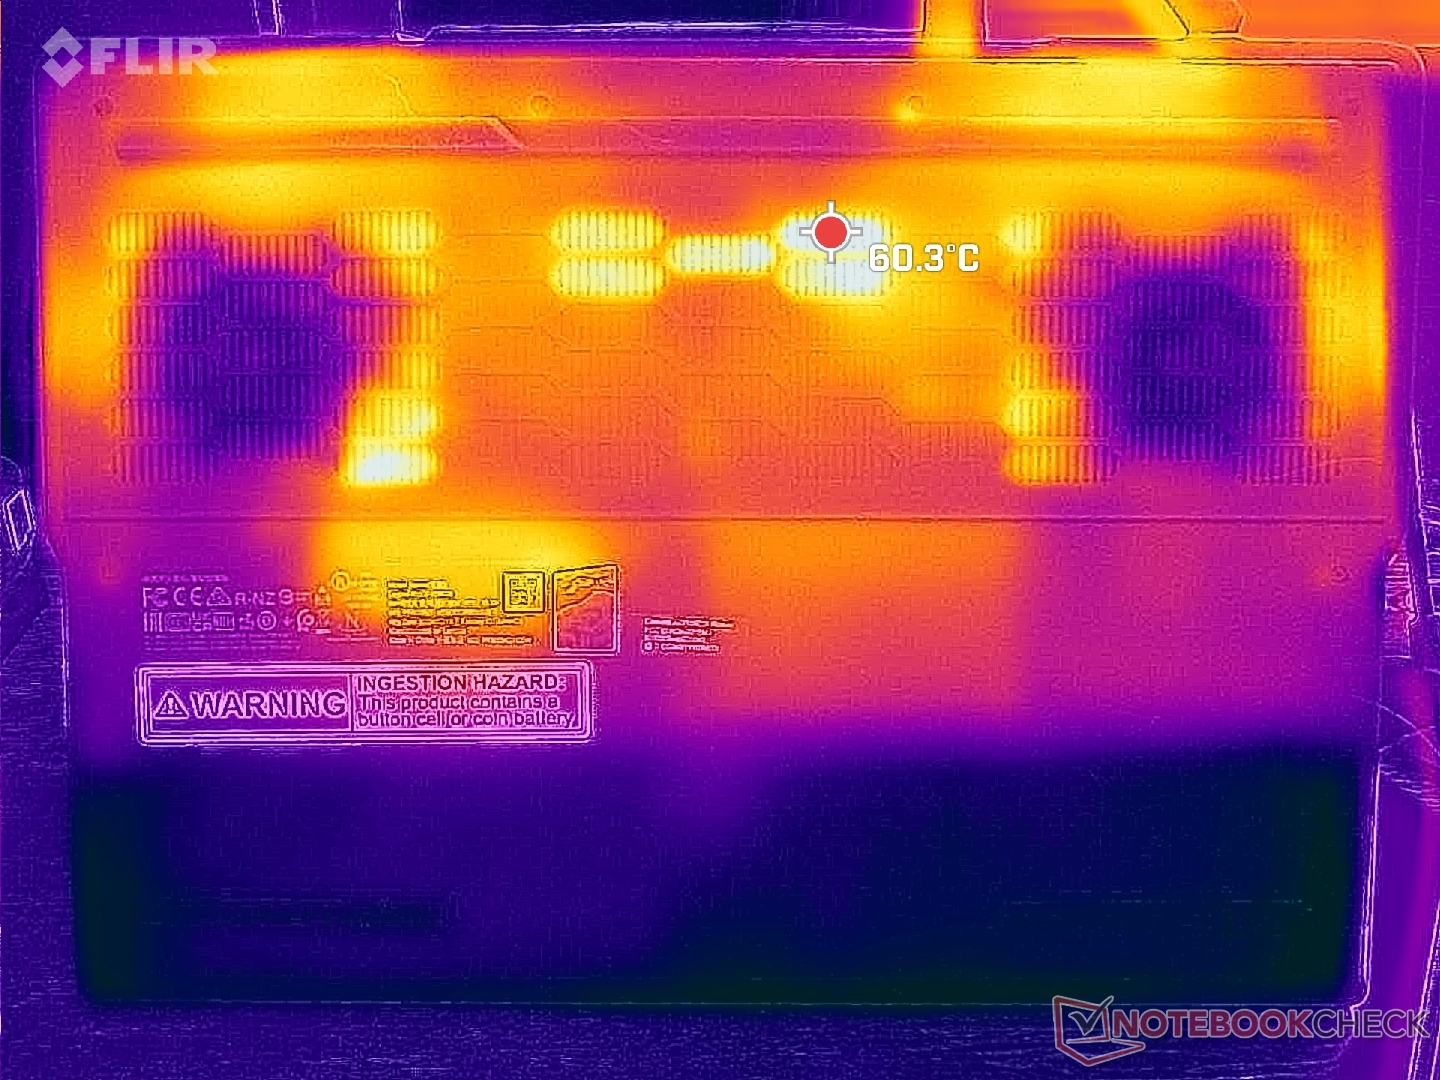
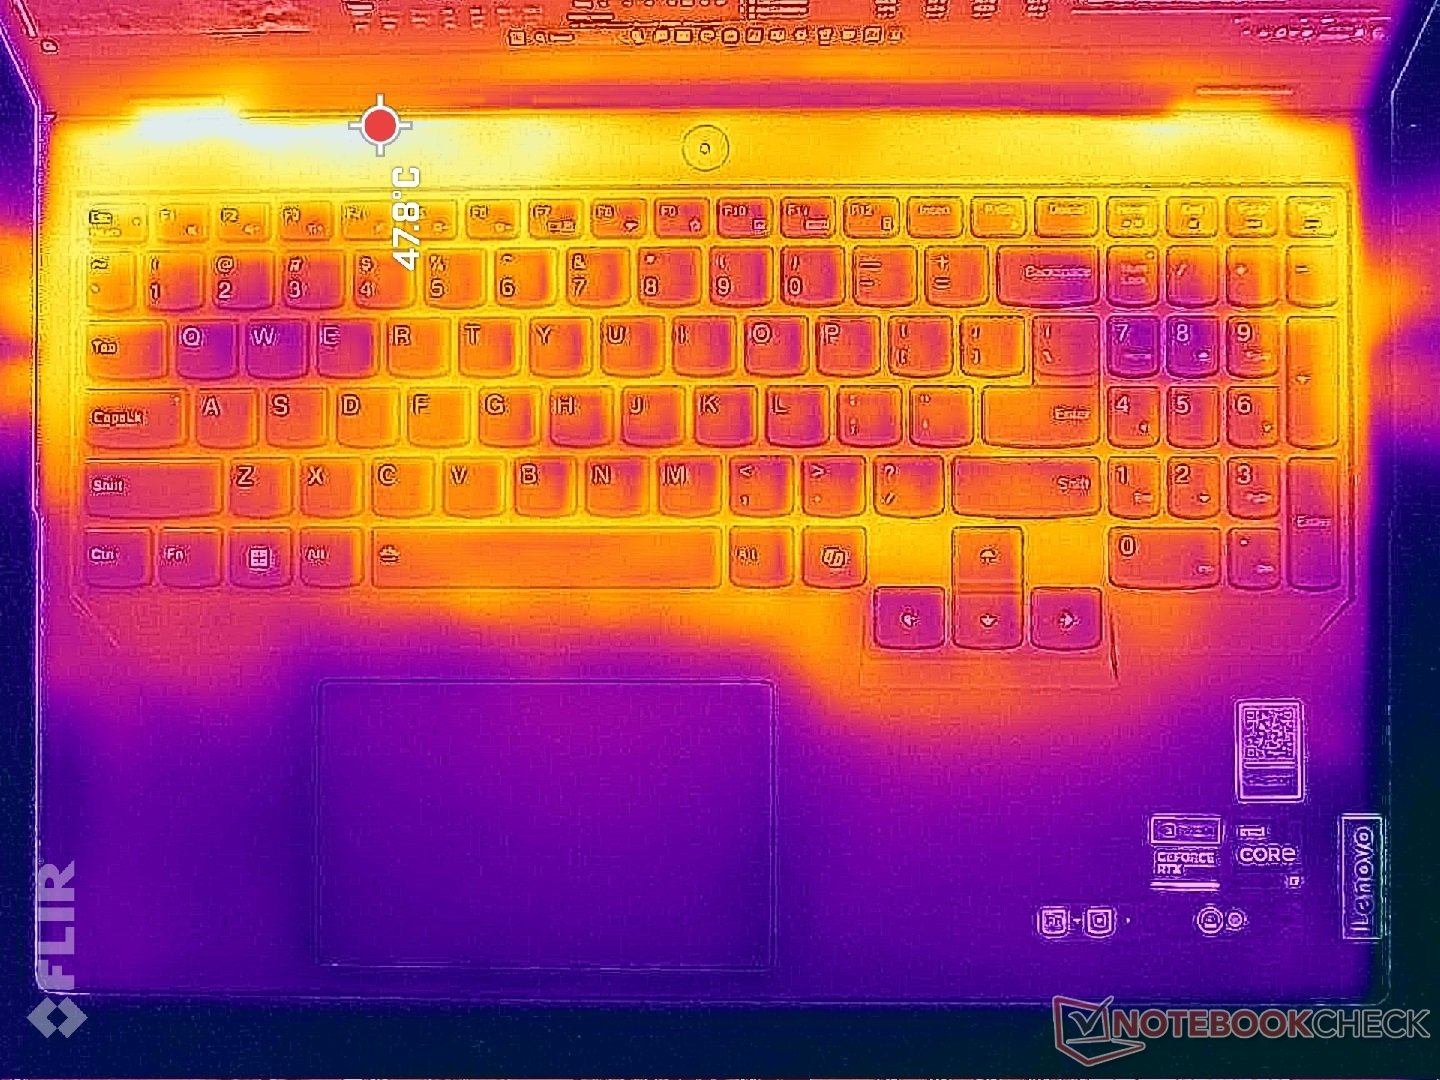
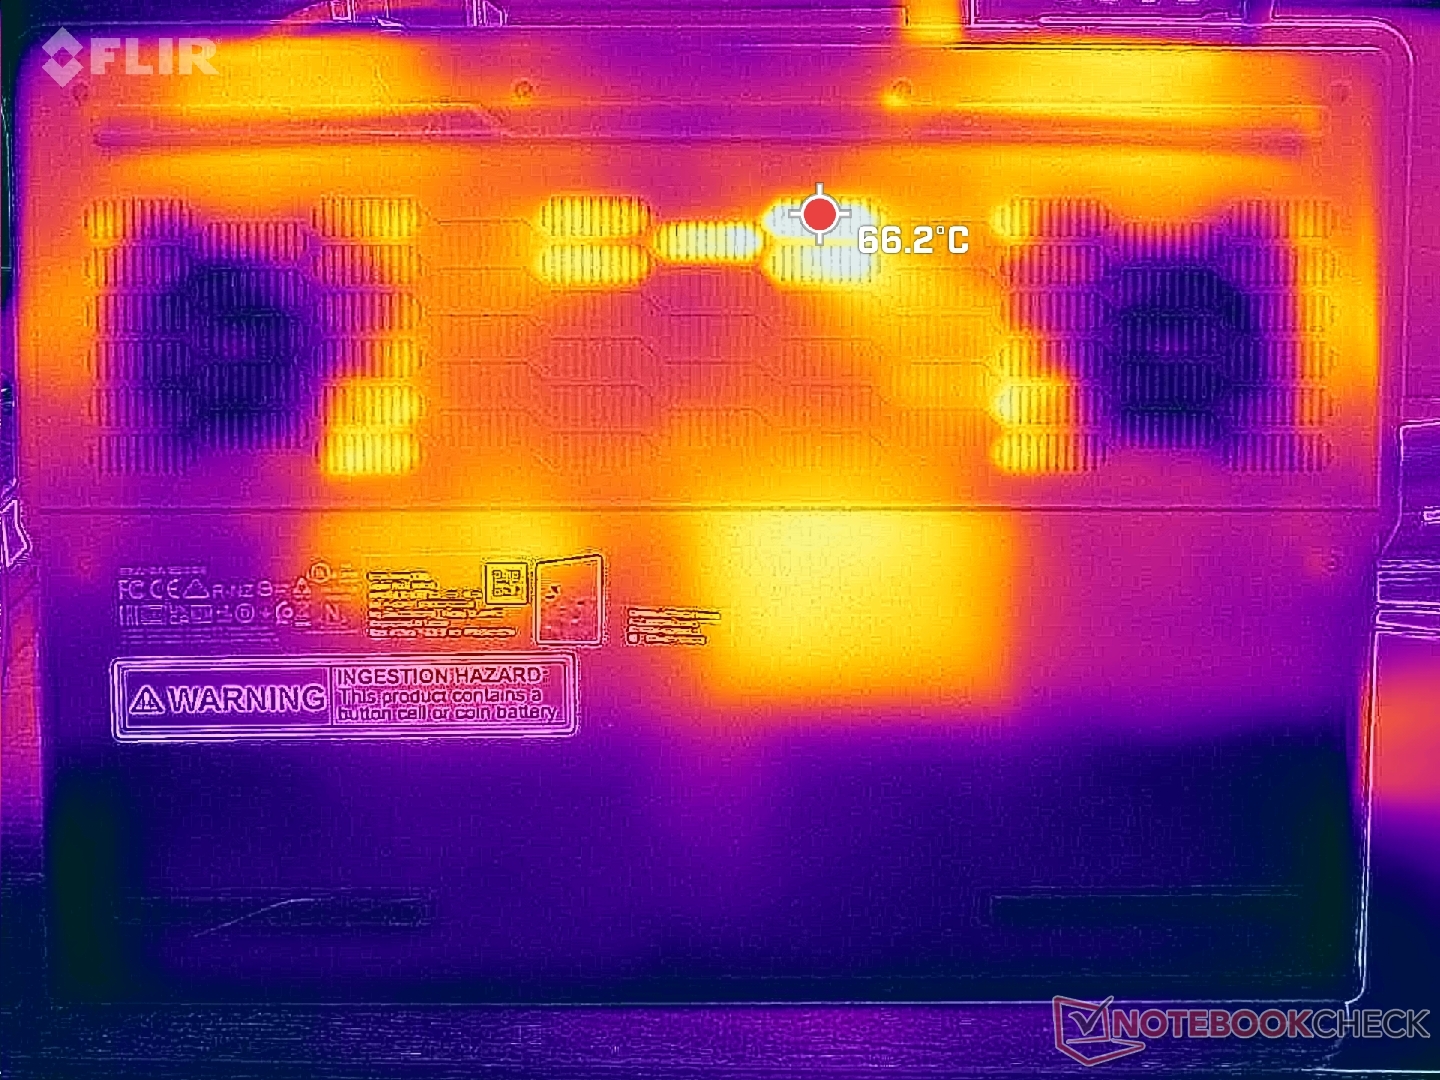
Température
Les températures de surface peuvent être plus élevées que celles enregistrées sur le modèle de l'année dernière. Lorsque vous jouez, par exemple, une grande partie du clavier peut atteindre une température de 40°C, contre seulement 36°C sur le Legion Pro 5 16IRX8 ou 34°C sur l'Alienware m16 R2. Les repose-poignets et les touches WASD resteront plus froids pour que les mains soient à l'aise pendant les jeux, mais le reste de l'ordinateur portable sera assez chaud.
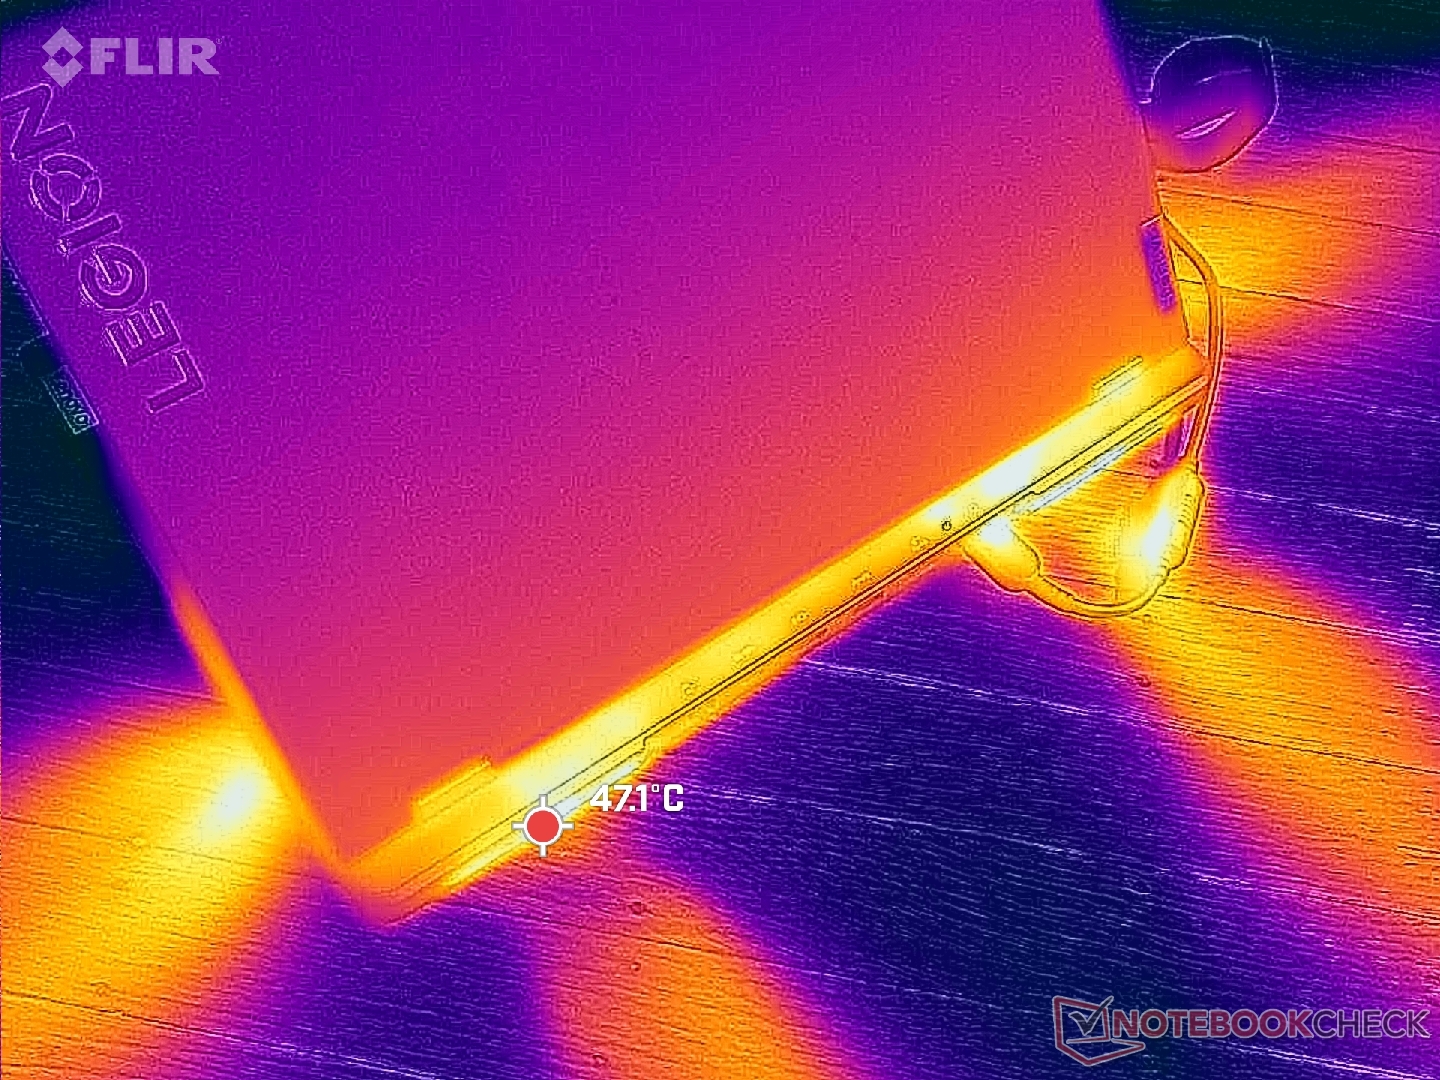
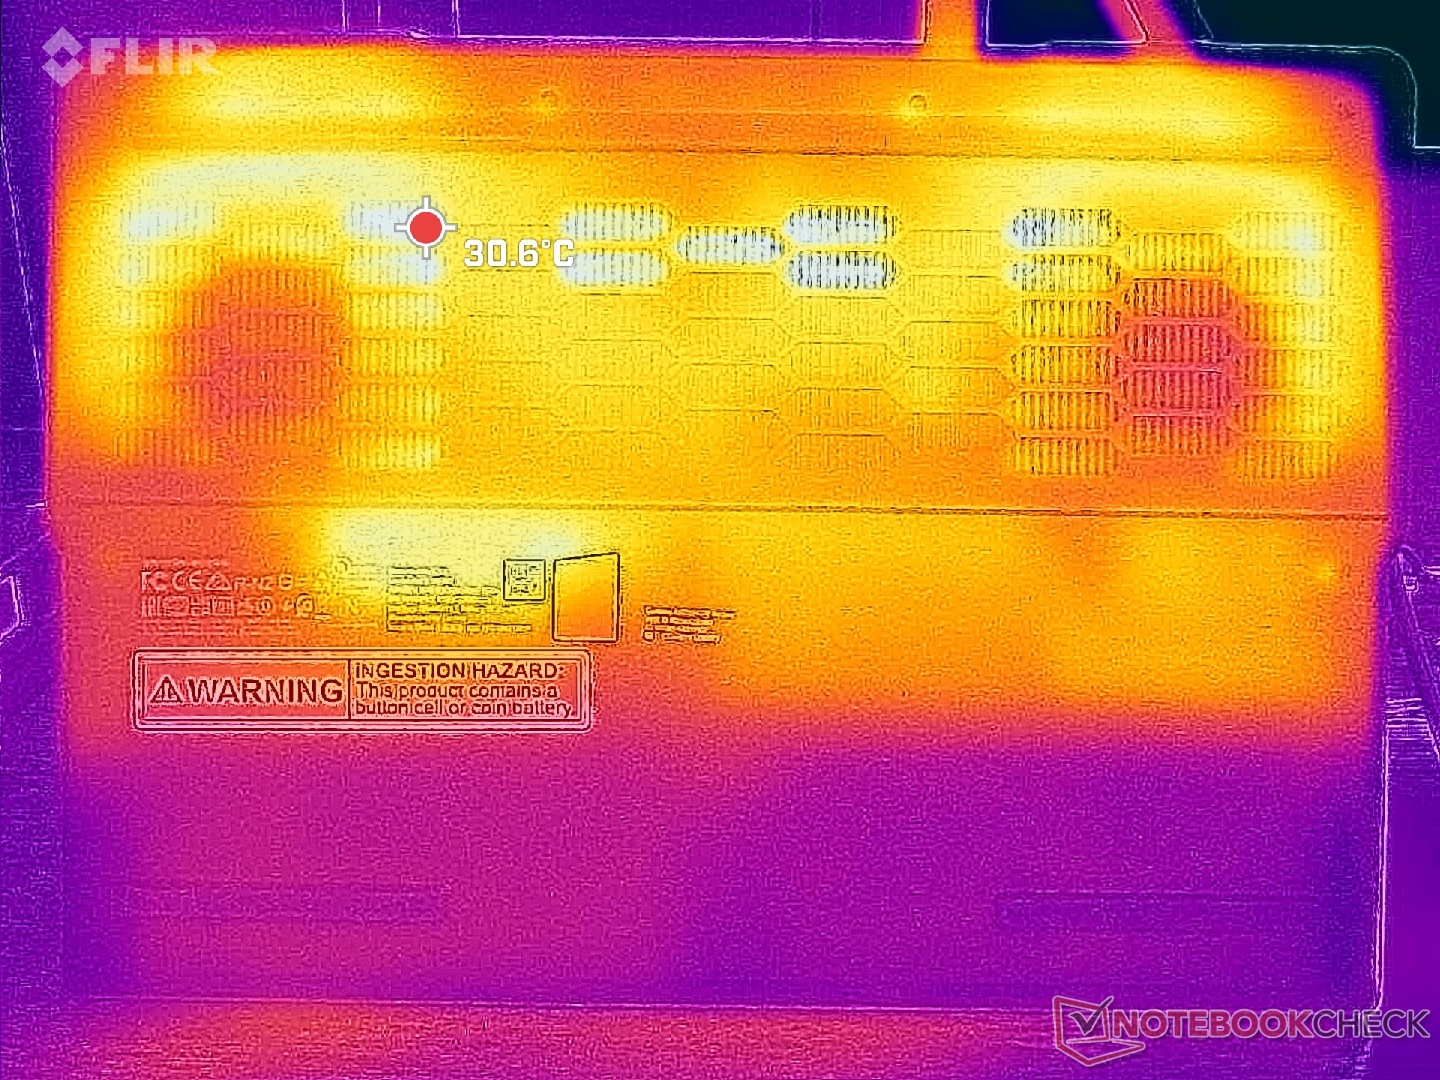
(±) La température maximale du côté supérieur est de 43.8 °C / 111 F, par rapport à la moyenne de 40.4 °C / 105 F, allant de 21.2 à 68.8 °C pour la classe Gaming.
(-) Le fond chauffe jusqu'à un maximum de 55.4 °C / 132 F, contre une moyenne de 43.2 °C / 110 F
(+) En utilisation inactive, la température moyenne du côté supérieur est de 29.6 °C / 85 F, par rapport à la moyenne du dispositif de 33.9 °C / 93 F.
(±) En jouant à The Witcher 3, la température moyenne du côté supérieur est de 36.1 °C / 97 F, alors que la moyenne de l'appareil est de 33.9 °C / 93 F.
(+) Les repose-poignets et le pavé tactile sont plus froids que la température de la peau avec un maximum de 28 °C / 82.4 F et sont donc froids au toucher.
(±) La température moyenne de la zone de l'appui-paume de dispositifs similaires était de 28.8 °C / 83.8 F (+0.8 °C / #1.4 F).
| Lenovo Legion Pro 5 16IRX9 Intel Core i9-14900HX, NVIDIA GeForce RTX 4070 Laptop GPU | Lenovo Legion Pro 5 16IRX8 Intel Core i7-13700HX, NVIDIA GeForce RTX 4060 Laptop GPU | Alienware m16 R2 Intel Core Ultra 7 155H, NVIDIA GeForce RTX 4070 Laptop GPU | HP Omen Transcend 16-u1095ng Intel Core i9-14900HX, NVIDIA GeForce RTX 4070 Laptop GPU | Asus ROG Zephyrus G16 2024 GU605M Intel Core Ultra 7 155H, NVIDIA GeForce RTX 4070 Laptop GPU | MSI Stealth 16 Mercedes-AMG Motorsport A13VG Intel Core i9-13900H, NVIDIA GeForce RTX 4070 Laptop GPU | |
|---|---|---|---|---|---|---|
| Heat | 7% | -5% | 1% | 7% | 1% | |
| Maximum Upper Side * (°C) | 43.8 | 42.8 2% | 44.8 -2% | 49 -12% | 50.3 -15% | 49 -12% |
| Maximum Bottom * (°C) | 55.4 | 50 10% | 48 13% | 63 -14% | 48 13% | 52 6% |
| Idle Upper Side * (°C) | 32.8 | 29.6 10% | 37.2 -13% | 30 9% | 28.8 12% | 32 2% |
| Idle Bottom * (°C) | 36 | 34 6% | 42 -17% | 29 19% | 29.8 17% | 34 6% |
* ... Moindre est la valeur, meilleures sont les performances
Intervenants
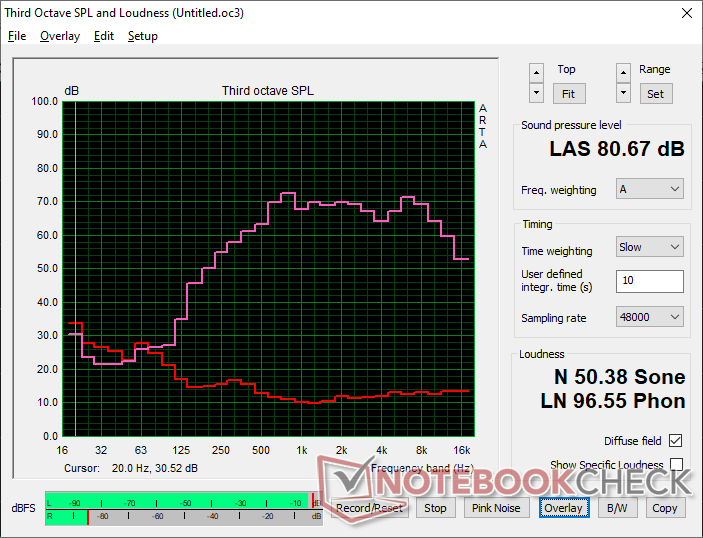
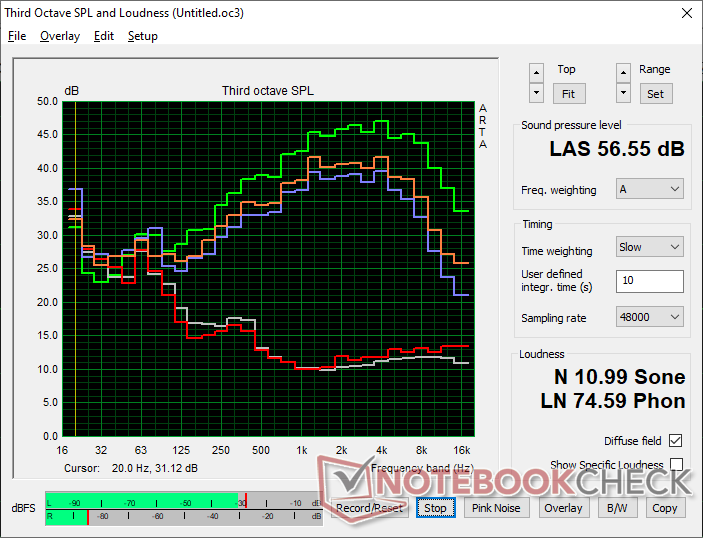
Lenovo Legion Pro 5 16IRX9 analyse audio
(±) | le niveau sonore du haut-parleur est moyen mais bon (80.7# dB)
Basses 100 - 315 Hz
(-) | presque aucune basse - en moyenne 19% plus bas que la médiane
(±) | la linéarité des basses est moyenne (10.1% delta à la fréquence précédente)
Médiums 400 - 2000 Hz
(+) | médiane équilibrée - seulement 4.7% de la médiane
(+) | les médiums sont linéaires (5.7% delta à la fréquence précédente)
Aiguës 2 - 16 kHz
(+) | des sommets équilibrés - à seulement 3.3% de la médiane
(+) | les aigus sont linéaires (5.6% delta à la fréquence précédente)
Globalement 100 - 16 000 Hz
(±) | la linéarité du son global est moyenne (17.2% de différence avec la médiane)
Par rapport à la même classe
» 47% de tous les appareils testés de cette catégorie étaient meilleurs, 11% similaires, 42% pires
» Le meilleur avait un delta de 6%, la moyenne était de 18%, le pire était de 132%.
Par rapport à tous les appareils testés
» 32% de tous les appareils testés étaient meilleurs, 8% similaires, 60% pires
» Le meilleur avait un delta de 4%, la moyenne était de 23%, le pire était de 134%.
Apple MacBook Pro 16 2021 M1 Pro analyse audio
(+) | les haut-parleurs peuvent jouer relativement fort (84.7# dB)
Basses 100 - 315 Hz
(+) | bonne basse - seulement 3.8% loin de la médiane
(+) | les basses sont linéaires (5.2% delta à la fréquence précédente)
Médiums 400 - 2000 Hz
(+) | médiane équilibrée - seulement 1.3% de la médiane
(+) | les médiums sont linéaires (2.1% delta à la fréquence précédente)
Aiguës 2 - 16 kHz
(+) | des sommets équilibrés - à seulement 1.9% de la médiane
(+) | les aigus sont linéaires (2.7% delta à la fréquence précédente)
Globalement 100 - 16 000 Hz
(+) | le son global est linéaire (4.6% différence à la médiane)
Par rapport à la même classe
» 0% de tous les appareils testés de cette catégorie étaient meilleurs, 0% similaires, 100% pires
» Le meilleur avait un delta de 5%, la moyenne était de 17%, le pire était de 45%.
Par rapport à tous les appareils testés
» 0% de tous les appareils testés étaient meilleurs, 0% similaires, 100% pires
» Le meilleur avait un delta de 4%, la moyenne était de 23%, le pire était de 134%.
Gestion de l'énergie
Consommation électrique
L'exécution de Witcher 3 devrait tourner autour de 220 W, ce qui est plus exigeant que ce que nous avons enregistré sur le modèle de l'année dernière. C'est aussi nettement plus élevé que le HP Omen Transcend 16 qui est livré avec le même CPU et GPU que notre Lenovo. Cette différence peut être attribuée en grande partie au processeur Core i9 du Lenovo, qui maintient un niveau d'énergie plus élevé lorsque le système est réglé en mode Performance.
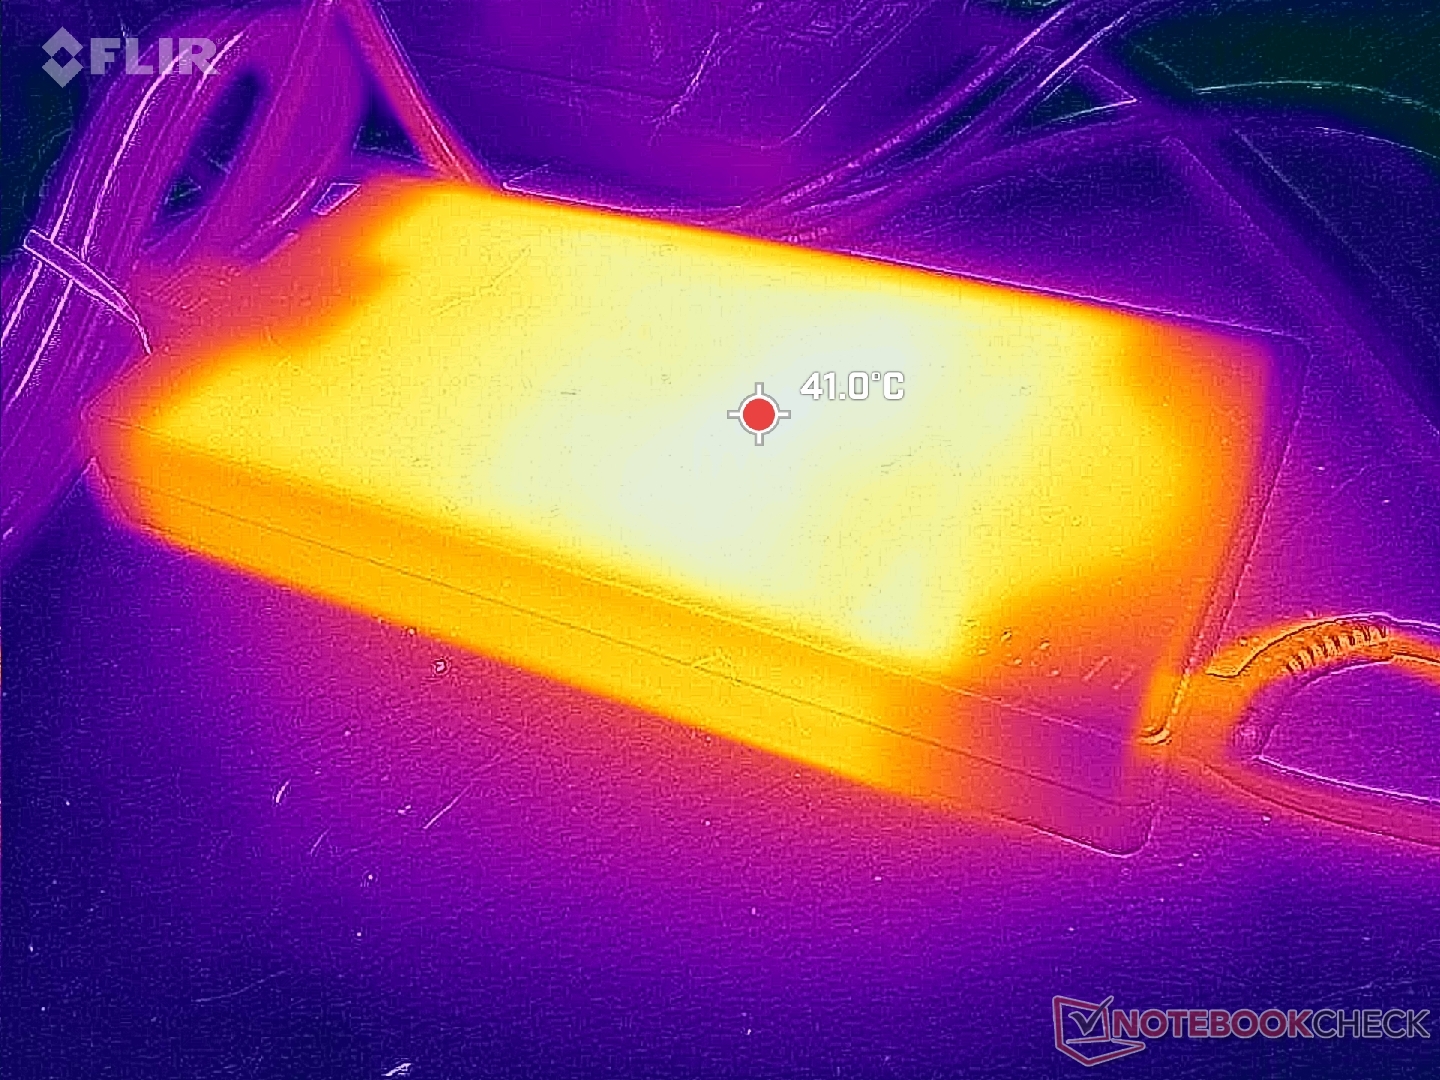
Nous avons enregistré une consommation maximale temporaire d'environ 274 W lorsque le CPU et le GPU sont tous deux utilisés à 100 %. Le grand adaptateur secteur (~19,9 x 9,9 x 2,6 cm) 300 W AC adapter est le même que celui livré avec les modèles Legion 5 15, Legion 5 17 et Legion 7 16.
(Note de l'éditeur: cette section sera mise à jour lorsque les réparations de notre multimètre Metrahit Energy seront terminées. Nous vous prions de nous excuser pour la gêne occasionnée)
| Éteint/en veille | |
| Au repos | |
| Fortement sollicité |
|
Légende:
min: | |
| Lenovo Legion Pro 5 16IRX9 i9-14900HX, GeForce RTX 4070 Laptop GPU, Samsung PM9A1 MZVL21T0HCLR, IPS, 2560x1600, 16" | Lenovo Legion Pro 5 16IRX8 i7-13700HX, GeForce RTX 4060 Laptop GPU, SK hynix PC801 HFS512GEJ9X115N, IPS, 2560x1600, 16" | Alienware m16 R2 Ultra 7 155H, GeForce RTX 4070 Laptop GPU, Samsung PM9A1 MZVL21T0HCLR, IPS, 2560x1600, 16" | HP Omen Transcend 16-u1095ng i9-14900HX, GeForce RTX 4070 Laptop GPU, Kioxia XG8 KXG80ZNV1T02, OLED, 2560x1600, 16" | Asus ROG Zephyrus G16 2024 GU605M Ultra 7 155H, GeForce RTX 4070 Laptop GPU, WD PC SN560 SDDPNQE-1T00, OLED, 2560x1600, 16" | MSI Stealth 16 Mercedes-AMG Motorsport A13VG i9-13900H, GeForce RTX 4070 Laptop GPU, Samsung PM9A1 MZVL22T0HBLB, OLED, 3840x2400, 16" | |
|---|---|---|---|---|---|---|
| Power Consumption | -19% | 12% | 8% | 42% | 22% | |
| Idle Minimum * (Watt) | 12.5 | 24.5 -96% | 8.1 35% | 10 20% | 8.3 34% | 11 12% |
| Idle Average * (Watt) | 24.6 | 29.2 -19% | 13 47% | 18 27% | 12.5 49% | 14 43% |
| Idle Maximum * (Watt) | 24.8 | 34.3 -38% | 40.3 -62% | 32 -29% | 12.8 48% | 28 -13% |
| Load Average * (Watt) | 109.6 | 98.7 10% | 79 28% | 128 -17% | 71.3 35% | 83 24% |
| Witcher 3 ultra * (Watt) | 218 | 178.6 18% | 188.1 14% | 148.4 32% | 127.5 42% | 140 36% |
| Load Maximum * (Watt) | 284.9 | 249.6 12% | 254.9 11% | 242 15% | 169.1 41% | 204 28% |
* ... Moindre est la valeur, meilleures sont les performances
Power Consumption Witcher 3 / Stresstest
Power Consumption external Monitor
Autonomie de la batterie
Avec 80 Wh, la capacité de la batterie est inférieure à celle de la plupart des autres ordinateurs portables de 16 pouces, où 90 Wh ou plus sont courants. Malgré cela, l'autonomie de la batterie est supérieure à celle du Legion Pro 5 16IRX8 de l'année dernière de près de 90 minutes. Le Zephyrus G16 et l'Alienware m16 R2 peuvent chacun durer des heures de plus, mais ils sont également livrés avec des CPU Core Ultra 7 plus lents.
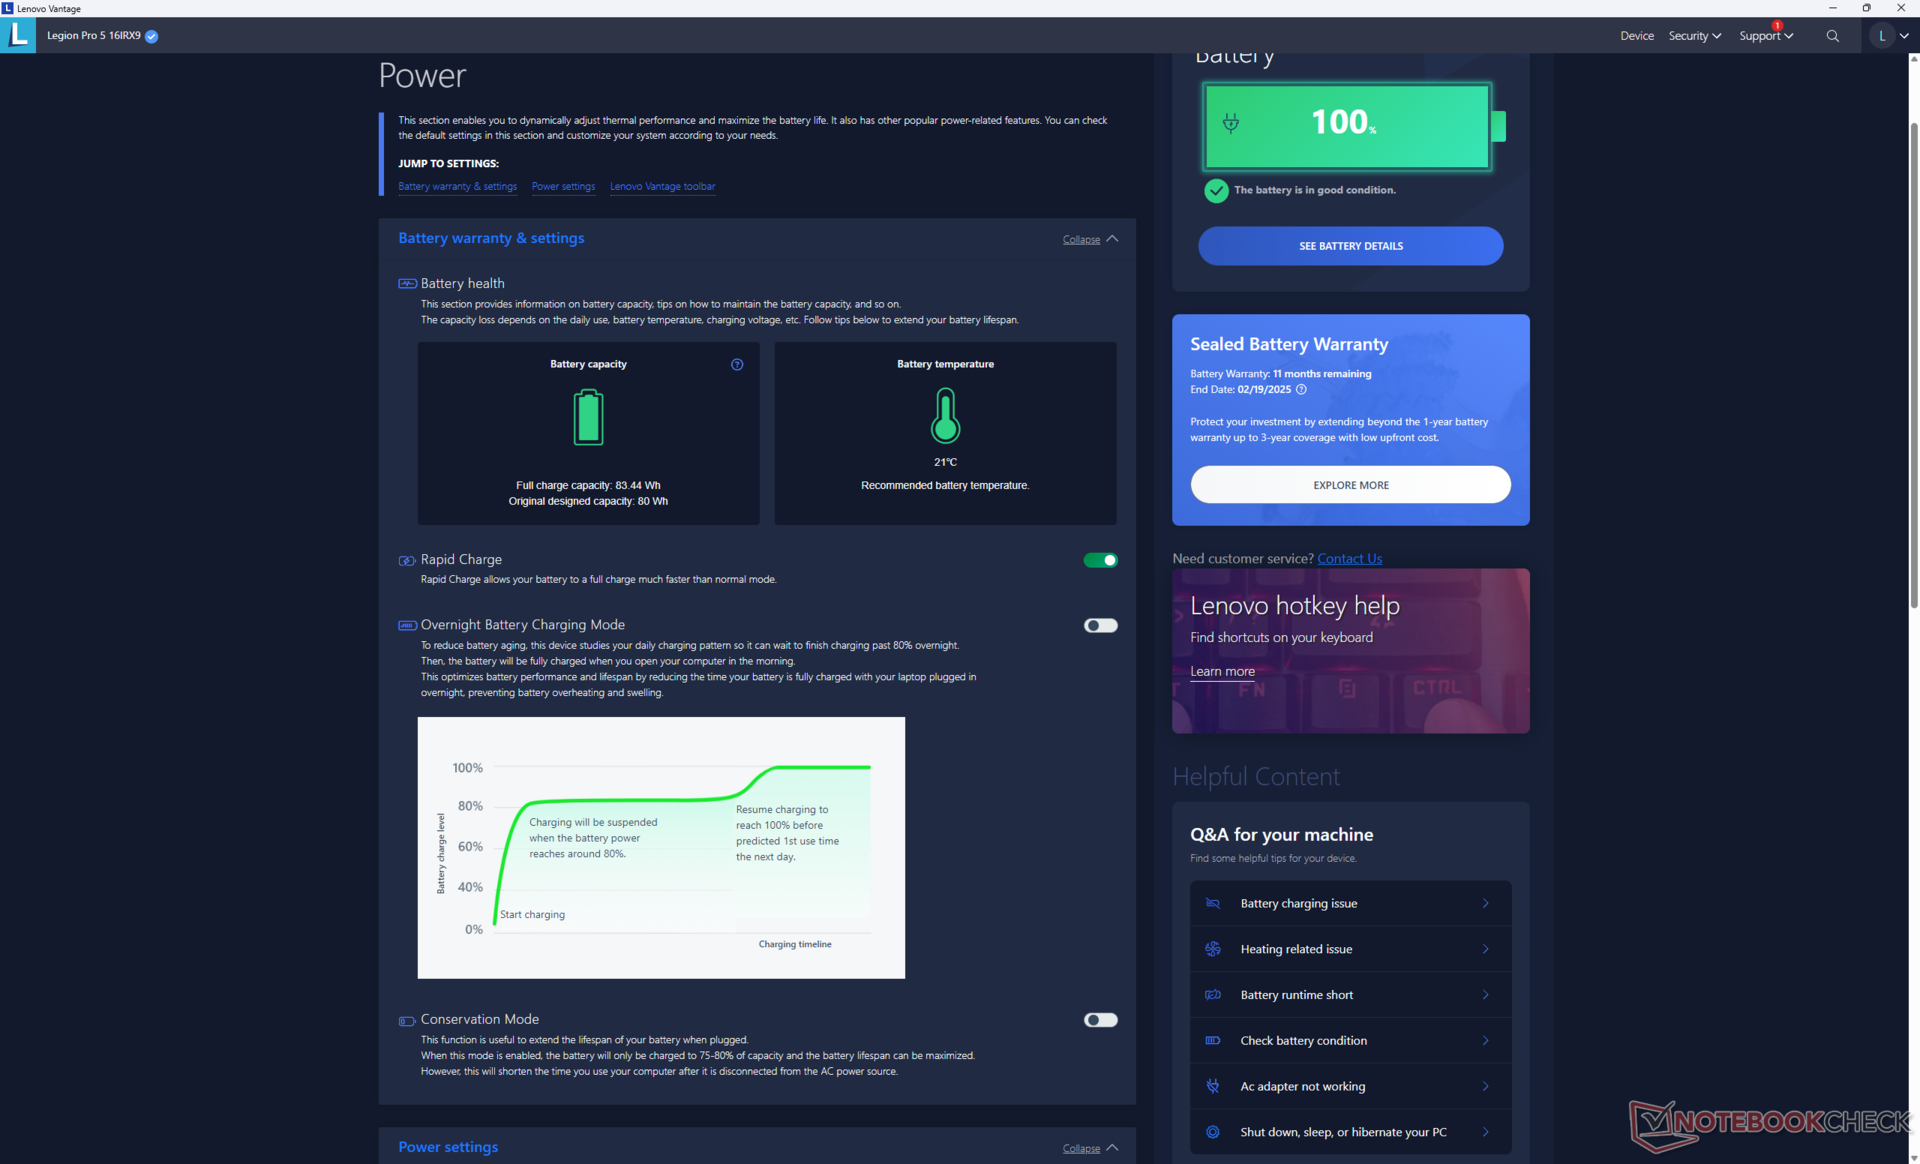
La charge de la batterie vide à la batterie pleine est très rapide : un peu moins d'une heure, contre 1,5 à 2 heures pour la plupart des autres ordinateurs portables. La fonction Lenovo Rapid Charge est activée par défaut. Le système peut également être chargé avec des adaptateurs USB-C tiers via le port USB-C arrière.
| Lenovo Legion Pro 5 16IRX9 i9-14900HX, GeForce RTX 4070 Laptop GPU, 80 Wh | Lenovo Legion Pro 5 16IRX8 i7-13700HX, GeForce RTX 4060 Laptop GPU, 80 Wh | Alienware m16 R2 Ultra 7 155H, GeForce RTX 4070 Laptop GPU, 90 Wh | HP Omen Transcend 16-u1095ng i9-14900HX, GeForce RTX 4070 Laptop GPU, 97 Wh | Asus ROG Zephyrus G16 2024 GU605M Ultra 7 155H, GeForce RTX 4070 Laptop GPU, 90 Wh | MSI Stealth 16 Mercedes-AMG Motorsport A13VG i9-13900H, GeForce RTX 4070 Laptop GPU, 99.99 Wh | |
|---|---|---|---|---|---|---|
| Autonomie de la batterie | -22% | 49% | 2% | 31% | 35% | |
| Reader / Idle (h) | 6.7 | 6.7 0% | 12.6 88% | |||
| WiFi v1.3 (h) | 4.8 | 3.4 -29% | 8.1 69% | 4.9 2% | 7.3 52% | 6.5 35% |
| Load (h) | 1.1 | 0.7 -36% | 1 -9% | 1.2 9% | ||
| H.264 (h) | 11.2 |
Points positifs
Points négatifs
Verdict - Des changements simples pour une expérience similaire à celle d'avant
Tout comme le récent Alienware m18 R2le Lenovo Legion Pro 5 16 G9 n'offre pas suffisamment d'avantages par rapport à son prédécesseur pour mériter une mise à niveau. Il est tout aussi bon qu'avant, mais il ne fait pas beaucoup bouger l'aiguille car il est bloqué sur les mêmes options de GPU avec des CPU Raptor Lake-HX rebaptisés. En d'autres termes, le 2024 Legion Pro 5 16 a des performances presque identiques à celles de la version 2023, moins chère, en ce qui concerne les jeux. Il serait judicieux de rechercher des offres sur les SKU 2023 avant d'envisager les nouvelles options 2024.
Il y a quelques ajouts mineurs, le plus notable étant une nouvelle option de panneau DCI-P3 alors que le modèle de l'année dernière était limité aux couleurs sRGB. Cependant, les inconvénients innés tels que la grande taille, l'adaptateur secteur volumineux et les ventilateurs bruyants demeurent.
À moins que vous ne souhaitiez vraiment des couleurs DCI-P3, le Lenovo Legion Pro 5 16IRX9 2024 est presque identique au modèle 2023, désormais moins cher, en termes de performances, d'options et de caractéristiques physiques.
Le Legion Pro 5 16 peut être intéressant pour ceux qui préfèrent les processeurs de la série Core HX aux options Core Ultra plus lentes. Sinon, des alternatives plus petites ou plus portables comme le Asus ROG Zephyrus G16 ou Alienware m16 R2 ont des performances de processeur plus lentes mais avec presque les mêmes performances de jeu.
Prix et disponibilité
Lenovo livre maintenant le Legion 5 Pro 16 à partir de 1770 $ pour la configuration Core i7-14650HX et RTX 4060 jusqu'à 2000 $ pour notre configuration Core i9-14900HX et RTX 4070.
Lenovo Legion Pro 5 16IRX9
- 03/28/2024 v7 (old)
Allen Ngo
Transparency
La sélection des appareils à examiner est effectuée par notre équipe éditoriale. L'échantillon de test a été prêté à l'auteur par le fabricant ou le détaillant pour les besoins de cet examen. Le prêteur n'a pas eu d'influence sur cette évaluation et le fabricant n'a pas reçu de copie de cette évaluation avant sa publication. Il n'y avait aucune obligation de publier cet article. En tant que média indépendant, Notebookcheck n'est pas soumis à l'autorité des fabricants, des détaillants ou des éditeurs.
Voici comment Notebookcheck teste
Chaque année, Notebookcheck examine de manière indépendante des centaines d'ordinateurs portables et de smartphones en utilisant des procédures standardisées afin de garantir que tous les résultats sont comparables. Nous avons continuellement développé nos méthodes de test depuis environ 20 ans et avons établi des normes industrielles dans le processus. Dans nos laboratoires de test, des équipements de mesure de haute qualité sont utilisés par des techniciens et des rédacteurs expérimentés. Ces tests impliquent un processus de validation en plusieurs étapes. Notre système d'évaluation complexe repose sur des centaines de mesures et de points de référence bien fondés, ce qui garantit l'objectivité.Price comparison

