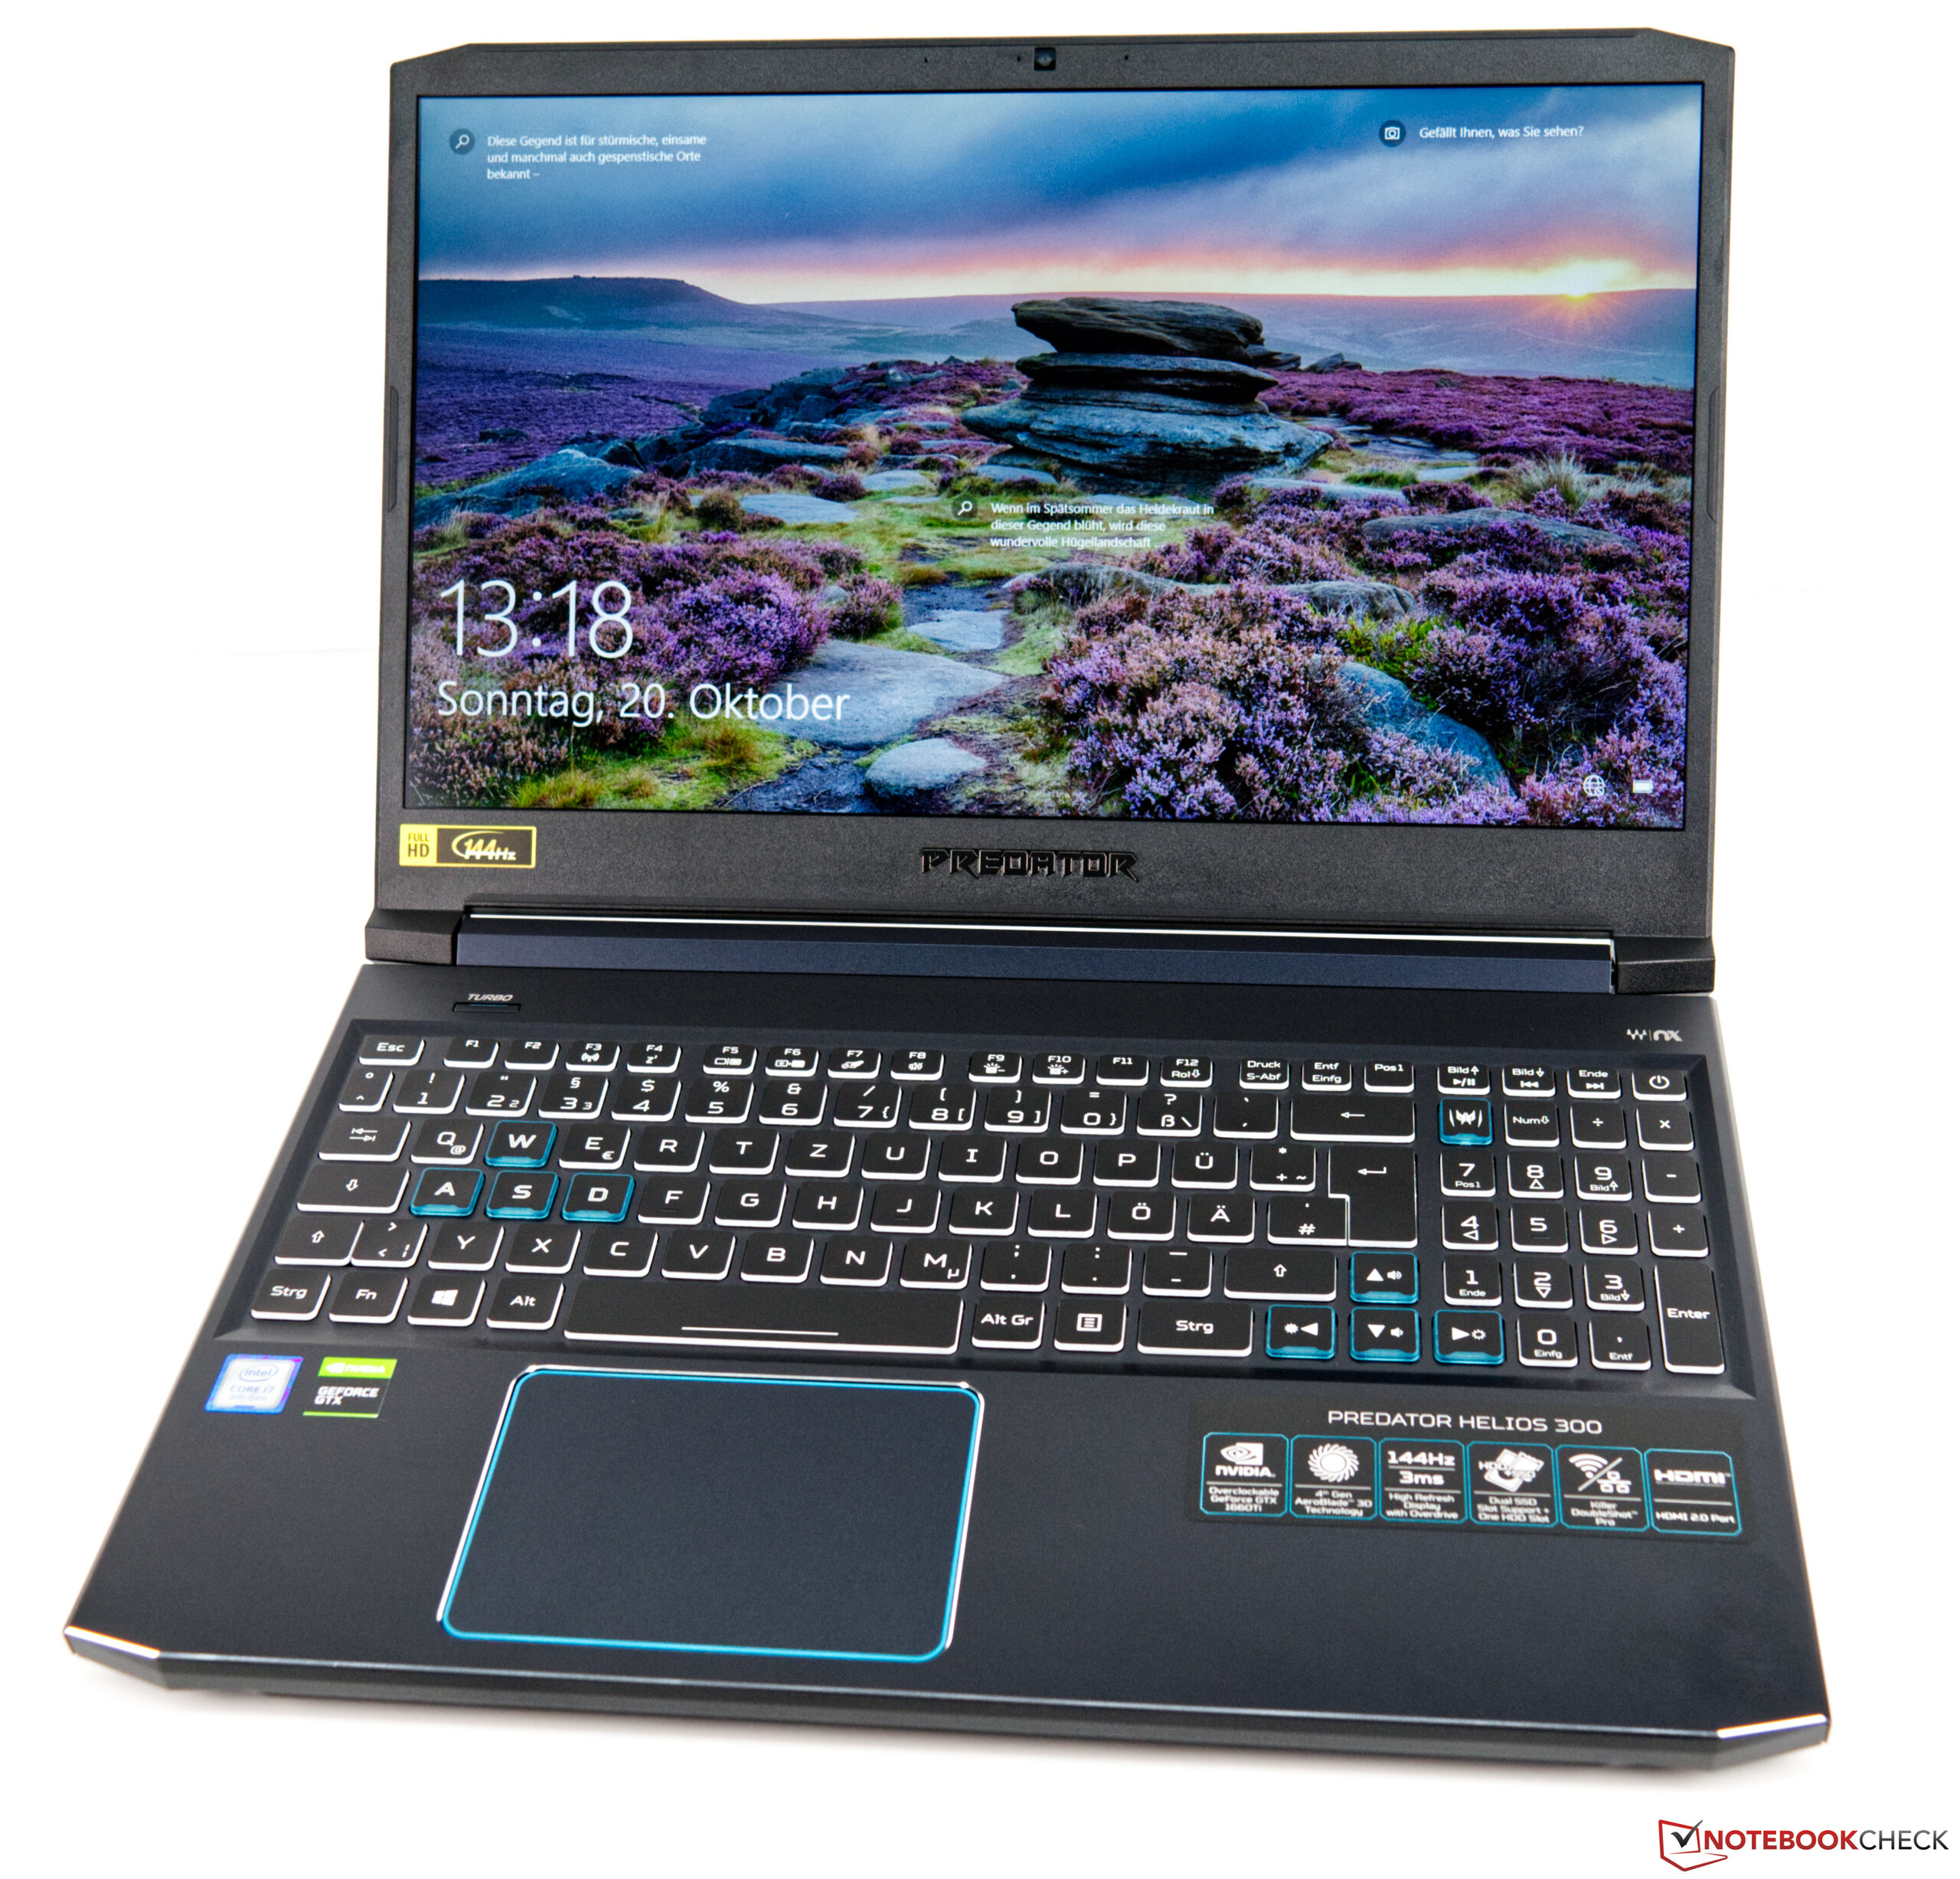
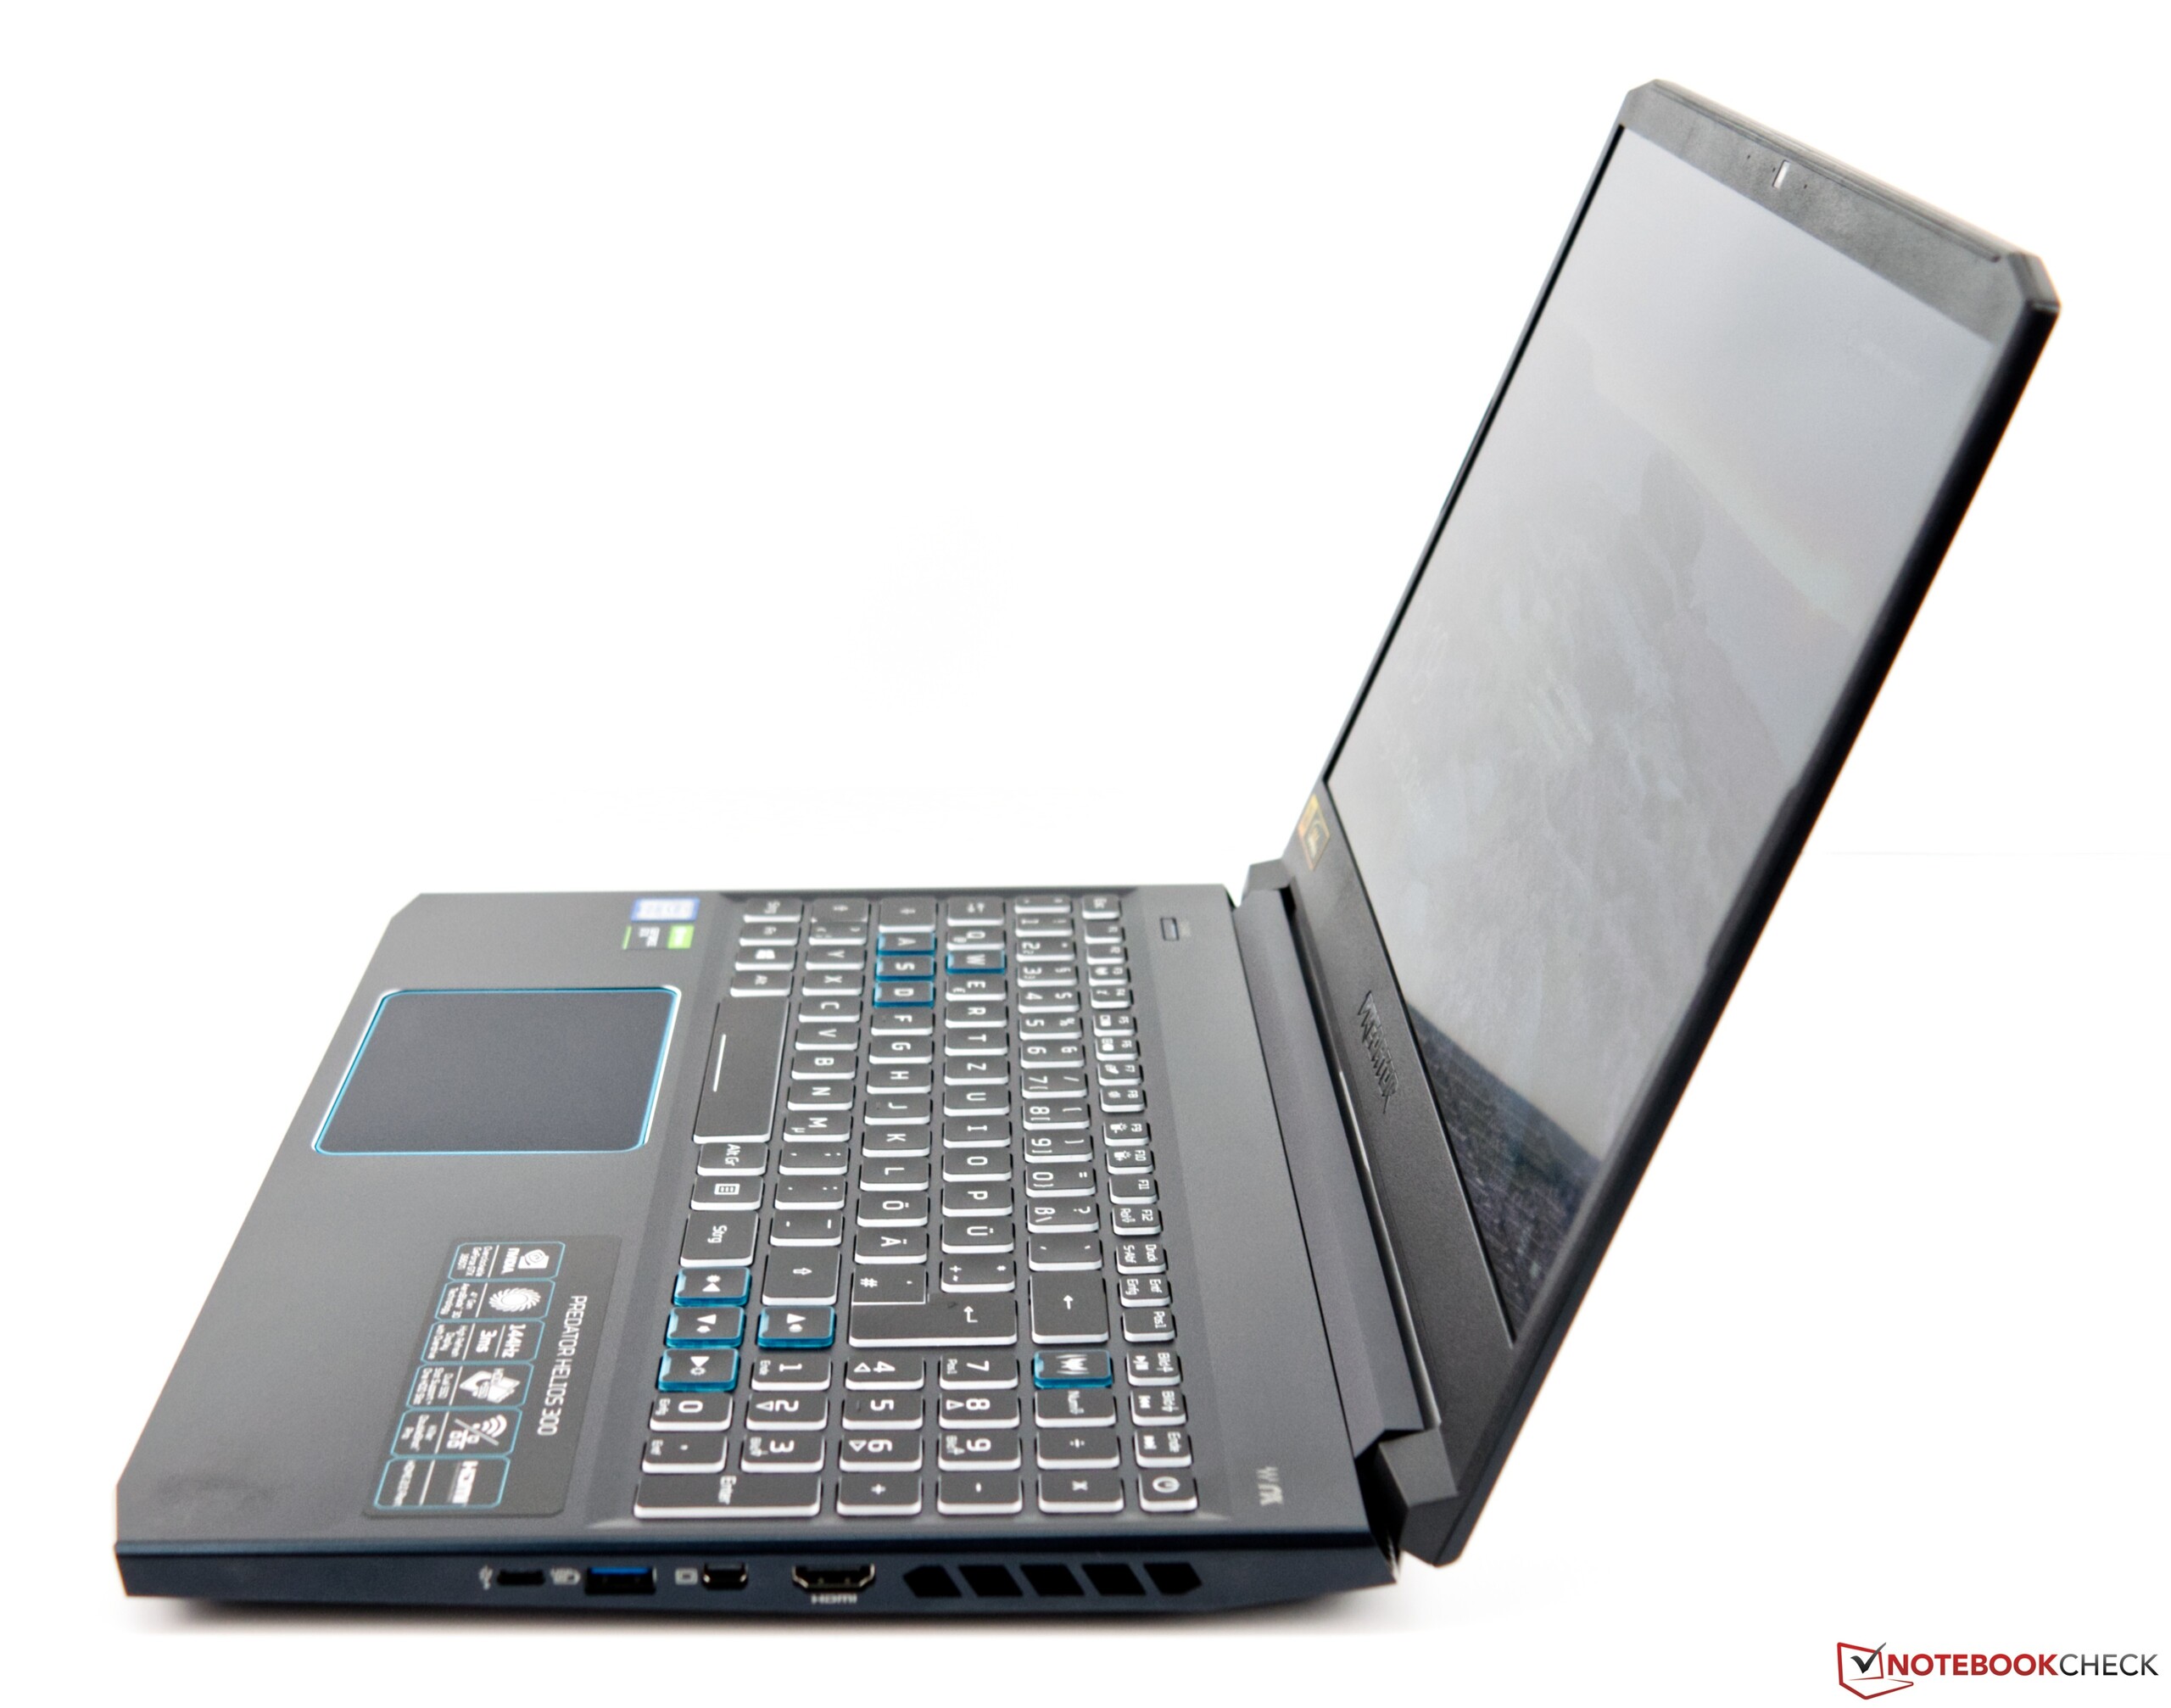
Test de l'Acer Predator Helios 300 (i7-9750H, GTX 1660 Ti, FHD) : portable de jeu moderne avec carte graphique Turing
Note | Date | Modèle | Poids | Épaisseur | Taille | Résolution | Prix |
|---|---|---|---|---|---|---|---|
| 82.1 % v7 (old) | 11/19 | Acer Predator Helios 300 PH315-52-79TY i7-9750H, GeForce GTX 1660 Ti Mobile | 2.3 kg | 23.2 mm | 15.60" | 1920x1080 | |
| 83.9 % v7 (old) | 08/19 | HP Gaming Pavilion 15-dk0009ng i7-9750H, GeForce GTX 1660 Ti Max-Q | 2.4 kg | 23.4 mm | 15.60" | 1920x1080 | |
| 82.3 % v7 (old) | 08/19 | Lenovo Legion Y540-15IRH-81SX00B2GE i7-9750H, GeForce GTX 1660 Ti Mobile | 2.2 kg | 26 mm | 15.60" | 1920x1080 | |
| 83 % v7 (old) | 05/19 | Dell G5 15 5590 i7-8750H, GeForce RTX 2060 Mobile | 2.7 kg | 23.7 mm | 15.60" | 1920x1080 | |
| 84.8 % v7 (old) | 10/19 | Lenovo Legion Y740-15ICHg i7-9750H, GeForce RTX 2070 Max-Q | 2.3 kg | 25 mm | 15.60" | 1920x1080 | |
| 82 % v6 (old) | 06/18 | Acer Predator Helios 300 PH317-52-51M6 i5-8300H, GeForce GTX 1050 Ti Mobile | 2.9 kg | 29 mm | 17.30" | 1920x1080 |
| |||||||||||||||||||||||||
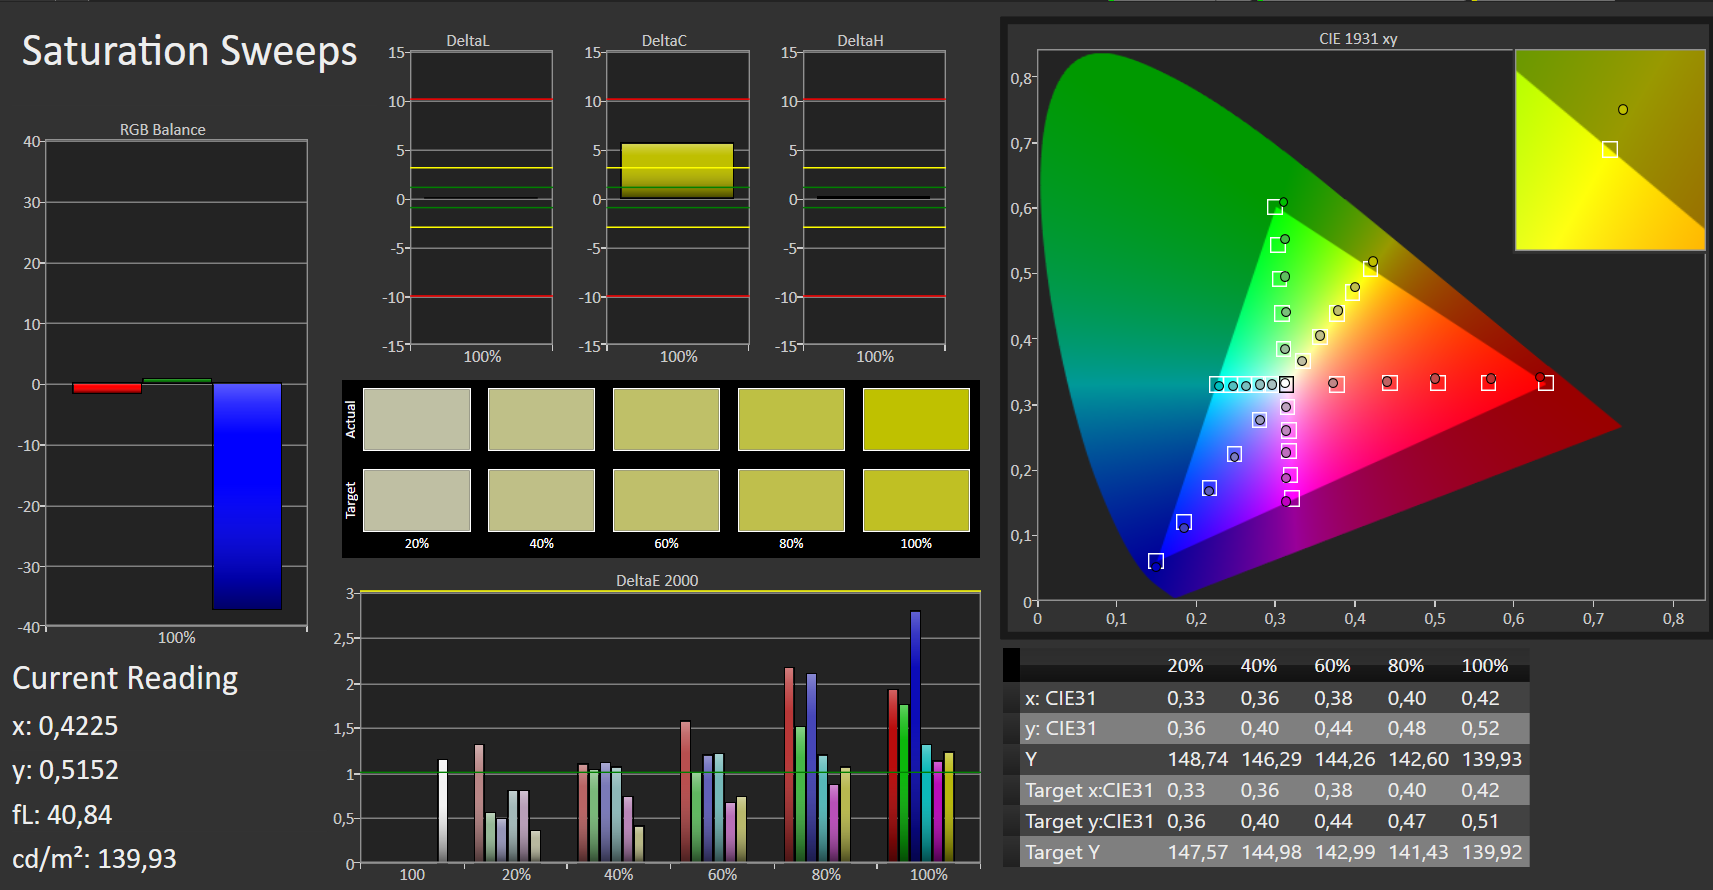
Homogénéité de la luminosité: 82 %
Valeur mesurée au centre, sur batterie: 326 cd/m²
Contraste: 1275:1 (Valeurs des noirs: 0.255 cd/m²)
ΔE ColorChecker Calman: 4.28 | ∀{0.5-29.43 Ø4.73}
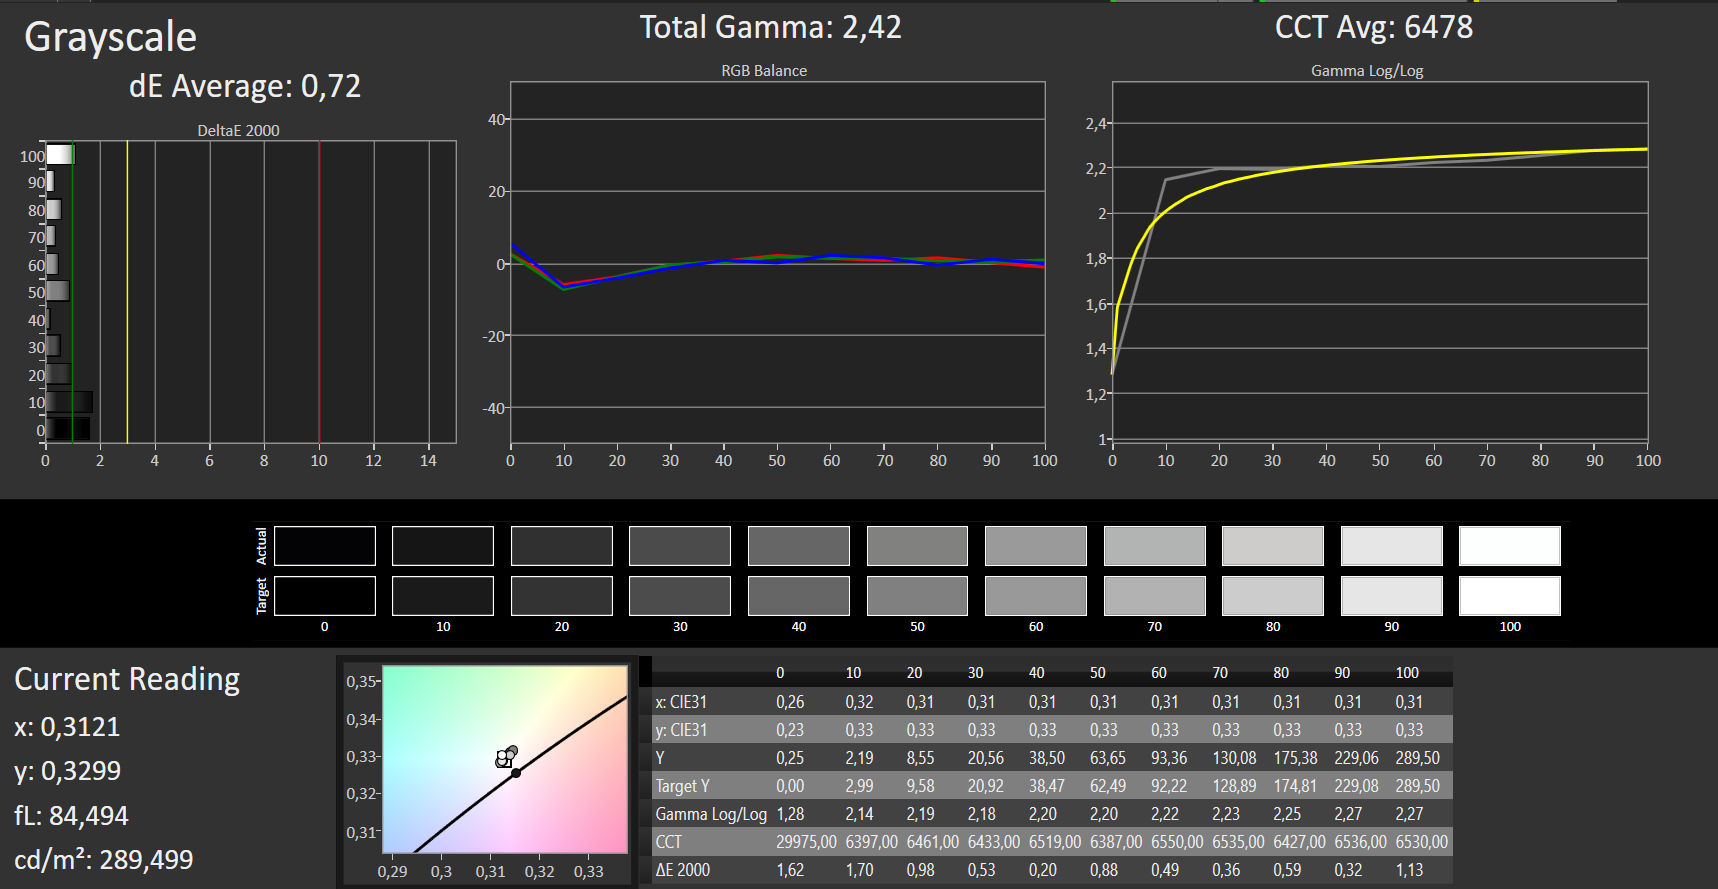
calibrated: 1.45
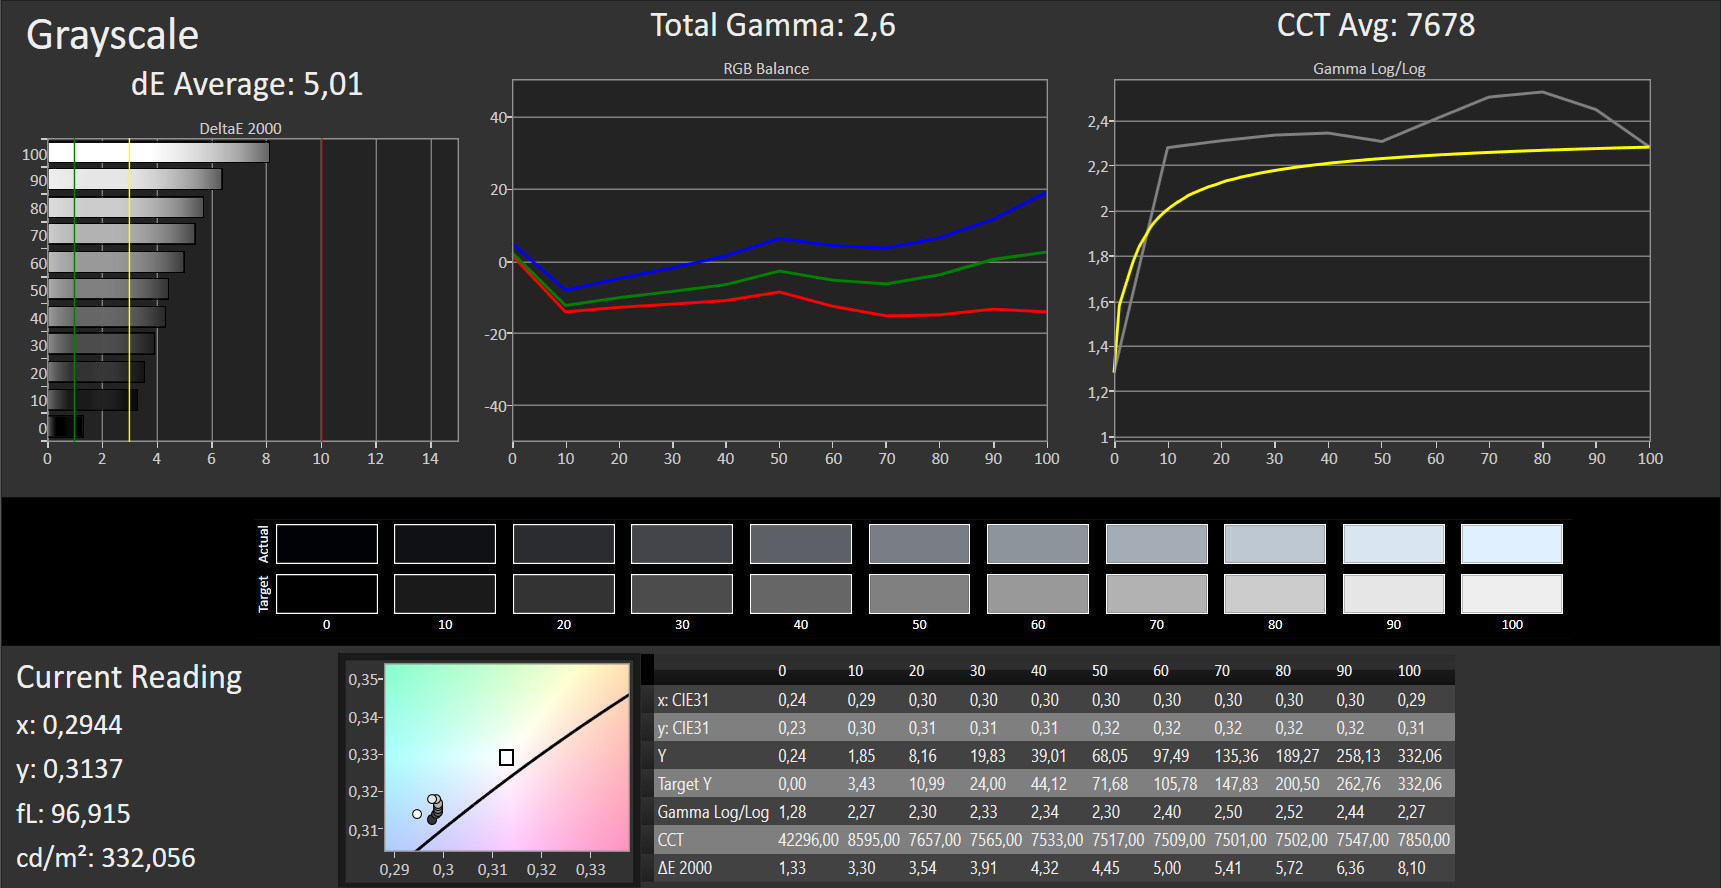
ΔE Greyscale Calman: 5.01 | ∀{0.09-98 Ø4.97}
93% sRGB (Argyll 1.6.3 3D)
60% AdobeRGB 1998 (Argyll 1.6.3 3D)
65.7% AdobeRGB 1998 (Argyll 3D)
93% sRGB (Argyll 3D)
64.1% Display P3 (Argyll 3D)
Gamma: 2.6
CCT: 7678 K
| Acer Predator Helios 300 PH315-52-79TY AUO, B156HAN08.2, IPS, 1920x1080, 15.6" | HP Gaming Pavilion 15-dk0009ng LG Philips LGD05FE, IPS, 1920x1080, 15.6" | Lenovo Legion Y540-15IRH-81SX00B2GE BOE 084D, IPS, 1920x1080, 15.6" | Dell G5 15 5590 AU Optronics B156HAN, IPS, 1920x1080, 15.6" | Lenovo Legion Y740-15ICHg BOE NV156FHM-N4J, IPS, 1920x1080, 15.6" | Acer Predator Helios 300 PH317-52-51M6 LG Philips LP173WF4-SPF5 (LGD056D), IPS, 1920x1080, 17.3" | |
|---|---|---|---|---|---|---|
| Display | 1% | -1% | -38% | 2% | -2% | |
| Display P3 Coverage (%) | 64.1 | 64.2 0% | 63.6 -1% | 39.26 -39% | 67.7 6% | 67.1 5% |
| sRGB Coverage (%) | 93 | 95.1 2% | 91.7 -1% | 59.1 -36% | 91.6 -2% | 86.1 -7% |
| AdobeRGB 1998 Coverage (%) | 65.7 | 65.8 0% | 65.2 -1% | 40.56 -38% | 67.1 2% | 63 -4% |
| Response Times | -13% | 4% | -217% | -19% | -142% | |
| Response Time Grey 50% / Grey 80% * (ms) | 15 ? | 16.4 ? -9% | 8.8 ? 41% | 45 ? -200% | 19 ? -27% | 36 ? -140% |
| Response Time Black / White * (ms) | 9 ? | 10.4 ? -16% | 12 ? -33% | 30 ? -233% | 10 ? -11% | 22 ? -144% |
| PWM Frequency (Hz) | 122000 ? | |||||
| Screen | 14% | -3% | -50% | 19% | -25% | |
| Brightness middle (cd/m²) | 325 | 345 6% | 299 -8% | 234 -28% | 477 47% | 365 12% |
| Brightness (cd/m²) | 310 | 324 5% | 290 -6% | 219 -29% | 431 39% | 341 10% |
| Brightness Distribution (%) | 82 | 86 5% | 89 9% | 82 0% | 84 2% | 89 9% |
| Black Level * (cd/m²) | 0.255 | 0.42 -65% | 0.29 -14% | 0.17 33% | 0.175 31% | 0.32 -25% |
| Contrast (:1) | 1275 | 821 -36% | 1031 -19% | 1376 8% | 2726 114% | 1141 -11% |
| Colorchecker dE 2000 * | 4.28 | 1.3 70% | 3.7 14% | 8.6 -101% | 4.17 3% | 6.51 -52% |
| Colorchecker dE 2000 max. * | 8.42 | 2.8 67% | 7 17% | 17.49 -108% | 6.97 17% | 12.32 -46% |
| Colorchecker dE 2000 calibrated * | 1.45 | 1.1 24% | 2 -38% | 4.06 -180% | 2.51 -73% | 2.9 -100% |
| Greyscale dE 2000 * | 5.01 | 1.2 76% | 4.1 18% | 8.55 -71% | 3.49 30% | 7.65 -53% |
| Gamma | 2.6 85% | 2.31 95% | 2.19 100% | 3.02 73% | 2.5 88% | 2.64 83% |
| CCT | 7678 85% | 6476 100% | 7166 91% | 7802 83% | 7076 92% | 8066 81% |
| Color Space (Percent of AdobeRGB 1998) (%) | 60 | 60.5 1% | 59.3 -1% | 37 -38% | 60 0% | 56 -7% |
| Color Space (Percent of sRGB) (%) | 93 | 94.9 2% | 91.5 -2% | 59 -37% | 91 -2% | 86 -8% |
| Moyenne finale (programmes/paramètres) | 1% /
8% | 0% /
-2% | -102% /
-69% | 1% /
11% | -56% /
-35% |
* ... Moindre est la valeur, meilleures sont les performances


Temps de réponse de l'écran
| ↔ Temps de réponse noir à blanc | ||
|---|---|---|
| 9 ms ... hausse ↗ et chute ↘ combinées | ↗ 5 ms hausse | 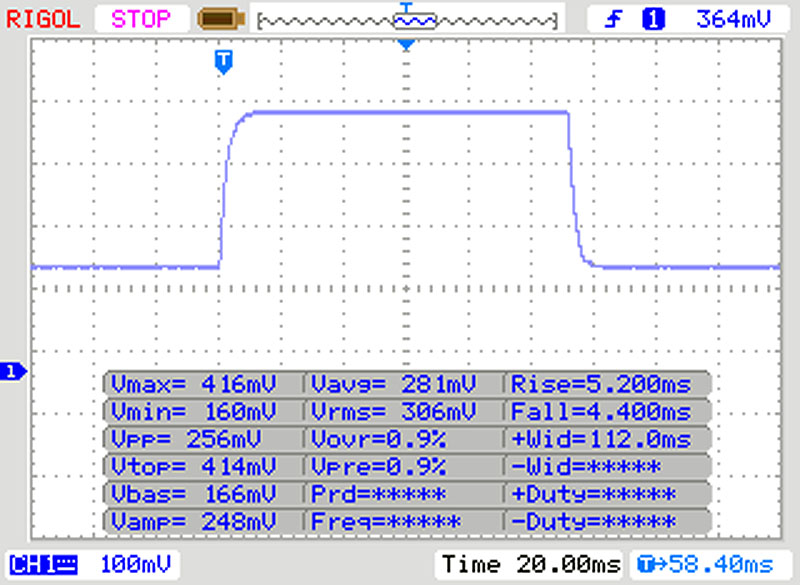 |
| ↘ 4 ms chute | ||
| L'écran montre de faibles temps de réponse, un bon écran pour jouer. En comparaison, tous les appareils testés affichent entre 0.1 (minimum) et 240 (maximum) ms. » 25 % des appareils testés affichent de meilleures performances. Cela signifie que les latences relevées sont meilleures que la moyenne (19.9 ms) de tous les appareils testés. | ||
| ↔ Temps de réponse gris 50% à gris 80% | ||
| 15 ms ... hausse ↗ et chute ↘ combinées | ↗ 8 ms hausse | 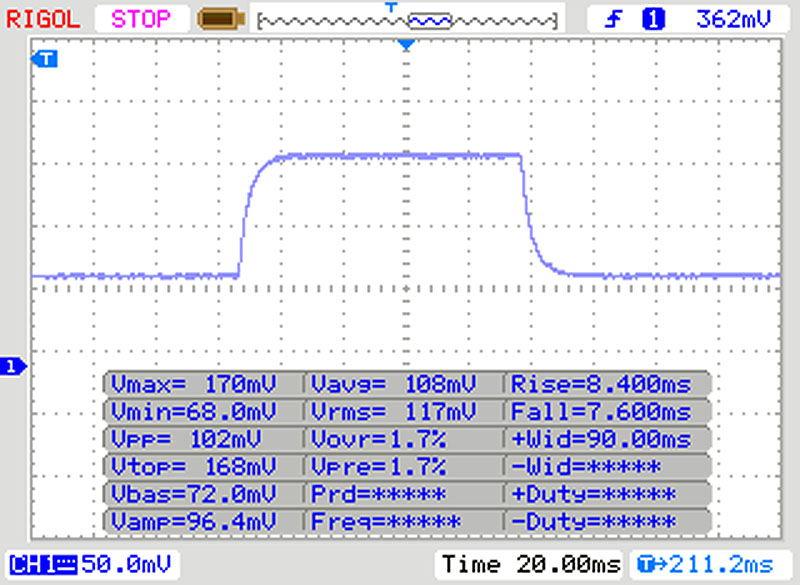 |
| ↘ 7 ms chute | ||
| L'écran montre de bons temps de réponse, mais insuffisant pour du jeu compétitif. En comparaison, tous les appareils testés affichent entre 0.165 (minimum) et 636 (maximum) ms. » 29 % des appareils testés affichent de meilleures performances. Cela signifie que les latences relevées sont meilleures que la moyenne (31.1 ms) de tous les appareils testés. | ||
Scintillement / MLI (Modulation de largeur d'impulsion)
| Scintillement / MLI (Modulation de largeur d'impulsion) non décelé | 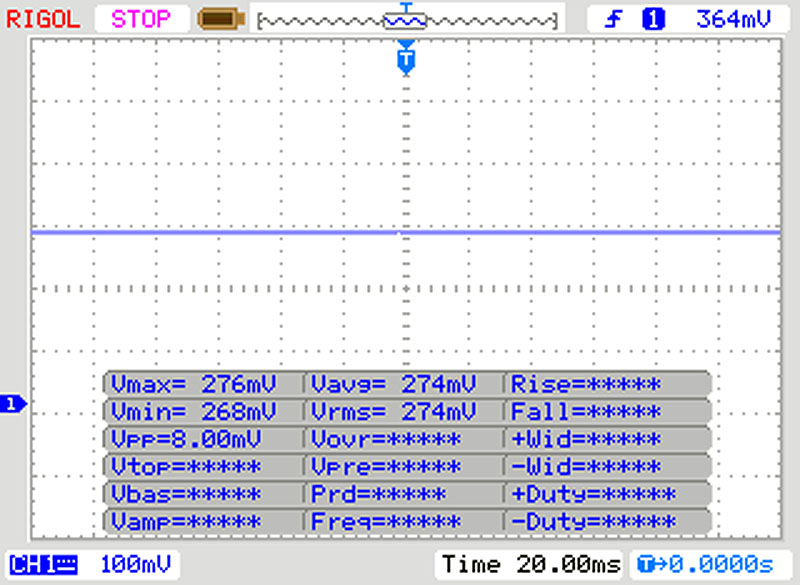 | ||
En comparaison, 52 % des appareils testés n'emploient pas MDI pour assombrir leur écran. Nous avons relevé une moyenne à 7798 (minimum : 5 - maximum : 343500) Hz dans le cas où une MDI était active. | |||
| Blender - v2.79 BMW27 CPU | |
| Acer Predator Helios 300 PH315-52-79TY | |
| Moyenne Intel Core i7-9750H (342 - 495, n=21) | |
| Lenovo Legion Y540-15IRH-81SX00B2GE | |
| Lenovo Legion Y740-15ICHg | |
* ... Moindre est la valeur, meilleures sont les performances
| PCMark 8 Home Score Accelerated v2 | 4688 points | |
| PCMark 8 Creative Score Accelerated v2 | 7682 points | |
| PCMark 8 Work Score Accelerated v2 | 5483 points | |
| PCMark 10 Score | 5279 points | |
Aide | ||
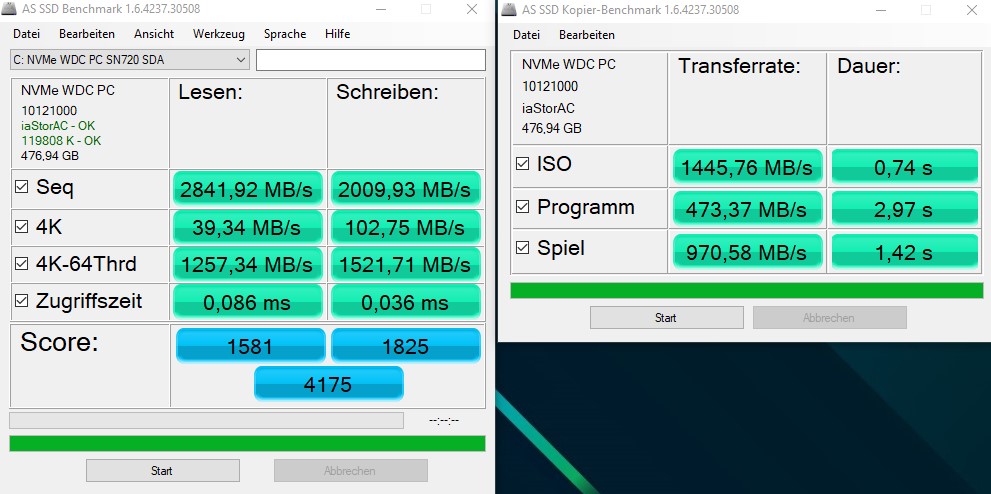
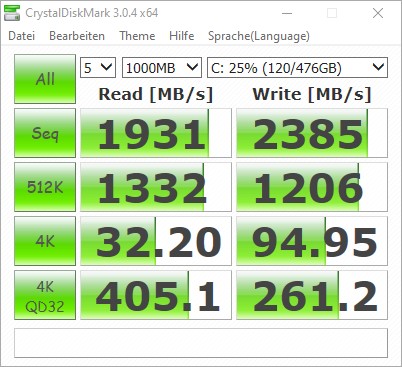
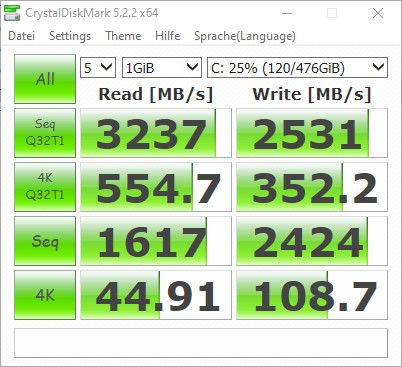
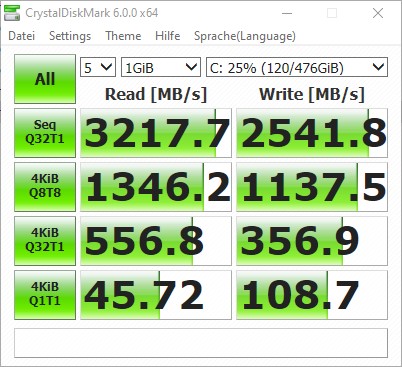
| Acer Predator Helios 300 PH315-52-79TY WDC PC SN720 SDAPNTW-512G | HP Gaming Pavilion 15-dk0009ng Samsung SSD PM981 MZVLB256HAHQ | Lenovo Legion Y540-15IRH-81SX00B2GE WDC PC SN720 SDAPNTW-512G | Dell G5 15 5590 KBG30ZMS128G | Lenovo Legion Y740-15ICHg WDC PC SN520 SDAPMUW-128G | Acer Predator Helios 300 PH317-52-51M6 Hynix HFS128G39TND | Moyenne WDC PC SN720 SDAPNTW-512G | |
|---|---|---|---|---|---|---|---|
| CrystalDiskMark 5.2 / 6 | -23% | 0% | -65% | -45% | -70% | -14% | |
| Write 4K (MB/s) | 108.7 | 100 -8% | 158.8 46% | 64.3 -41% | 134.2 23% | 61.9 -43% | 110 ? 1% |
| Read 4K (MB/s) | 44.91 | 31.39 -30% | 29.11 -35% | 29.3 -35% | 37.72 -16% | 22.78 -49% | 36.9 ? -18% |
| Write Seq (MB/s) | 2424 | 1308 -46% | 1584 -35% | 131.1 -95% | 389.2 -84% | 136.1 -94% | 1976 ? -18% |
| Read Seq (MB/s) | 1617 | 1083 -33% | 1694 5% | 776 -52% | 1030 -36% | 490.1 -70% | 1710 ? 6% |
| Write 4K Q32T1 (MB/s) | 356.9 | 362.9 2% | 536 50% | 96.8 -73% | 238.9 -33% | 136.2 -62% | 339 ? -5% |
| Read 4K Q32T1 (MB/s) | 557 | 425.7 -24% | 363.9 -35% | 198.6 -64% | 343.9 -38% | 208.4 -63% | 417 ? -25% |
| Write Seq Q32T1 (MB/s) | 2542 | 1411 -44% | 2536 0% | 127.8 -95% | 789 -69% | 136 -95% | 2218 ? -13% |
| Read Seq Q32T1 (MB/s) | 3218 | 3240 1% | 3458 7% | 1044 -68% | 1502 -53% | 553 -83% | 2940 ? -9% |
| Write 4K Q8T8 (MB/s) | 1138 | 293.4 -74% | 721 ? -37% | ||||
| Read 4K Q8T8 (MB/s) | 1346 | 405.8 -70% | 993 ? -26% | ||||
| AS SSD | -33% | 10% | -227% | -46% | -128% | -9% | |
| Seq Read (MB/s) | 2841 | 2088 -27% | 2927 3% | 1036 -64% | 1372 -52% | 513 -82% | 2544 ? -10% |
| Seq Write (MB/s) | 2009 | 1347 -33% | 2149 7% | 115.1 -94% | 746 -63% | 128.2 -94% | 2034 ? 1% |
| 4K Read (MB/s) | 39.34 | 36.14 -8% | 42.43 8% | 29.6 -25% | 35.42 -10% | 26.5 -33% | 36.5 ? -7% |
| 4K Write (MB/s) | 102.8 | 96.5 -6% | 147.1 43% | 67.8 -34% | 99.9 -3% | 62.7 -39% | 110.8 ? 8% |
| 4K-64 Read (MB/s) | 1257 | 565 -55% | 1286 2% | 184.5 -85% | 302.1 -76% | 336.6 -73% | 1112 ? -12% |
| 4K-64 Write (MB/s) | 1522 | 588 -61% | 1432 -6% | 95.2 -94% | 191.4 -87% | 120.1 -92% | 1222 ? -20% |
| Access Time Read * (ms) | 0.086 | 0.093 -8% | 0.065 24% | 1.519 -1666% | 0.132 -53% | 0.0965 ? -12% | |
| Access Time Write * (ms) | 0.036 | 0.038 -6% | 0.026 28% | 0.255 -608% | 0.037 -3% | 0.259 -619% | 0.04212 ? -17% |
| Score Read (Points) | 1581 | 810 -49% | 1621 3% | 318 -80% | 475 -70% | 414 -74% | 1403 ? -11% |
| Score Write (Points) | 1825 | 819 -55% | 1794 -2% | 174 -90% | 366 -80% | 196 -89% | 1536 ? -16% |
| Score Total (Points) | 4175 | 2014 -52% | 4208 1% | 620 -85% | 1065 -74% | 811 -81% | 3633 ? -13% |
| Copy ISO MB/s (MB/s) | 1446 | 1043 -28% | 159.2 -89% | 1062 -27% | 1506 ? 4% | ||
| Copy Program MB/s (MB/s) | 473.4 | 371.7 -21% | 94.4 -80% | 426 -10% | 410 ? -13% | ||
| Copy Game MB/s (MB/s) | 971 | 399.9 -59% | 106.3 -89% | 650 -33% | 894 ? -8% | ||
| Moyenne finale (programmes/paramètres) | -28% /
-30% | 5% /
6% | -146% /
-168% | -46% /
-45% | -99% /
-102% | -12% /
-11% |
* ... Moindre est la valeur, meilleures sont les performances

| 3DMark 11 Performance | 16344 points | |
| 3DMark Ice Storm Standard Score | 106089 points | |
| 3DMark Cloud Gate Standard Score | 35033 points | |
| 3DMark Fire Strike Score | 12903 points | |
| 3DMark Fire Strike Extreme Score | 6532 points | |
| 3DMark Time Spy Score | 5615 points | |
Aide | ||
| Bas | Moyen | Élevé | Ultra | |
|---|---|---|---|---|
| BioShock Infinite (2013) | 283 | 241 | 237 | 128 |
| The Witcher 3 (2015) | 204 | 151 | 93 | 54.6 |
| Dota 2 Reborn (2015) | 119.4 | 110.4 | 103.3 | 94.6 |
| Rise of the Tomb Raider (2016) | 118 | 116 | 86 | 74 |
| X-Plane 11.11 (2018) | 83 | 76 | 64 |
Degré de la nuisance sonore
| Au repos |
| 31 / 31 / 31 dB(A) |
| Fortement sollicité |
| 41.5 / 46.9 dB(A) |
 | ||
30 dB silencieux 40 dB(A) audible 50 dB(A) bruyant |
||
min: | ||
| Acer Predator Helios 300 PH315-52-79TY GeForce GTX 1660 Ti Mobile, i7-9750H, WDC PC SN720 SDAPNTW-512G | HP Gaming Pavilion 15-dk0009ng GeForce GTX 1660 Ti Max-Q, i7-9750H, Samsung SSD PM981 MZVLB256HAHQ | Lenovo Legion Y540-15IRH-81SX00B2GE GeForce GTX 1660 Ti Mobile, i7-9750H, WDC PC SN720 SDAPNTW-512G | Dell G5 15 5590 GeForce RTX 2060 Mobile, i7-8750H, KBG30ZMS128G | Lenovo Legion Y740-15ICHg GeForce RTX 2070 Max-Q, i7-9750H, WDC PC SN520 SDAPMUW-128G | Acer Predator Helios 300 PH317-52-51M6 GeForce GTX 1050 Ti Mobile, i5-8300H, Hynix HFS128G39TND | |
|---|---|---|---|---|---|---|
| Noise | 12% | 6% | -2% | 1% | -1% | |
| arrêt / environnement * (dB) | 30.2 | 28.2 7% | 29.3 3% | 30.4 -1% | 30 1% | 29 4% |
| Idle Minimum * (dB) | 31 | 29.3 5% | 29.3 5% | 30.4 2% | 31.3 -1% | 29 6% |
| Idle Average * (dB) | 31 | 29.3 5% | 29.3 5% | 30.4 2% | 31.3 -1% | 31 -0% |
| Idle Maximum * (dB) | 31 | 29.3 5% | 29.3 5% | 33.4 -8% | 31.3 -1% | 33 -6% |
| Load Average * (dB) | 41.5 | 32.3 22% | 35.7 14% | 42 -1% | 42 -1% | 45 -8% |
| Witcher 3 ultra * (dB) | 46.7 | 34 27% | 44.2 5% | 42.1 10% | 45 4% | |
| Load Maximum * (dB) | 46.9 | 41.2 12% | 45.6 3% | 48.7 -4% | 46.5 1% | 51 -9% |
* ... Moindre est la valeur, meilleures sont les performances
(-) La température maximale du côté supérieur est de 52 °C / 126 F, par rapport à la moyenne de 40.4 °C / 105 F, allant de 21.2 à 68.8 °C pour la classe Gaming.
(-) Le fond chauffe jusqu'à un maximum de 46.3 °C / 115 F, contre une moyenne de 43.2 °C / 110 F
(+) En utilisation inactive, la température moyenne du côté supérieur est de 24.1 °C / 75 F, par rapport à la moyenne du dispositif de 33.9 °C / 93 F.
(±) En jouant à The Witcher 3, la température moyenne du côté supérieur est de 38 °C / 100 F, alors que la moyenne de l'appareil est de 33.9 °C / 93 F.
(+) Les repose-poignets et le pavé tactile atteignent la température maximale de la peau (33 °C / 91.4 F) et ne sont donc pas chauds.
(-) La température moyenne de la zone de l'appui-paume de dispositifs similaires était de 28.8 °C / 83.8 F (-4.2 °C / #-7.6 F).
| Acer Predator Helios 300 PH315-52-79TY GeForce GTX 1660 Ti Mobile, i7-9750H, WDC PC SN720 SDAPNTW-512G | HP Gaming Pavilion 15-dk0009ng GeForce GTX 1660 Ti Max-Q, i7-9750H, Samsung SSD PM981 MZVLB256HAHQ | Lenovo Legion Y540-15IRH-81SX00B2GE GeForce GTX 1660 Ti Mobile, i7-9750H, WDC PC SN720 SDAPNTW-512G | Dell G5 15 5590 GeForce RTX 2060 Mobile, i7-8750H, KBG30ZMS128G | Lenovo Legion Y740-15ICHg GeForce RTX 2070 Max-Q, i7-9750H, WDC PC SN520 SDAPMUW-128G | Acer Predator Helios 300 PH317-52-51M6 GeForce GTX 1050 Ti Mobile, i5-8300H, Hynix HFS128G39TND | |
|---|---|---|---|---|---|---|
| Heat | 1% | -23% | -5% | -26% | -15% | |
| Maximum Upper Side * (°C) | 52 | 46.7 10% | 42.7 18% | 51.5 1% | 43.9 16% | 50 4% |
| Maximum Bottom * (°C) | 46.3 | 53.7 -16% | 52.7 -14% | 48.3 -4% | 47.6 -3% | 52 -12% |
| Idle Upper Side * (°C) | 24.8 | 23.8 4% | 33.1 -33% | 27.2 -10% | 38.6 -56% | 33 -33% |
| Idle Bottom * (°C) | 25.4 | 23.7 7% | 41 -61% | 27.4 -8% | 40.8 -61% | 30 -18% |
* ... Moindre est la valeur, meilleures sont les performances
Acer Predator Helios 300 PH315-52-79TY analyse audio
(-) | haut-parleurs pas très forts (69.2 dB)
Basses 100 - 315 Hz
(-) | presque aucune basse - en moyenne 22.4% plus bas que la médiane
(±) | la linéarité des basses est moyenne (12.4% delta à la fréquence précédente)
Médiums 400 - 2000 Hz
(+) | médiane équilibrée - seulement 3.8% de la médiane
(±) | la linéarité des médiums est moyenne (9.8% delta à la fréquence précédente)
Aiguës 2 - 16 kHz
(+) | des sommets équilibrés - à seulement 2% de la médiane
(+) | les aigus sont linéaires (6.9% delta à la fréquence précédente)
Globalement 100 - 16 000 Hz
(±) | la linéarité du son global est moyenne (21.4% de différence avec la médiane)
Par rapport à la même classe
» 77% de tous les appareils testés de cette catégorie étaient meilleurs, 5% similaires, 18% pires
» Le meilleur avait un delta de 6%, la moyenne était de 18%, le pire était de 132%.
Par rapport à tous les appareils testés
» 60% de tous les appareils testés étaient meilleurs, 7% similaires, 33% pires
» Le meilleur avait un delta de 4%, la moyenne était de 24%, le pire était de 134%.
Lenovo Legion Y540-15IRH-81SX00B2GE analyse audio
(±) | le niveau sonore du haut-parleur est moyen mais bon (77.4# dB)
Basses 100 - 315 Hz
(-) | presque aucune basse - en moyenne 17.7% plus bas que la médiane
(±) | la linéarité des basses est moyenne (11.6% delta à la fréquence précédente)
Médiums 400 - 2000 Hz
(+) | médiane équilibrée - seulement 3.7% de la médiane
(+) | les médiums sont linéaires (4.5% delta à la fréquence précédente)
Aiguës 2 - 16 kHz
(+) | des sommets équilibrés - à seulement 3.3% de la médiane
(+) | les aigus sont linéaires (5.9% delta à la fréquence précédente)
Globalement 100 - 16 000 Hz
(±) | la linéarité du son global est moyenne (18.1% de différence avec la médiane)
Par rapport à la même classe
» 57% de tous les appareils testés de cette catégorie étaient meilleurs, 8% similaires, 35% pires
» Le meilleur avait un delta de 6%, la moyenne était de 18%, le pire était de 132%.
Par rapport à tous les appareils testés
» 38% de tous les appareils testés étaient meilleurs, 8% similaires, 54% pires
» Le meilleur avait un delta de 4%, la moyenne était de 24%, le pire était de 134%.
| Éteint/en veille | |
| Au repos | |
| Fortement sollicité |
|
Légende:
min: | |
| Acer Predator Helios 300 PH315-52-79TY i7-9750H, GeForce GTX 1660 Ti Mobile, WDC PC SN720 SDAPNTW-512G, IPS, 1920x1080, 15.6" | HP Gaming Pavilion 15-dk0009ng i7-9750H, GeForce GTX 1660 Ti Max-Q, Samsung SSD PM981 MZVLB256HAHQ, IPS, 1920x1080, 15.6" | Lenovo Legion Y540-15IRH-81SX00B2GE i7-9750H, GeForce GTX 1660 Ti Mobile, WDC PC SN720 SDAPNTW-512G, IPS, 1920x1080, 15.6" | Dell G5 15 5590 i7-8750H, GeForce RTX 2060 Mobile, KBG30ZMS128G, IPS, 1920x1080, 15.6" | Lenovo Legion Y740-15ICHg i7-9750H, GeForce RTX 2070 Max-Q, WDC PC SN520 SDAPMUW-128G, IPS, 1920x1080, 15.6" | Acer Predator Helios 300 PH317-52-51M6 i5-8300H, GeForce GTX 1050 Ti Mobile, Hynix HFS128G39TND, IPS, 1920x1080, 17.3" | Moyenne NVIDIA GeForce GTX 1660 Ti Mobile | Moyenne de la classe Gaming | |
|---|---|---|---|---|---|---|---|---|
| Power Consumption | 31% | 9% | 34% | -16% | 38% | 7% | -5% | |
| Idle Minimum * (Watt) | 17.2 | 6.8 60% | 14.5 16% | 3.5 80% | 22.2 -29% | 6 65% | 12.4 ? 28% | 13.3 ? 23% |
| Idle Average * (Watt) | 22.6 | 10.7 53% | 18.5 18% | 6.9 69% | 24.9 -10% | 9 60% | 18 ? 20% | 19 ? 16% |
| Idle Maximum * (Watt) | 25.5 | 12.5 51% | 20 22% | 8.5 67% | 30.6 -20% | 13 49% | 25.3 ? 1% | 24.5 ? 4% |
| Load Average * (Watt) | 88 | 87.2 1% | 81.6 7% | 127 -44% | 101 -15% | 95 -8% | 93.5 ? -6% | 108.1 ? -23% |
| Load Maximum * (Watt) | 177 | 191.4 -8% | 208.1 -18% | 179 -1% | 186 -5% | 134 24% | 191.9 ? -8% | 254 ? -44% |
| Witcher 3 ultra * (Watt) | 121 | 132 | 143 | 102 |
* ... Moindre est la valeur, meilleures sont les performances


| Acer Predator Helios 300 PH315-52-79TY i7-9750H, GeForce GTX 1660 Ti Mobile, 58.75 Wh | HP Gaming Pavilion 15-dk0009ng i7-9750H, GeForce GTX 1660 Ti Max-Q, 52.5 Wh | Lenovo Legion Y540-15IRH-81SX00B2GE i7-9750H, GeForce GTX 1660 Ti Mobile, 57 Wh | Dell G5 15 5590 i7-8750H, GeForce RTX 2060 Mobile, 60 Wh | Lenovo Legion Y740-15ICHg i7-9750H, GeForce RTX 2070 Max-Q, 57 Wh | Acer Predator Helios 300 PH317-52-51M6 i5-8300H, GeForce GTX 1050 Ti Mobile, 48 Wh | Moyenne de la classe Gaming | |
|---|---|---|---|---|---|---|---|
| Autonomie de la batterie | 44% | -14% | 149% | -14% | 82% | 85% | |
| Reader / Idle (h) | 5 | 8.7 74% | 4 -20% | 14.8 196% | 11.8 136% | 8.71 ? 74% | |
| H.264 (h) | 3.4 | 5.3 56% | 8.4 147% | 8.26 ? 143% | |||
| WiFi v1.3 (h) | 3.5 | 4.8 37% | 2.4 -31% | 7.7 120% | 3 -14% | 5.9 69% | 7.01 ? 100% |
| Load (h) | 1.2 | 1.3 8% | 1.3 8% | 2.8 133% | 1.7 42% | 1.47 ? 23% | |
| Witcher 3 ultra (h) | 1 |
Points positifs
Points négatifs
Verdict - A powerful 1080p gaming laptop with flaws
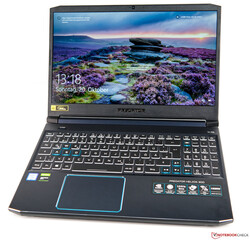
L’Acer Predator Helios 300 PH315 est un portable de jeu moderne avec des performances de jeu acceptables. Le modèle d’entrée de gamme n’est cependant pas spécialement bon marché, pour environ 1 400 €. Néanmoins, le portable de 15 pouces mis à jour évolue dans le bon sens, et intègre des composants capables de faire tourner tous les jeux triple A récents en 1080p.
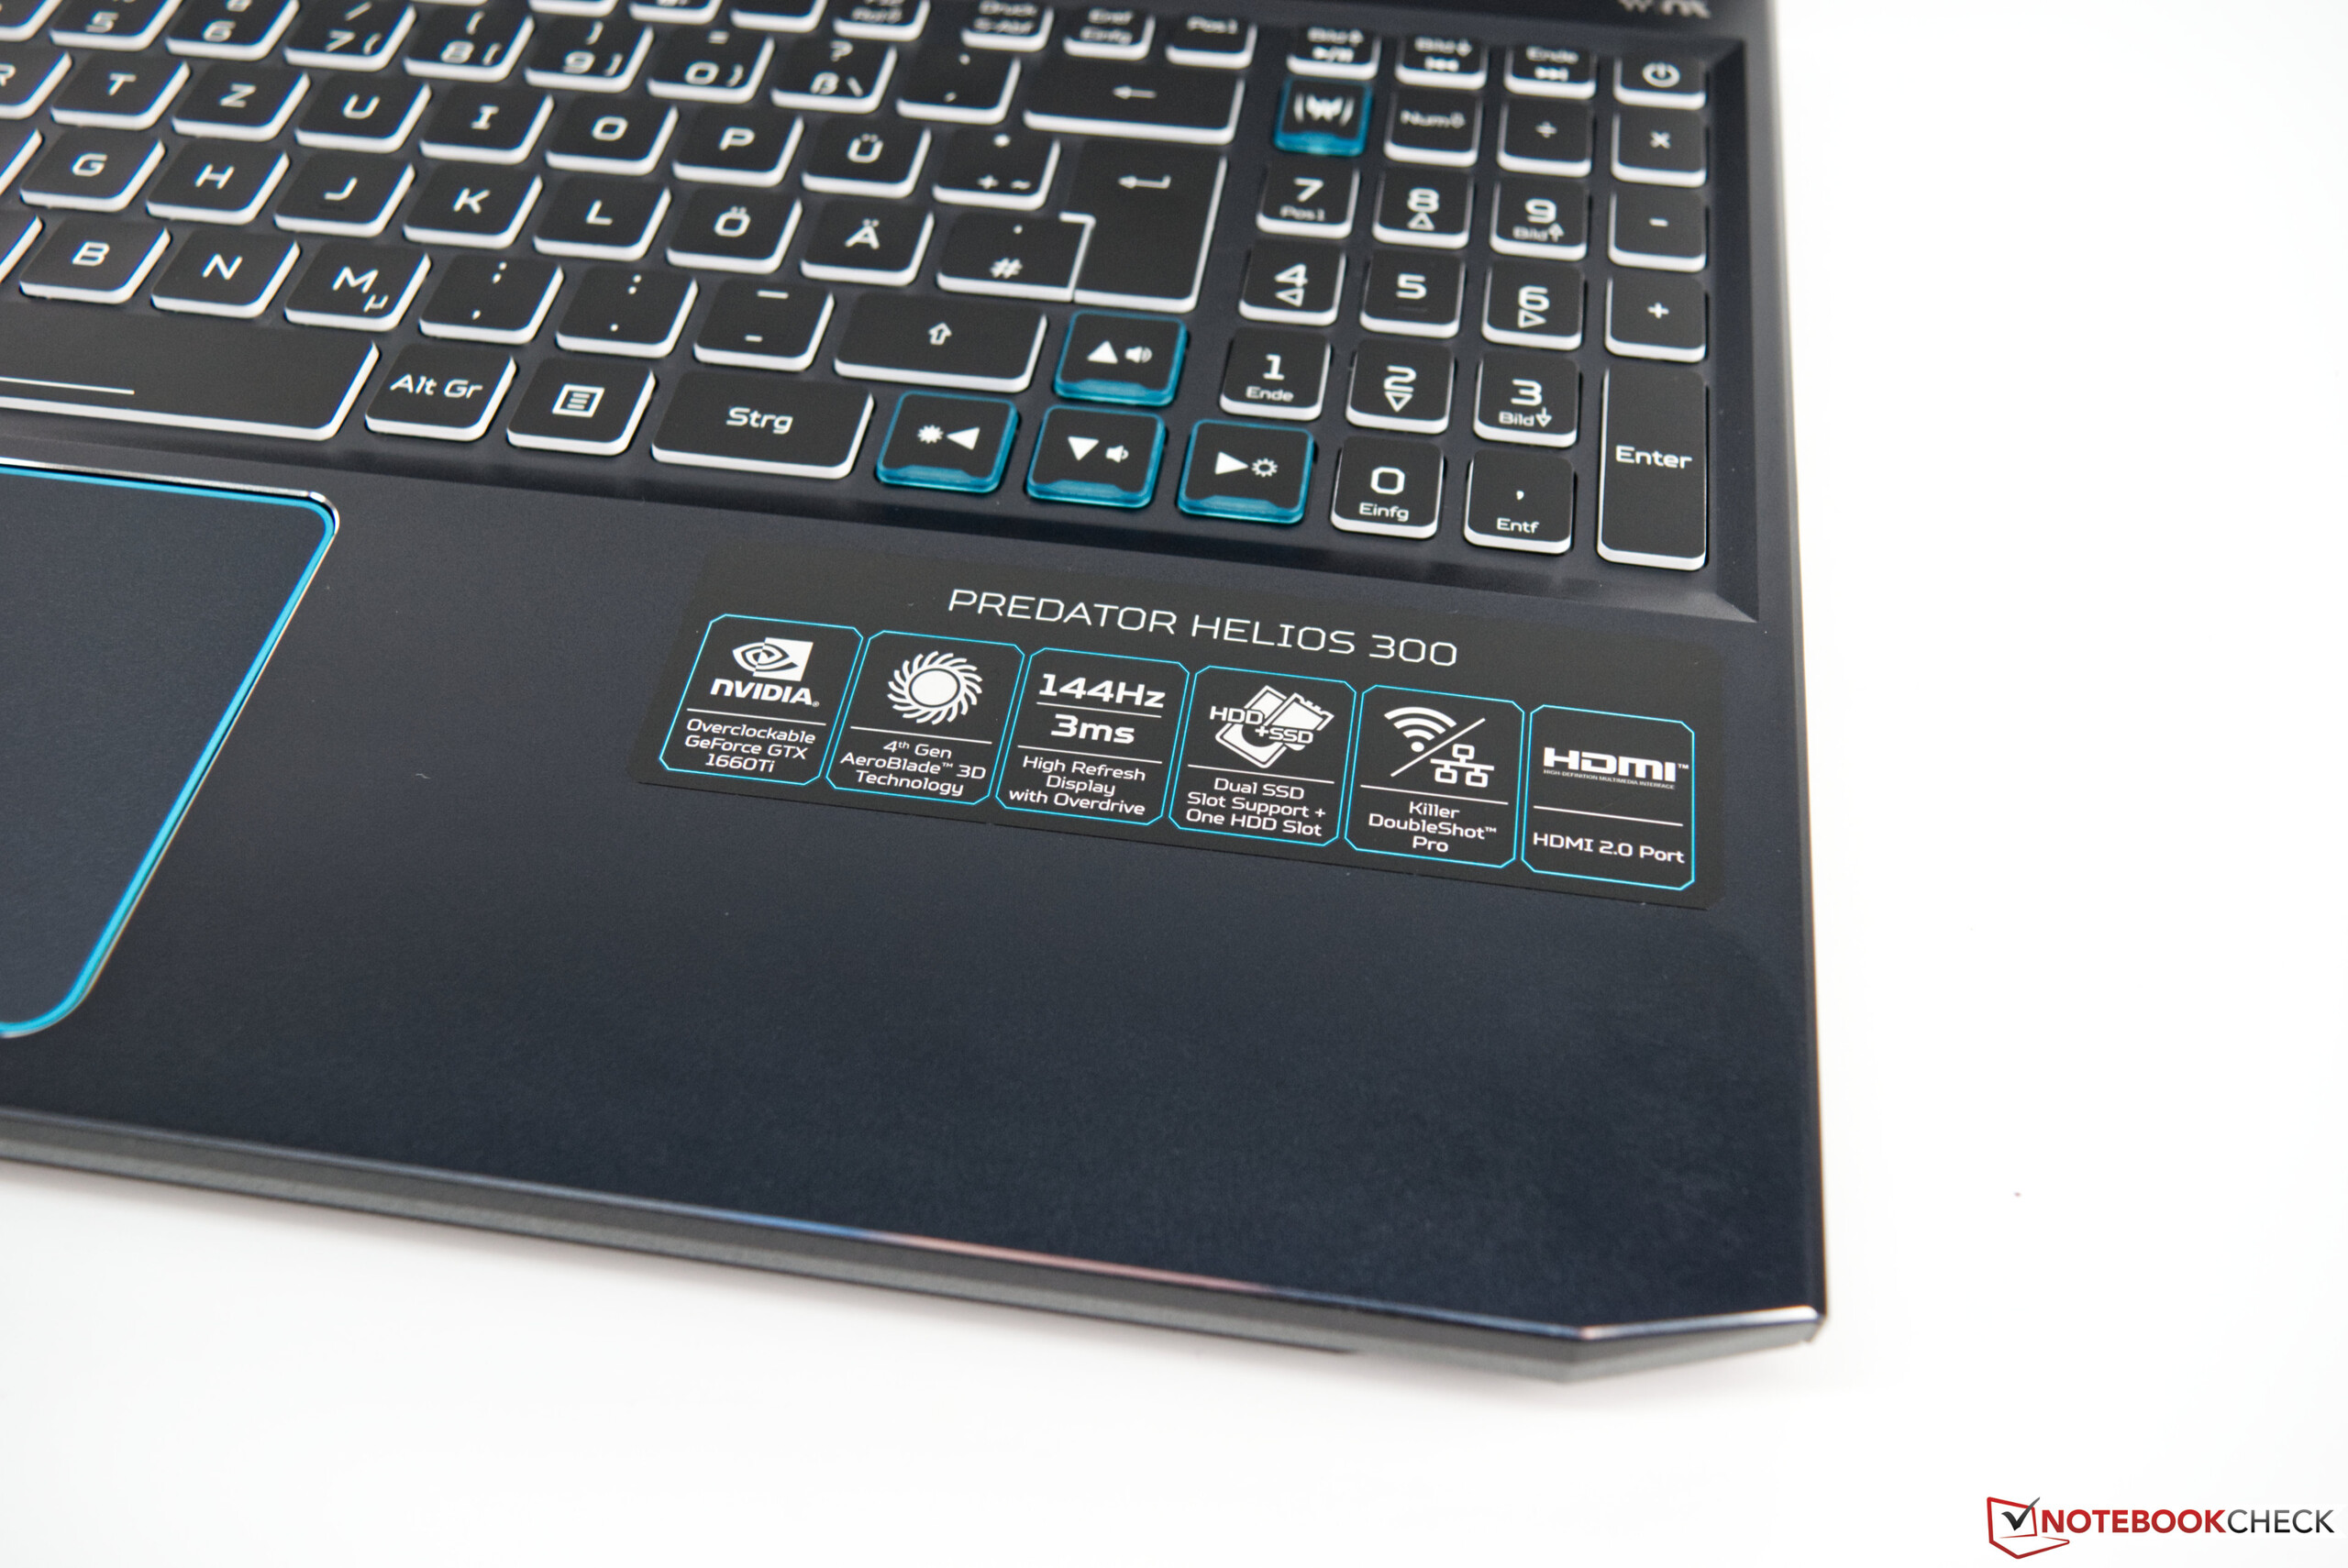
Alors que nous apprécions toujours que les fabricants intègrent des dalles 144 Hz dans leurs portables de jeu, ce type d’écran au taux de rafraîchissement élevé n’est pas encore devenu la norme. Ici, il est lumineux et ses couleurs sont fidèles, deux qualités importantes. Mais il souffre de fuites de lumière conséquentes, ce qui est une surprise pour un portable à ce prix. Le choix de n’intégrer que 512 Go de mémoire dans un portable de jeu est sujet à caution, si bien que nous recommandons de choisir une version 1 To si possible. Faute de quoi vous pourriez avoir besoin d’intégrer rapidement un deuxième disque, surtout avec des jeux qui nécessitent 100 Go d’espace.
L’Acer Predator Helios 300 PH315 est un bon portable de jeu d’entrée de gamme, mais avec quelques défauts.
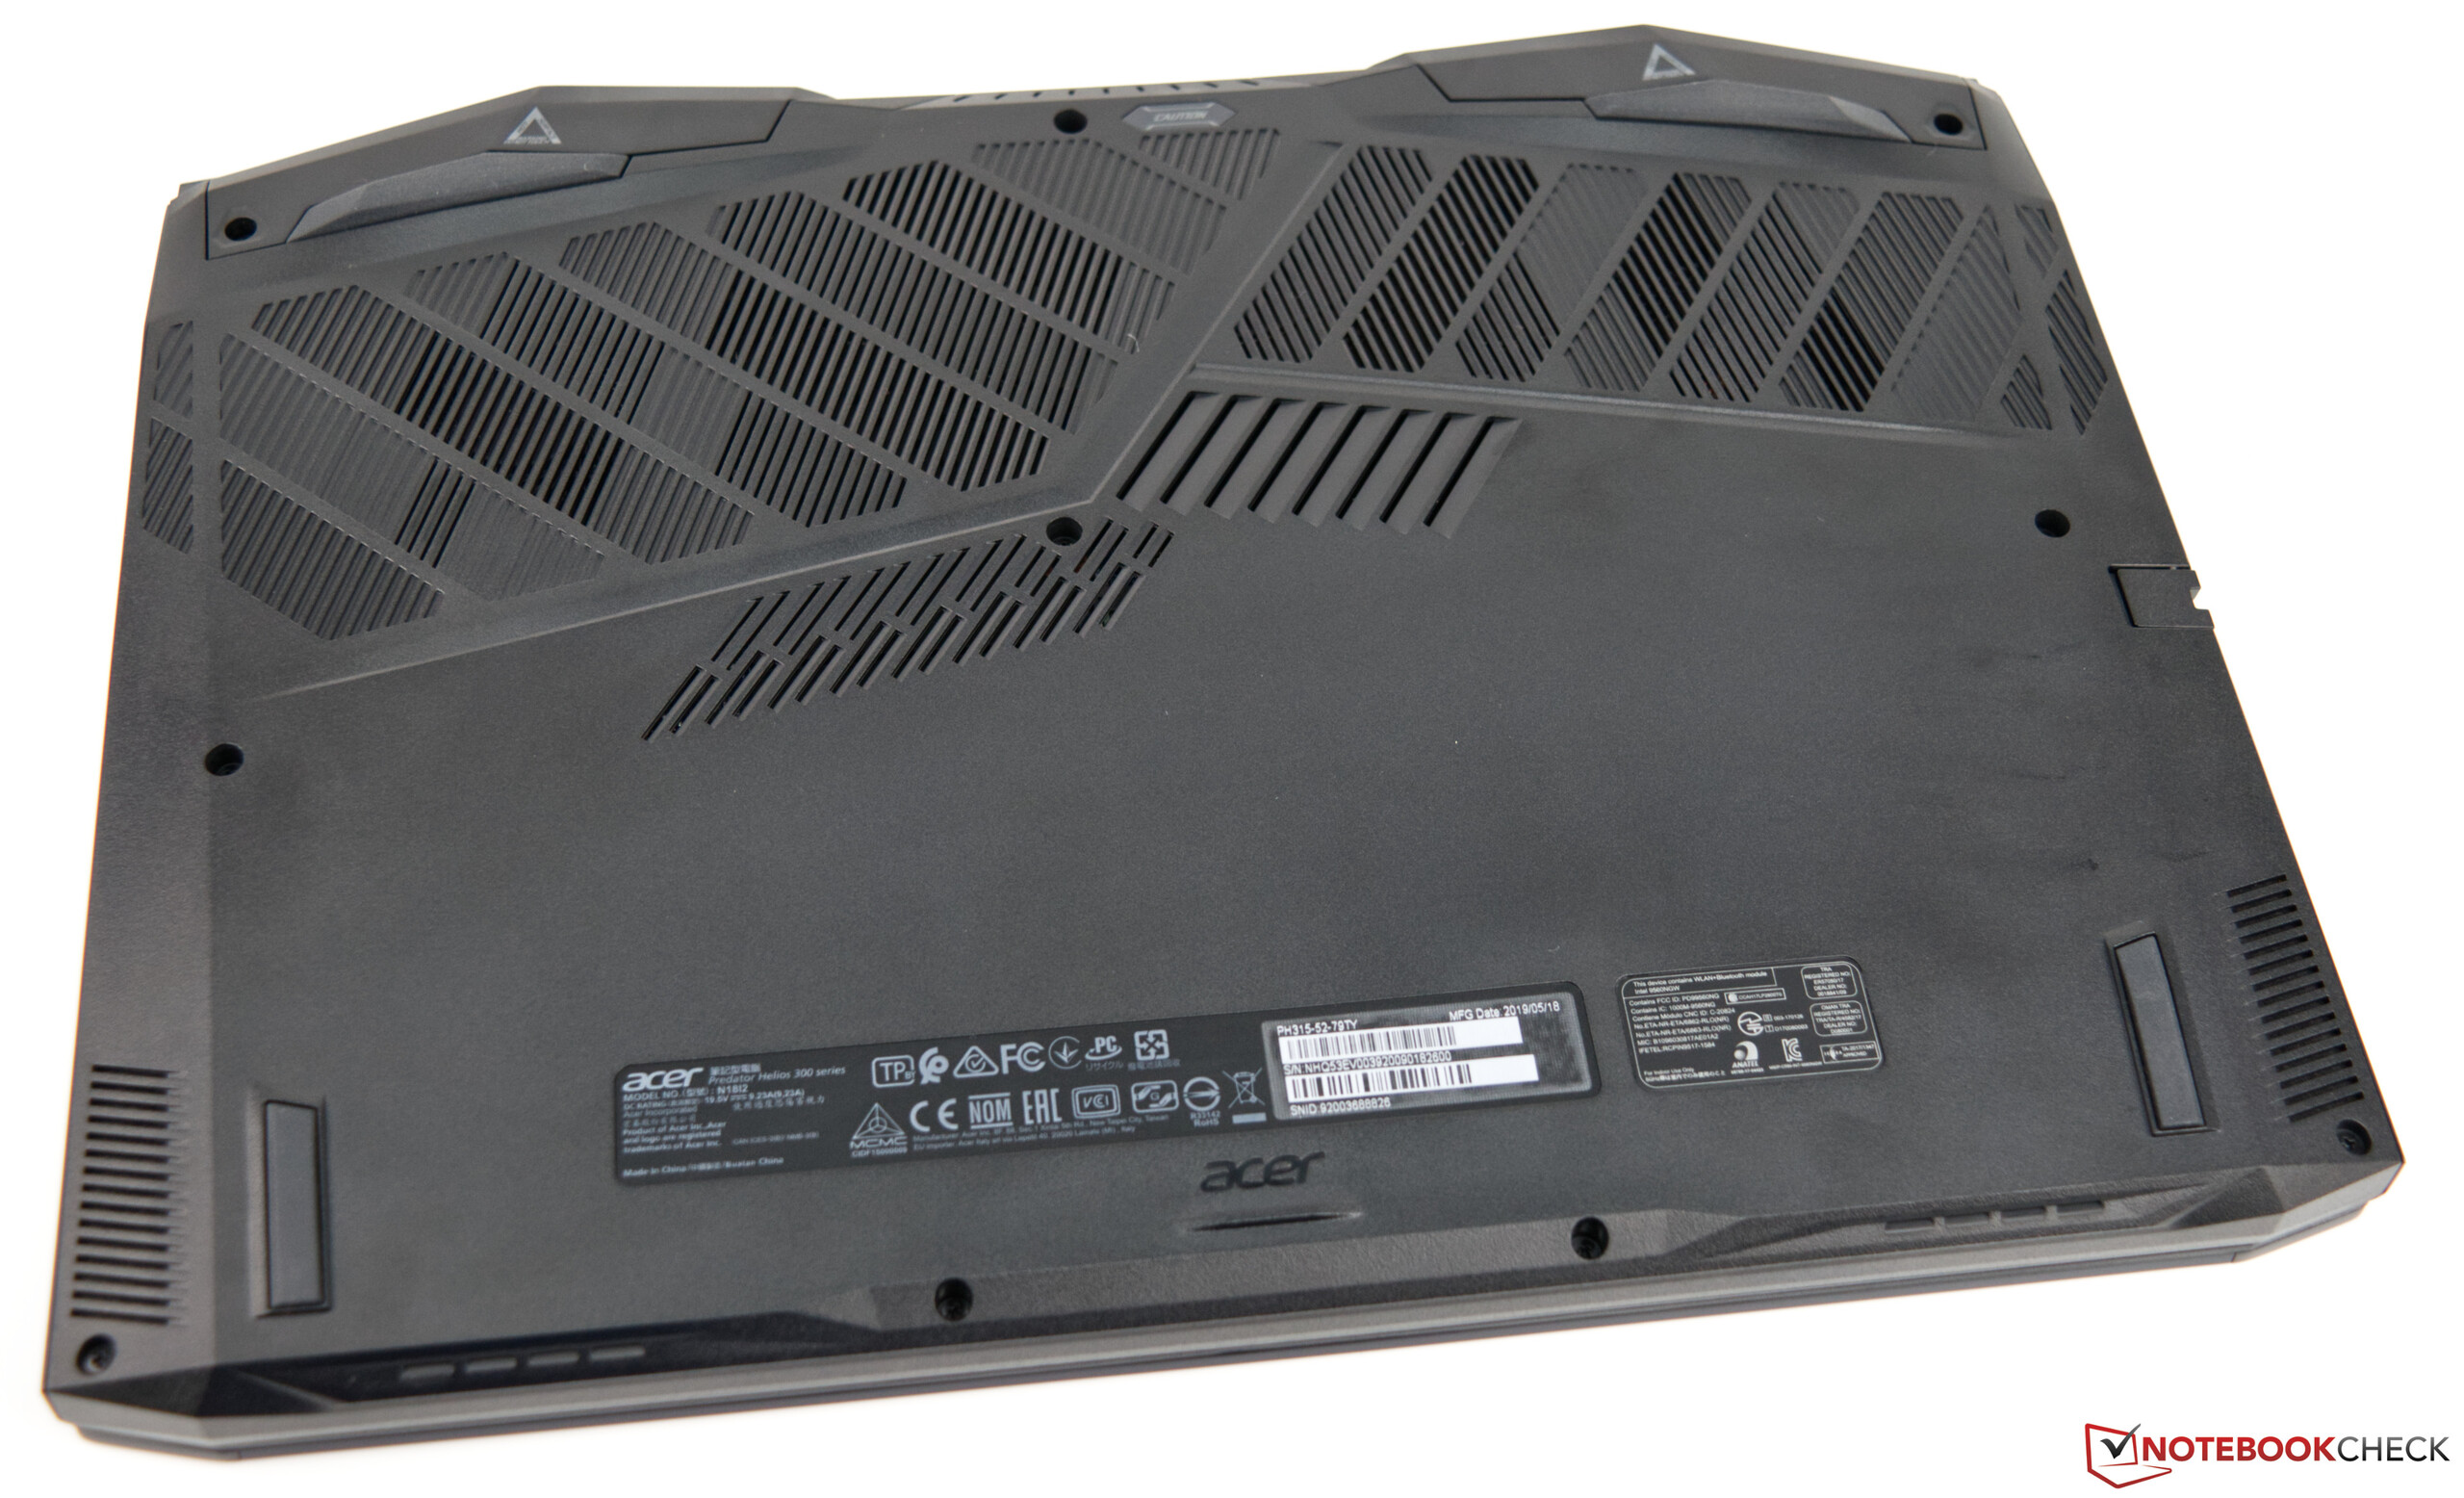
Ajouter des disques est relativement simple, les emplacements étant situés sous la coque, qui est facile à enlever. Alors qu’il n’y a pas grand-chose à redire en ce qui concerne la qualité, le Helios 300 PH315 consomme à notre avis plus qu’il ne le devrait. Si l’appareil possède ce défaut, et celui d’avoir des haut-parleurs moyens, il n’en reste pas moins un portable de jeu tout à fait correct.
L’intégralité de cette critique est disponible en anglais en suivant ce lien.
Acer Predator Helios 300 PH315-52-79TY
- 05/15/2020 v7 (old)
Sebastian Bade
Price comparison
