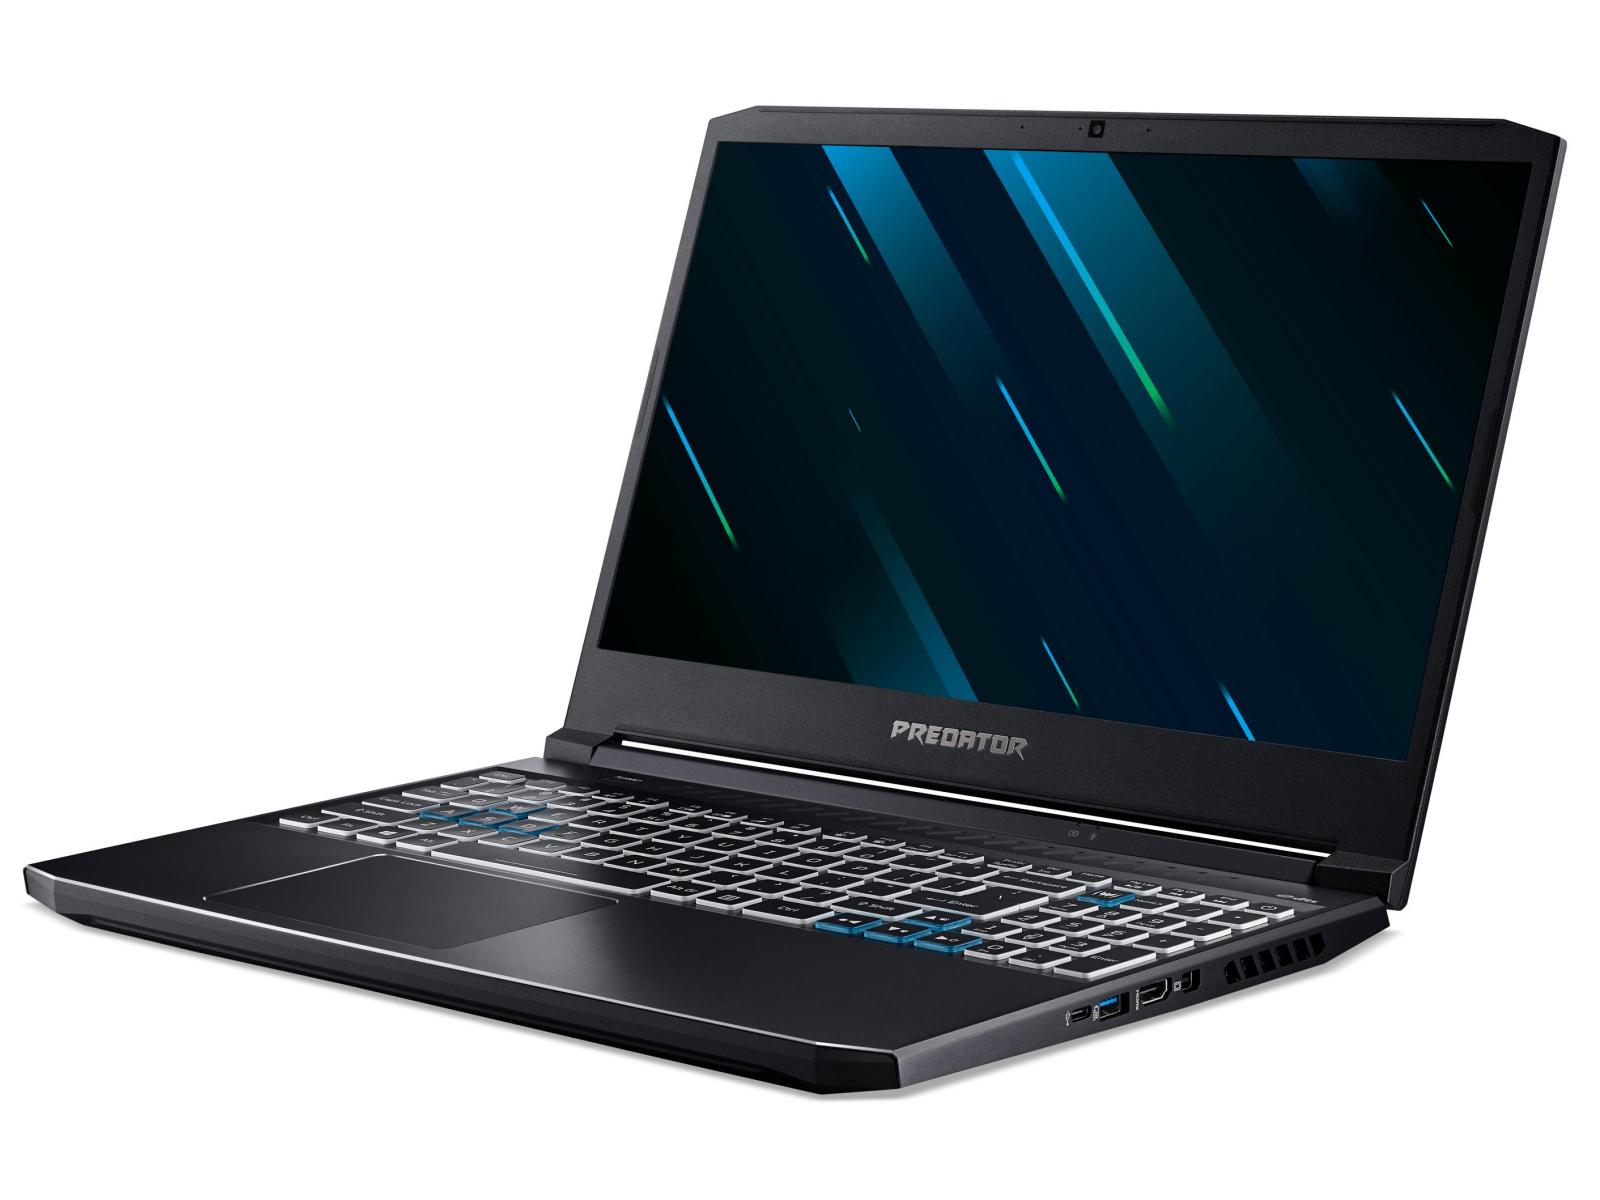
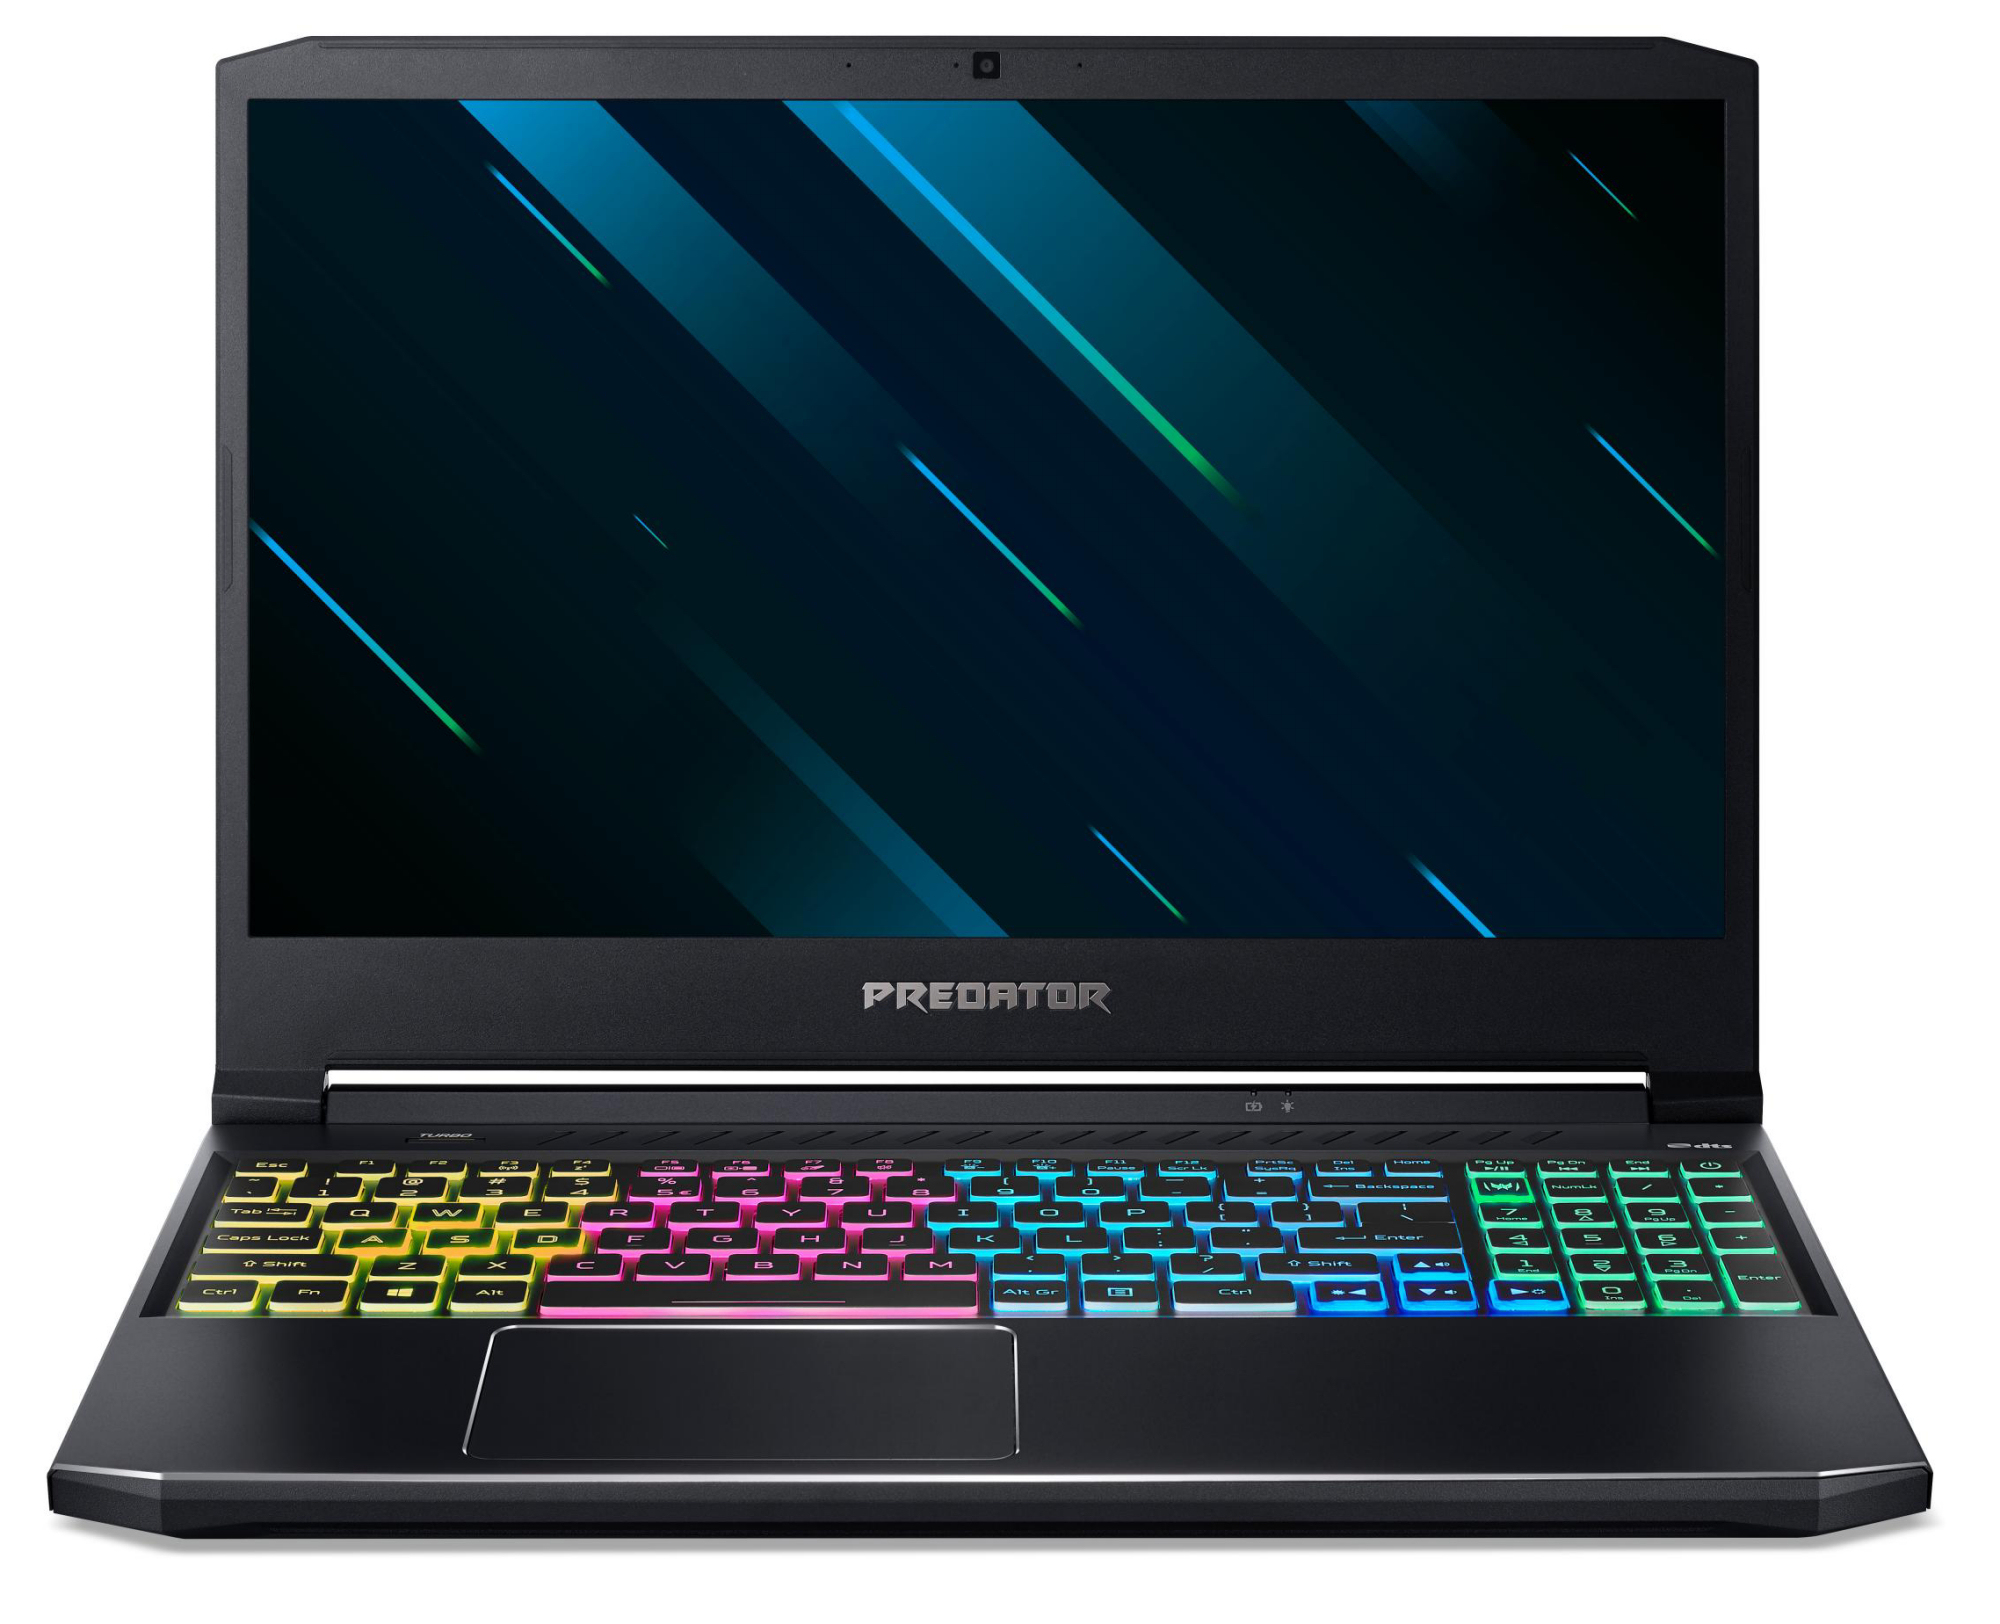
Test de l'Acer Predator Helios 300 PH315-53 (i7-10750H, RTX 2060, FHD, 144 Hz) : puissant PC de jeu avec des réserves
Note | Date | Modèle | Poids | Épaisseur | Taille | Résolution | Prix |
|---|---|---|---|---|---|---|---|
| 82.9 % v7 (old) | 11/20 | Acer Predator Helios 300 PH315-53-77N5 i7-10750H, GeForce RTX 2060 Mobile | 2.5 kg | 22.9 mm | 15.60" | 1920x1080 | |
| 83.7 % v7 (old) | 08/20 | Dell G5 15 SE 5505 P89F R7 4800H, Radeon RX 5600M | 2.4 kg | 21.6 mm | 15.60" | 1920x1080 | |
| 83.7 % v7 (old) | 10/20 | Aorus 5 KB i7-10750H, GeForce RTX 2060 Mobile | 2.1 kg | 28 mm | 15.60" | 1920x1080 | |
| 82.1 % v7 (old) | 09/20 | Schenker XMG Core 15 GK5NR0O R7 4800H, GeForce RTX 2060 Mobile | 2 kg | 19.9 mm | 15.60" | 1920x1080 | |
| 82.7 % v7 (old) | Asus TUF Gaming A15 FA506IV-HN172 R7 4800H, GeForce RTX 2060 Mobile | 2.2 kg | 24.9 mm | 15.60" | 1920x1080 |


")
")


| |||||||||||||||||||||||||
Homogénéité de la luminosité: 83 %
Valeur mesurée au centre, sur batterie: 254 cd/m²
Contraste: 1450:1 (Valeurs des noirs: 0.22 cd/m²)
ΔE ColorChecker Calman: 4.42 | ∀{0.5-29.43 Ø4.73}
ΔE Greyscale Calman: 4.84 | ∀{0.09-98 Ø4.97}
92% sRGB (Argyll 1.6.3 3D)
60% AdobeRGB 1998 (Argyll 1.6.3 3D)
66.3% AdobeRGB 1998 (Argyll 3D)
92.3% sRGB (Argyll 3D)
65.2% Display P3 (Argyll 3D)
Gamma: 2.39
CCT: 6850 K
| Acer Predator Helios 300 PH315-53-77N5 AU Optronics B156HAN08.2, IPS, 1920x1080, 15.6" | Acer Predator Helios 300 PH315-52-79TY AUO, B156HAN08.2, IPS, 1920x1080, 15.6" | Dell G5 15 SE 5505 P89F BOE NV156FH, WVA, 1920x1080, 15.6" | Aorus 5 KB LG Philips LP156WFG-SPB2 (LGD05E8), IPS, 1920x1080, 15.6" | Schenker XMG Core 15 GK5NR0O LM156LF-1F02, IPS, 1920x1080, 15.6" | Asus TUF Gaming A15 FA506IV-HN172 LM156LF-2F01, IPS, 1920x1080, 15.6" | |
|---|---|---|---|---|---|---|
| Display | -1% | -3% | -1% | 3% | -39% | |
| Display P3 Coverage (%) | 65.2 | 64.1 -2% | 63 -3% | 63.4 -3% | 67.2 3% | 38.92 -40% |
| sRGB Coverage (%) | 92.3 | 93 1% | 90.1 -2% | 92.8 1% | 95.9 4% | 58.5 -37% |
| AdobeRGB 1998 Coverage (%) | 66.3 | 65.7 -1% | 64.1 -3% | 64.8 -2% | 68.5 3% | 40.22 -39% |
| Response Times | 15% | -9% | 7% | 29% | -109% | |
| Response Time Grey 50% / Grey 80% * (ms) | 17 ? | 15 ? 12% | 20.4 ? -20% | 14.4 ? 15% | 9.6 ? 44% | 34 ? -100% |
| Response Time Black / White * (ms) | 11 ? | 9 ? 18% | 10.8 ? 2% | 11.2 ? -2% | 9.6 ? 13% | 24 ? -118% |
| PWM Frequency (Hz) | 198.4 ? | |||||
| Screen | -2% | 0% | 10% | -13% | -17% | |
| Brightness middle (cd/m²) | 319 | 325 2% | 292 -8% | 318 0% | 312 -2% | 280 -12% |
| Brightness (cd/m²) | 294 | 310 5% | 290 -1% | 298 1% | 290 -1% | 254 -14% |
| Brightness Distribution (%) | 83 | 82 -1% | 77 -7% | 87 5% | 87 5% | 88 6% |
| Black Level * (cd/m²) | 0.22 | 0.255 -16% | 0.27 -23% | 0.3 -36% | 0.2 9% | 0.15 32% |
| Contrast (:1) | 1450 | 1275 -12% | 1081 -25% | 1060 -27% | 1560 8% | 1867 29% |
| Colorchecker dE 2000 * | 4.42 | 4.28 3% | 3.99 10% | 2.49 44% | 4.84 -10% | 5.89 -33% |
| Colorchecker dE 2000 max. * | 8.54 | 8.42 1% | 6.11 28% | 5.06 41% | 13.85 -62% | 19 -122% |
| Greyscale dE 2000 * | 4.84 | 5.01 -4% | 3.3 32% | 1.6 67% | 9 -86% | 4.08 16% |
| Gamma | 2.39 92% | 2.6 85% | 2.25 98% | 2.211 100% | 2.105 105% | 2.33 94% |
| CCT | 6850 95% | 7678 85% | 7047 92% | 6714 97% | 8099 80% | 7303 89% |
| Color Space (Percent of AdobeRGB 1998) (%) | 60 | 60 0% | 58.1 -3% | 65 8% | 68 13% | 37 -38% |
| Color Space (Percent of sRGB) (%) | 92 | 93 1% | 89.7 -2% | 89 -3% | 92 0% | 58 -37% |
| Colorchecker dE 2000 calibrated * | 1.45 | 3.02 | 1.53 | 1.77 | 4.79 | |
| Moyenne finale (programmes/paramètres) | 4% /
0% | -4% /
-2% | 5% /
7% | 6% /
-4% | -55% /
-34% |
* ... Moindre est la valeur, meilleures sont les performances
Temps de réponse de l'écran
| ↔ Temps de réponse noir à blanc | ||
|---|---|---|
| 11 ms ... hausse ↗ et chute ↘ combinées | ↗ 6 ms hausse | 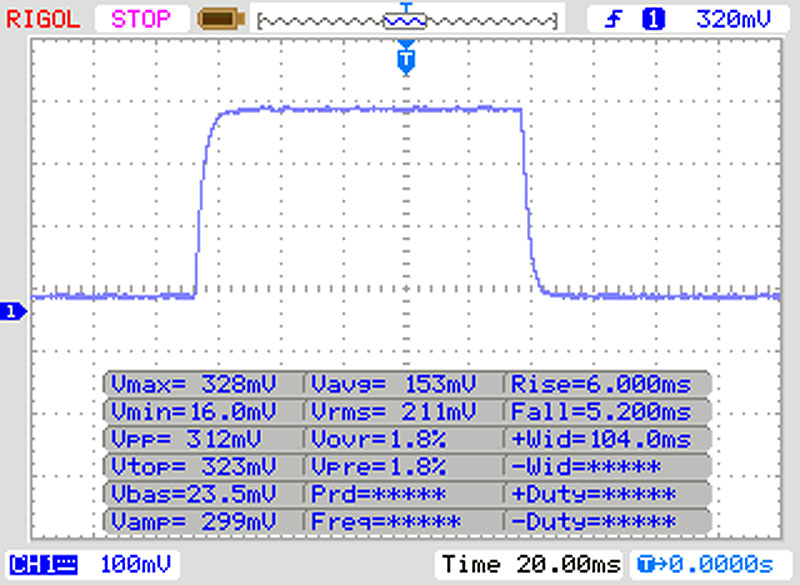 |
| ↘ 5 ms chute | ||
| L'écran montre de bons temps de réponse, mais insuffisant pour du jeu compétitif. En comparaison, tous les appareils testés affichent entre 0.1 (minimum) et 240 (maximum) ms. » 29 % des appareils testés affichent de meilleures performances. Cela signifie que les latences relevées sont meilleures que la moyenne (19.9 ms) de tous les appareils testés. | ||
| ↔ Temps de réponse gris 50% à gris 80% | ||
| 17 ms ... hausse ↗ et chute ↘ combinées | ↗ 9 ms hausse | 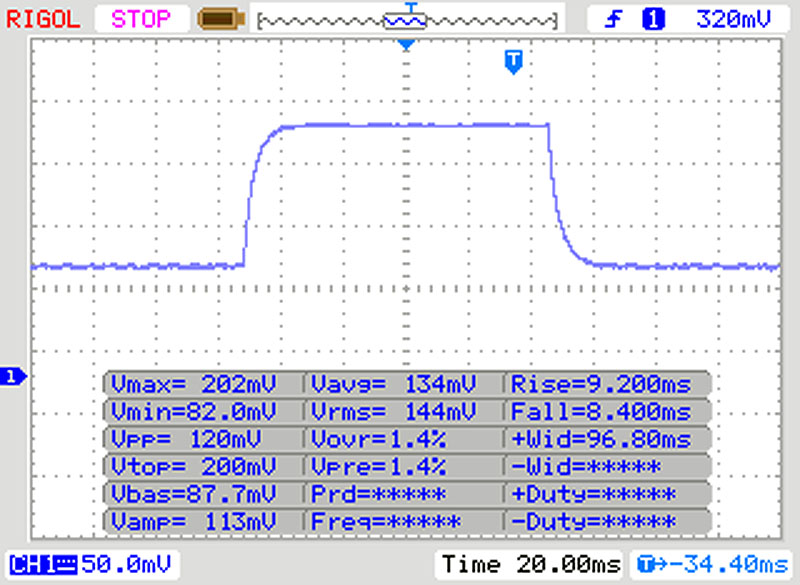 |
| ↘ 8 ms chute | ||
| L'écran montre de bons temps de réponse, mais insuffisant pour du jeu compétitif. En comparaison, tous les appareils testés affichent entre 0.165 (minimum) et 636 (maximum) ms. » 31 % des appareils testés affichent de meilleures performances. Cela signifie que les latences relevées sont meilleures que la moyenne (31.1 ms) de tous les appareils testés. | ||
Scintillement / MLI (Modulation de largeur d'impulsion)
| Scintillement / MLI (Modulation de largeur d'impulsion) non décelé |  | ||
En comparaison, 52 % des appareils testés n'emploient pas MDI pour assombrir leur écran. Nous avons relevé une moyenne à 7794 (minimum : 5 - maximum : 343500) Hz dans le cas où une MDI était active. | |||
| HWBOT x265 Benchmark v2.2 - 4k Preset | |
| Moyenne de la classe Gaming (11.5 - 44.3, n=110, 2 dernières années) | |
| HP Pavilion Gaming 15-ec1177ng | |
| Dell G5 15 SE 5505 P89F | |
| Schenker XMG Core 15 GK5NR0O | |
| MSI Bravo 15 A4DCR | |
| Asus TUF Gaming A15 FA506IV-HN172 | |
| Acer Predator Helios 300 PH315-53-77N5 | |
| Moyenne Intel Core i7-10750H (5.54 - 11.6, n=43) | |
| Aorus 5 KB | |
| Acer Predator Helios 300 PH315-52-79TY | |
| LibreOffice - 20 Documents To PDF | |
| MSI Bravo 15 A4DCR | |
| Dell G5 15 SE 5505 P89F | |
| HP Pavilion Gaming 15-ec1177ng | |
| Schenker XMG Core 15 GK5NR0O | |
| Acer Predator Helios 300 PH315-53-77N5 | |
| Moyenne Intel Core i7-10750H (43.1 - 99.2, n=43) | |
| Moyenne de la classe Gaming (19 - 88.8, n=110, 2 dernières années) | |
| Aorus 5 KB | |
| Asus TUF Gaming A15 FA506IV-HN172 | |
| R Benchmark 2.5 - Overall mean | |
| Moyenne Intel Core i7-10750H (0.578 - 0.708, n=42) | |
| Asus TUF Gaming A15 FA506IV-HN172 | |
| Aorus 5 KB | |
| Acer Predator Helios 300 PH315-53-77N5 | |
| MSI Bravo 15 A4DCR | |
| Schenker XMG Core 15 GK5NR0O | |
| Dell G5 15 SE 5505 P89F | |
| HP Pavilion Gaming 15-ec1177ng | |
| Moyenne de la classe Gaming (0.3439 - 0.759, n=111, 2 dernières années) | |
* ... Moindre est la valeur, meilleures sont les performances
| PCMark 8 Home Score Accelerated v2 | 4160 points | |
| PCMark 8 Creative Score Accelerated v2 | 5899 points | |
| PCMark 8 Work Score Accelerated v2 | 5405 points | |
| PCMark 10 Score | 5921 points | |
Aide | ||
| DPC Latencies / LatencyMon - interrupt to process latency (max), Web, Youtube, Prime95 | |
| Dell G5 15 SE 5505 P89F | |
| Schenker XMG Core 15 GK5NR0O | |
| MSI Bravo 15 A4DCR | |
| Aorus 5 KB | |
| Acer Predator Helios 300 PH315-53-77N5 | |
| Asus TUF Gaming A15 FA506IV-HN172 | |
| HP Pavilion Gaming 15-ec1177ng | |
* ... Moindre est la valeur, meilleures sont les performances

| Acer Predator Helios 300 PH315-53-77N5 WDC PC SN730 SDBQNTY-512GB | Acer Predator Helios 300 PH315-52-79TY WDC PC SN720 SDAPNTW-512G | Dell G5 15 SE 5505 P89F Samsung PM991 MZ9LQ512HALU | Aorus 5 KB ADATA XPG SX8200 Pro (ASX8200PNP-512GT) | Schenker XMG Core 15 GK5NR0O Samsung SSD 970 EVO Plus 500GB | Asus TUF Gaming A15 FA506IV-HN172 Kingston OM8PCP3512F-AB | Moyenne WDC PC SN730 SDBQNTY-512GB | |
|---|---|---|---|---|---|---|---|
| CrystalDiskMark 5.2 / 6 | -7% | -17% | 11% | 29% | -13% | -2% | |
| Write 4K (MB/s) | 137.5 | 108.7 -21% | 142.1 3% | 162.1 18% | 233 69% | 219.8 60% | 140.9 ? 2% |
| Read 4K (MB/s) | 48.24 | 44.91 -7% | 46.43 -4% | 60.7 26% | 54.5 13% | 50.2 4% | 45.6 ? -5% |
| Write Seq (MB/s) | 2644 | 2424 -8% | 1108 -58% | 2366 -11% | 3050 15% | 979 -63% | 2066 ? -22% |
| Read Seq (MB/s) | 1718 | 1617 -6% | 1622 -6% | 2633 53% | 3042 77% | 1990 16% | 2014 ? 17% |
| Write 4K Q32T1 (MB/s) | 416.6 | 356.9 -14% | 467 12% | 428.2 3% | 520 25% | 516 24% | 472 ? 13% |
| Read 4K Q32T1 (MB/s) | 525 | 557 6% | 525 0% | 582 11% | 546 4% | 298.3 -43% | 453 ? -14% |
| Write Seq Q32T1 (MB/s) | 2705 | 2542 -6% | 1203 -56% | 2480 -8% | 3241 20% | 982 -64% | 2433 ? -10% |
| Read Seq Q32T1 (MB/s) | 3213 | 3218 0% | 2288 -29% | 3121 -3% | 3538 10% | 1907 -41% | 3237 ? 1% |
| Write 4K Q8T8 (MB/s) | 1138 | 981 | |||||
| Read 4K Q8T8 (MB/s) | 1346 | 300.9 | |||||
| AS SSD | 4% | -29% | 0% | 32% | -23% | 3% | |
| Seq Read (MB/s) | 2753 | 2841 3% | 1386 -50% | 2795 2% | 2836 3% | 1682 -39% | 2506 ? -9% |
| Seq Write (MB/s) | 2495 | 2009 -19% | 1234 -51% | 2172 -13% | 2452 -2% | 904 -64% | 1655 ? -34% |
| 4K Read (MB/s) | 38.64 | 39.34 2% | 41.32 7% | 53.3 38% | 60.4 56% | 60.2 56% | 42.2 ? 9% |
| 4K Write (MB/s) | 88.8 | 102.8 16% | 128 44% | 121.3 37% | 190.5 115% | 164.8 86% | 127.5 ? 44% |
| 4K-64 Read (MB/s) | 952 | 1257 32% | 854 -10% | 714 -25% | 1283 35% | 472.5 -50% | 1061 ? 11% |
| 4K-64 Write (MB/s) | 1568 | 1522 -3% | 721 -54% | 1376 -12% | 2298 47% | 845 -46% | 1480 ? -6% |
| Access Time Read * (ms) | 0.086 | 0.098 | 0.049 | 0.034 | 0.087 | 0.1012 ? | |
| Access Time Write * (ms) | 0.044 | 0.036 18% | 0.095 -116% | 0.036 18% | 0.02 55% | 0.02 55% | 0.03833 ? 13% |
| Score Read (Points) | 1266 | 1581 25% | 1034 -18% | 1046 -17% | 1627 29% | 701 -45% | 1354 ? 7% |
| Score Write (Points) | 1906 | 1825 -4% | 973 -49% | 1714 -10% | 2734 43% | 1101 -42% | 1772 ? -7% |
| Score Total (Points) | 3811 | 4175 10% | 2536 -33% | 3279 -14% | 5184 36% | 2143 -44% | 3781 ? -1% |
| Copy ISO MB/s (MB/s) | 2037 | 1446 -29% | 1284 -37% | 2039 0% | 675 -67% | 1903 ? -7% | |
| Copy Program MB/s (MB/s) | 475.6 | 473.4 0% | 401.9 -15% | 438 -8% | 248.4 -48% | 533 ? 12% | |
| Copy Game MB/s (MB/s) | 1018 | 971 -5% | 1013 0% | 1137 12% | 535 -47% | 1074 ? 6% | |
| Moyenne finale (programmes/paramètres) | -2% /
-0% | -23% /
-25% | 6% /
5% | 31% /
31% | -18% /
-19% | 1% /
1% |
* ... Moindre est la valeur, meilleures sont les performances
Continuous load read: DiskSpd Read Loop, Queue Depth 8
| 3DMark 11 Performance | 17684 points | |
| 3DMark Cloud Gate Standard Score | 36435 points | |
| 3DMark Fire Strike Score | 14732 points | |
| 3DMark Time Spy Score | 6011 points | |
Aide | ||
| 3DMark 11 - 1280x720 Performance GPU | |
| Moyenne de la classe Gaming (21841 - 80022, n=108, 2 dernières années) | |
| Dell G5 15 SE 5505 P89F | |
| Acer Predator Helios 300 PH315-53-77N5 (Extrem) | |
| Aorus 5 KB | |
| Schenker XMG Core 15 GK5NR0O | |
| Asus TUF Gaming A15 FA506IV-HN172 | |
| Moyenne NVIDIA GeForce RTX 2060 Mobile (19143 - 24662, n=40) | |
| Acer Predator Helios 300 PH315-53-77N5 | |
| Acer Predator Helios 300 PH315-52-79TY | |
| HP Pavilion Gaming 15-ec1177ng | |
| MSI Bravo 15 A4DCR | |
| The Witcher 3 | |
| 1920x1080 Ultra Graphics & Postprocessing (HBAO+) | |
| Moyenne de la classe Gaming (95 - 240, n=8, 2 dernières années) | |
| Acer Predator Helios 300 PH315-53-77N5 (Extrem) | |
| Acer Predator Helios 300 PH317-54-75G8 | |
| Dell G5 15 SE 5505 P89F | |
| Acer Predator Helios 300 PH315-53-77N5 | |
| Aorus 7 KB | |
| Moyenne NVIDIA GeForce RTX 2060 Mobile (50.6 - 74, n=40) | |
| Asus TUF Gaming A15 FA506IV-HN172 | |
| Schenker XMG Core 15 GK5NR0O | |
| Aorus 5 KB | |
| Acer Predator Helios 300 PH315-52-79TY | |
| HP Pavilion Gaming 15-ec1177ng | |
| MSI Bravo 15 A4DCR | |
| 1024x768 Low Graphics & Postprocessing | |
| Moyenne de la classe Gaming (389 - 686, n=3, 2 dernières années) | |
| Acer Predator Helios 300 PH317-54-75G8 | |
| Aorus 7 KB | |
| Dell G5 15 SE 5505 P89F | |
| HP Pavilion Gaming 15-ec1177ng | |
| Moyenne NVIDIA GeForce RTX 2060 Mobile (188.7 - 295, n=27) | |
| Acer Predator Helios 300 PH315-53-77N5 | |
| Schenker XMG Core 15 GK5NR0O | |
| Acer Predator Helios 300 PH315-52-79TY | |
| Asus TUF Gaming A15 FA506IV-HN172 | |
| MSI Bravo 15 A4DCR | |
| Shadow of the Tomb Raider | |
| 1920x1080 Highest Preset AA:T | |
| Moyenne de la classe Gaming (96 - 116, n=2, 2 dernières années) | |
| Acer Predator Helios 300 PH317-54-75G8 | |
| Aorus 7 KB | |
| Acer Predator Helios 300 PH315-53-77N5 (Extrem) | |
| Moyenne NVIDIA GeForce RTX 2060 Mobile (54 - 86, n=22) | |
| Acer Predator Helios 300 PH315-53-77N5 | |
| Dell G5 15 SE 5505 P89F | |
| MSI Bravo 15 A4DCR | |
| 1280x720 Lowest Preset | |
| Dell G5 15 SE 5505 P89F | |
| Aorus 7 KB | |
| Moyenne NVIDIA GeForce RTX 2060 Mobile (88 - 133, n=19) | |
| Acer Predator Helios 300 PH317-54-75G8 | |
| MSI Bravo 15 A4DCR | |
| Acer Predator Helios 300 PH315-53-77N5 | |
| Serious Sam 4 - 1920x1080 Ultra (DX12) AA:2xMS | |
| Acer Predator Helios 300 PH315-53-77N5 (Extrem) | |
| Acer Predator Helios 300 PH317-54-75G8 | |
| Aorus 7 KB | |
| Moyenne NVIDIA GeForce RTX 2060 Mobile (50.3 - 63.3, n=6) | |
| Acer Predator Helios 300 PH315-53-77N5 | |
| Horizon Zero Dawn - 1920x1080 Ultimate Quality | |
| Acer Predator Helios 300 PH317-54-75G8 | |
| Acer Predator Helios 300 PH315-53-77N5 (Extrem) | |
| Moyenne NVIDIA GeForce RTX 2060 Mobile (54 - 67, n=6) | |
| Acer Predator Helios 300 PH315-53-77N5 | |
| Aorus 7 KB | |
| HP Pavilion Gaming 15-ec1177ng | |
| Mafia Definitive Edition - 1920x1080 High Preset | |
| Aorus 7 KB | |
| Moyenne NVIDIA GeForce RTX 2060 Mobile (60.2 - 76.1, n=4) | |
| Acer Predator Helios 300 PH317-54-75G8 | |
| Acer Predator Helios 300 PH315-53-77N5 | |
| Star Wars Squadrons - 1920x1080 Ultra Preset | |
| Moyenne NVIDIA GeForce RTX 2060 Mobile (156.2 - 181, n=3) | |
| Acer Predator Helios 300 PH317-54-75G8 | |
| Acer Predator Helios 300 PH315-53-77N5 | |
| Bas | Moyen | Élevé | Ultra | |
|---|---|---|---|---|
| BioShock Infinite (2013) | 307.3 | 270.5 | 249.6 | 130.9 |
| The Witcher 3 (2015) | 226.4 | 172.4 | 110.7 | 64.8 |
| Shadow of the Tomb Raider (2018) | 88 | 80 | 76 | 71 |
| Doom Eternal (2020) | 171 | 126.9 | 117.9 | 114 |
| Gears Tactics (2020) | 201.6 | 128.5 | 93.4 | 66.5 |
| Horizon Zero Dawn (2020) | 106 | 72 | 67 | 57 |
| Serious Sam 4 (2020) | 113 | 75.7 | 69.9 | 56.6 |
| Mafia Definitive Edition (2020) | 94.3 | 62.5 | 60.2 | |
| Star Wars Squadrons (2020) | 262.1 | 184.5 | 172.8 | 156.2 |
Degré de la nuisance sonore
| Au repos |
| 25.2 / 25.2 / 25.2 dB(A) |
| Fortement sollicité |
| 43.5 / 56 dB(A) |
 | ||
30 dB silencieux 40 dB(A) audible 50 dB(A) bruyant |
||
min: | ||
| Acer Predator Helios 300 PH315-53-77N5 i7-10750H, GeForce RTX 2060 Mobile | Acer Predator Helios 300 PH315-52-79TY i7-9750H, GeForce GTX 1660 Ti Mobile | Dell G5 15 SE 5505 P89F R7 4800H, Radeon RX 5600M | Aorus 5 KB i7-10750H, GeForce RTX 2060 Mobile | Schenker XMG Core 15 GK5NR0O R7 4800H, GeForce RTX 2060 Mobile | Asus TUF Gaming A15 FA506IV-HN172 R7 4800H, GeForce RTX 2060 Mobile | Moyenne NVIDIA GeForce RTX 2060 Mobile | Moyenne de la classe Gaming | |
|---|---|---|---|---|---|---|---|---|
| Noise | -8% | 1% | -11% | -4% | -7% | -12% | -4% | |
| arrêt / environnement * (dB) | 25.2 | 30.2 -20% | 28 -11% | 25 1% | 25 1% | 30.2 -20% | 27.9 ? -11% | 24.1 ? 4% |
| Idle Minimum * (dB) | 25.2 | 31 -23% | 28 -11% | 26 -3% | 26 -3% | 30.2 -20% | 29 ? -15% | 25.8 ? -2% |
| Idle Average * (dB) | 25.2 | 31 -23% | 28 -11% | 30 -19% | 30 -19% | 30.2 -20% | 30 ? -19% | 27.4 ? -9% |
| Idle Maximum * (dB) | 25.2 | 31 -23% | 28 -11% | 34 -35% | 32 -27% | 30.2 -20% | 33 ? -31% | 30 ? -19% |
| Load Average * (dB) | 43.5 | 41.5 5% | 28 36% | 53 -22% | 46 -6% | 40 8% | 44 ? -1% | 43 ? 1% |
| Witcher 3 ultra * (dB) | 53.1 | 46.7 12% | 50.6 5% | 51 4% | 48 10% | 49 8% | ||
| Load Maximum * (dB) | 56 | 46.9 16% | 50.6 10% | 56 -0% | 48 14% | 49 12% | 51.6 ? 8% | 54 ? 4% |
* ... Moindre est la valeur, meilleures sont les performances
(±) La température maximale du côté supérieur est de 44.1 °C / 111 F, par rapport à la moyenne de 40.4 °C / 105 F, allant de 21.2 à 68.8 °C pour la classe Gaming.
(-) Le fond chauffe jusqu'à un maximum de 48 °C / 118 F, contre une moyenne de 43.2 °C / 110 F
(+) En utilisation inactive, la température moyenne du côté supérieur est de 24.1 °C / 75 F, par rapport à la moyenne du dispositif de 33.9 °C / 93 F.
(±) En jouant à The Witcher 3, la température moyenne du côté supérieur est de 33.9 °C / 93 F, alors que la moyenne de l'appareil est de 33.9 °C / 93 F.
(+) Les repose-poignets et le pavé tactile sont plus froids que la température de la peau avec un maximum de 31.9 °C / 89.4 F et sont donc froids au toucher.
(-) La température moyenne de la zone de l'appui-paume de dispositifs similaires était de 28.8 °C / 83.8 F (-3.1 °C / #-5.6 F).
| Acer Predator Helios 300 PH315-53-77N5 i7-10750H, GeForce RTX 2060 Mobile | Acer Predator Helios 300 PH315-52-79TY i7-9750H, GeForce GTX 1660 Ti Mobile | Dell G5 15 SE 5505 P89F R7 4800H, Radeon RX 5600M | Aorus 5 KB i7-10750H, GeForce RTX 2060 Mobile | Schenker XMG Core 15 GK5NR0O R7 4800H, GeForce RTX 2060 Mobile | Asus TUF Gaming A15 FA506IV-HN172 R7 4800H, GeForce RTX 2060 Mobile | Moyenne NVIDIA GeForce RTX 2060 Mobile | Moyenne de la classe Gaming | |
|---|---|---|---|---|---|---|---|---|
| Heat | -3% | -18% | -19% | -22% | -4% | -17% | -15% | |
| Maximum Upper Side * (°C) | 44.1 | 52 -18% | 53 -20% | 50 -13% | 51 -16% | 42.9 3% | 47.2 ? -7% | 45.2 ? -2% |
| Maximum Bottom * (°C) | 48 | 46.3 4% | 57.6 -20% | 49 -2% | 64 -33% | 49.9 -4% | 52.7 ? -10% | 48 ? -0% |
| Idle Upper Side * (°C) | 25.2 | 24.8 2% | 27.4 -9% | 35 -39% | 29 -15% | 27.8 -10% | 31 ? -23% | 31.1 ? -23% |
| Idle Bottom * (°C) | 25.7 | 25.4 1% | 31 -21% | 31 -21% | 32 -25% | 27 -5% | 32.9 ? -28% | 34.2 ? -33% |
* ... Moindre est la valeur, meilleures sont les performances
Acer Predator Helios 300 PH315-53-77N5 analyse audio
(±) | le niveau sonore du haut-parleur est moyen mais bon (74.4# dB)
Basses 100 - 315 Hz
(-) | presque aucune basse - en moyenne 20.9% plus bas que la médiane
(±) | la linéarité des basses est moyenne (10.1% delta à la fréquence précédente)
Médiums 400 - 2000 Hz
(±) | médiane supérieure - en moyenne 5.7% supérieure à la médiane
(±) | la linéarité des médiums est moyenne (10.3% delta à la fréquence précédente)
Aiguës 2 - 16 kHz
(+) | des sommets équilibrés - à seulement 1.3% de la médiane
(+) | les aigus sont linéaires (4.7% delta à la fréquence précédente)
Globalement 100 - 16 000 Hz
(±) | la linéarité du son global est moyenne (18.2% de différence avec la médiane)
Par rapport à la même classe
» 57% de tous les appareils testés de cette catégorie étaient meilleurs, 8% similaires, 35% pires
» Le meilleur avait un delta de 6%, la moyenne était de 18%, le pire était de 132%.
Par rapport à tous les appareils testés
» 39% de tous les appareils testés étaient meilleurs, 8% similaires, 53% pires
» Le meilleur avait un delta de 4%, la moyenne était de 24%, le pire était de 134%.
| Éteint/en veille | |
| Au repos | |
| Fortement sollicité |
|
Légende:
min: | |
| Acer Predator Helios 300 PH315-53-77N5 i7-10750H, GeForce RTX 2060 Mobile | Acer Predator Helios 300 PH315-52-79TY i7-9750H, GeForce GTX 1660 Ti Mobile | Dell G5 15 SE 5505 P89F R7 4800H, Radeon RX 5600M | Aorus 5 KB i7-10750H, GeForce RTX 2060 Mobile | Schenker XMG Core 15 GK5NR0O R7 4800H, GeForce RTX 2060 Mobile | Asus TUF Gaming A15 FA506IV-HN172 R7 4800H, GeForce RTX 2060 Mobile | Moyenne NVIDIA GeForce RTX 2060 Mobile | Moyenne de la classe Gaming | |
|---|---|---|---|---|---|---|---|---|
| Power Consumption | -115% | -10% | -38% | -54% | -7% | -71% | -94% | |
| Idle Minimum * (Watt) | 2.9 | 17.2 -493% | 6.5 -124% | 8 -176% | 12 -314% | 5.4 -86% | 11.5 ? -297% | 13.2 ? -355% |
| Idle Average * (Watt) | 13.2 | 22.6 -71% | 10.6 20% | 12 9% | 14 -6% | 10 24% | 16.5 ? -25% | 18.9 ? -43% |
| Idle Maximum * (Watt) | 19.8 | 25.5 -29% | 11 44% | 21 -6% | 20 -1% | 10.5 47% | 23.7 ? -20% | 24.3 ? -23% |
| Load Average * (Watt) | 105 | 88 16% | 84.1 20% | 128 -22% | 103 2% | 135 -29% | 107.5 ? -2% | 108 ? -3% |
| Witcher 3 ultra * (Watt) | 127 | 152.9 -20% | 138 -9% | 125 2% | 144 -13% | |||
| Load Maximum * (Watt) | 177 | 177 -0% | 180.4 -2% | 217 -23% | 193 -9% | 147 17% | 199.7 ? -13% | 254 ? -44% |
* ... Moindre est la valeur, meilleures sont les performances
| Acer Predator Helios 300 PH315-53-77N5 i7-10750H, GeForce RTX 2060 Mobile, 58.7 Wh | Acer Predator Helios 300 PH315-52-79TY i7-9750H, GeForce GTX 1660 Ti Mobile, 58.75 Wh | Dell G5 15 SE 5505 P89F R7 4800H, Radeon RX 5600M, 51 Wh | Aorus 5 KB i7-10750H, GeForce RTX 2060 Mobile, 48.96 Wh | Schenker XMG Core 15 GK5NR0O R7 4800H, GeForce RTX 2060 Mobile, 62 Wh | Asus TUF Gaming A15 FA506IV-HN172 R7 4800H, GeForce RTX 2060 Mobile, 48 Wh | Moyenne de la classe Gaming | |
|---|---|---|---|---|---|---|---|
| Autonomie de la batterie | -38% | 8% | -18% | -1% | 7% | 16% | |
| Reader / Idle (h) | 10.4 | 5 -52% | 11.2 8% | 9 -13% | 7.8 -25% | 9.8 -6% | 8.71 ? -16% |
| H.264 (h) | 5.6 | 3.4 -39% | 6.2 11% | 5.4 -4% | 8.26 ? 48% | ||
| WiFi v1.3 (h) | 4.7 | 3.5 -26% | 6.2 32% | 4.8 2% | 5.9 26% | 6.2 32% | 7.02 ? 49% |
| Load (h) | 1.8 | 1.2 -33% | 1.5 -17% | 1 -44% | 1.5 -17% | 1.9 6% | 1.47 ? -18% |
Points positifs
Points négatifs
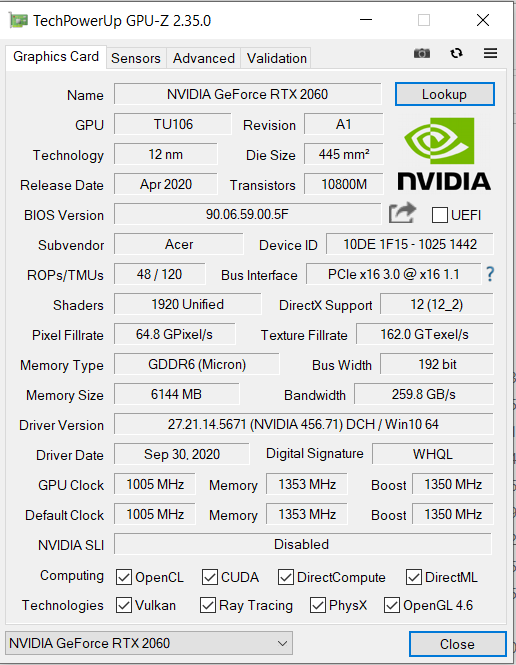
Le PC portable de jeu d'Acer fait tourner tous les jeux récents de façon fluide grâce à son processeur Core i7-10750H et la carte vidéo GeForce RTX 2060. La résolution Full HD et des réglages élevés ou maximaux peuvent être le plus souvent utilisés. Les performances GPU peuvent être améliorées.
L'Acer Predator Helios 300 PH315-53 est un PC portable de jeu équilibré qui en a encore sous le pied.
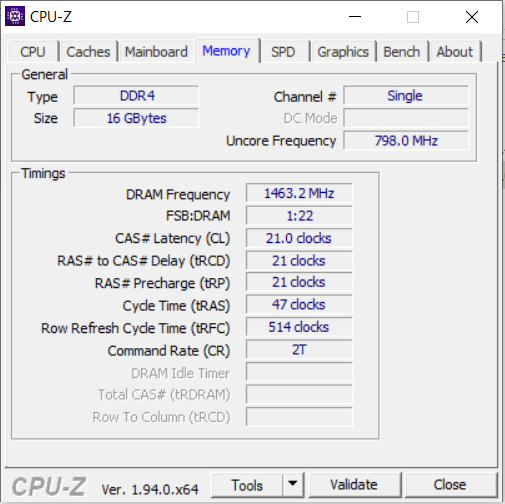
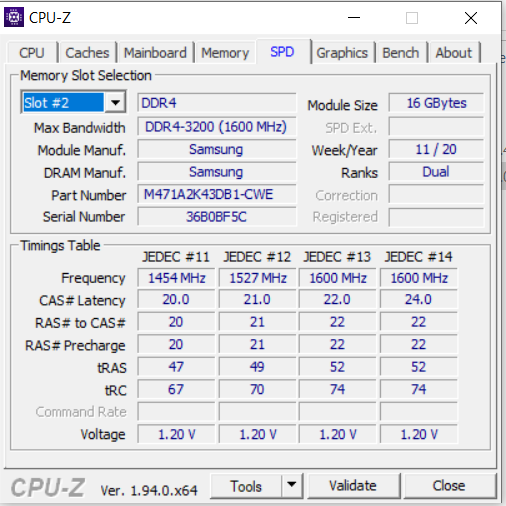
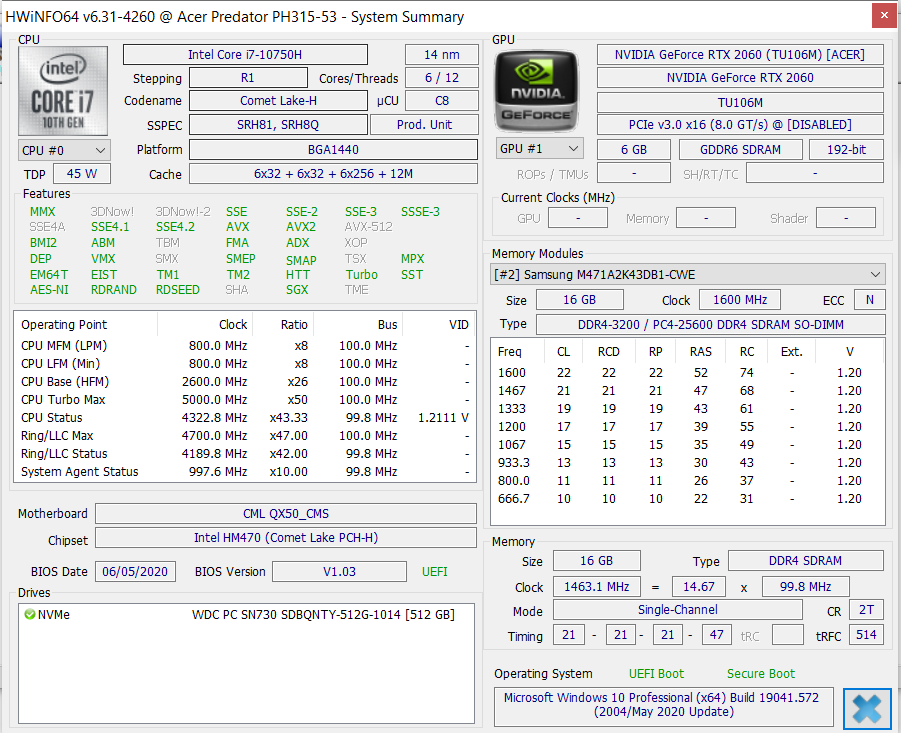
La machine intègre 16 Go de RAM (1 module, mode mono-canal). Le portable peut et doit être mis à jour avec un deuxième module, afin d'activer le mode double canal. Cela permet une légère hausse des performances. La capacité de stockage (512 Go, SSD NVMe) n'est pas très grande pour une machine de jeu. Un deuxième SSD peut être installé - le Predator est compatible RAID 0.
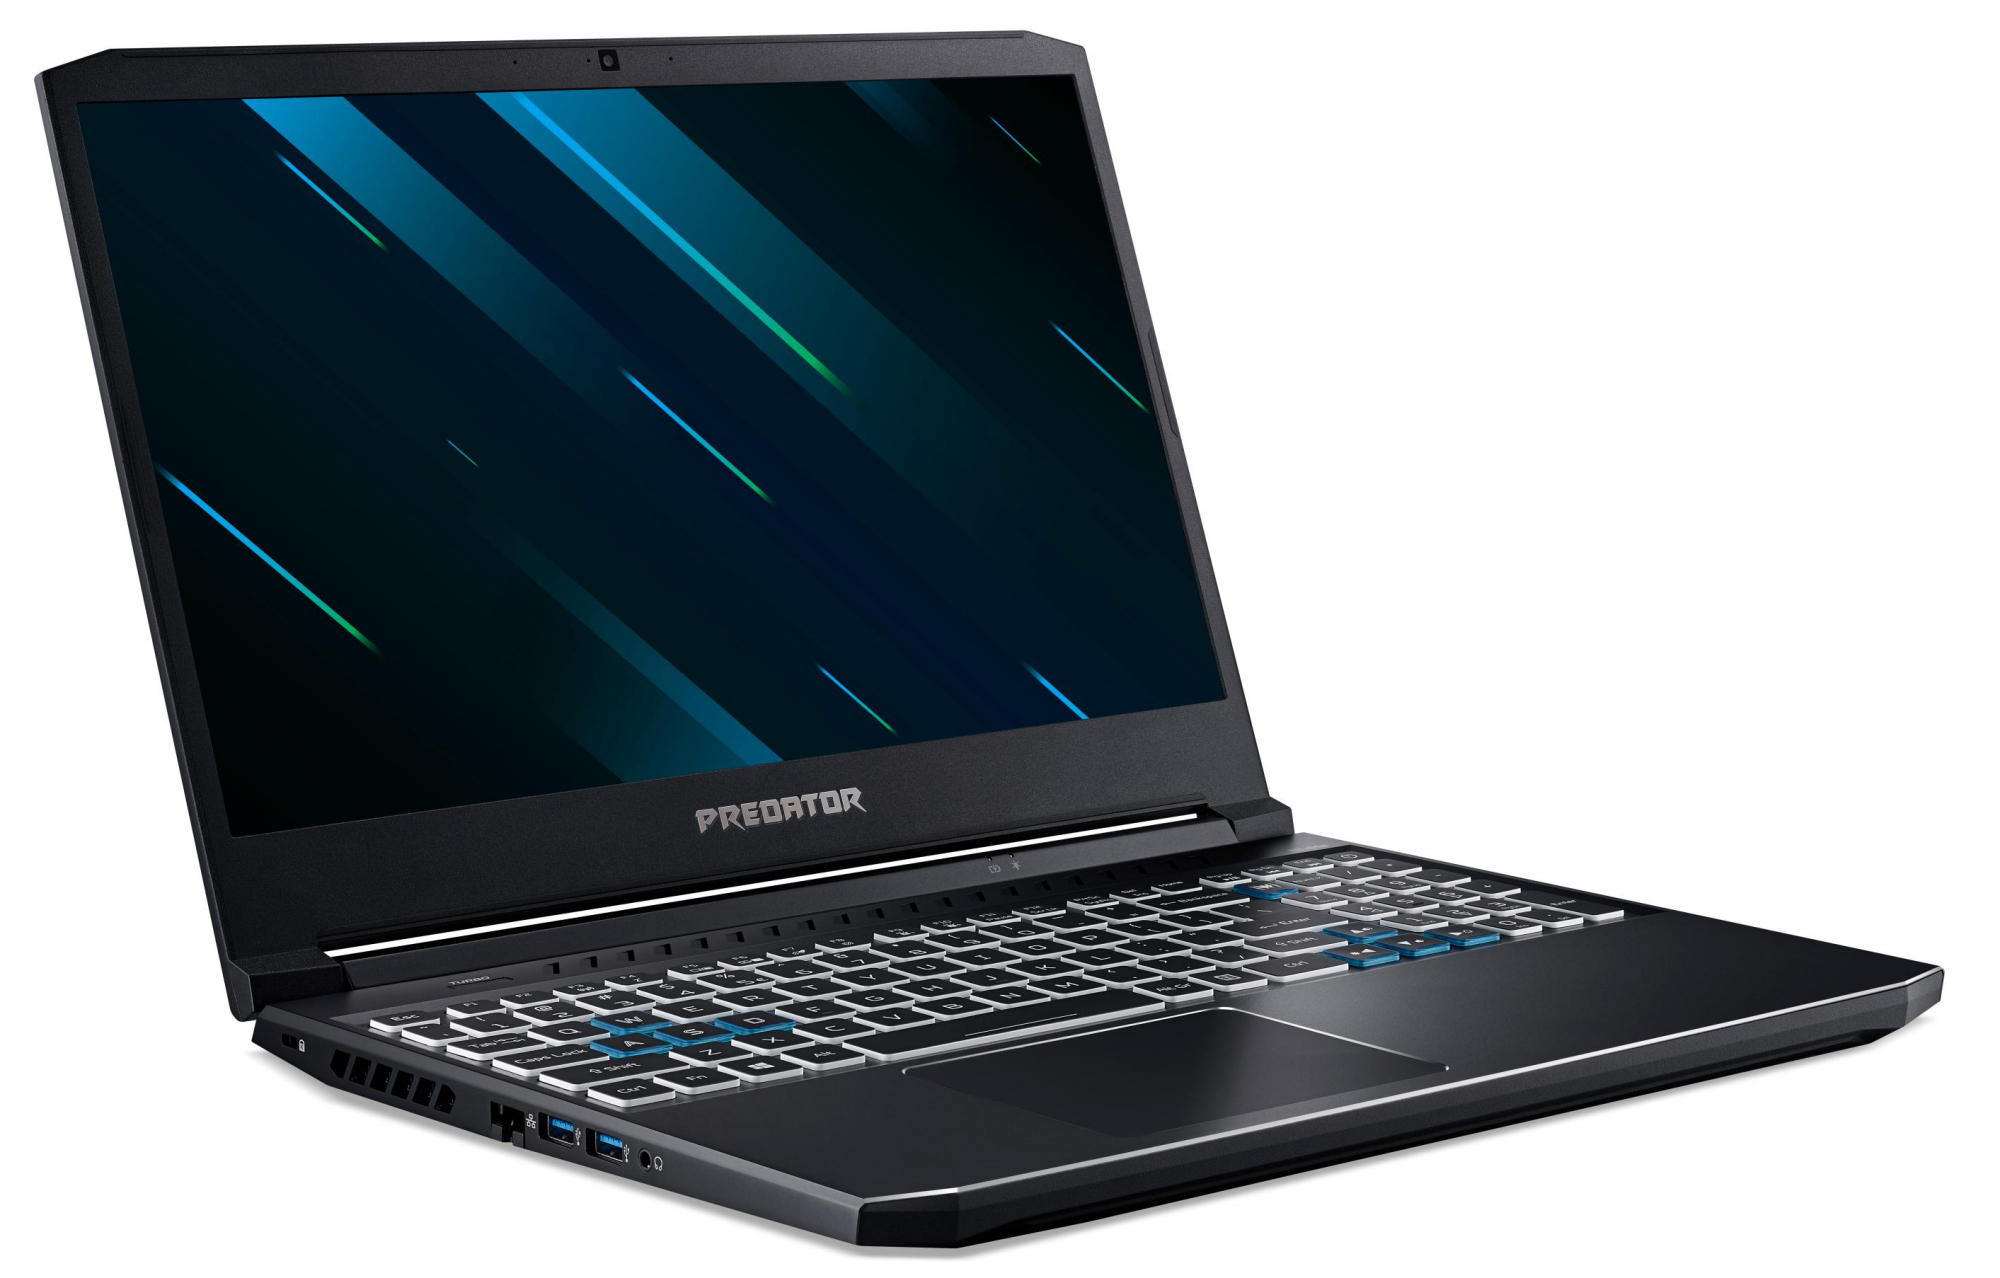
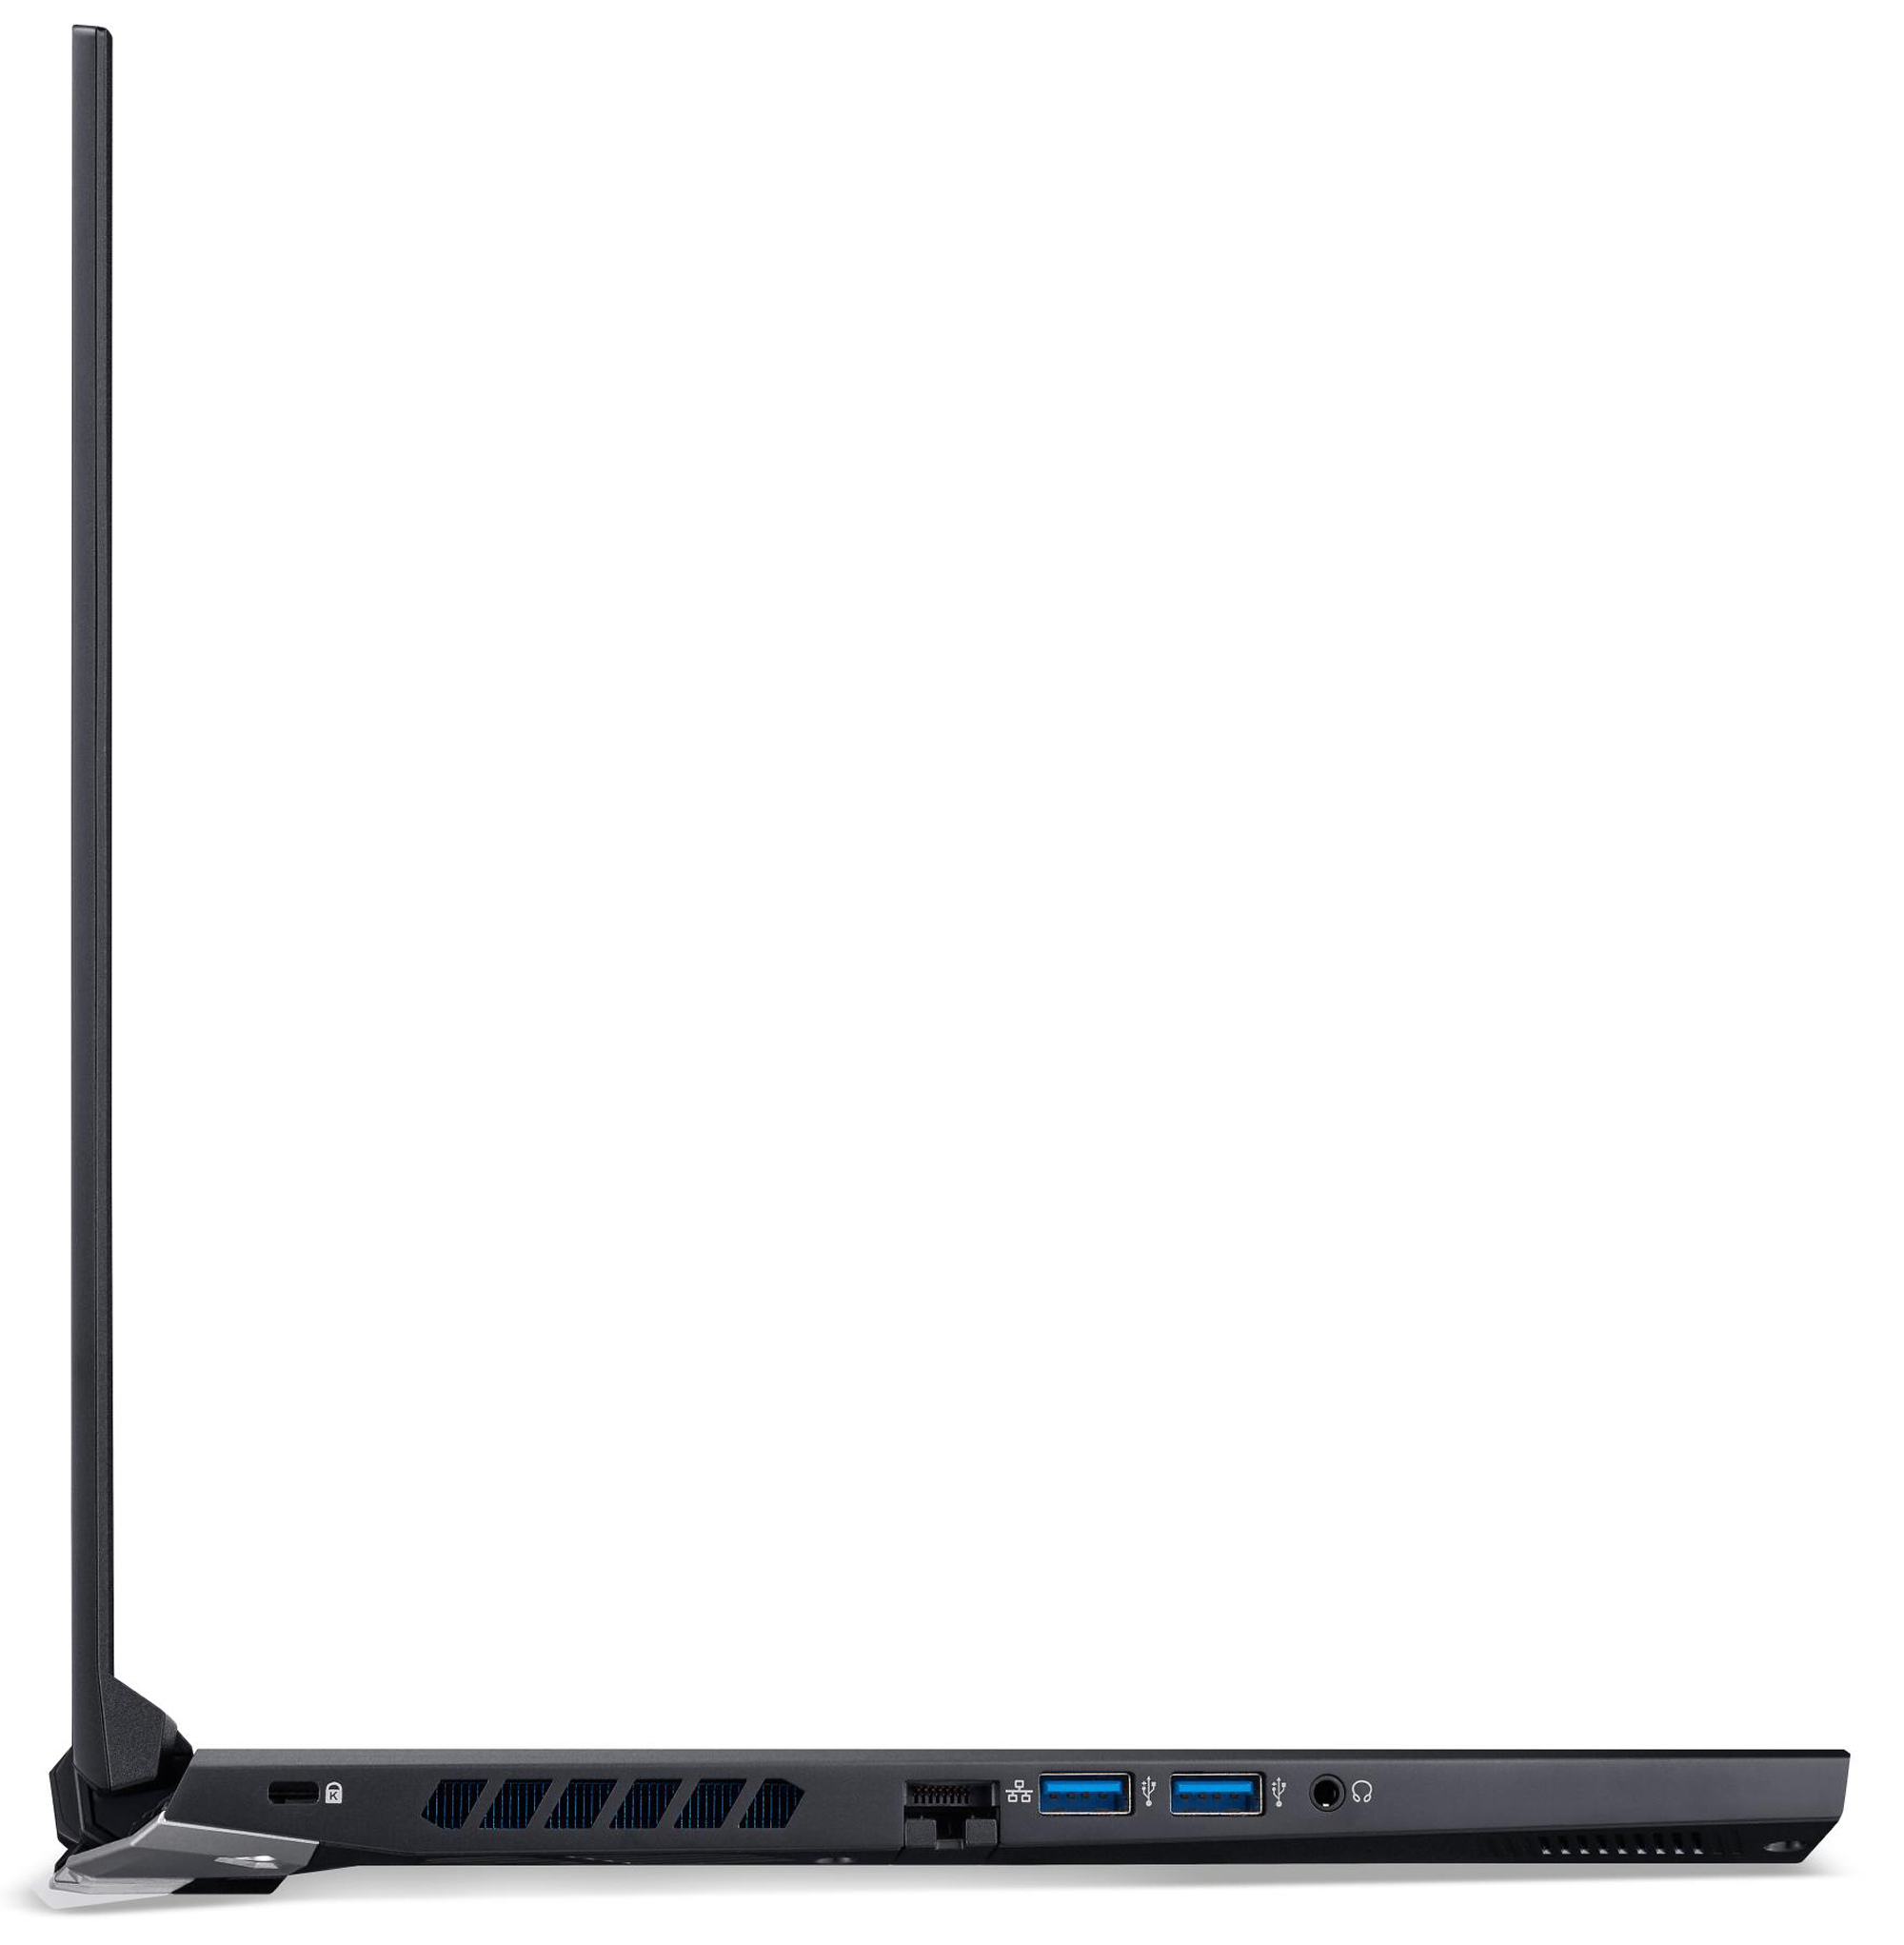
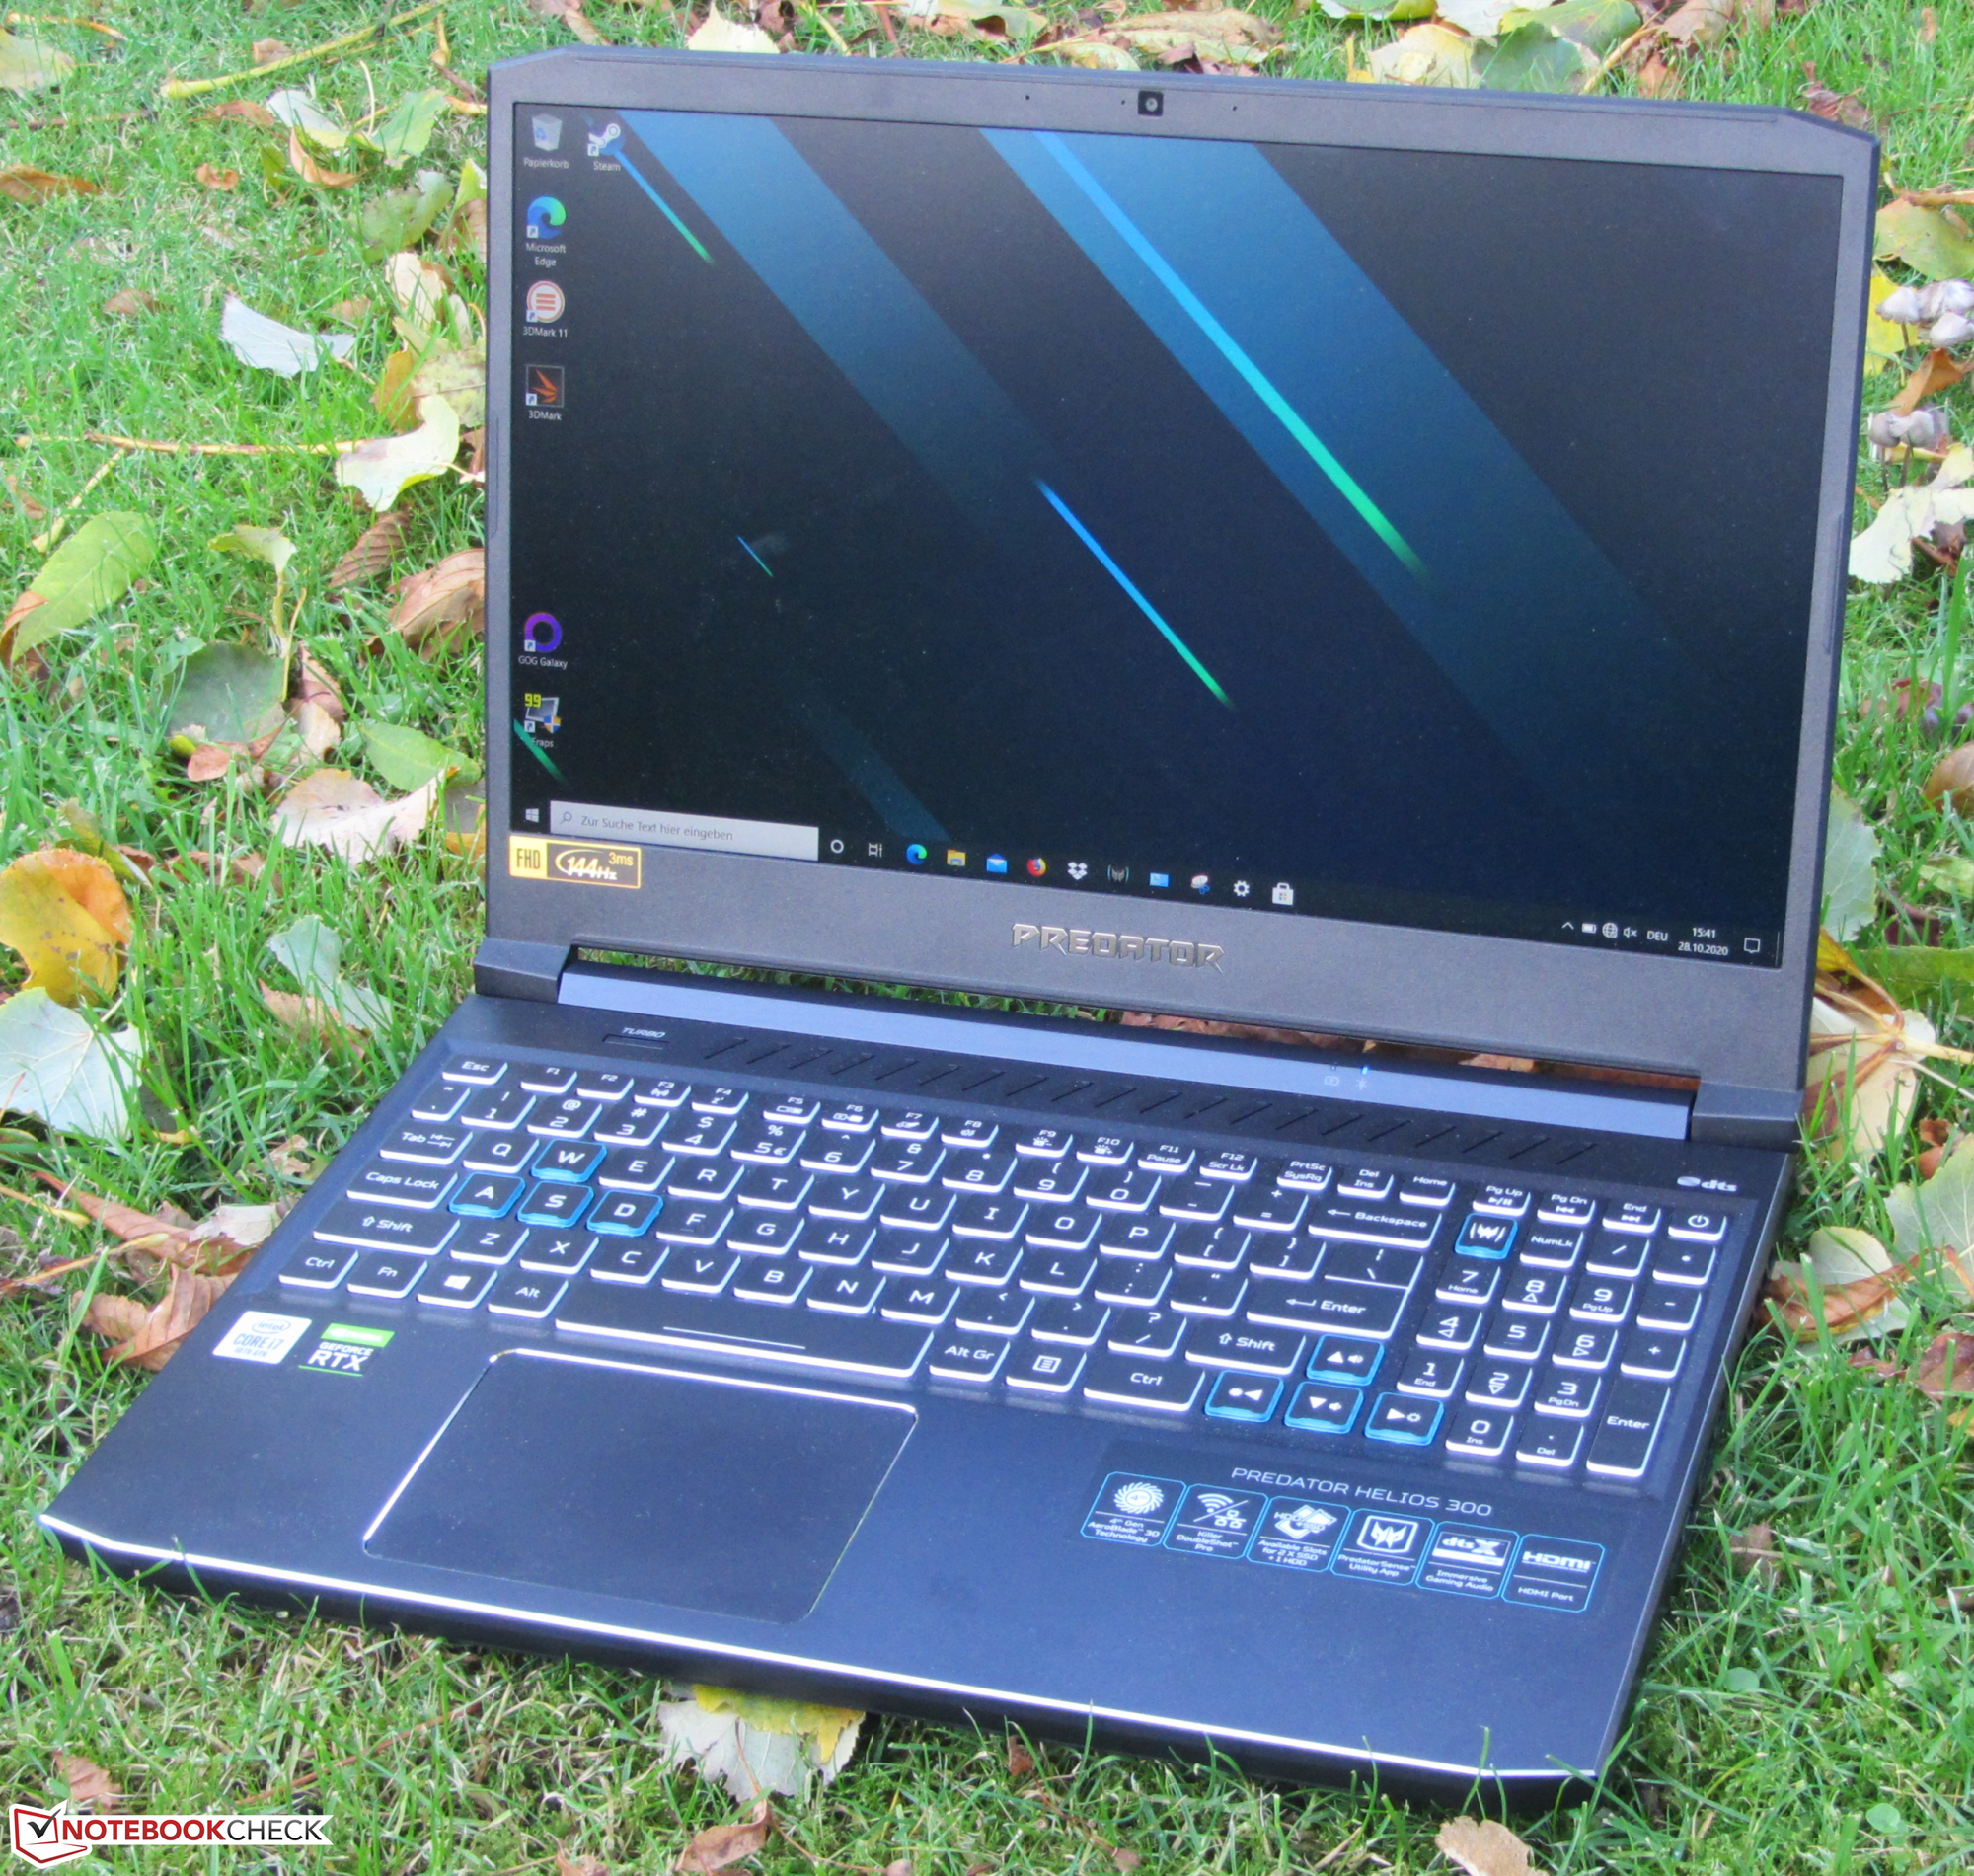
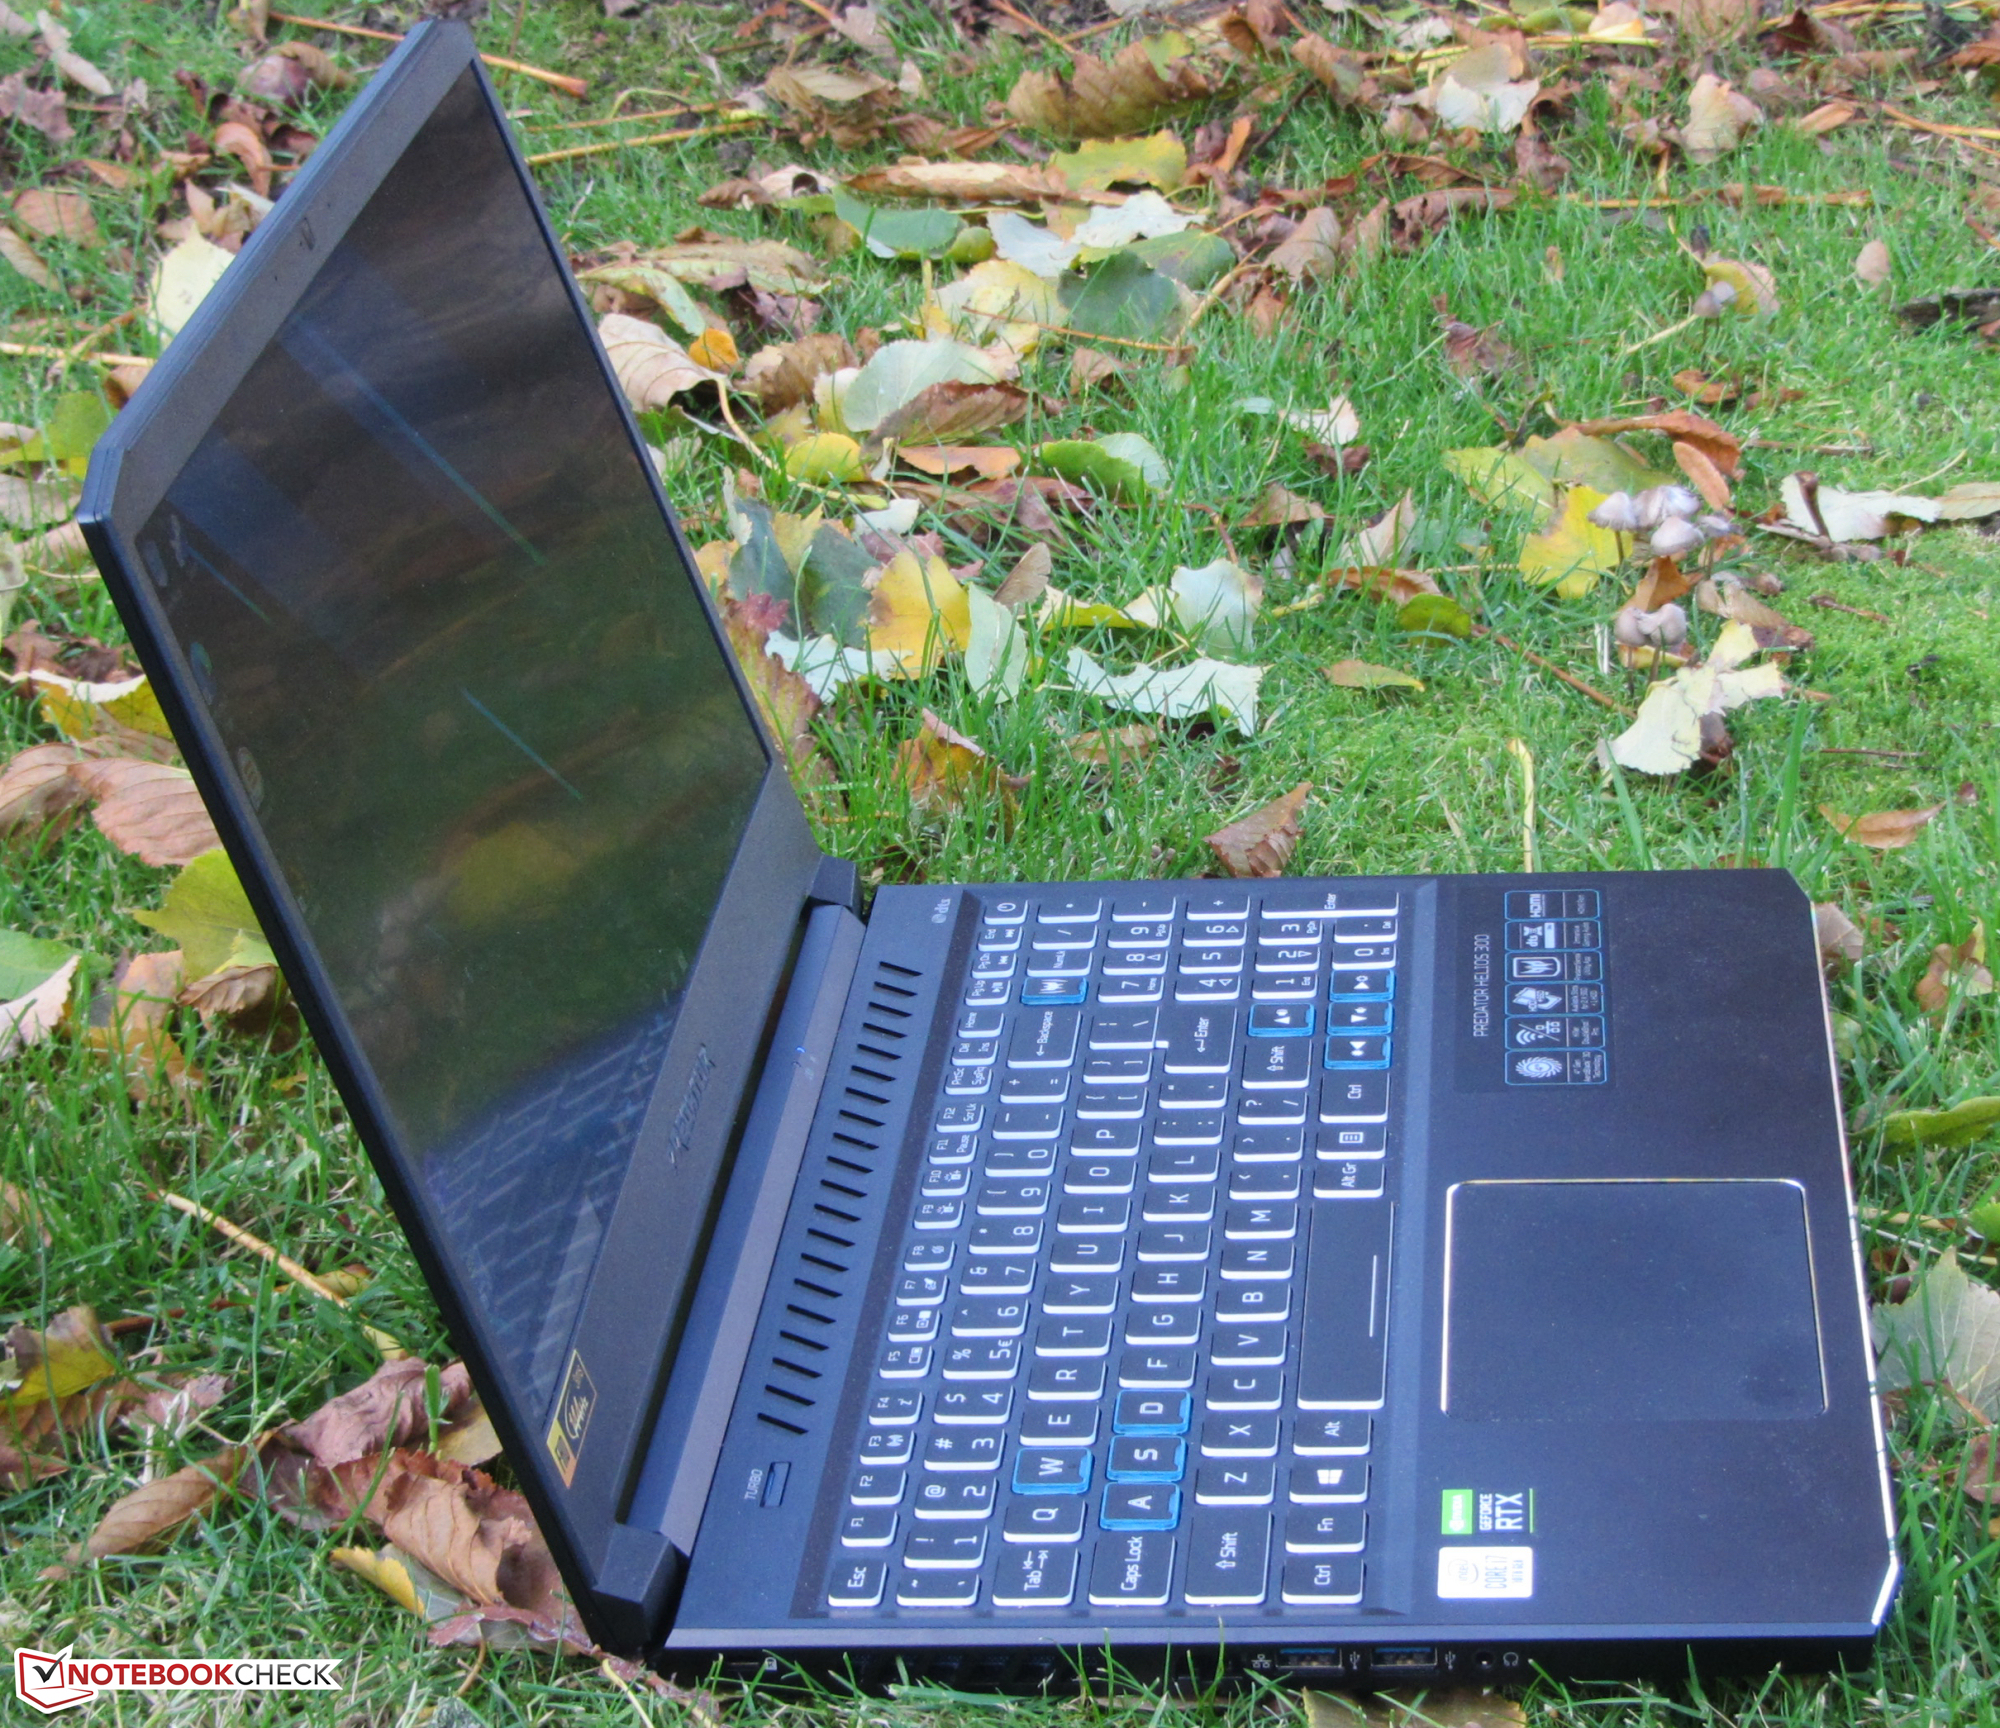
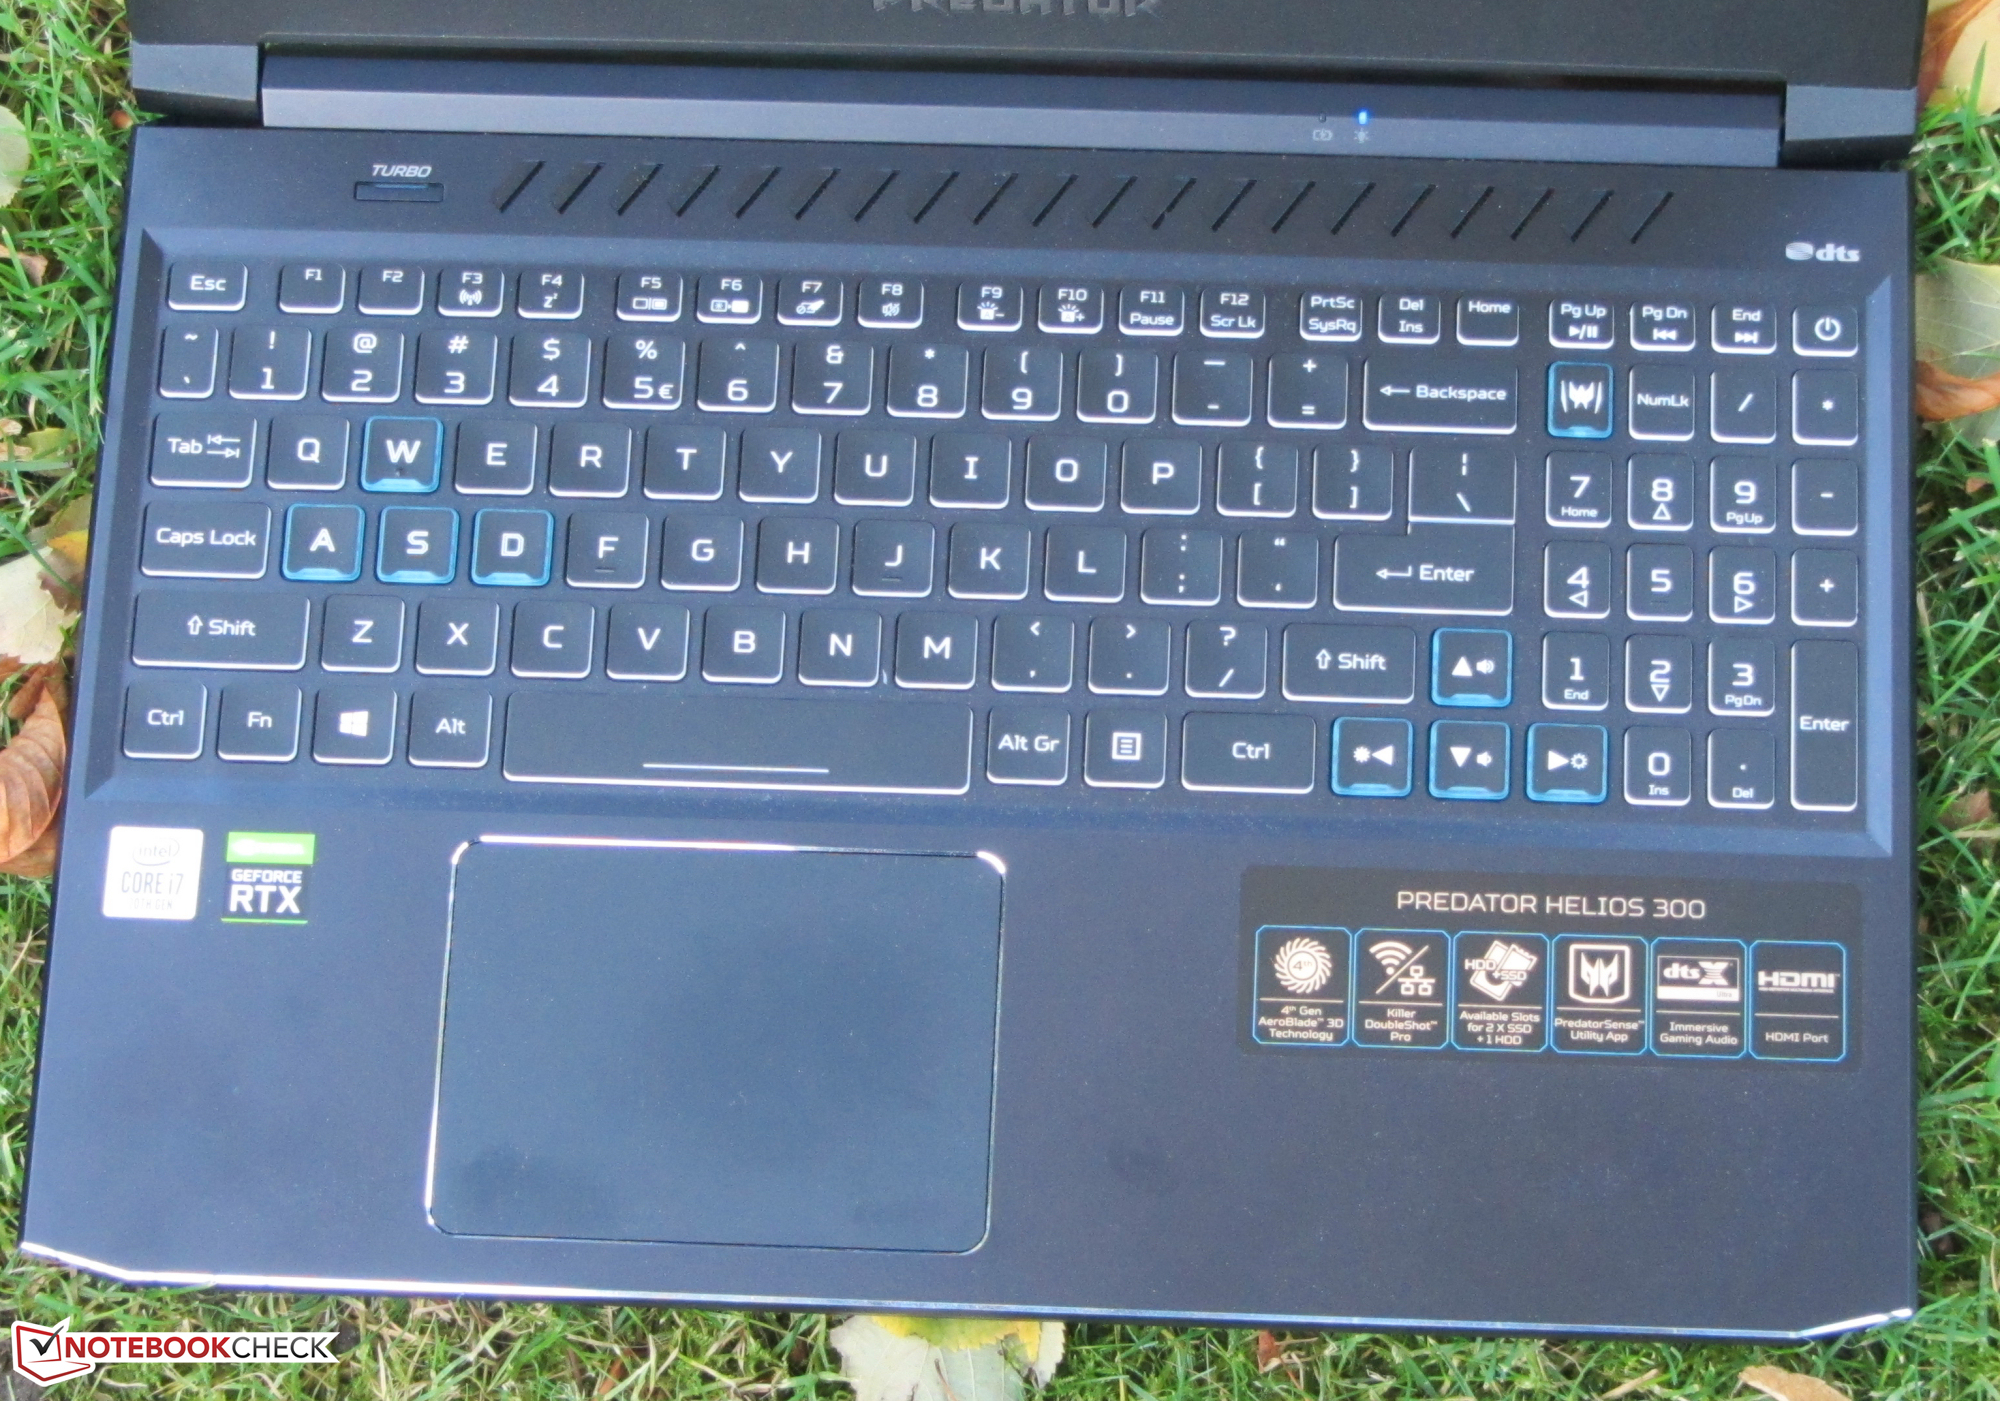
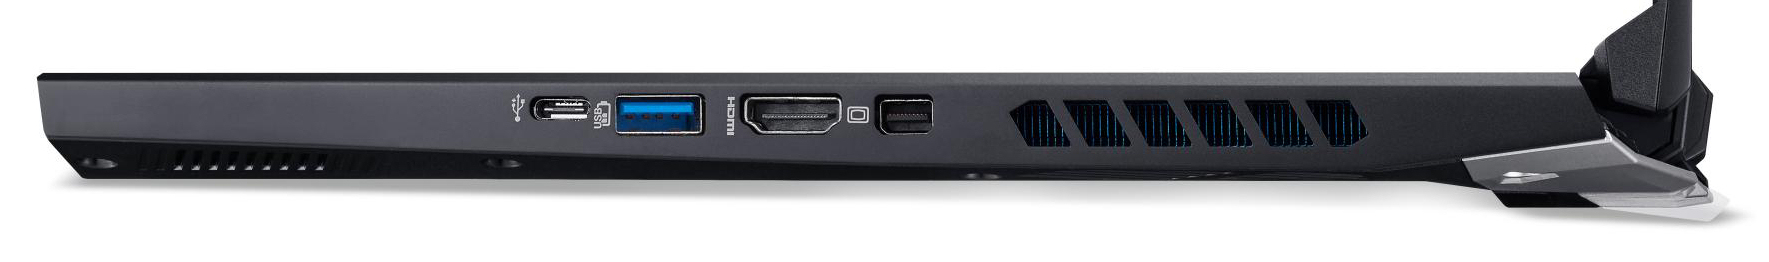
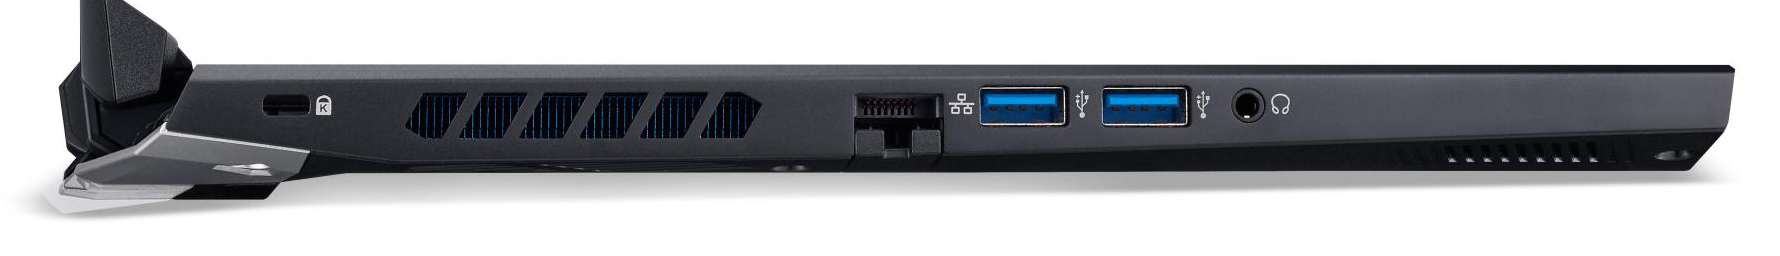
L'écran (Full HD, IPS, 144 Hz) possède des angles de vision larges, une surface matte, un bon contraste, des temps de réponse réduits, et des couleurs fidèles. En revanche la luminosité maximale devrait être plus élevée. Le clavier (rétroéclairé) s'avère adapté à un usage quotidien. L'autonomie est acceptable. De plus, le Helios ne possède pas de port Thunderbolt 3. Il n'y a qu'un USB C 3.2 Gen 2, et n'est compatible ni DisplayPort ni Power Delivery.
Le Predator laisse globalement une bonne impression, mais notre modèle n'est pas équipé de façon optimale au regard de la mémoire et du stockage. Il faudra dépenser un peu plus pour un deuxième module mémoire et un deuxième SSD NVMe. Ceux qui sont vraiment intéressés par le Predator devraient choisir une version mieux équipée.
L’intégralité de cette critique est disponible en anglais en suivant ce lien.
Acer Predator Helios 300 PH315-53-77N5
- 10/30/2020 v7 (old)
Sascha Mölck
Price comparison
