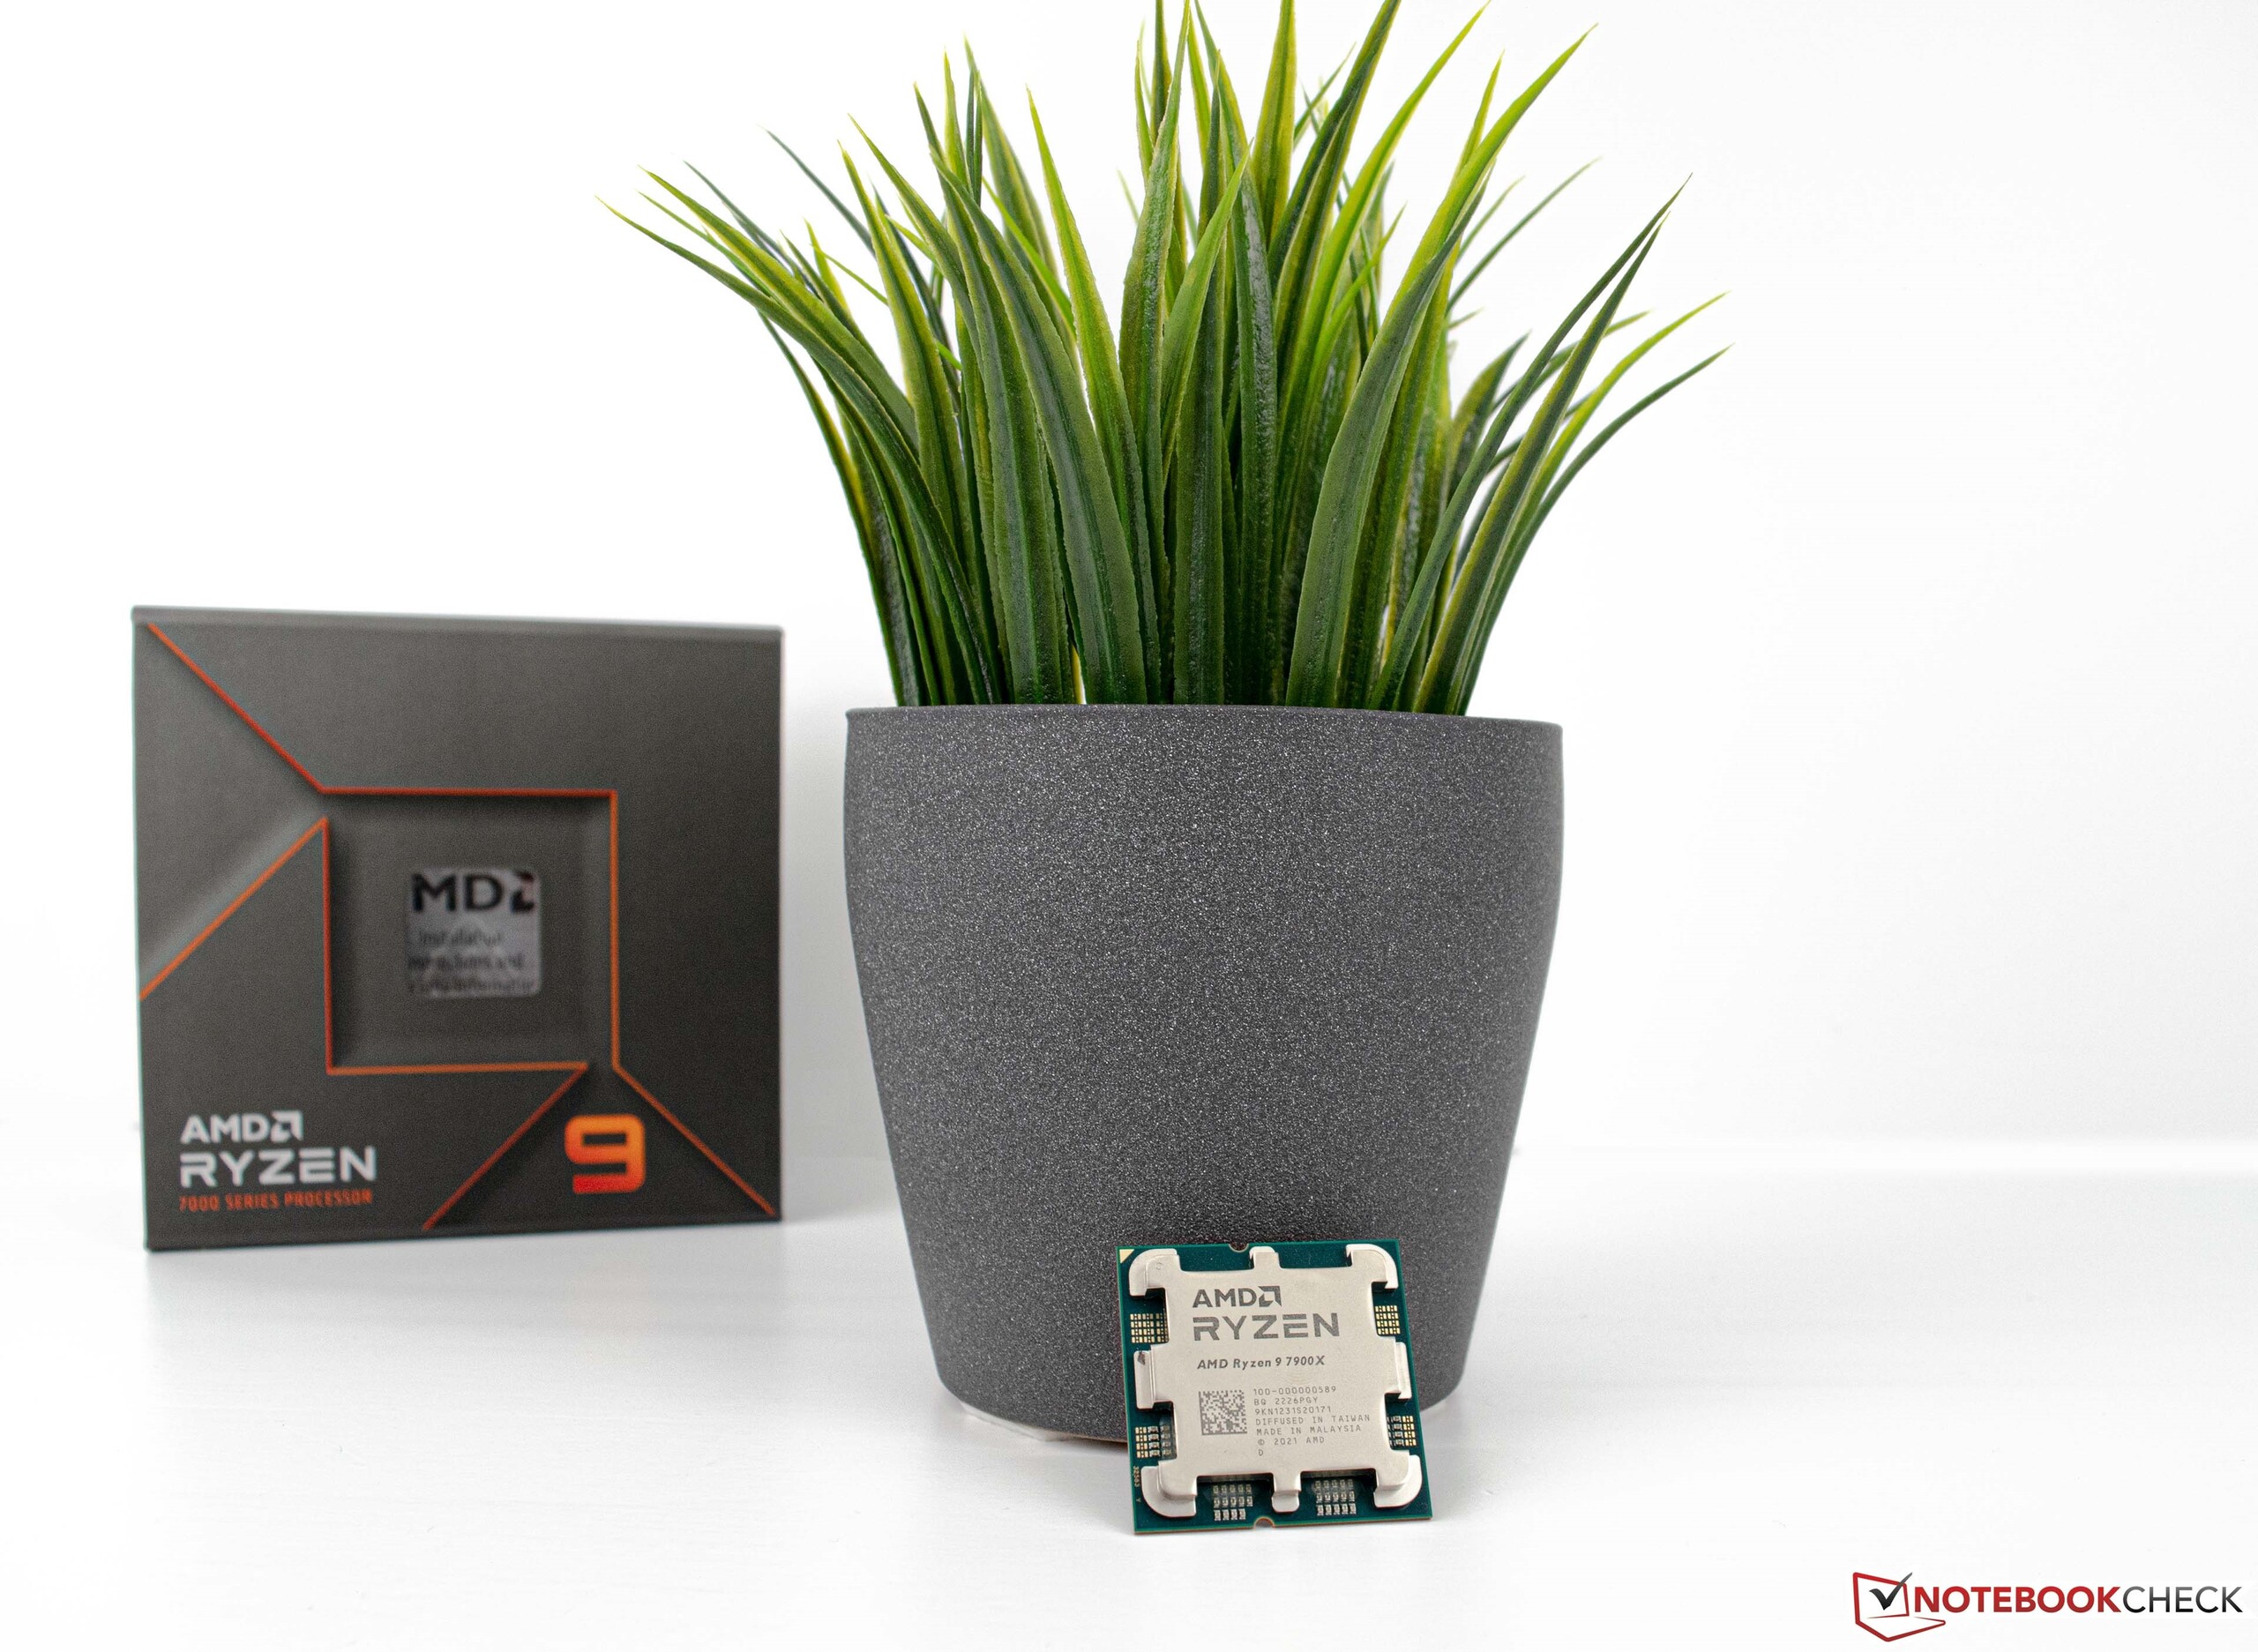
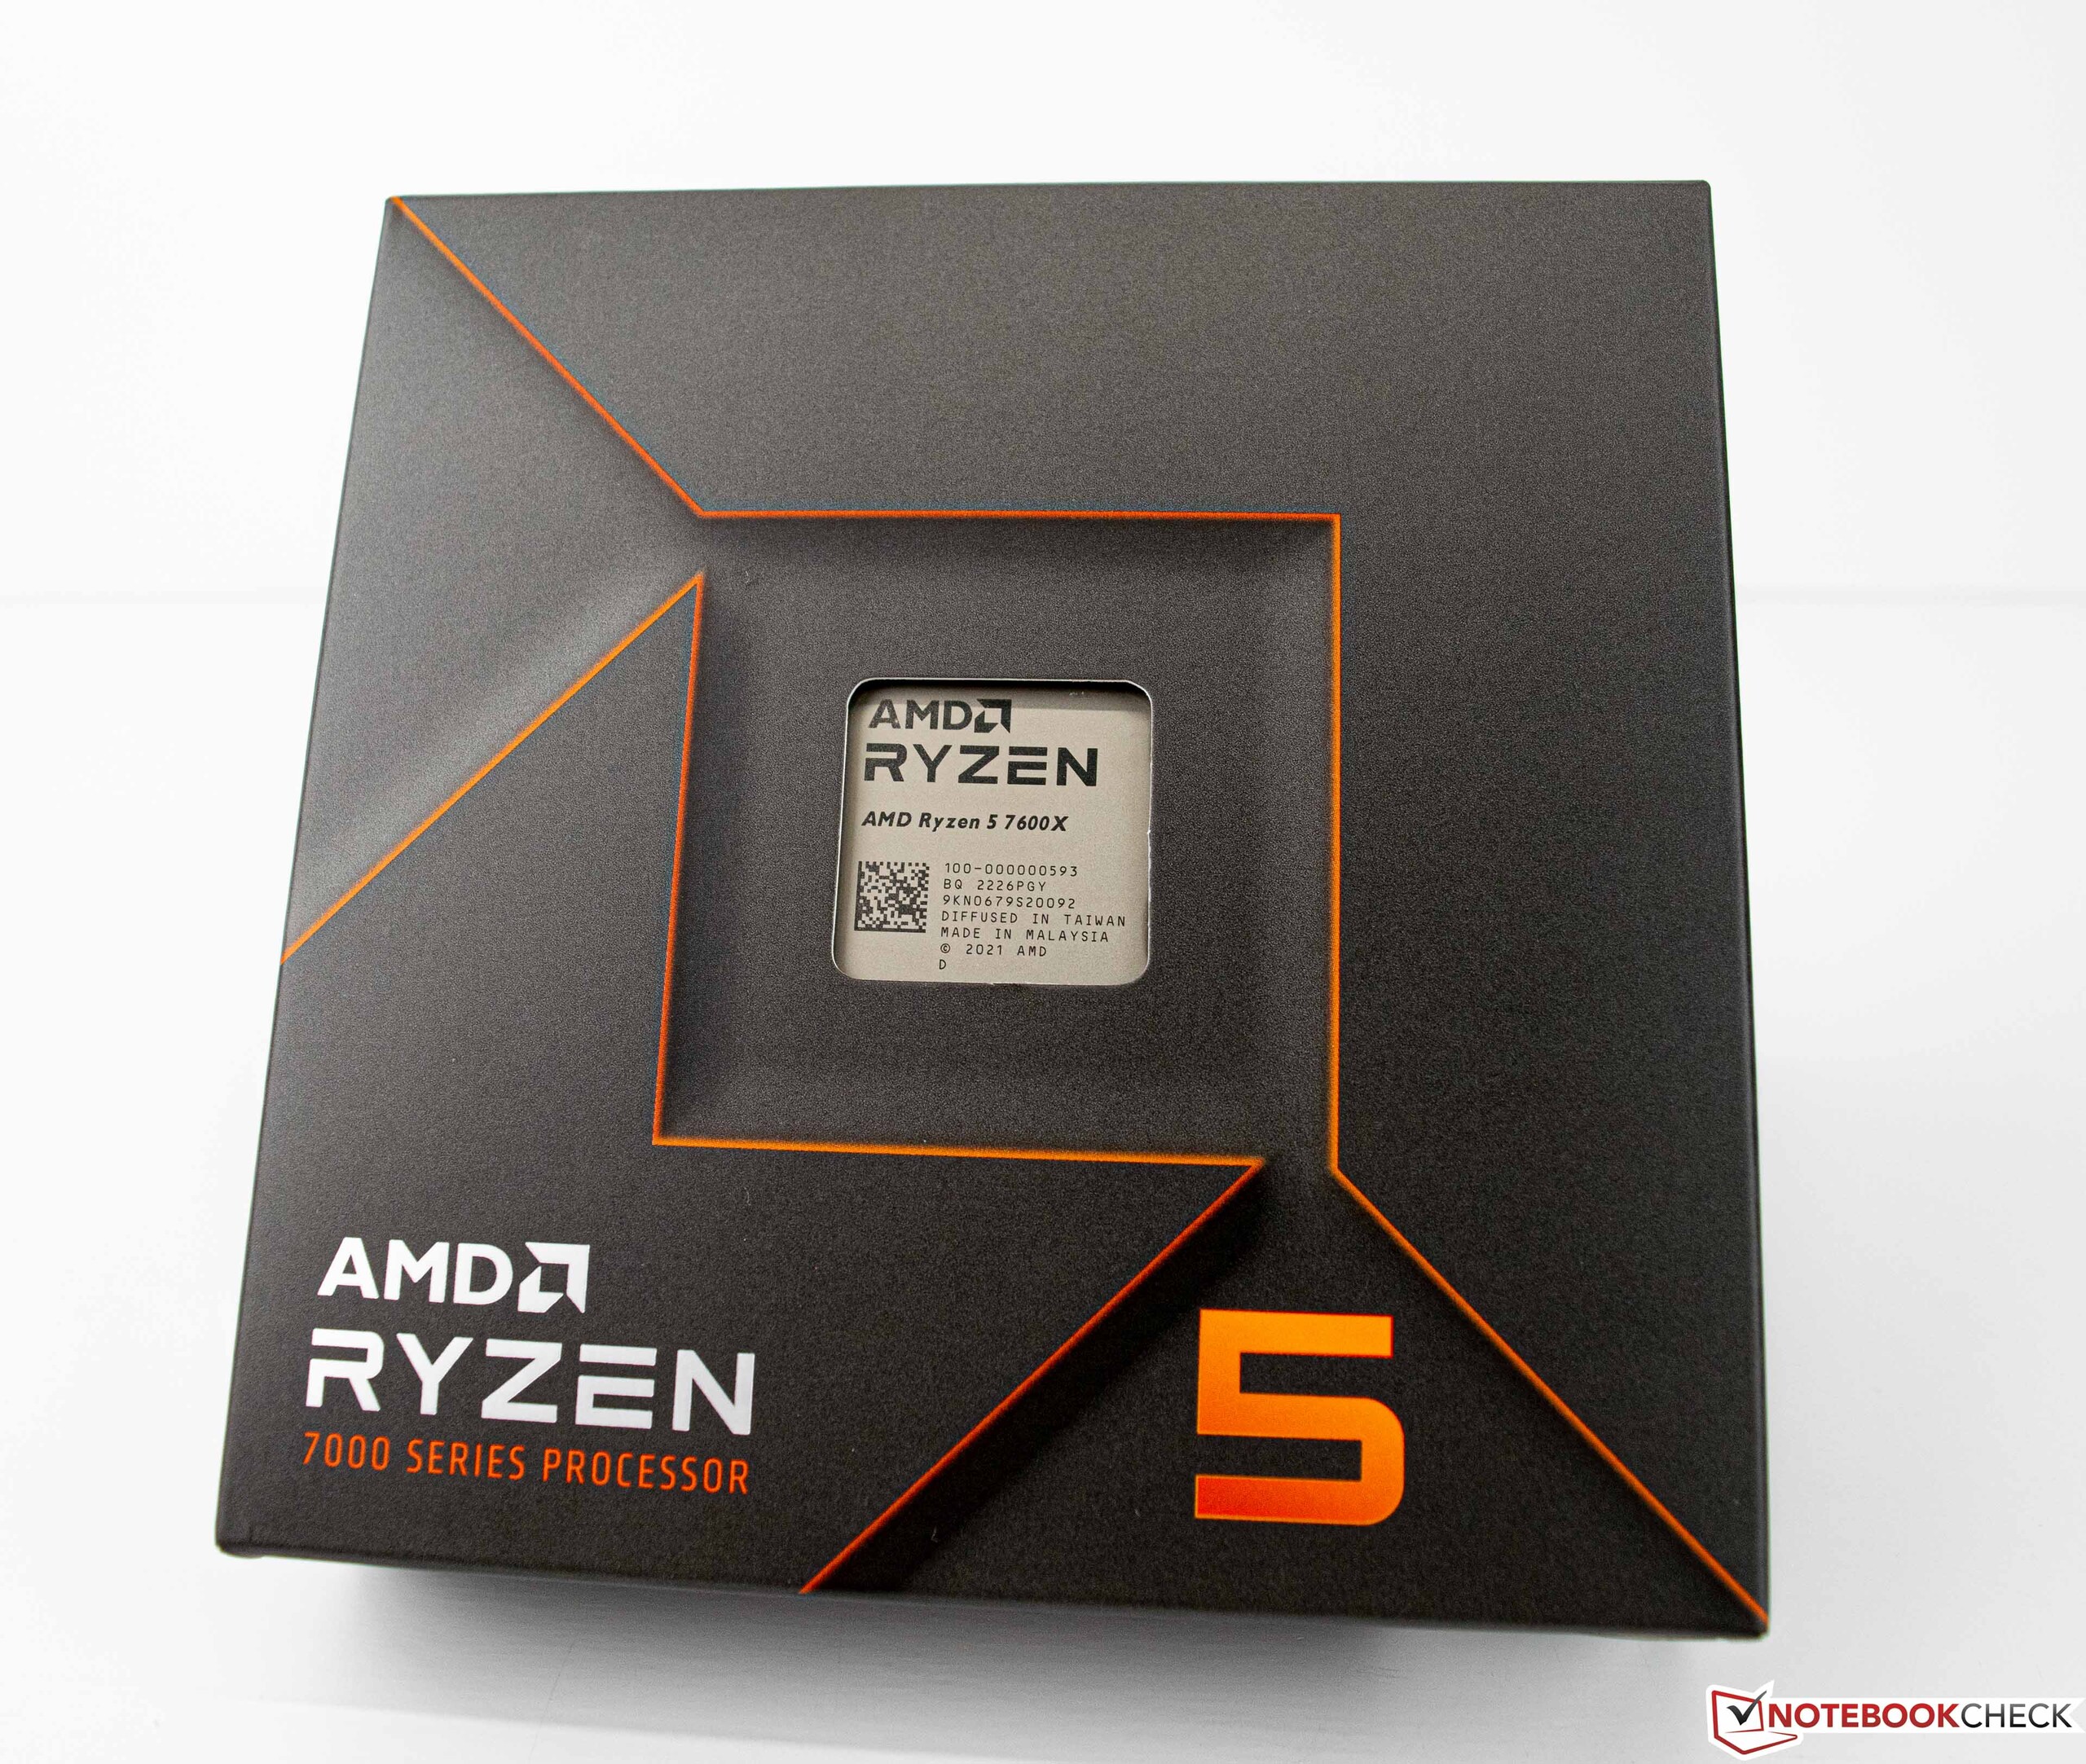
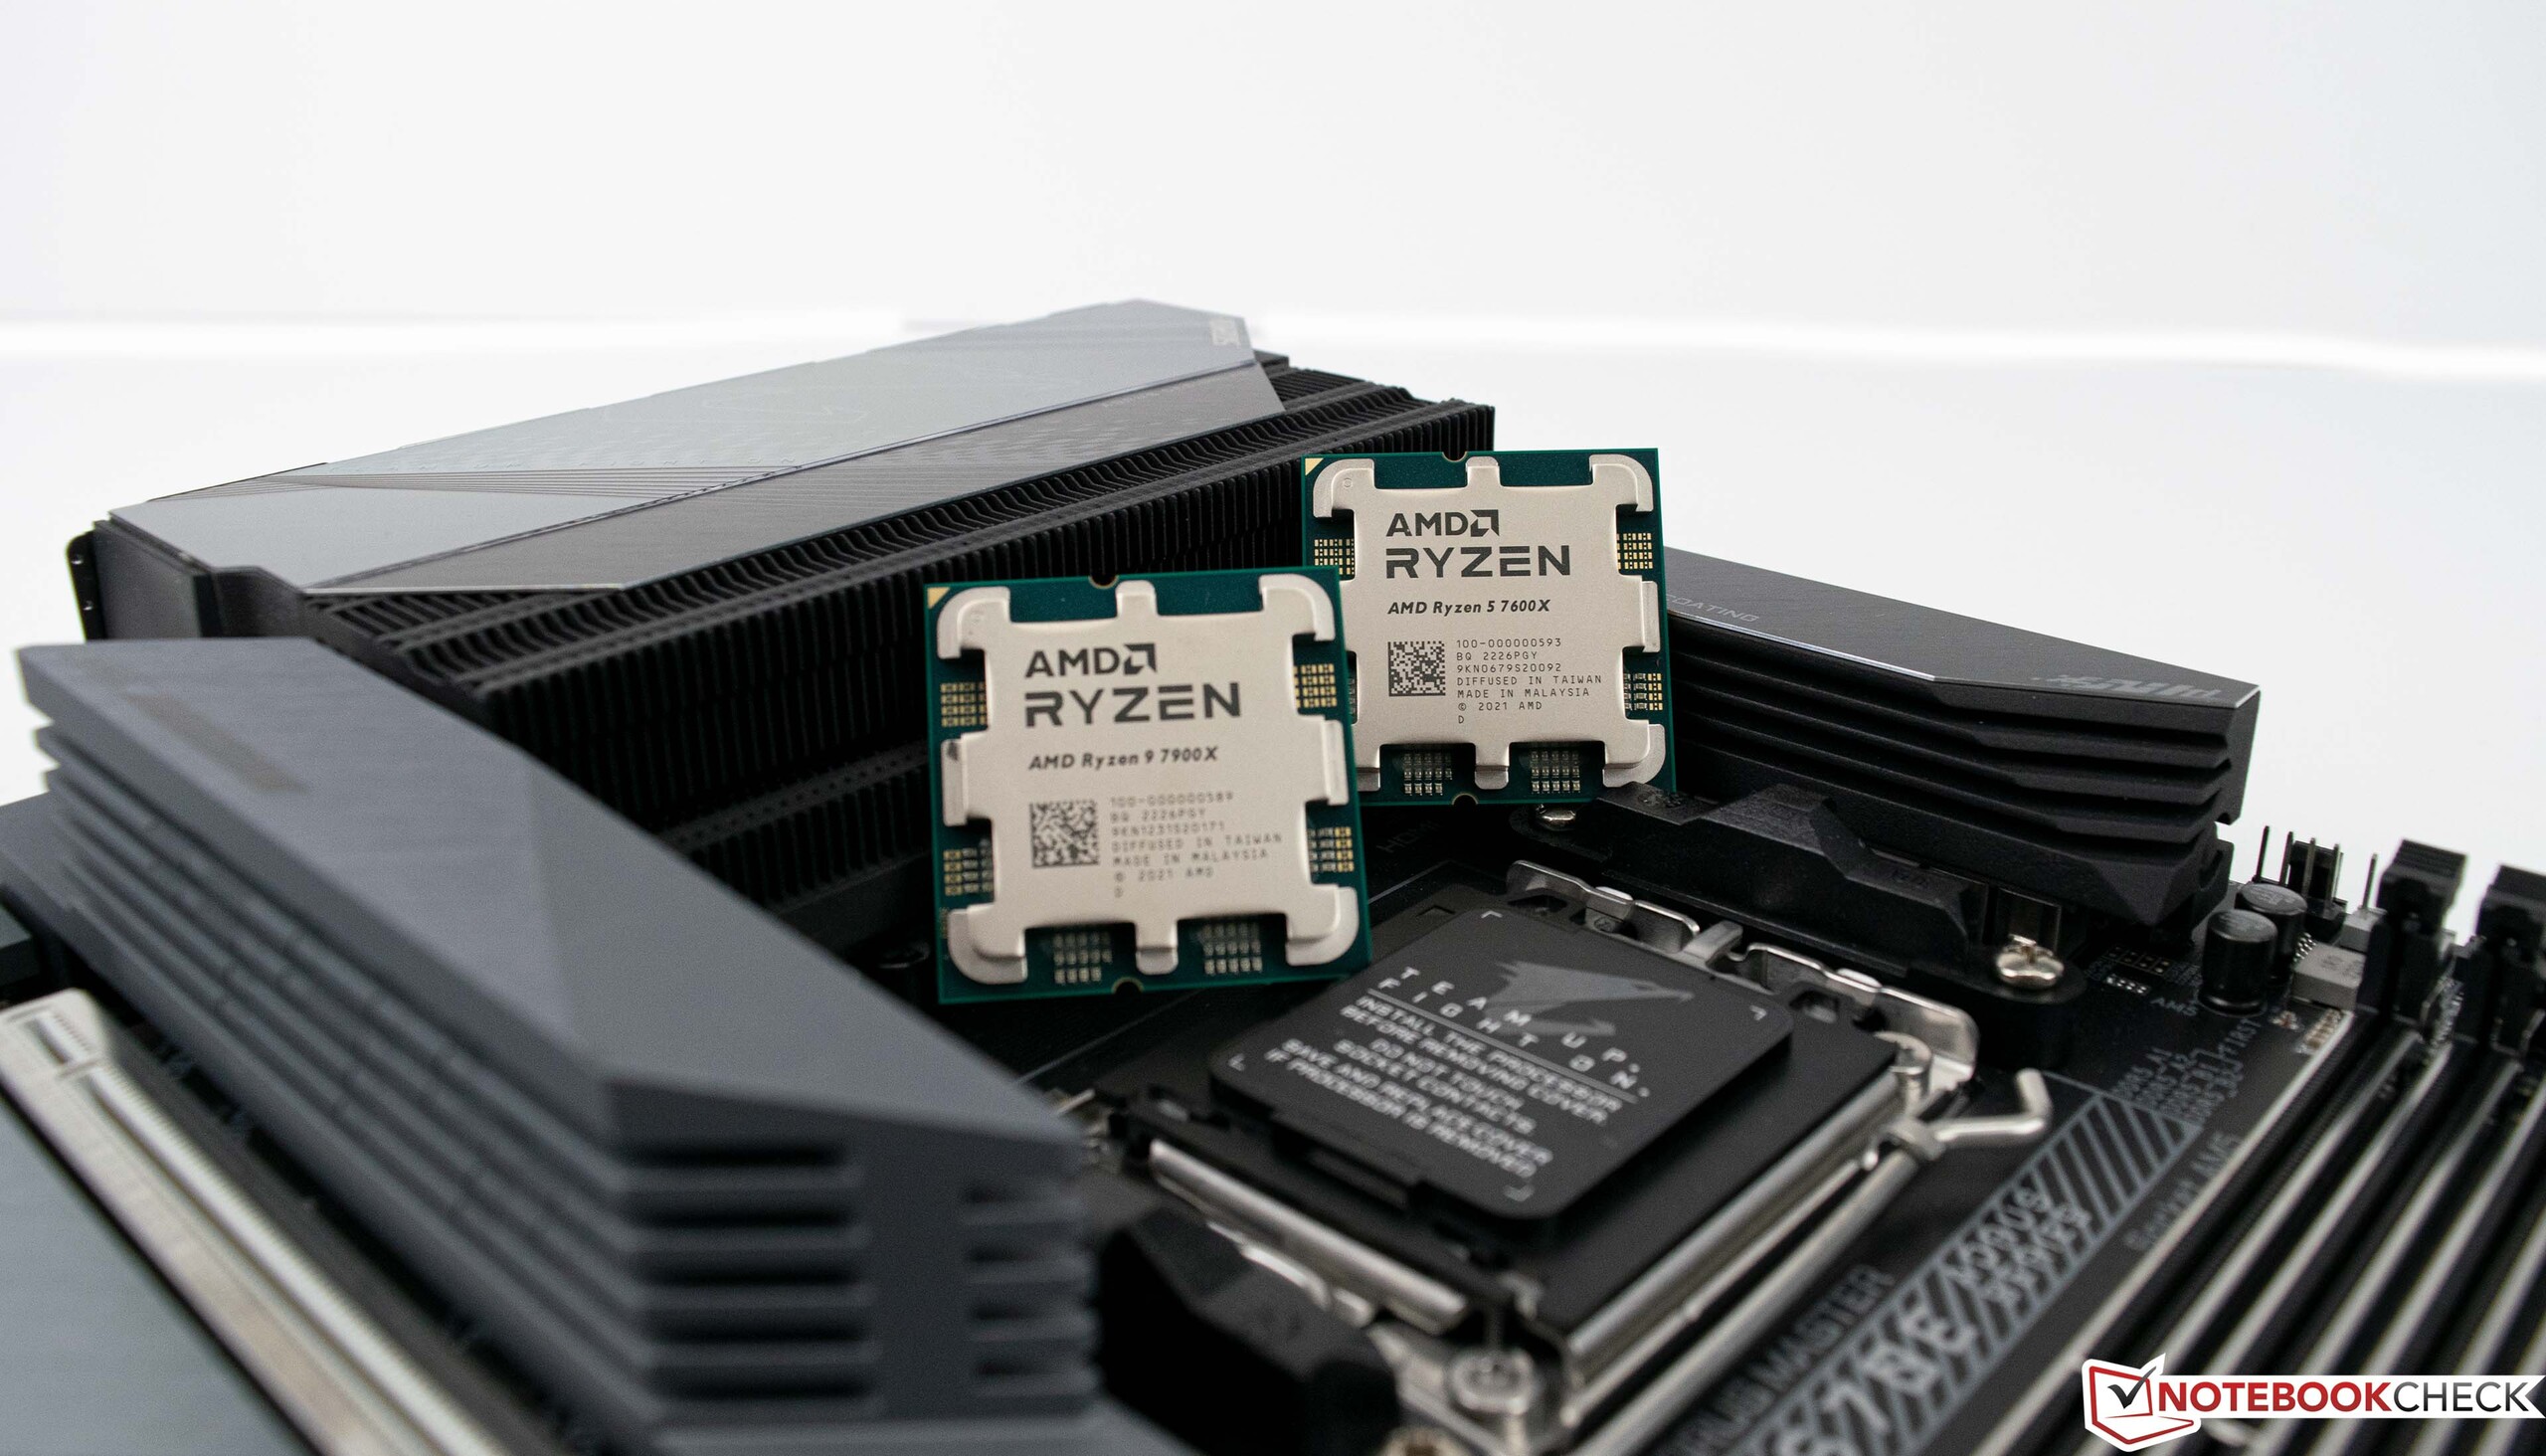
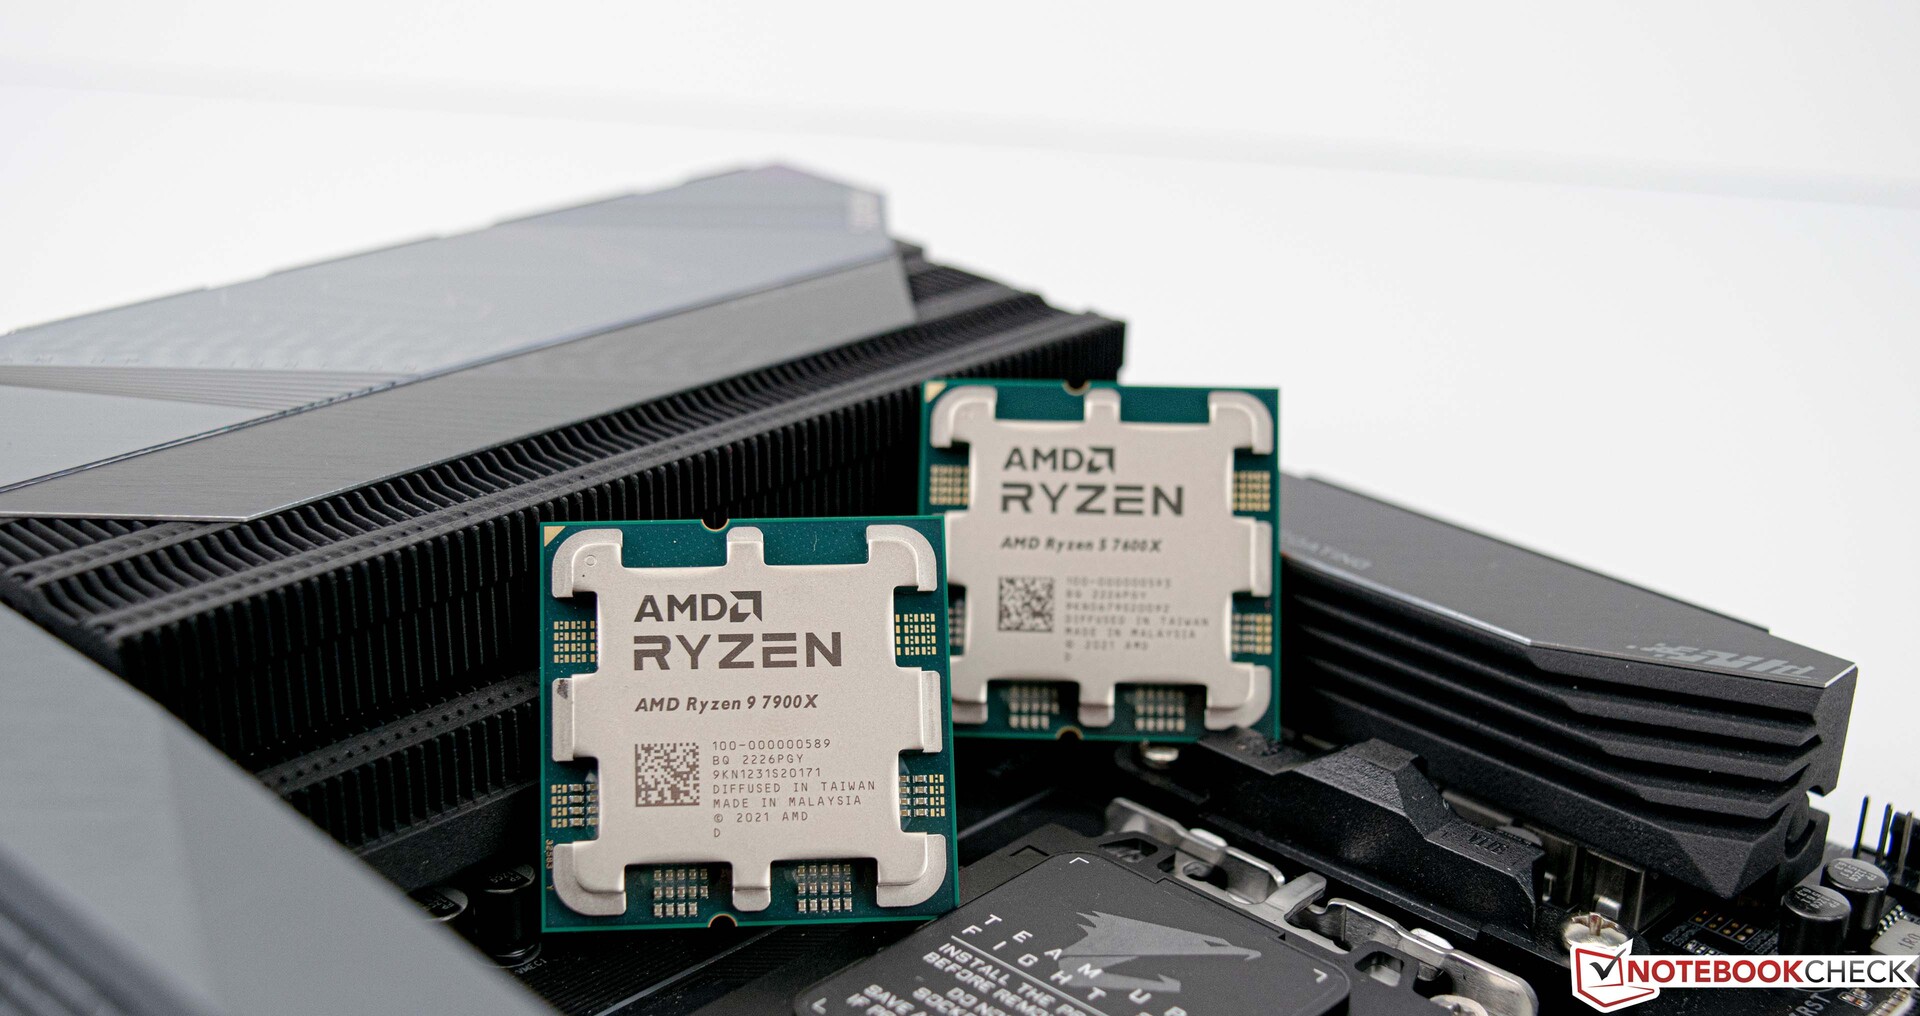
Test des AMD Ryzen 9 7900X et AMD Ryzen 5 7600X : retour à la couronne des CPU de jeu les plus rapides avec Raphael !
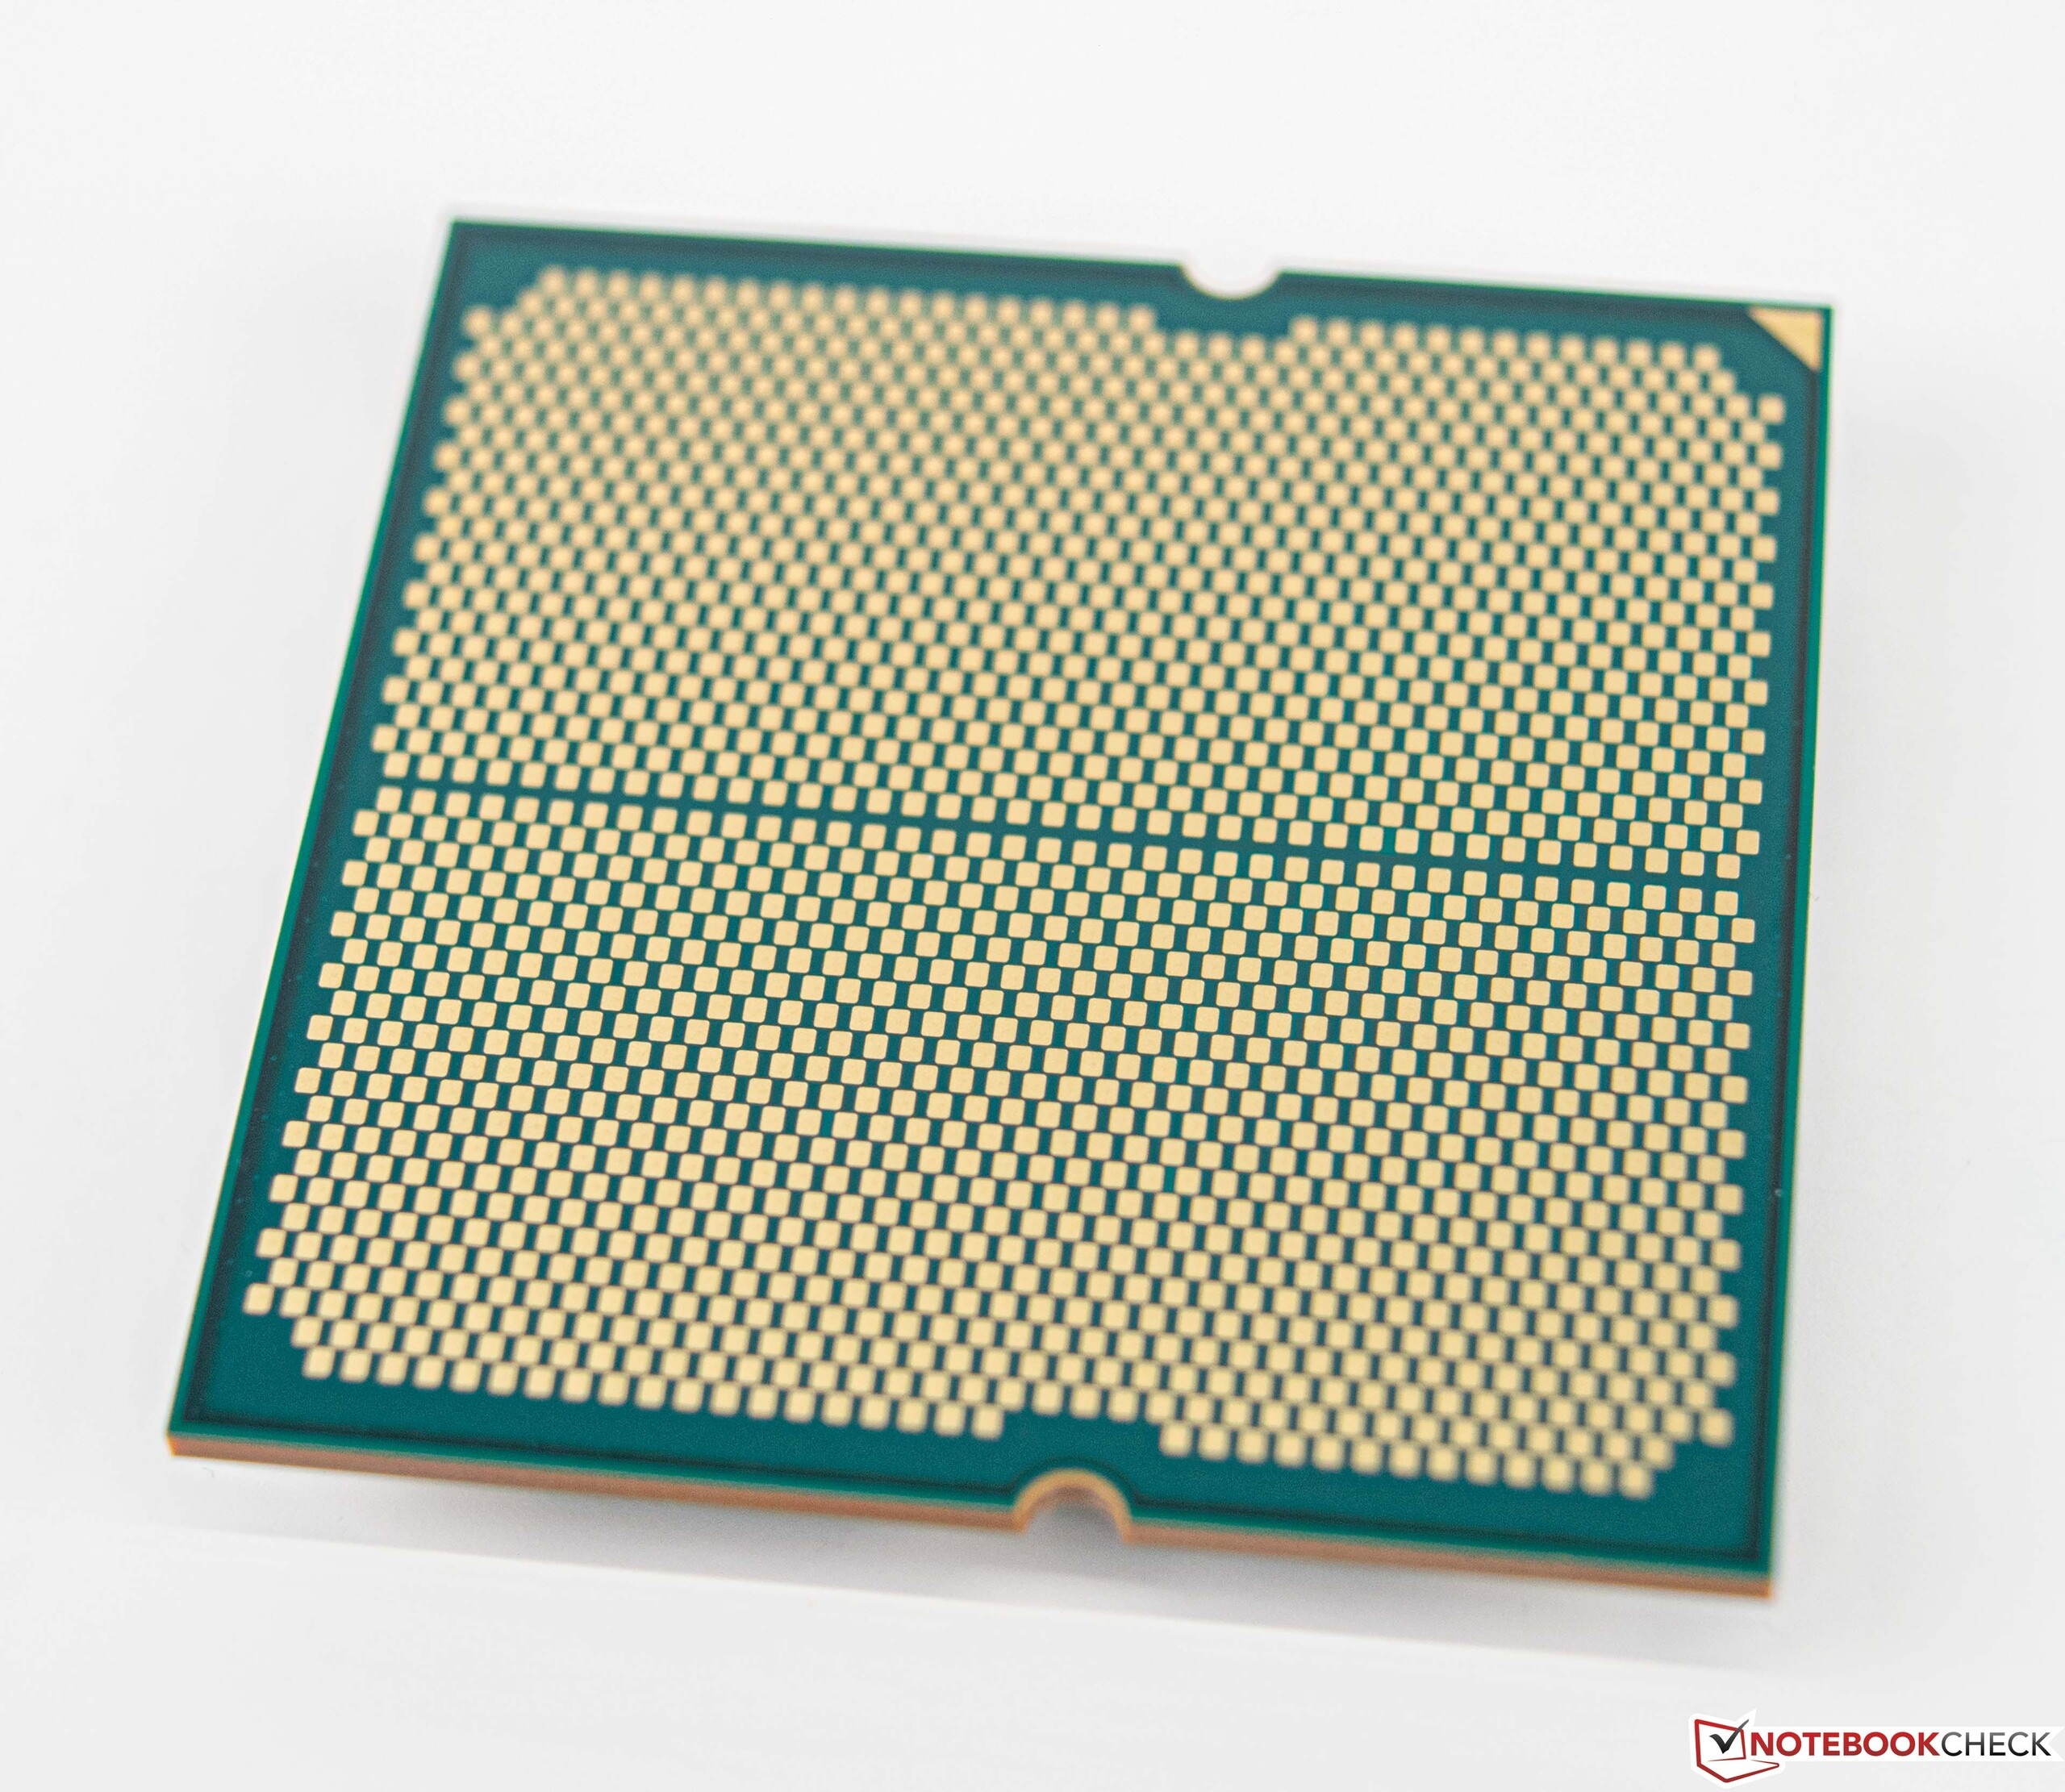
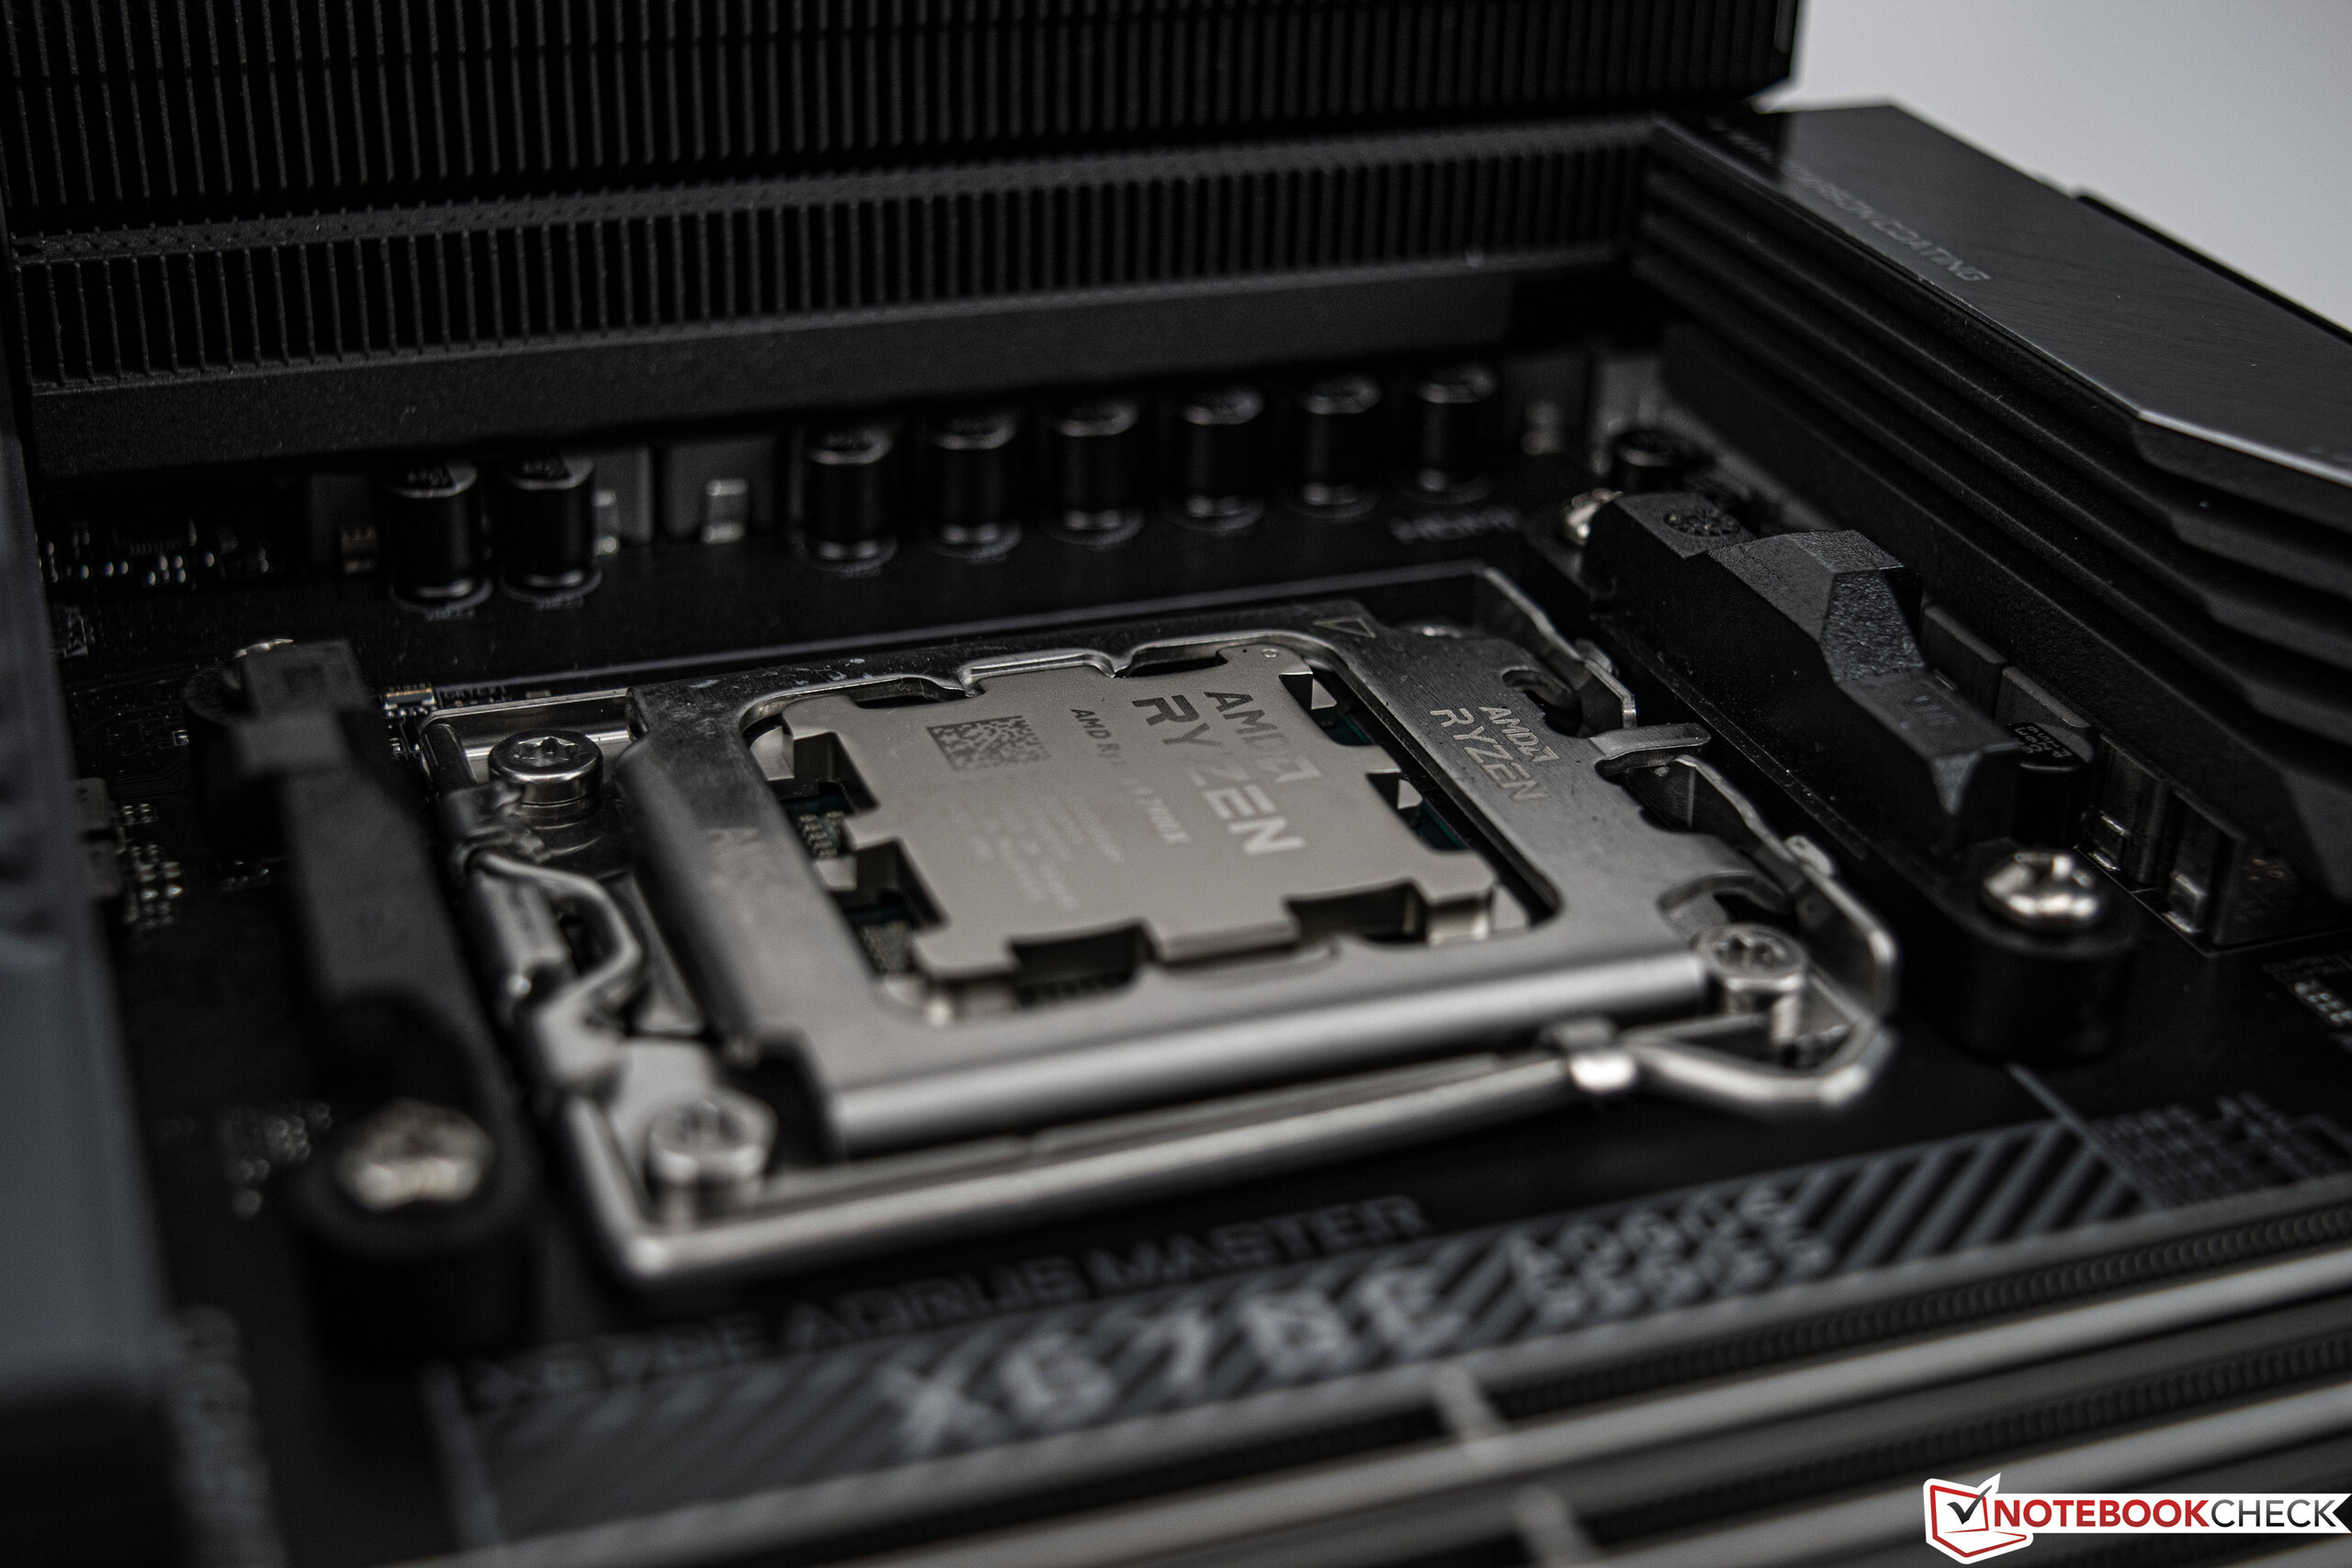
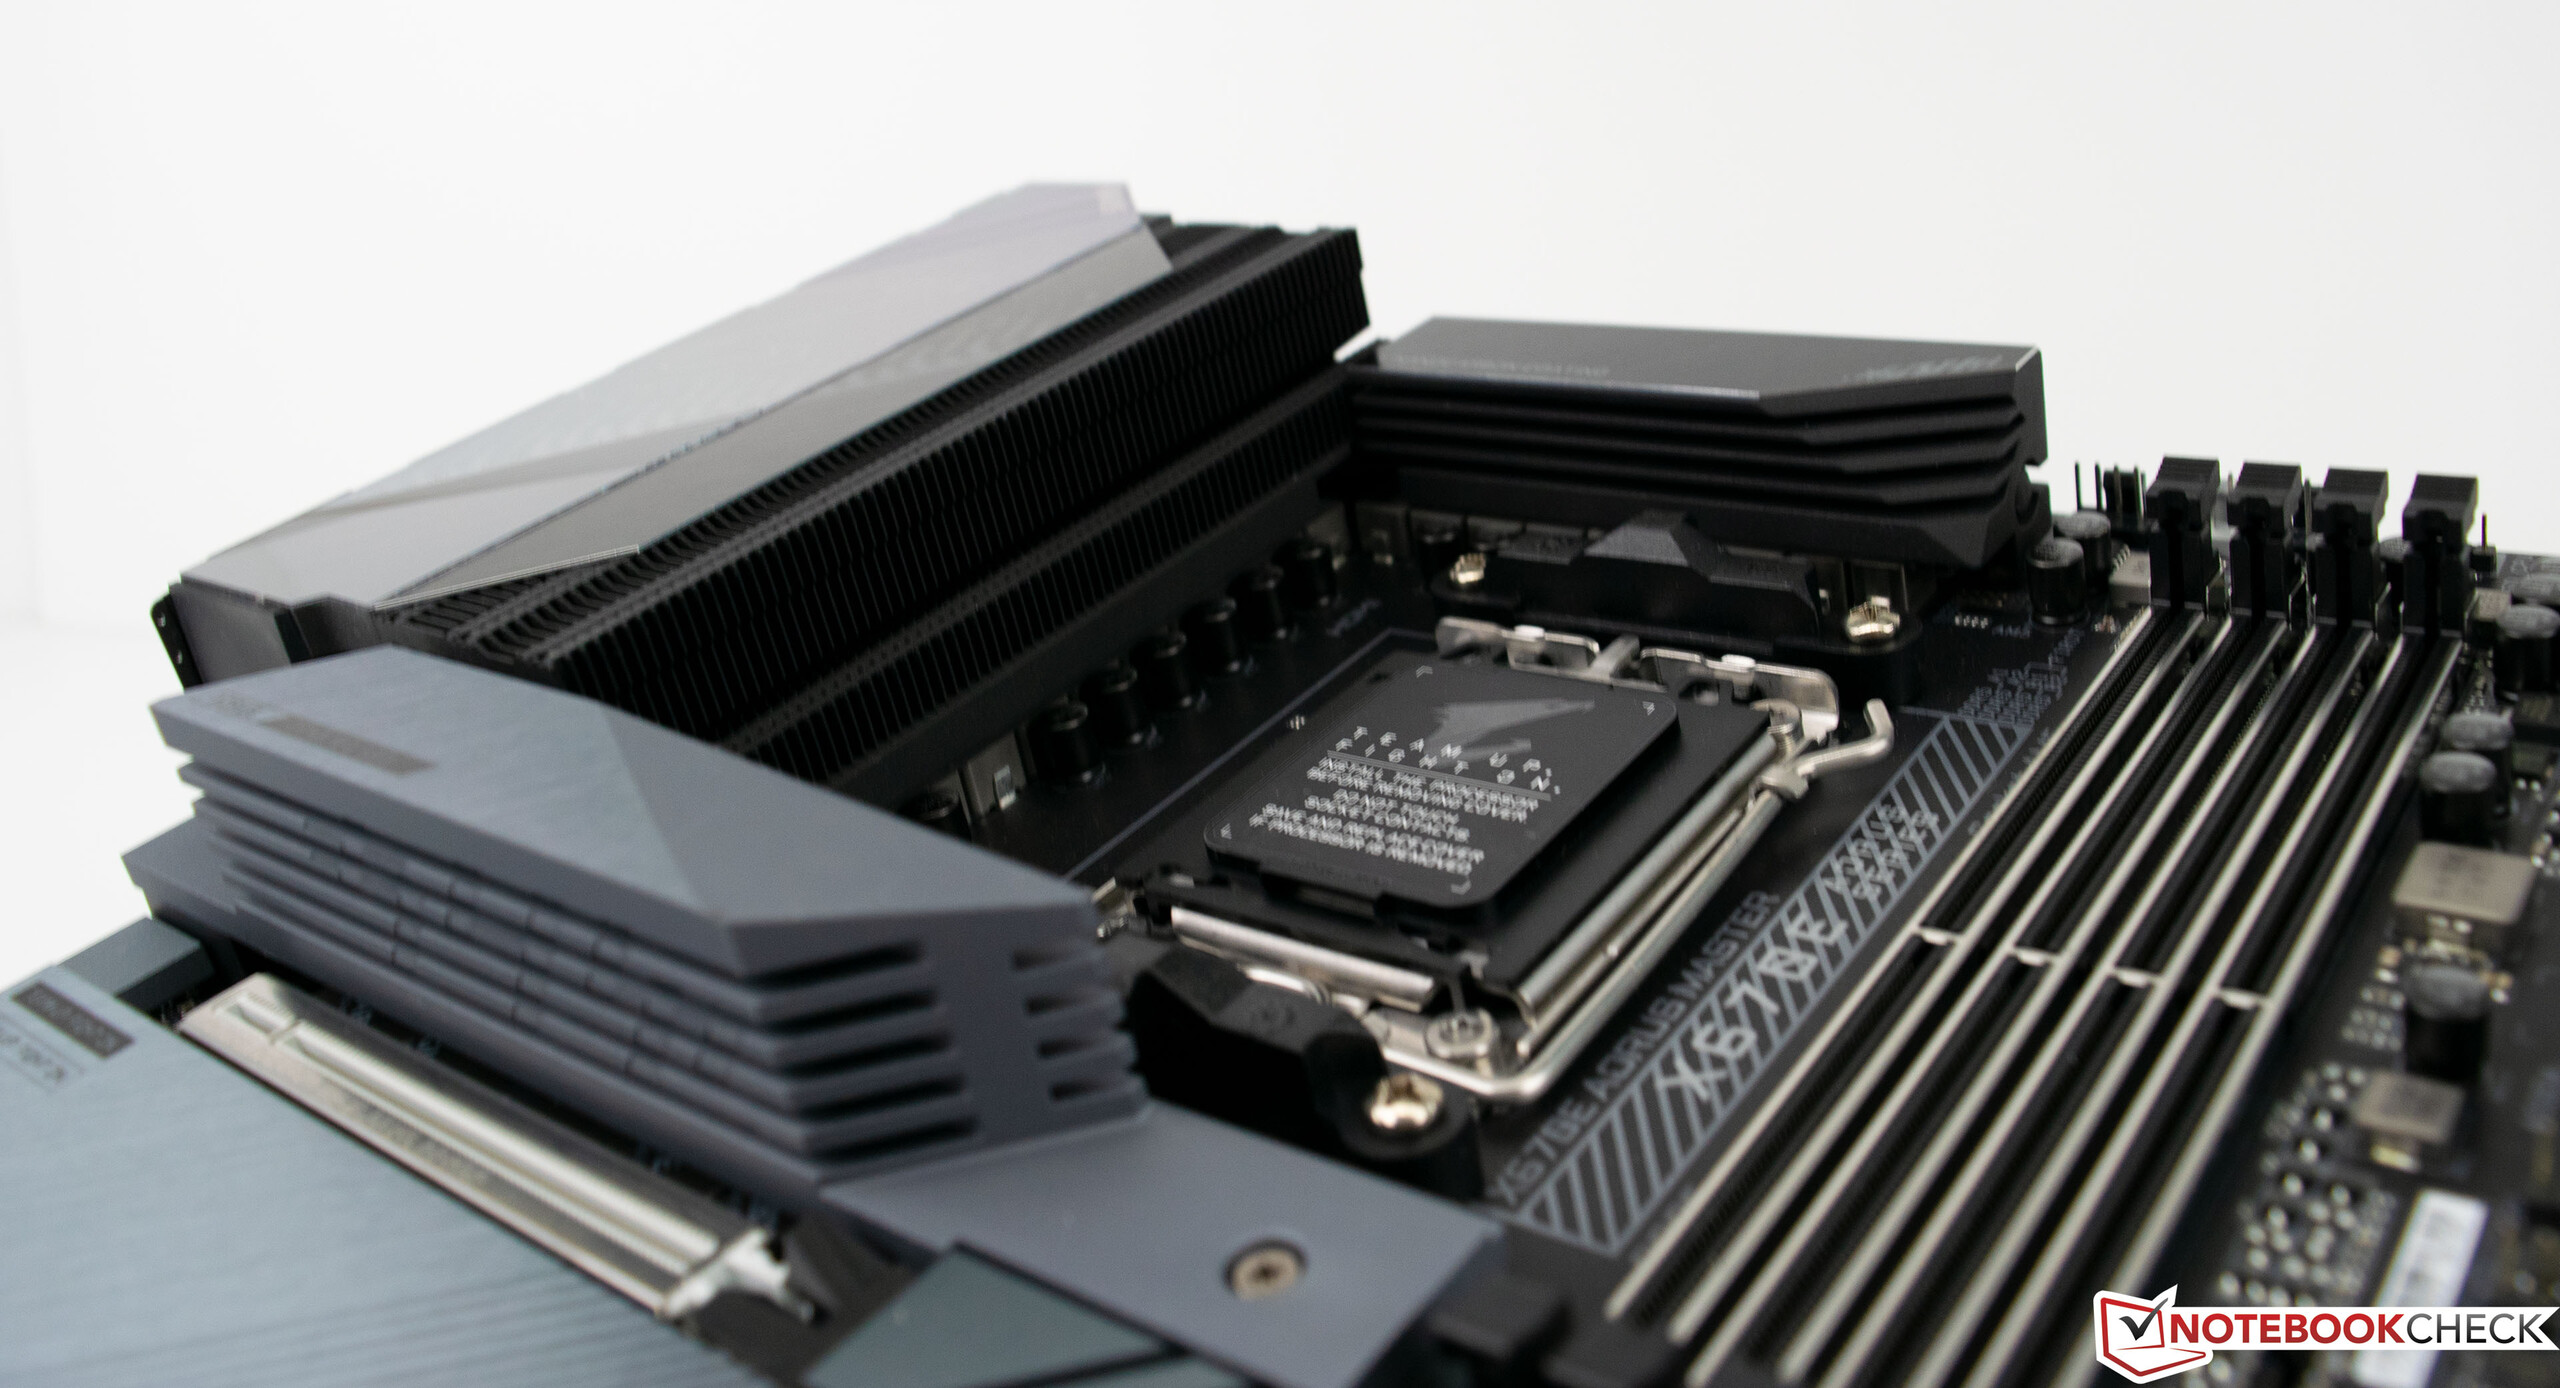
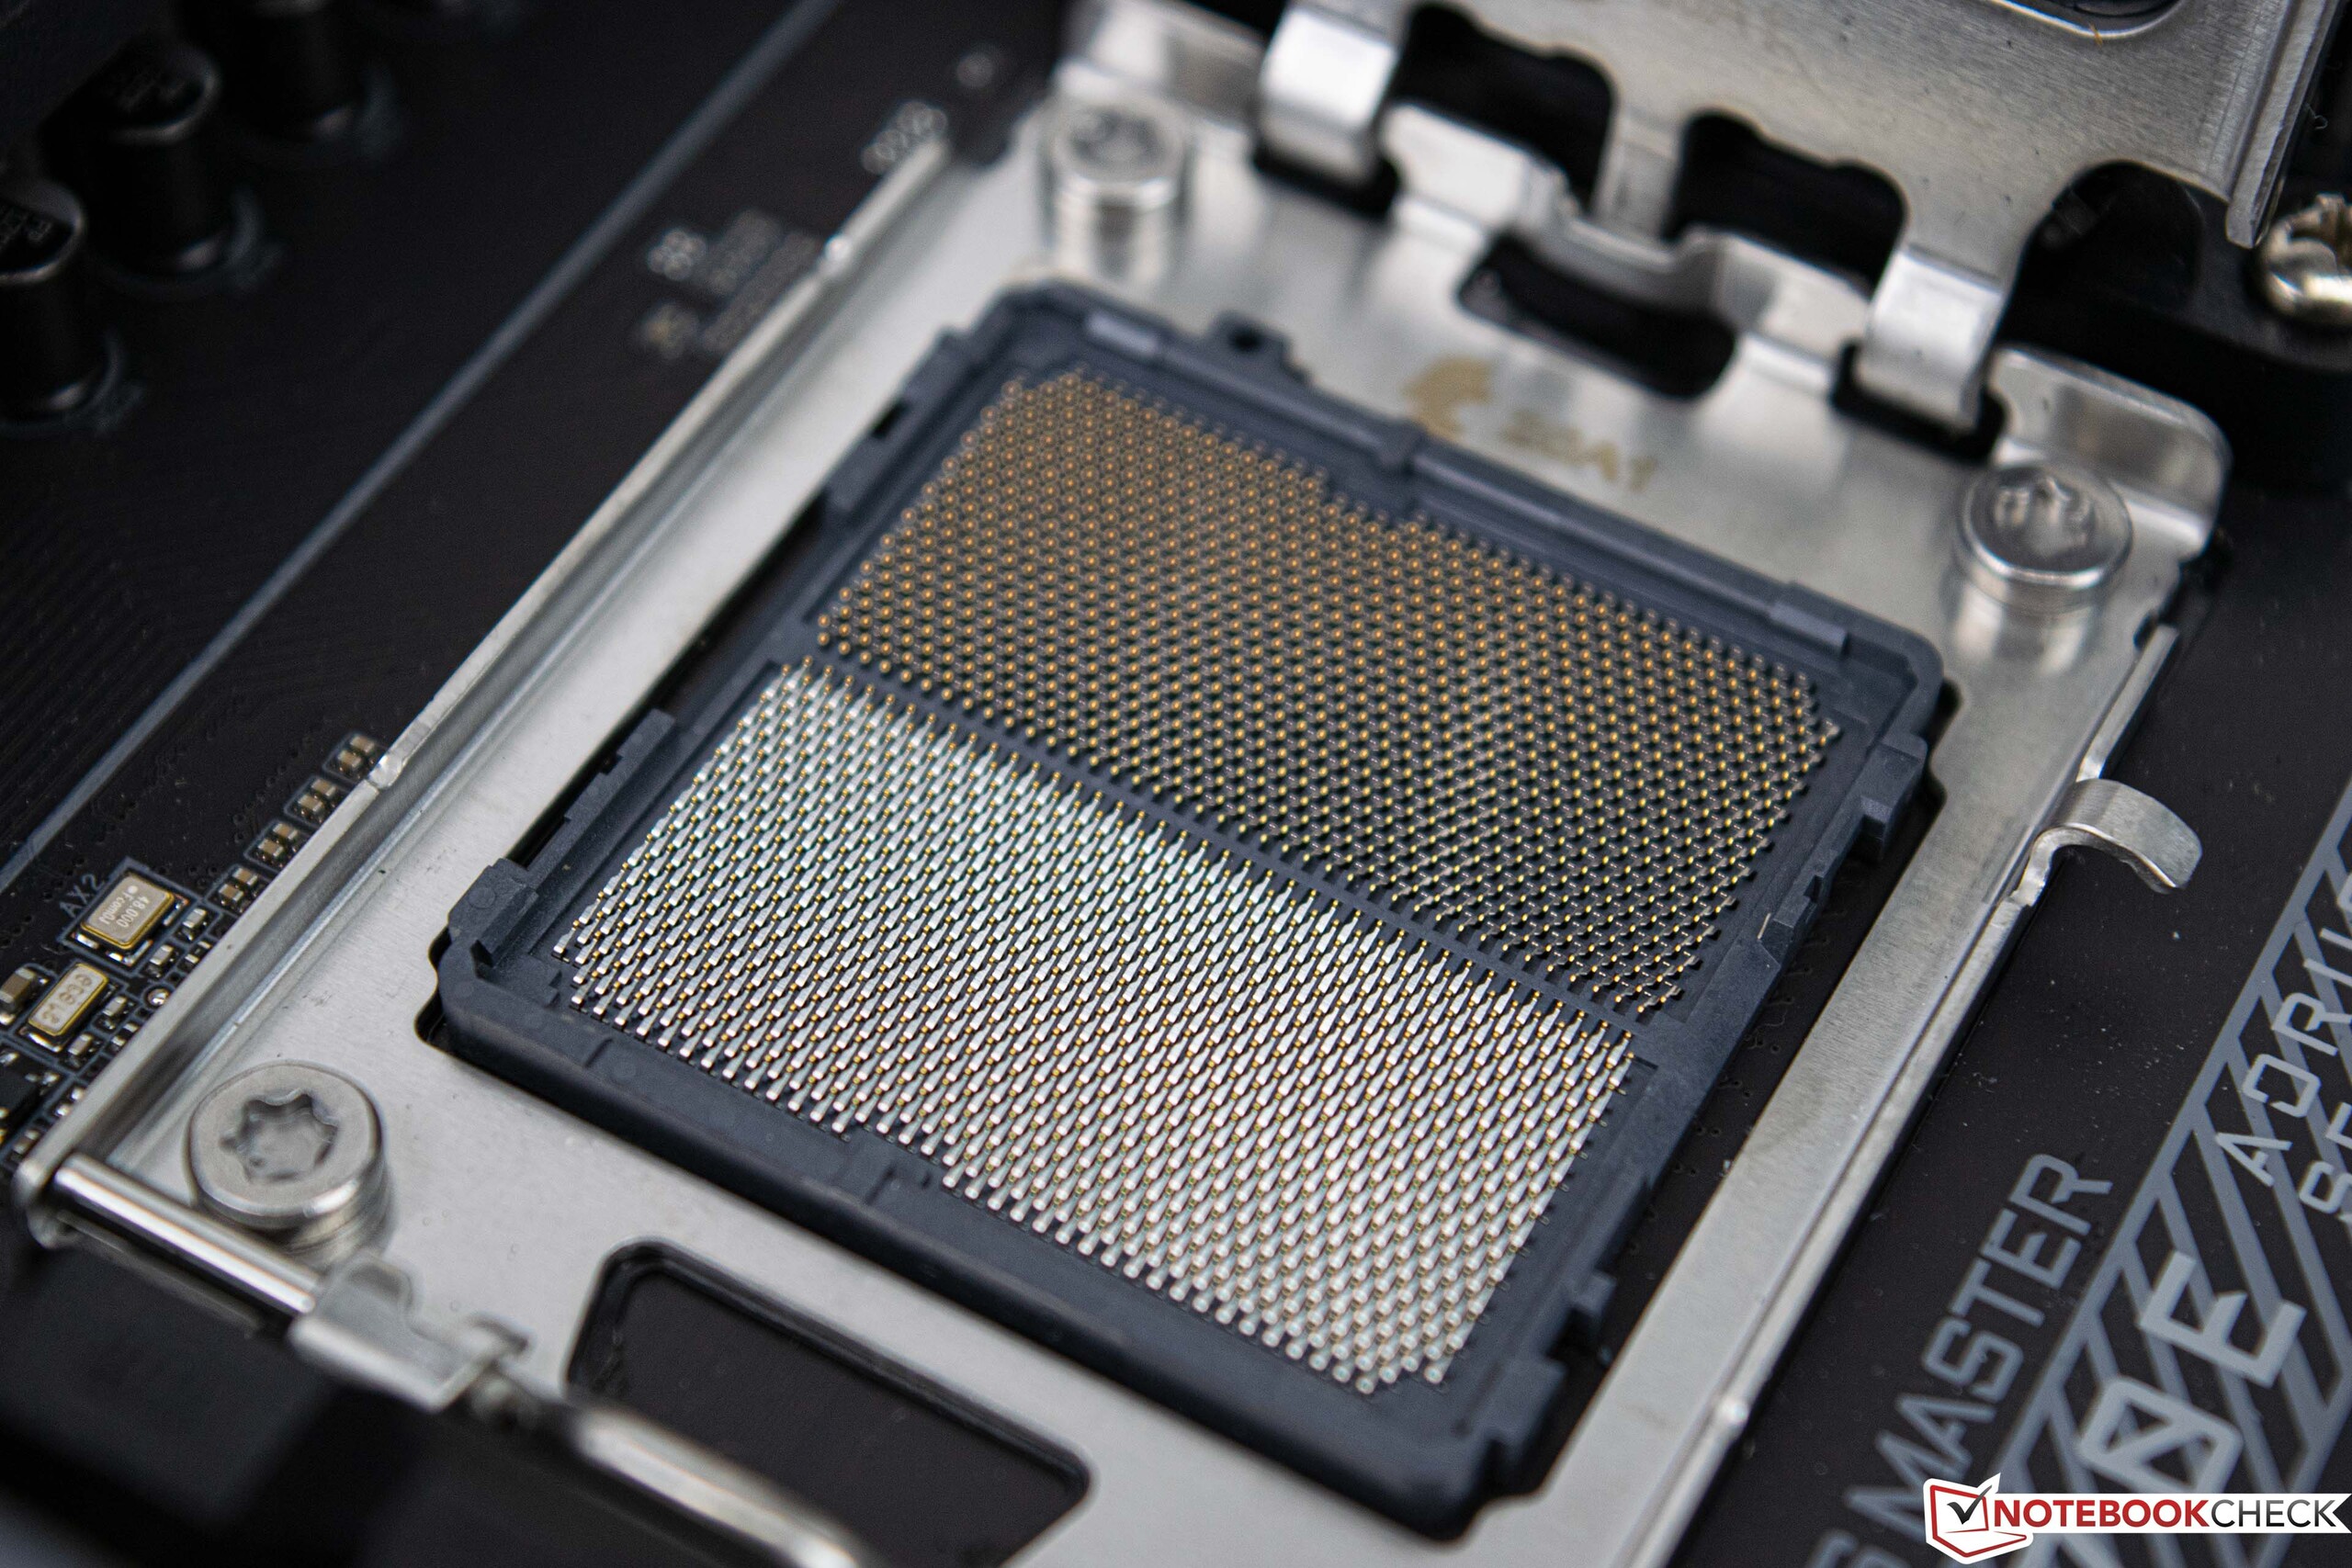
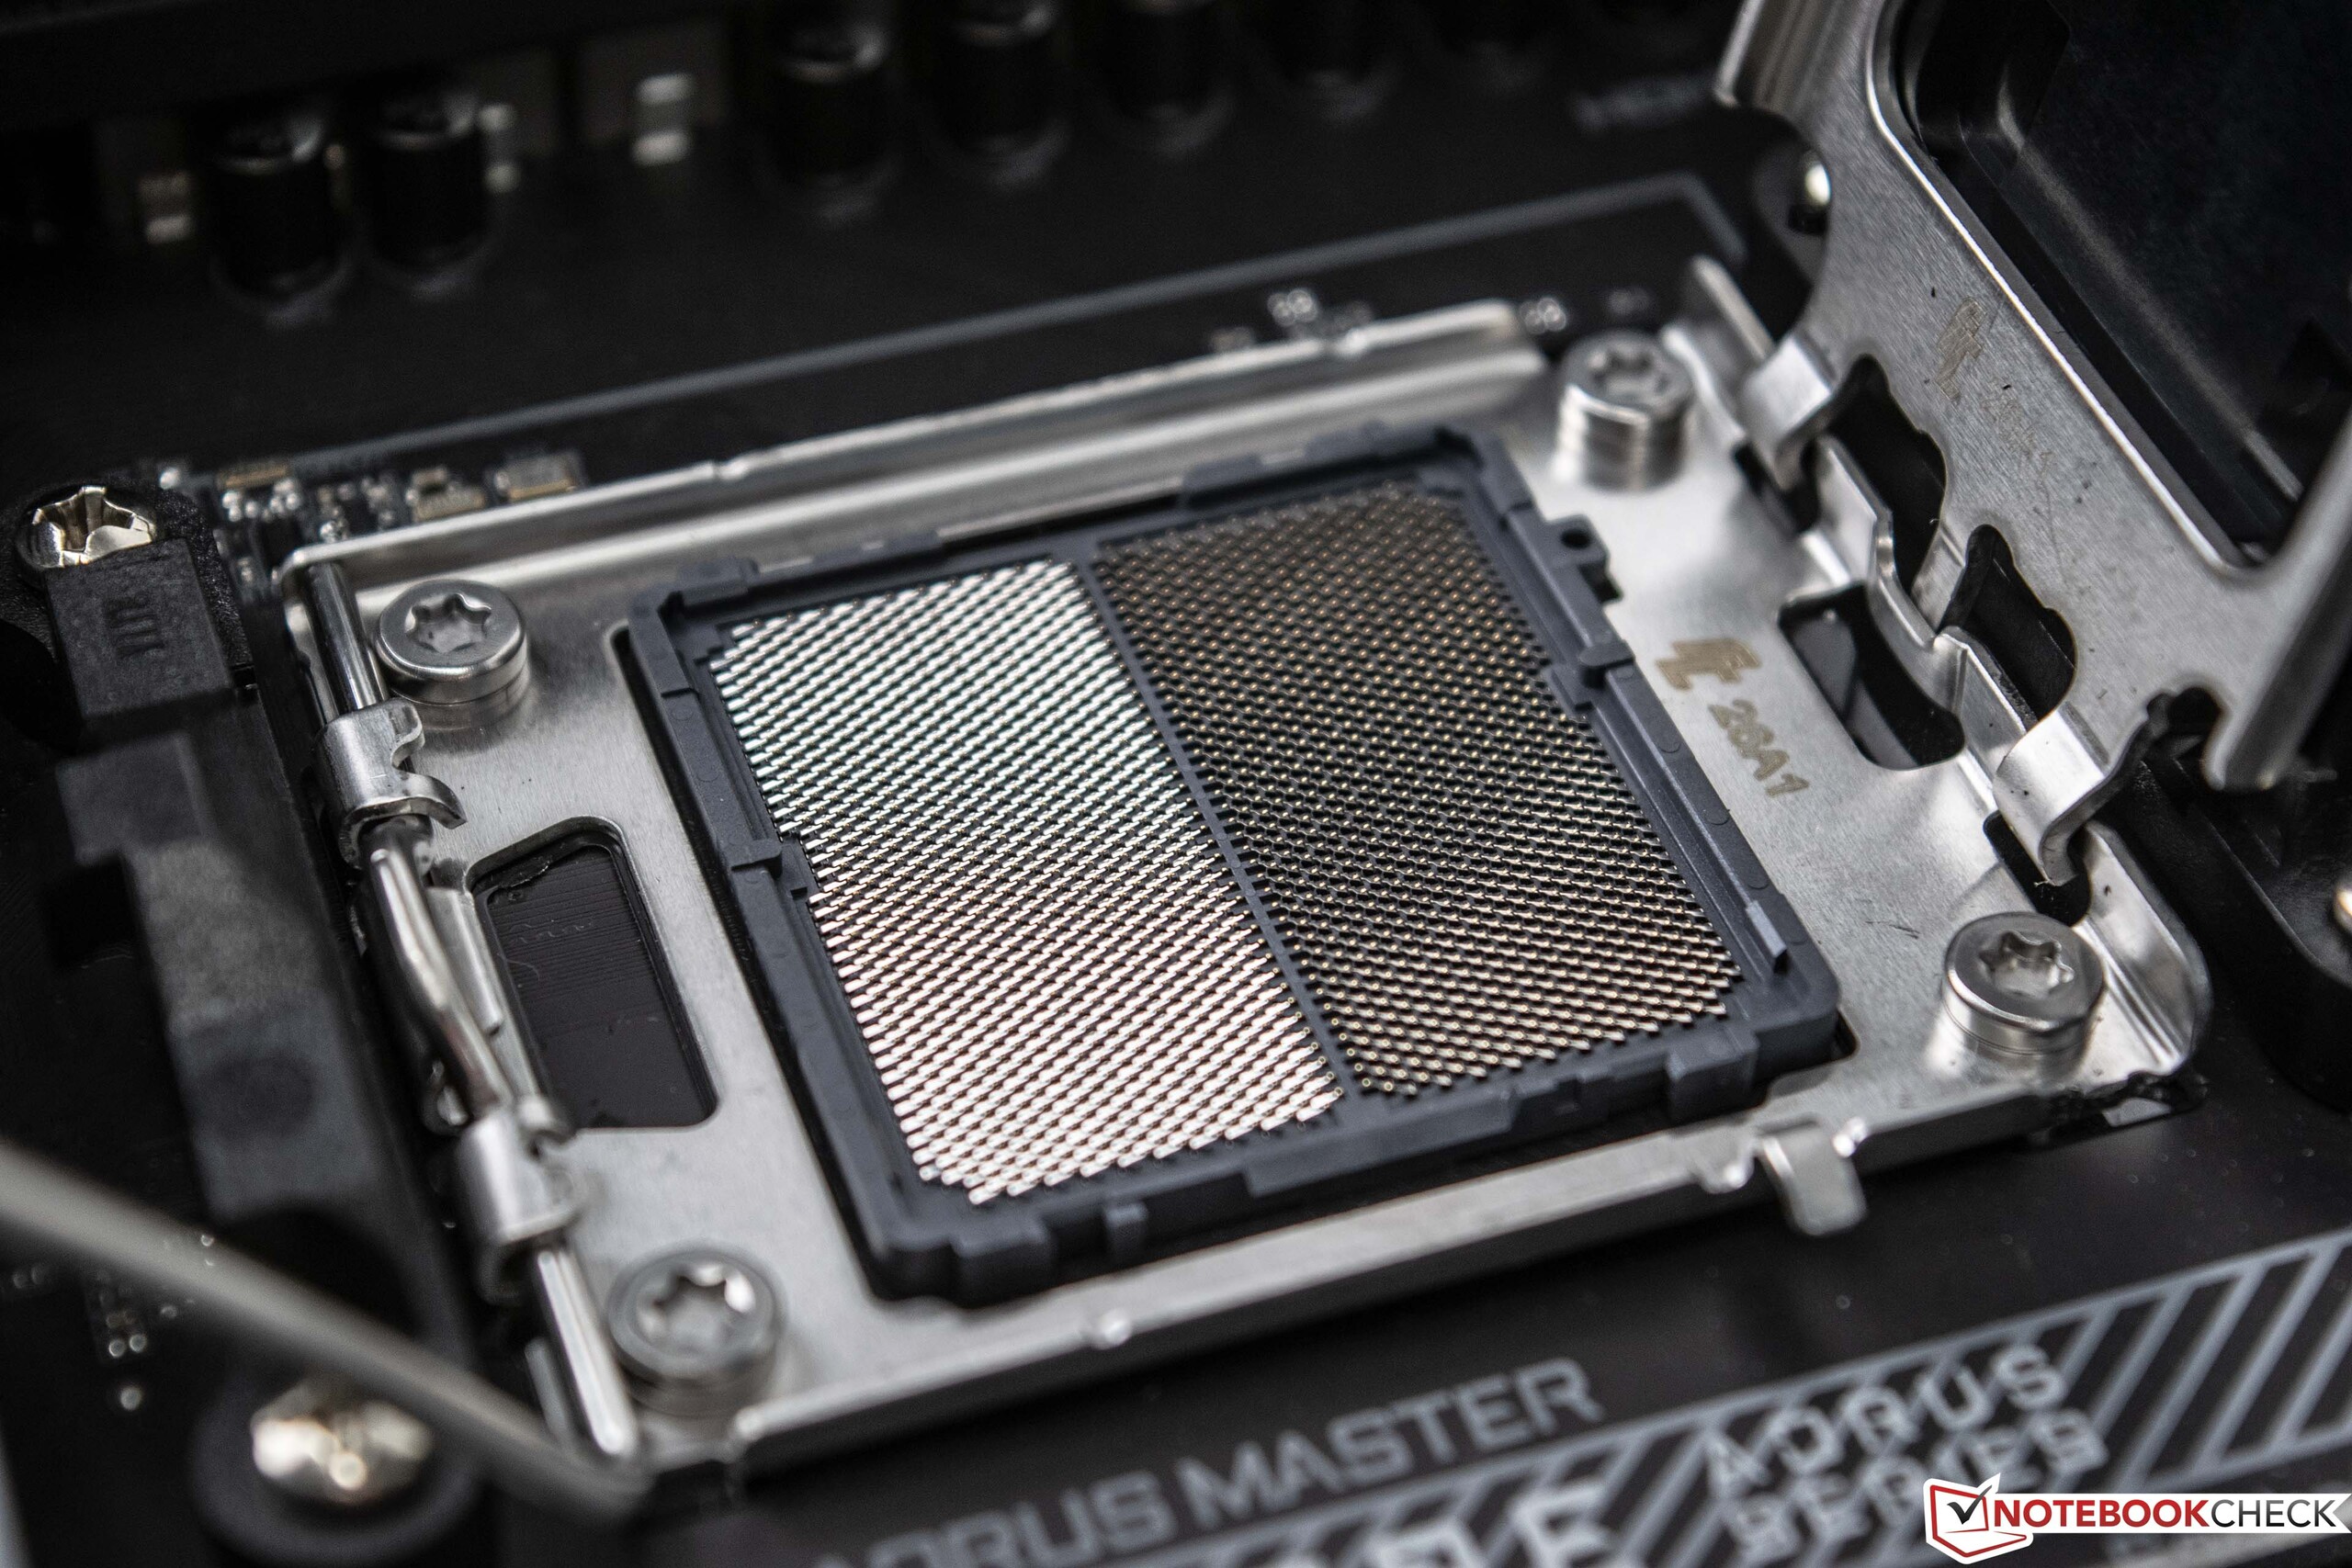
Le 08.10.2020, AMD a procédé à son dernier grand lancement en matière de processeurs de bureau. Aujourd'hui, presque deux ans plus tard, AMD sort les tout nouveaux modèles AMD Ryzen 7000. En plus des nouveaux processeurs, de nombreuses autres innovations concernent la carte mère et la mémoire vive. Le socket AM4 est remplacé par le nouveau socket AM5 basé sur une disposition PGA. Cela signifie que Ryzen 7000 n'a pas de broches, mais seulement des surfaces de contact sur la face inférieure - 1.718 pour être exact. Contrairement à Intel, cependant, l'utilisation de DDR5 est devenue obligatoire avec Ryzen 7000. Il n'y a pas de rétrocompatibilité, ce qui doit absolument être pris en compte lors du calcul des coûts d'une mise à niveau.
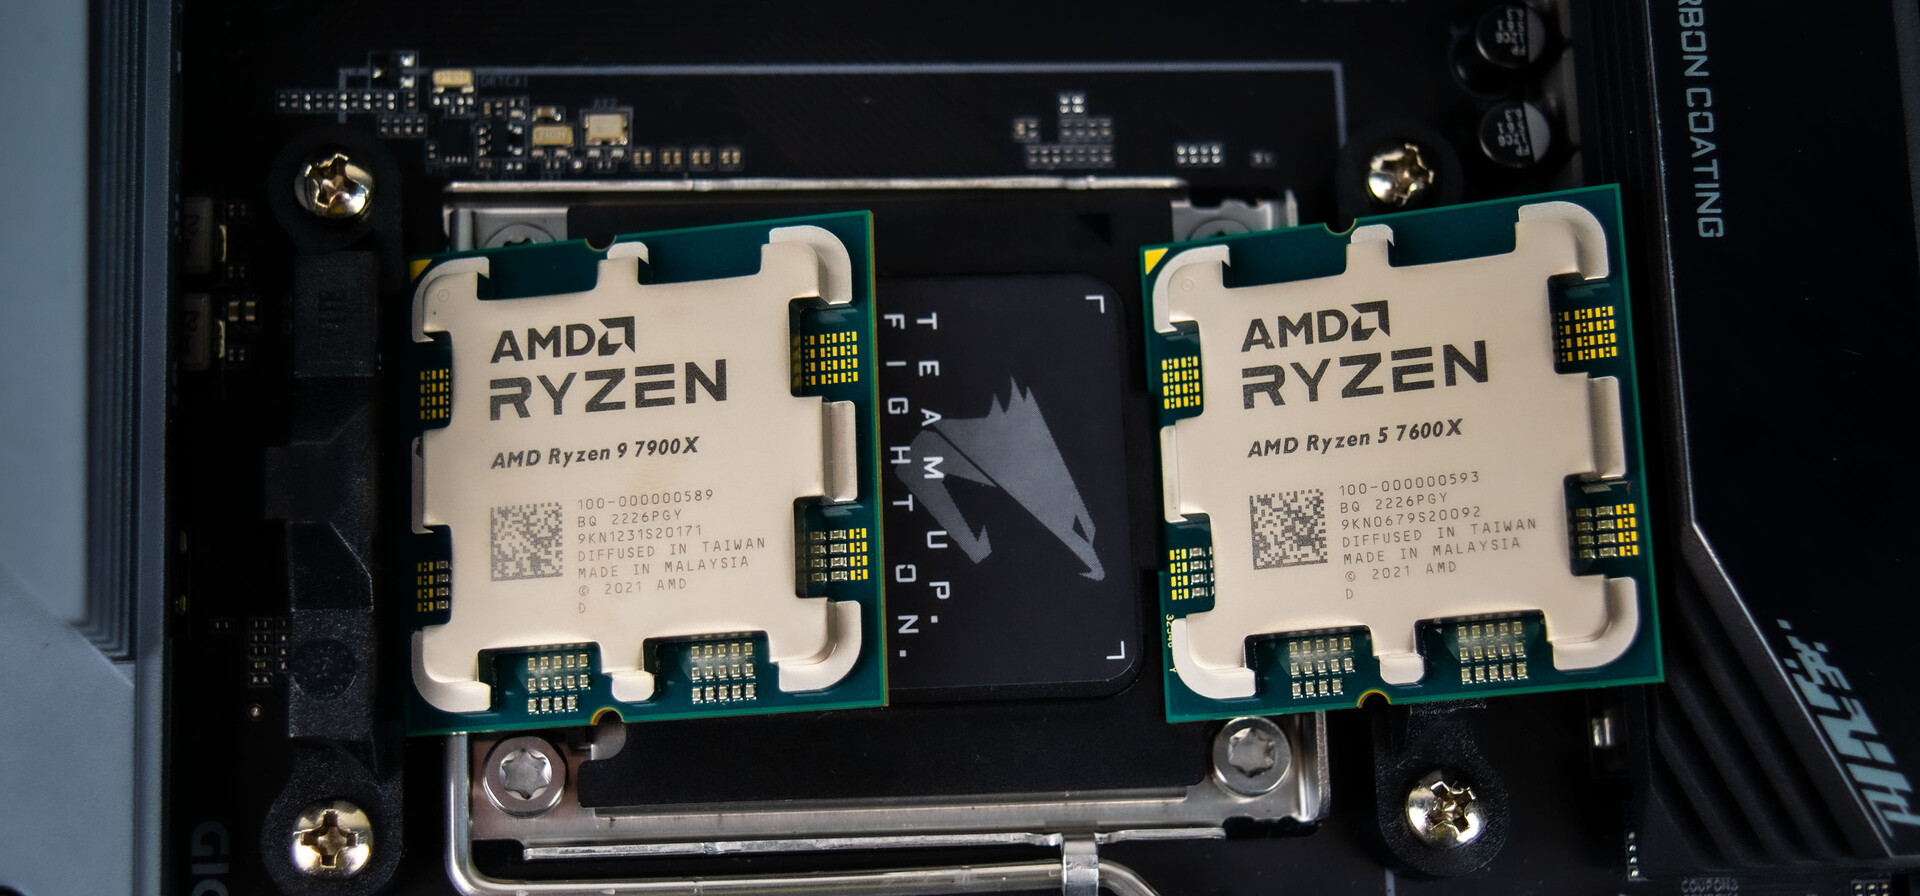
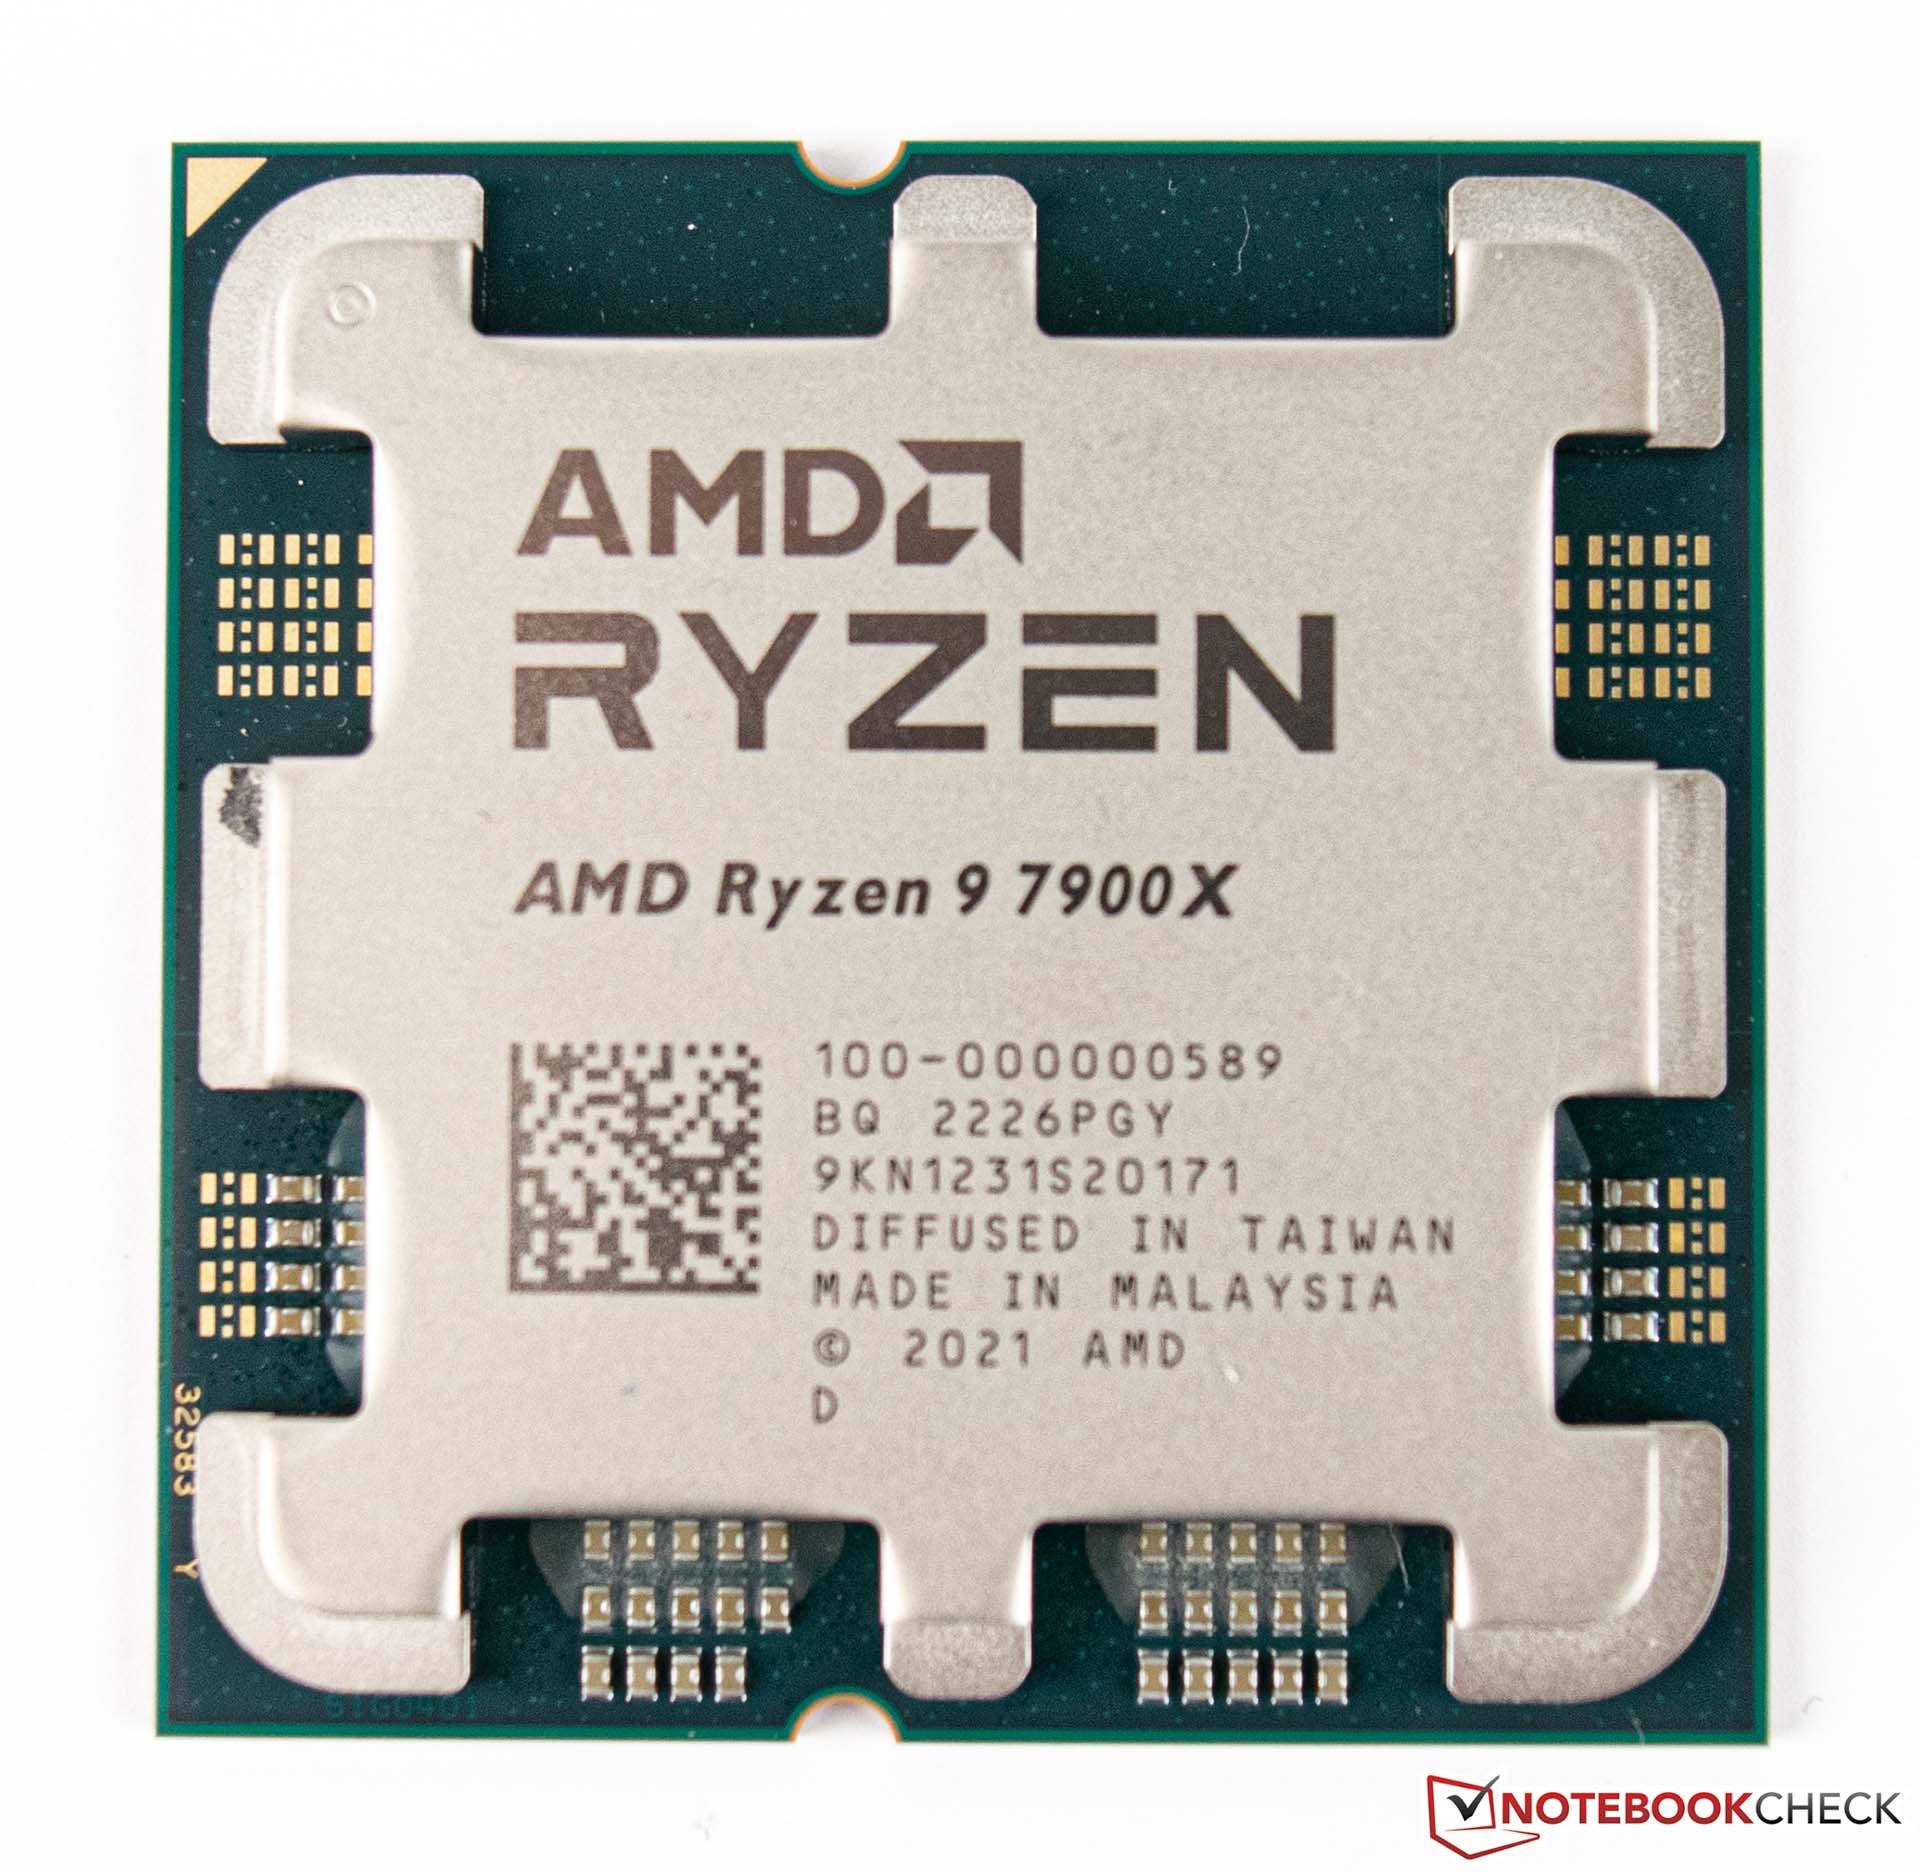
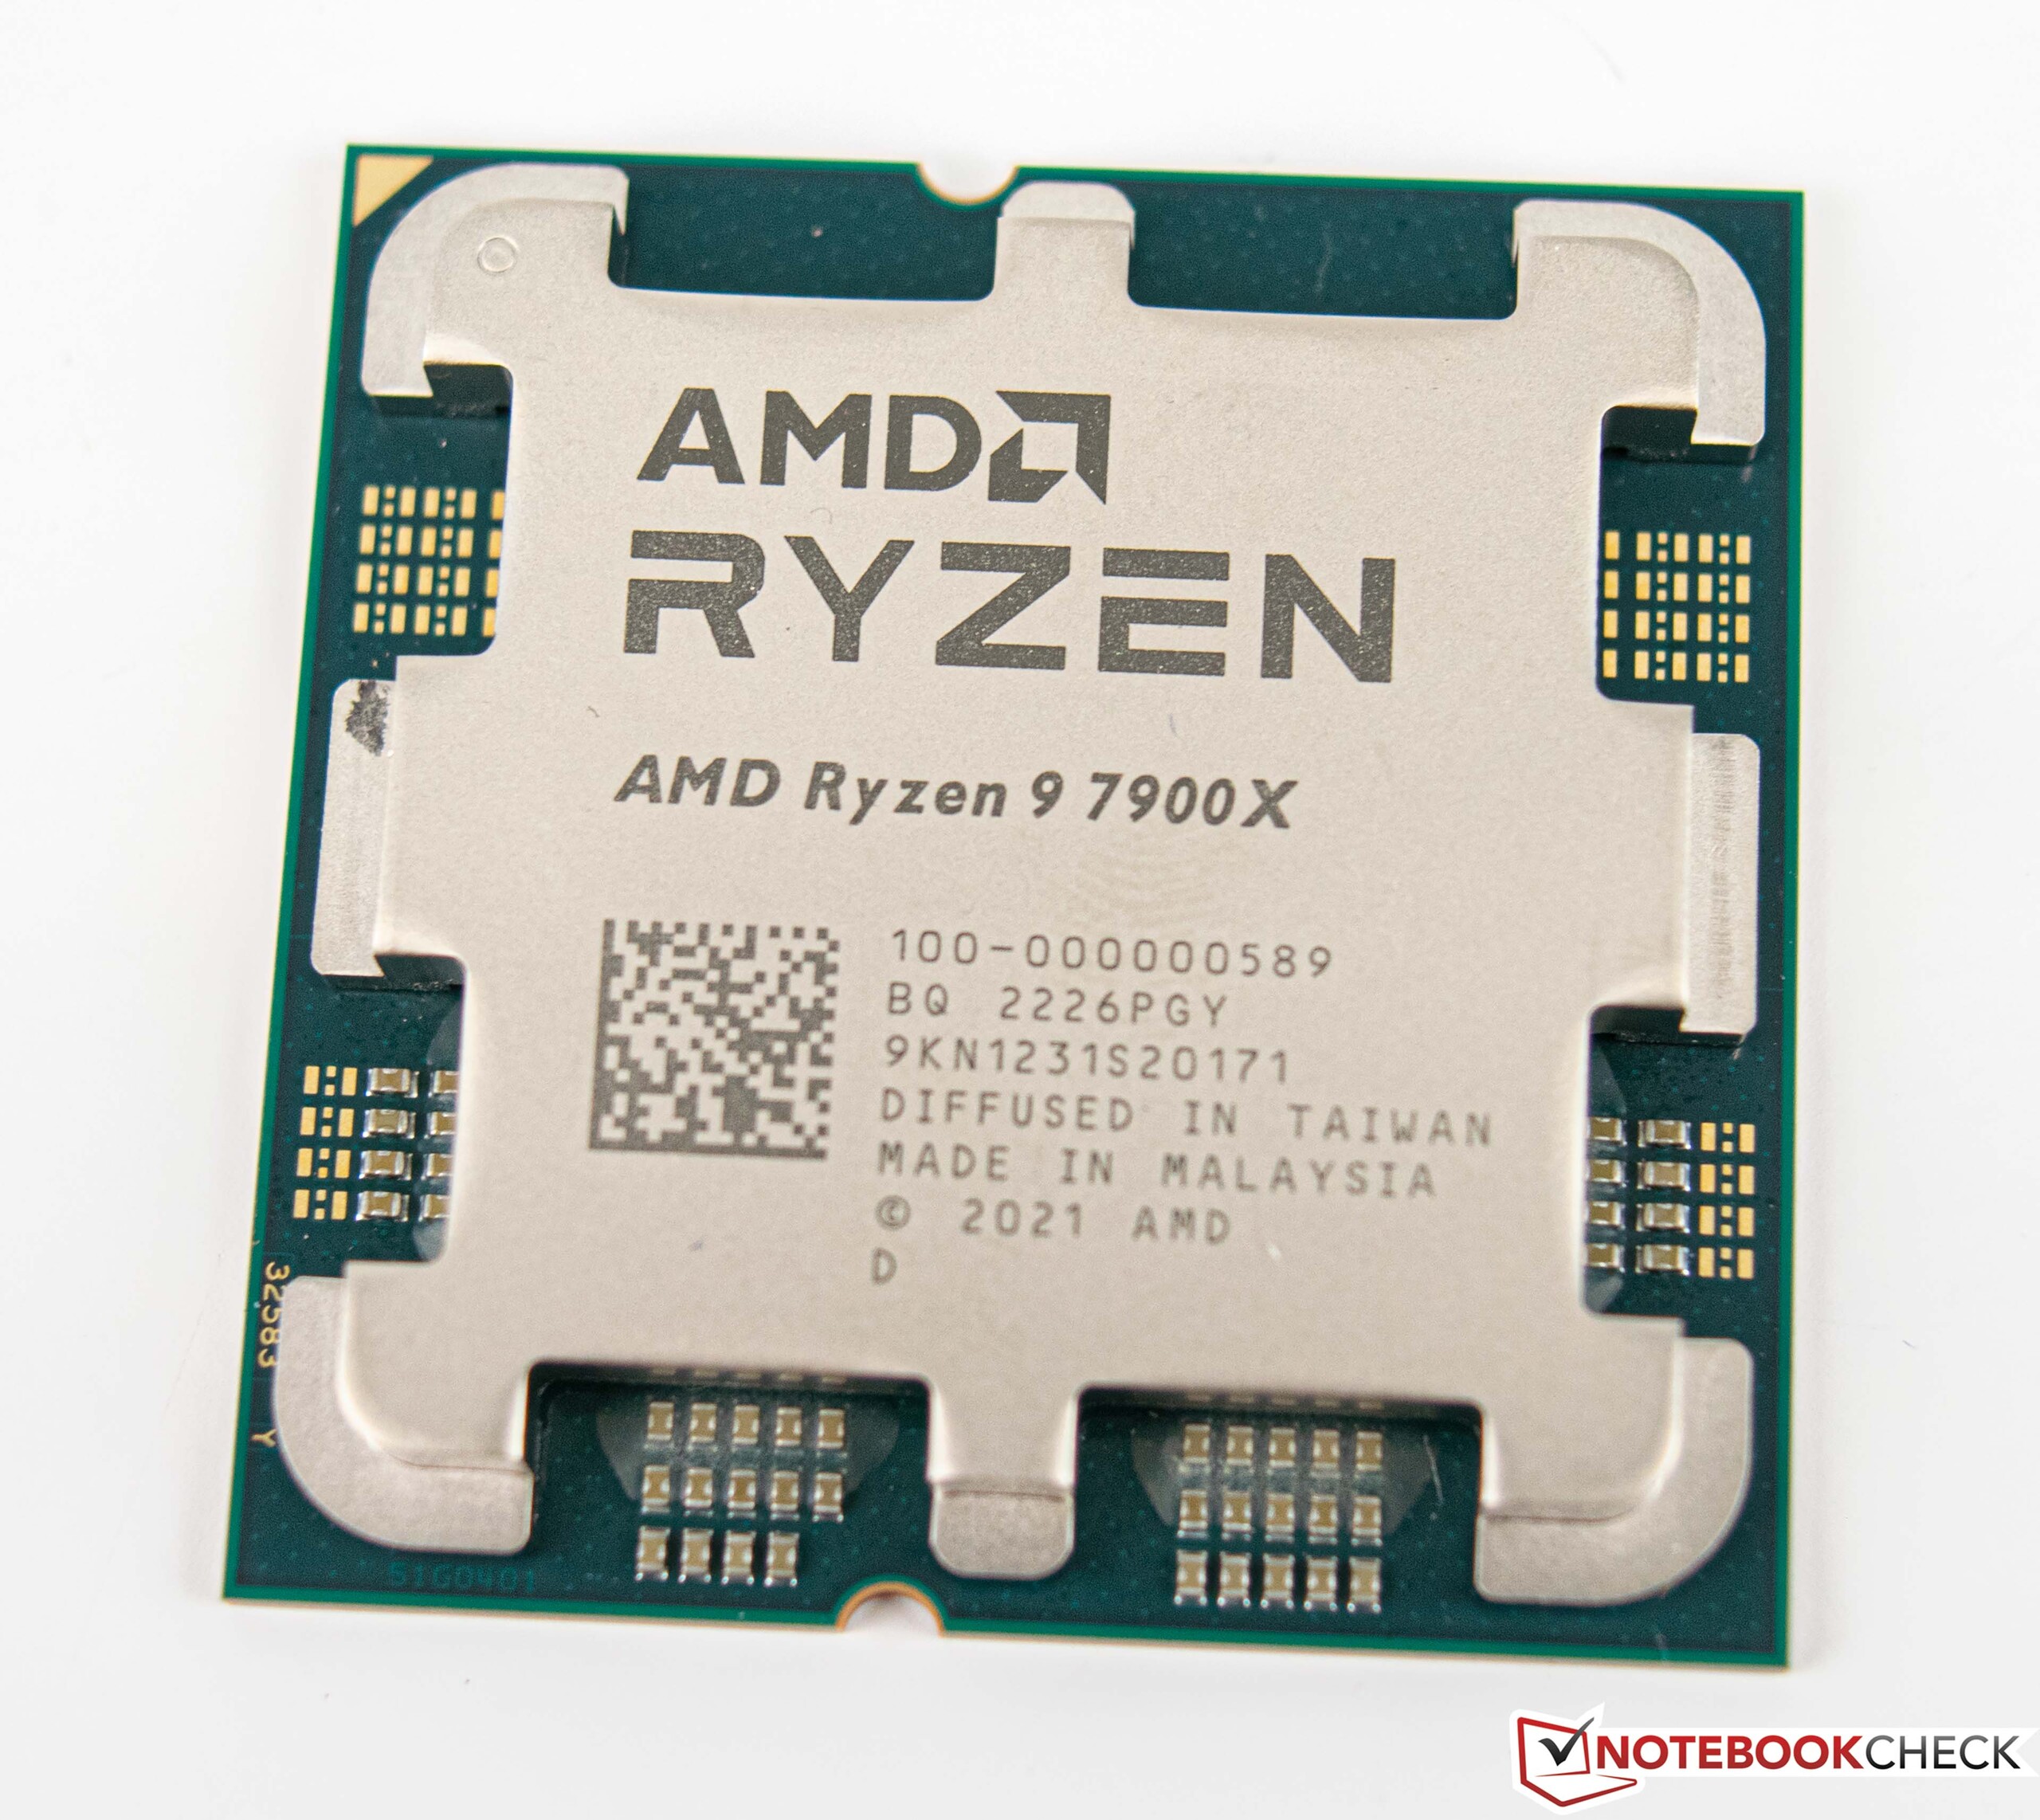
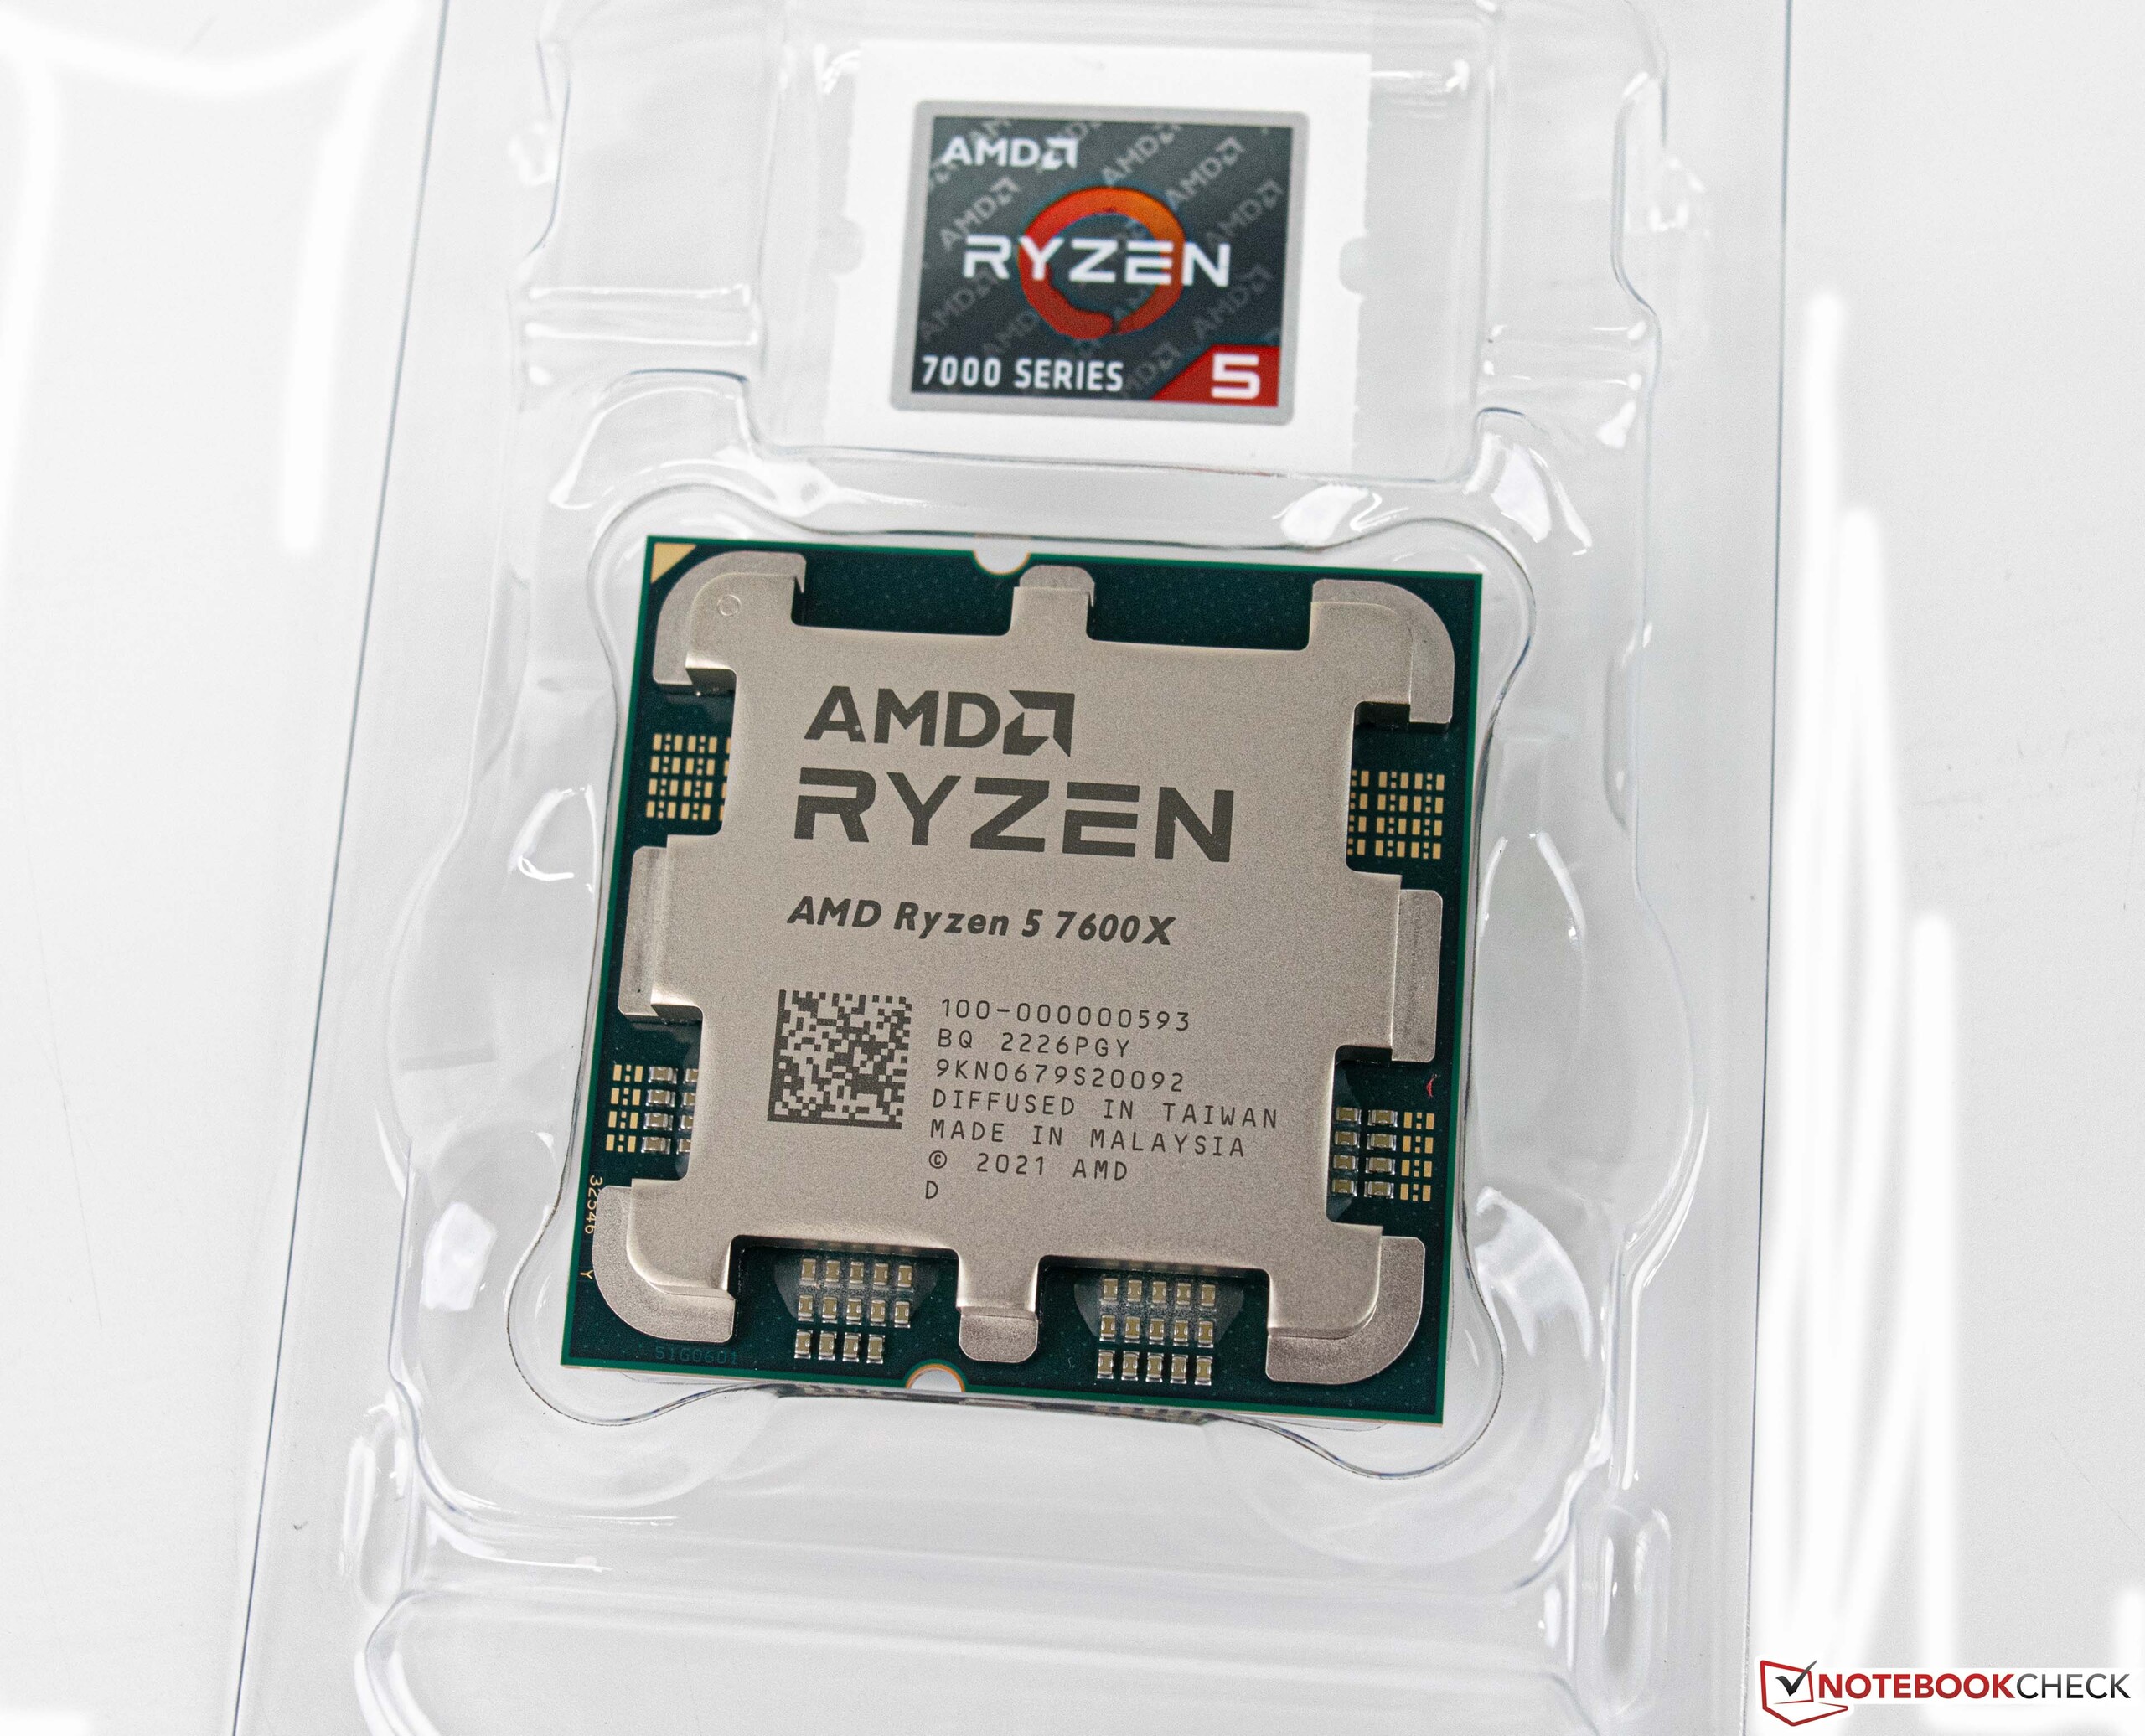
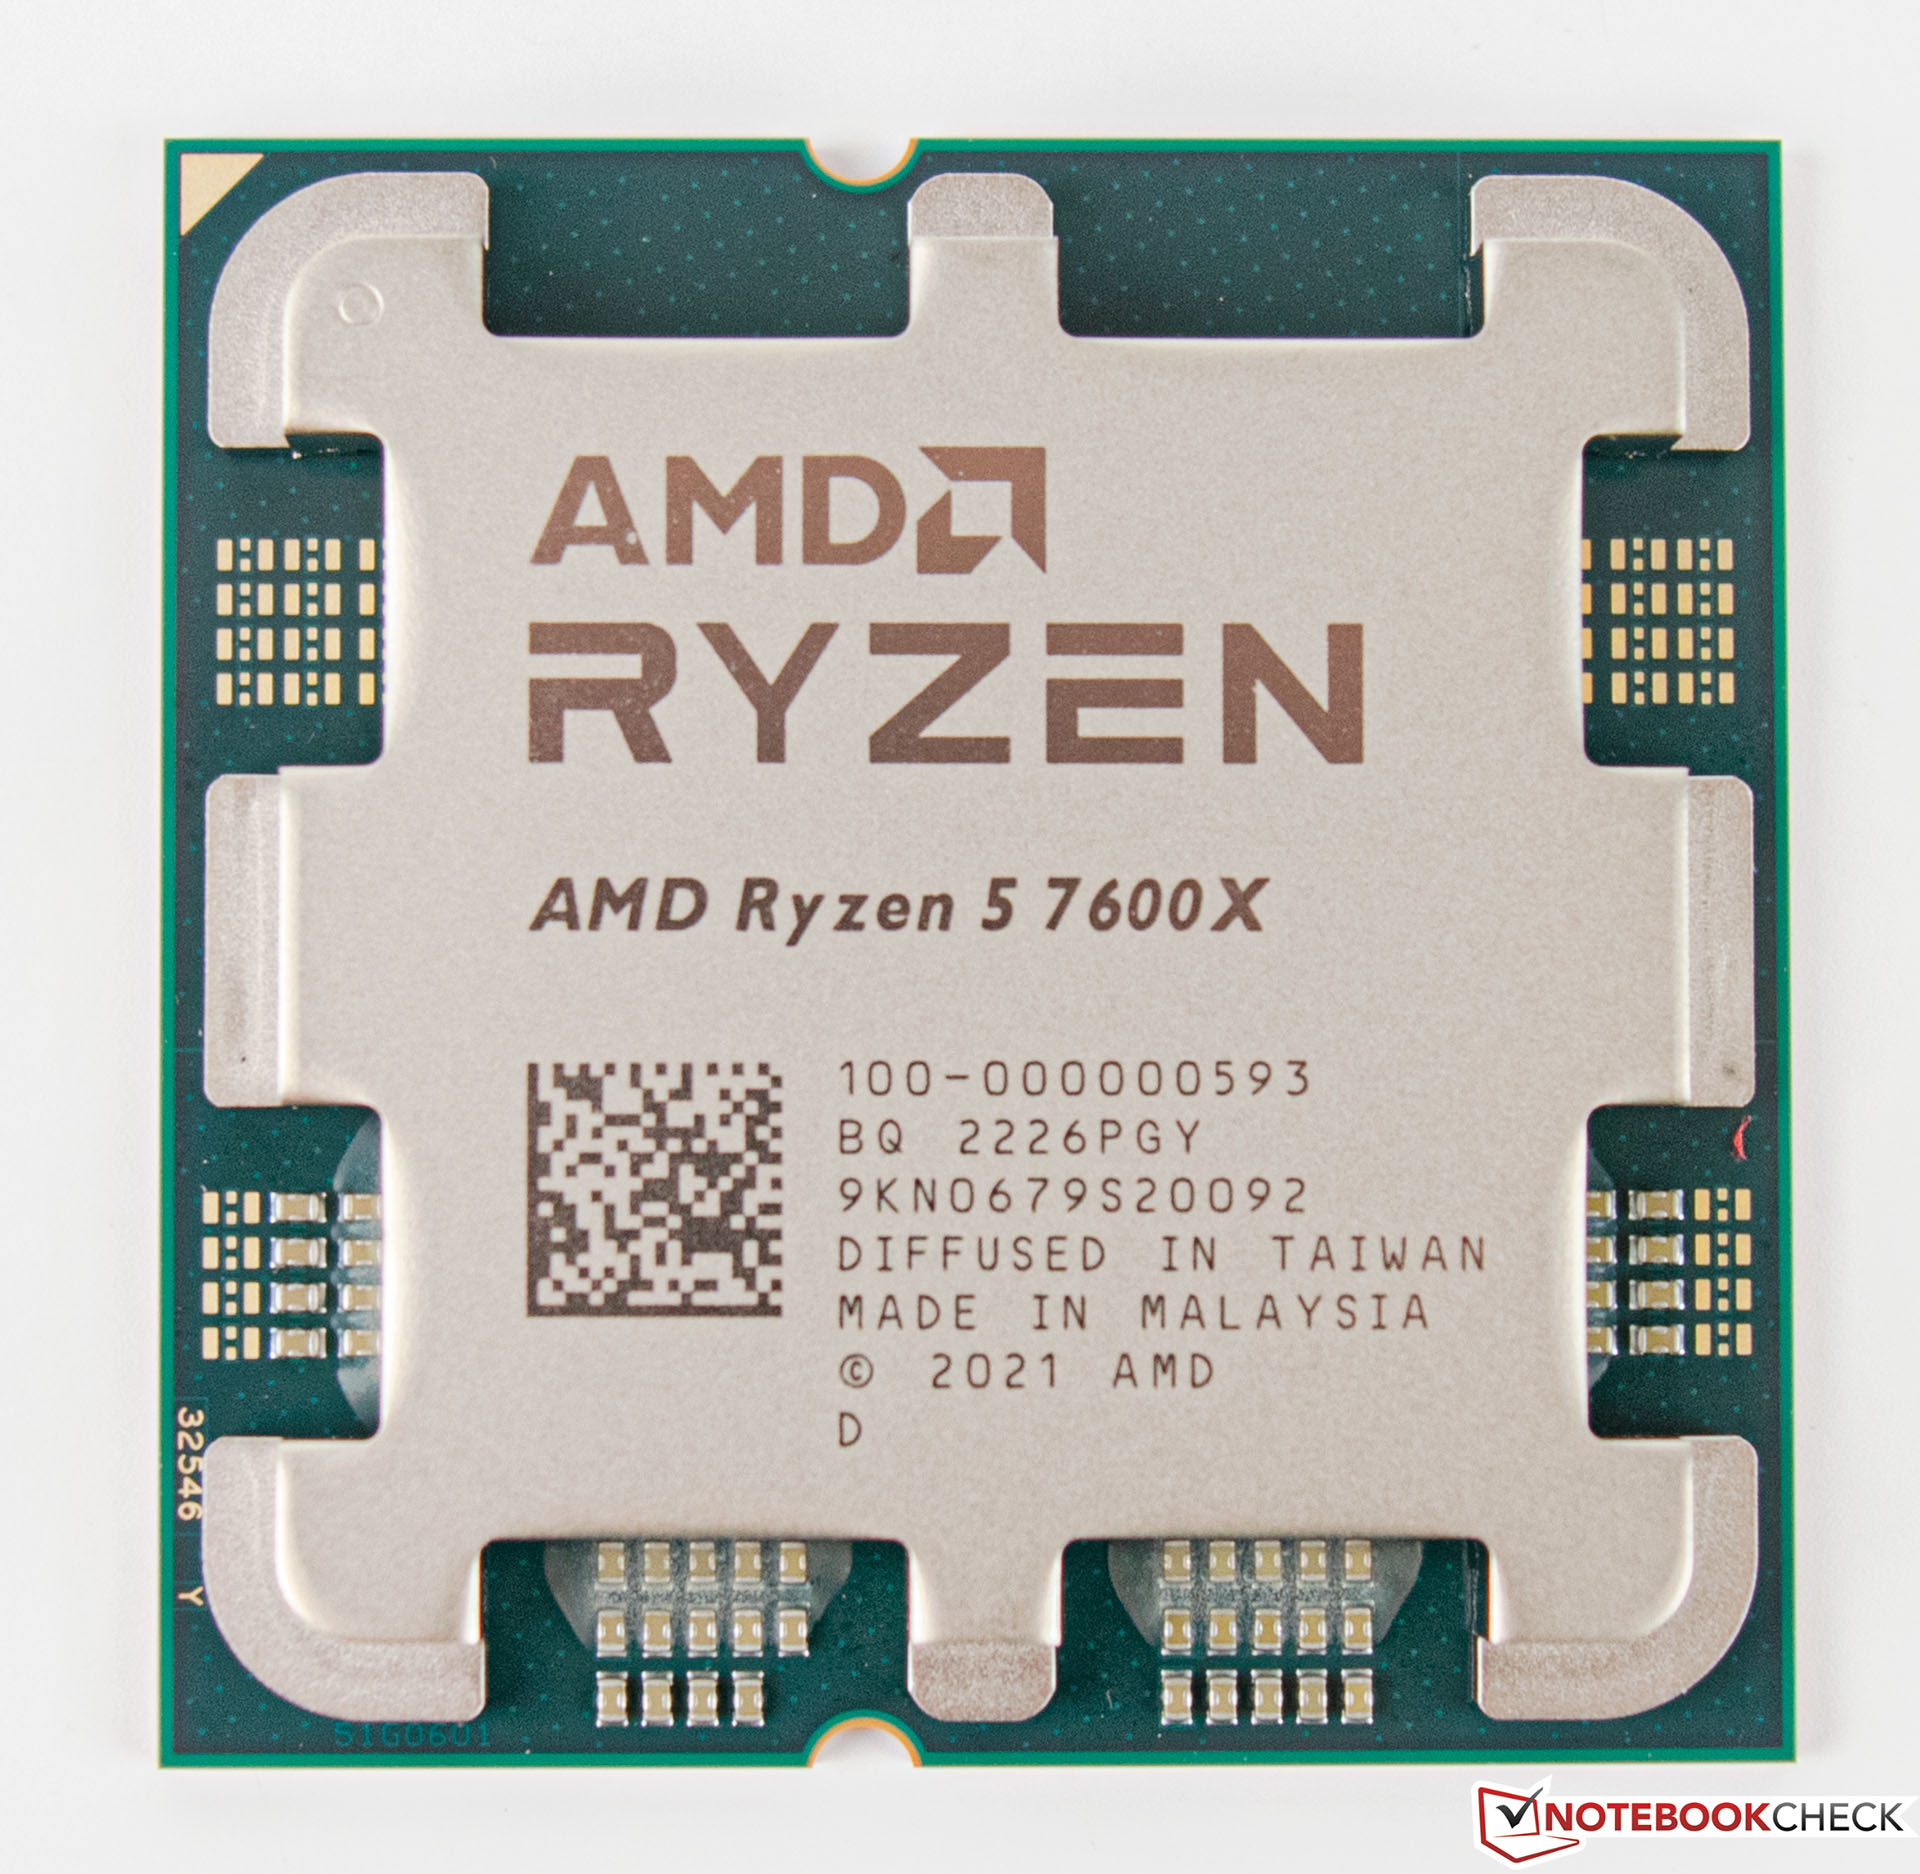
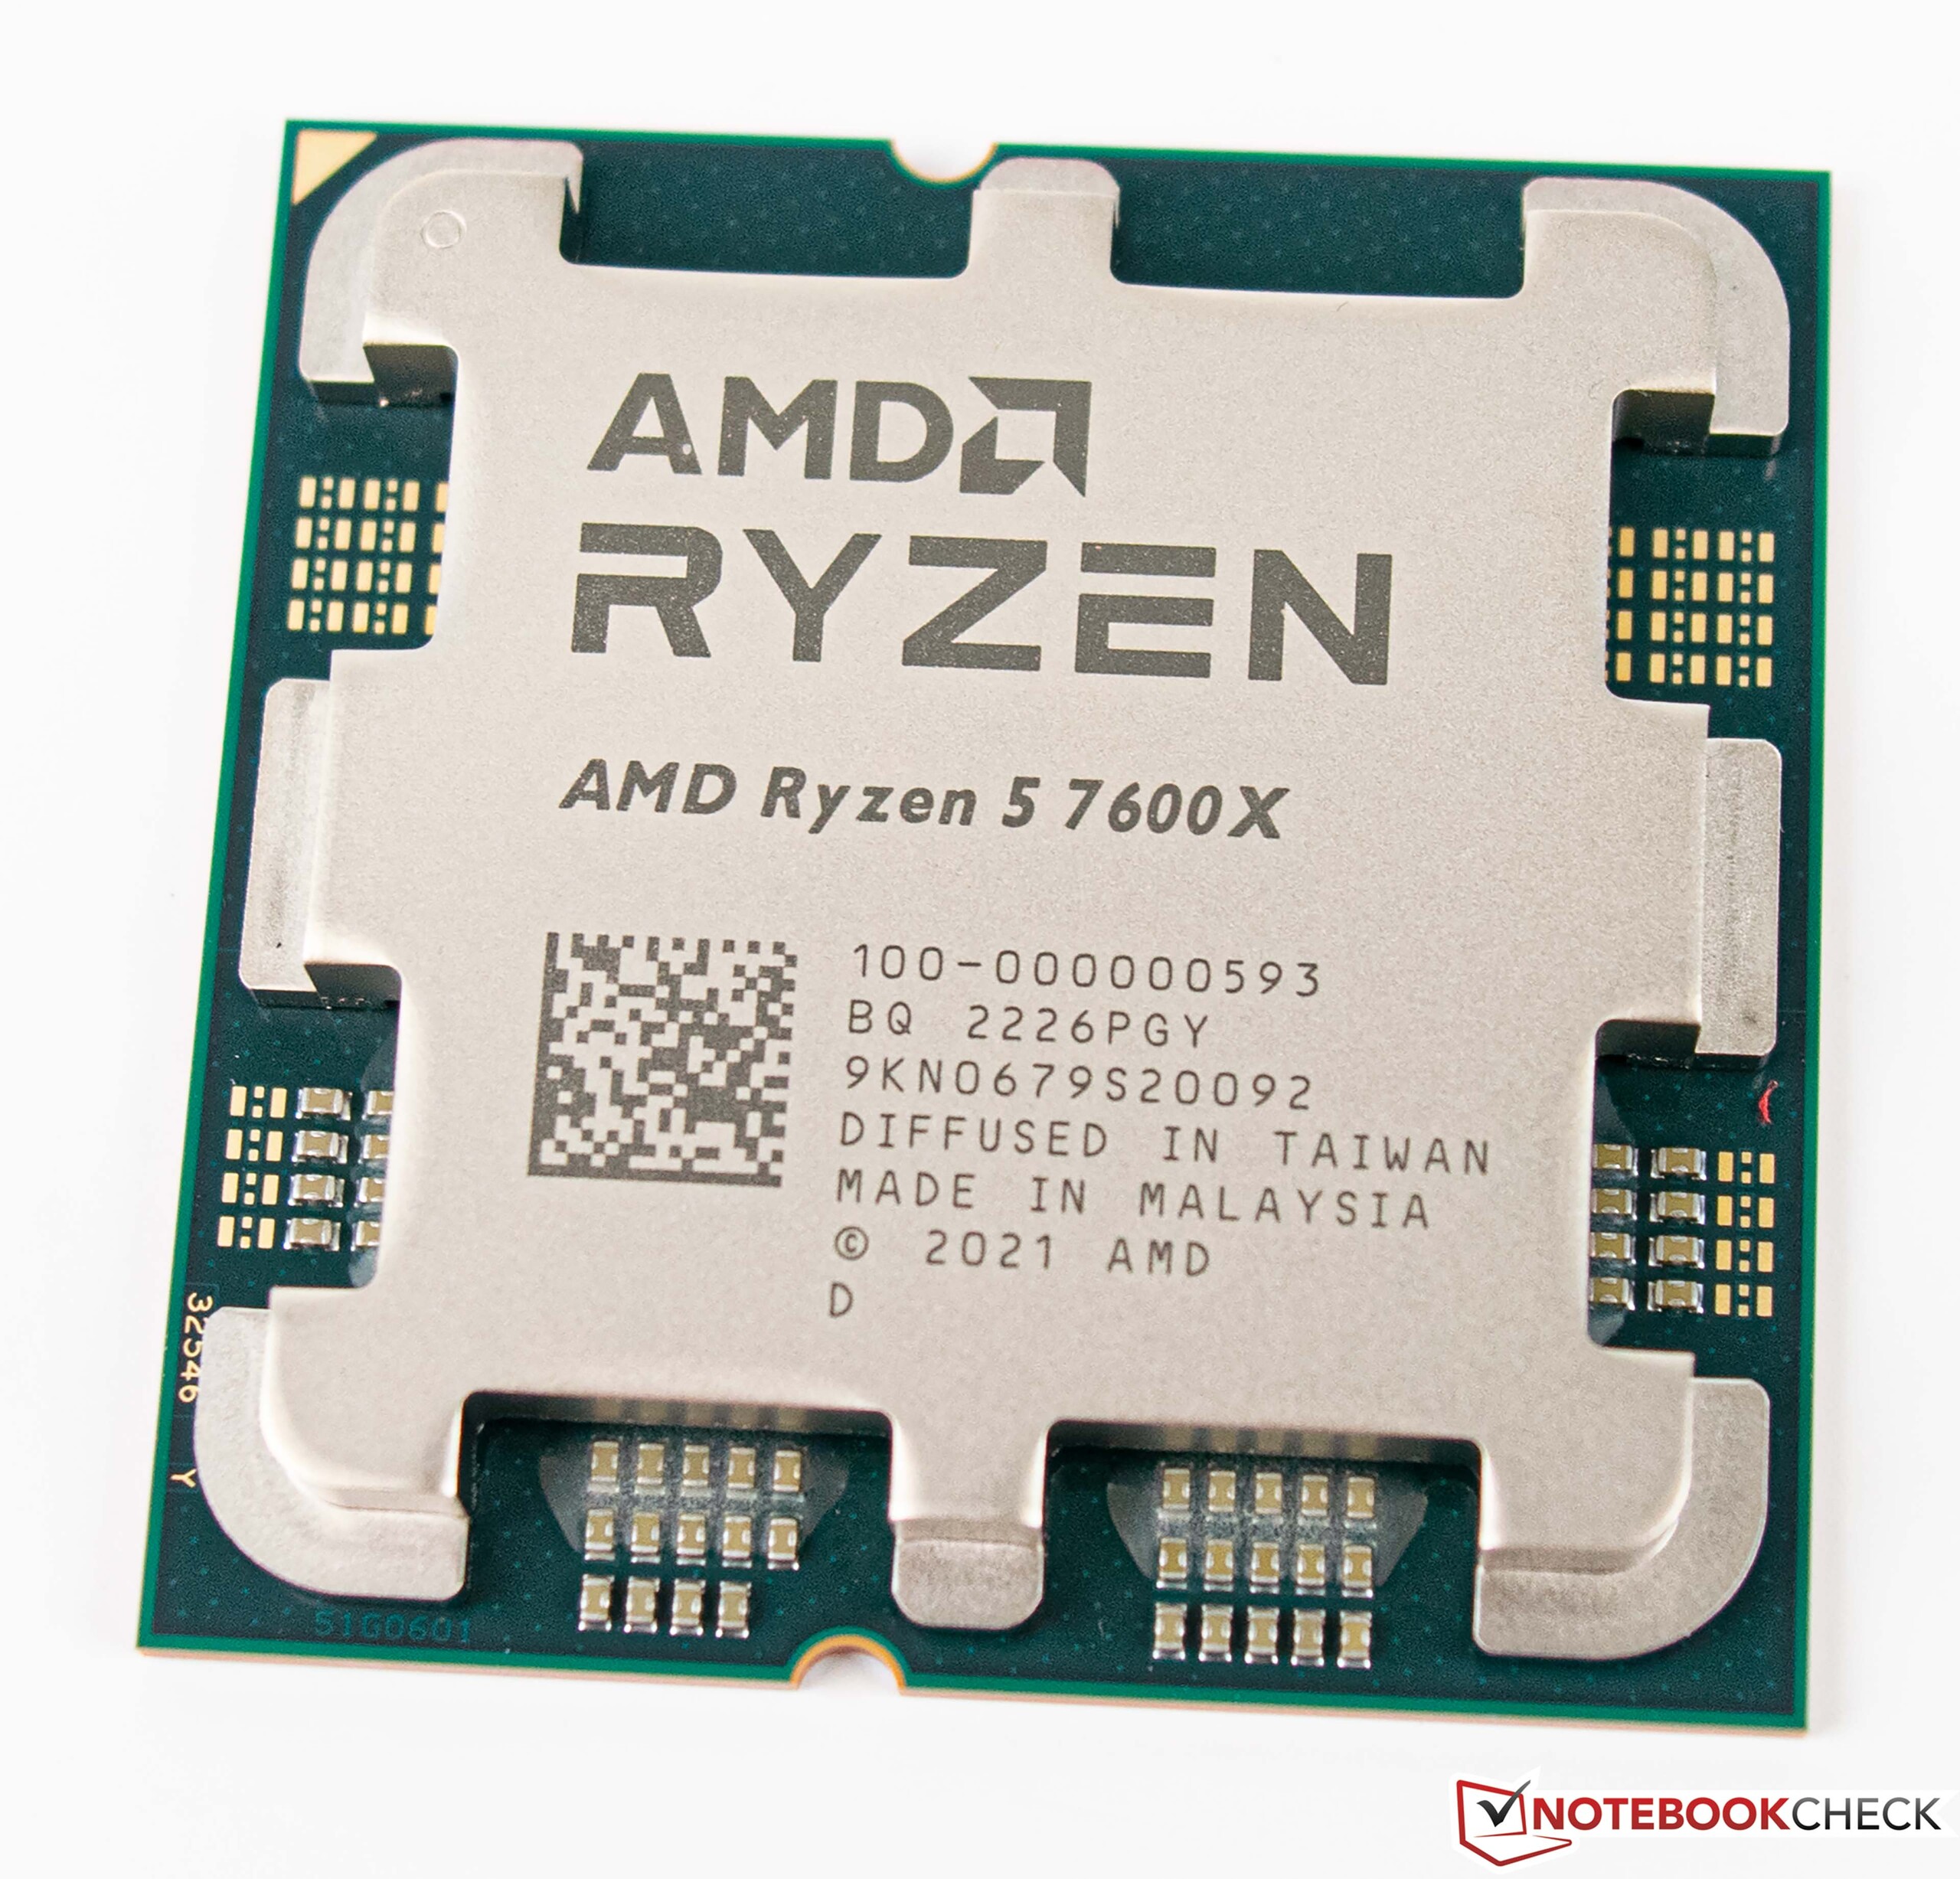
Le processeur lui-même présente d'autres différences visuelles au niveau du dissipateur thermique par rapport aux modèles précédents. En interne, cependant, AMD s'appuie toujours sur la conception dite "chiplet", qui consiste en deux CCD avec huit cœurs chacun et un dé d'E/S dans l'AMD Ryzen 9 7950X. Comme on le sait, les deux CCD communiquent via l'Infinity Fabric avec le die I/O, qui comprend désormais toujours un iGPU en plus du nouveau contrôleur mémoire DDR5.
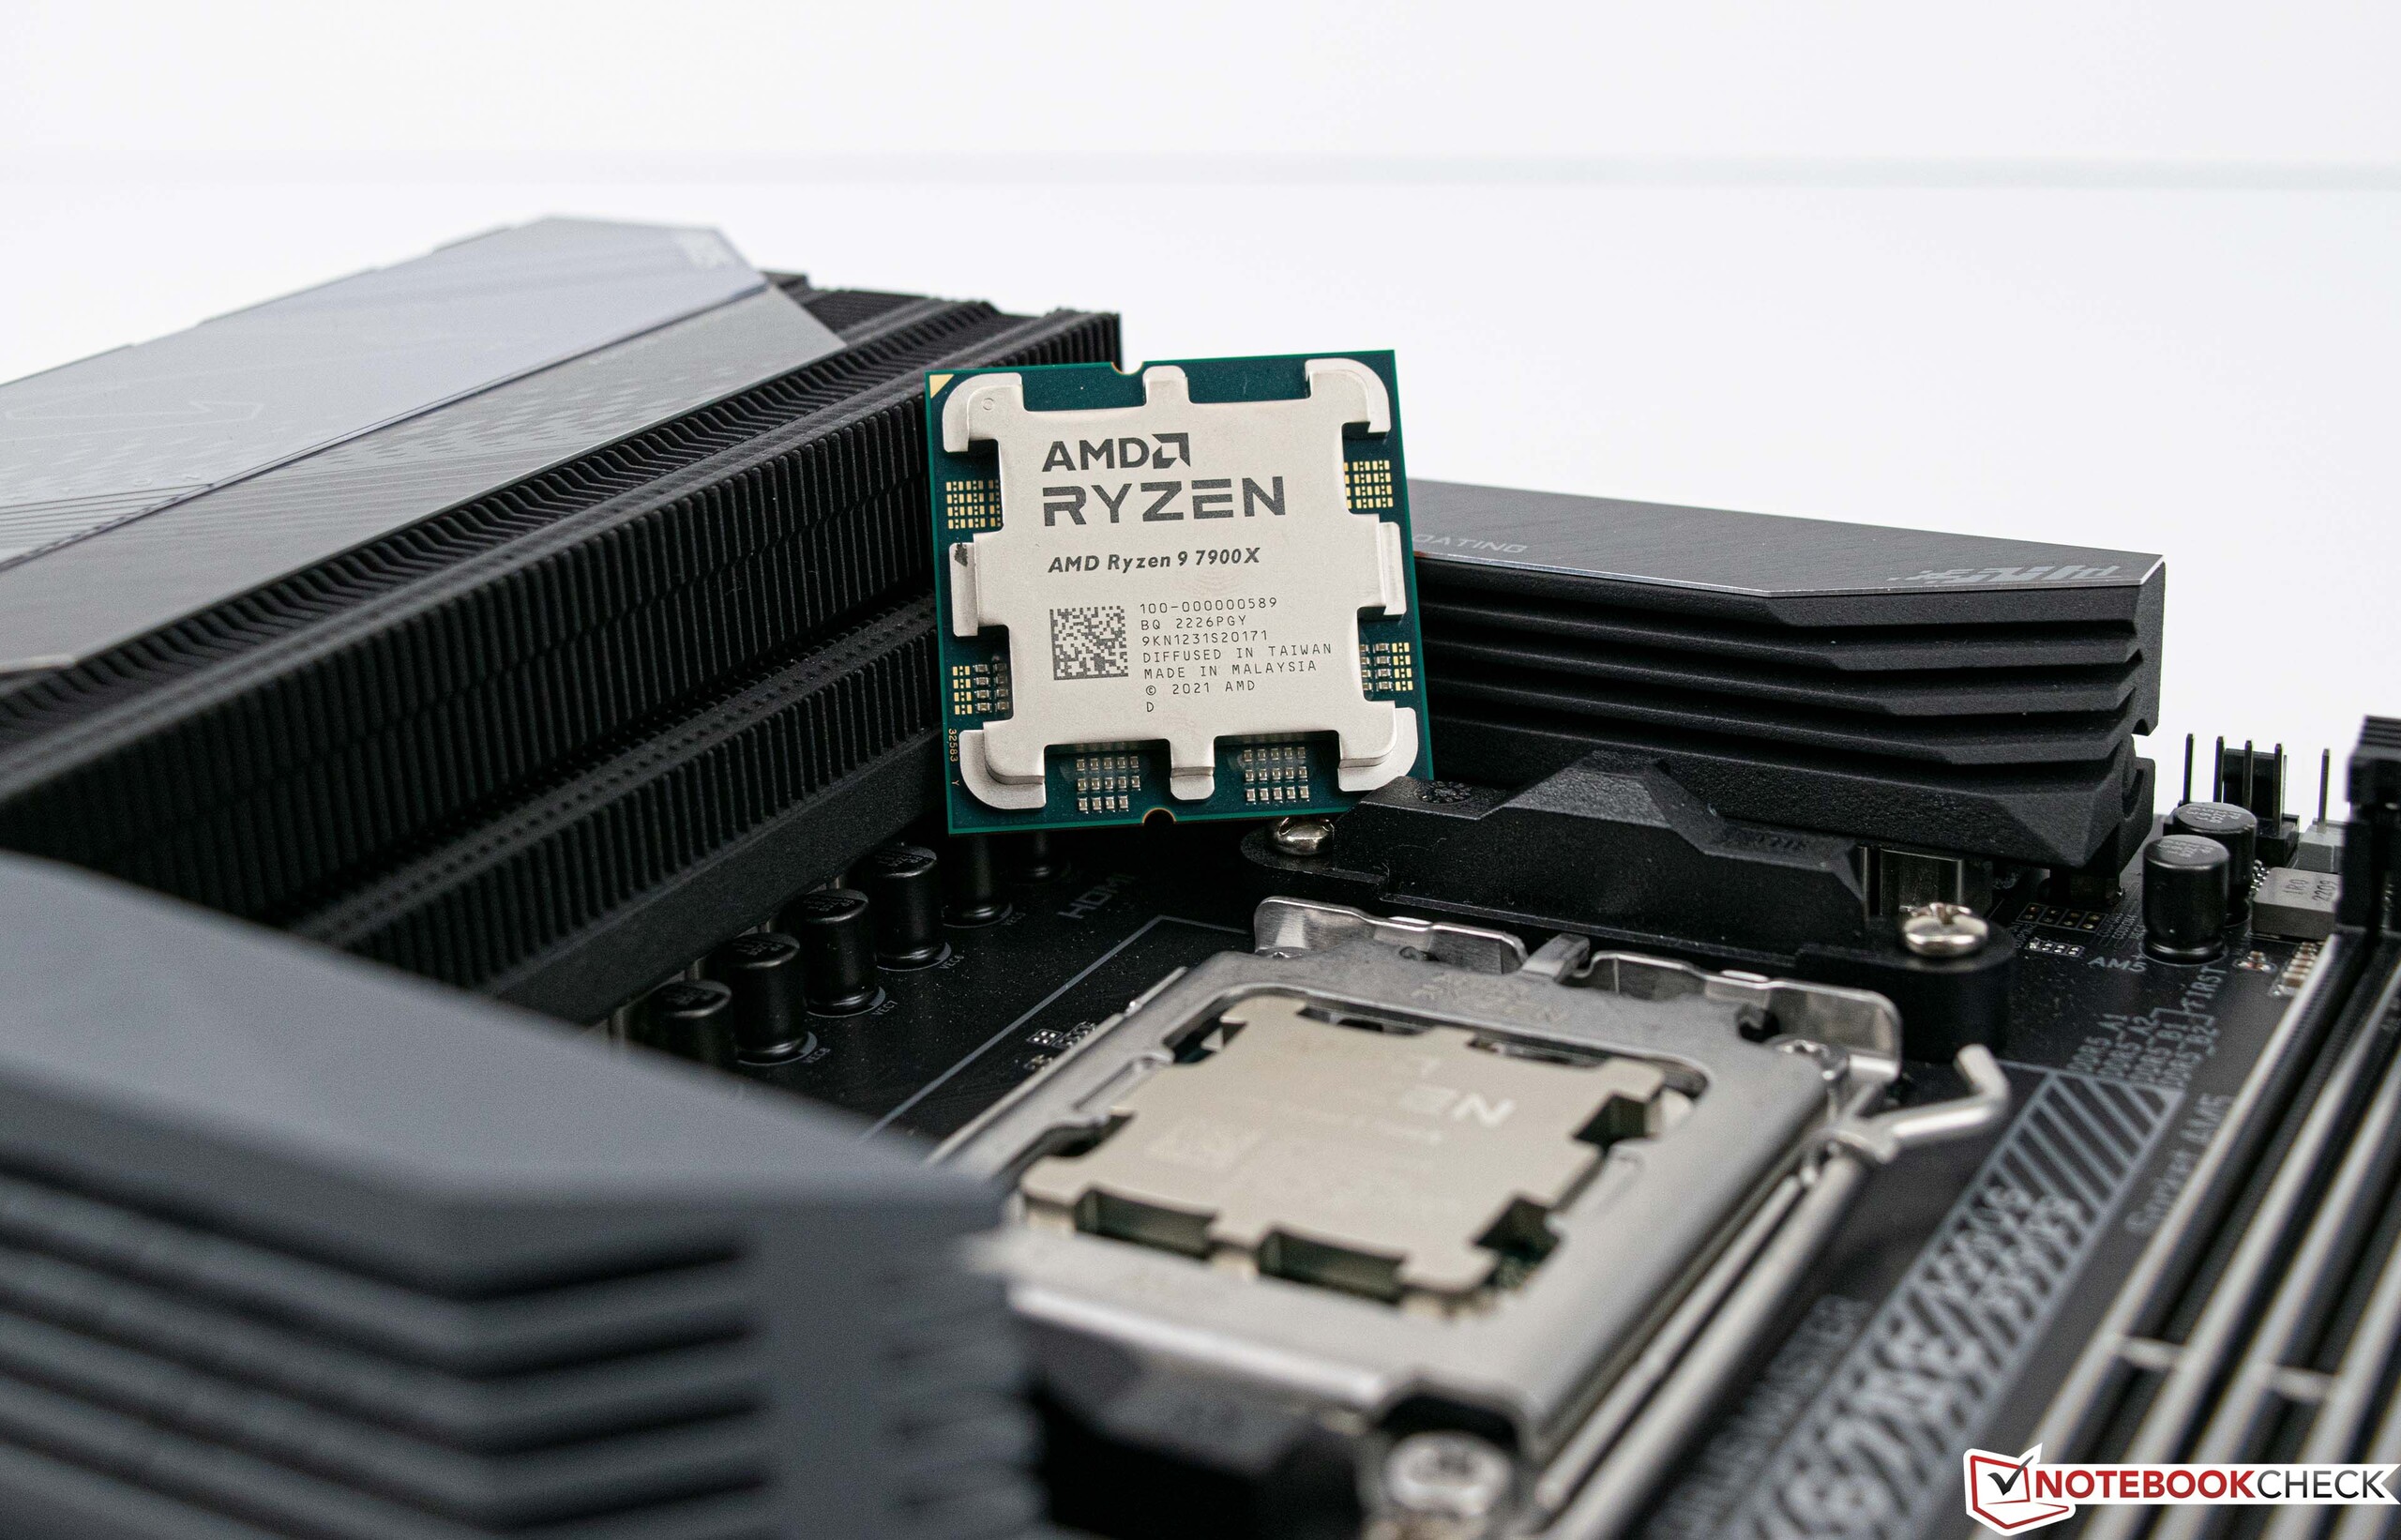
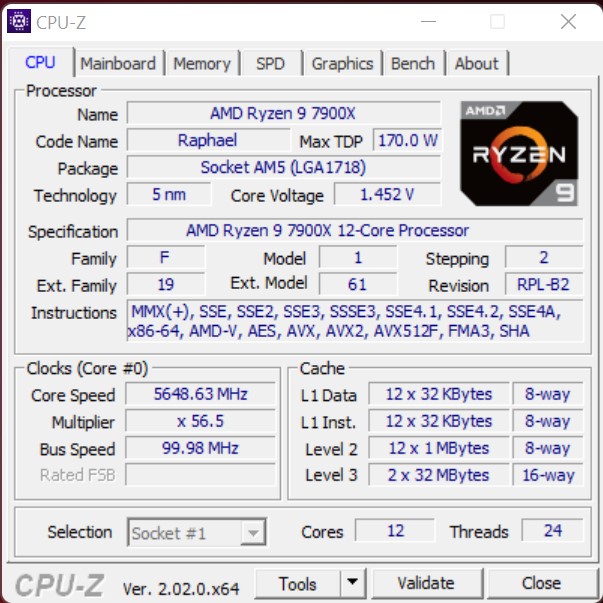
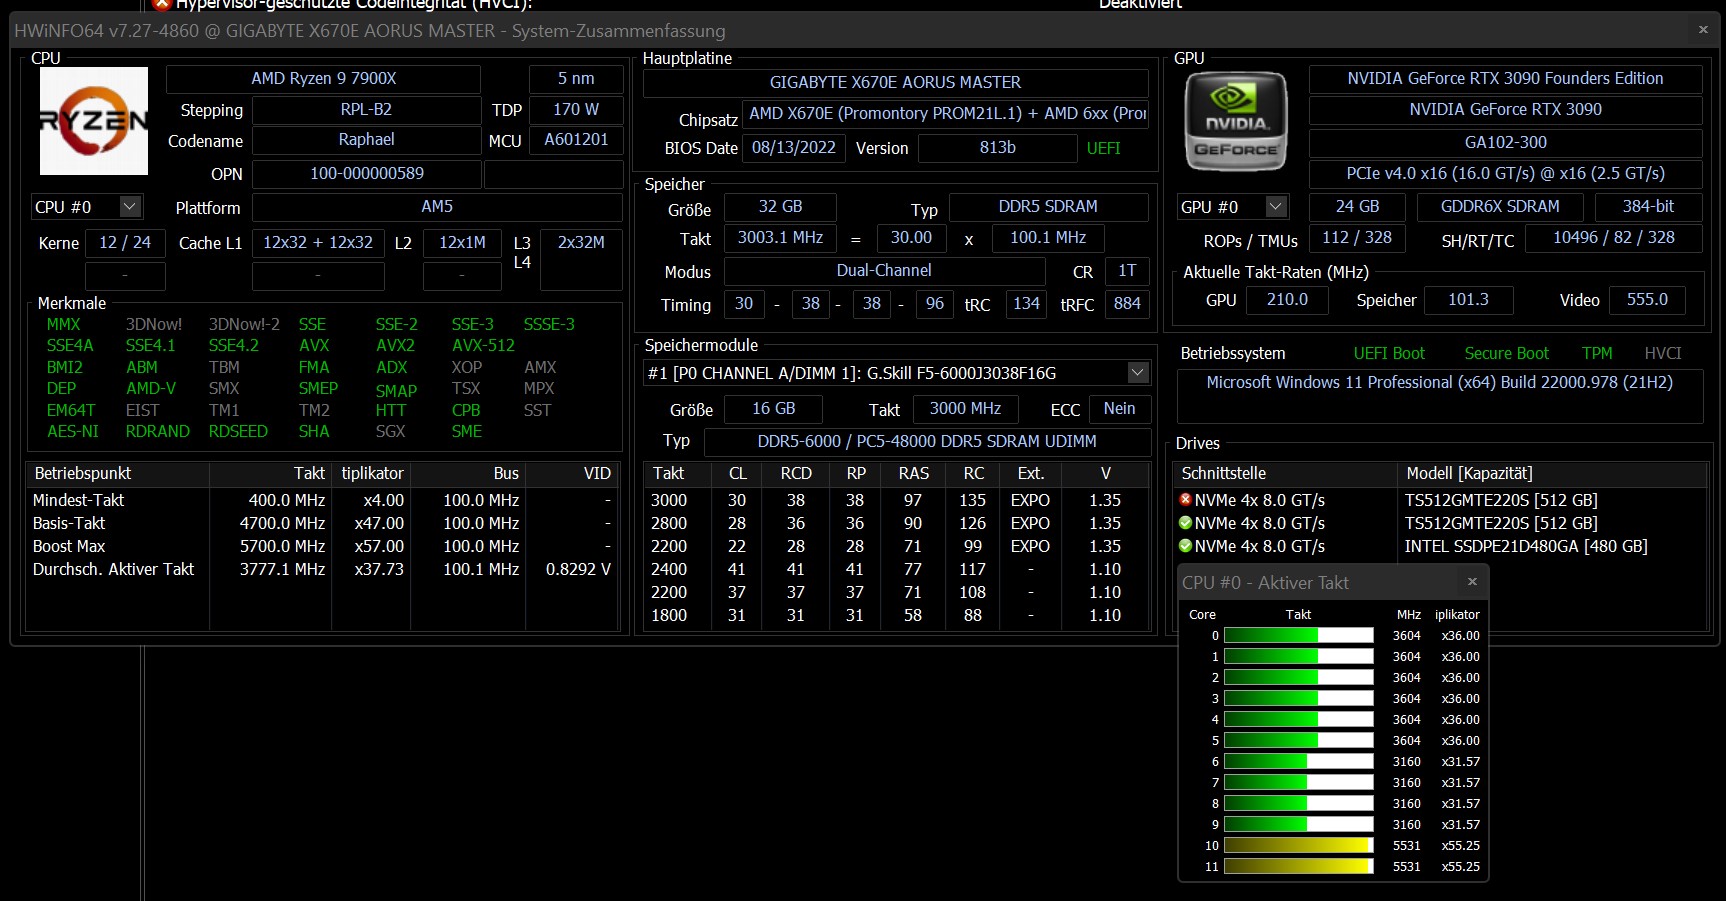
Les nouveaux processeurs sont fabriqués chez TSMC et AMD franchit une nouvelle étape avec le processus 5 nm. Des fréquences d'horloge plus élevées peuvent ainsi être atteintes, ce qu'AMD utilise également très bien. Le Ryzen 9 7950X peut atteindre jusqu'à 5,7 GHz en mode Turbo. Le Ryzen 9 7900X a encore 5,6 GHz dans sa fiche technique. A ce stade, nous pouvons déjà dire que ces fréquences d'horloge ont également été atteintes dans nos tests. Avec l'IPC plus élevé et les fréquences d'horloge considérablement augmentées, les utilisateurs peuvent s'attendre à une augmentation décente des performances.
Cependant, le gain de performance a un inconvénient, car le TDP des nouveaux modèles Ryzen 9 a augmenté jusqu'à 170 W. AMD spécifie même jusqu'à 230 W pour l'ensemble du package (PPT - Package Power Tracking). Toutefois, cela reste inférieur à ce qu'Intel autorise pour ses processeurs actuels - jusqu'à 241 W en charge.
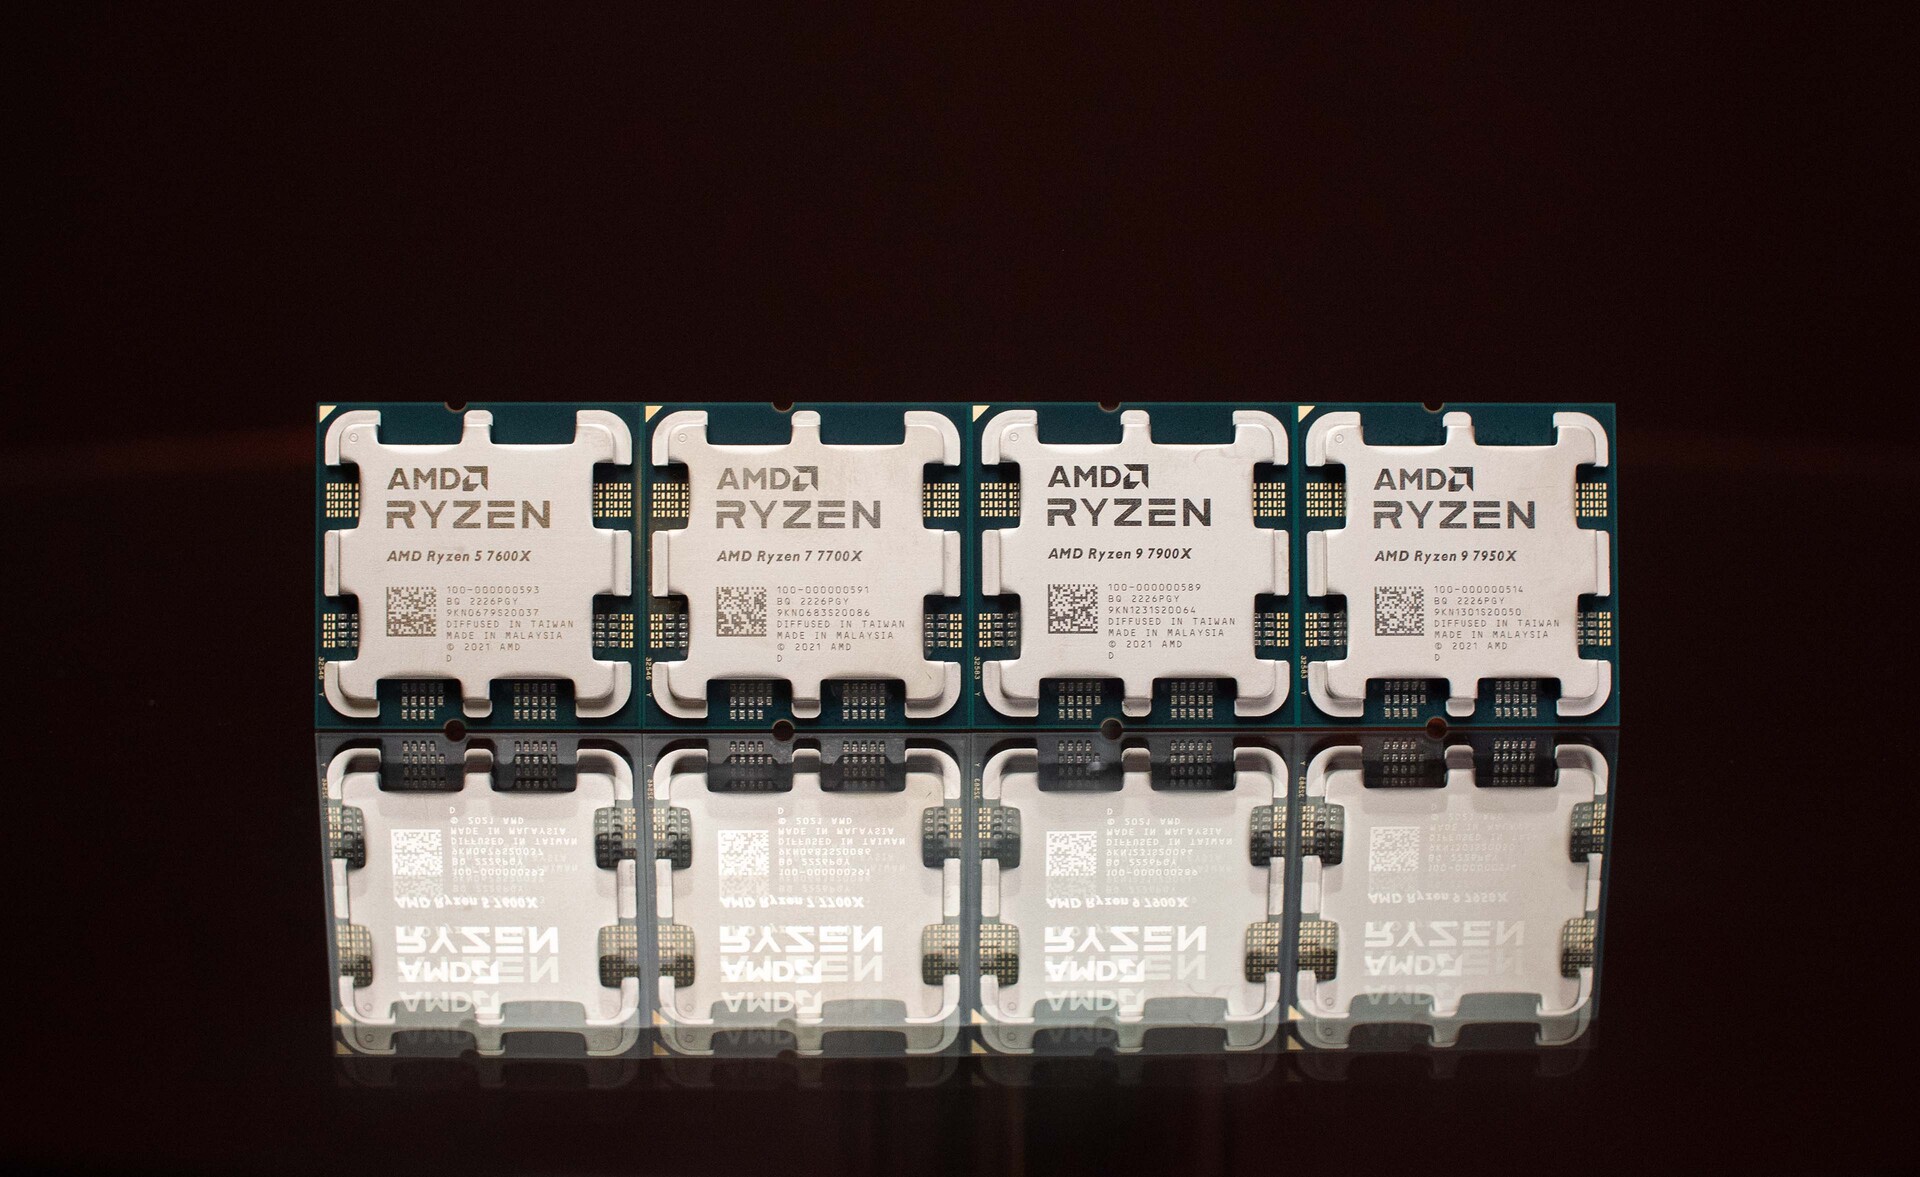
La famille AMD Ryzen 7000 en un coup d'œil
| Modèle | Cœurs/Treads | Horloge de base | Horloge turbo | Cache L2 | Cache L3 | TDP | PPT | Prix de lancement |
|---|---|---|---|---|---|---|---|---|
| Ryzen 9 7950X | 16/32 | 4,5 GHz | 5,7 GHz | 16x 1 Mo | 64 Mo | 170 W | 230 W | 699 USD / 849 EUR |
| Ryzen 9 7900X | 12/24 | 4,7 GHz | 5,6 GHz | 12x 1 MB | 64 MB | 170 W | 230 W | 549 USD / 669 EUR |
| Ryzen 7 7700X | 8/16 | 4,5 GHz | 5,4 GHz | 8x 1 Mo | 32 Mo | 105 W | 142 W | 399 USD / 479 EUR |
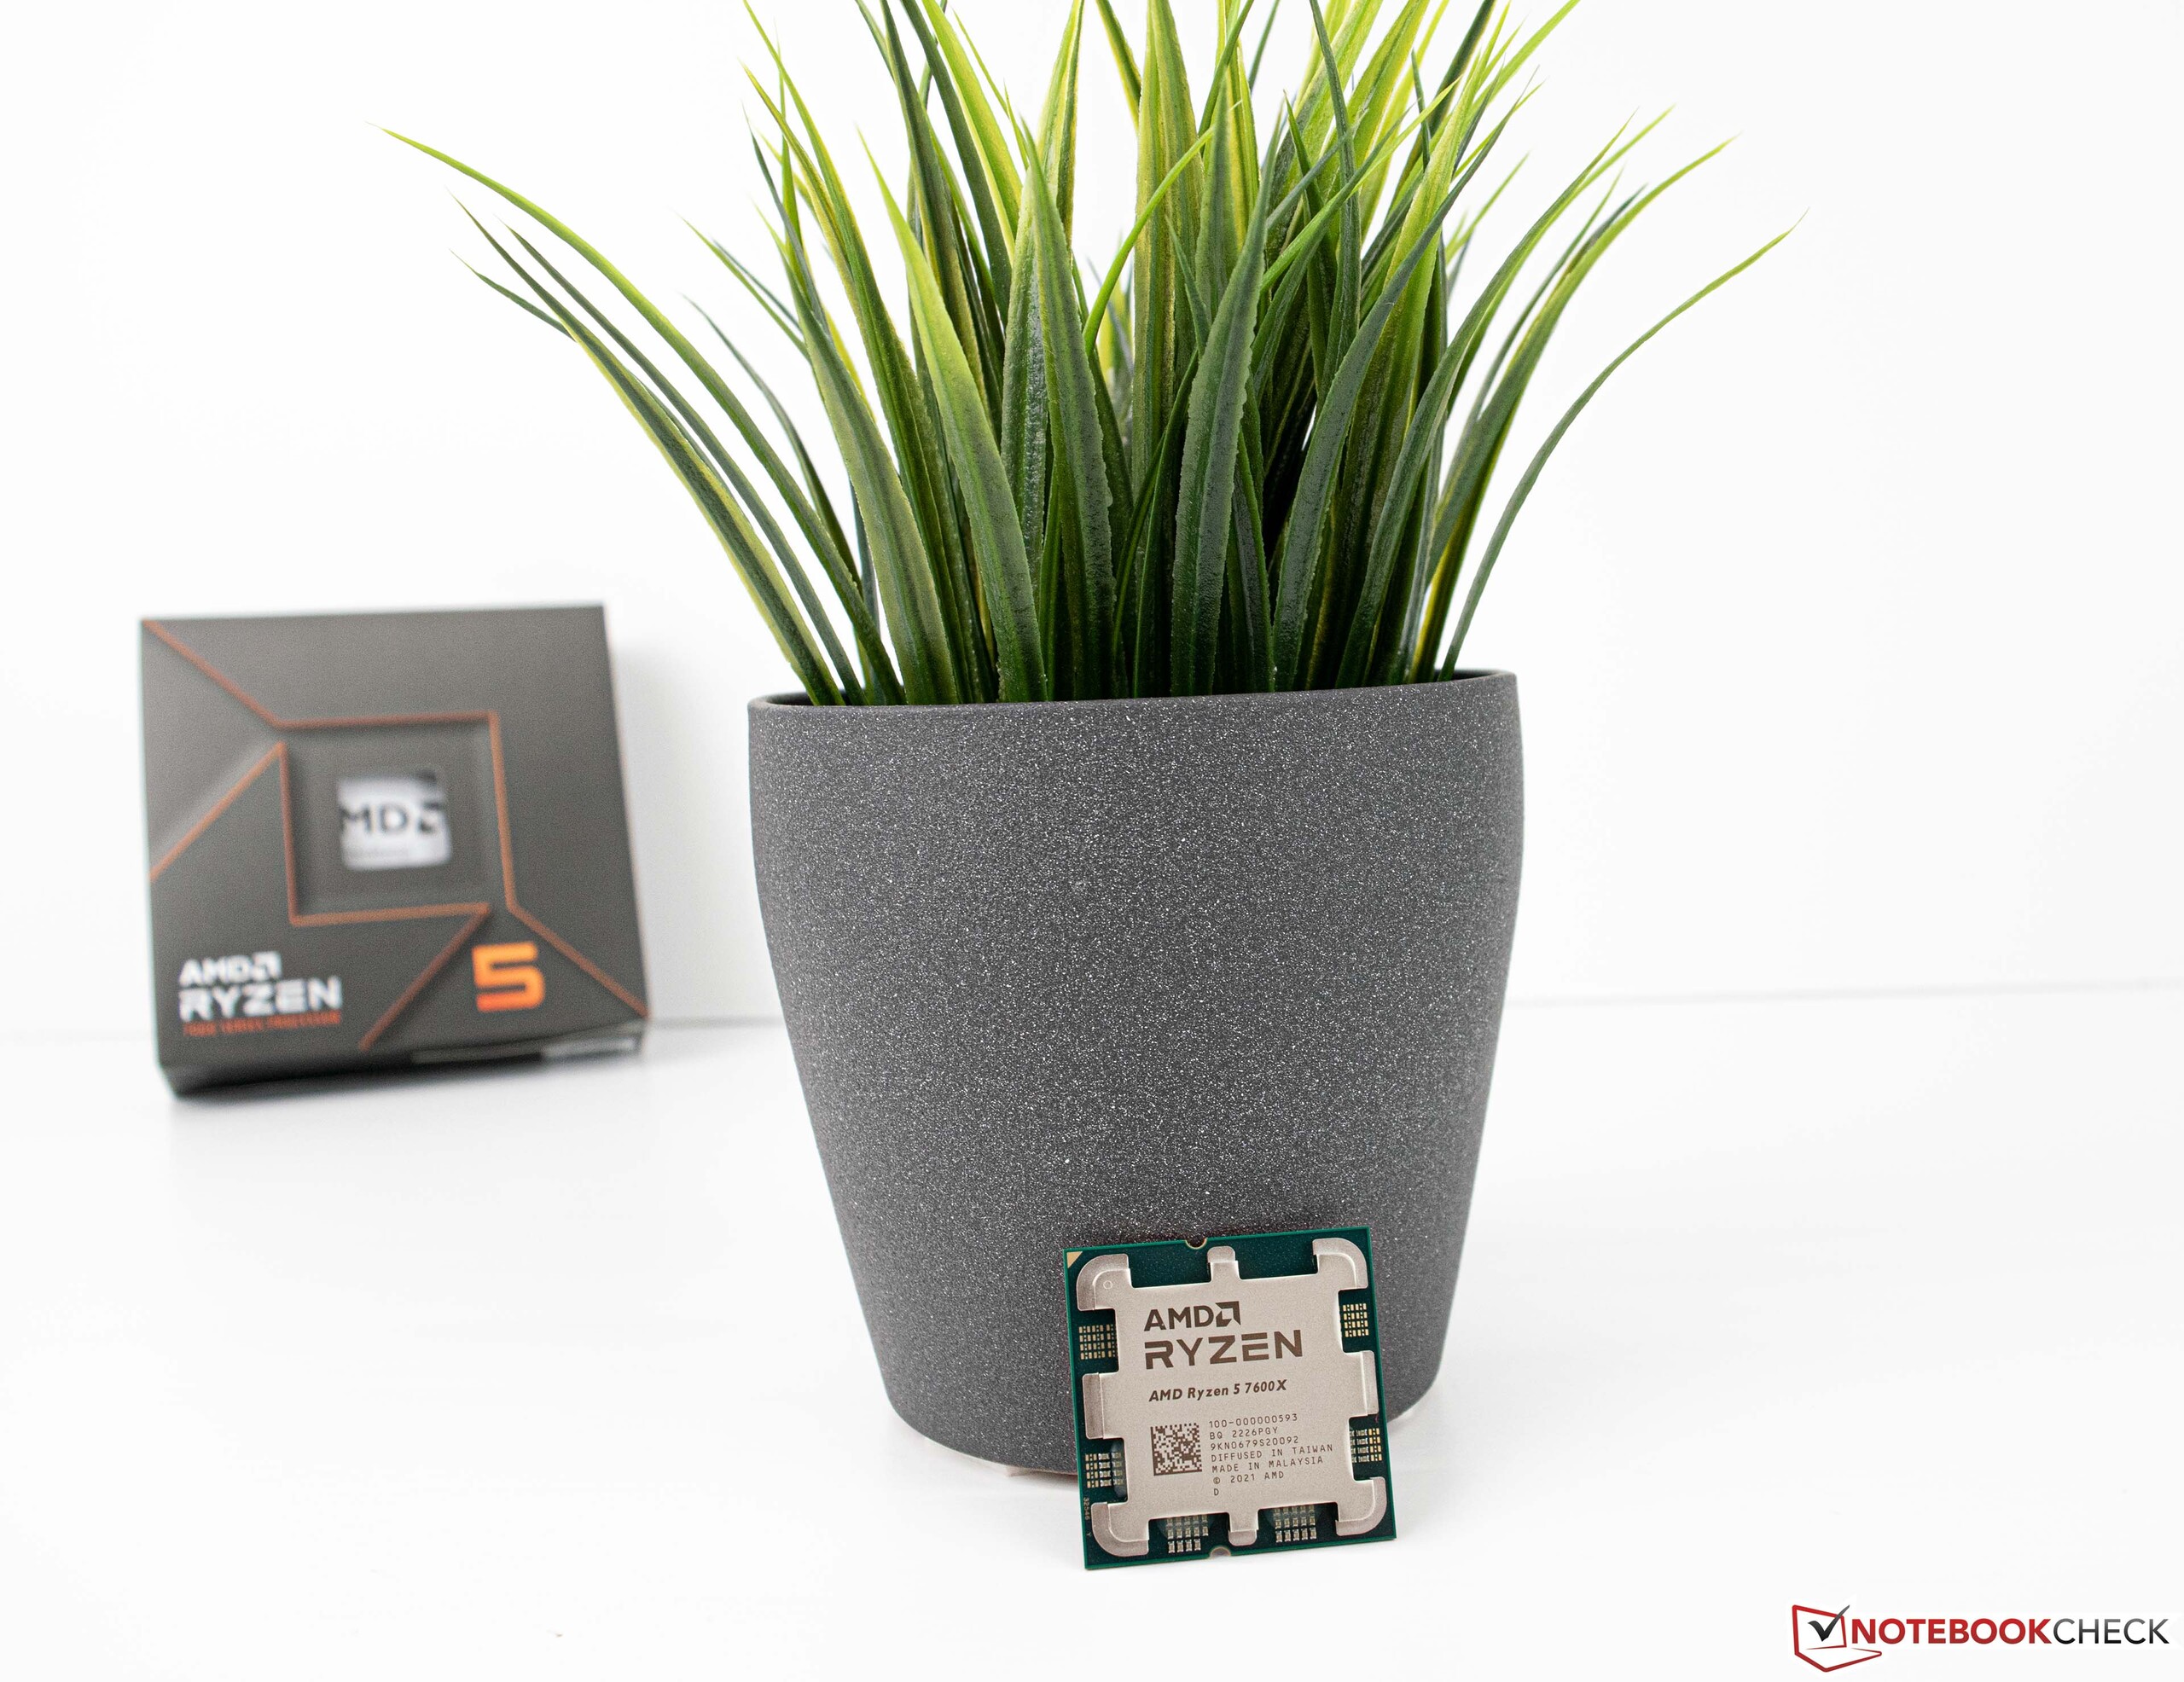
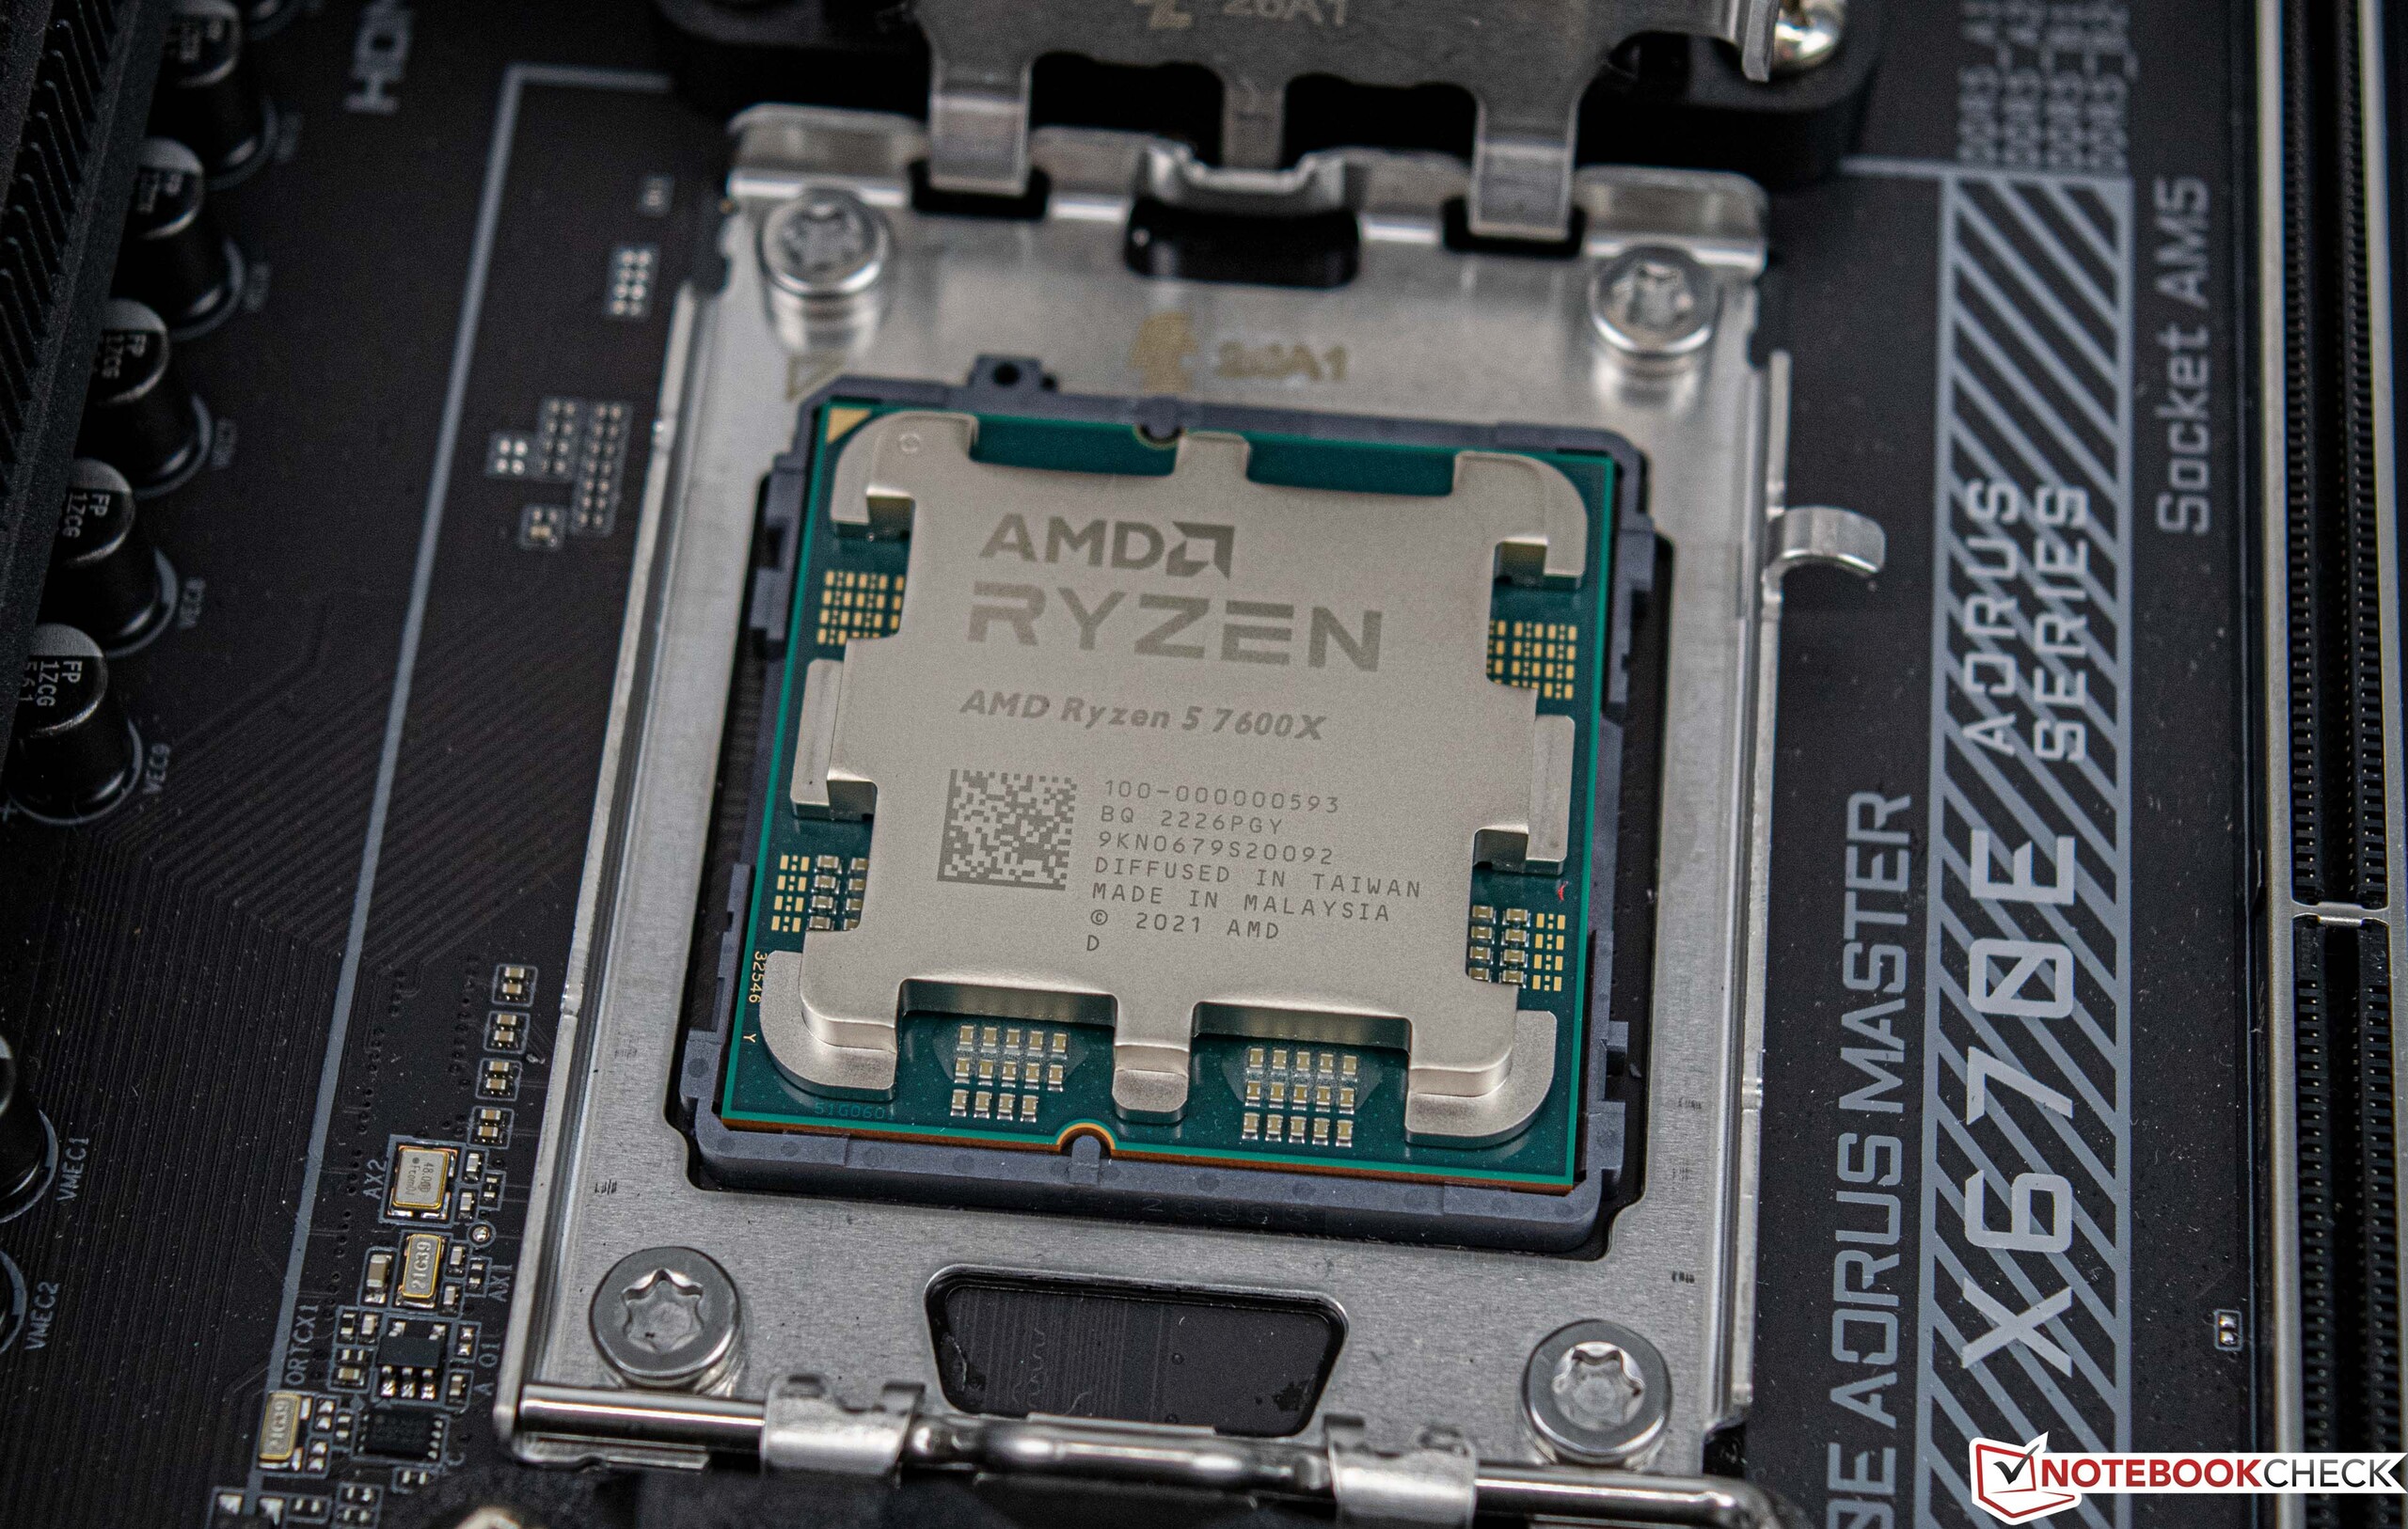
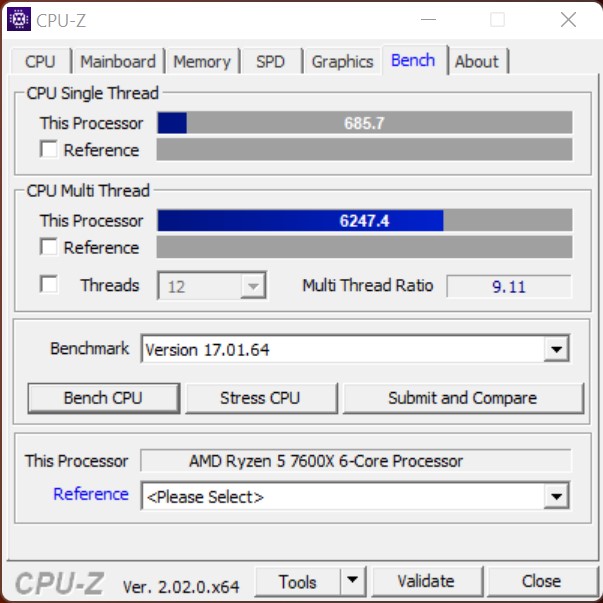
| Ryzen 5 7600X | 6/12 | 4,7 GHz | 5,3 GHz | 6x 1 MB | 32 MB | 105 W | 142 W | 299 USD / 359 EUR |
Le système d'essai
Nous utilisons le système suivant pour les benchmarks et tests suivants
- Banc d'essai Raijintek Pean
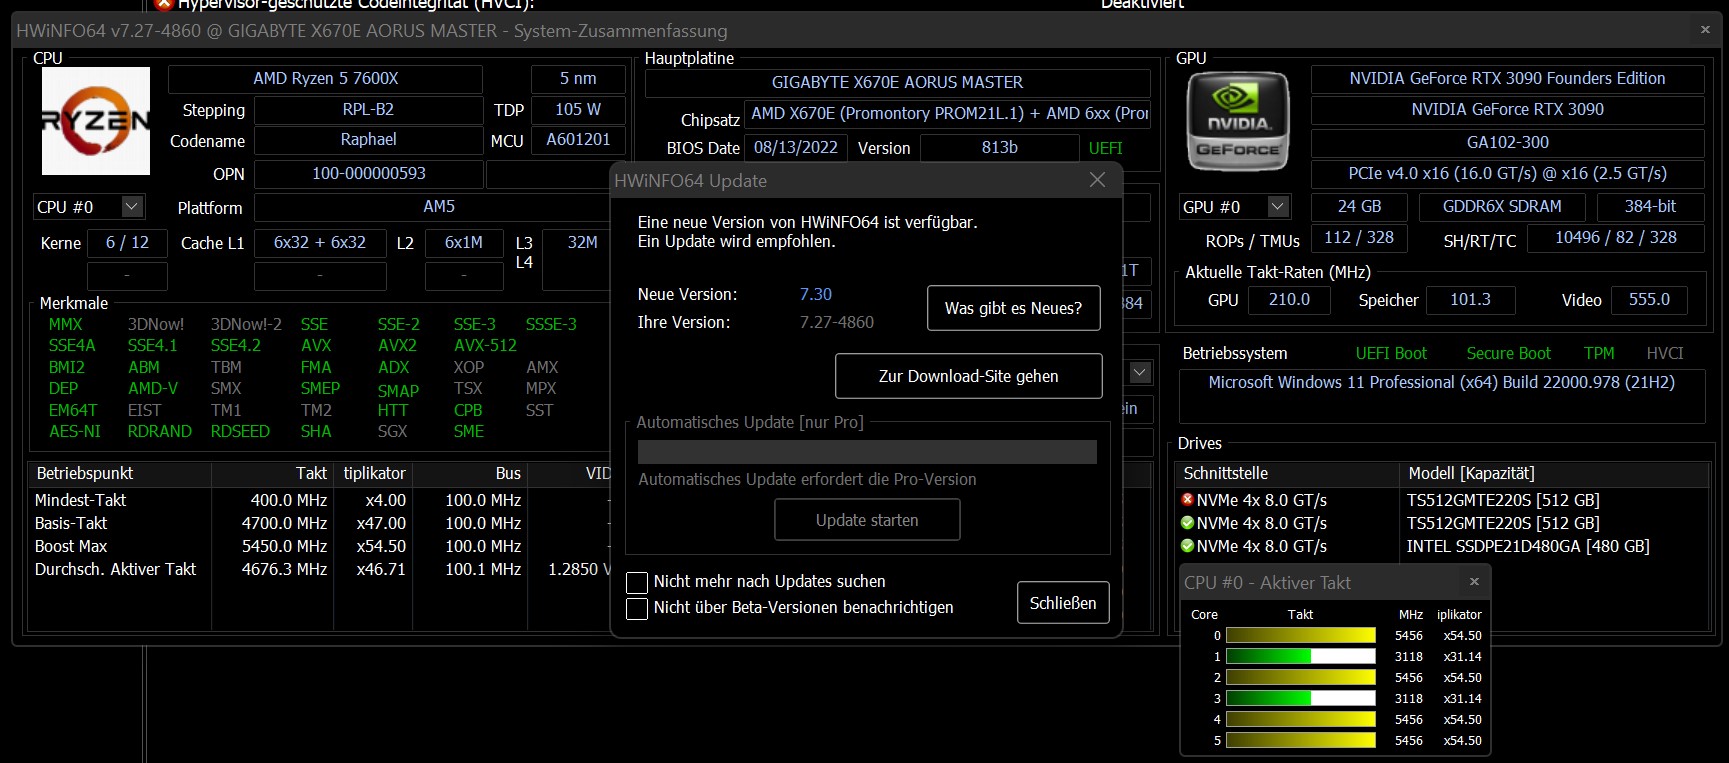
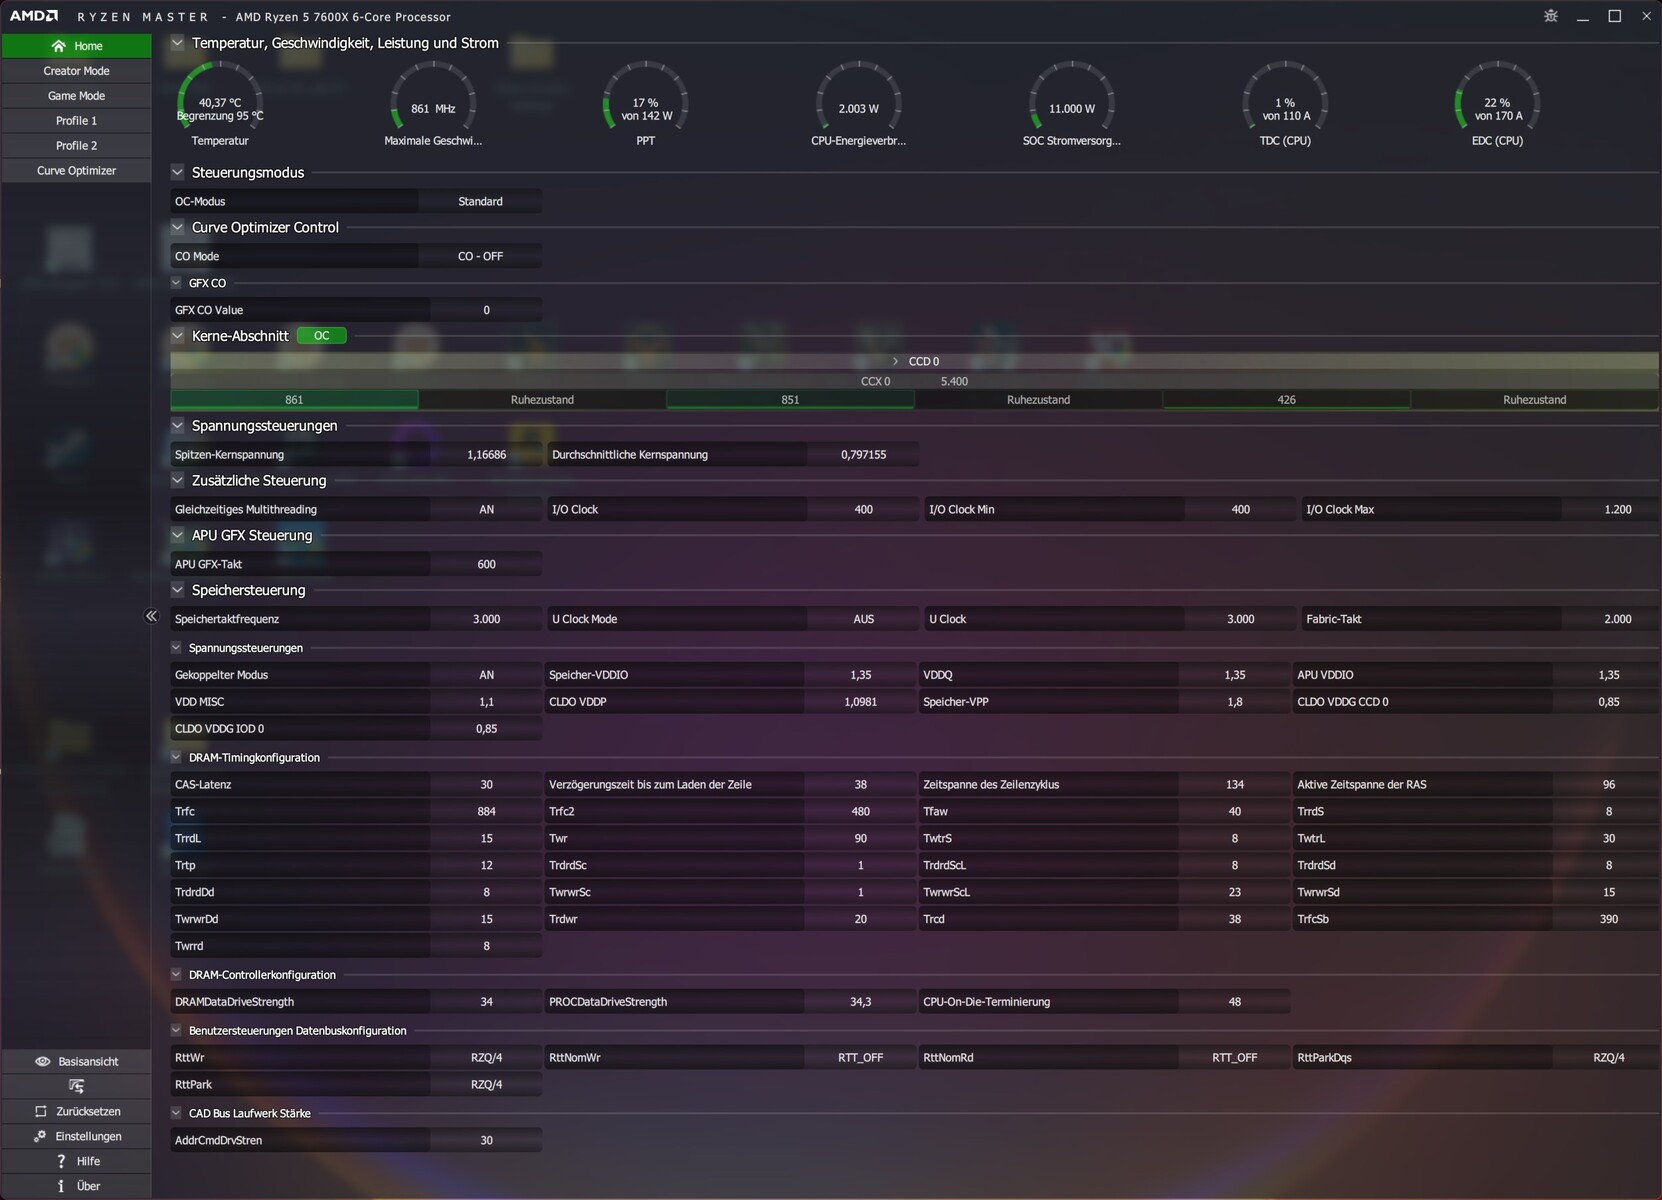
- AMD Ryzen 9 7900X, AMD Ryzen 5 7600X
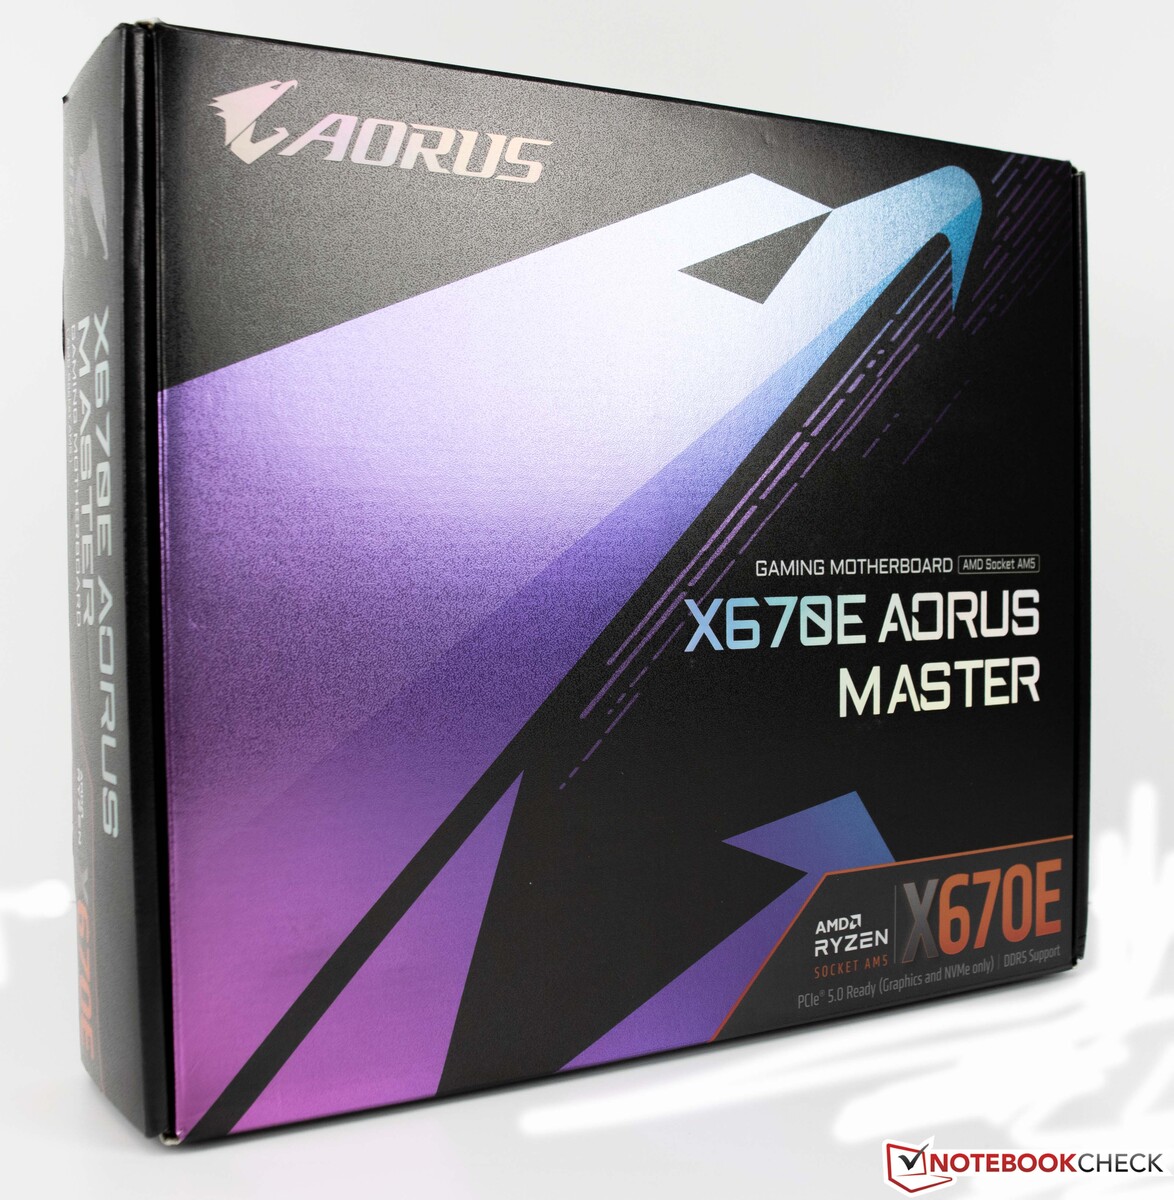
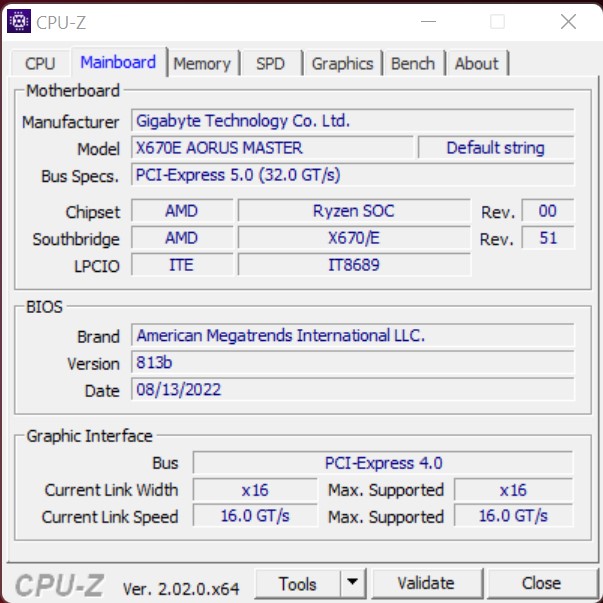
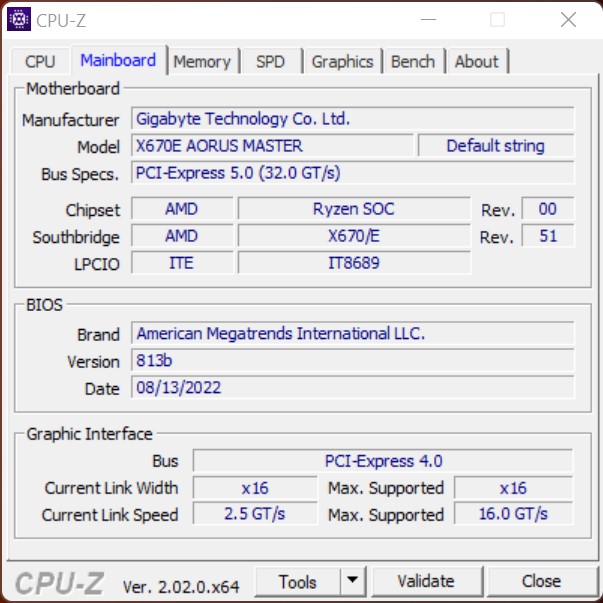
- Gigabyte X670E Aorus Master, BIOS : 813b
- Alphacool Eisbear 280 AiO
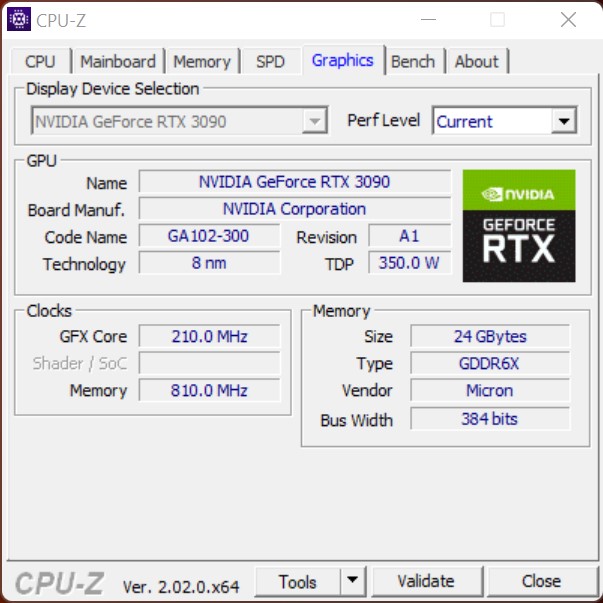
- Nvidia GeForce RTX 3090 Founders Edition
- Alimentation Corsair HX 1200i
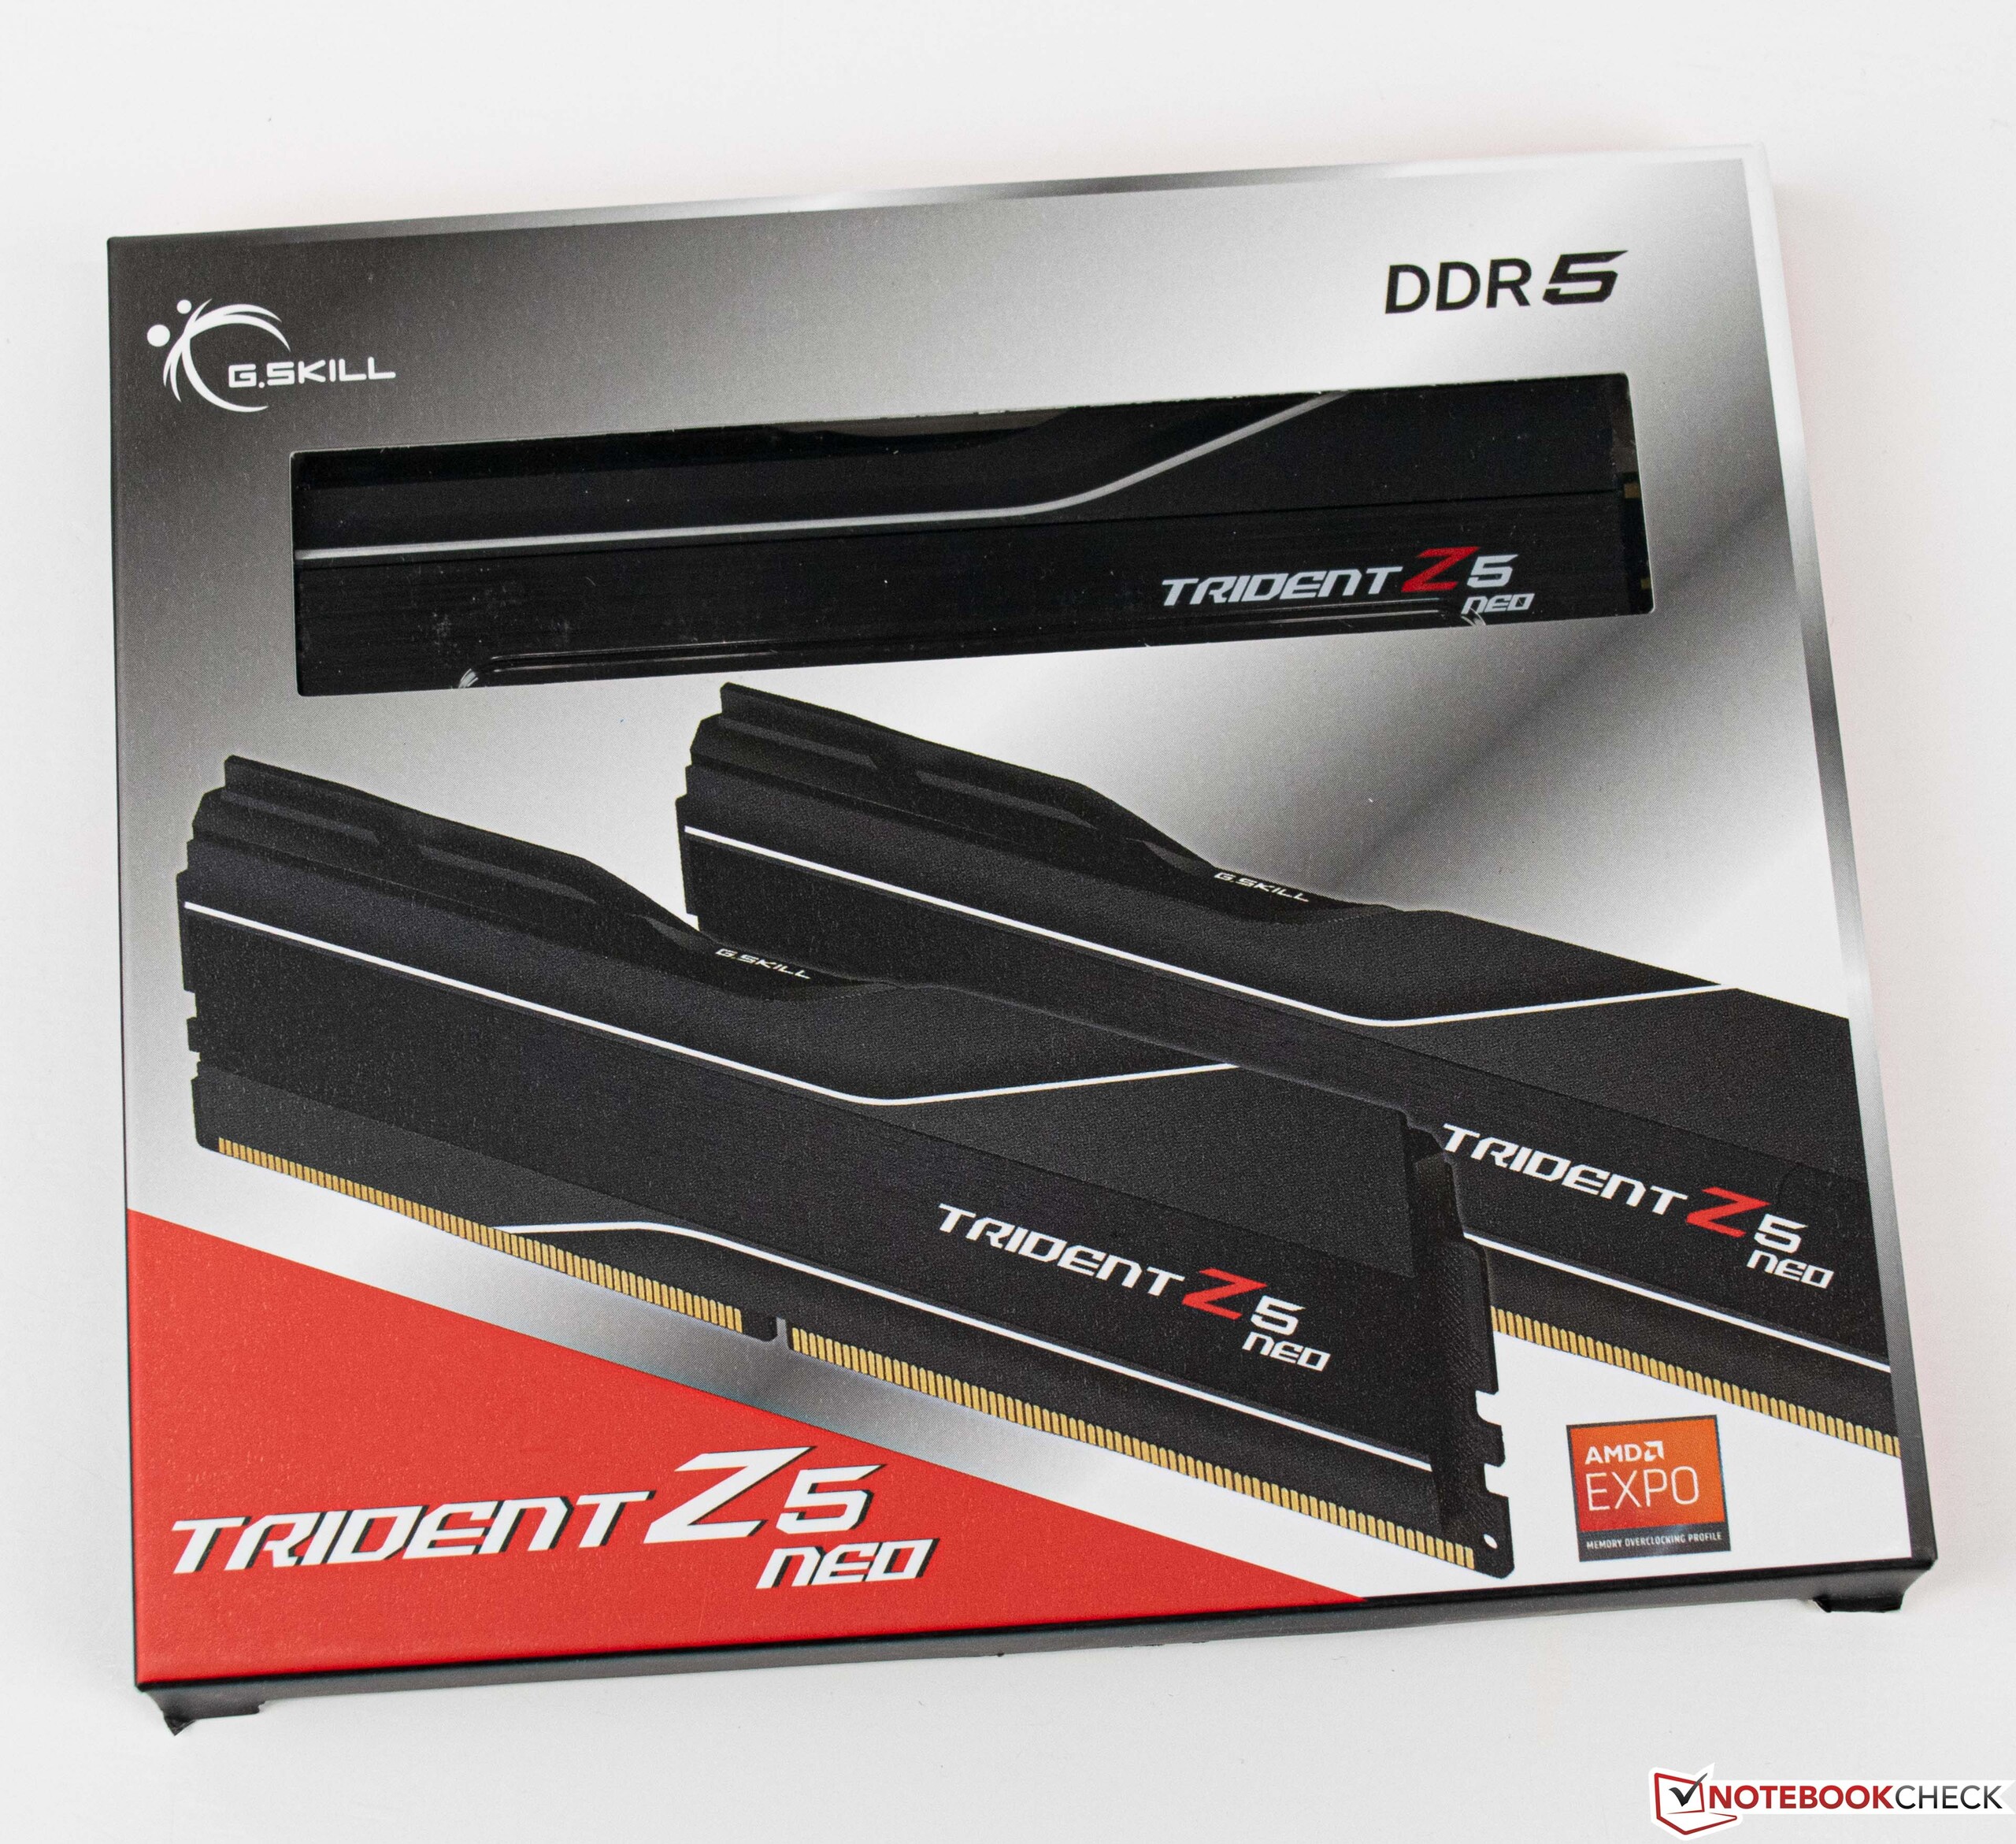
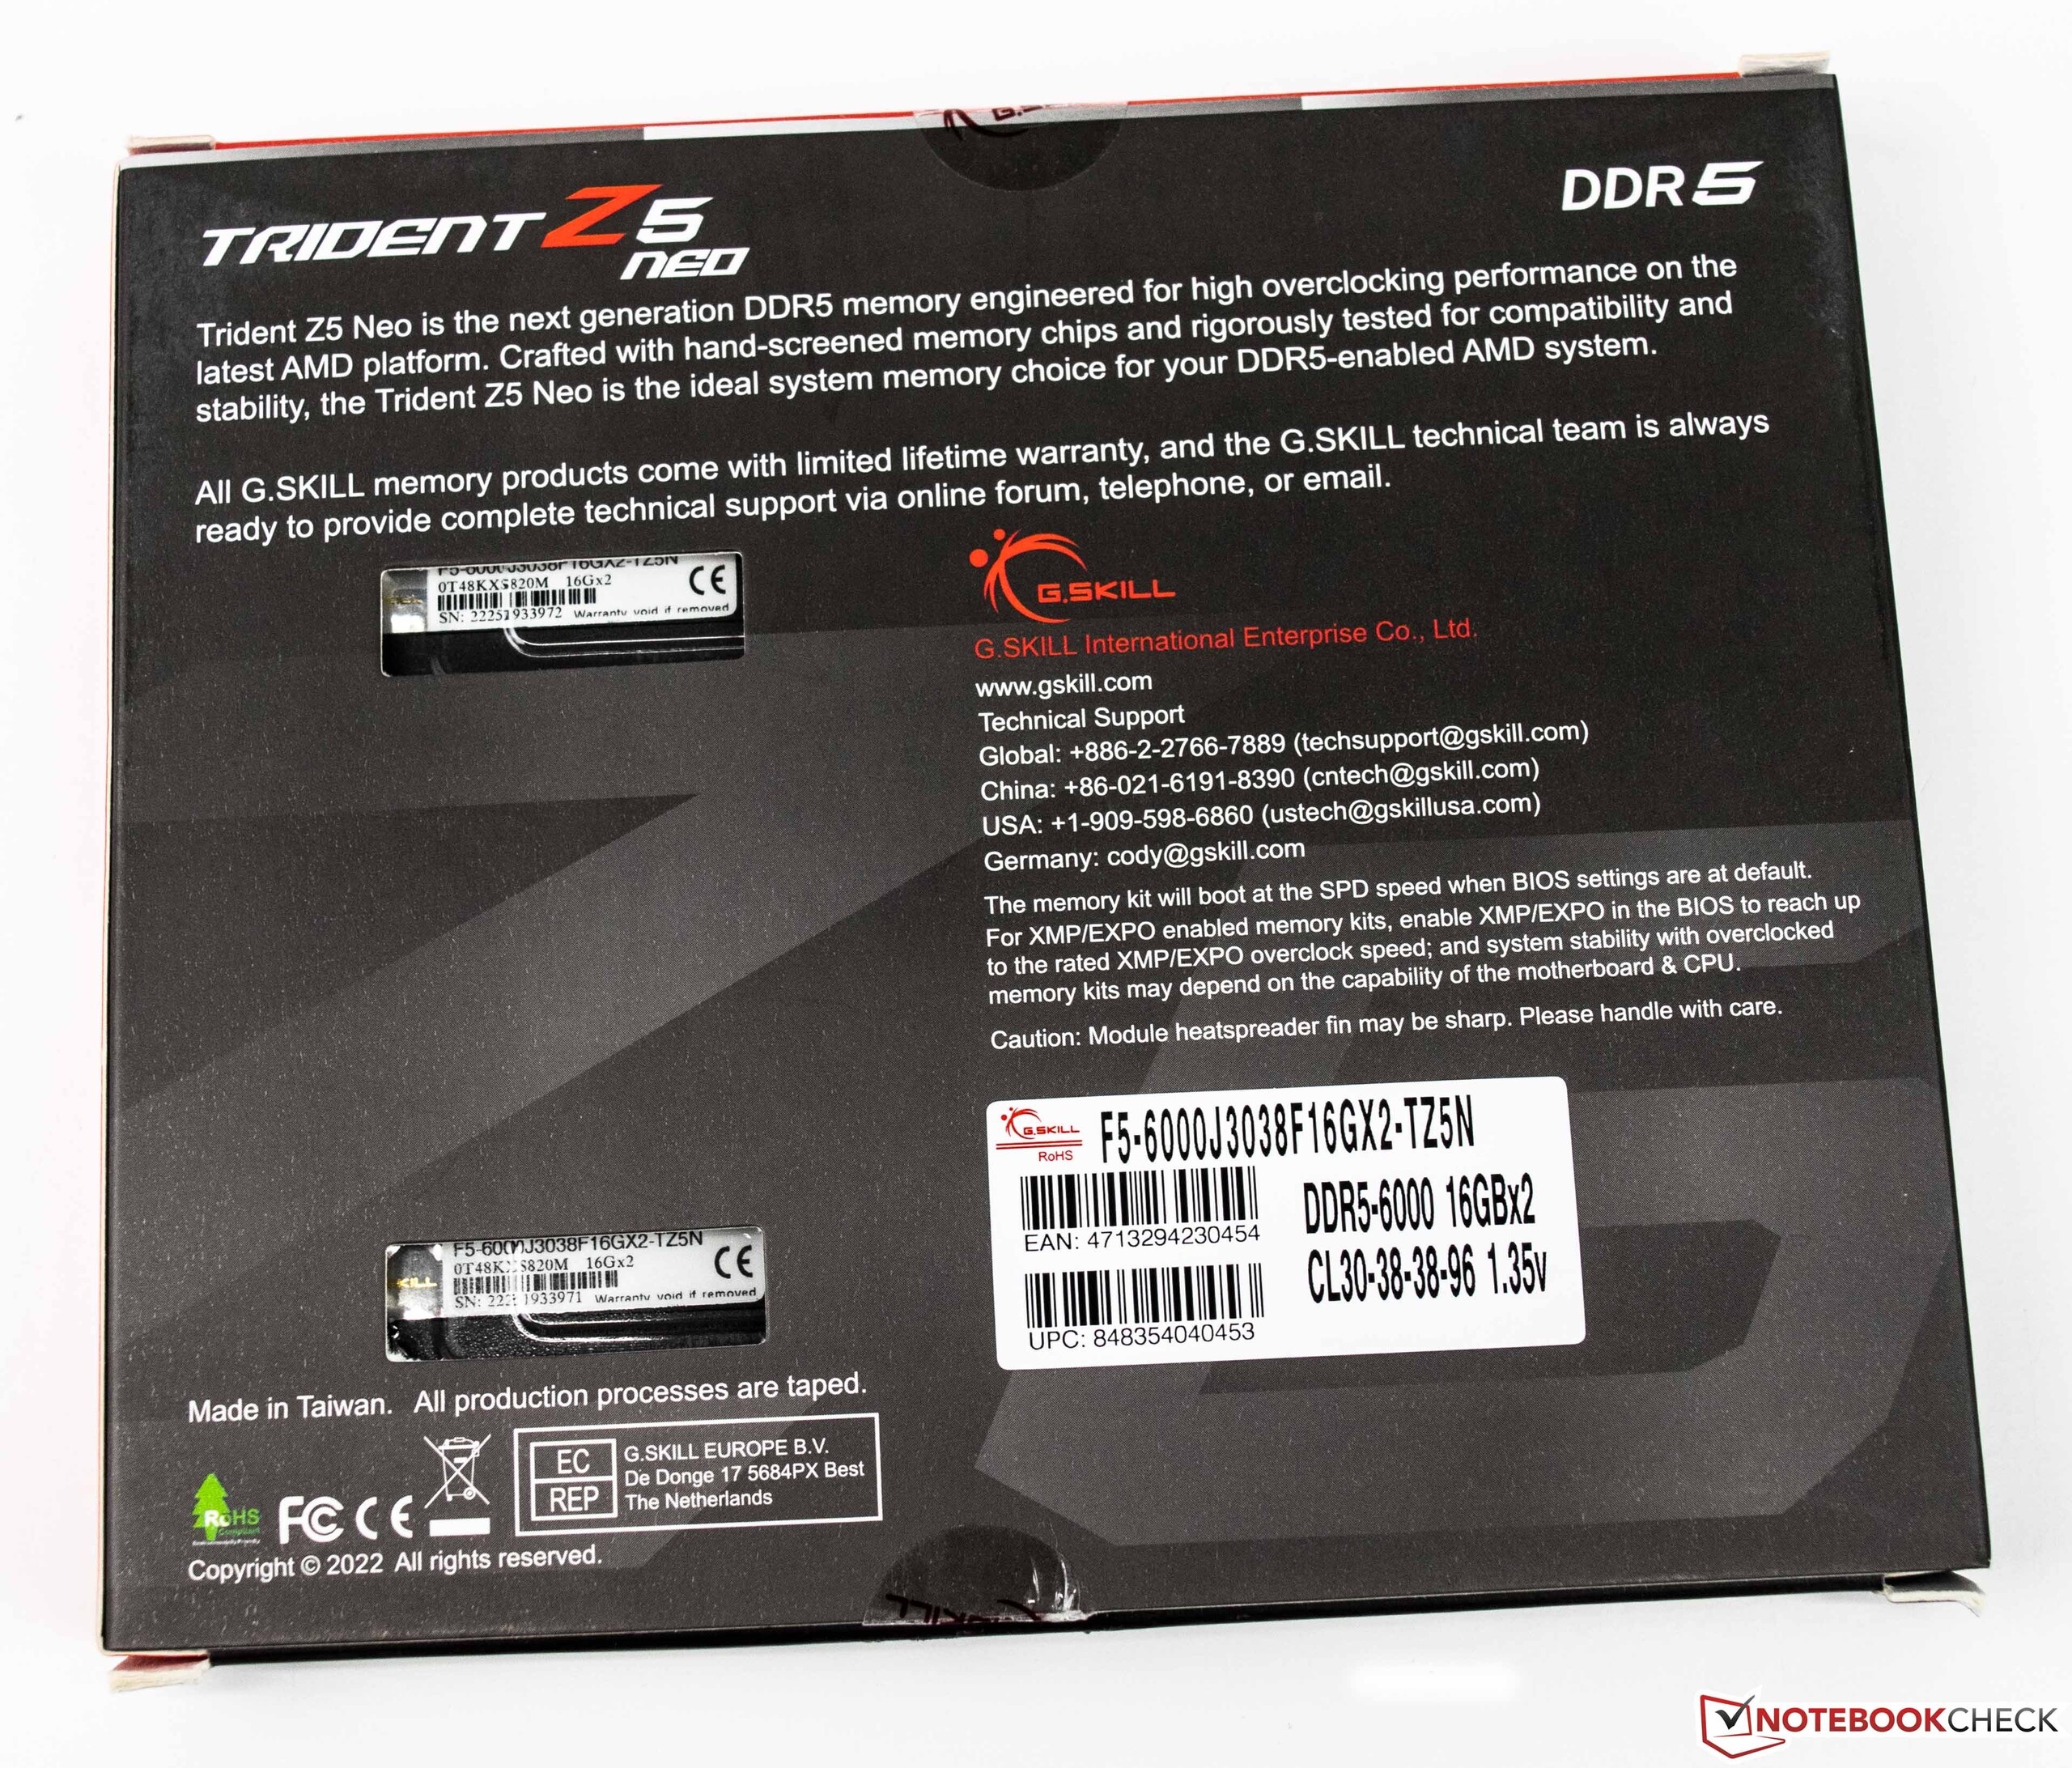
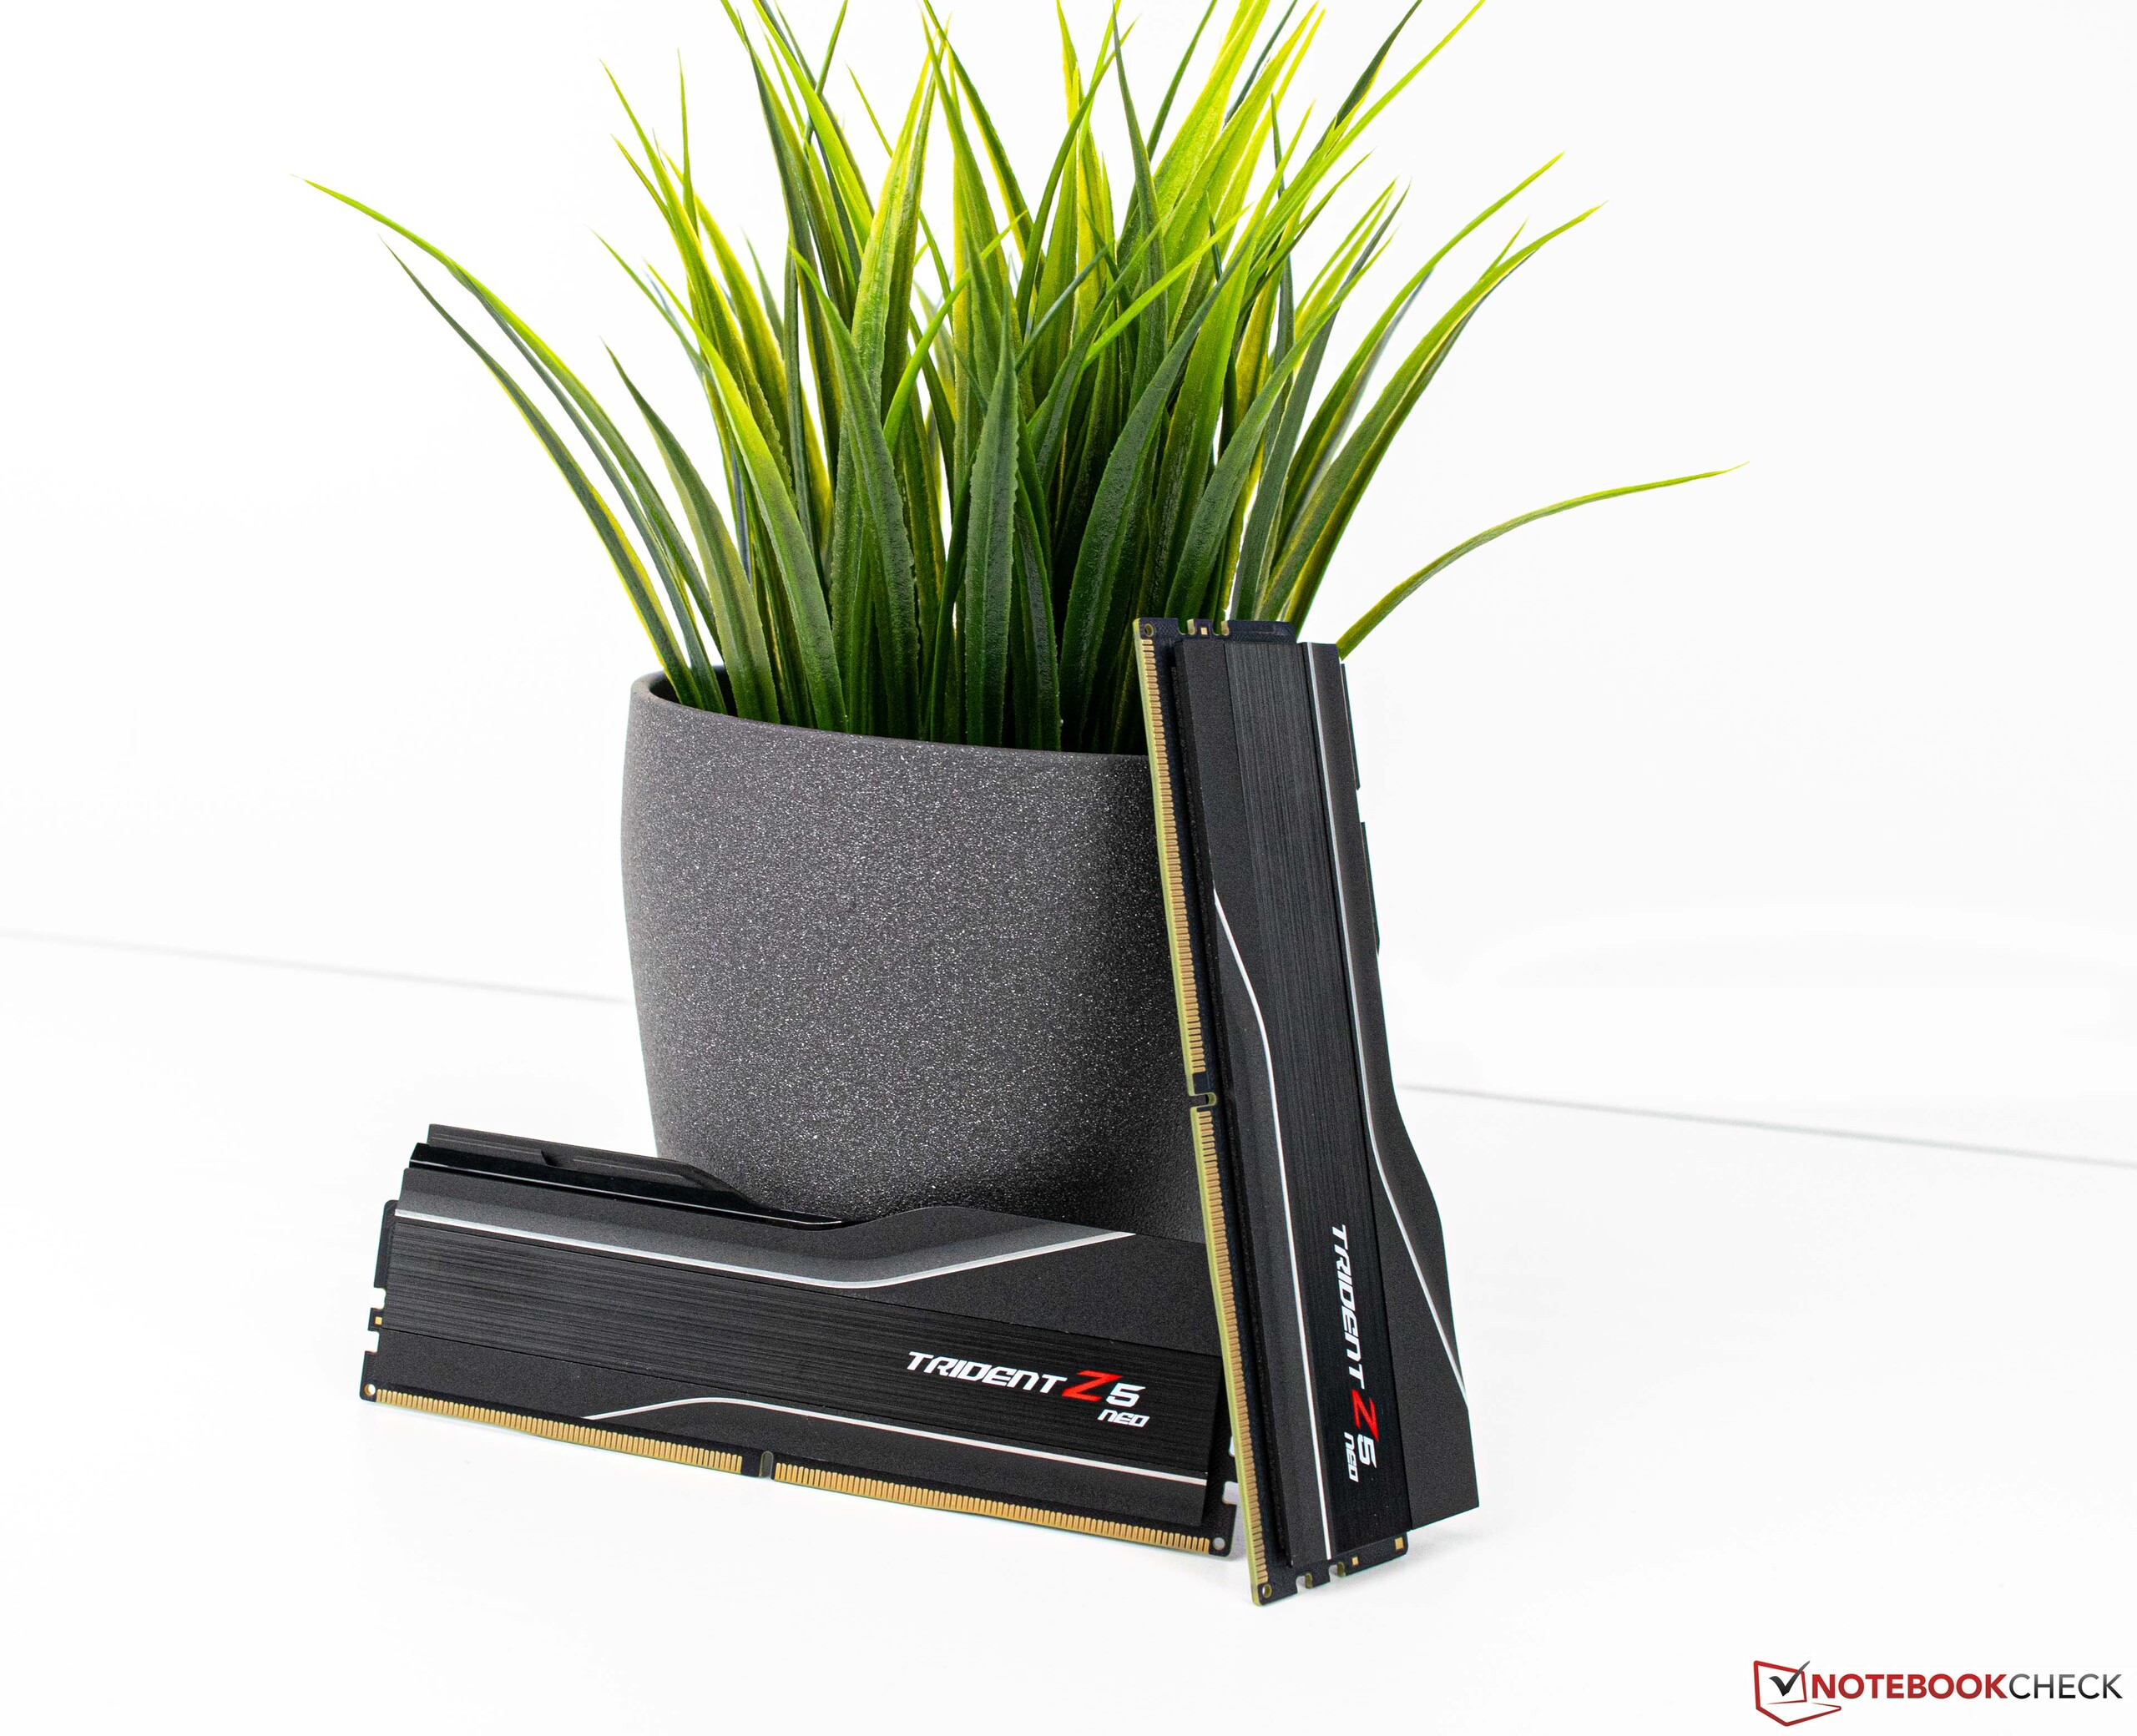
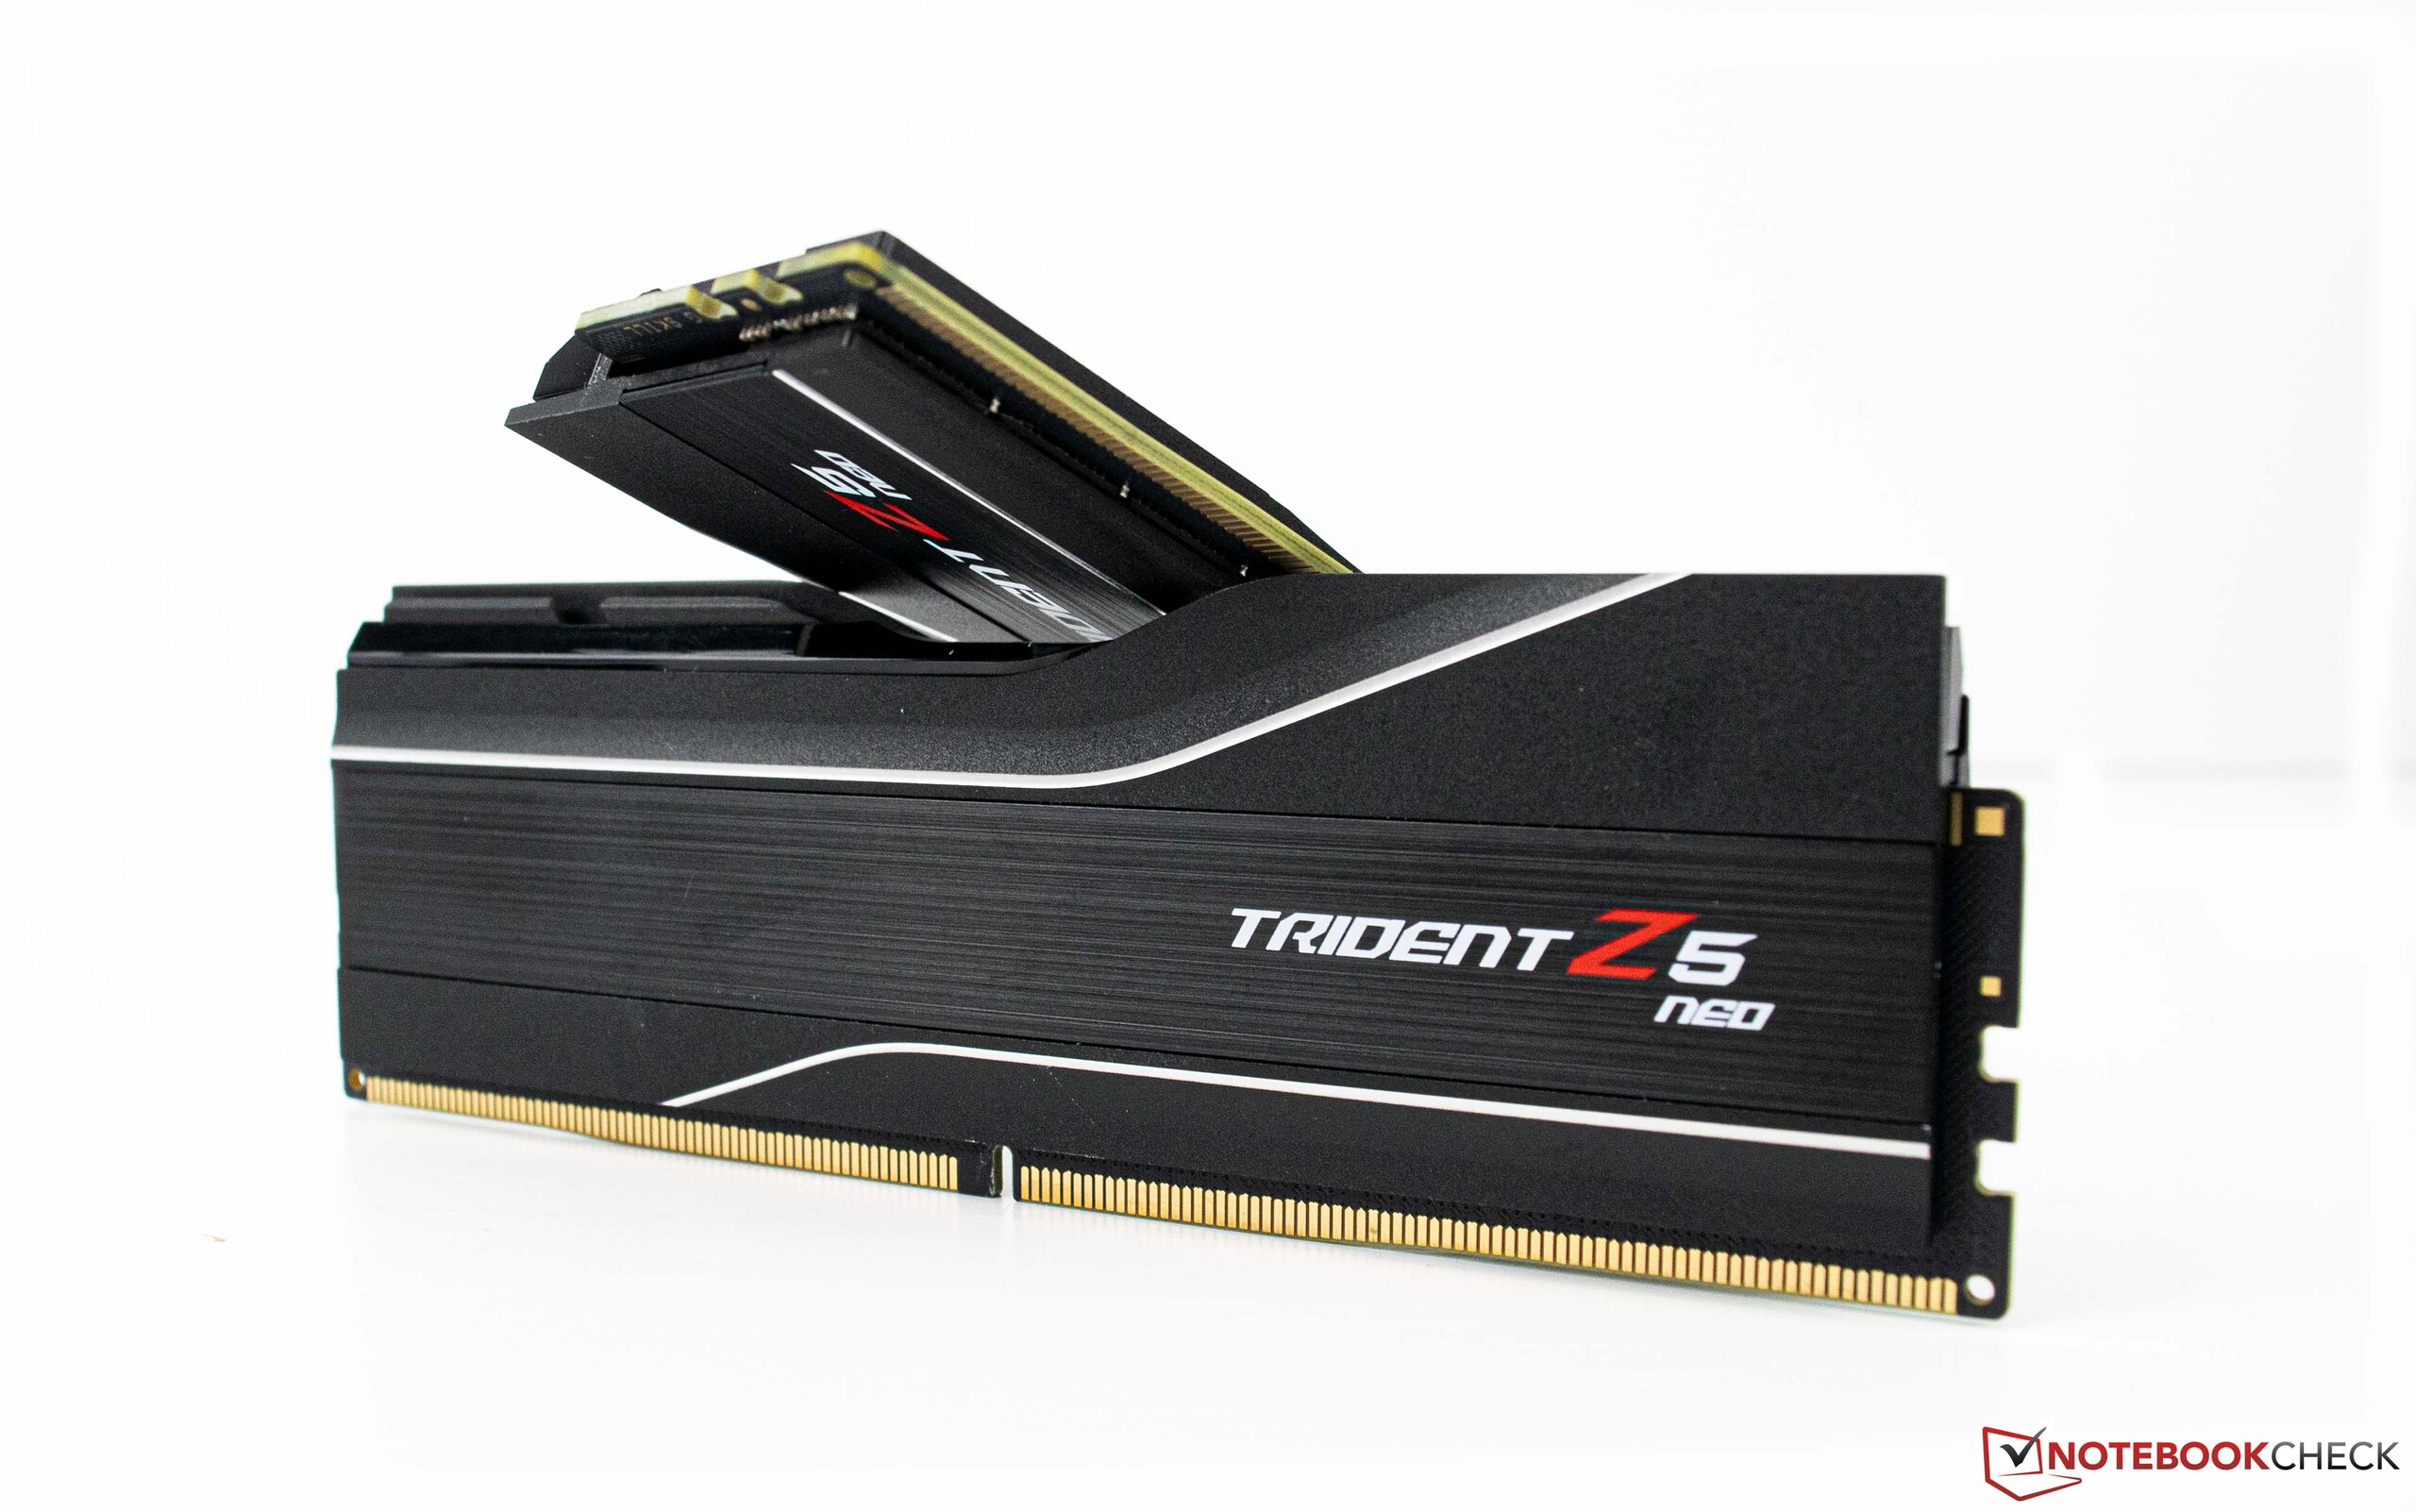
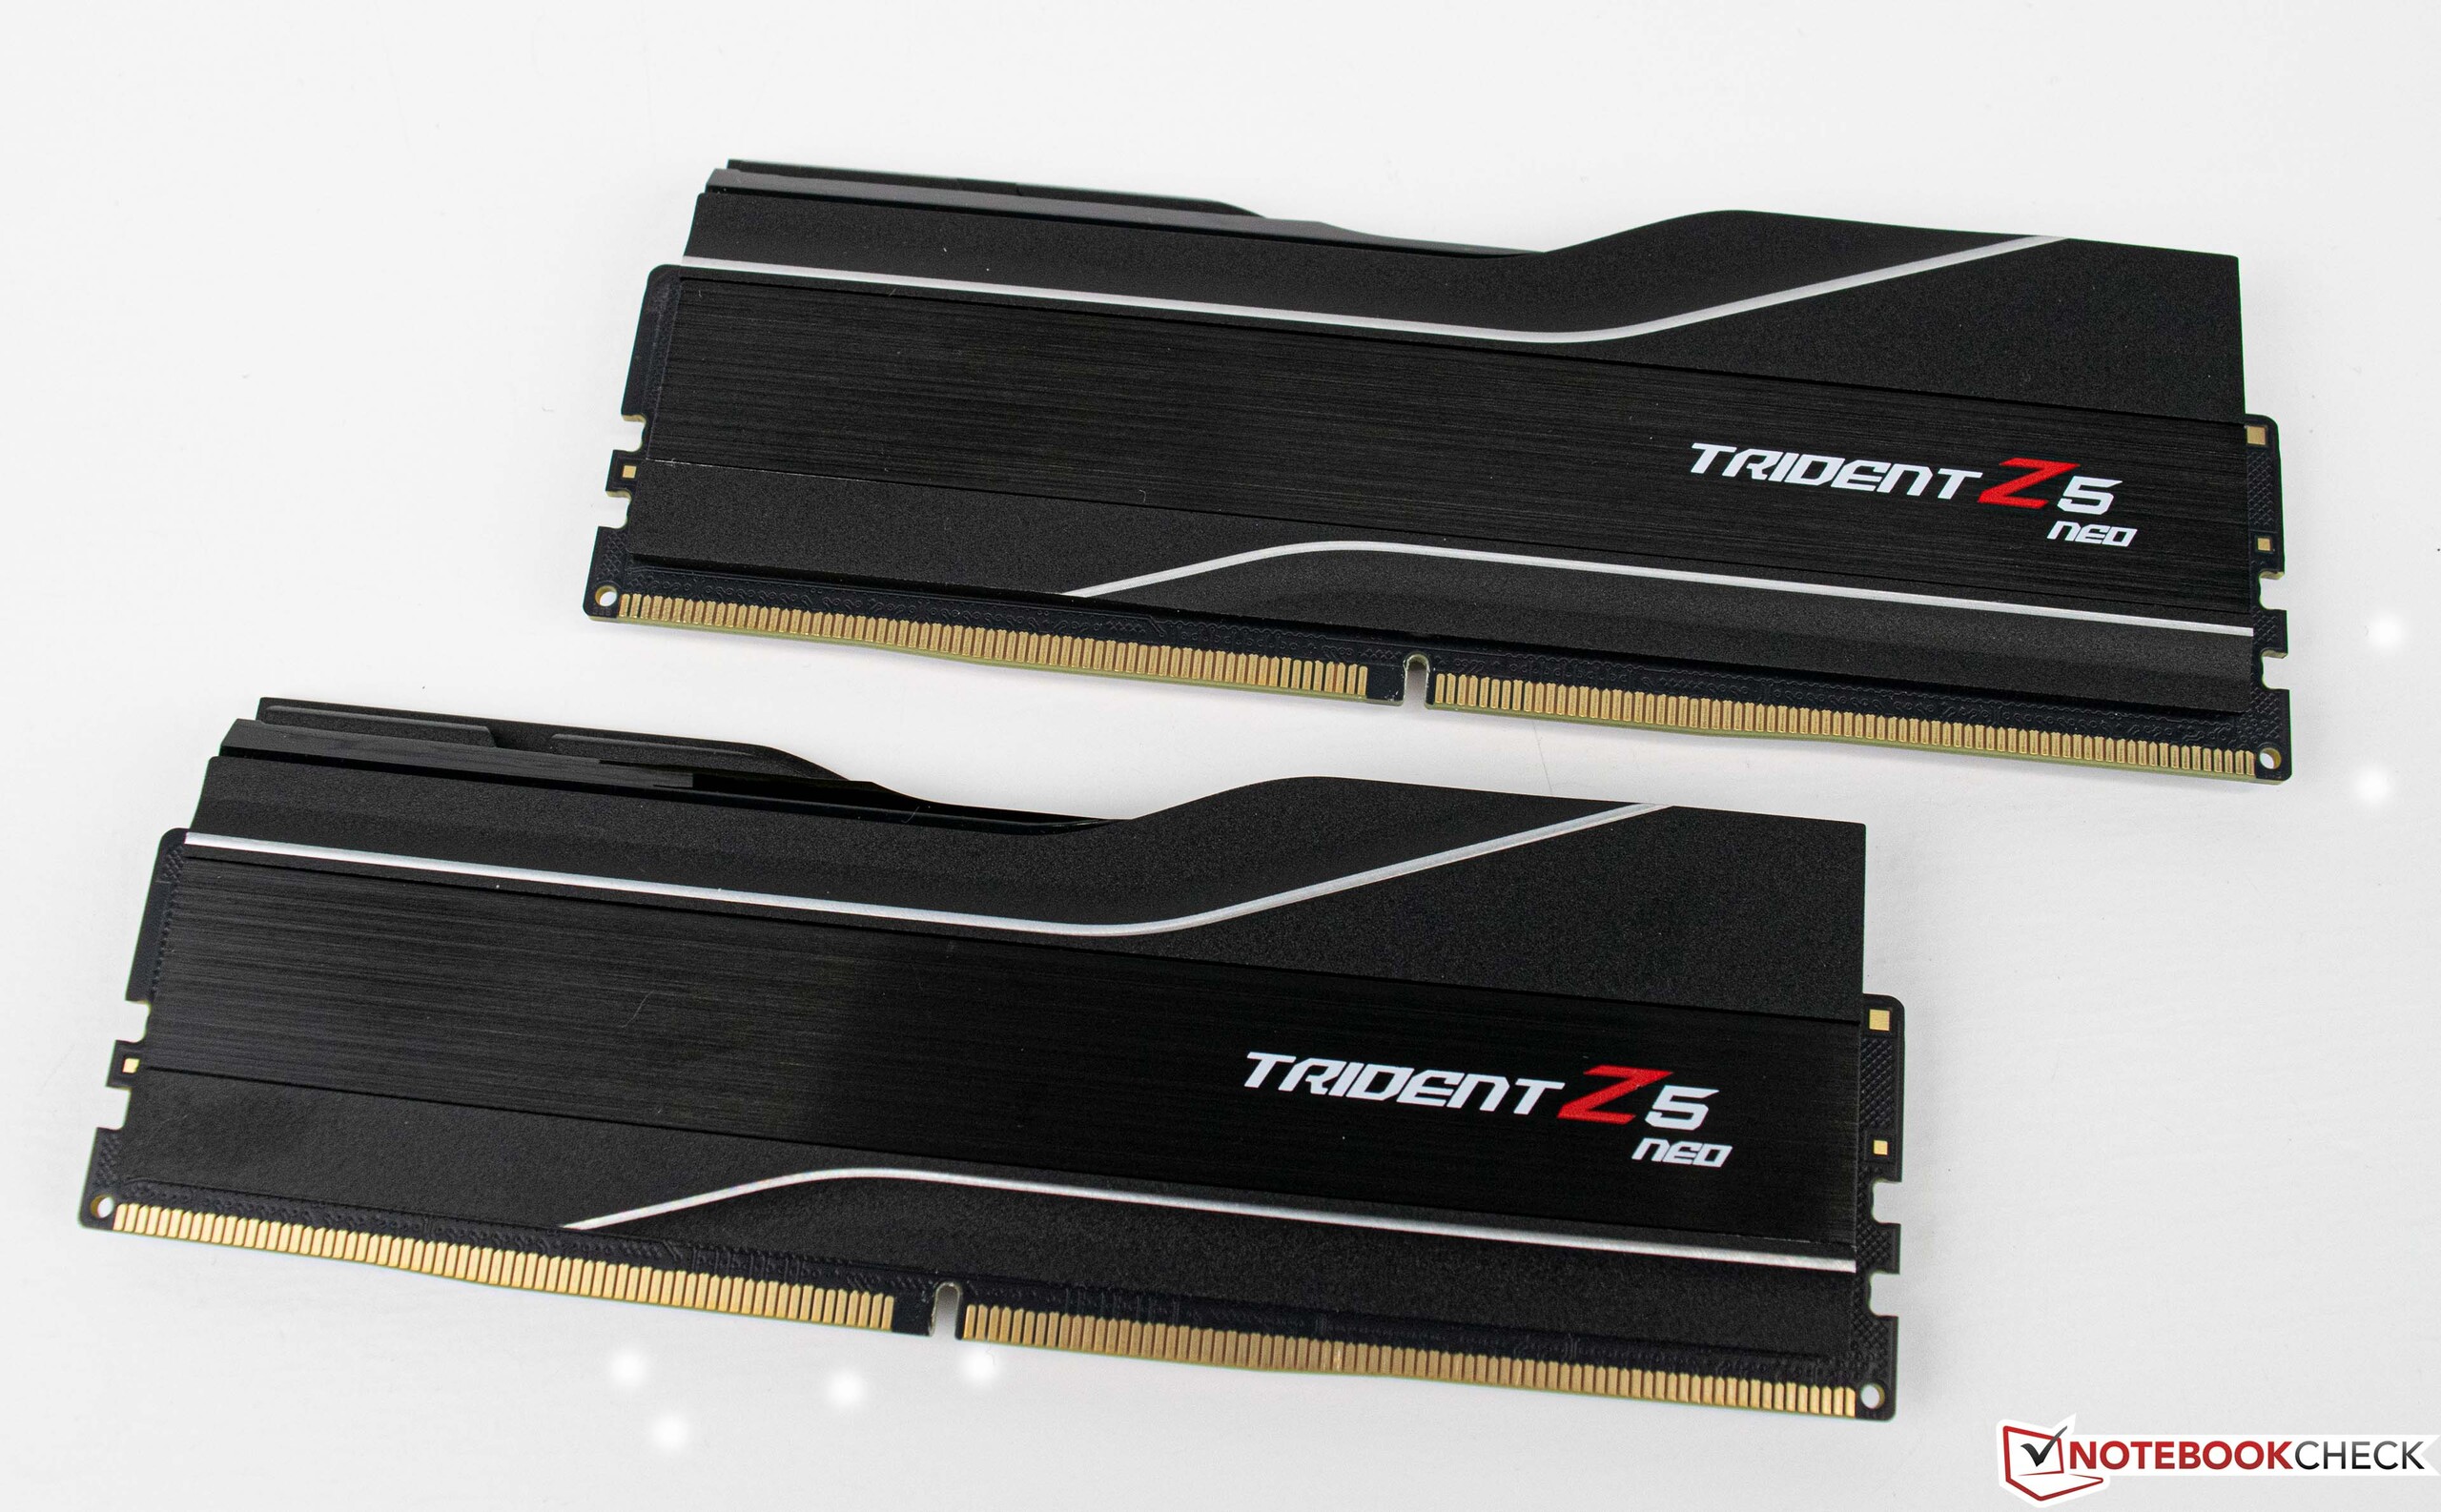
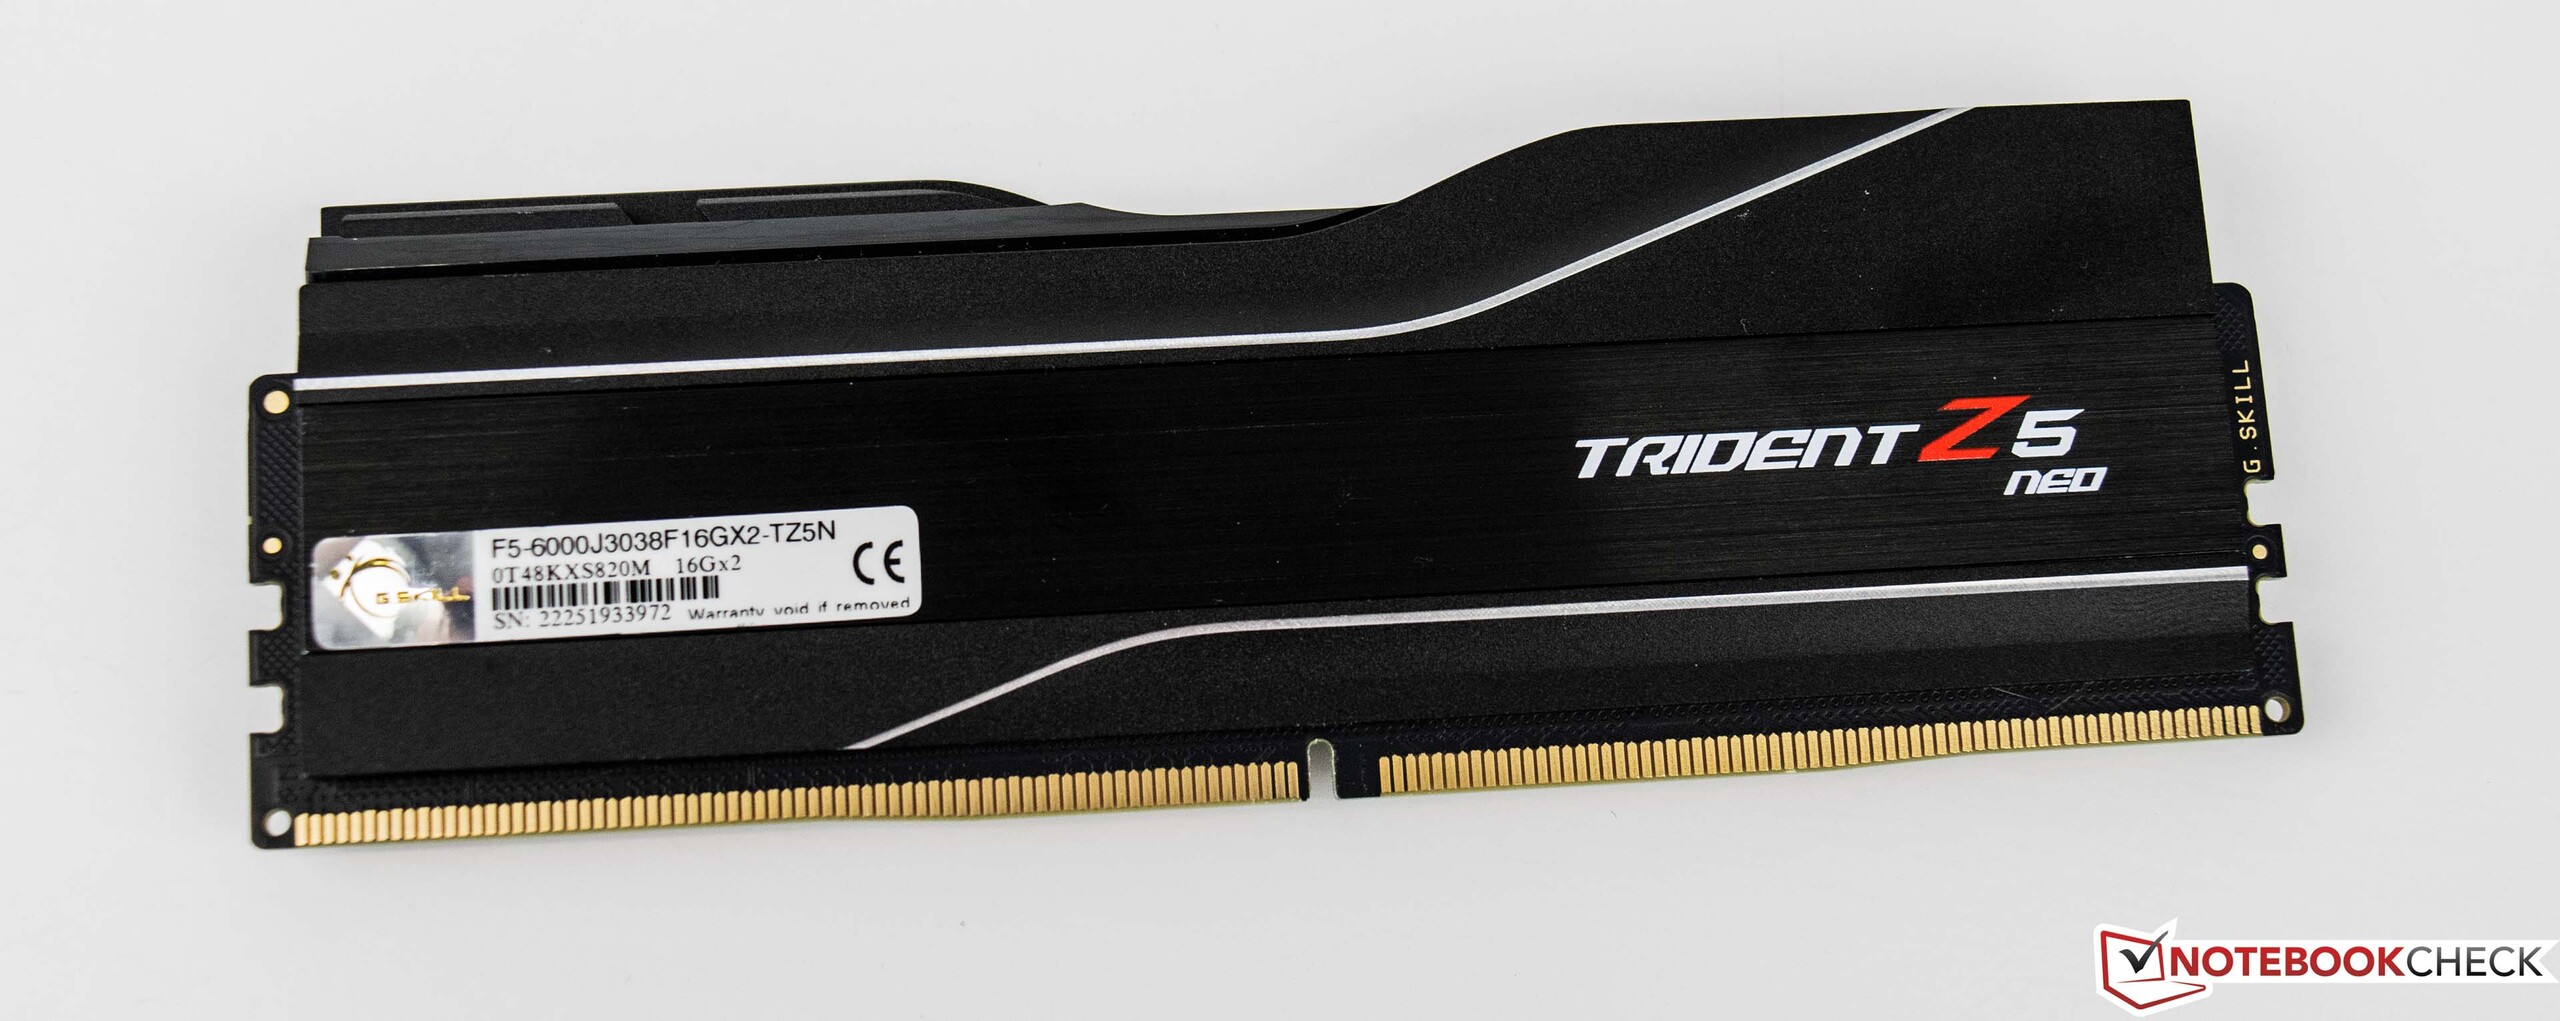
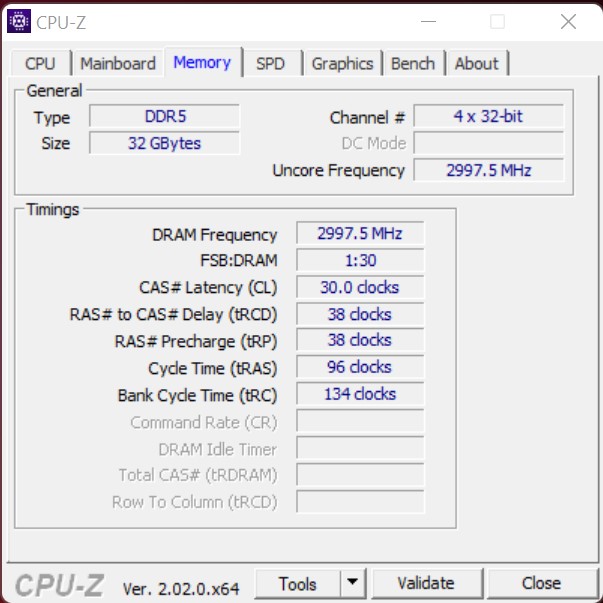
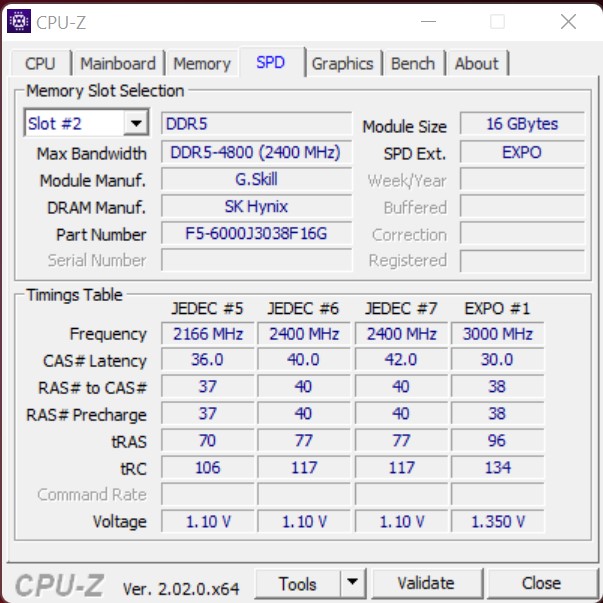
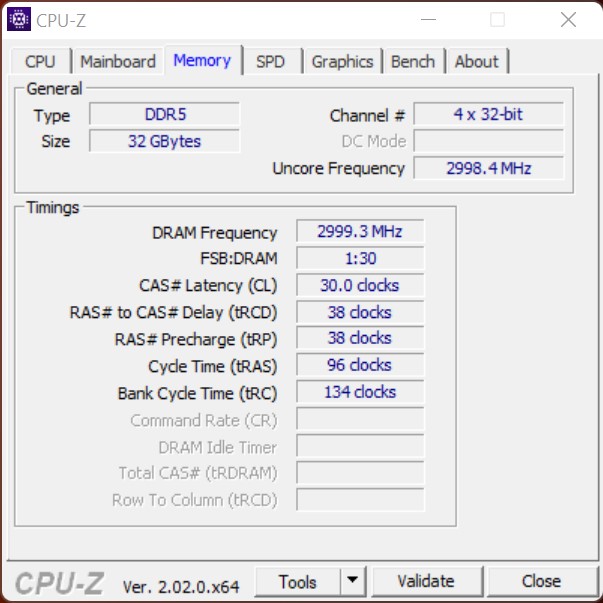
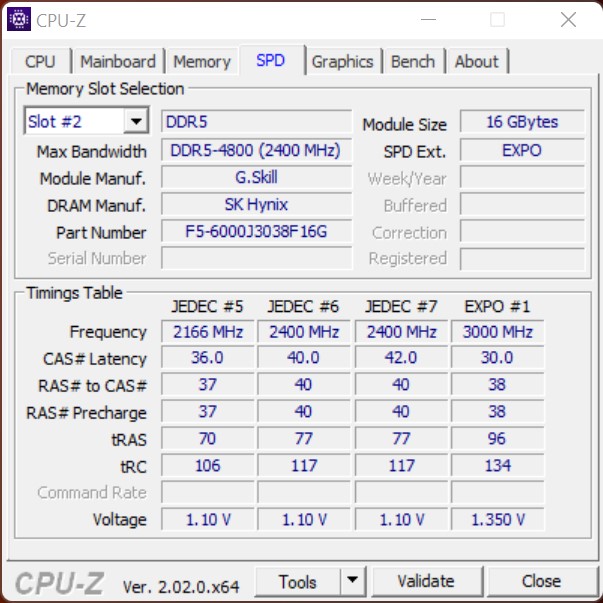
- G.Skill Trident Z5 Neo DDR5-6000 2x 16 Go, EXPO (DDR5-6000 CL30-38-38-96)
- Intel Optane 905P 480 GB PCIe SSD
- 2x Transcend NVMe SSD 512 GB
- Microsoft Windows 11 Professional 64-bit (version 21H2)
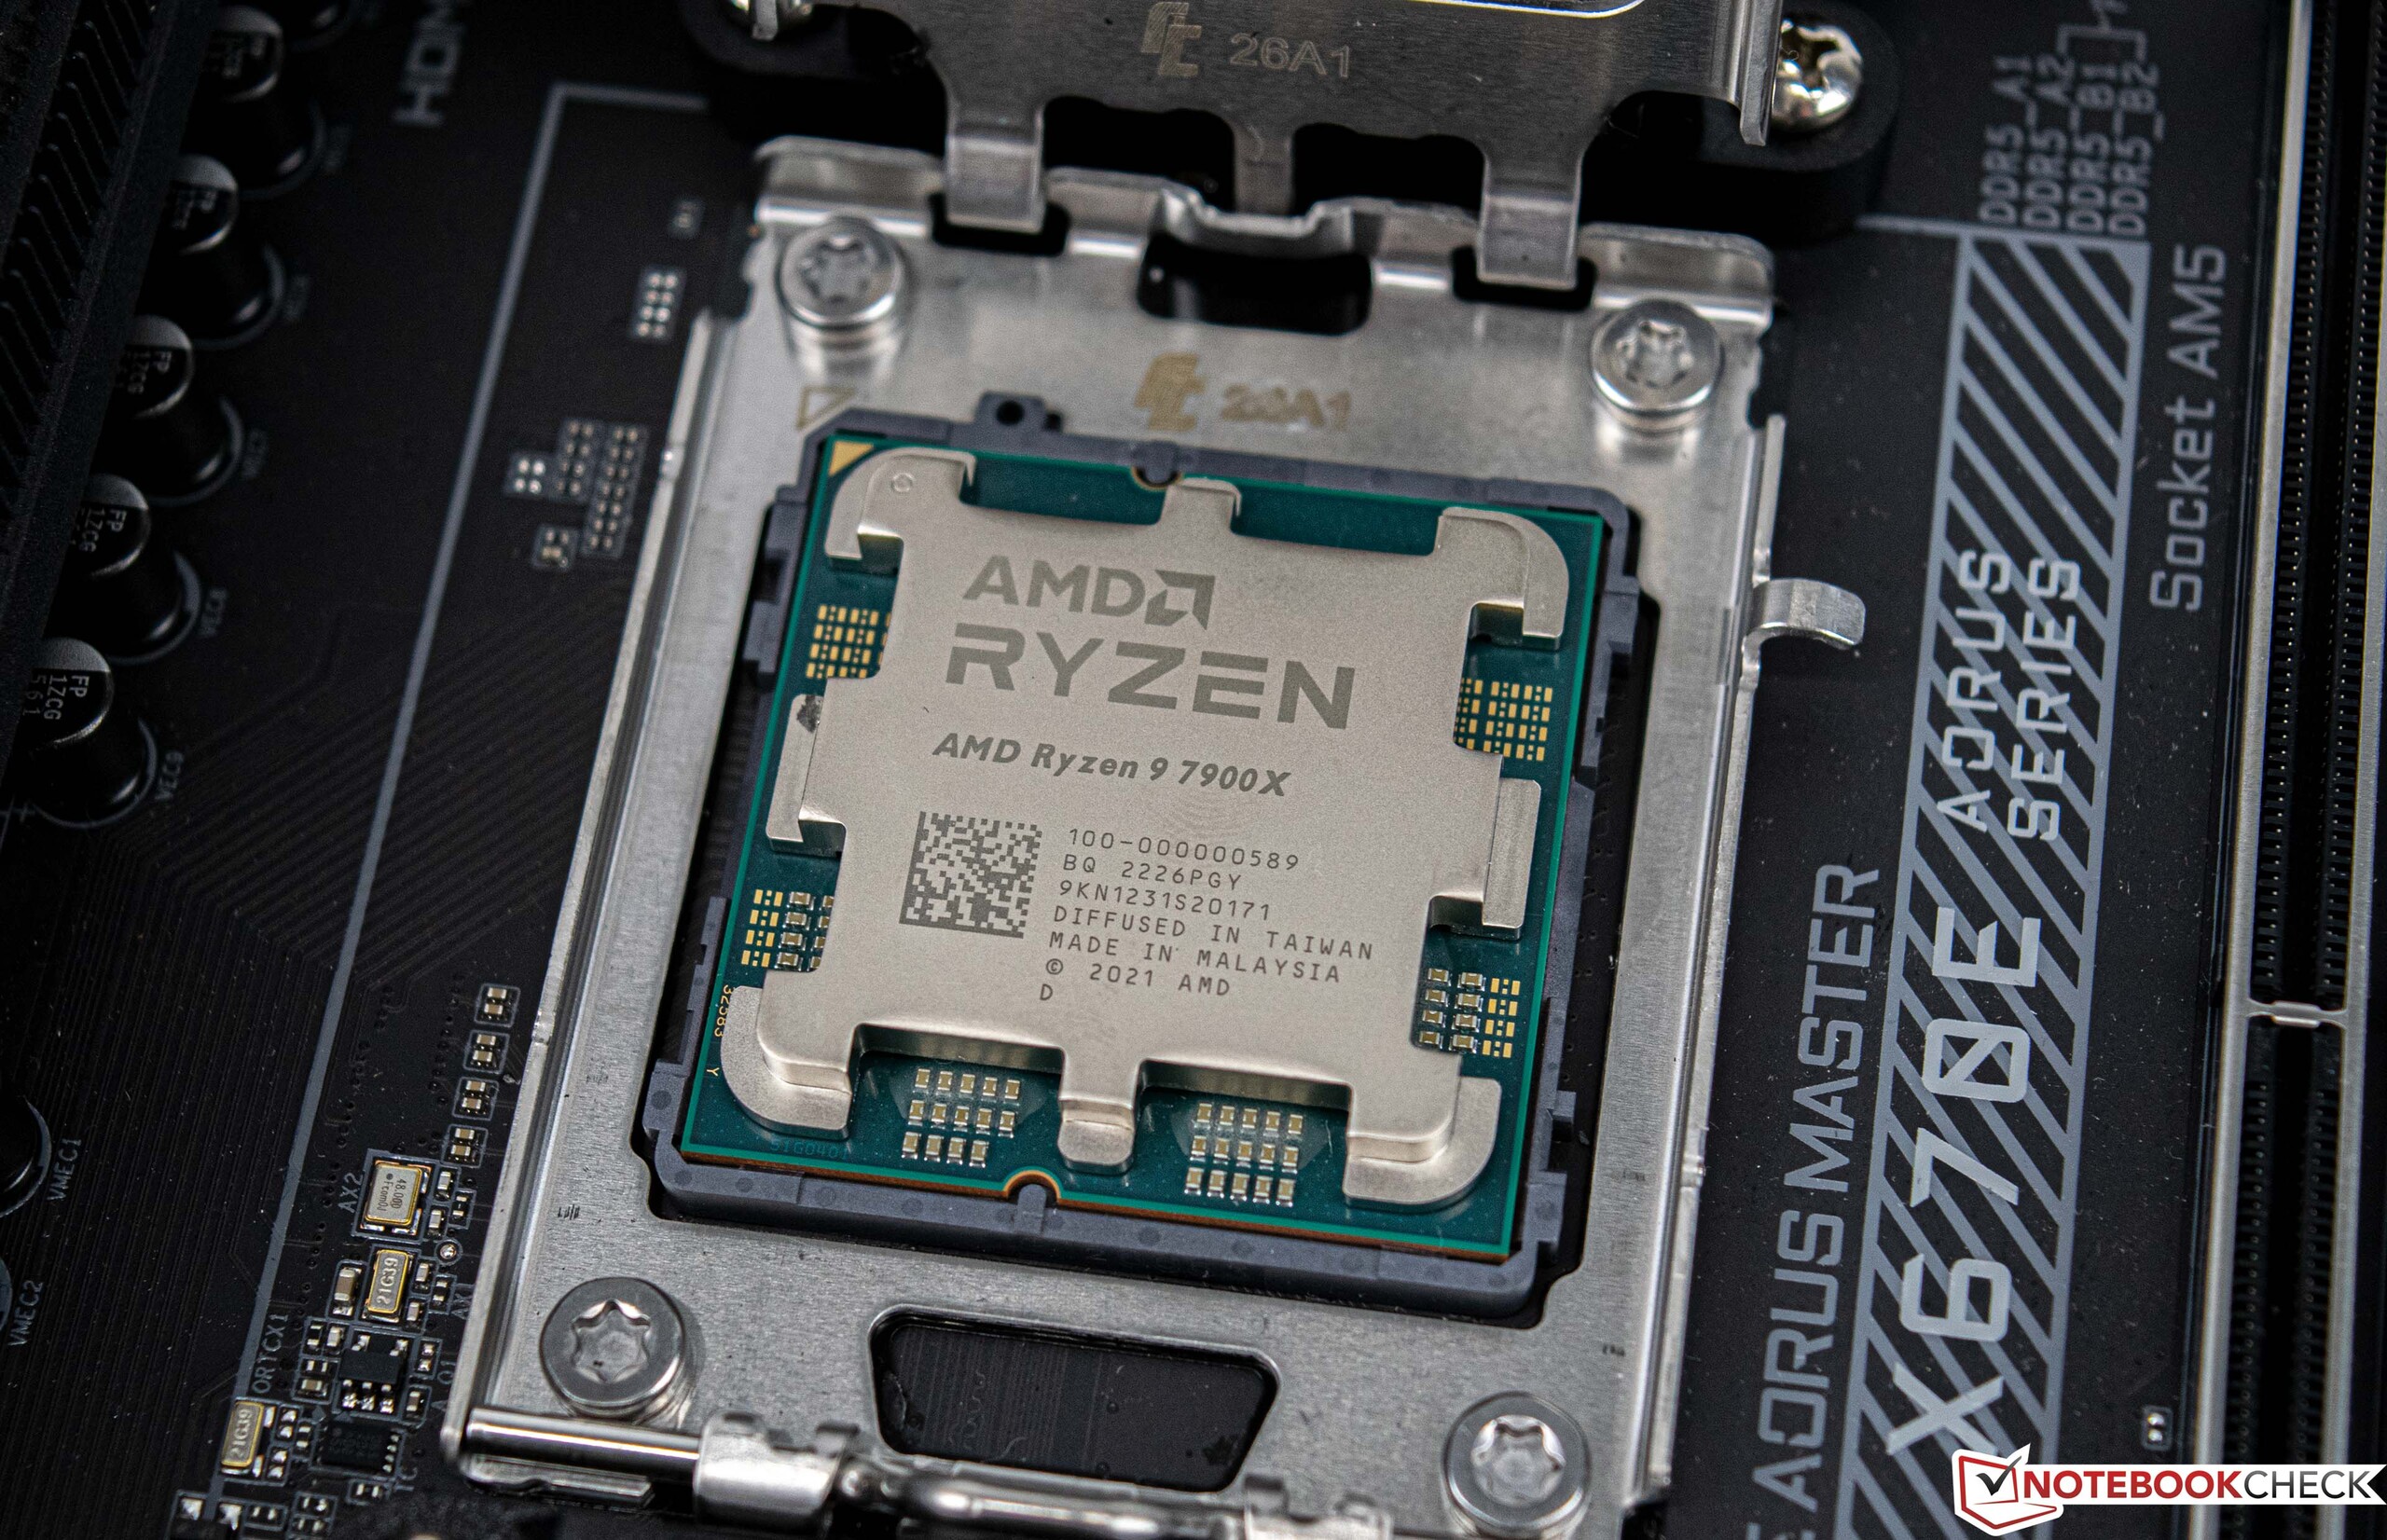

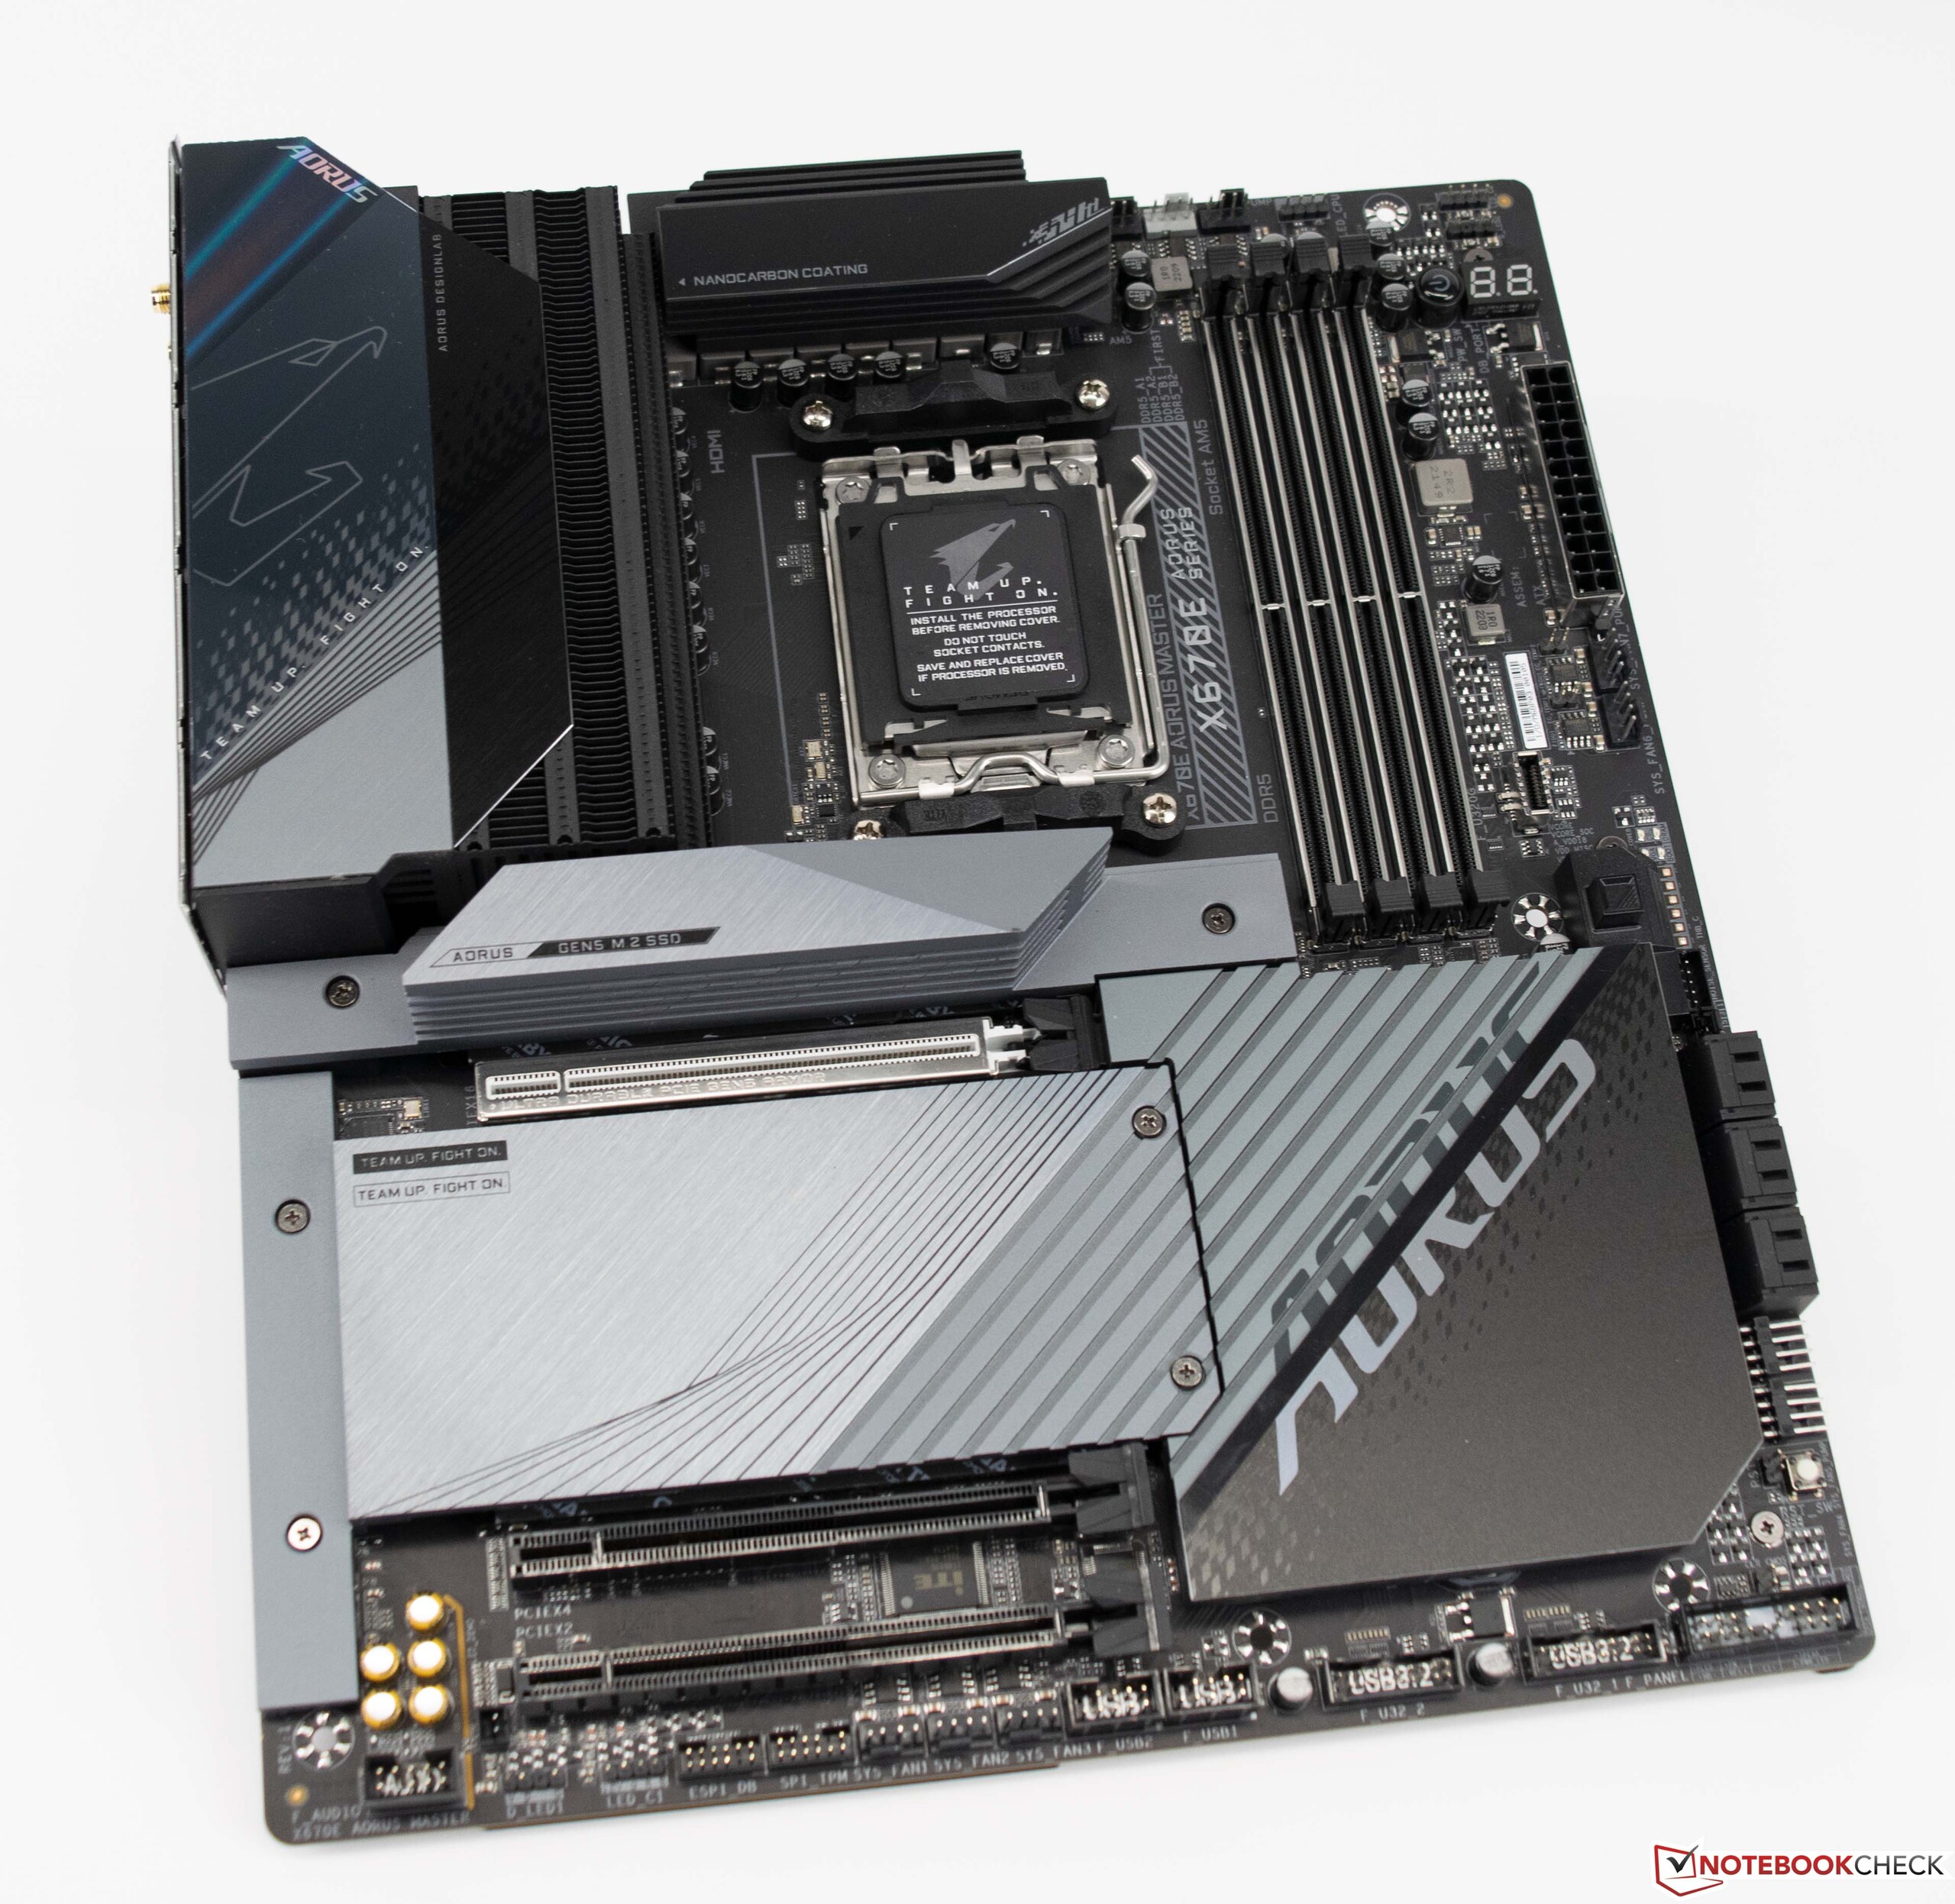
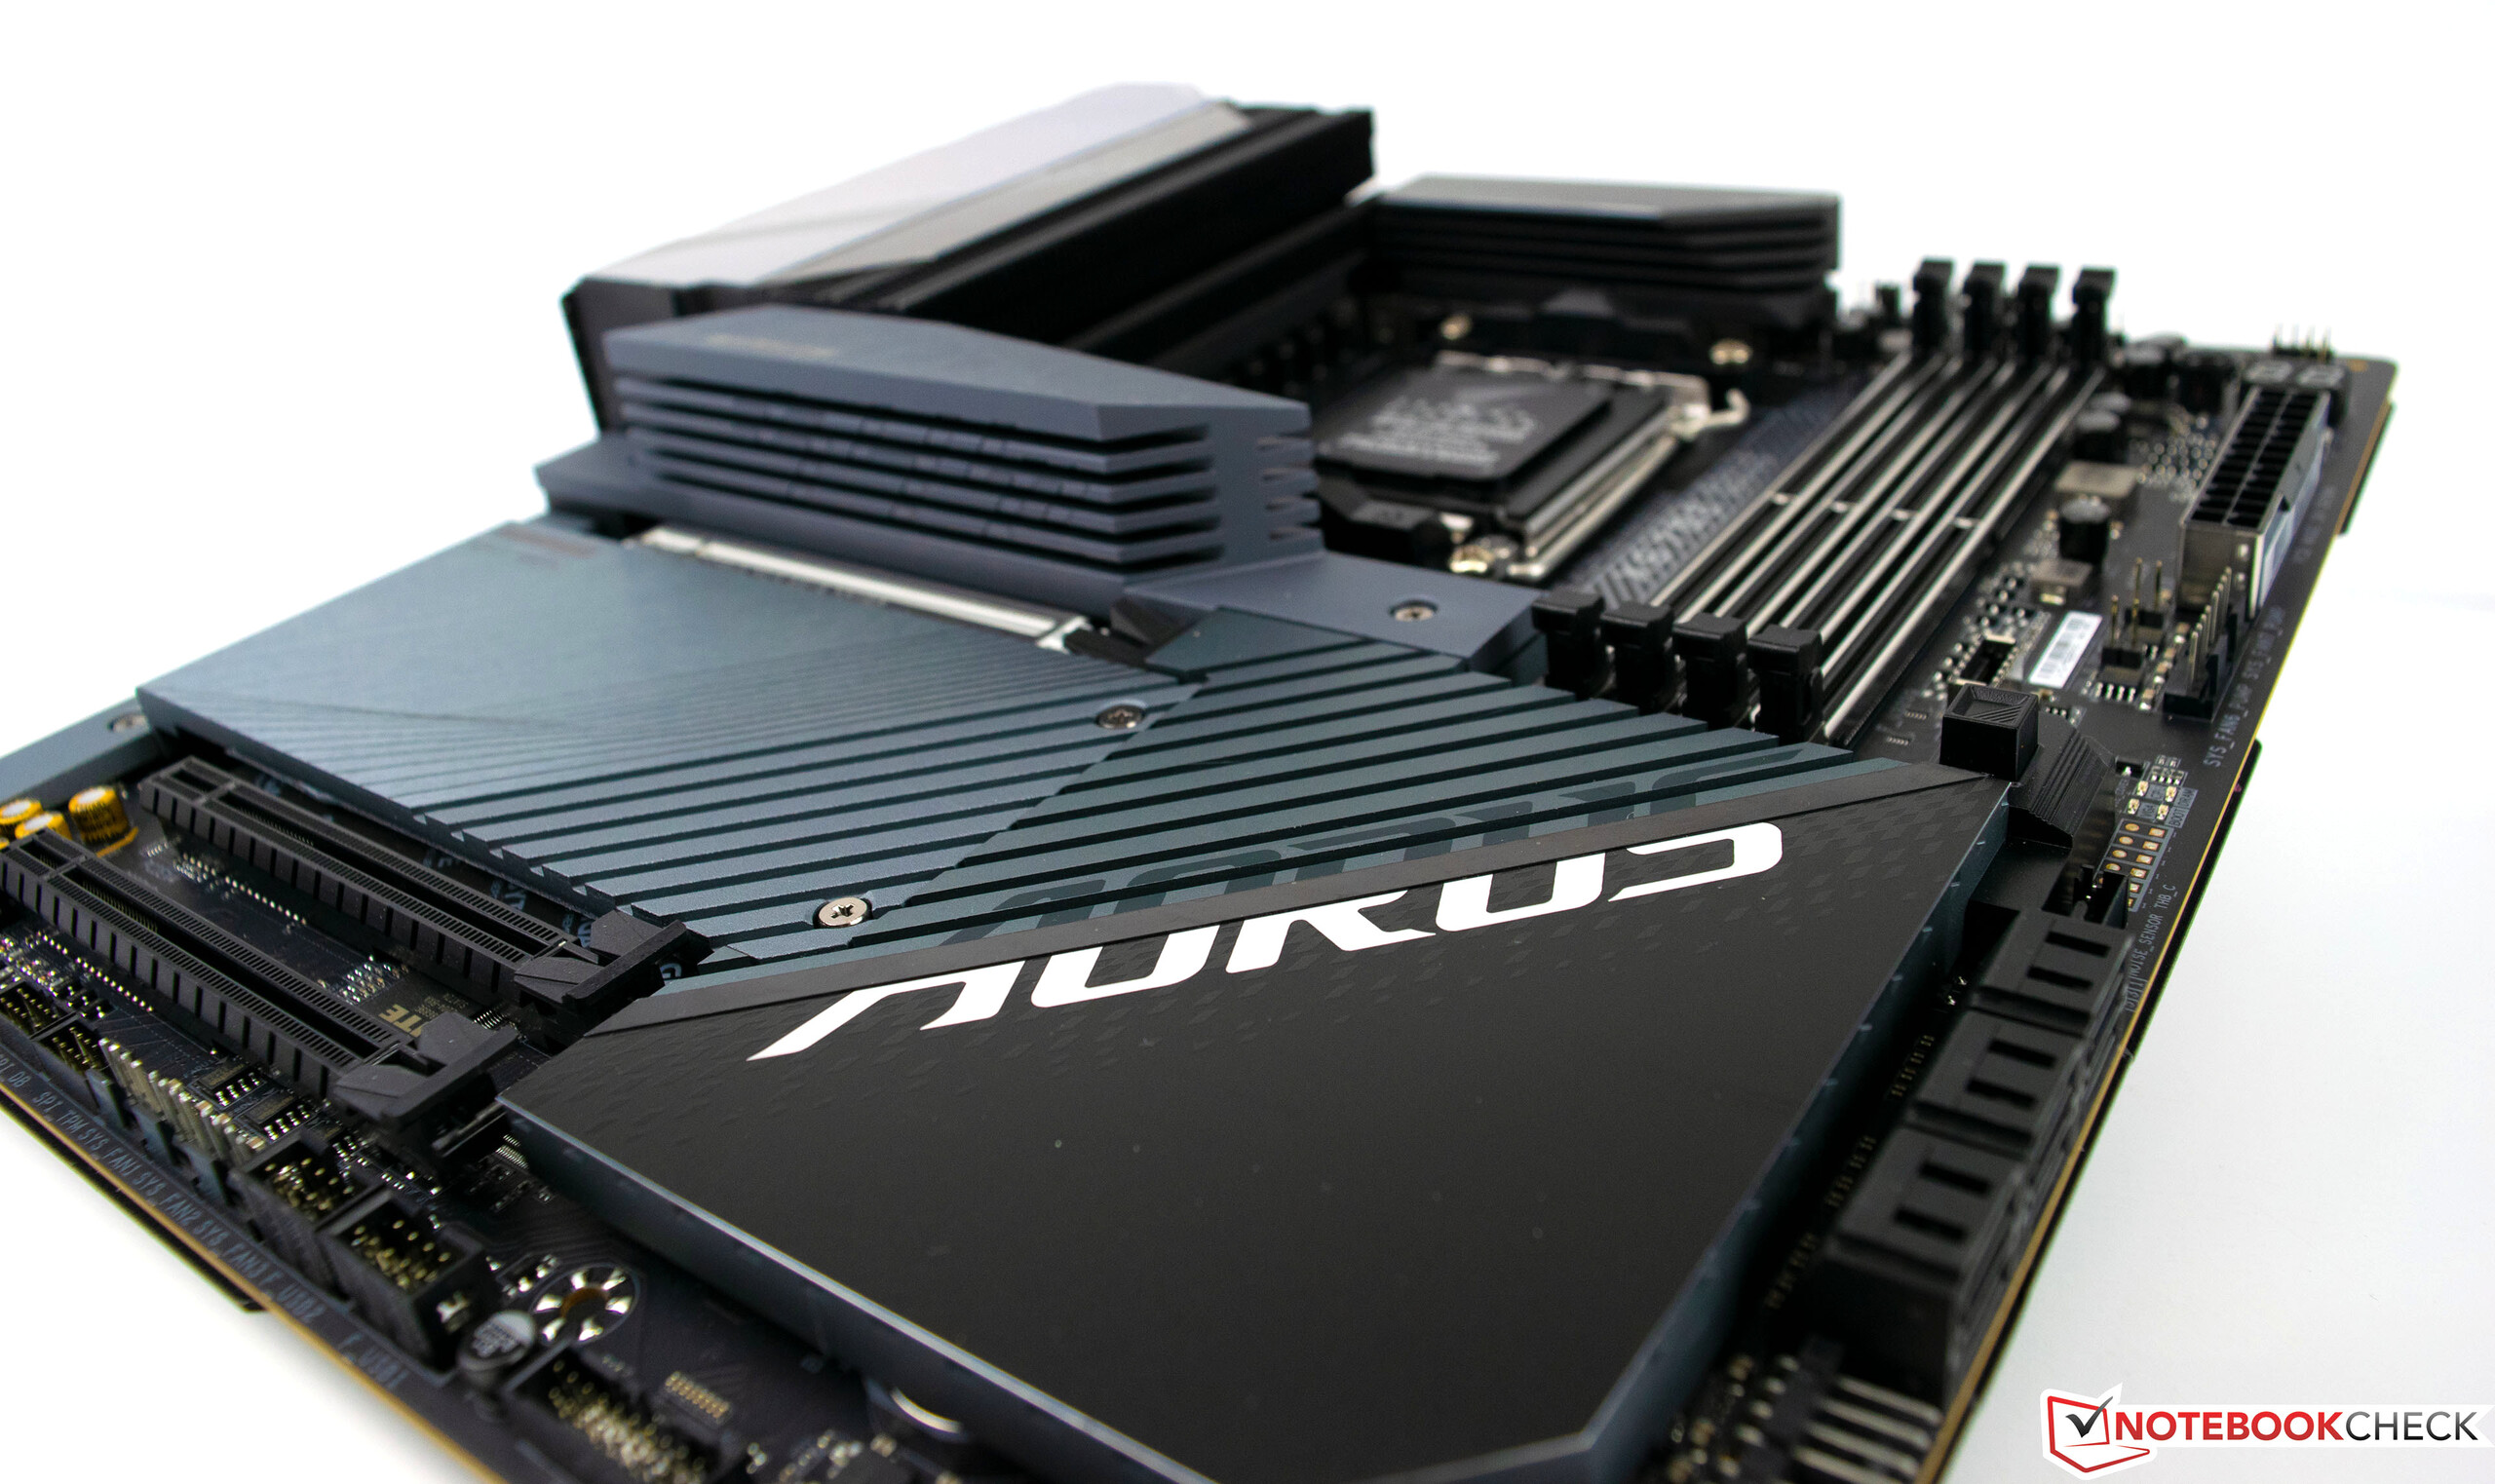
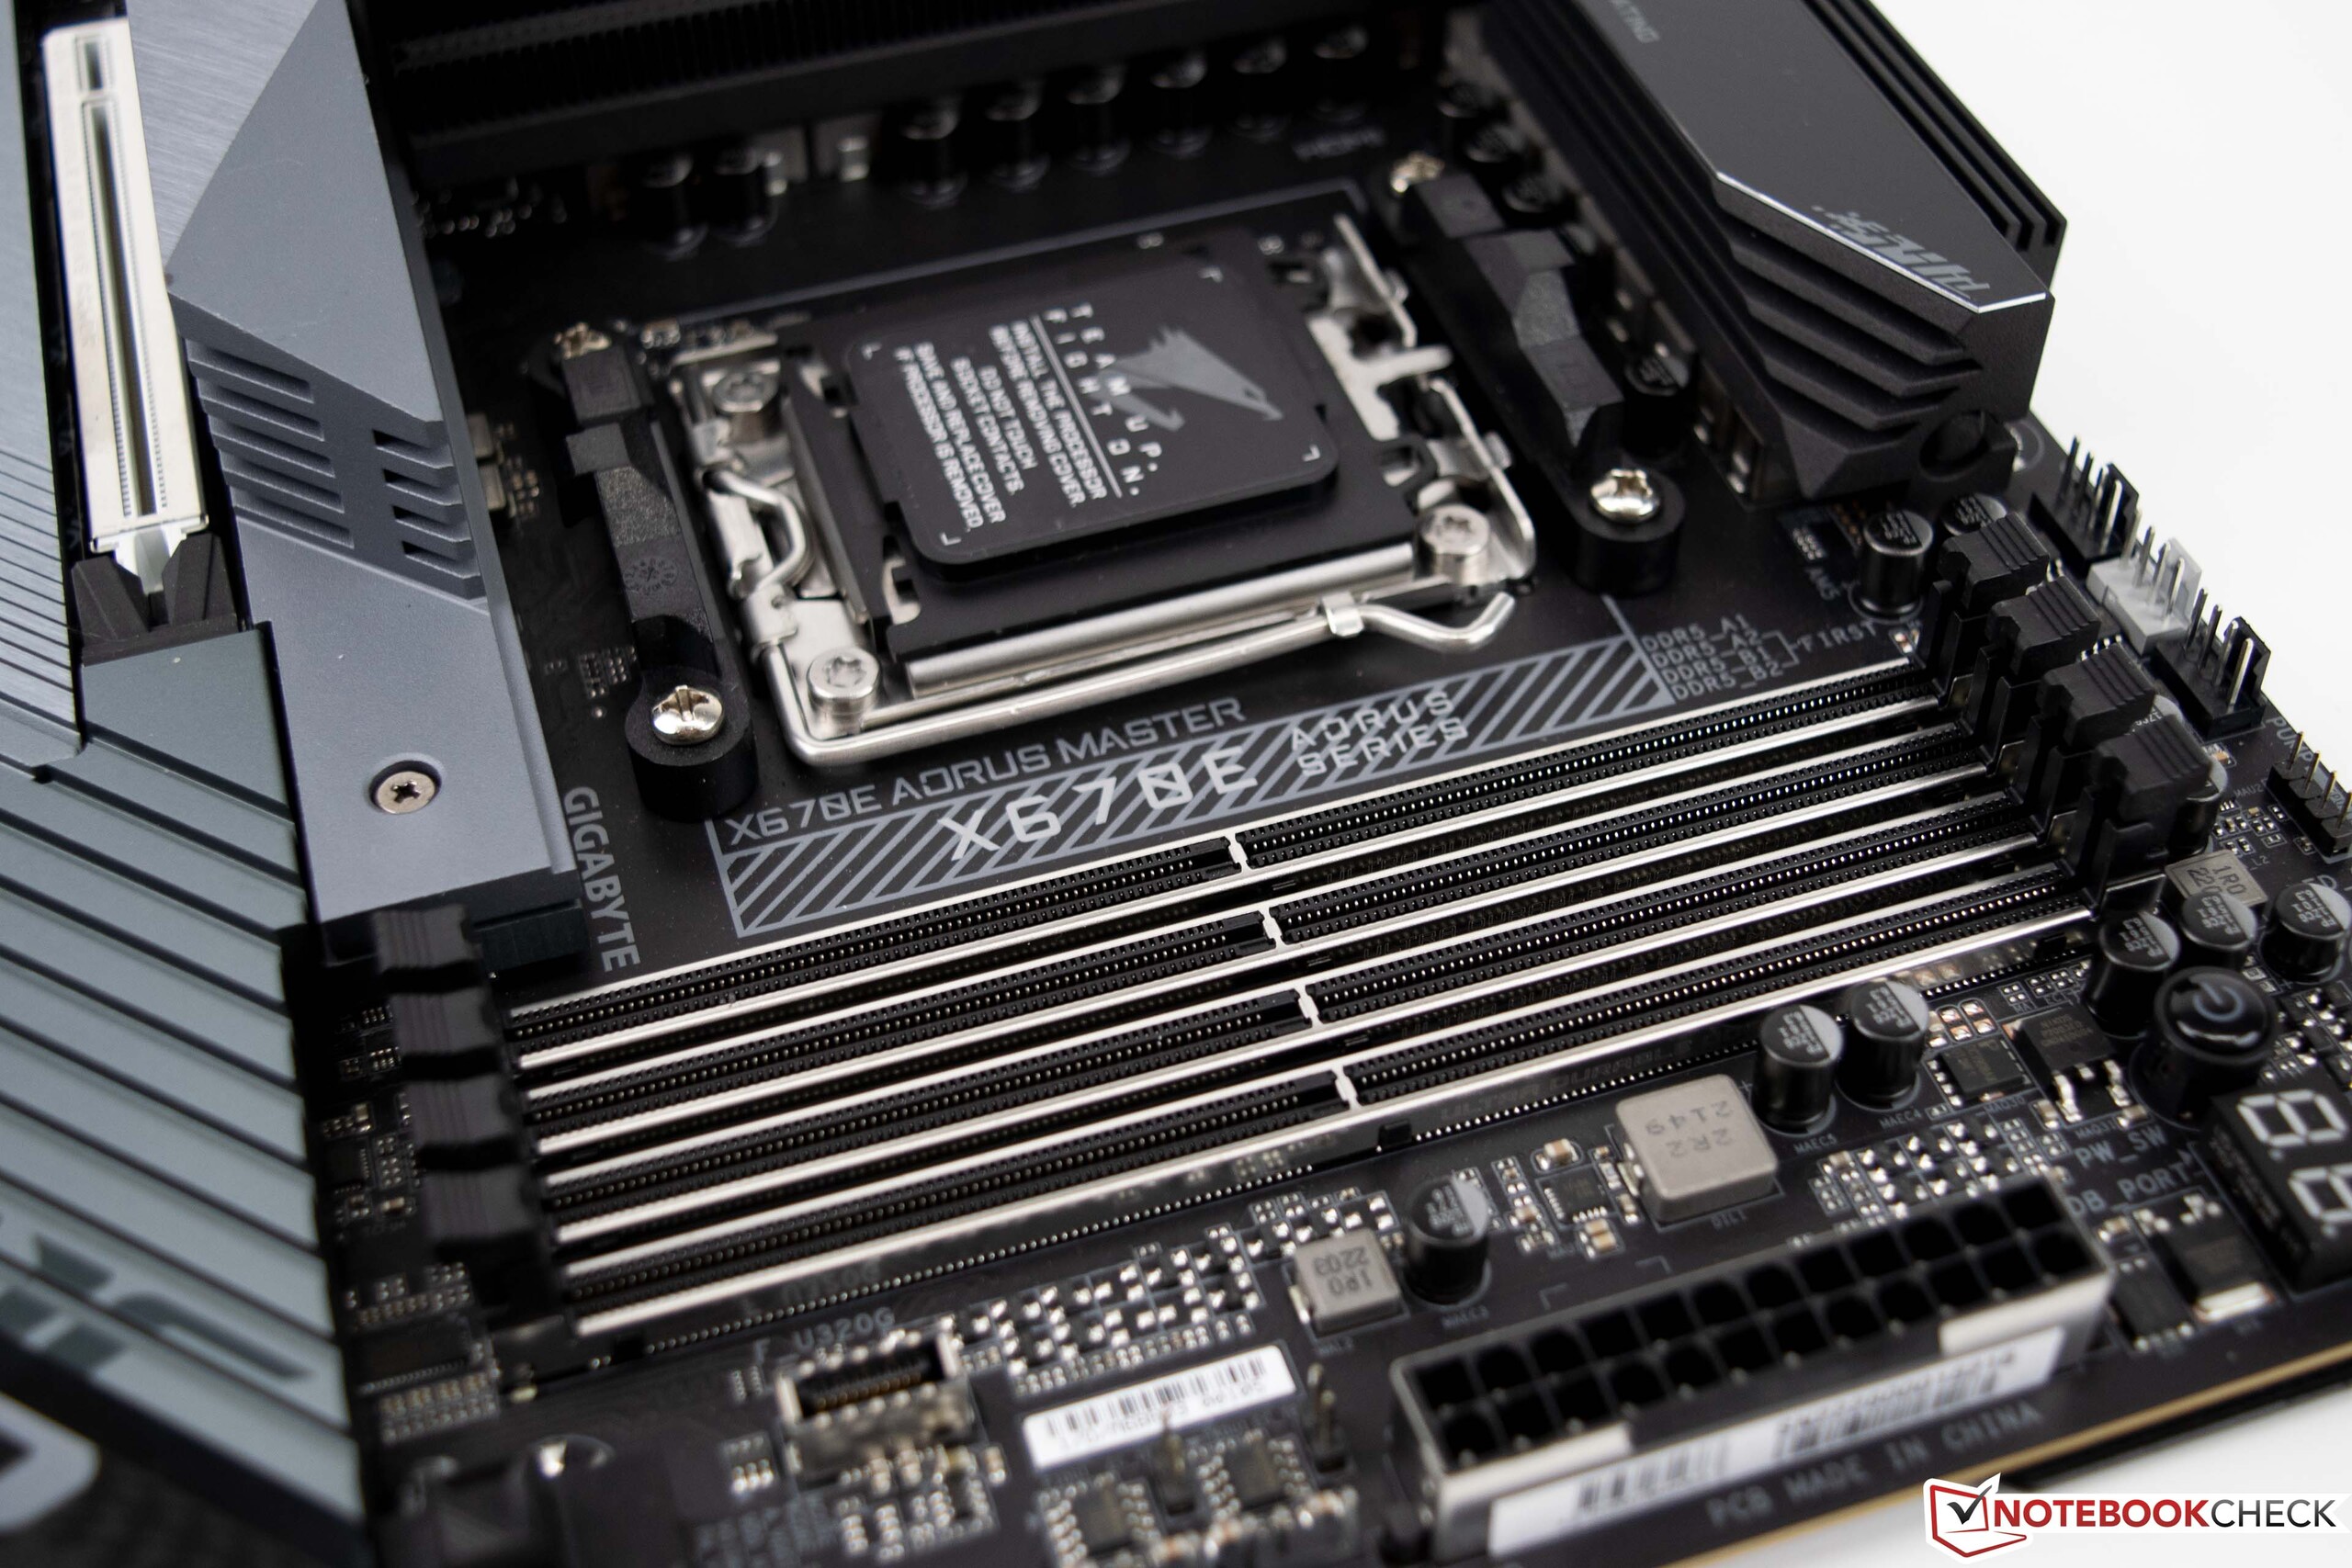
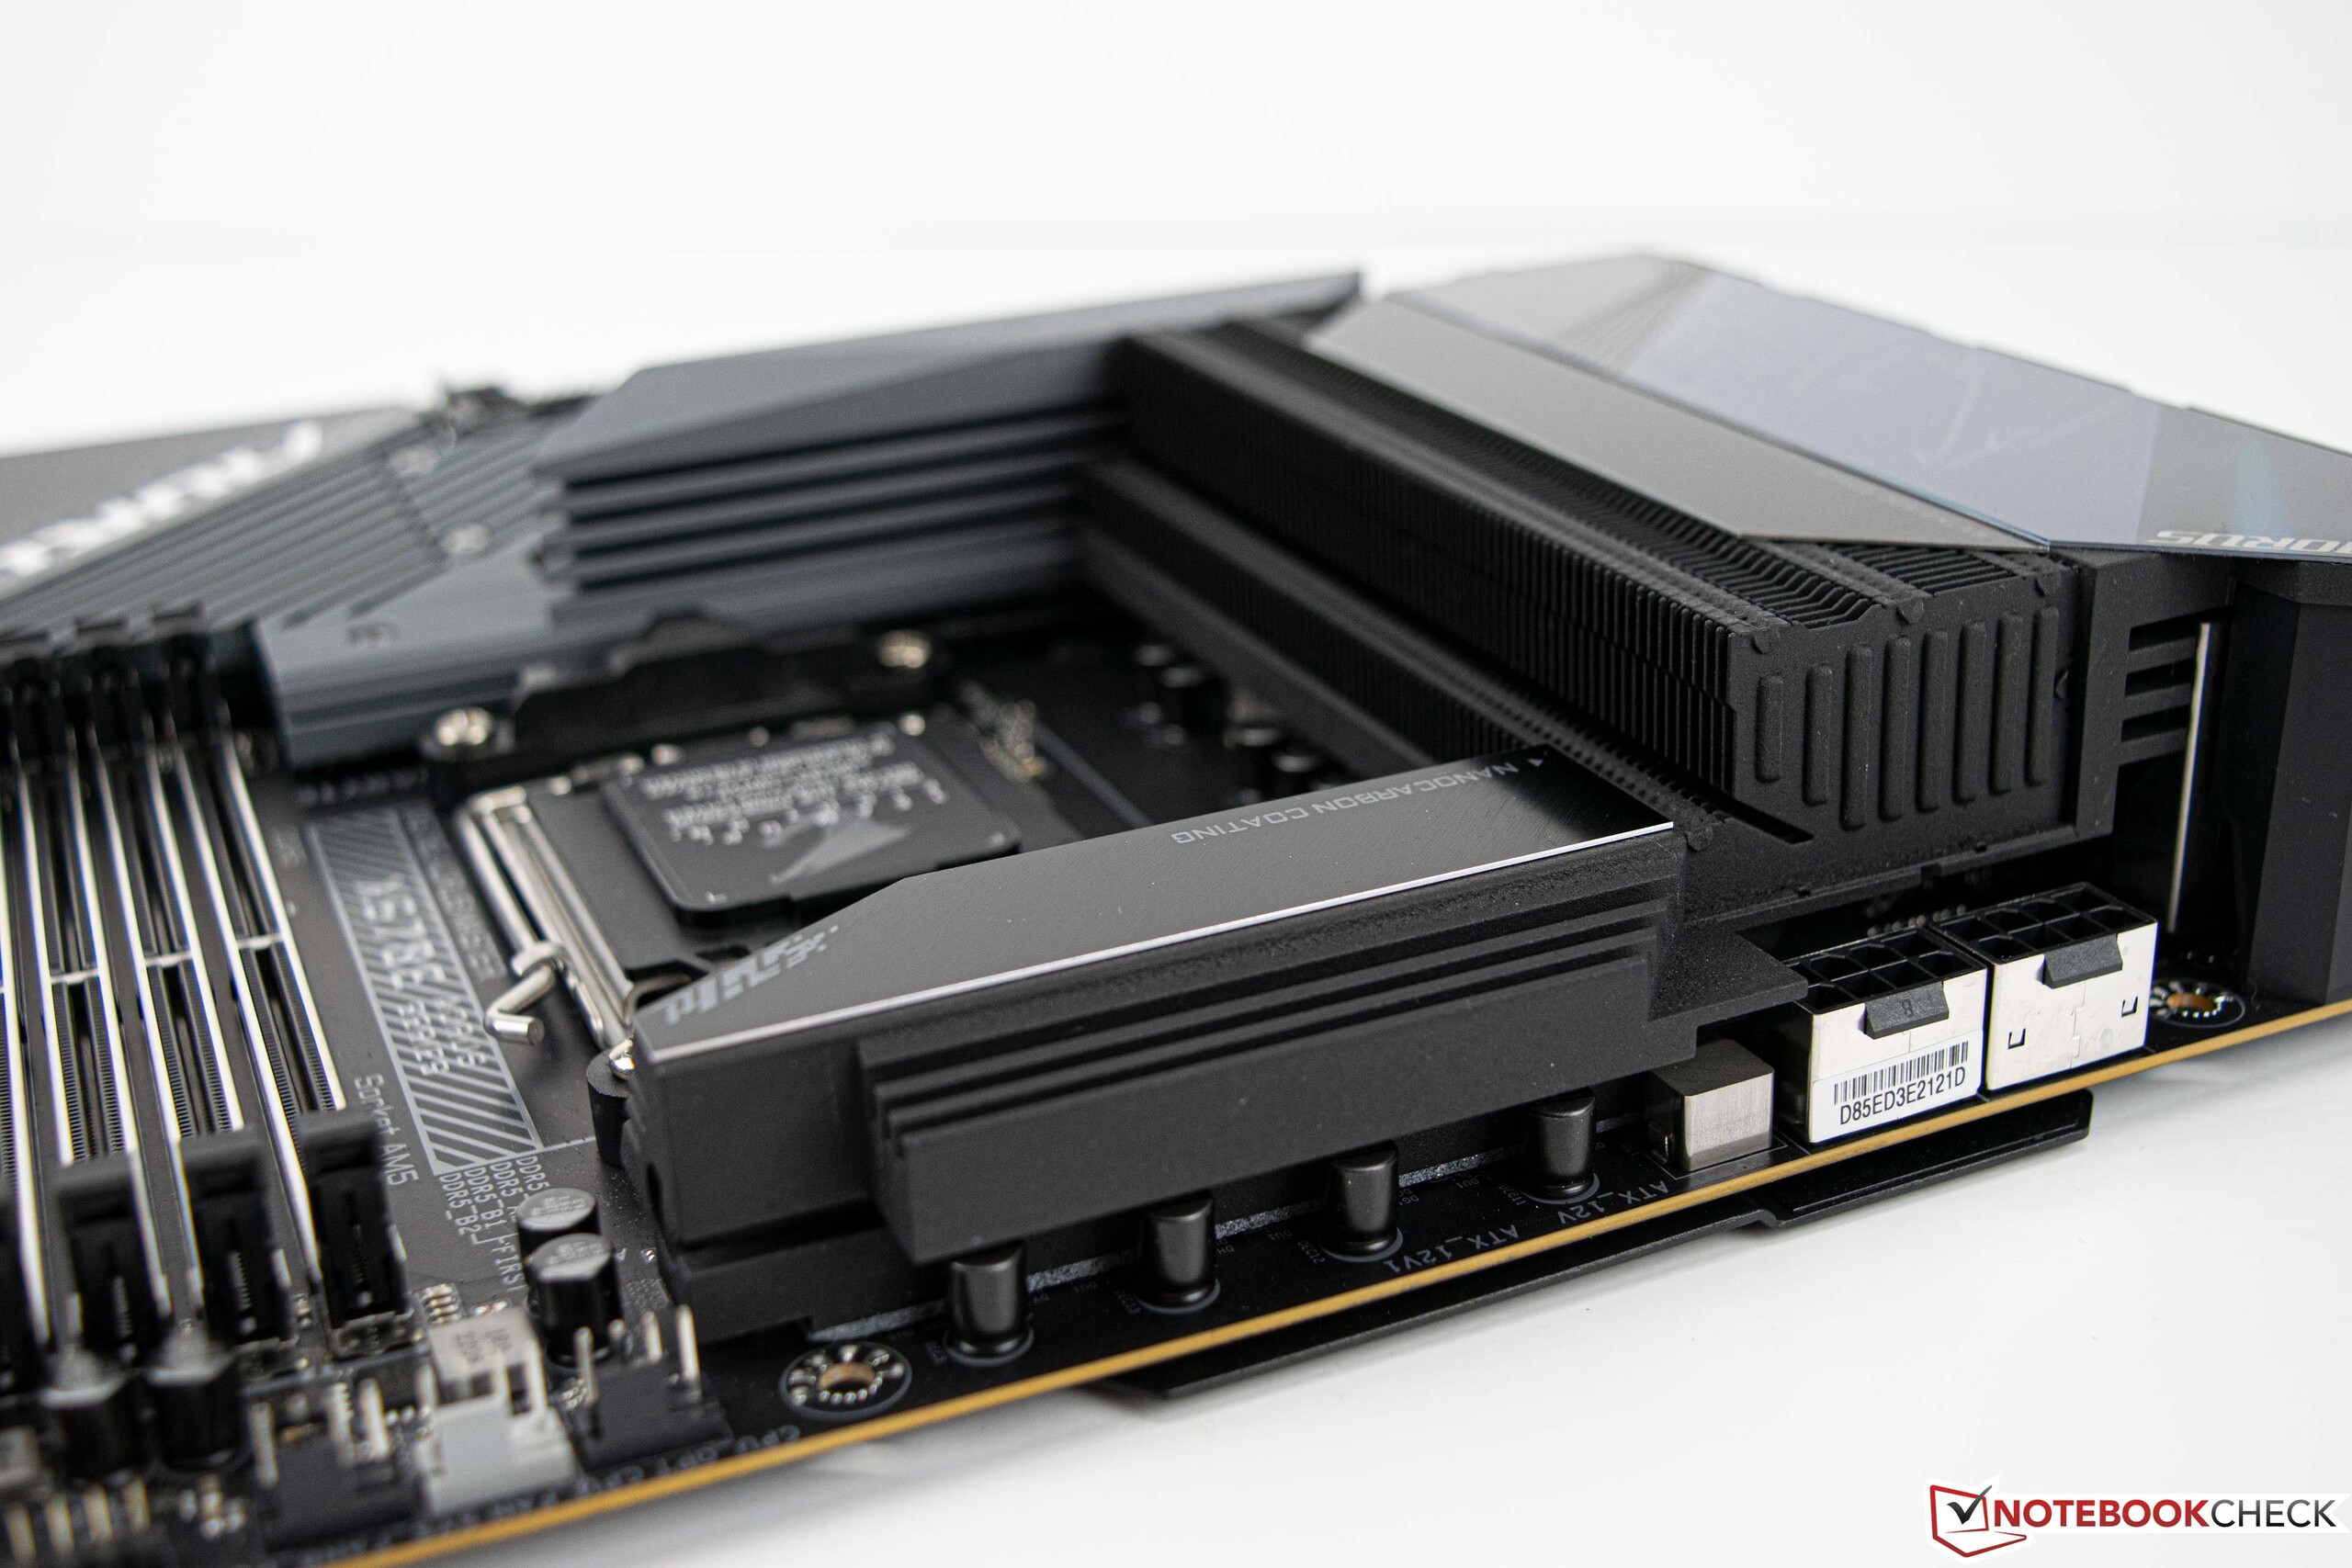
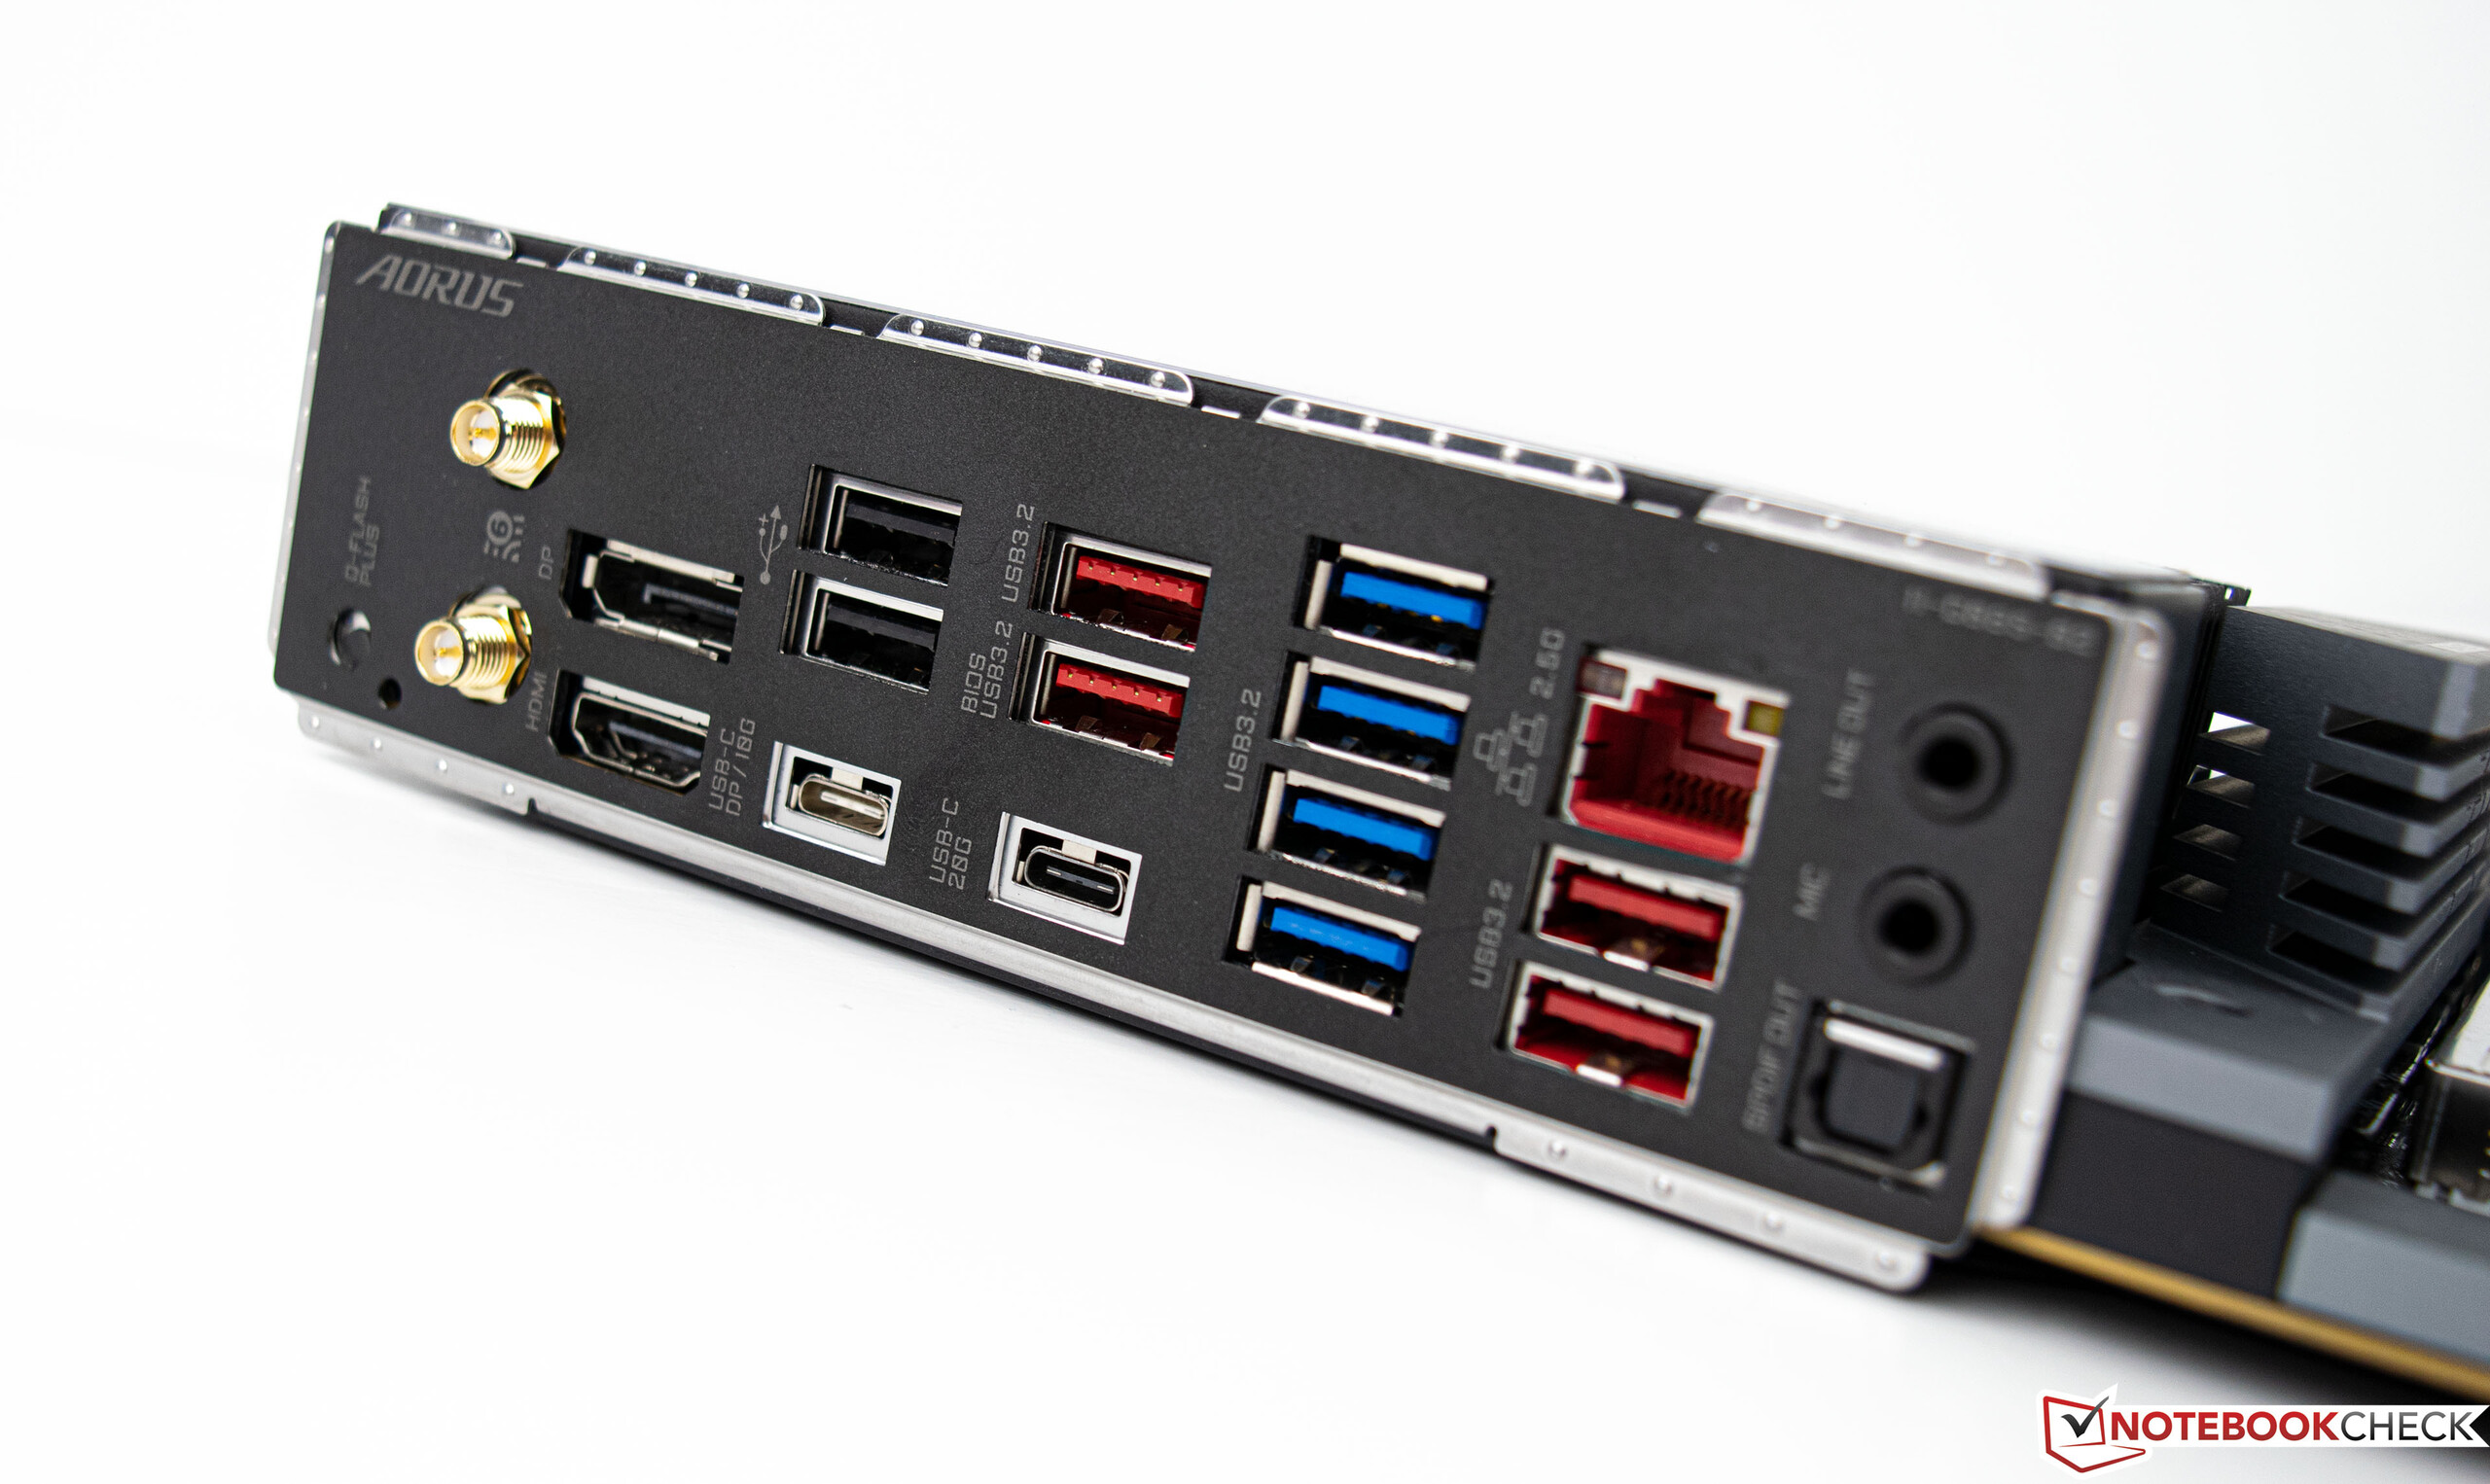
Le Gigabyte X670E Aorus Master en détail
Nous utilisons la Gigabyte X670E Aorus Master comme base pour notre test. Cette carte mère offre toutes les nouvelles fonctionnalités qui accompagnent les nouveaux processeurs AMD Ryzen. Cela inclut le support PCIe 5.0, qui sera utilisé par les futurs SSD mais aussi par les cartes graphiques.
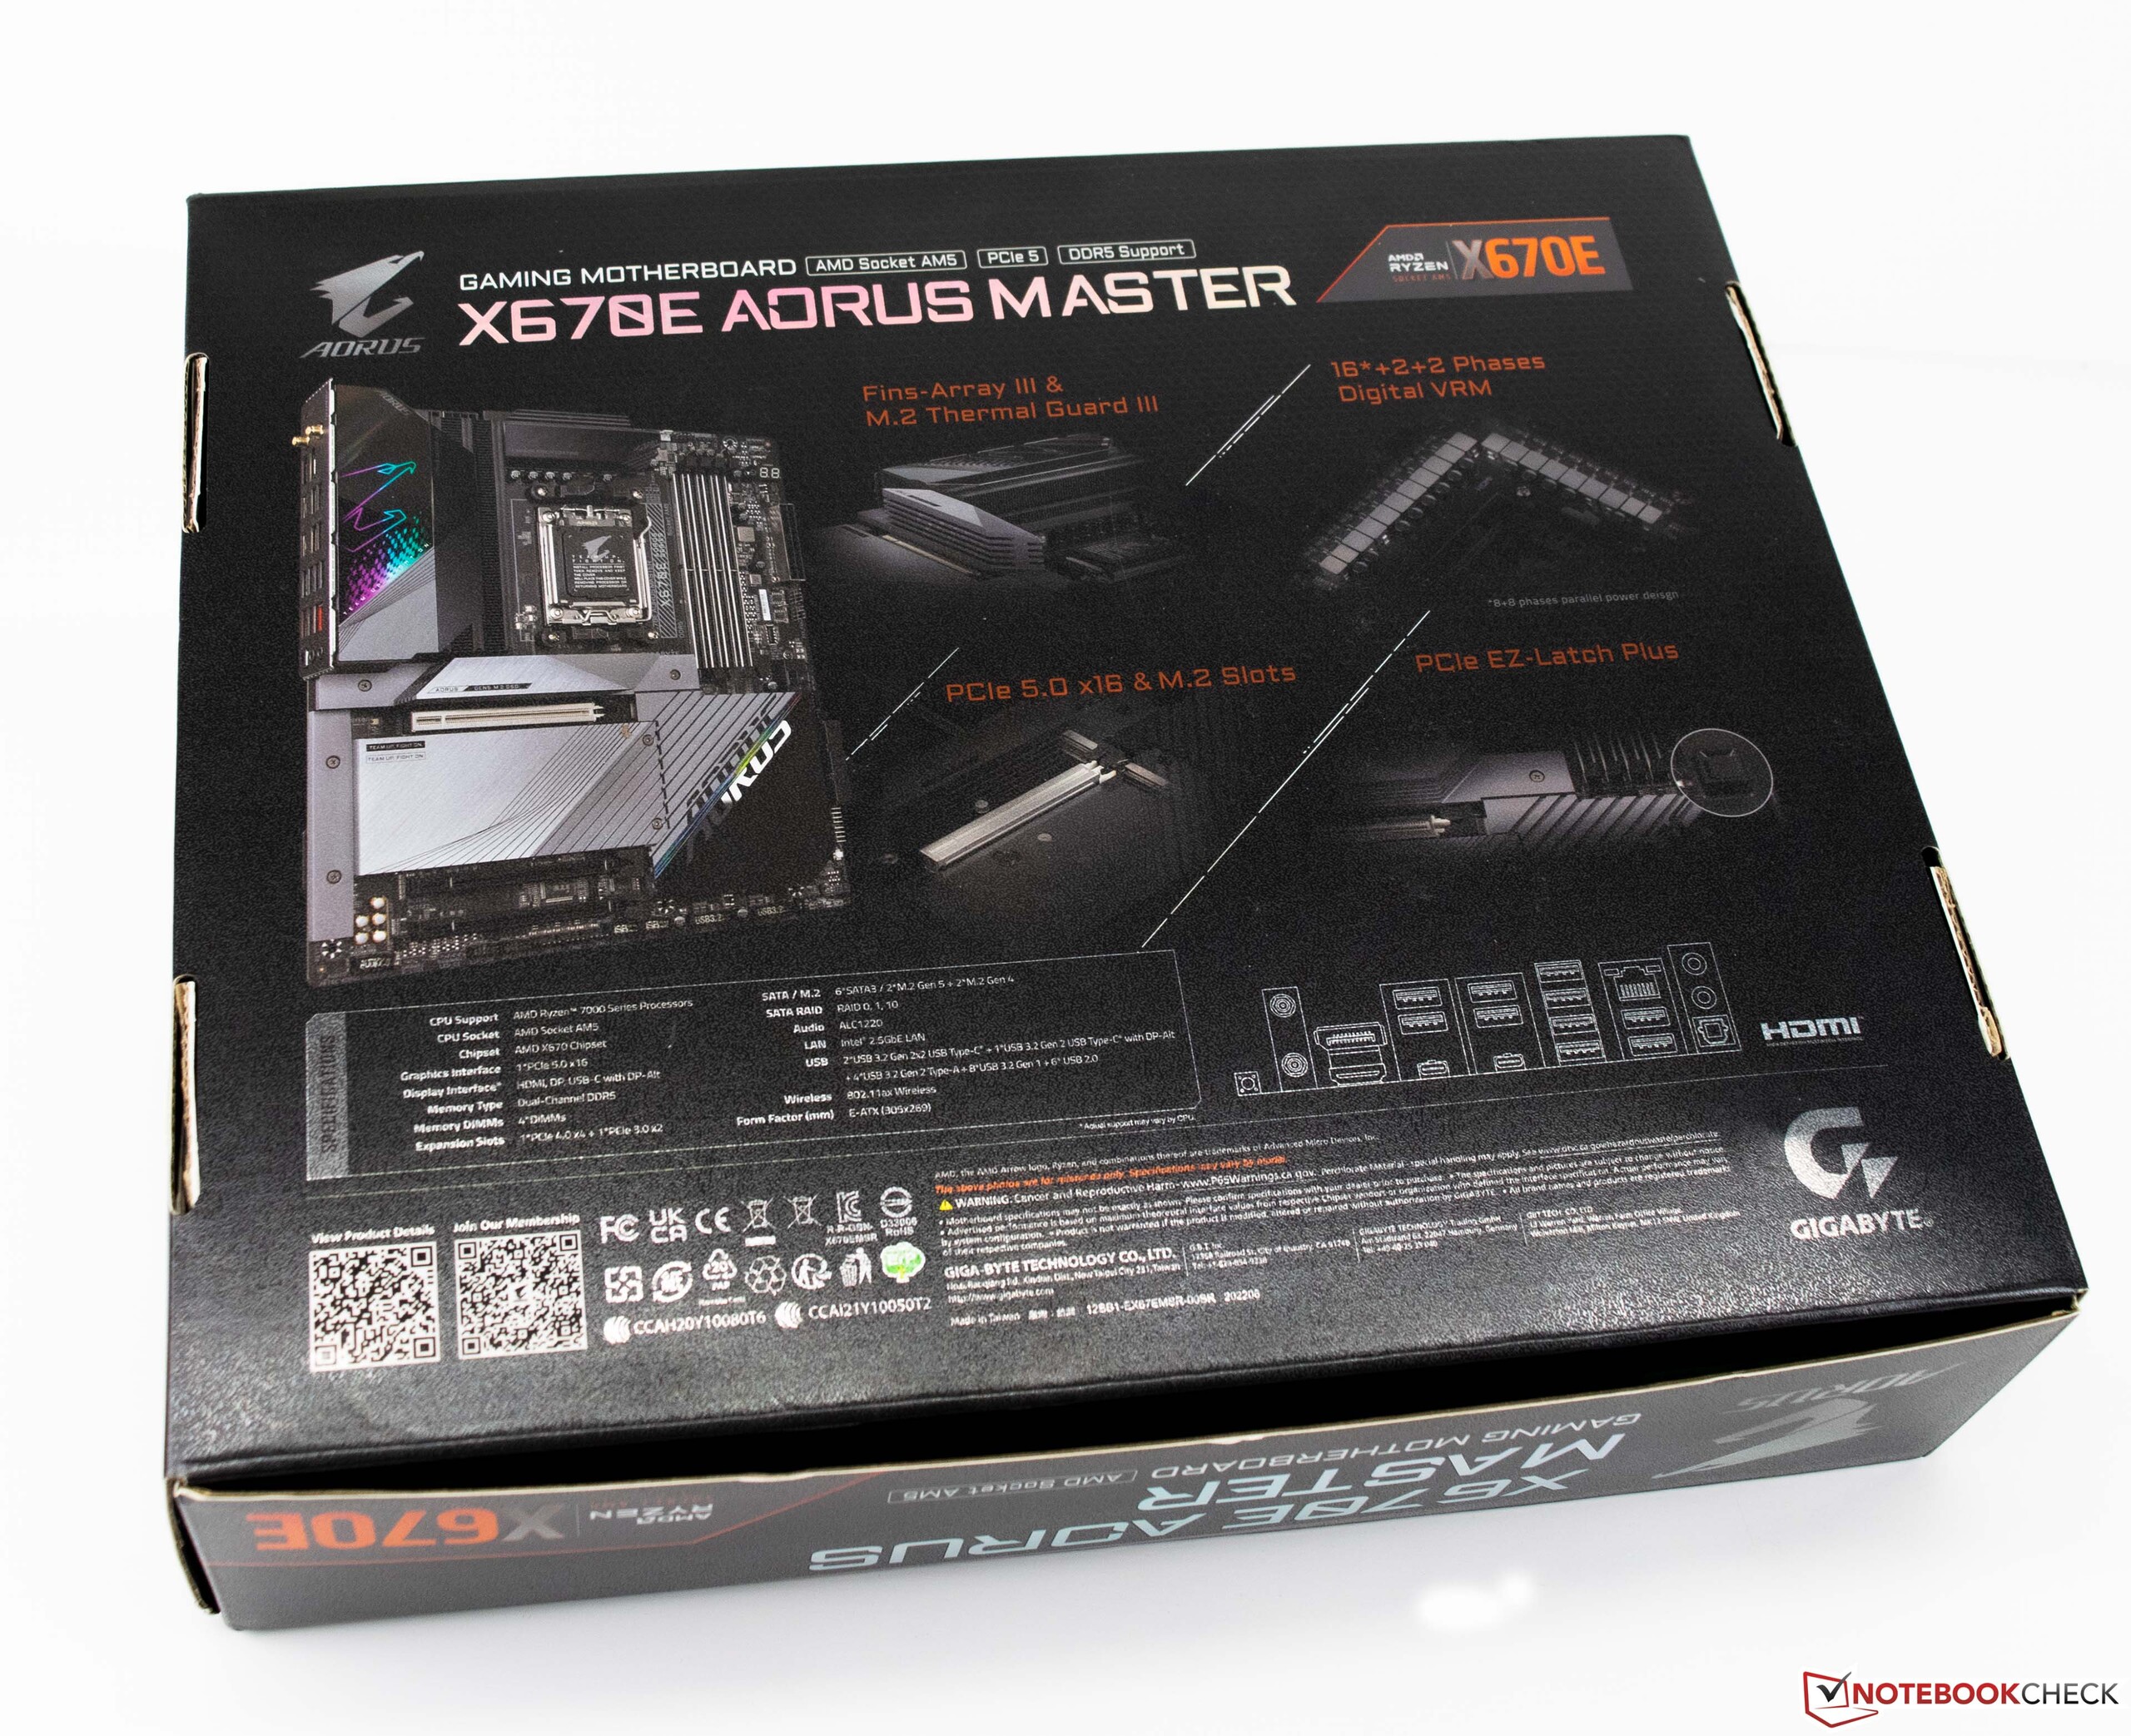
Au total, il y aura quatre chipsets différents pour le socket AM5 : X670E, X670, B650E et B650. Toutefois, les cartes les moins chères ne seront disponibles que dans les prochaines semaines. La carte phare de Gigabyte offre 16+2+2 phases avec le chipset X670 Extreme pour assurer une bonne alimentation du processeur même lors d'overclocking extrême. Les convertisseurs de tension sont situés sous un dissipateur thermique massif, ce qui signifie que nous n'avons pas eu de problèmes de température même sous charge.
Au total, jusqu'à quatre SSD M.2 peuvent être stockés directement sur la carte mère. Néanmoins, seul le premier emplacement M.2 offre le nouveau support PCIe 5.0. Le refroidissement actif du chipset, qui était le cas sur les cartes X570, n'est pas disponible sur la Gigabyte X670E Aorus Master. Le nouveau socket LGA alias AM5 offre 1 718 zones de contact et est compatible avec les anciens refroidisseurs AM4. AMD a également parlé de la durée de vie du nouveau socket AM5 lors du lancement du produit. Il est censé servir de base jusqu'en 2025 au moins.
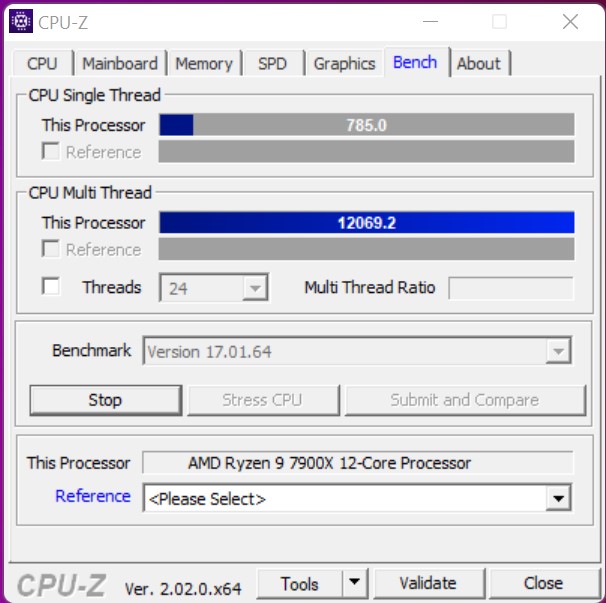
Benchmarks des processeurs
Les spécifications techniques des nouveaux processeurs AMD Ryzen 7000 promettent déjà beaucoup, et les nouveaux processeurs peuvent réellement les prouver en action. Par rapport à la génération Ryzen 5000, nous enregistrons une augmentation des performances de 26% pour l'AMD Ryzen 9 7900X. L'AMD Ryzen 5 7600X peut gagner près de 20% de performance par rapport à l'AMD Ryzen 5 5600X.
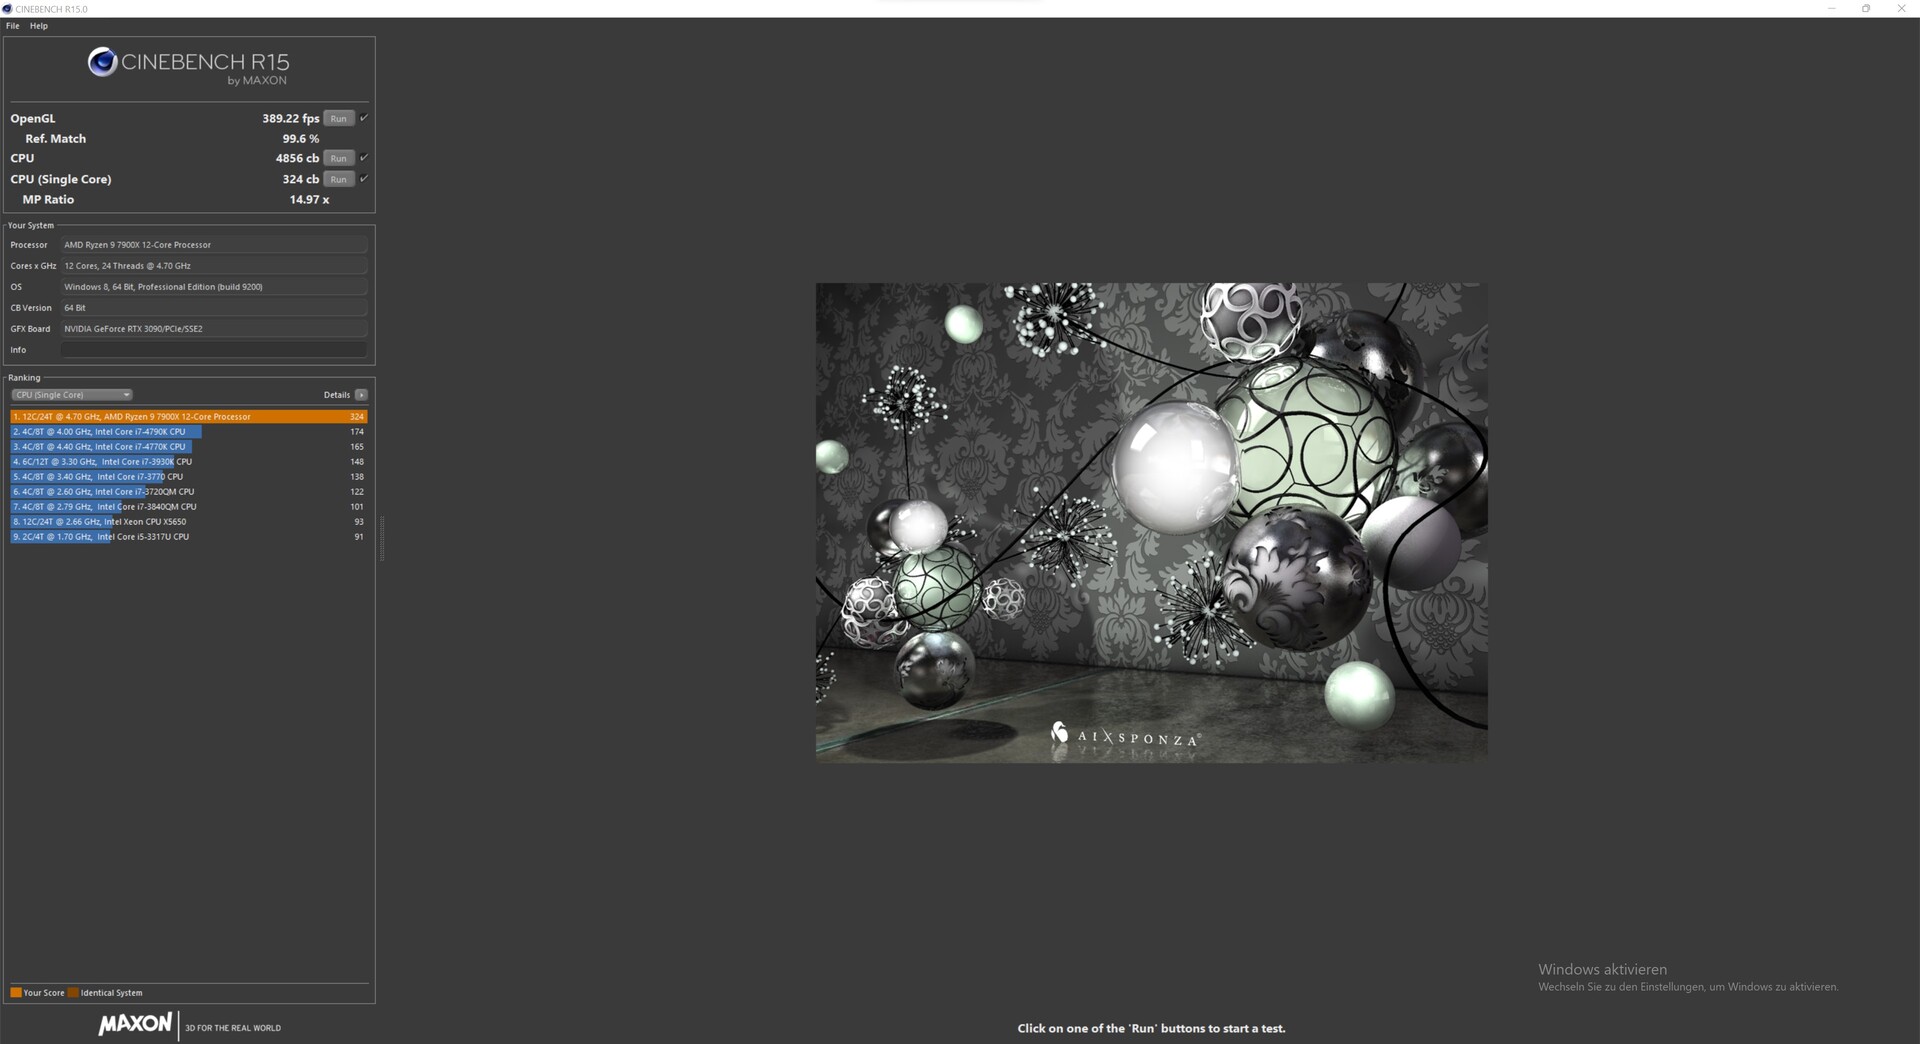
Quant à l'AMD Ryzen 9 7900X, il est même nettement plus rapide que l'AMD Ryzen 9 5950X AMD Ryzen 9 5950X. Mais le nouveau 12-core peut également l'emporter sur le 16-core dans les benchmarks individuels. Nous pouvons donc supposer que l'AMD Ryzen 9 7950X peut également fournir des performances multithread nettement supérieures. Nous essaierons également de faire passer cet échantillon par notre parcours de test dans les prochains jours afin de pouvoir montrer la performance du modèle supérieur par rapport à la concurrence. En parlant de la concurrence, le Intel Core i9-12900K n'arrive pas non plus à suivre l'AMD Ryzen 9 7900X et doit se classer 9% derrière notre échantillon de test.
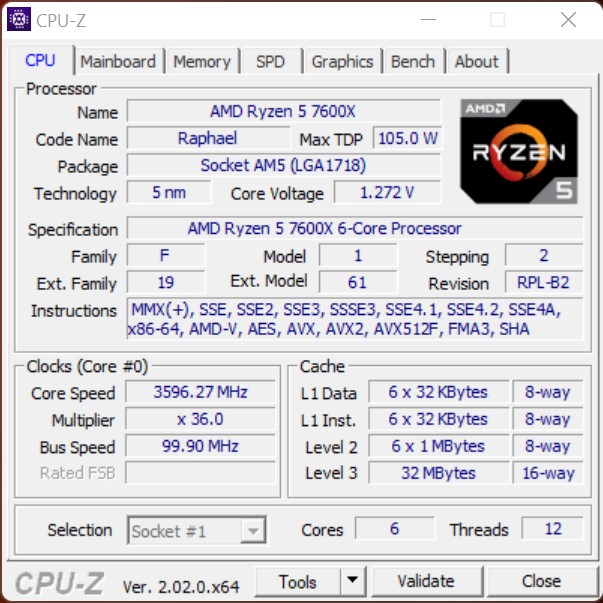
Le plus petit AMD Ryzen 5 7600X est aussi performant et peut surpasser l'AMD Ryzen 5 5600X AMD Ryzen 5 5600X clairement. L'avance sur le Intel Core i5-12600K est un peu plus faible que celle du 12-core, à environ 6%, mais elle est toujours là.
Il reste à voir ce qu'Intel va proposer en termes de nouveaux processeurs Raptor Lake. Ceux-ci devraient suivre prochainement et nous nous réjouissons déjà d'une nouvelle bataille.
AMD Ryzen 9 7900X

AMD Ryzen 5 7600X
| Performance rating - Percent | |
| AMD Ryzen 9 7900X | |
| Intel Core i9-12900K | |
| AMD Ryzen 9 5950X | |
| AMD Ryzen 5 7600X | |
| Intel Core i5-12600K | |
| AMD Ryzen 9 5900X -2! | |
| AMD Ryzen 5 5600X | |
| Cinebench R15 | |
| CPU Single 64Bit | |
| AMD Ryzen 9 7900X | |
| AMD Ryzen 5 7600X | |
| Intel Core i9-12900K | |
| Intel Core i5-12600K | |
| AMD Ryzen 9 5950X | |
| AMD Ryzen 9 5900X | |
| AMD Ryzen 5 5600X | |
| CPU Multi 64Bit | |
| AMD Ryzen 9 7900X | |
| AMD Ryzen 9 5950X | |
| Intel Core i9-12900K | |
| AMD Ryzen 9 5900X | |
| Intel Core i5-12600K | |
| AMD Ryzen 5 7600X | |
| AMD Ryzen 5 5600X | |
| Cinebench R20 | |
| CPU (Single Core) | |
| AMD Ryzen 9 7900X | |
| Intel Core i9-12900K | |
| AMD Ryzen 5 7600X | |
| Intel Core i5-12600K | |
| AMD Ryzen 9 5950X | |
| AMD Ryzen 9 5900X | |
| AMD Ryzen 5 5600X | |
| CPU (Multi Core) | |
| AMD Ryzen 9 7900X | |
| AMD Ryzen 9 5950X | |
| Intel Core i9-12900K | |
| AMD Ryzen 9 5900X | |
| Intel Core i5-12600K | |
| AMD Ryzen 5 7600X | |
| AMD Ryzen 5 5600X | |
| Cinebench R23 | |
| Single Core | |
| AMD Ryzen 9 7900X | |
| Intel Core i9-12900K | |
| AMD Ryzen 5 7600X | |
| Intel Core i5-12600K | |
| AMD Ryzen 9 5950X | |
| AMD Ryzen 9 5900X | |
| AMD Ryzen 5 5600X | |
| Multi Core | |
| AMD Ryzen 9 7900X | |
| AMD Ryzen 9 5950X | |
| Intel Core i9-12900K | |
| AMD Ryzen 9 5900X | |
| Intel Core i5-12600K | |
| AMD Ryzen 5 7600X | |
| AMD Ryzen 5 5600X | |
| Cinebench R11.5 | |
| CPU Single 64Bit | |
| AMD Ryzen 9 7900X | |
| AMD Ryzen 5 7600X | |
| Intel Core i9-12900K | |
| Intel Core i5-12600K | |
| AMD Ryzen 9 5900X | |
| AMD Ryzen 9 5950X | |
| AMD Ryzen 5 5600X | |
| CPU Multi 64Bit | |
| AMD Ryzen 9 7900X | |
| AMD Ryzen 9 5950X | |
| Intel Core i9-12900K | |
| AMD Ryzen 9 5900X | |
| Intel Core i5-12600K | |
| AMD Ryzen 5 7600X | |
| AMD Ryzen 5 5600X | |
| Cinebench R10 | |
| Rendering Single CPUs 64Bit | |
| AMD Ryzen 9 7900X | |
| Intel Core i9-12900K | |
| AMD Ryzen 5 7600X | |
| Intel Core i5-12600K | |
| AMD Ryzen 9 5950X | |
| AMD Ryzen 9 5900X | |
| AMD Ryzen 5 5600X | |
| Rendering Multiple CPUs 64Bit | |
| AMD Ryzen 9 7900X | |
| Intel Core i9-12900K | |
| AMD Ryzen 9 5950X | |
| AMD Ryzen 9 5900X | |
| AMD Ryzen 5 7600X | |
| Intel Core i5-12600K | |
| AMD Ryzen 5 5600X | |
| Blender - v2.79 BMW27 CPU | |
| AMD Ryzen 5 5600X | |
| AMD Ryzen 5 7600X | |
| Intel Core i5-12600K | |
| AMD Ryzen 9 5900X | |
| Intel Core i9-12900K | |
| AMD Ryzen 9 5950X | |
| AMD Ryzen 9 7900X | |
| X264 HD Benchmark 4.0 | |
| Pass 1 | |
| AMD Ryzen 9 7900X | |
| Intel Core i9-12900K | |
| AMD Ryzen 5 7600X | |
| AMD Ryzen 9 5950X | |
| AMD Ryzen 9 5900X | |
| Intel Core i5-12600K | |
| AMD Ryzen 5 5600X | |
| Pass 2 | |
| AMD Ryzen 9 7900X | |
| AMD Ryzen 9 5950X | |
| Intel Core i9-12900K | |
| AMD Ryzen 9 5900X | |
| Intel Core i5-12600K | |
| AMD Ryzen 5 7600X | |
| AMD Ryzen 5 5600X | |
| WinRAR - Result | |
| AMD Ryzen 9 7900X | |
| AMD Ryzen 5 7600X | |
| AMD Ryzen 9 5900X | |
| AMD Ryzen 5 5600X | |
| AMD Ryzen 9 5950X | |
| Intel Core i9-12900K | |
| Intel Core i5-12600K | |
| TrueCrypt | |
| AES Mean 100MB | |
| AMD Ryzen 9 5950X | |
| AMD Ryzen 9 5900X | |
| Intel Core i9-12900K | |
| AMD Ryzen 9 7900X | |
| AMD Ryzen 5 7600X | |
| Intel Core i5-12600K | |
| AMD Ryzen 5 5600X | |
| Twofish Mean 100MB | |
| AMD Ryzen 9 5950X | |
| Intel Core i9-12900K | |
| AMD Ryzen 9 5900X | |
| AMD Ryzen 9 7900X | |
| Intel Core i5-12600K | |
| AMD Ryzen 5 7600X | |
| AMD Ryzen 5 5600X | |
| Serpent Mean 100MB | |
| AMD Ryzen 9 5950X | |
| Intel Core i9-12900K | |
| AMD Ryzen 9 5900X | |
| AMD Ryzen 9 7900X | |
| Intel Core i5-12600K | |
| AMD Ryzen 5 7600X | |
| AMD Ryzen 5 5600X | |
| Geekbench 5.5 | |
| Multi-Core | |
| AMD Ryzen 9 7900X | |
| Intel Core i9-12900K | |
| AMD Ryzen 9 5950X | |
| AMD Ryzen 9 5900X | |
| Intel Core i5-12600K | |
| AMD Ryzen 5 7600X | |
| AMD Ryzen 5 5600X | |
| Single-Core | |
| AMD Ryzen 9 7900X | |
| AMD Ryzen 5 7600X | |
| Intel Core i9-12900K | |
| Intel Core i5-12600K | |
| AMD Ryzen 9 5950X | |
| AMD Ryzen 9 5900X | |
| AMD Ryzen 5 5600X | |
| Geekbench 5.0 | |
| 5.0 Multi-Core | |
| AMD Ryzen 9 7900X | |
| Intel Core i9-12900K | |
| AMD Ryzen 9 5950X | |
| AMD Ryzen 9 5900X | |
| Intel Core i5-12600K | |
| AMD Ryzen 5 7600X | |
| AMD Ryzen 5 5600X | |
| 5.0 Single-Core | |
| AMD Ryzen 9 7900X | |
| AMD Ryzen 5 7600X | |
| Intel Core i9-12900K | |
| Intel Core i5-12600K | |
| AMD Ryzen 9 5950X | |
| AMD Ryzen 9 5900X | |
| AMD Ryzen 5 5600X | |
| Geekbench 4.4 | |
| 64 Bit Single-Core Score | |
| AMD Ryzen 9 7900X | |
| AMD Ryzen 5 7600X | |
| Intel Core i9-12900K | |
| Intel Core i5-12600K | |
| AMD Ryzen 9 5900X | |
| AMD Ryzen 9 5950X | |
| AMD Ryzen 5 5600X | |
| 64 Bit Multi-Core Score | |
| AMD Ryzen 9 7900X | |
| Intel Core i9-12900K | |
| AMD Ryzen 9 5950X | |
| AMD Ryzen 9 5900X | |
| AMD Ryzen 5 7600X | |
| Intel Core i5-12600K | |
| AMD Ryzen 5 5600X | |
| 3DMark 11 - 1280x720 Performance Physics | |
| AMD Ryzen 9 7900X | |
| Intel Core i9-12900K | |
| AMD Ryzen 5 7600X | |
| AMD Ryzen 9 5950X | |
| Intel Core i5-12600K | |
| AMD Ryzen 9 5900X | |
| AMD Ryzen 5 5600X | |
| 7-Zip 18.03 | |
| 7z b 4 | |
| AMD Ryzen 9 5950X | |
| AMD Ryzen 9 7900X | |
| Intel Core i9-12900K | |
| AMD Ryzen 9 5900X | |
| AMD Ryzen 5 7600X | |
| Intel Core i5-12600K | |
| AMD Ryzen 5 5600X | |
| 7z b 4 -mmt1 | |
| AMD Ryzen 9 7900X | |
| AMD Ryzen 5 7600X | |
| AMD Ryzen 9 5950X | |
| AMD Ryzen 9 5900X | |
| AMD Ryzen 5 5600X | |
| Intel Core i9-12900K | |
| Intel Core i5-12600K | |
| HWBOT x265 Benchmark v2.2 - 4k Preset | |
| AMD Ryzen 9 7900X | |
| AMD Ryzen 9 5950X | |
| Intel Core i5-12600K | |
| Intel Core i9-12900K | |
| AMD Ryzen 9 5900X | |
| AMD Ryzen 5 7600X | |
| AMD Ryzen 5 5600X | |
| R Benchmark 2.5 - Overall mean | |
| AMD Ryzen 5 5600X | |
| AMD Ryzen 9 5950X | |
| AMD Ryzen 9 5900X | |
| Intel Core i5-12600K | |
| Intel Core i9-12900K | |
| AMD Ryzen 5 7600X | |
| AMD Ryzen 9 7900X | |
| LibreOffice - 20 Documents To PDF | |
| Intel Core i5-12600K | |
| AMD Ryzen 9 5900X | |
| AMD Ryzen 9 5950X | |
| AMD Ryzen 5 5600X | |
| Intel Core i9-12900K | |
| AMD Ryzen 5 7600X | |
| AMD Ryzen 9 7900X | |
| WebXPRT 3 - Overall | |
| AMD Ryzen 9 7900X | |
| AMD Ryzen 5 7600X | |
| Intel Core i9-12900K | |
| Intel Core i5-12600K | |
| AMD Ryzen 9 5950X | |
| AMD Ryzen 5 5600X | |
| AMD Ryzen 9 5900X | |
| Mozilla Kraken 1.1 - Total | |
| AMD Ryzen 5 5600X | |
| AMD Ryzen 9 5900X | |
| AMD Ryzen 9 5950X | |
| Intel Core i5-12600K | |
| Intel Core i9-12900K | |
| AMD Ryzen 5 7600X | |
| AMD Ryzen 9 7900X | |
| 3DMark | |
| 3840x2160 Fire Strike Ultra Physics | |
| AMD Ryzen 9 7900X | |
| Intel Core i9-12900K | |
| AMD Ryzen 9 5950X | |
| AMD Ryzen 9 5900X | |
| AMD Ryzen 5 7600X | |
| Intel Core i5-12600K | |
| AMD Ryzen 5 5600X | |
| 1920x1080 Fire Strike Physics | |
| AMD Ryzen 9 7900X | |
| AMD Ryzen 9 5950X | |
| Intel Core i9-12900K | |
| AMD Ryzen 9 5900X | |
| AMD Ryzen 5 7600X | |
| Intel Core i5-12600K | |
| AMD Ryzen 5 5600X | |
| 2560x1440 Time Spy CPU | |
| Intel Core i9-12900K | |
| AMD Ryzen 9 7900X | |
| Intel Core i5-12600K | |
| AMD Ryzen 9 5950X | |
| AMD Ryzen 9 5900X | |
| AMD Ryzen 5 7600X | |
| AMD Ryzen 5 5600X | |
* ... Moindre est la valeur, meilleures sont les performances


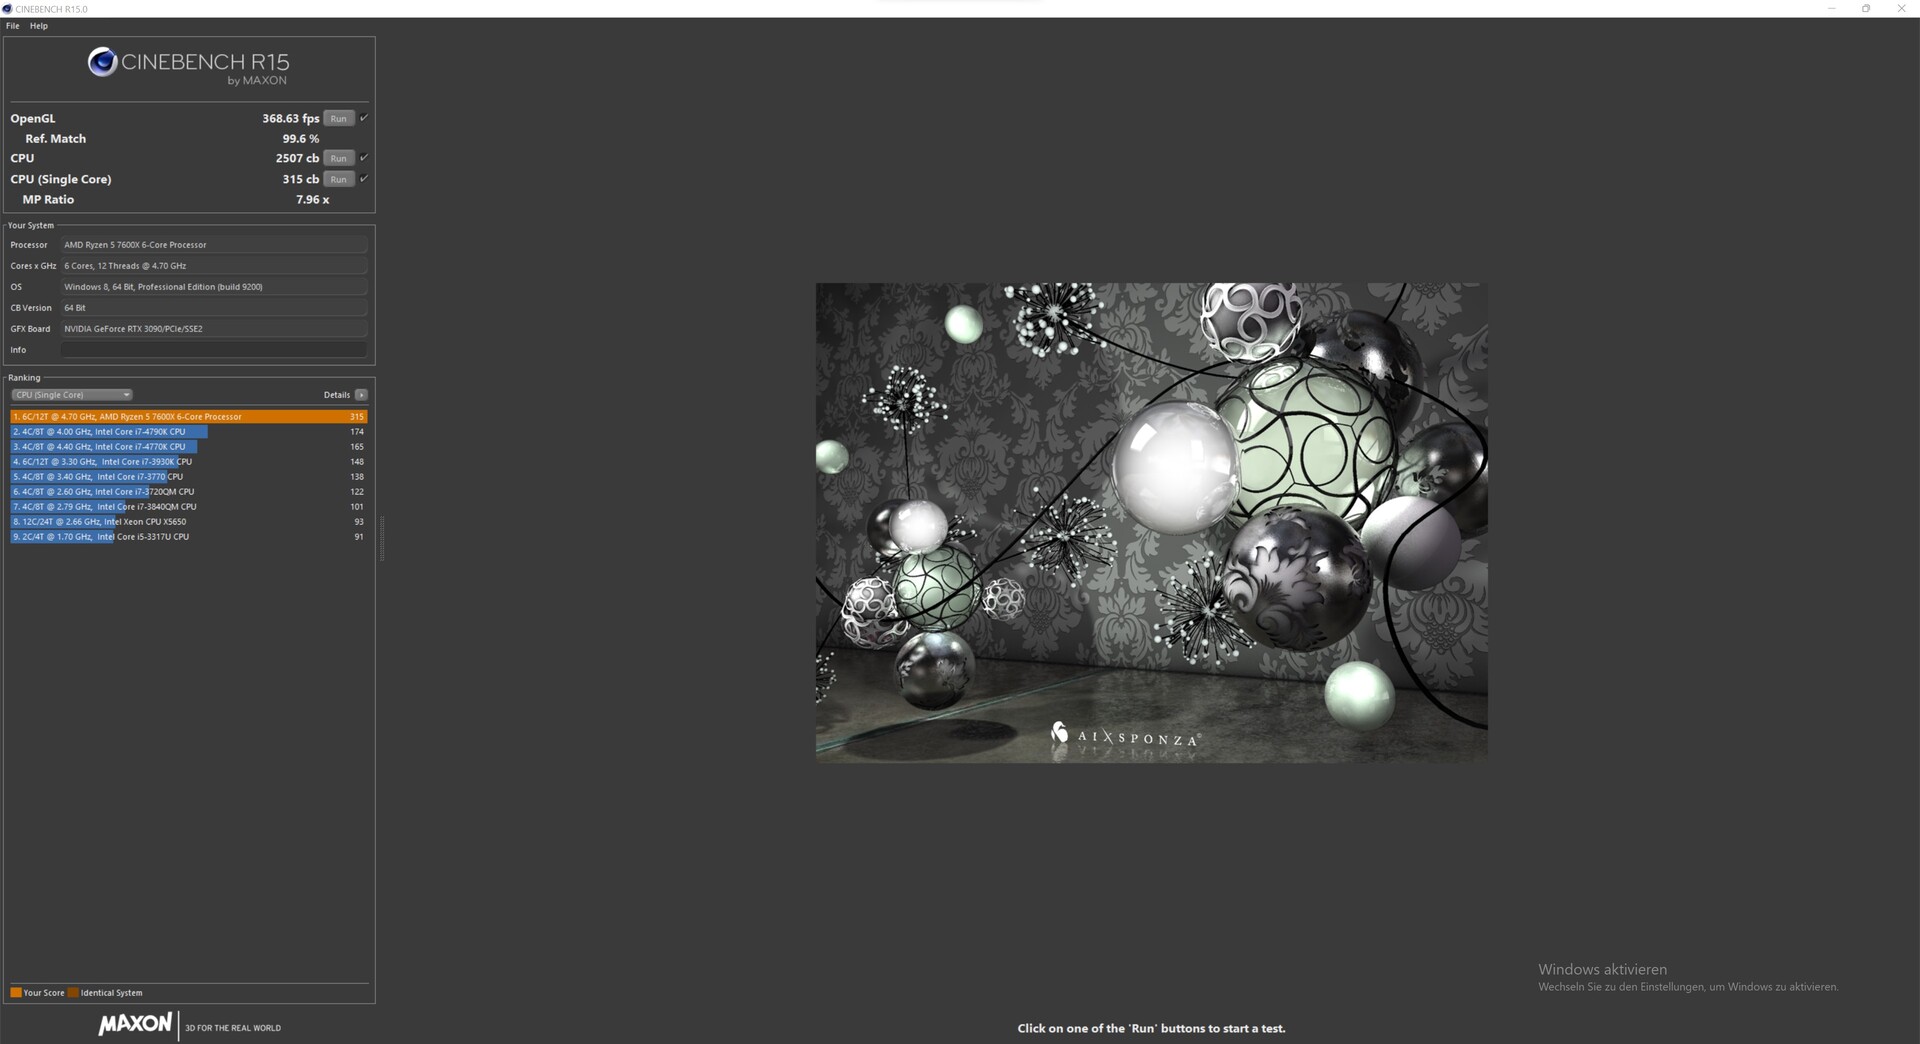

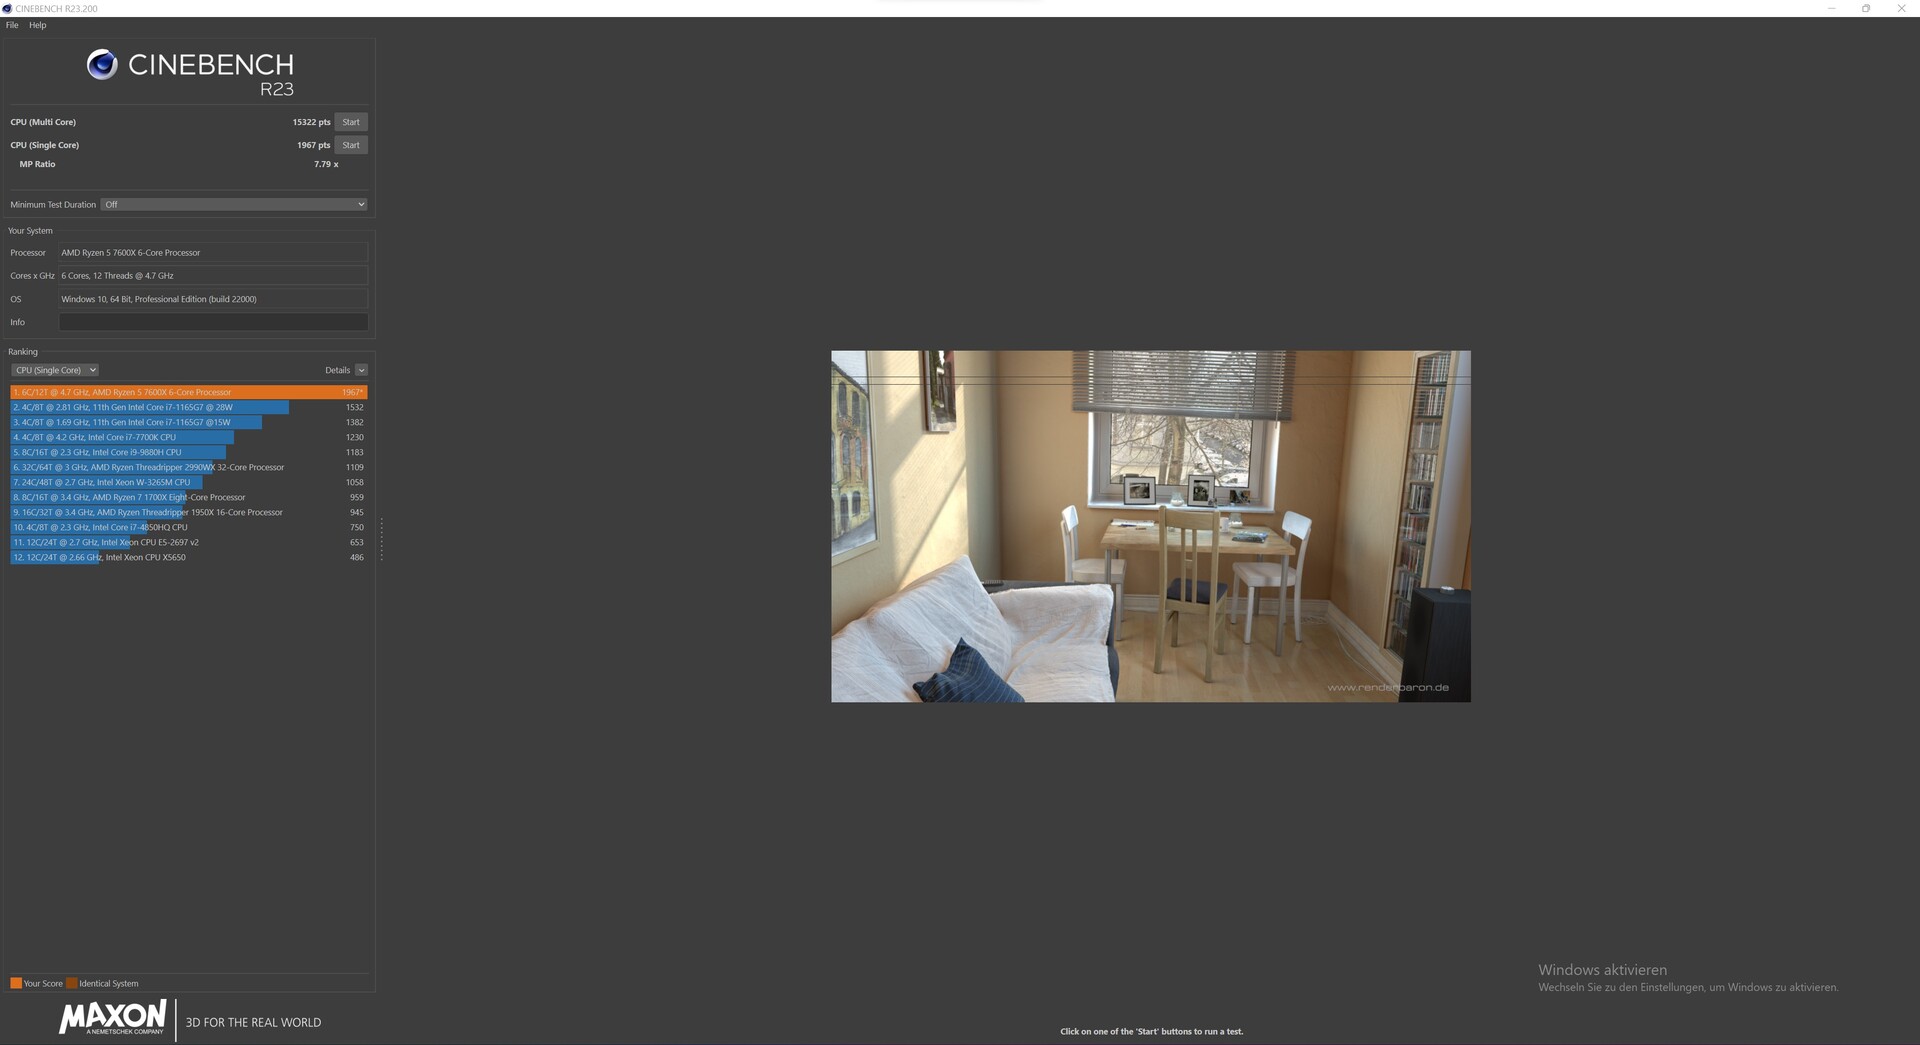
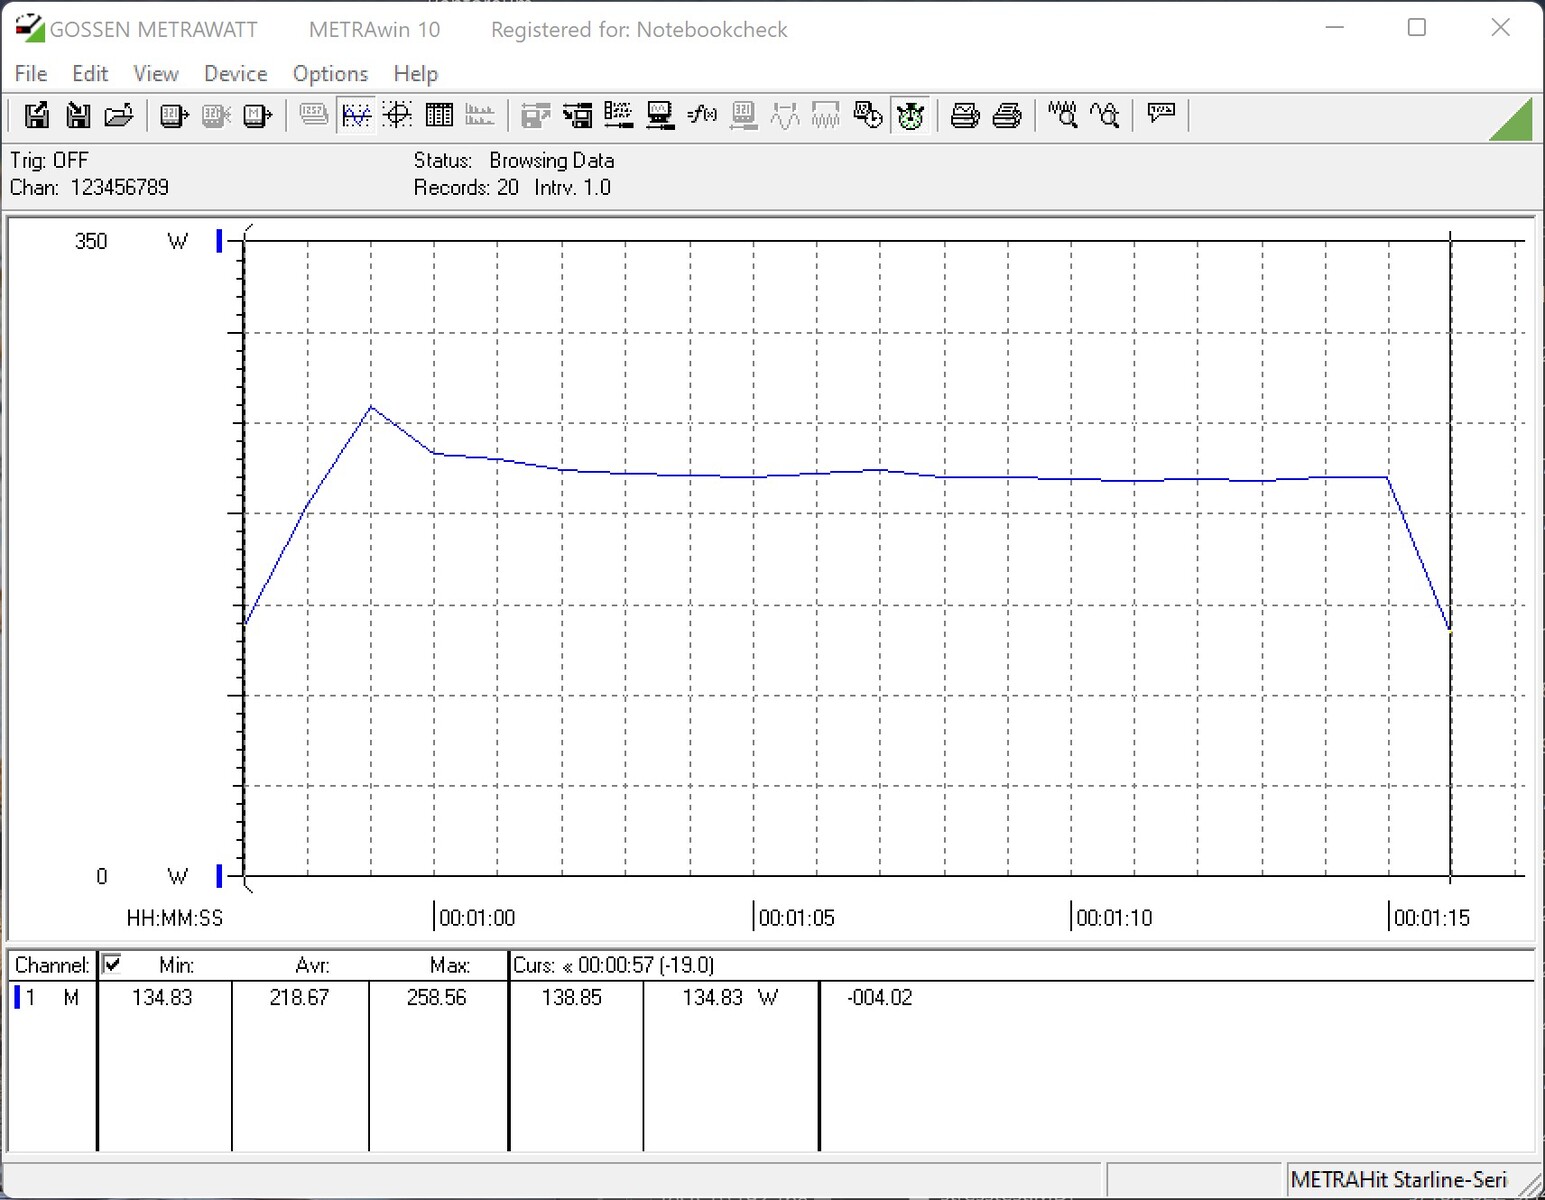
AMD Ryzen 5 7600X + AMD Ryzen 9 7900X vs. Cinebench R15 multi-boucles
La haute performance multithread peut également être maintenue en permanence dans notre configuration de test, comme nous pouvons le voir dans les résultats de la multi-boucle Cinebench R15. Avec une moyenne de 4 785 points, l'AMD Ryzen 9 7900X termine ce test mieux que l'AMD Ryzen 9 5950X AMD Ryzen 9 5950X (4 467 points)
L'AMD Ryzen 5 7600X n'arrive pas tout à fait à suivre l'avance du Intel Core i5 12600K bien que l'écart soit excessivement faible avec seulement 100 points sur les 50 passages. Le site Intel Core i9-12900K ne joue pas un grand rôle ici et ne peut même pas mettre sous pression l'AMD Ryzen 9 7900X.
Bancs d'essai synthétiques et performances des applications
Les deux nouveaux processeurs AMD donnent clairement le ton dans les benchmarks synthétiques. L'AMD Ryzen 9 7900X peut se placer devant la concurrence avec une nette avance. AMD doit seulement se classer derrière Intel dans les benchmarks de mémoire. Néanmoins, l'écart n'est que de pourcentages à un chiffre.
| PCMark 10 - Score | |
| AMD Ryzen 9 7900X | |
| AMD Ryzen 5 7600X | |
| AMD Ryzen 9 5950X | |
| Intel Core i9-12900K | |
| AMD Ryzen 5 5600X | |
| Intel Core i5-12600K | |
| AMD Ryzen 9 5900X | |
| 3DMark 11 - 1280x720 Performance Physics | |
| AMD Ryzen 9 7900X | |
| Intel Core i9-12900K | |
| AMD Ryzen 5 7600X | |
| AMD Ryzen 9 5950X | |
| Intel Core i5-12600K | |
| Intel Core i9-12900K | |
| AMD Ryzen 9 5900X | |
| AMD Ryzen 5 5600X | |
| CrossMark - Overall | |
| AMD Ryzen 9 7900X | |
| AMD Ryzen 5 7600X | |
| Intel Core i5-12600K | |
| AMD Ryzen 9 5900X | |
| AMD Ryzen 9 5950X | |
| AMD Ryzen 5 5600X | |
| AIDA64 / Memory Copy | |
| Intel Core i5-12600K | |
| AMD Ryzen 9 7900X | |
| AMD Ryzen 9 5900X | |
| AMD Ryzen 5 7600X | |
| AMD Ryzen 9 5950X | |
| Desktop-PC | |
| AMD Ryzen 5 5600X | |
| Moyenne de la classe (4514 - 234662, n=2201) | |
| AIDA64 / Memory Read | |
| Intel Core i5-12600K | |
| AMD Ryzen 9 7900X | |
| AMD Ryzen 9 5900X | |
| AMD Ryzen 9 5950X | |
| AMD Ryzen 5 5600X | |
| AMD Ryzen 5 7600X | |
| Moyenne de la classe (4031 - 271066, n=2163) | |
| Desktop-PC | |
| AIDA64 / Memory Write | |
| AMD Ryzen 5 7600X | |
| AMD Ryzen 9 7900X | |
| Intel Core i5-12600K | |
| Moyenne de la classe (3506 - 242868, n=2168) | |
| AMD Ryzen 9 5900X | |
| Desktop-PC | |
| AMD Ryzen 9 5950X | |
| AMD Ryzen 5 5600X | |
| AIDA64 / Memory Latency | |
| Moyenne de la classe (6.1 - 536, n=2230) | |
| Intel Core i5-12600K | |
| AMD Ryzen 9 5950X | |
| AMD Ryzen 5 5600X | |
| AMD Ryzen 5 7600X | |
| AMD Ryzen 9 7900X | |
| Desktop-PC | |
| AMD Ryzen 9 5900X | |
* ... Moindre est la valeur, meilleures sont les performances
Bancs d'essai de jeux
Passons maintenant aux benchmarks pour les jeux. En raison des performances élevées des processeurs Intel en mode single-thread, Intel a longtemps donné le ton ici et a été progressivement mis sous pression par AMD avec les CPU Ryzen 5000. Ce n'est qu'avec le Intel Core i9-12900Kqu'Intel a pu regagner la couronne dans ce domaine. Mais il y a maintenant un autre changement au sommet, car le Intel Core i9-12900K est maintenant battu par les nouveaux processeurs AMD Ryzen de la génération 7000. Le Core i9-12900K doit même se subordonner à l'AMD Ryzen 5 7600X, ce qui est très impressionnant.
Il faut néanmoins relativiser le fait que la différence de performance se réduit avec l'augmentation des résolutions, car elle dépend alors davantage des performances de la carte graphique. Néanmoins, nous pouvons en partie nous passer d'une augmentation drastique des performances en faveur des nouveaux processeurs AMD Ryzen à 1080p avec un maximum de détails.
Gaming performance in direct comparison with Intel
| Performance rating - Percent | |
| AMD Ryzen 9 7900X | |
| AMD Ryzen 5 7600X | |
| Intel Core i9-12900K | |
| Intel Core i5-12600K -2! | |
| F1 22 | |
| 1920x1080 Low Preset AA:T AF:16x | |
| AMD Ryzen 9 7900X | |
| AMD Ryzen 5 7600X | |
| Intel Core i9-12900K | |
| Intel Core i5-12600K | |
| 1920x1080 Ultra High Preset AA:T AF:16x | |
| Intel Core i9-12900K | |
| Intel Core i5-12600K | |
| AMD Ryzen 5 7600X | |
| AMD Ryzen 9 7900X | |
| Cyberpunk 2077 1.6 | |
| 1920x1080 Ultra Preset | |
| AMD Ryzen 9 7900X | |
| Intel Core i5-12600K | |
| AMD Ryzen 5 7600X | |
| Intel Core i9-12900K | |
| 1920x1080 Low Preset | |
| Intel Core i9-12900K | |
| AMD Ryzen 9 7900X | |
| AMD Ryzen 5 7600X | |
| Intel Core i5-12600K | |
| Far Cry 5 | |
| 1920x1080 Ultra Preset AA:T | |
| Intel Core i9-12900K | |
| AMD Ryzen 9 7900X | |
| AMD Ryzen 5 7600X | |
| Intel Core i5-12600K | |
| 1280x720 Low Preset AA:T | |
| AMD Ryzen 9 7900X | |
| AMD Ryzen 5 7600X | |
| Intel Core i9-12900K | |
| Intel Core i5-12600K | |
| X-Plane 11.11 | |
| 1920x1080 high (fps_test=3) | |
| AMD Ryzen 9 7900X | |
| AMD Ryzen 5 7600X | |
| Intel Core i9-12900K | |
| Intel Core i5-12600K | |
| 1280x720 low (fps_test=1) | |
| AMD Ryzen 5 7600X | |
| AMD Ryzen 9 7900X | |
| Intel Core i9-12900K | |
| Intel Core i5-12600K | |
| Final Fantasy XV Benchmark | |
| 1920x1080 High Quality | |
| AMD Ryzen 9 7900X | |
| AMD Ryzen 5 7600X | |
| Intel Core i9-12900K | |
| Intel Core i5-12600K | |
| 1280x720 Lite Quality | |
| AMD Ryzen 9 7900X | |
| Intel Core i9-12900K | |
| AMD Ryzen 5 7600X | |
| Intel Core i5-12600K | |
| Dota 2 Reborn | |
| 1920x1080 ultra (3/3) best looking | |
| AMD Ryzen 9 7900X | |
| AMD Ryzen 5 7600X | |
| Intel Core i9-12900K | |
| Intel Core i5-12600K | |
| 1280x720 min (0/3) fastest | |
| AMD Ryzen 5 7600X | |
| AMD Ryzen 9 7900X | |
| Intel Core i9-12900K | |
| Intel Core i5-12600K | |
| The Witcher 3 | |
| 1920x1080 Ultra Graphics & Postprocessing (HBAO+) | |
| AMD Ryzen 9 7900X | |
| AMD Ryzen 5 7600X | |
| Intel Core i9-12900K | |
| 1024x768 Low Graphics & Postprocessing | |
| AMD Ryzen 9 7900X | |
| AMD Ryzen 5 7600X | |
| Intel Core i9-12900K | |
| GTA V | |
| 1920x1080 Highest AA:4xMSAA + FX AF:16x | |
| AMD Ryzen 9 7900X | |
| AMD Ryzen 5 7600X | |
| Intel Core i9-12900K | |
| Intel Core i5-12600K | |
| 1024x768 Lowest Settings possible | |
| AMD Ryzen 9 7900X | |
| AMD Ryzen 5 7600X | |
| Intel Core i9-12900K | |
| Intel Core i5-12600K | |
Ryzen 9 7900X with Nvidia GeForce RTX 3090
| Bas | Moyen | Élevé | Ultra | QHD | 4K | |
|---|---|---|---|---|---|---|
| GTA V (2015) | 187.5 | 187.5 | 187.1 | 161.4 | 151.8 | 182.2 |
| The Witcher 3 (2015) | 773 | 586 | 384 | 188.1 | 156.9 | |
| Dota 2 Reborn (2015) | 293.1 | 257 | 250.4 | 231.65 | 216.7 | |
| Final Fantasy XV Benchmark (2018) | 236 | 231 | 190.8 | 146.6 | 88.8 | |
| X-Plane 11.11 (2018) | 225 | 199.2 | 160.9 | 133.5 | ||
| Far Cry 5 (2018) | 244 | 211 | 203 | 186 | 176 | 110 |
| Strange Brigade (2018) | 741 | 479 | 380 | 329 | 249 | 153.1 |
| Shadow of the Tomb Raider (2018) | 314 | 261 | 251 | 234 | 172.2 | 99.6 |
| Far Cry New Dawn (2019) | 200 | 176 | 169 | 151 | 143 | 109 |
| Metro Exodus (2019) | 311 | 223 | 175.2 | 140.1 | 115.8 | 76.6 |
| Borderlands 3 (2019) | 244 | 213 | 190.8 | 164.1 | 131.6 | 75.3 |
| F1 2020 (2020) | 487 | 403 | 374 | 270 | 218 | 138.8 |
| F1 2021 (2021) | 648 | 548 | 441 | 224 | 175.4 | 105.3 |
| Cyberpunk 2077 1.6 (2022) | 214 | 213 | 174 | 173 | 88 | 46 |
| Tiny Tina's Wonderlands (2022) | 364 | 294 | 212 | 168.5 | 124 | 70.8 |
| F1 22 (2022) | 344 | 361 | 321 | 125.1 | 83.8 | 42.4 |
| The Quarry (2022) | 282 | 216 | 177.7 | 144.4 | 103.6 | 58.9 |
Ryzen 5 7600X with Nvidia GeForce RTX 3090
| Bas | Moyen | Élevé | Ultra | QHD | 4K | |
|---|---|---|---|---|---|---|
| GTA V (2015) | 187.5 | 187.5 | 186.7 | 155.2 | 148 | 181.9 |
| The Witcher 3 (2015) | 710 | 566 | 265 | 186.4 | 158.1 | |
| Dota 2 Reborn (2015) | 301.3 | 260 | 244.9 | 228.5 | 214.5 | |
| Final Fantasy XV Benchmark (2018) | 233 | 227 | 188.4 | 147.1 | 90.6 | |
| X-Plane 11.11 (2018) | 227 | 193.6 | 151.8 | 127.6 | ||
| Far Cry 5 (2018) | 238 | 208 | 196 | 183 | 171 | 111 |
| Strange Brigade (2018) | 819 | 510 | 402 | 354 | 270 | 161.4 |
| Shadow of the Tomb Raider (2018) | 299 | 251 | 241 | 228 | 172 | 99.7 |
| Far Cry New Dawn (2019) | 191 | 168 | 161 | 144 | 138 | 109 |
| Metro Exodus (2019) | 321 | 221 | 173.1 | 138.5 | 115.4 | 76.3 |
| Borderlands 3 (2019) | 232 | 205 | 185 | 161.2 | 130.7 | 75 |
| F1 2020 (2020) | 587 | 460 | 418 | 302 | 238 | 145.4 |
| F1 2021 (2021) | 699 | 562 | 453 | 227 | 175.8 | 105.6 |
| Cyberpunk 2077 1.6 (2022) | 199 | 198 | 174 | 125 | 88 | 46 |
| Tiny Tina's Wonderlands (2022) | 367 | 294 | 211 | 168.3 | 124 | 70.4 |
| F1 22 (2022) | 333 | 352 | 312 | 126.4 | 84.4 | 42.6 |
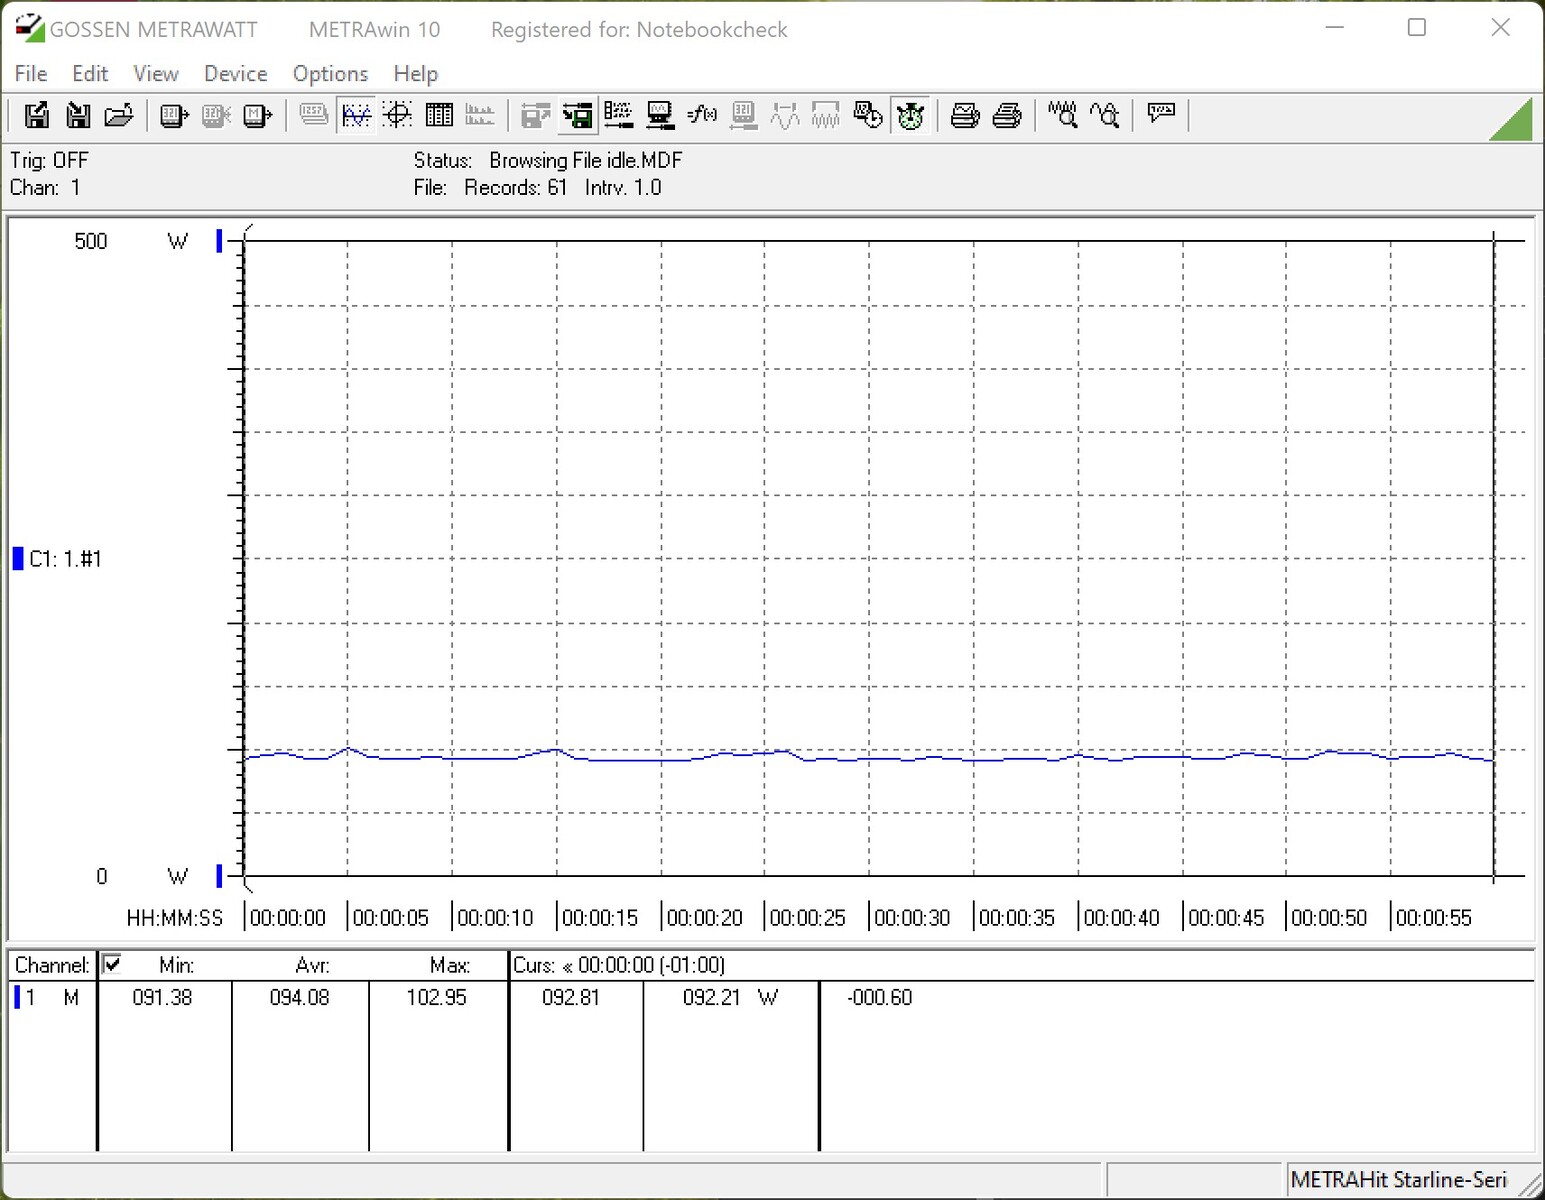
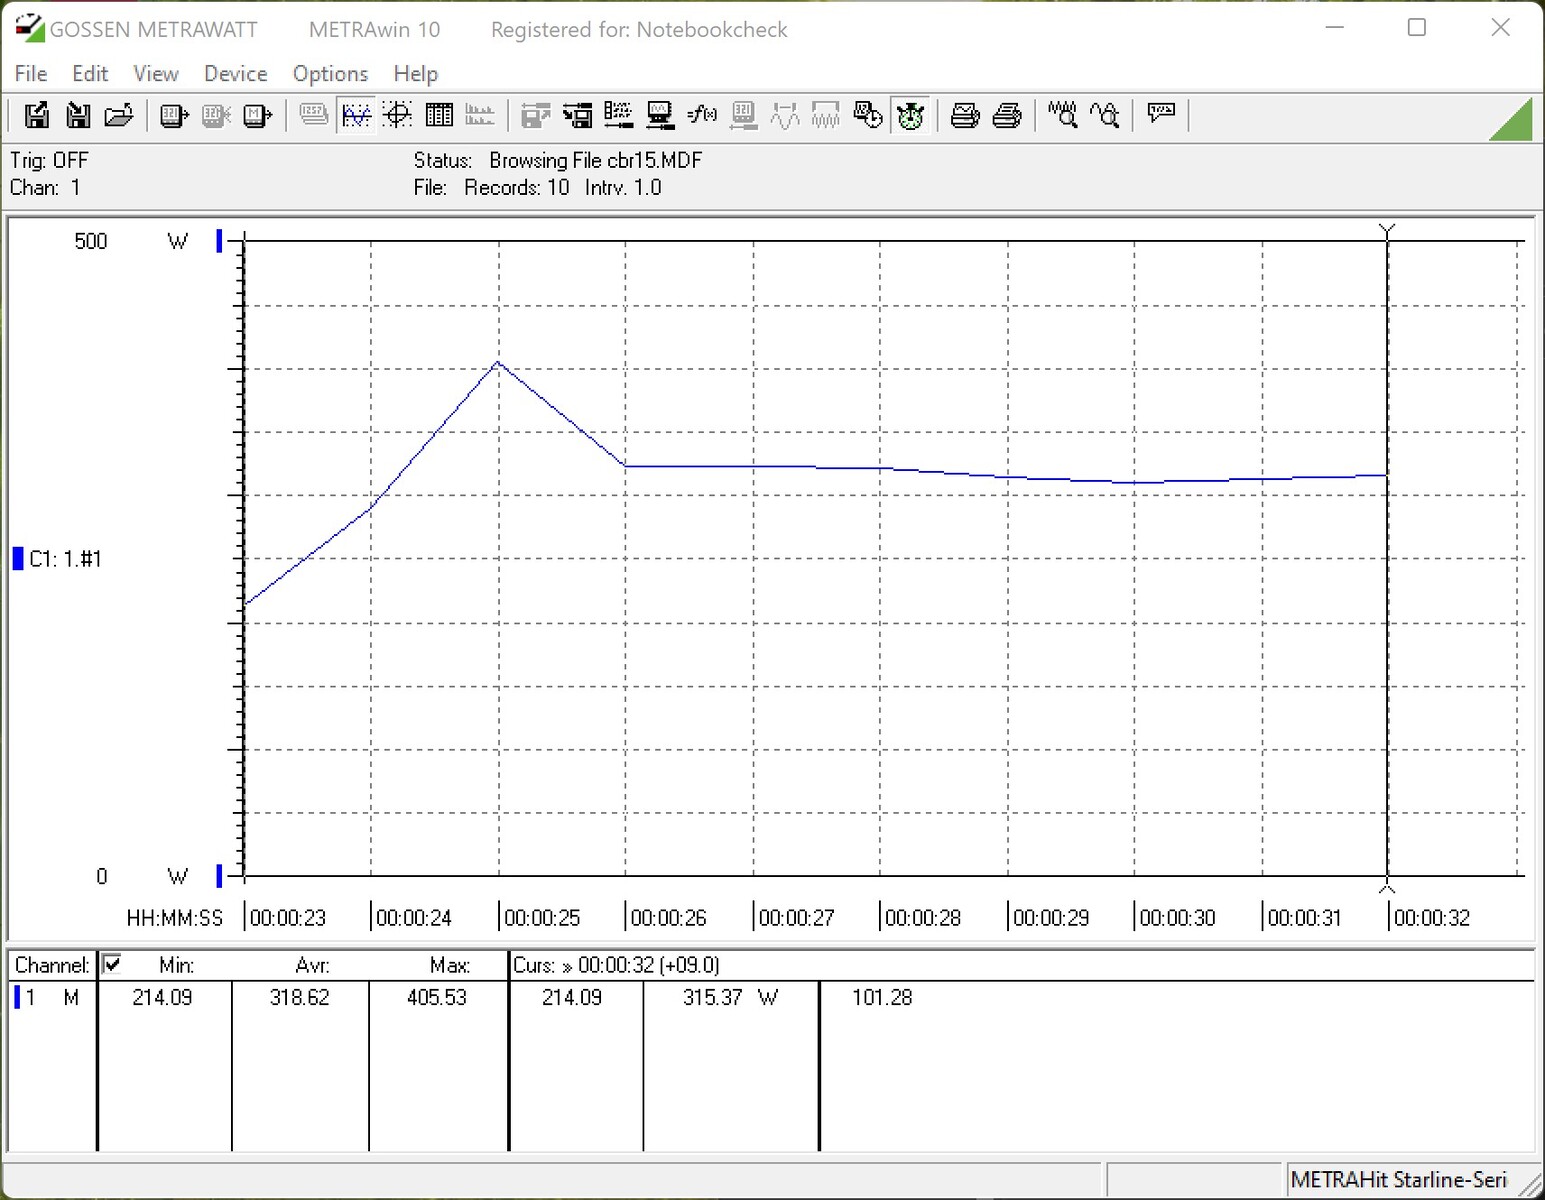
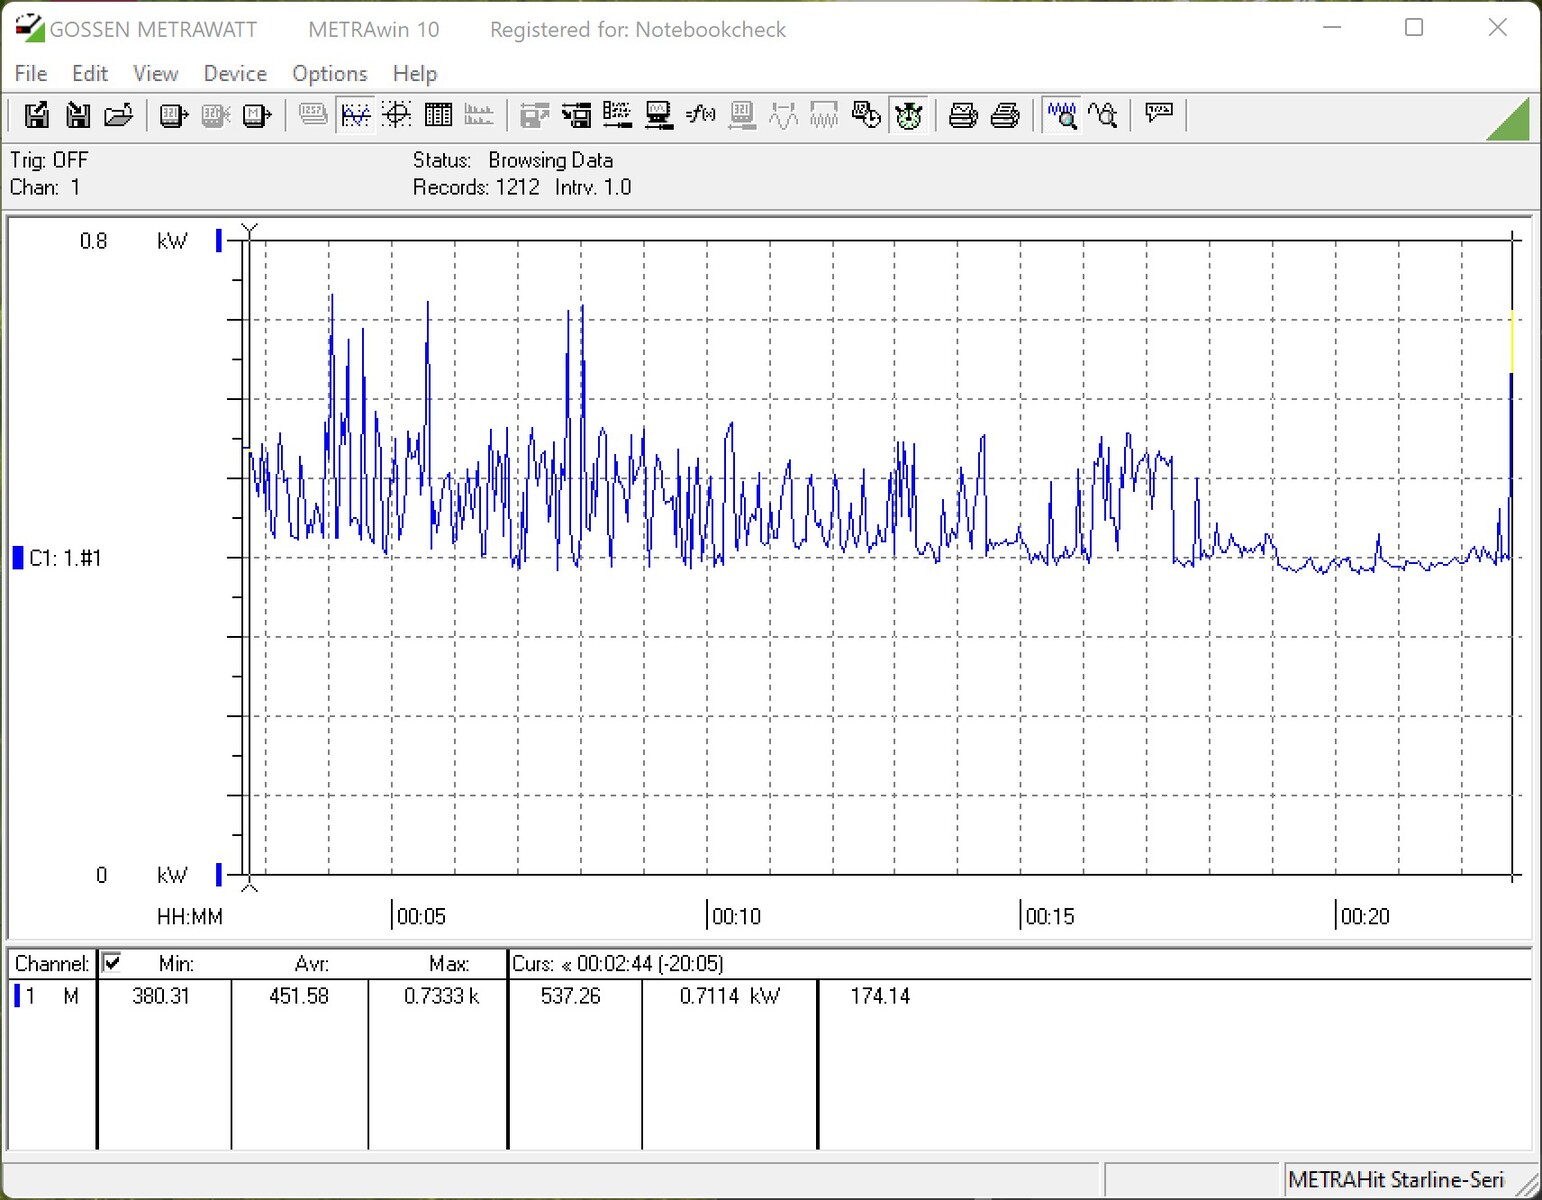
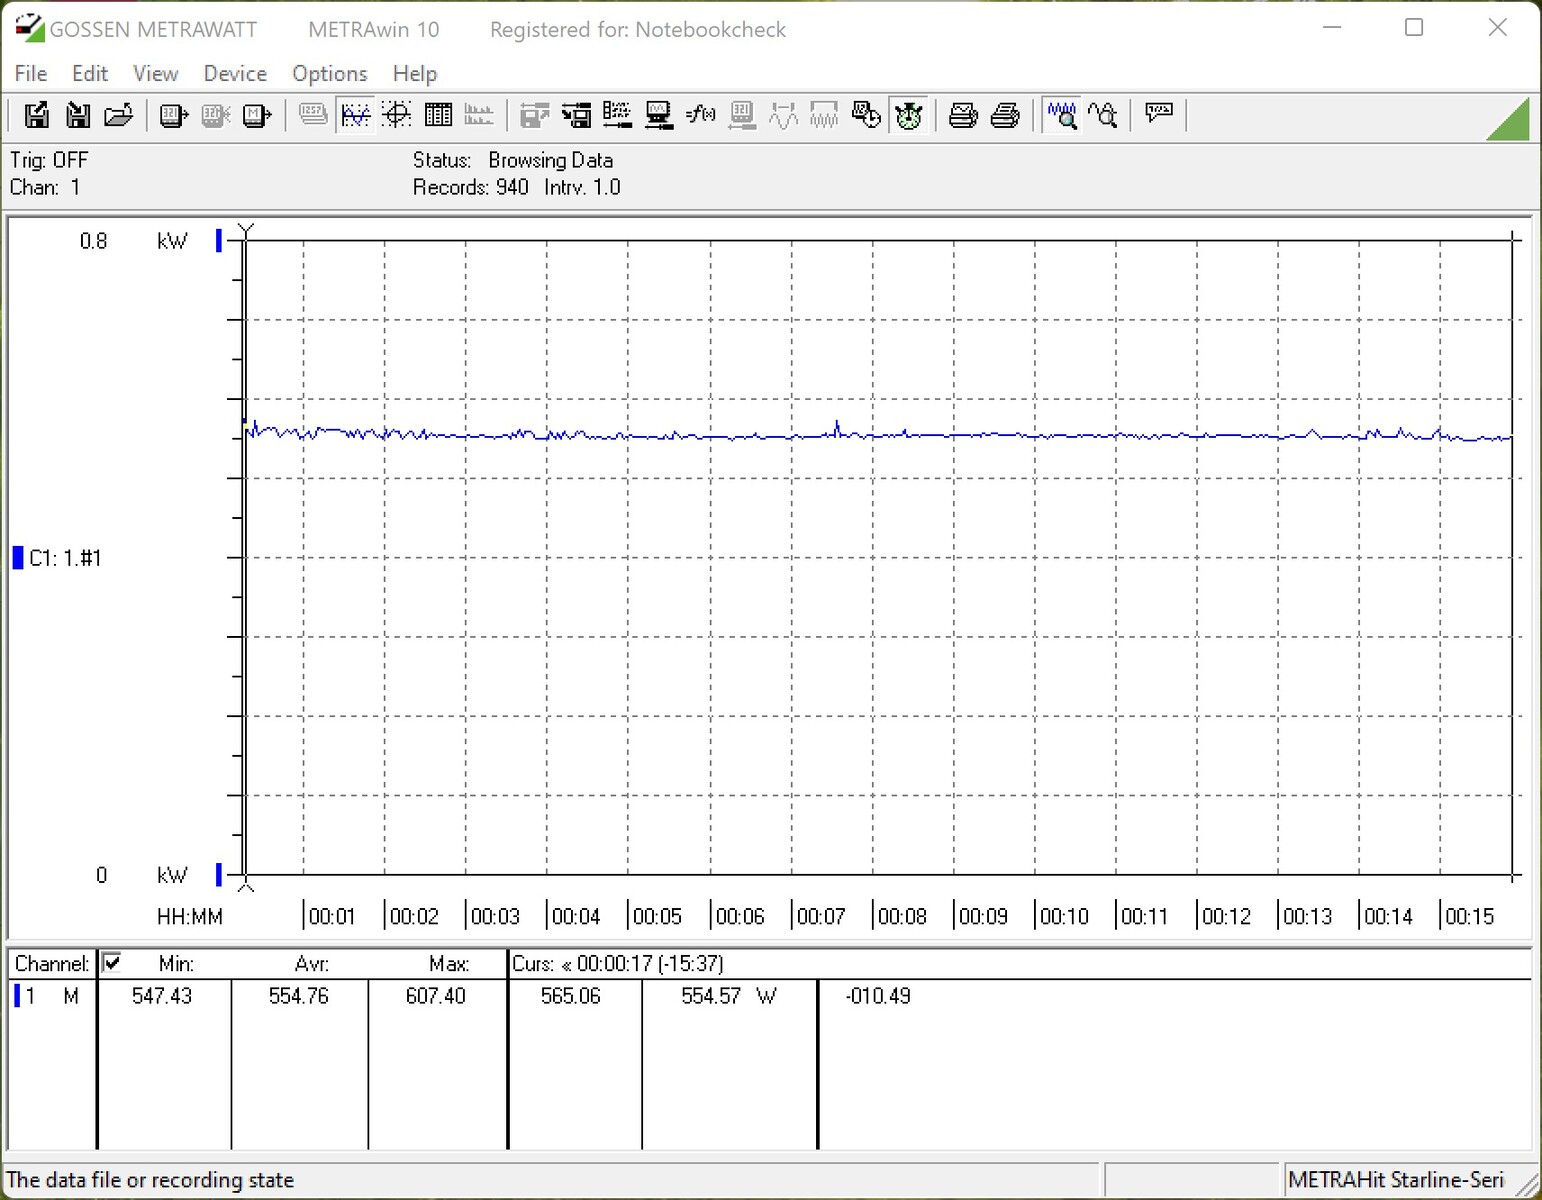
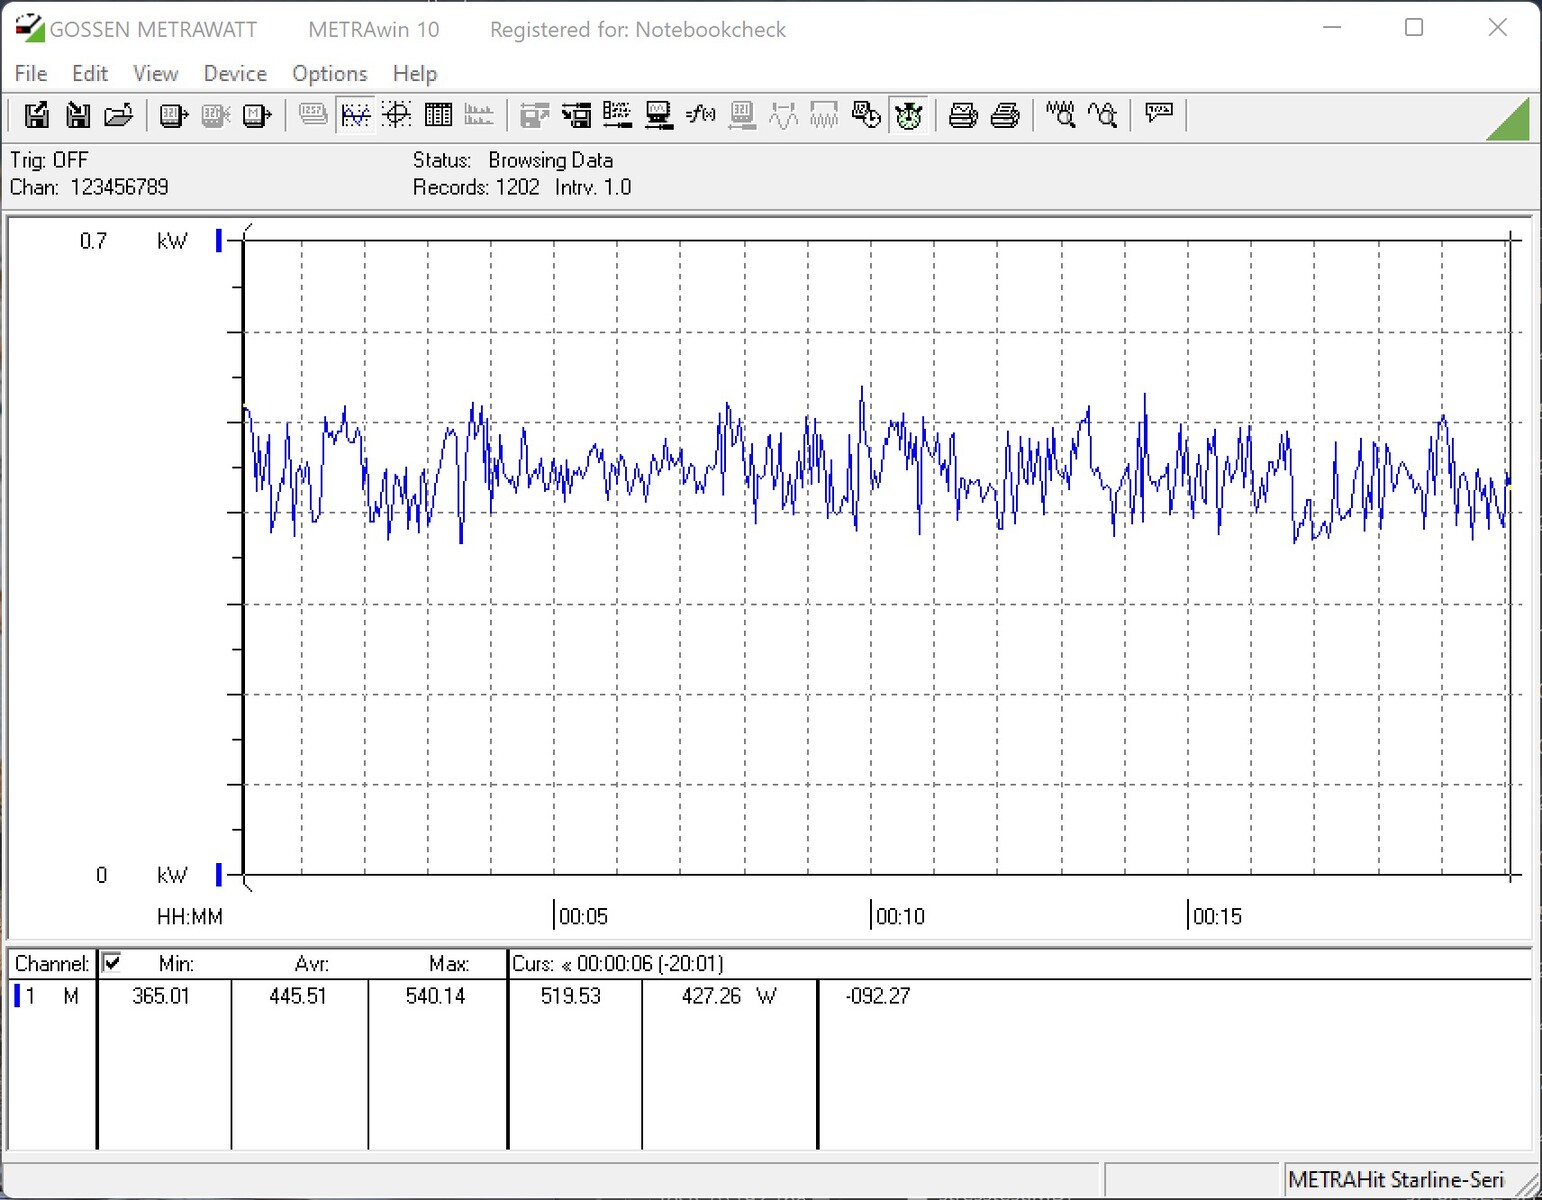
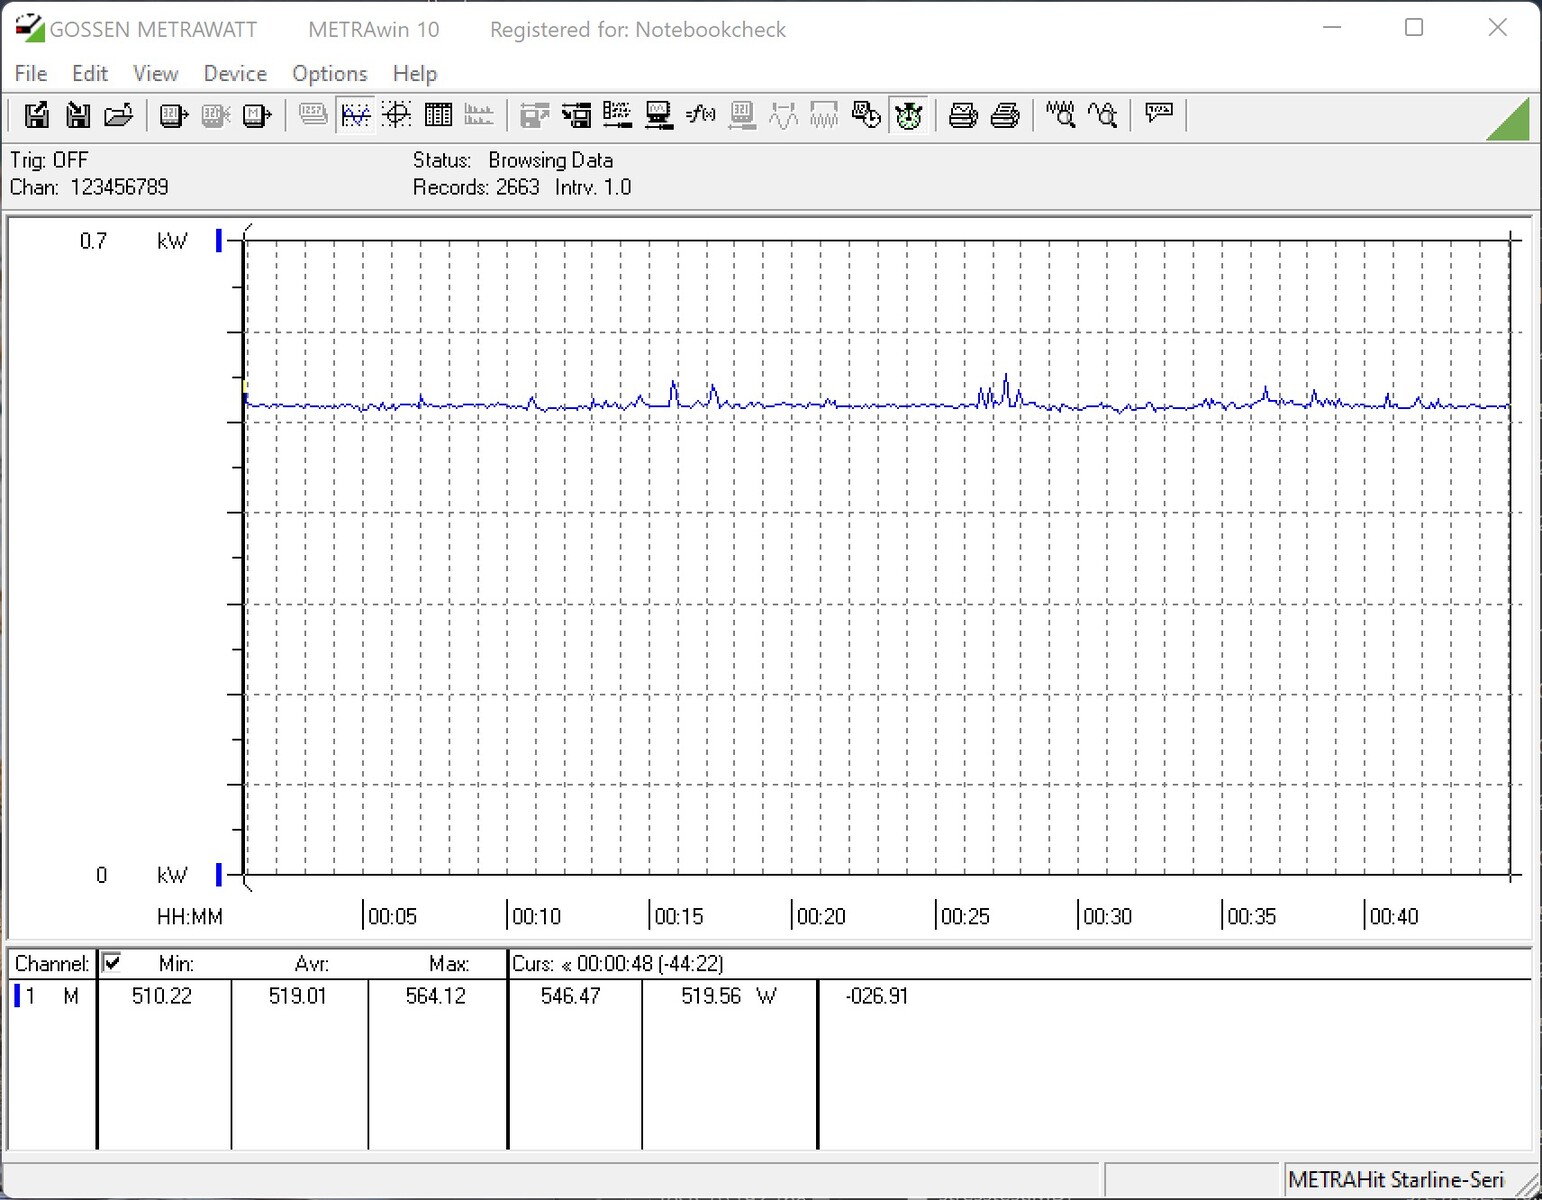
Consommation d'énergie
Les performances élevées des nouveaux processeurs AMD Ryzen 7000 s'accompagnent d'une consommation d'énergie nettement accrue. Si l'AMD Ryzen 9 5900X affichait encore 105 W (TDP - Thermal Design Power), les modèles Ryzen 9 actuels peuvent consommer 170 W. Le PPT (Package Power Tracking) passe de 142 W à 230 W
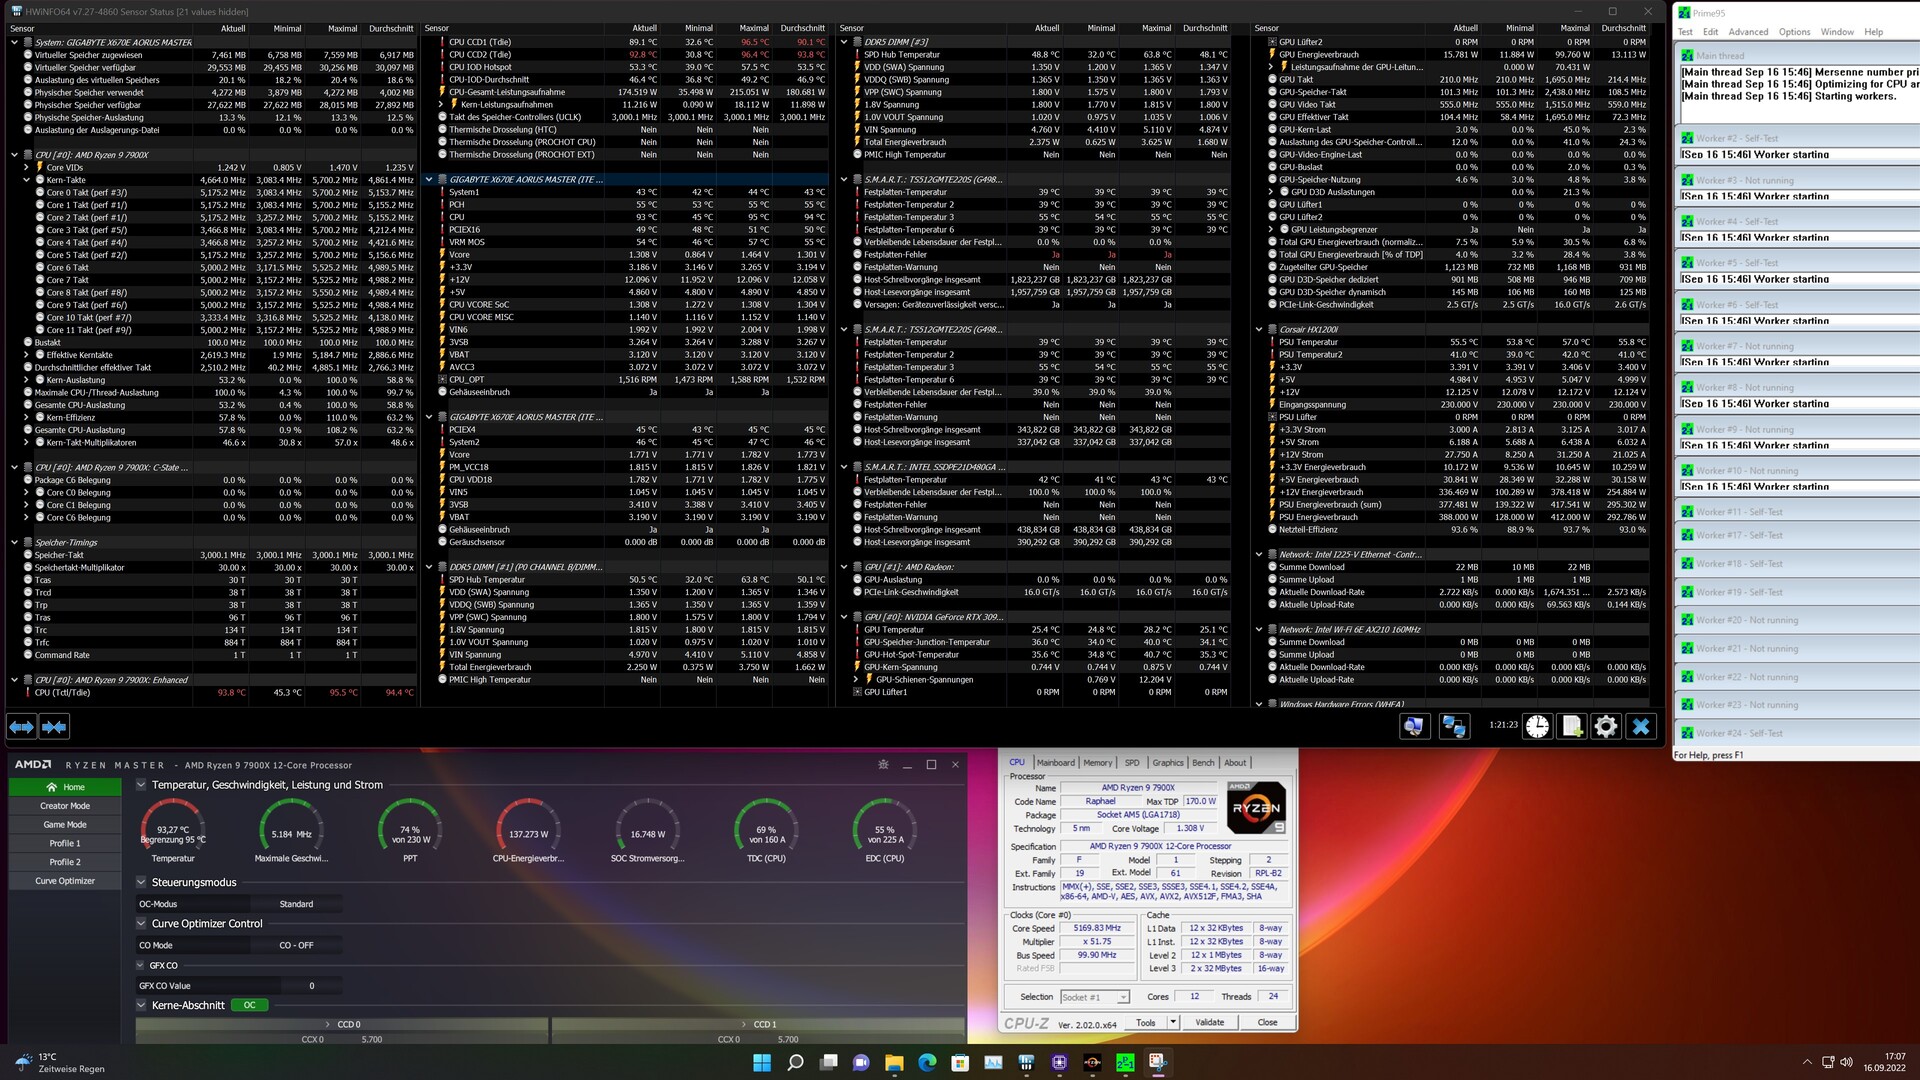
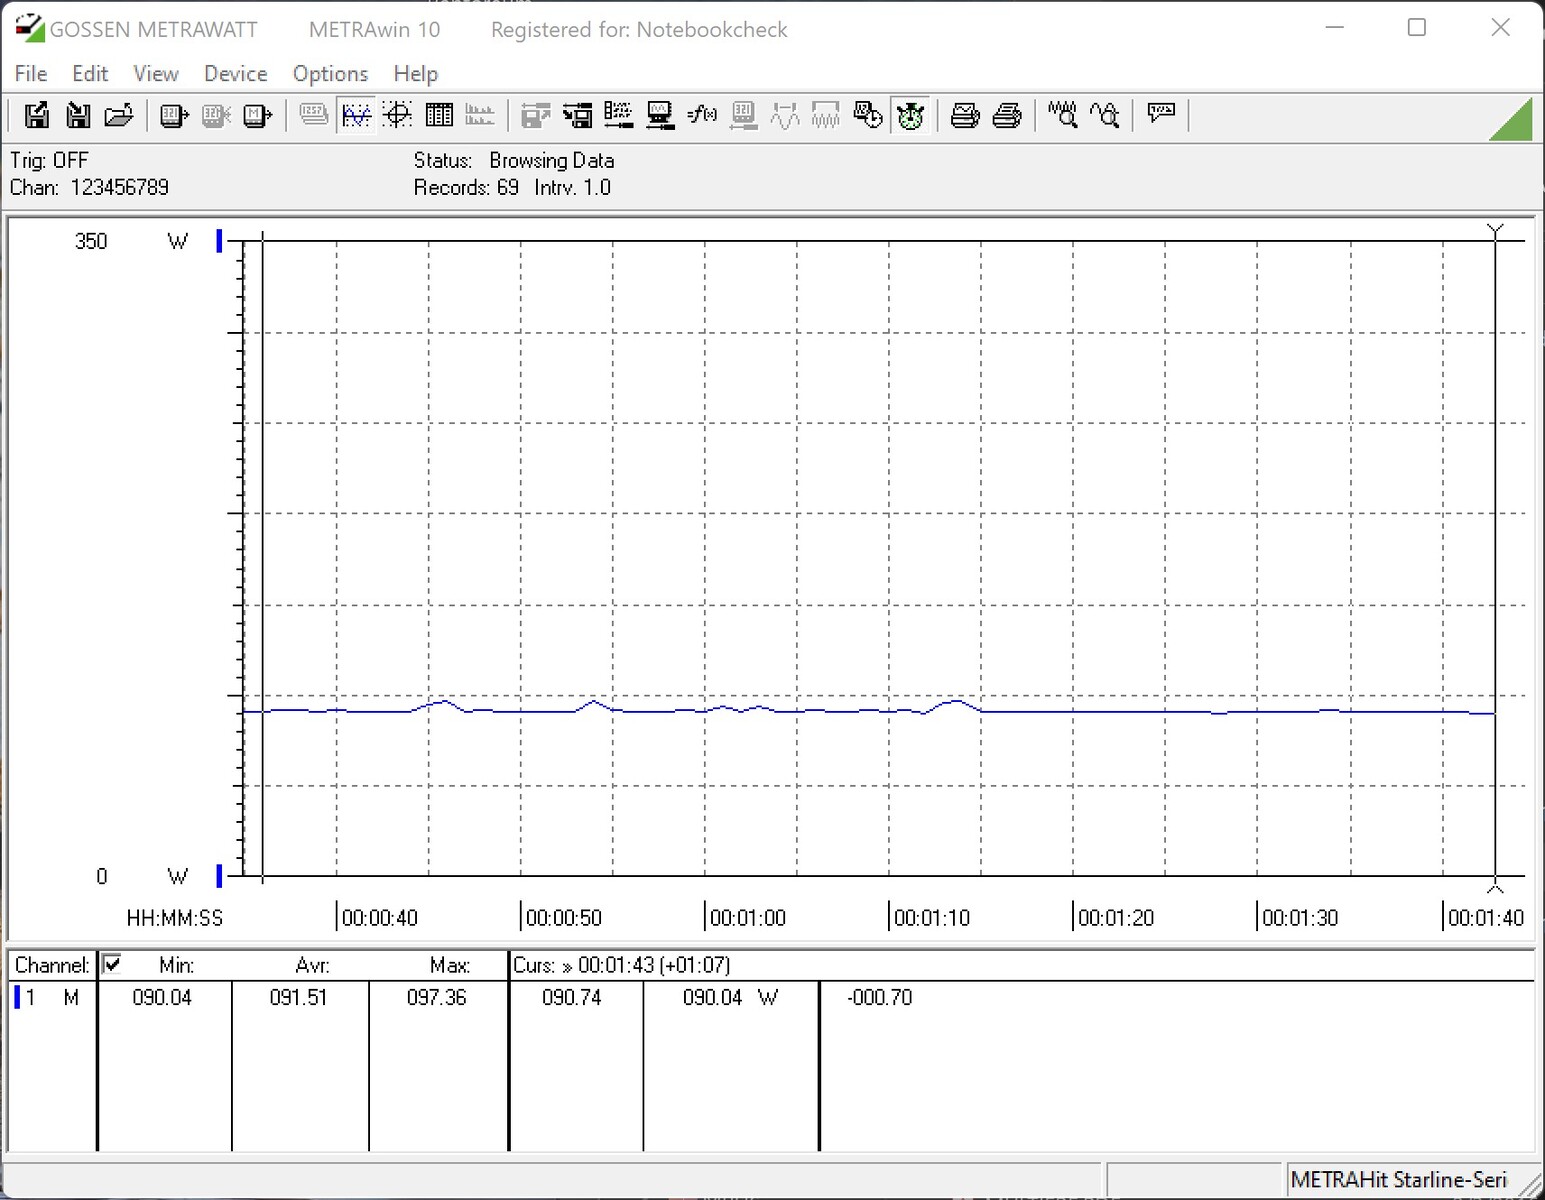
Si l'on regarde la comparaison sous charge avec le Cinebech R15-Multi, l'AMD Ryzen 9 7900X n'est que légèrement derrière le Intel Core i9-12900K dans le classement. Néanmoins, nous constatons une baisse de performance par rapport à l'AMD Ryzen 9 5900X AMD Ryzen 9 5900Xindiqué par une consommation d'énergie 33% plus élevée. Pour l'AMD Ryzen 5 7600X, on note seulement une augmentation de 26% par rapport à l'AMD Ryzen 5 5600X AMD Ryzen 5 5600X. Nous avons également observé une augmentation similaire des performances lors du test de stress avec Prime95. Avec plus de 500 W, la consommation d'énergie pendant les jeux est une fois de plus nettement plus élevée en raison de la carte graphique. Nous devons calculer environ 350 W pour la seule Nvidia GeForce RTX 3090.
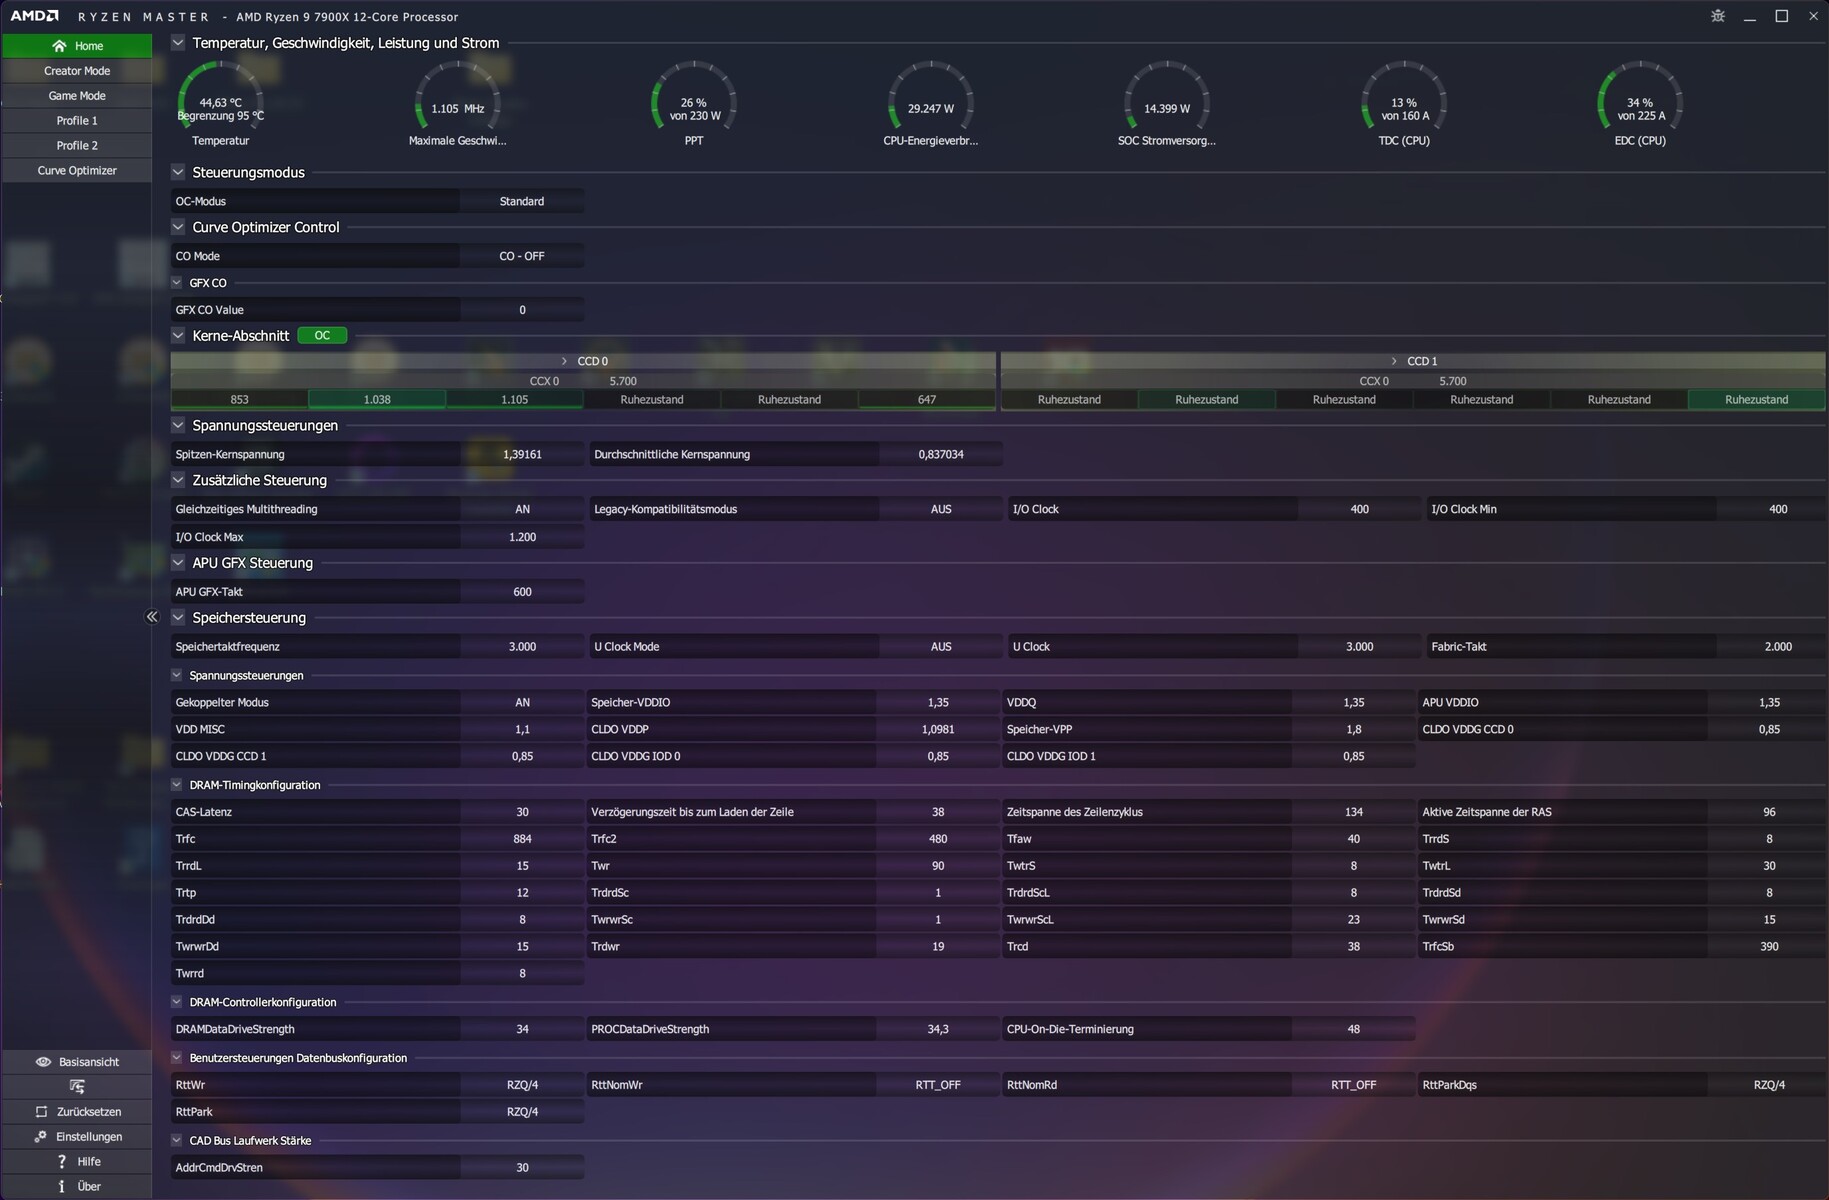
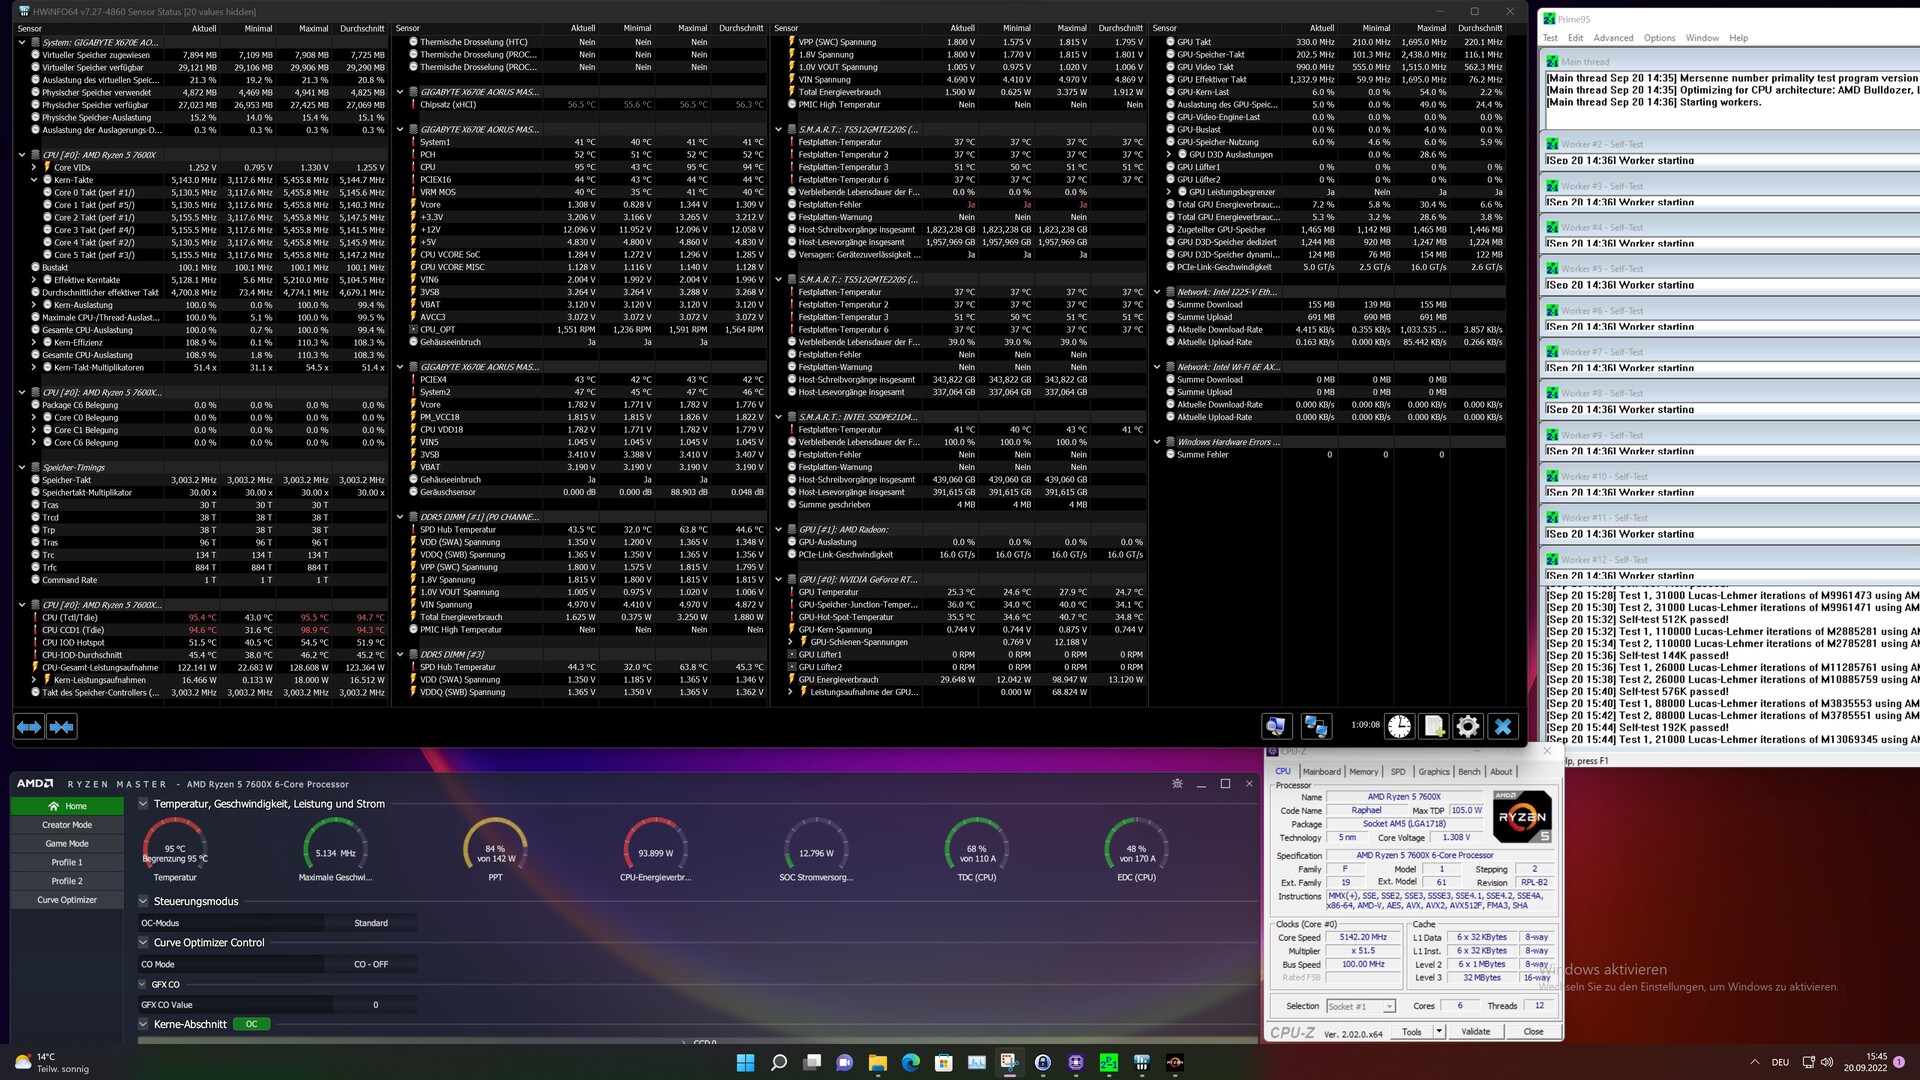
AMD recommande d'utiliser une solution de refroidissement appropriée pour ses processeurs. Ainsi, vous devriez au moins utiliser une solution 240 ou 280 AiO lorsque vous utilisez un AMD Ryzen 9, bien qu'un bon refroidisseur tour soit suffisant pour l'AMD Ryzen 7 ainsi que l'AMD Ryzen 5. Cependant, notre test de charge montre que notre solution 280 AiO avait déjà des problèmes dans la configuration ouverte. La température maximale de 95 °C qu'AMD spécifie pour tous les nouveaux processeurs est toujours atteinte. Nous recommandons d'utiliser une solution 360 AiO, indépendamment de l'installation d'un Ryzen 9, Ryzen 7 ou Ryzen 5 de la série 7000. À titre indicatif, AMD fournit également une valeur de référence pour les températures, qui se situe entre 70 et 90 °C.
Mode Eco :
AMD utilise ce mode pour réduire le TDP, qui peut également être comparé aux limitations PL1 et PL2 d'Intel. Ainsi, les processeurs peuvent être exploités à 65 W, 105 W ou à 170 W non bridés.
AMD Ryzen 9 7900X
AMD Ryzen 5 7600X
| Power Consumption / Cinebench R15 Multi (external Monitor) | |
| Intel Core i9-12900K (Idle: 70.5 W) | |
| AMD Ryzen 9 7900X | |
| AMD Ryzen 9 5900X (Idle: 78.1 W) | |
| AMD Ryzen 9 5950X (Idle: 78 W) | |
| AMD Ryzen 5 7600X | |
| Intel Core i5-12600K (Idle: 70.45 W) | |
| AMD Ryzen 5 5600X (Idle: 79.23 W) | |
| Power Consumption / Prime95 V2810 Stress (external Monitor) | |
| AMD Ryzen 9 7900X | |
| Intel Core i9-12900K (Idle: 70.5 W) | |
| Intel Core i5-12600K (Idle: 70.45 W) | |
| AMD Ryzen 9 5950X (Idle: 78 W) | |
| AMD Ryzen 9 5900X (Idle: 78.1 W) | |
| AMD Ryzen 5 7600X | |
| AMD Ryzen 5 5600X (Idle: 79.23 W) | |
| Power Consumption / The Witcher 3 ultra (external Monitor) | |
| AMD Ryzen 9 7900X | |
| AMD Ryzen 5 7600X | |
| Nvidia GeForce RTX 3090 Founders Edition (Idle: 91.1 W) | |
| Intel Core i9-12900K (Idle: 70.5 W) | |
| AMD Ryzen 9 5950X (Idle: 78 W) | |
| AMD Ryzen 9 5900X (Idle: 78.1 W) | |
| AMD Ryzen 5 5600X (Idle: 79.23 W) | |
| Intel Core i5-12600K (Idle: 70.45 W) | |
* ... Moindre est la valeur, meilleures sont les performances
Power Consumption With External Monitor
Points positifs
Points négatifs
Conclusion : Extrêmement rapide mais aussi avide de performances
Après plus de cinq ans pendant lesquels le socket AM4 était la base des processeurs Ryzen, AMD présente maintenant le nouveau socket AM5 avec les nouveaux processeurs AMD Ryzen 7000. Nous apprécions le passage de PGA à LGA et le problème des CPU à broches cassées lors du retrait du refroidisseur appartient enfin au passé. Cela signifie également que la norme DDR4 est de l'histoire ancienne, car Ryzen 7000 est uniquement compatible avec AM5 et DDR5. C'est une étape qu'Intel a déjà franchie avec la série Alder Lake, bien qu'elle supporte toujours DDR4 et DDR5.
En termes de performances, AMD a une fois de plus augmenté de manière significative la performance par horloge (IPC). Avec les fréquences d'horloge nettement plus élevées qui sont maintenant possibles avec la fabrication plus petite en 5 nm, nous enregistrons une augmentation de la performance jusqu'à 30%. Il n'y a pas de changements majeurs sous le dissipateur thermique par rapport au Ryzen 5000. Il y a toujours deux CCD et une puce E/S sur le PCB. Le die I/O est fabriqué en 6 nm et offre un iGPU, qui ne peut pas être utilisé pour les applications 3D avec seulement 2 CU.
Cependant, nous pouvons actuellement affirmer qu'AMD fournit une meilleure performance de jeu que le Core i9-12900K d'Intel avec le Ryzen 9 7900X et le Ryzen 5 7600X. Le Core i9-12900K d'Intel, qui a déjà un an, sera remplacé dans un avenir proche, ce qui pourrait à nouveau changer complètement l'équilibre des forces. Cependant, ce ne sont que des rêves d'avenir pour l'instant et nous évaluons l'ici et maintenant. En outre, nous n'avons pas encore examiné le modèle haut de gamme d'AMD, l'AMD Ryzen 9 7950X, dans cette revue. Il y a encore plus de potentiel pour mettre Intel sous une pression encore plus grande.
Les Ryzen 9 7900X et Ryzen 5 7600X d'AMD offrent des performances fabuleuses à tous égards. De plus, il existe un digne successeur au Socket AM5 qui éradique les problèmes connus
Comme souvent, le client a l'embarras du choix et doit décider quel processeur il préfère. Si vous ne voulez jouer qu'à des jeux, vous serez très bien servi avec un AMD Ryzen 5 7600X. Ce processeur à 6 cœurs est rapide et offre tous les avantages de la nouvelle génération Zen 4. La différence de performance avec l'AMD Ryzen 9 7900X est extrêmement faible dans les jeux testés. Si vous êtes à la recherche d'une plateforme pour un travail productif ou si vous êtes un créateur de contenu, vous serez certainement satisfait de l'AMD Ryzen 9 7900X, car les performances multithread élevées sont meilleures que celles d'un AMD Ryzen 9 5950X.
Prix et disponibilité
Directement dans la boutique AMD https://www.amd.com/de/direct-buy/de mais les processeurs actuels peuvent également être achetés auprès de nombreux magasins en ligne réputés. AMD indique un PDSF de 669 euros pour l'AMD Ryzen 9 7900X. Selon AMD, le modèle d'entrée de gamme, l'AMD Ryzen 5 7600X, coûte 359 euros.
