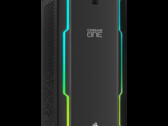
Notebookcheck Logo

Intel Core i9-12900K

Intel i9-12900K

L'Intel Core i9-12900K est un processeur haut de gamme pour ordinateurs de bureau basé sur l'architecture Alder Lake. Il a été annoncé pour la première fois en novembre 2021 et offre 8 cœurs de performance et 8 cœurs d'efficacité. Les cœurs de performance (P-cores) prennent en charge l'HyperThreading, ce qui conduit à 24 Threads pouvant être traités en même temps. Les cœurs de performance peuvent atteindre une fréquence de 5,2 GHz (Turbo Boost Max 3.0), tandis que les cœurs d'efficacité peuvent atteindre une fréquence de 3,9 GHz. Tous les cœurs peuvent utiliser 30 Mo de Smart Cache. Le contrôleur de mémoire intégré prend en charge jusqu'à 128 Go de mémoire DDR5 à 4800 MT/s (double canal).

Le Thread Director (en matériel) peut aider le système d'exploitation à décider quel thread utiliser sur les cœurs de performance ou d'efficacité pour obtenir les meilleures performances.

Pour les tâches d'IA, le processeur intègre également GNA 3.0 et DL Boost (très probablement en utilisant uniquement AVX2). Quick Sync en version 8 est le même que celui des CPU Rocket Lake et prend en charge le décodage MPEG-2, AVC, VC-1, JPEG, VP8, VP9, HEVC et AV1 en matériel.

La carte graphique intégrée est basée sur l'architecture Xe et appelée Intel UHD Graphics 770. Elle tourne à une fréquence comprise entre 300 et 1,55 GHz.

Le processeur a une puissance de base de 125 watts et une puissance turbo maximale de 241 watts. Il est fabriqué selon le procédé 10nm, appelé Intel 7, chez Intel.

GammeIntel Alder Lake-S
Nom de codeAlder Lake

Gamme: Alder Lake-S Alder Lake

Intel Core i9-12900K « 3.2 - 5.2 GHz16 / 24 cores30 MB L3
Intel Core i9-129002.4 - 5.1 GHz16 / 24 cores20 MB L3
Intel Core i7-12700K2.7 - 5 GHz12 / 20 cores25 MB L3
Intel Core i7-12700F3.3 - 4.9 GHz12 / 20 cores25 MB L3
Intel Core i7-127003.3 - 4.9 GHz12 / 20 cores25 MB L3
Intel Core i5-12600K2.8 - 4.9 GHz10 / 16 cores20 MB L3
Fréquence3200 - 5200 MHz
Cache de Niveau 1 (L1)1.4 MB
Cache de Niveau 2 (L2)14 MB
Cache de Niveau 3 (L3)30 MB
Nombres de cœurs/threads simultanés supportés16 / 24
Consommation énergétique maximale (TDP)125 Watt(s)
Lithographie (procédé de fabrication)10 nm
Température maximale100 °C
SocketLGA1700
FonctionnalitésDDR4-3200/DDR5-4800 RAM (incl. ECC), PCIe 5, Thread Director, DL Boost, GNA, vPro Enterprise, MMX, SSE, SSE2, SSE3, SSSE3, SSE4.1, SSE4.2, AES, AVX, AVX2, FMA3, SHA
Carte graphiqueIntel UHD Graphics 770 (300 - 1550 MHz)
64 BitPrend en charge les instructions 64 Bit
Architecturex86
Prix de départ$589 U.S.
Date de présentation11/05/2021
Lien redirigeant vers une page externe du produitark.intel.com

Benchmarks

Performance Rating - CB R15 + R20 + 7-Zip + X265 + Blender + 3DM11 CPU
50.7 pt (70%)
Cinebench R23 - Cinebench R23 Multi Core
min: 25245     moyenne: 26125     médian: 26125 (24%)     maximum: 27005 Points
Cinebench R23 - Cinebench R23 Single Core
min: 1998     moyenne: 2005     médian: 2004.5 (85%)     maximum: 2011 Points
Cinebench R20 - Cinebench R20 CPU (Single Core)
min: 766     moyenne: 772     médian: 771.5 (86%)     maximum: 777 Points
Cinebench R20 - Cinebench R20 CPU (Multi Core)
min: 9630     moyenne: 9935     médian: 9935 (24%)     maximum: 10240 Points
Cinebench R15 - Cinebench R15 CPU Multi 64 Bit
min: 3473     moyenne: 3877     médian: 4057 (26%)     maximum: 4102 Points
0205410615820102512301435164018452050225524602665287030753280348536903895Tooltip
Cinebench R15 - Cinebench R15 CPU Single 64 Bit
min: 286     moyenne: 289     médian: 289 (87%)     maximum: 292 Points
Cinebench R11.5 - Cinebench R11.5 CPU Multi 64 Bit
min: 44.18     moyenne: 45.6     médian: 45.6 (59%)     maximum: 47.06 Points
Cinebench R11.5 - Cinebench R11.5 CPU Single 64 Bit
min: 3.49     moyenne: 3.5     médian: 3.5 (87%)     maximum: 3.5 Points
Cinebench R10 - Cinebench R10 Rend. Single (32bit)
min: 9812     moyenne: 9859     médian: 9859 (60%)     maximum: 9906 points
Cinebench R10 - Cinebench R10 Rend. Multi (32bit)
min: 70420     moyenne: 71819     médian: 71819 (52%)     maximum: 73218 points
Cinebench R10 - Cinebench R10 Rend. Multi (64bit)
min: 112749     moyenne: 112821     médian: 112821 (78%)     maximum: 112893 Points
Cinebench R10 - Cinebench R10 Rend. Single (64bit)
min: 16144     moyenne: 16271     médian: 16270.5 (20%)     maximum: 16397 Points
wPrime 2.10 - wPrime 2.0 1024m *
min: 190.6     moyenne: 192.8     médian: 192.8 (2%)     maximum: 195 s
wPrime 2.10 - wPrime 2.0 32m *
min: 2.398     moyenne: 3.7     médian: 3.7 (1%)     maximum: 4.924 s
WinRAR - WinRAR 4.0
min: 10792     moyenne: 11834     médian: 11834 (19%)     maximum: 12876 points
7-Zip 18.03 - 7-Zip 18.03 Multli Thread 4 runs
min: 96960     moyenne: 97316     médian: 97315.5 (56%)     maximum: 97671 MIPS
7-Zip 18.03 - 7-Zip 18.03 Single Thread 4 runs
min: 6571     moyenne: 6576     médian: 6575.5 (79%)     maximum: 6580 MIPS
X264 HD Benchmark 4.0 - x264 Pass 2
min: 196     moyenne: 201     médian: 201 (70%)     maximum: 206 fps
X264 HD Benchmark 4.0 - x264 Pass 1
min: 365     moyenne: 366.8     médian: 366.8 (85%)     maximum: 368.5 fps
HWBOT x265 Benchmark v2.2 - HWBOT x265 4k Preset
min: 29     moyenne: 29.5     médian: 29.5 (52%)     maximum: 30 fps
051015202530354045Tooltip
TrueCrypt - TrueCrypt Serpent
min: 1.9     moyenne: 2     médian: 2 (0%)     maximum: 2 GB/s
TrueCrypt - TrueCrypt Twofish
min: 3.5     moyenne: 3.6     médian: 3.6 (62%)     maximum: 3.7 GB/s
TrueCrypt - TrueCrypt AES
min: 18.5     moyenne: 19.3     médian: 19.3 (50%)     maximum: 20 GB/s
Blender - Blender 2.79 BMW27 CPU *
min: 121.1     moyenne: 124.7     médian: 124.7 (1%)     maximum: 128.3 Seconds
R Benchmark 2.5 - R Benchmark 2.5 *
min: 0.3946     moyenne: 0.4     médian: 0.4 (9%)     maximum: 0.4216 sec
3DMark 06 - CPU - 3DMark 06 - CPU
min: 18426     moyenne: 18753     médian: 18752.5 (40%)     maximum: 19079 Points
Super Pi mod 1.5 XS 1M - Super Pi mod 1.5 XS 1M *
min: 7.04     moyenne: 7.1     médian: 7.1 (2%)     maximum: 7.063 s
Super Pi mod 1.5 XS 2M - Super Pi mod 1.5 XS 2M *
min: 15.59     moyenne: 15.6     médian: 15.6 (1%)     maximum: 15.67 s
Super Pi Mod 1.5 XS 32M - Super Pi mod 1.5 XS 32M *
min: 338.6     moyenne: 347     médian: 347 (2%)     maximum: 355.4 s
3DMark Vantage - 3DM Vant. Perf. CPU no Physx
min: 97859     moyenne: 97907     médian: 97907 (86%)     maximum: 97955 Points
3DMark 11 - 3DM11 Performance Physics
min: 23010     moyenne: 25787     médian: 26223 (71%)     maximum: 28789 Points
3DMark - 3DMark Ice Storm Physics
min: 81757     moyenne: 101311     médian: 101311 (82%)     maximum: 120865 Points
3DMark - 3DMark Ice Storm Extreme Physics
min: 78981     moyenne: 99892     médian: 99891.5 (81%)     maximum: 120802 Points
3DMark - 3DMark Ice Storm Unlimited Physics
min: 80654     moyenne: 99678     médian: 99678 (84%)     maximum: 118702 Points
3DMark - 3DMark Cloud Gate Physics
min: 25449     moyenne: 25582     médian: 25581.5 (65%)     maximum: 25714 Points
3DMark - 3DMark Fire Strike Standard Physics
min: 39112     moyenne: 39903     médian: 39903 (71%)     maximum: 40694 Points
3DMark - 3DMark Time Spy CPU
min: 18431     moyenne: 18556     médian: 18555.5 (78%)     maximum: 18680 Points
Geekbench 5.5 - Geekbench 5.1 - 5.4 64 Bit Single-Core
min: 1969     moyenne: 2006     médian: 2005.5 (85%)     maximum: 2042 points
Geekbench 5.5 - Geekbench 5.1 - 5.4 64 Bit Multi-Core
min: 17698     moyenne: 17776     médian: 17776 (32%)     maximum: 17854 points
Geekbench 5.0 - Geekbench 5.0 64 Bit Single-Core
min: 1927     moyenne: 1948     médian: 1947.5 (8%)     maximum: 1968 points
Geekbench 5.0 - Geekbench 5.0 64 Bit Multi-Core
min: 17697     moyenne: 17828     médian: 17828 (56%)     maximum: 17959 points
Geekbench 4.4 - Geekbench 4.1 - 4.4 64 Bit Single-Core
min: 8593     moyenne: 8629     médian: 8629 (86%)     maximum: 8665 points
Geekbench 4.4 - Geekbench 4.1 - 4.4 64 Bit Multi-Core
min: 63583     moyenne: 63911     médian: 63910.5 (71%)     maximum: 64238 points
Mozilla Kraken 1.1 - Kraken 1.1 Total Score *
min: 475     moyenne: 478     médian: 478 (1%)     maximum: 481 ms
Octane V2 - Octane V2 Total Score
96769 Points (87%)
WebXPRT 3 - WebXPRT 3 Score
min: 320     moyenne: 325     médian: 325 (68%)     maximum: 330 Points
CrossMark - CrossMark Overall
2308 Points (88%)
Power Consumption - Prime95 Power Consumption - external Monitor *
min: 257     moyenne: 268.3     médian: 268.3 (46%)     maximum: 279.6 Watt
020406080100120140160180200220240260280300320340360Tooltip
Power Consumption - Cinebench R15 Multi Power Consumption - external Monitor *
min: 265     moyenne: 294.7     médian: 294.7 (54%)     maximum: 324.4 Watt
020406080100120140160180200220240260280300Tooltip
Power Consumption - Idle Power Consumption - external Monitor *
56.1 Watt (37%)
05101520253035404550556065Tooltip
Power Consumption - Cinebench R15 Multi Power Efficiency - external Monitor
min: 12.5     moyenne: 12.8     médian: 12.8 (10%)     maximum: 13.1 Points per Watt
- Amplitude des valeurs obtenues dans le benchmark avec cette carte graphique
- Valeur moyenne obtenue dans le benchmark avec cette carte graphique
* Plus les chiffres sont petits, plus les performances sont élevées

v1.26
log 27. 05:45:58

#0 no ids found in url (should be separated by "_") +0s ... 0s

#1 not redirecting to Ajax server +0s ... 0s

#2 did not recreate cache, as it is less than 5 days old! Created at Thu, 25 Apr 2024 05:38:32 +0200 +0.001s ... 0.001s

#3 no comparison url found in template nbc.compare_page_2 needed +0.008s ... 0.009s

#4 no comparison url found in template nbc.compare_page_2 needed +0s ... 0.01s

#5 no comparison url found in template nbc.compare_page_2 needed +0s ... 0.01s

#6 no comparison url found in template nbc.compare_page_2 needed +0s ... 0.01s

#7 no comparison url found in template nbc.compare_page_2 needed +0s ... 0.01s

#8 composed specs +0s ... 0.011s

#9 did output specs +0s ... 0.011s

#10 getting avg benchmarks for device 13851 +0.024s ... 0.035s

#11 got single benchmarks 13851 +0.03s ... 0.065s

#12 got avg benchmarks for devices +0s ... 0.065s

#13 min, max, avg, median took s +1.366s ... 1.432s

#14 no comparison url found in template nbc.compare_page_2 needed +0s ... 1.432s

#15 return log +0s ... 1.432s

Please share our article, every link counts!

» Comparaison des processeurs pour ordinateur portable
Comparaison de tout les processeurs mobiles


» Processeurs mobiles - liste des benchmarks
Liste des benchmarks de l'intégralité des processeurs pour portables


Les autres processeurs de la gamme Alder Lake-S

» Intel Core i9-12900K
   16x 3.2 GHz - 5.2 GHz
» Intel Core i9-12900
   16x 2.4 GHz - 5.1 GHz
» Intel Core i9-12950HX
   16x 1.7 GHz - 5 GHz
» Intel Core i9-12900HX
   16x 1.7 GHz - 5 GHz
» Intel Core i7-12700K
   12x 2.7 GHz - 5 GHz
» Intel Core i7-12850HX
   16x 1.5 GHz - 4.8 GHz
» Intel Core i7-12800HX
   16x 1.5 GHz - 4.8 GHz
» Intel Core i7-12700F
   12x 3.3 GHz - 4.9 GHz
» Intel Core i7-12700
   12x 3.3 GHz - 4.9 GHz
» Intel Core i5-12600K
   10x 2.8 GHz - 4.9 GHz
» Intel Core i7-12650HX
   14x 1.5 GHz - 4.7 GHz
» Intel Core i7-12700H
   14x 1.7 GHz - 4.7 GHz
» Intel Core i5-12600HX
   12x 1.8 GHz - 4.6 GHz
» Intel Core i5-12450HX
   8x 1.8 GHz - 4.4 GHz
» Intel Core i5-12400F
   6x 2.5 GHz - 4.4 GHz

Processeurs similaires

+ Intel Core i7-14700K
   20x 2.5 GHz - 5.6 GHz
+ AMD Ryzen 9 7900X
   12x 4.7 GHz - 5.6 GHz
+ Intel Core i7-13700K
   16x 3.4 GHz - 5.4 GHz
+ AMD Ryzen Threadripper PRO 3975WX
   32x 3.5 GHz - 4.2 GHz
+ AMD Ryzen 9 7900
   12x 3.7 GHz - 5.4 GHz
» Intel Core i9-12900K
   16x 3.2 GHz - 5.2 GHz
- Intel Core i5-14600K
   14x 3.5 GHz - 5.3 GHz
- AMD Ryzen 7 7700X
   8x 4.5 GHz - 5.4 GHz
- AMD Ryzen 7 7700
   8x 3.8 GHz - 5.3 GHz
- AMD Ryzen 9 5950X
   16x 3.4 GHz - 4.9 GHz
- Intel Core i5-13600K
   14x 3.5 GHz - 5.1 GHz
> Revues et rapports de ordinateurs portatifs et smartphones, ordiphones > FAQ > Processeurs mobiles - indice de référence > Intel Alder Lake-S i9-12900K Notebook Processor
Klaus Hinum (Update: 2022-04- 2)