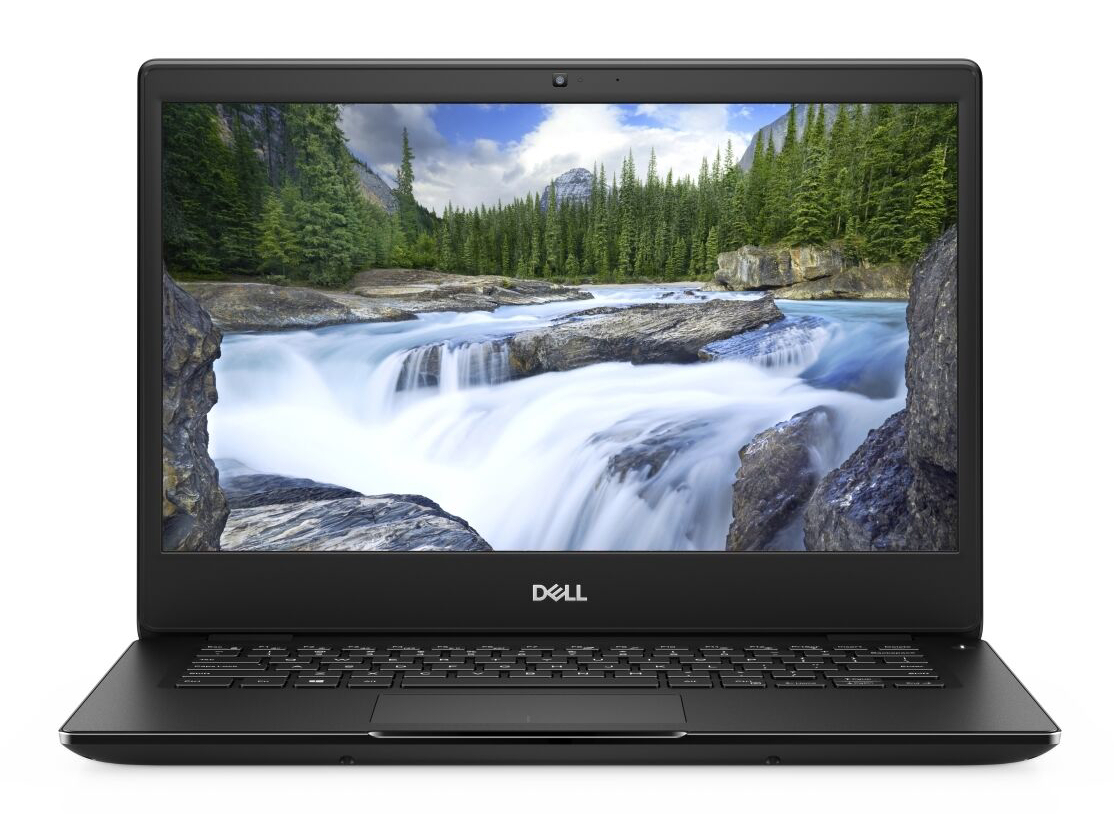
Test du Dell Latitude 3400 (i3-8145U, UHD 620, FHD) : un portable professionnel abordable à la bonne autonomie
Note | Date | Modèle | Poids | Épaisseur | Taille | Résolution | Prix |
|---|---|---|---|---|---|---|---|
| 83 % v7 (old) | 10/19 | Dell Latitude 3400 i3-8145U, UHD Graphics 620 | 1.7 kg | 18.65 mm | 14.00" | 1920x1080 | |
| 85.9 % v7 (old) | 06/19 | Lenovo ThinkPad E490-20N8000RGE i5-8265U, UHD Graphics 620 | 1.8 kg | 19.9 mm | 14.00" | 1920x1080 | |
| 84.2 % v7 (old) | 09/19 | Lenovo ThinkPad E495-20NE000JGE R5 3500U, Vega 8 | 1.8 kg | 19.9 mm | 14.00" | 1920x1080 | |
| 86.3 % v6 (old) | 03/19 | HP ProBook 440 G6-5TK01EA i7-8565U, UHD Graphics 620 | 1.6 kg | 18 mm | 14.00" | 1920x1080 | |
| 83.7 % v6 (old) | 05/19 | HP ProBook 445 G6 R5 2500U, Vega 8 | 1.6 kg | 18 mm | 14.00" | 1920x1080 |

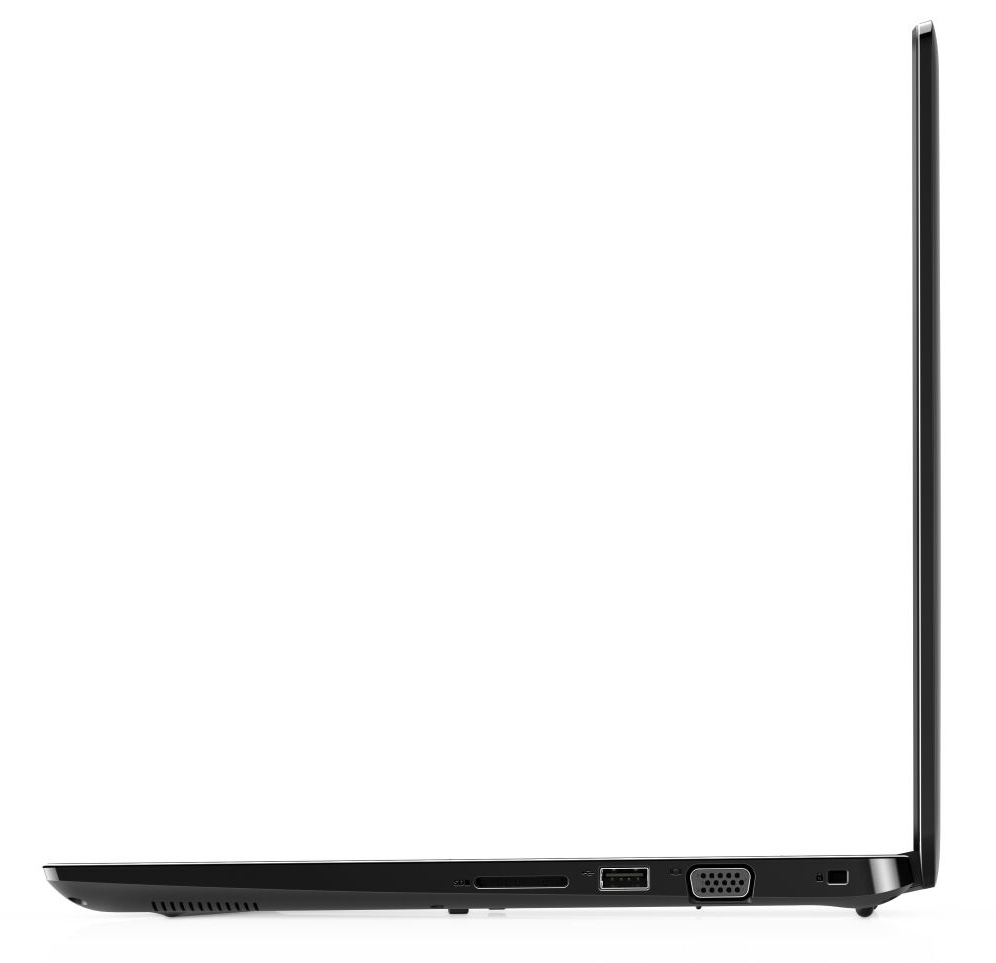
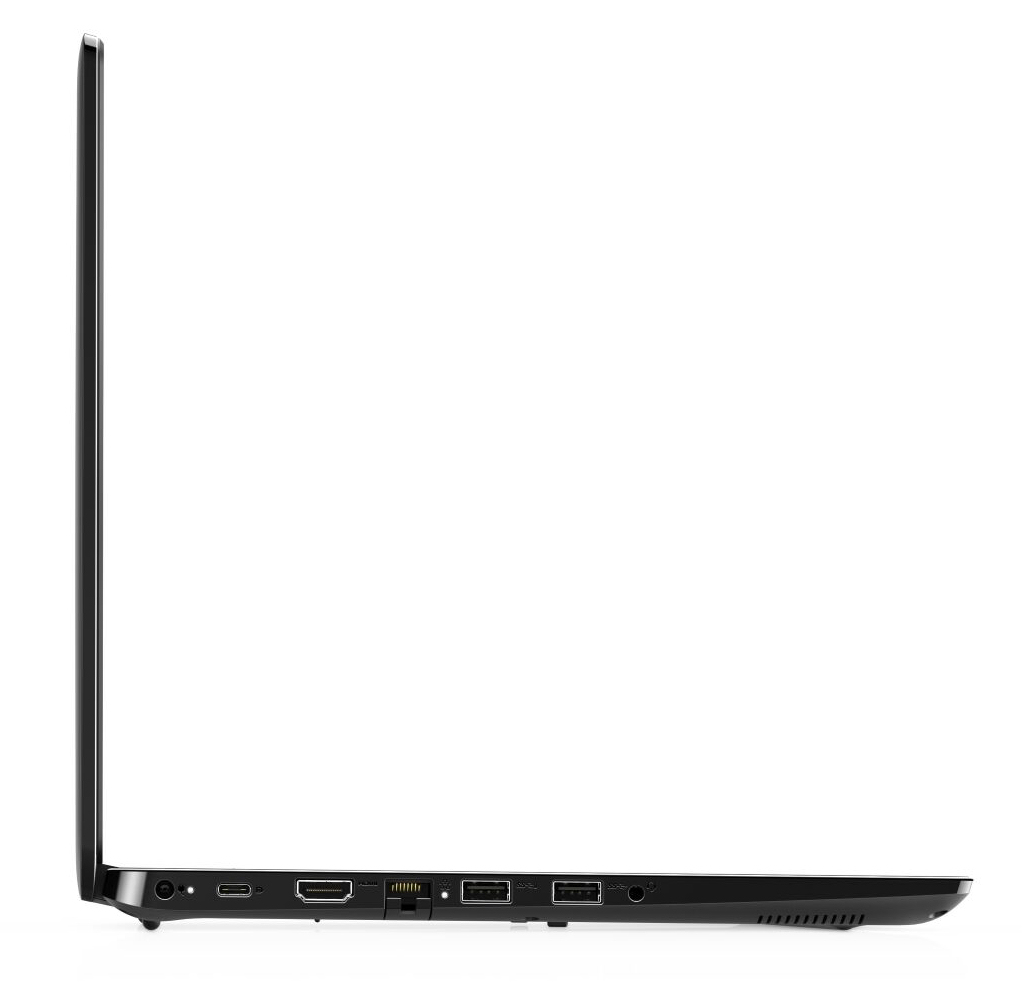
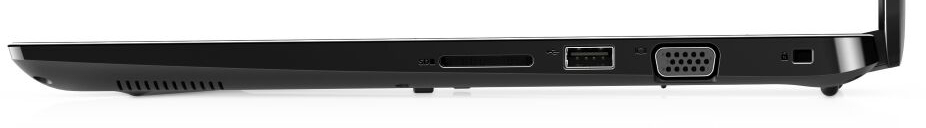
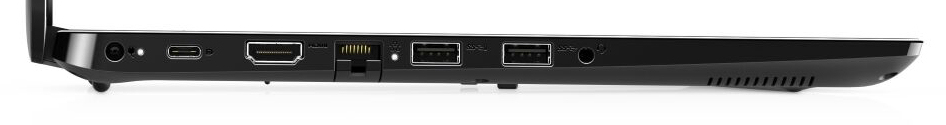
Connectivité
| SD Card Reader | |
| average JPG Copy Test (av. of 3 runs) | |
| Lenovo ThinkPad E495-20NE000JGE (Toshiba Exceria Pro M501) | |
| HP ProBook 440 G6-5TK01EA (Toshiba Exceria Pro SDXC 64 GB UHS-II) | |
| HP ProBook 445 G6 (Toshiba Exceria Pro SDXC 64 GB UHS-II) | |
| Lenovo ThinkPad E490-20N8000RGE (Toshiba Exceria Pro M501) | |
| Moyenne de la classe Office (22.4 - 198.5, n=22, 2 dernières années) | |
| Dell Latitude 3490 (Toshiba Exceria Pro SDXC 64 GB UHS-II) | |
| Dell Latitude 3400 (Toshiba Exceria Pro SDXC 64 GB UHS-II) | |
| maximum AS SSD Seq Read Test (1GB) | |
| Lenovo ThinkPad E495-20NE000JGE (Toshiba Exceria Pro M501) | |
| HP ProBook 445 G6 (Toshiba Exceria Pro SDXC 64 GB UHS-II) | |
| Lenovo ThinkPad E490-20N8000RGE (Toshiba Exceria Pro M501) | |
| HP ProBook 440 G6-5TK01EA (Toshiba Exceria Pro SDXC 64 GB UHS-II) | |
| Moyenne de la classe Office (27.4 - 249, n=20, 2 dernières années) | |
| Dell Latitude 3400 (Toshiba Exceria Pro SDXC 64 GB UHS-II) | |
| Dell Latitude 3490 (Toshiba Exceria Pro SDXC 64 GB UHS-II) | |
| |||||||||||||||||||||||||
Homogénéité de la luminosité: 79 %
Valeur mesurée au centre, sur batterie: 240 cd/m²
Contraste: 500:1 (Valeurs des noirs: 0.48 cd/m²)
ΔE ColorChecker Calman: 4.2 | ∀{0.5-29.43 Ø4.73}
ΔE Greyscale Calman: 1.75 | ∀{0.09-98 Ø4.97}
59% sRGB (Argyll 1.6.3 3D)
38% AdobeRGB 1998 (Argyll 1.6.3 3D)
42.03% AdobeRGB 1998 (Argyll 3D)
59.3% sRGB (Argyll 3D)
40.68% Display P3 (Argyll 3D)
Gamma: 2.36
CCT: 6387 K
| Dell Latitude 3400 IPS, 1920x1080, 14" | Lenovo ThinkPad E490-20N8000RGE IPS, 1920x1080, 14" | Lenovo ThinkPad E495-20NE000JGE IPS, 1920x1080, 14" | HP ProBook 440 G6-5TK01EA IPS, 1920x1080, 14" | HP ProBook 445 G6 IPS, 1920x1080, 14" | Dell Latitude 3490 IPS LED, 1920x1080, 14" | |
|---|---|---|---|---|---|---|
| Display | -2% | 5% | -5% | 3% | -1% | |
| Display P3 Coverage (%) | 40.68 | 39.85 -2% | 42.37 4% | 38.08 -6% | 41.53 2% | 39.81 -2% |
| sRGB Coverage (%) | 59.3 | 58.6 -1% | 63.5 7% | 57.2 -4% | 62 5% | 59.6 1% |
| AdobeRGB 1998 Coverage (%) | 42.03 | 41.18 -2% | 43.8 4% | 39.37 -6% | 42.94 2% | 41.16 -2% |
| Response Times | -1% | 17% | 20% | 24% | 30% | |
| Response Time Grey 50% / Grey 80% * (ms) | 44 ? | 48.4 ? -10% | 40.8 ? 7% | 41.6 ? 5% | 40 ? 9% | 36.4 ? 17% |
| Response Time Black / White * (ms) | 42 ? | 38.4 ? 9% | 30.8 ? 27% | 27.2 ? 35% | 26 ? 38% | 24 ? 43% |
| PWM Frequency (Hz) | 1000 ? | 1250 ? | 25000 ? | 208 ? | ||
| Screen | 7% | 2% | -13% | 5% | -20% | |
| Brightness middle (cd/m²) | 240 | 305 27% | 241 0% | 256 7% | 200 -17% | 250 4% |
| Brightness (cd/m²) | 227 | 295 30% | 230 1% | 238 5% | 196 -14% | 241 6% |
| Brightness Distribution (%) | 79 | 90 14% | 75 -5% | 85 8% | 67 -15% | 81 3% |
| Black Level * (cd/m²) | 0.48 | 0.23 52% | 0.17 65% | 0.23 52% | 0.17 65% | 0.25 48% |
| Contrast (:1) | 500 | 1326 165% | 1418 184% | 1113 123% | 1176 135% | 1000 100% |
| Colorchecker dE 2000 * | 4.2 | 5.3 -26% | 4.7 -12% | 6.2 -48% | 4.26 -1% | 5.5 -31% |
| Colorchecker dE 2000 max. * | 7.16 | 18.9 -164% | 19.7 -175% | 18.2 -154% | 9.7 -35% | 23.5 -228% |
| Greyscale dE 2000 * | 1.75 | 2.3 -31% | 2.6 -49% | 3.8 -117% | 3.15 -80% | 3.5 -100% |
| Gamma | 2.36 93% | 2.09 105% | 2.12 104% | 2.5 88% | 2.31 95% | 2.27 97% |
| CCT | 6387 102% | 6246 104% | 6507 100% | 6643 98% | 6882 94% | 7049 92% |
| Color Space (Percent of AdobeRGB 1998) (%) | 38 | 37.7 -1% | 40.3 6% | 36.1 -5% | 40 5% | 37.9 0% |
| Color Space (Percent of sRGB) (%) | 59 | 58.2 -1% | 63.3 7% | 56.9 -4% | 62 5% | 59.4 1% |
| Colorchecker dE 2000 calibrated * | 5 | 4.2 | 5.2 | 4.8 | ||
| Moyenne finale (programmes/paramètres) | 1% /
4% | 8% /
5% | 1% /
-7% | 11% /
7% | 3% /
-9% |
* ... Moindre est la valeur, meilleures sont les performances
Temps de réponse de l'écran
| ↔ Temps de réponse noir à blanc | ||
|---|---|---|
| 42 ms ... hausse ↗ et chute ↘ combinées | ↗ 28 ms hausse | 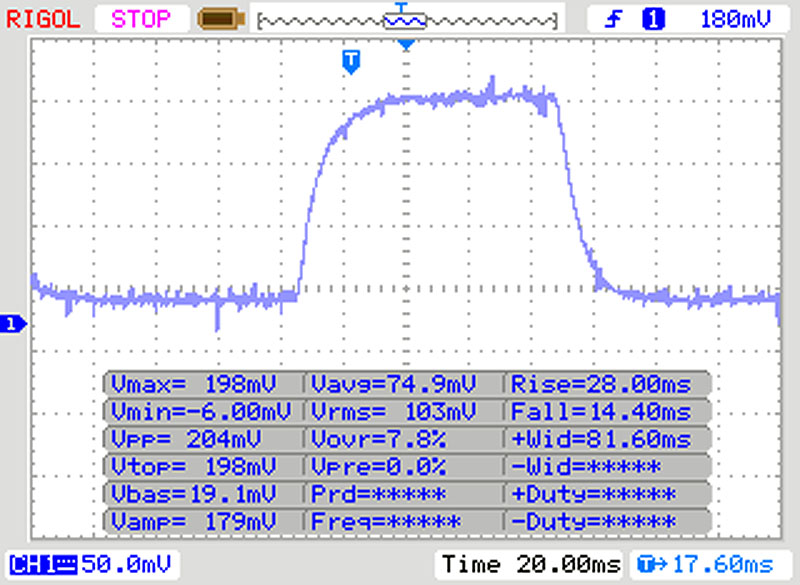 |
| ↘ 14 ms chute | ||
| L'écran souffre de latences très élevées, à éviter pour le jeu. En comparaison, tous les appareils testés affichent entre 0.1 (minimum) et 240 (maximum) ms. » 98 % des appareils testés affichent de meilleures performances. Cela signifie que les latences relevées sont moins bonnes que la moyenne (19.9 ms) de tous les appareils testés. | ||
| ↔ Temps de réponse gris 50% à gris 80% | ||
| 44 ms ... hausse ↗ et chute ↘ combinées | ↗ 22 ms hausse | 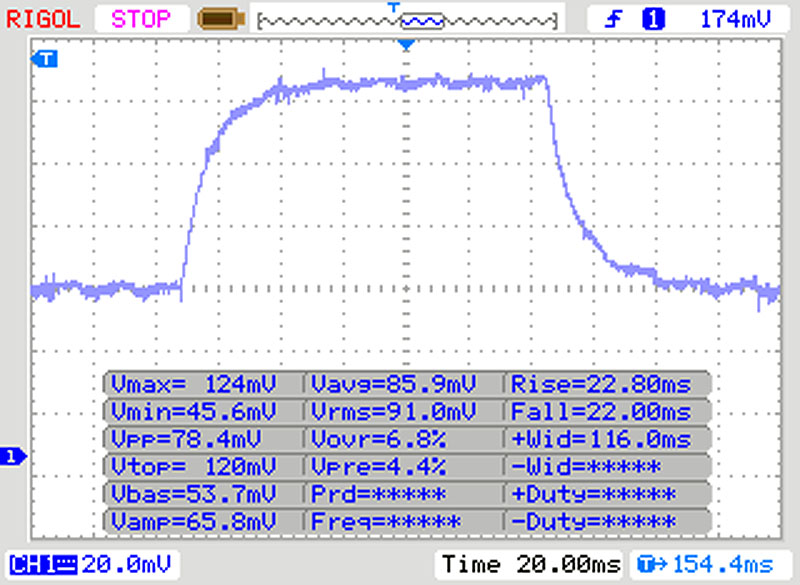 |
| ↘ 22 ms chute | ||
| L'écran souffre de latences très élevées, à éviter pour le jeu. En comparaison, tous les appareils testés affichent entre 0.165 (minimum) et 636 (maximum) ms. » 73 % des appareils testés affichent de meilleures performances. Cela signifie que les latences relevées sont moins bonnes que la moyenne (31.1 ms) de tous les appareils testés. | ||
Scintillement / MLI (Modulation de largeur d'impulsion)
| Scintillement / MLI (Modulation de largeur d'impulsion) décelé | 1000 Hz | ≤ 90 Niveau de luminosité | 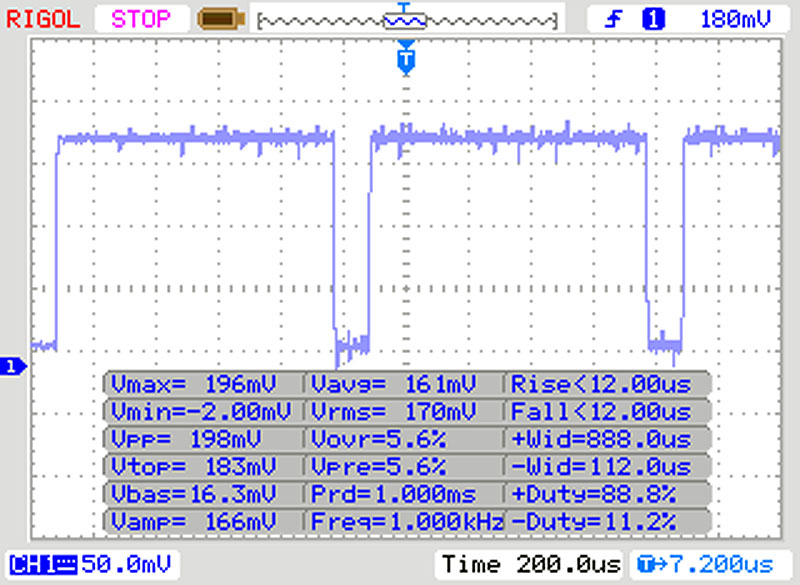 |
Le rétroéclairage de l'écran scintille à la fréquence de 1000 Hz (certainement du fait de l'utilisation d'une MDI - Modulation de largeur d'impulsion) à un niveau de luminosité inférieur ou égal à 90 % . Aucun scintillement ne devrait être perceptible au-dessus de cette valeur. La fréquence de rafraîchissement de 1000 Hz est élevée, la grande majorité des utilisateurs ne devrait pas percevoir de scintillements et être sujette à une fatigue oculaire accrue. En comparaison, 52 % des appareils testés n'emploient pas MDI pour assombrir leur écran. Nous avons relevé une moyenne à 7798 (minimum : 5 - maximum : 343500) Hz dans le cas où une MDI était active. | |||
| Geekbench 3 | |
| 32 Bit Multi-Core Score | |
| Lenovo ThinkPad E490-20N8000RGE | |
| HP ProBook 445 G6 | |
| Dell Latitude 3400 | |
| Moyenne Intel Core i3-8145U (6870 - 7572, n=3) | |
| 32 Bit Single-Core Score | |
| Lenovo ThinkPad E490-20N8000RGE | |
| Dell Latitude 3400 | |
| Moyenne Intel Core i3-8145U (3350 - 3457, n=3) | |
| HP ProBook 445 G6 | |
| Geekbench 5.0 | |
| 5.0 Multi-Core | |
| Moyenne de la classe Office (5706 - 11112, n=8, 2 dernières années) | |
| Dell Latitude 3400 | |
| Moyenne Intel Core i3-8145U (n=1) | |
| 5.0 Single-Core | |
| Moyenne de la classe Office (990 - 1992, n=8, 2 dernières années) | |
| Dell Latitude 3400 | |
| Moyenne Intel Core i3-8145U (n=1) | |
| Mozilla Kraken 1.1 - Total | |
| HP ProBook 445 G6 (Edge 44) | |
| Lenovo ThinkPad E495-20NE000JGE (Edge 44.17763.1.0) | |
| Moyenne Intel Core i3-8145U (1252 - 1314, n=2) | |
| Dell Latitude 3400 (Edge 44) | |
| Dell Latitude 3490 (Edge) | |
| Lenovo ThinkPad E490-20N8000RGE (Edge 44) | |
| HP ProBook 440 G6-5TK01EA (EDGE: 42.17134.1.0) | |
| Moyenne de la classe Office (391 - 1297, n=76, 2 dernières années) | |
| Octane V2 - Total Score | |
| Moyenne de la classe Office (49011 - 122119, n=19, 2 dernières années) | |
| HP ProBook 440 G6-5TK01EA (EDGE: 42.17134.1.0) | |
| Lenovo ThinkPad E490-20N8000RGE (Edge 44) | |
| Dell Latitude 3490 (Edge) | |
| Moyenne Intel Core i3-8145U (28265 - 29392, n=2) | |
| Dell Latitude 3400 (Edge 44) | |
| Lenovo ThinkPad E495-20NE000JGE (Edge 44.17763.1.0) | |
| HP ProBook 445 G6 (Edge 44) | |
| JetStream 1.1 - 1.1 Total | |
| HP ProBook 440 G6-5TK01EA (EDGE: 42.17134.1.0) | |
| Lenovo ThinkPad E490-20N8000RGE (Edge 44) | |
| Dell Latitude 3490 (Edge) | |
| Moyenne Intel Core i3-8145U (205 - 227, n=3) | |
| Dell Latitude 3400 (Edge 44) | |
| Lenovo ThinkPad E495-20NE000JGE (Edge 44.17763.1.0) | |
* ... Moindre est la valeur, meilleures sont les performances
| PCMark 8 Home Score Accelerated v2 | 2959 points | |
| PCMark 8 Creative Score Accelerated v2 | 3016 points | |
| PCMark 8 Work Score Accelerated v2 | 4552 points | |
| PCMark 10 Score | 3399 points | |
Aide | ||

| Dell Latitude 3400 WDC PC SN520 SDAPNUW-256G | Lenovo ThinkPad E490-20N8000RGE SK hynix BC501 HFM256GDHTNG | Lenovo ThinkPad E495-20NE000JGE SK hynix BC501 HFM256GDHTNG | HP ProBook 440 G6-5TK01EA Toshiba XG5 KXG50ZNV512G | HP ProBook 445 G6 SK Hynix BC501 NVMe 256 GB | Dell Latitude 3490 SK hynix SC311 M.2 | Moyenne WDC PC SN520 SDAPNUW-256G | Moyenne de la classe Office | |
|---|---|---|---|---|---|---|---|---|
| CrystalDiskMark 5.2 / 6 | -10% | -13% | 7% | -15% | -47% | -5% | 111% | |
| Write 4K (MB/s) | 107.9 | 110.7 3% | 121.3 12% | 117.6 9% | 110.4 2% | 71.7 -34% | 118.5 ? 10% | 151.4 ? 40% |
| Read 4K (MB/s) | 40.27 | 41.02 2% | 41.24 2% | 32.61 -19% | 39.46 -2% | 28.66 -29% | 42 ? 4% | 72.8 ? 81% |
| Write Seq (MB/s) | 1253 | 757 -40% | 814 -35% | 527 -58% | 808 -36% | 415.9 -67% | 1123 ? -10% | 2558 ? 104% |
| Read Seq (MB/s) | 1298 | 1037 -20% | 1098 -15% | 2181 68% | 1130 -13% | 500 -61% | 1208 ? -7% | 3237 ? 149% |
| Write 4K Q32T1 (MB/s) | 415 | 359 -13% | 267 -36% | 508 22% | 260.8 -37% | 278 -33% | 324 ? -22% | 424 ? 2% |
| Read 4K Q32T1 (MB/s) | 313.3 | 402.4 28% | 334.6 7% | 352.1 12% | 308 -2% | 252.9 -19% | 322 ? 3% | 509 ? 62% |
| Write Seq Q32T1 (MB/s) | 1297 | 833 -36% | 819 -37% | 526 -59% | 816 -37% | 502 -61% | 1091 ? -16% | 3999 ? 208% |
| Read Seq Q32T1 (MB/s) | 1728 | 1635 -5% | 1646 -5% | 3135 81% | 1783 3% | 553 -68% | 1729 ? 0% | 5962 ? 245% |
| 3DMark 11 Performance | 1598 points | |
| 3DMark Ice Storm Standard Score | 50752 points | |
| 3DMark Cloud Gate Standard Score | 6028 points | |
| 3DMark Fire Strike Score | 873 points | |
| 3DMark Time Spy Score | 353 points | |
Aide | ||
| Bas | Moyen | Élevé | Ultra | |
|---|---|---|---|---|
| BioShock Infinite (2013) | 44.6 | 26.8 | 22.4 | 7 |
| BioShock Infinite - 1280x720 Very Low Preset | |
| HP ProBook 445 G6 | |
| Lenovo ThinkPad E495-20NE000JGE | |
| Dell Latitude 3400 (Dual-Channel) | |
| Moyenne Intel UHD Graphics 620 (18.3 - 90.2, n=187) | |
| HP ProBook 440 G6-5TK01EA | |
| Lenovo ThinkPad E490-20N8000RGE | |
| Dell Latitude 3490 | |
| Dell Latitude 3400 | |
Degré de la nuisance sonore
| Au repos |
| 30.2 / 30.2 / 32.8 dB(A) |
| Fortement sollicité |
| 38.1 / 37.9 dB(A) |
 | ||
30 dB silencieux 40 dB(A) audible 50 dB(A) bruyant |
||
min: | ||
(±) La température maximale du côté supérieur est de 40.8 °C / 105 F, par rapport à la moyenne de 34.3 °C / 94 F, allant de 21.2 à 62.5 °C pour la classe Office.
(+) Le fond chauffe jusqu'à un maximum de 39.8 °C / 104 F, contre une moyenne de 36.8 °C / 98 F
(+) En utilisation inactive, la température moyenne du côté supérieur est de 26.8 °C / 80 F, par rapport à la moyenne du dispositif de 29.5 °C / 85 F.
(+) Les repose-poignets et le pavé tactile sont plus froids que la température de la peau avec un maximum de 26.7 °C / 80.1 F et sont donc froids au toucher.
(±) La température moyenne de la zone de l'appui-paume de dispositifs similaires était de 27.5 °C / 81.5 F (+0.8 °C / #1.4 F).
Dell Latitude 3400 analyse audio
(-) | haut-parleurs pas très forts (65.9 dB)
Basses 100 - 315 Hz
(-) | presque aucune basse - en moyenne 26.6% plus bas que la médiane
(+) | les basses sont linéaires (5.8% delta à la fréquence précédente)
Médiums 400 - 2000 Hz
(±) | médiane réduite - en moyenne 5.7% inférieure à la médiane
(±) | la linéarité des médiums est moyenne (11.6% delta à la fréquence précédente)
Aiguës 2 - 16 kHz
(+) | des sommets équilibrés - à seulement 1.5% de la médiane
(+) | les aigus sont linéaires (4.3% delta à la fréquence précédente)
Globalement 100 - 16 000 Hz
(±) | la linéarité du son global est moyenne (24.2% de différence avec la médiane)
Par rapport à la même classe
» 70% de tous les appareils testés de cette catégorie étaient meilleurs, 8% similaires, 22% pires
» Le meilleur avait un delta de 7%, la moyenne était de 21%, le pire était de 53%.
Par rapport à tous les appareils testés
» 73% de tous les appareils testés étaient meilleurs, 6% similaires, 21% pires
» Le meilleur avait un delta de 4%, la moyenne était de 24%, le pire était de 134%.
| Éteint/en veille | |
| Au repos | |
| Fortement sollicité |
|
Légende:
min: | |
Points positifs
Points négatifs
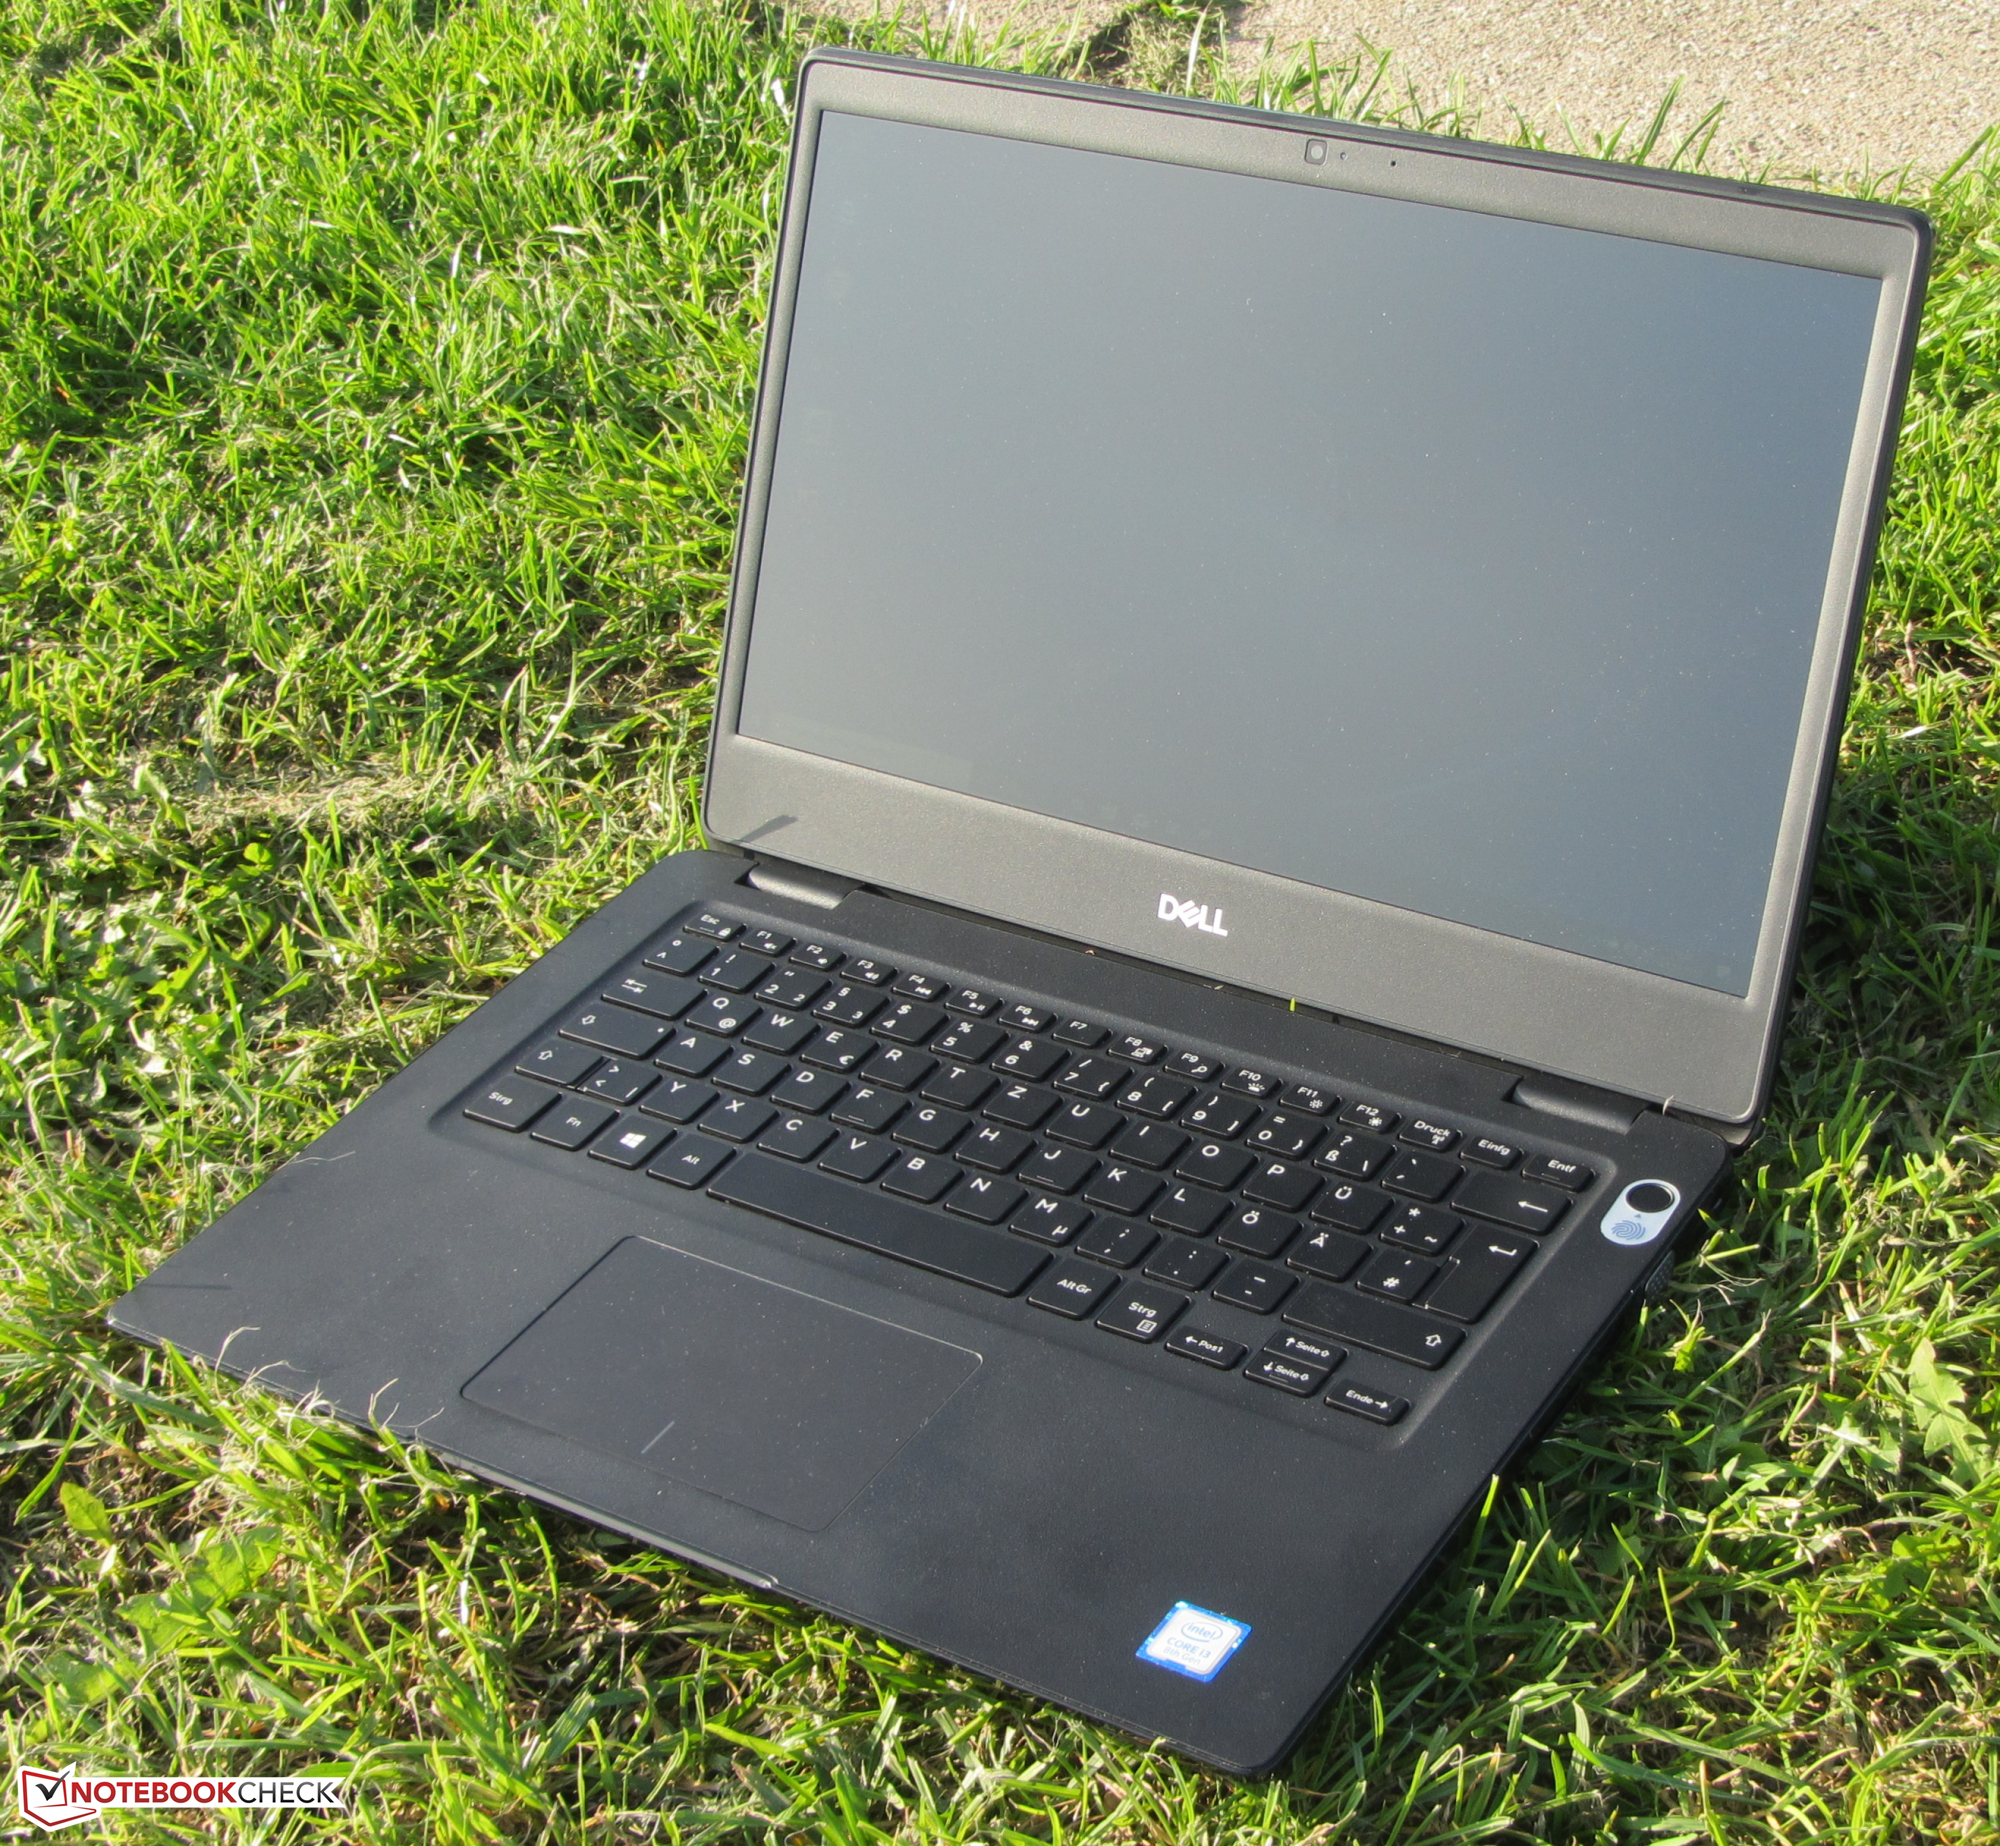
Le Dell Latitude 3400 est un portable pro sans relief, surtout quand il est équipé d’un processeur Intel Core i3-8145U. Mais il est assez puissant pour toutes les tâches de bureautique ou Internet, tout en n’étant jamais trop chaud ni trop bruyant.
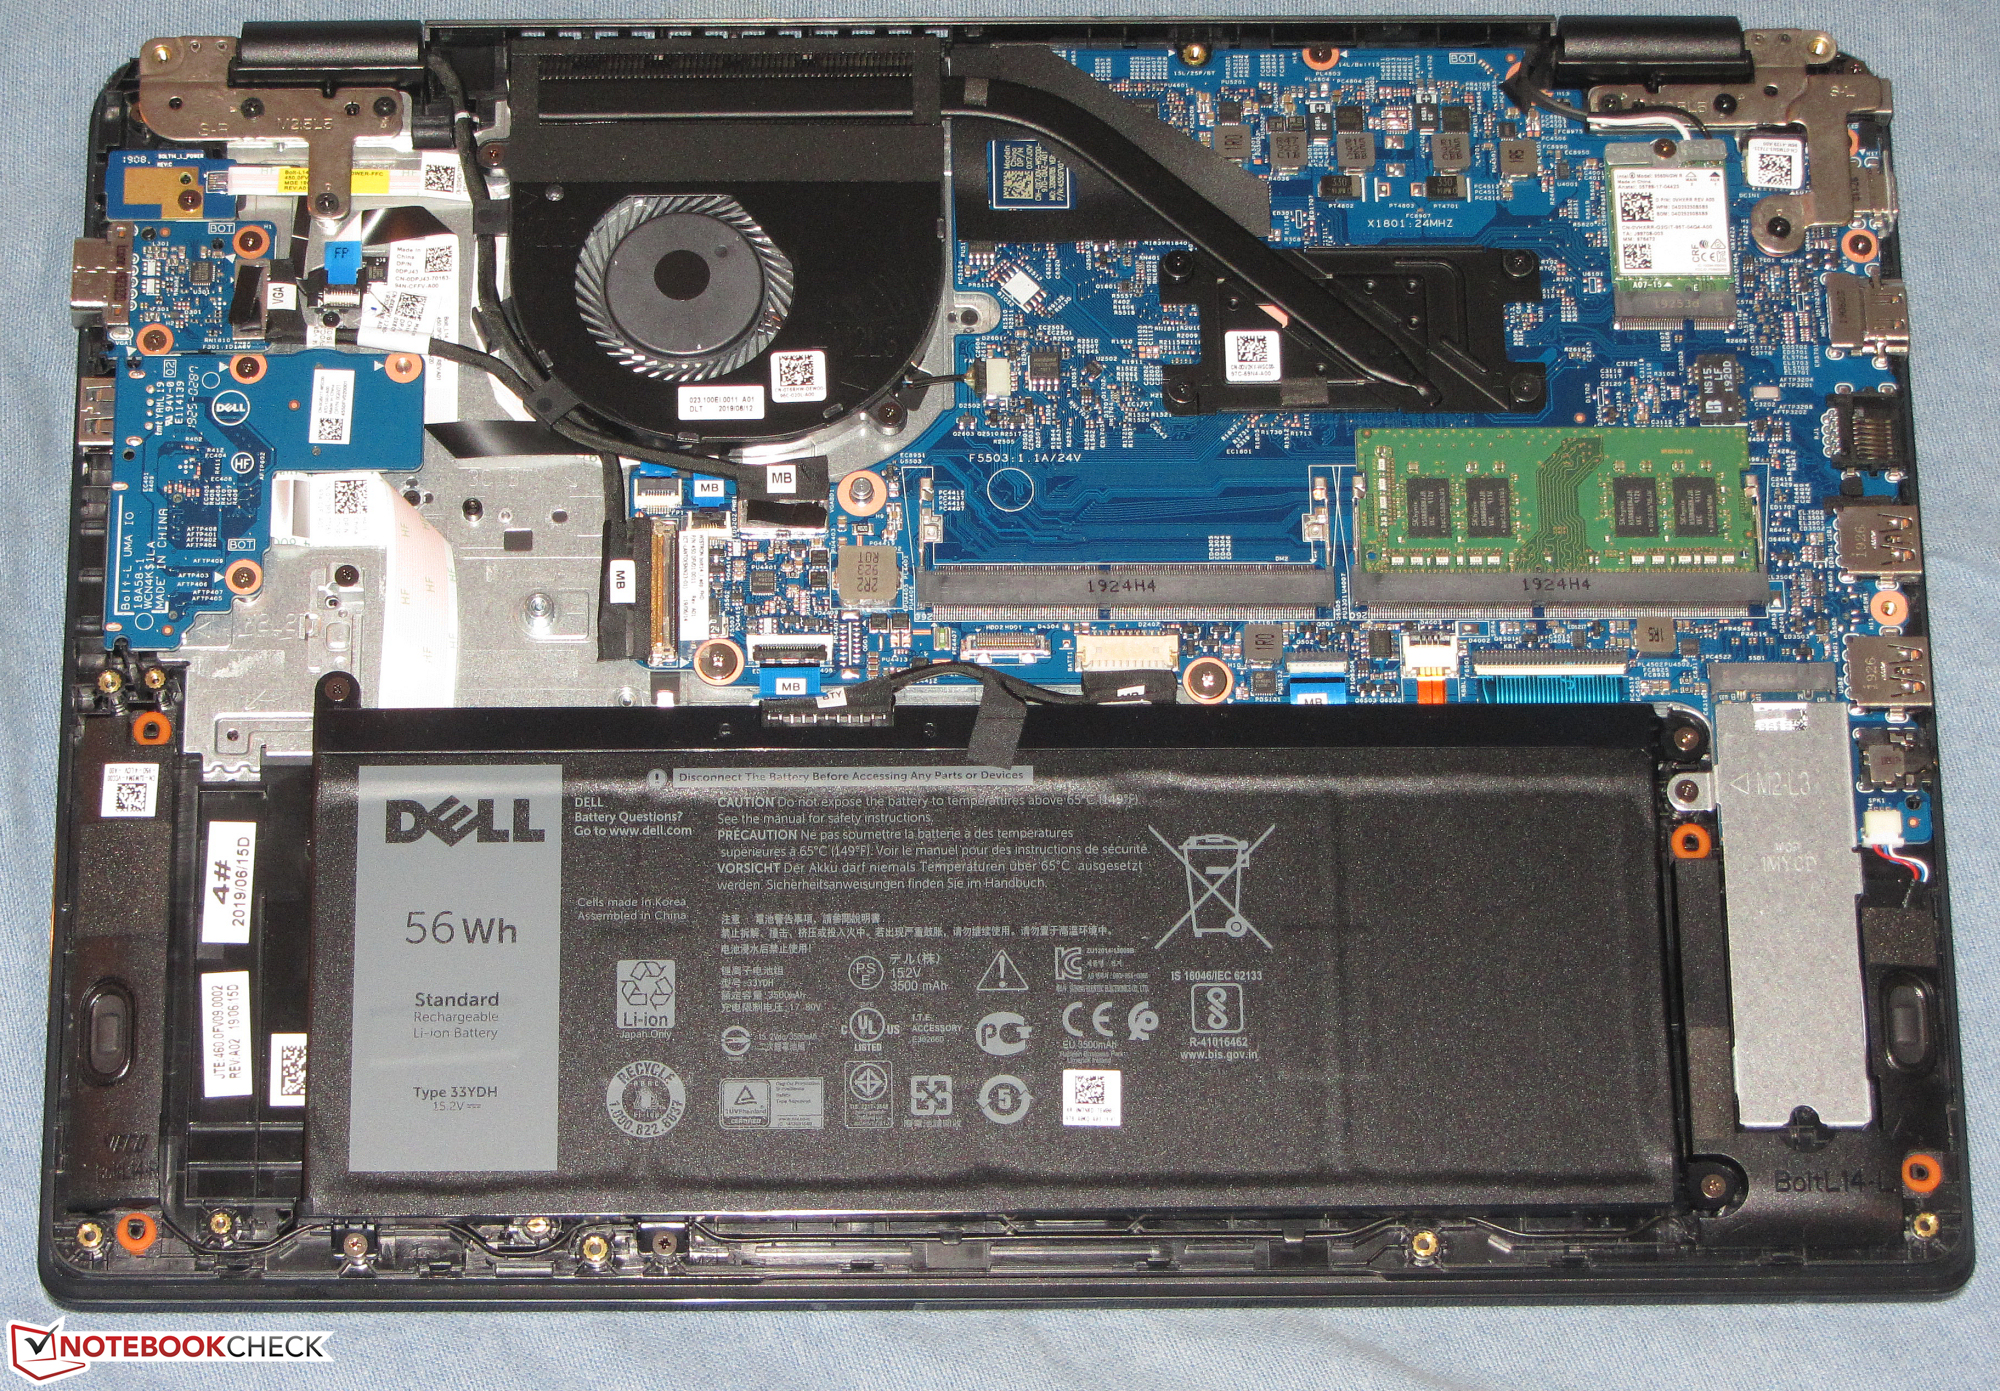
L’intégration d’un SSD NVMe rapide permet au système d’être réactif, et il est possible de le changer pour ceux qui ont besoin de plus de place. Il faudra ouvrir l’appareil pour le faire.
Le Dell Latitude 3400 est un portable pro de 14 pouces solide et abordable, qui devrait faire l’affaire au travail.
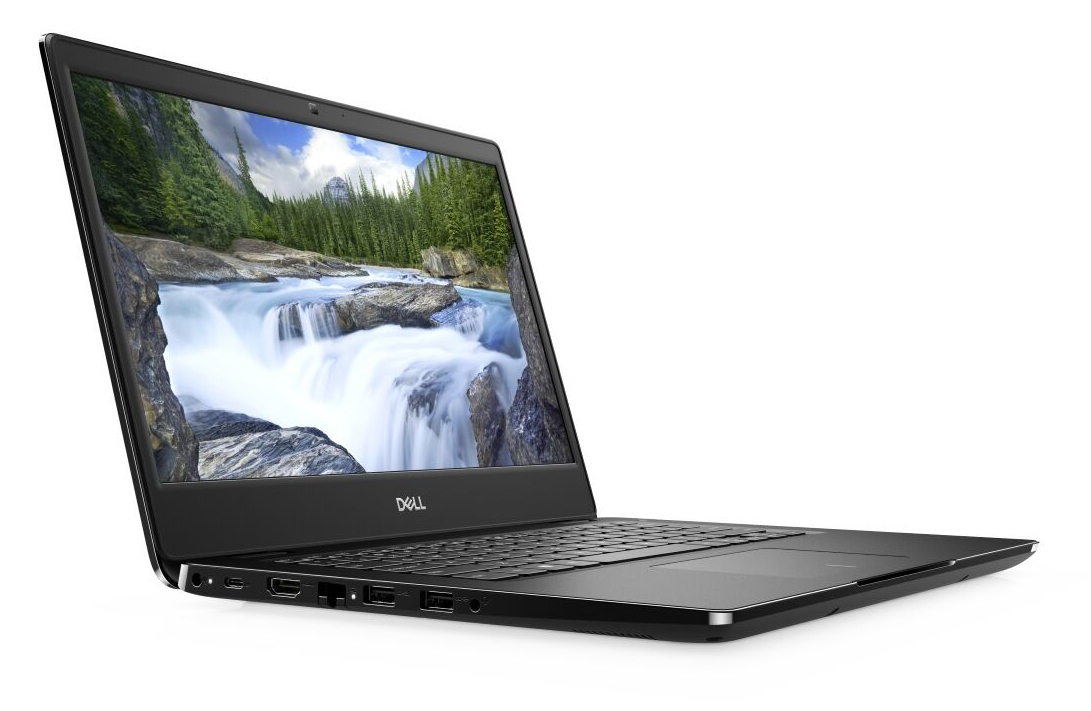
Nous apprécions également le clavier et le trackpad, ainsi que l’autonomie. Le Latitude 3400 possède également une bonne sélection de ports, dont l’USB C qui prend en charge le DisplayPort et la charge. Cependant son écran sombre et peu contrasté déçoit, tout comme le lecteur de carte lent et la garantie de seulement 12 mois. Dans l’ensemble, le Dell Latitude 3400 est un portable de bureau correct, qui sera à même de séduire tous ceux qui ont un budget serré.
L’intégralité de cette critique est disponible en anglais en suivant ce lien.
Dell Latitude 3400
- 09/29/2019 v7 (old)
Sascha Mölck
Price comparison
