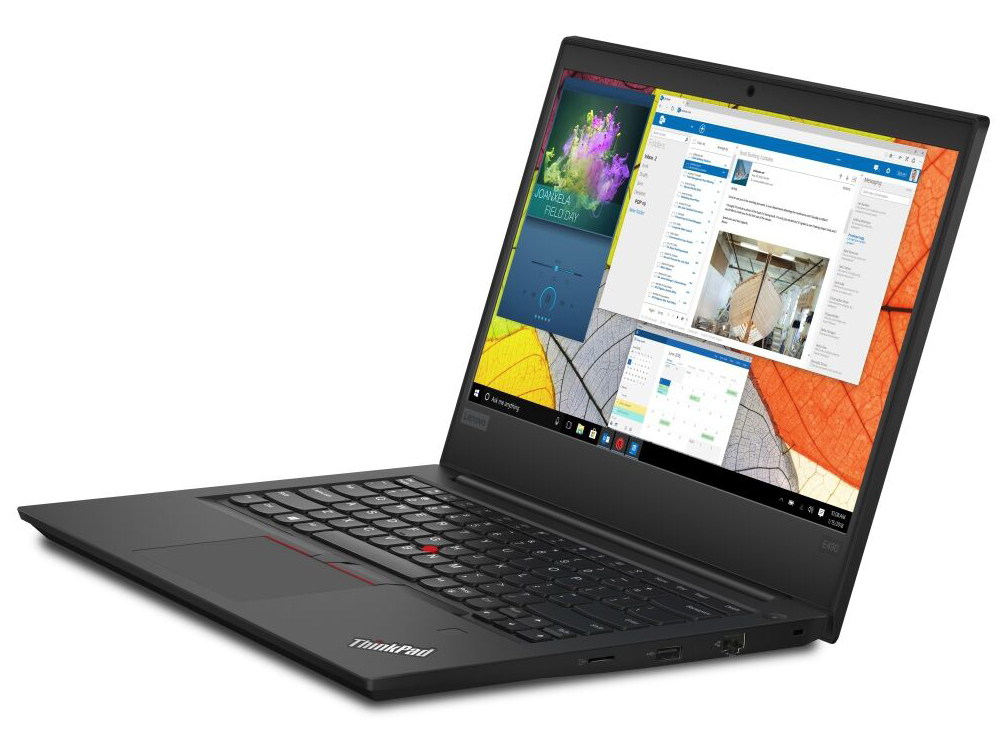
Courte critique du PC portable Lenovo ThinkPad E490 (i5-8265U, UHD 620, FHD, SSD)
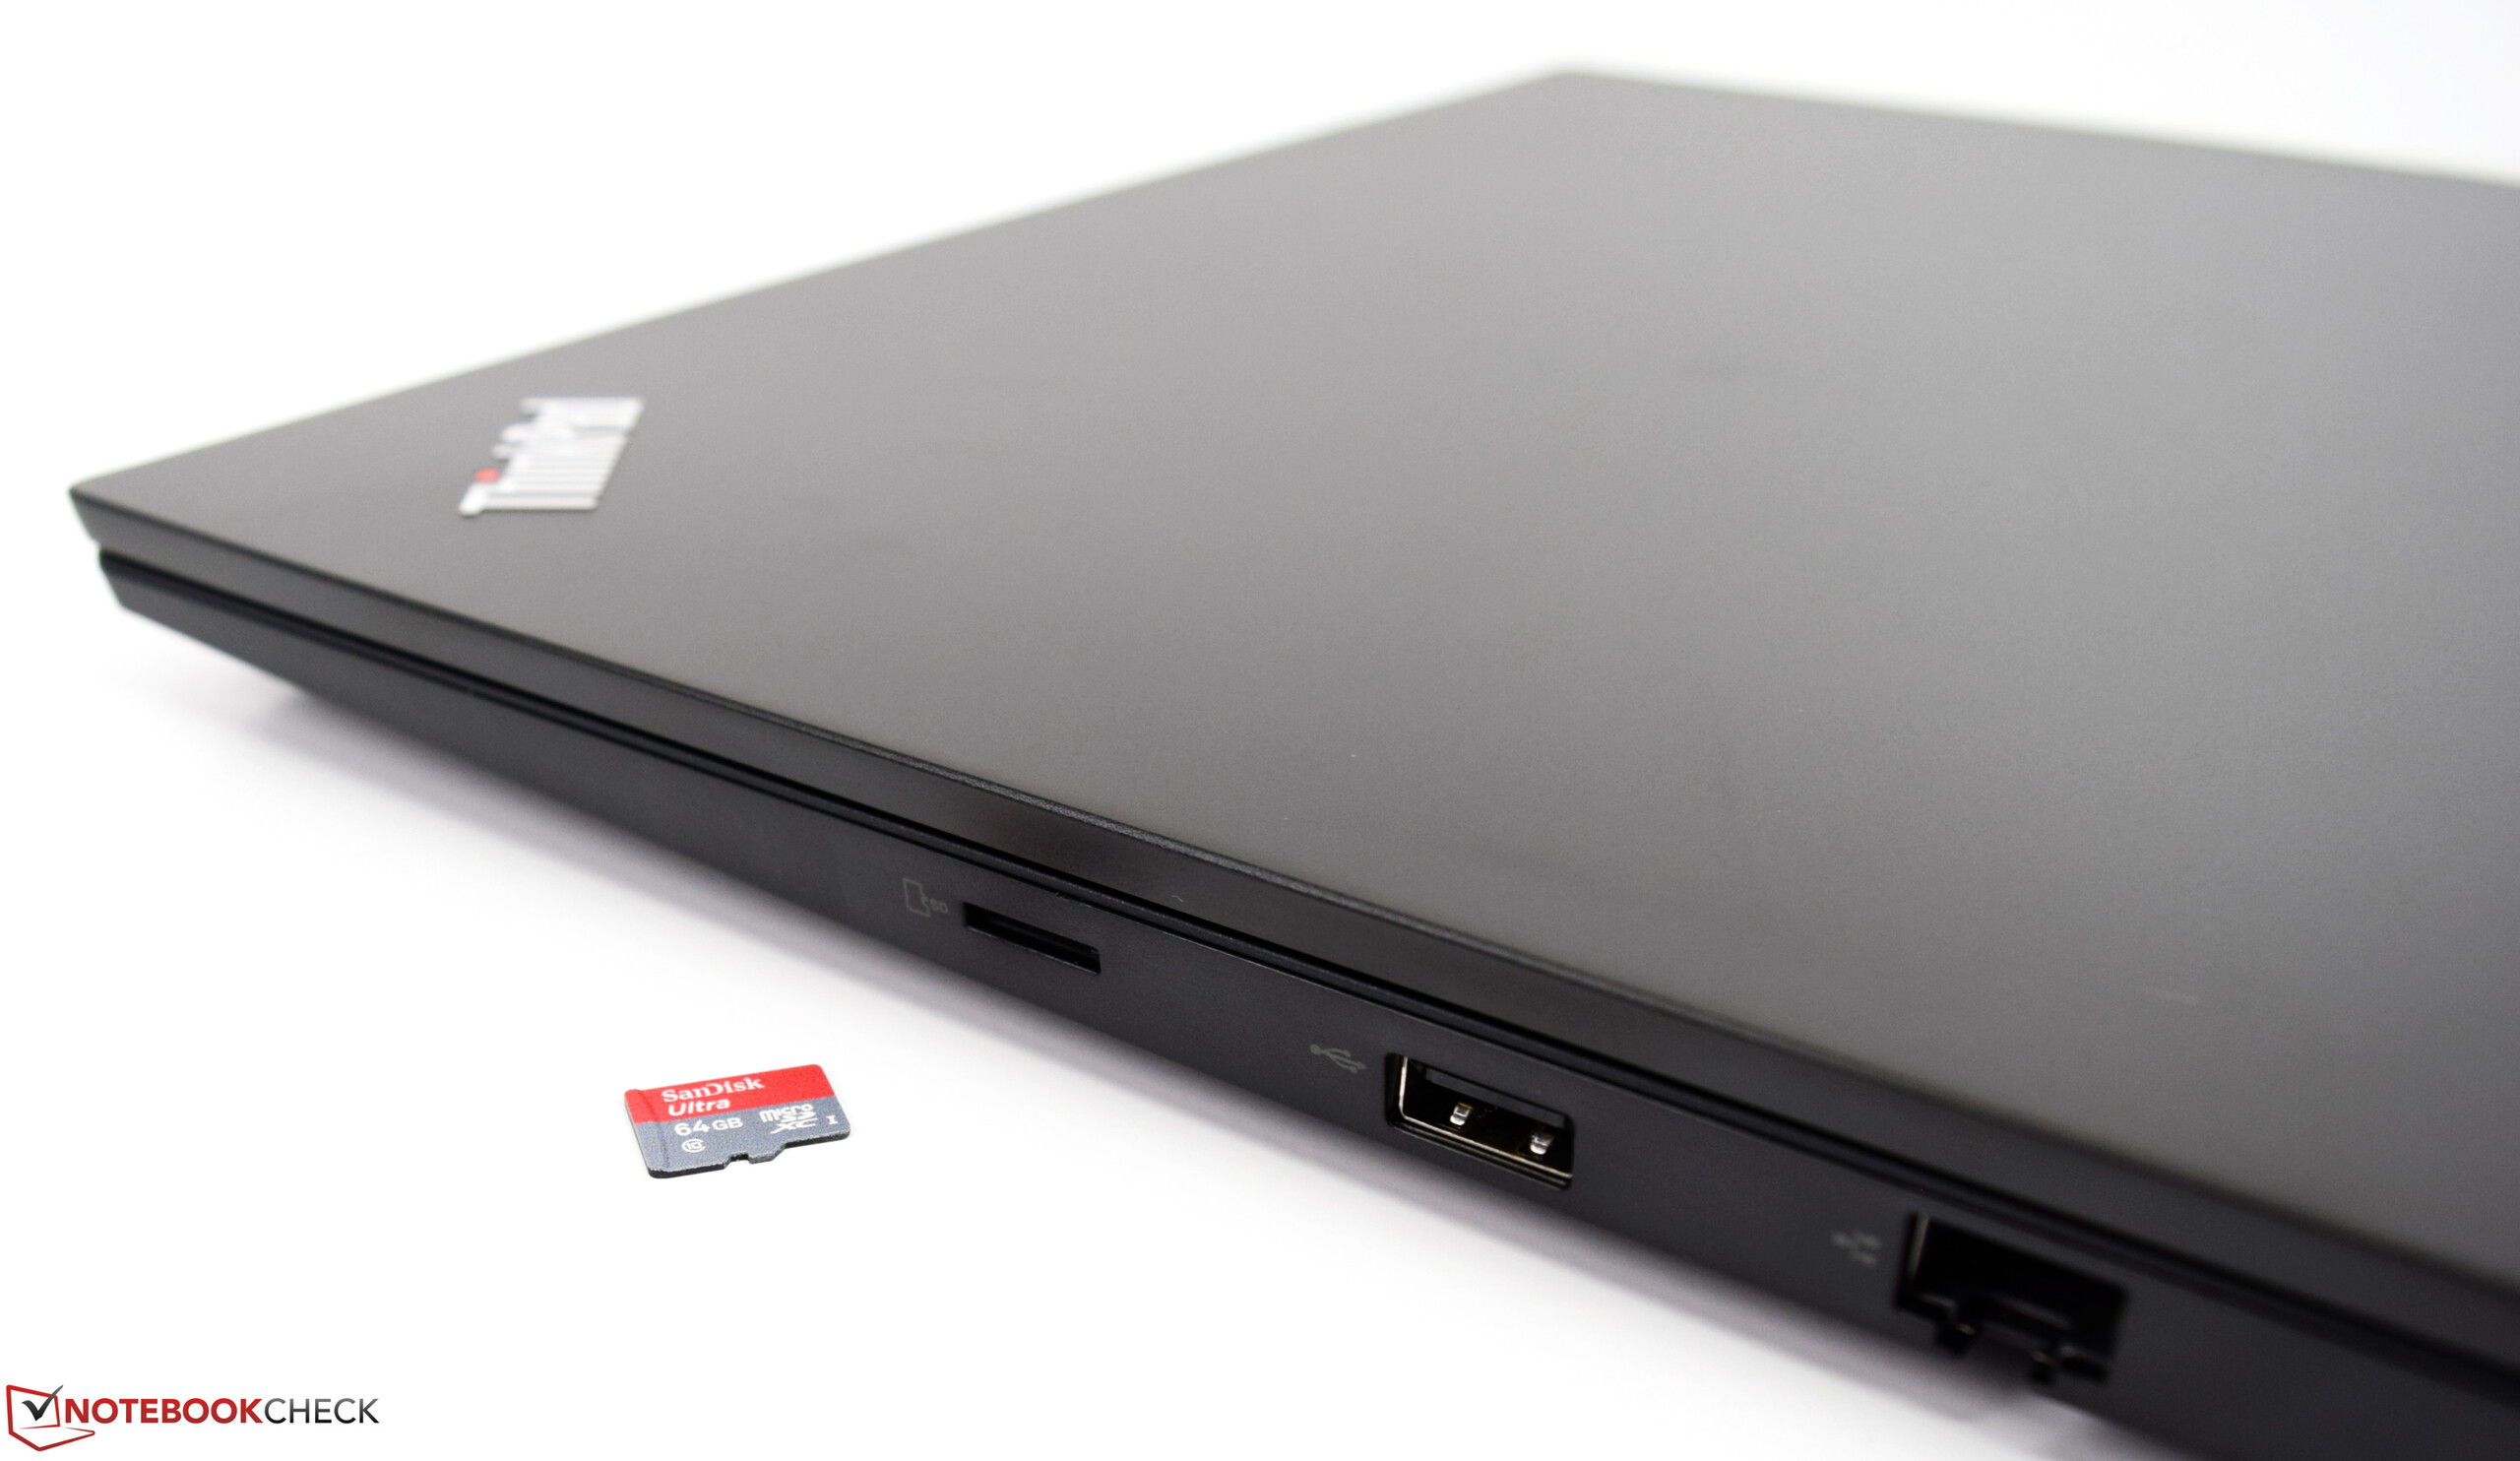
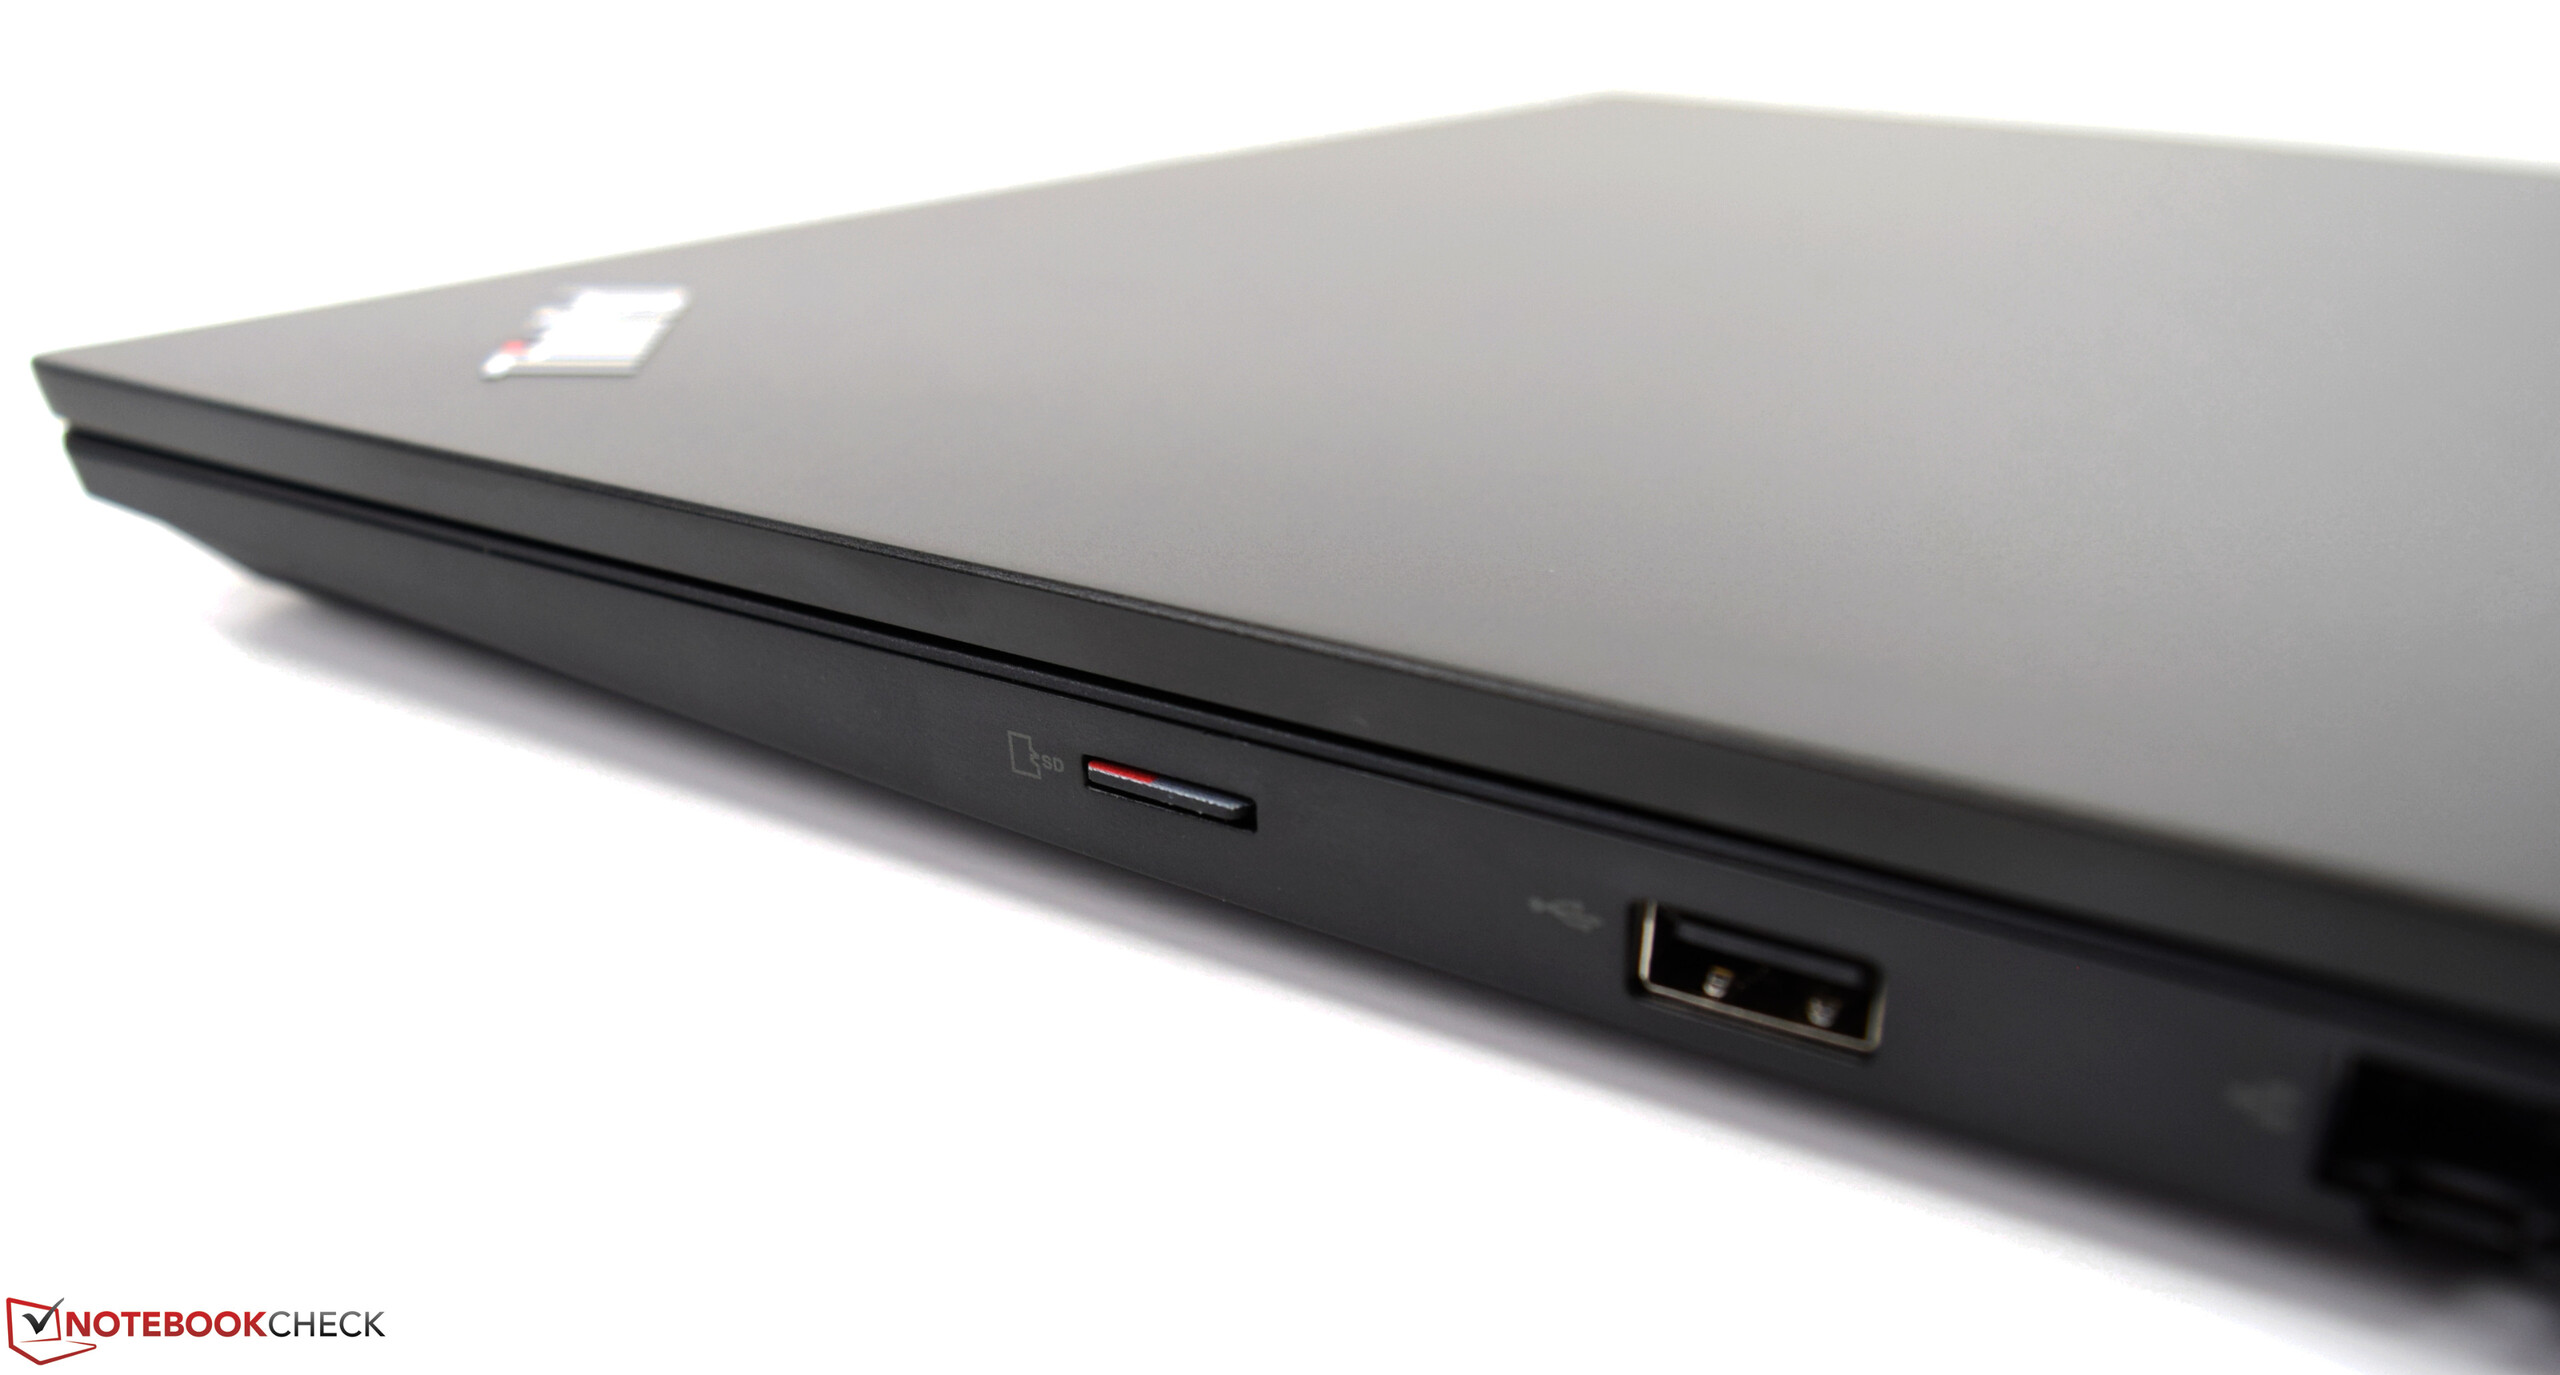
| SD Card Reader | |
| average JPG Copy Test (av. of 3 runs) | |
| Dell Latitude 14 5495 (Toshiba Exceria Pro SDXC 64 GB UHS-II) | |
| HP ProBook 440 G6-5TK01EA (Toshiba Exceria Pro SDXC 64 GB UHS-II) | |
| HP ProBook 445 G6 (Toshiba Exceria Pro SDXC 64 GB UHS-II) | |
| Lenovo ThinkPad E480-20KQS00000 (Toshiba Exceria Pro M501) | |
| Lenovo ThinkPad E480-20KNCTO1WW (Toshiba Exceria Pro M501) | |
| Lenovo ThinkPad E490-20N8000RGE (Toshiba Exceria Pro M501) | |
| Lenovo ThinkPad E485-20KU000NGE (Toshiba Exceria Pro M501) | |
| Moyenne de la classe Office (19.8 - 198.5, n=22, 2 dernières années) | |
| Dell Latitude 3490 (Toshiba Exceria Pro SDXC 64 GB UHS-II) | |
| Acer TravelMate X3410-M-866T (Toshiba Exceria Pro SDXC 64 GB UHS-II) | |
| Acer TravelMate X3410-M-50DD (Toshiba Exceria Pro SDXC 64 GB UHS-II) | |
| Acer TravelMate 2410-G2-MG-82E6 (Toshiba Exceria Pro SDXC 64 GB UHS-II) | |
| maximum AS SSD Seq Read Test (1GB) | |
| Dell Latitude 14 5495 (Toshiba Exceria Pro SDXC 64 GB UHS-II) | |
| Lenovo ThinkPad E480-20KNCTO1WW (Toshiba Exceria Pro M501) | |
| HP ProBook 445 G6 (Toshiba Exceria Pro SDXC 64 GB UHS-II) | |
| Lenovo ThinkPad E490-20N8000RGE (Toshiba Exceria Pro M501) | |
| Lenovo ThinkPad E480-20KQS00000 (Toshiba Exceria Pro M501) | |
| Lenovo ThinkPad E485-20KU000NGE (Toshiba Exceria Pro M501) | |
| HP ProBook 440 G6-5TK01EA (Toshiba Exceria Pro SDXC 64 GB UHS-II) | |
| Moyenne de la classe Office (27.4 - 249, n=21, 2 dernières années) | |
| Acer TravelMate X3410-M-50DD (Toshiba Exceria Pro SDXC 64 GB UHS-II) | |
| Dell Latitude 3490 (Toshiba Exceria Pro SDXC 64 GB UHS-II) | |
| Acer TravelMate 2410-G2-MG-82E6 (Toshiba Exceria Pro SDXC 64 GB UHS-II) | |
| Acer TravelMate X3410-M-866T (Toshiba Exceria Pro SDXC 64 GB UHS-II) | |
| |||||||||||||||||||||||||
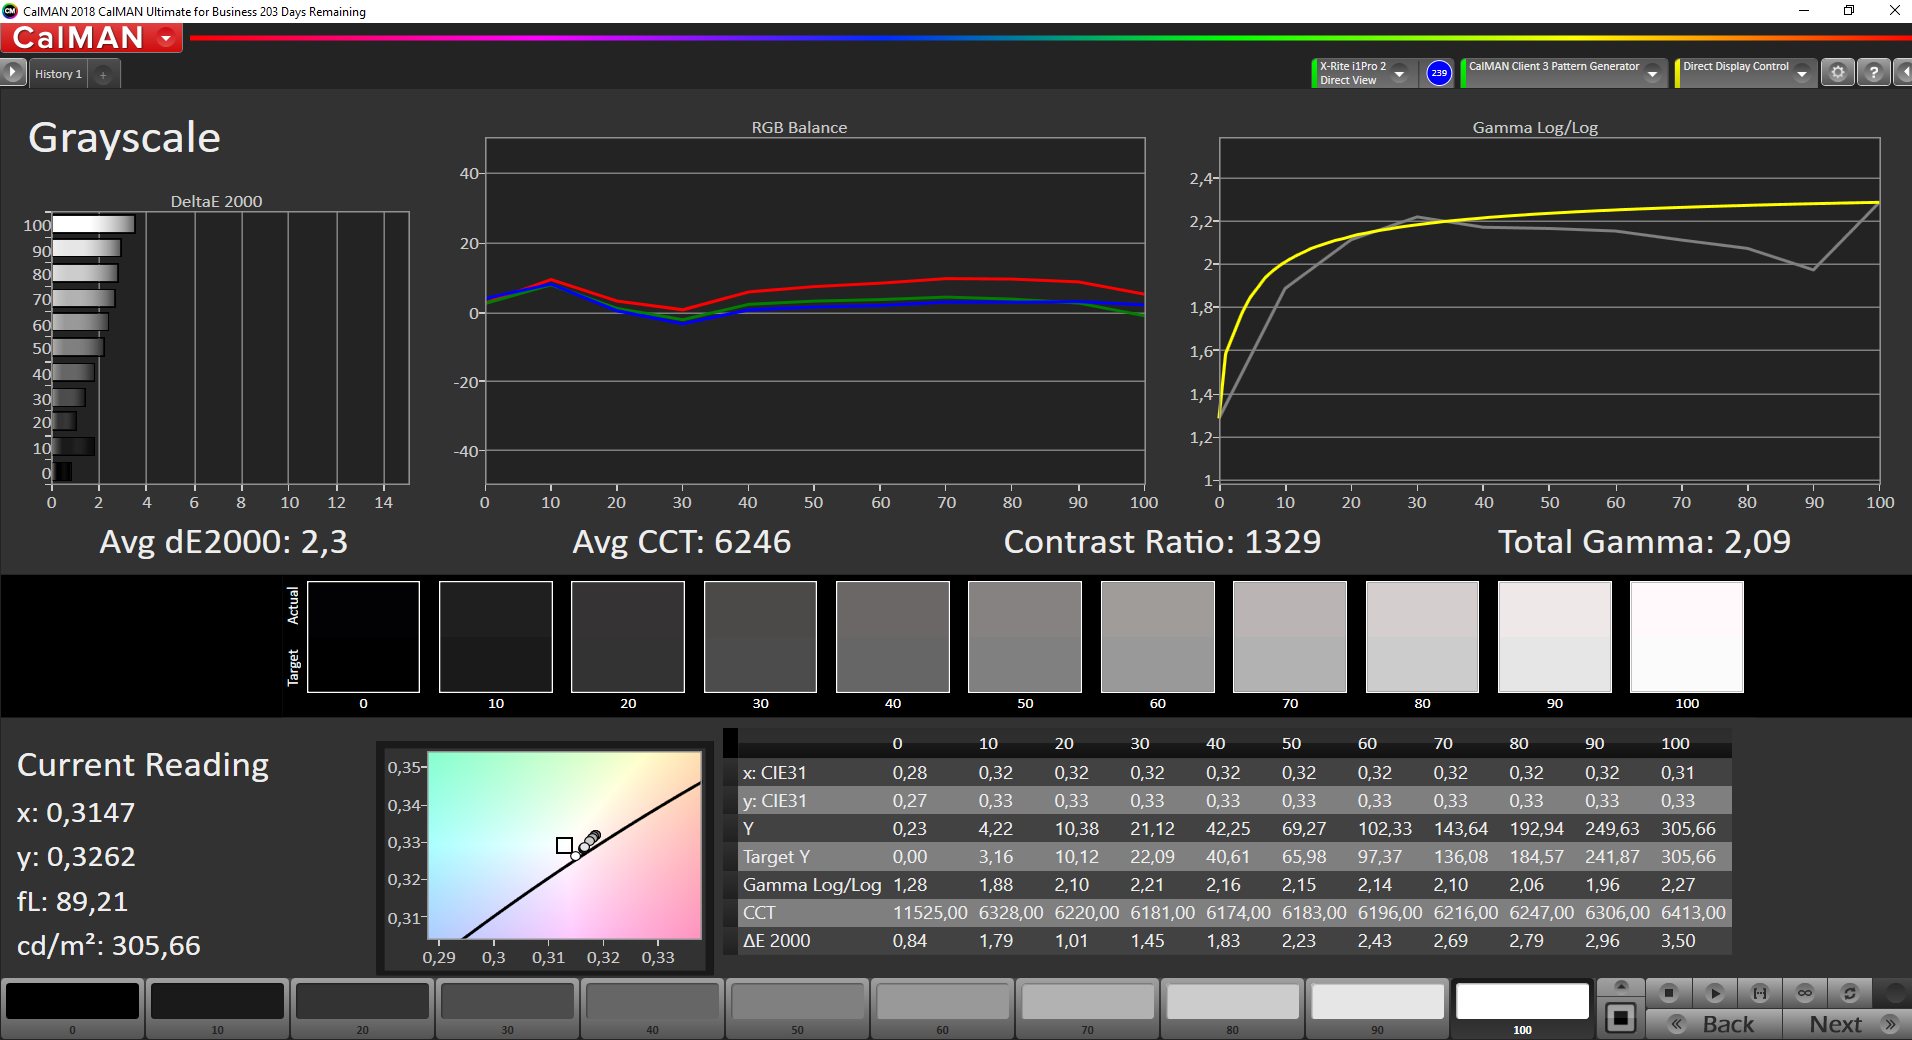
Homogénéité de la luminosité: 90 %
Valeur mesurée au centre, sur batterie: 305 cd/m²
Contraste: 1326:1 (Valeurs des noirs: 0.23 cd/m²)
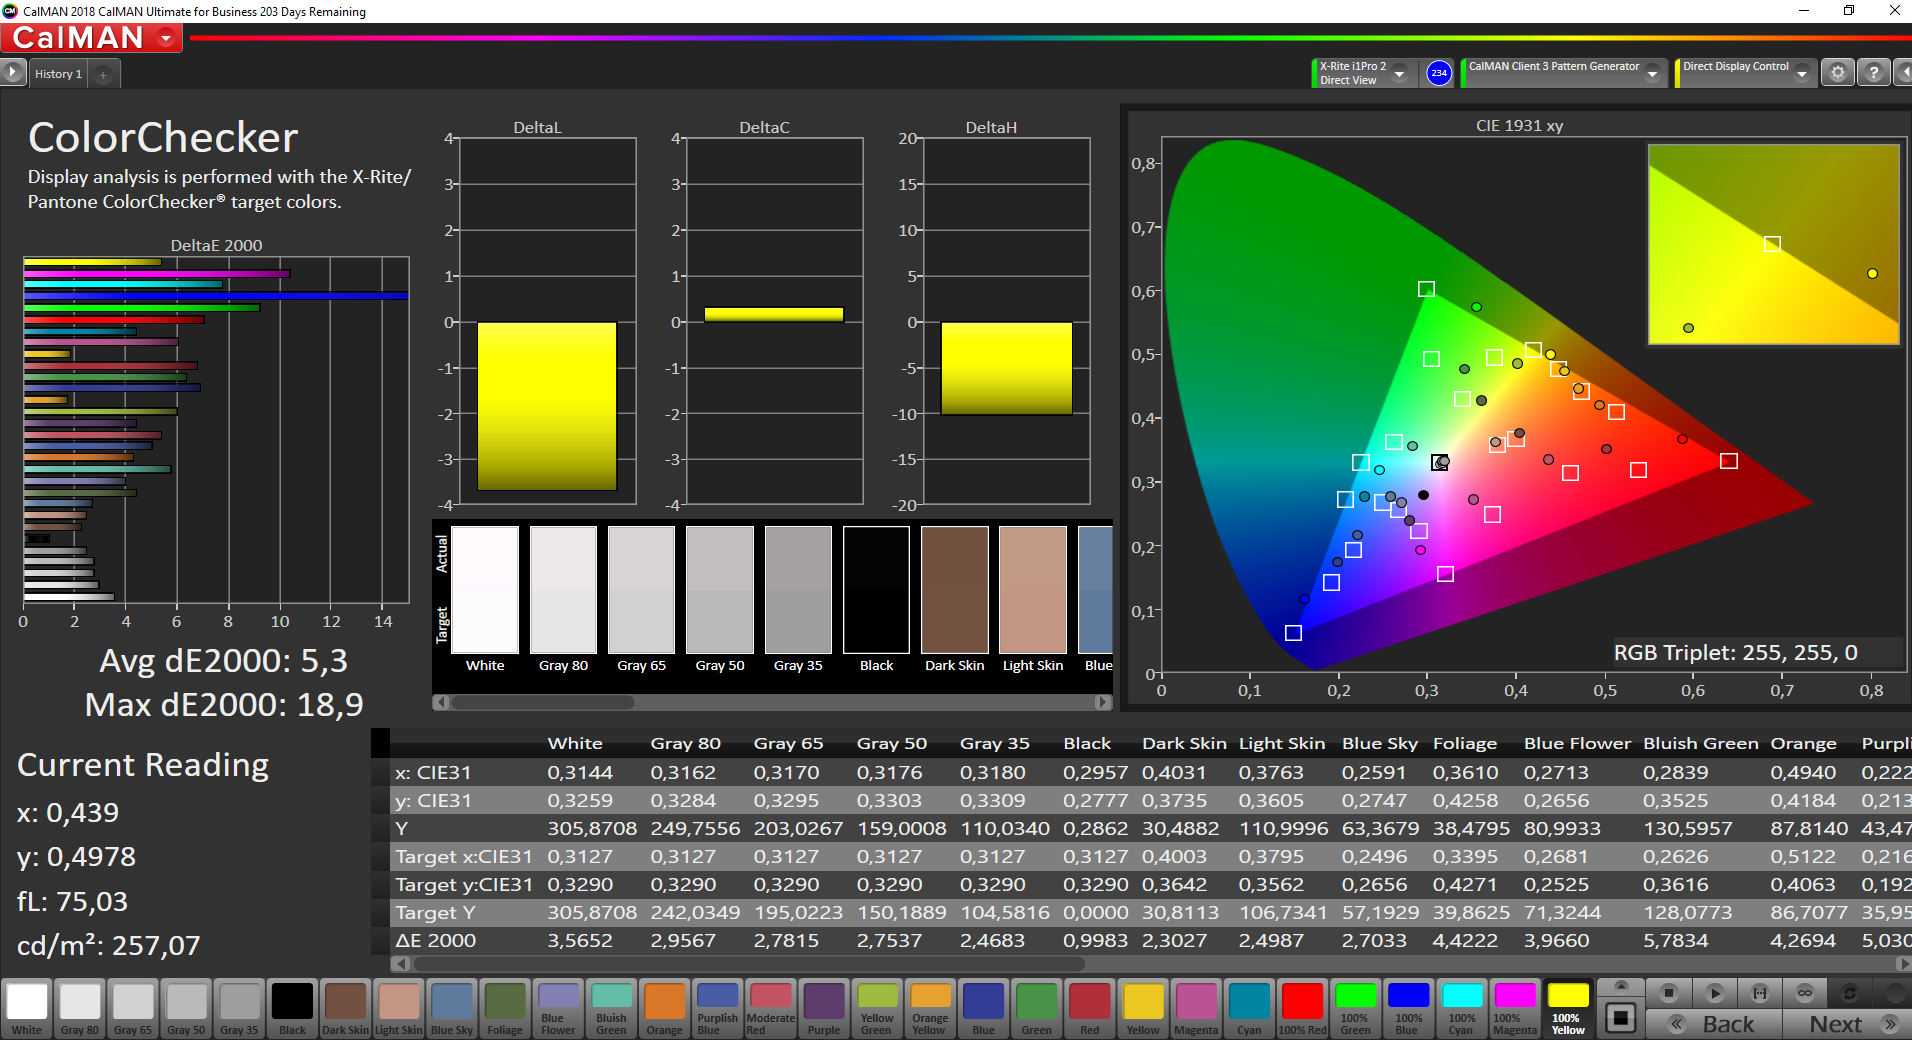
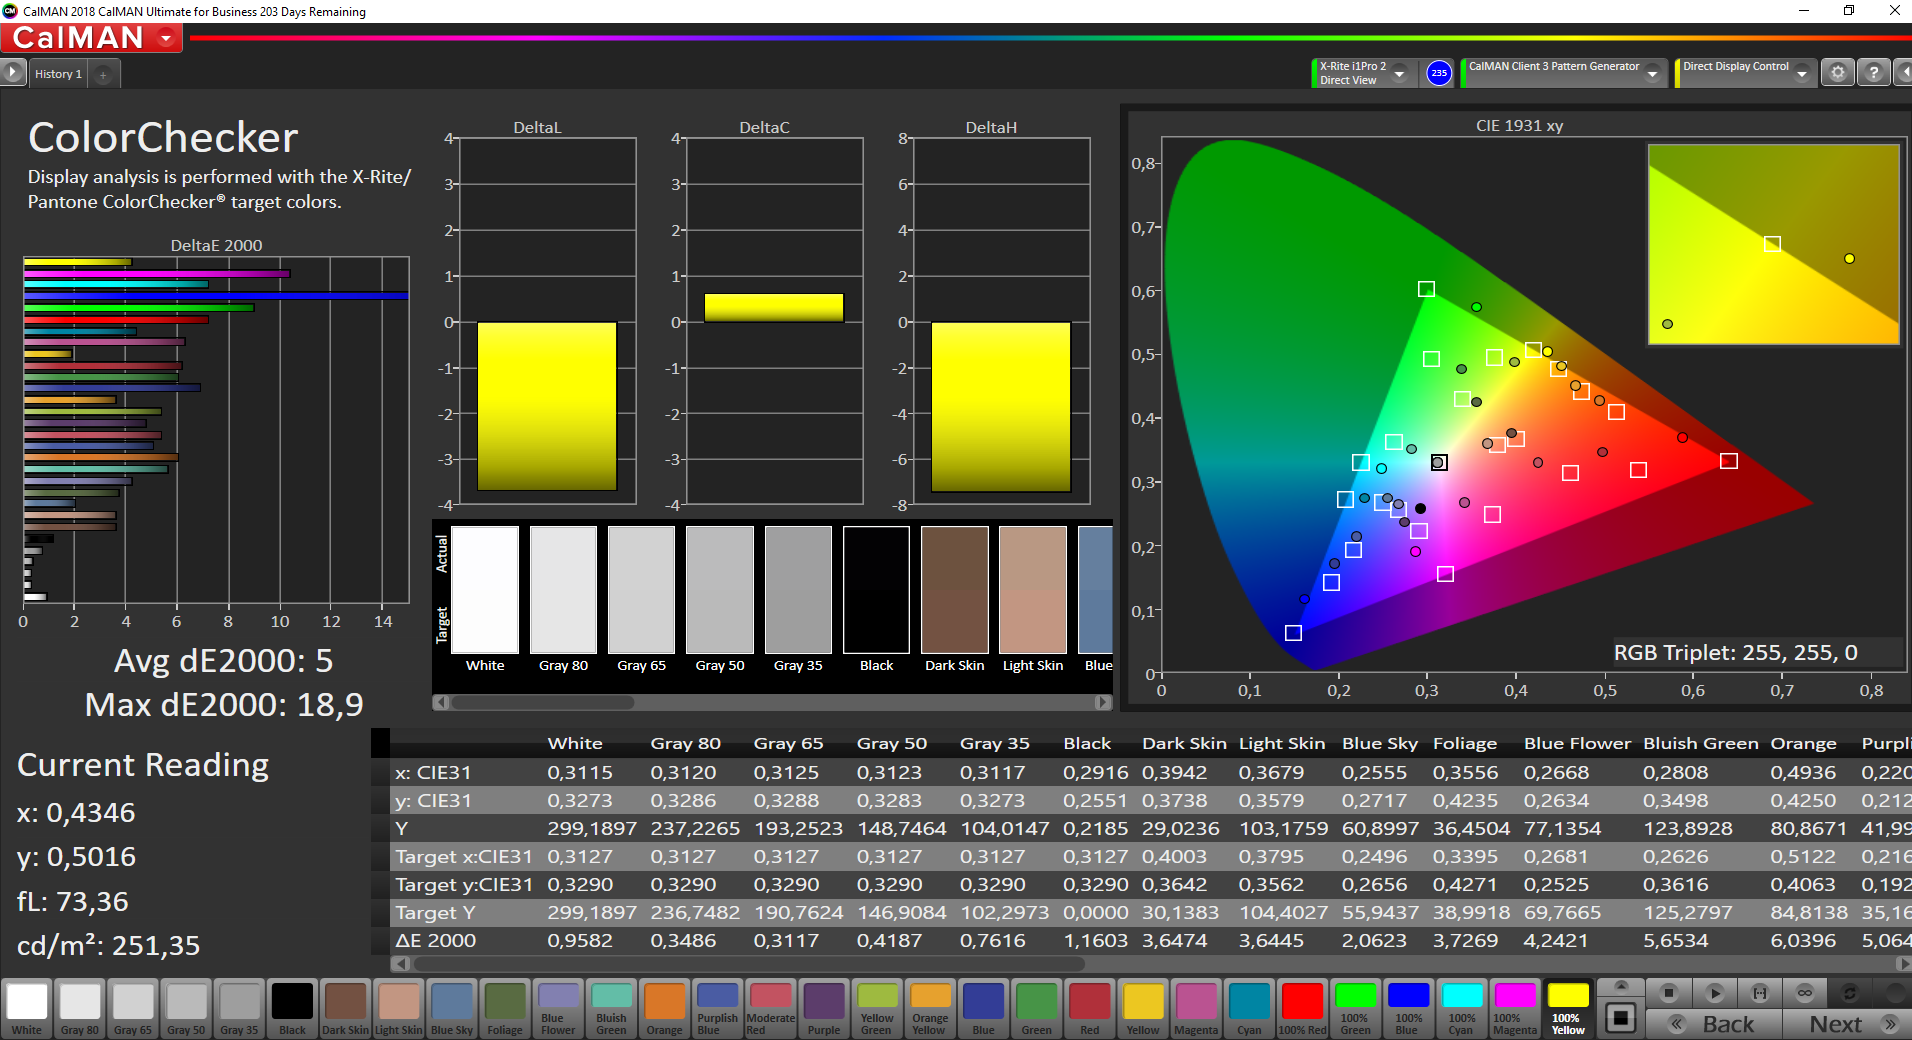
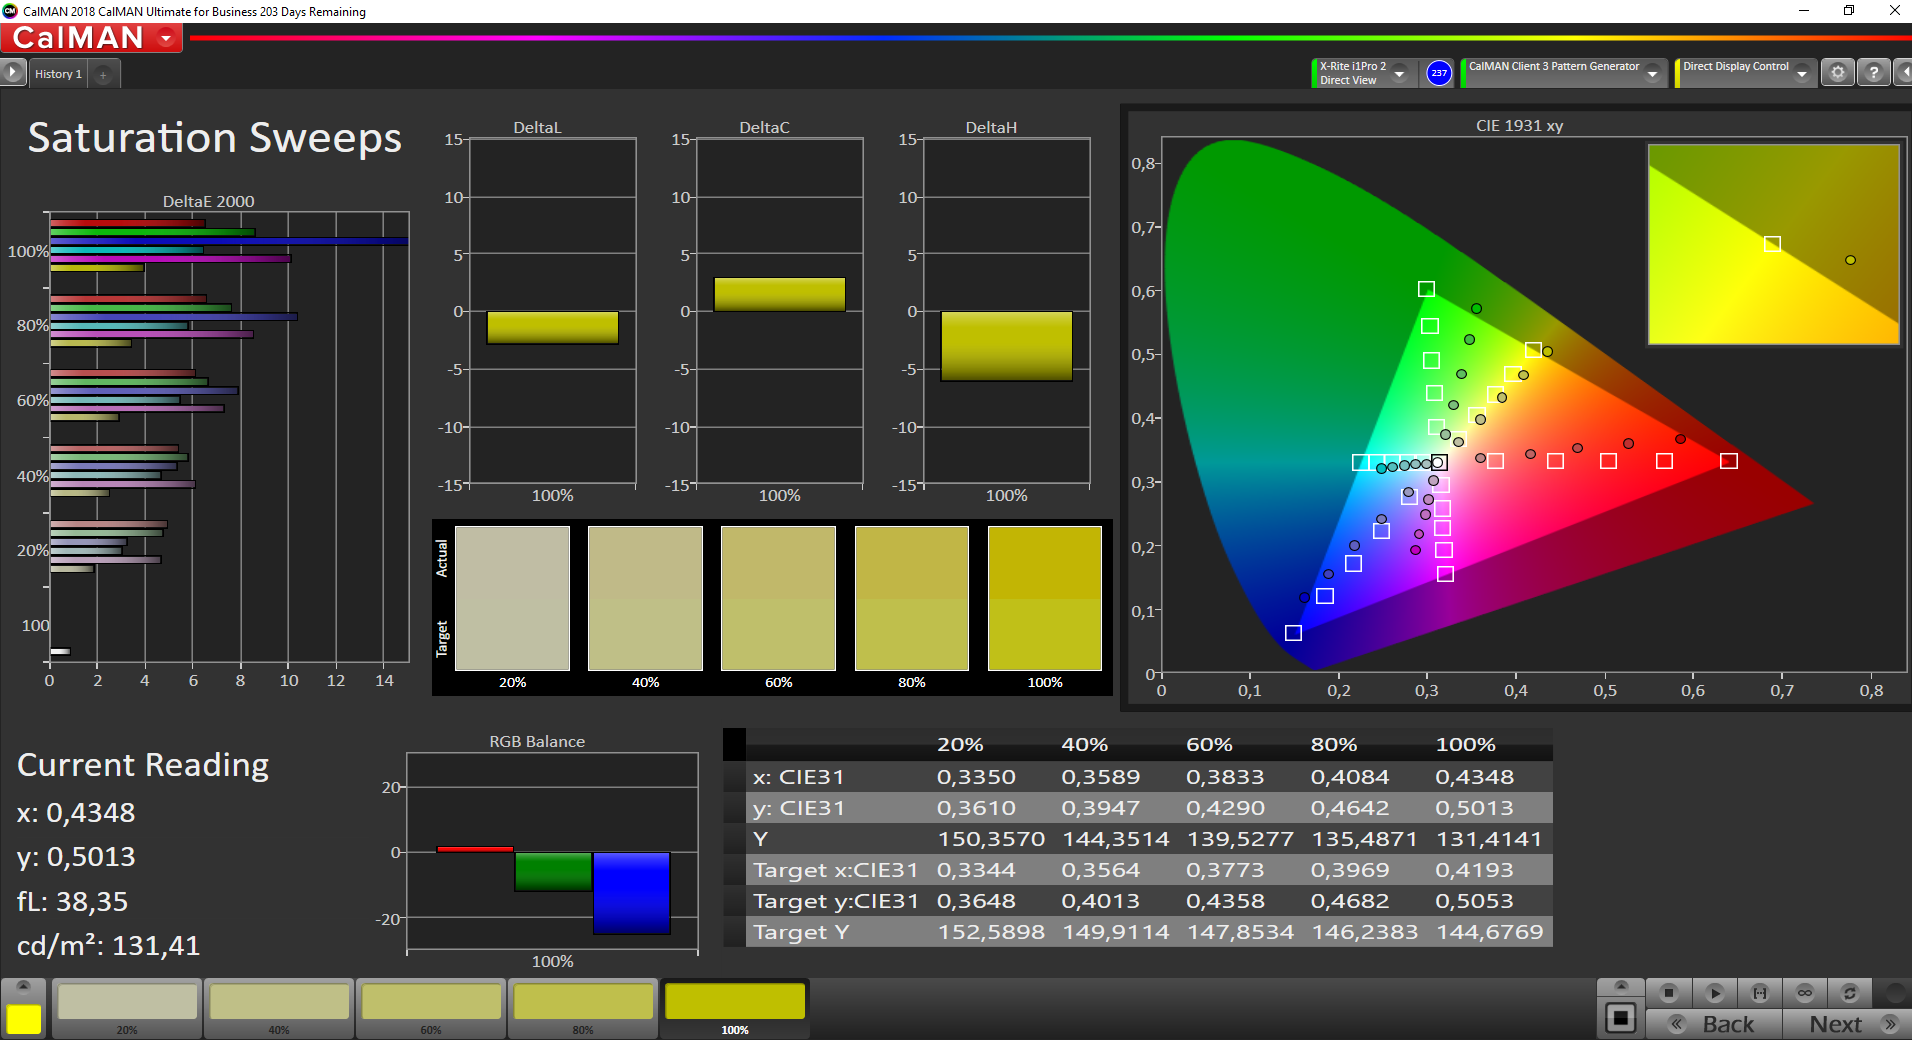
ΔE ColorChecker Calman: 5.3 | ∀{0.5-29.43 Ø4.71}
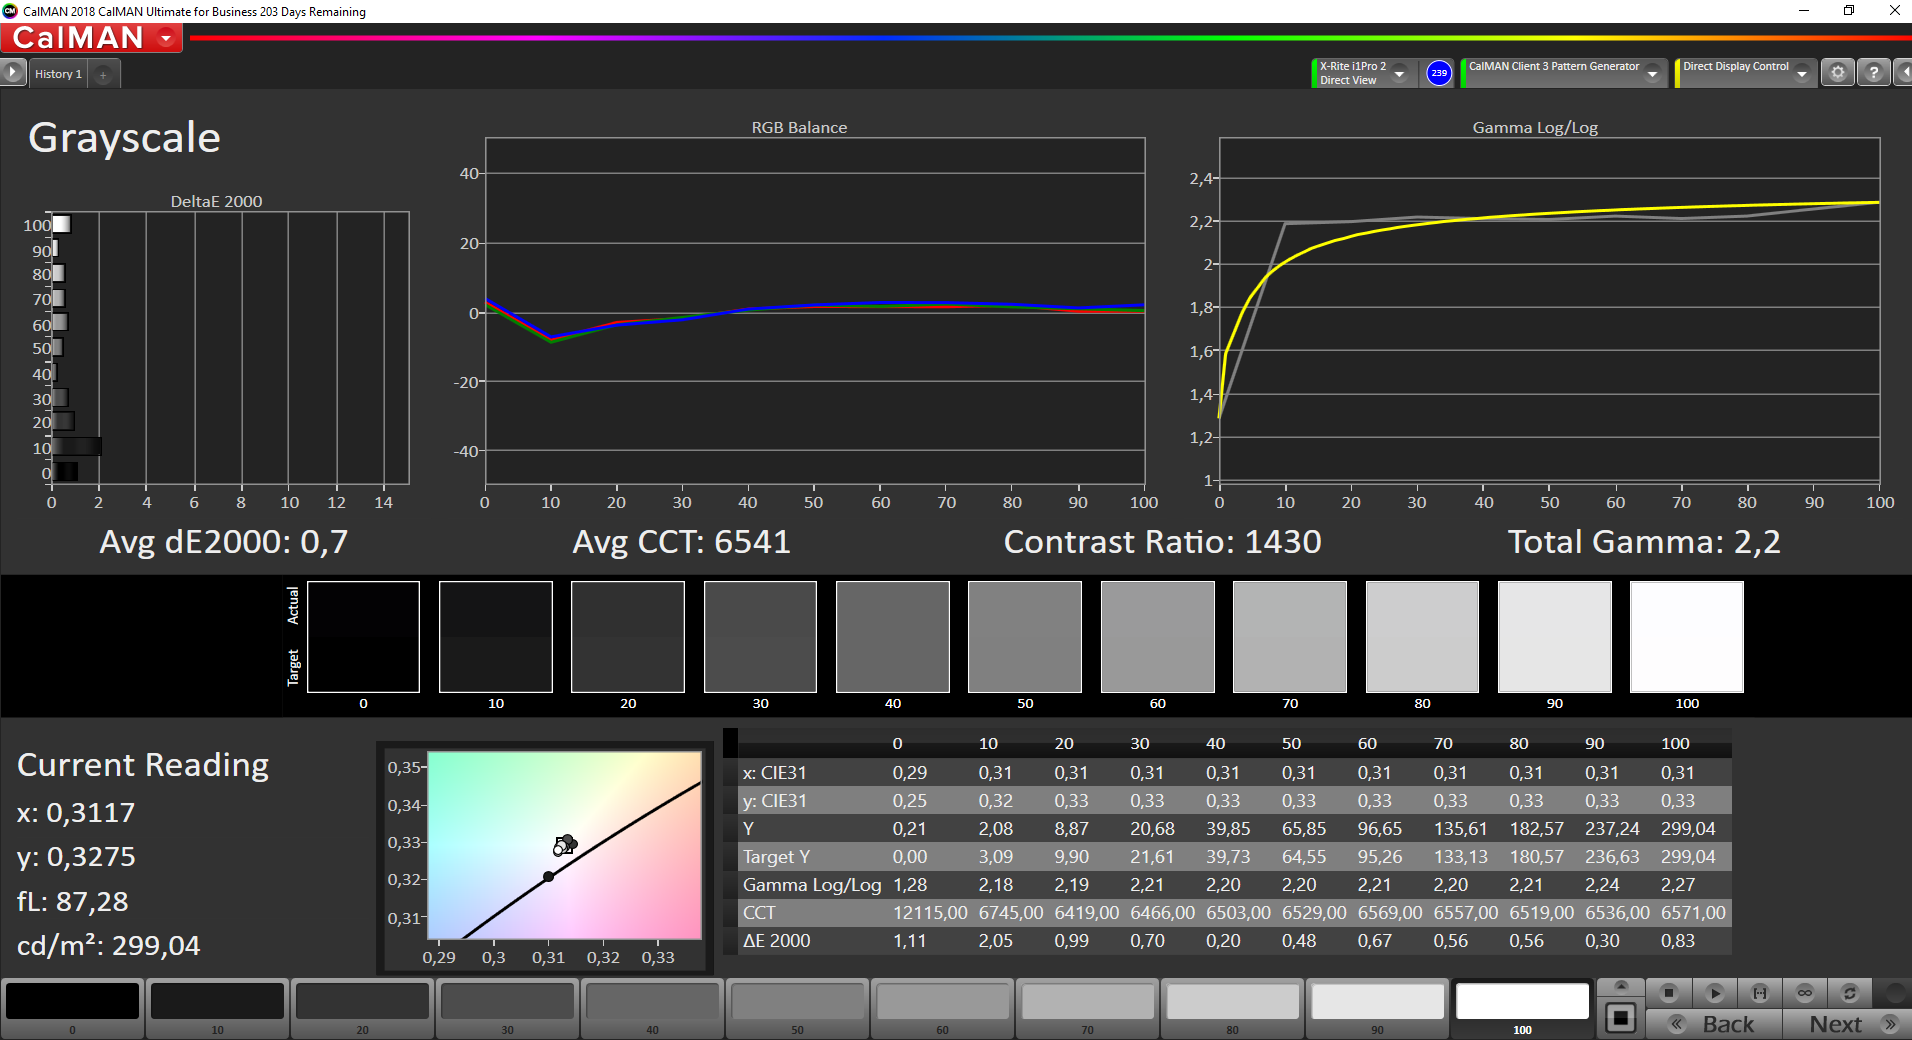
calibrated: 5
ΔE Greyscale Calman: 2.3 | ∀{0.09-98 Ø4.96}
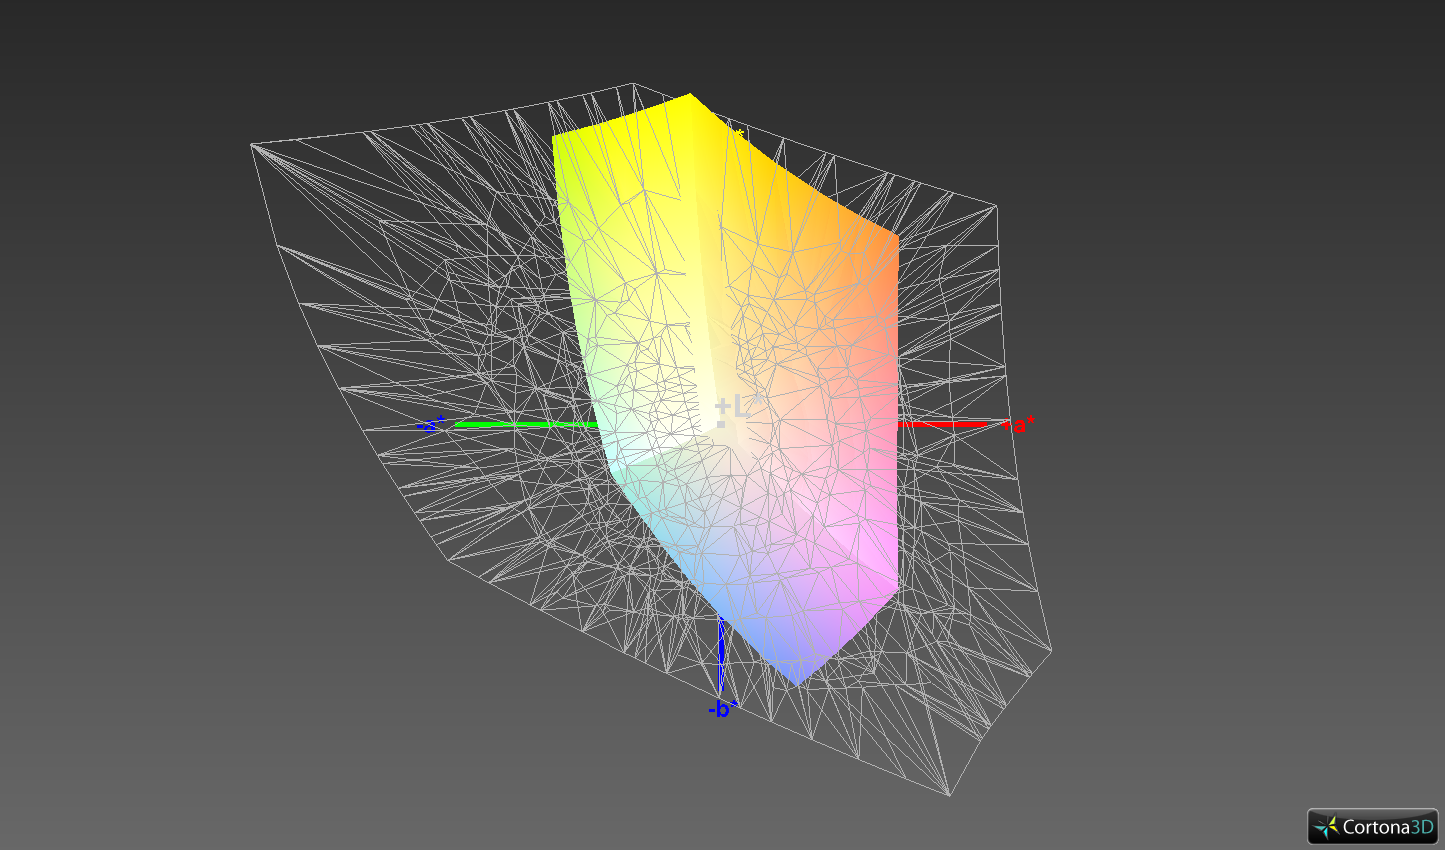
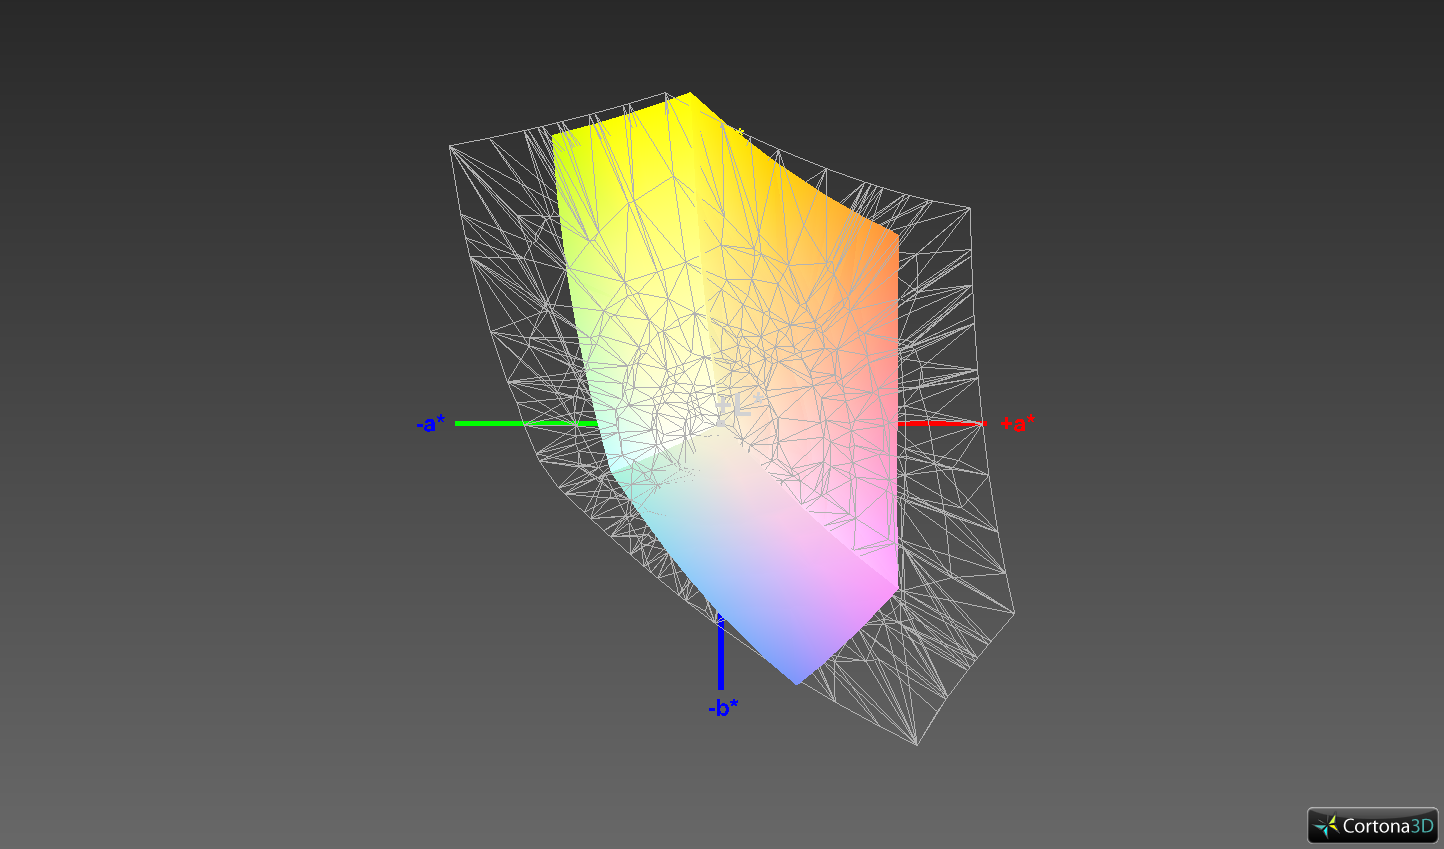
58.2% sRGB (Argyll 1.6.3 3D)
37.7% AdobeRGB 1998 (Argyll 1.6.3 3D)
41.18% AdobeRGB 1998 (Argyll 3D)
58.6% sRGB (Argyll 3D)
39.85% Display P3 (Argyll 3D)
Gamma: 2.09
CCT: 6246 K
| Lenovo ThinkPad E490-20N8000RGE IPS, 1920x1080, 14" | Lenovo ThinkPad E480-20KNCTO1WW IPS LED, 1920x1080, 14" | Lenovo ThinkPad E480-20KQS00000 IPS LED, 1920x1080, 14" | Lenovo ThinkPad E485-20KU000NGE IPS, 1920x1080, 14" | HP ProBook 440 G6-5TK01EA IPS, 1920x1080, 14" | HP ProBook 445 G6 IPS, 1920x1080, 14" | Dell Latitude 3490 IPS LED, 1920x1080, 14" | Acer TravelMate 2410-G2-MG-82E6 IPS, 1920x1080, 14" | |
|---|---|---|---|---|---|---|---|---|
| Display | 5% | 6% | -2% | -3% | 5% | 1% | 2% | |
| Display P3 Coverage (%) | 39.85 | 41.56 4% | 41.88 5% | 39.21 -2% 38.48 -3% | 38.08 -4% | 41.53 4% | 39.81 0% | 40.28 1% |
| sRGB Coverage (%) | 58.6 | 62.2 6% | 62.8 7% | 58.8 0% 57.9 -1% | 57.2 -2% | 62 6% | 59.6 2% | 60.4 3% |
| AdobeRGB 1998 Coverage (%) | 41.18 | 42.96 4% | 43.29 5% | 40.52 -2% 39.76 -3% | 39.37 -4% | 42.94 4% | 41.16 0% | 41.65 1% |
| Response Times | 13% | 14% | 10% | 22% | 25% | 31% | 34% | |
| Response Time Grey 50% / Grey 80% * (ms) | 48.4 ? | 44.8 ? 7% | 44 ? 9% | 44.8 ? 7% | 41.6 ? 14% | 40 ? 17% | 36.4 ? 25% | 34 ? 30% |
| Response Time Black / White * (ms) | 38.4 ? | 31.2 ? 19% | 31.2 ? 19% | 33.6 ? 12% | 27.2 ? 29% | 26 ? 32% | 24 ? 37% | 24 ? 37% |
| PWM Frequency (Hz) | 1250 ? | 25000 ? | 24880 ? | 208 ? | 25000 ? | |||
| Screen | -24% | -7% | -1% | -13% | -3% | -14% | -2% | |
| Brightness middle (cd/m²) | 305 | 262 -14% | 251 -18% | 289 -5% | 256 -16% | 200 -34% | 250 -18% | 265 -13% |
| Brightness (cd/m²) | 295 | 245 -17% | 231 -22% | 271 -8% | 238 -19% | 196 -34% | 241 -18% | 239 -19% |
| Brightness Distribution (%) | 90 | 83 -8% | 80 -11% | 87 -3% | 85 -6% | 67 -26% | 81 -10% | 85 -6% |
| Black Level * (cd/m²) | 0.23 | 0.19 17% | 0.19 17% | 0.19 17% | 0.23 -0% | 0.17 26% | 0.25 -9% | 0.37 -61% |
| Contrast (:1) | 1326 | 1379 4% | 1321 0% | 1521 15% | 1113 -16% | 1176 -11% | 1000 -25% | 716 -46% |
| Colorchecker dE 2000 * | 5.3 | 7 -32% | 5.1 4% | 5.6 -6% | 6.2 -17% | 4.26 20% | 5.5 -4% | 3.93 26% |
| Colorchecker dE 2000 max. * | 18.9 | 23.6 -25% | 10.6 44% | 20.8 -10% | 18.2 4% | 9.7 49% | 23.5 -24% | 8.79 53% |
| Colorchecker dE 2000 calibrated * | 5 | 4.7 6% | 5.2 -4% | 4.8 4% | 3.13 37% | |||
| Greyscale dE 2000 * | 2.3 | 6.4 -178% | 4.5 -96% | 2.7 -17% | 3.8 -65% | 3.15 -37% | 3.5 -52% | 2.29 -0% |
| Gamma | 2.09 105% | 2.14 103% | 2.18 101% | 1.96 112% | 2.5 88% | 2.31 95% | 2.27 97% | 2.33 94% |
| CCT | 6246 104% | 6065 107% | 6146 106% | 6506 100% | 6643 98% | 6882 94% | 7049 92% | 6951 94% |
| Color Space (Percent of AdobeRGB 1998) (%) | 37.7 | 39.5 5% | 39.8 6% | 37.2 -1% | 36.1 -4% | 40 6% | 37.9 1% | 38 1% |
| Color Space (Percent of sRGB) (%) | 58.2 | 61.9 6% | 62.5 7% | 58.5 1% | 56.9 -2% | 62 7% | 59.4 2% | 60 3% |
| Moyenne finale (programmes/paramètres) | -2% /
-13% | 4% /
-2% | 2% /
-0% | 2% /
-7% | 9% /
2% | 6% /
-6% | 11% /
3% |
* ... Moindre est la valeur, meilleures sont les performances
Temps de réponse de l'écran
| ↔ Temps de réponse noir à blanc | ||
|---|---|---|
| 38.4 ms ... hausse ↗ et chute ↘ combinées | ↗ 21.2 ms hausse | 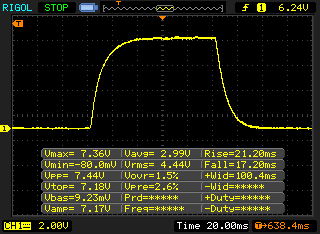 |
| ↘ 17.2 ms chute | ||
| L'écran souffre de latences très élevées, à éviter pour le jeu. En comparaison, tous les appareils testés affichent entre 0.1 (minimum) et 240 (maximum) ms. » 96 % des appareils testés affichent de meilleures performances. Cela signifie que les latences relevées sont moins bonnes que la moyenne (19.8 ms) de tous les appareils testés. | ||
| ↔ Temps de réponse gris 50% à gris 80% | ||
| 48.4 ms ... hausse ↗ et chute ↘ combinées | ↗ 25.2 ms hausse | 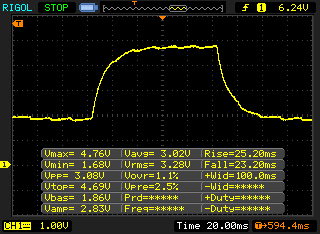 |
| ↘ 23.2 ms chute | ||
| L'écran souffre de latences très élevées, à éviter pour le jeu. En comparaison, tous les appareils testés affichent entre 0.165 (minimum) et 636 (maximum) ms. » 84 % des appareils testés affichent de meilleures performances. Cela signifie que les latences relevées sont moins bonnes que la moyenne (31 ms) de tous les appareils testés. | ||
Scintillement / MLI (Modulation de largeur d'impulsion)
| Scintillement / MLI (Modulation de largeur d'impulsion) décelé | 1250 Hz | ≤ 99 Niveau de luminosité | 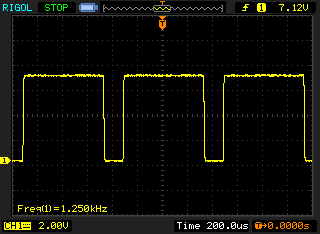 |
Le rétroéclairage de l'écran scintille à la fréquence de 1250 Hz (certainement du fait de l'utilisation d'une MDI - Modulation de largeur d'impulsion) à un niveau de luminosité inférieur ou égal à 99 % . Aucun scintillement ne devrait être perceptible au-dessus de cette valeur. La fréquence de rafraîchissement de 1250 Hz est élevée, la grande majorité des utilisateurs ne devrait pas percevoir de scintillements et être sujette à une fatigue oculaire accrue. En comparaison, 52 % des appareils testés n'emploient pas MDI pour assombrir leur écran. Nous avons relevé une moyenne à 7754 (minimum : 5 - maximum : 343500) Hz dans le cas où une MDI était active. | |||
| Geekbench 3 | |
| 32 Bit Multi-Core Score | |
| Moyenne Intel Core i5-8265U (12198 - 14499, n=6) | |
| Lenovo ThinkPad E490-20N8000RGE | |
| HP ProBook 445 G6 | |
| 32 Bit Single-Core Score | |
| Moyenne Intel Core i5-8265U (3470 - 3842, n=6) | |
| Lenovo ThinkPad E490-20N8000RGE | |
| HP ProBook 445 G6 | |
| Mozilla Kraken 1.1 - Total | |
| Lenovo ThinkPad E485-20KU000NGE (Edge 42.17134.1.0) | |
| HP ProBook 445 G6 (Edge 44) | |
| Lenovo ThinkPad E480-20KNCTO1WW (Edge 41.16299.15.0) | |
| Dell Latitude 14 5495 (Edge) | |
| Dell Latitude 3490 (Edge) | |
| Acer TravelMate 2410-G2-MG-82E6 | |
| Lenovo ThinkPad E490-20N8000RGE (Edge 44) | |
| Moyenne Intel Core i5-8265U (851 - 1245, n=25) | |
| Acer TravelMate X3410-M-866T (Microsoft Edge 44.17763.1.0) | |
| Acer TravelMate X3410-M-50DD (Edge) | |
| Lenovo ThinkPad E480-20KQS00000 (Edge) | |
| HP ProBook 440 G6-5TK01EA (EDGE: 42.17134.1.0) | |
| Moyenne de la classe Office (391 - 1297, n=78, 2 dernières années) | |
| Octane V2 - Total Score | |
| Moyenne de la classe Office (49011 - 126830, n=20, 2 dernières années) | |
| HP ProBook 440 G6-5TK01EA (EDGE: 42.17134.1.0) | |
| Lenovo ThinkPad E480-20KQS00000 (Edge) | |
| Lenovo ThinkPad E490-20N8000RGE (Edge 44) | |
| Moyenne Intel Core i5-8265U (12842 - 35563, n=23) | |
| Dell Latitude 3490 (Edge) | |
| Lenovo ThinkPad E480-20KNCTO1WW (Edge 41.16299.15.0) | |
| Dell Latitude 14 5495 (Edge) | |
| HP ProBook 445 G6 (Edge 44) | |
| Acer TravelMate X3410-M-50DD (Edge) | |
| Lenovo ThinkPad E485-20KU000NGE (Edge 42.17134.1.0) | |
| Acer TravelMate X3410-M-866T (Microsoft Edge 44.17763.1.0) | |
| Speedometer 2.0 - Result 2.0 | |
| Moyenne de la classe Office (173 - 640, n=18, 2 dernières années) | |
| Lenovo ThinkPad E490-20N8000RGE (Edge 44) | |
| Moyenne Intel Core i5-8265U (52.6 - 57.9, n=4) | |
| HP ProBook 445 G6 (Edge 44) | |
| Lenovo ThinkPad E485-20KU000NGE (Edge 42.17134.1.0) | |
| JetStream 1.1 - 1.1 Total | |
| HP ProBook 440 G6-5TK01EA (EDGE: 42.17134.1.0) | |
| Lenovo ThinkPad E480-20KQS00000 (Edge) | |
| Lenovo ThinkPad E490-20N8000RGE (Edge 44) | |
| Acer TravelMate X3410-M-866T (Microsoft Edge 44.17763.1.0) | |
| Dell Latitude 3490 (Edge) | |
| Acer TravelMate 2410-G2-MG-82E6 | |
| Moyenne Intel Core i5-8265U (193.7 - 244, n=19) | |
| Lenovo ThinkPad E480-20KNCTO1WW (Edge 41.16299.15.0) | |
| Acer TravelMate X3410-M-50DD (Edge) | |
* ... Moindre est la valeur, meilleures sont les performances
| PCMark 7 Score | 5926 points | |
| PCMark 8 Home Score Accelerated v2 | 3666 points | |
| PCMark 8 Creative Score Accelerated v2 | 4449 points | |
| PCMark 8 Work Score Accelerated v2 | 4637 points | |
| PCMark 10 Score | 3617 points | |
Aide | ||

| Lenovo ThinkPad E490-20N8000RGE SK hynix BC501 HFM256GDHTNG | Lenovo ThinkPad E480-20KNCTO1WW Toshiba KBG30ZMT128G | HP ProBook 440 G6-5TK01EA Toshiba XG5 KXG50ZNV512G | HP ProBook 445 G6 SK Hynix BC501 NVMe 256 GB | Dell Latitude 3490 SK hynix SC311 M.2 | Acer TravelMate 2410-G2-MG-82E6 SK Hynix HFS256G39TND-N210A | Lenovo ThinkPad E480-20KQS00000 Lenovo LENSE20256GMSP34MEAT2TA | Lenovo ThinkPad E485-20KU000NGE Samsung PM961 MZVLW256HEHP | Moyenne SK hynix BC501 HFM256GDHTNG | |
|---|---|---|---|---|---|---|---|---|---|
| CrystalDiskMark 5.2 / 6 | -49% | 19% | -4% | -41% | -53% | 13% | 15% | -3% | |
| Write 4K (MB/s) | 110.7 | 81.4 -26% | 117.6 6% | 110.4 0% | 71.7 -35% | 79.1 -29% | 120.3 9% | 72.2 -35% | 116.4 ? 5% |
| Read 4K (MB/s) | 41.02 | 33.74 -18% | 32.61 -21% | 39.46 -4% | 28.66 -30% | 23.41 -43% | 43.48 6% | 35.25 -14% | 40.1 ? -2% |
| Write Seq (MB/s) | 757 | 129 -83% | 527 -30% | 808 7% | 415.9 -45% | 259 -66% | 986 30% | 1412 87% | 773 ? 2% |
| Read Seq (MB/s) | 1037 | 905 -13% | 2181 110% | 1130 9% | 500 -52% | 474 -54% | 1395 35% | 1523 47% | 1099 ? 6% |
| Write 4K Q32T1 (MB/s) | 359 | 107.2 -70% | 508 42% | 260.8 -27% | 278 -23% | 80.3 -78% | 250 -30% | 102.1 -72% | 290 ? -19% |
| Read 4K Q32T1 (MB/s) | 402.4 | 197.1 -51% | 352.1 -12% | 308 -23% | 252.9 -37% | 331.7 -18% | 491.5 22% | 170.9 -58% | 342 ? -15% |
| Write Seq Q32T1 (MB/s) | 833 | 128.9 -85% | 526 -37% | 816 -2% | 502 -40% | 259.9 -69% | 1047 26% | 1429 72% | 818 ? -2% |
| Read Seq Q32T1 (MB/s) | 1635 | 906 -45% | 3135 92% | 1783 9% | 553 -66% | 548 -66% | 1781 9% | 3204 96% | 1648 ? 1% |
| 3DMark 06 Standard Score | 10006 points | |
| 3DMark 11 Performance | 1808 points | |
| 3DMark Ice Storm Standard Score | 55934 points | |
| 3DMark Cloud Gate Standard Score | 7662 points | |
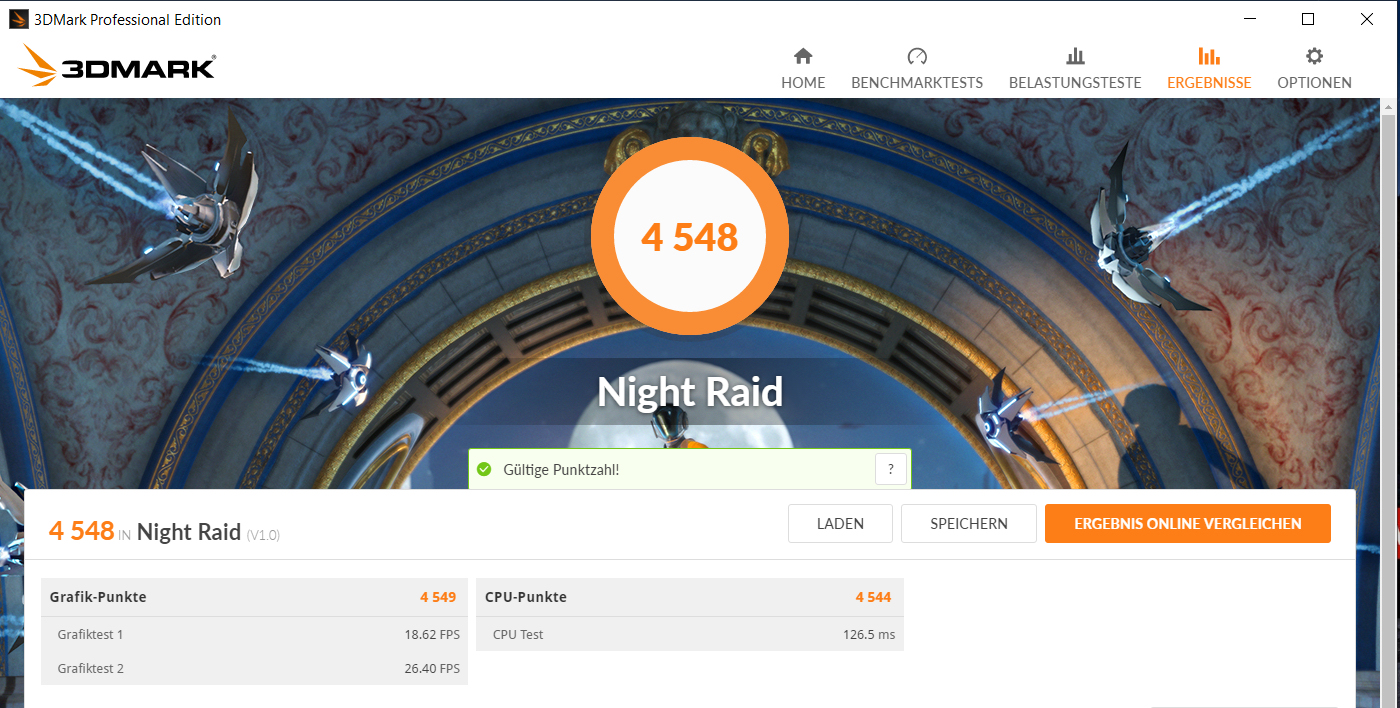
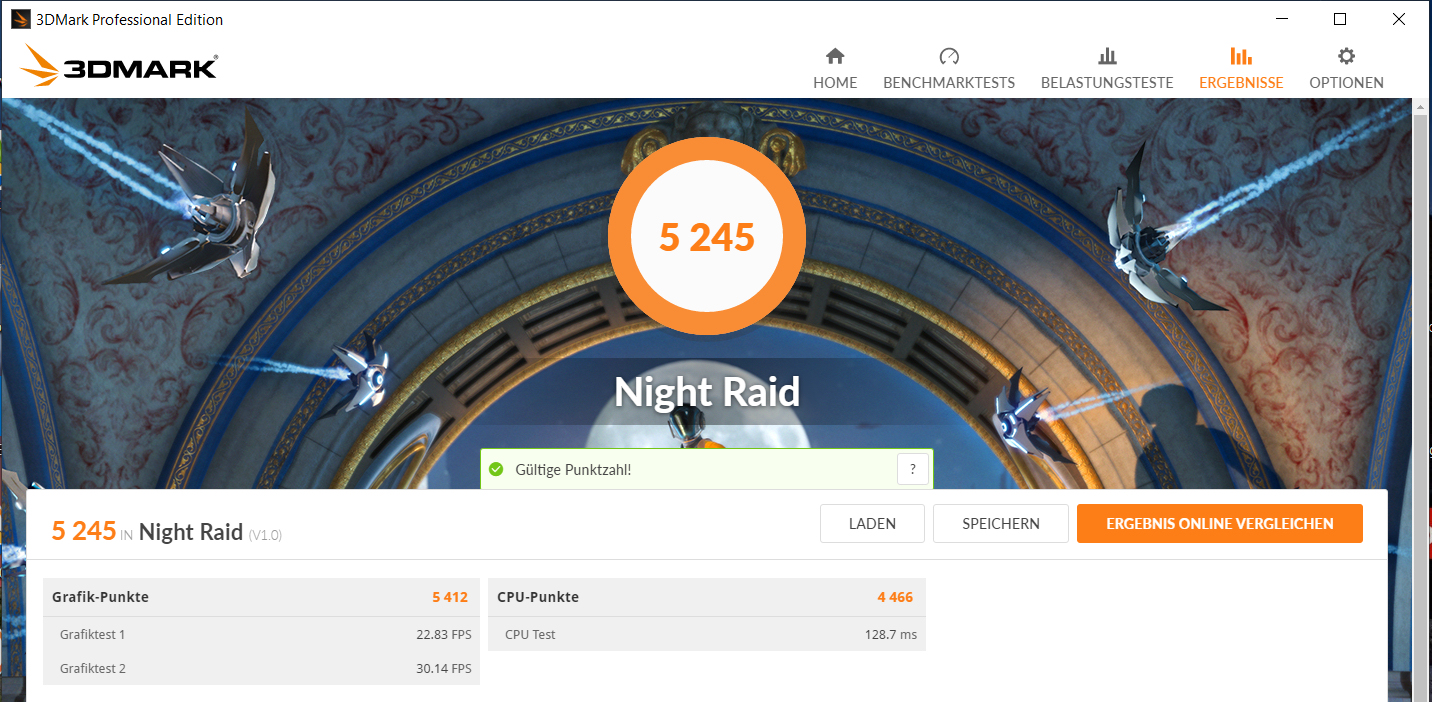
| 3DMark Fire Strike Score | 984 points | |
| 3DMark Time Spy Score | 399 points | |
Aide | ||
| Bas | Moyen | Élevé | Ultra | |
|---|---|---|---|---|
| BioShock Infinite (2013) | 53.1 | 29.3 | 24 | 7.8 |
| The Witcher 3 (2015) | 14.9 | 9.4 | 5.3 | 3 |
| Dota 2 Reborn (2015) | 60.5 | 38 | 18.4 | 16.4 |
| BioShock Infinite - 1280x720 Very Low Preset | |
| Lenovo ThinkPad E490-20N90004GE | |
| Lenovo ThinkPad E480-20KQS00000 | |
| Acer TravelMate X3410-M-50DD | |
| HP ProBook 445 G6 | |
| Dell Latitude 14 5495 | |
| Lenovo ThinkPad E485-20KU000NGE | |
| Lenovo ThinkPad E490-20N8000RGE (Dual-Channel) | |
| Moyenne Intel UHD Graphics 620 (18.3 - 90.2, n=187) | |
| HP ProBook 440 G6-5TK01EA | |
| Lenovo ThinkPad E490-20N8000RGE | |
| Dell Latitude 3490 | |
| Acer TravelMate X3410-M-866T | |
| Lenovo ThinkPad E480-20KNCTO1WW | |
| Dota 2 Reborn - 1280x720 min (0/3) fastest | |
| Moyenne de la classe Office (32.2 - 174.1, n=77, 2 dernières années) | |
| Lenovo ThinkPad E490-20N90004GE | |
| Lenovo ThinkPad E490-20N8000RGE (Dual-Channel) | |
| Moyenne Intel UHD Graphics 620 (42.4 - 90, n=92) | |
| HP ProBook 440 G6-5TK01EA | |
| Lenovo ThinkPad E490-20N8000RGE | |
Degré de la nuisance sonore
| Au repos |
| 29.4 / 29.4 / 29.4 dB(A) |
| Fortement sollicité |
| 30.2 / 30.9 dB(A) |
 | ||
30 dB silencieux 40 dB(A) audible 50 dB(A) bruyant |
||
min: | ||
| Lenovo ThinkPad E490-20N8000RGE i5-8265U, UHD Graphics 620 | Lenovo ThinkPad E480-20KNCTO1WW i5-8250U, UHD Graphics 620 | Lenovo ThinkPad E485-20KU000NGE R5 2500U, Vega 8 | Lenovo ThinkPad E490-20N90004GE i7-8565U, Radeon RX 550X (Laptop) | HP ProBook 440 G6-5TK01EA i7-8565U, UHD Graphics 620 | HP ProBook 445 G6 R5 2500U, Vega 8 | Dell Latitude 3490 i5-8250U, UHD Graphics 620 | Acer TravelMate 2410-G2-MG-82E6 i5-8550U, GeForce MX130 | Moyenne Intel UHD Graphics 620 | Moyenne de la classe Office | |
|---|---|---|---|---|---|---|---|---|---|---|
| Noise | -2% | -5% | -4% | -3% | -10% | -13% | -15% | -4% | 3% | |
| arrêt / environnement * (dB) | 29.4 | 29.1 1% | 29.4 -0% | 29.3 -0% | 29.4 -0% | 30.5 -4% | 29.8 -1% | 30.3 -3% | 29 ? 1% | 24.2 ? 18% |
| Idle Minimum * (dB) | 29.4 | 29.1 1% | 29.4 -0% | 29.3 -0% | 29.4 -0% | 30.5 -4% | 29.8 -1% | 30.8 -5% | 29.1 ? 1% | 24.3 ? 17% |
| Idle Average * (dB) | 29.4 | 29.1 1% | 29.4 -0% | 29.3 -0% | 29.4 -0% | 30.5 -4% | 29.8 -1% | 30.8 -5% | 29.1 ? 1% | 24.5 ? 17% |
| Idle Maximum * (dB) | 29.4 | 30.3 -3% | 31.2 -6% | 29.3 -0% | 30.2 -3% | 31.6 -7% | 29.8 -1% | 30.8 -5% | 29.7 ? -1% | 25.3 ? 14% |
| Load Average * (dB) | 30.2 | 31.8 -5% | 32.7 -8% | 34.2 -13% | 31.8 -5% | 36.7 -22% | 39.1 -29% | 42.7 -41% | 33.5 ? -11% | 34.3 ? -14% |
| Load Maximum * (dB) | 30.9 | 33.8 -9% | 35.3 -14% | 34.2 -11% | 33.1 -7% | 37 -20% | 44.3 -43% | 39.7 -28% | 36.1 ? -17% | 41.4 ? -34% |
| Witcher 3 ultra * (dB) | 34.2 |
* ... Moindre est la valeur, meilleures sont les performances
(+) La température maximale du côté supérieur est de 39.9 °C / 104 F, par rapport à la moyenne de 34.3 °C / 94 F, allant de 21.2 à 62.5 °C pour la classe Office.
(±) Le fond chauffe jusqu'à un maximum de 45 °C / 113 F, contre une moyenne de 36.8 °C / 98 F
(+) En utilisation inactive, la température moyenne du côté supérieur est de 24.2 °C / 76 F, par rapport à la moyenne du dispositif de 29.5 °C / 85 F.
(+) Les repose-poignets et le pavé tactile sont plus froids que la température de la peau avec un maximum de 26.8 °C / 80.2 F et sont donc froids au toucher.
(±) La température moyenne de la zone de l'appui-paume de dispositifs similaires était de 27.5 °C / 81.5 F (+0.7 °C / #1.3 F).
| Lenovo ThinkPad E490-20N8000RGE i5-8265U, UHD Graphics 620 | Lenovo ThinkPad E480-20KNCTO1WW i5-8250U, UHD Graphics 620 | Lenovo ThinkPad E485-20KU000NGE R5 2500U, Vega 8 | Lenovo ThinkPad E490-20N90004GE i7-8565U, Radeon RX 550X (Laptop) | HP ProBook 440 G6-5TK01EA i7-8565U, UHD Graphics 620 | HP ProBook 445 G6 R5 2500U, Vega 8 | Dell Latitude 3490 i5-8250U, UHD Graphics 620 | Acer TravelMate 2410-G2-MG-82E6 i5-8550U, GeForce MX130 | Moyenne Intel UHD Graphics 620 | Moyenne de la classe Office | |
|---|---|---|---|---|---|---|---|---|---|---|
| Heat | 8% | -11% | -22% | -2% | -8% | -2% | -10% | -4% | -4% | |
| Maximum Upper Side * (°C) | 39.9 | 36.7 8% | 42.3 -6% | 53.1 -33% | 38.3 4% | 36 10% | 46.6 -17% | 47.3 -19% | 41.1 ? -3% | 40.4 ? -1% |
| Maximum Bottom * (°C) | 45 | 42.8 5% | 45.2 -0% | 63.8 -42% | 50.5 -12% | 43 4% | 48.8 -8% | 47.8 -6% | 44.3 ? 2% | 42.5 ? 6% |
| Idle Upper Side * (°C) | 24.7 | 23.4 5% | 28.8 -17% | 25.4 -3% | 24.6 -0% | 29.6 -20% | 23.5 5% | 26.7 -8% | 26.8 ? -9% | 27.4 ? -11% |
| Idle Bottom * (°C) | 25.8 | 22.8 12% | 30.7 -19% | 28.1 -9% | 25.4 2% | 31.9 -24% | 22.9 11% | 27.8 -8% | 27.7 ? -7% | 28.5 ? -10% |
* ... Moindre est la valeur, meilleures sont les performances
| Éteint/en veille | |
| Au repos | |
| Fortement sollicité |
|
Légende:
min: | |
| Lenovo ThinkPad E490-20N8000RGE i5-8265U, UHD Graphics 620 | Lenovo ThinkPad E480-20KNCTO1WW i5-8250U, UHD Graphics 620 | Lenovo ThinkPad E485-20KU000NGE R5 2500U, Vega 8 | Lenovo ThinkPad E490-20N90004GE i7-8565U, Radeon RX 550X (Laptop) | HP ProBook 440 G6-5TK01EA i7-8565U, UHD Graphics 620 | HP ProBook 445 G6 R5 2500U, Vega 8 | Dell Latitude 3490 i5-8250U, UHD Graphics 620 | Acer TravelMate 2410-G2-MG-82E6 i5-8550U, GeForce MX130 | Moyenne Intel UHD Graphics 620 | Moyenne de la classe Office | |
|---|---|---|---|---|---|---|---|---|---|---|
| Power Consumption | -2% | -51% | -88% | -8% | -31% | -26% | -37% | -24% | -42% | |
| Idle Minimum * (Watt) | 2.76 | 3.5 -27% | 6.2 -125% | 6.8 -146% | 2.98 -8% | 4.8 -74% | 3.2 -16% | 3.5 -27% | 3.81 ? -38% | 4.26 ? -54% |
| Idle Average * (Watt) | 5.96 | 5.3 11% | 8.6 -44% | 9.4 -58% | 5.4 9% | 6.9 -16% | 5.5 8% | 5.9 1% | 6.94 ? -16% | 7.31 ? -23% |
| Idle Maximum * (Watt) | 6.57 | 6.1 7% | 9.7 -48% | 12.4 -89% | 7.9 -20% | 9.8 -49% | 8.1 -23% | 8.2 -25% | 8.75 ? -33% | 8.55 ? -30% |
| Load Average * (Watt) | 28.2 | 30 -6% | 37.4 -33% | 57.2 -103% | 34.5 -22% | 35 -24% | 40.8 -45% | 57.3 -103% | 35 ? -24% | 43.8 ? -55% |
| Load Maximum * (Watt) | 43.6 | 42.3 3% | 44.8 -3% | 63.1 -45% | 43.3 1% | 39.7 9% | 68.1 -56% | 57.9 -33% | 47.5 ? -9% | 64.5 ? -48% |
* ... Moindre est la valeur, meilleures sont les performances
| Lenovo ThinkPad E490-20N8000RGE i5-8265U, UHD Graphics 620, 45 Wh | Lenovo ThinkPad E480-20KNCTO1WW i5-8250U, UHD Graphics 620, 45 Wh | Lenovo ThinkPad E490-20N90004GE i7-8565U, Radeon RX 550X (Laptop), 45 Wh | Lenovo ThinkPad E485-20KU000NGE R5 2500U, Vega 8, 45 Wh | HP ProBook 440 G6-5TK01EA i7-8565U, UHD Graphics 620, 45 Wh | HP ProBook 445 G6 R5 2500U, Vega 8, 45 Wh | Dell Latitude 3490 i5-8250U, UHD Graphics 620, 56 Wh | Acer TravelMate 2410-G2-MG-82E6 i5-8550U, GeForce MX130, 48 Wh | Moyenne de la classe Office | |
|---|---|---|---|---|---|---|---|---|---|
| Autonomie de la batterie | -10% | -19% | -44% | -2% | -37% | 43% | -12% | 32% | |
| Reader / Idle (h) | 17.7 | 18.4 4% | 14.4 -19% | 9.1 -49% | 17.1 -3% | 10.4 -41% | 24.5 ? 38% | ||
| H.264 (h) | 11.5 | 7.2 -37% | 8.2 -29% | 5.7 -50% | 7.6 -34% | 4.8 -58% | 8.9 -23% | 15.5 ? 35% | |
| WiFi v1.3 (h) | 8.1 | 8.3 2% | 7 -14% | 5.4 -33% | 8.4 4% | 5.9 -27% | 11.6 43% | 7.4 -9% | 13.2 ? 63% |
| Load (h) | 2 | 1.8 -10% | 1.7 -15% | 1.1 -45% | 2.5 25% | 1.6 -20% | 1.9 -5% | 1.808 ? -10% |
Points positifs
Points négatifs
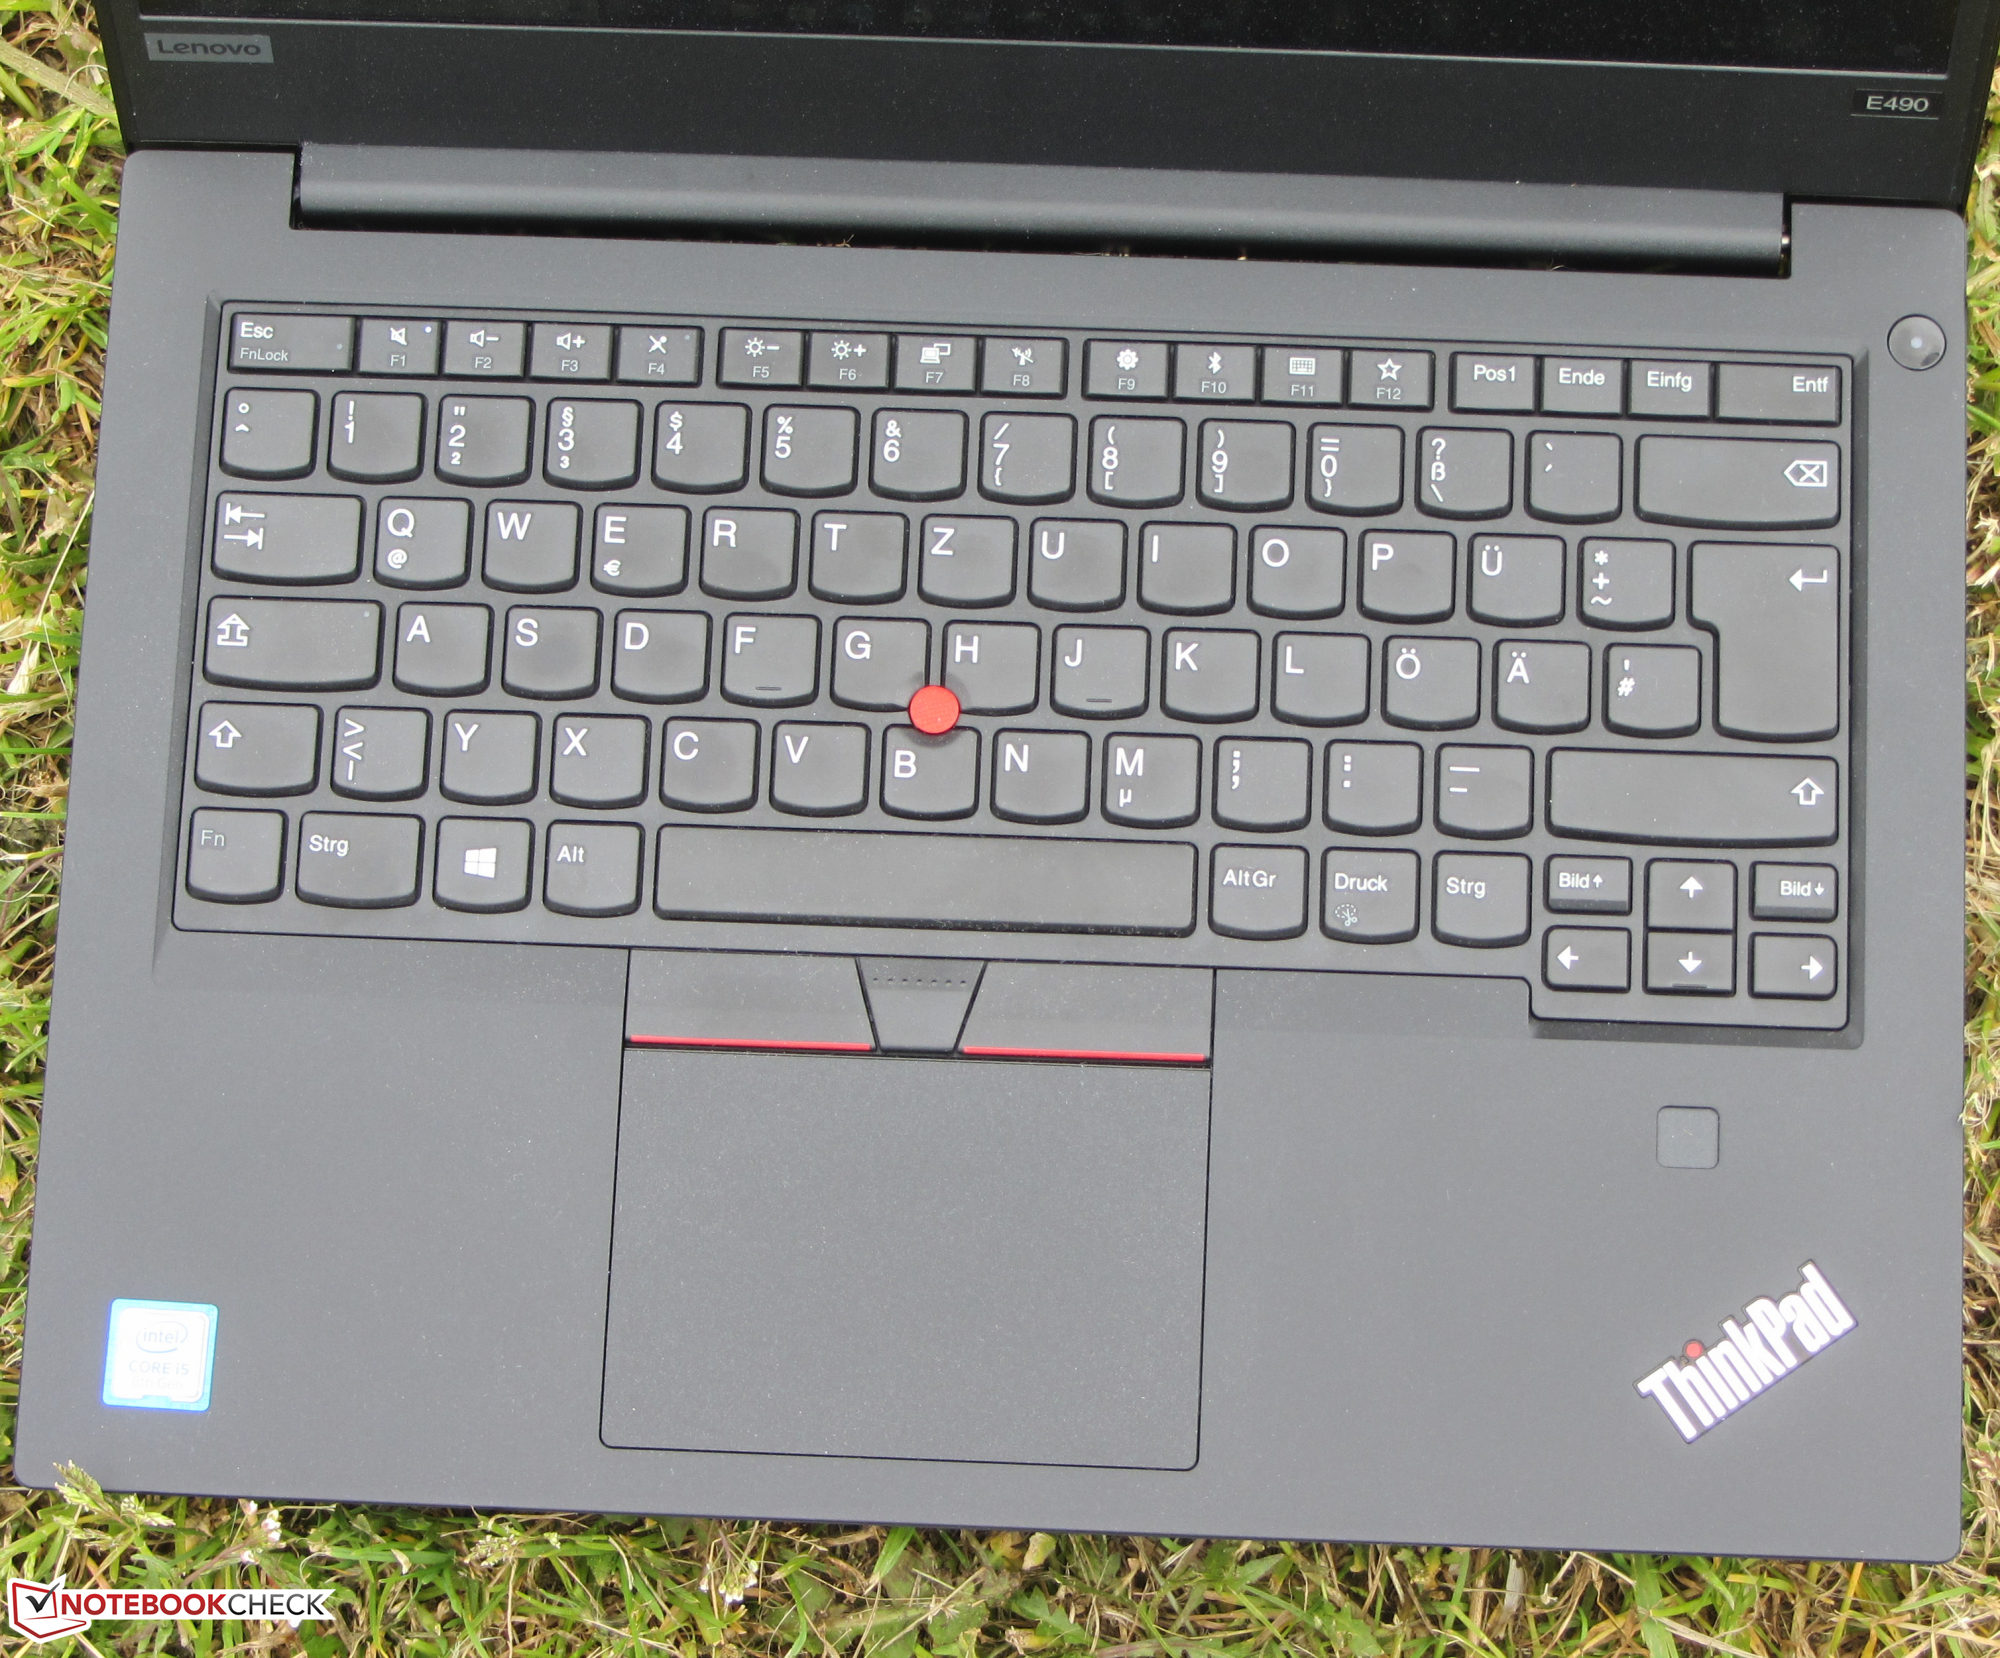
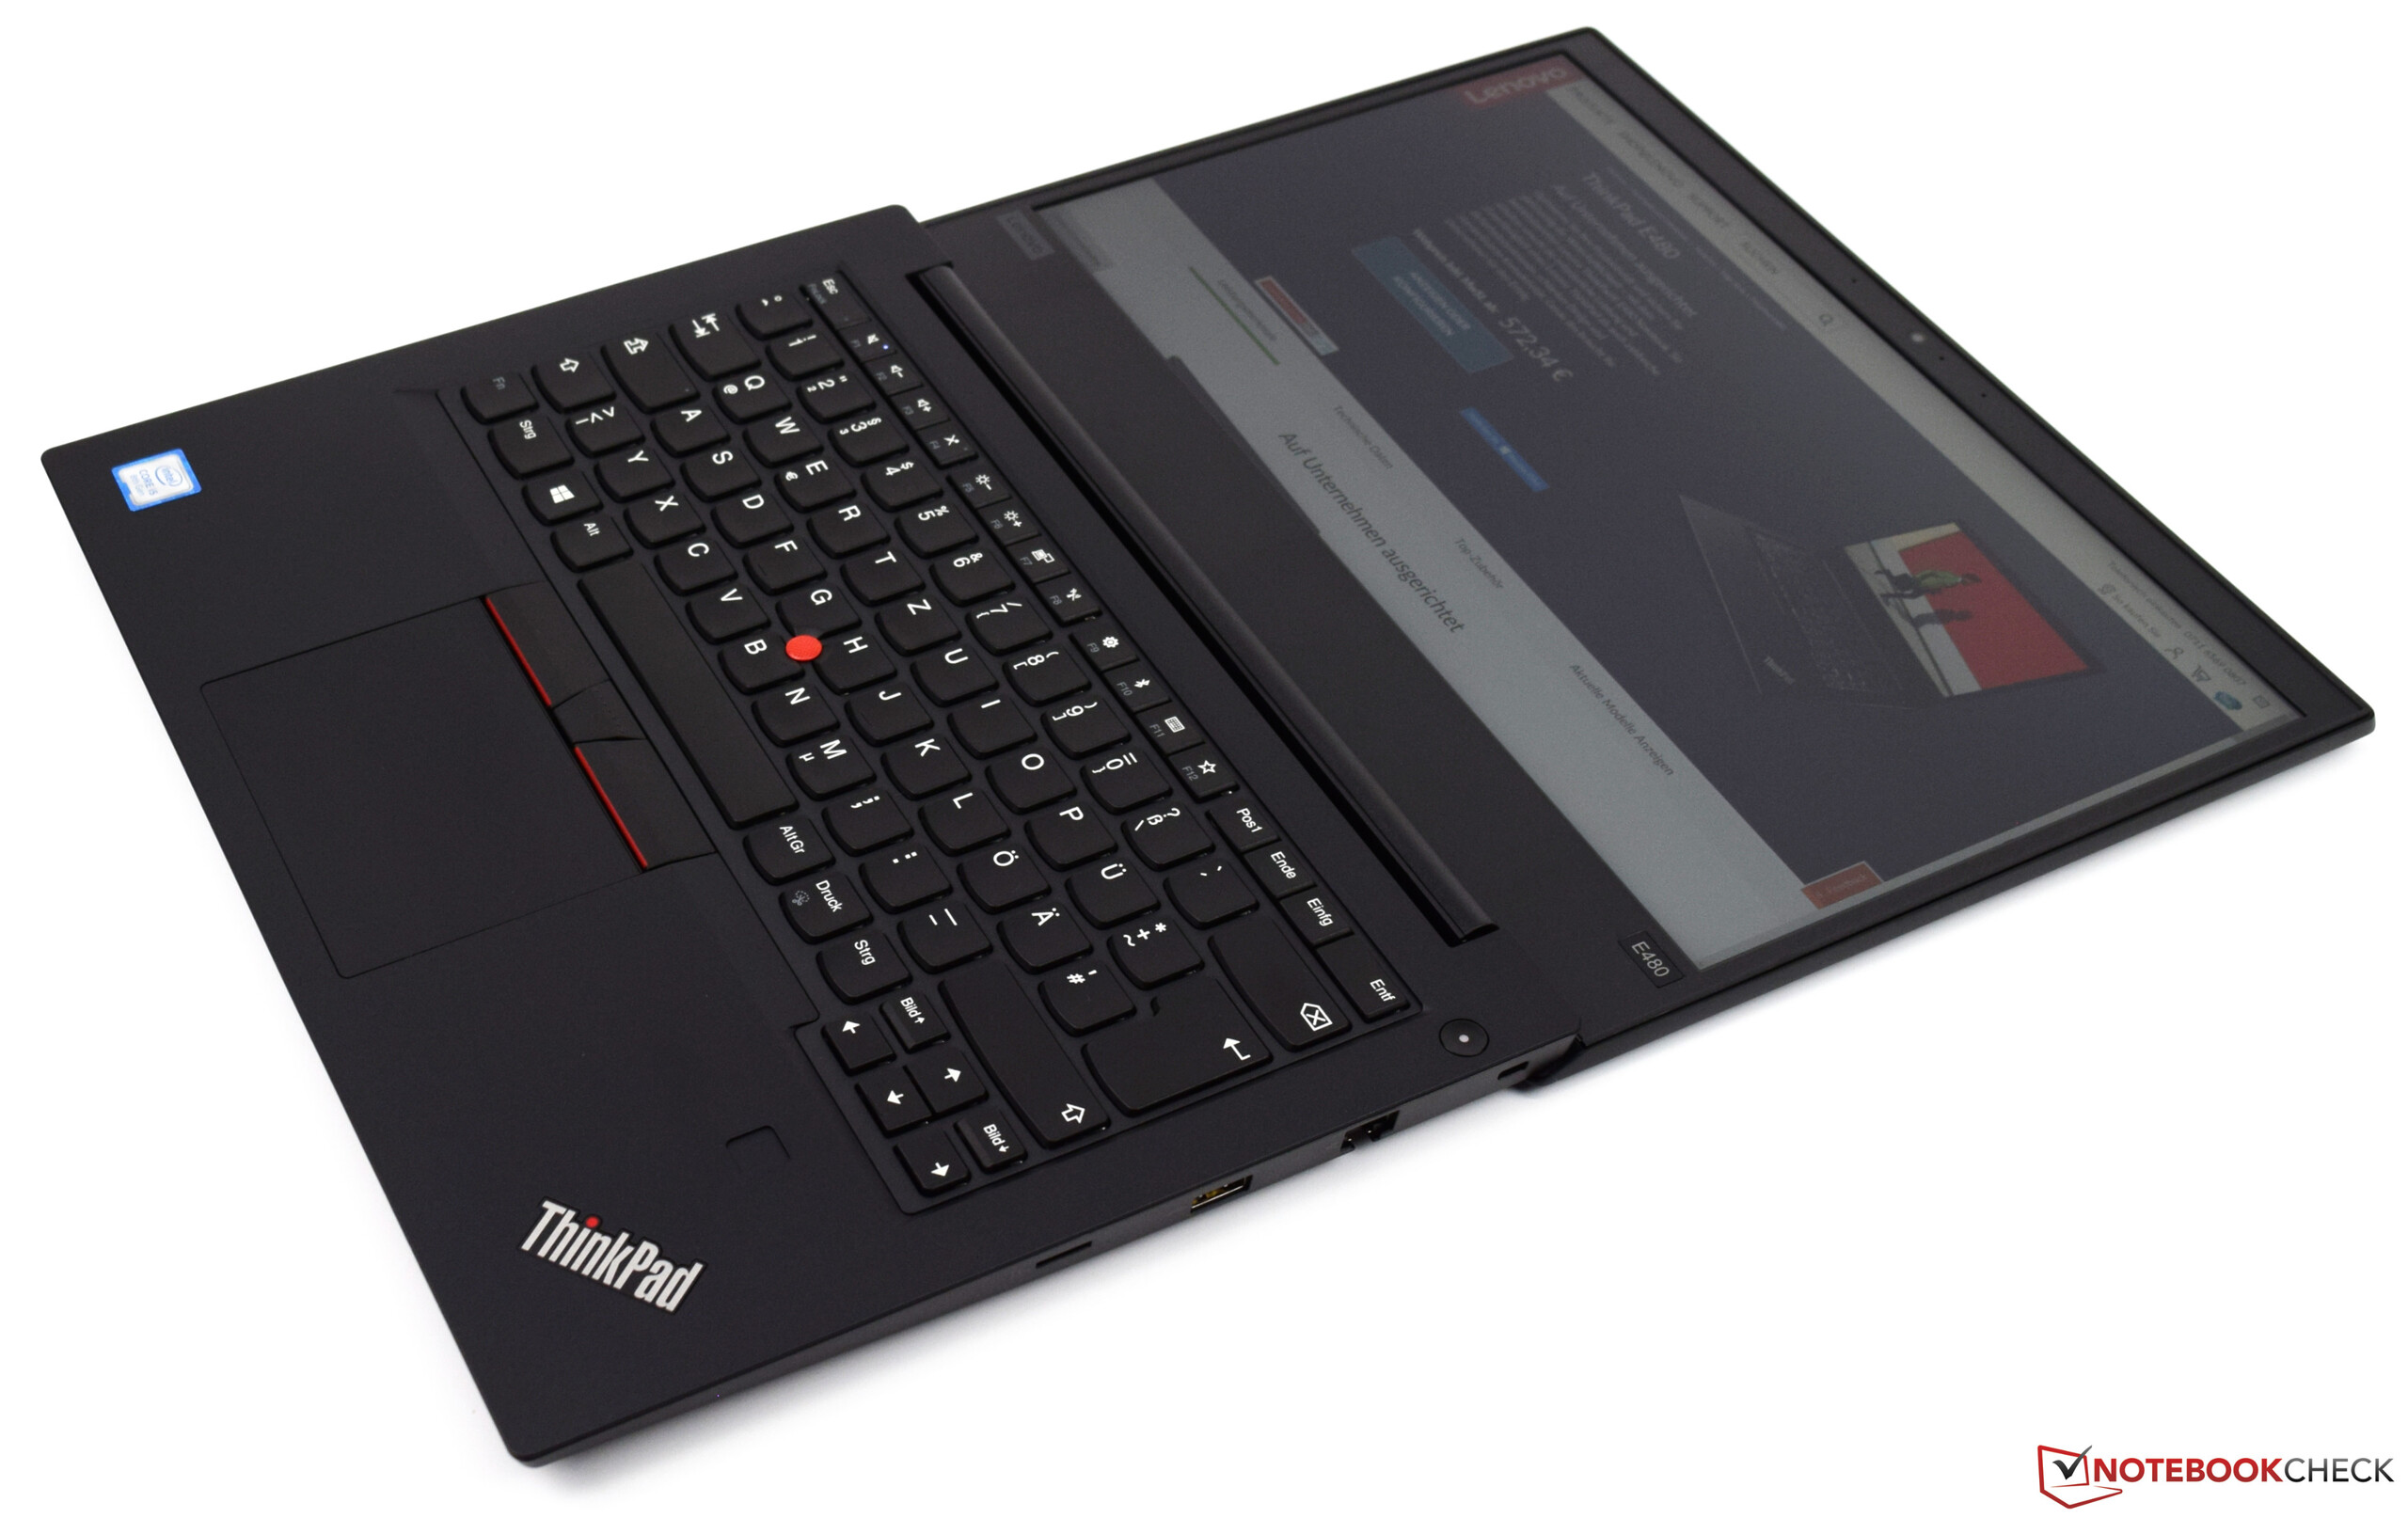
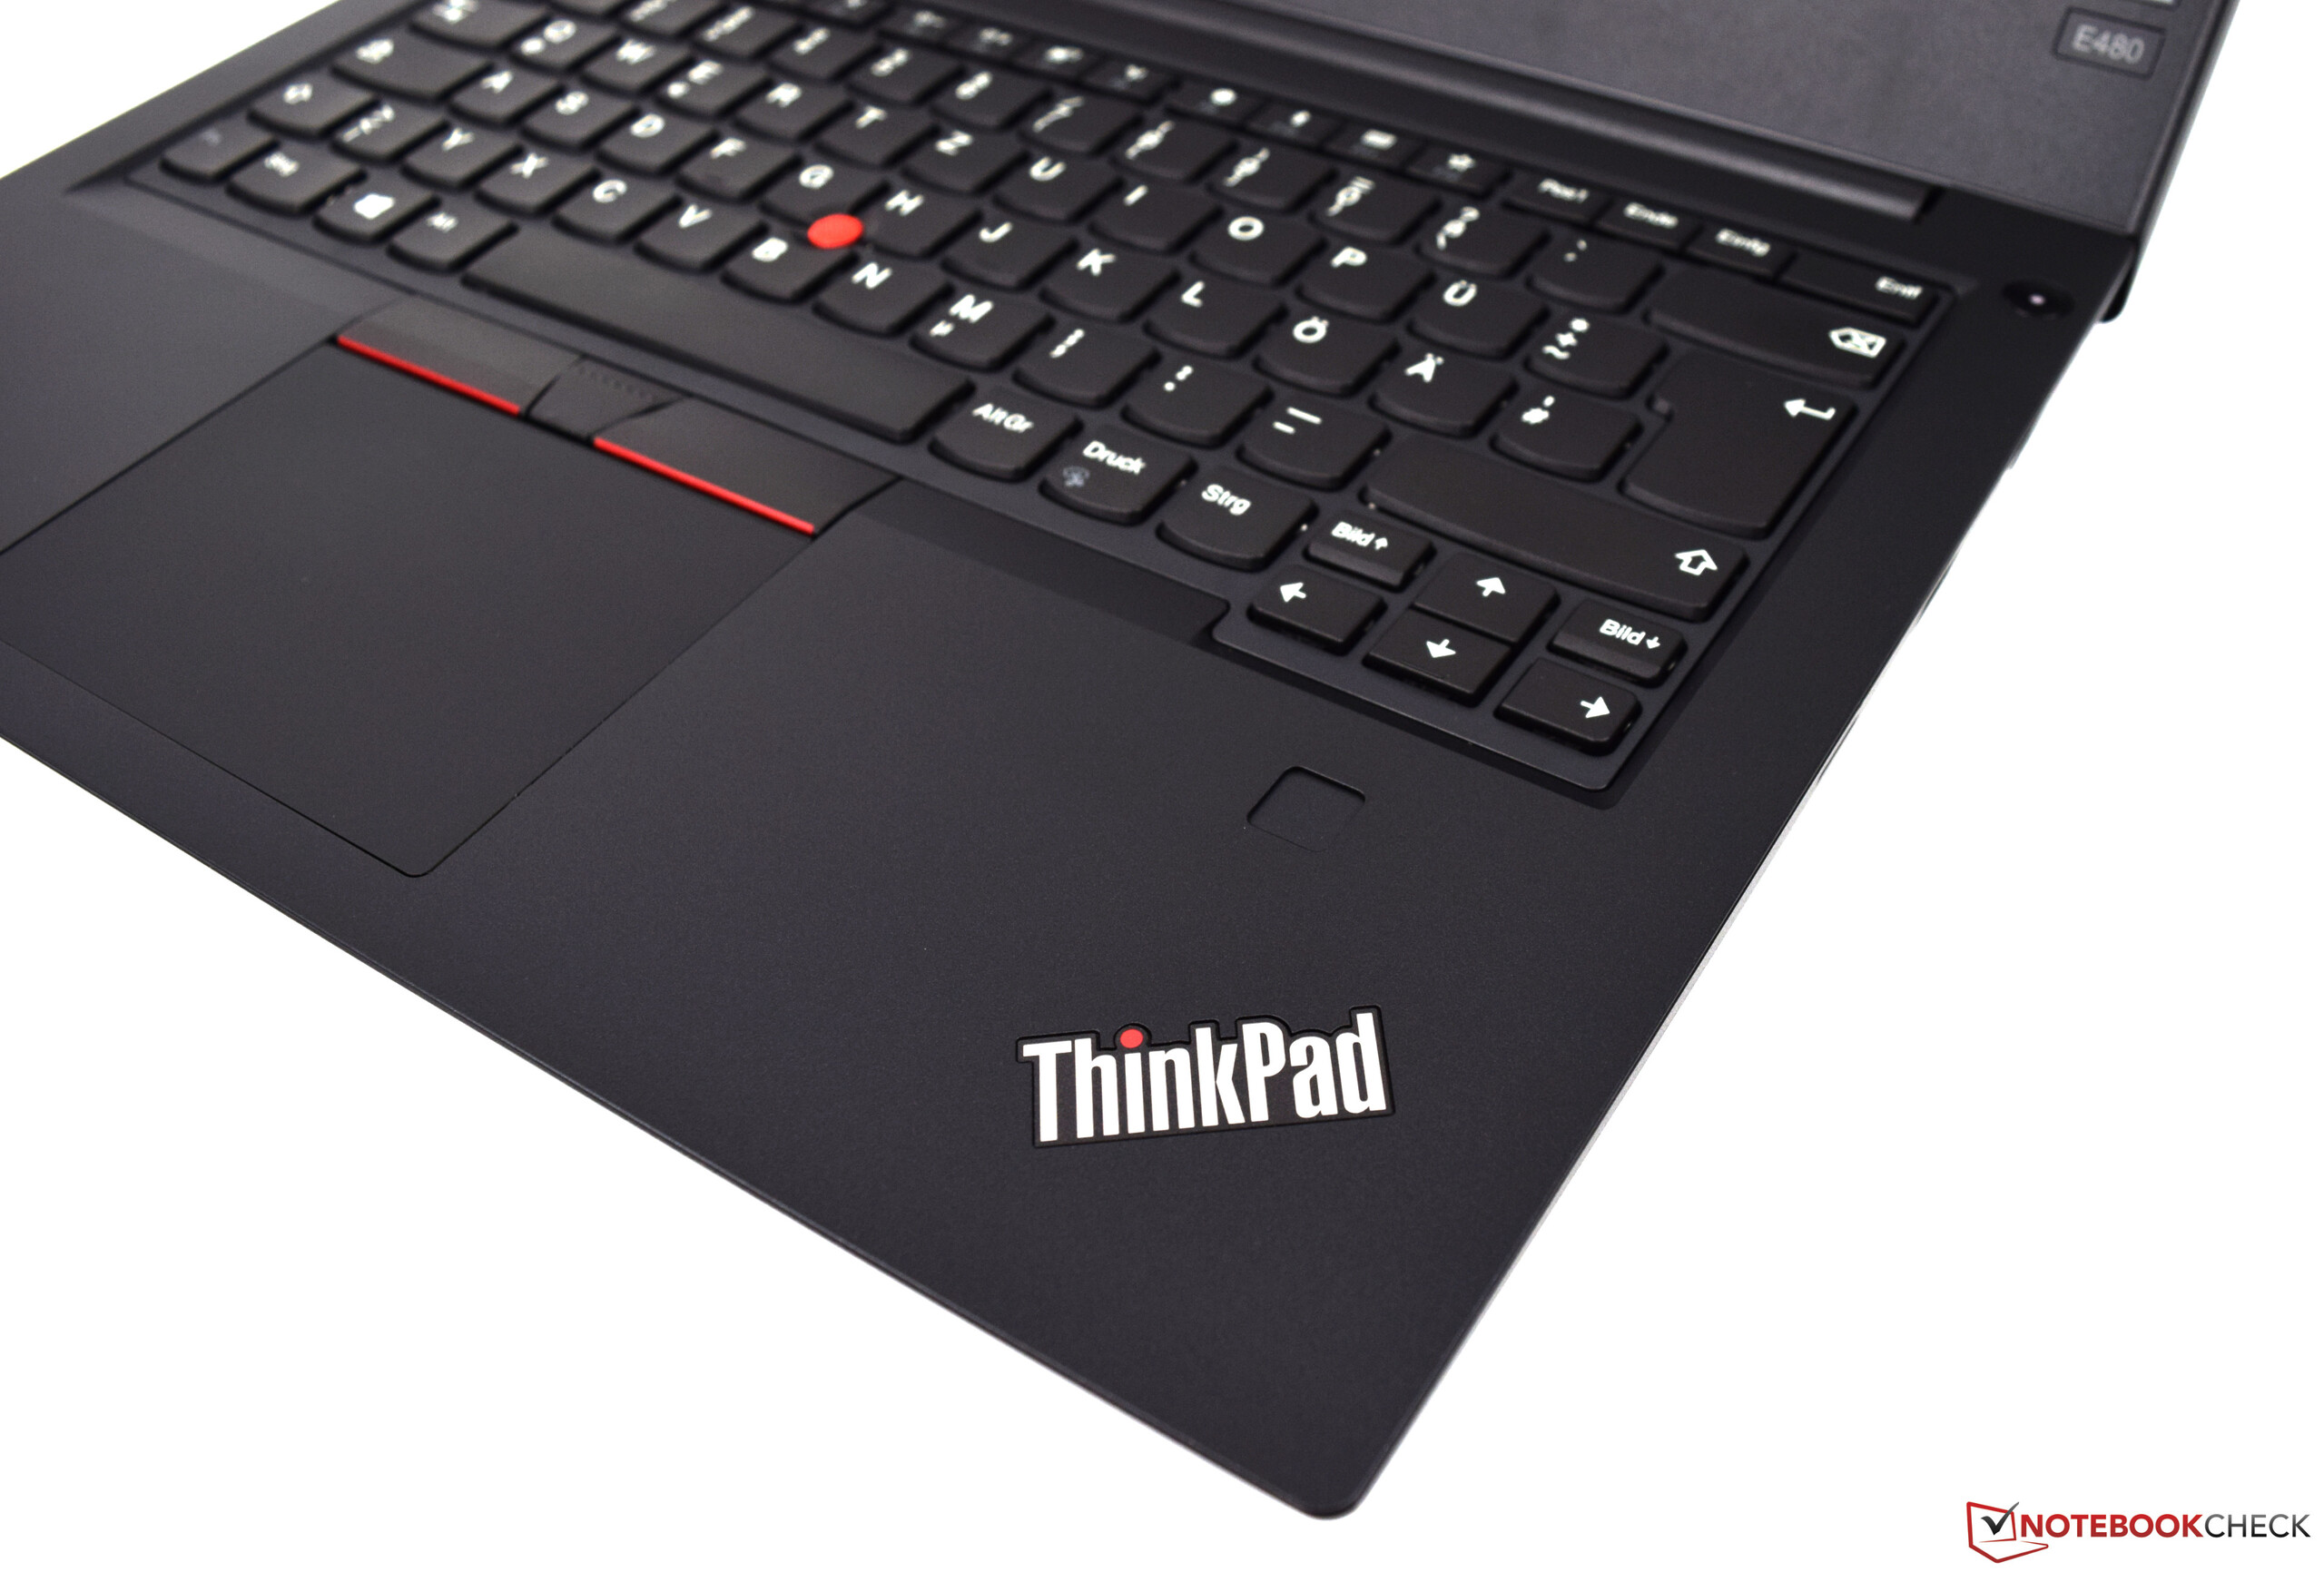
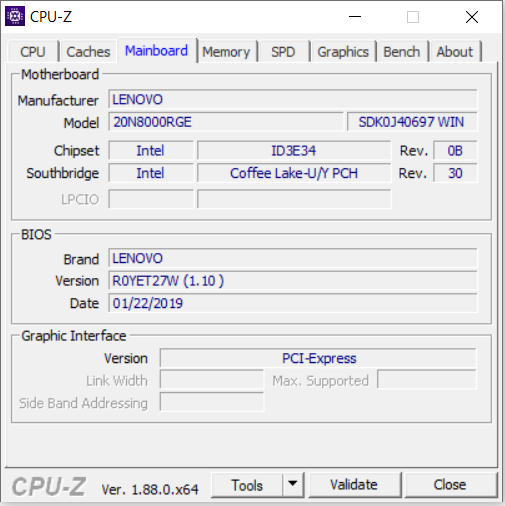
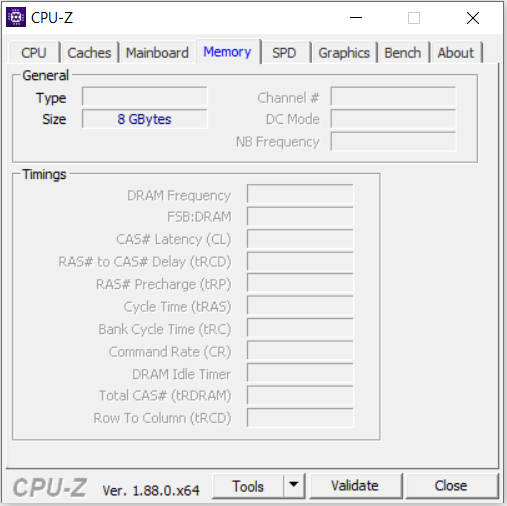
Le ThinkPad E490 coche à peu près toutes les cases pour être une bonne machine mobile : il est assez performant pour les logiciels de bureautique et Internet, reste silencieux quelles que soient les sollicitations, possède d’excellents périphériques d’entrée, et une très bonne autonomie. Mais il n’a pas de rétroéclairage du clavier, et sa RAM tourne en mode monocanal - si vous souhaitez ces fonctionnalités, il faudra choisir une autre version de l’appareil.
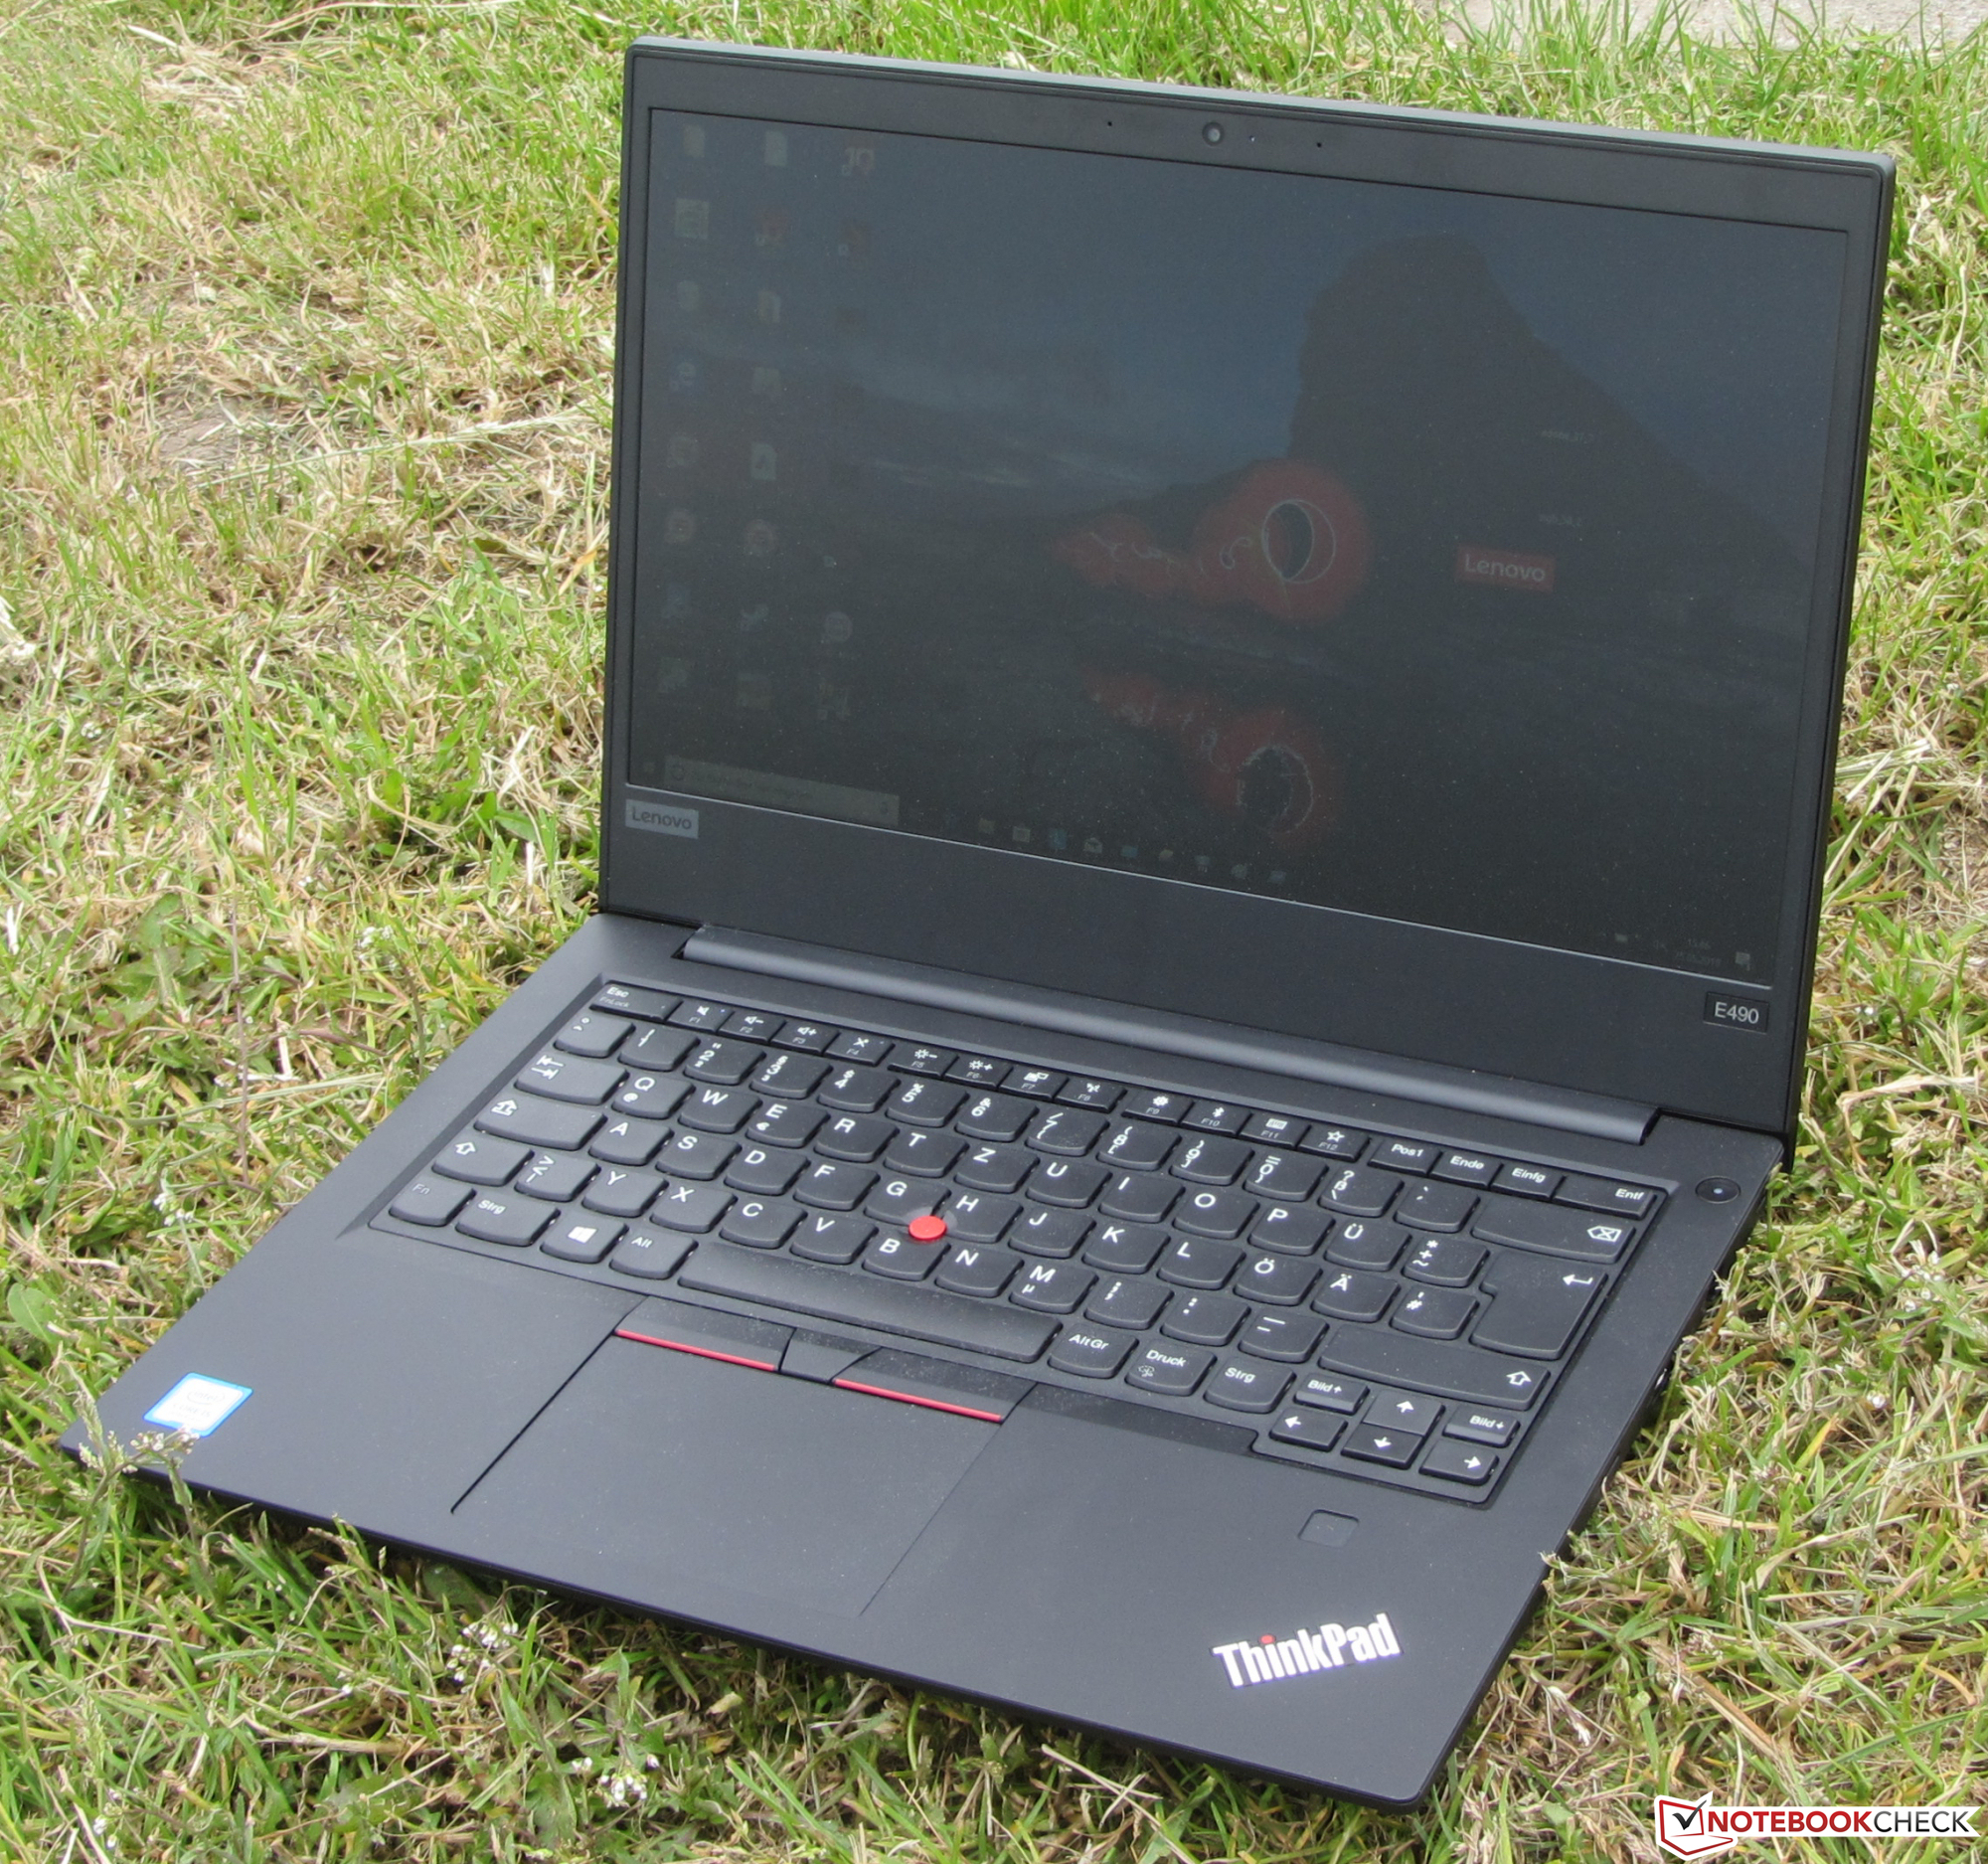
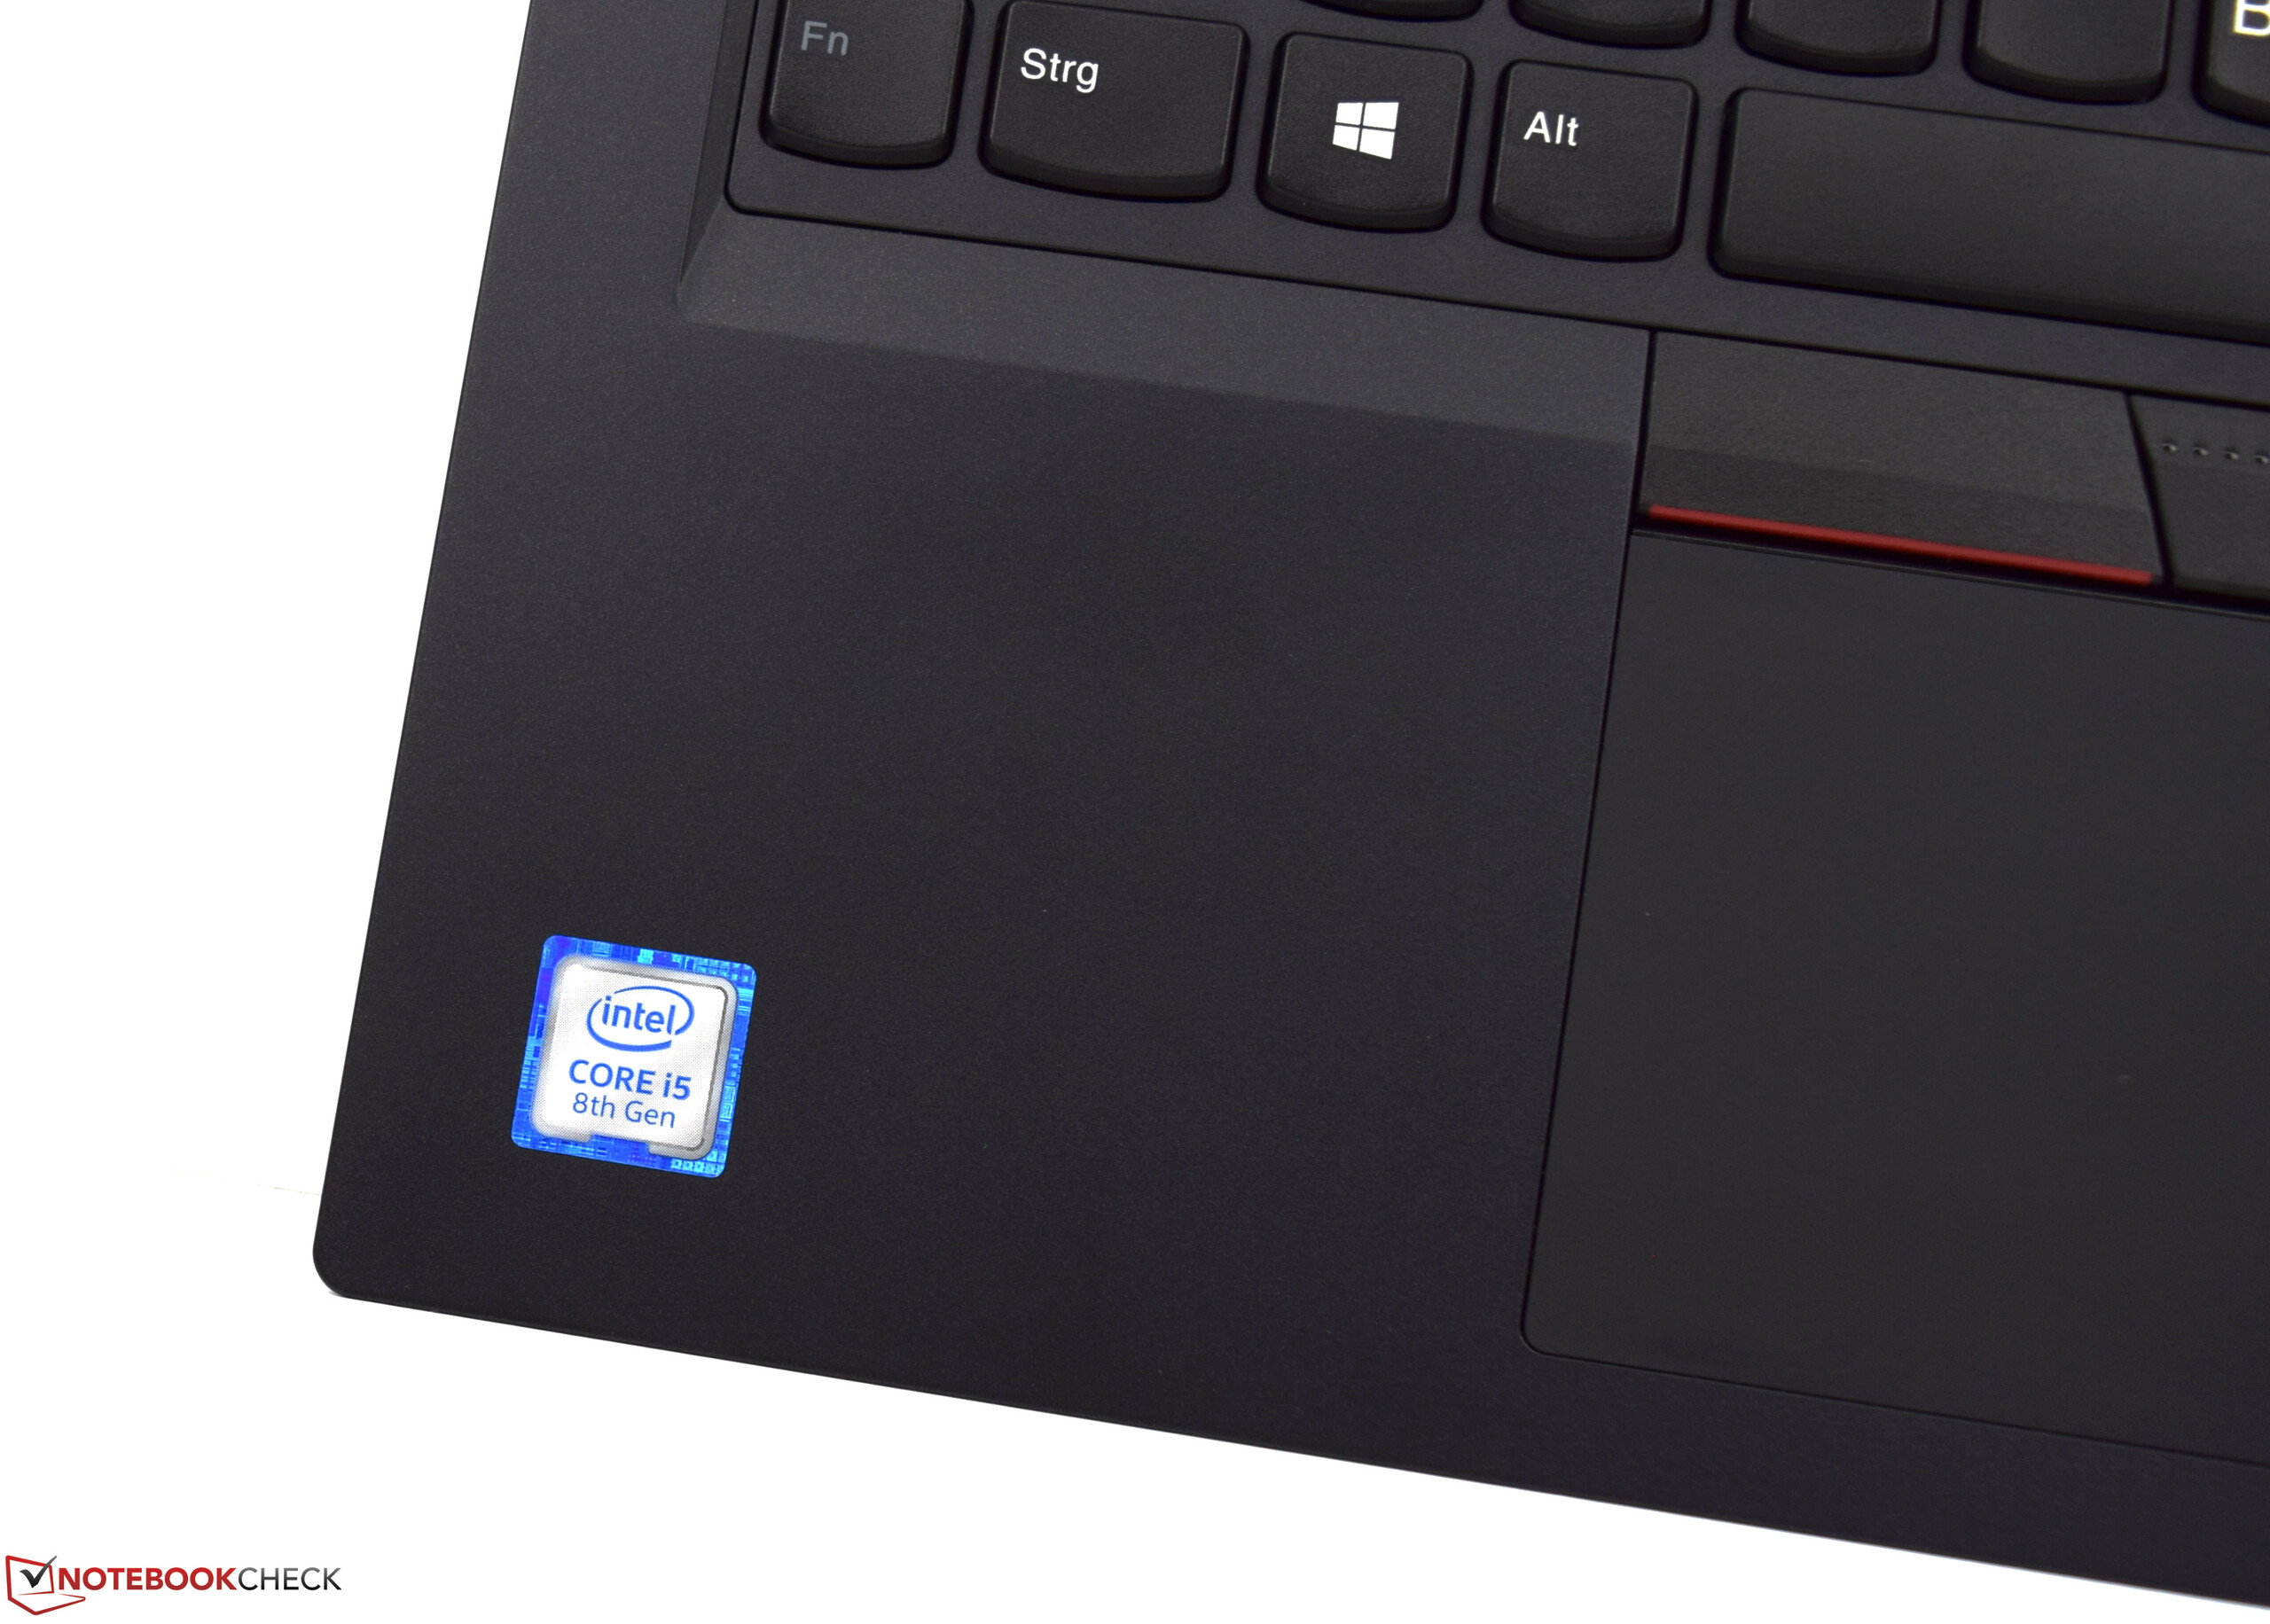
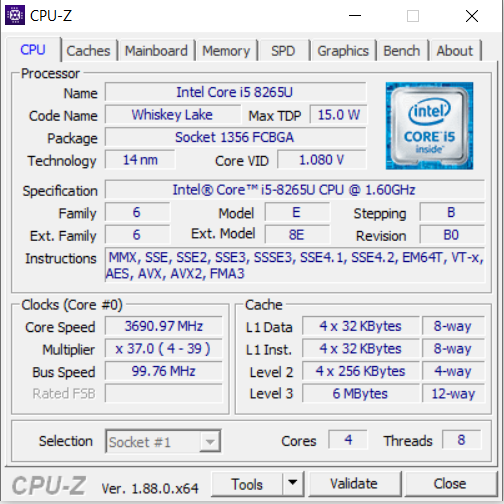
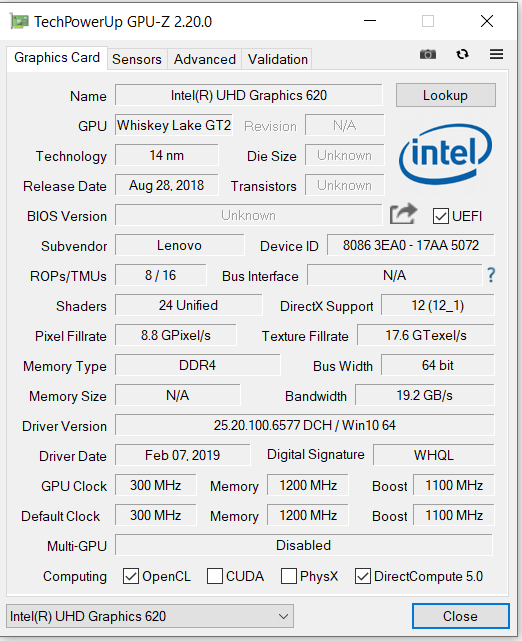
L’E490 reprend le châssis de son prédécesseur. Seul le processeur a changé, les nouveaux modèles étant équipé de processeurs Whiskey Lake. Cependant, le processeur Core i5-8265U de notre modèle n'apporte pas de véritables gains de performances comparé au Core i5-8250U du ThinkPad E480.
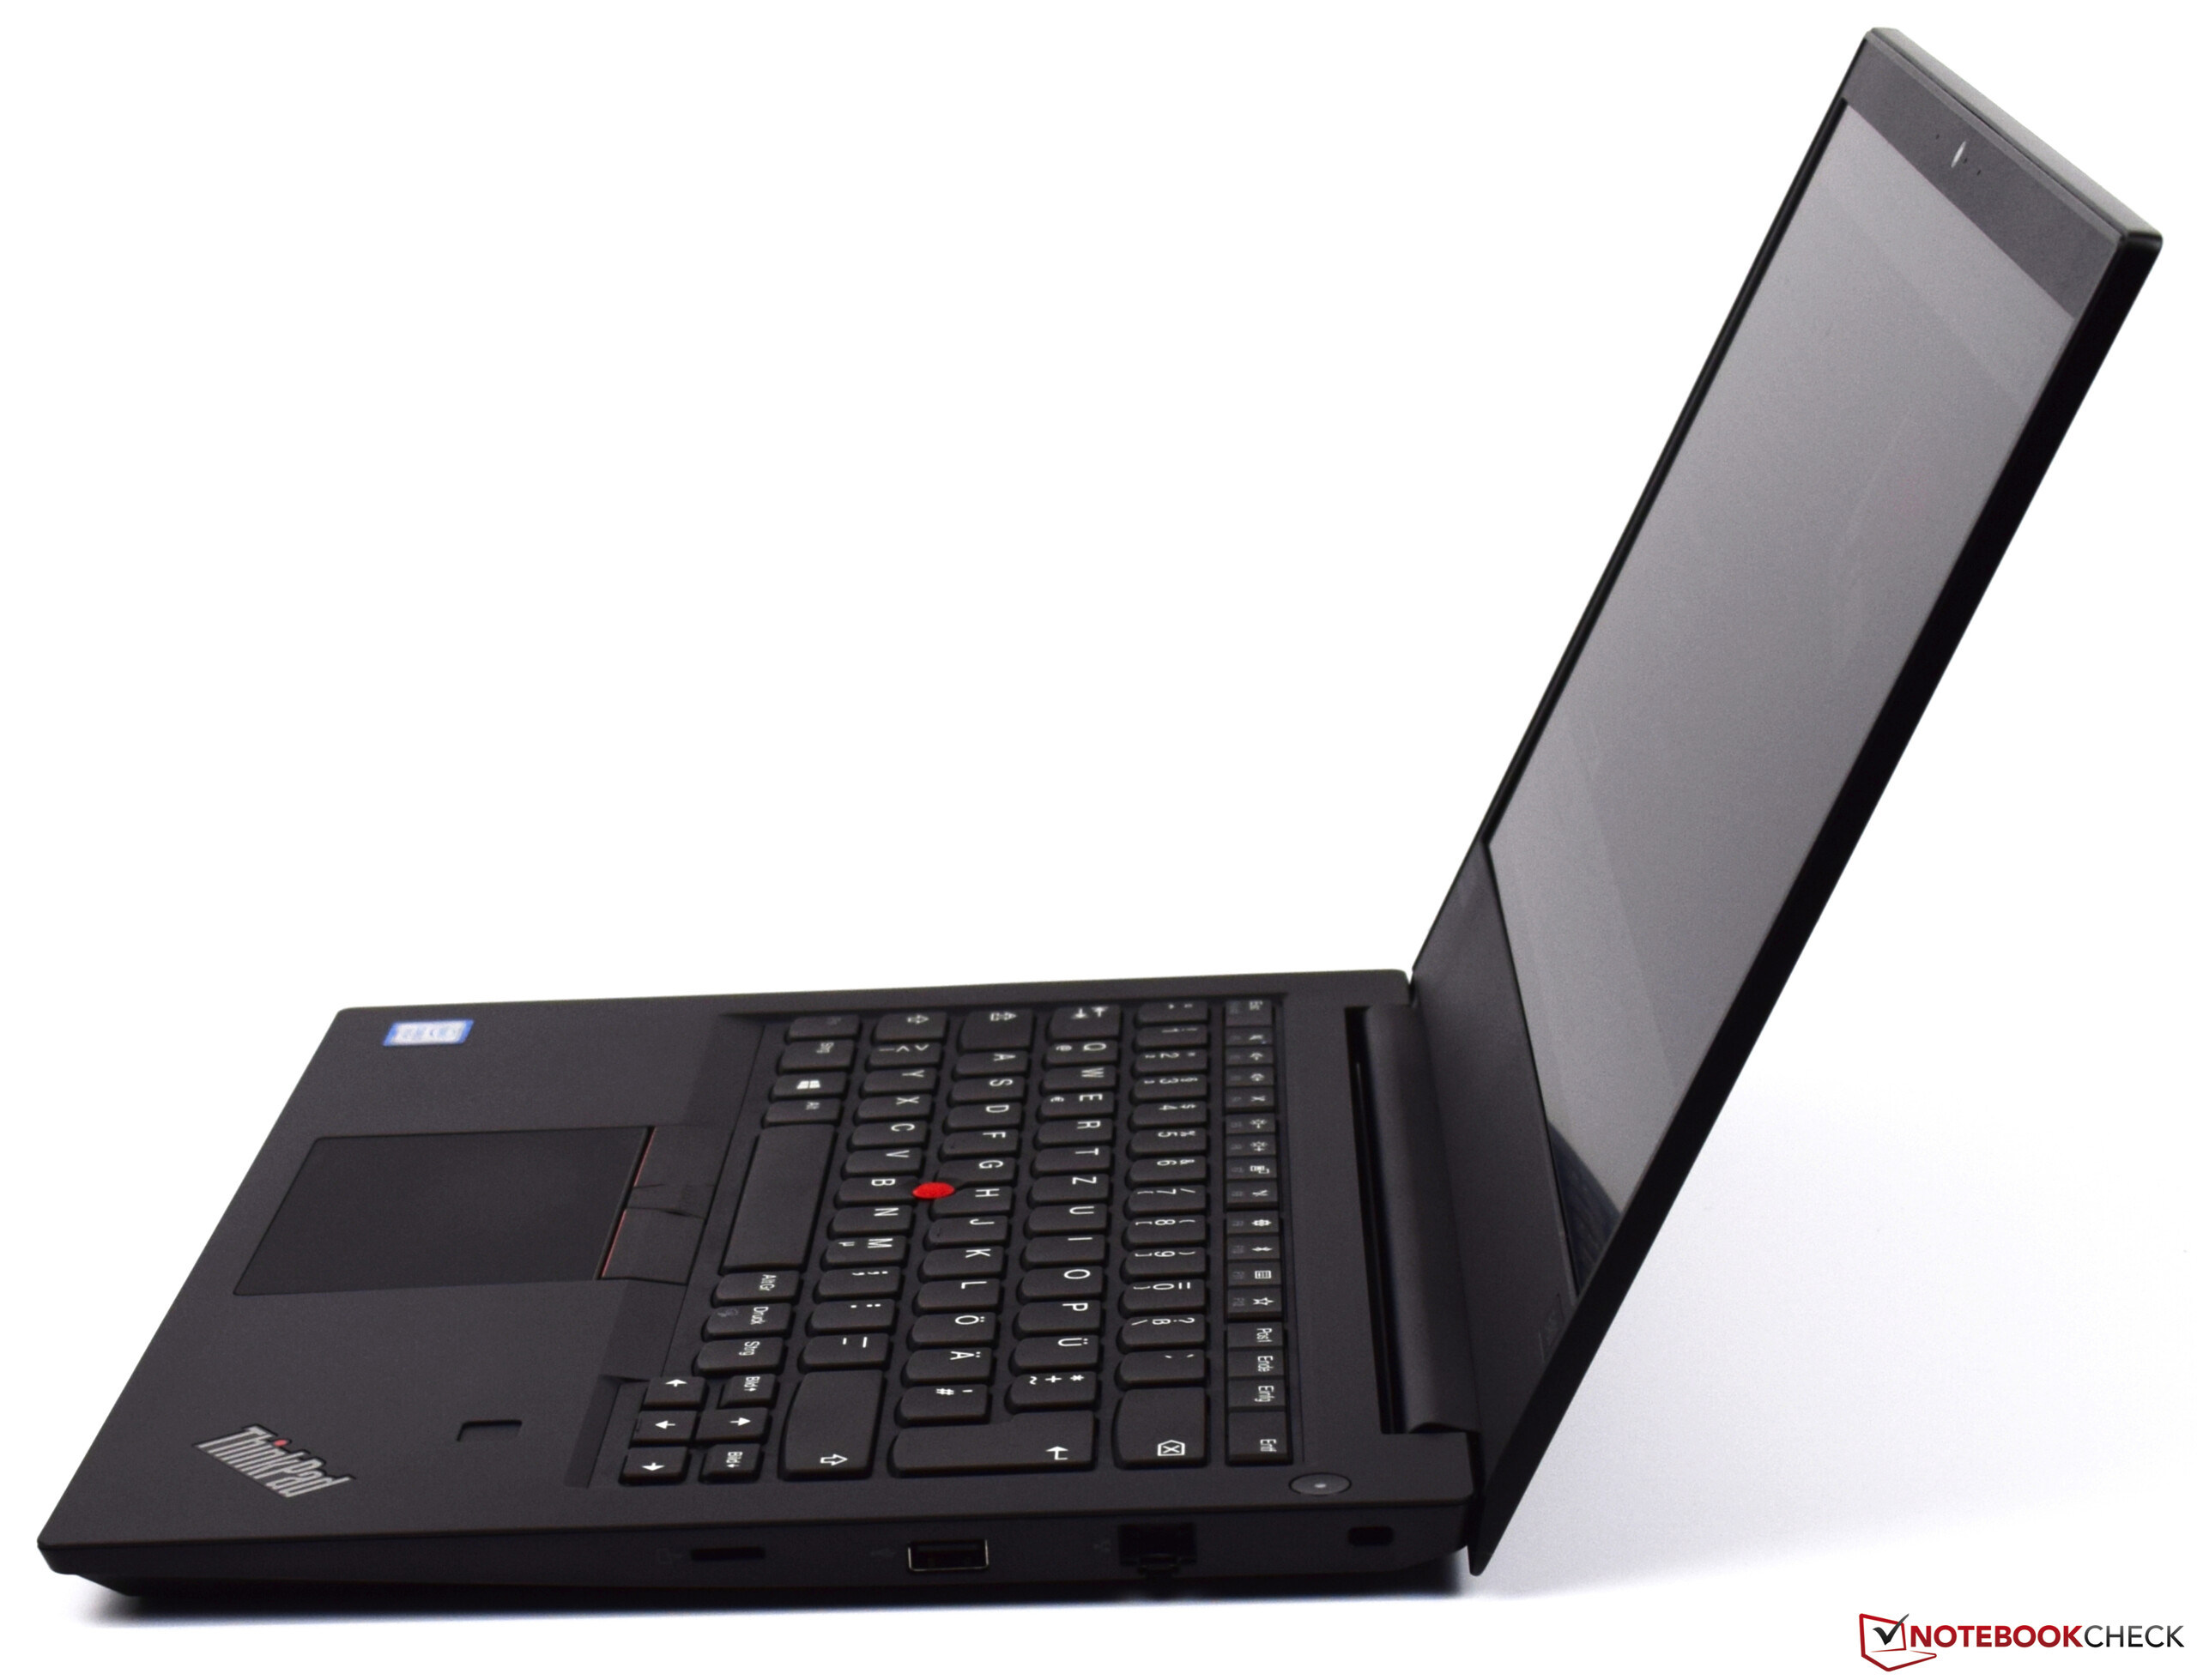
Le ThinkPad E490 est un portable pro de 14 pouces réussi, au prix abordable.
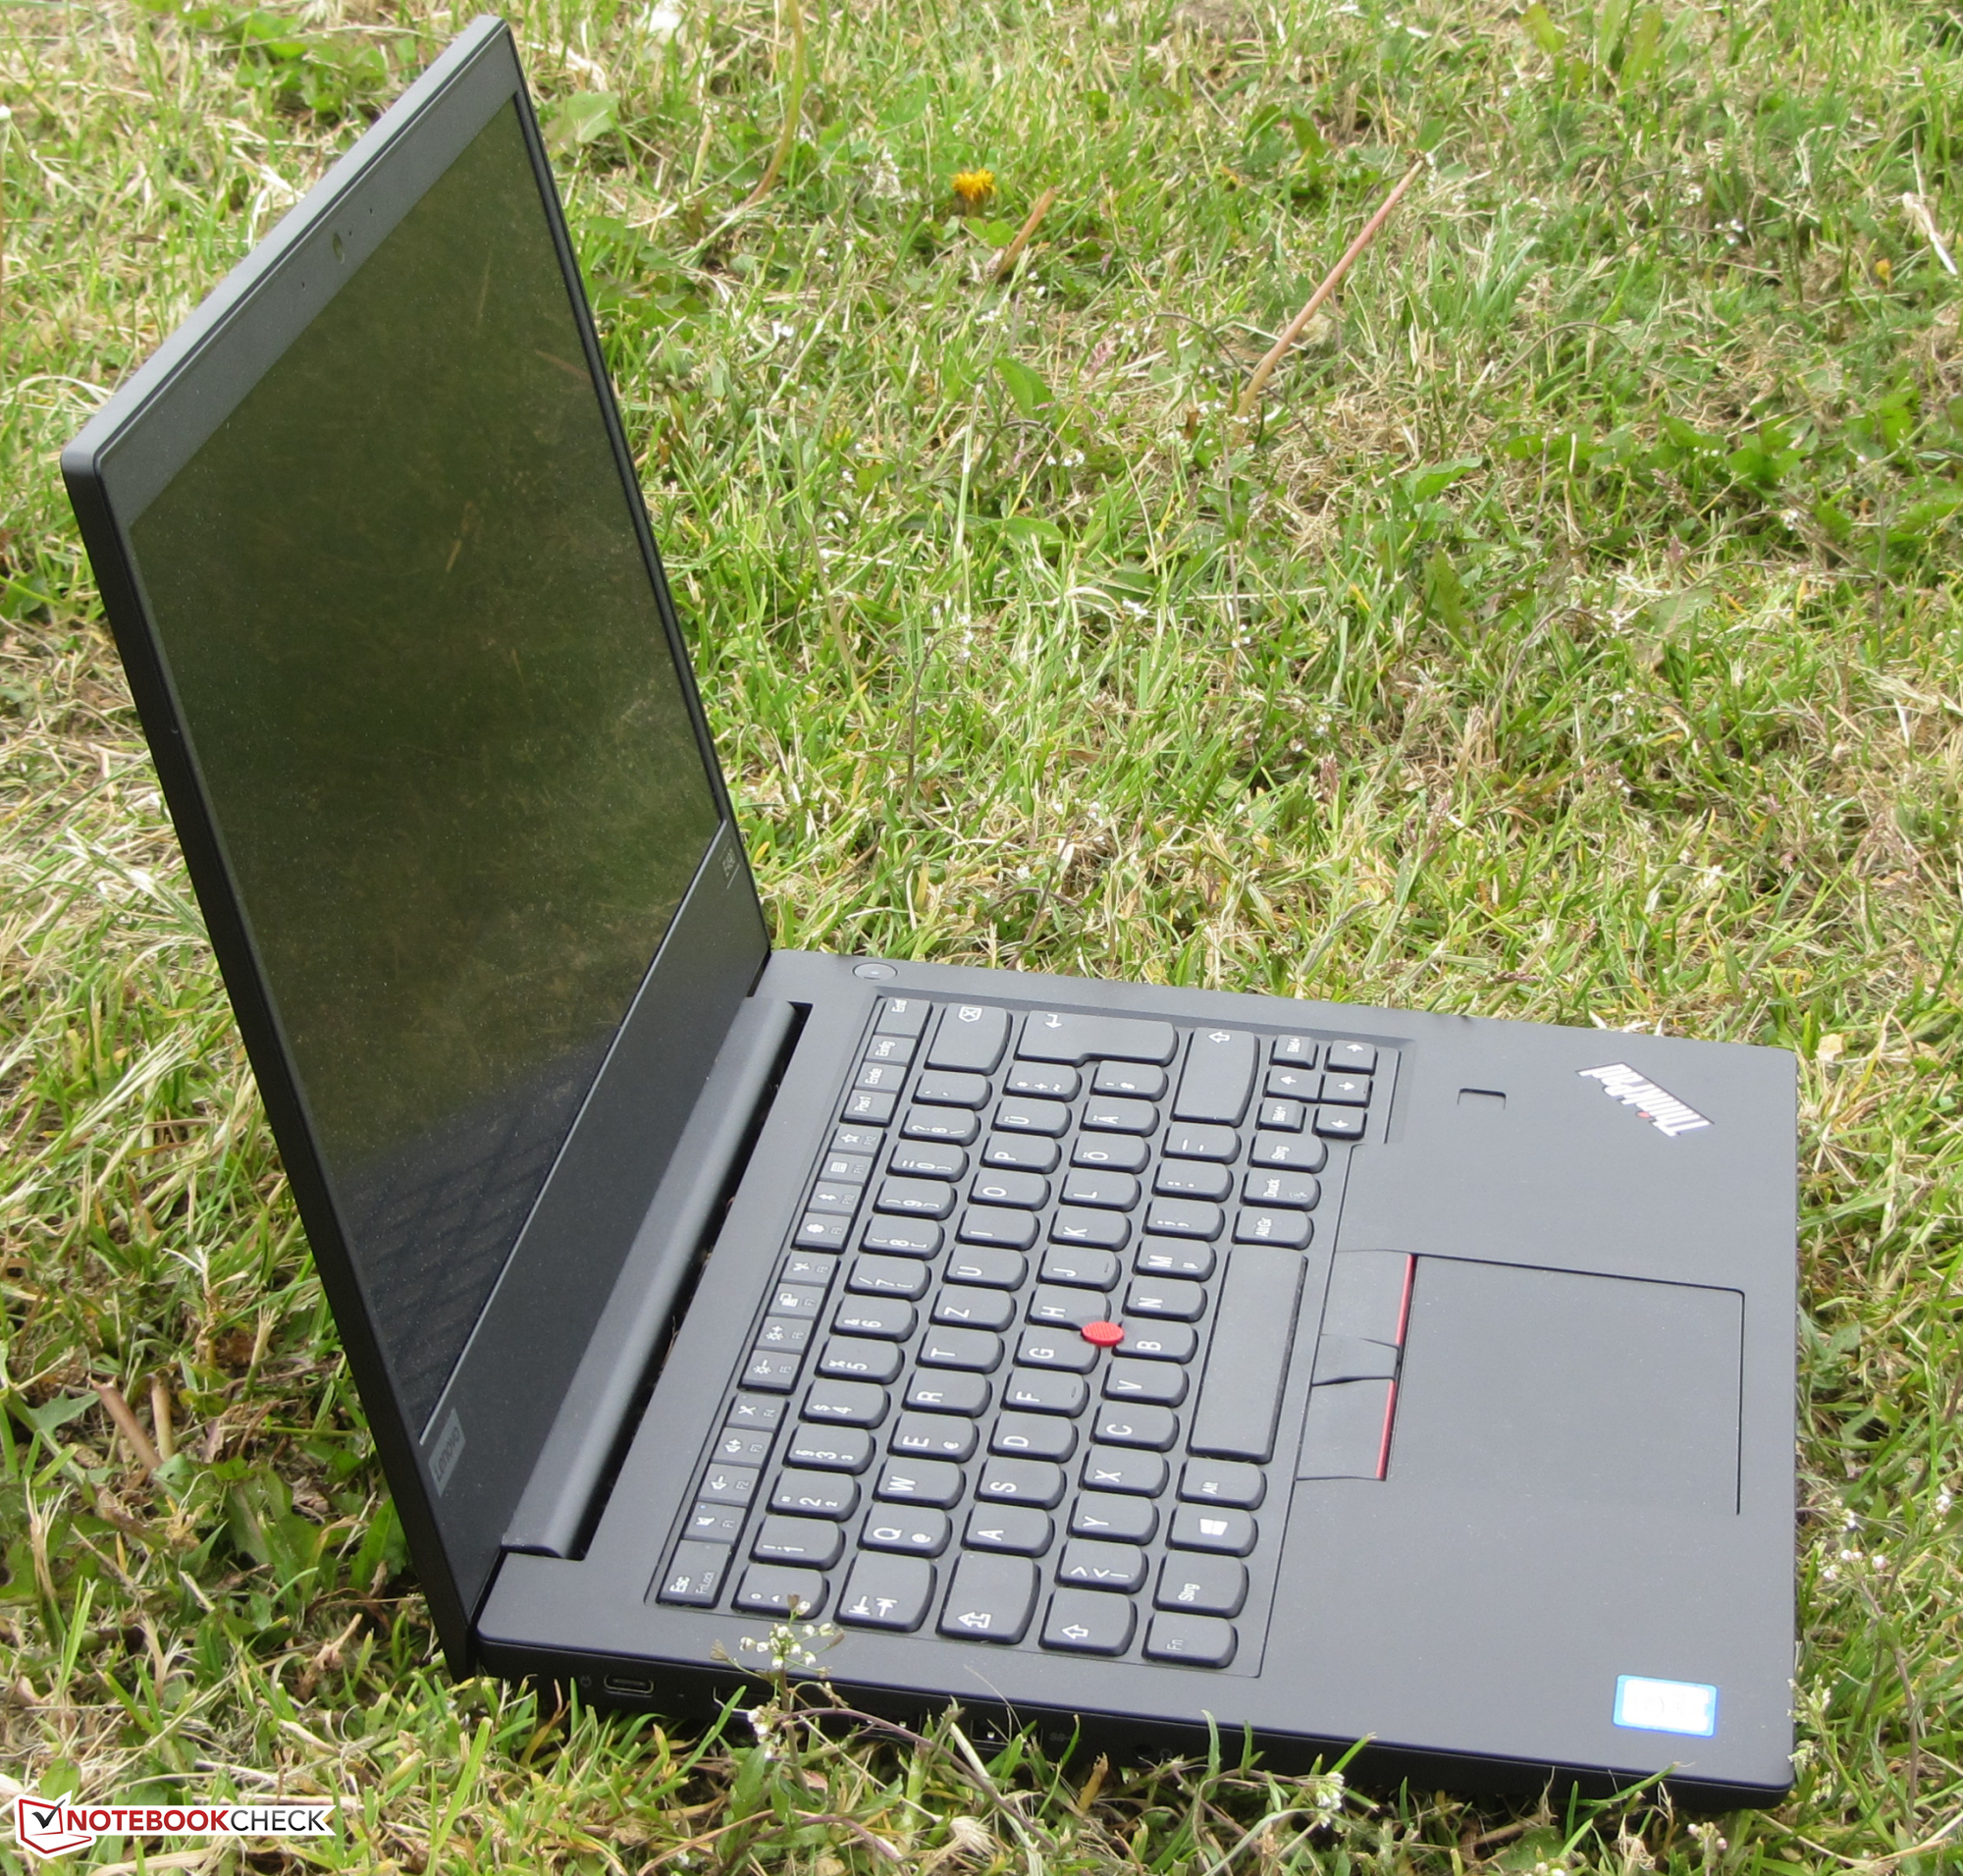
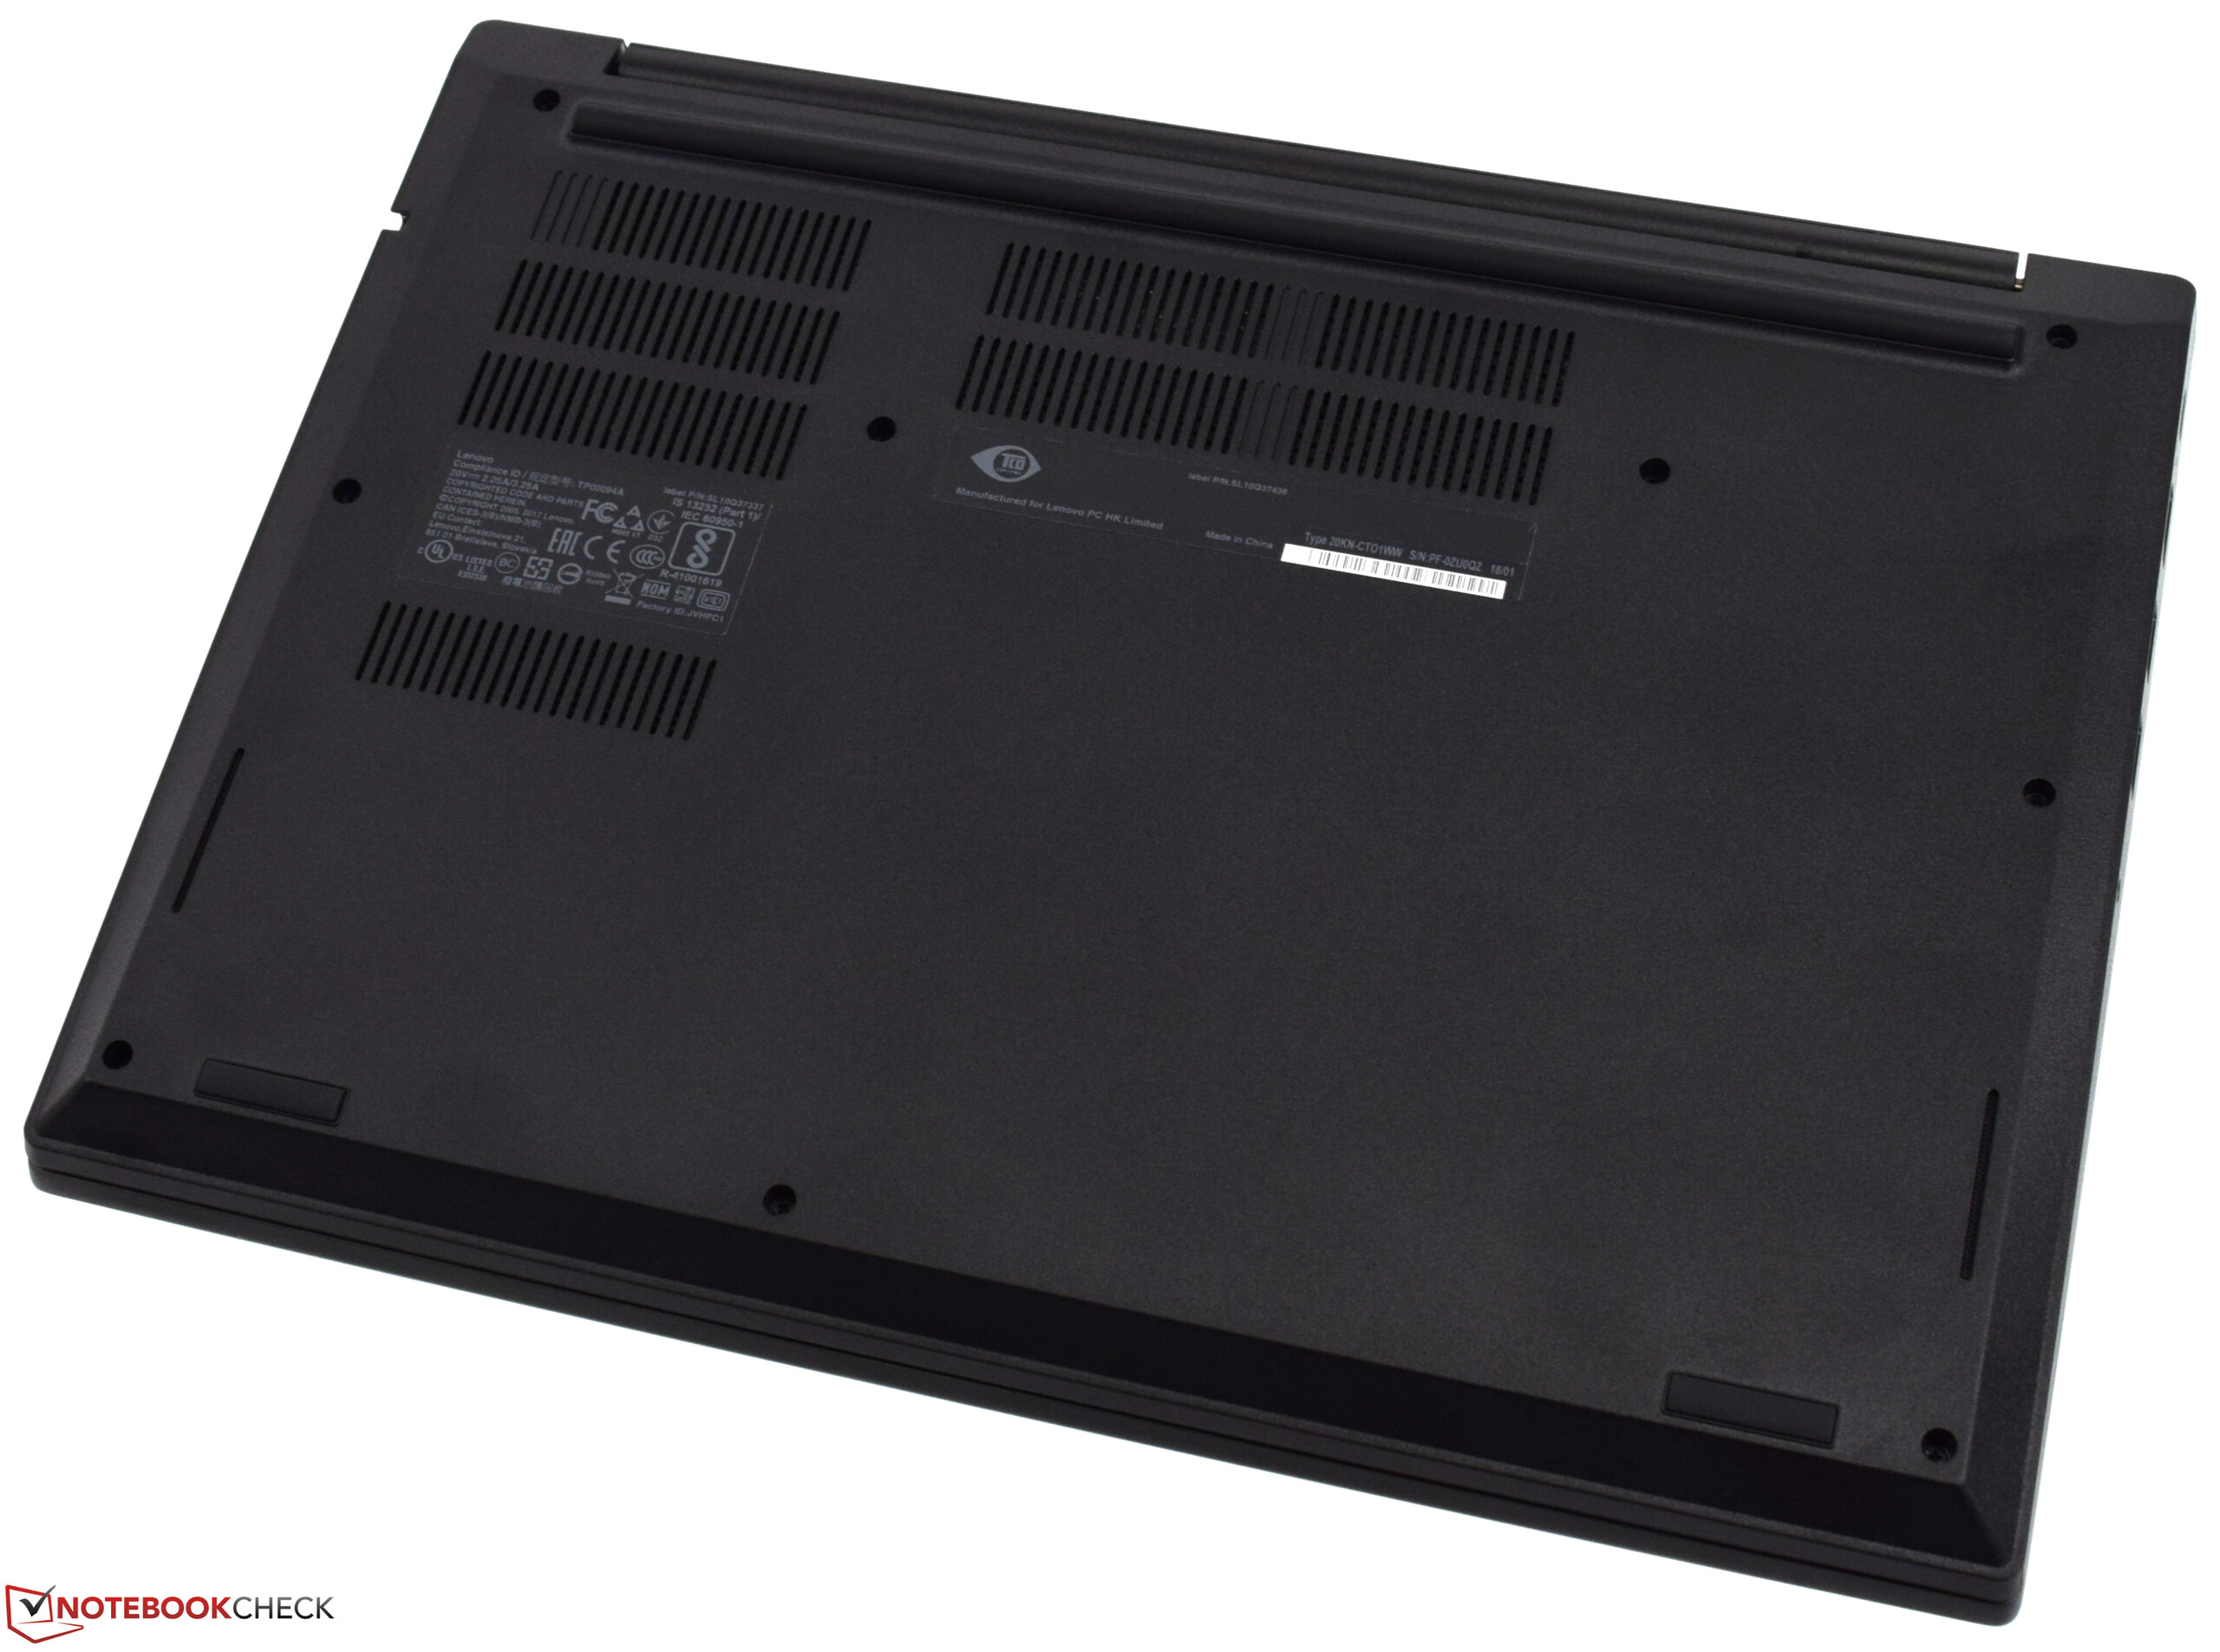
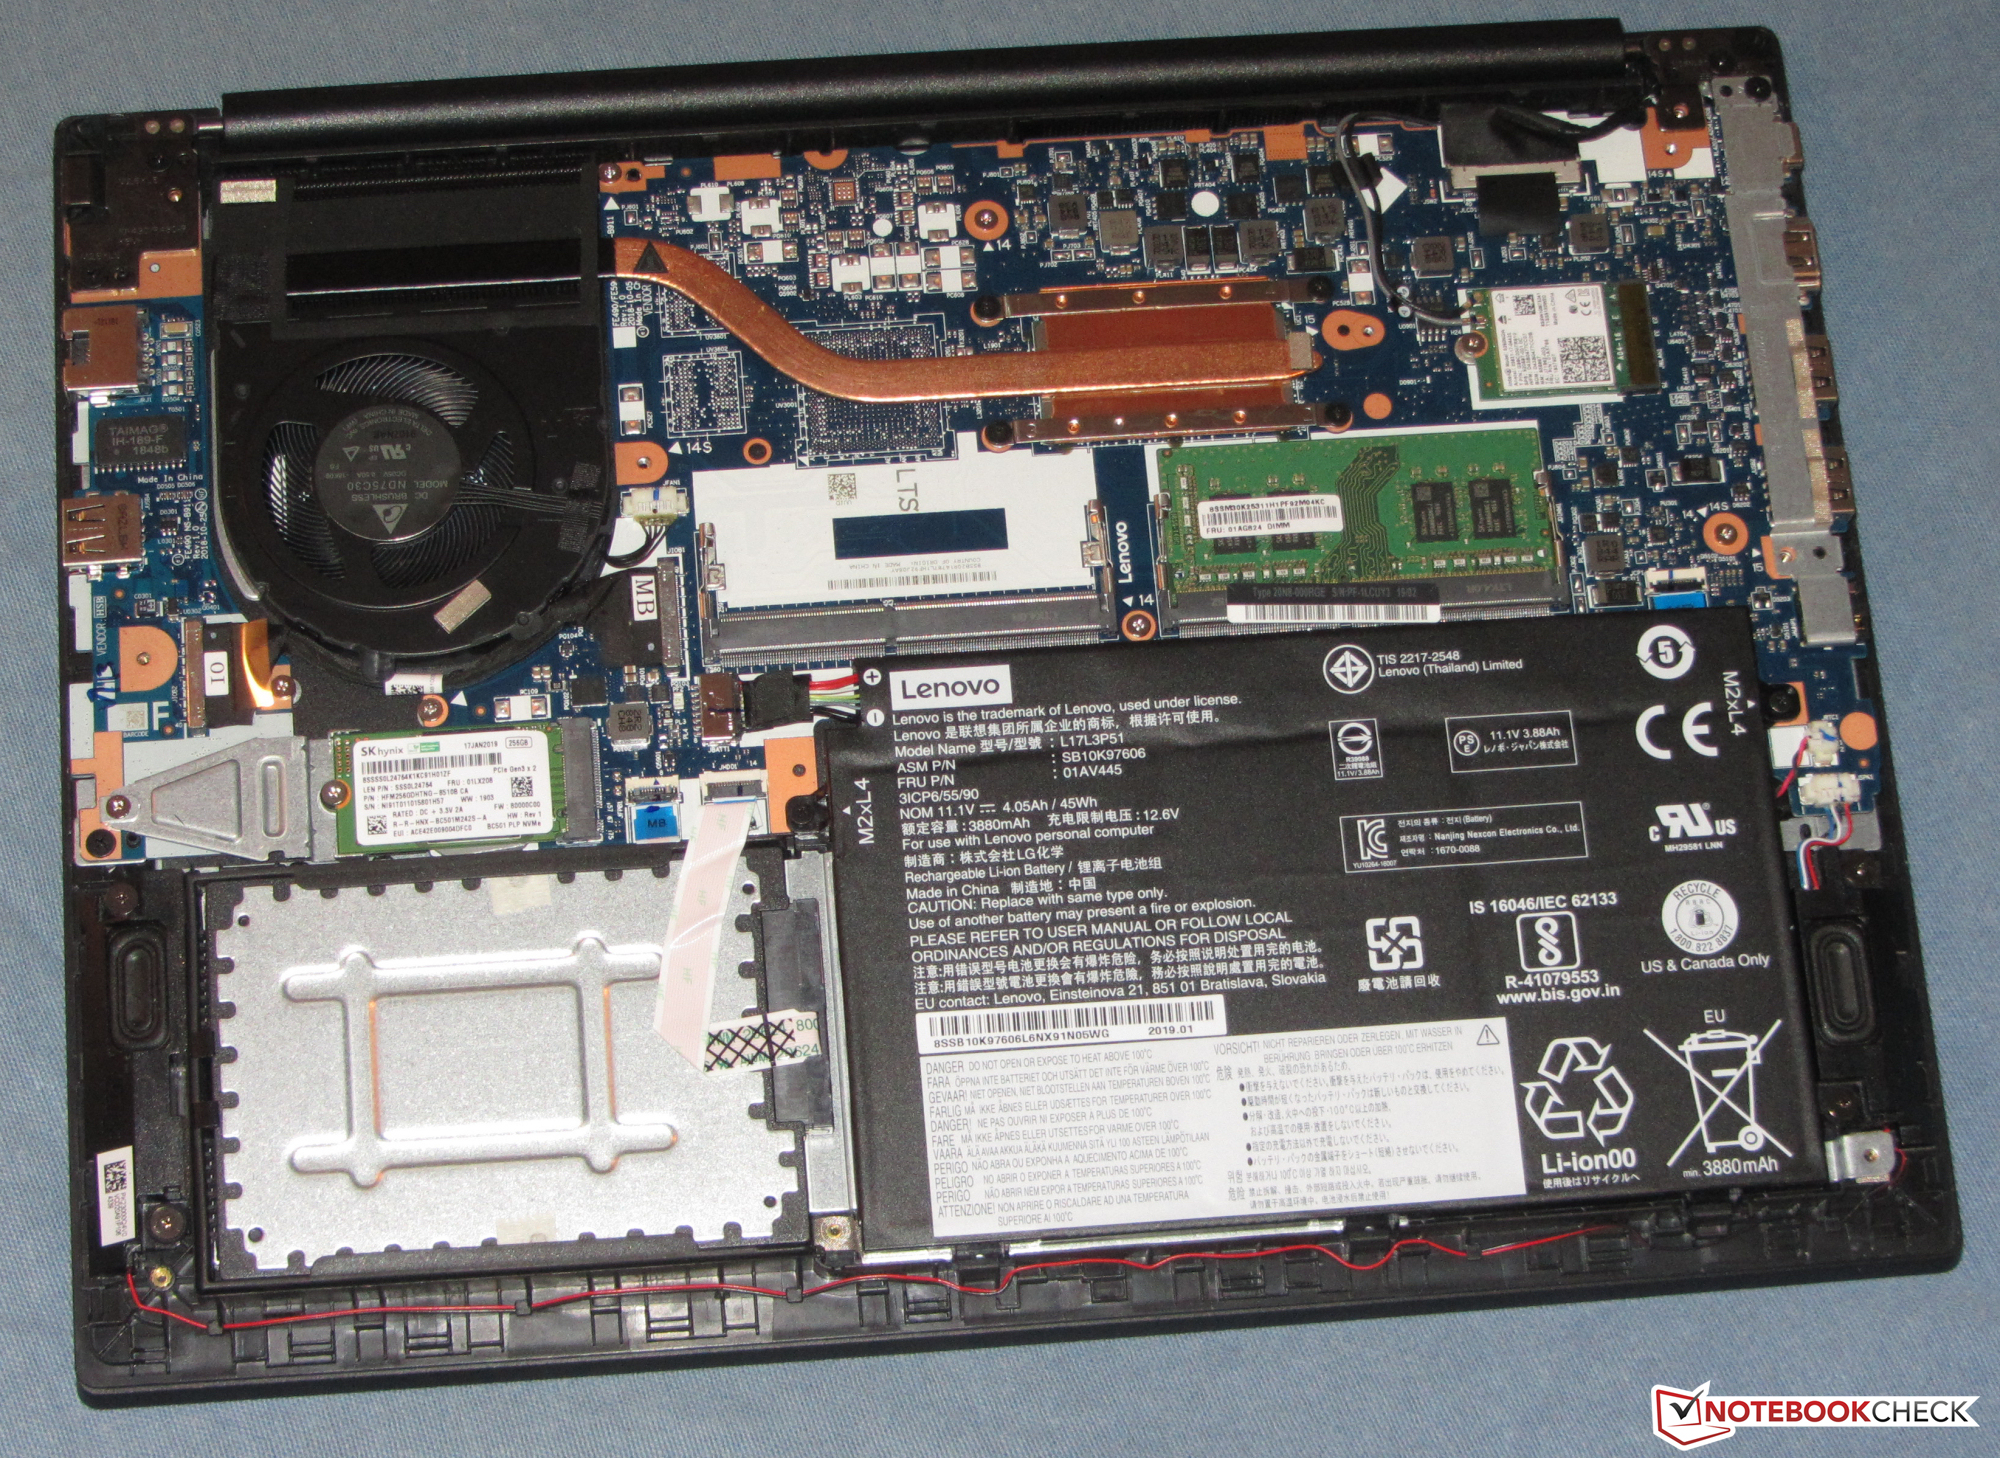
Le SSD NVMe permet au système d’être rapide et réactif. Il est possible de le changer, pour un modèle plus rapide ou plus gros. Il est également possible d’ajouter un disque dur de 2,5 pouces - le cadre et l’emplacement SATA III sont présents. Il faudra dans les deux cas retirer la coque inférieure, ce qui est tout à fait aisé à faire.
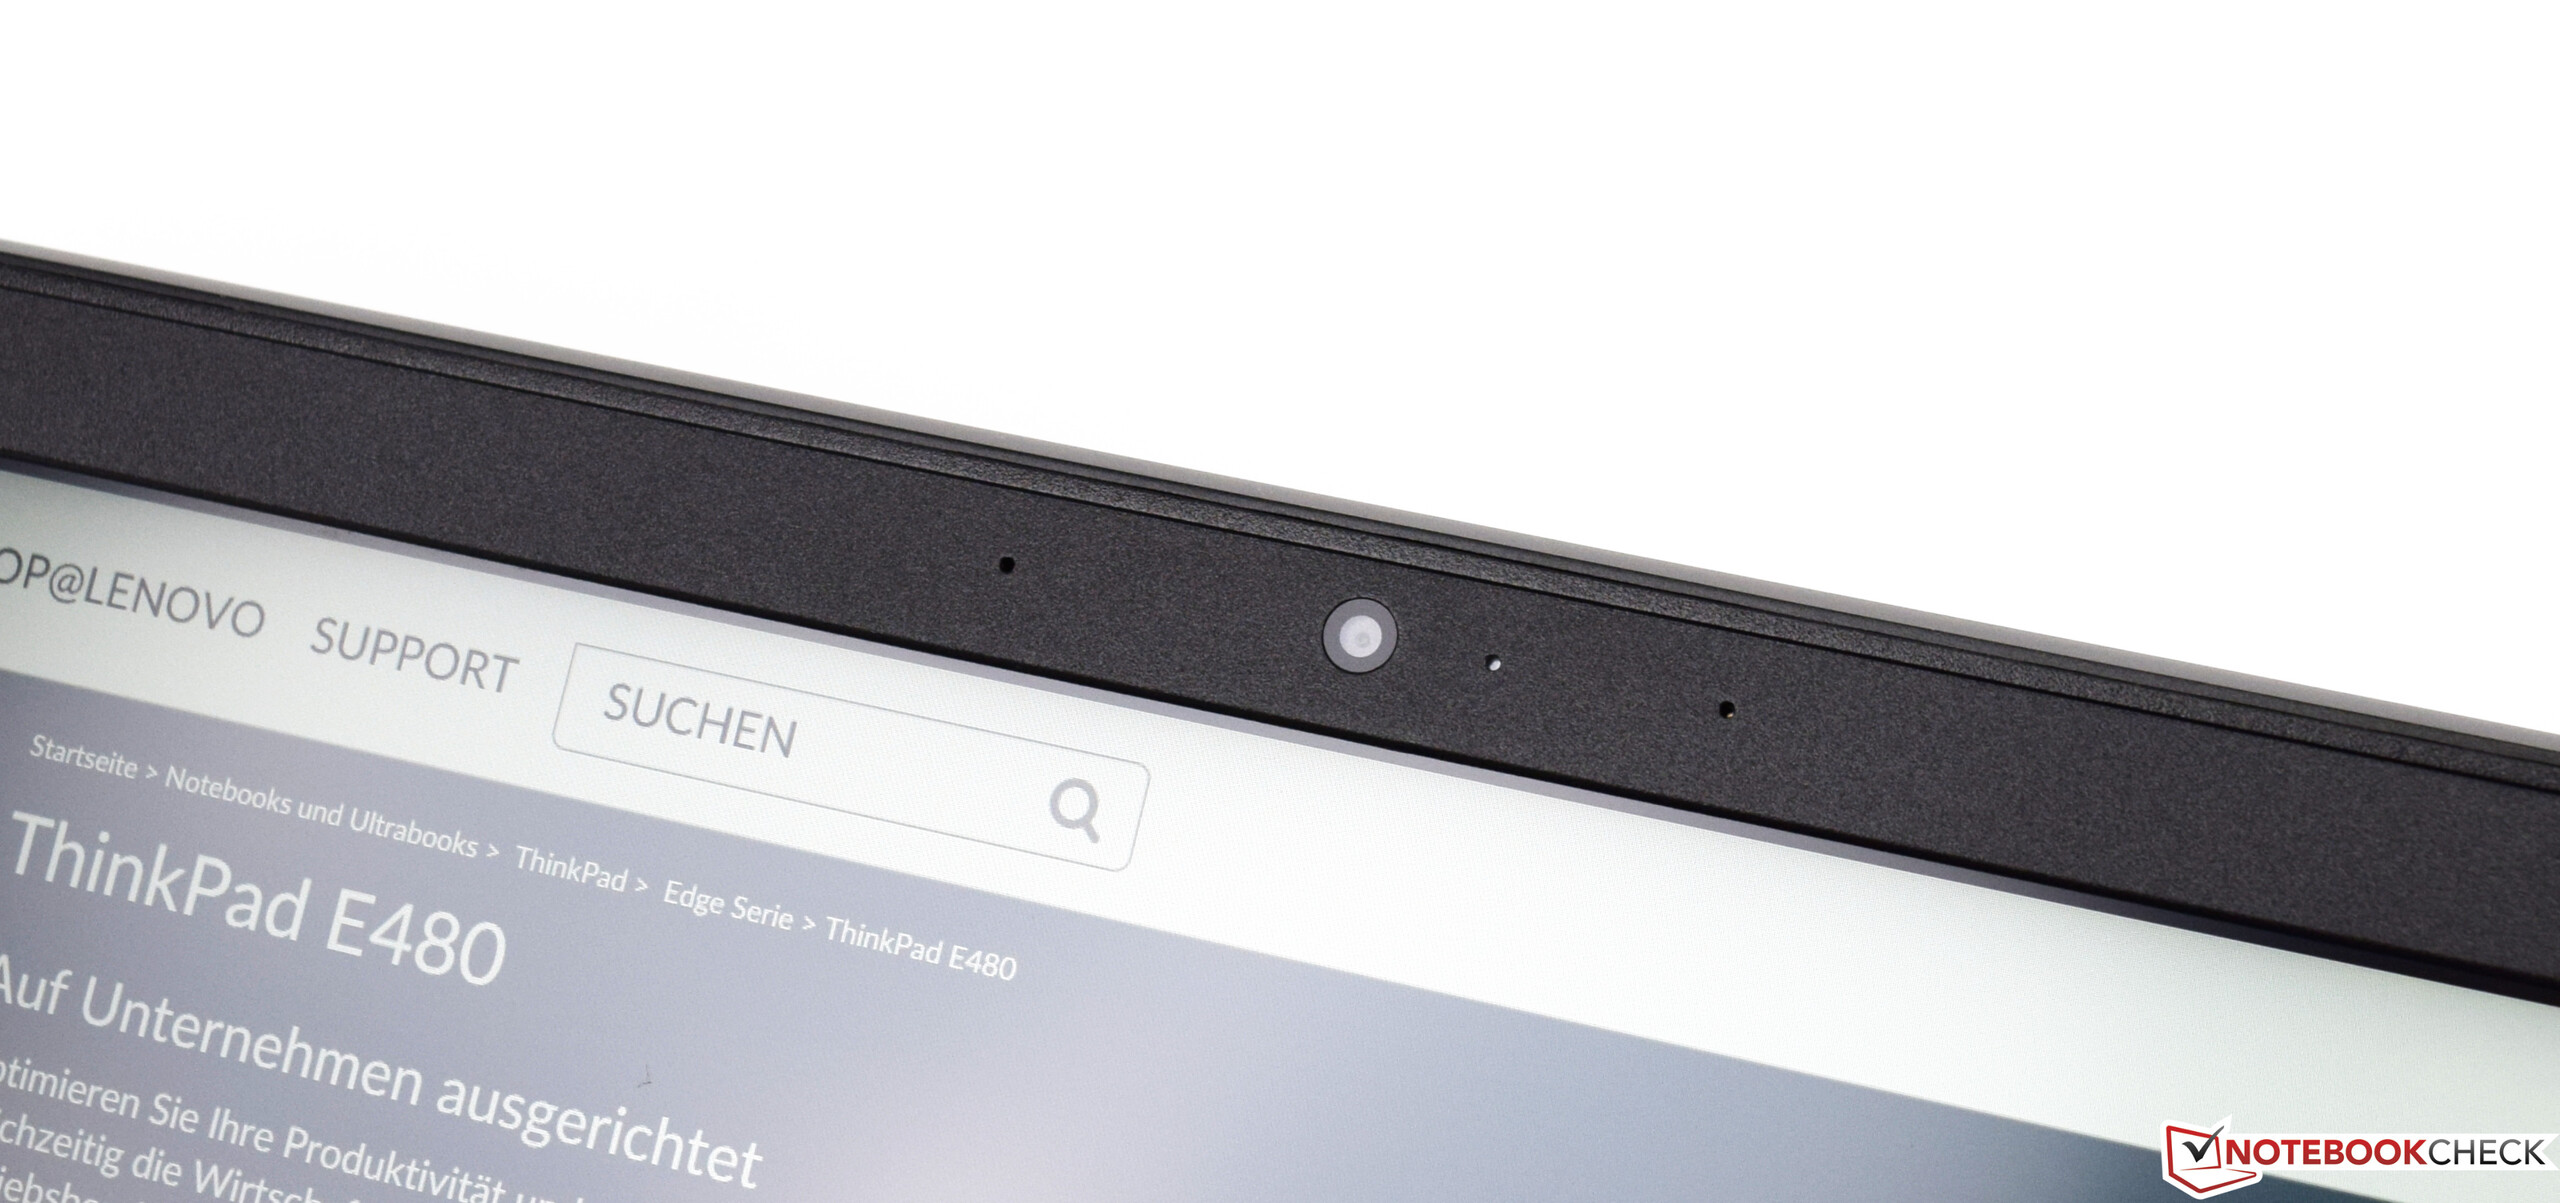
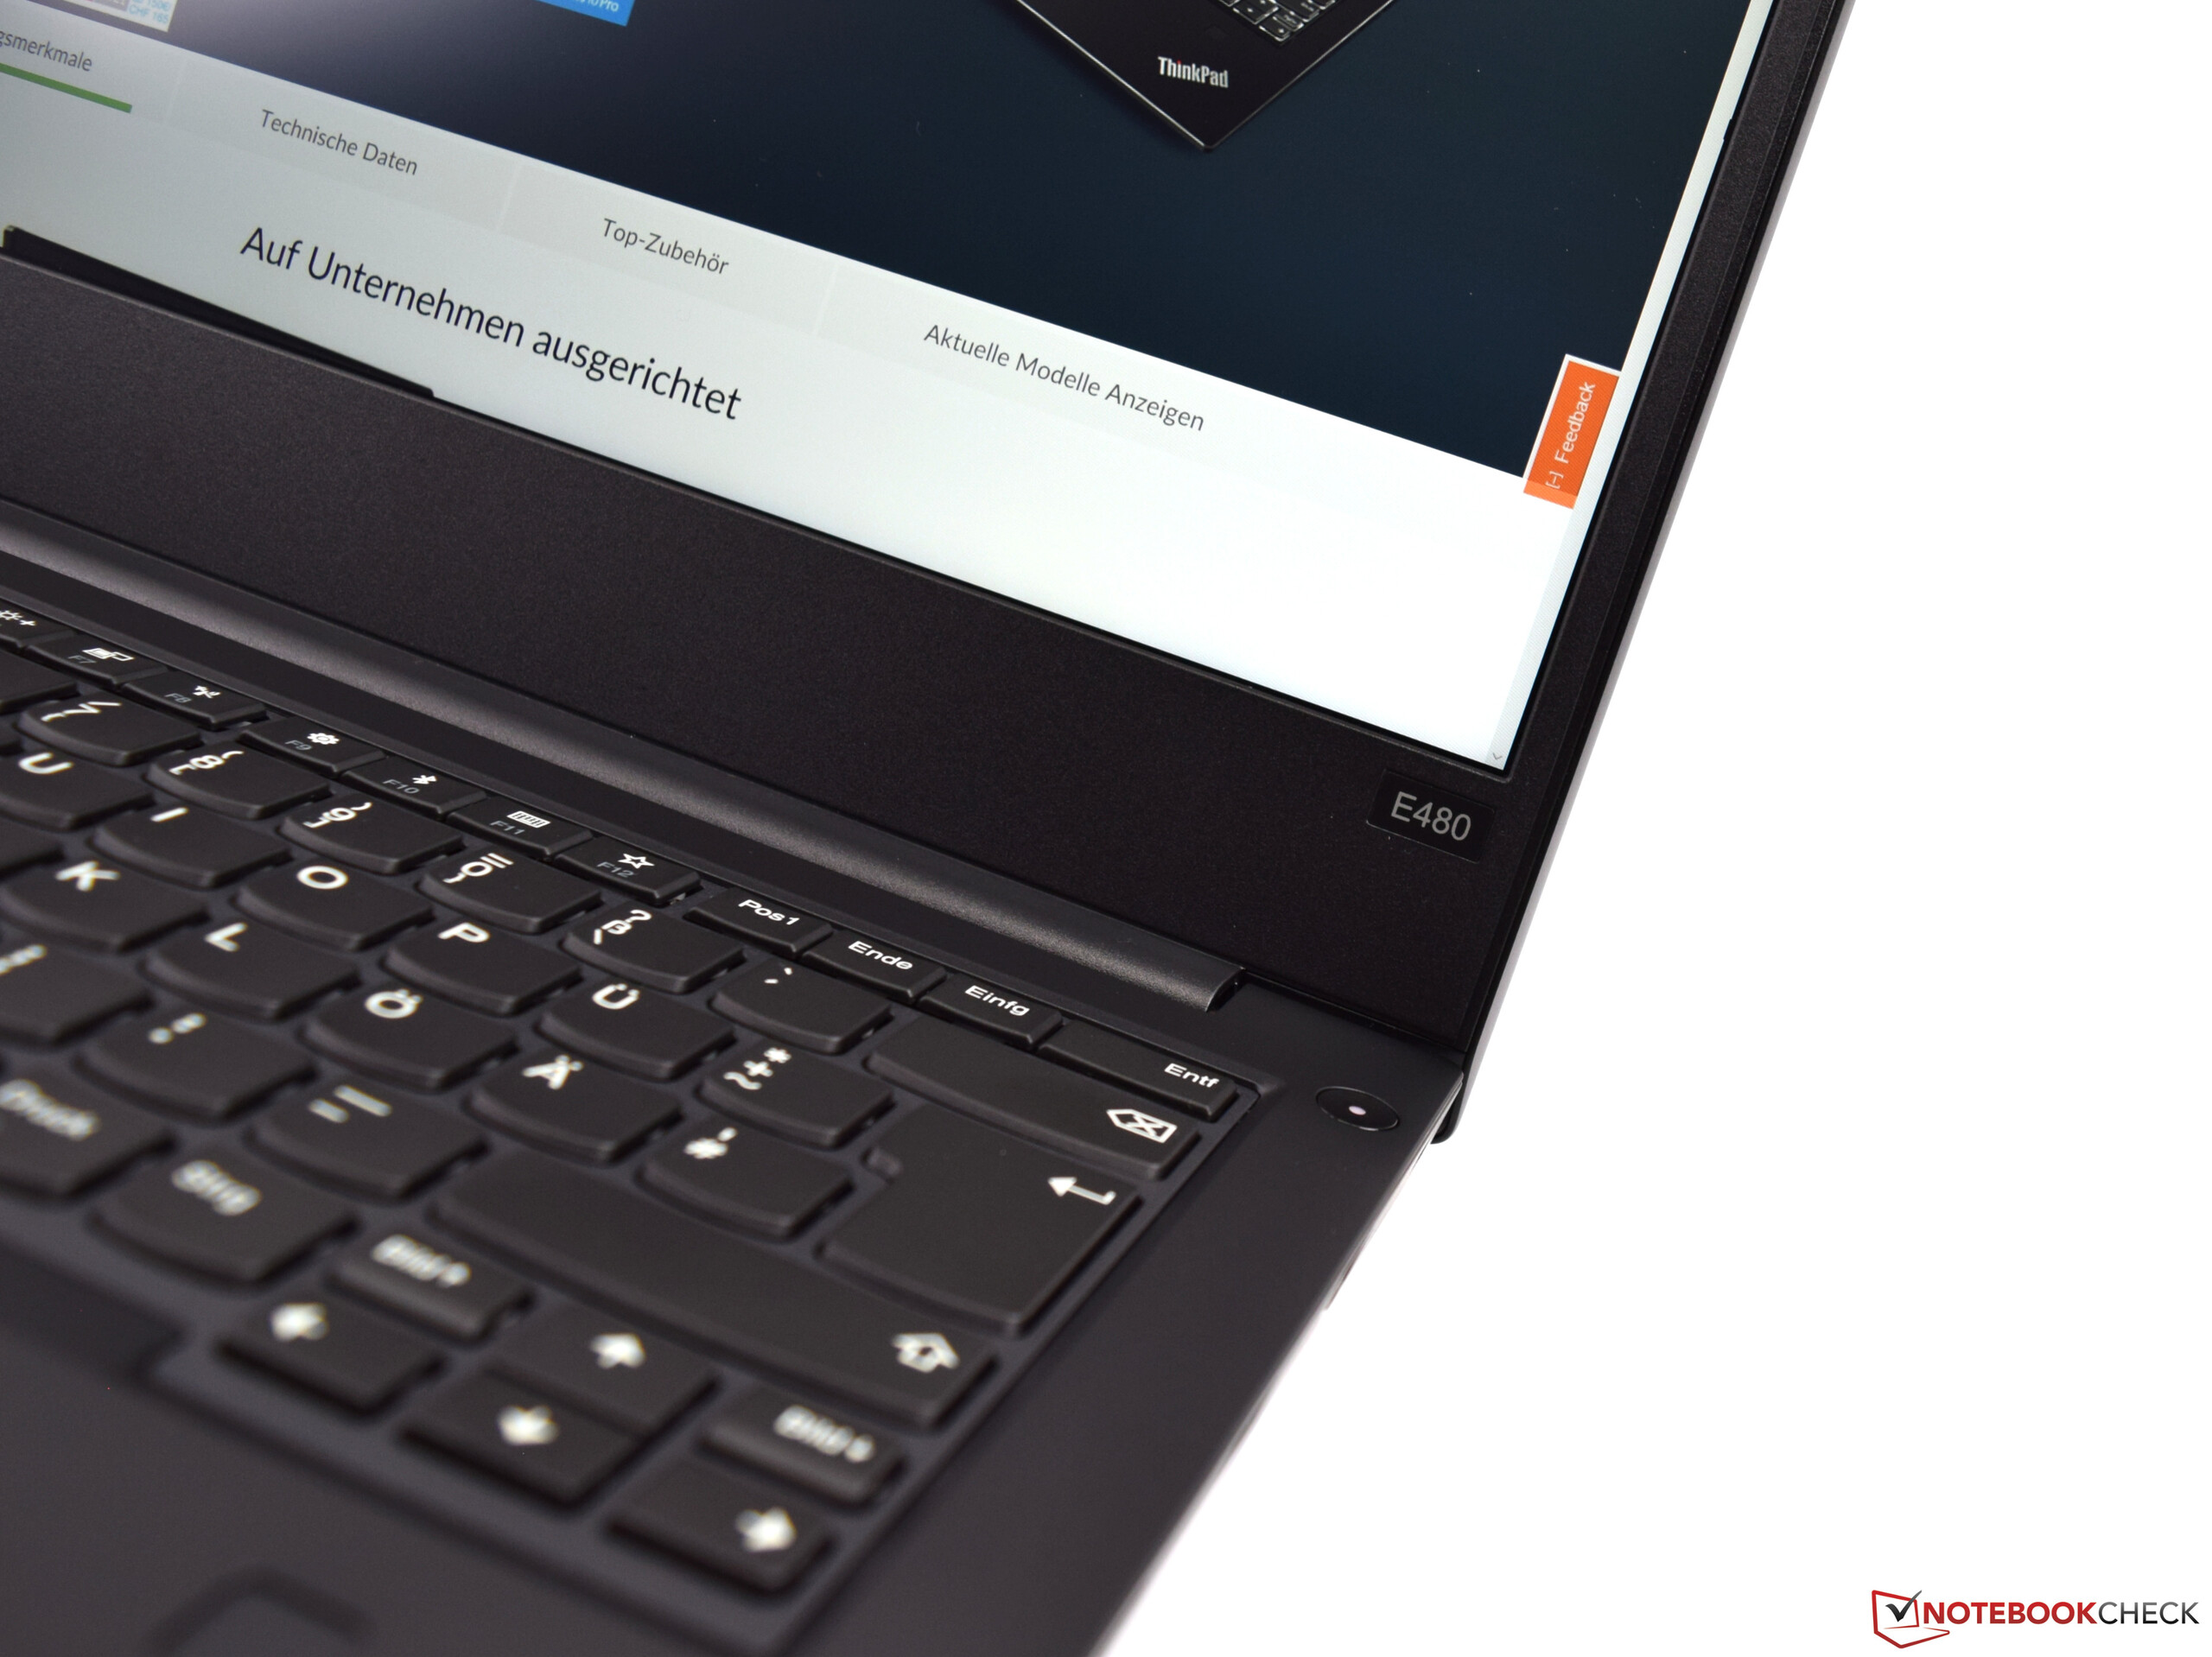
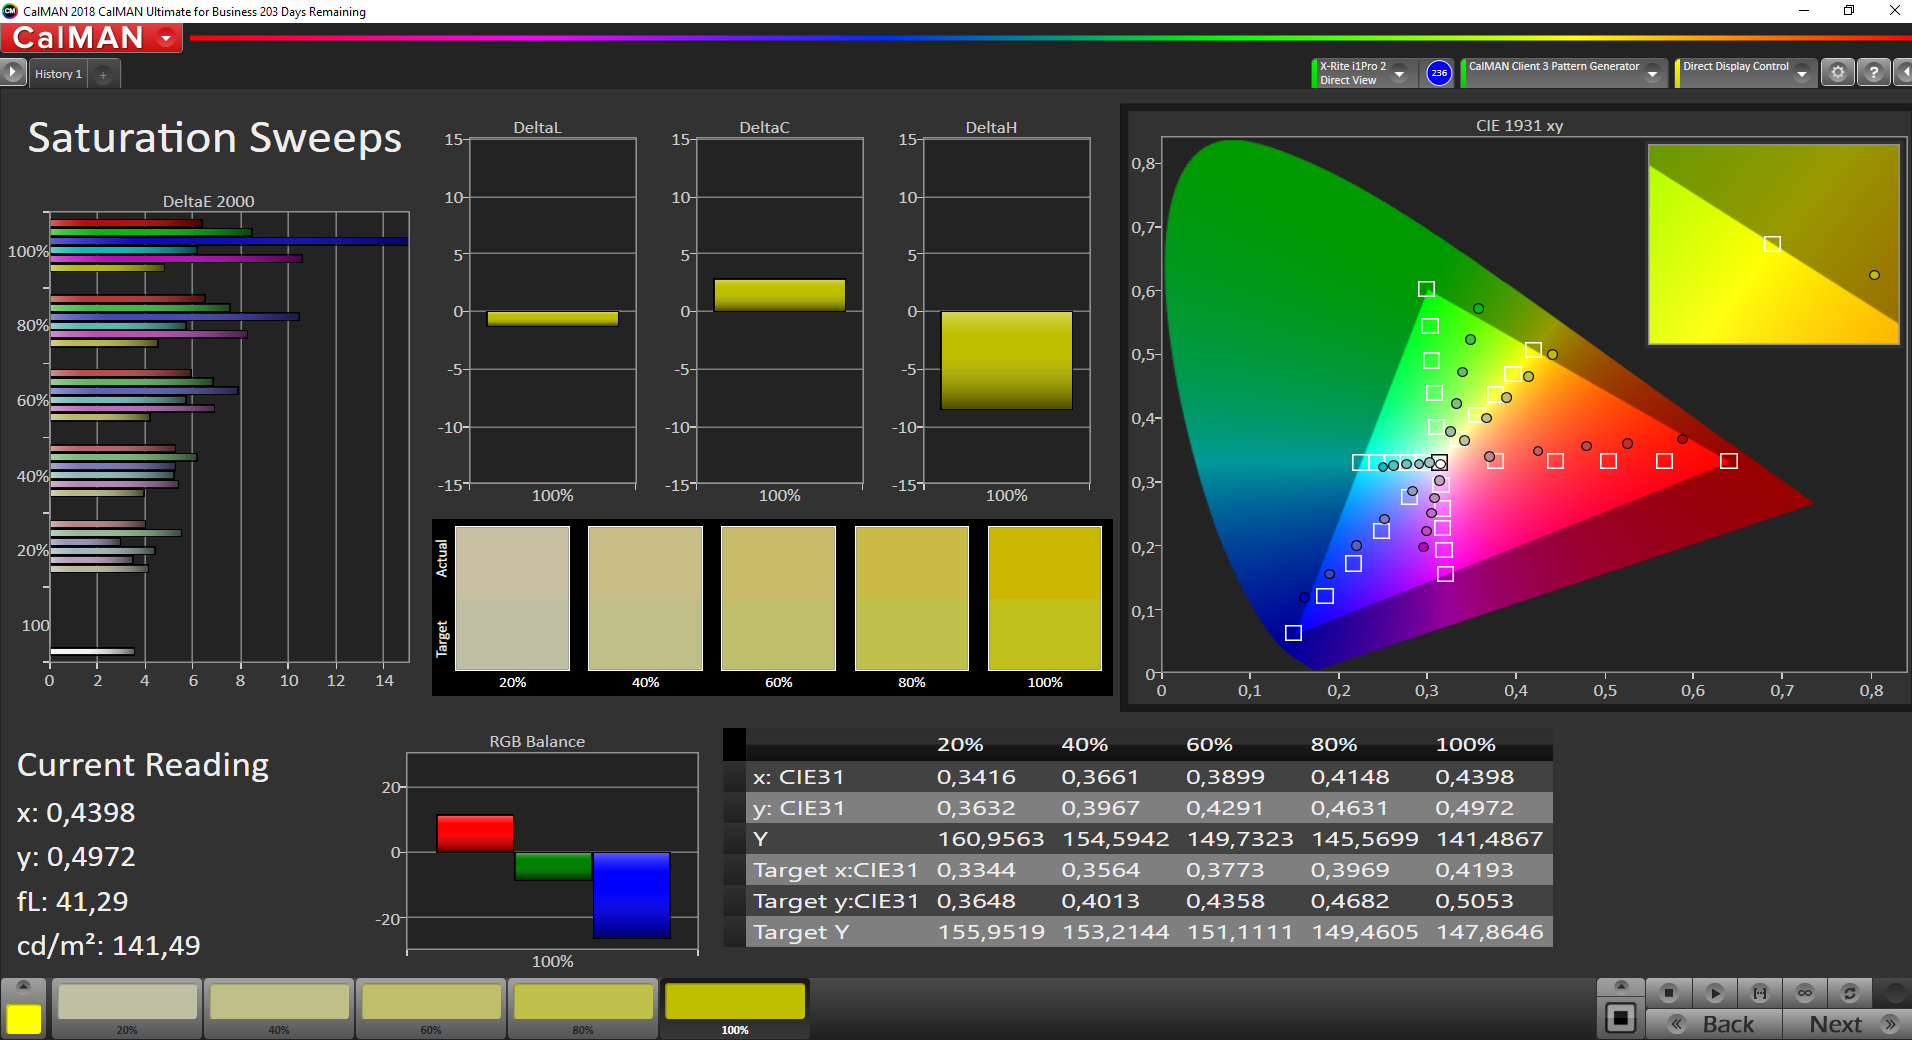
L’écran mat IPS est séduisant avec de bons angles de vision et un bon contraste. La luminosité n’atteint une valeur-cible adéquate (300 cd/m²) que de justesse, mais la fidélité des couleurs est à revoir.
Le ThinkPad E490 laisse dans l’ensemble une très bonne impression. Mais rien ne permet de le préférer vraiment au ThinkPad E480 : si vous avez ce dernier à bon prix, n’hésitez pas à le choisir - mais cela n’est vrai que pour les versions des E480 / E490 avec carte graphique intégrée.
L’intégralité de cette critique est disponible en anglais en suivant ce lien.
Lenovo ThinkPad E490-20N8000RGE
- 09/16/2019 v7 (old)
Sascha Mölck
Price comparison
