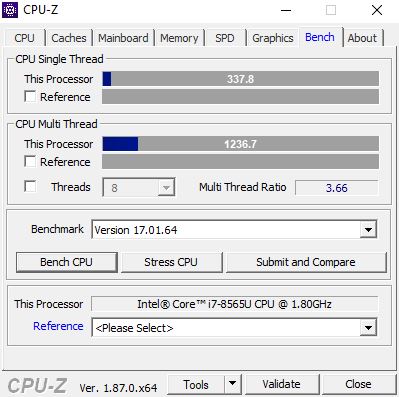
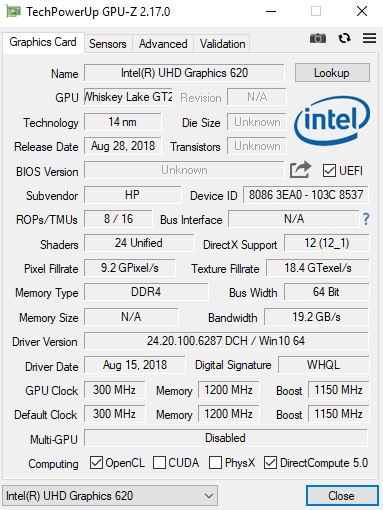
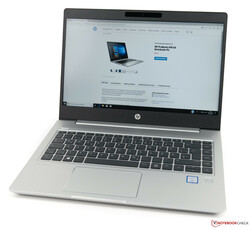
Courte critique du PC portable HP ProBook 440 G6 (i7-8565U, UHD 620, FHD, SSD 512 Go)

| SD Card Reader | |
| average JPG Copy Test (av. of 3 runs) | |
| HP ProBook 440 G5-3KX87ES (Toshiba Exceria Pro SDXC 64 GB UHS-II) | |
| HP ProBook 440 G6-5TK01EA (Toshiba Exceria Pro SDXC 64 GB UHS-II) | |
| Lenovo ThinkPad E480-20KNCTO1WW (Toshiba Exceria Pro M501) | |
| Lenovo ThinkPad A485-20MU000CGE (Toshiba Exceria Pro SDXC 64 GB UHS-II) | |
| Fujitsu Lifebook E548 (Toshiba Exceria Pro SDXC 64 GB UHS-II) | |
| Moyenne de la classe Office (19.8 - 198.5, n=22, 2 dernières années) | |
| Acer TravelMate X3410-M-866T (Toshiba Exceria Pro SDXC 64 GB UHS-II) | |
| maximum AS SSD Seq Read Test (1GB) | |
| HP ProBook 440 G5-3KX87ES (Toshiba Exceria Pro SDXC 64 GB UHS-II) | |
| Lenovo ThinkPad E480-20KNCTO1WW (Toshiba Exceria Pro M501) | |
| Lenovo ThinkPad A485-20MU000CGE (Toshiba Exceria Pro SDXC 64 GB UHS-II) | |
| HP ProBook 440 G6-5TK01EA (Toshiba Exceria Pro SDXC 64 GB UHS-II) | |
| Moyenne de la classe Office (27.4 - 249, n=21, 2 dernières années) | |
| Fujitsu Lifebook E548 (Toshiba Exceria Pro SDXC 64 GB UHS-II) | |
| Acer TravelMate X3410-M-866T (Toshiba Exceria Pro SDXC 64 GB UHS-II) | |
| |||||||||||||||||||||||||
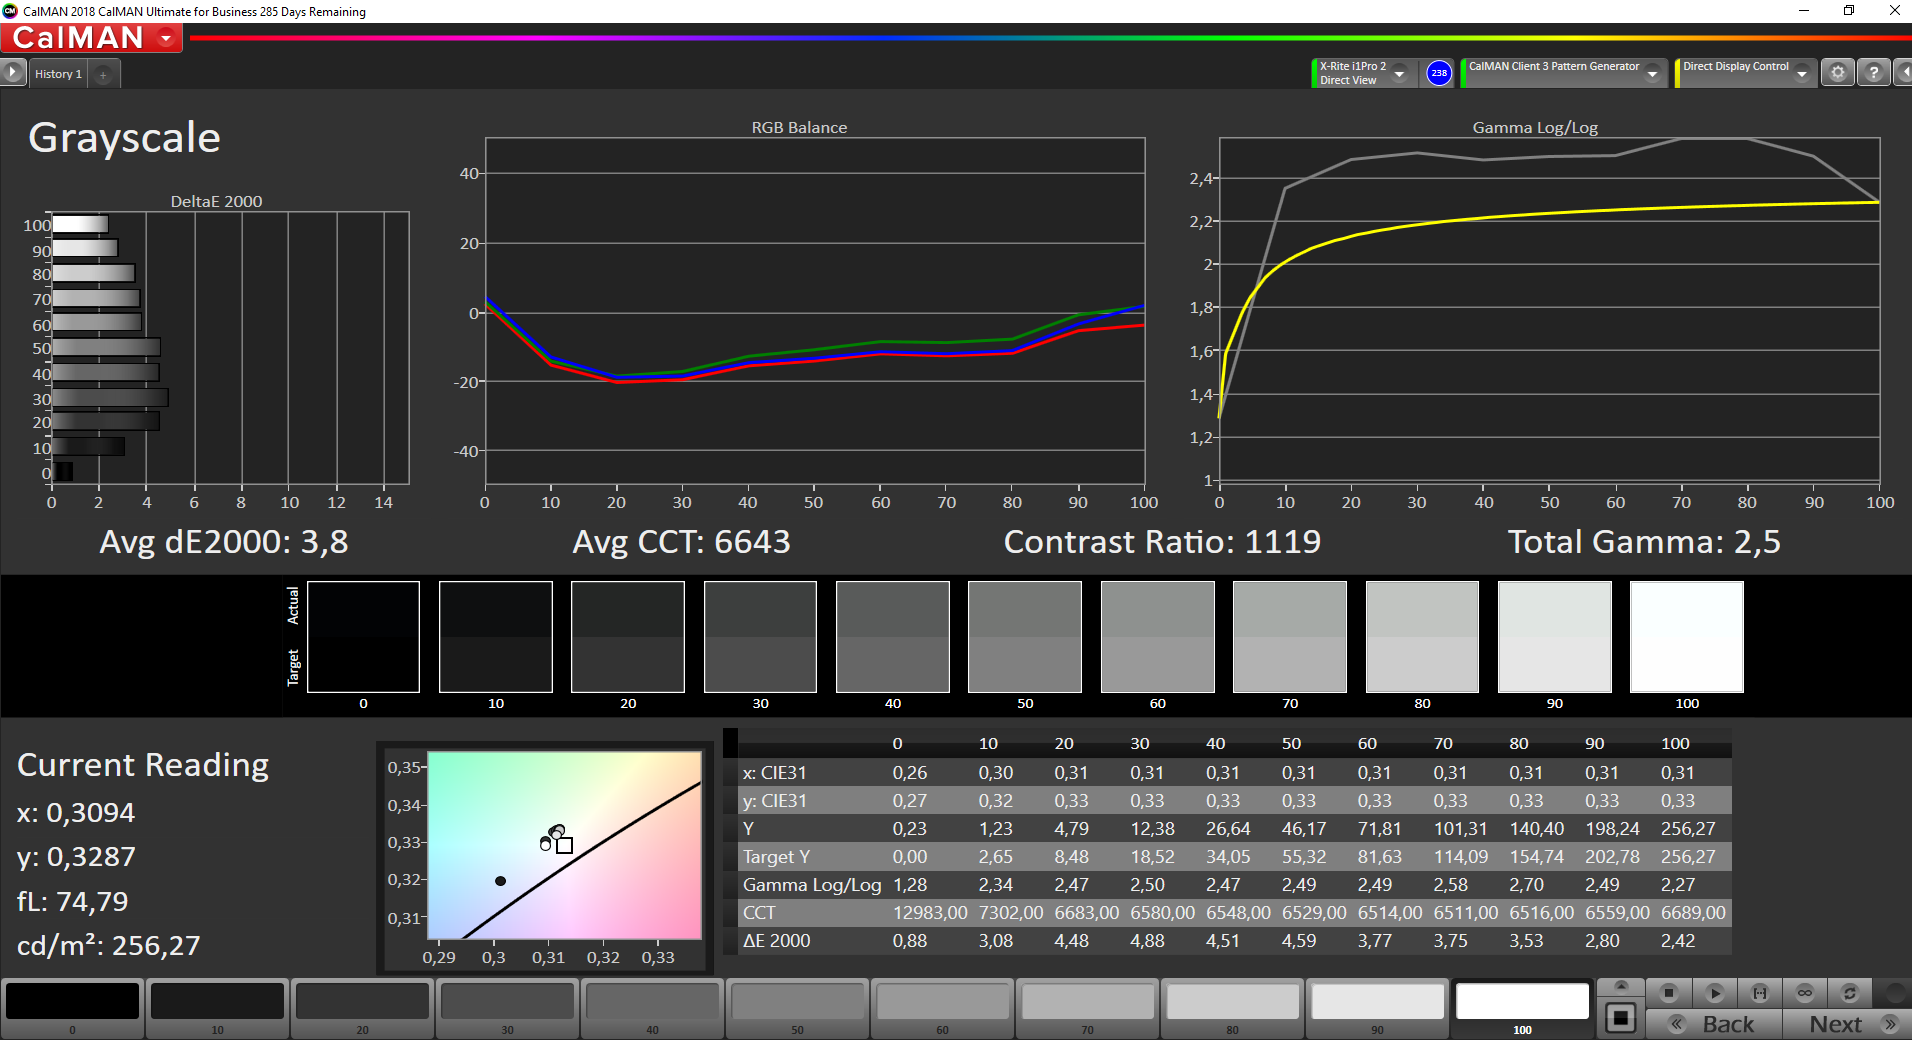
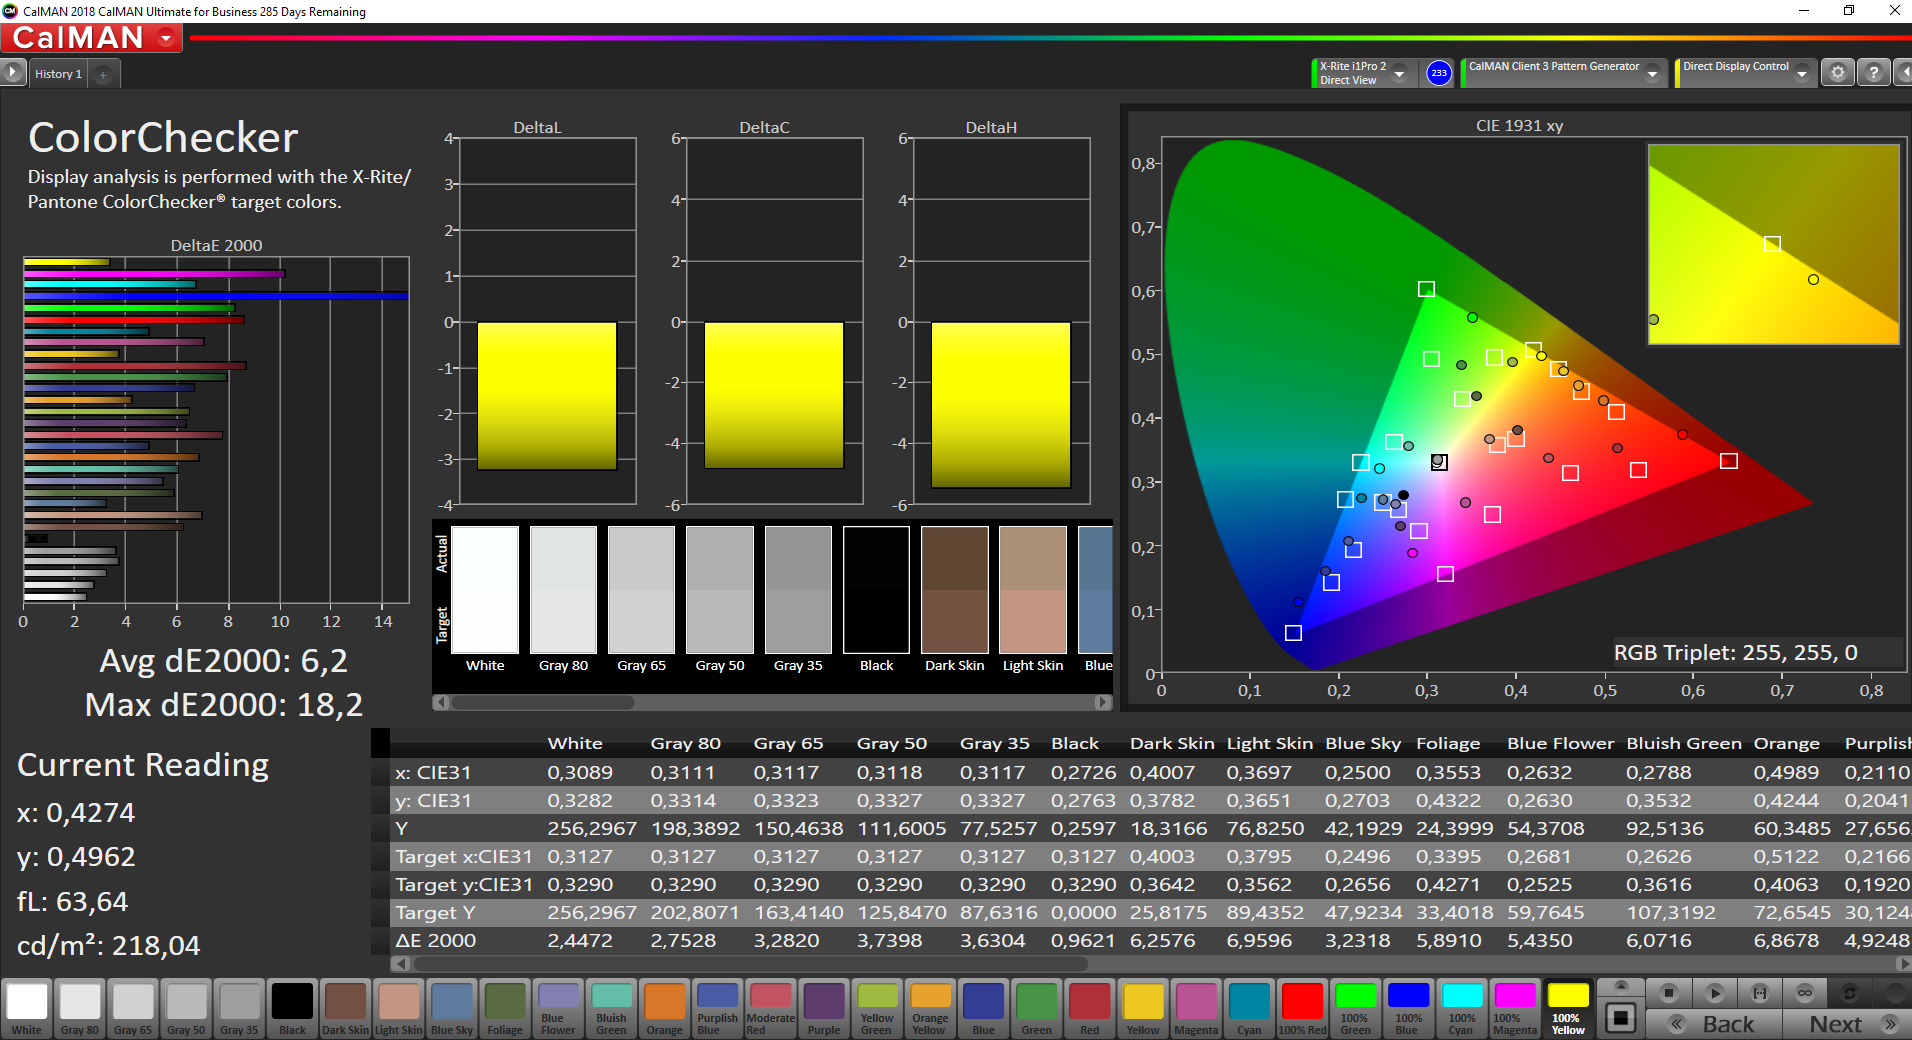
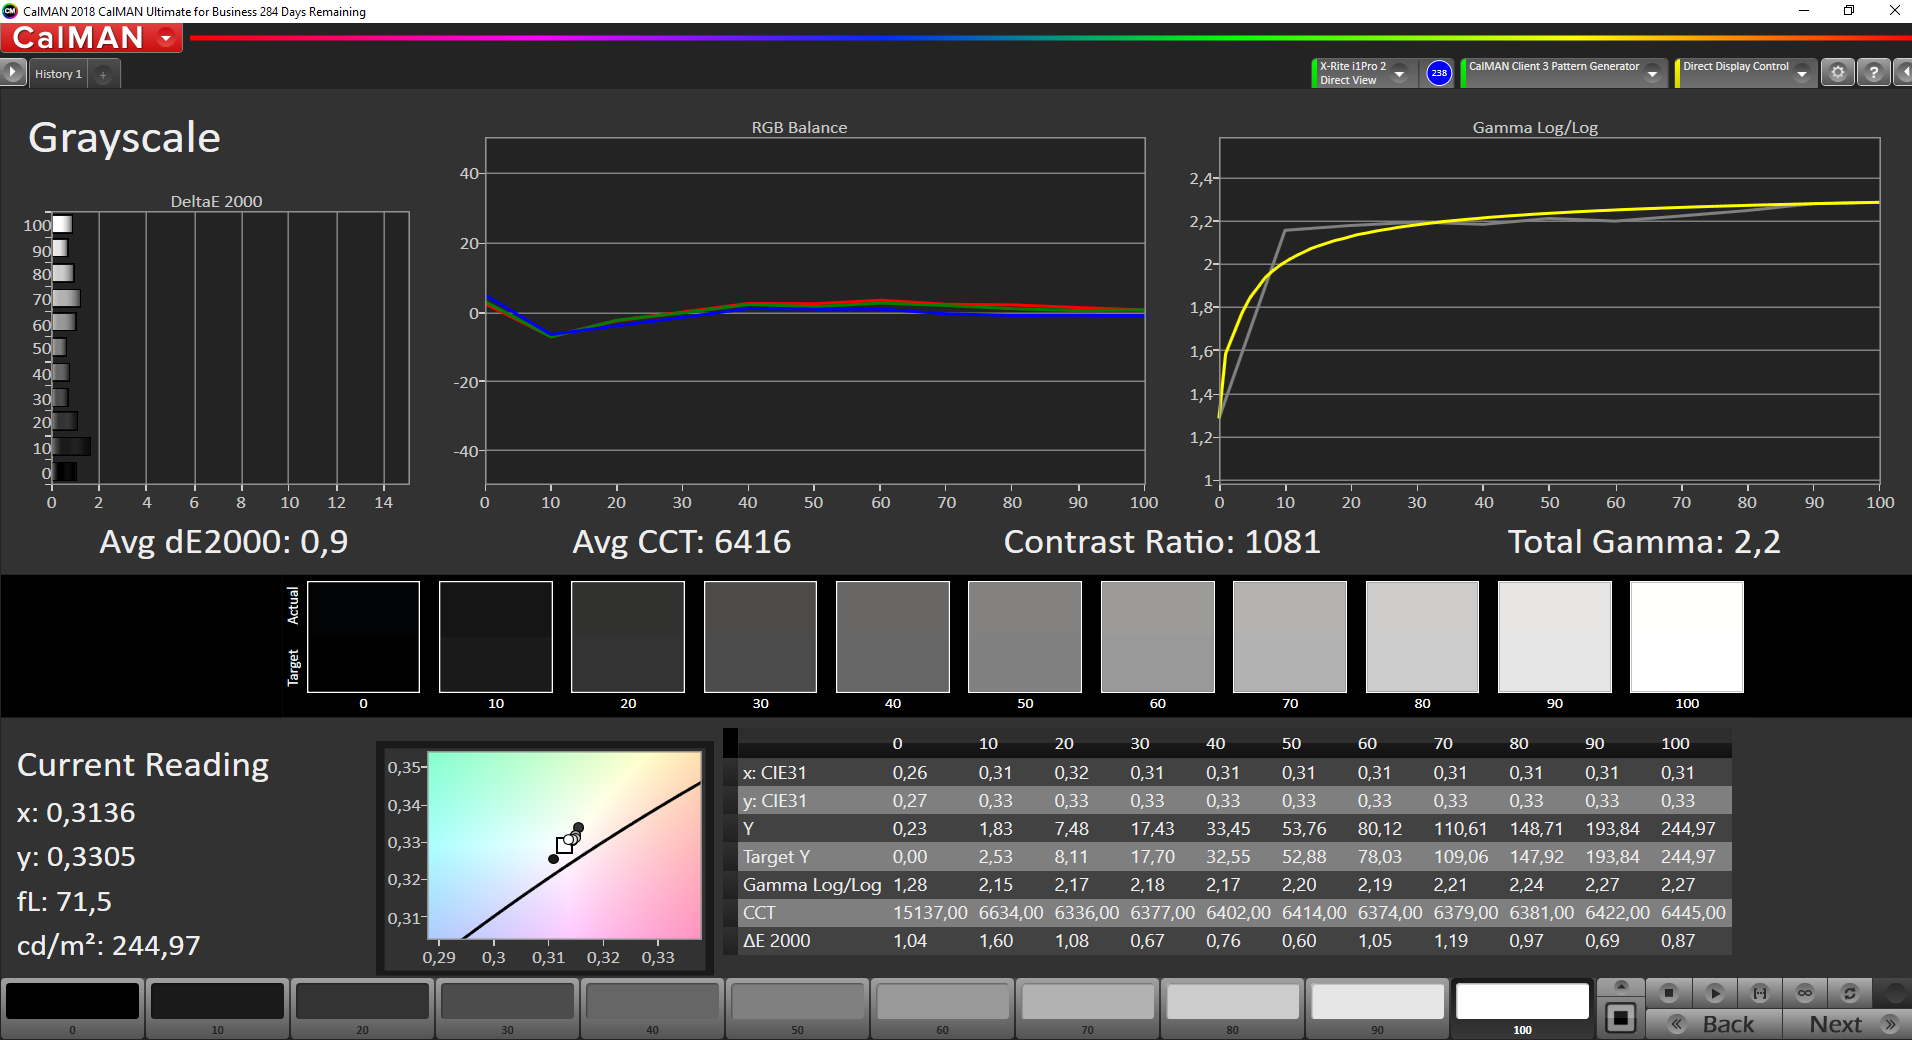
Homogénéité de la luminosité: 85 %
Valeur mesurée au centre, sur batterie: 257 cd/m²
Contraste: 1113:1 (Valeurs des noirs: 0.23 cd/m²)
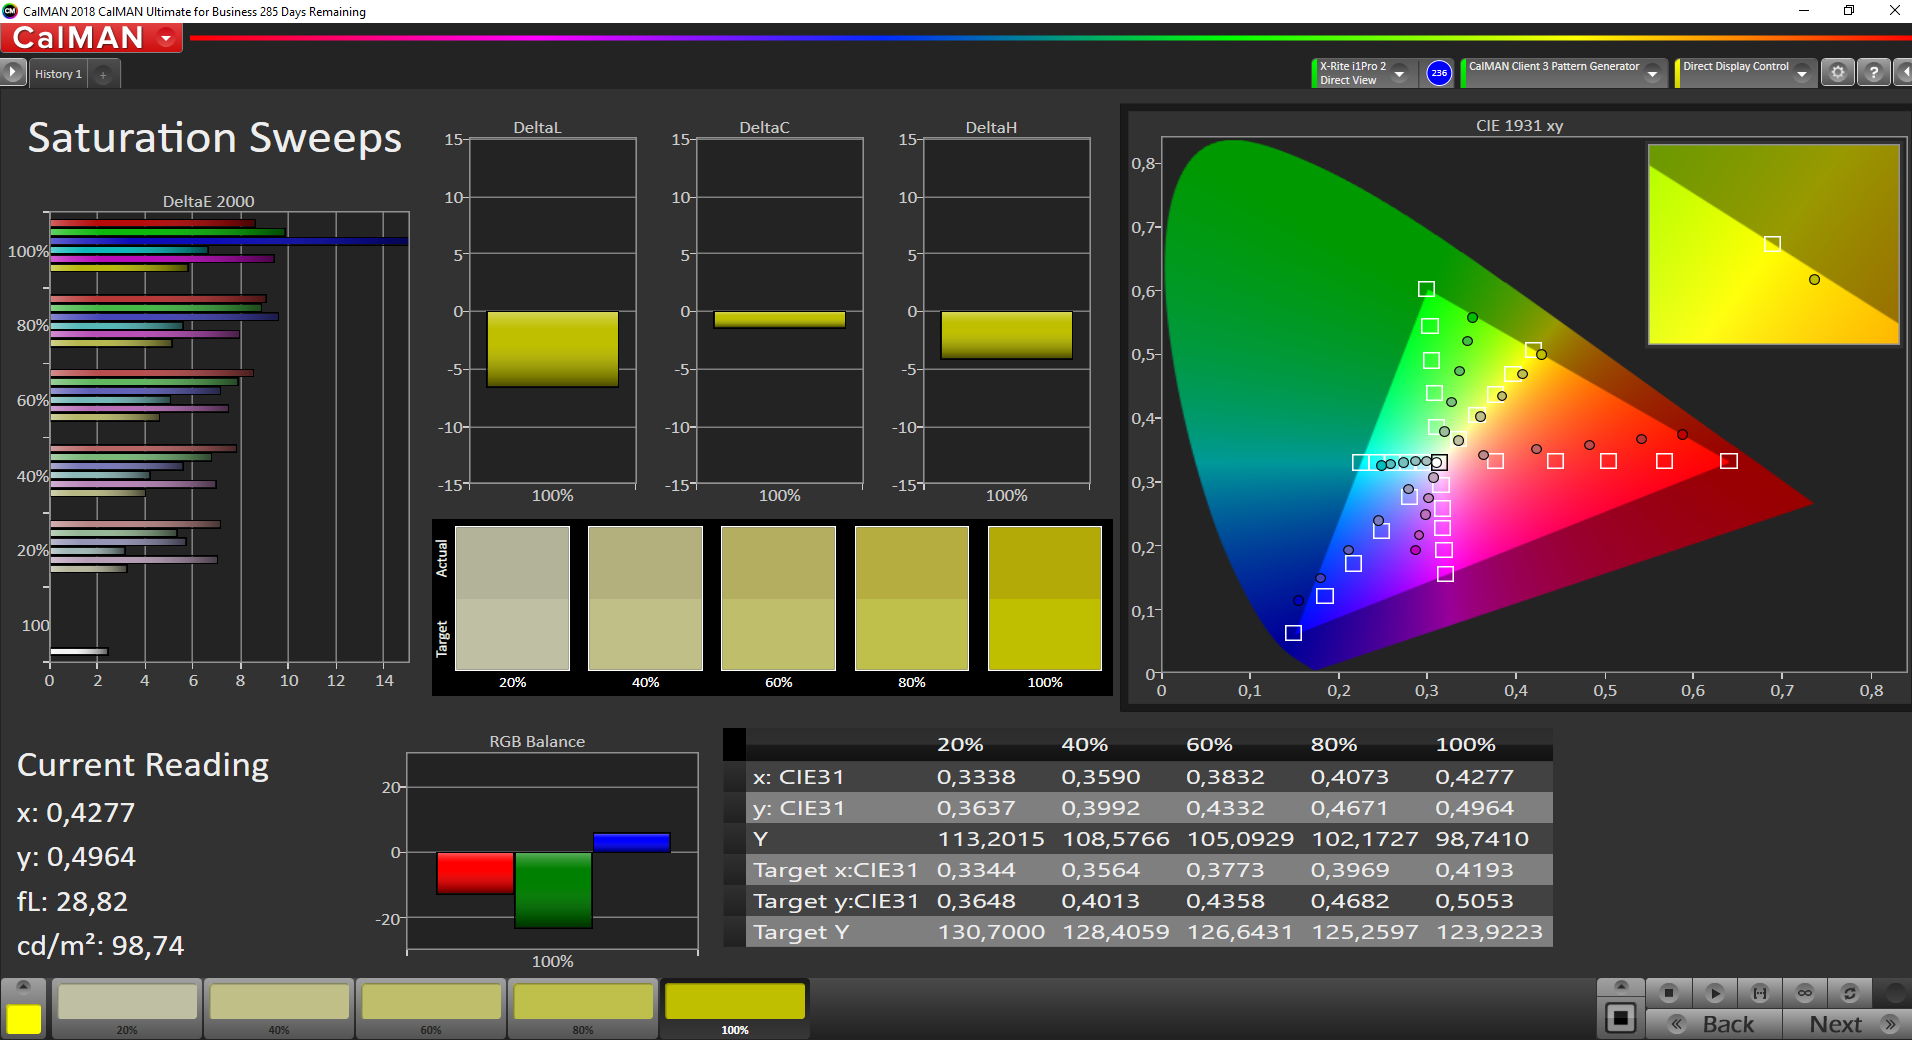
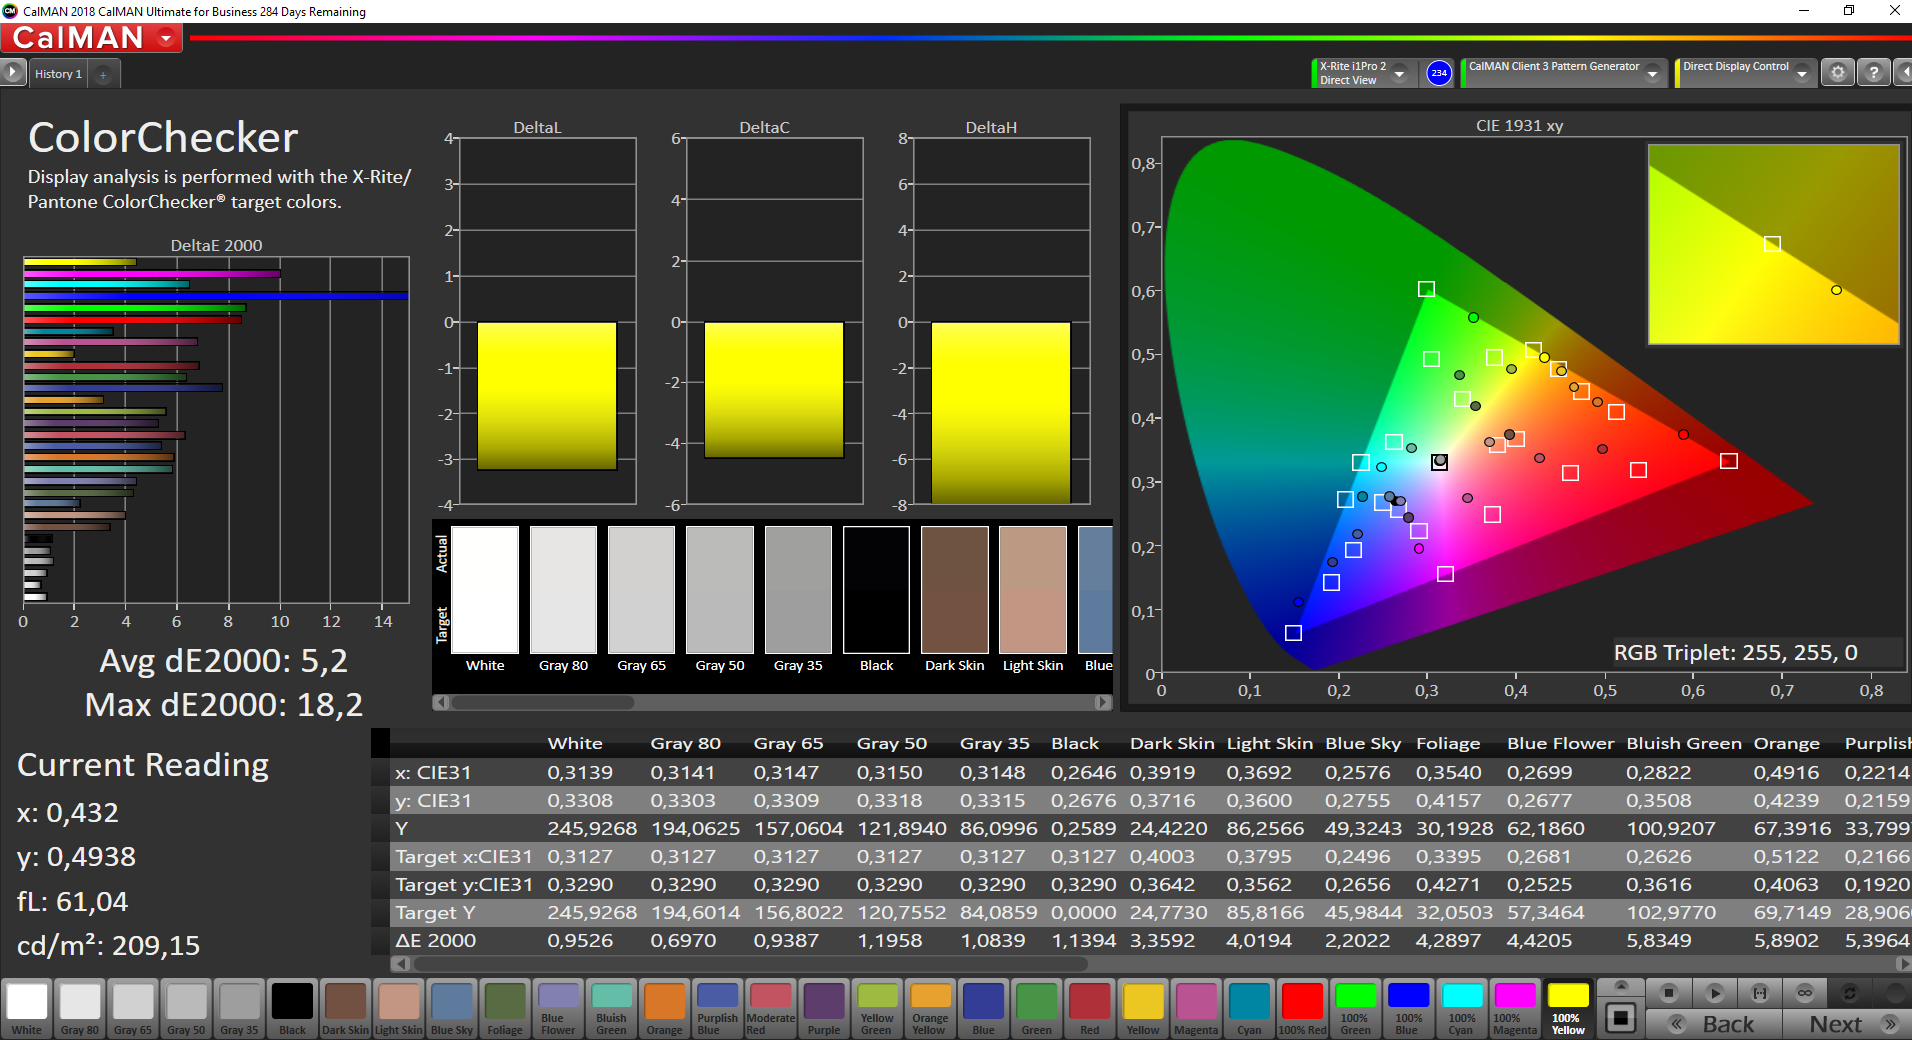
ΔE ColorChecker Calman: 6.2 | ∀{0.5-29.43 Ø4.72}
calibrated: 5.2
ΔE Greyscale Calman: 3.8 | ∀{0.09-98 Ø4.97}
56.9% sRGB (Argyll 1.6.3 3D)
36.1% AdobeRGB 1998 (Argyll 1.6.3 3D)
39.37% AdobeRGB 1998 (Argyll 3D)
57.2% sRGB (Argyll 3D)
38.08% Display P3 (Argyll 3D)
Gamma: 2.5
CCT: 6643 K
| HP ProBook 440 G6-5TK01EA LG Philips, LGD05F1, IPS, 1920x1080, 14" | HP ProBook 440 G5-3KX87ES LGD04B2, IPS LED, 1920x1080, 14" | Lenovo ThinkPad E480-20KNCTO1WW Innolux N140HCA-EAC, IPS LED, 1920x1080, 14" | Lenovo ThinkPad A485-20MU000CGE NV140FHM-N46, IPS LED, 1920x1080, 14" | Acer TravelMate X3410-M-866T Chi Mei CMN14D4, IPS, 1920x1080, 14" | Fujitsu Lifebook E548 LG Philips LGD05B6, IPS, 1920x1080, 14" | Huawei MateBook D 14 W50F BOE0764 / TV140FHM-NH0, IPS, 1920x1080, 14" | |
|---|---|---|---|---|---|---|---|
| Display | 4% | 9% | 6% | 9% | 3% | 13% | |
| Display P3 Coverage (%) | 38.08 | 39.56 4% | 41.56 9% | 40.24 6% | 41.59 9% | 39.21 3% | 43.19 13% |
| sRGB Coverage (%) | 57.2 | 59.3 4% | 62.2 9% | 60 5% | 62.4 9% | 58.5 2% | 64 12% |
| AdobeRGB 1998 Coverage (%) | 39.37 | 40.88 4% | 42.96 9% | 41.57 6% | 42.99 9% | 40.56 3% | 44.62 13% |
| Response Times | -1% | -12% | -19% | -13% | 21% | -18% | |
| Response Time Grey 50% / Grey 80% * (ms) | 41.6 ? | 40 ? 4% | 44.8 ? -8% | 44.8 ? -8% | 40.4 ? 3% | 34 ? 18% | 41 ? 1% |
| Response Time Black / White * (ms) | 27.2 ? | 28.8 ? -6% | 31.2 ? -15% | 35.2 ? -29% | 35.2 ? -29% | 21 ? 23% | 37 ? -36% |
| PWM Frequency (Hz) | 25000 ? | 1000 ? | 25000 ? | 200 ? | |||
| Screen | -5% | -5% | 2% | 1% | -1% | 2% | |
| Brightness middle (cd/m²) | 256 | 236 -8% | 262 2% | 275 7% | 253.1 -1% | 278 9% | 291 14% |
| Brightness (cd/m²) | 238 | 221 -7% | 245 3% | 272 14% | 230 -3% | 240 1% | 276 16% |
| Brightness Distribution (%) | 85 | 88 4% | 83 -2% | 85 0% | 77 -9% | 78 -8% | 85 0% |
| Black Level * (cd/m²) | 0.23 | 0.26 -13% | 0.19 17% | 0.26 -13% | 0.3 -30% | 0.27 -17% | 0.46 -100% |
| Contrast (:1) | 1113 | 908 -18% | 1379 24% | 1058 -5% | 844 -24% | 1030 -7% | 633 -43% |
| Colorchecker dE 2000 * | 6.2 | 5.7 8% | 7 -13% | 5.9 5% | 4.71 24% | 5.57 10% | 4.3 31% |
| Colorchecker dE 2000 max. * | 18.2 | 22 -21% | 23.6 -30% | 20 -10% | 20.72 -14% | 11.01 40% | 10.01 45% |
| Colorchecker dE 2000 calibrated * | 5.2 | 4.9 6% | 3.44 34% | 5.63 -8% | 3.18 39% | ||
| Greyscale dE 2000 * | 3.8 | 3.8 -0% | 6.4 -68% | 3.6 5% | 3.4 11% | 4.94 -30% | 4.21 -11% |
| Gamma | 2.5 88% | 2.1 105% | 2.14 103% | 2.36 93% | 1.997 110% | 2.6 85% | 2.46 89% |
| CCT | 6643 98% | 7318 89% | 6065 107% | 6798 96% | 6266 104% | 7322 89% | 6867 95% |
| Color Space (Percent of AdobeRGB 1998) (%) | 36.1 | 37.7 4% | 39.5 9% | 38.1 6% | 40 11% | 37 2% | 41 14% |
| Color Space (Percent of sRGB) (%) | 56.9 | 59.2 4% | 61.9 9% | 59.6 5% | 62 9% | 58 2% | 64 12% |
| Moyenne finale (programmes/paramètres) | -1% /
-2% | -3% /
-3% | -4% /
0% | -1% /
1% | 8% /
3% | -1% /
1% |
* ... Moindre est la valeur, meilleures sont les performances
Temps de réponse de l'écran
| ↔ Temps de réponse noir à blanc | ||
|---|---|---|
| 27.2 ms ... hausse ↗ et chute ↘ combinées | ↗ 15.6 ms hausse | 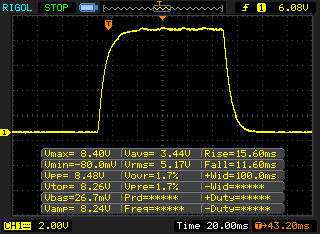 |
| ↘ 11.6 ms chute | ||
| L'écran souffre de latences relativement élevées, insuffisant pour le jeu. En comparaison, tous les appareils testés affichent entre 0.1 (minimum) et 240 (maximum) ms. » 69 % des appareils testés affichent de meilleures performances. Cela signifie que les latences relevées sont moins bonnes que la moyenne (19.8 ms) de tous les appareils testés. | ||
| ↔ Temps de réponse gris 50% à gris 80% | ||
| 41.6 ms ... hausse ↗ et chute ↘ combinées | ↗ 22.8 ms hausse | 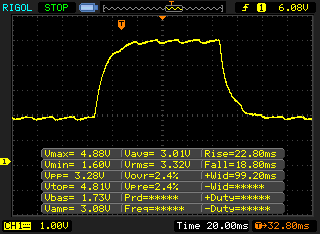 |
| ↘ 18.8 ms chute | ||
| L'écran souffre de latences très élevées, à éviter pour le jeu. En comparaison, tous les appareils testés affichent entre 0.165 (minimum) et 636 (maximum) ms. » 67 % des appareils testés affichent de meilleures performances. Cela signifie que les latences relevées sont moins bonnes que la moyenne (31 ms) de tous les appareils testés. | ||
Scintillement / MLI (Modulation de largeur d'impulsion)
| Scintillement / MLI (Modulation de largeur d'impulsion) non décelé | 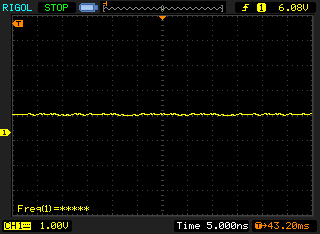 | ||
En comparaison, 52 % des appareils testés n'emploient pas MDI pour assombrir leur écran. Nous avons relevé une moyenne à 7765 (minimum : 5 - maximum : 343500) Hz dans le cas où une MDI était active. | |||
| Blender - v2.79 BMW27 CPU | |
| Lenovo ThinkPad A485-20MU000CGE | |
| HP ProBook 440 G6-5TK01EA | |
| Moyenne Intel Core i7-8565U (687 - 1175, n=22) | |
| Moyenne de la classe Office (158 - 1940, n=74, 2 dernières années) | |
* ... Moindre est la valeur, meilleures sont les performances
| PCMark 8 Home Score Accelerated v2 | 4071 points | |
| PCMark 8 Creative Score Accelerated v2 | 5124 points | |
| PCMark 8 Work Score Accelerated v2 | 5160 points | |
| PCMark 10 Score | 4015 points | |
Aide | ||
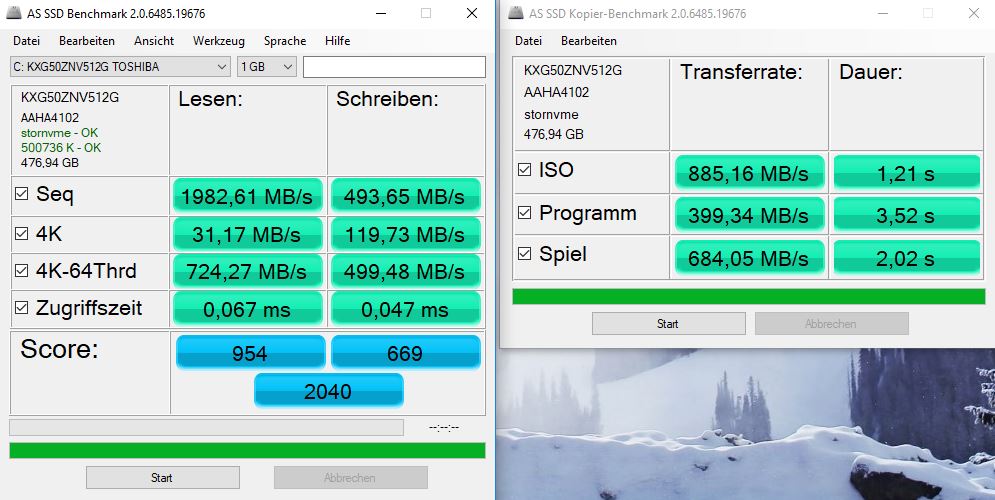
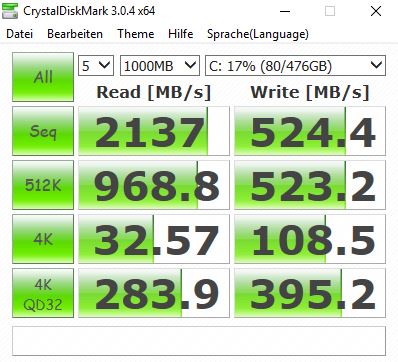
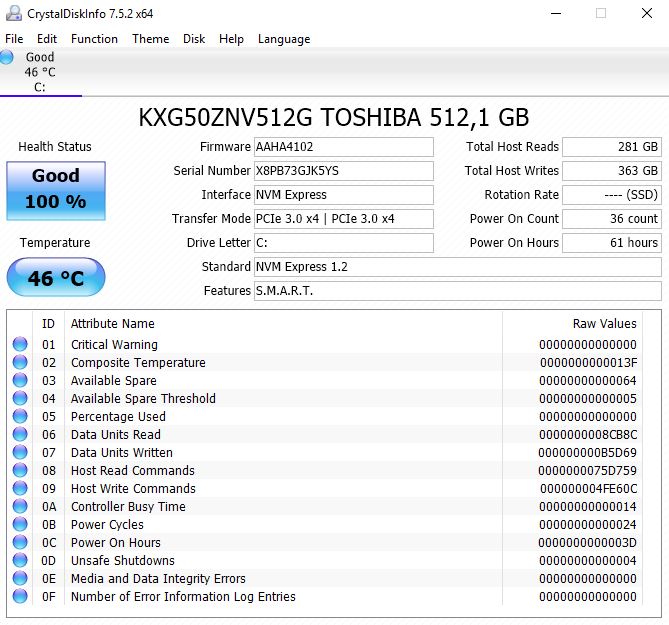
| HP ProBook 440 G6-5TK01EA Toshiba XG5 KXG50ZNV512G | HP ProBook 440 G5-3KX87ES Intel SSD 600p SSDPEKKW256G7 | Lenovo ThinkPad E480-20KNCTO1WW Toshiba KBG30ZMT128G | Lenovo ThinkPad A485-20MU000CGE Samsung SSD PM981 MZVLB256HAHQ | Acer TravelMate X3410-M-866T Micron SSD 1100 SED 512GB, M.2 (MTFDDAV512TBN) | Fujitsu Lifebook E548 Samsung SSD PM871b MZNLN256HAJQ | Huawei MateBook D 14 W50F SanDisk SD9SN8W256G1027 | Moyenne Toshiba XG5 KXG50ZNV512G | |
|---|---|---|---|---|---|---|---|---|
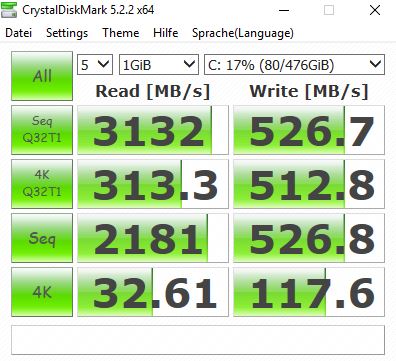
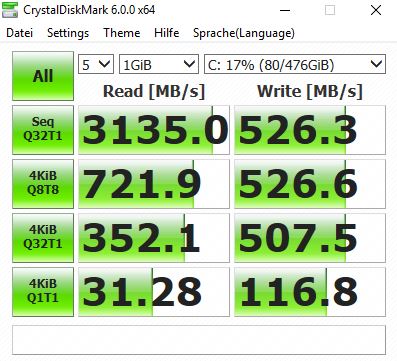
| CrystalDiskMark 5.2 / 6 | -12% | -54% | 34% | -32% | -42% | -41% | 18% | |
| Write 4K (MB/s) | 117.6 | 135.3 15% | 81.4 -31% | 114.8 -2% | 113.3 -4% | 83.2 -29% | 60.5 -49% | 114 ? -3% |
| Read 4K (MB/s) | 32.61 | 34.35 5% | 33.74 3% | 41.33 27% | 28.65 -12% | 16.66 -49% | 21.63 -34% | 35.6 ? 9% |
| Write Seq (MB/s) | 527 | 601 14% | 129 -76% | 1271 141% | 428.7 -19% | 384.3 -27% | 450.9 -14% | 684 ? 30% |
| Read Seq (MB/s) | 2181 | 1175 -46% | 905 -59% | 1171 -46% | 435.2 -80% | 466.8 -79% | 482.3 -78% | 1612 ? -26% |
| Write 4K Q32T1 (MB/s) | 508 | 377.6 -26% | 107.2 -79% | 218.4 -57% | 274.6 -46% | 269.7 -47% | 248.9 -51% | 401 ? -21% |
| Read 4K Q32T1 (MB/s) | 352.1 | 288.3 -18% | 197.1 -44% | 308.5 -12% | 326.5 -7% | 260 -26% | 267.6 -24% | 427 ? 21% |
| Write Seq Q32T1 (MB/s) | 526 | 591 12% | 128.9 -75% | 1460 178% | 505 -4% | 532 1% | 534 2% | 830 ? 58% |
| Read Seq Q32T1 (MB/s) | 3135 | 1574 -50% | 906 -71% | 1529 -51% | 530 -83% | 545 -83% | 563 -82% | 2950 ? -6% |
| Write 4K Q8T8 (MB/s) | 527 | 1208 129% | 887 ? 68% | |||||
| Read 4K Q8T8 (MB/s) | 722 | 983 36% | 1060 ? 47% | |||||
| AS SSD | -28% | -88% | -10% | -36% | -48% | -65% | -14% | |
| Seq Read (MB/s) | 1983 | 1282 -35% | 1015 -49% | 1224 -38% | 464.9 -77% | 448.4 -77% | 458.3 -77% | 2137 ? 8% |
| Seq Write (MB/s) | 493.6 | 430 -13% | 115.4 -77% | 1118 126% | 465.2 -6% | 246.1 -50% | 268.6 -46% | 744 ? 51% |
| 4K Read (MB/s) | 31.17 | 31.9 2% | 31.13 0% | 42.46 36% | 22.96 -26% | 14.13 -55% | 26.87 -14% | 30.1 ? -3% |
| 4K Write (MB/s) | 119.7 | 106.5 -11% | 78.9 -34% | 77.4 -35% | 89.1 -26% | 72.1 -40% | 51.7 -57% | 93.6 ? -22% |
| 4K-64 Read (MB/s) | 724 | 277.5 -62% | 190.9 -74% | 559 -23% | 350.5 -52% | 375.2 -48% | 364.2 -50% | 784 ? 8% |
| 4K-64 Write (MB/s) | 499.5 | 485 -3% | 92.1 -82% | 378.1 -24% | 313.3 -37% | 288.8 -42% | 137.3 -73% | 515 ? 3% |
| Access Time Read * (ms) | 0.067 | 0.119 -78% | 0.106 -58% | 0.081 -21% | 0.123 -84% | 0.092 -37% | 0.09253 ? -38% | |
| Access Time Write * (ms) | 0.047 | 0.032 32% | 0.235 -400% | 0.049 -4% | 0.047 -0% | 0.041 13% | 0.13 -177% | 0.1653 ? -252% |
| Score Read (Points) | 954 | 438 -54% | 324 -66% | 724 -24% | 420 -56% | 434 -55% | 437 -54% | 1028 ? 8% |
| Score Write (Points) | 669 | 634 -5% | 182 -73% | 567 -15% | 449 -33% | 385 -42% | 216 -68% | 683 ? 2% |
| Score Total (Points) | 2040 | 1264 -38% | 638 -69% | 1669 -18% | 1090 -47% | 1034 -49% | 875 -57% | 2170 ? 6% |
| Copy ISO MB/s (MB/s) | 885 | 522 -41% | 108.2 -88% | 812 -8% | 1109 ? 25% | |||
| Copy Program MB/s (MB/s) | 399.3 | 229.6 -42% | 78 -80% | 209.4 -48% | 380 ? -5% | |||
| Copy Game MB/s (MB/s) | 684 | 395.8 -42% | 105.5 -85% | 356.1 -48% | 738 ? 8% | |||
| Moyenne finale (programmes/paramètres) | -20% /
-22% | -71% /
-76% | 12% /
8% | -34% /
-34% | -45% /
-46% | -53% /
-55% | 2% /
-1% |
* ... Moindre est la valeur, meilleures sont les performances

| 3DMark 11 Performance | 1997 points | |
| 3DMark Ice Storm Standard Score | 45682 points | |
| 3DMark Cloud Gate Standard Score | 8458 points | |
| 3DMark Fire Strike Score | 1090 points | |
| 3DMark Fire Strike Extreme Score | 506 points | |
Aide | ||
| Bas | Moyen | Élevé | Ultra | |
|---|---|---|---|---|
| BioShock Infinite (2013) | 59.8 | 34.3 | 27.4 | 8.2 |
| Dota 2 Reborn (2015) | 70 | 42.5 | 19.7 | 17.5 |
| Rise of the Tomb Raider (2016) | 20.6 | 13.4 | 6.9 | |
| Rocket League (2017) | 25.5 | 16.9 | ||
| X-Plane 11.11 (2018) | 30.3 | 22.7 | 19.1 |
Degré de la nuisance sonore
| Au repos |
| 29.4 / 29.4 / 30.2 dB(A) |
| Fortement sollicité |
| 31.8 / 33.1 dB(A) |
 | ||
30 dB silencieux 40 dB(A) audible 50 dB(A) bruyant |
||
min: | ||
| HP ProBook 440 G6-5TK01EA UHD Graphics 620, i7-8565U, Toshiba XG5 KXG50ZNV512G | HP ProBook 440 G5-3KX87ES UHD Graphics 620, i5-8250U, Intel SSD 600p SSDPEKKW256G7 | Lenovo ThinkPad E480-20KNCTO1WW UHD Graphics 620, i5-8250U, Toshiba KBG30ZMT128G | Lenovo ThinkPad A485-20MU000CGE Vega 8, R5 PRO 2500U, Samsung SSD PM981 MZVLB256HAHQ | Acer TravelMate X3410-M-866T UHD Graphics 620, i5-8550U, Micron SSD 1100 SED 512GB, M.2 (MTFDDAV512TBN) | Fujitsu Lifebook E548 UHD Graphics 620, i5-8250U, Samsung SSD PM871b MZNLN256HAJQ | Huawei MateBook D 14 W50F UHD Graphics 620, i5-8250U, SanDisk SD9SN8W256G1027 | |
|---|---|---|---|---|---|---|---|
| Noise | -3% | 0% | 1% | 1% | -3% | -3% | |
| arrêt / environnement * (dB) | 29.4 | 29.1 1% | 29.1 1% | 29.3 -0% | 28.2 4% | 30 -2% | 30.5 -4% |
| Idle Minimum * (dB) | 29.4 | 29.1 1% | 29.1 1% | 29.3 -0% | 28.2 4% | 30 -2% | 30.5 -4% |
| Idle Average * (dB) | 29.4 | 29.1 1% | 29.1 1% | 29.3 -0% | 28.2 4% | 30 -2% | 30.5 -4% |
| Idle Maximum * (dB) | 30.2 | 30.7 -2% | 30.3 -0% | 29.6 2% | 28.2 7% | 30 1% | 30.5 -1% |
| Load Average * (dB) | 31.8 | 34.5 -8% | 31.8 -0% | 31.6 1% | 33.2 -4% | 35.3 -11% | 33.6 -6% |
| Load Maximum * (dB) | 33.1 | 36 -9% | 33.8 -2% | 31.6 5% | 35.6 -8% | 33.9 -2% | 32.6 2% |
* ... Moindre est la valeur, meilleures sont les performances
(+) La température maximale du côté supérieur est de 38.3 °C / 101 F, par rapport à la moyenne de 34.3 °C / 94 F, allant de 21.2 à 62.5 °C pour la classe Office.
(-) Le fond chauffe jusqu'à un maximum de 50.5 °C / 123 F, contre une moyenne de 36.8 °C / 98 F
(+) En utilisation inactive, la température moyenne du côté supérieur est de 24.1 °C / 75 F, par rapport à la moyenne du dispositif de 29.5 °C / 85 F.
(+) Les repose-poignets et le pavé tactile sont plus froids que la température de la peau avec un maximum de 30.3 °C / 86.5 F et sont donc froids au toucher.
(-) La température moyenne de la zone de l'appui-paume de dispositifs similaires était de 27.5 °C / 81.5 F (-2.8 °C / #-5 F).
| HP ProBook 440 G6-5TK01EA UHD Graphics 620, i7-8565U, Toshiba XG5 KXG50ZNV512G | HP ProBook 440 G5-3KX87ES UHD Graphics 620, i5-8250U, Intel SSD 600p SSDPEKKW256G7 | Lenovo ThinkPad E480-20KNCTO1WW UHD Graphics 620, i5-8250U, Toshiba KBG30ZMT128G | Lenovo ThinkPad A485-20MU000CGE Vega 8, R5 PRO 2500U, Samsung SSD PM981 MZVLB256HAHQ | Acer TravelMate X3410-M-866T UHD Graphics 620, i5-8550U, Micron SSD 1100 SED 512GB, M.2 (MTFDDAV512TBN) | Fujitsu Lifebook E548 UHD Graphics 620, i5-8250U, Samsung SSD PM871b MZNLN256HAJQ | Huawei MateBook D 14 W50F UHD Graphics 620, i5-8250U, SanDisk SD9SN8W256G1027 | |
|---|---|---|---|---|---|---|---|
| Heat | 2% | 9% | -9% | 2% | -6% | -4% | |
| Maximum Upper Side * (°C) | 38.3 | 39 -2% | 36.7 4% | 39.1 -2% | 35.2 8% | 40.3 -5% | 41.6 -9% |
| Maximum Bottom * (°C) | 50.5 | 45.5 10% | 42.8 15% | 49.9 1% | 39.4 22% | 42.6 16% | 44.2 12% |
| Idle Upper Side * (°C) | 24.6 | 24.8 -1% | 23.4 5% | 28 -14% | 27.6 -12% | 28 -14% | 27.4 -11% |
| Idle Bottom * (°C) | 25.4 | 25 2% | 22.8 10% | 30.5 -20% | 27.8 -9% | 31 -22% | 27.6 -9% |
* ... Moindre est la valeur, meilleures sont les performances
HP ProBook 440 G6-5TK01EA analyse audio
(±) | le niveau sonore du haut-parleur est moyen mais bon (78.1# dB)
Basses 100 - 315 Hz
(-) | presque aucune basse - en moyenne 17.2% plus bas que la médiane
(±) | la linéarité des basses est moyenne (12.1% delta à la fréquence précédente)
Médiums 400 - 2000 Hz
(+) | médiane équilibrée - seulement 3.3% de la médiane
(+) | les médiums sont linéaires (6.7% delta à la fréquence précédente)
Aiguës 2 - 16 kHz
(±) | sommets plus élevés - en moyenne 5.7% plus élevés que la médiane
(±) | la linéarité des aigus est moyenne (7.1% delta à la fréquence précédente)
Globalement 100 - 16 000 Hz
(±) | la linéarité du son global est moyenne (20.8% de différence avec la médiane)
Par rapport à la même classe
» 48% de tous les appareils testés de cette catégorie étaient meilleurs, 9% similaires, 42% pires
» Le meilleur avait un delta de 7%, la moyenne était de 21%, le pire était de 53%.
Par rapport à tous les appareils testés
» 56% de tous les appareils testés étaient meilleurs, 8% similaires, 36% pires
» Le meilleur avait un delta de 4%, la moyenne était de 24%, le pire était de 134%.
Lenovo ThinkPad A485-20MU000CGE analyse audio
(±) | le niveau sonore du haut-parleur est moyen mais bon (74.1# dB)
Basses 100 - 315 Hz
(-) | presque aucune basse - en moyenne 24.7% plus bas que la médiane
(±) | la linéarité des basses est moyenne (11.9% delta à la fréquence précédente)
Médiums 400 - 2000 Hz
(+) | médiane équilibrée - seulement 2.9% de la médiane
(±) | la linéarité des médiums est moyenne (7.5% delta à la fréquence précédente)
Aiguës 2 - 16 kHz
(+) | des sommets équilibrés - à seulement 2.2% de la médiane
(+) | les aigus sont linéaires (6.8% delta à la fréquence précédente)
Globalement 100 - 16 000 Hz
(±) | la linéarité du son global est moyenne (23.8% de différence avec la médiane)
Par rapport à la même classe
» 68% de tous les appareils testés de cette catégorie étaient meilleurs, 8% similaires, 23% pires
» Le meilleur avait un delta de 7%, la moyenne était de 21%, le pire était de 53%.
Par rapport à tous les appareils testés
» 71% de tous les appareils testés étaient meilleurs, 6% similaires, 22% pires
» Le meilleur avait un delta de 4%, la moyenne était de 24%, le pire était de 134%.
| Éteint/en veille | |
| Au repos | |
| Fortement sollicité |
|
Légende:
min: | |
| HP ProBook 440 G6-5TK01EA i7-8565U, UHD Graphics 620, Toshiba XG5 KXG50ZNV512G, IPS, 1920x1080, 14" | HP ProBook 440 G5-3KX87ES i5-8250U, UHD Graphics 620, Intel SSD 600p SSDPEKKW256G7, IPS LED, 1920x1080, 14" | Lenovo ThinkPad E480-20KNCTO1WW i5-8250U, UHD Graphics 620, Toshiba KBG30ZMT128G, IPS LED, 1920x1080, 14" | Lenovo ThinkPad A485-20MU000CGE R5 PRO 2500U, Vega 8, Samsung SSD PM981 MZVLB256HAHQ, IPS LED, 1920x1080, 14" | Acer TravelMate X3410-M-866T i5-8550U, UHD Graphics 620, Micron SSD 1100 SED 512GB, M.2 (MTFDDAV512TBN), IPS, 1920x1080, 14" | Fujitsu Lifebook E548 i5-8250U, UHD Graphics 620, Samsung SSD PM871b MZNLN256HAJQ, IPS, 1920x1080, 14" | Huawei MateBook D 14 W50F i5-8250U, UHD Graphics 620, SanDisk SD9SN8W256G1027, IPS, 1920x1080, 14" | Moyenne Intel UHD Graphics 620 | Moyenne de la classe Office | |
|---|---|---|---|---|---|---|---|---|---|
| Power Consumption | -25% | 5% | -42% | -19% | 16% | -5% | -16% | -34% | |
| Idle Minimum * (Watt) | 2.98 | 4.4 -48% | 3.5 -17% | 5.3 -78% | 4.5 -51% | 3.1 -4% | 3.7 -24% | 3.81 ? -28% | 4.41 ? -48% |
| Idle Average * (Watt) | 5.4 | 7.1 -31% | 5.3 2% | 8.3 -54% | 6.3 -17% | 5 7% | 6.9 -28% | 6.94 ? -29% | 7.38 ? -37% |
| Idle Maximum * (Watt) | 7.9 | 10.2 -29% | 6.1 23% | 11.4 -44% | 7 11% | 6.1 23% | 8.4 -6% | 8.75 ? -11% | 8.59 ? -9% |
| Load Average * (Watt) | 34.5 | 36.5 -6% | 30 13% | 42 -22% | 28.7 17% | 27 22% | 32 7% | 35 ? -1% | 43.3 ? -26% |
| Load Maximum * (Watt) | 43.3 | 48.7 -12% | 42.3 2% | 48.8 -13% | 67.7 -56% | 29.7 31% | 32.6 25% | 47.5 ? -10% | 64.5 ? -49% |
* ... Moindre est la valeur, meilleures sont les performances
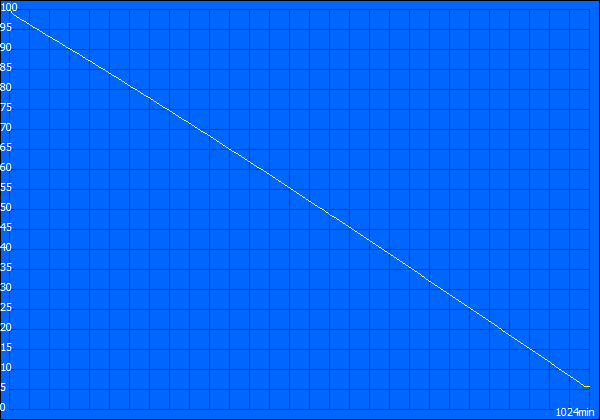
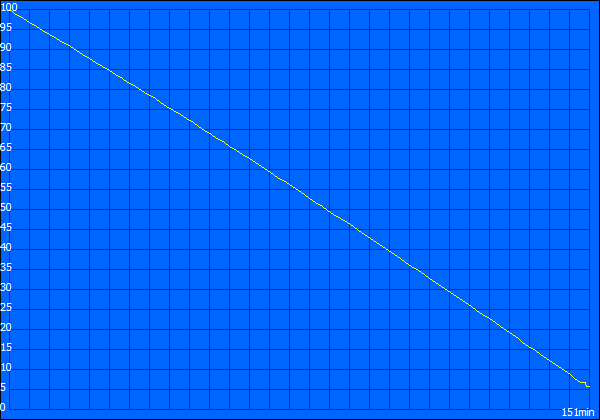
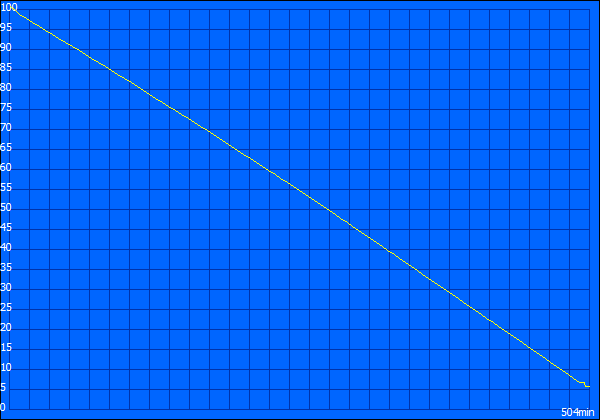

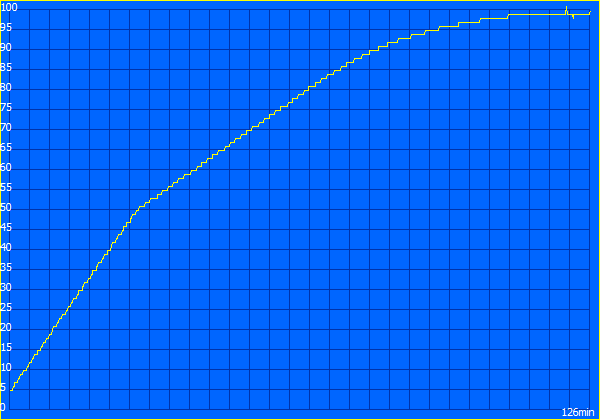
| HP ProBook 440 G6-5TK01EA i7-8565U, UHD Graphics 620, 45 Wh | HP ProBook 440 G5-3KX87ES i5-8250U, UHD Graphics 620, 48 Wh | Lenovo ThinkPad E480-20KNCTO1WW i5-8250U, UHD Graphics 620, 45 Wh | Lenovo ThinkPad A485-20MU000CGE R5 PRO 2500U, Vega 8, 48 Wh | Acer TravelMate X3410-M-866T i5-8550U, UHD Graphics 620, 57 Wh | Fujitsu Lifebook E548 i5-8250U, UHD Graphics 620, 50 Wh | Huawei MateBook D 14 W50F i5-8250U, UHD Graphics 620, 57 Wh | Moyenne de la classe Office | |
|---|---|---|---|---|---|---|---|---|
| Autonomie de la batterie | -16% | -7% | -37% | 11% | 1% | 26% | 40% | |
| Reader / Idle (h) | 17.1 | 13.7 -20% | 18.4 8% | 11.2 -35% | 20.8 22% | 23.6 38% | 23.7 ? 39% | |
| H.264 (h) | 7.6 | 3.7 -51% | 7.2 -5% | 6.1 -20% | 12.1 59% | 15 ? 97% | ||
| WiFi v1.3 (h) | 8.4 | 6.9 -18% | 8.3 -1% | 5.5 -35% | 10.3 23% | 8.5 1% | 10 19% | 12.8 ? 52% |
| Load (h) | 2.5 | 3.1 24% | 1.8 -28% | 1.1 -56% | 2.2 -12% | 2.2 -12% | 1.793 ? -28% |
Points positifs
Points négatifs
Verdict
Le HP ProBook 440 G6 est un appareil qui vise spécialement les professionnels, pour des firmes de petite et moyenne taille. Mais l’appareil est également adapté au grand public, avec une machine parfaite pour la bureautique classique et la navigation web.
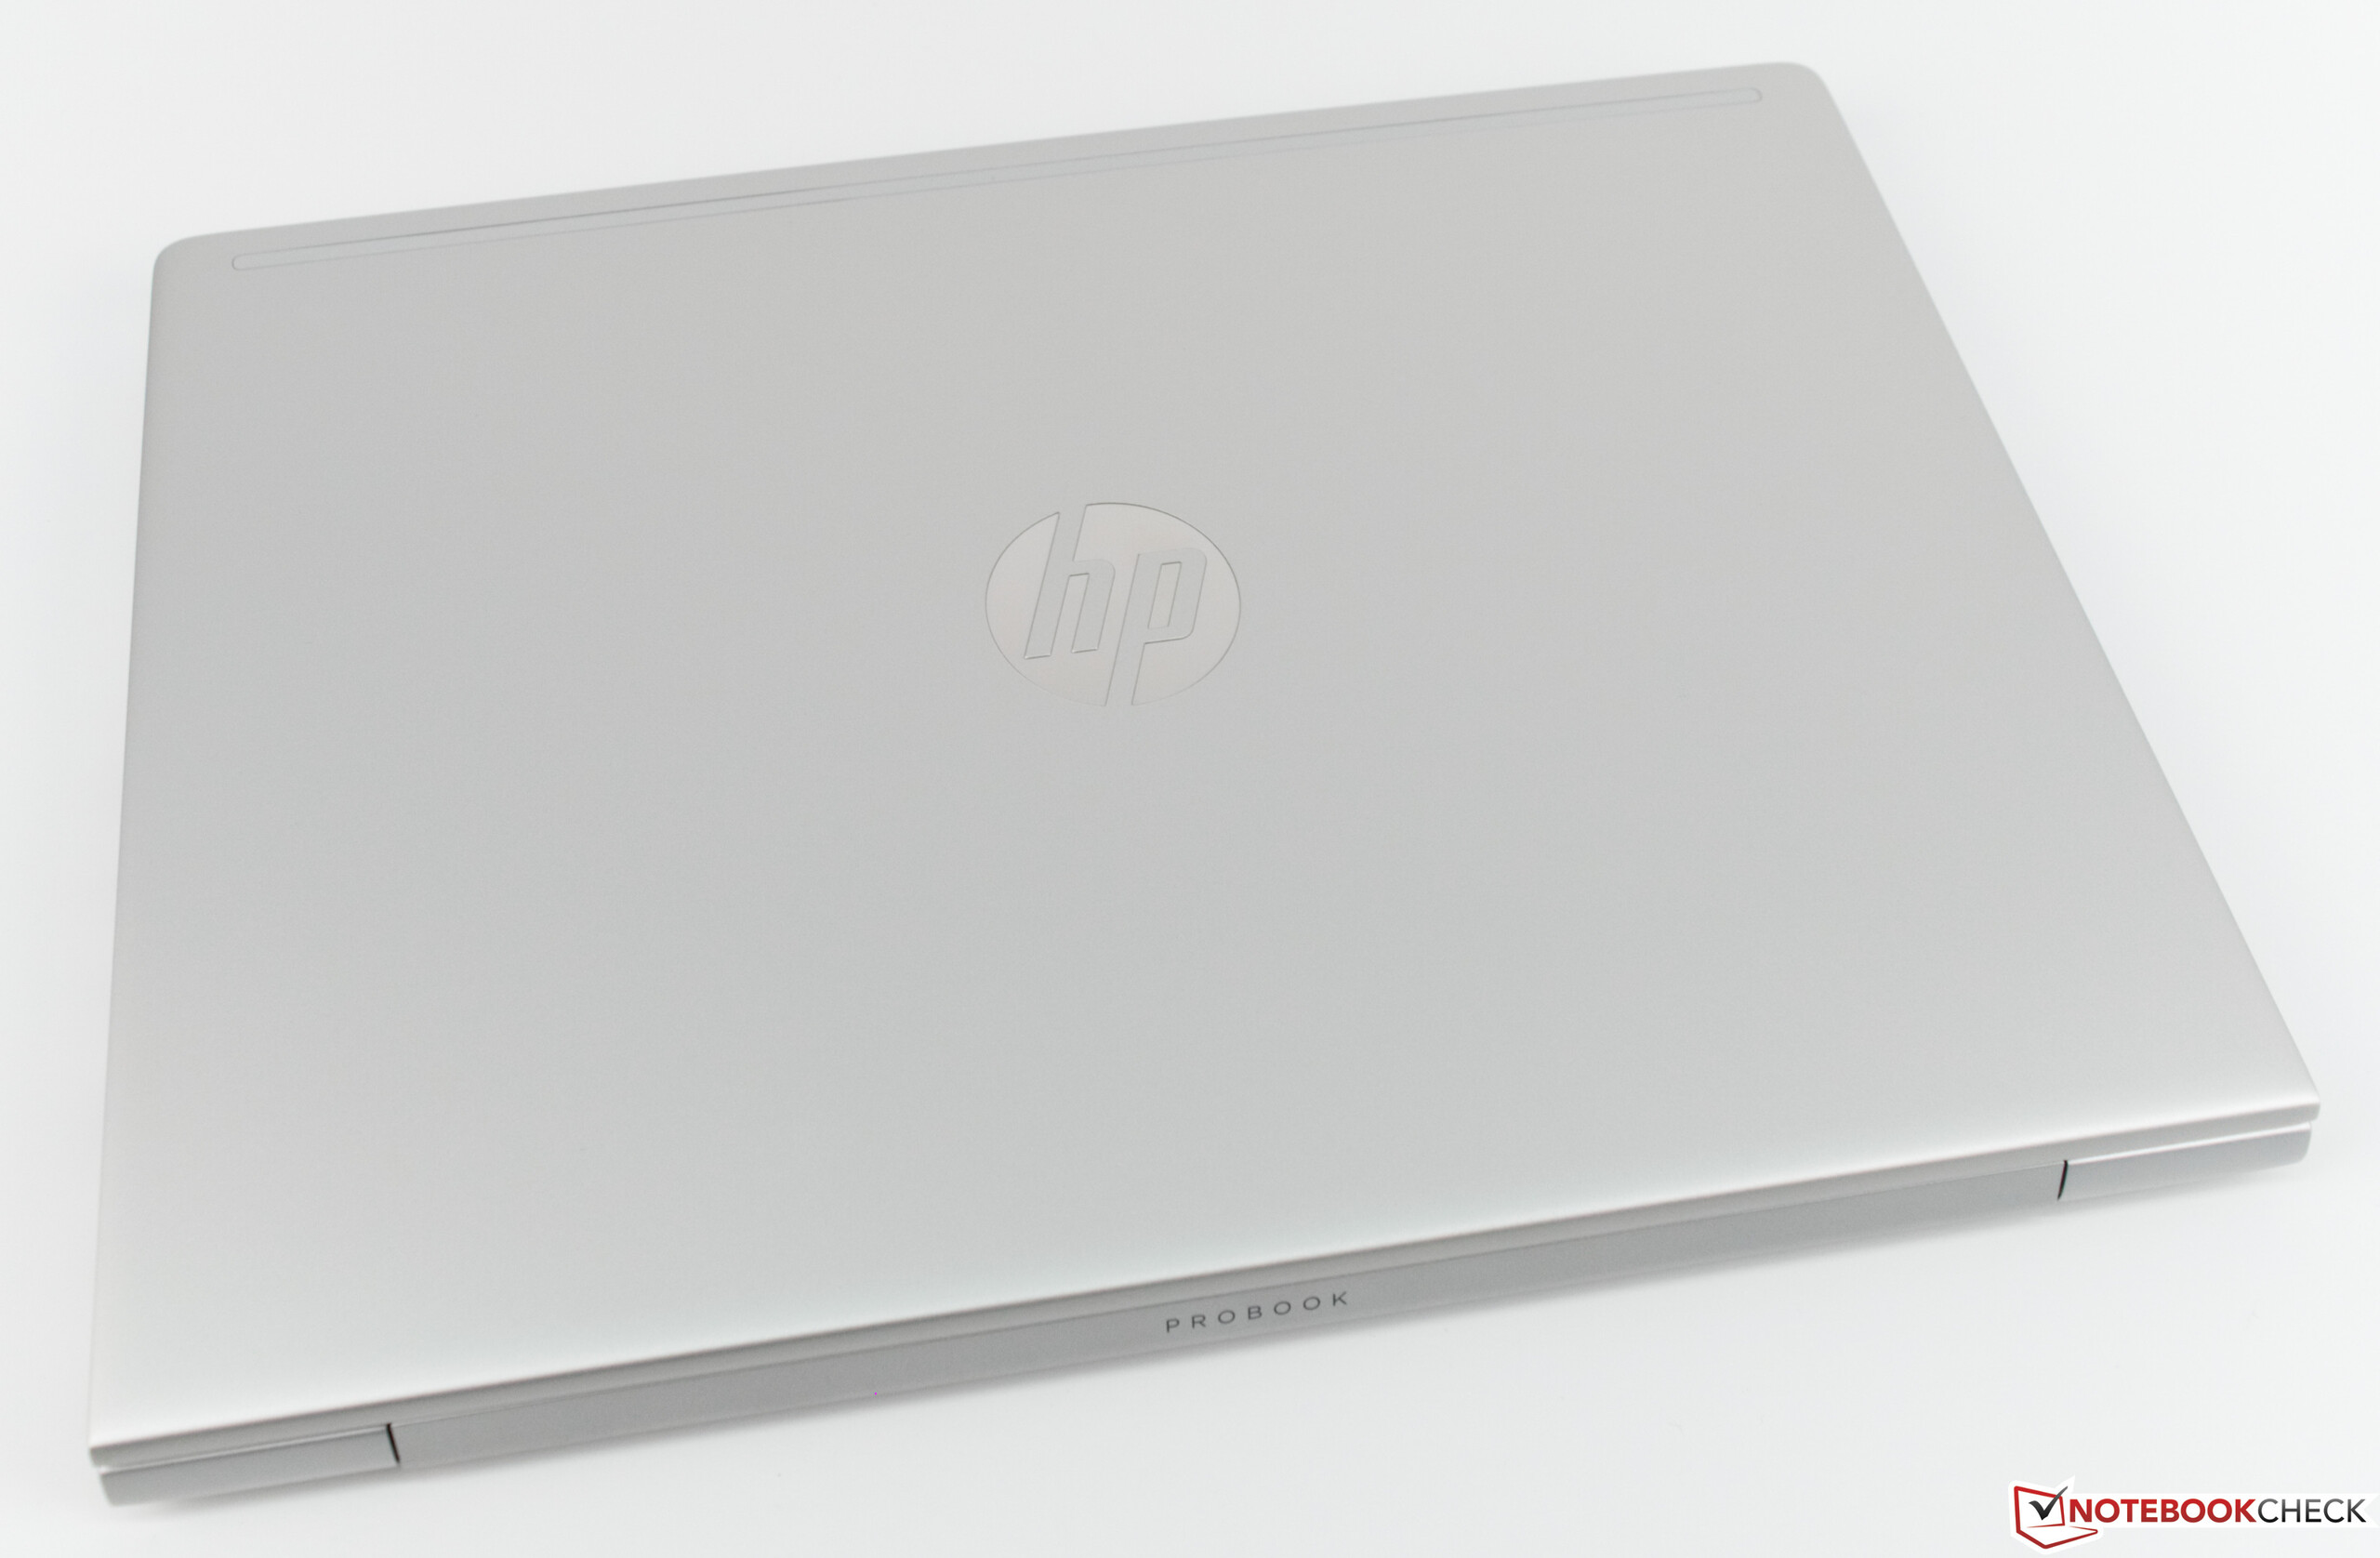
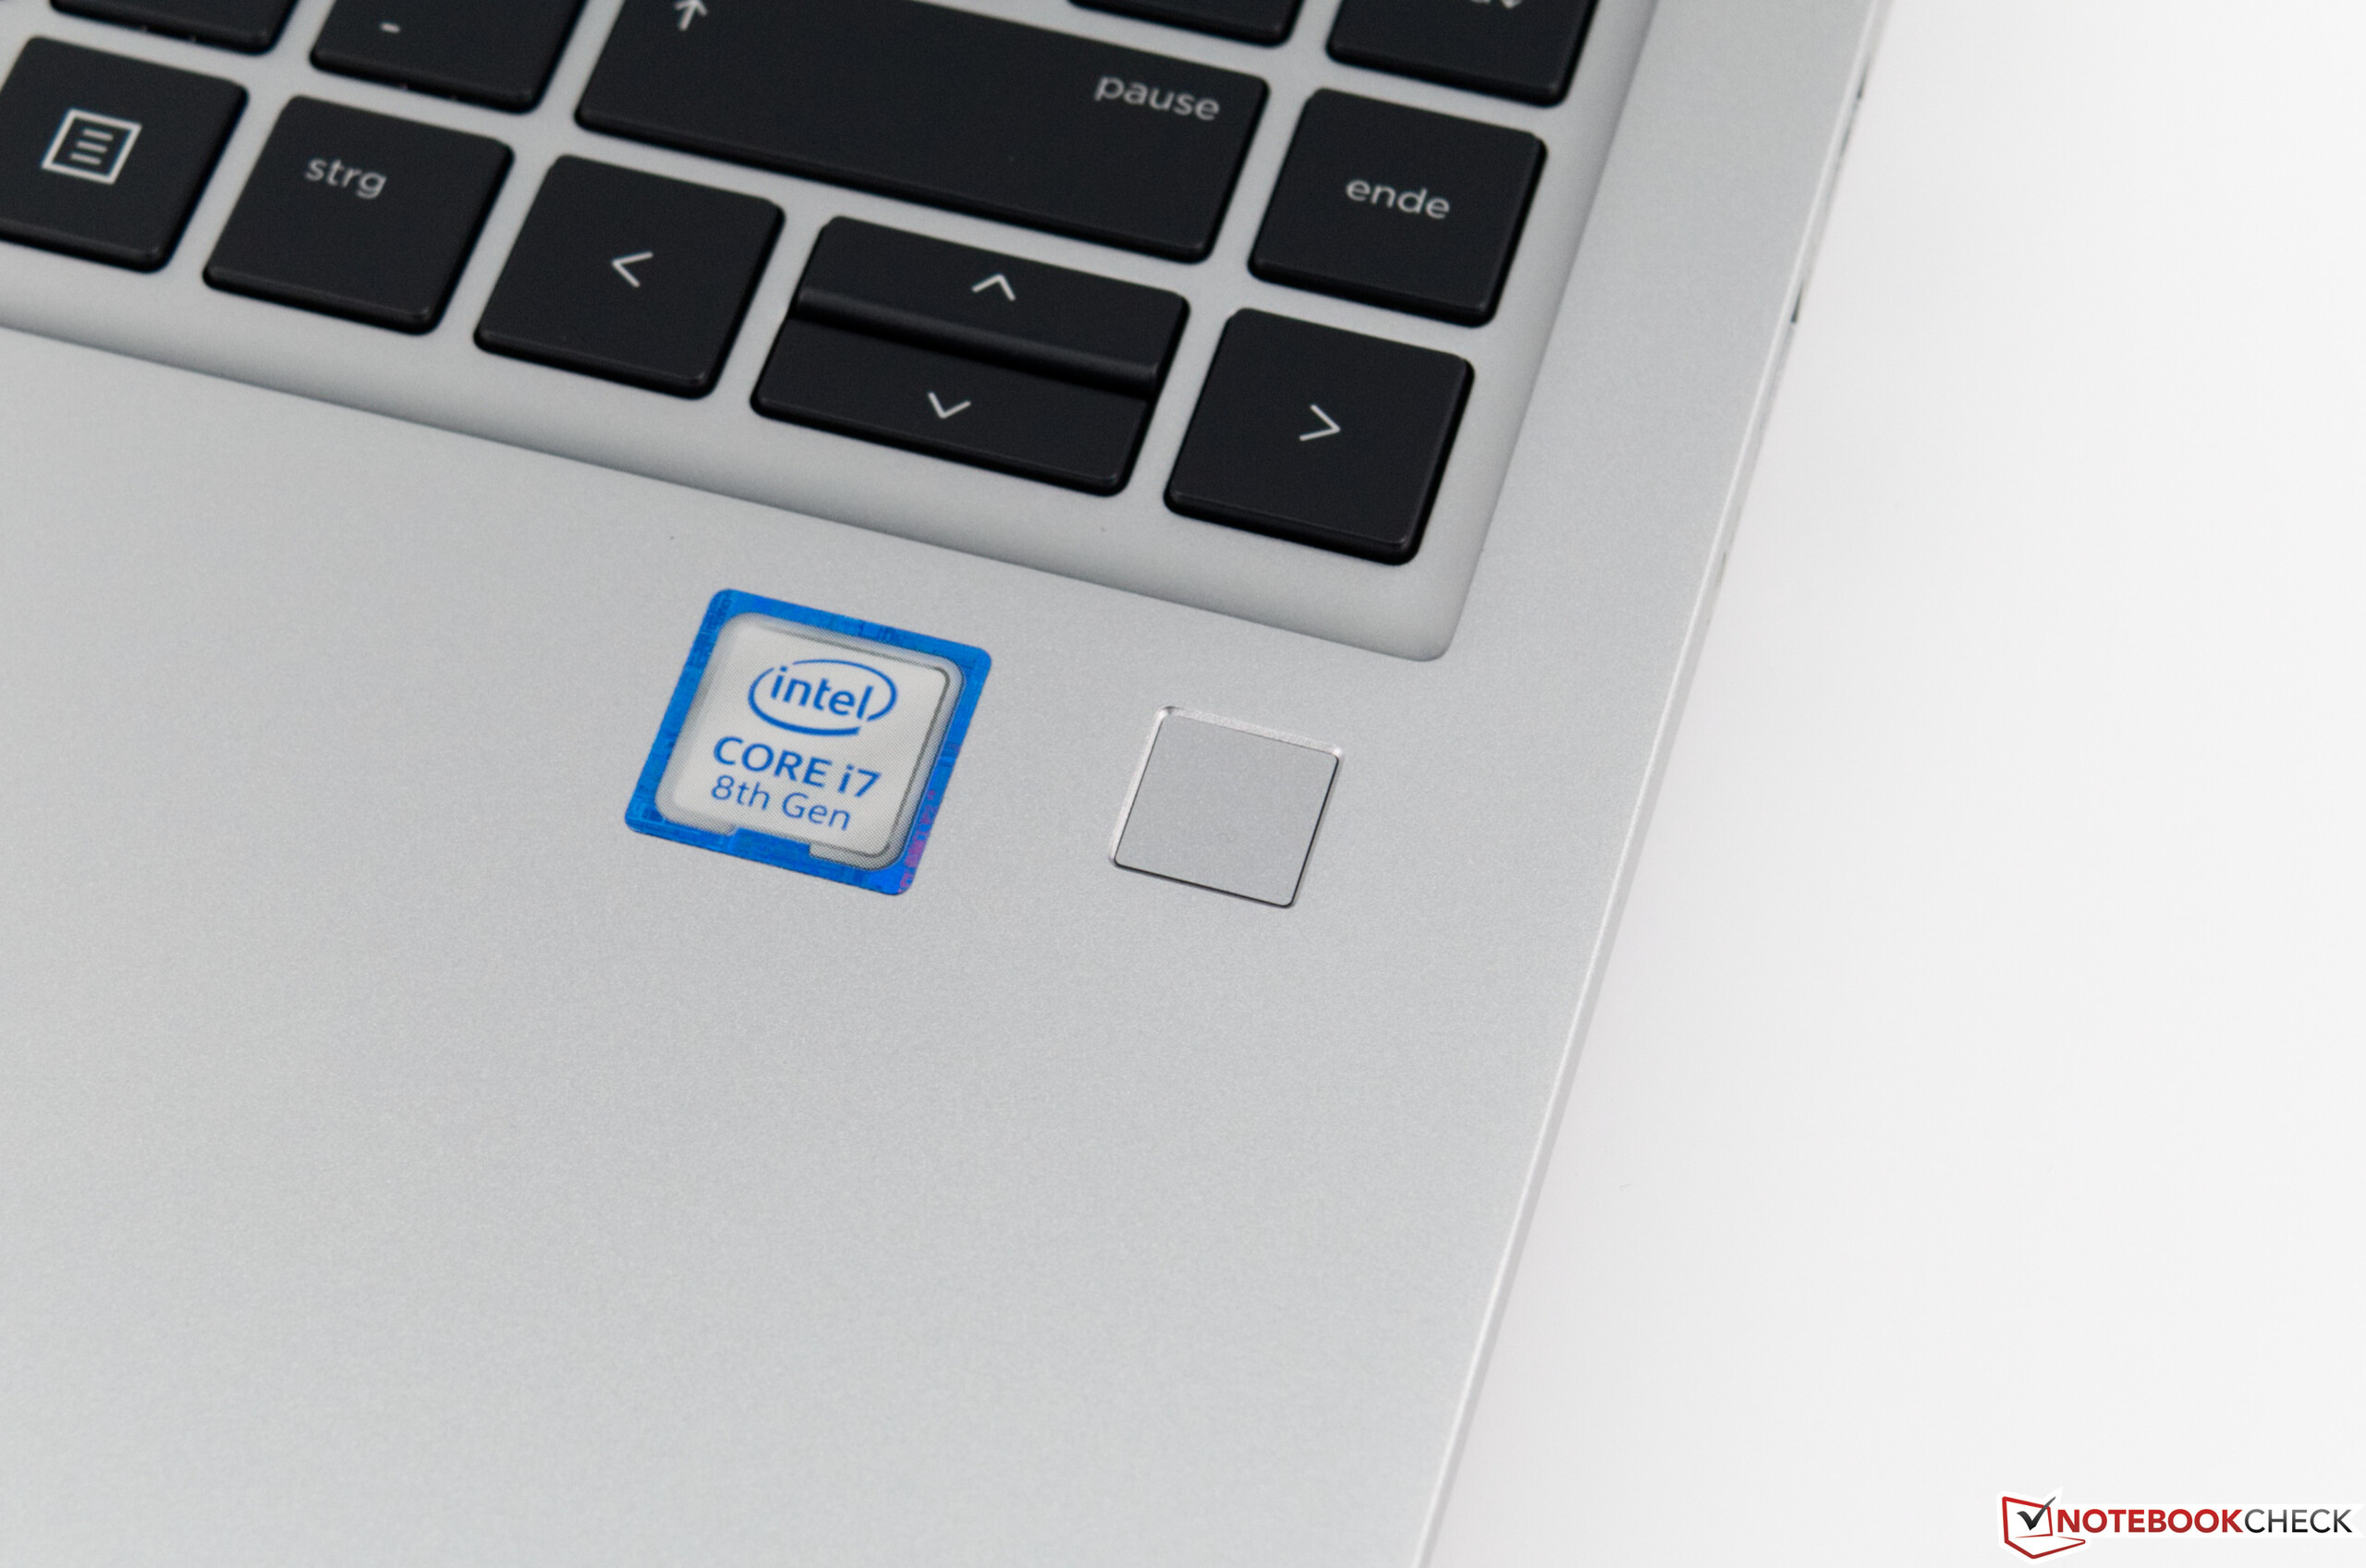
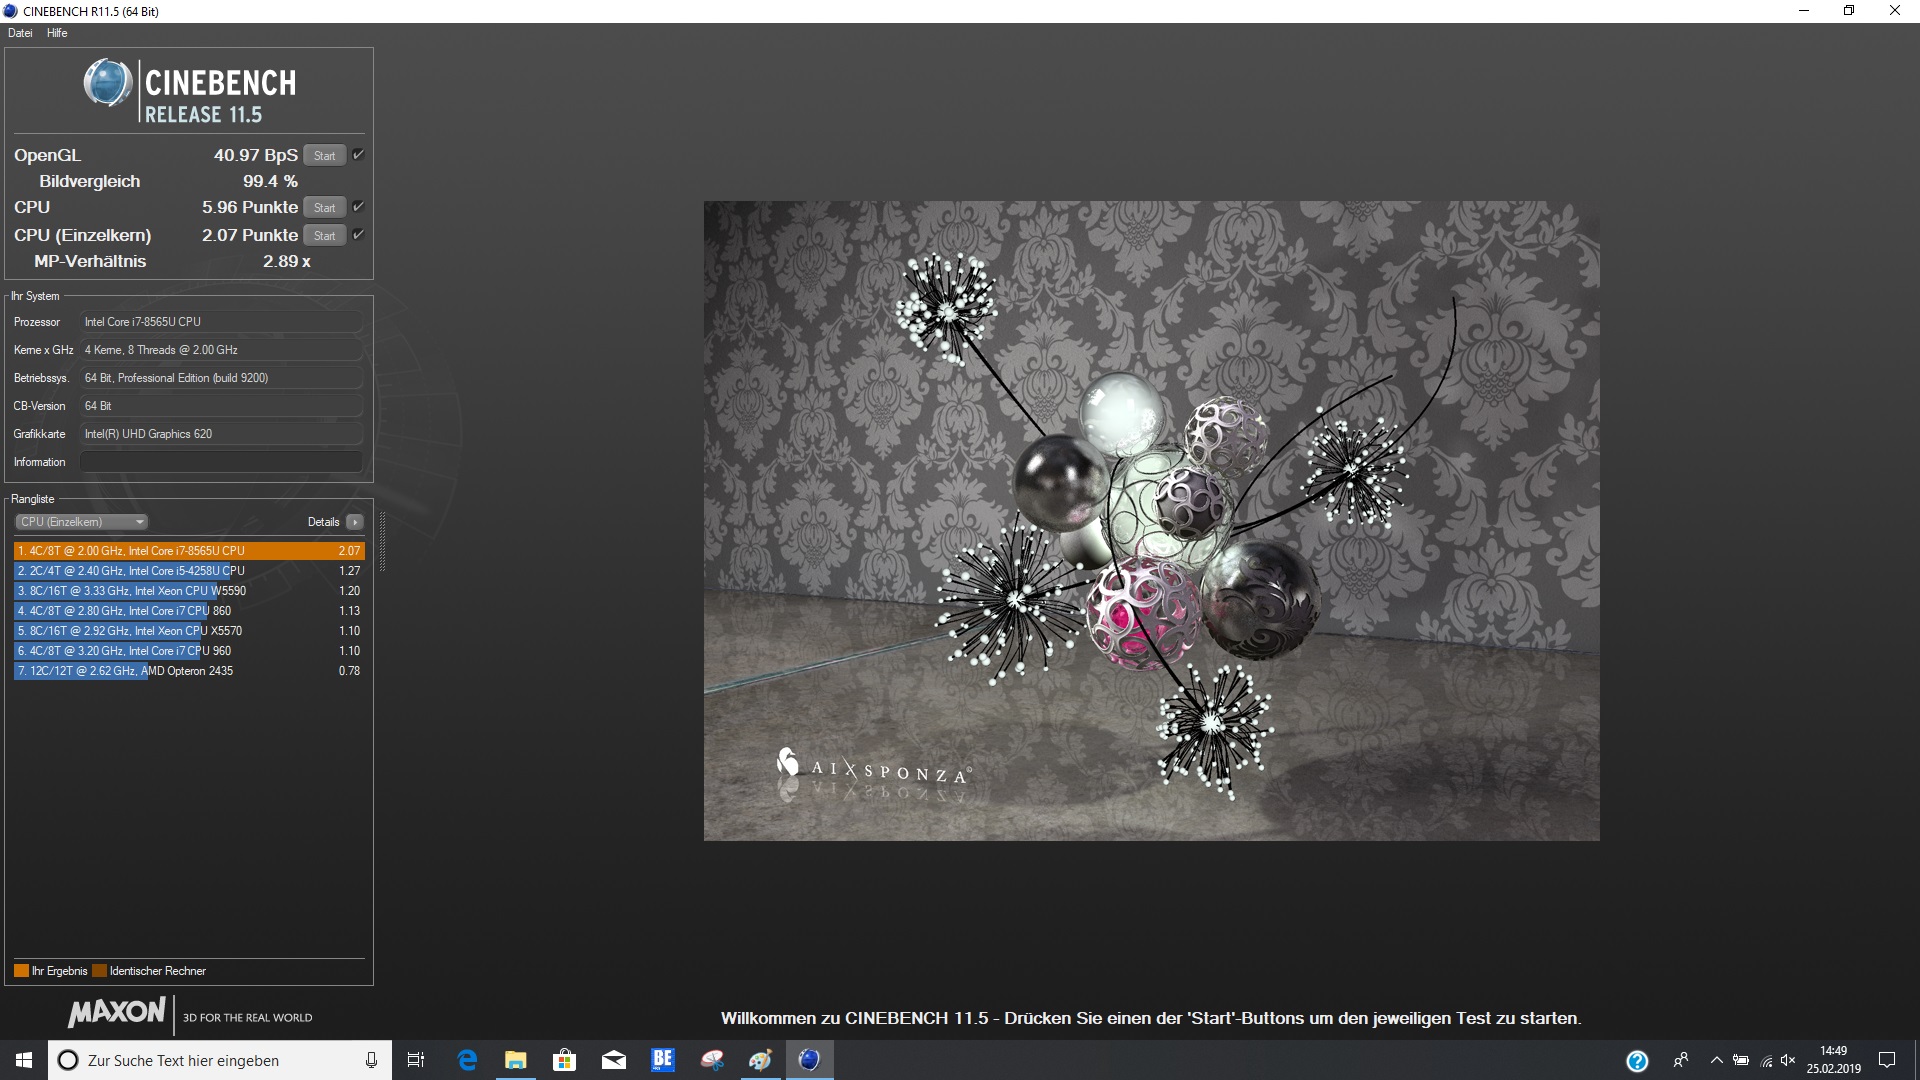
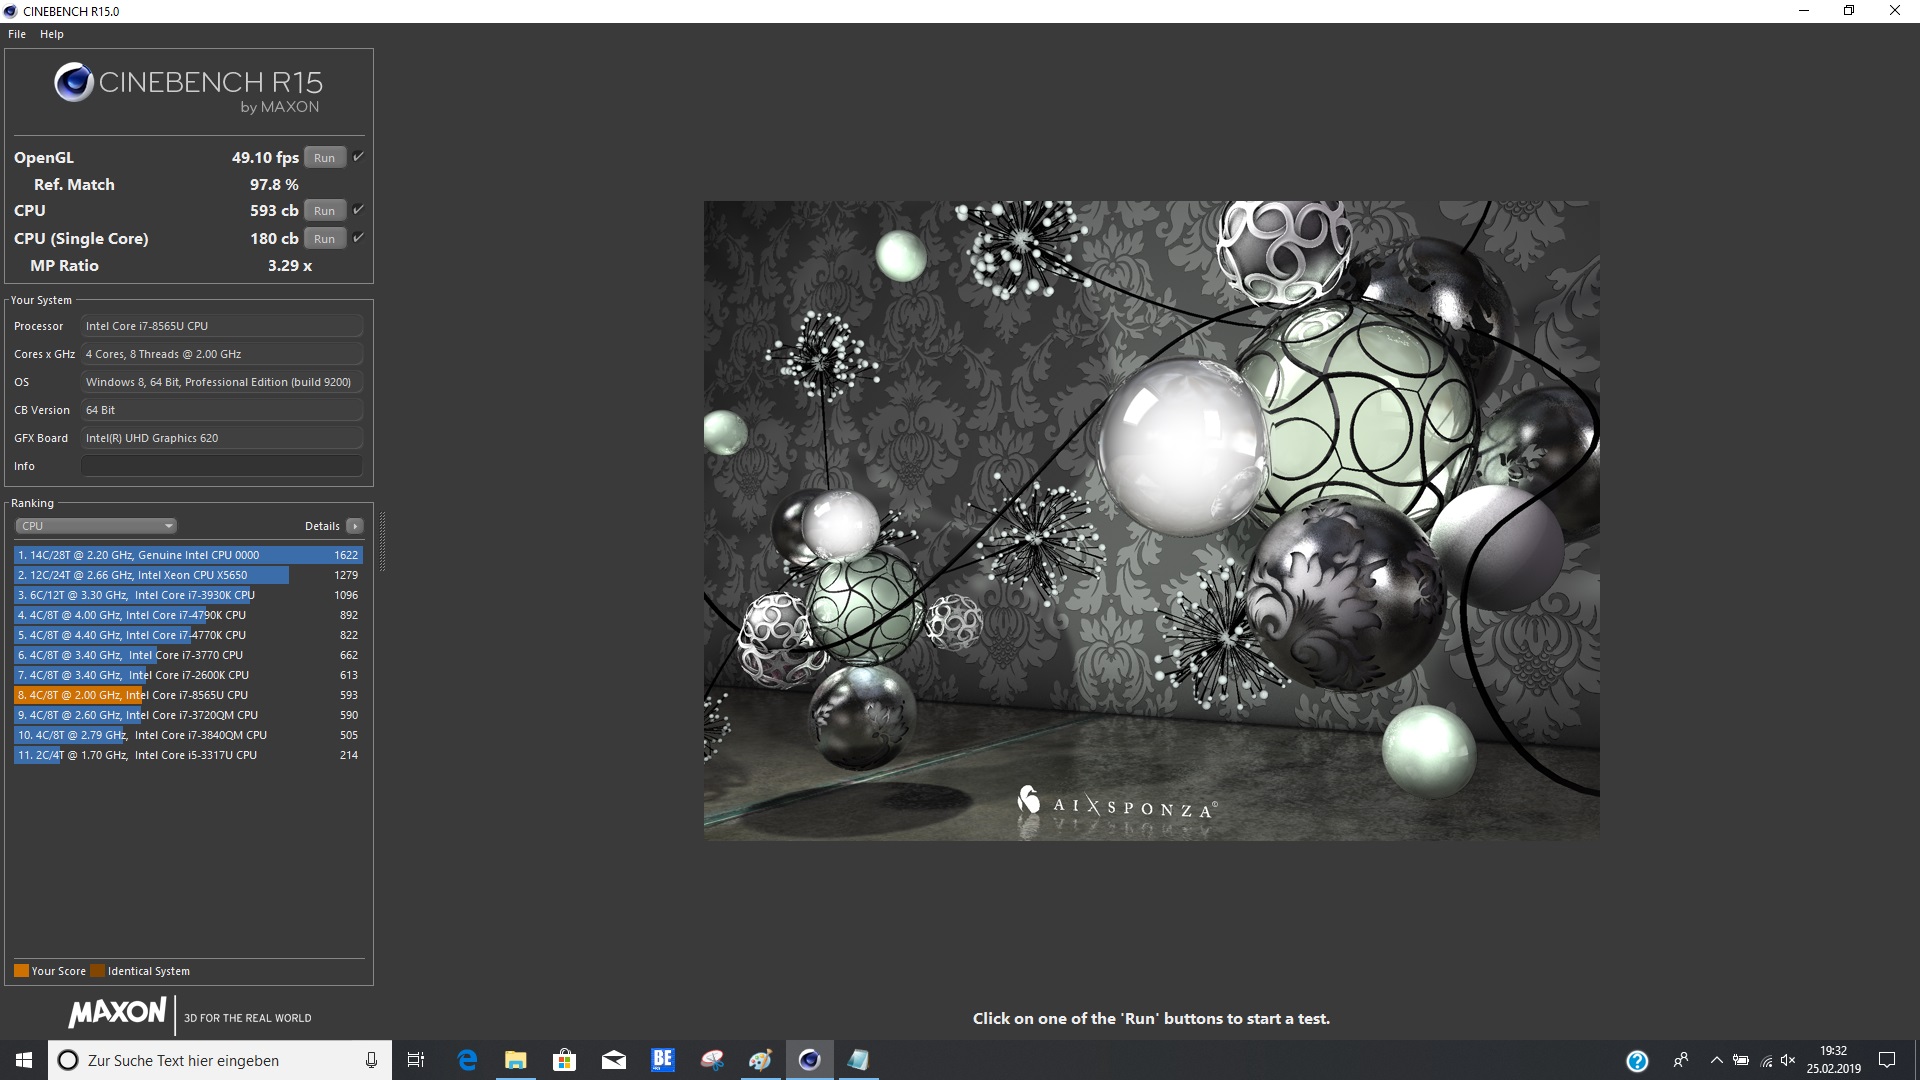
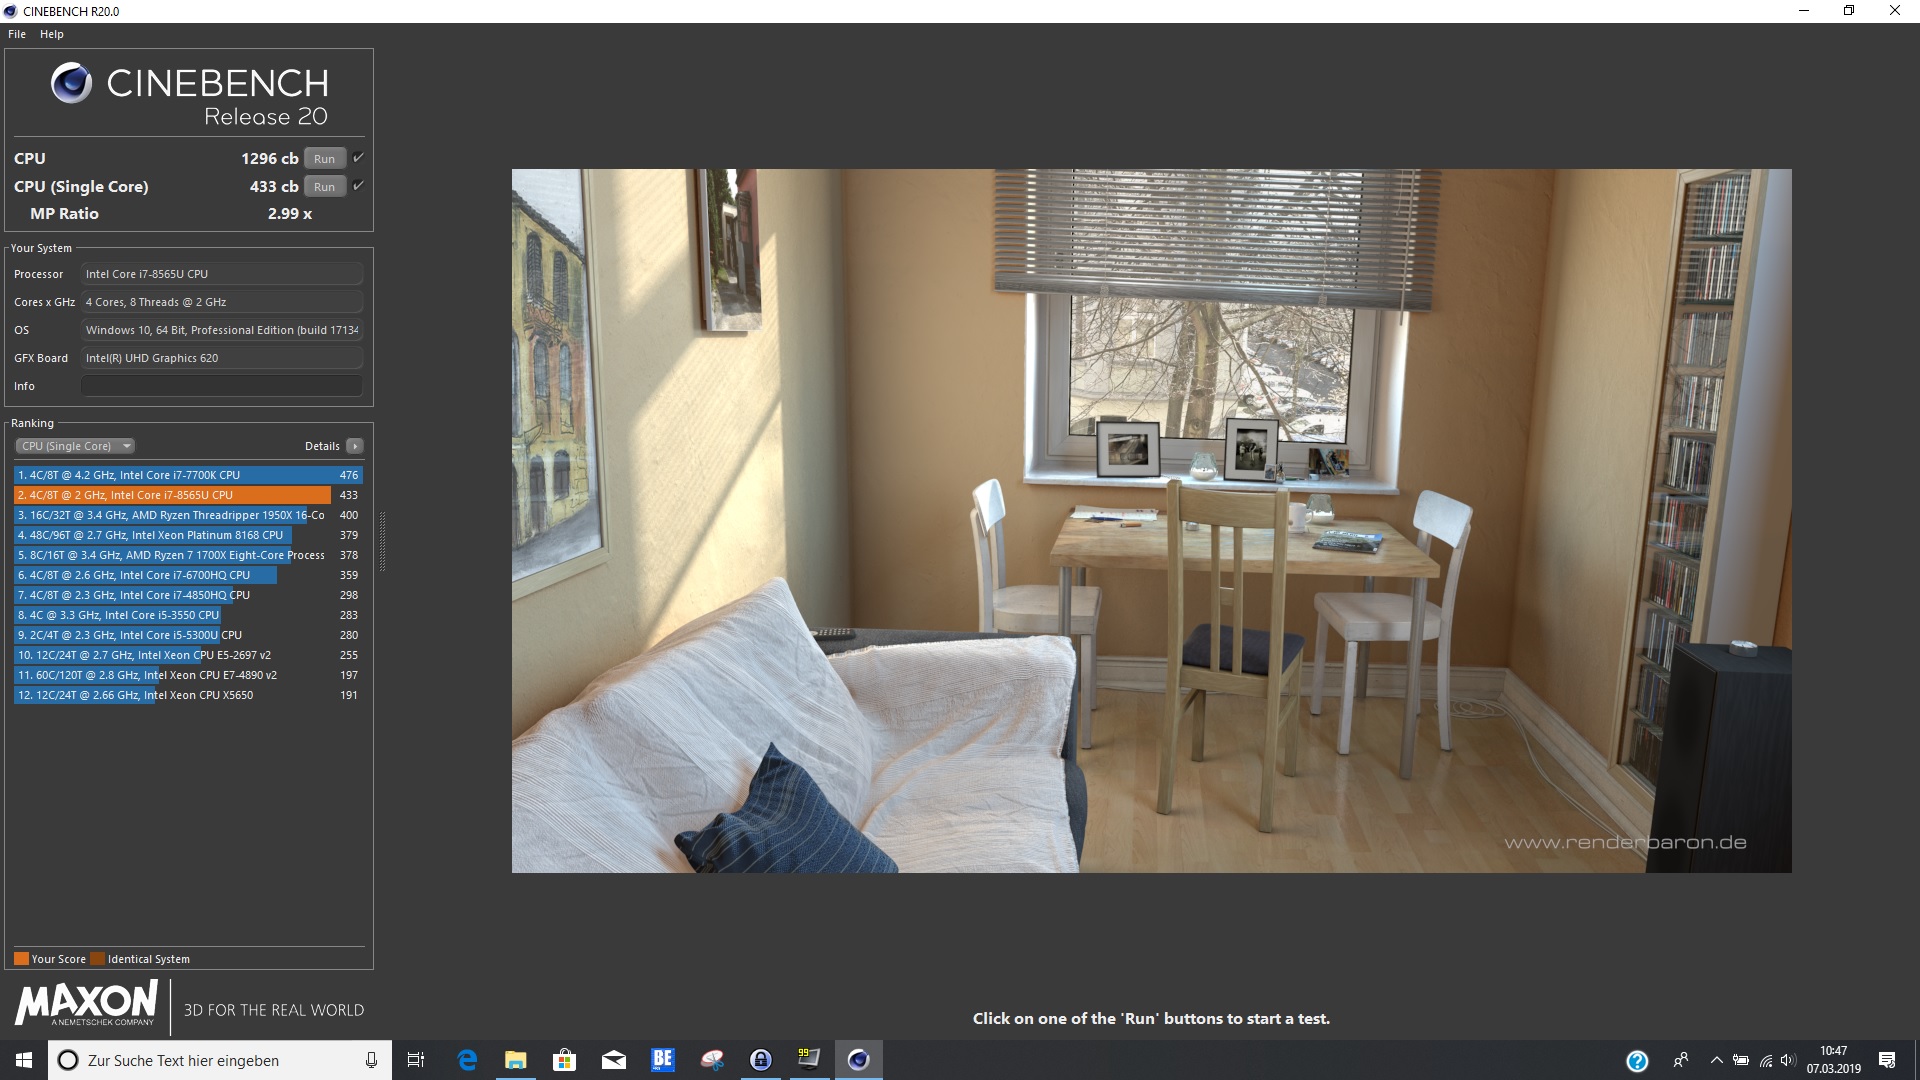
HP a retravaillé le châssis du ProBook 440 G6, pour le rendre plus fin et lui donner un look plus moderne. Le fabricant a fait un bon choix de matériaux, l’aluminium donnant un aspect haute qualité. Mais ce n’est pas juste l’allure de l’appareil qui a été mise à niveau, les composants de la machine ayant été aussi mis à jour, avec les tout derniers processeurs d’Intel - même si nous n’avons pas été complètement convaincus par la prestation de l’Intel Core i7-8565U de notre machine dans notre boucle Cinebench R15 Multi. Les performances monocœur sont néanmoins très bonnes, ainsi que les performances globales, notre machine HP prenant la tête de notre comparatif.
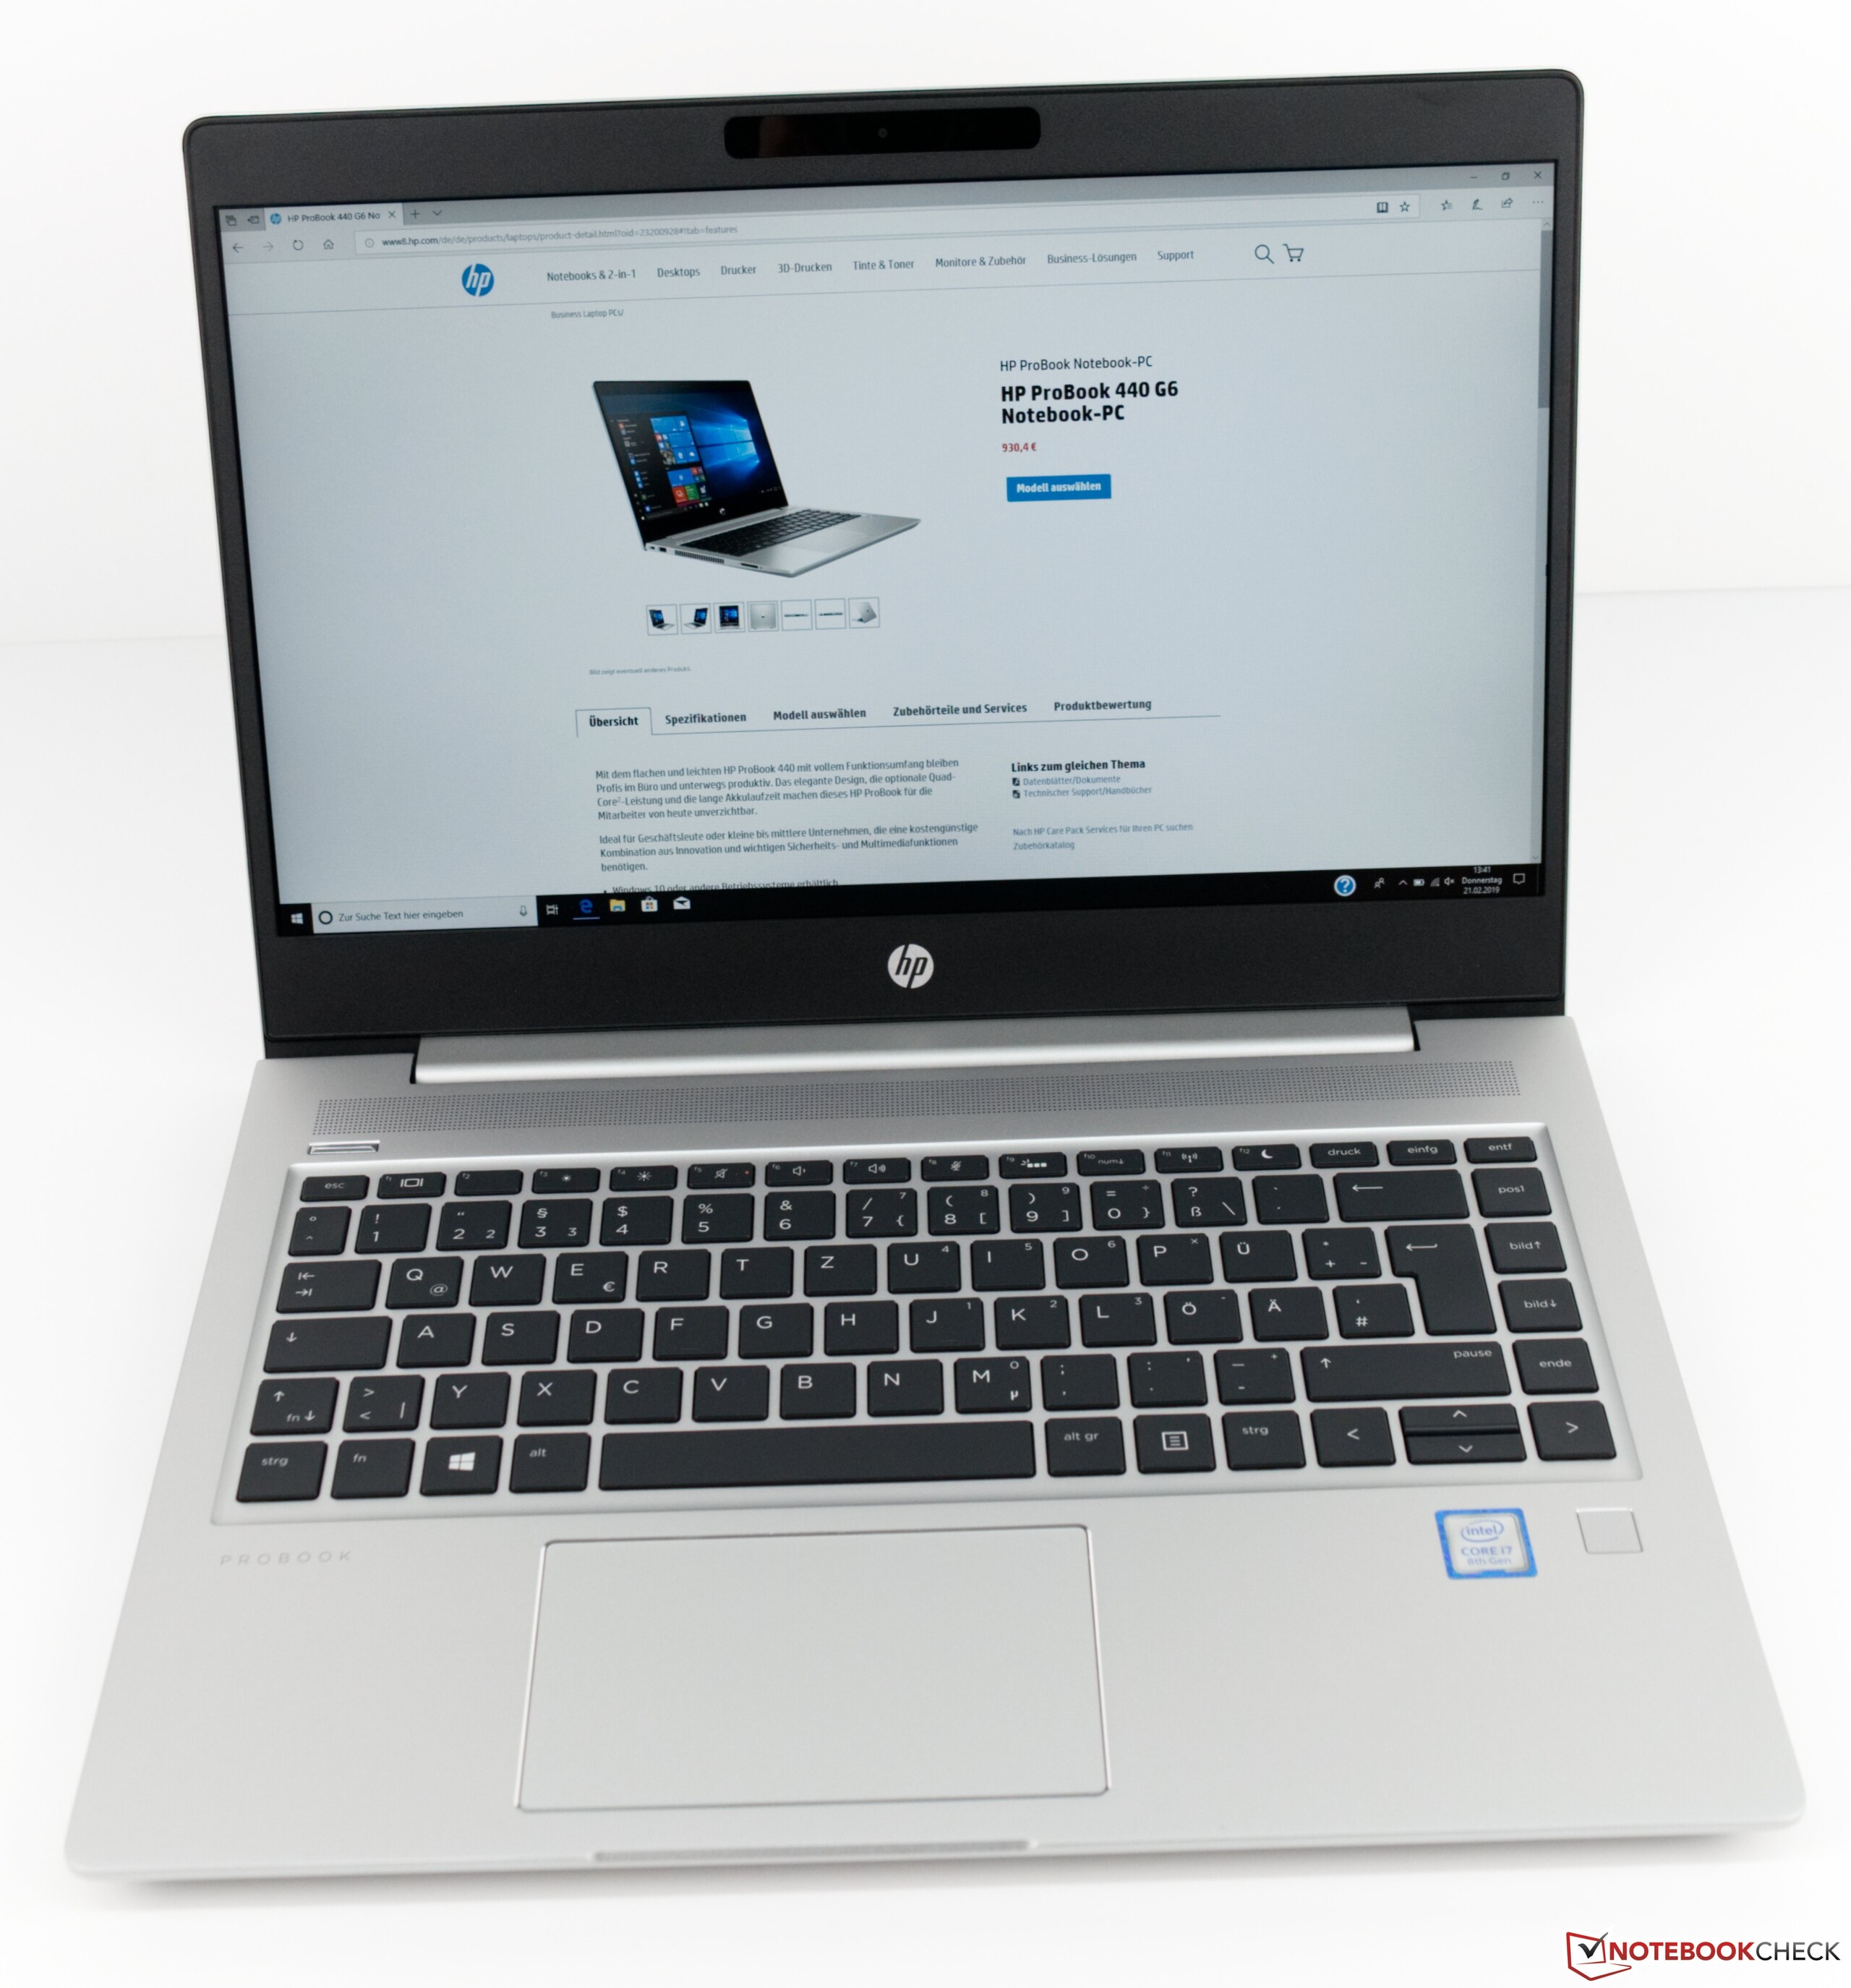
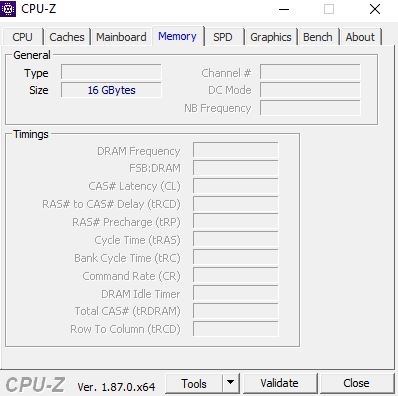
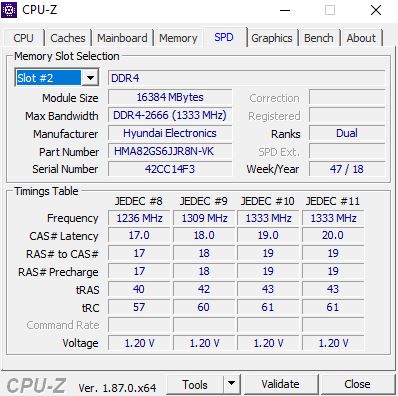
Le HP Probook 440 G6 est disponible pour environ 1 300 $ dans notre configuration. On retrouve un processeur Core i7, 16 Go de RAM et un SSD de 512 Go. Nous apprécions le choix de l’écran, mais celui-ci n’est pas suffisant à ce niveau de prix : une dalle matte IPS ne suffit pas si elle possède une couverture des espaces colorimétriques réduite, et un clouding élevé.
HP est sur le bon chemin avec son ProBook 440 G6. Néanmoins, l’appareil a des difficultés à se maintenir face à la concurrence débridée des autres fabricants.
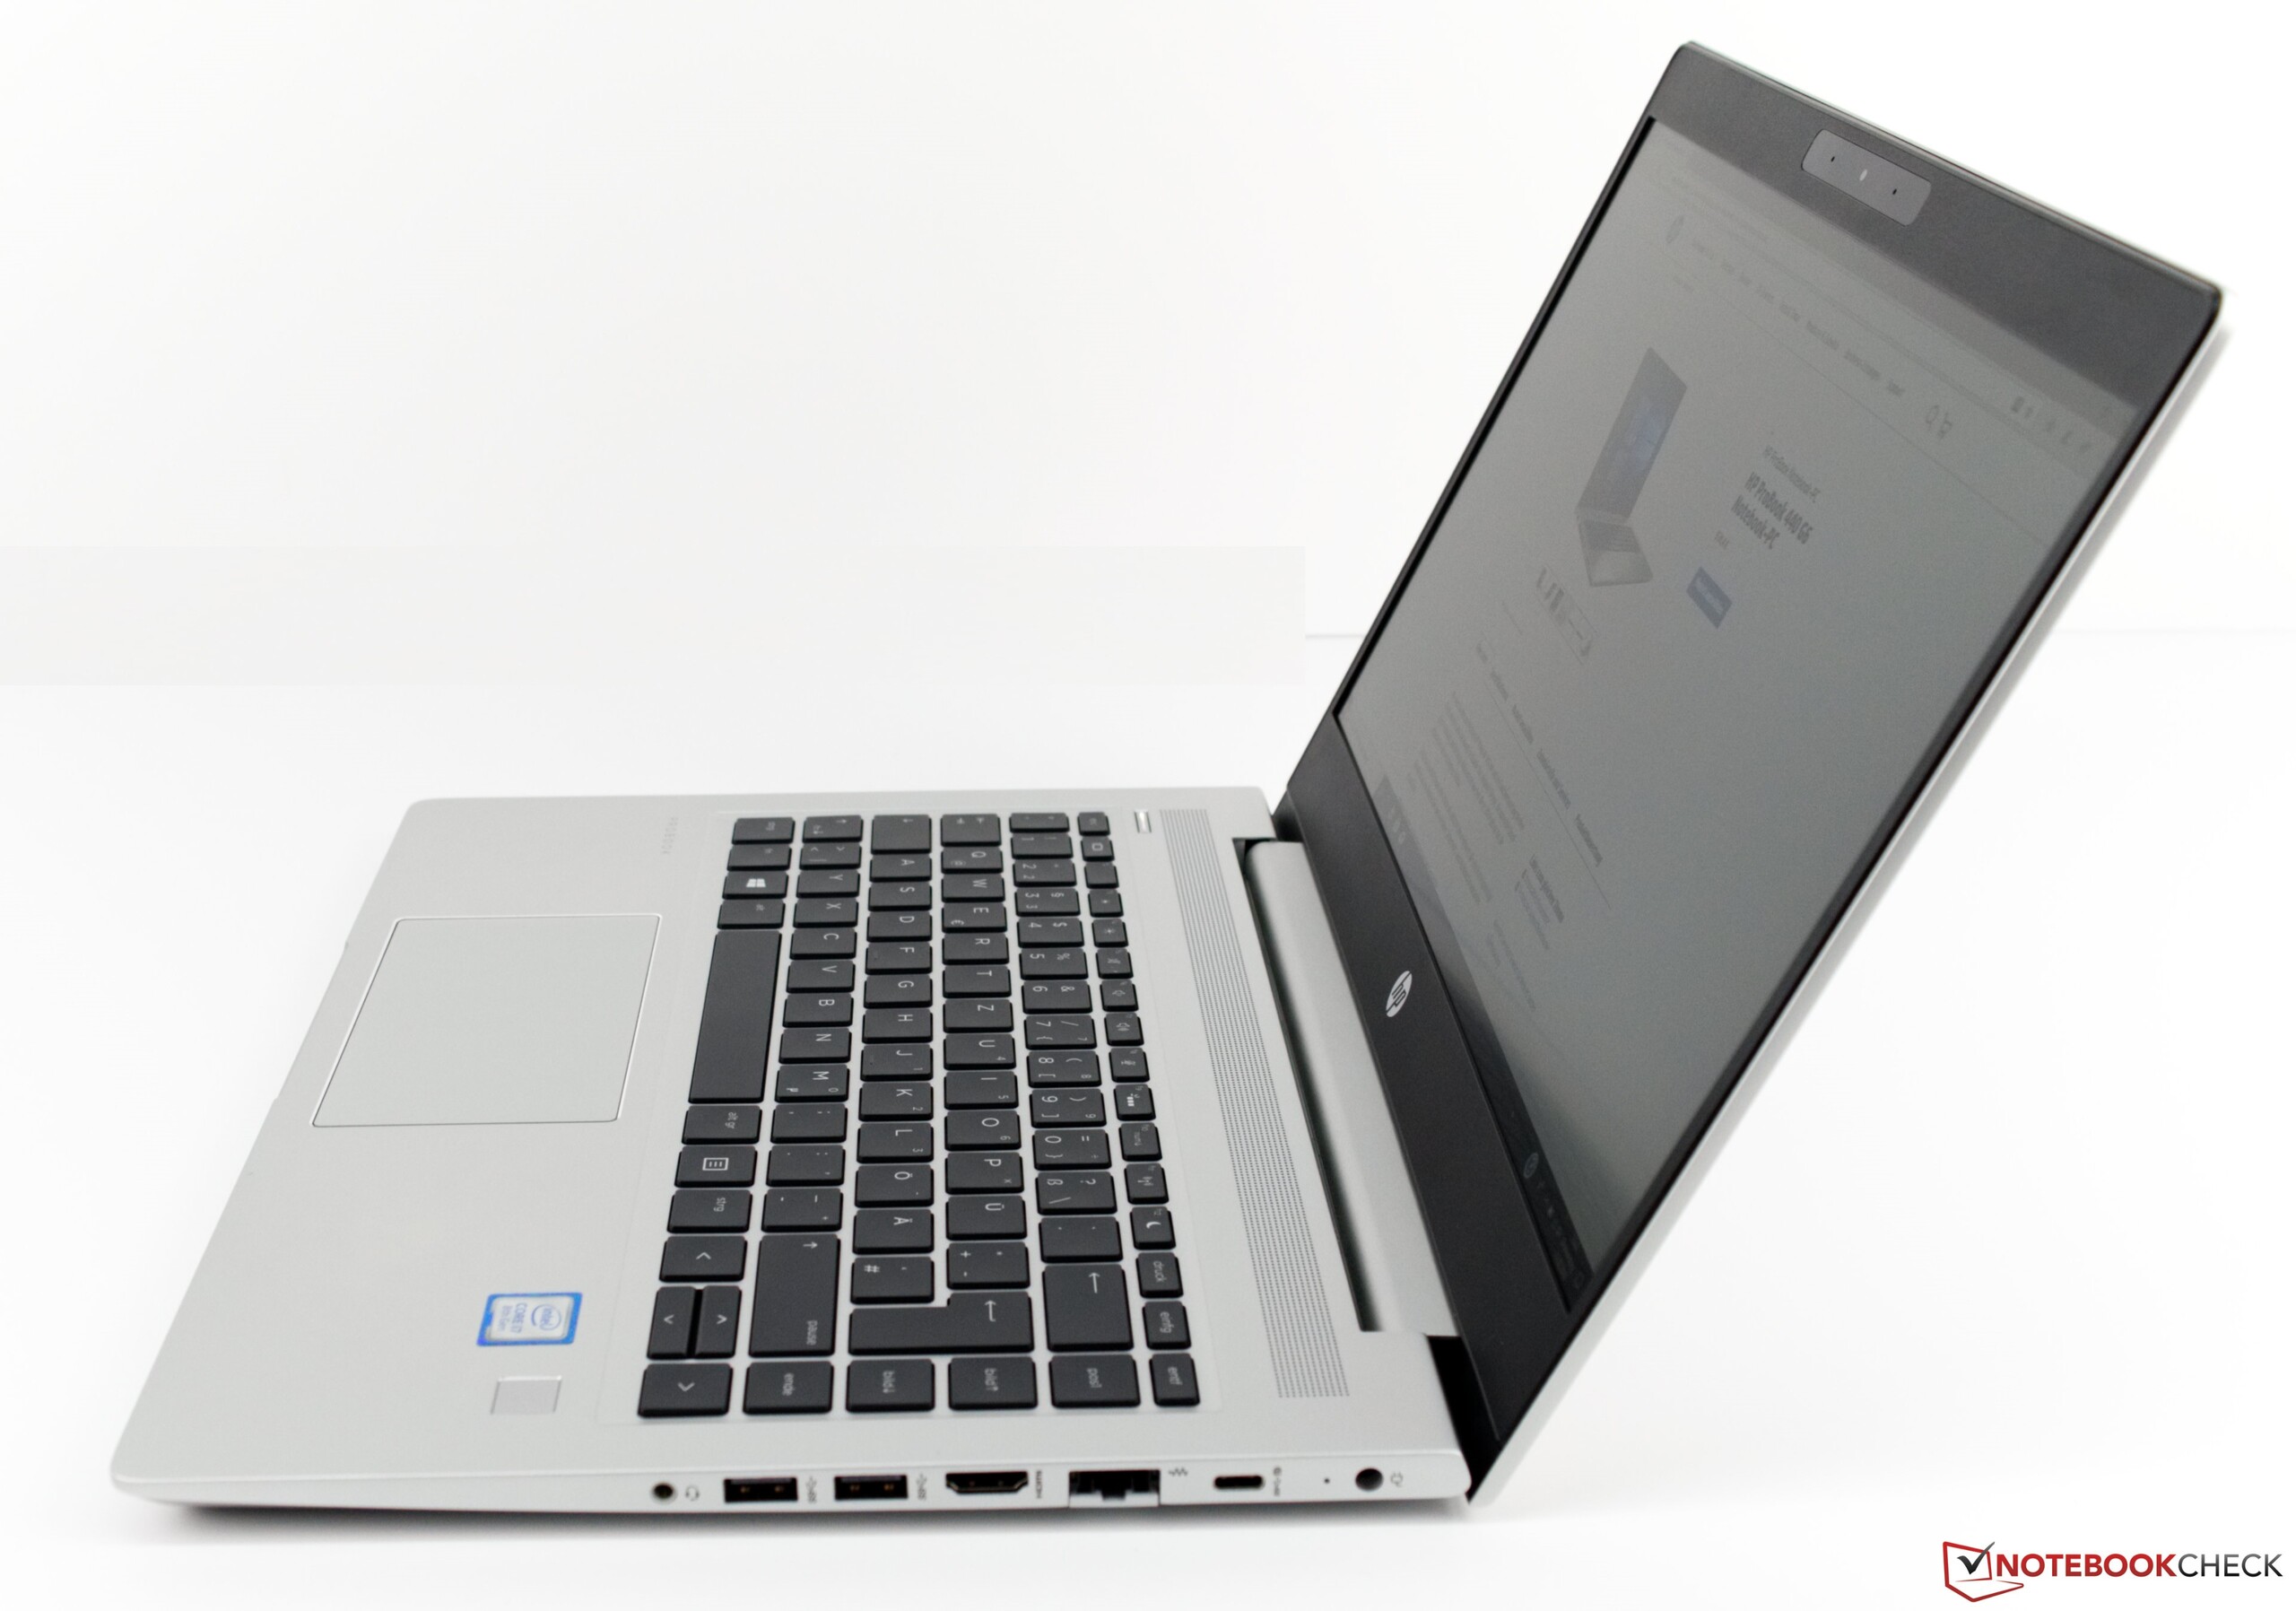
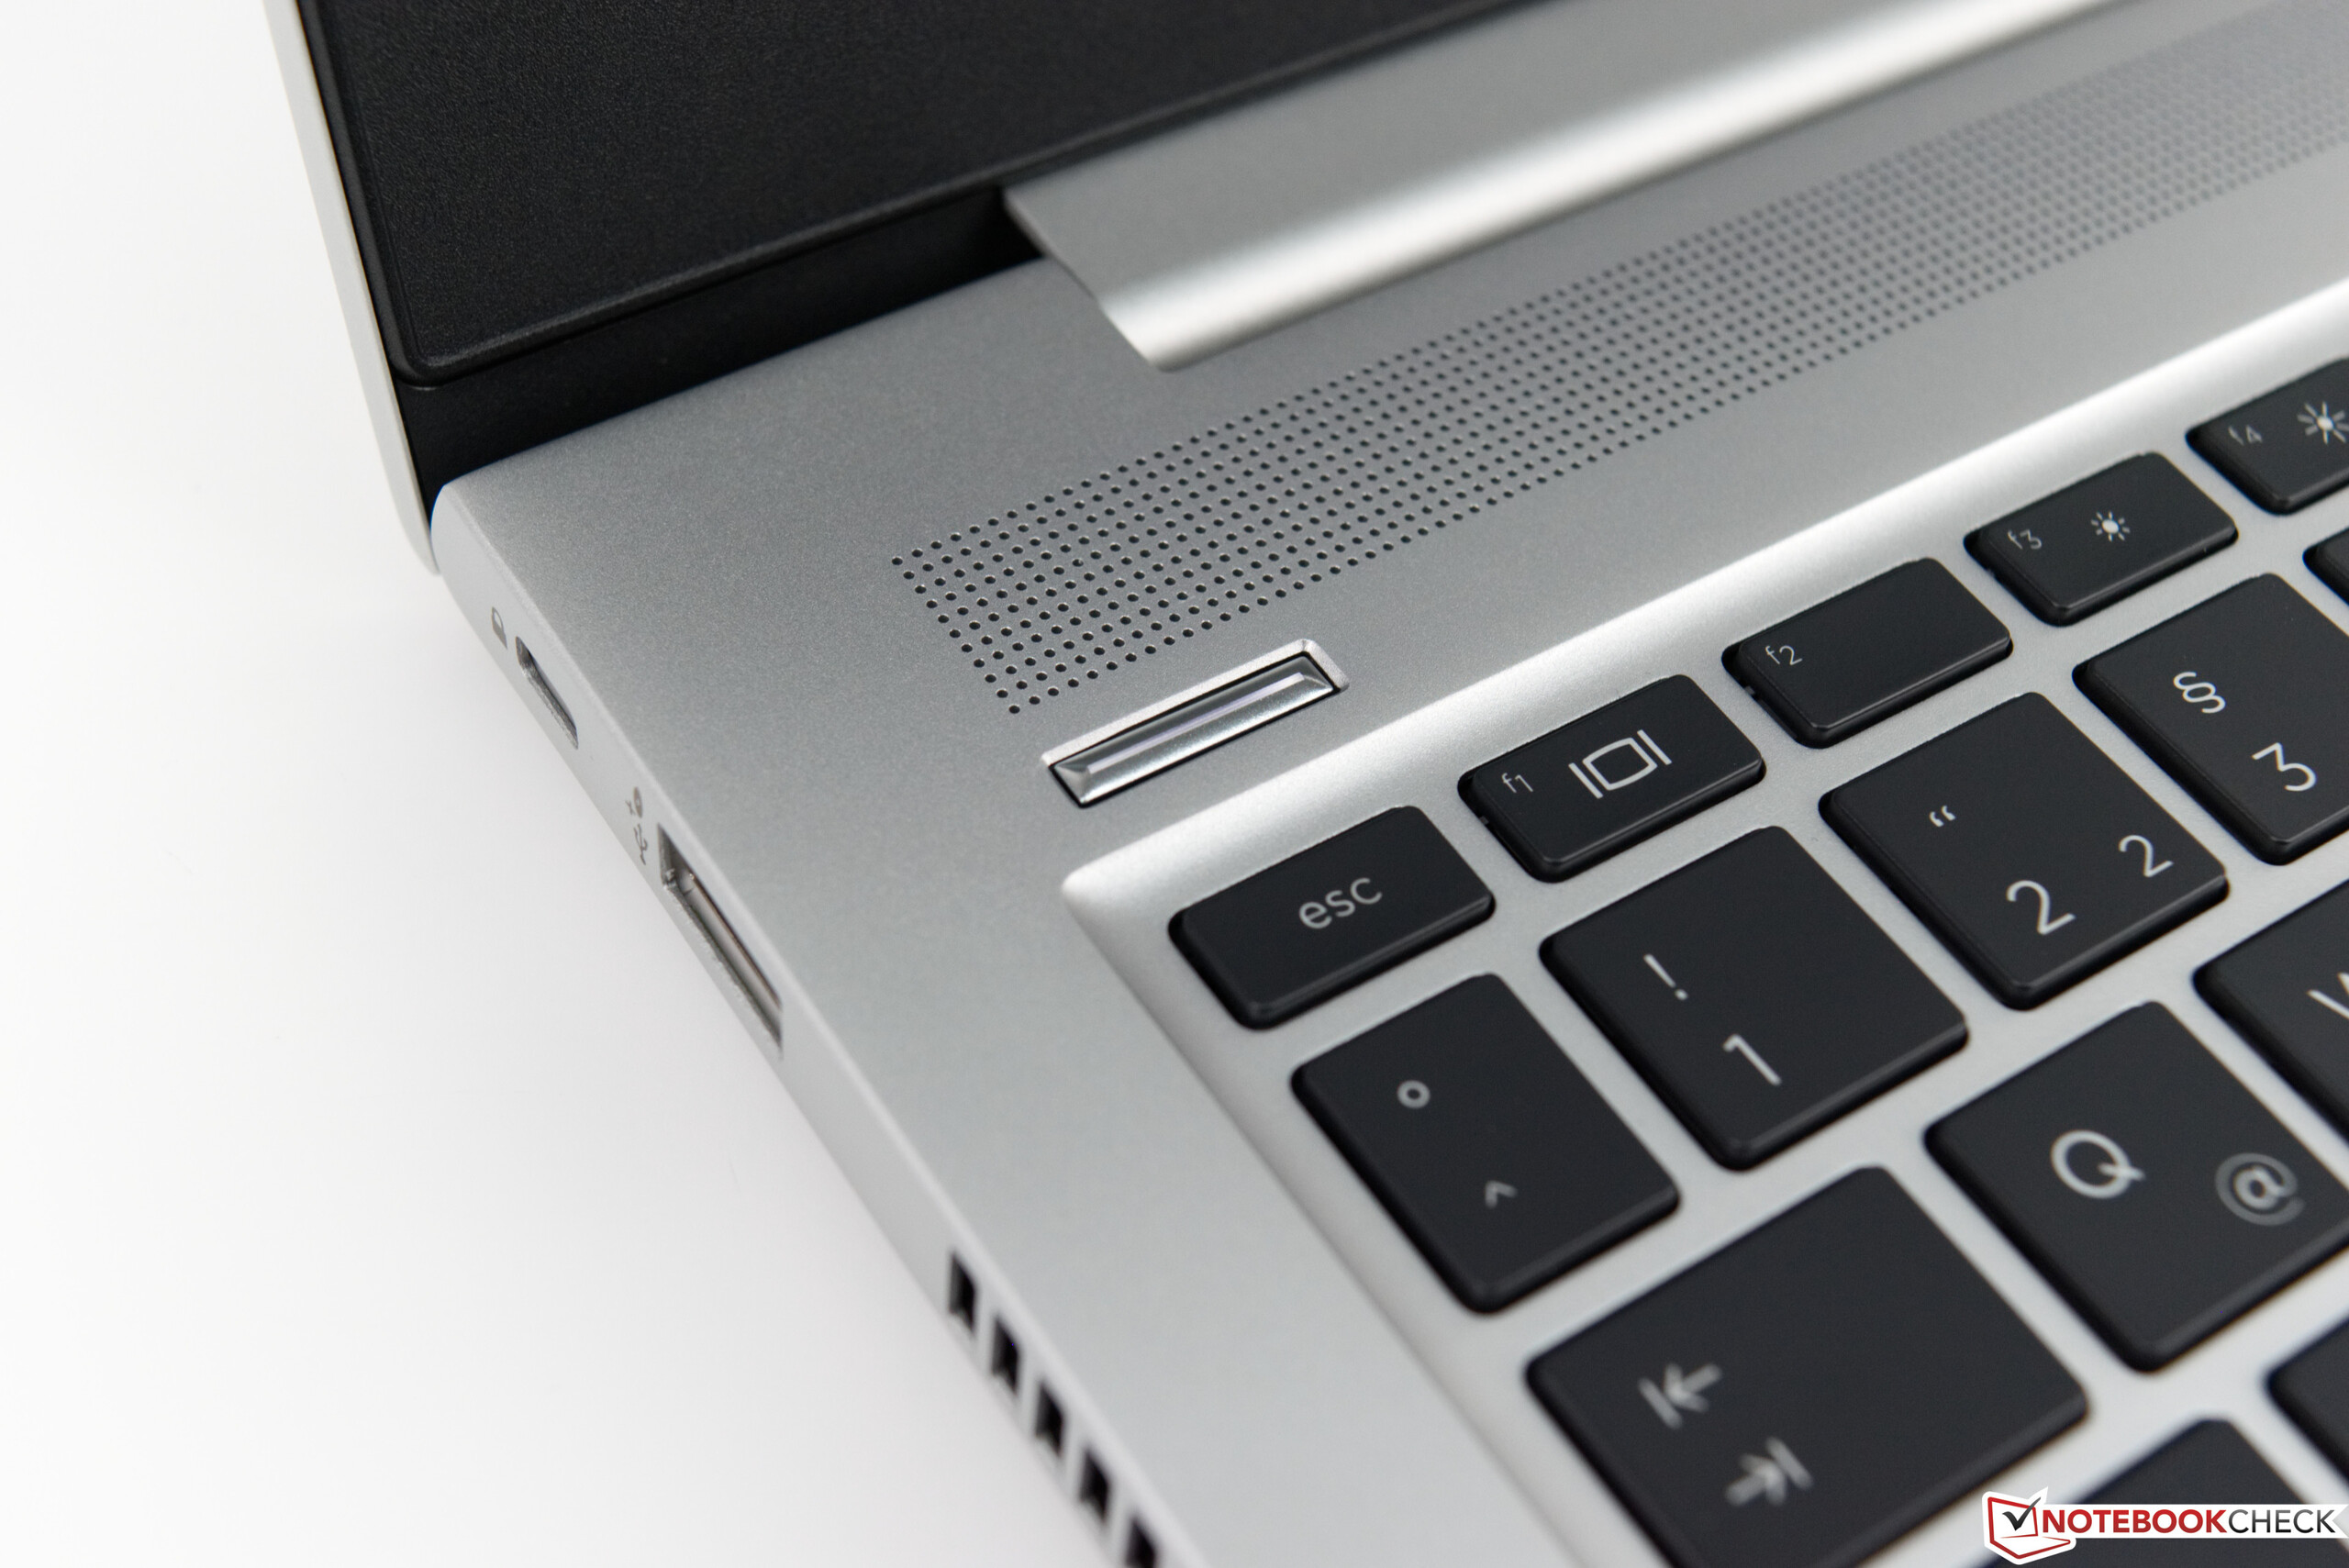
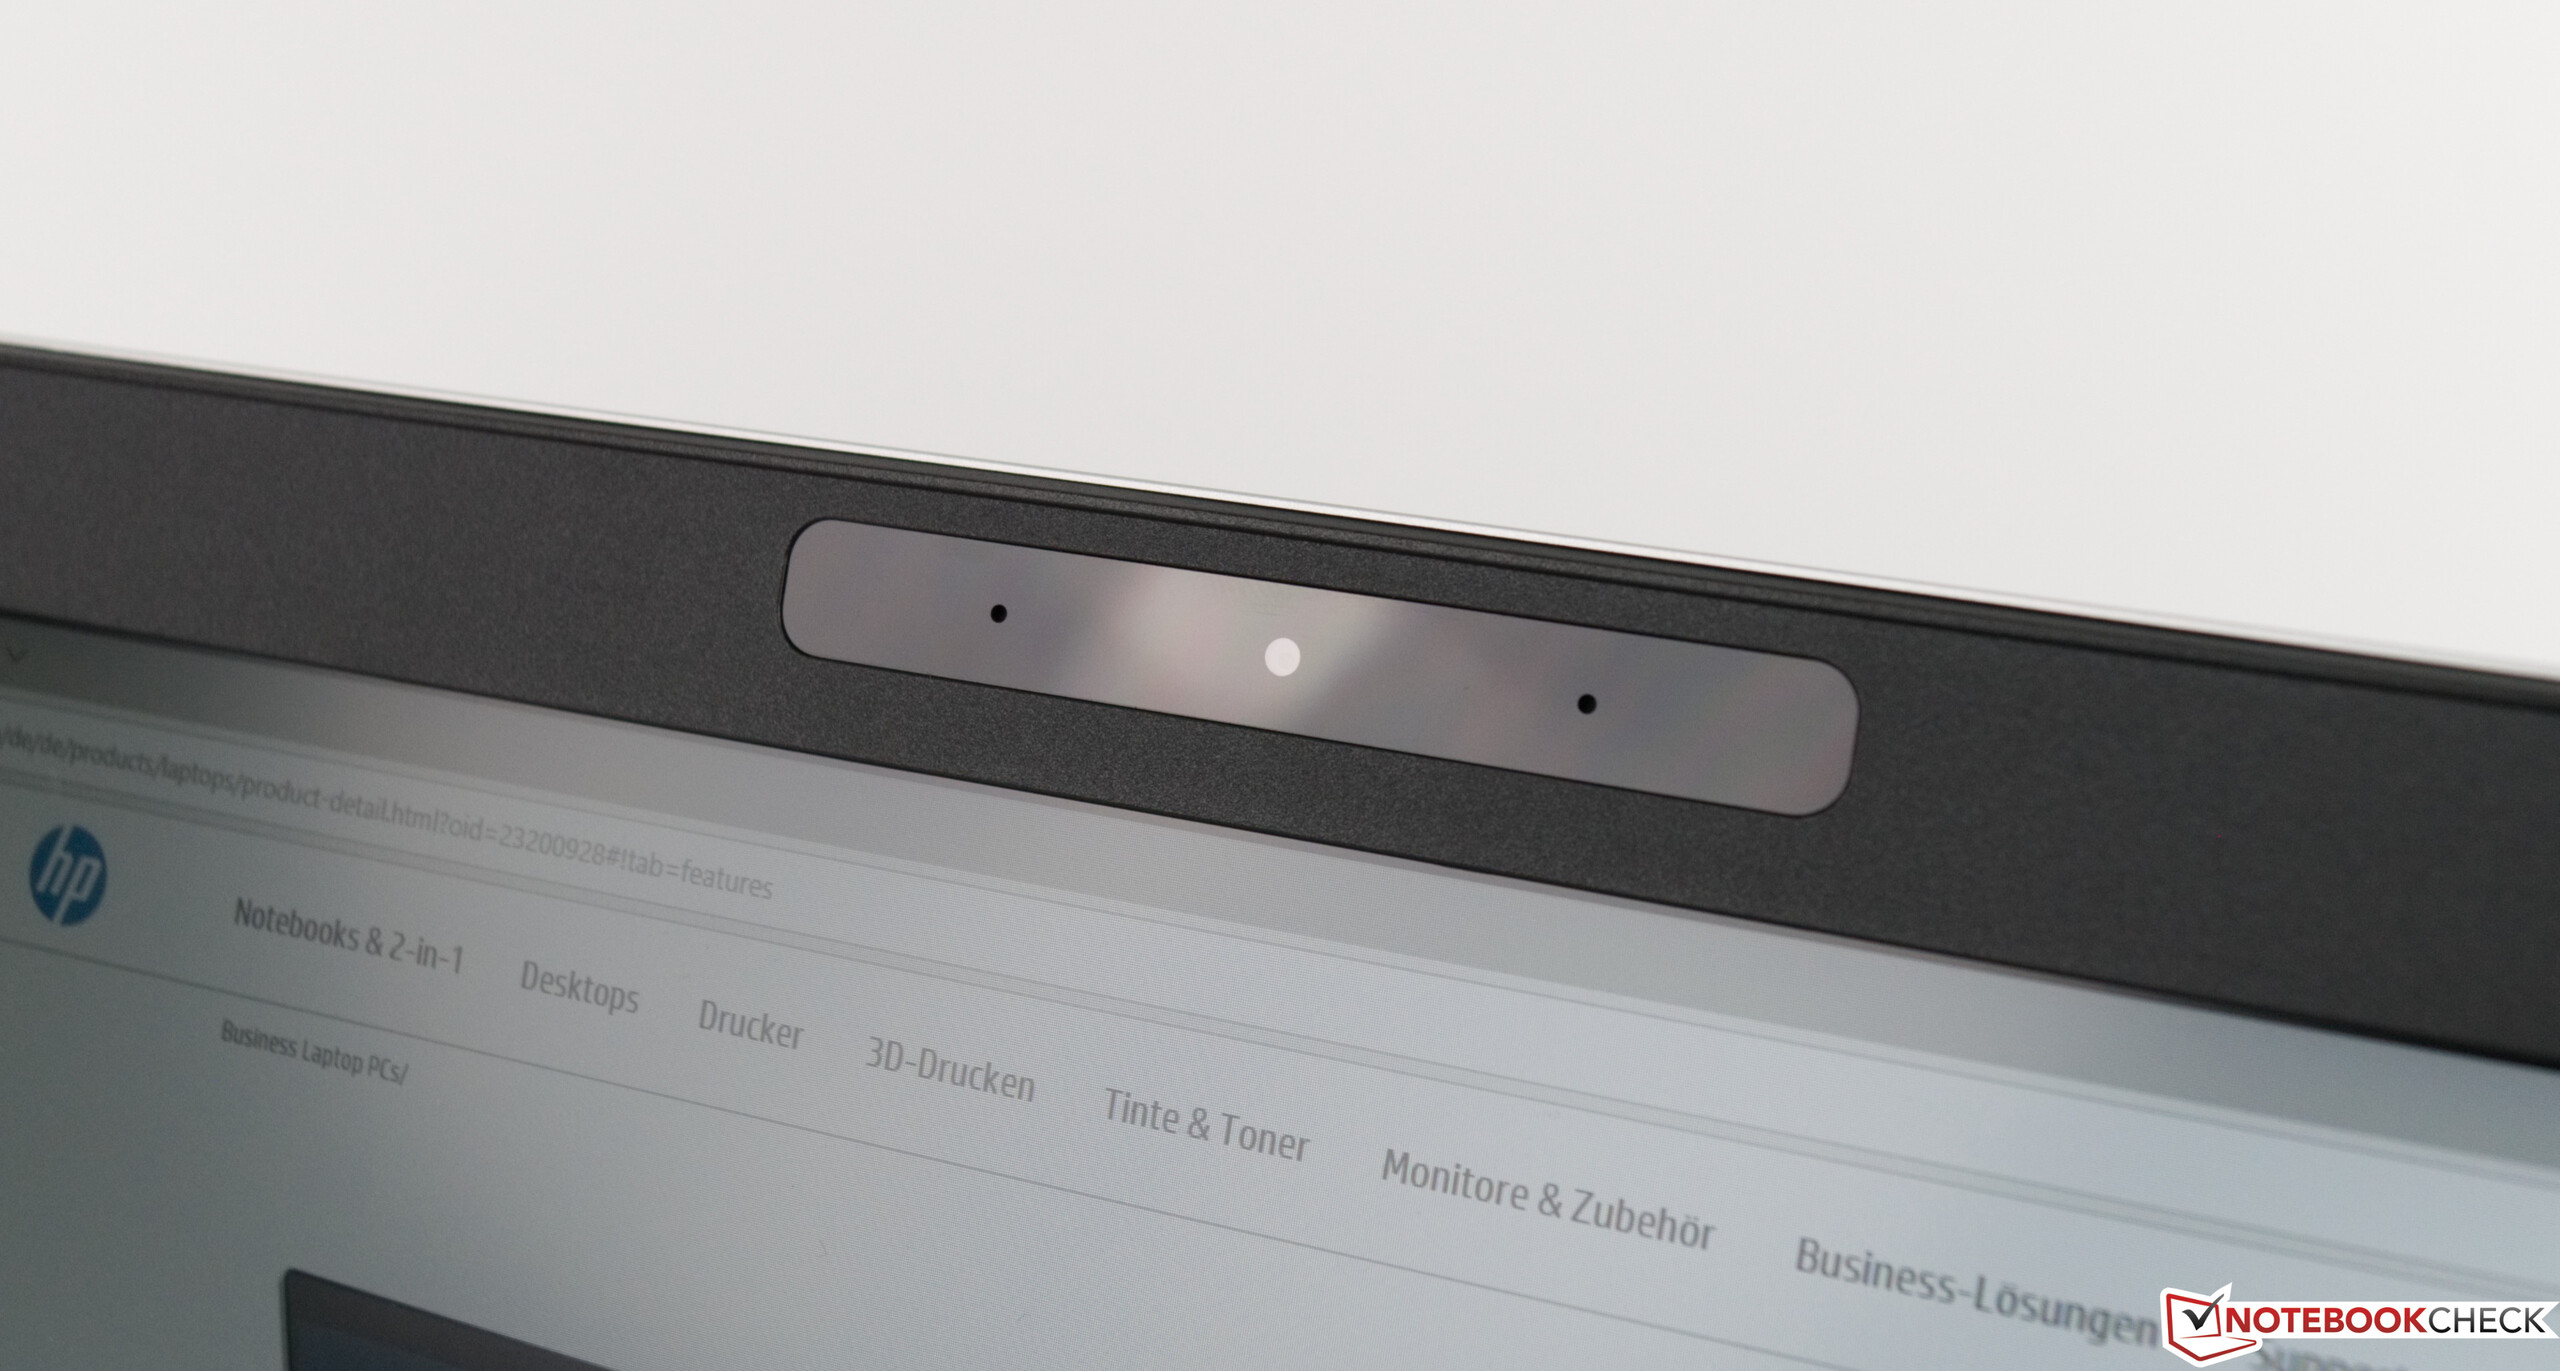
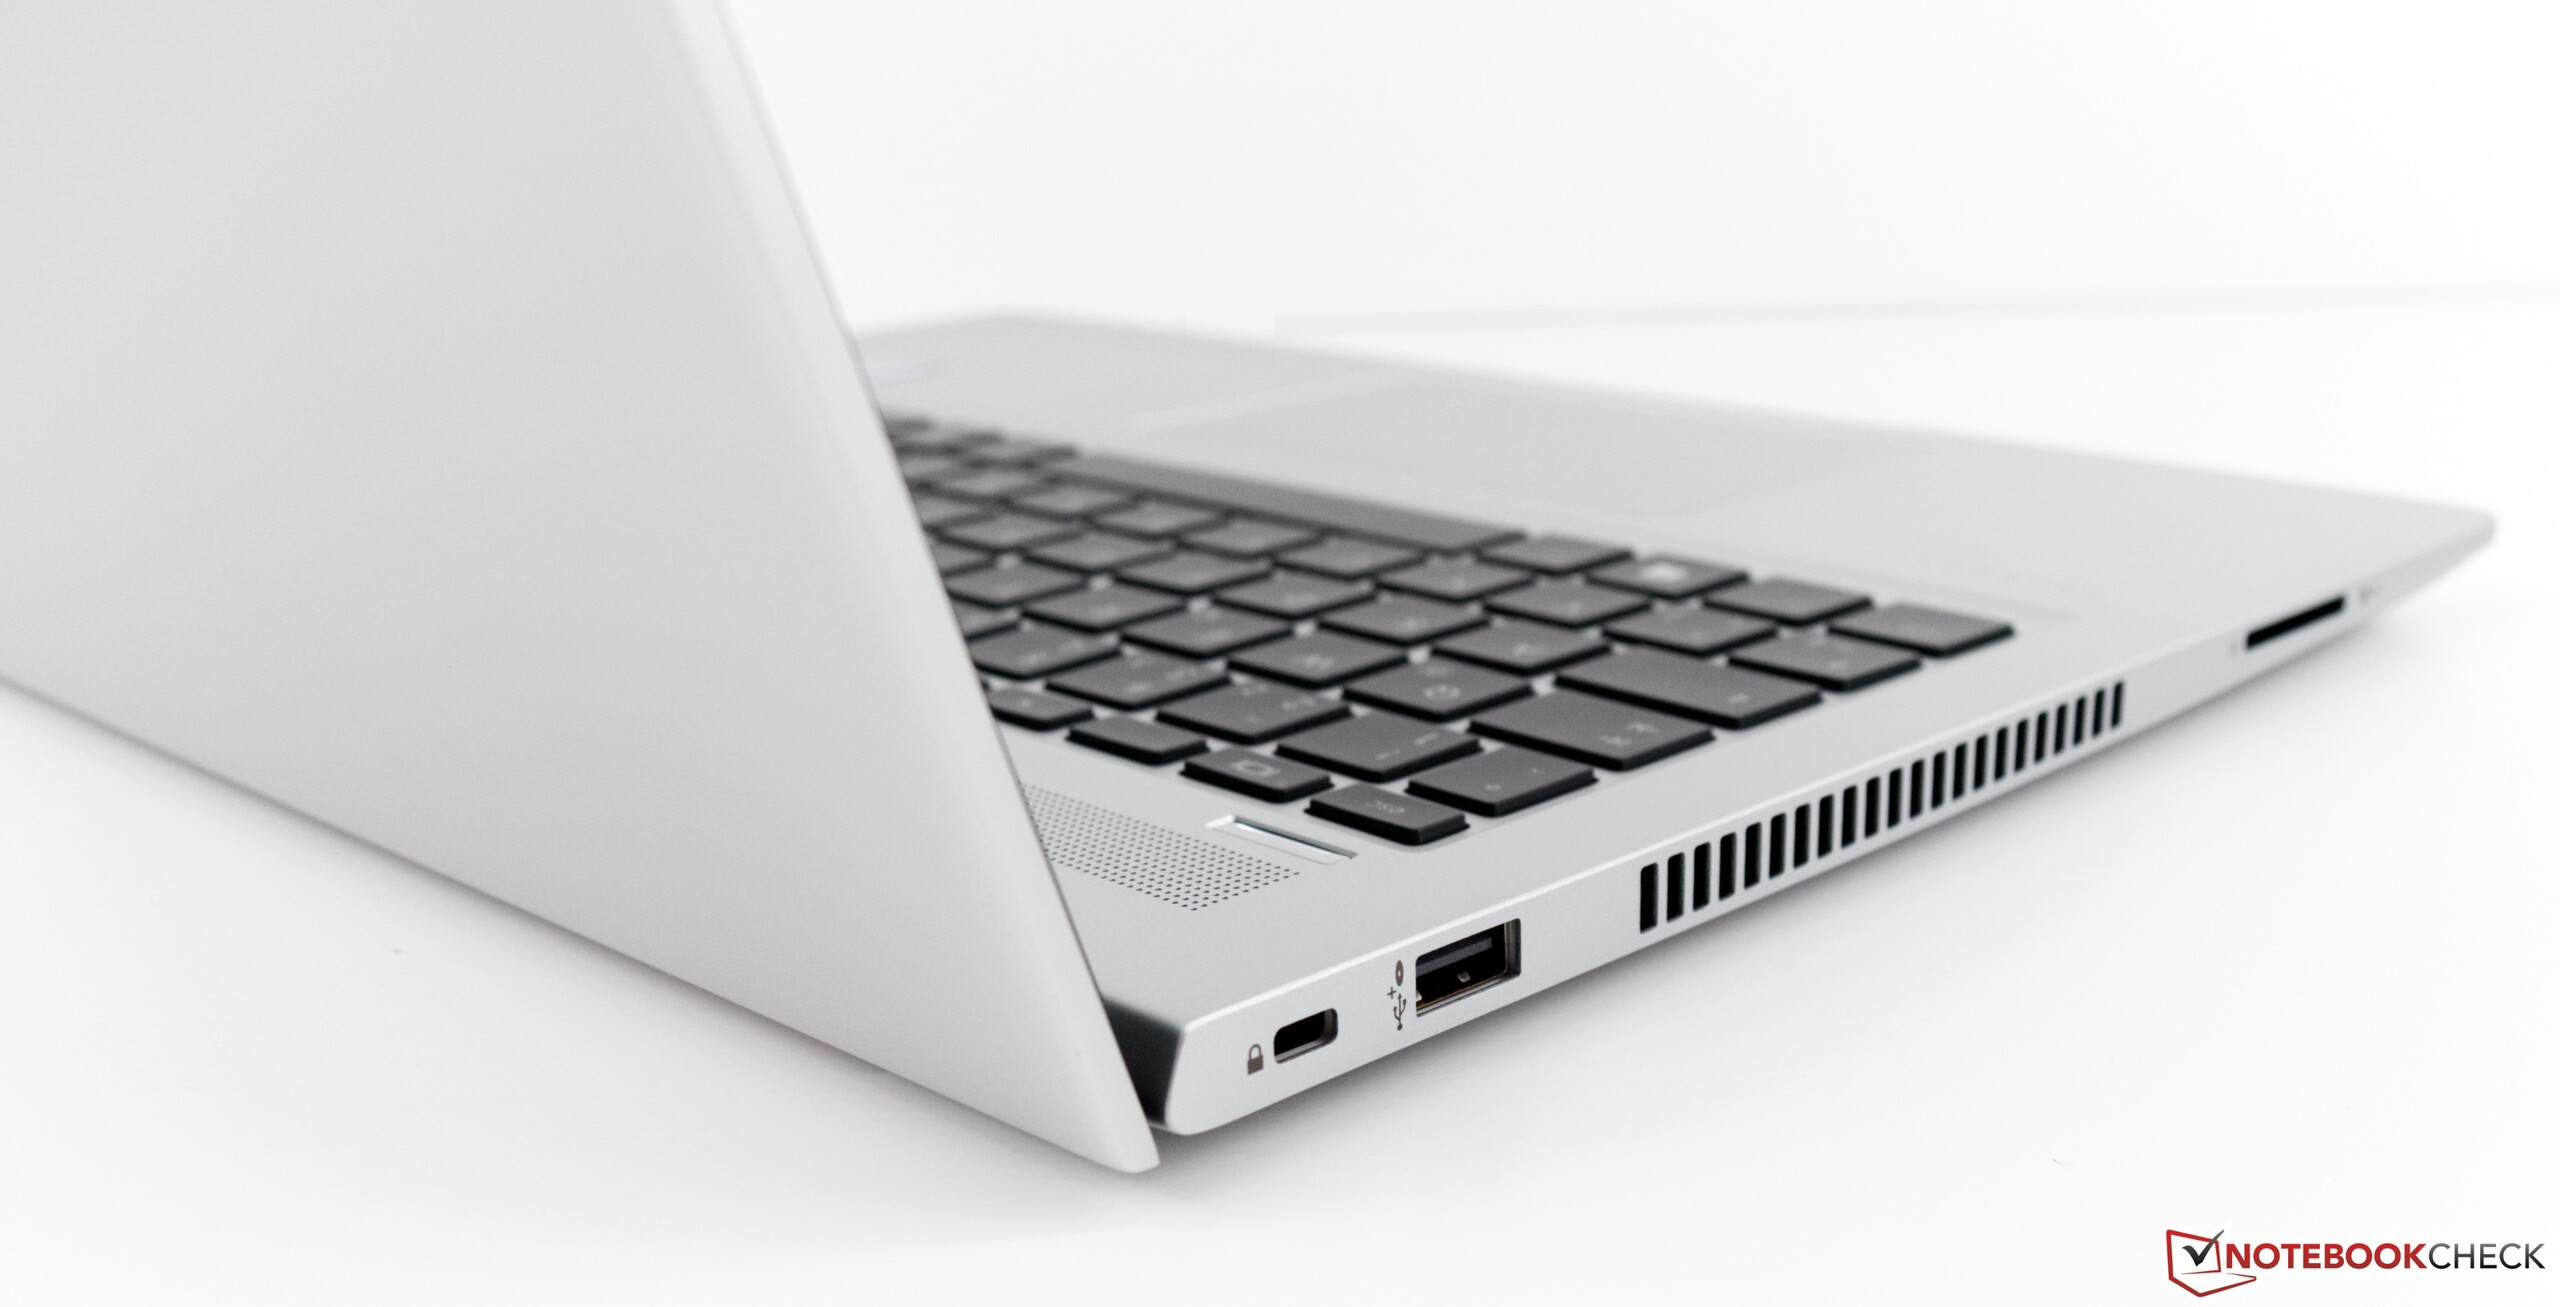
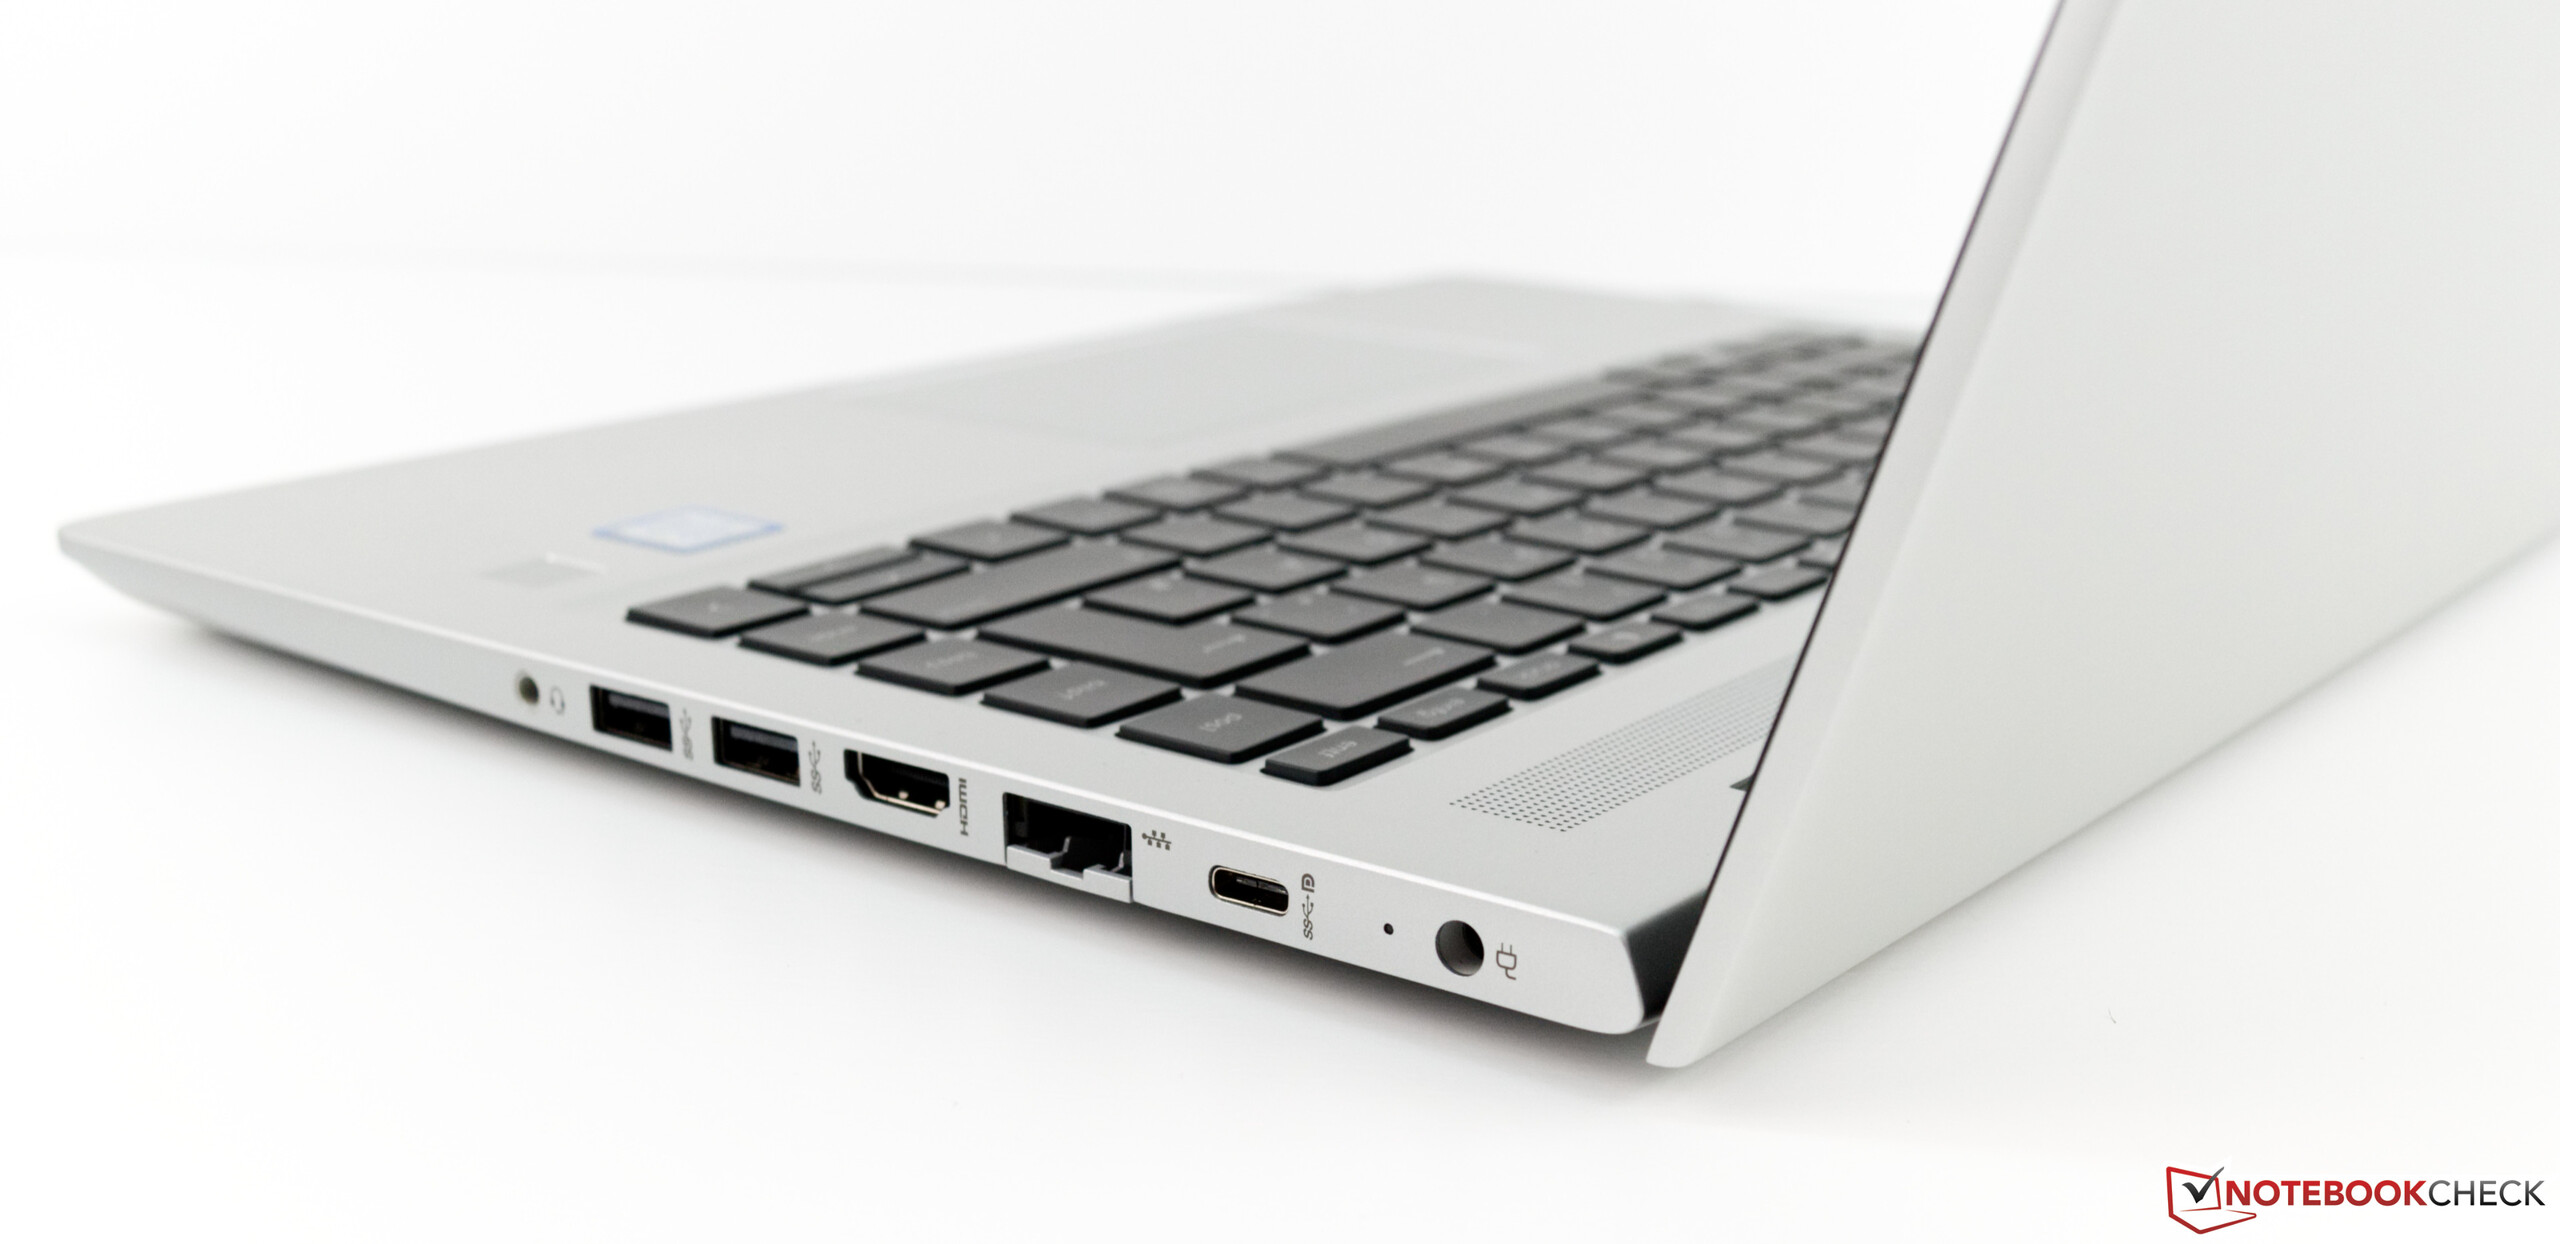
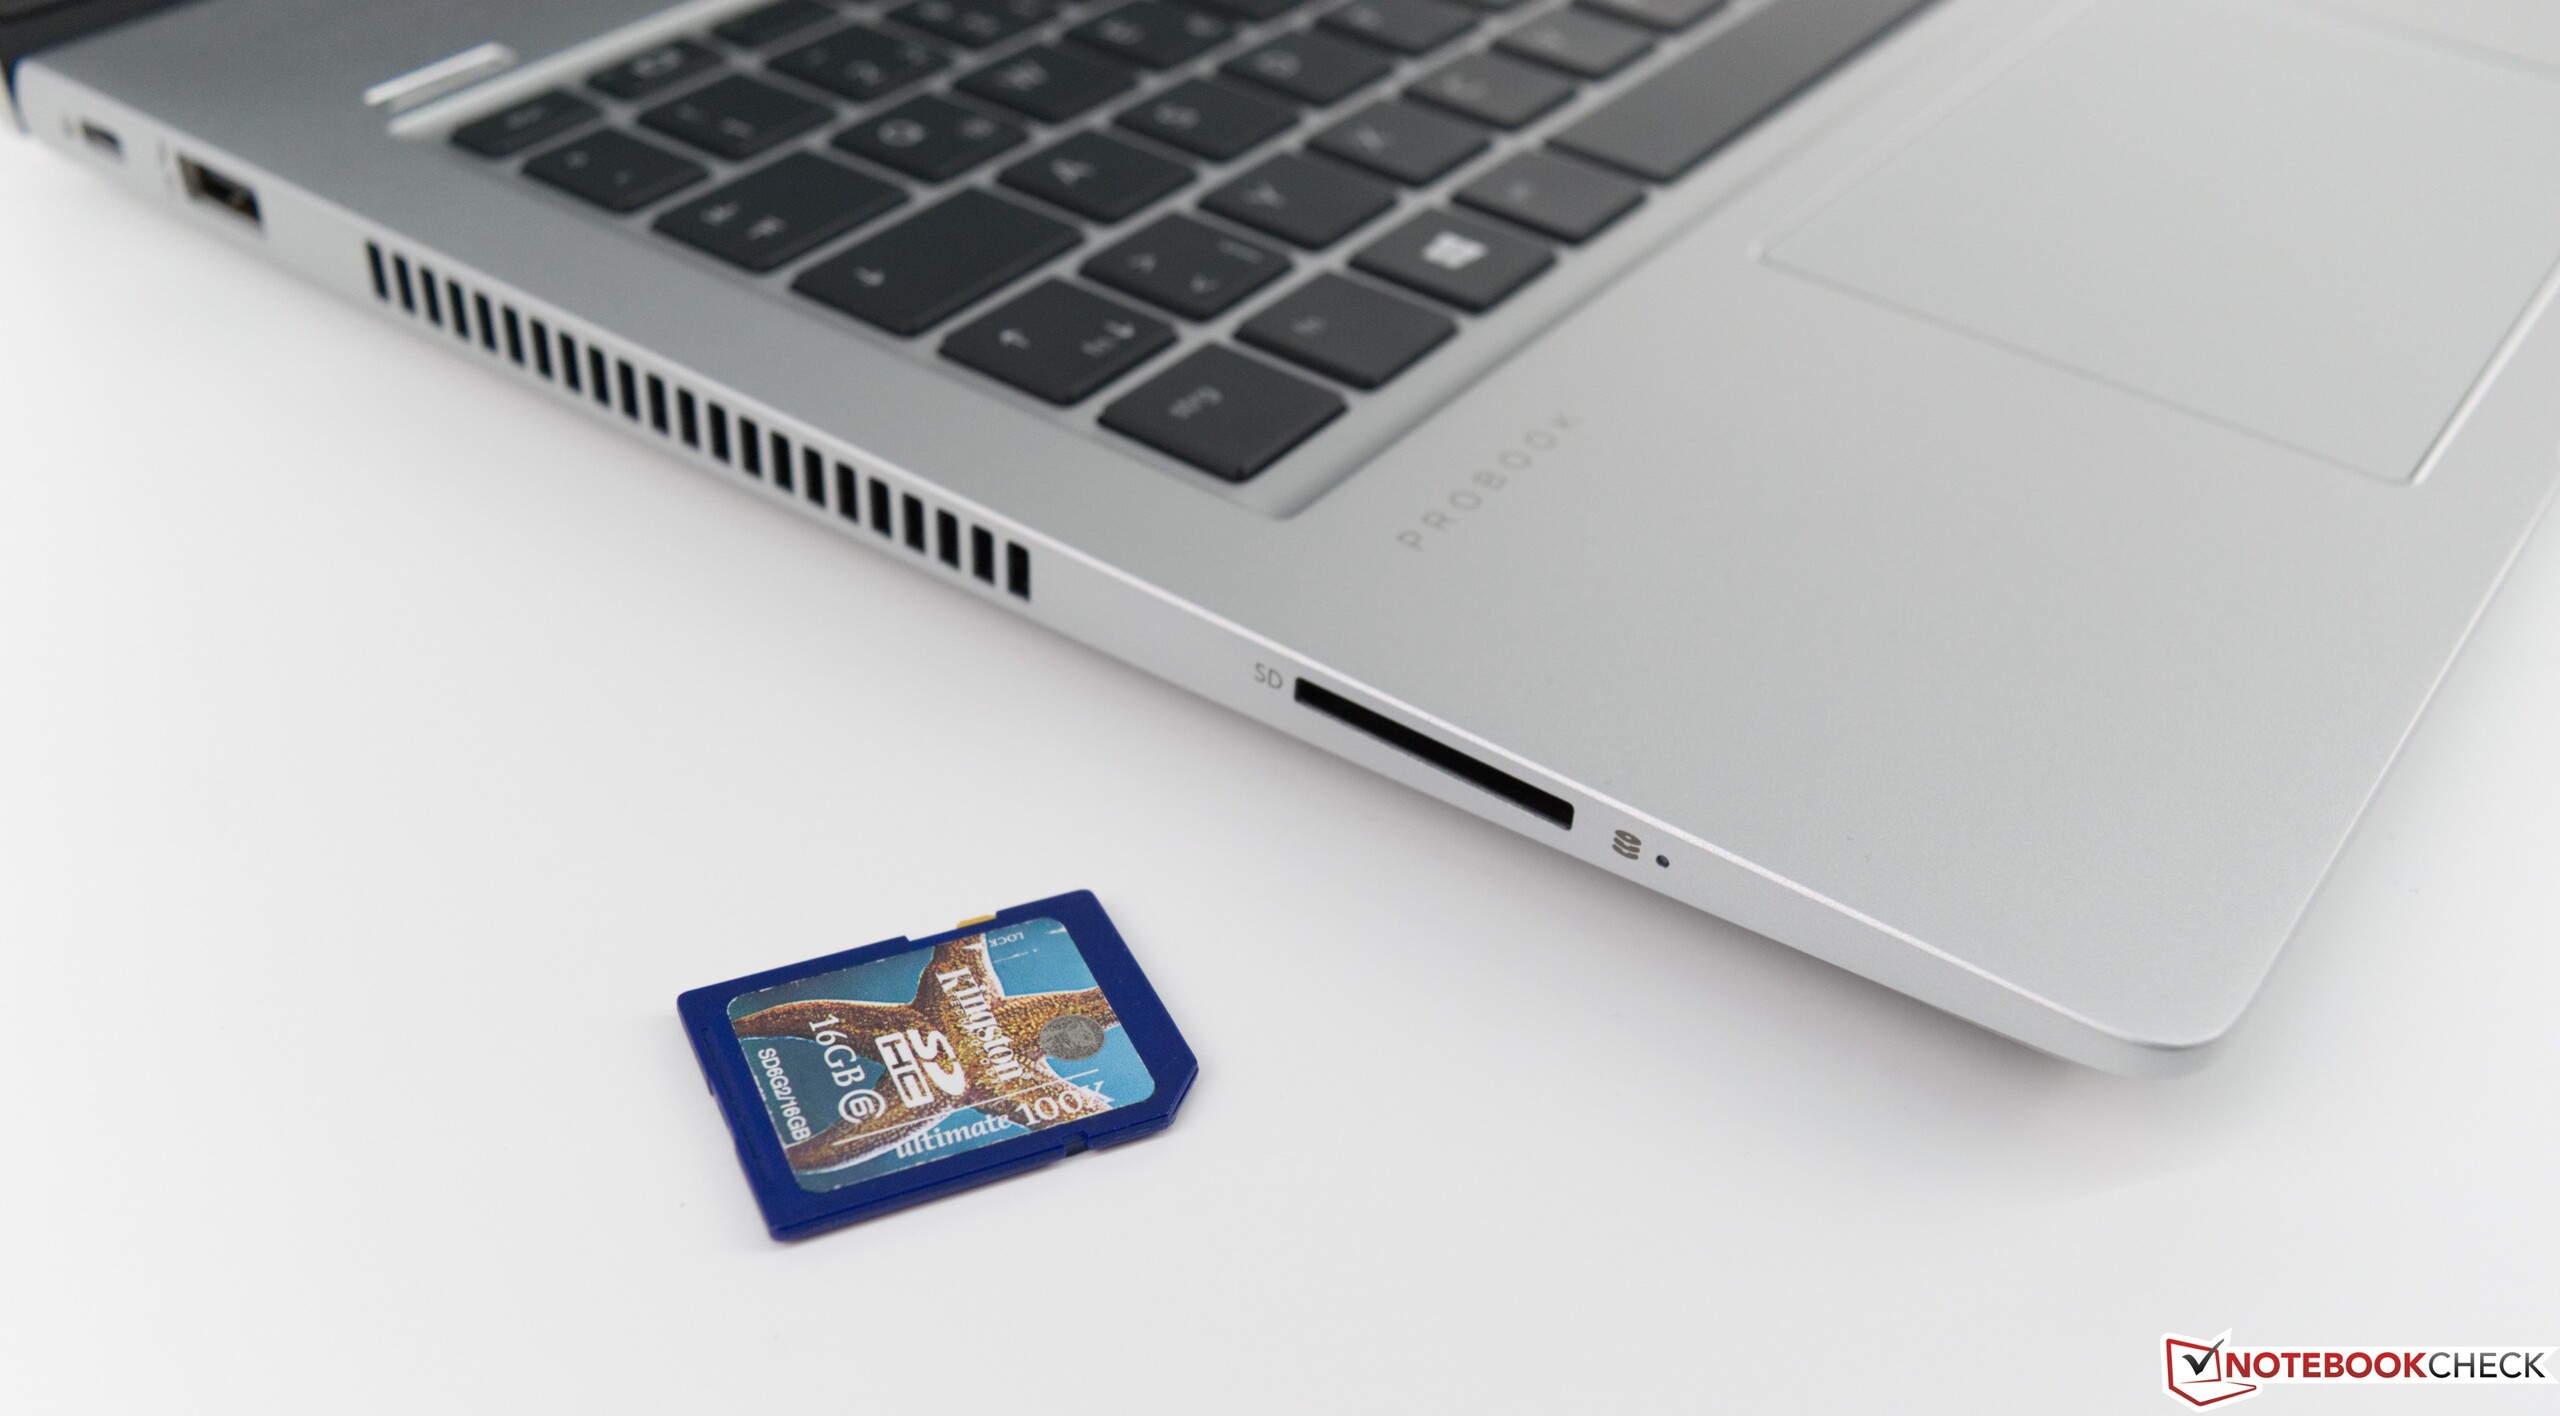
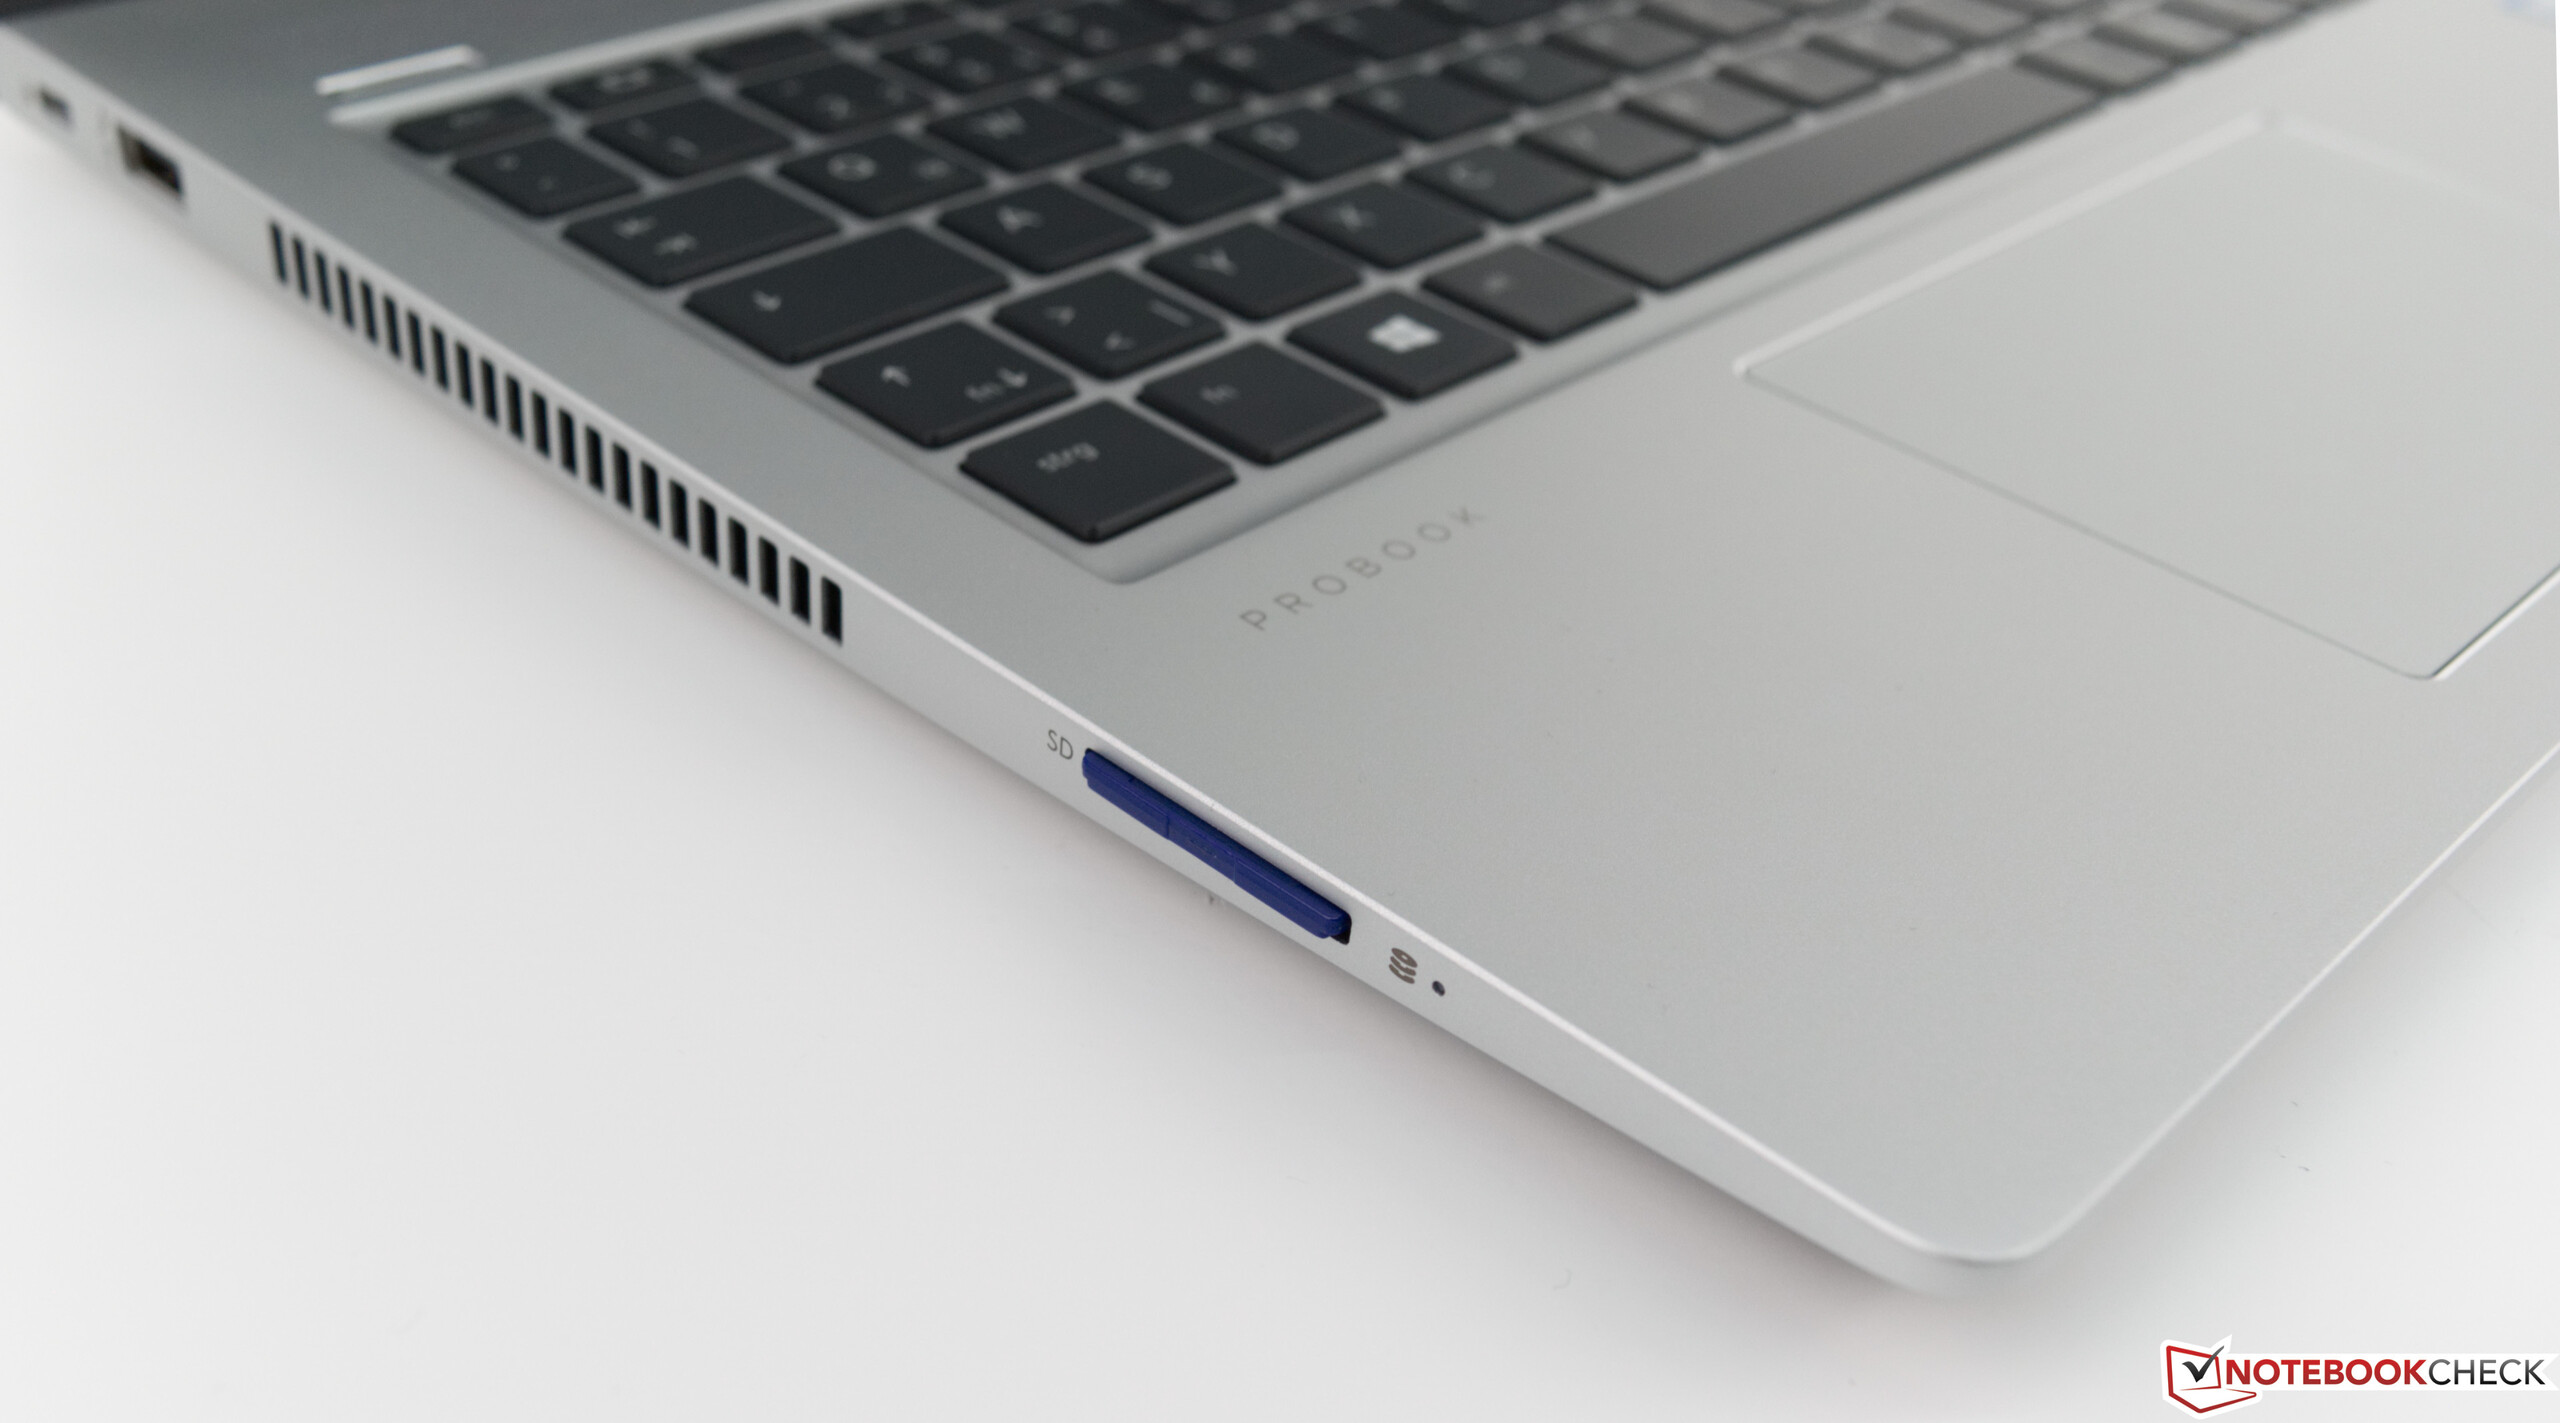
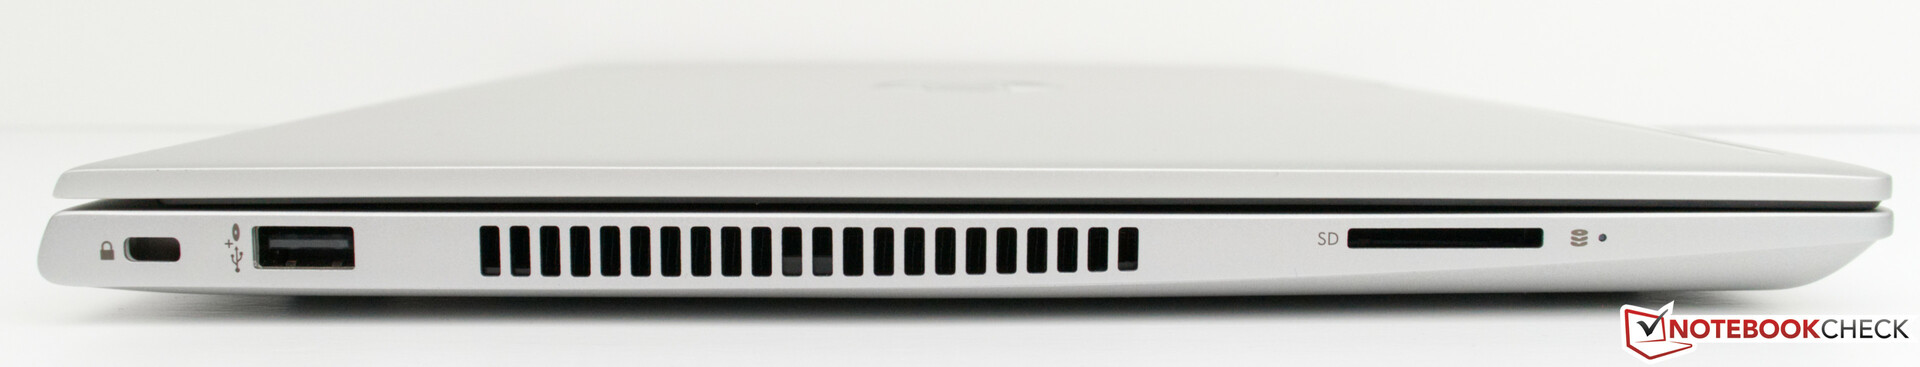
Il nous faut souligner les bons résultats de l’appareil en ce qui concerne les émissions. La faible consommation permet d’avoir une bonne autonomie, et le refroidissement prudent assure de faibles nuisances sonores. Nous avons également été impressionnés par les fonctionnalités de sécurité (lecteur d’empreintes digitales et webcam infrarouge), qui fonctionnent parfaitement. La présence d’un lecteur de carte SD doit également être mentionnée, beaucoup de constructeurs ayant maintenant tendance à proposer des lecteur de carte micro SD.
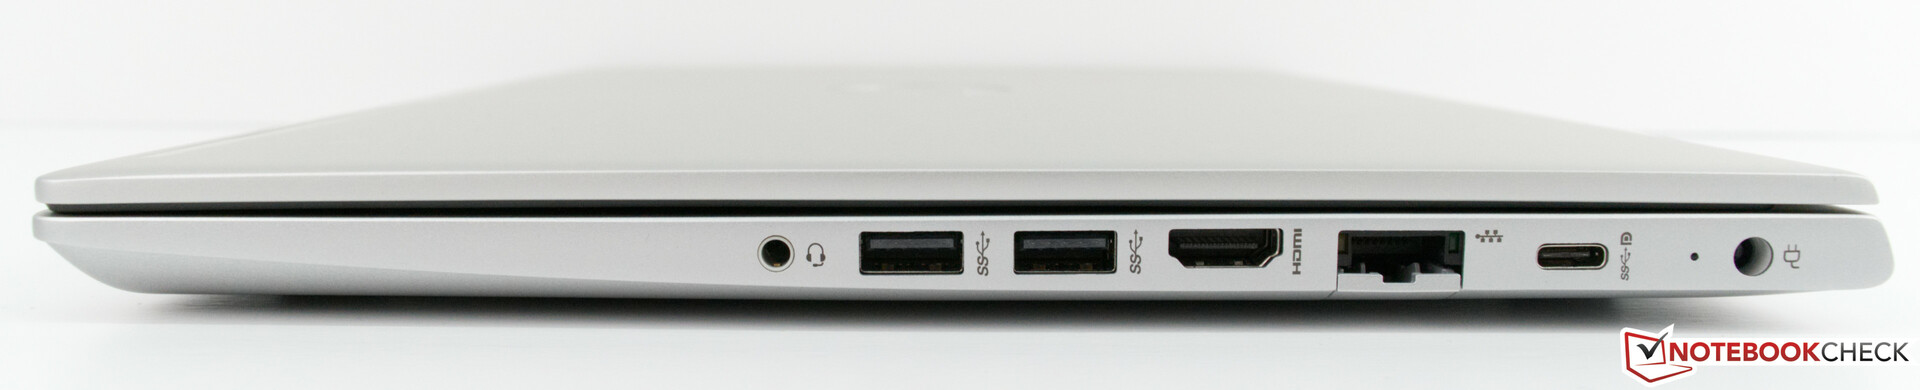
Mais un véritable portable pro aurait dû intégrer un lecteur de carte à puce. Cela aurait également été bien d’intégrer un port USB C avec Thunderbolt 3 - cela aurait permis à la machine de se différencier davantage de la multitude de ses concurrents.
L’intégralité de cette critique est disponible en anglais en suivant ce lien.
HP ProBook 440 G6-5TK01EA
- 03/08/2019 v6 (old)
Sebastian Bade
Price comparison
