Test du Lenovo ThinkPad T14s G3 AMD : bête de somme silencieuse et efficace avec la puissance de Ryzen
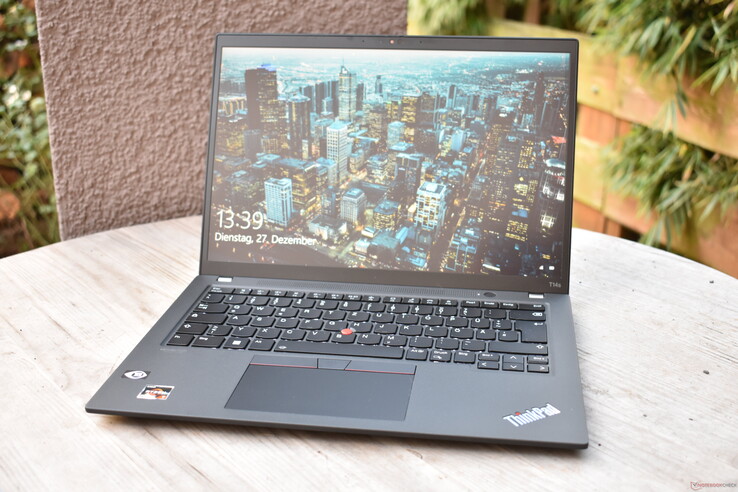
La gamme de Lenovo pour les clients professionnels est clairement alignée : L'ordinateur portable standard pour le bureau est le Lenovo ThinkPad T14 G3. Pour les cadres supérieurs et les utilisateurs particulièrement mobiles, Lenovo propose le ThinkPad X1 Carbon Gen 10. Et si ce dernier est trop cher mais que la mobilité est toujours importante, le Lenovo ThinkPad T14s G3 représente une autre option qui est censée combiner le meilleur des deux modèles. Un avantage par rapport au ThinkPad X1 Carbon est que le T14s est également disponible avec des processeurs AMD, tels que le AMD Ryzen Pro 6850Uinclus dans notre unité de test aujourd'hui.
Comme le T14s G3 utilise toujours le même boîtier, qu'il soit équipé d'un processeur Intel ou AMD, cet article est une mise à jour du test. Vous trouverez des informations sur le boîtier et le design, l'équipement et les périphériques d'entrée dans notre test du Lenovo ThinkPad T14s G3 Intel sur
.<br>
Comparaison avec les concurrents potentiels
Note | Date | Modèle | Poids | Épaisseur | Taille | Résolution | Prix |
|---|---|---|---|---|---|---|---|
| 90.6 % v7 (old) | 01/23 | Lenovo ThinkPad T14s G3 21CQ002LGE R7 PRO 6850U, Radeon 680M | 1.3 kg | 16.9 mm | 14.00" | 1920x1200 | |
| 89.1 % v7 (old) | 12/22 | Lenovo ThinkPad T14s G3 21BR00CDGE i5-1235U, Iris Xe G7 80EUs | 1.3 kg | 16.9 mm | 14.00" | 1920x1200 | |
| 90.1 % v7 (old) | 03/22 | Lenovo ThinkPad T14s G2 20XGS01100 R7 PRO 5850U, Vega 8 | 1.3 kg | 16.14 mm | 14.00" | 1920x1080 | |
| 89.8 % v7 (old) | 08/22 | Dell Latitude 9430 2-in-1 i7-1265U, Iris Xe G7 96EUs | 1.5 kg | 13.94 mm | 14.00" | 2560x1600 | |
| 88.6 % v7 (old) | 11/22 | HP EliteBook 845 G9 6F6H9EA R5 PRO 6650U, Radeon 660M | 1.4 kg | 19 mm | 14.00" | 1920x1200 |
Connexions
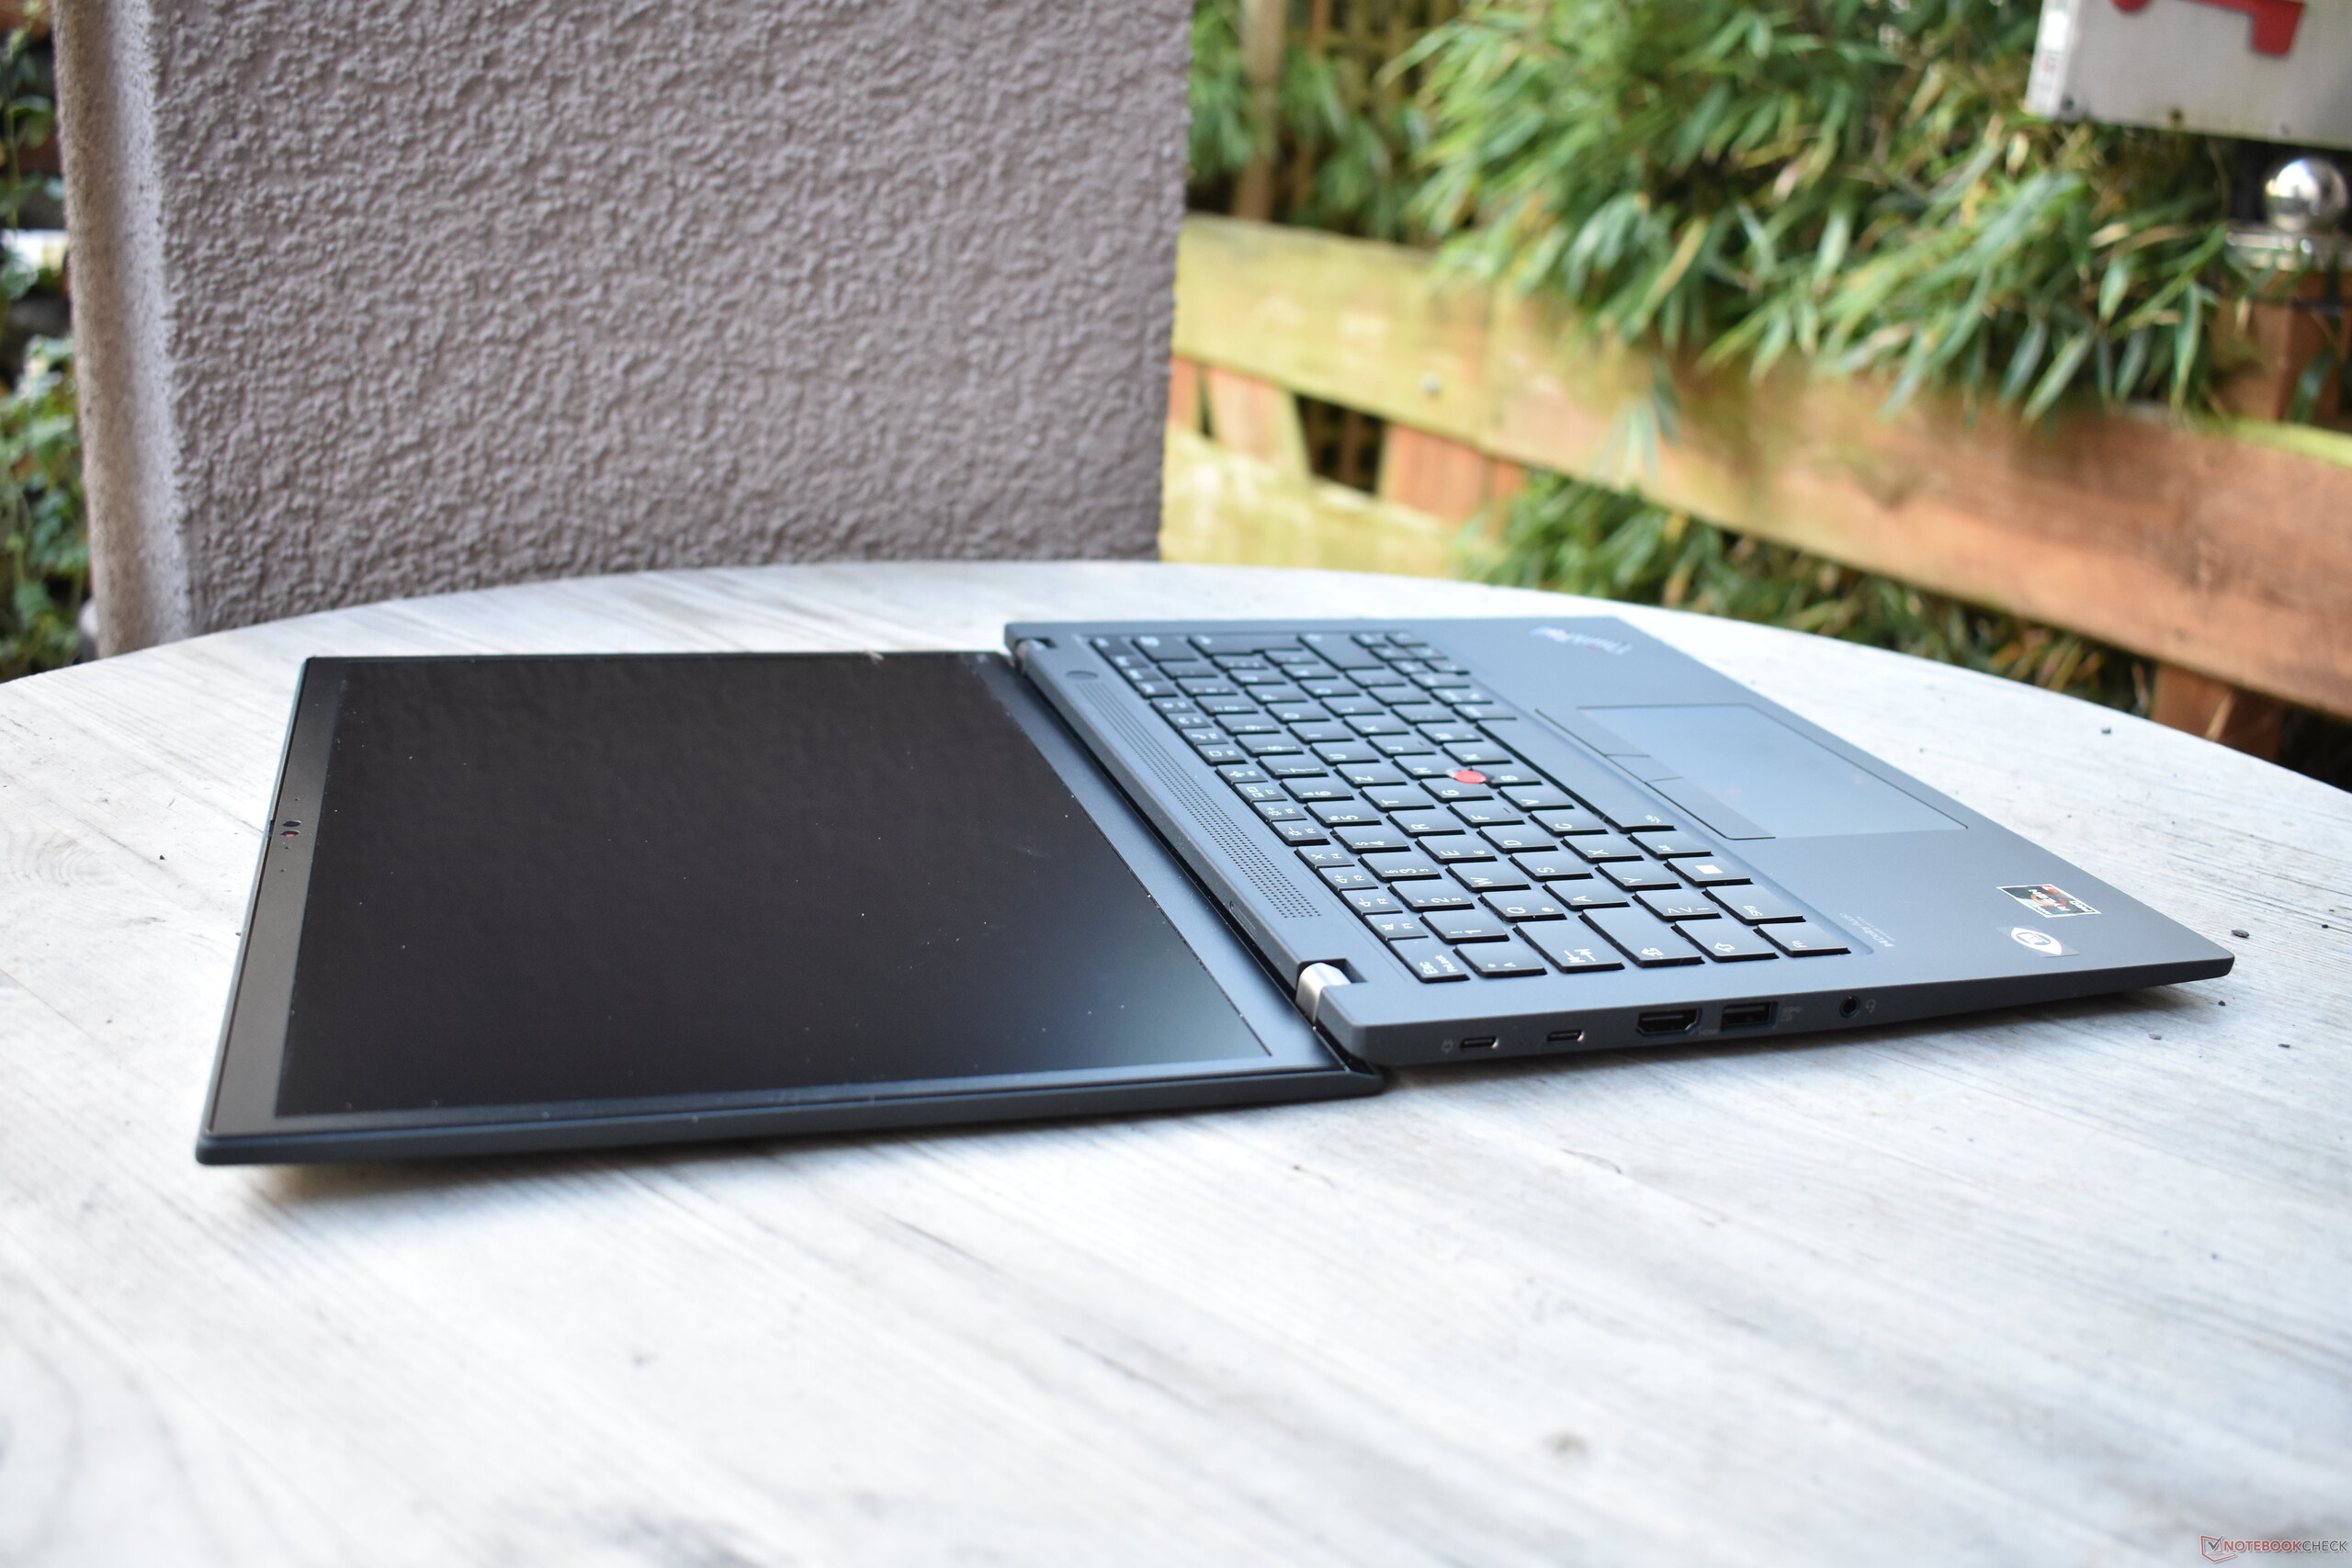
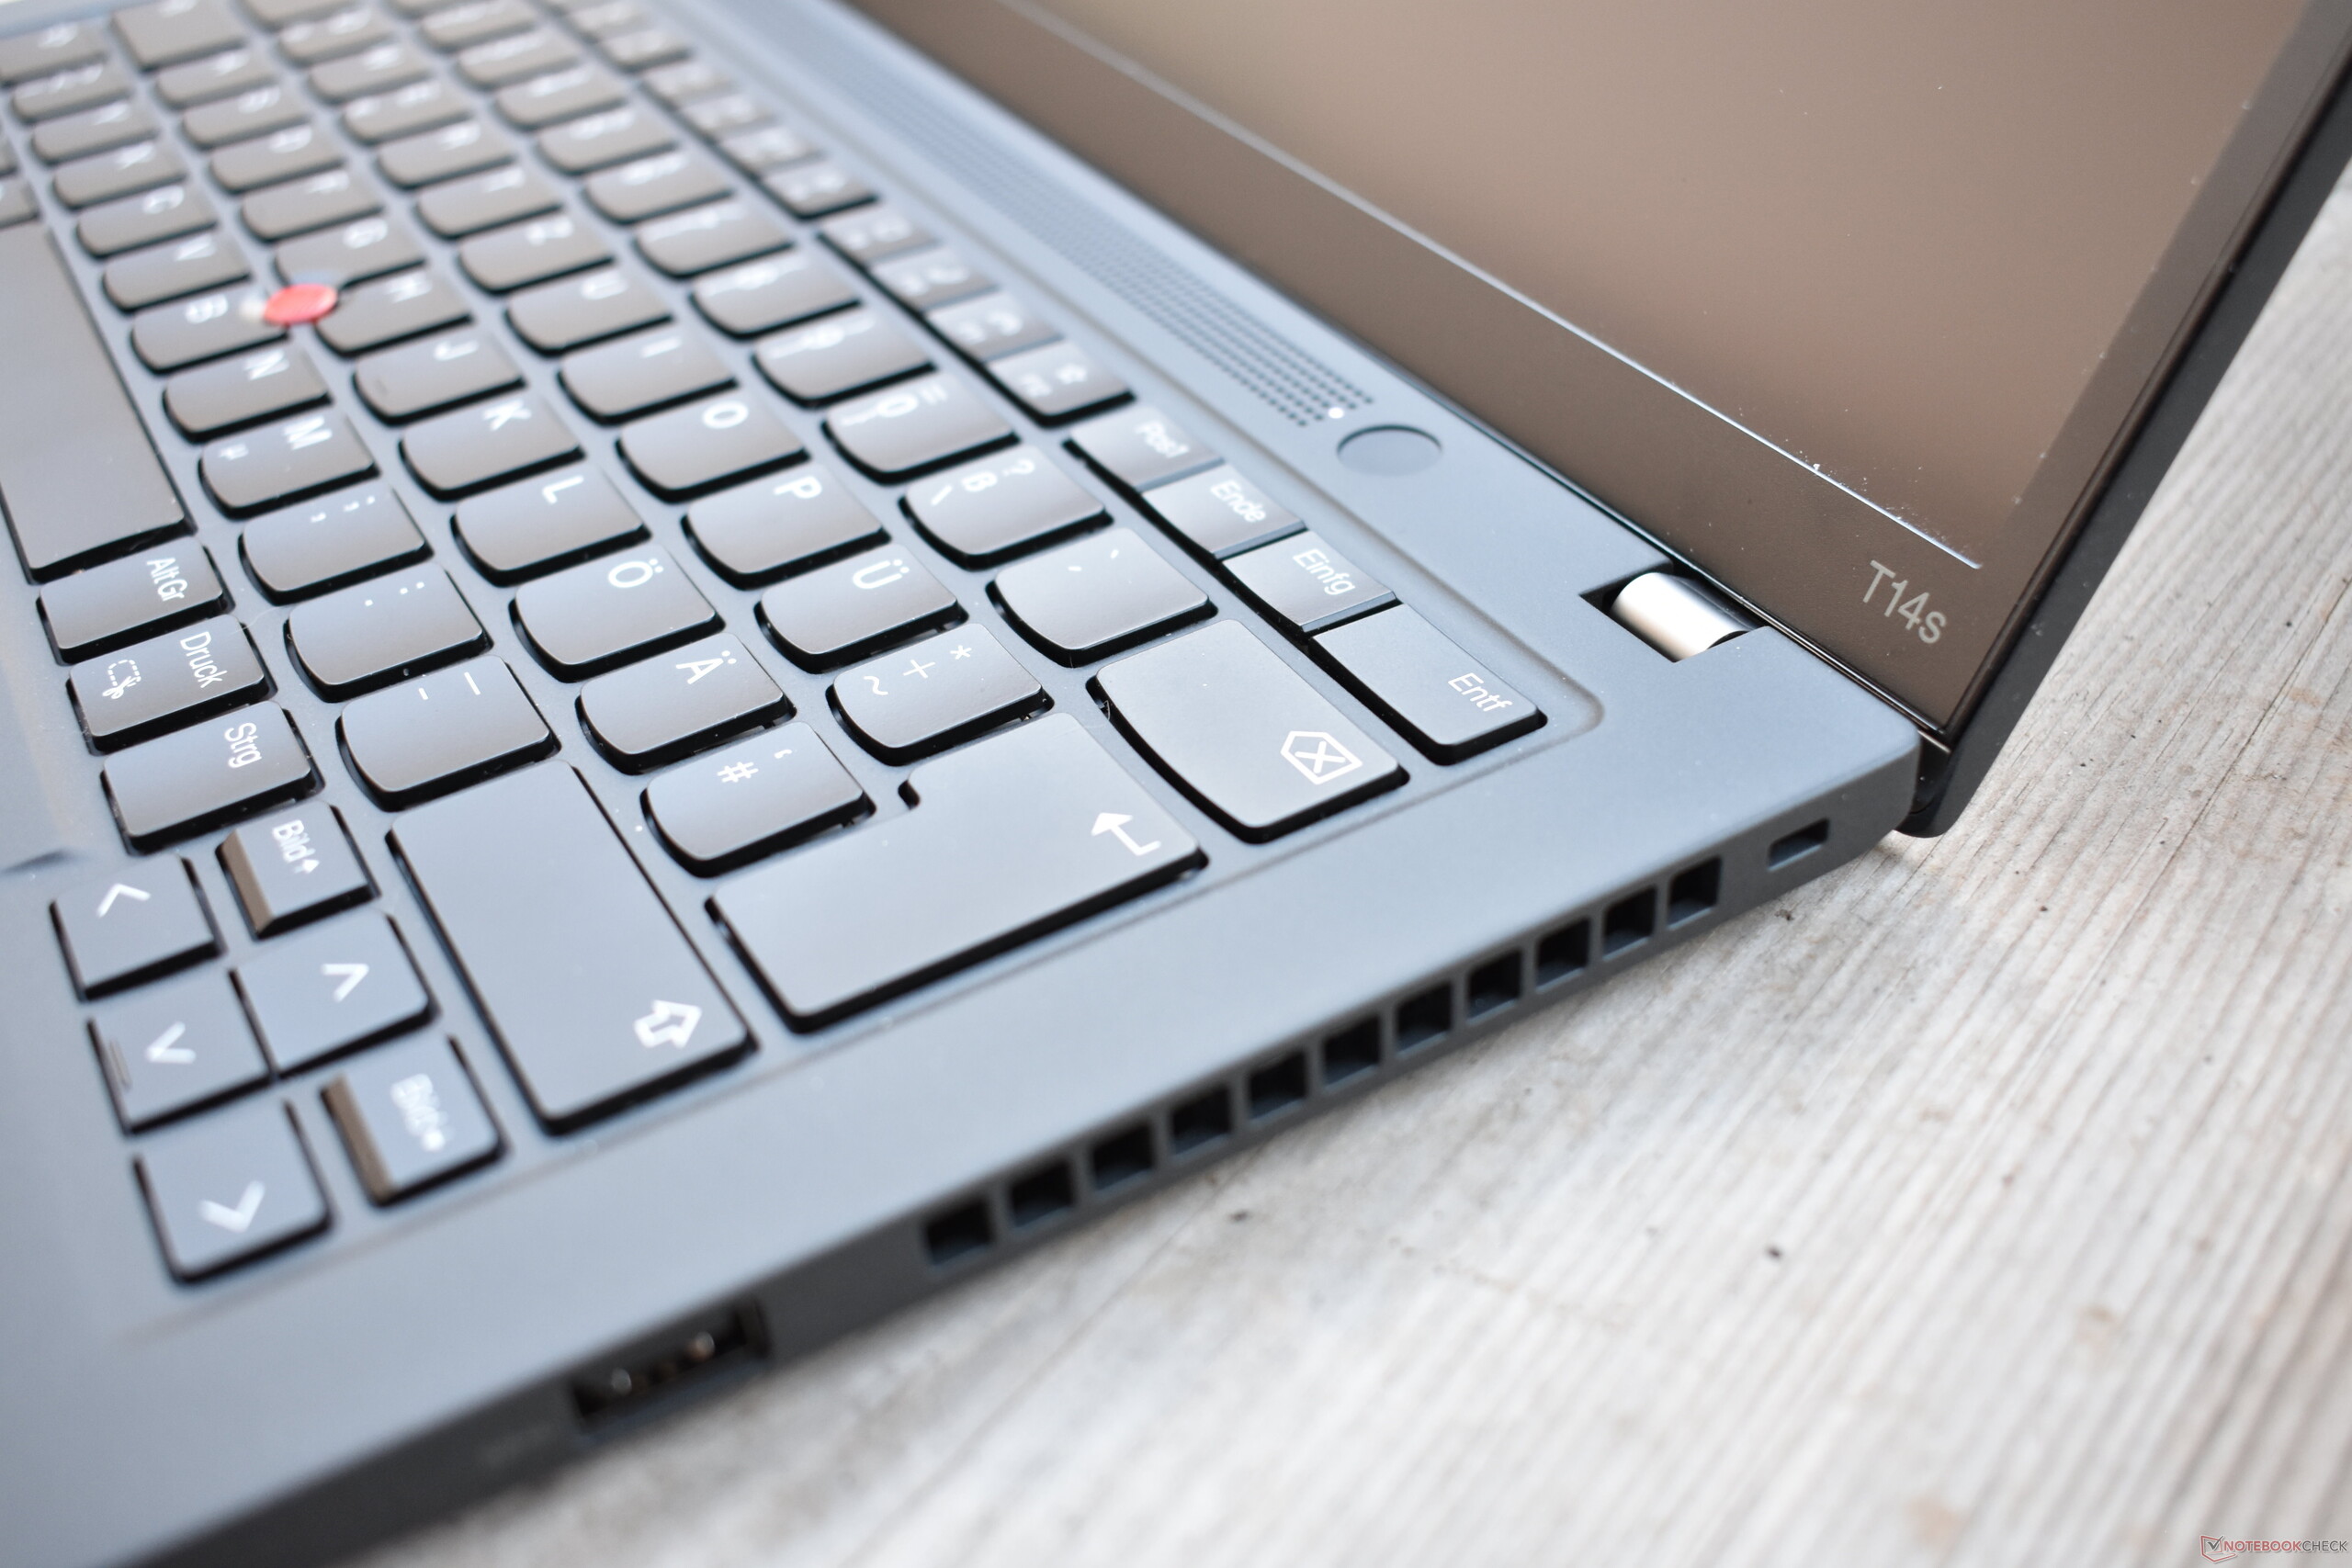
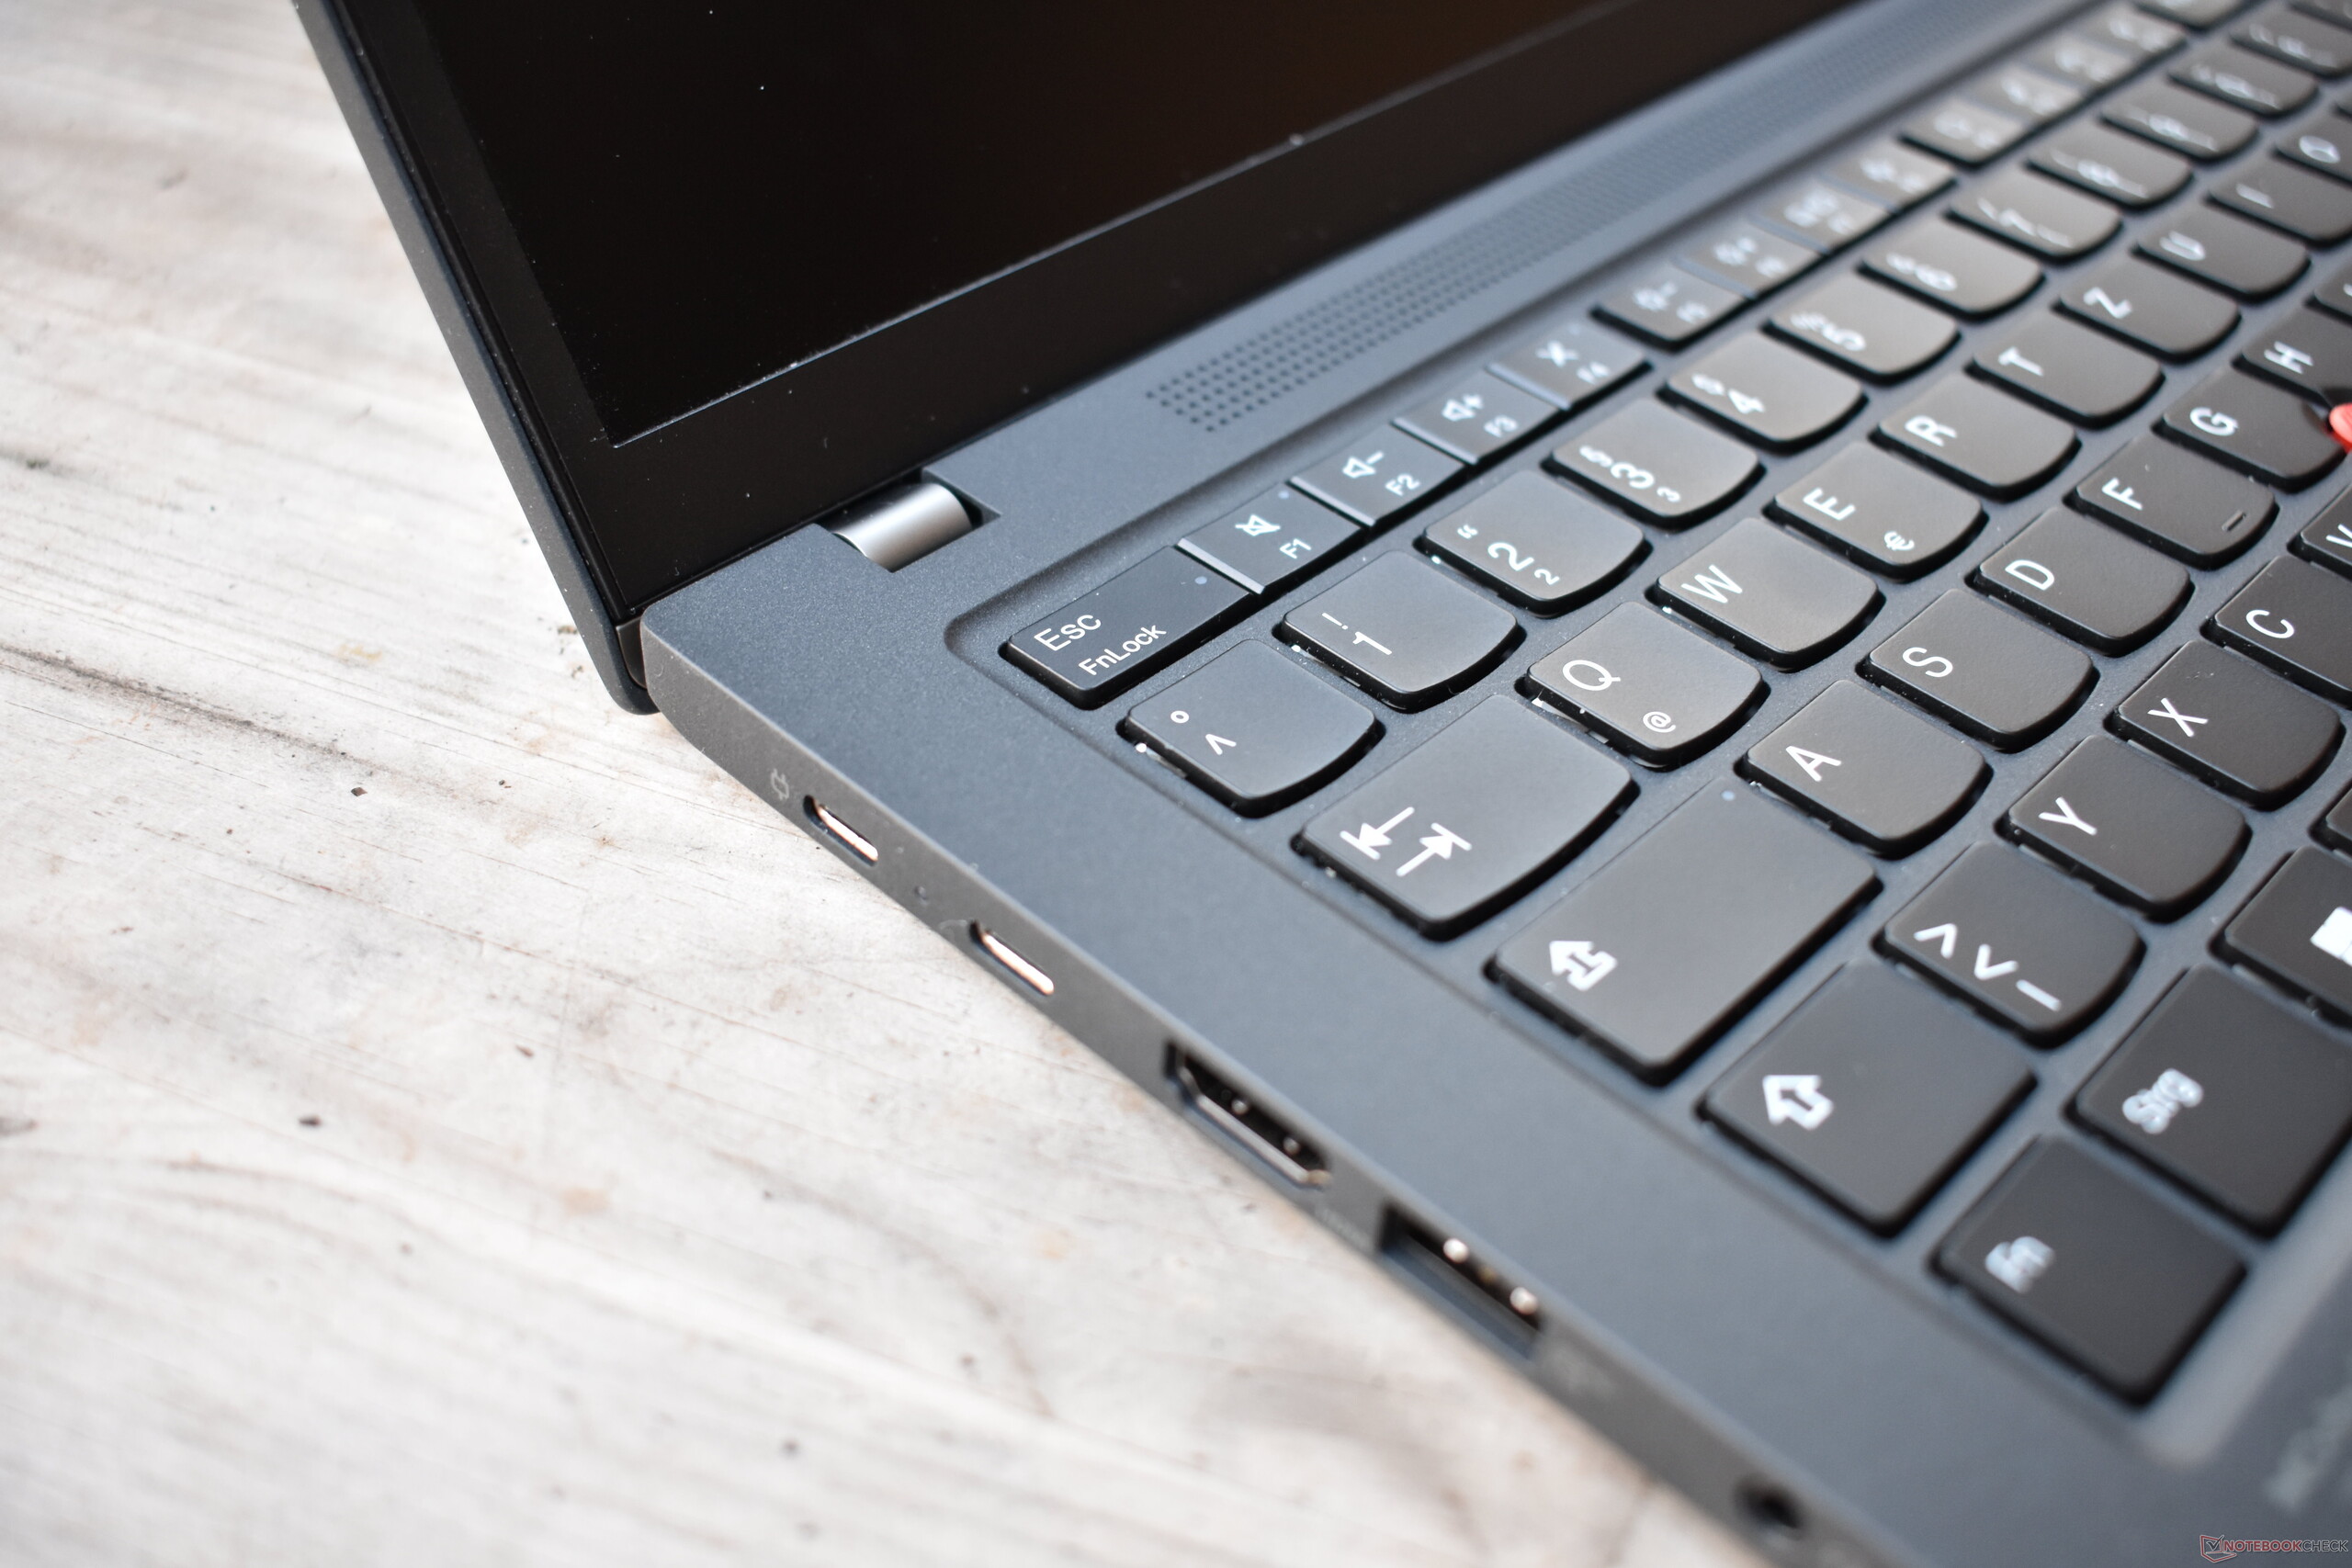
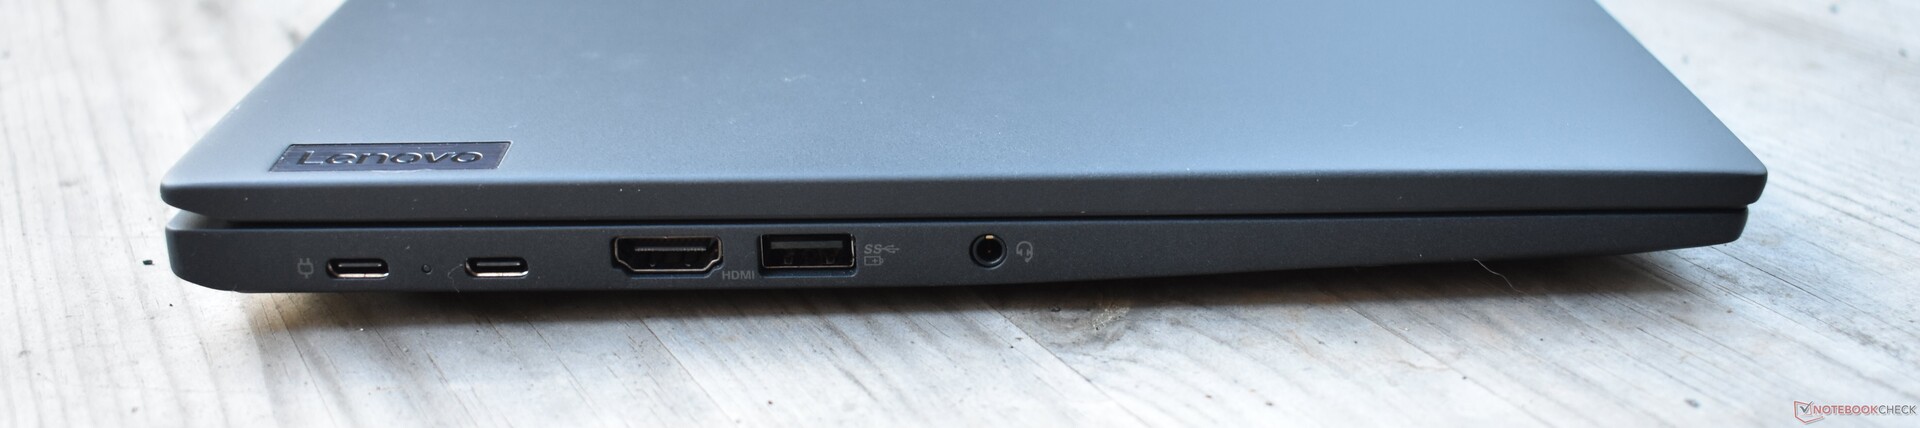
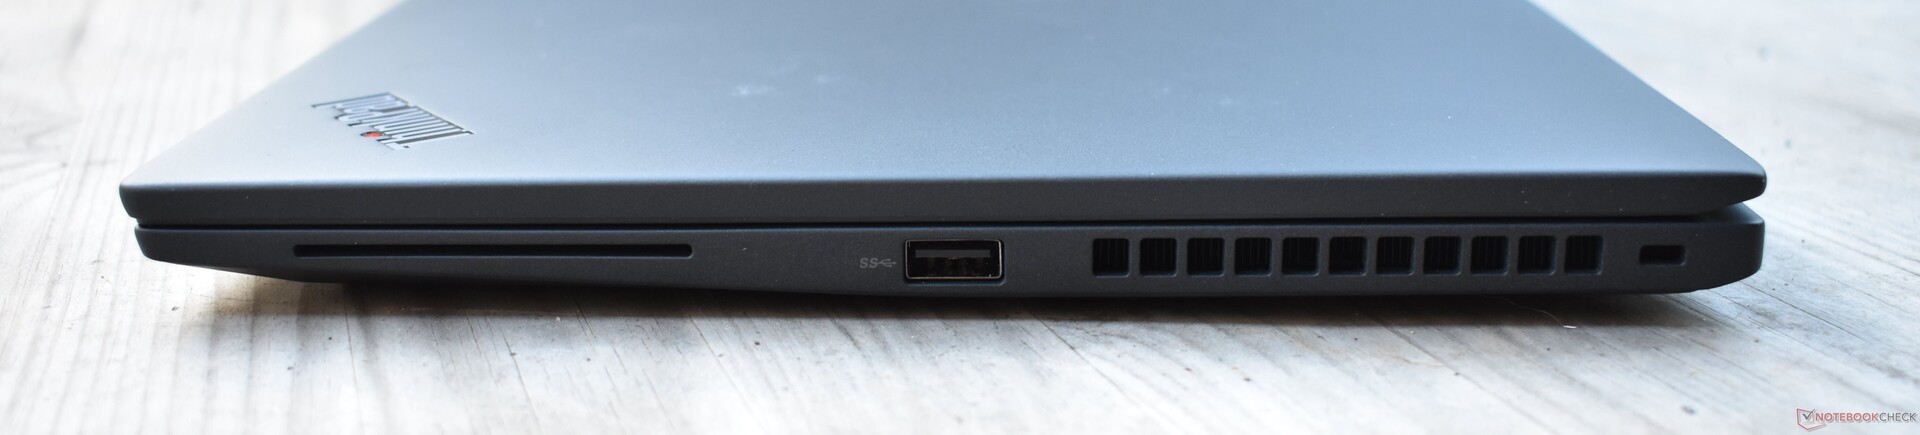
Les connexions sont presque identiques à celles duLenovo ThinkPad T14s G3 Intel. La seule différence est qu'au lieu de deux ports Thunderbolt 4, le ThinkPad T14s G3 AMD offre une connexion USB 4 et un port USB-C qui prend en charge un maximum d'USB 3.2 Gen 2. Les deux connexions peuvent être utilisées pour la charge via USB-C power delivery, et les deux disposent également du mode alternatif DisplayPort. Pour tester cela, nous avons connecté un eGPU Thunderbolt 3 et un écran Thunderbolt au ThinkPad, et les deux ont fonctionné sans aucun problème en utilisant le port USB 4.
Communication
L'équipement de communication est identique, à l'exception de la puce WiFi : Alors que leT14s G3 Intelpossède un module WiFi d'Intel, le T14s G3 AMD utilise une puce WiFi de Qualcomm. Les spécifications de performance sont presque identiques, et les deux solutions obtiennent des résultats similaires dans les benchmarks.
Webcam
La webcam 1080p est identique à celle du ThinkPad T14s G3 Intel.


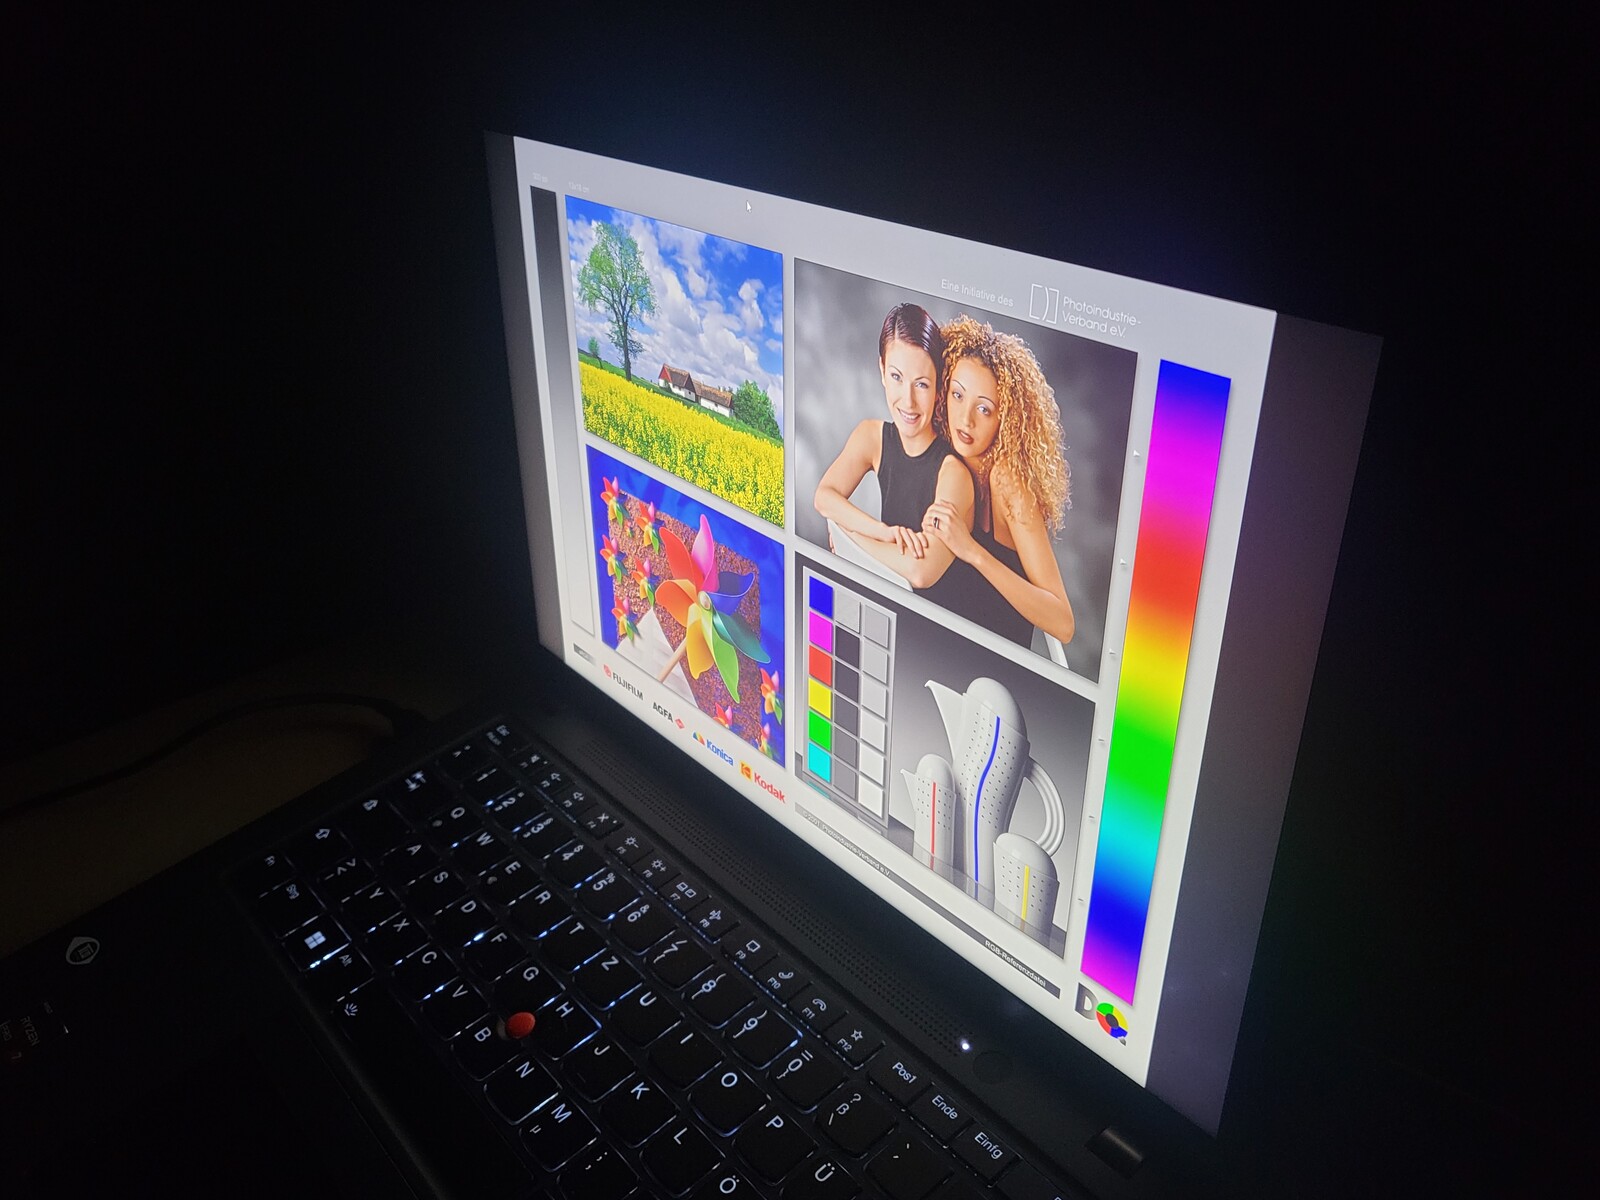
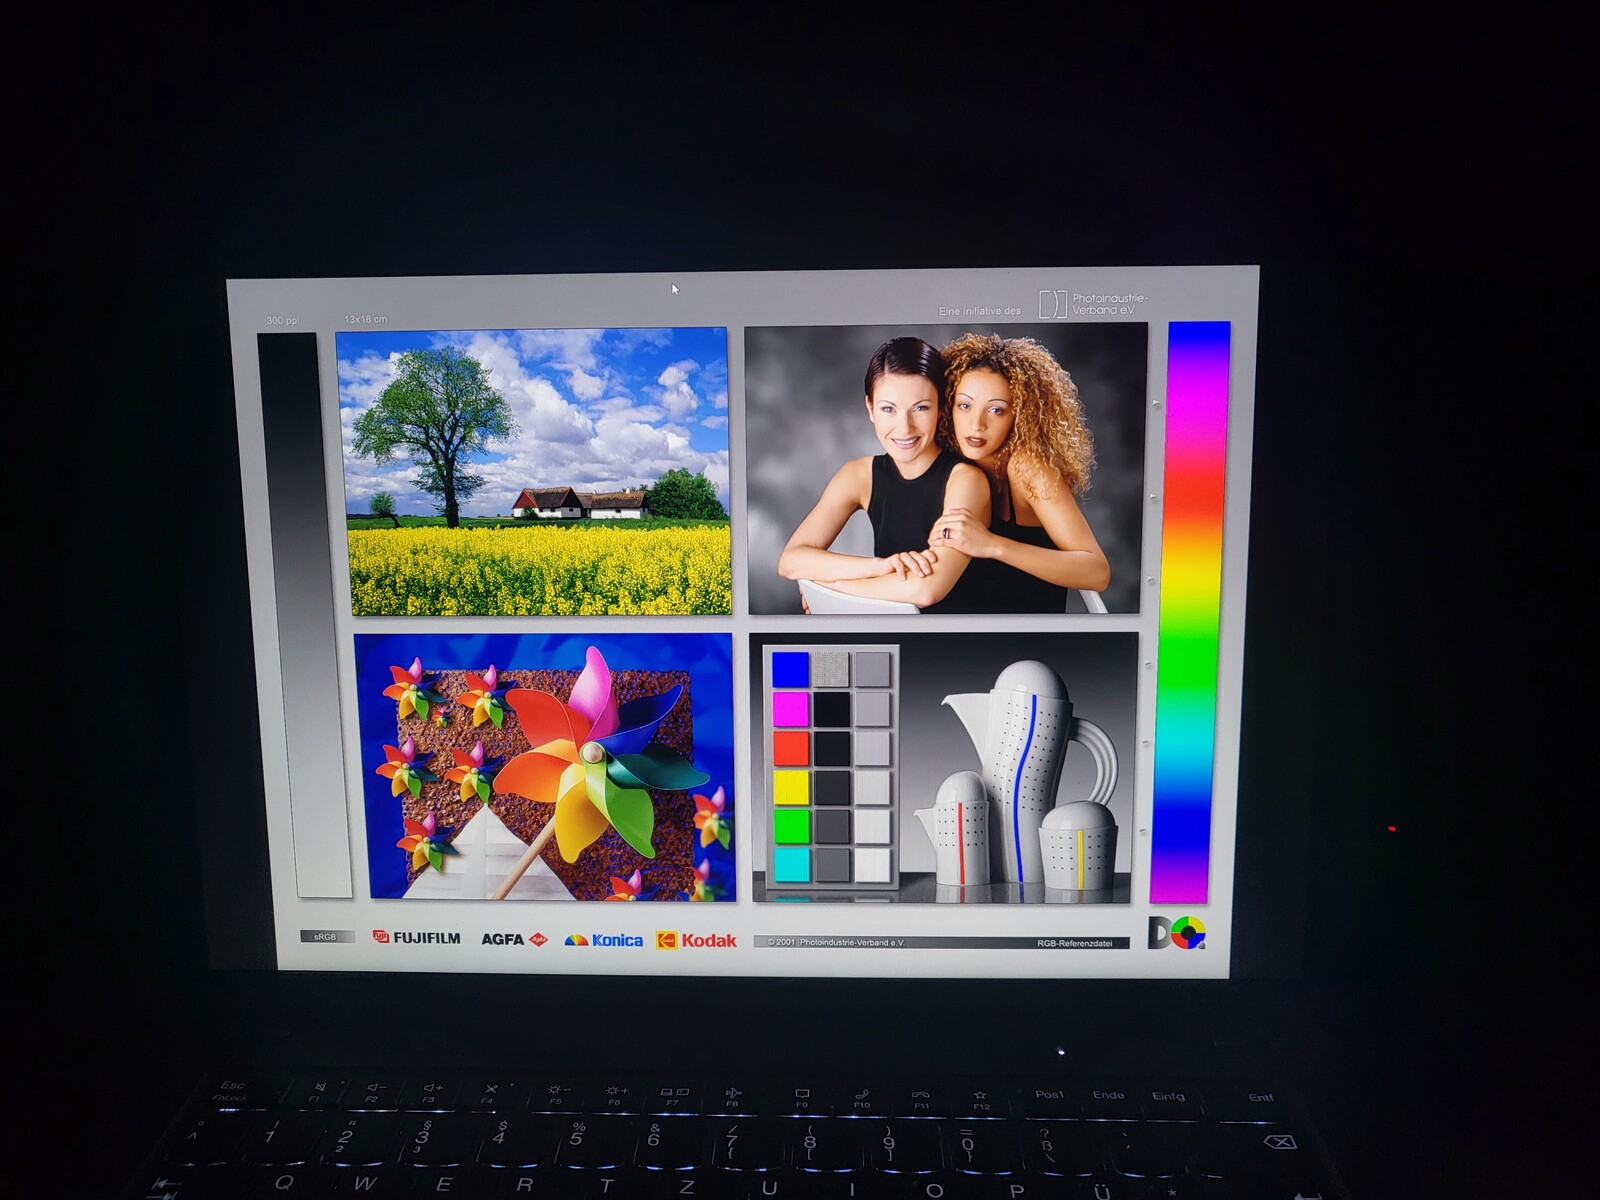
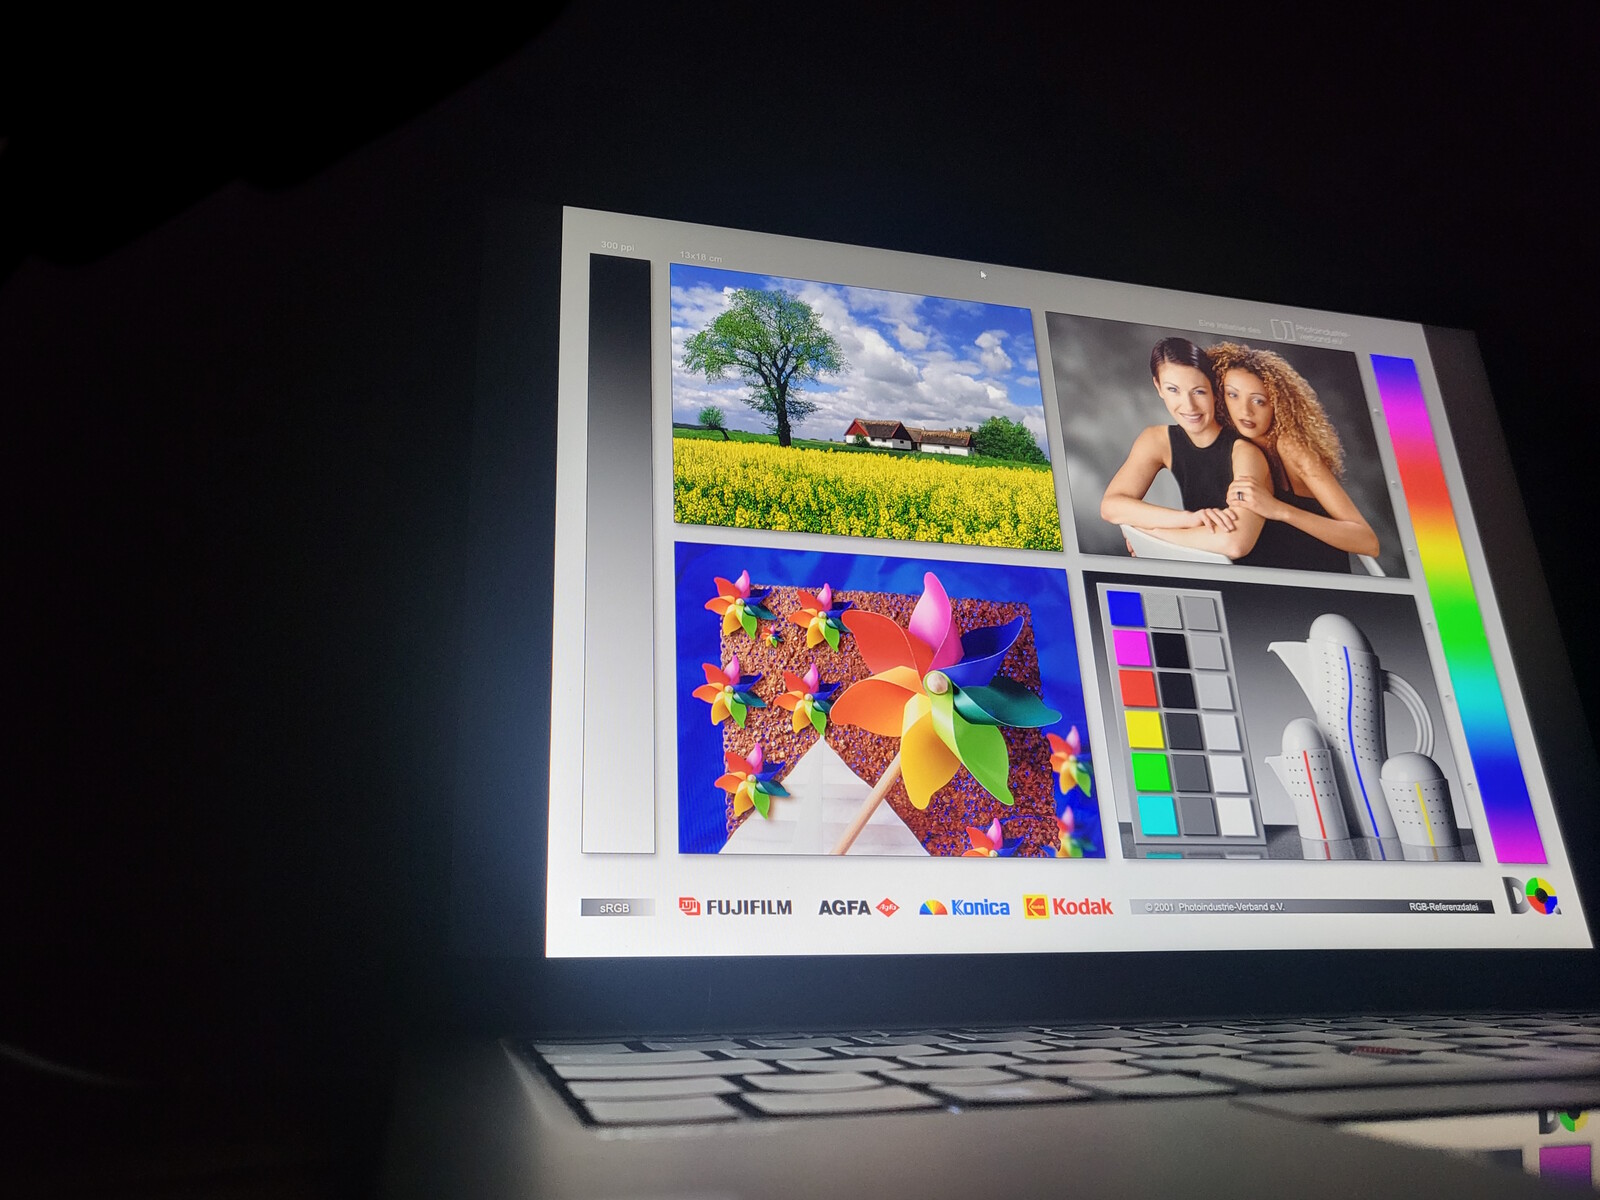
Écran à faible consommation d'énergie avec une surface mate
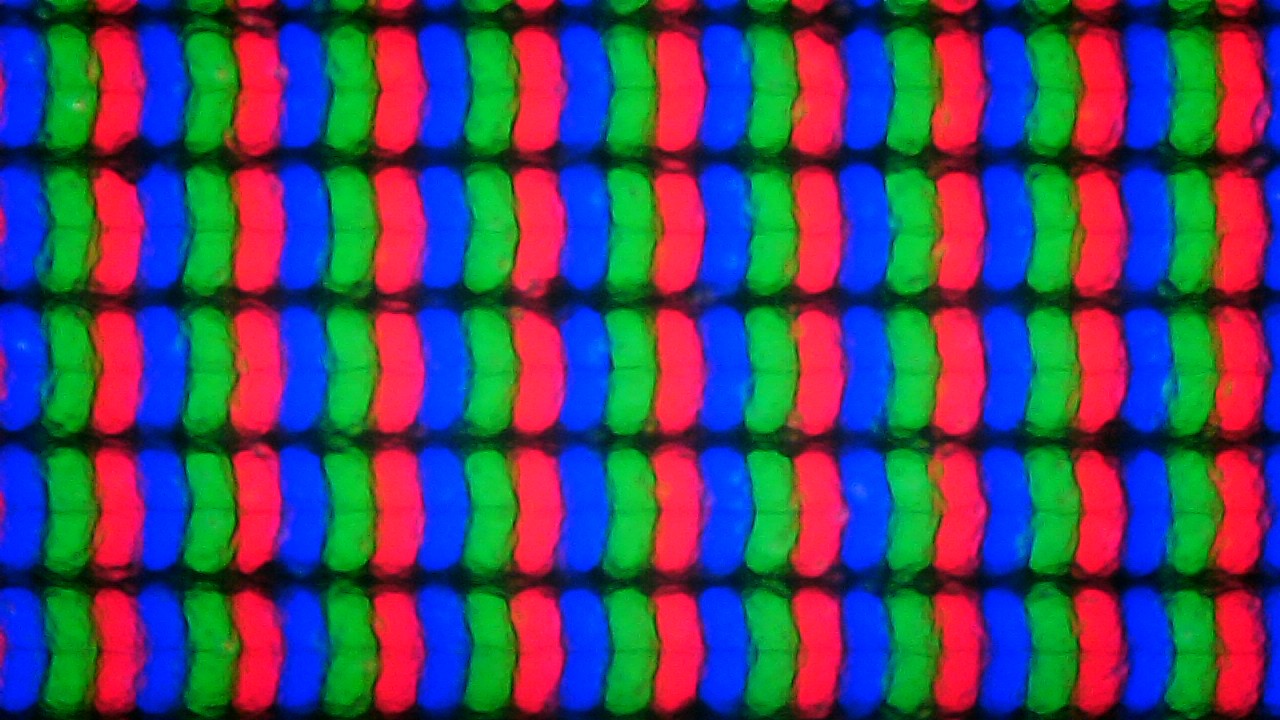
En termes d'affichage, il y a également de nombreuses similitudes avec leLenovo ThinkPad T14s G3 Intel. Les options d'affichage disponibles ainsi que le modèle d'écran utilisé dans notre unité de test sont identiques. Même les numéros de modèle de l'écran de 14 pouces, 16:10, sont les mêmes : MNE007JA1-1. Il s'agit d'un écran à faible consommation d'énergie sur base IPS avec une résolution WUXGA (1.920 x 1.200).
Lenovo spécifie une valeur de luminosité de 400 cd/m², mais l'écran de notre unité de test Intel est resté bien en deçà. Heureusement, notre unité de test ThinkPad T14s G3 AMD ne confirme pas ce résultat, et avec environ 379 cd/m² en moyenne, elle est beaucoup plus proche de la valeur cible que le T14s G3 Intel, qui n'offrait que 301 cd/m².
| |||||||||||||||||||||||||
Homogénéité de la luminosité: 92 %
Valeur mesurée au centre, sur batterie: 396 cd/m²
Contraste: 1523:1 (Valeurs des noirs: 0.26 cd/m²)
ΔE ColorChecker Calman: 1.3 | ∀{0.5-29.43 Ø4.72}
calibrated: 0.7
ΔE Greyscale Calman: 1.6 | ∀{0.09-98 Ø4.97}
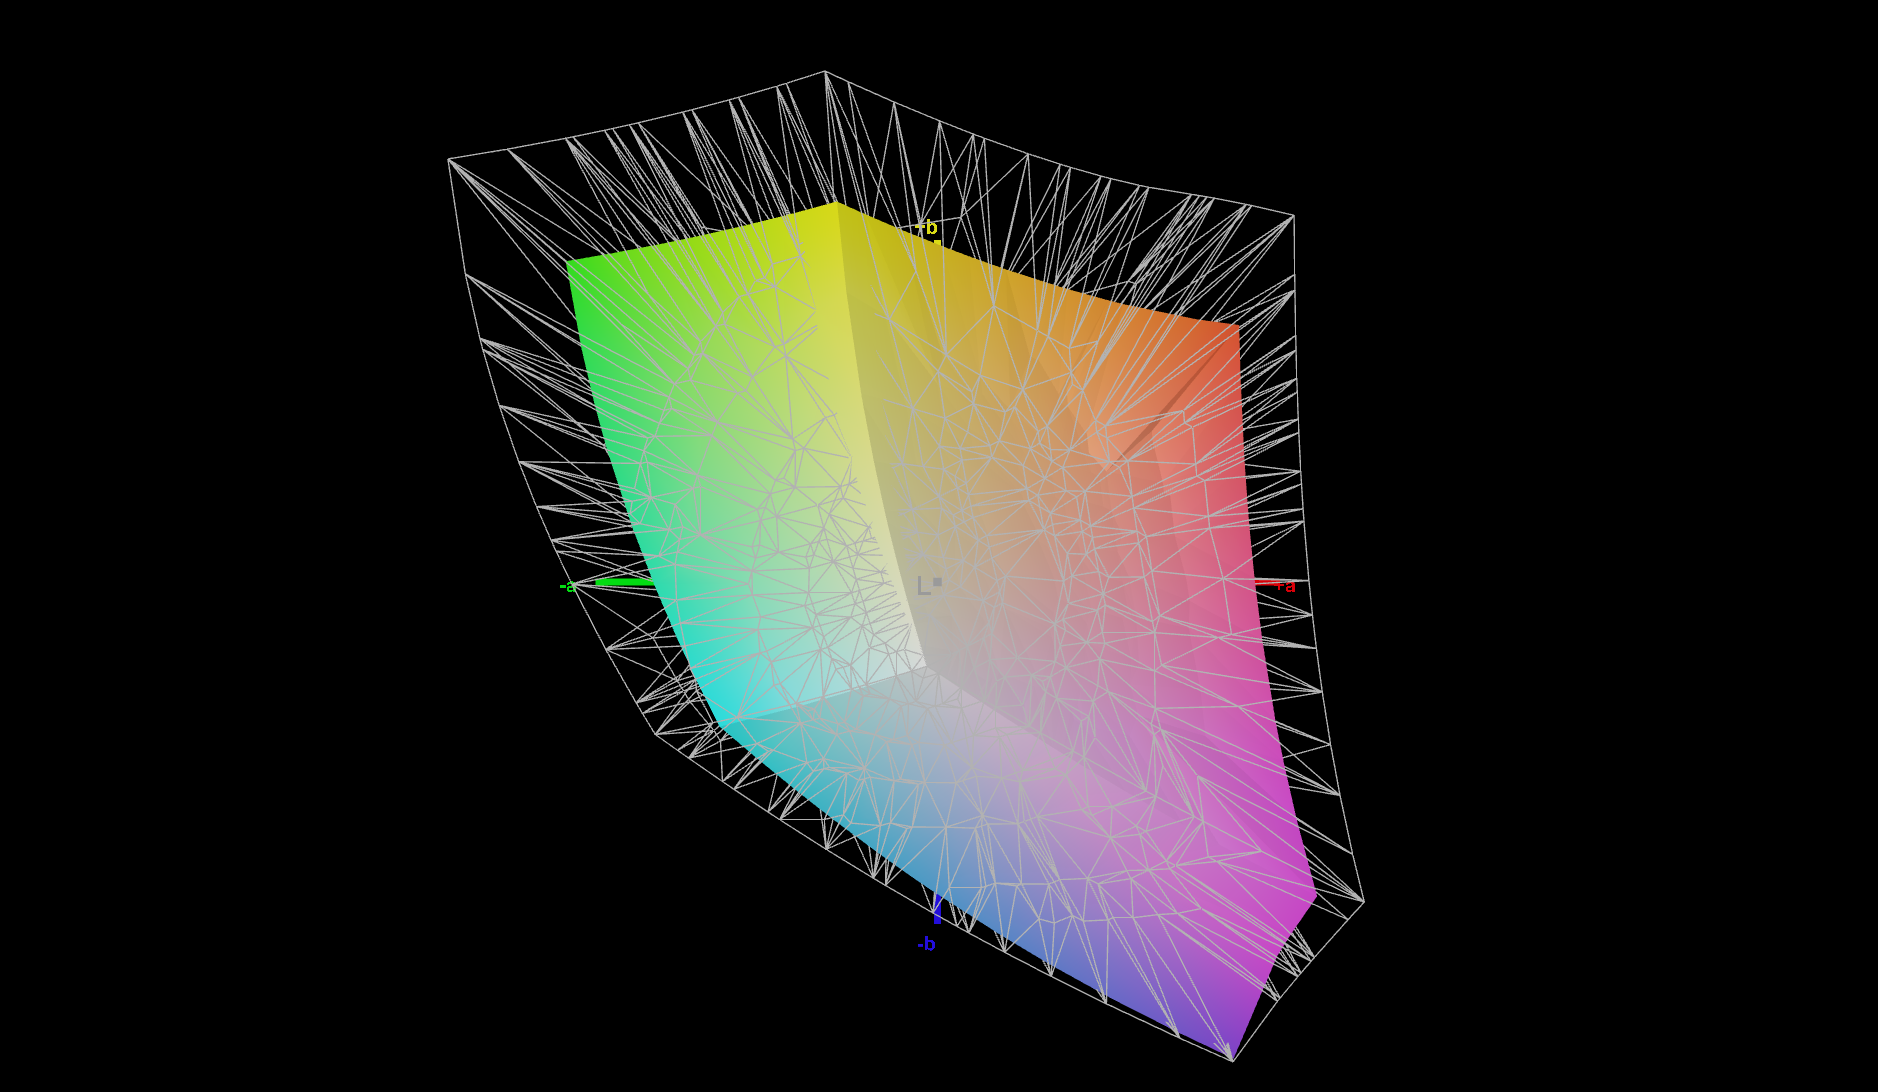
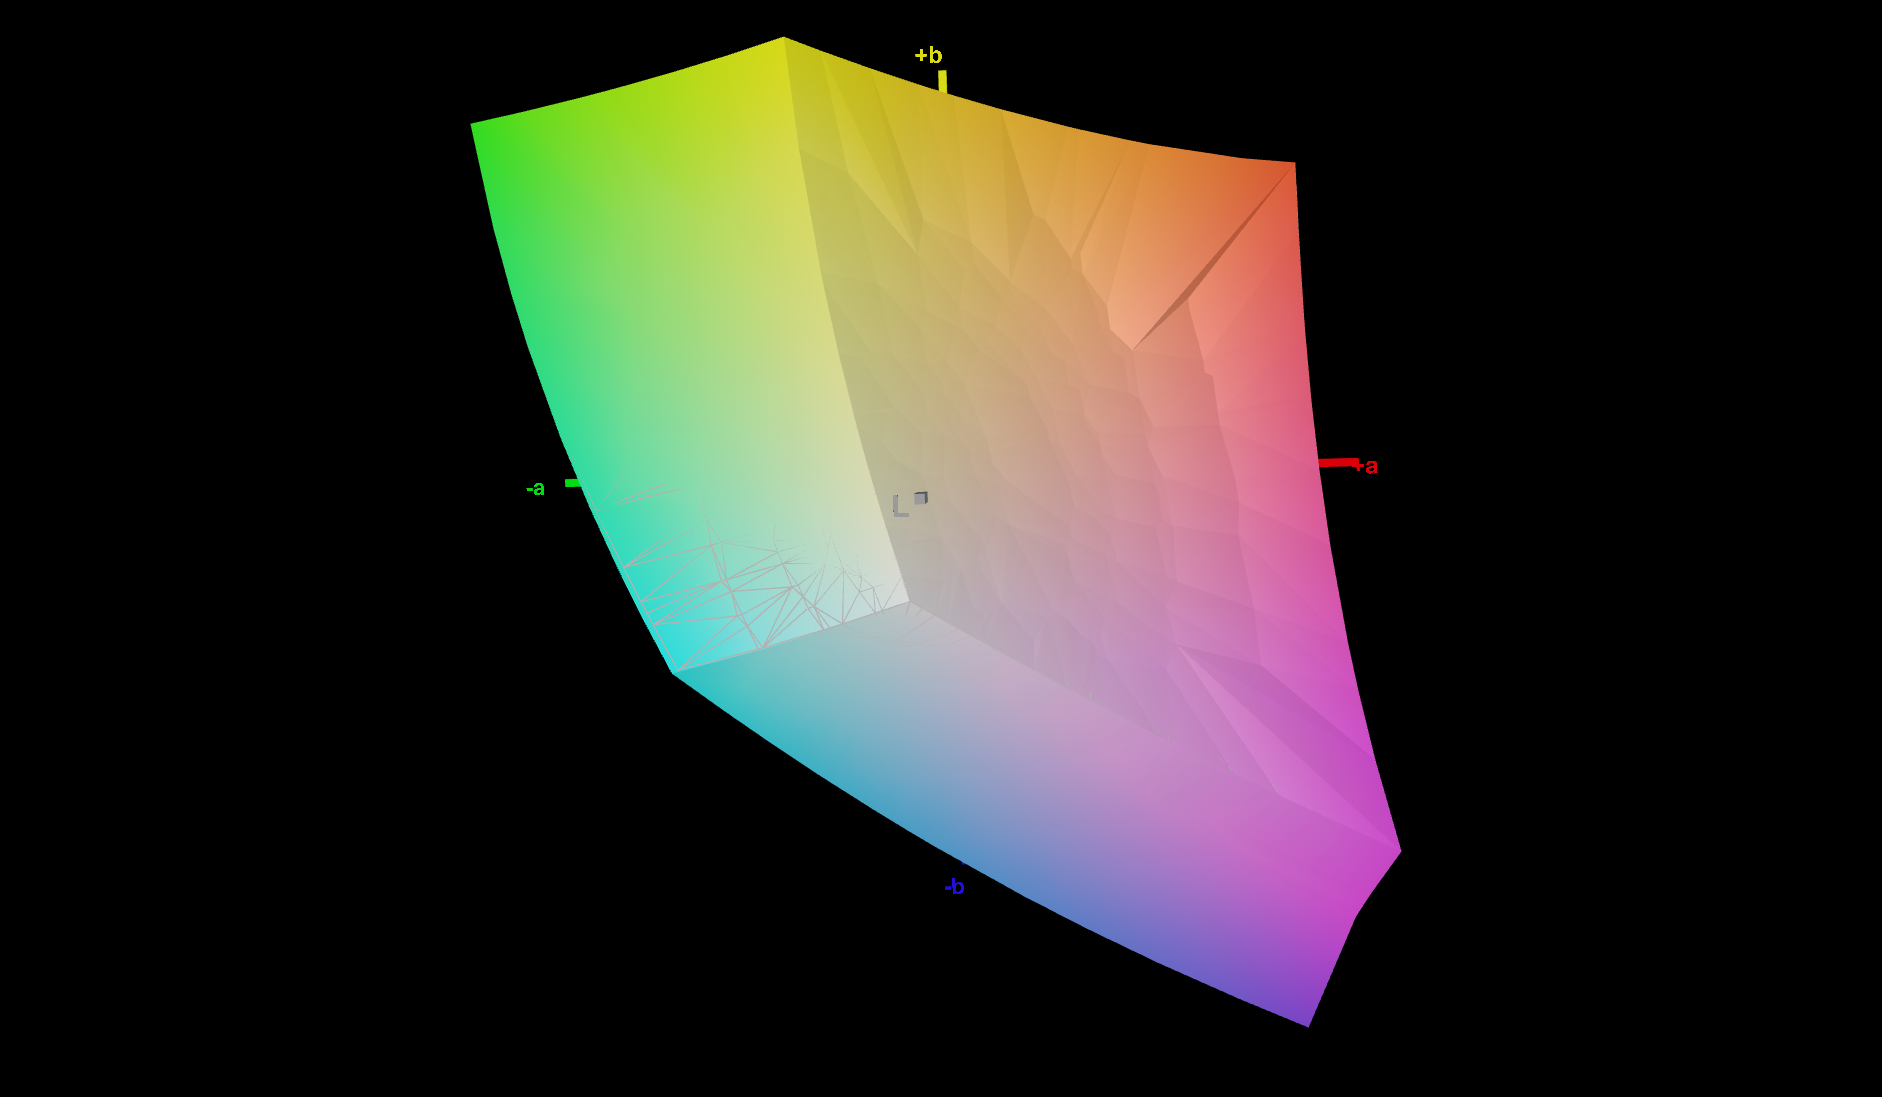
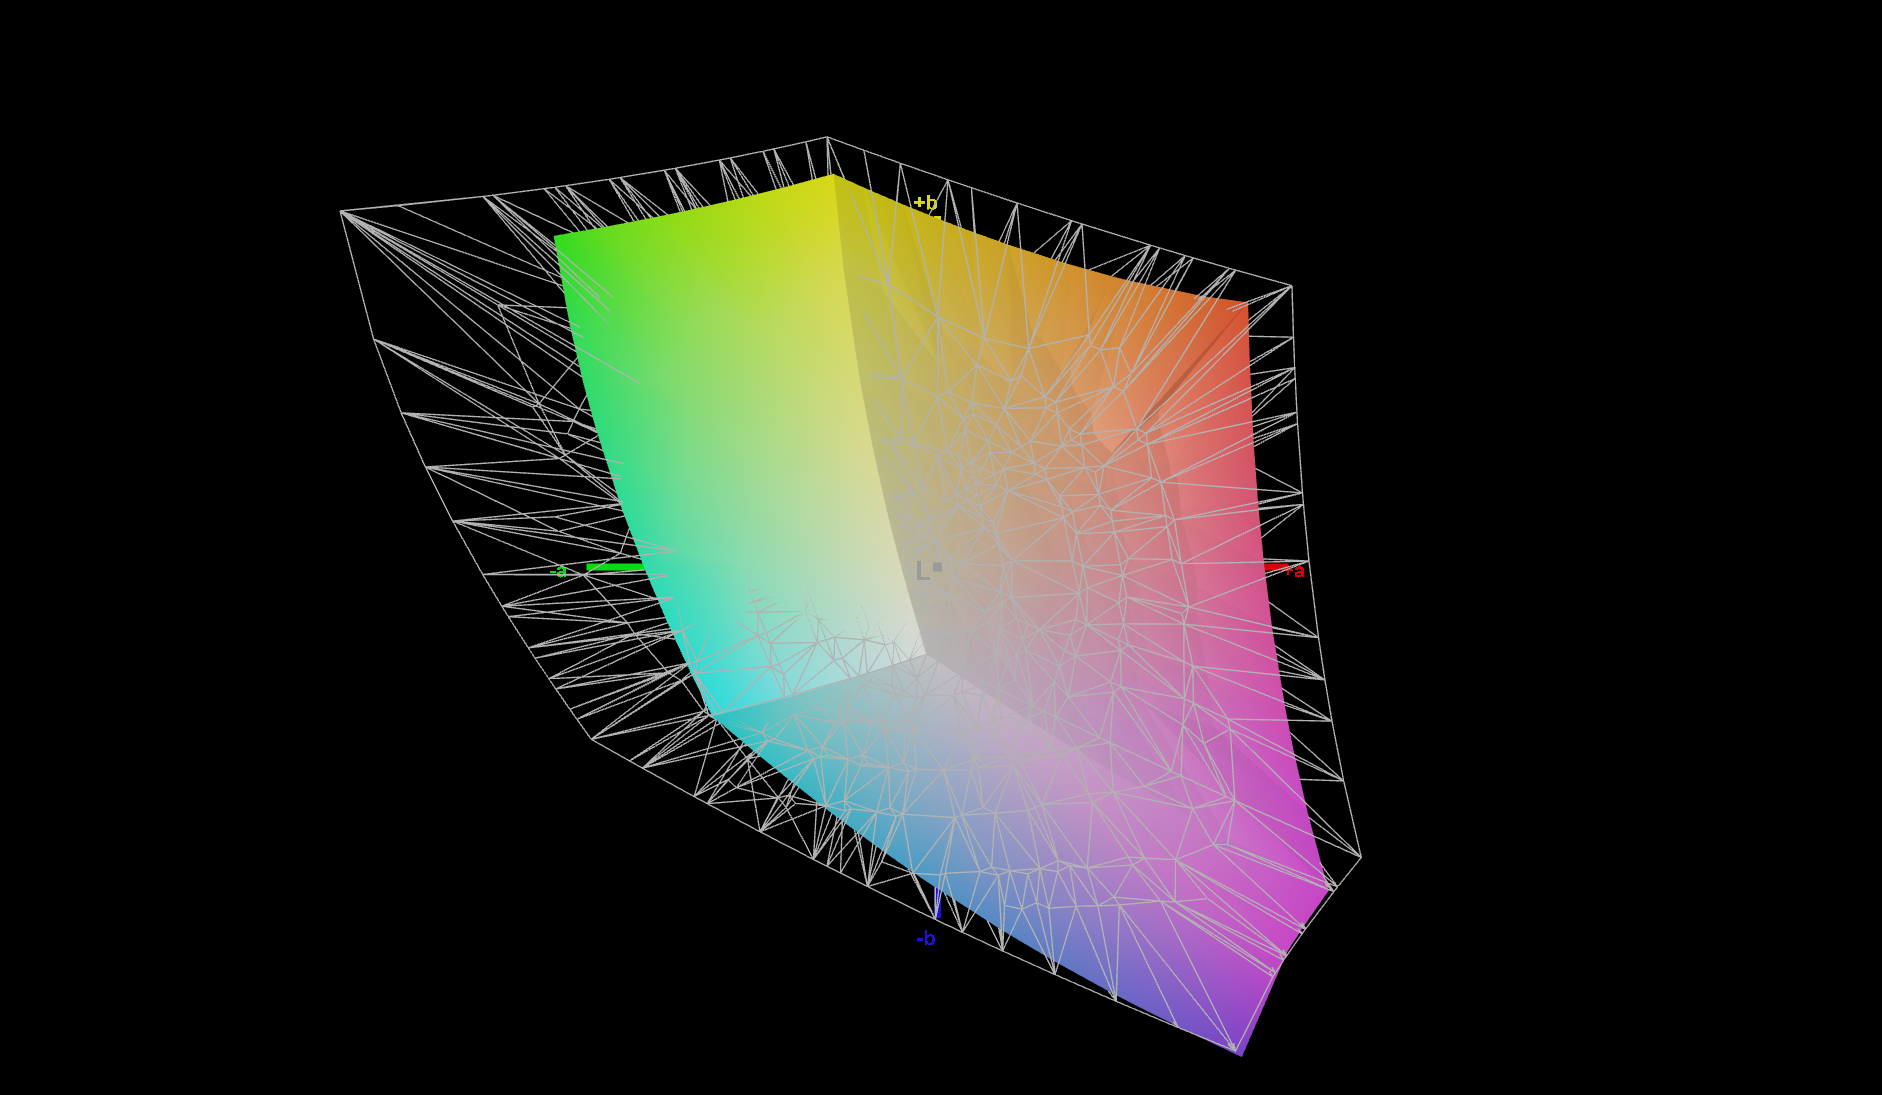
71.4% AdobeRGB 1998 (Argyll 3D)
99.8% sRGB (Argyll 3D)
69.4% Display P3 (Argyll 3D)
Gamma: 2.14
CCT: 6554 K
| Lenovo ThinkPad T14s G3 21CQ002LGE MNE007JA1-1, LTPS IPS LED, 1920x1200, 14" | Lenovo ThinkPad T14s G3 21BR00CDGE MNE007JA1-1, IPS LED, 1920x1200, 14" | Lenovo ThinkPad T14s G2 20XGS01100 NE140FHM-N61, IPS LED, 1920x1080, 14" | Dell Latitude 9430 2-in-1 AU Optronics B140QAN, IPS, 2560x1600, 14" | HP EliteBook 845 G9 6F6H9EA AUOA49A, IPS, 1920x1200, 14" | |
|---|---|---|---|---|---|
| Display | -2% | -5% | 8% | 5% | |
| Display P3 Coverage (%) | 69.4 | 67.8 -2% | 69.7 0% | 79.4 14% | 75.4 9% |
| sRGB Coverage (%) | 99.8 | 98.6 -1% | 91.8 -8% | 100 0% | 100 0% |
| AdobeRGB 1998 Coverage (%) | 71.4 | 70.1 -2% | 67.2 -6% | 79.4 11% | 76.6 7% |
| Response Times | -16% | -137% | -60% | -39% | |
| Response Time Grey 50% / Grey 80% * (ms) | 36.3 ? | 41.4 ? -14% | 84 ? -131% | 63.6 ? -75% | 58.8 ? -62% |
| Response Time Black / White * (ms) | 23.1 ? | 27.2 ? -18% | 56 ? -142% | 33.6 ? -45% | 26.7 ? -16% |
| PWM Frequency (Hz) | 2451 ? | ||||
| Screen | -34% | -147% | -41% | -28% | |
| Brightness middle (cd/m²) | 396 | 312 -21% | 397 0% | 517.7 31% | 408 3% |
| Brightness (cd/m²) | 379 | 301 -21% | 386 2% | 493 30% | 402 6% |
| Brightness Distribution (%) | 92 | 93 1% | 88 -4% | 90 -2% | 92 0% |
| Black Level * (cd/m²) | 0.26 | 0.16 38% | 0.28 -8% | 0.33 -27% | 0.24 8% |
| Contrast (:1) | 1523 | 1950 28% | 1418 -7% | 1569 3% | 1700 12% |
| Colorchecker dE 2000 * | 1.3 | 2.2 -69% | 5.8 -346% | 3.38 -160% | 2.09 -61% |
| Colorchecker dE 2000 max. * | 2.7 | 5.6 -107% | 12.6 -367% | 6.25 -131% | 5.09 -89% |
| Colorchecker dE 2000 calibrated * | 0.7 | 1.3 -86% | 1.9 -171% | 0.41 41% | 1.56 -123% |
| Greyscale dE 2000 * | 1.6 | 2.7 -69% | 8.3 -419% | 4 -150% | 1.7 -6% |
| Gamma | 2.14 103% | 2.11 104% | 2.07 106% | 2.13 103% | 2.138 103% |
| CCT | 6554 99% | 6196 105% | 6867 95% | 6186 105% | 6628 98% |
| Moyenne finale (programmes/paramètres) | -17% /
-25% | -96% /
-115% | -31% /
-33% | -21% /
-22% |
* ... Moindre est la valeur, meilleures sont les performances
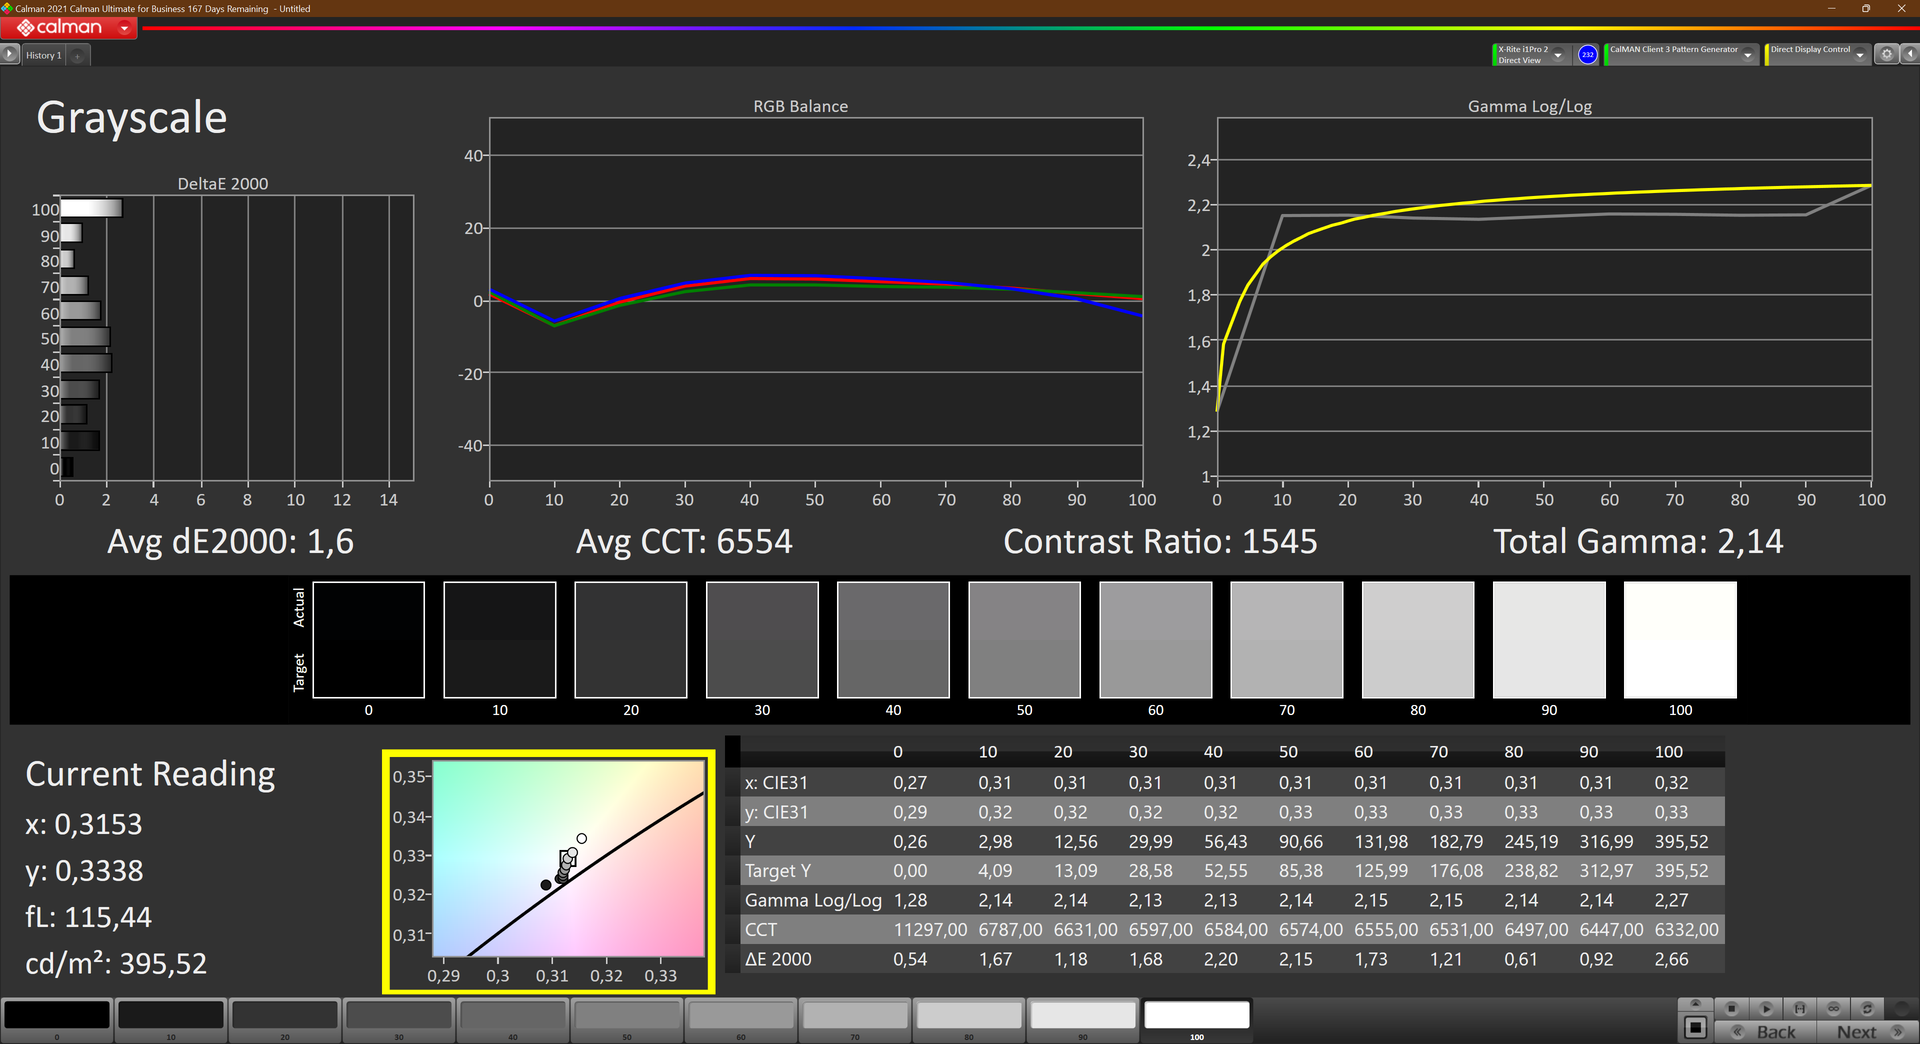
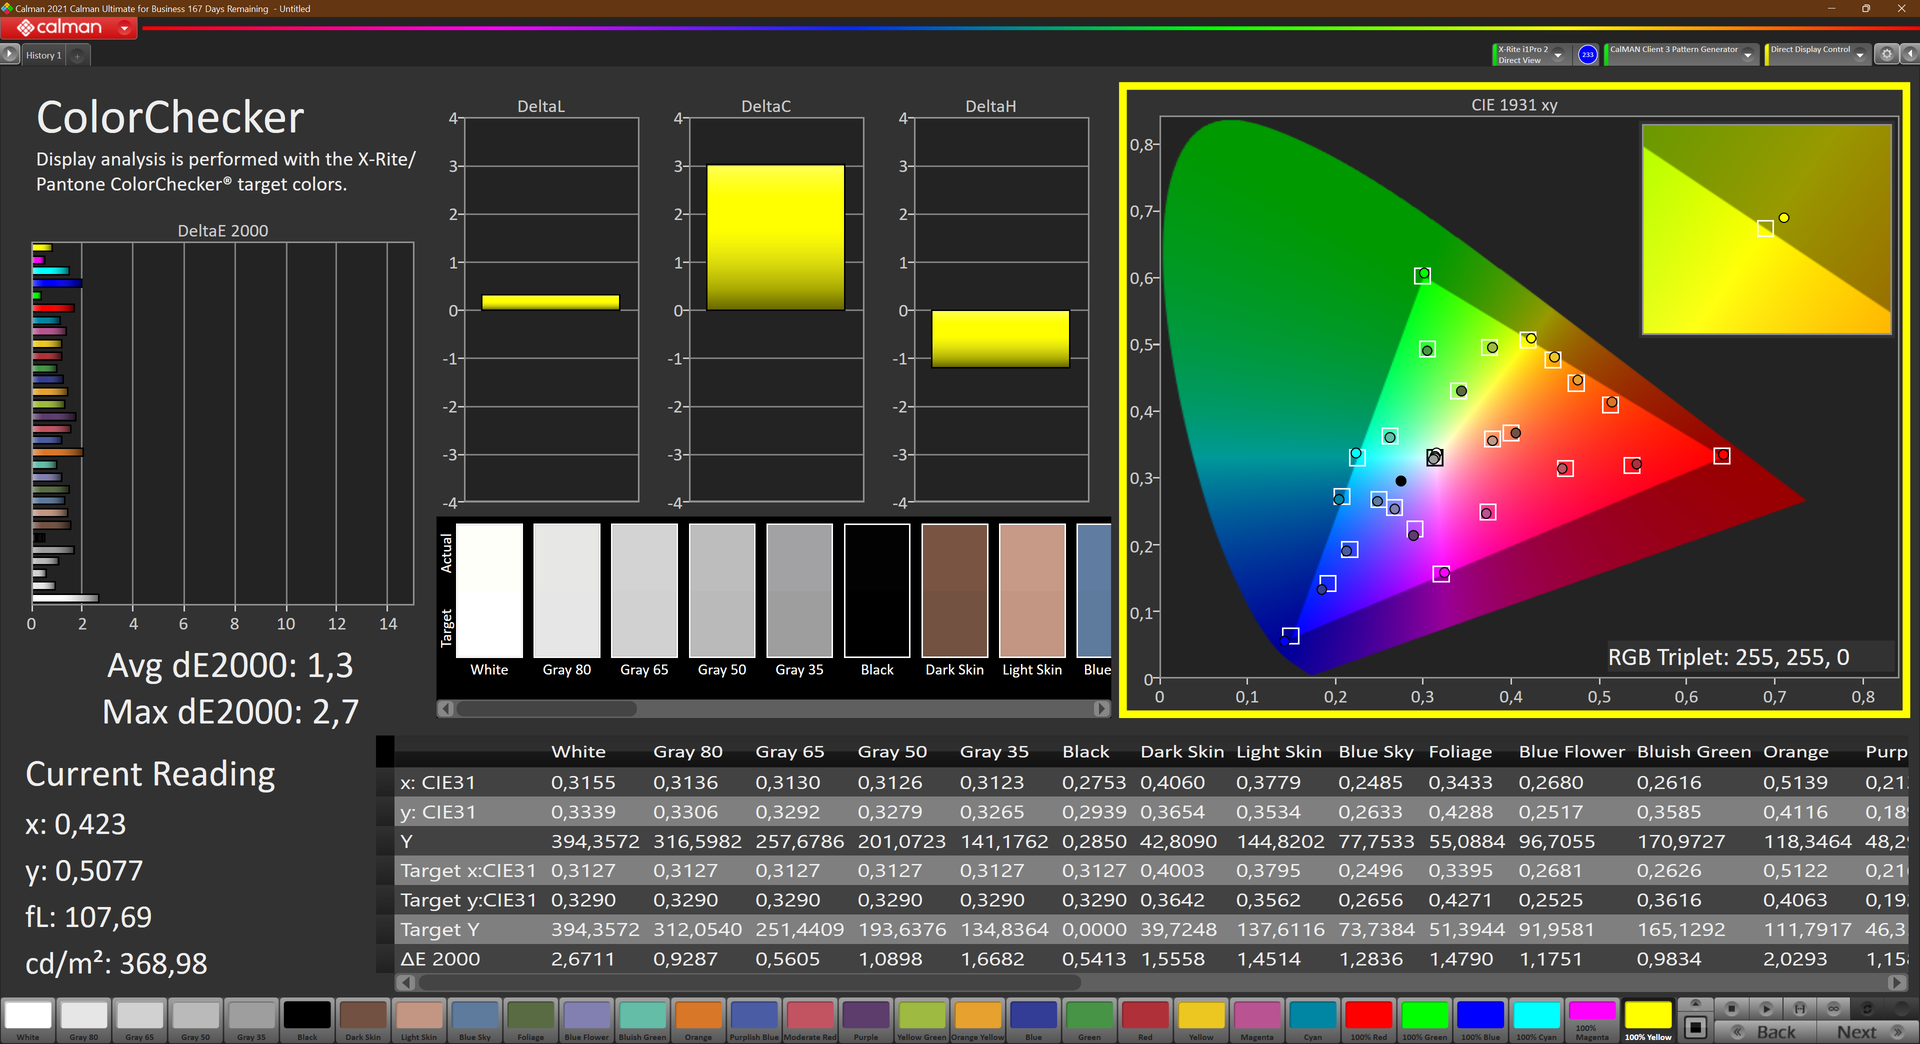
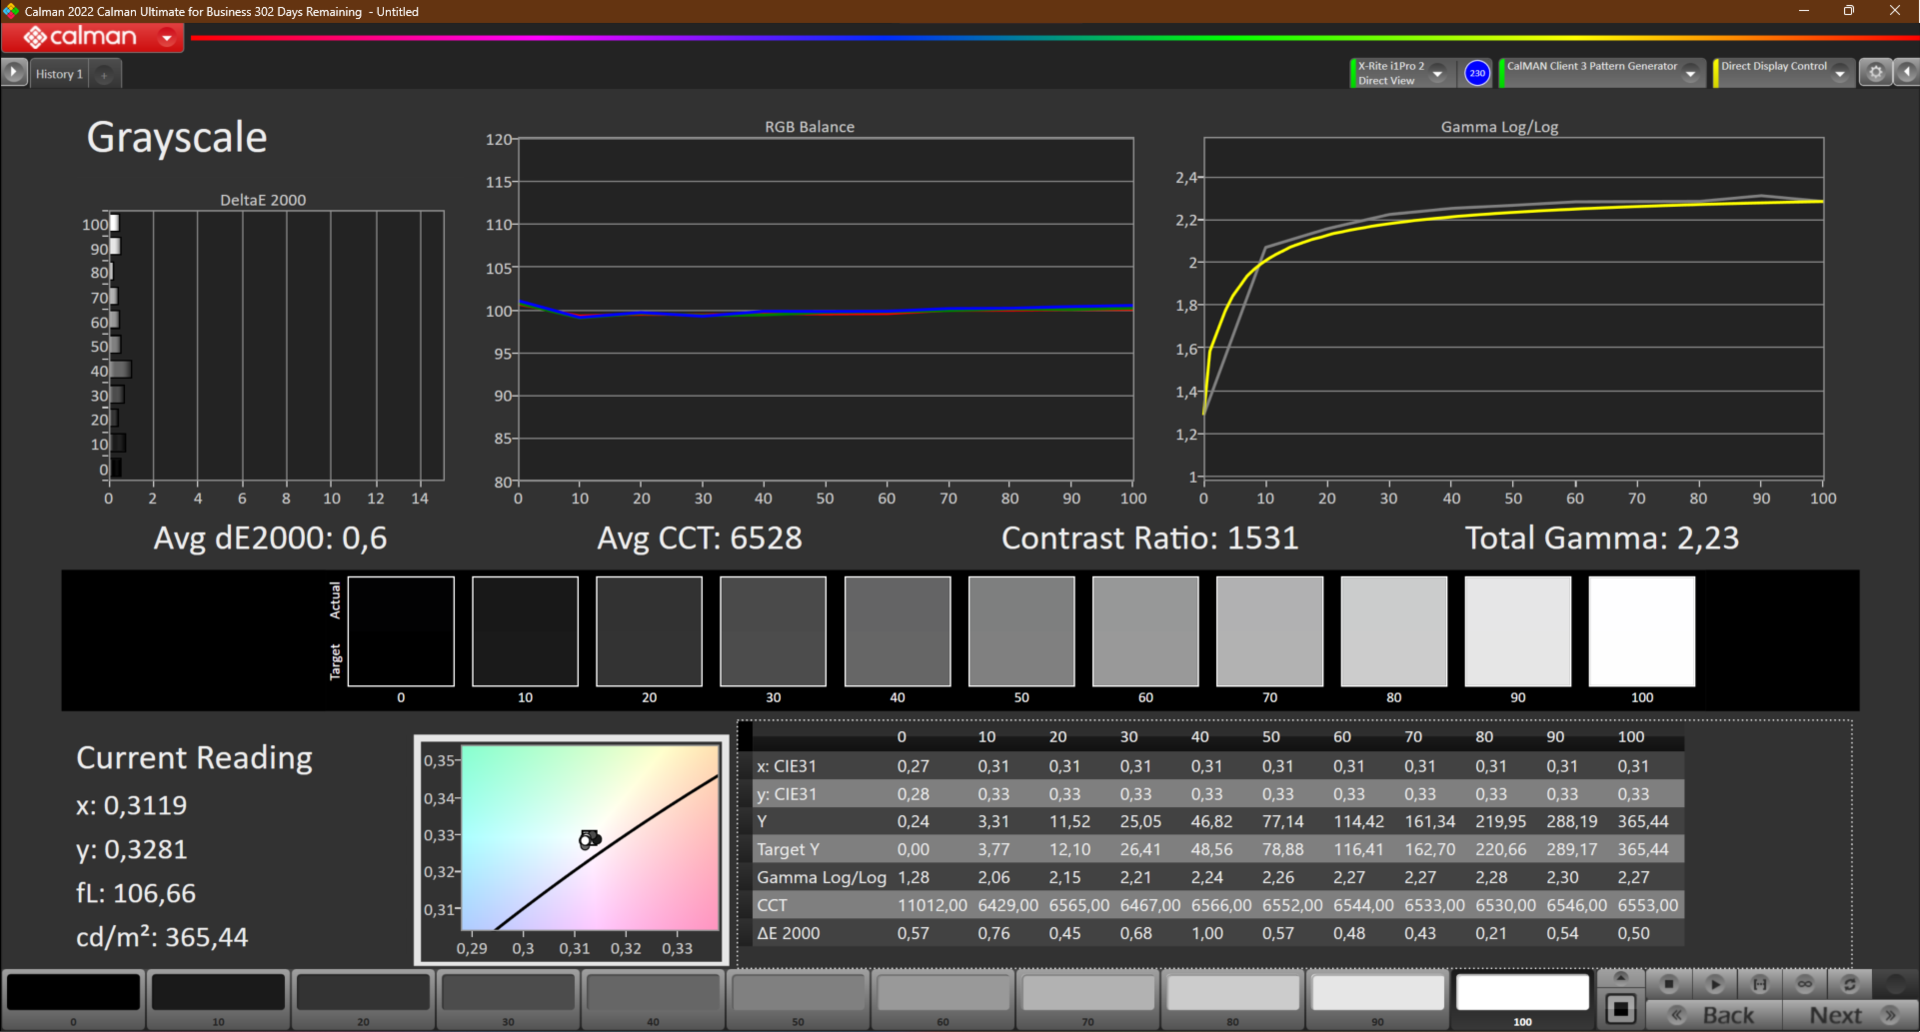
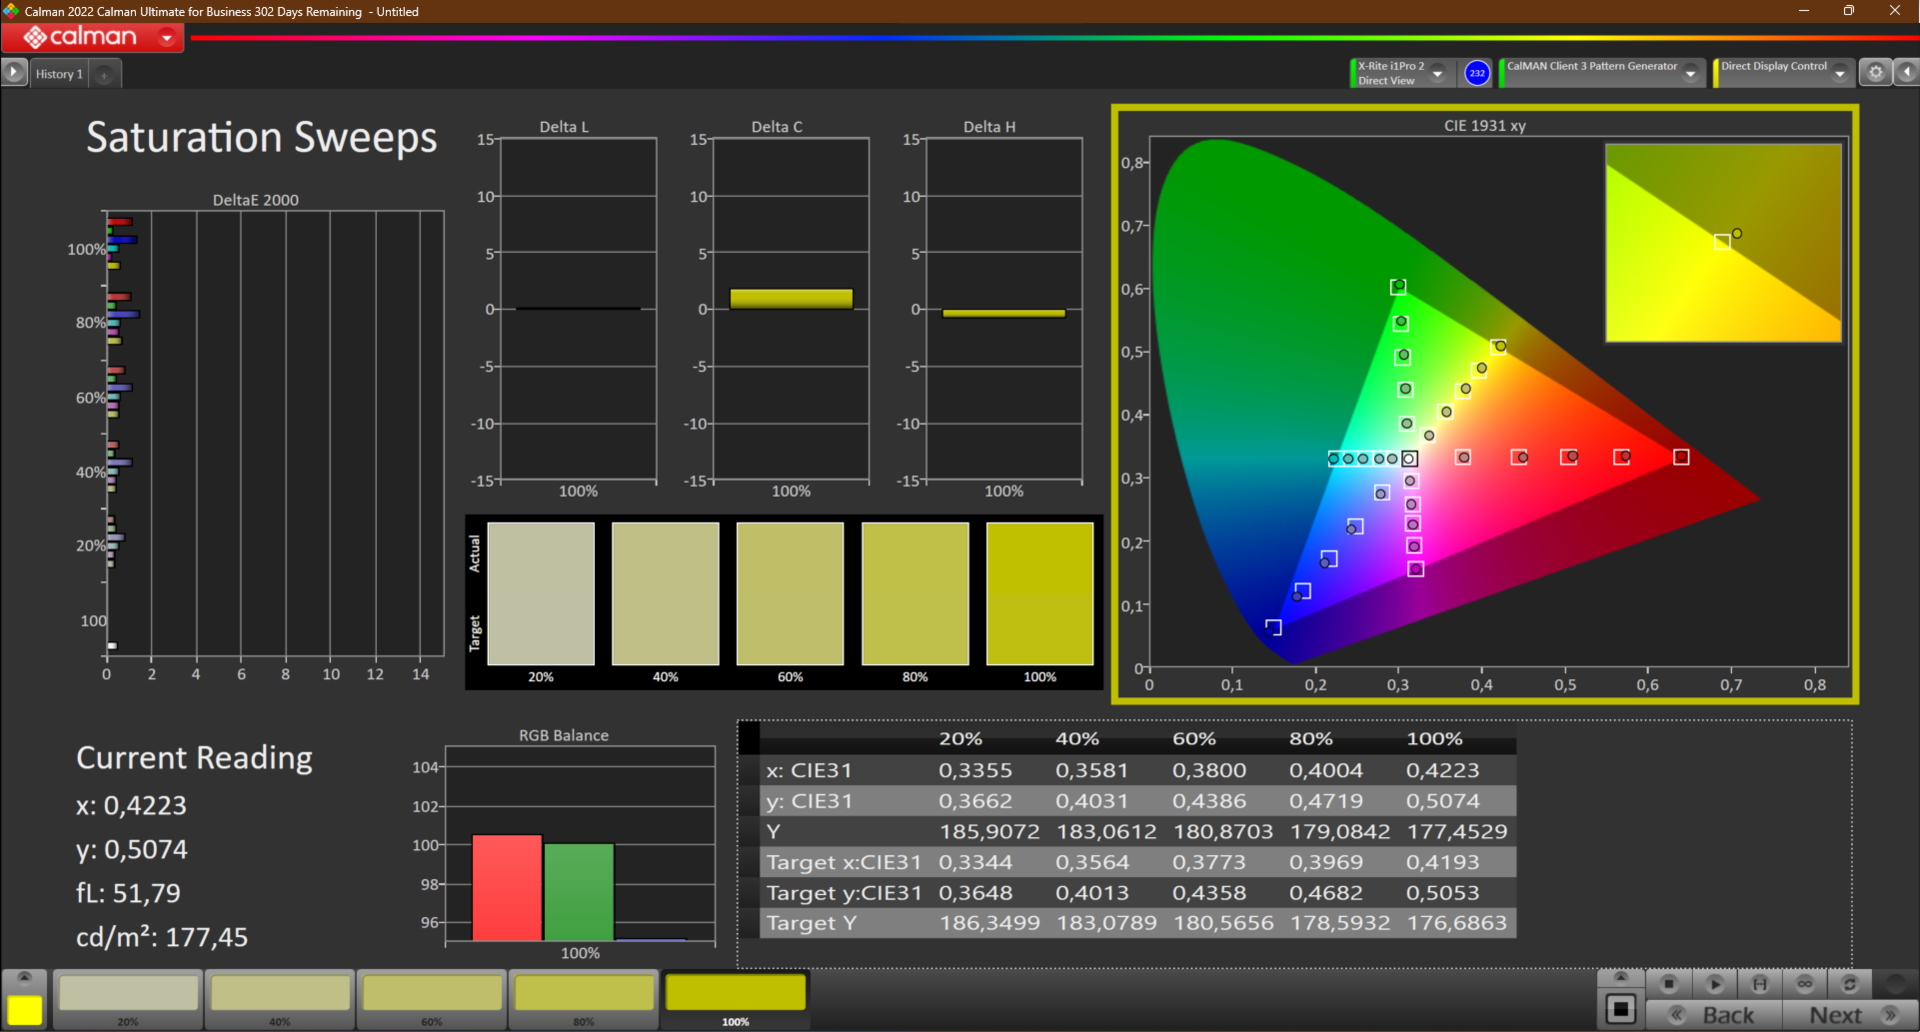
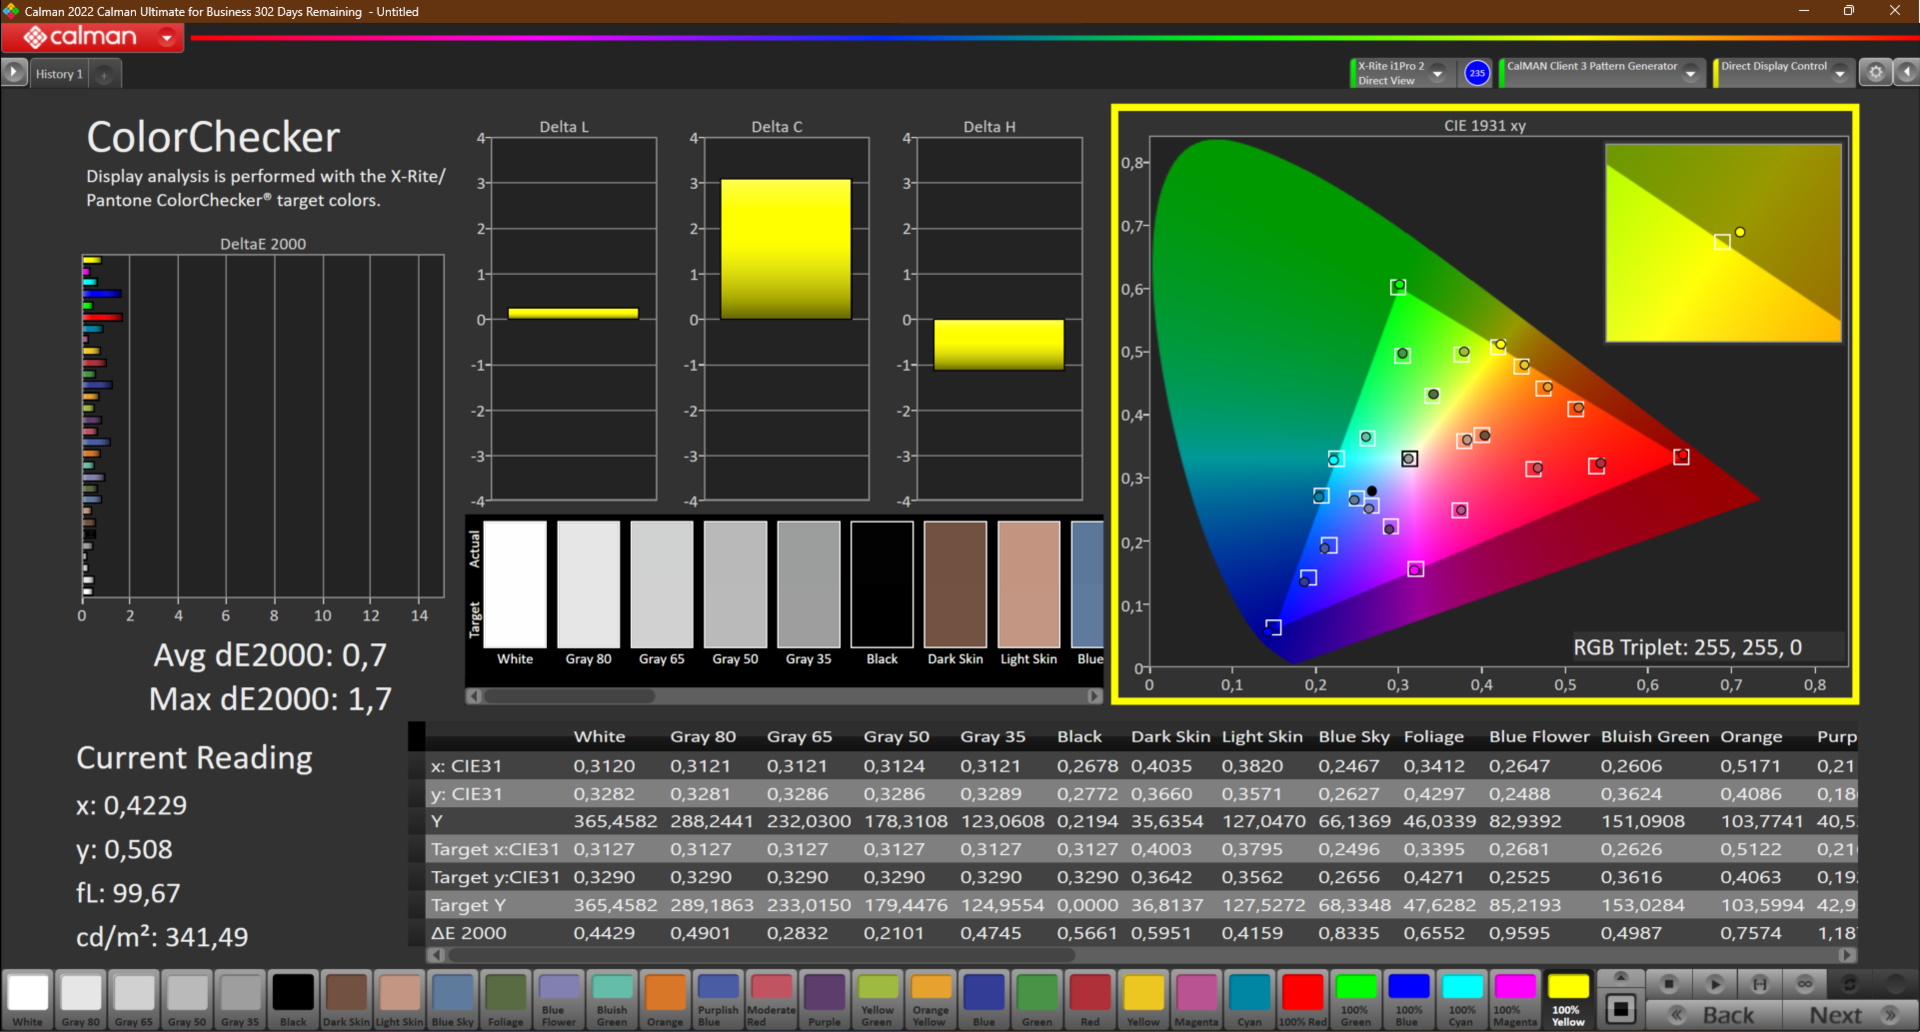
Les valeurs DeltaE sont déjà très basses dans l'état de livraison, et une moyenne de 1,3 dans le ColorChecker de Calman est très bonne. Grâce à un étalonnage avec le colorimètre X-Rite i1Pro 2, nous sommes même en mesure d'améliorer encore la valeur DeltaE du ColorChecker pour atteindre un excellent 0,7, ce qui correspond à un affichage des couleurs précis et sans aucune teinte. Comme toujours, vous pouvez télécharger gratuitement le profil que nous avons créé à partir du lien ci-dessus.
Lenovo annonce 100% sRGB pour le panneau à faible consommation, et nous mesurons 99,8%. Cela signifie que rien ne devrait vous empêcher de l'utiliser pour des tâches de traitement d'image à un niveau simple. Cependant, pour l'affichage des espaces colorimétriques plus larges AdobeRGB et DCI-P3, vous devrez utiliser un écran externe.
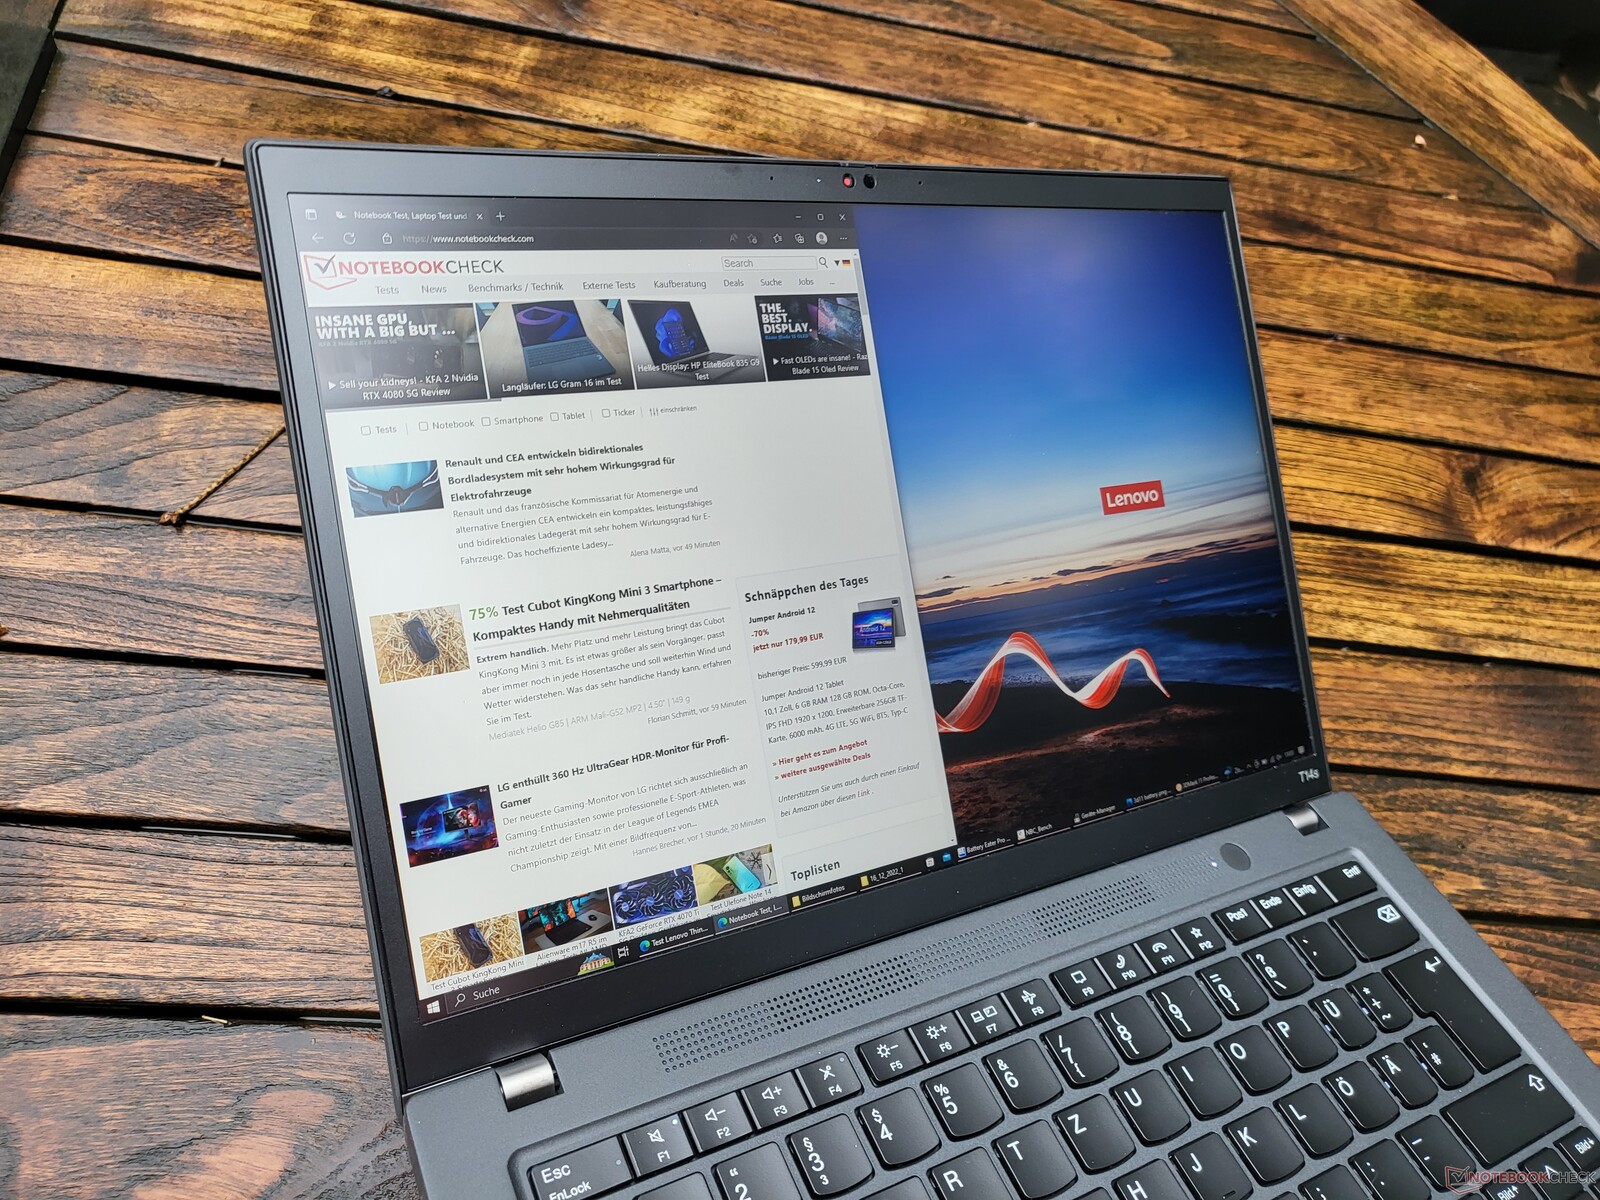
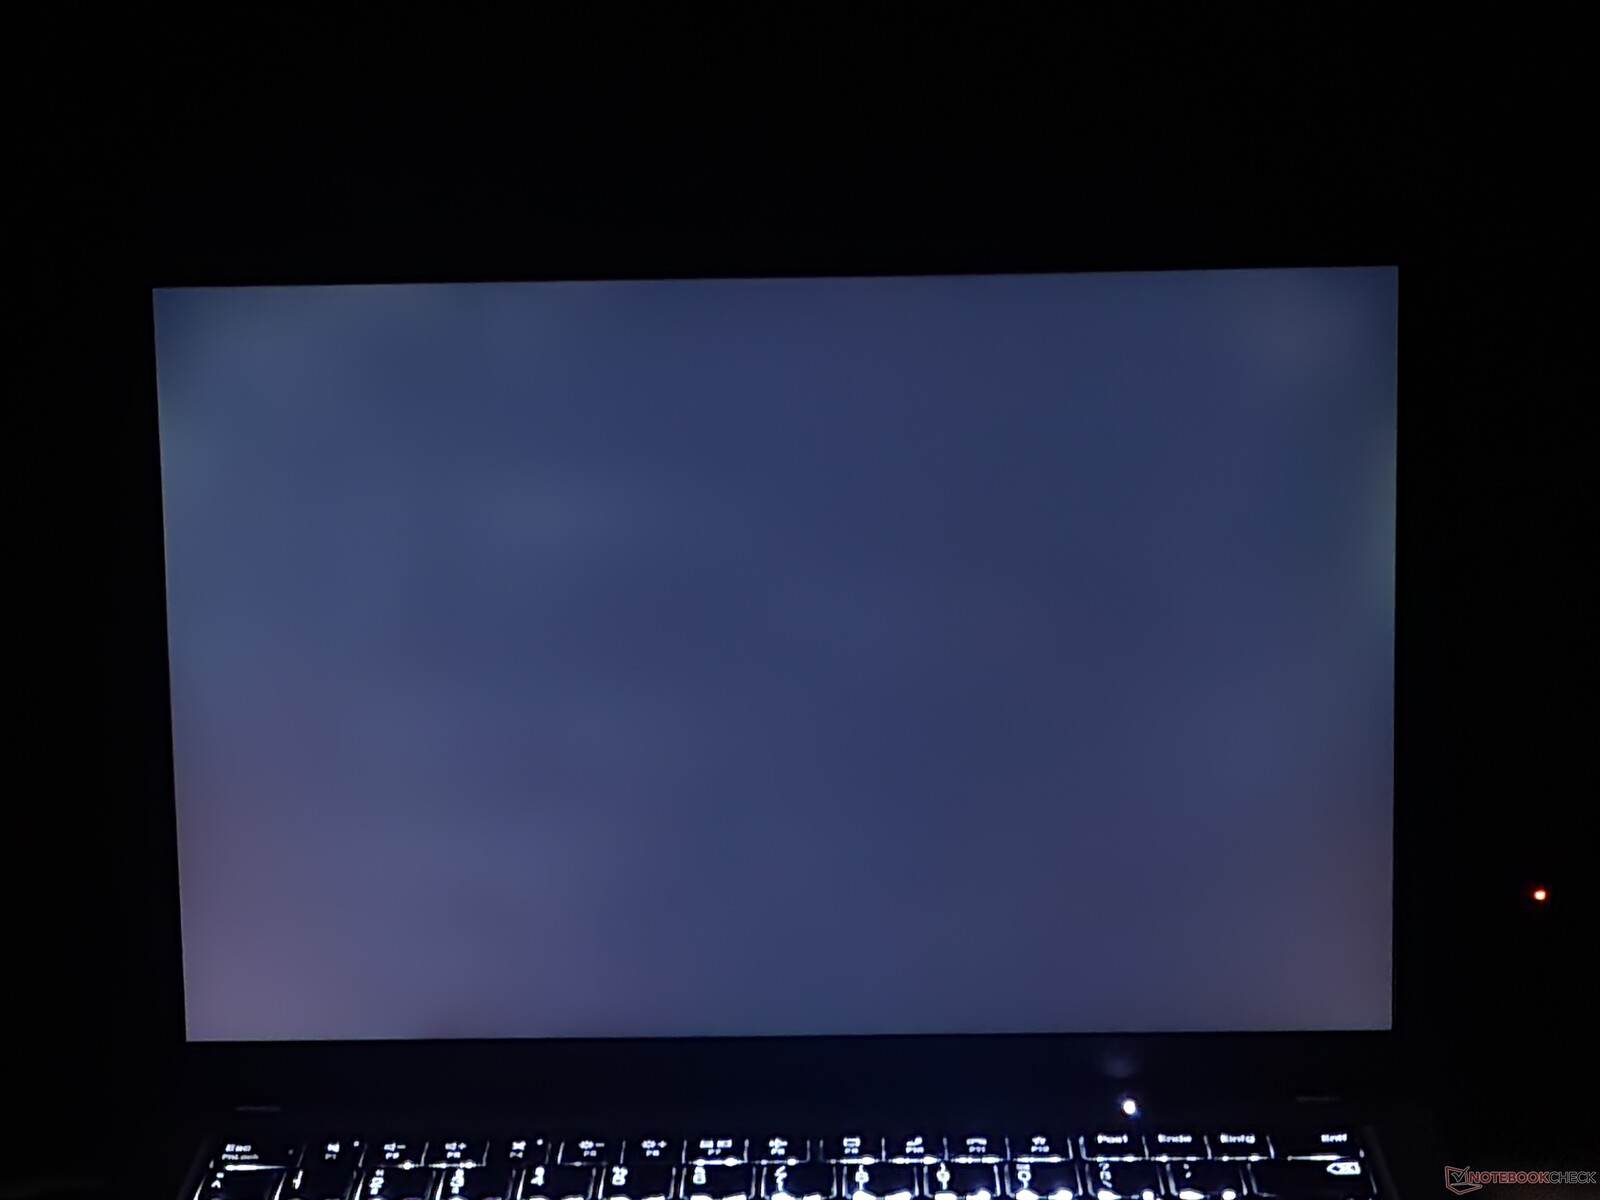
Le Lenovo ThinkPad T14s Gen 3 se montre tout à fait utilisable en extérieur, mais ce n'est pas particulièrement surprenant, puisque la luminosité est relativement élevée et qu'il offre une surface d'affichage mate.
Temps de réponse de l'écran
| ↔ Temps de réponse noir à blanc | ||
|---|---|---|
| 23.1 ms ... hausse ↗ et chute ↘ combinées | ↗ 10.4 ms hausse | 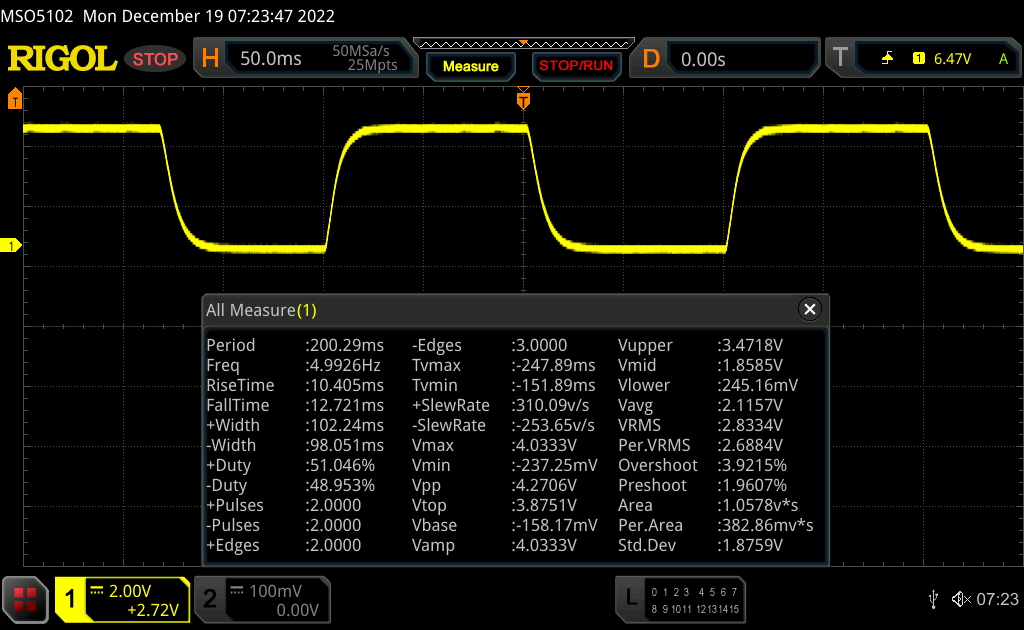 |
| ↘ 12.7 ms chute | ||
| L'écran montre de bons temps de réponse, mais insuffisant pour du jeu compétitif. En comparaison, tous les appareils testés affichent entre 0.1 (minimum) et 240 (maximum) ms. » 53 % des appareils testés affichent de meilleures performances. Cela signifie que les latences relevées sont moins bonnes que la moyenne (19.8 ms) de tous les appareils testés. | ||
| ↔ Temps de réponse gris 50% à gris 80% | ||
| 36.3 ms ... hausse ↗ et chute ↘ combinées | ↗ 16.4 ms hausse | 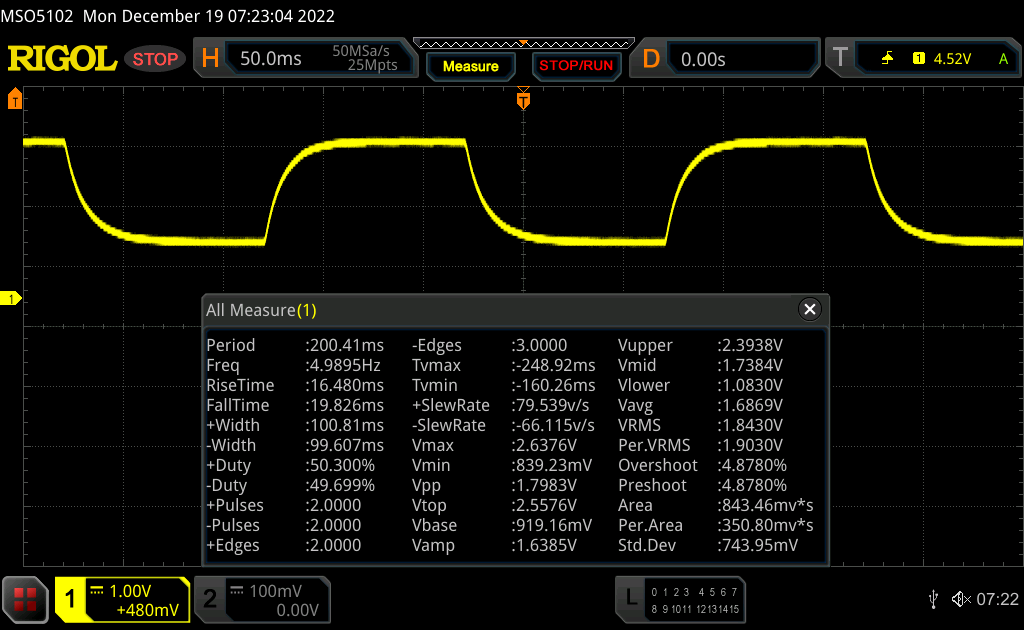 |
| ↘ 19.8 ms chute | ||
| L'écran souffre de latences très élevées, à éviter pour le jeu. En comparaison, tous les appareils testés affichent entre 0.165 (minimum) et 636 (maximum) ms. » 52 % des appareils testés affichent de meilleures performances. Cela signifie que les latences relevées sont moins bonnes que la moyenne (31 ms) de tous les appareils testés. | ||
Scintillement / MLI (Modulation de largeur d'impulsion)
| Scintillement / MLI (Modulation de largeur d'impulsion) non décelé |  | ||
En comparaison, 52 % des appareils testés n'emploient pas MDI pour assombrir leur écran. Nous avons relevé une moyenne à 7781 (minimum : 5 - maximum : 343500) Hz dans le cas où une MDI était active. | |||
Performances : Ryzen 6000 bat Intel dans les performances multicœurs de manière significative
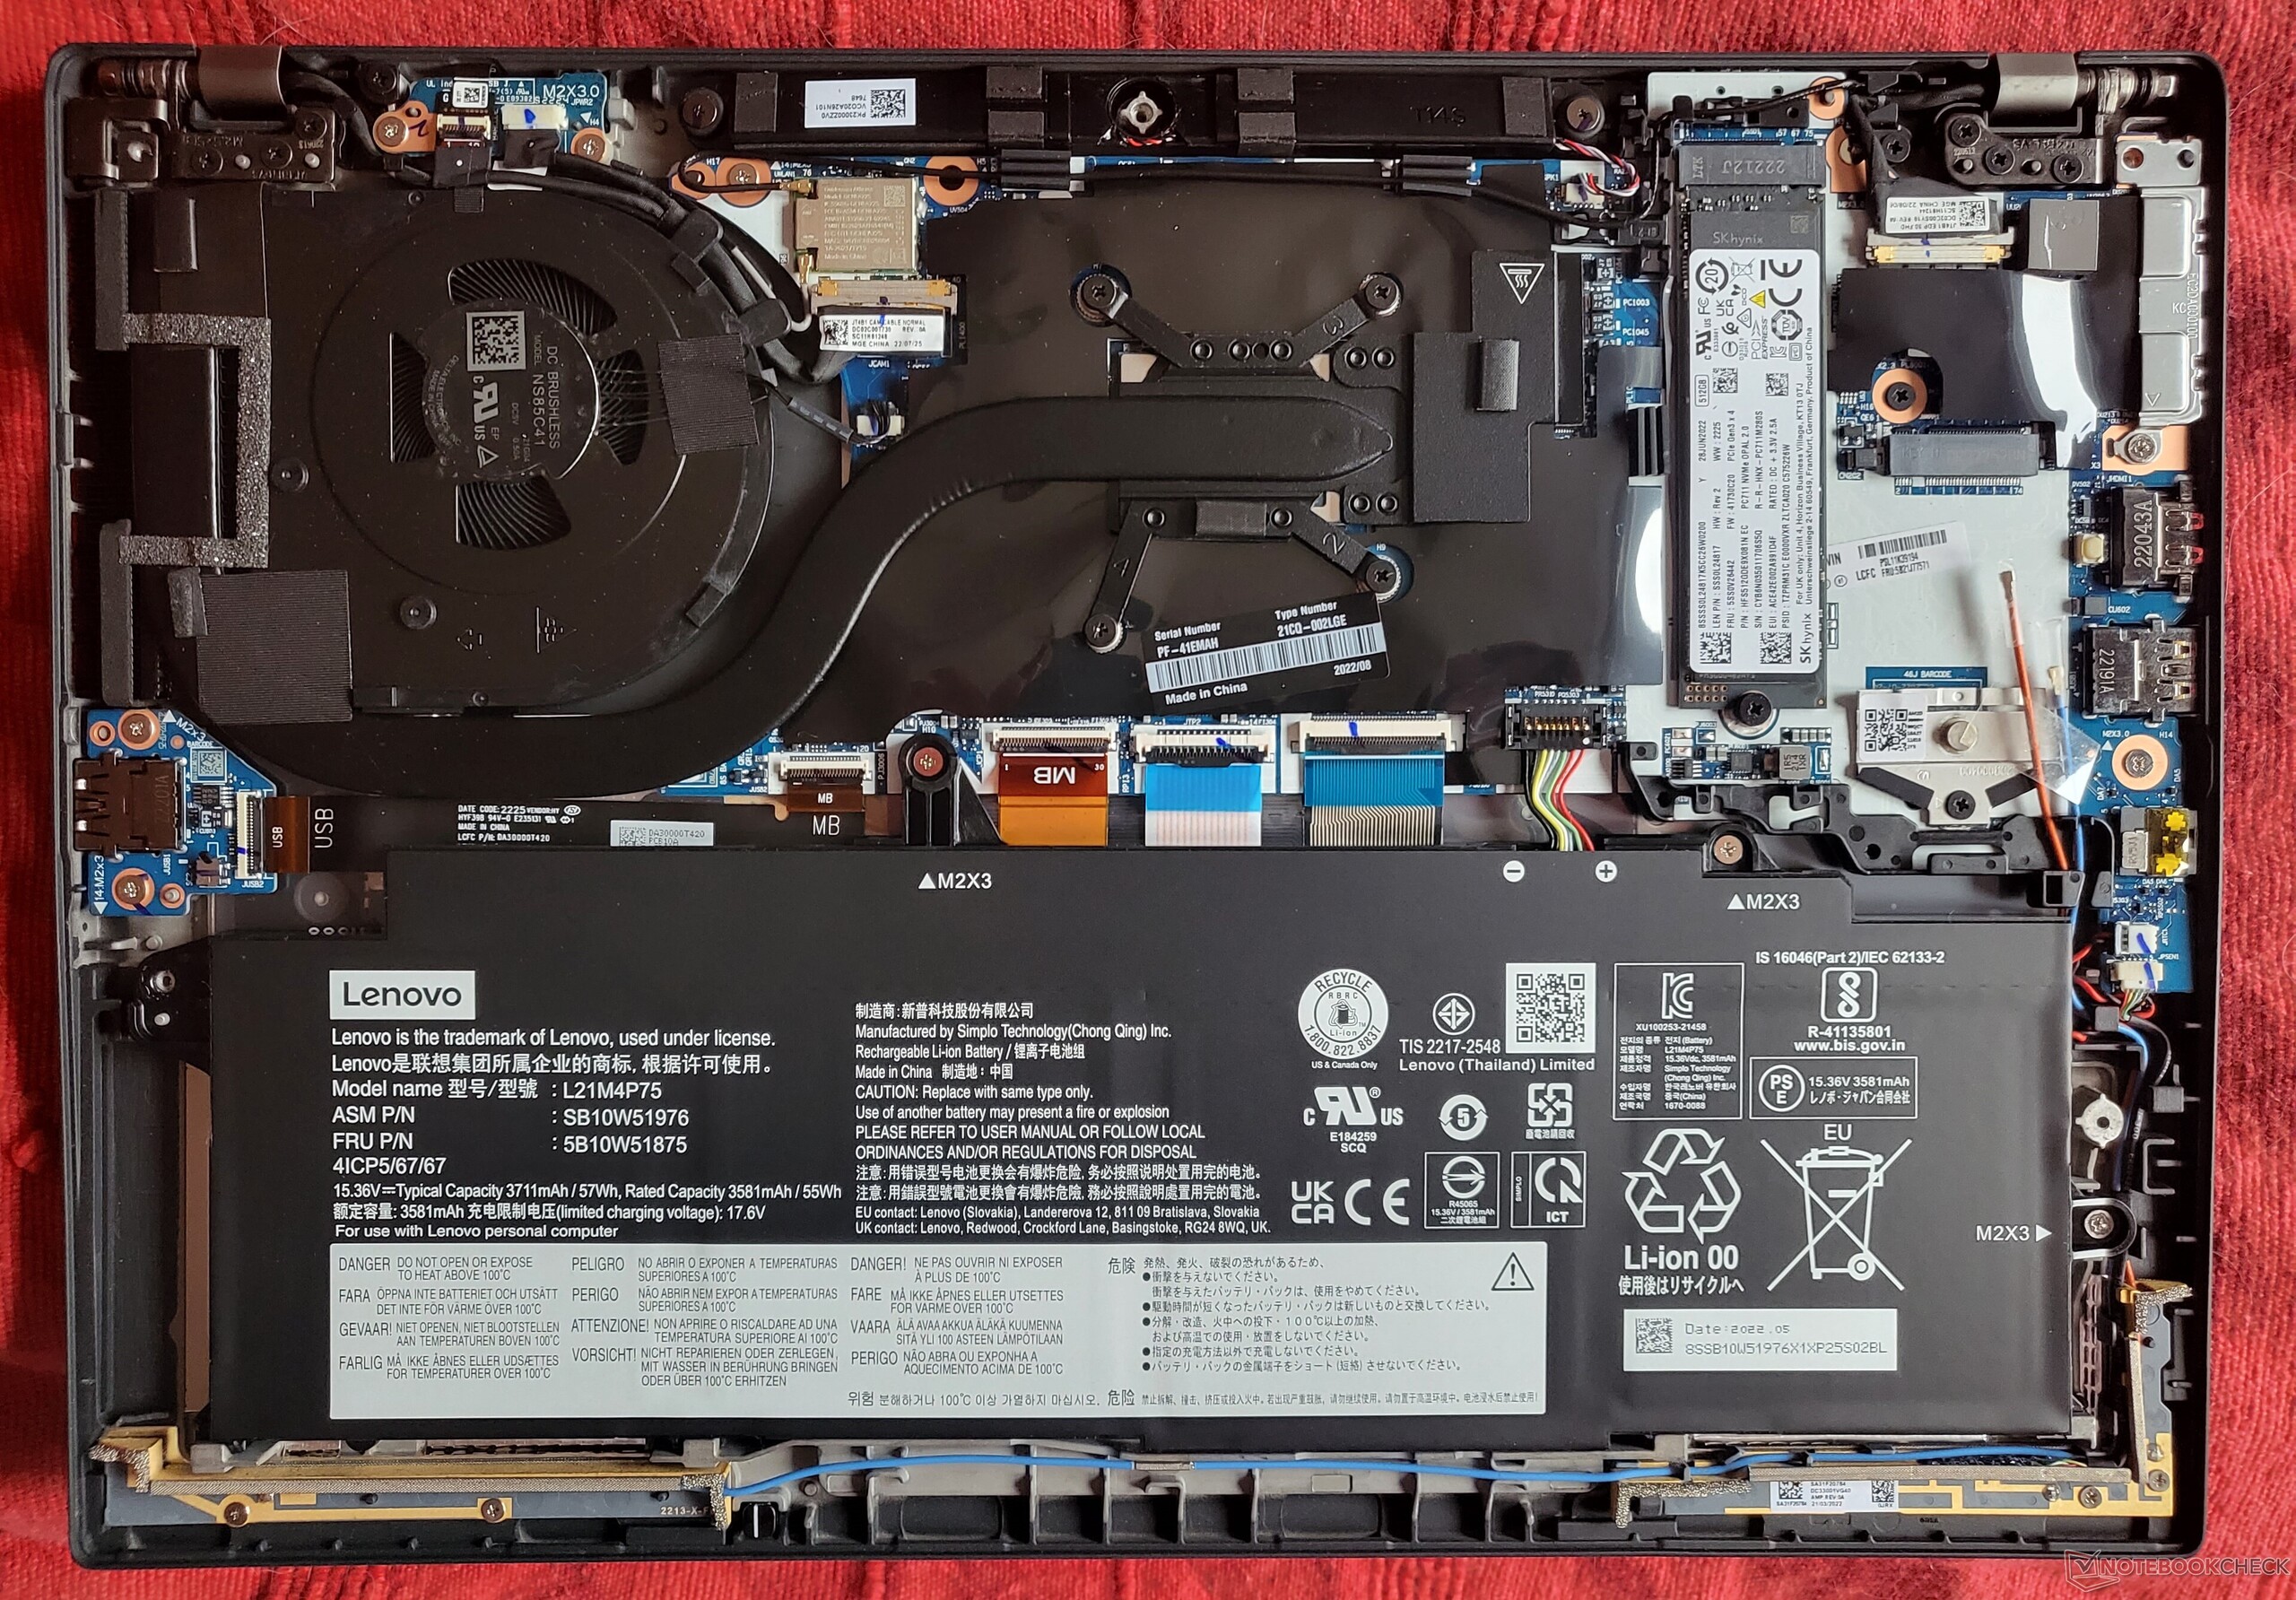
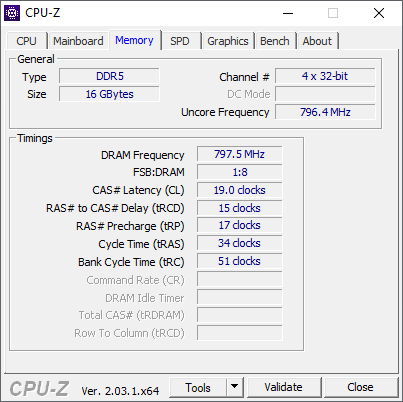
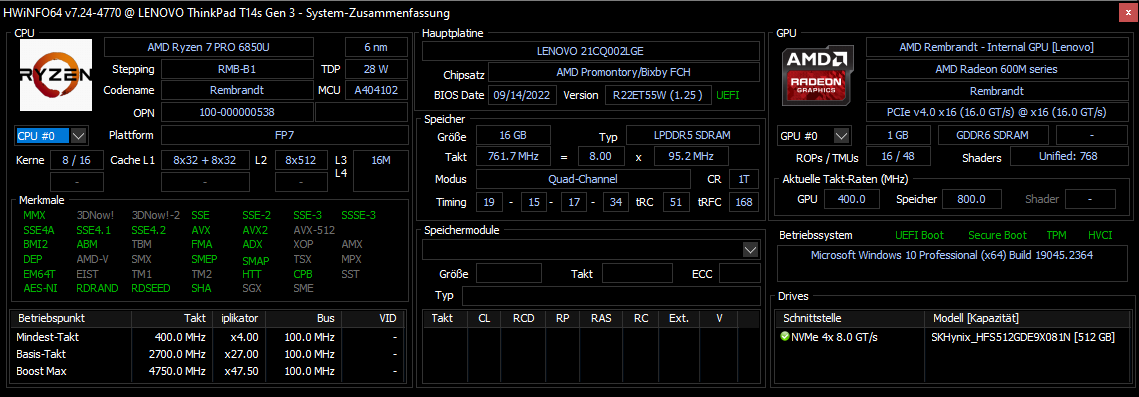
Lenovo vend le ThinkPad T14s G3 AMD avec deux options de processeur différentes : leAMD Ryzen 7 Pro 6850Uet le Ryzen 5 Pro 6650U. Il n'y a pas de GPU dédié, et vous devez utiliser le AMD Radeon intégré, qui est plus puissant dans le Ryzen 7 (Radeon 680M) que dans le Ryzen 5 (Radeon 660M). La mémoire de travail est soudée. Lenovo utilise la mémoire LPDDR5-6400 la plus récente. Le maximum disponible est de 32 Go, mais pour les clients moins exigeants, 8 et 16 Go sont également proposés. Comme solution de stockage, il y a un SSD M.2-2280 qui est connecté via NVMe PCIe 4.0 x4.
Conditions d'essai
Lenovo n'utilise pas son propre logiciel de gestion de l'énergie dans ses ordinateurs portables ThinkPad, mais les modes de performance peuvent être sélectionnés directement dans les paramètres de Windows. Il existe trois modes différents qui se distinguent par les limites de consommation d'énergie (PL2, qui est la limite de consommation à court terme, et PL1, qui est la limite de consommation à long terme) :
- Meilleure efficacité énergétique : PL2 12 Watt, PL1 12 Watt
- Équilibré : PL2 24 Watt, PL1 16.5 Watt
- Meilleure performance : PL2 30 Watt, PL1 24 Watt
Nous effectuons nos tests de performance uniquement en utilisant le mode "Best Performance", et "Balanced" est utilisé pendant le test de la batterie WiFi.
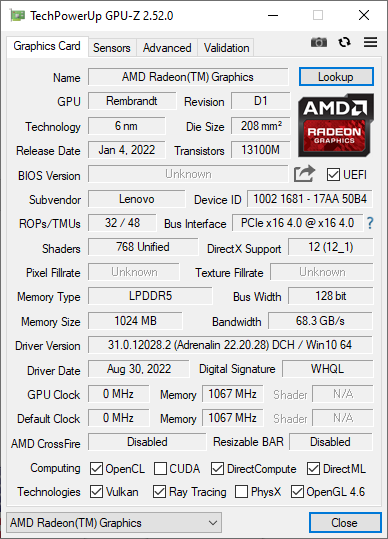
Processeur
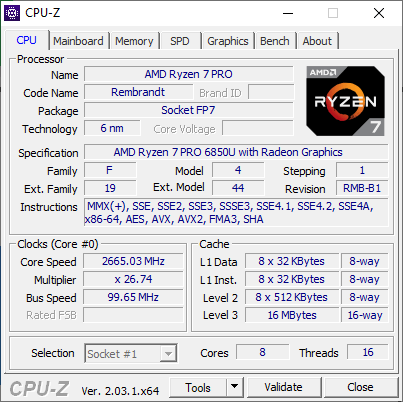
Le siteAMD Ryzen 7 Pro 6850U est un processeur de la génération Ryzen 6000 portant le nom de code "Rembrandt" Il s'agit d'une puce Zen3+ avec un total de 8 cœurs et 16 threads. La vitesse d'horloge maximale est de 4,7 GHz et la vitesse d'horloge de base de 2,7 GHz. AMD précise que le TDP typique de ce processeur est de 15 à 28 watts. Vous pouvez trouver des comparaisons de benchmark plus complètes dans notre Liste de repères de CPU.
Dans le Lenovo ThinkPad T14s G3, le Ryzen 7 fournit une très bonne performance. Dans les benchmarks multicœurs, le T14s se place au-dessus de tous les modèles de la concurrence, même dans les performances sous charge constante. Cependant, le tableau change dans les performances à un seul cœur, où le modèle actuel d'Intel et aussi le Apple M2 ont des performances légèrement meilleures. En outre, les performances globales du processeur sont légèrement meilleures sur le ThinkPad T14 G3équipé du même processeur.
Les performances du processeur ne sont pas limitées par le fonctionnement sur batterie.
Cinebench R15 Multi Constant Load Test
Cinebench R23: Multi Core | Single Core
Cinebench R20: CPU (Multi Core) | CPU (Single Core)
Cinebench R15: CPU Multi 64Bit | CPU Single 64Bit
Blender: v2.79 BMW27 CPU
7-Zip 18.03: 7z b 4 | 7z b 4 -mmt1
Geekbench 5.5: Multi-Core | Single-Core
HWBOT x265 Benchmark v2.2: 4k Preset
LibreOffice : 20 Documents To PDF
R Benchmark 2.5: Overall mean
| CPU Performance rating | |
| Dell Latitude 9430 2-in-1 -1! | |
| Moyenne de la classe Office | |
| Moyenne AMD Ryzen 7 PRO 6850U | |
| Lenovo ThinkPad T14 G3-21CF004NGE | |
| Lenovo ThinkPad T14s G3 21CQ002LGE | |
| Lenovo ThinkPad T14s G3 21BR00CDGE | |
| Lenovo ThinkPad X1 Carbon G10 21CB00DCGE | |
| Apple MacBook Pro 13 2022 M2 -5! | |
| Lenovo ThinkPad T14s G2 20XGS01100 | |
| HP EliteBook 845 G9 6F6H9EA | |
| Cinebench R23 / Multi Core | |
| Moyenne de la classe Office (1673 - 22808, n=74, 2 dernières années) | |
| Moyenne AMD Ryzen 7 PRO 6850U (9923 - 12945, n=7) | |
| Lenovo ThinkPad T14 G3-21CF004NGE | |
| Lenovo ThinkPad T14s G3 21CQ002LGE | |
| Lenovo ThinkPad X1 Carbon G10 21CB00DCGE | |
| Dell Latitude 9430 2-in-1 | |
| Lenovo ThinkPad T14s G3 21BR00CDGE | |
| Apple MacBook Pro 13 2022 M2 | |
| Lenovo ThinkPad T14s G2 20XGS01100 | |
| HP EliteBook 845 G9 6F6H9EA | |
| Cinebench R23 / Single Core | |
| Dell Latitude 9430 2-in-1 | |
| Lenovo ThinkPad T14s G3 21BR00CDGE | |
| Moyenne de la classe Office (708 - 2130, n=74, 2 dernières années) | |
| Lenovo ThinkPad X1 Carbon G10 21CB00DCGE | |
| Apple MacBook Pro 13 2022 M2 | |
| Lenovo ThinkPad T14s G3 21CQ002LGE | |
| Moyenne AMD Ryzen 7 PRO 6850U (1409 - 1536, n=7) | |
| Lenovo ThinkPad T14 G3-21CF004NGE | |
| HP EliteBook 845 G9 6F6H9EA | |
| Lenovo ThinkPad T14s G2 20XGS01100 | |
| Cinebench R20 / CPU (Multi Core) | |
| Moyenne de la classe Office (648 - 8840, n=73, 2 dernières années) | |
| Moyenne AMD Ryzen 7 PRO 6850U (3784 - 5022, n=7) | |
| Lenovo ThinkPad T14 G3-21CF004NGE | |
| Lenovo ThinkPad T14s G3 21CQ002LGE | |
| Lenovo ThinkPad X1 Carbon G10 21CB00DCGE | |
| Dell Latitude 9430 2-in-1 | |
| Lenovo ThinkPad T14s G3 21BR00CDGE | |
| Lenovo ThinkPad T14s G2 20XGS01100 | |
| HP EliteBook 845 G9 6F6H9EA | |
| Apple MacBook Pro 13 2022 M2 | |
| Cinebench R20 / CPU (Single Core) | |
| Dell Latitude 9430 2-in-1 | |
| Moyenne de la classe Office (345 - 816, n=73, 2 dernières années) | |
| Lenovo ThinkPad T14s G3 21BR00CDGE | |
| Lenovo ThinkPad X1 Carbon G10 21CB00DCGE | |
| Lenovo ThinkPad T14s G3 21CQ002LGE | |
| Moyenne AMD Ryzen 7 PRO 6850U (587 - 596, n=7) | |
| Lenovo ThinkPad T14 G3-21CF004NGE | |
| HP EliteBook 845 G9 6F6H9EA | |
| Lenovo ThinkPad T14s G2 20XGS01100 | |
| Apple MacBook Pro 13 2022 M2 | |
| Cinebench R15 / CPU Multi 64Bit | |
| Moyenne AMD Ryzen 7 PRO 6850U (1652 - 2092, n=7) | |
| Moyenne de la classe Office (250 - 3380, n=75, 2 dernières années) | |
| Lenovo ThinkPad T14 G3-21CF004NGE | |
| Lenovo ThinkPad T14s G3 21CQ002LGE | |
| Lenovo ThinkPad X1 Carbon G10 21CB00DCGE | |
| Lenovo ThinkPad T14s G3 21BR00CDGE | |
| Dell Latitude 9430 2-in-1 | |
| Lenovo ThinkPad T14s G2 20XGS01100 | |
| HP EliteBook 845 G9 6F6H9EA | |
| Apple MacBook Pro 13 2022 M2 | |
| Cinebench R15 / CPU Single 64Bit | |
| Dell Latitude 9430 2-in-1 | |
| Moyenne de la classe Office (99.5 - 312, n=75, 2 dernières années) | |
| Lenovo ThinkPad T14s G3 21BR00CDGE | |
| Lenovo ThinkPad T14s G3 21CQ002LGE | |
| Lenovo ThinkPad T14 G3-21CF004NGE | |
| Moyenne AMD Ryzen 7 PRO 6850U (228 - 244, n=7) | |
| HP EliteBook 845 G9 6F6H9EA | |
| Lenovo ThinkPad T14s G2 20XGS01100 | |
| Apple MacBook Pro 13 2022 M2 | |
| Lenovo ThinkPad X1 Carbon G10 21CB00DCGE | |
| Blender / v2.79 BMW27 CPU | |
| Apple MacBook Pro 13 2022 M2 | |
| Lenovo ThinkPad T14s G3 21BR00CDGE | |
| HP EliteBook 845 G9 6F6H9EA | |
| Moyenne de la classe Office (158 - 1940, n=74, 2 dernières années) | |
| Lenovo ThinkPad X1 Carbon G10 21CB00DCGE | |
| Lenovo ThinkPad T14s G2 20XGS01100 | |
| Lenovo ThinkPad T14s G3 21CQ002LGE | |
| Lenovo ThinkPad T14 G3-21CF004NGE | |
| Moyenne AMD Ryzen 7 PRO 6850U (241 - 307, n=7) | |
| 7-Zip 18.03 / 7z b 4 | |
| Lenovo ThinkPad T14 G3-21CF004NGE | |
| Moyenne AMD Ryzen 7 PRO 6850U (44011 - 59045, n=7) | |
| Lenovo ThinkPad T14s G3 21CQ002LGE | |
| Lenovo ThinkPad T14s G2 20XGS01100 | |
| Moyenne de la classe Office (7098 - 76886, n=75, 2 dernières années) | |
| Lenovo ThinkPad X1 Carbon G10 21CB00DCGE | |
| Lenovo ThinkPad T14s G3 21BR00CDGE | |
| Dell Latitude 9430 2-in-1 | |
| HP EliteBook 845 G9 6F6H9EA | |
| 7-Zip 18.03 / 7z b 4 -mmt1 | |
| Dell Latitude 9430 2-in-1 | |
| HP EliteBook 845 G9 6F6H9EA | |
| Moyenne AMD Ryzen 7 PRO 6850U (5057 - 5662, n=7) | |
| Moyenne de la classe Office (3387 - 6469, n=75, 2 dernières années) | |
| Lenovo ThinkPad T14s G3 21CQ002LGE | |
| Lenovo ThinkPad T14 G3-21CF004NGE | |
| Lenovo ThinkPad T14s G2 20XGS01100 | |
| Lenovo ThinkPad T14s G3 21BR00CDGE | |
| Lenovo ThinkPad X1 Carbon G10 21CB00DCGE | |
| Geekbench 5.5 / Multi-Core | |
| Moyenne de la classe Office (1483 - 16999, n=71, 2 dernières années) | |
| Dell Latitude 9430 2-in-1 | |
| Apple MacBook Pro 13 2022 M2 | |
| Lenovo ThinkPad X1 Carbon G10 21CB00DCGE | |
| Lenovo ThinkPad T14s G3 21BR00CDGE | |
| Moyenne AMD Ryzen 7 PRO 6850U (7044 - 9241, n=7) | |
| Lenovo ThinkPad T14 G3-21CF004NGE | |
| Lenovo ThinkPad T14s G3 21CQ002LGE | |
| Lenovo ThinkPad T14s G2 20XGS01100 | |
| HP EliteBook 845 G9 6F6H9EA | |
| Geekbench 5.5 / Single-Core | |
| Apple MacBook Pro 13 2022 M2 | |
| Moyenne de la classe Office (811 - 2128, n=71, 2 dernières années) | |
| Dell Latitude 9430 2-in-1 | |
| Lenovo ThinkPad X1 Carbon G10 21CB00DCGE | |
| Lenovo ThinkPad T14s G3 21BR00CDGE | |
| Lenovo ThinkPad T14 G3-21CF004NGE | |
| Moyenne AMD Ryzen 7 PRO 6850U (1433 - 1533, n=7) | |
| Lenovo ThinkPad T14s G3 21CQ002LGE | |
| HP EliteBook 845 G9 6F6H9EA | |
| Lenovo ThinkPad T14s G2 20XGS01100 | |
| HWBOT x265 Benchmark v2.2 / 4k Preset | |
| Lenovo ThinkPad T14 G3-21CF004NGE | |
| Moyenne AMD Ryzen 7 PRO 6850U (11.7 - 16.3, n=7) | |
| Moyenne de la classe Office (2.21 - 26, n=74, 2 dernières années) | |
| Lenovo ThinkPad T14s G3 21CQ002LGE | |
| Lenovo ThinkPad T14s G2 20XGS01100 | |
| Dell Latitude 9430 2-in-1 | |
| HP EliteBook 845 G9 6F6H9EA | |
| Lenovo ThinkPad T14s G3 21BR00CDGE | |
| Lenovo ThinkPad X1 Carbon G10 21CB00DCGE | |
| LibreOffice / 20 Documents To PDF | |
| HP EliteBook 845 G9 6F6H9EA | |
| Moyenne de la classe Office (39.9 - 102.3, n=74, 2 dernières années) | |
| Moyenne AMD Ryzen 7 PRO 6850U (46.3 - 74, n=7) | |
| Lenovo ThinkPad T14s G3 21CQ002LGE | |
| Lenovo ThinkPad T14 G3-21CF004NGE | |
| Lenovo ThinkPad T14s G2 20XGS01100 | |
| Lenovo ThinkPad X1 Carbon G10 21CB00DCGE | |
| Dell Latitude 9430 2-in-1 | |
| Lenovo ThinkPad T14s G3 21BR00CDGE | |
| R Benchmark 2.5 / Overall mean | |
| Lenovo ThinkPad T14s G2 20XGS01100 | |
| Moyenne de la classe Office (0.4098 - 0.888, n=74, 2 dernières années) | |
| Lenovo ThinkPad X1 Carbon G10 21CB00DCGE | |
| Lenovo ThinkPad T14 G3-21CF004NGE | |
| HP EliteBook 845 G9 6F6H9EA | |
| Moyenne AMD Ryzen 7 PRO 6850U (0.4932 - 0.544, n=7) | |
| Lenovo ThinkPad T14s G3 21CQ002LGE | |
| Lenovo ThinkPad T14s G3 21BR00CDGE | |
| Dell Latitude 9430 2-in-1 | |
* ... Moindre est la valeur, meilleures sont les performances
AIDA64: FP32 Ray-Trace | FPU Julia | CPU SHA3 | CPU Queen | FPU SinJulia | FPU Mandel | CPU AES | CPU ZLib | FP64 Ray-Trace | CPU PhotoWorxx
| Performance rating | |
| Moyenne AMD Ryzen 7 PRO 6850U | |
| Lenovo ThinkPad T14s G3 21CQ002LGE | |
| Moyenne de la classe Office | |
| Lenovo ThinkPad T14s G2 20XGS01100 | |
| HP EliteBook 845 G9 6F6H9EA | |
| Dell Latitude 9430 2-in-1 | |
| Lenovo ThinkPad T14s G3 21BR00CDGE | |
| Lenovo ThinkPad X1 Carbon G10 21CB00DCGE | |
| AIDA64 / FP32 Ray-Trace | |
| Moyenne de la classe Office (2083 - 31245, n=80, 2 dernières années) | |
| Moyenne AMD Ryzen 7 PRO 6850U (11272 - 14704, n=8) | |
| Lenovo ThinkPad T14s G3 21CQ002LGE | |
| Lenovo ThinkPad T14s G2 20XGS01100 | |
| HP EliteBook 845 G9 6F6H9EA | |
| Dell Latitude 9430 2-in-1 | |
| Lenovo ThinkPad T14s G3 21BR00CDGE | |
| Lenovo ThinkPad X1 Carbon G10 21CB00DCGE | |
| AIDA64 / FPU Julia | |
| Moyenne AMD Ryzen 7 PRO 6850U (72242 - 92957, n=8) | |
| Lenovo ThinkPad T14s G3 21CQ002LGE | |
| Lenovo ThinkPad T14s G2 20XGS01100 | |
| HP EliteBook 845 G9 6F6H9EA | |
| Moyenne de la classe Office (8191 - 125394, n=80, 2 dernières années) | |
| Dell Latitude 9430 2-in-1 | |
| Lenovo ThinkPad T14s G3 21BR00CDGE | |
| Lenovo ThinkPad X1 Carbon G10 21CB00DCGE | |
| AIDA64 / CPU SHA3 | |
| Moyenne de la classe Office (433 - 5755, n=80, 2 dernières années) | |
| Moyenne AMD Ryzen 7 PRO 6850U (2419 - 3104, n=8) | |
| Lenovo ThinkPad T14s G3 21CQ002LGE | |
| Lenovo ThinkPad T14s G2 20XGS01100 | |
| Dell Latitude 9430 2-in-1 | |
| Lenovo ThinkPad T14s G3 21BR00CDGE | |
| HP EliteBook 845 G9 6F6H9EA | |
| Lenovo ThinkPad X1 Carbon G10 21CB00DCGE | |
| AIDA64 / CPU Queen | |
| Moyenne AMD Ryzen 7 PRO 6850U (86644 - 96912, n=7) | |
| Lenovo ThinkPad T14s G3 21CQ002LGE | |
| Lenovo ThinkPad T14s G2 20XGS01100 | |
| Lenovo ThinkPad X1 Carbon G10 21CB00DCGE | |
| HP EliteBook 845 G9 6F6H9EA | |
| Dell Latitude 9430 2-in-1 | |
| Moyenne de la classe Office (22784 - 115197, n=69, 2 dernières années) | |
| Lenovo ThinkPad T14s G3 21BR00CDGE | |
| AIDA64 / FPU SinJulia | |
| Moyenne AMD Ryzen 7 PRO 6850U (10917 - 12571, n=8) | |
| Lenovo ThinkPad T14s G3 21CQ002LGE | |
| Lenovo ThinkPad T14s G2 20XGS01100 | |
| HP EliteBook 845 G9 6F6H9EA | |
| Moyenne de la classe Office (1378 - 18321, n=80, 2 dernières années) | |
| Dell Latitude 9430 2-in-1 | |
| Lenovo ThinkPad X1 Carbon G10 21CB00DCGE | |
| Lenovo ThinkPad T14s G3 21BR00CDGE | |
| AIDA64 / FPU Mandel | |
| Moyenne AMD Ryzen 7 PRO 6850U (39609 - 51296, n=8) | |
| Lenovo ThinkPad T14s G3 21CQ002LGE | |
| Lenovo ThinkPad T14s G2 20XGS01100 | |
| HP EliteBook 845 G9 6F6H9EA | |
| Moyenne de la classe Office (4601 - 66922, n=80, 2 dernières années) | |
| Dell Latitude 9430 2-in-1 | |
| Lenovo ThinkPad T14s G3 21BR00CDGE | |
| Lenovo ThinkPad X1 Carbon G10 21CB00DCGE | |
| AIDA64 / CPU AES | |
| Lenovo ThinkPad T14s G2 20XGS01100 | |
| Moyenne AMD Ryzen 7 PRO 6850U (45568 - 60867, n=8) | |
| Moyenne de la classe Office (4854 - 155900, n=80, 2 dernières années) | |
| Lenovo ThinkPad T14s G3 21CQ002LGE | |
| Dell Latitude 9430 2-in-1 | |
| HP EliteBook 845 G9 6F6H9EA | |
| Lenovo ThinkPad T14s G3 21BR00CDGE | |
| Lenovo ThinkPad X1 Carbon G10 21CB00DCGE | |
| AIDA64 / CPU ZLib | |
| Moyenne de la classe Office (114.6 - 1366, n=80, 2 dernières années) | |
| Moyenne AMD Ryzen 7 PRO 6850U (641 - 805, n=8) | |
| Lenovo ThinkPad T14s G3 21CQ002LGE | |
| Dell Latitude 9430 2-in-1 | |
| Lenovo ThinkPad T14s G3 21BR00CDGE | |
| Lenovo ThinkPad T14s G2 20XGS01100 | |
| HP EliteBook 845 G9 6F6H9EA | |
| Lenovo ThinkPad X1 Carbon G10 21CB00DCGE | |
| AIDA64 / FP64 Ray-Trace | |
| Moyenne de la classe Office (1109 - 17834, n=80, 2 dernières années) | |
| Moyenne AMD Ryzen 7 PRO 6850U (5967 - 7821, n=8) | |
| Lenovo ThinkPad T14s G3 21CQ002LGE | |
| Lenovo ThinkPad T14s G2 20XGS01100 | |
| HP EliteBook 845 G9 6F6H9EA | |
| Dell Latitude 9430 2-in-1 | |
| Lenovo ThinkPad T14s G3 21BR00CDGE | |
| Lenovo ThinkPad X1 Carbon G10 21CB00DCGE | |
| AIDA64 / CPU PhotoWorxx | |
| Dell Latitude 9430 2-in-1 | |
| Lenovo ThinkPad T14s G3 21BR00CDGE | |
| Lenovo ThinkPad X1 Carbon G10 21CB00DCGE | |
| Moyenne de la classe Office (11090 - 65229, n=80, 2 dernières années) | |
| Lenovo ThinkPad T14s G3 21CQ002LGE | |
| Moyenne AMD Ryzen 7 PRO 6850U (19707 - 27840, n=8) | |
| HP EliteBook 845 G9 6F6H9EA | |
| Lenovo ThinkPad T14s G2 20XGS01100 | |
Performance du système
Dans PCMark 10, le Lenovo ThinkPad T14s G3 prend la première place. Il n'est donc pas surprenant que le Lenovo ThinkPad T14s Gen 3 soit très rapide et fluide au quotidien.
CrossMark: Overall | Productivity | Creativity | Responsiveness
| PCMark 10 / Score | |
| Moyenne de la classe Office (2601 - 9298, n=64, 2 dernières années) | |
| Lenovo ThinkPad T14s G3 21CQ002LGE | |
| Moyenne AMD Ryzen 7 PRO 6850U, AMD Radeon 680M (5873 - 6311, n=7) | |
| Lenovo ThinkPad T14s G2 20XGS01100 | |
| HP EliteBook 845 G9 6F6H9EA | |
| Dell Latitude 9430 2-in-1 | |
| Lenovo ThinkPad T14s G3 21BR00CDGE | |
| PCMark 10 / Essentials | |
| Dell Latitude 9430 2-in-1 | |
| Lenovo ThinkPad T14s G2 20XGS01100 | |
| Moyenne de la classe Office (3245 - 11594, n=64, 2 dernières années) | |
| Lenovo ThinkPad T14s G3 21BR00CDGE | |
| Lenovo ThinkPad T14s G3 21CQ002LGE | |
| HP EliteBook 845 G9 6F6H9EA | |
| Moyenne AMD Ryzen 7 PRO 6850U, AMD Radeon 680M (9151 - 10263, n=7) | |
| PCMark 10 / Productivity | |
| Moyenne de la classe Office (5336 - 17243, n=64, 2 dernières années) | |
| Lenovo ThinkPad T14s G2 20XGS01100 | |
| Lenovo ThinkPad T14s G3 21CQ002LGE | |
| HP EliteBook 845 G9 6F6H9EA | |
| Moyenne AMD Ryzen 7 PRO 6850U, AMD Radeon 680M (8435 - 8891, n=7) | |
| Dell Latitude 9430 2-in-1 | |
| Lenovo ThinkPad T14s G3 21BR00CDGE | |
| PCMark 10 / Digital Content Creation | |
| Moyenne de la classe Office (2049 - 13541, n=64, 2 dernières années) | |
| Moyenne AMD Ryzen 7 PRO 6850U, AMD Radeon 680M (6796 - 8422, n=7) | |
| Lenovo ThinkPad T14s G3 21CQ002LGE | |
| Lenovo ThinkPad T14s G2 20XGS01100 | |
| Dell Latitude 9430 2-in-1 | |
| HP EliteBook 845 G9 6F6H9EA | |
| Lenovo ThinkPad T14s G3 21BR00CDGE | |
| CrossMark / Overall | |
| Dell Latitude 9430 2-in-1 | |
| Lenovo ThinkPad T14s G3 21BR00CDGE | |
| Moyenne de la classe Office (381 - 2010, n=73, 2 dernières années) | |
| Lenovo ThinkPad T14s G3 21CQ002LGE | |
| Moyenne AMD Ryzen 7 PRO 6850U, AMD Radeon 680M (1154 - 1442, n=7) | |
| Lenovo ThinkPad T14s G2 20XGS01100 | |
| CrossMark / Productivity | |
| Dell Latitude 9430 2-in-1 | |
| Lenovo ThinkPad T14s G3 21BR00CDGE | |
| Moyenne de la classe Office (464 - 1880, n=73, 2 dernières années) | |
| Lenovo ThinkPad T14s G3 21CQ002LGE | |
| Moyenne AMD Ryzen 7 PRO 6850U, AMD Radeon 680M (1188 - 1444, n=7) | |
| Lenovo ThinkPad T14s G2 20XGS01100 | |
| CrossMark / Creativity | |
| Dell Latitude 9430 2-in-1 | |
| Moyenne de la classe Office (319 - 2361, n=73, 2 dernières années) | |
| Lenovo ThinkPad T14s G3 21BR00CDGE | |
| Lenovo ThinkPad T14s G3 21CQ002LGE | |
| Lenovo ThinkPad T14s G2 20XGS01100 | |
| Moyenne AMD Ryzen 7 PRO 6850U, AMD Radeon 680M (1180 - 1523, n=7) | |
| CrossMark / Responsiveness | |
| Dell Latitude 9430 2-in-1 | |
| Lenovo ThinkPad T14s G3 21BR00CDGE | |
| Moyenne de la classe Office (360 - 1690, n=73, 2 dernières années) | |
| Lenovo ThinkPad T14s G3 21CQ002LGE | |
| Moyenne AMD Ryzen 7 PRO 6850U, AMD Radeon 680M (990 - 1282, n=7) | |
| Lenovo ThinkPad T14s G2 20XGS01100 | |
| PCMark 10 Score | 6152 points | |
Aide | ||
| AIDA64 / Memory Copy | |
| Dell Latitude 9430 2-in-1 | |
| Moyenne de la classe Office (20075 - 110930, n=77, 2 dernières années) | |
| Lenovo ThinkPad T14s G3 21BR00CDGE | |
| Lenovo ThinkPad T14s G3 21CQ002LGE | |
| Moyenne AMD Ryzen 7 PRO 6850U (31003 - 48605, n=8) | |
| Lenovo ThinkPad T14s G2 20XGS01100 | |
| HP EliteBook 845 G9 6F6H9EA | |
| AIDA64 / Memory Read | |
| Moyenne de la classe Office (10084 - 128030, n=78, 2 dernières années) | |
| Lenovo ThinkPad T14s G3 21BR00CDGE | |
| Dell Latitude 9430 2-in-1 | |
| Moyenne AMD Ryzen 7 PRO 6850U (34682 - 45912, n=8) | |
| Lenovo ThinkPad T14s G3 21CQ002LGE | |
| Lenovo ThinkPad T14s G2 20XGS01100 | |
| HP EliteBook 845 G9 6F6H9EA | |
| AIDA64 / Memory Write | |
| Moyenne de la classe Office (20073 - 119858, n=78, 2 dernières années) | |
| Dell Latitude 9430 2-in-1 | |
| Lenovo ThinkPad T14s G3 21BR00CDGE | |
| Lenovo ThinkPad T14s G3 21CQ002LGE | |
| Moyenne AMD Ryzen 7 PRO 6850U (34532 - 51096, n=8) | |
| Lenovo ThinkPad T14s G2 20XGS01100 | |
| HP EliteBook 845 G9 6F6H9EA | |
| AIDA64 / Memory Latency | |
| Lenovo ThinkPad T14s G3 21CQ002LGE | |
| Lenovo ThinkPad T14s G2 20XGS01100 | |
| Moyenne AMD Ryzen 7 PRO 6850U (86.1 - 135.3, n=8) | |
| Dell Latitude 9430 2-in-1 | |
| Moyenne de la classe Office (7.6 - 162.9, n=73, 2 dernières années) | |
| HP EliteBook 845 G9 6F6H9EA | |
| Lenovo ThinkPad T14s G3 21BR00CDGE | |
* ... Moindre est la valeur, meilleures sont les performances
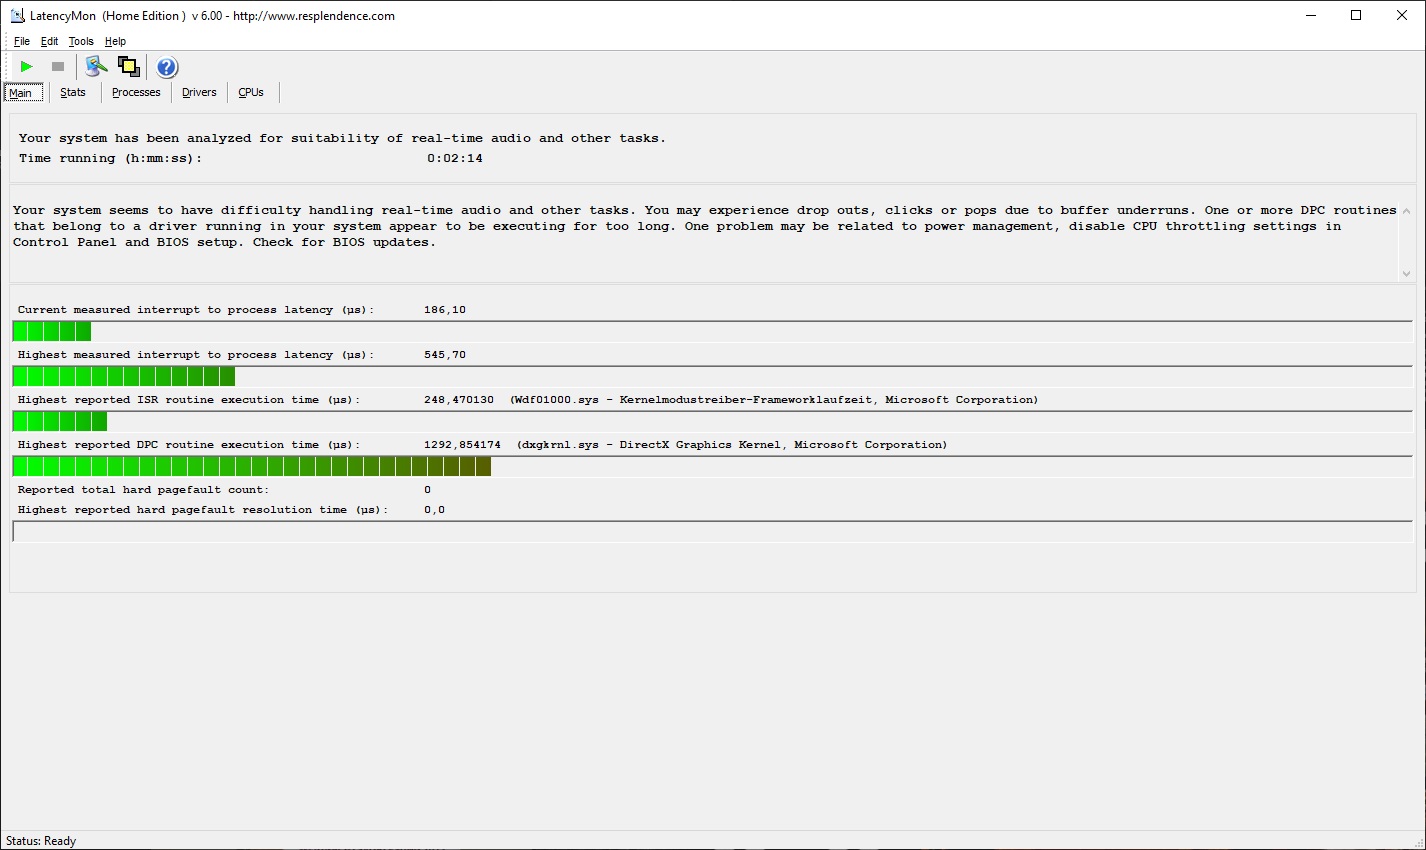
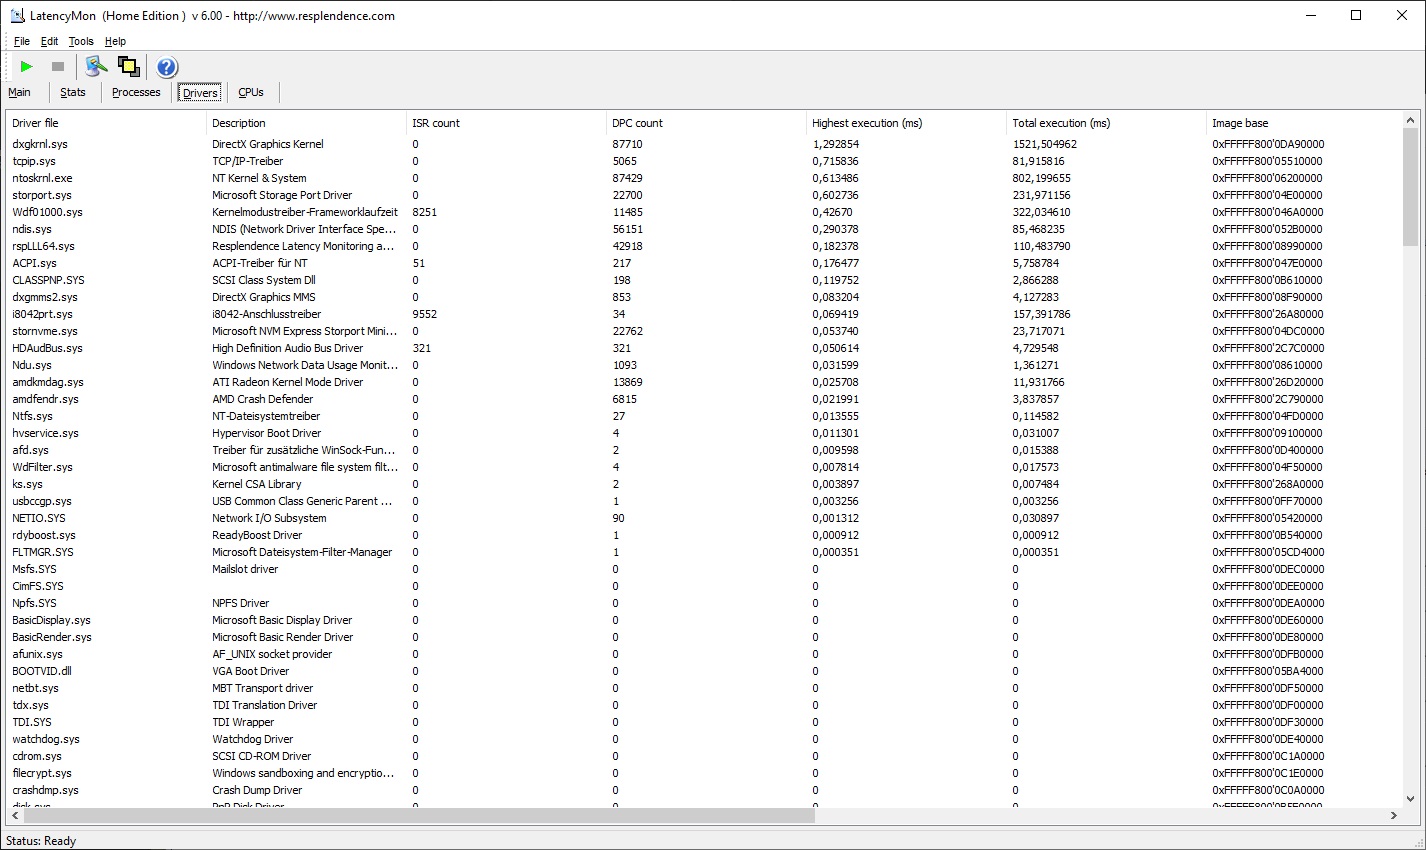
Latences DPC
Si les latences DPC mesurées ne sont pas particulièrement élevées, elles restent problématiques pour le travail audio et vidéo en temps réel, du moins dans la version que nous avons testée, avec l'état des pilotes en vigueur au moment de notre test.
| DPC Latencies / LatencyMon - interrupt to process latency (max), Web, Youtube, Prime95 | |
| Lenovo ThinkPad T14s G2 20XGS01100 | |
| HP EliteBook 845 G9 6F6H9EA | |
| Lenovo ThinkPad T14s G3 21BR00CDGE | |
| Dell Latitude 9430 2-in-1 | |
| Lenovo ThinkPad T14s G3 21CQ002LGE | |
* ... Moindre est la valeur, meilleures sont les performances
Solution de stockage
Le SSD Hynix de notre unité de test du Lenovo ThinkPad T14s G3 offre une capacité de 512 Go. Le SSD M.2-2280 est connecté via la norme rapide NVMe PCIe 4.0, obtenant de meilleurs résultats aux tests de référence que tous les concurrents de notre comparaison. Cependant, sous une charge constante, on peut observer quelques baisses de performances, qui pourraient être dues à certaines limitations thermiques.

* ... Moindre est la valeur, meilleures sont les performances
Disk Throttling: DiskSpd Read Loop, Queue Depth 8
Carte graphique
Le siteAMD Radeon 680M ce GPU RNDA2 intégré dans le Lenovo ThinkPad T14s G3 obtient des résultats de référence qui dépassent de loin ceux de ses concurrents équipés de GPU Intel, que l'on se réfère aux tests 3DMark ou à nos benchmarks de jeux, même si nous admettons que ceux-ci sont moins significatifs pour un ordinateur portable professionnel. Ce qui pourrait être plus intéressant est peut-être Blender v3.3, où la Radeon 680M du Lenovo ThinkPad fonctionne environ deux fois plus vite que la Radeon 660M du HP EliteBook 845 G9pendant le test HIP. Avec cela, le ThinkPad T14s G3 AMD peut également être utilisé assez bien pour le rendu.
| 3DMark 11 Performance | 9637 points | |
| 3DMark Cloud Gate Standard Score | 29621 points | |
| 3DMark Fire Strike Score | 5908 points | |
| 3DMark Time Spy Score | 2171 points | |
Aide | ||
* ... Moindre est la valeur, meilleures sont les performances
| The Witcher 3 - 1920x1080 Ultra Graphics & Postprocessing (HBAO+) | |
| Lenovo ThinkPad T14s G3 21CQ002LGE | |
| Moyenne de la classe Office (14.8 - 18.1, n=4, 2 dernières années) | |
| Dell Latitude 9430 2-in-1 | |
| Lenovo ThinkPad T14s G2 20XGS01100 | |
| Lenovo ThinkPad T14s G3 21BR00CDGE | |
| HP EliteBook 845 G9 6F6H9EA | |
| Final Fantasy XV Benchmark - 1920x1080 High Quality | |
| Moyenne de la classe Office (8.09 - 79.5, n=69, 2 dernières années) | |
| Lenovo ThinkPad T14s G3 21CQ002LGE | |
| Dell Latitude 9430 2-in-1 | |
| Lenovo ThinkPad T14s G3 21BR00CDGE | |
| HP EliteBook 845 G9 6F6H9EA | |
The Witcher 3 FPS Chart
| Bas | Moyen | Élevé | Ultra | |
|---|---|---|---|---|
| The Witcher 3 (2015) | 119.7 | 40.5 | 24.5 | |
| Dota 2 Reborn (2015) | 109.1 | 90.4 | 66.3 | 56.6 |
| Final Fantasy XV Benchmark (2018) | 58.7 | 30.4 | 21.7 | |
| X-Plane 11.11 (2018) | 50.7 | 38.6 | 31.2 | |
| Strange Brigade (2018) | 133.7 | 54.7 | 45.1 | 38.3 |
Émissions : ThinkPad T14s G3 avec un ventilateur presque silencieux
Niveaux de bruit
Lorsque nous avons commencé à tester les niveaux sonores du ThinkPad T14s G3, nous nous sommes d'abord demandé si le ventilateur fonctionnait, car l'ordinateur portable ThinkPad restait très silencieux. En mode veille, il reste totalement silencieux, et même notre test pour des charges moyennes ne provoque pas l'activation du ventilateur. Ce n'est qu'en cas de charge maximale que le refroidissement s'active enfin, mais même dans ce cas, il reste pratiquement silencieux avec seulement 27,3 dB(a). Tous les modèles de comparaison sans exception affichent des niveaux de bruit de ventilateur plus élevés.
Nous ne remarquons aucun ronronnement de la bobine dans le T14s Gen 3.
Degré de la nuisance sonore
| Au repos |
| 22.8 / 22.8 / 22.8 dB(A) |
| Fortement sollicité |
| 22.8 / 27.3 dB(A) |
 | ||
30 dB silencieux 40 dB(A) audible 50 dB(A) bruyant |
||
min: | ||
| Lenovo ThinkPad T14s G3 21CQ002LGE Radeon 680M, R7 PRO 6850U, SK Hynix PC711 512GB HFS512GDE9X081N | Lenovo ThinkPad T14s G3 21BR00CDGE Iris Xe G7 80EUs, i5-1235U, SK Hynix HFS512 GDE9X081N | Lenovo ThinkPad T14s G2 20XGS01100 Vega 8, R7 PRO 5850U, Lenovo UMIS AM630 RPETJ1T24MGE2QDQ | Dell Latitude 9430 2-in-1 Iris Xe G7 96EUs, i7-1265U | HP EliteBook 845 G9 6F6H9EA Radeon 660M, R5 PRO 6650U, Samsung PM991 MZVLQ512HBLU | |
|---|---|---|---|---|---|
| Noise | -16% | -21% | -26% | -23% | |
| arrêt / environnement * (dB) | 22.8 | 24.6 -8% | 26.81 -18% | 23.7 -4% | 24 -5% |
| Idle Minimum * (dB) | 22.8 | 24.6 -8% | 26.81 -18% | 23.7 -4% | 24 -5% |
| Idle Average * (dB) | 22.8 | 24.6 -8% | 26.81 -18% | 23.7 -4% | 25 -10% |
| Idle Maximum * (dB) | 22.8 | 24.6 -8% | 26.81 -18% | 23.7 -4% | 26 -14% |
| Load Average * (dB) | 22.8 | 26.1 -14% | 30.16 -32% | 35.1 -54% | 34 -49% |
| Witcher 3 ultra * (dB) | 27.5 | 35.9 -31% | 43.3 -57% | 38 -38% | |
| Load Maximum * (dB) | 27.3 | 36.3 -33% | 33.98 -24% | 43 -58% | 38 -39% |
* ... Moindre est la valeur, meilleures sont les performances
Température
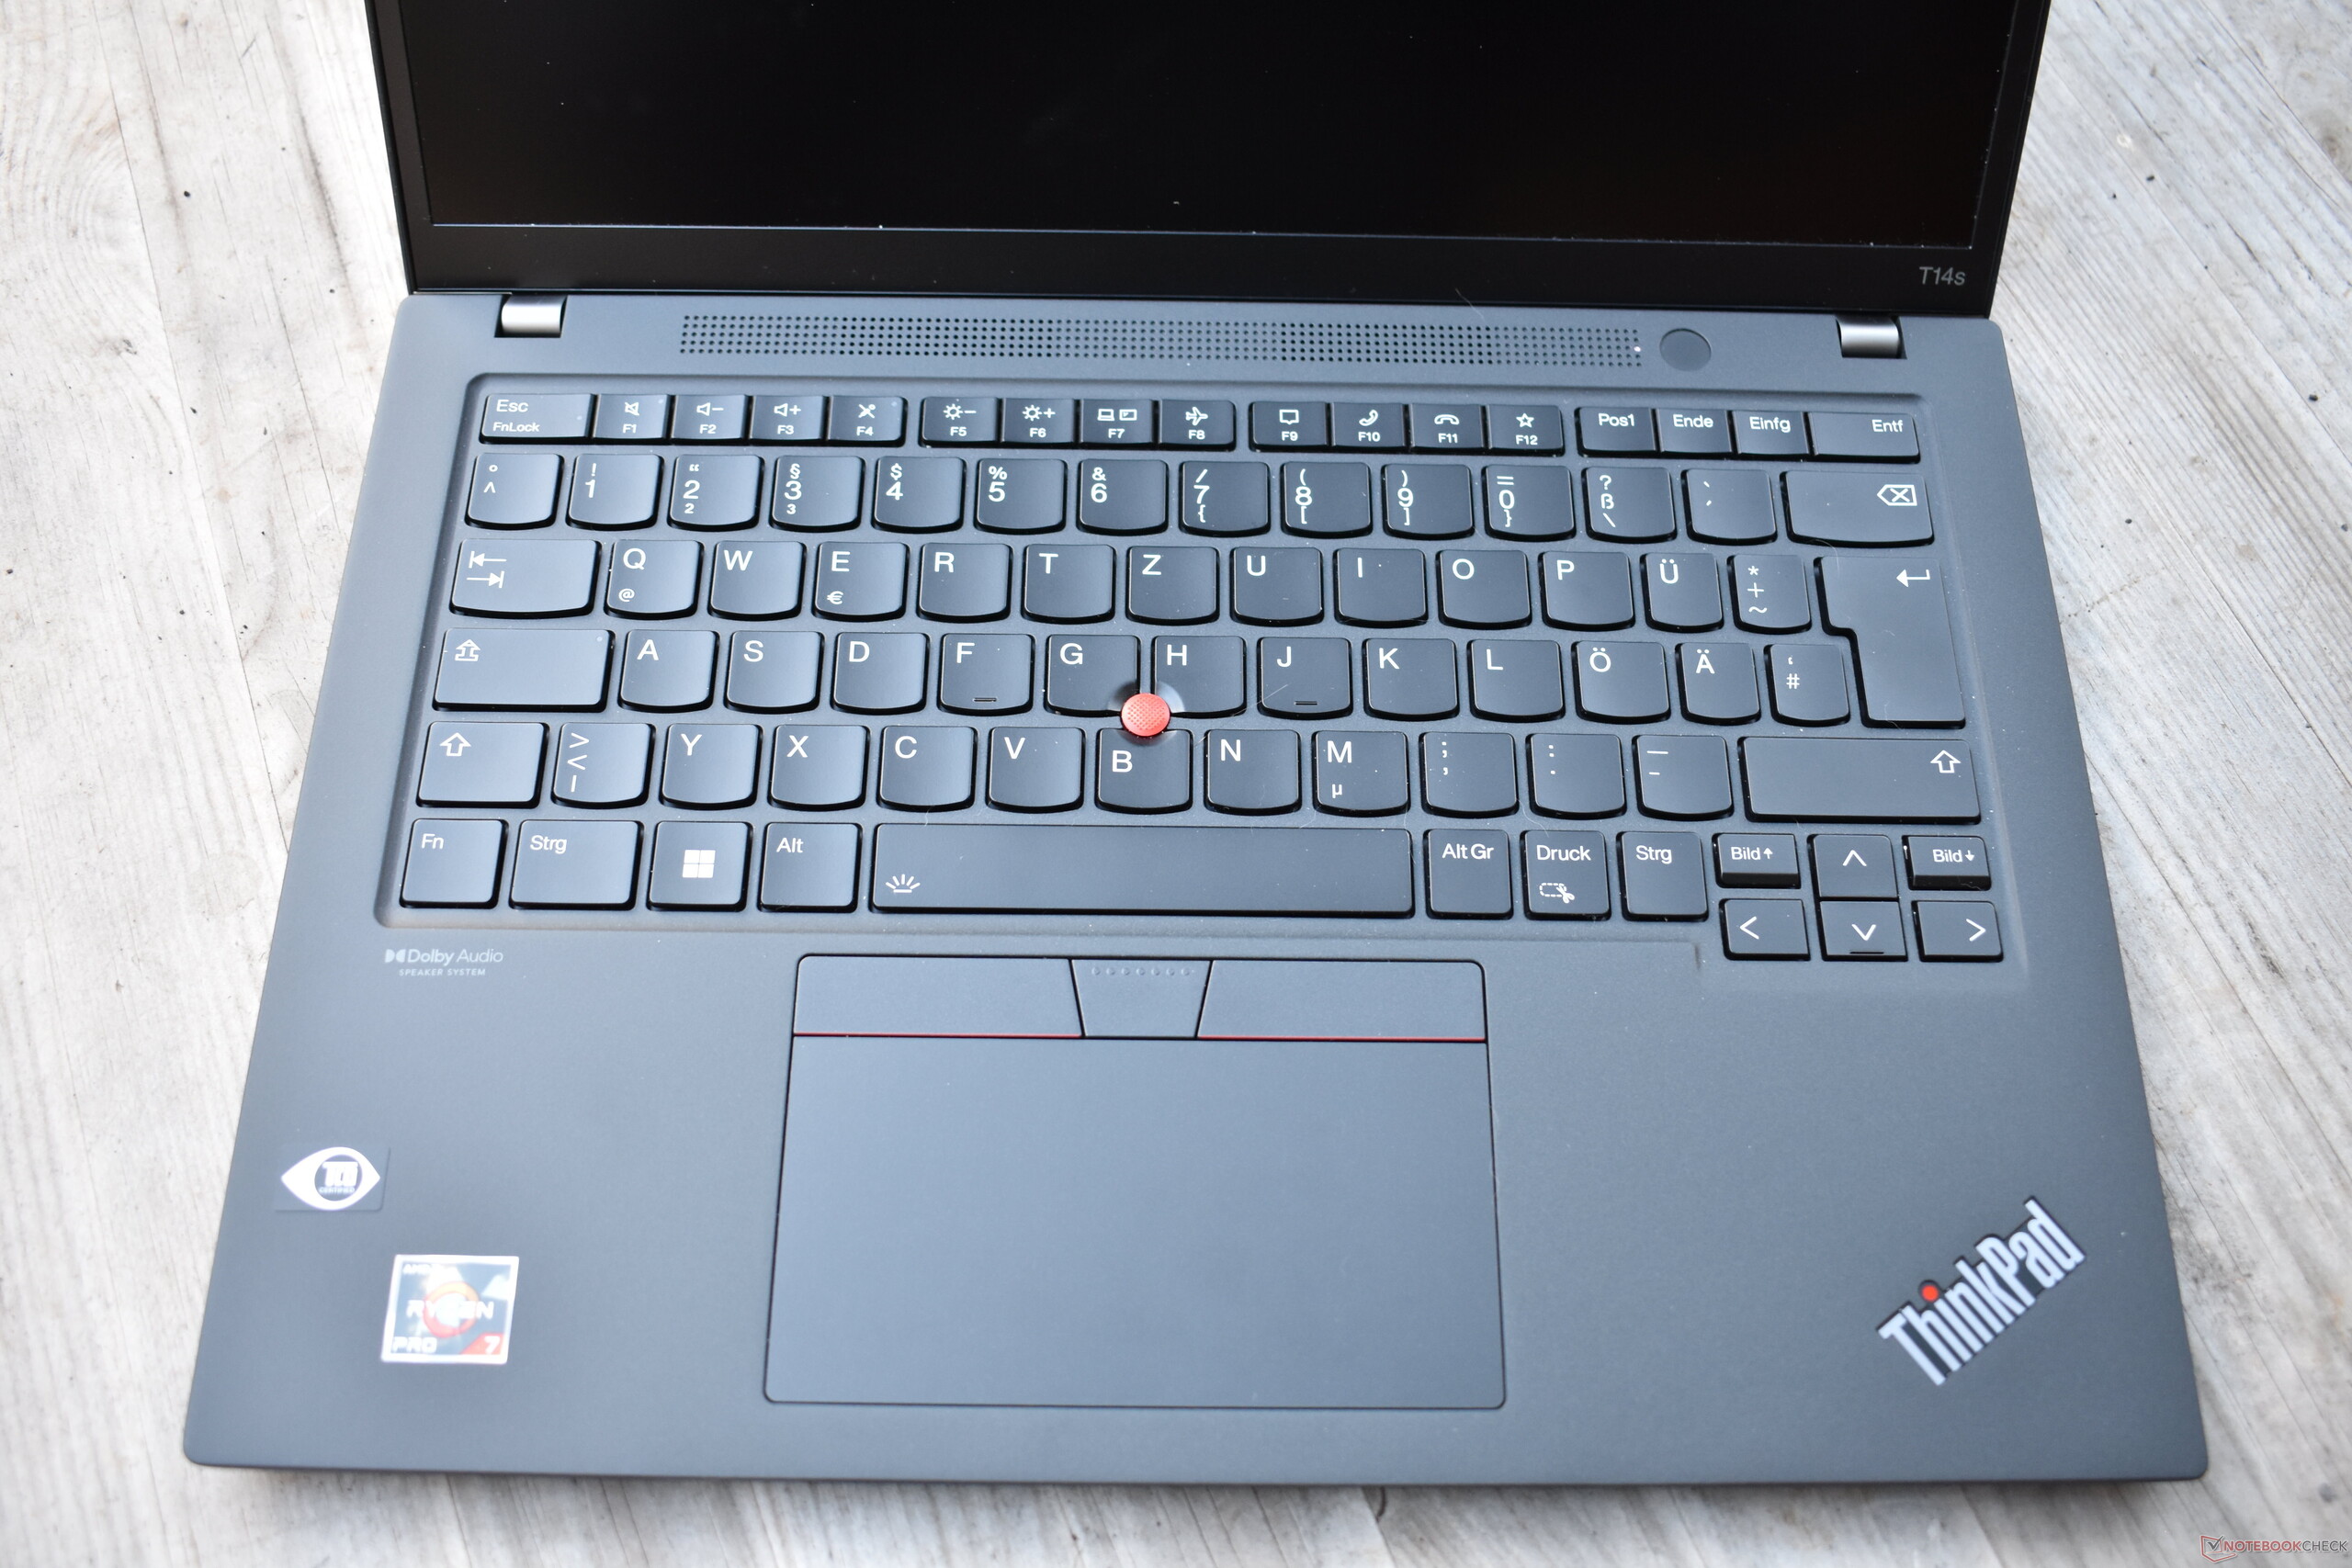
En règle générale, le Lenovo ThinkPad T14s Gen 3 reste très frais, et même en charge, presque aucun des points de mesure ne dépasse la barre des 40 degrés Celsius (104 °F). La seule exception est la zone située au centre du clavier, autour du TrackPoint, où l'espace entre les touches atteint des températures comprises entre 47,7 et 49,2 °C (118 - 120 °F). Sur une note positive, le repose-poignets reste confortablement frais dans tous les cas.
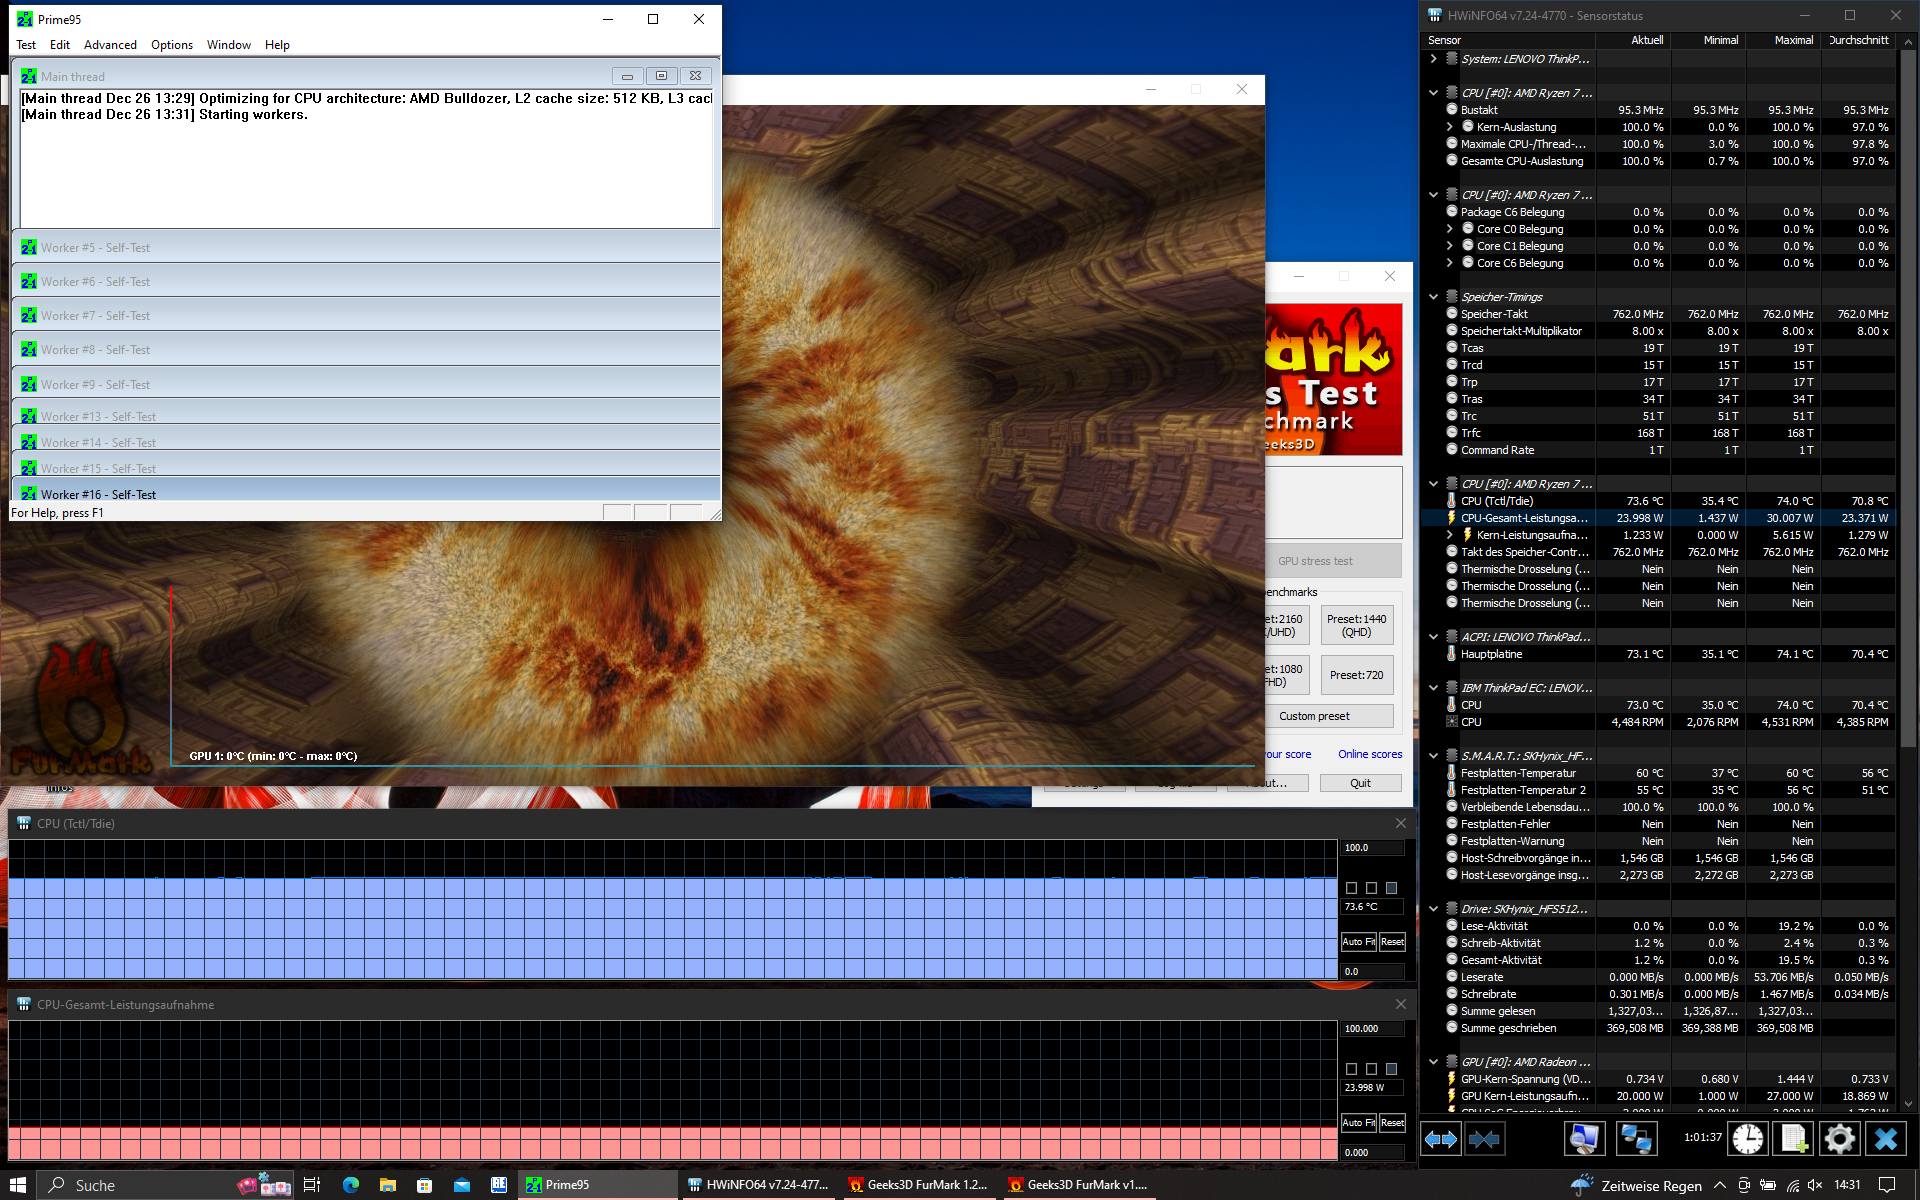
Nous n'avons constaté aucun ralentissement pendant le test de stress. Même après une heure, le processeur est capable de maintenir sa limite de consommation à long terme de 24 watts.
(-) La température maximale du côté supérieur est de 49.2 °C / 121 F, par rapport à la moyenne de 34.3 °C / 94 F, allant de 21.2 à 62.5 °C pour la classe Office.
(+) Le fond chauffe jusqu'à un maximum de 37.2 °C / 99 F, contre une moyenne de 36.8 °C / 98 F
(+) En utilisation inactive, la température moyenne du côté supérieur est de 25.2 °C / 77 F, par rapport à la moyenne du dispositif de 29.5 °C / 85 F.
(±) En jouant à The Witcher 3, la température moyenne du côté supérieur est de 34.7 °C / 94 F, alors que la moyenne de l'appareil est de 29.5 °C / 85 F.
(+) Les repose-poignets et le pavé tactile sont plus froids que la température de la peau avec un maximum de 28.2 °C / 82.8 F et sont donc froids au toucher.
(±) La température moyenne de la zone de l'appui-paume de dispositifs similaires était de 27.5 °C / 81.5 F (-0.7 °C / #-1.3 F).
| Lenovo ThinkPad T14s G3 21CQ002LGE AMD Ryzen 7 PRO 6850U, AMD Radeon 680M | Lenovo ThinkPad T14s G3 21BR00CDGE Intel Core i5-1235U, Intel Iris Xe Graphics G7 80EUs | Lenovo ThinkPad T14s G2 20XGS01100 AMD Ryzen 7 PRO 5850U, AMD Radeon RX Vega 8 (Ryzen 4000/5000) | Dell Latitude 9430 2-in-1 Intel Core i7-1265U, Intel Iris Xe Graphics G7 96EUs | HP EliteBook 845 G9 6F6H9EA AMD Ryzen 5 PRO 6650U, AMD Radeon 660M | |
|---|---|---|---|---|---|
| Heat | -1% | 2% | 11% | -0% | |
| Maximum Upper Side * (°C) | 49.2 | 43.6 11% | 44.2 10% | 39.2 20% | 44 11% |
| Maximum Bottom * (°C) | 37.2 | 42 -13% | 38.9 -5% | 44.8 -20% | 45 -21% |
| Idle Upper Side * (°C) | 31.1 | 28.1 10% | 27.7 11% | 21.4 31% | 27 13% |
| Idle Bottom * (°C) | 26 | 28.9 -11% | 28.3 -9% | 22.4 14% | 27 -4% |
* ... Moindre est la valeur, meilleures sont les performances
Haut-parleurs
Les haut-parleurs sont un aspect où le ThinkPad série T est clairement surpassé par les modèles haut de gamme de la série X1. Les haut-parleurs stéréo situés au-dessus du clavier produisent un son équilibré dans les médiums et les aigus mais aussi très silencieux, manquant de basses.
Lenovo ThinkPad T14s G3 21CQ002LGE analyse audio
(-) | haut-parleurs pas très forts (70.2 dB)
Basses 100 - 315 Hz
(-) | presque aucune basse - en moyenne 16.8% plus bas que la médiane
(±) | la linéarité des basses est moyenne (14.6% delta à la fréquence précédente)
Médiums 400 - 2000 Hz
(+) | médiane équilibrée - seulement 2.3% de la médiane
(+) | les médiums sont linéaires (5.4% delta à la fréquence précédente)
Aiguës 2 - 16 kHz
(+) | des sommets équilibrés - à seulement 1.6% de la médiane
(+) | les aigus sont linéaires (3.5% delta à la fréquence précédente)
Globalement 100 - 16 000 Hz
(±) | la linéarité du son global est moyenne (15.7% de différence avec la médiane)
Par rapport à la même classe
» 16% de tous les appareils testés de cette catégorie étaient meilleurs, 5% similaires, 79% pires
» Le meilleur avait un delta de 7%, la moyenne était de 21%, le pire était de 53%.
Par rapport à tous les appareils testés
» 24% de tous les appareils testés étaient meilleurs, 5% similaires, 71% pires
» Le meilleur avait un delta de 4%, la moyenne était de 24%, le pire était de 134%.
Lenovo ThinkPad X1 Carbon G10 21CC001RGE analyse audio
(±) | le niveau sonore du haut-parleur est moyen mais bon (75.09# dB)
Basses 100 - 315 Hz
(±) | basse réduite - en moyenne 13.2% inférieure à la médiane
(-) | les basses ne sont pas linéaires (16% delta à la fréquence précédente)
Médiums 400 - 2000 Hz
(+) | médiane équilibrée - seulement 2.8% de la médiane
(+) | les médiums sont linéaires (3.6% delta à la fréquence précédente)
Aiguës 2 - 16 kHz
(+) | des sommets équilibrés - à seulement 2.7% de la médiane
(+) | les aigus sont linéaires (4.1% delta à la fréquence précédente)
Globalement 100 - 16 000 Hz
(+) | le son global est linéaire (13.7% différence à la médiane)
Par rapport à la même classe
» 8% de tous les appareils testés de cette catégorie étaient meilleurs, 4% similaires, 88% pires
» Le meilleur avait un delta de 7%, la moyenne était de 21%, le pire était de 53%.
Par rapport à tous les appareils testés
» 15% de tous les appareils testés étaient meilleurs, 4% similaires, 81% pires
» Le meilleur avait un delta de 4%, la moyenne était de 24%, le pire était de 134%.
Gestion de l'énergie : AMD Ryzen 6000 assure une haute efficacité
Consommation d'énergie
Le Lenovo ThinkPad T14s G3 AMD est un ordinateur portable extrêmement efficace. Par rapport au ThinkPad T14s G3 Intel, il est environ 8 % plus efficace en moyenne. L'écart avec le HP EliteBook 845 G9, qui consomme 22 % d'énergie en plus en moyenne, est encore plus grand.
L'ordinateur portable ThinkPad consomme un maximum d'environ 48,5 watts, de sorte que sa consommation d'énergie est plus que couverte par son chargeur de 65 watts.
| Éteint/en veille | |
| Au repos | |
| Fortement sollicité |
|
Légende:
min: | |
| Lenovo ThinkPad T14s G3 21CQ002LGE R7 PRO 6850U, Radeon 680M, SK Hynix PC711 512GB HFS512GDE9X081N, LTPS IPS LED, 1920x1200, 14" | Lenovo ThinkPad T14s G3 21BR00CDGE i5-1235U, Iris Xe G7 80EUs, SK Hynix HFS512 GDE9X081N, IPS LED, 1920x1200, 14" | Lenovo ThinkPad T14s G2 20XGS01100 R7 PRO 5850U, Vega 8, Lenovo UMIS AM630 RPETJ1T24MGE2QDQ, IPS LED, 1920x1080, 14" | Dell Latitude 9430 2-in-1 i7-1265U, Iris Xe G7 96EUs, , IPS, 2560x1600, 14" | HP EliteBook 845 G9 6F6H9EA R5 PRO 6650U, Radeon 660M, Samsung PM991 MZVLQ512HBLU, IPS, 1920x1200, 14" | Moyenne AMD Radeon 680M | Moyenne de la classe Office | |
|---|---|---|---|---|---|---|---|
| Power Consumption | -8% | -15% | -27% | -22% | -106% | -59% | |
| Idle Minimum * (Watt) | 2.2 | 2.3 -5% | 3.16 -44% | 2.9 -32% | 3 -36% | 6.93 ? -215% | 4.41 ? -100% |
| Idle Average * (Watt) | 4.4 | 4.6 -5% | 5.6 -27% | 5.8 -32% | 5 -14% | 8.98 ? -104% | 7.37 ? -67% |
| Idle Maximum * (Watt) | 5.1 | 5.6 -10% | 7.13 -40% | 6.6 -29% | 9 -76% | 10.5 ? -106% | 8.58 ? -68% |
| Load Average * (Watt) | 33.3 | 37.1 -11% | 30.86 7% | 49.2 -48% | 41 -23% | 53.5 ? -61% | 43 ? -29% |
| Witcher 3 ultra * (Watt) | 40.1 | 32.8 18% | 37 8% | 35.3 12% | 32.6 19% | ||
| Load Maximum * (Watt) | 48.5 | 65.8 -36% | 46.55 4% | 63.1 -30% | 50 -3% | 70.5 ? -45% | 64.6 ? -33% |
* ... Moindre est la valeur, meilleures sont les performances
Power Consumption The Witcher 3 / Stress Test
Power Consumption With External Monitor
Autonomie de la batterie
Tous les modèles ThinkPad T14s, indépendamment de leur génération et du processeur qu'ils utilisent, ont une batterie d'une capacité de 57 Wh. Avec cette batterie interne, l'ordinateur portable Lenovo atteint une autonomie d'environ 12 heures dans le test WiFi avec une luminosité d'écran de 150 cd/m². Il est intéressant de noter que ce résultat est inférieur à celui duThinkPad T14s G2 AMDmais aussi nettement plus long que le ThinkPad T14s G3 Intel T14s G3 Intelqui durait moins de 10 heures.
| Lenovo ThinkPad T14s G3 21CQ002LGE R7 PRO 6850U, Radeon 680M, 57 Wh | Lenovo ThinkPad T14s G3 21BR00CDGE i5-1235U, Iris Xe G7 80EUs, 57 Wh | Lenovo ThinkPad T14s G2 20XGS01100 R7 PRO 5850U, Vega 8, 57 Wh | Dell Latitude 9430 2-in-1 i7-1265U, Iris Xe G7 96EUs, 60 Wh | HP EliteBook 845 G9 6F6H9EA R5 PRO 6650U, Radeon 660M, 51 Wh | Moyenne de la classe Office | |
|---|---|---|---|---|---|---|
| Autonomie de la batterie | -34% | -5% | 2% | 1% | -10% | |
| WiFi v1.3 (h) | 12 | 9.6 -20% | 14.6 22% | 12.8 7% | 12.1 1% | 12.9 ? 8% |
| Load (h) | 2.5 | 1.3 -48% | 1.7 -32% | 2.4 -4% | 1.794 ? -28% |
Points positifs
Points négatifs
Verdict : le Lenovo ThinkPad T14s G3 est un gagnant

S'il y avait un ordinateur portable correspondant au ThinkPad X1 Carbon G10avec un CPU AMD, le Lenovo ThinkPad T14s Gen 3 AMD n'en serait pas loin. C'est le modèle qui se rapproche le plus de cette idée.
La combinaison des CPU AMD Ryzen de la série 6000 et de la plateforme T14s est une grande réussite. Il s'agit d'un ordinateur portable Lenovo qui n'a pratiquement aucune faiblesse, à part l'évolutivité et quelques points faibles au niveau de l'affichage à faible consommation. Il est relativement léger et compact, tout en restant robuste, grâce à la combinaison de métaux légers et de fibres de carbone. Le ThinkPad T14s G3 offre des équipements adaptés aux entreprises, notamment l'USB 4, de très bons périphériques de saisie et un écran mat et lumineux. Le Ryzen 7 Pro offre des performances élevées sans trop augmenter la consommation d'énergie. Il en résulte une bonne autonomie et un ventilateur qui reste presque toujours silencieux.
Compact, robuste, rapide et doté d'une longue autonomie : le Lenovo ThinkPad T14s Gen 3 AMD a de nombreux atouts
Il n'est donc pas surprenant que le Lenovo ThinkPad T14s G3 obtienne une très bonne évaluation d'environ 91 %. Avec cela, il est bien positionné sur le marché des entreprises. Les plus grands concurrents viennent de HP sous la forme du HP EliteBook 845 G9et de Dell avec leDell Latitude 9430 2-en-1. Par rapport à ses concurrents, le ThinkPad impressionne surtout par son poids inférieur, sa plus grande autonomie et ses ventilateurs nettement plus silencieux.
Prix et disponibilité
Le Lenovo ThinkPad T14s G3 AMD est disponible directement auprès de Lenovo à partir d'environ 984 $. Une configuration similaire à notre unité de test est également disponible sur B&H pour environ 199 $par exemple.
Lenovo ThinkPad T14s G3 21CQ002LGE
- 01/17/2023 v7 (old)
Benjamin Herzig
Price comparison

