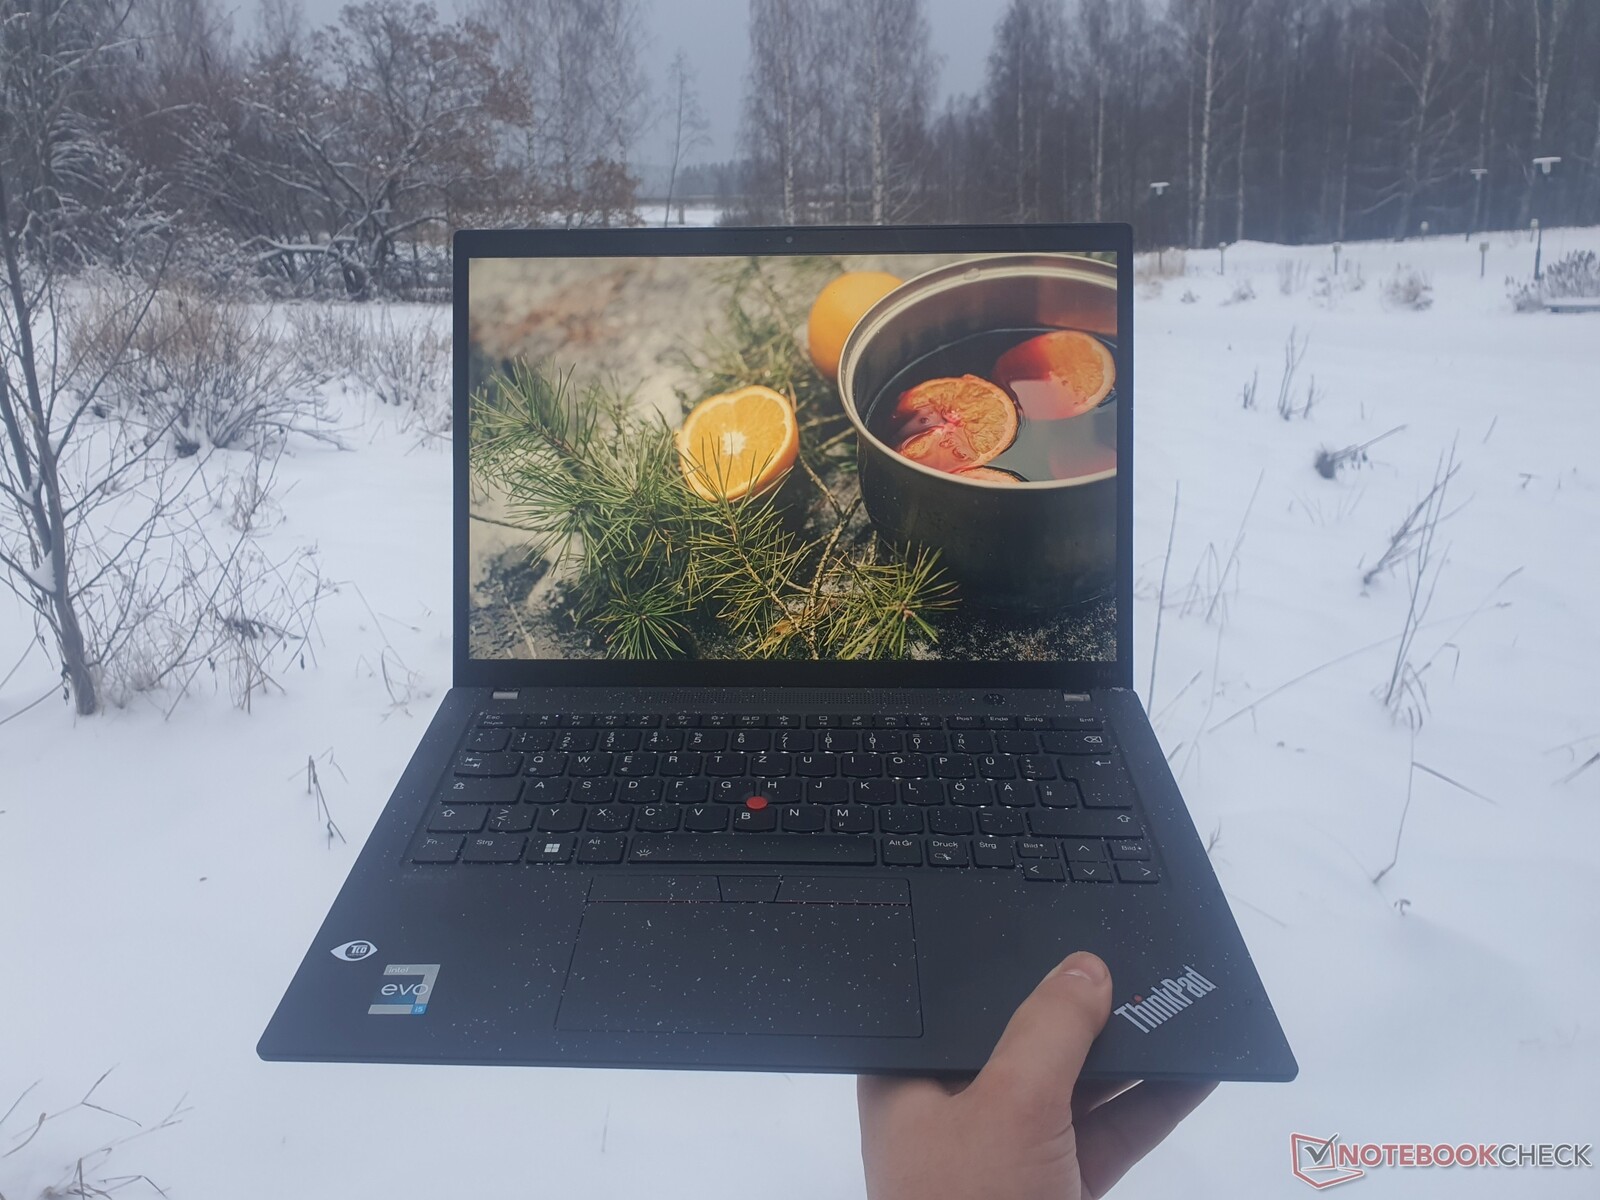
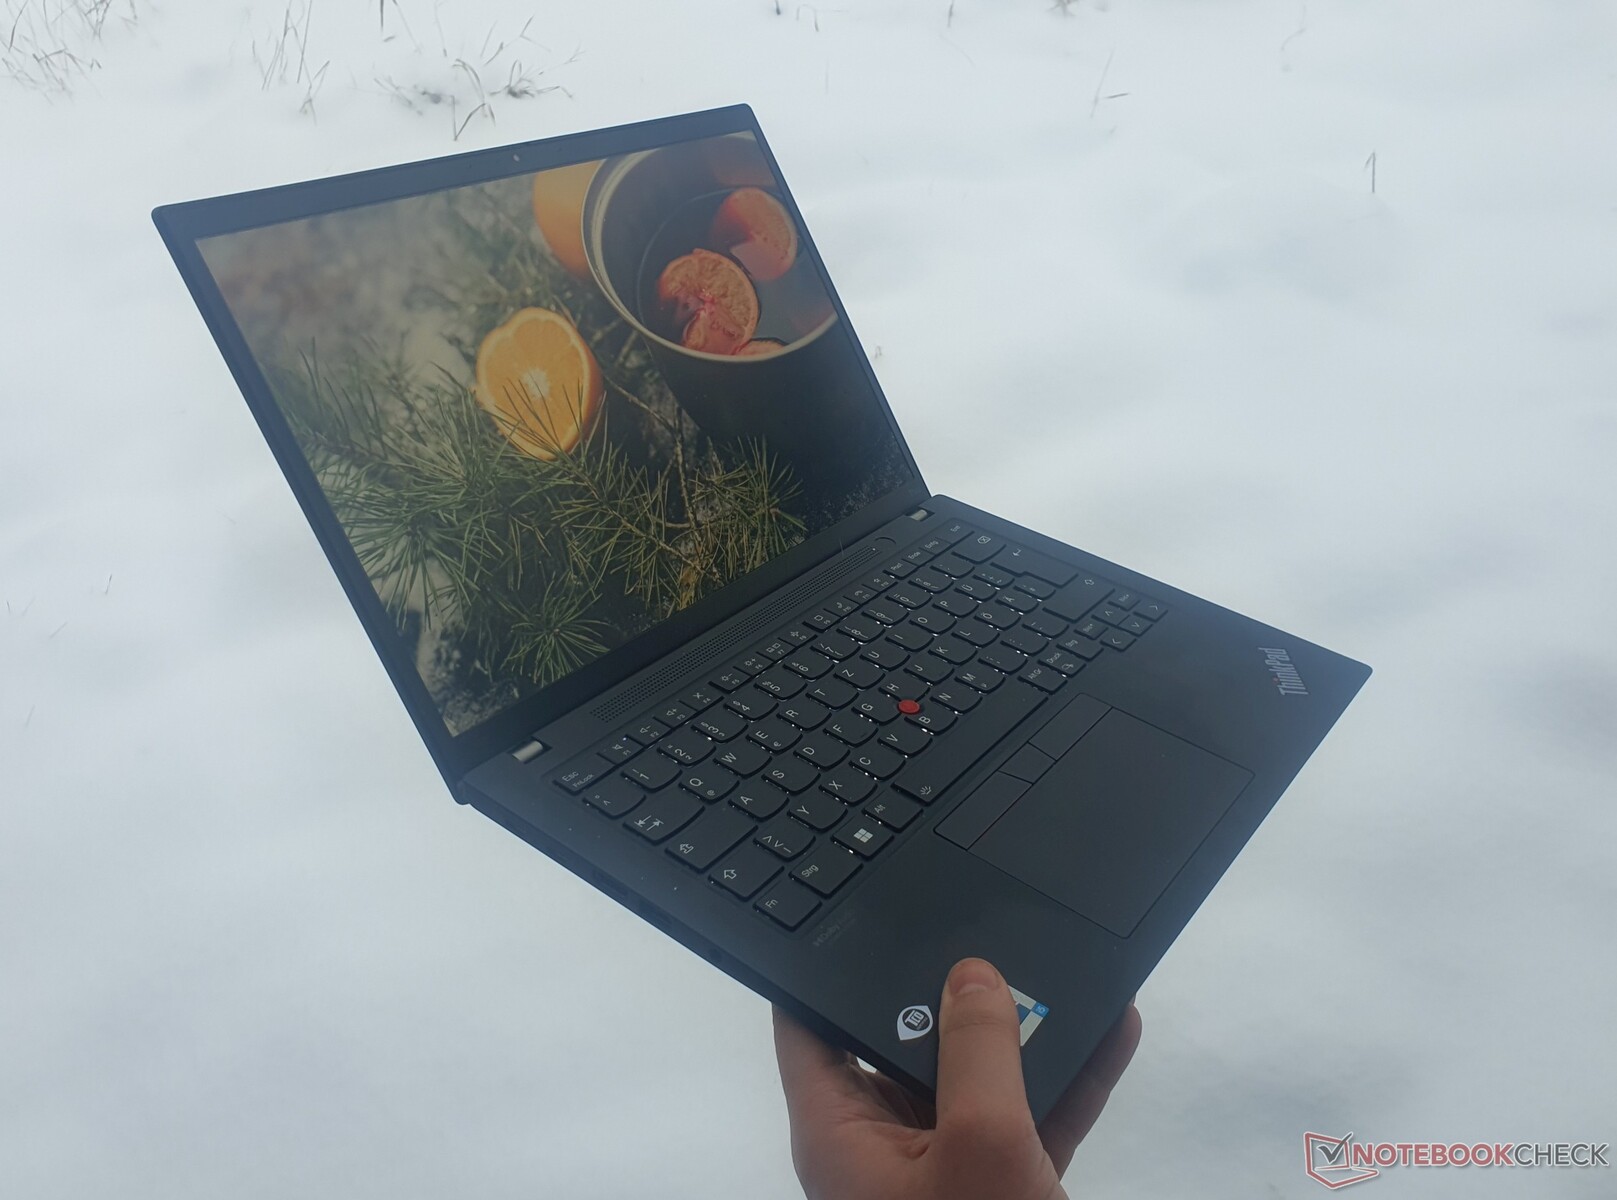
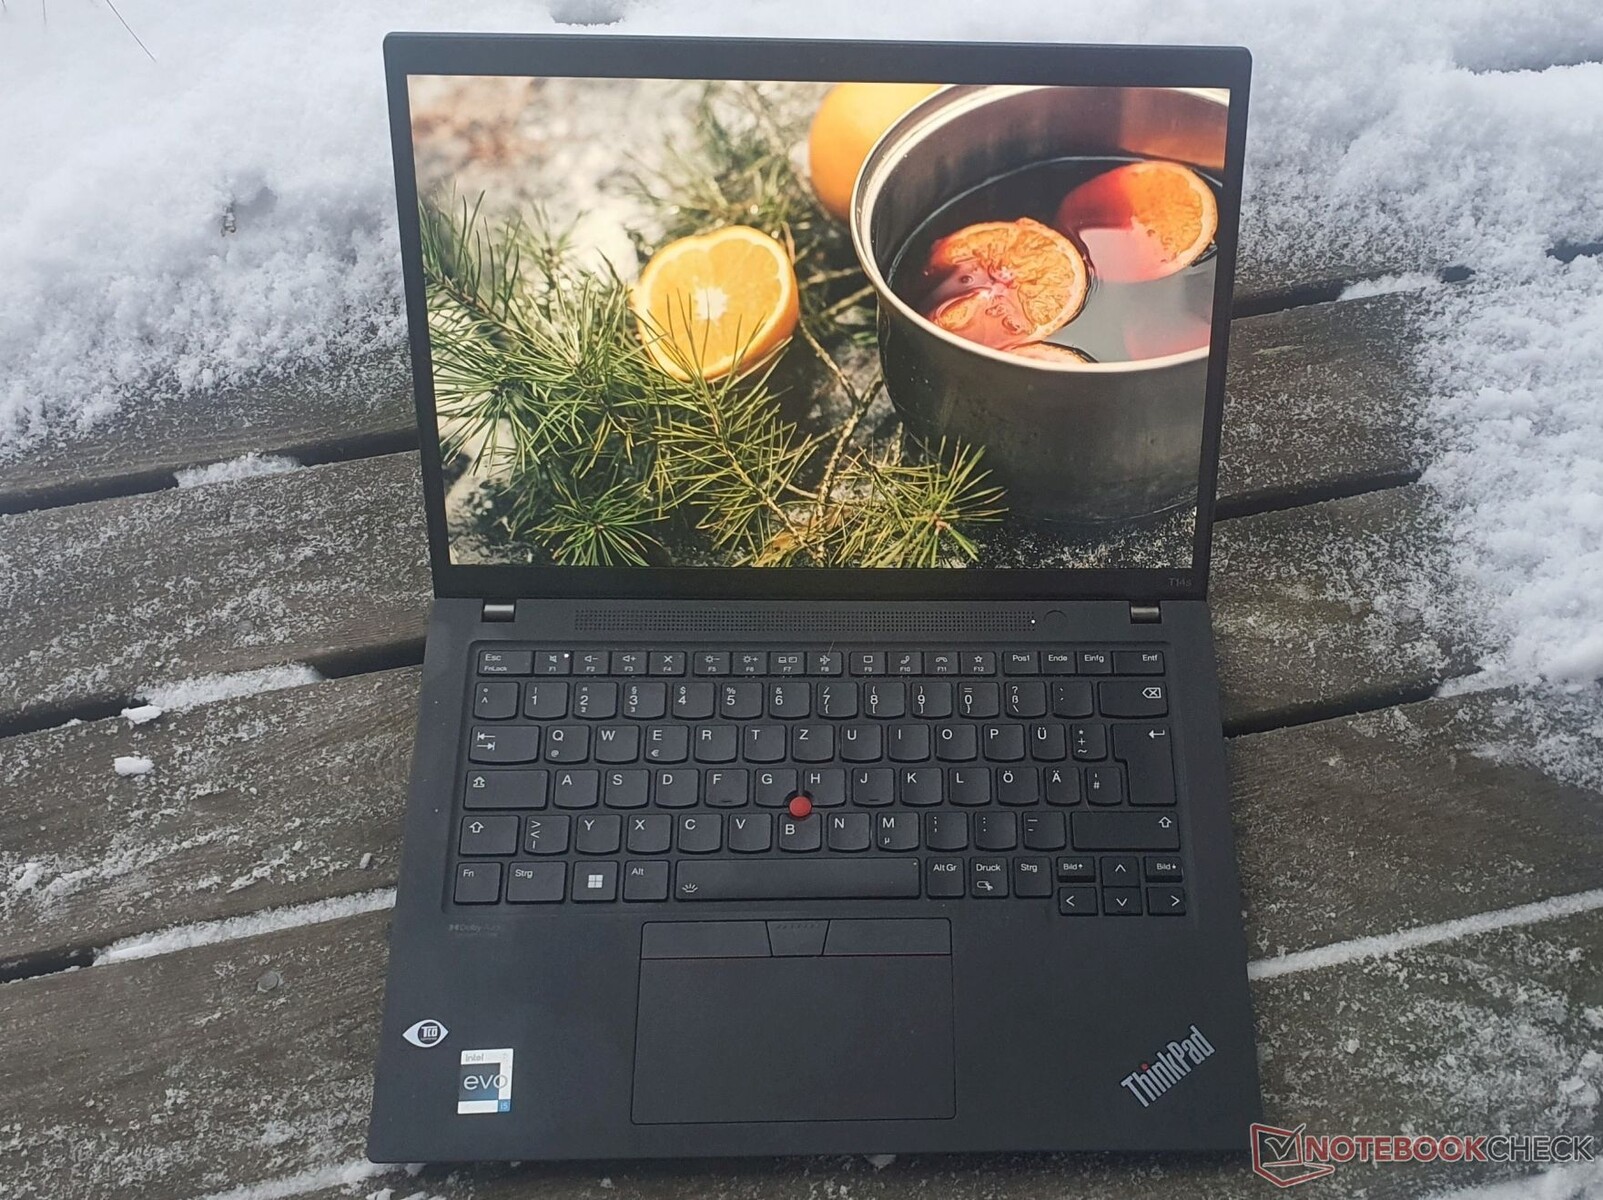
Test du Lenovo ThinkPad T14s G3 Intel : silencieux, efficace et rapide

Le dernier ThinkPad T14s G3 a finalement reçu un écran 16:10 et même une option OLED 3K très attendue dans le cadre de la refonte de Lenovo. De plus, il est maintenant équipé d'un processeur Intel avec un TDP de 28W (au lieu de 15W). Toutes ces caractéristiques sont regroupées dans un châssis compact et robuste qui est également léger (le poids varie selon la configuration). Dans l'ensemble, le T14s G3 ressemble davantage au ThinkPad X1 Carbontandis que le ThinkPad T14 est tout aussi compact.
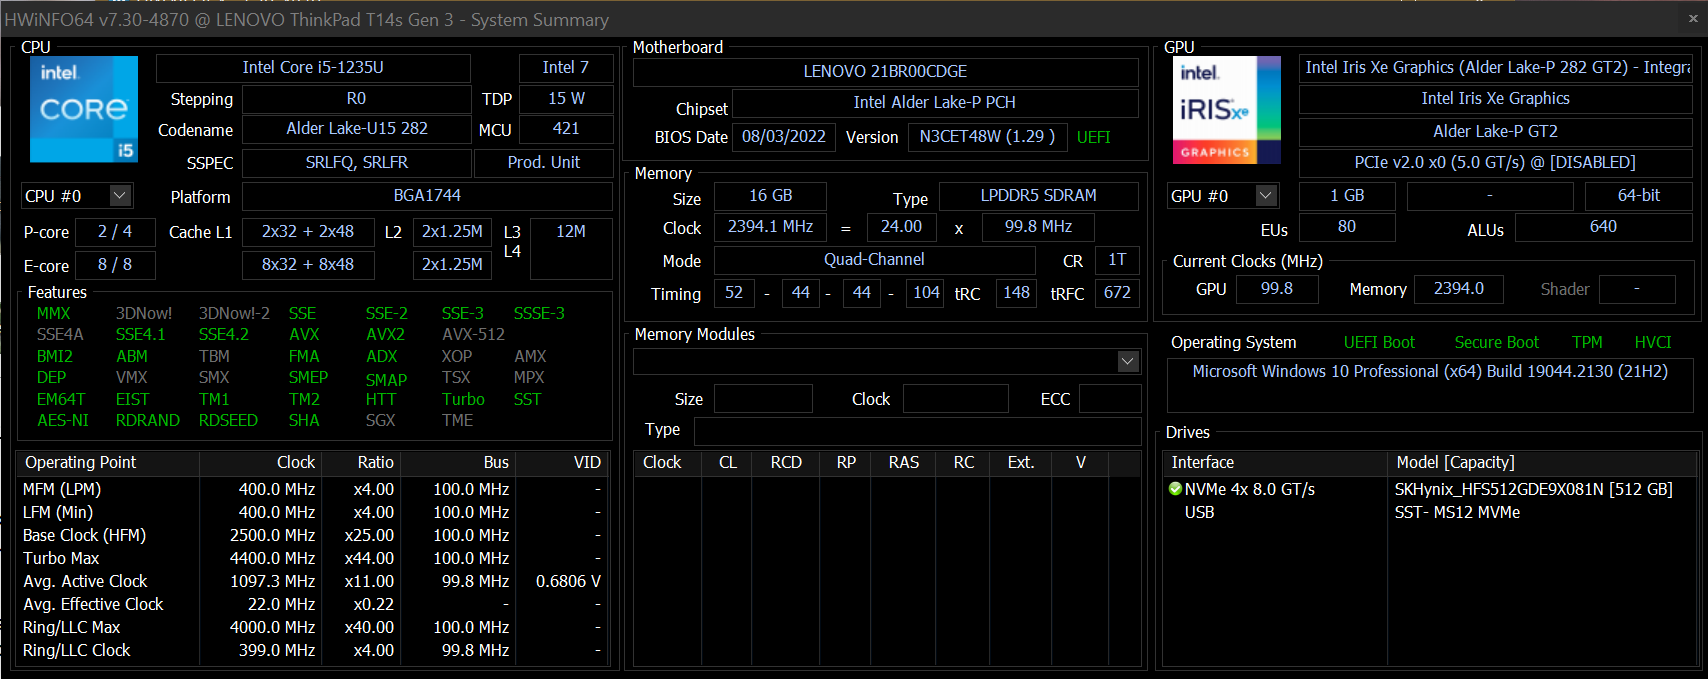
Notre unité de test est équipée de l'efficace Core i5-1235U16 Go de RAM LPDDR5 rapide, un SSD PCIe 4.0 avec 512 Go de stockage et un écran FHD+ à faible consommation. Cette configuration coûte 1 699 € (1 800 $ US) après la réduction accordée par Lenovo aux étudiants. Dans cet article, nous allons voir si ces composants peuvent transformer le T14s G3 en un système efficace, à égalité avec un ordinateur portable basé sur AMD.
Si l'on exclut les autres appareils Lenovo, le ThinkPad haut de gamme est en concurrence avec des ordinateurs portables tels que le HP EliteBook 845 G9, Dell Latitude 7420 et Schenker Vision 14. Au fil de cet article, vous découvrirez s'il s'agit d'alternatives viables aux ThinkPad.
Comparaison avec les concurrents potentiels
Note | Date | Modèle | Poids | Épaisseur | Taille | Résolution | Prix |
|---|---|---|---|---|---|---|---|
| 89.1 % v7 (old) | 12/22 | Lenovo ThinkPad T14s G3 21BR00CDGE i5-1235U, Iris Xe G7 80EUs | 1.3 kg | 16.9 mm | 14.00" | 1920x1200 | |
| 89.4 % v7 (old) | 07/21 | Lenovo ThinkPad T14s G2 20WM003TGE i7-1165G7, Iris Xe G7 96EUs | 1.3 kg | 16.14 mm | 14.00" | 1920x1080 | |
| 88.8 % v7 (old) | 09/22 | Lenovo ThinkPad T14 G3-21CF004NGE R7 PRO 6850U, Radeon 680M | 1.4 kg | 17.9 mm | 14.00" | 1920x1200 | |
| 90.2 % v7 (old) | 06/22 | Lenovo ThinkPad X1 Carbon G10 21CC001RGE i5-1250P, Iris Xe G7 80EUs | 1.2 kg | 15.36 mm | 14.00" | 1920x1200 | |
| 89.4 % v7 (old) | 11/22 | Lenovo ThinkPad X13 G3 21BN0046GE i5-1235U, Iris Xe G7 80EUs | 1.3 kg | 18.9 mm | 13.30" | 1920x1200 | |
| 88.6 % v7 (old) | 11/22 | HP EliteBook 845 G9 6F6H9EA R5 PRO 6650U, Radeon 660M | 1.4 kg | 19 mm | 14.00" | 1920x1200 | |
| 90.1 % v7 (old) | 04/22 | Dell Latitude 7420 JW6MH i5-1145G7, Iris Xe G7 80EUs | 1.3 kg | 17.3 mm | 14.00" | 1920x1080 | |
| 88.8 % v7 (old) | 10/22 | Schenker Vision 14 2022 RTX 3050 Ti i7-12700H, GeForce RTX 3050 Ti Laptop GPU | 1.3 kg | 16.6 mm | 14.00" | 2880x1800 |
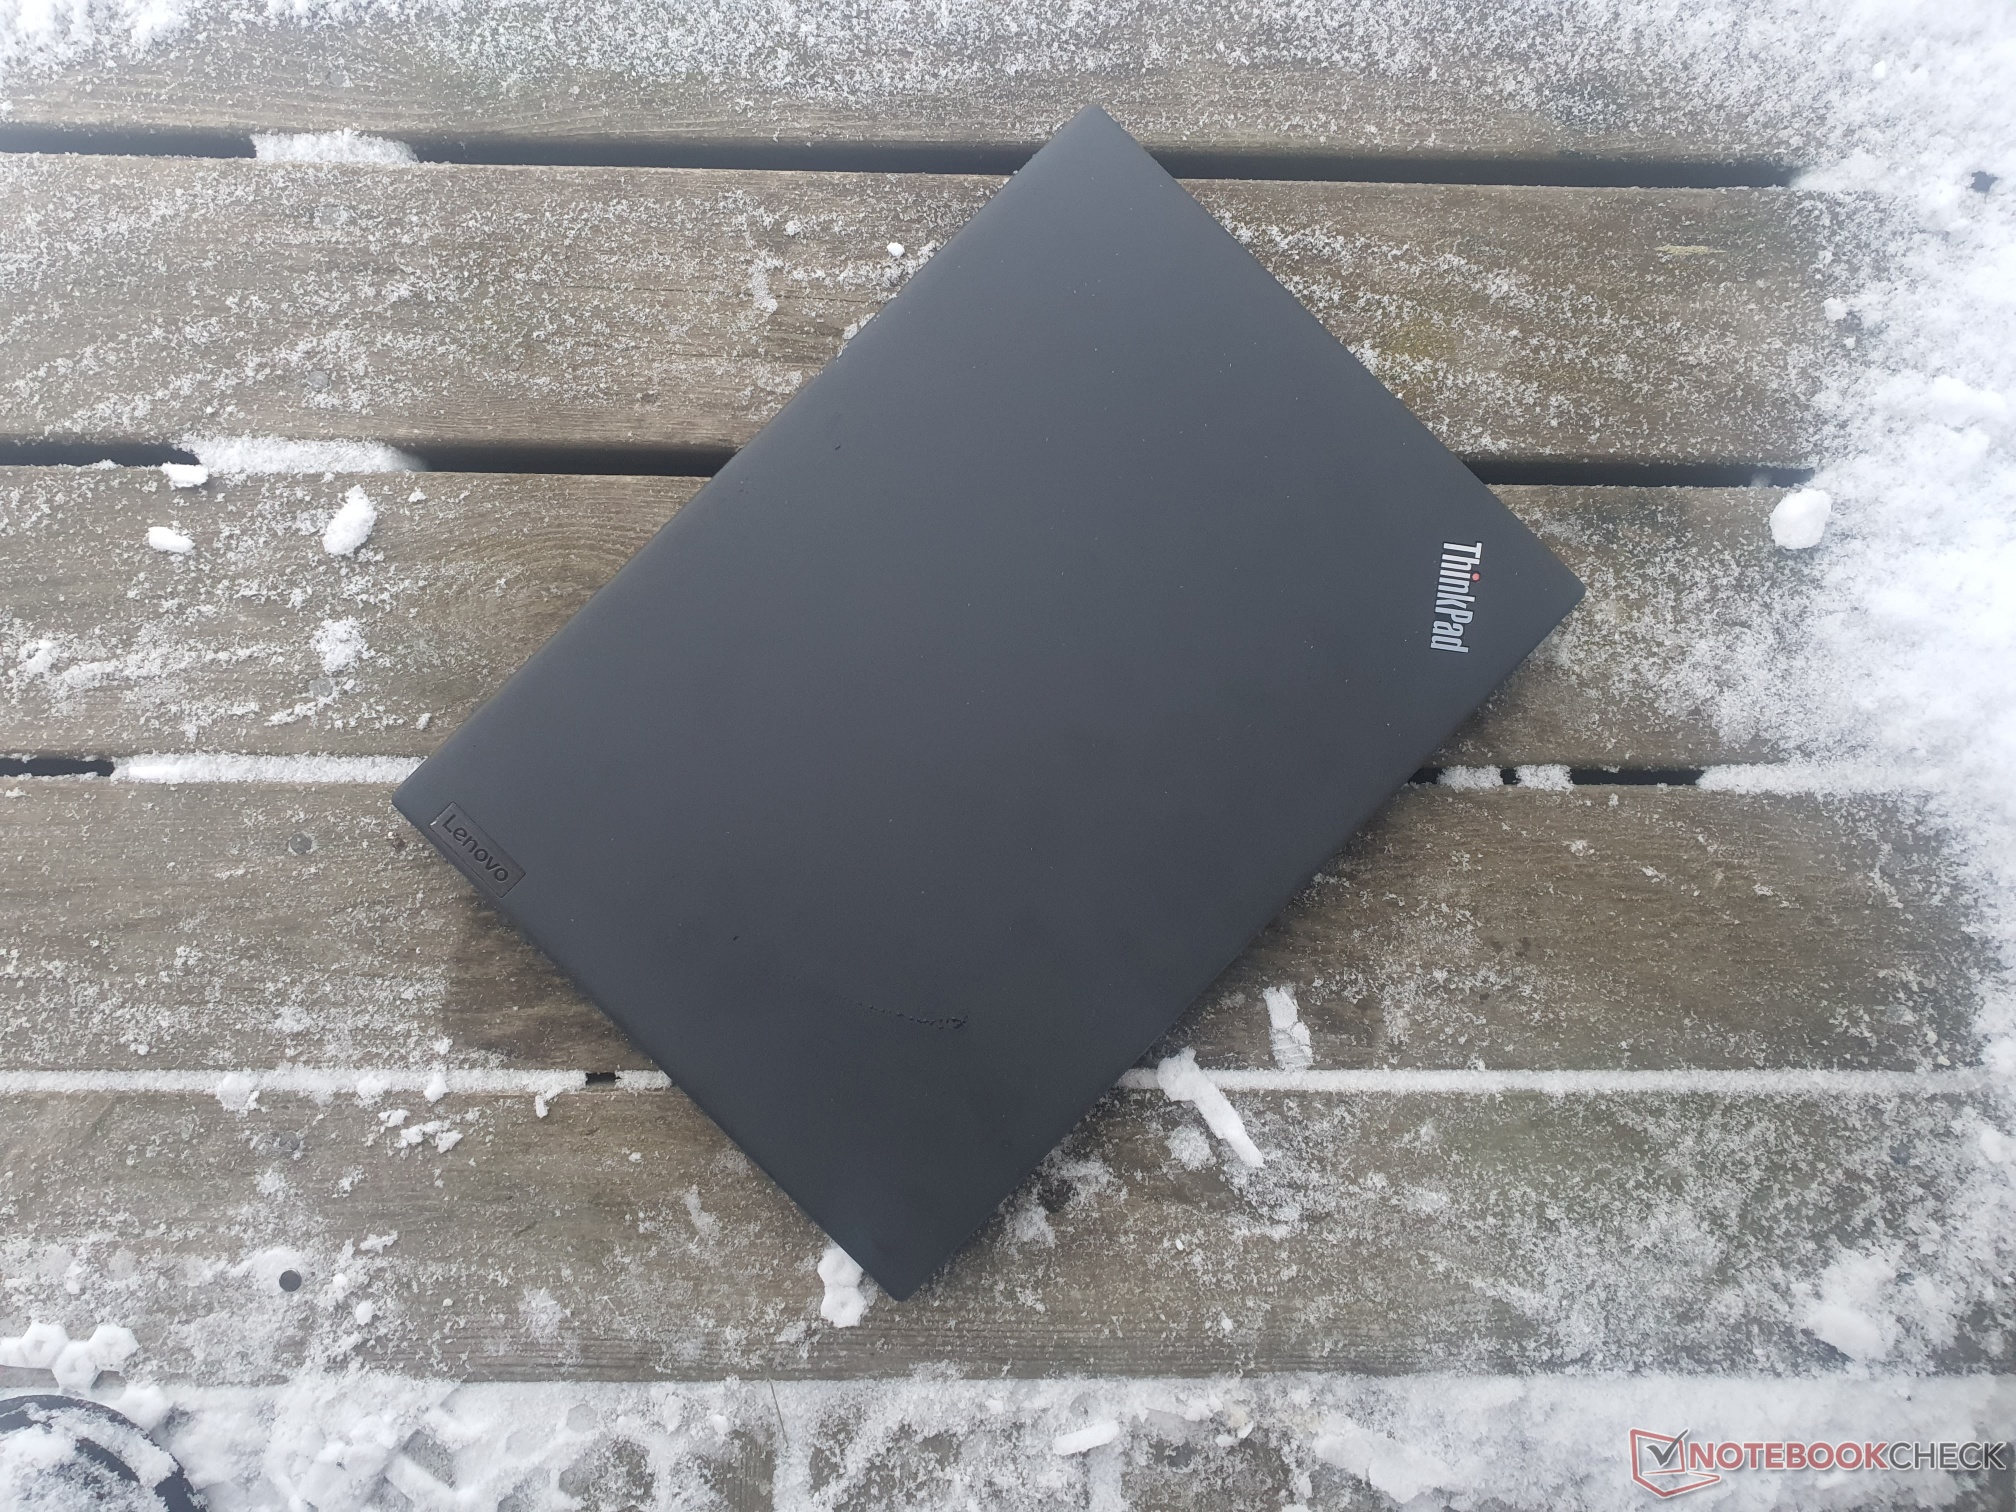
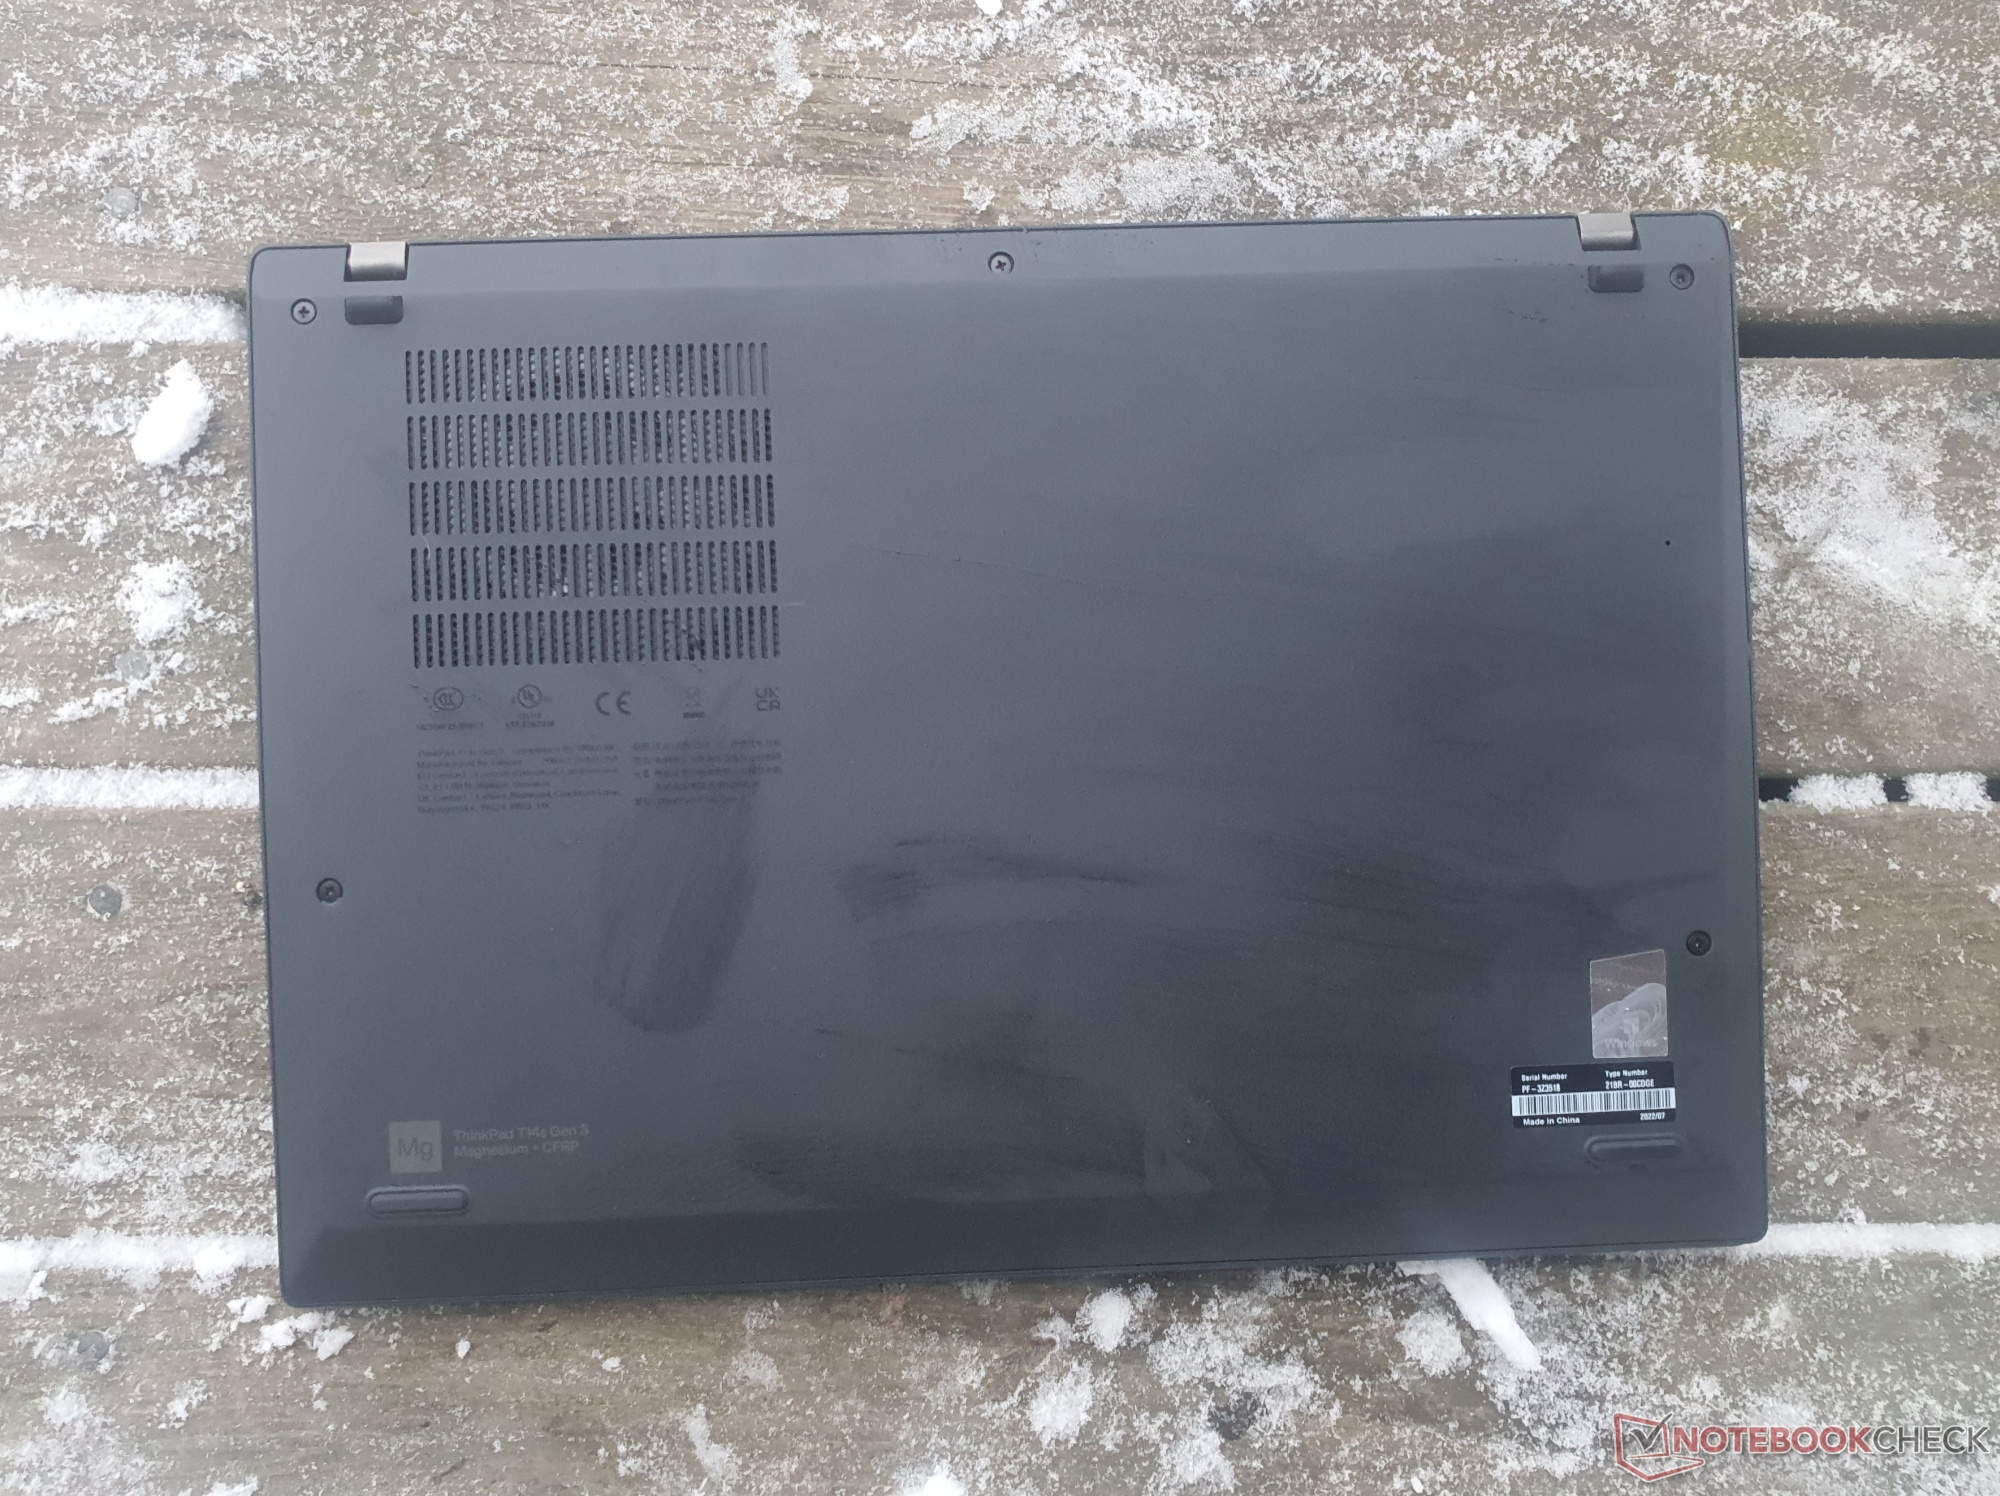
Boîtier : Compact et robuste grâce à sa conception en carbone et en métal
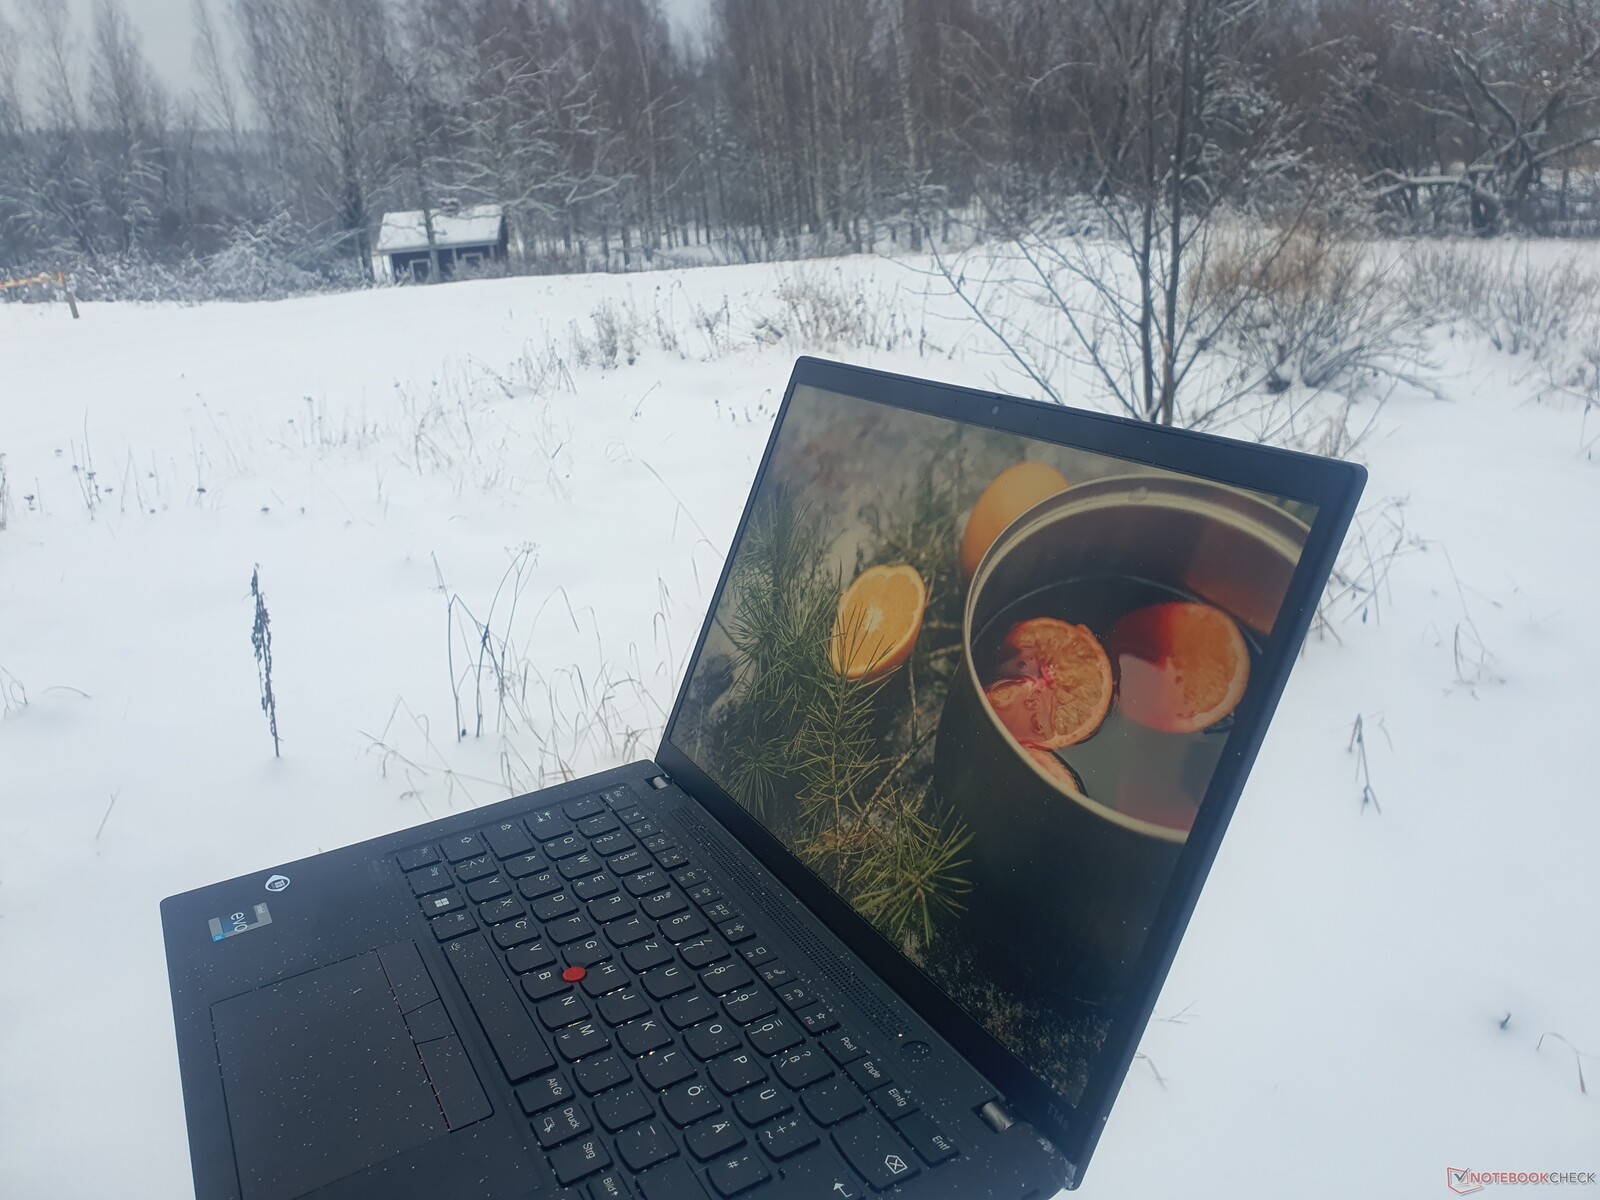
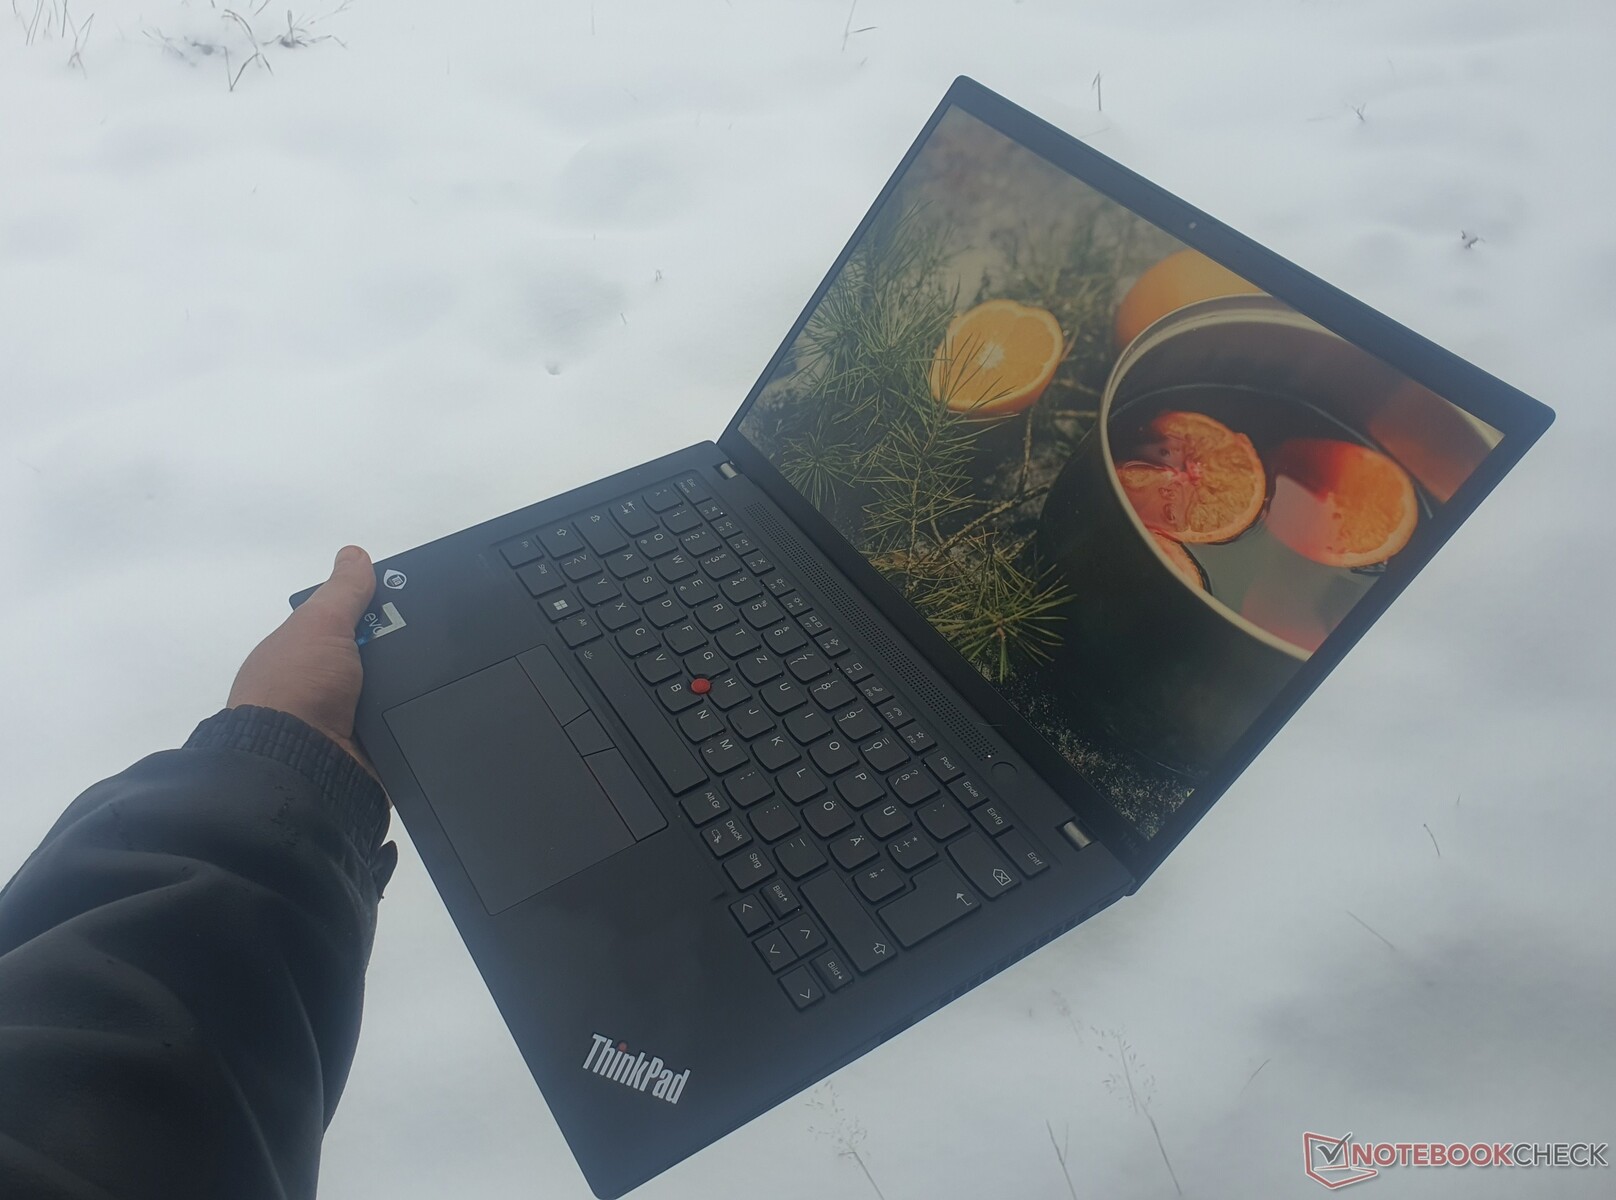
Le ThinkPad T14s G3 gris foncé est très robuste grâce à l'utilisation de carbone, de magnésium et d'aluminium. Quelle que soit la façon dont nous avons essayé de tordre le ThinkPad ou de lui appliquer d'autres forces physiques, il ne s'est déformé en aucune façon. Le châssis a un facteur de forme plus petit (grâce à son rapport d'aspect 16:10) et un cadre plus fin que son prédécesseur.
Les charnières permettent de replier l'écran jusqu'à 180 degrés et ont été ajustées pour maintenir l'écran fermement en position. Cependant, il est impossible d'ouvrir l'ordinateur portable d'une seule main. L'ajustement et la finition sont impeccables, et les surfaces légèrement rugueuses sont agréables, non glissantes et n'attirent pas trop les empreintes digitales.
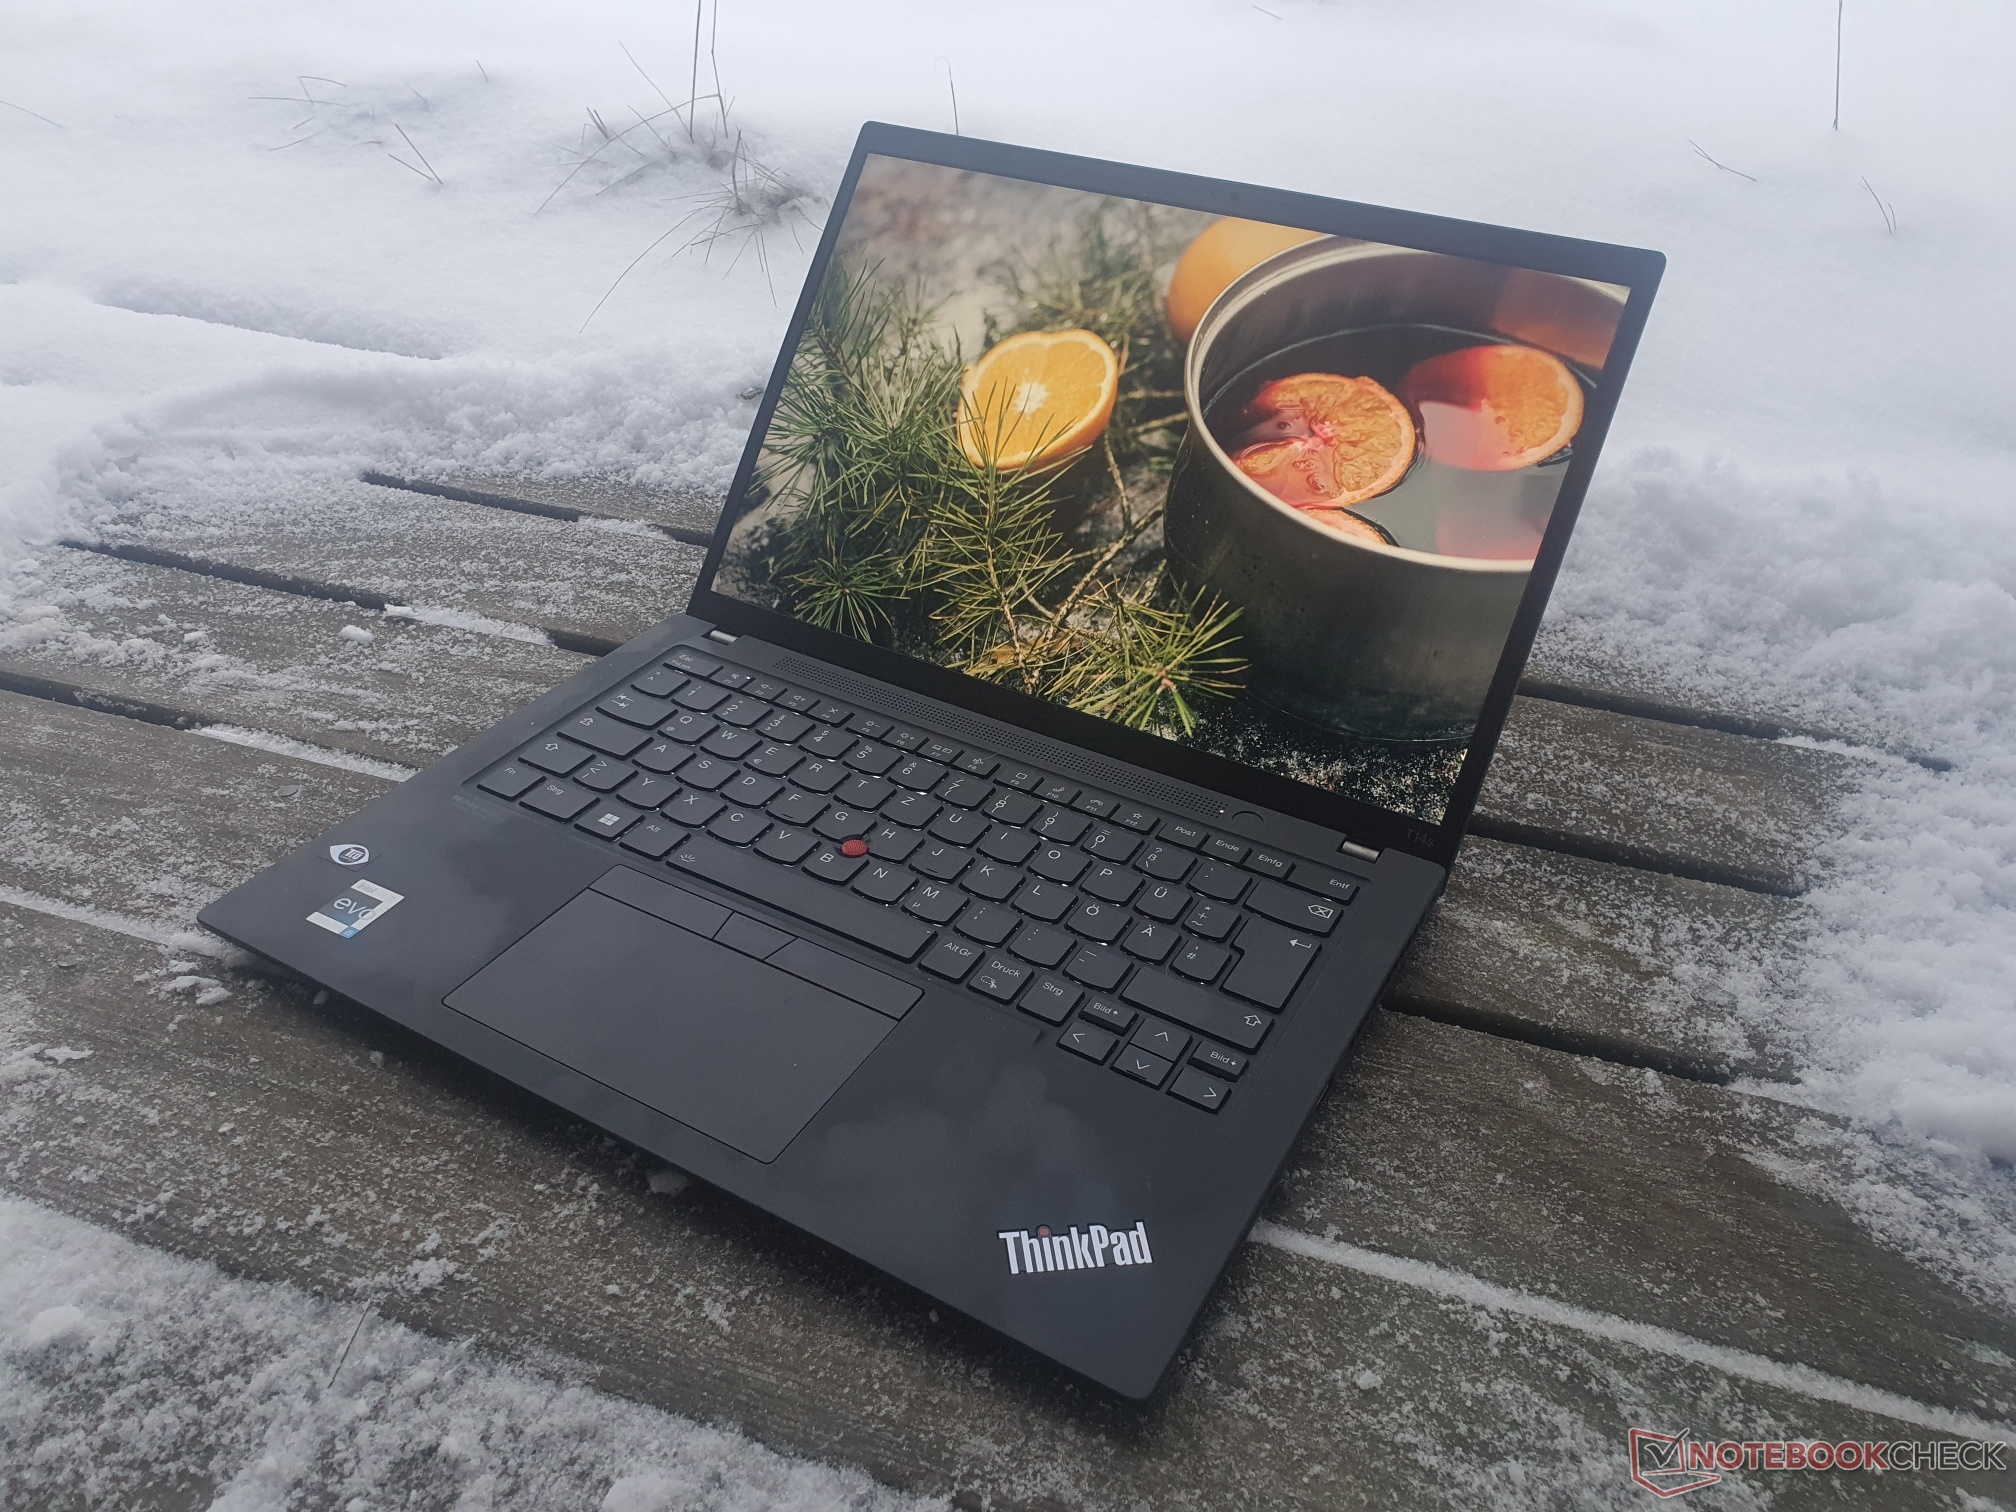
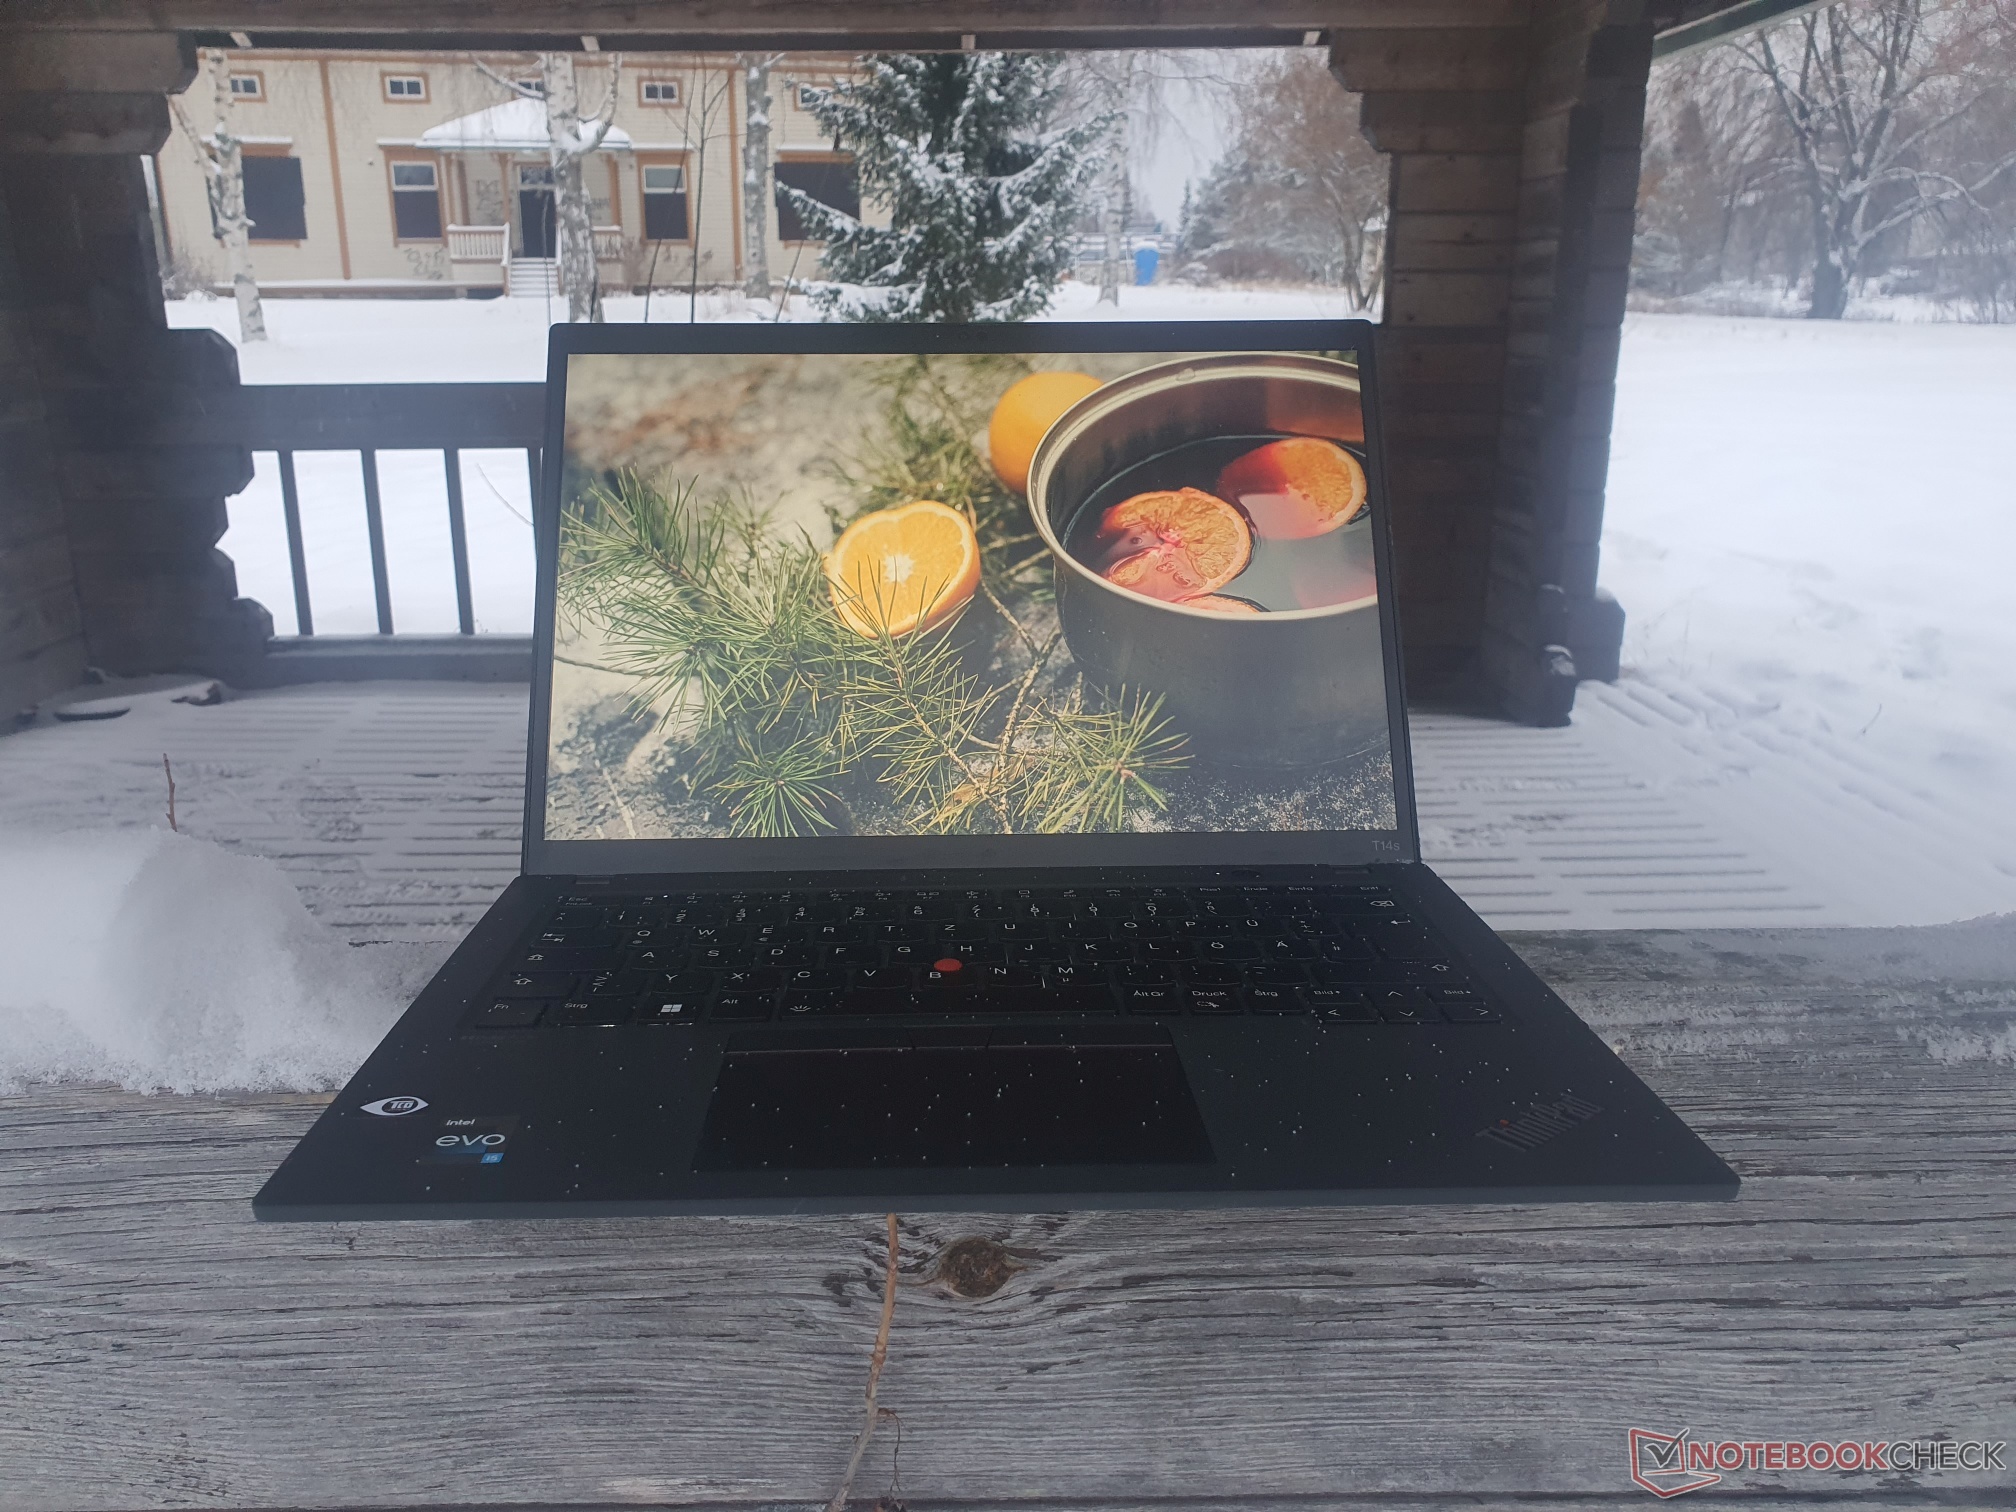
Avec une largeur de 317,5 mm (12,5"), le ThinkPad T14s G3 est 10 mm (0,393") plus étroit et 3 mm (0,12") plus profond que son prédécesseur. Bien que le T14s G3 pèse 1,21 kg (2,67 lb), notre unité de test pèse 1,33 kg (2,95 lb), ce qui le rend plus lourd que le ThinkPad T14s G2 que nous avons examiné précédemment. L'ordinateur portable a pratiquement le même encombrement que le X1 Carbon G10. Comme le ThinkPad X13 et MacBook Airle Schenker Vision 14 est encore plus compact que le T14s G3 malgré un matériel plus puissant.
Spécifications : Thunderbolt & webcam 1080p, nombreux composants soudés
Sur le côté gauche du ThinkPad T14s G3 Intel, vous trouverez deux ports Thunderbolt 4, un port HDMI 2.0b (capable d'atteindre la 4K 60Hz) et une prise audio. Un port USB-A 3.2 Gen 1 est également présent de chaque côté de l'appareil. Un lecteur de carte à puce optionnel et un emplacement Kensington sont situés sur le côté droit. L'arrière de l'appareil comporte un emplacement Nano SIM. Un lecteur de carte SD est absent de l'ordinateur portable, tandis qu'un port Ethernet n'est disponible que sur le ThinkPad T14 (non S).


Connectivité
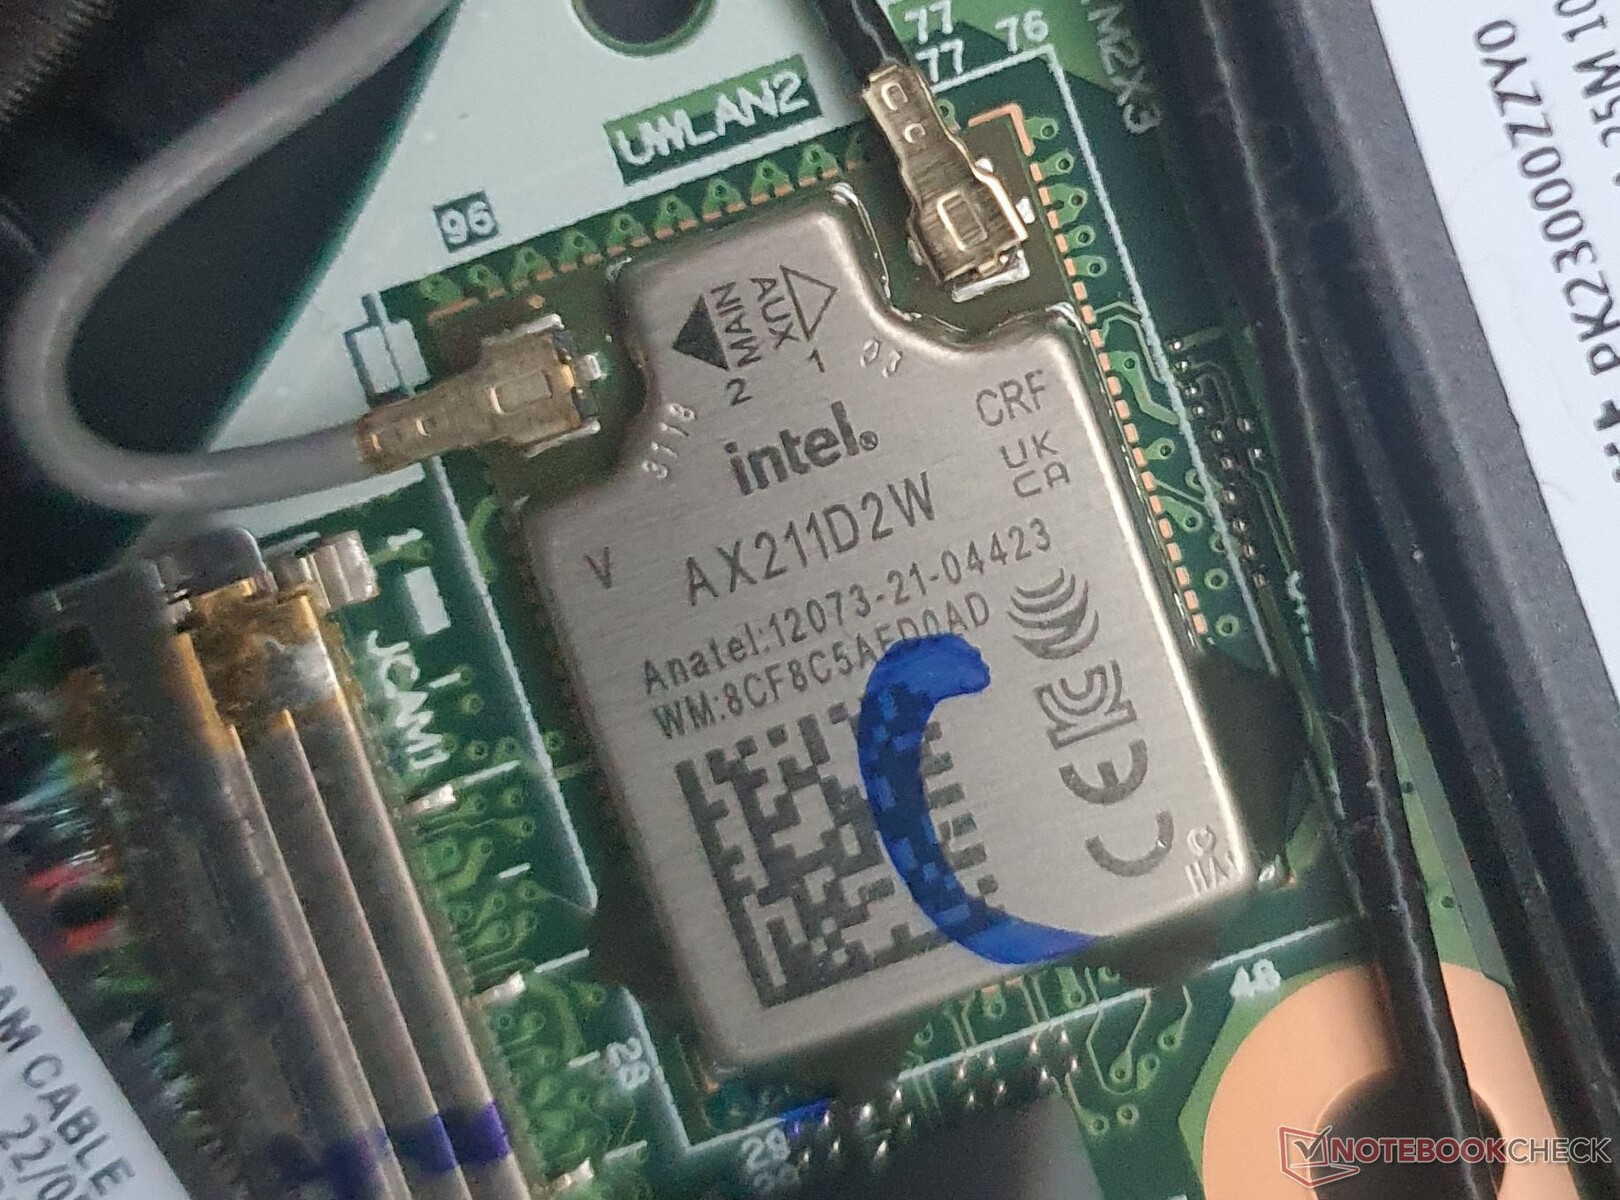
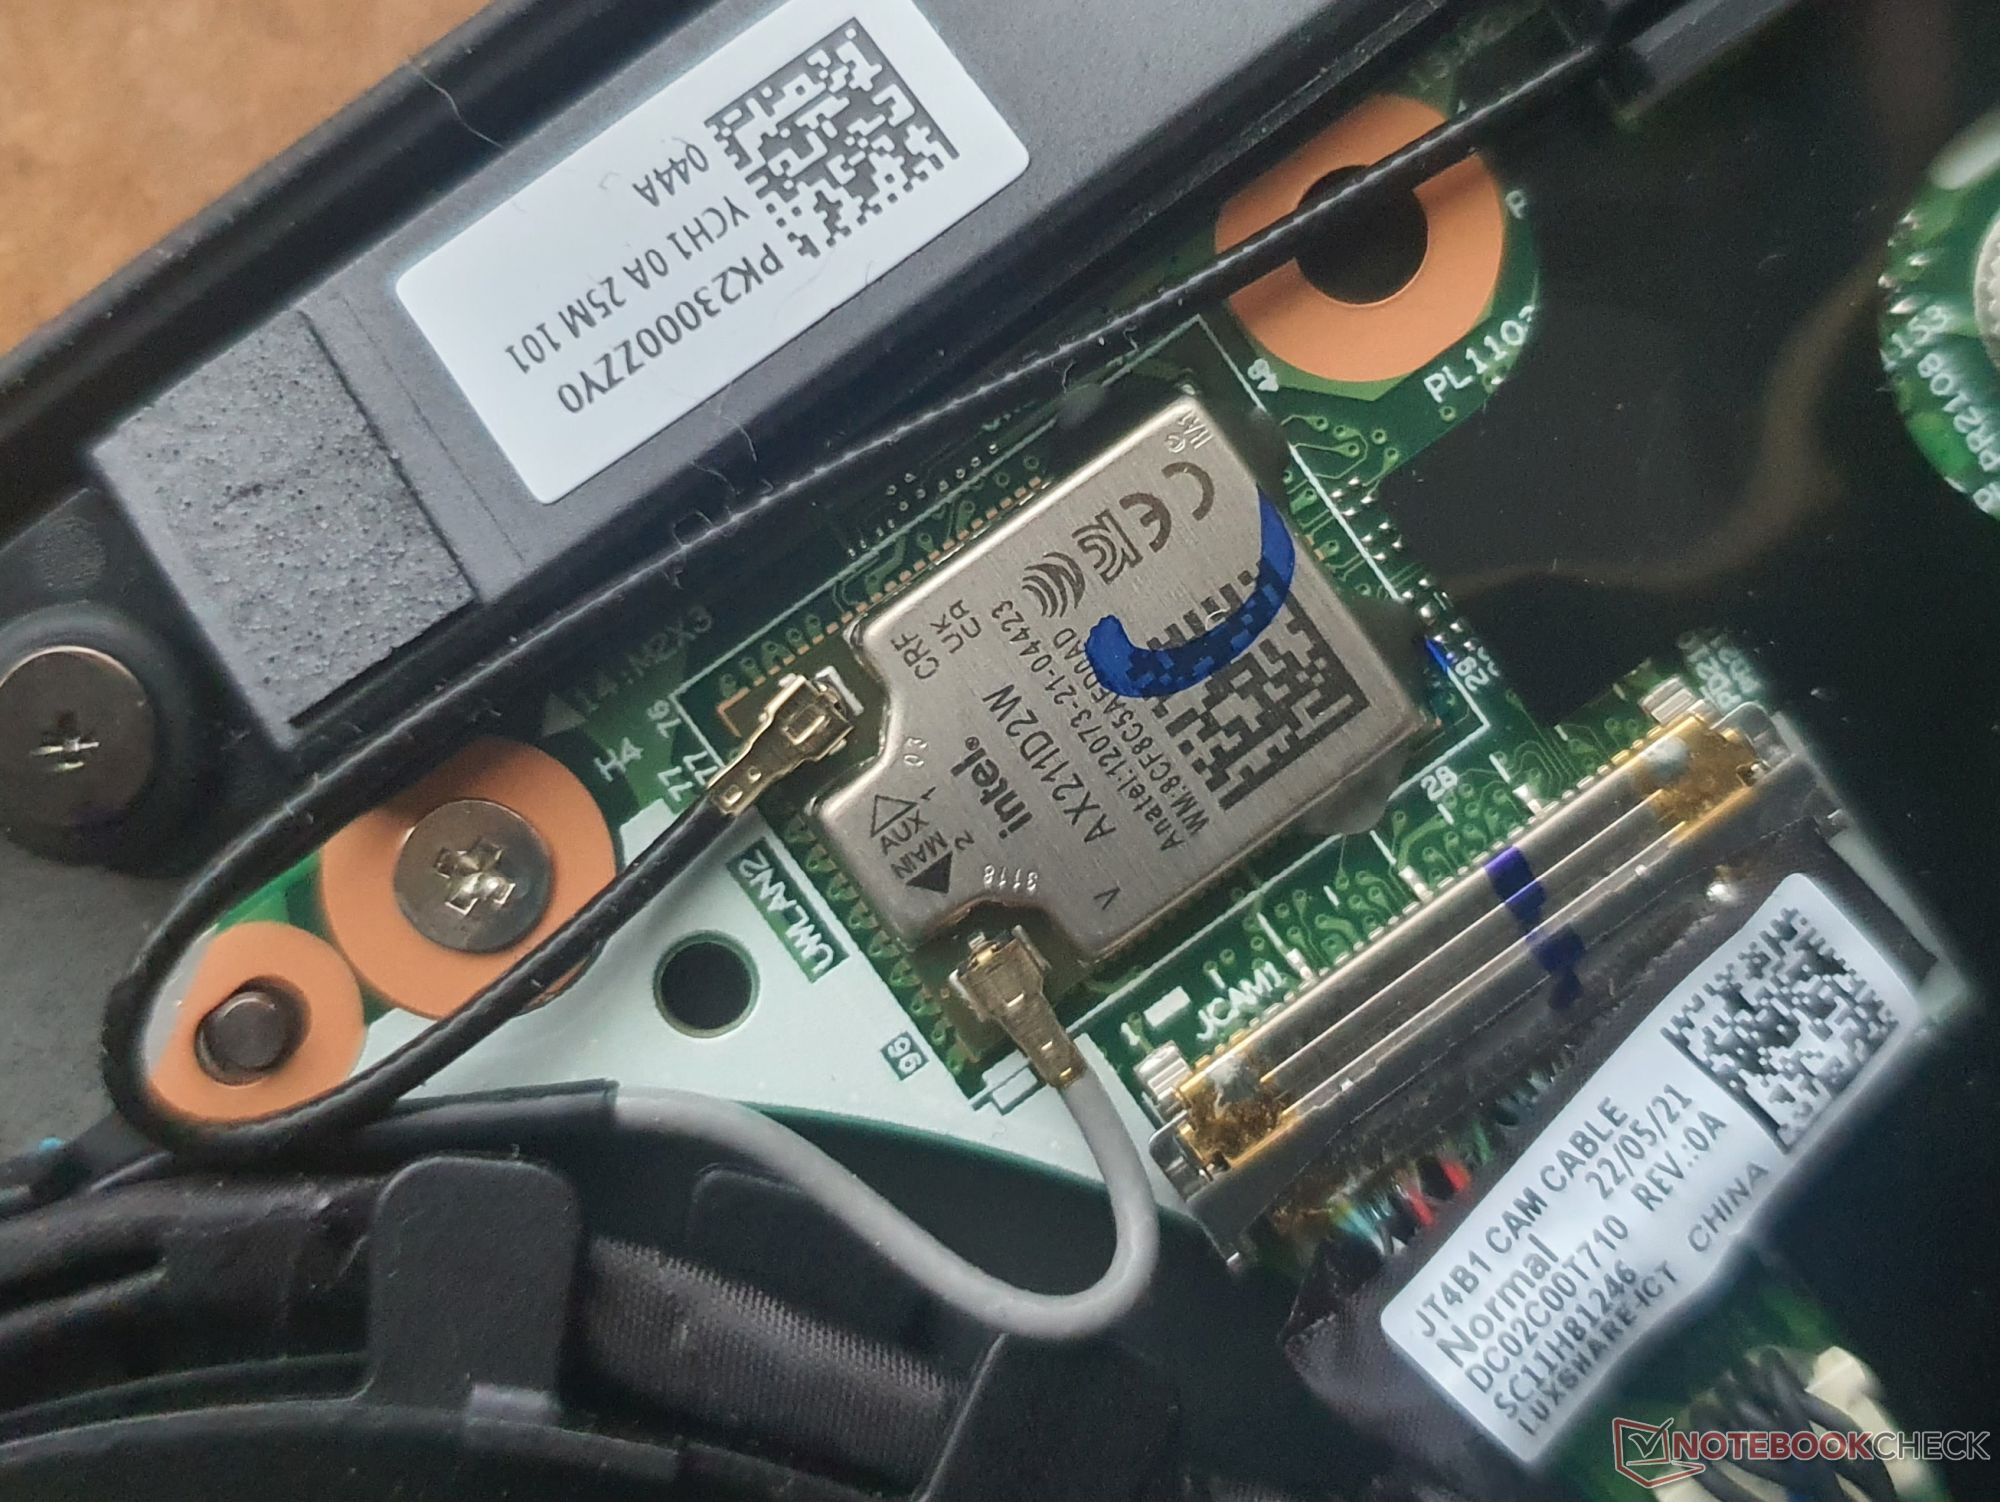
Lenovo a soudé le module W-Fi 6E à la carte mère sur les ThinkPad T14. L'Intel AX211 est capable de fournir des vitesses de transfert de données élevées, de l'ordre de 1,6 à 1,7 Gbit/s, ce qui est comparable à son prédécesseur. En comparaison, le module Wi-Fi Qualcomm de la version AMD du ThinkPad T14s Version AMD du ThinkPad T14fonctionne encore plus vite que la carte Intel. Le T14s G3 prend en charge Bluetooth 5.2, tandis que le WWAN avec 4G/5G et le NFC sont en option.
| Networking | |
| Lenovo ThinkPad T14s G3 21BR00CDGE | |
| iperf3 receive AXE11000 | |
| iperf3 transmit AXE11000 | |
| Lenovo ThinkPad T14s G2 20WM003TGE | |
| iperf3 transmit AX12 | |
| iperf3 receive AX12 | |
| Lenovo ThinkPad T14 G3-21CF004NGE | |
| iperf3 receive AXE11000 6GHz | |
| iperf3 transmit AXE11000 6GHz | |
| Lenovo ThinkPad X13 G3 21BN0046GE | |
| iperf3 receive AXE11000 | |
| iperf3 transmit AXE11000 | |
| Lenovo ThinkPad X1 Carbon G10 21CC001RGE | |
| iperf3 receive AXE11000 6GHz | |
| iperf3 transmit AXE11000 6GHz | |
| HP EliteBook 845 G9 6F6H9EA | |
| iperf3 receive AXE11000 | |
| Dell Latitude 7420 JW6MH | |
| iperf3 transmit AX12 | |
| iperf3 receive AX12 | |
| Schenker Vision 14 2022 RTX 3050 Ti | |
| iperf3 receive AXE11000 | |
| iperf3 transmit AXE11000 | |
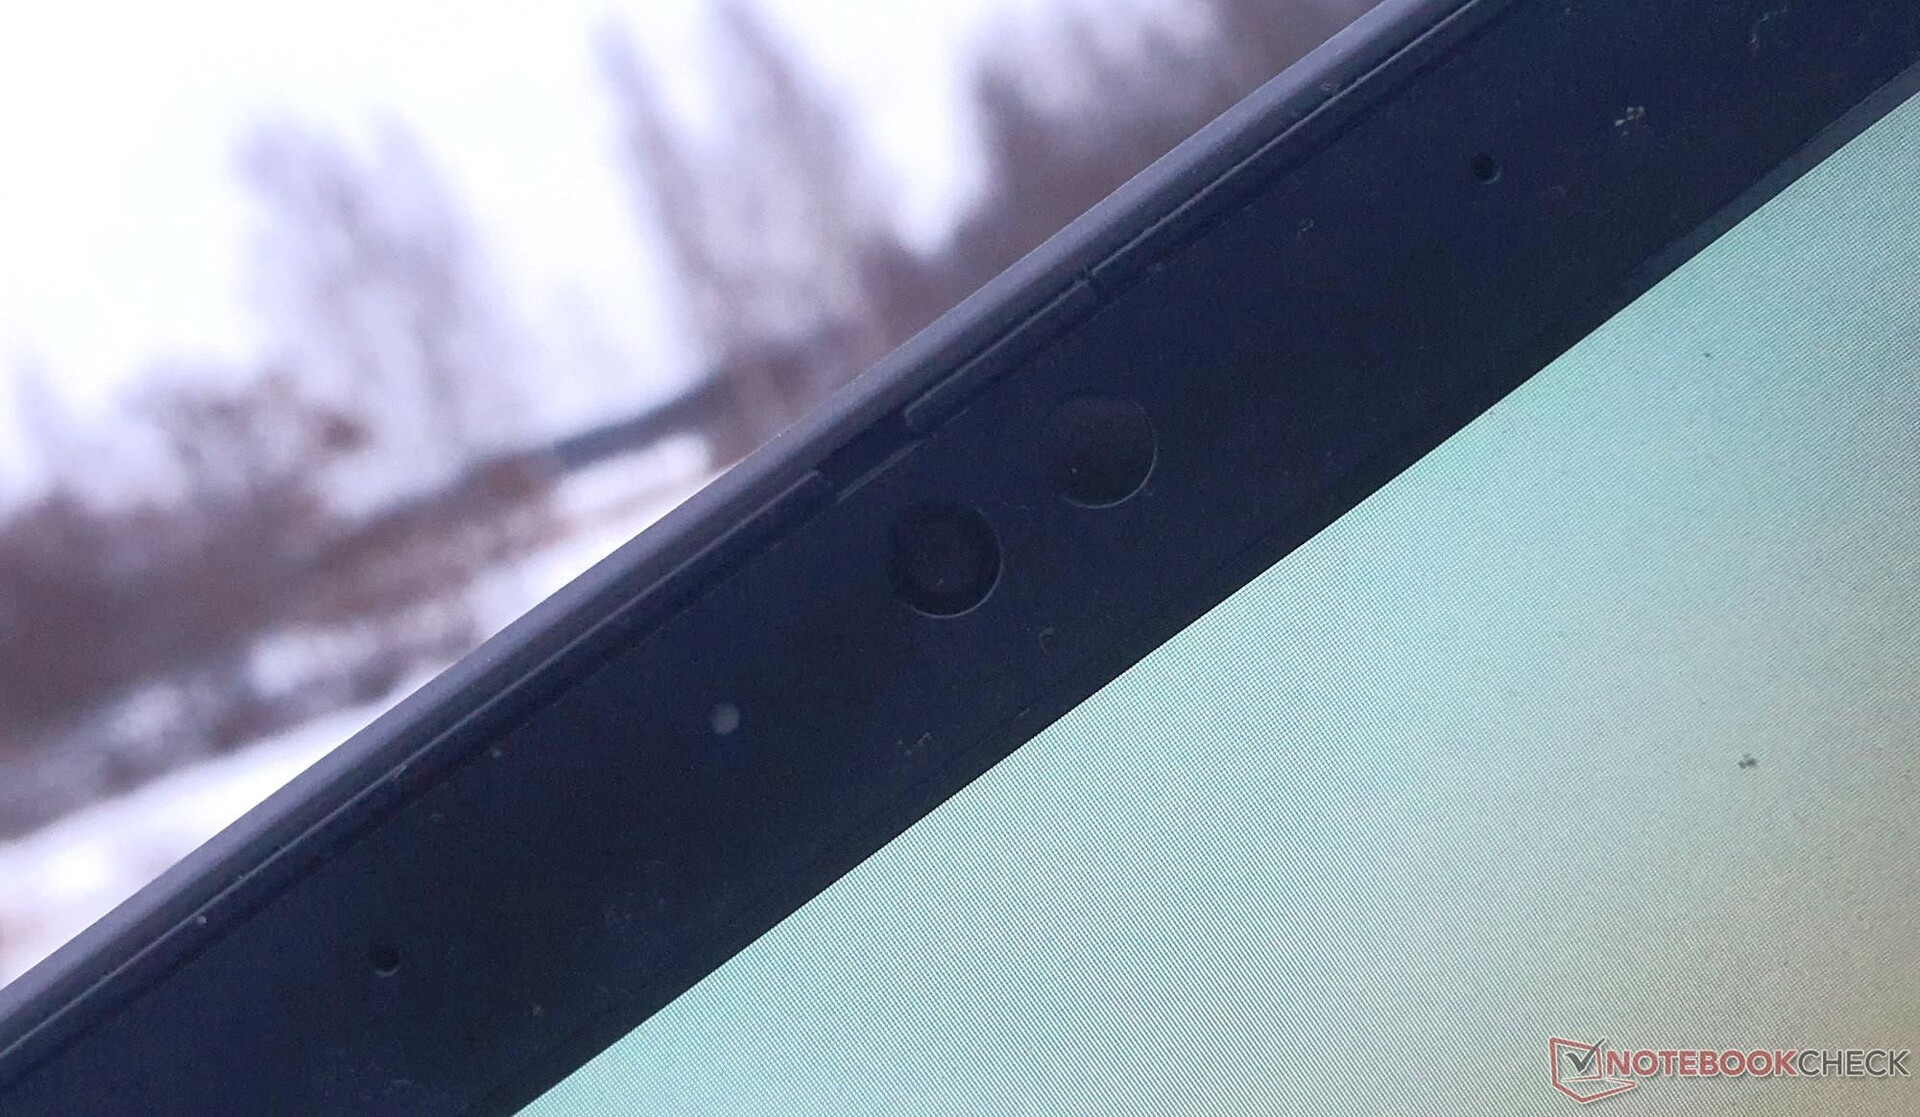
Webcam
Bien que la webcam 1080p avec microphones à double réseau ne soit pas si géniale, elle produit des images nettement moins bruyantes et délavées que celles de son prédécesseur.


Sécurité
Le ThinkPad T14s Gen 3 offre un lecteur de cartes à puce en option, un IR pour la reconnaissance des visages et un obturateur physique pour l'appareil photo. Les autres caractéristiques de sécurité comprennent une fente Kensington et un capteur d'empreintes digitales en option. Sur le plan logiciel, l'ordinateur portable prend également en charge la détection de présence humaine et Mirametrix Glance.
Accessoires
Cette année, le port d'accueil a été abandonné sur la série T également. À la place, vous pouvez utiliser une station d'accueil Thunderbolt ou USB-C fabriquée par Lenovo ou une société tierce. L'ordinateur portable est livré avec un chargeur USB-C de 65W, et 90 % de ses matériaux d'emballage sont soit recyclés, soit issus de la foresterie durable.
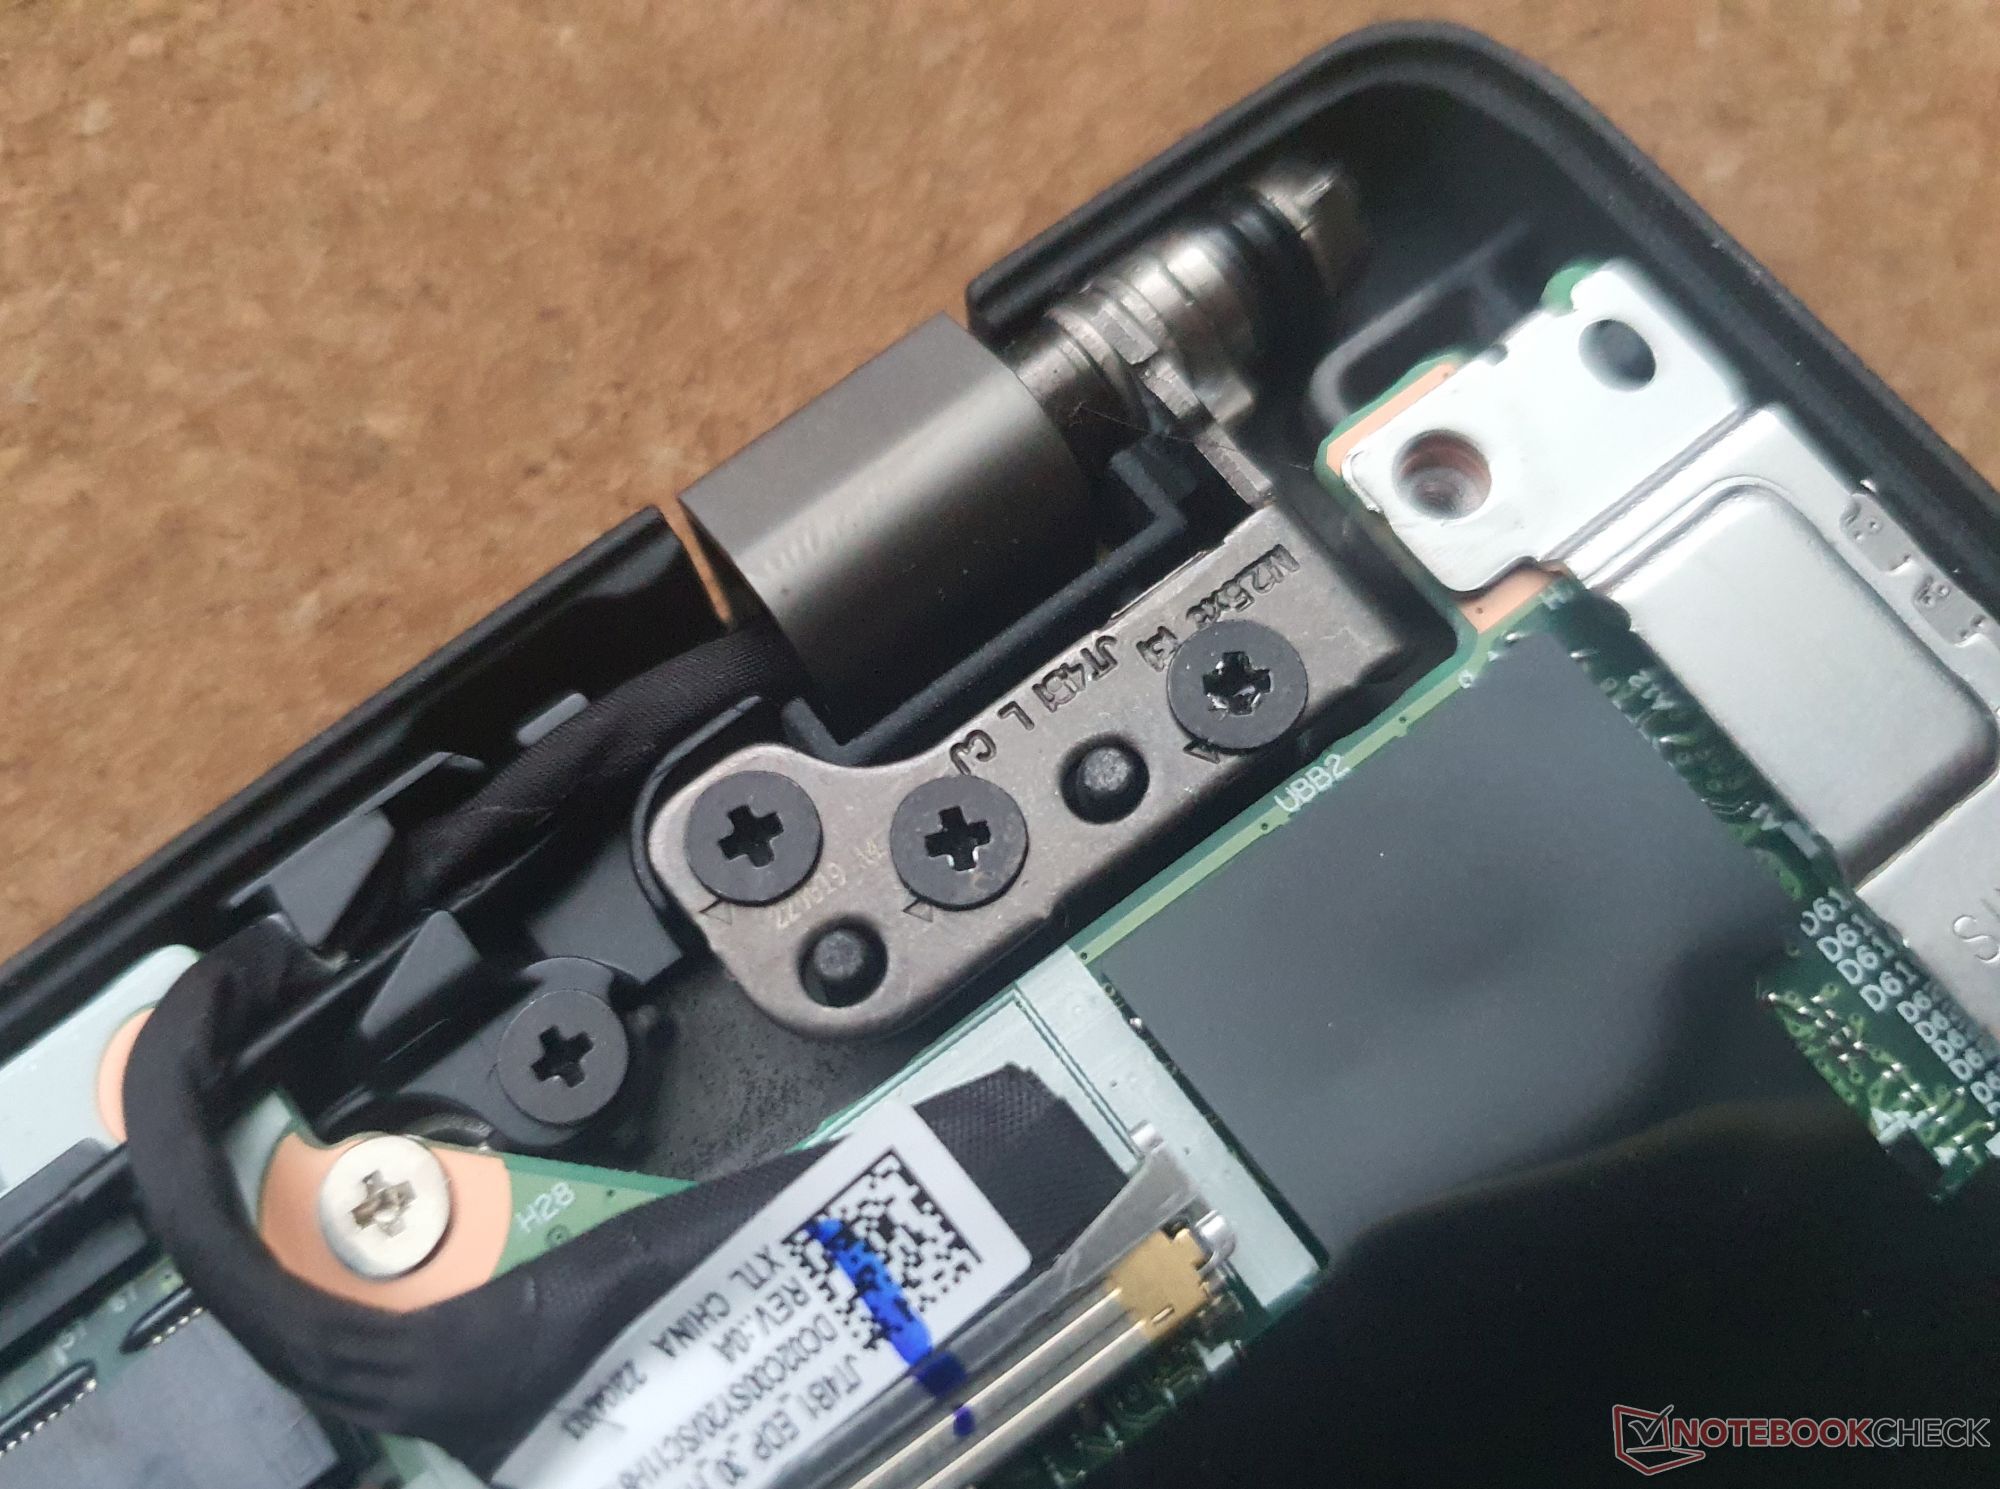
Maintenance
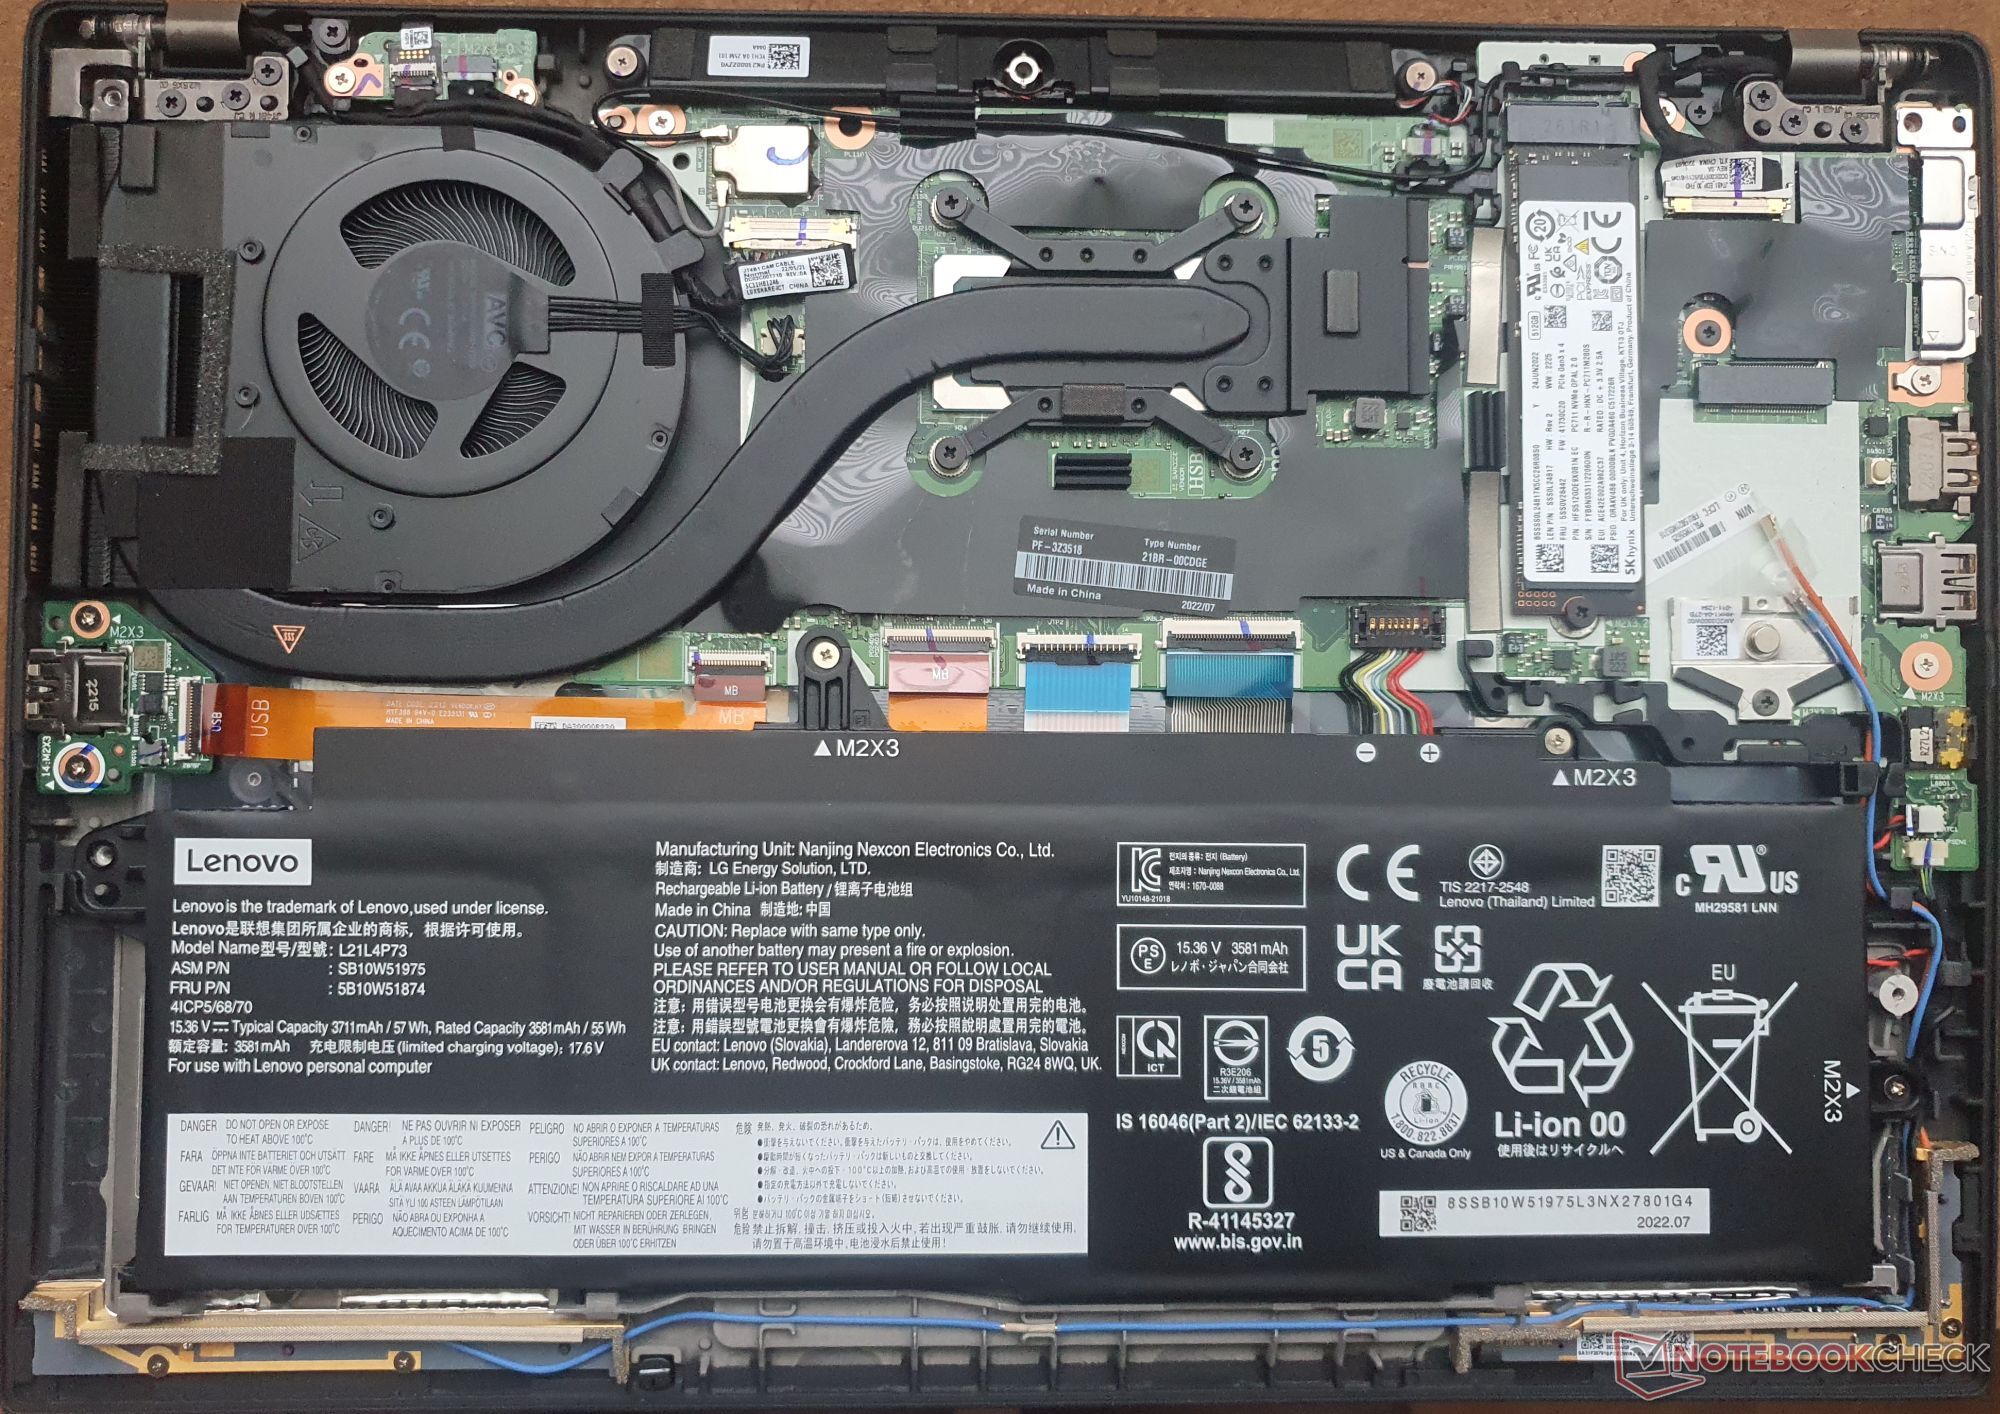
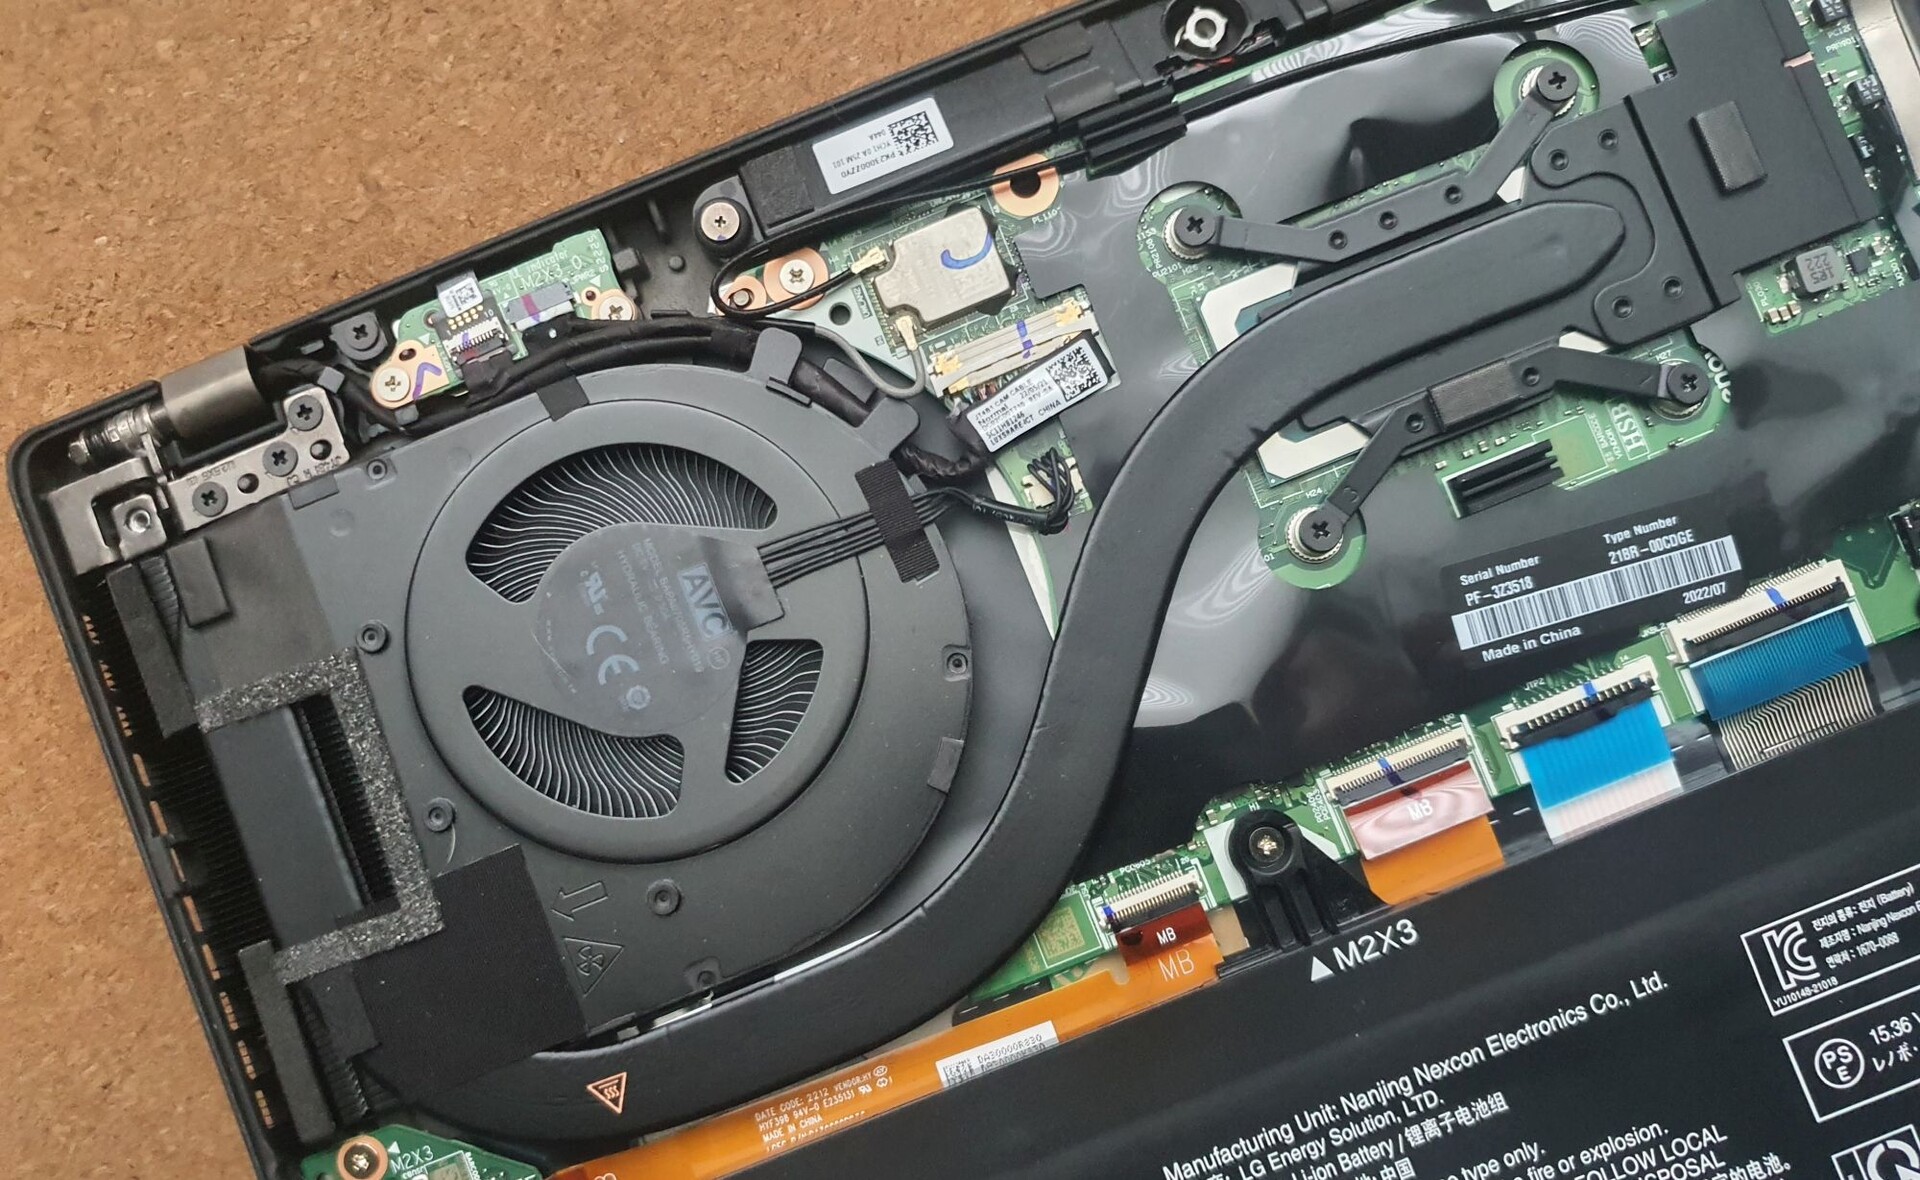
Avant d'ouvrir le ThinkPad, vous devez d'abord entrer dans le BIOS et désactiver la batterie interne. Pour retirer le couvercle inférieur, vous devez défaire cinq vis Phillips imperdables et utiliser une spudger en plastique ou une carte en plastique pour libérer quelques clips.
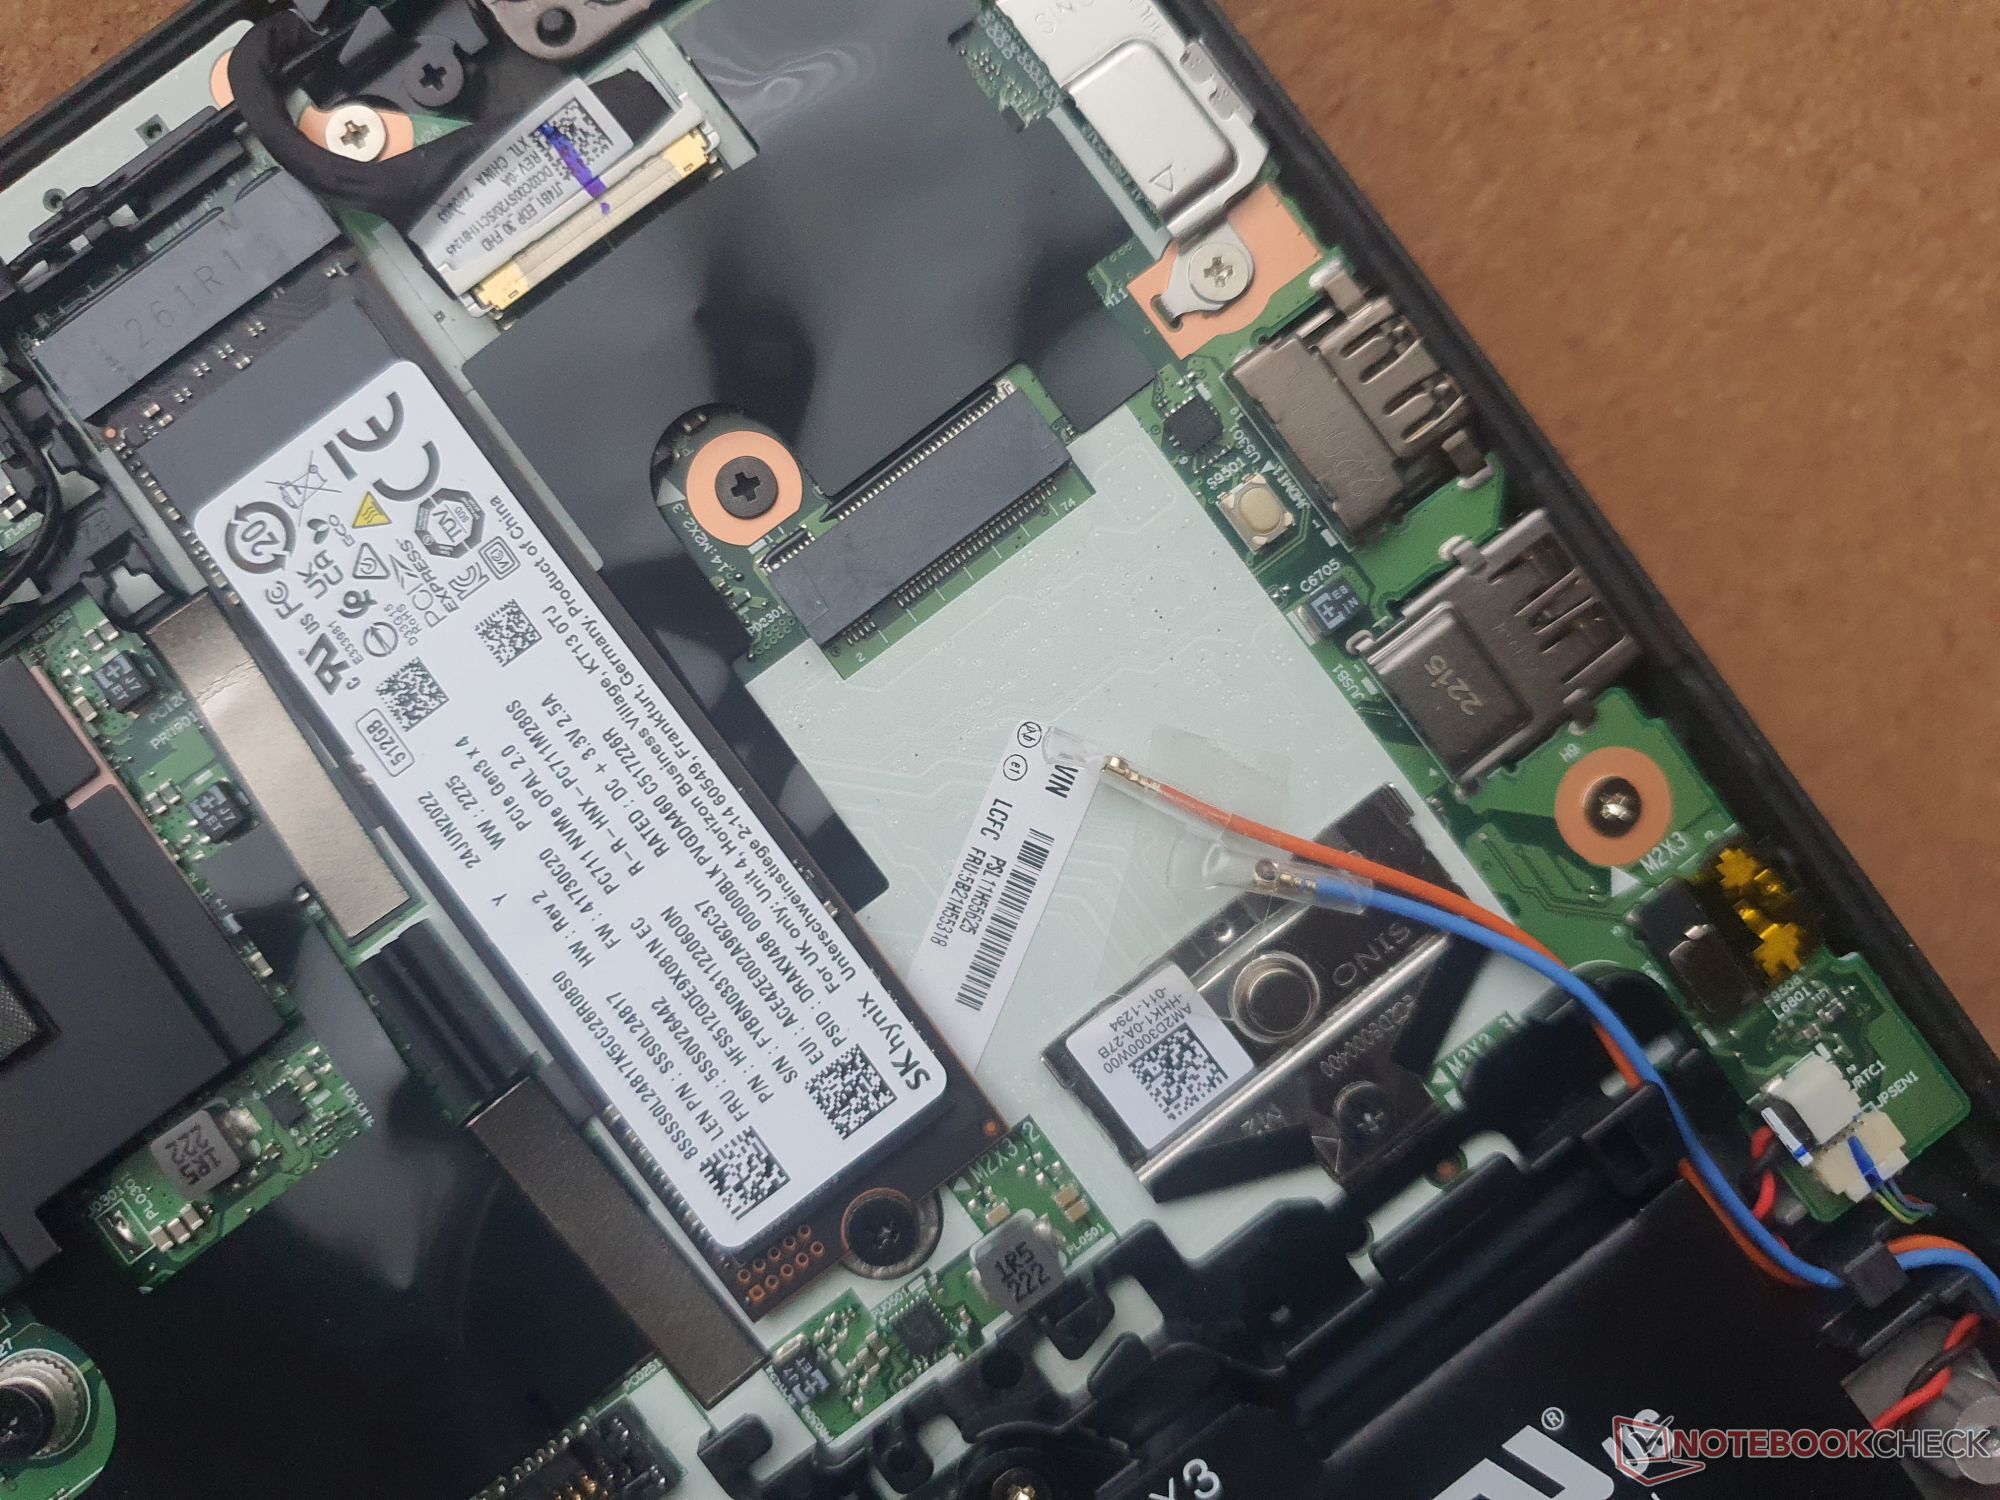
Une fois cette opération effectuée, vous aurez accès au SSD M.2 2280, à un emplacement WWAN libre, à la batterie vissée de 57 Wh et au système de refroidissement (que vous pouvez nettoyer). Dommage que le module Wi-Fi et la RAM soient soudés à la carte mère.
Garantie
En Allemagne, Lenovo offre une garantie de trois ans sur l'appareil et une garantie d'un an sur la batterie. Notre modèle pour étudiants est livré avec 12 mois de Premier Support, qui comprend un service sur site. Toutefois, vous ne bénéficierez par défaut que d'un service de messagerie ou de transport. Il en coûte 80 € pour passer à l'assistance Premier Support pendant 36 mois (270 € pour quatre ans et 382 € pour cinq ans). Les conditions de garantie peuvent varier selon les pays. Par exemple, les clients des États-Unis ne bénéficieront que d'une garantie standard d'un an. Le passage à l'assistance sur site Premier pendant trois ans coûte environ 151 USD (239 USD pour quatre ans et 367 USD pour cinq ans).
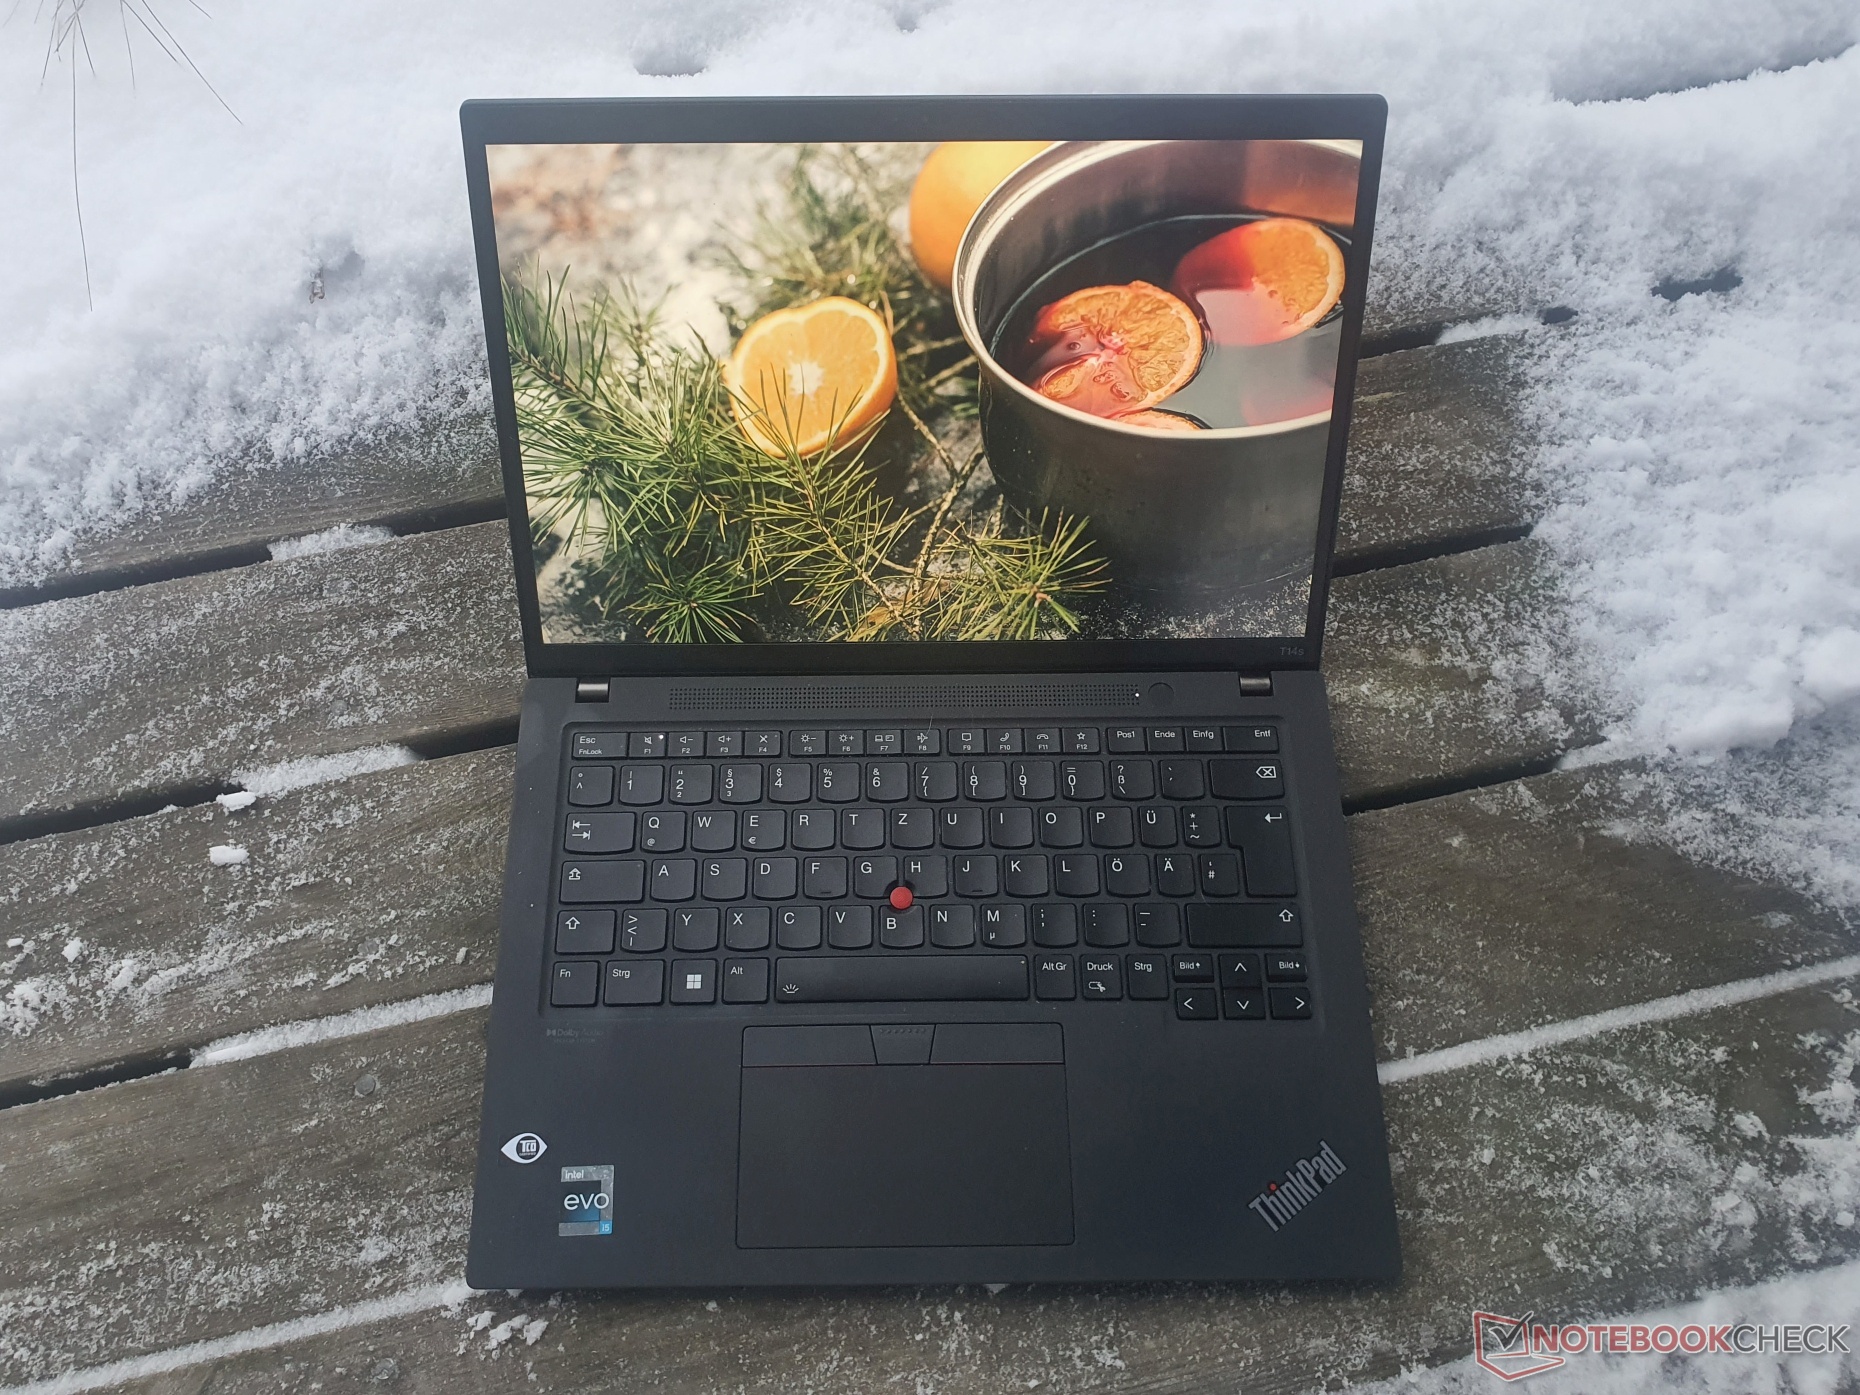
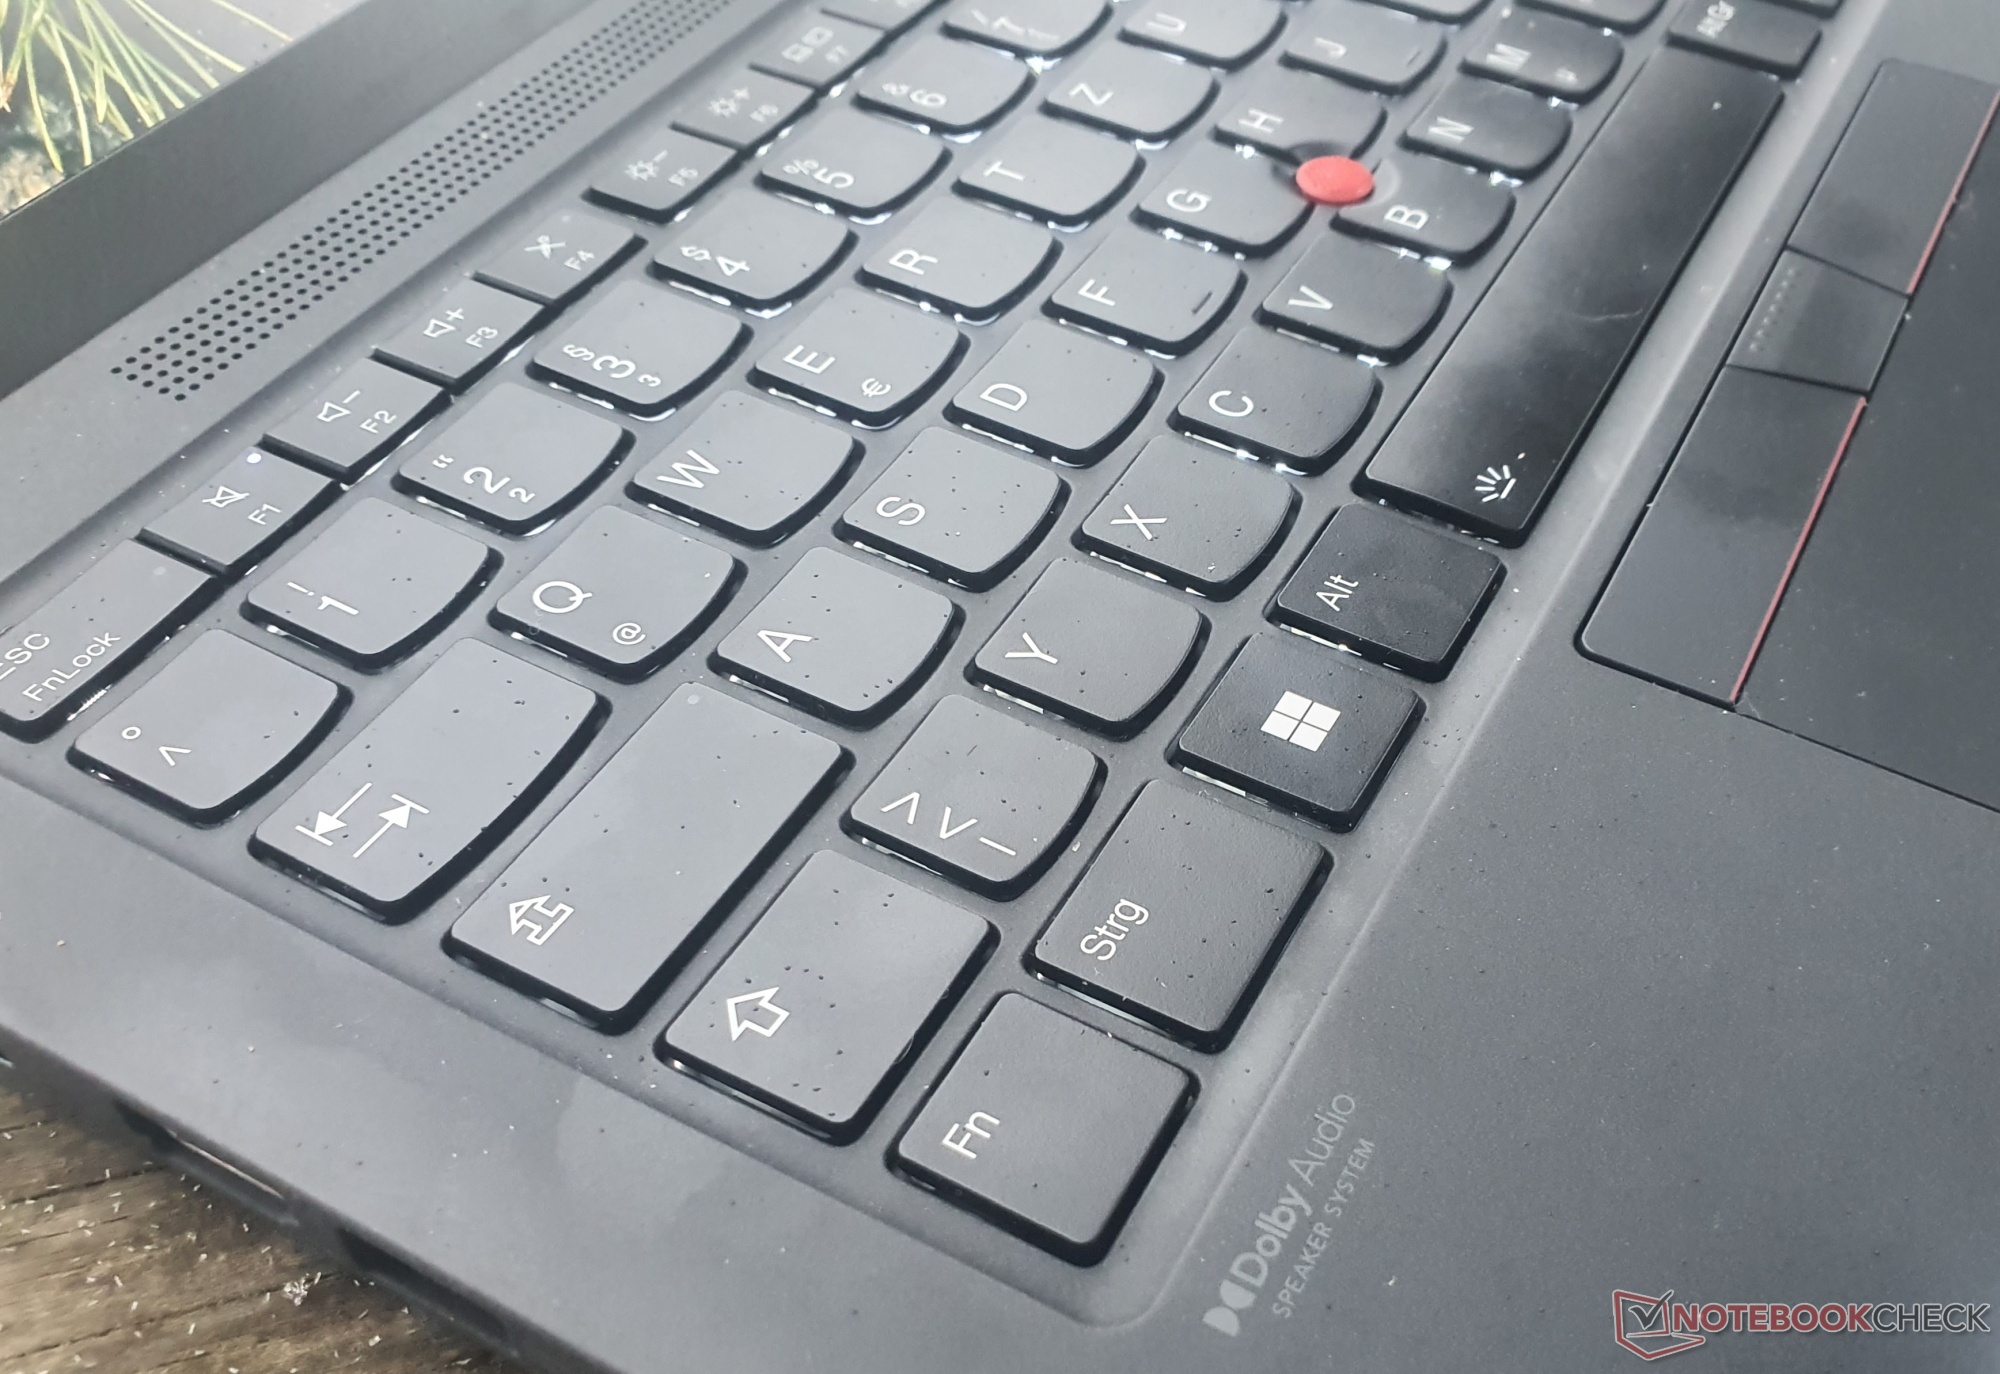
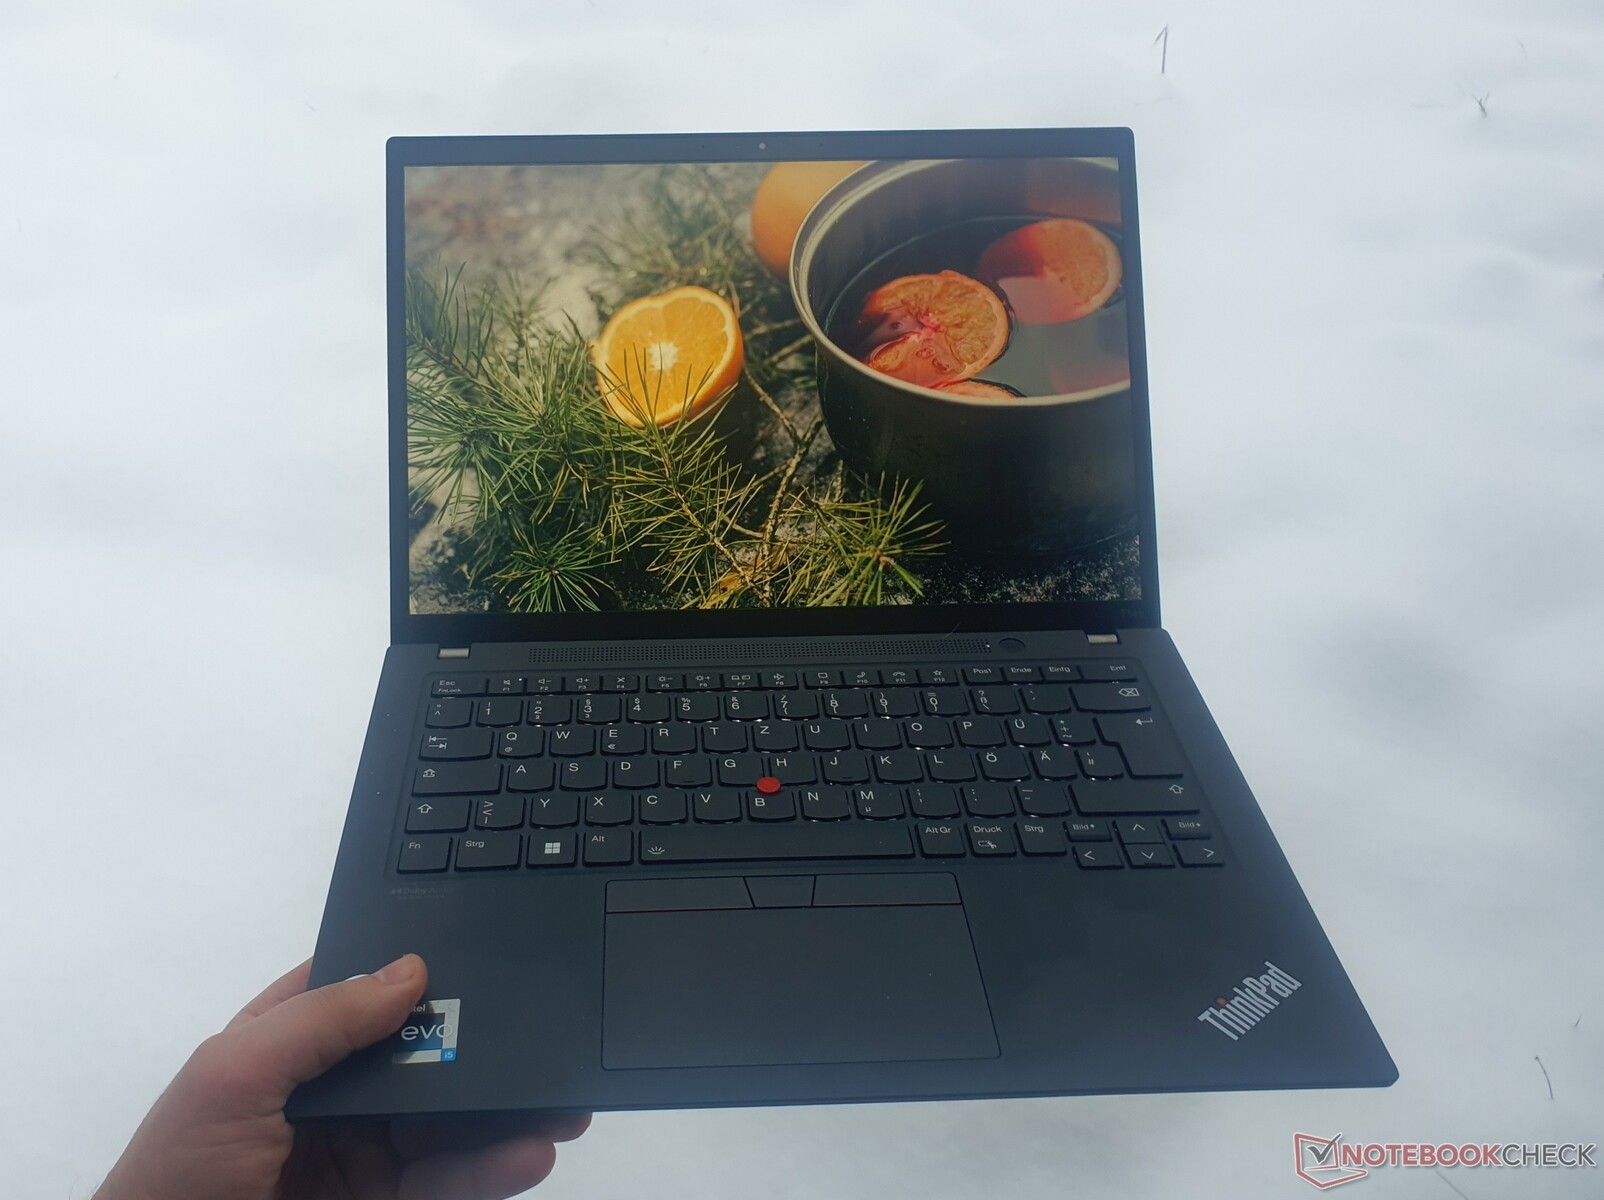
Dispositifs d'entrée : Bon clavier ThinkPad de taille normale
Clavier
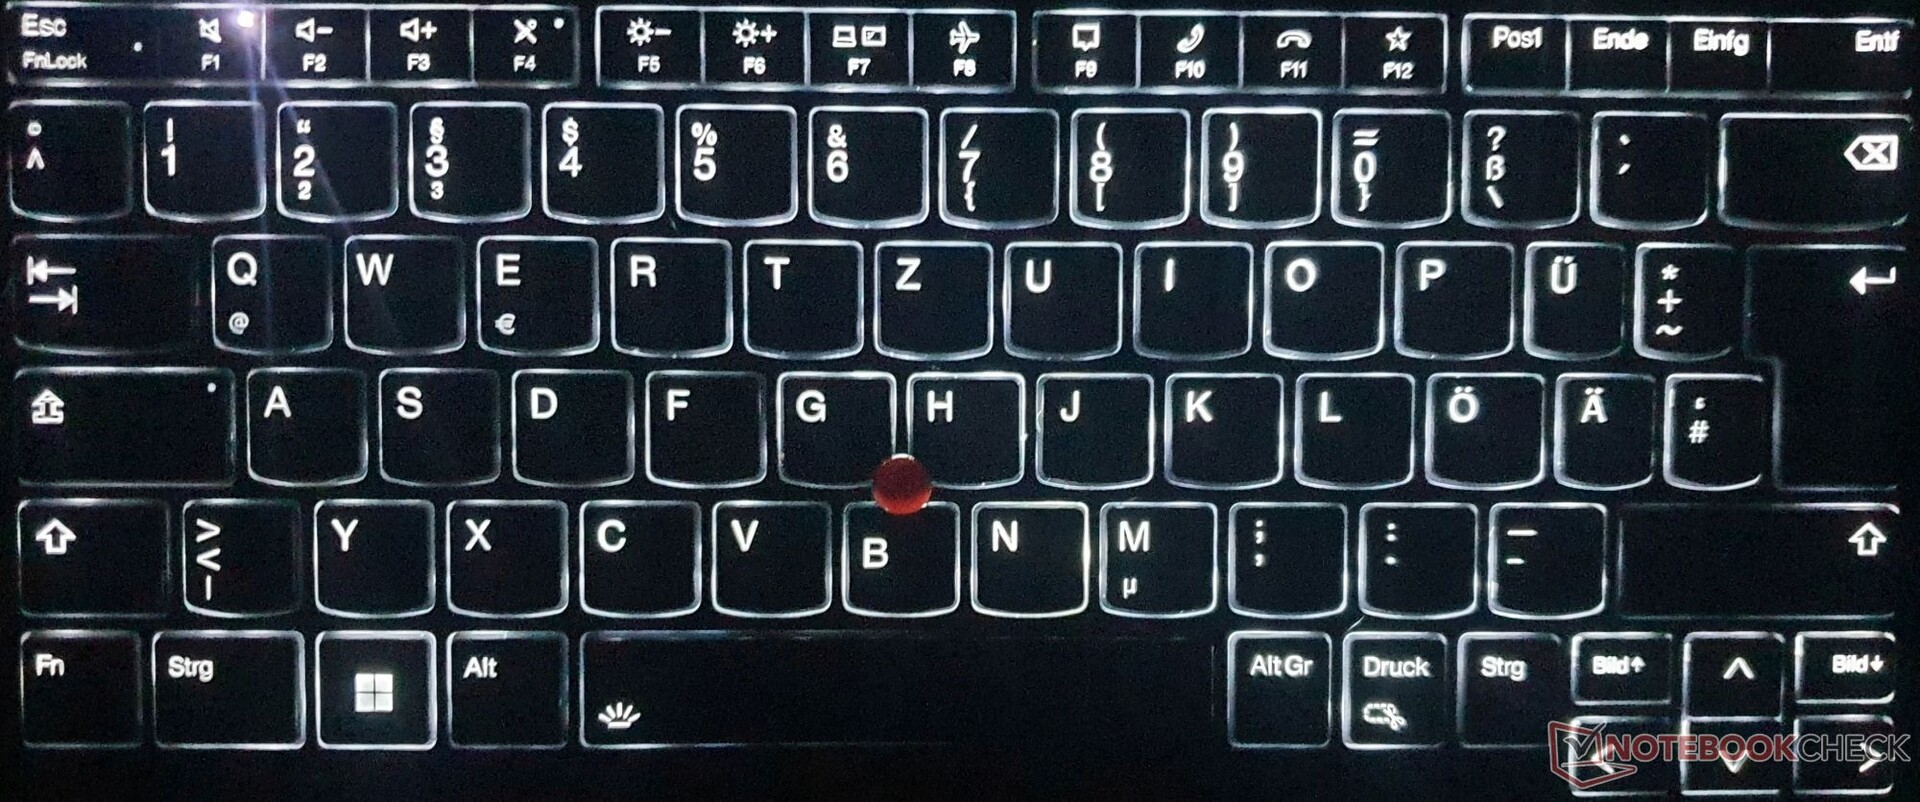
Le clavier à six rangées, résistant aux projections, est doté de touches mesurant 16 x 16 mm (0,63 x 0,63"). Elles sont toutes de taille normale, à l'exception des touches de tréma (uniquement sur la disposition allemande QWERTZ). Les touches fléchées sont légèrement plus petites, et tous les boutons importants sont présents sans qu'il soit nécessaire d'utiliser des touches à double fonction.
Depuis l'année dernière, la course des touches sur un ThinkPad T14s a été raccourcie à 1,5 mm (0,06"). Le clavier permet aux utilisateurs de taper plus rapidement et plus précisément que la plupart des autres claviers grâce à son point d'actionnement très distinct et à sa résistance tactile. Le plateau du clavier est également solide et ne fléchit pas lorsque vous exercez une pression délibérée dessus.
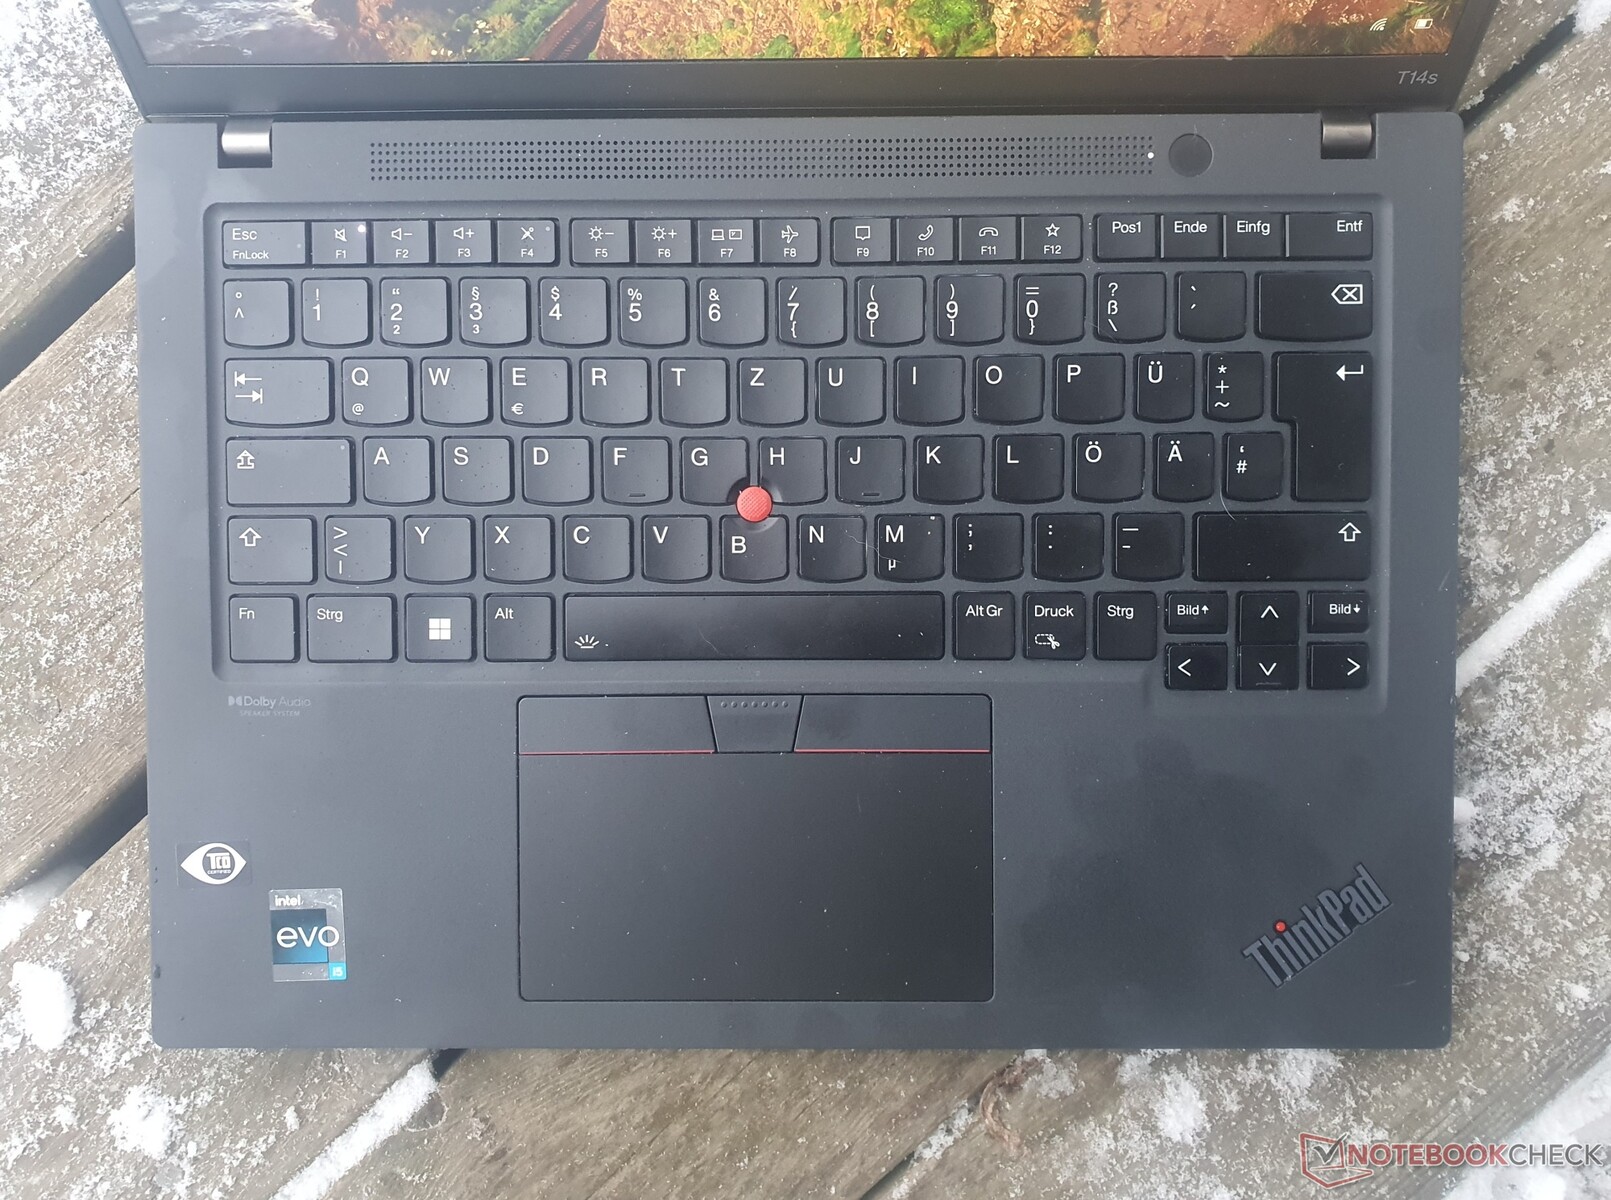
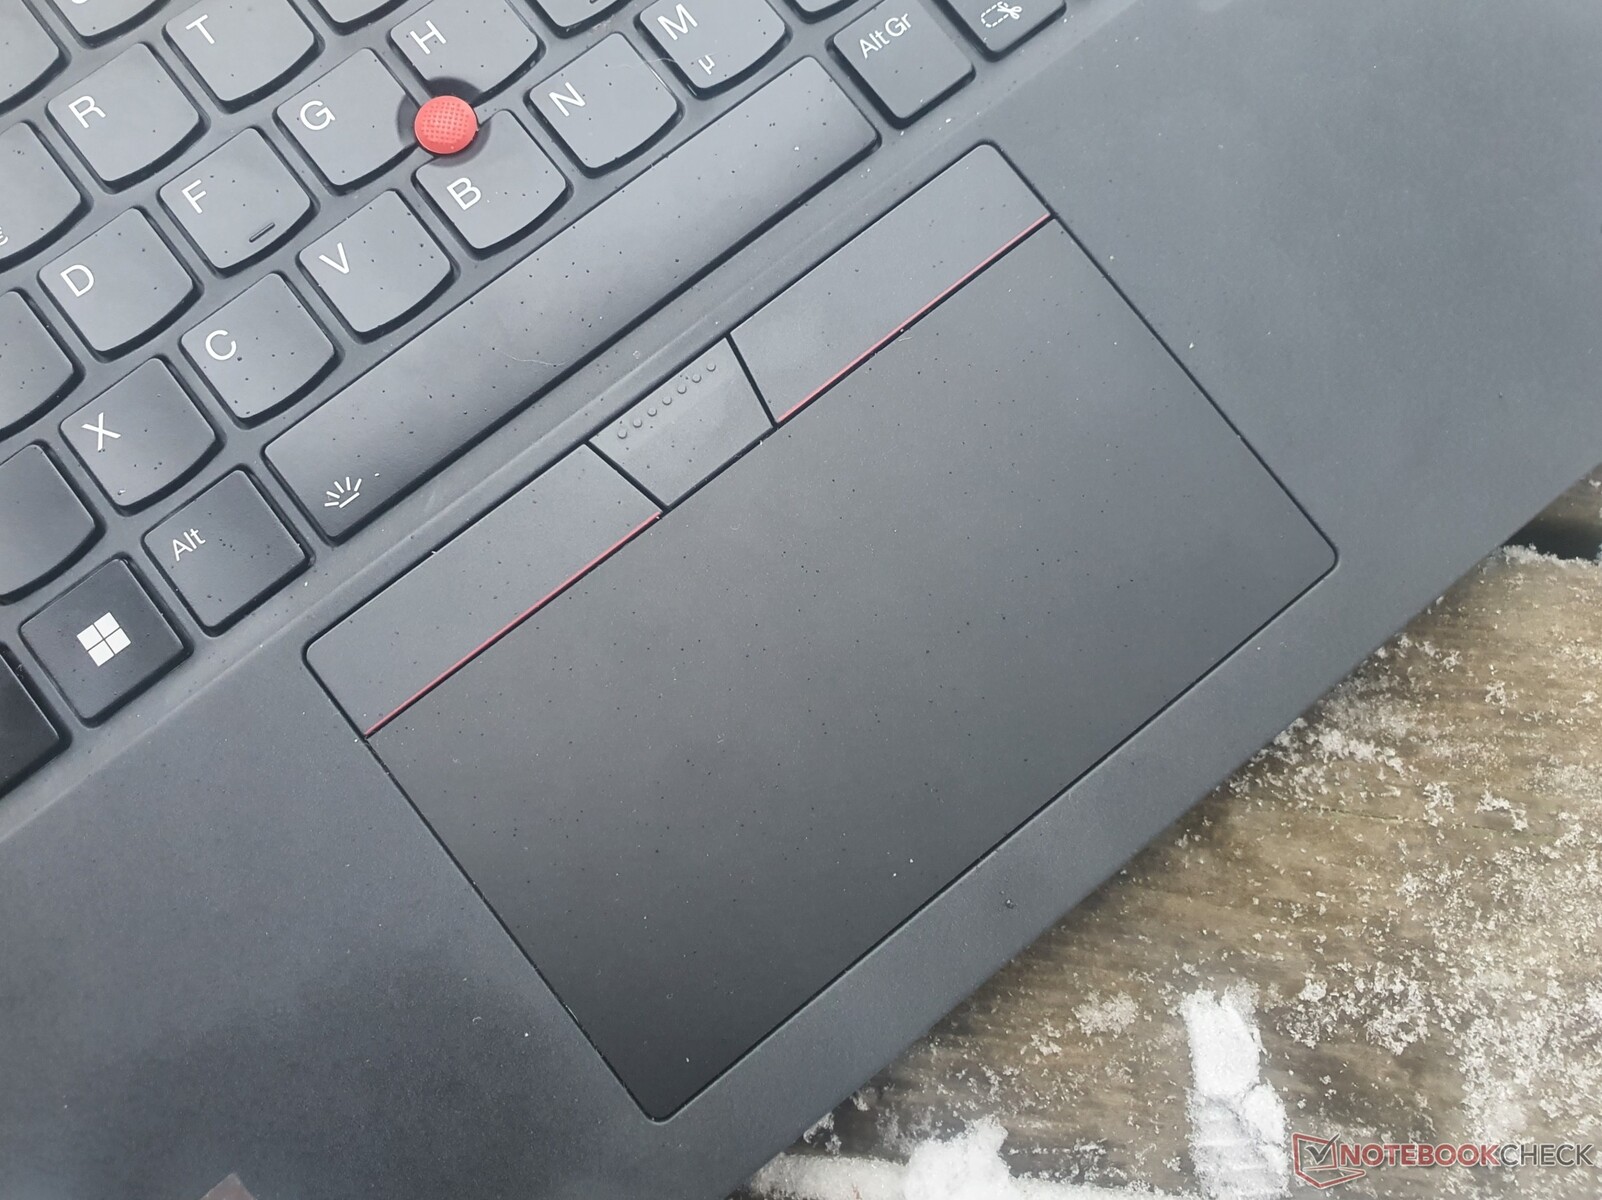
Pavé tactile et TrackPoint
Le pavé tactile du ThinkPad T14s G3 mesure 11,5 x 6,1 cm (4,5 x 2,4"), comme sur le modèle de dernière génération. Il est doté d'une surface Mylar améliorée qui donne l'impression d'être en verre mais qui est encore plus douce à utiliser. Le trackpad n'a aucun mal à reconnaître les gestes de pincer pour zoomer et de glisser-déposer. Les boutons de clic intégrés ont une distance de déplacement modérément longue et fournissent un retour distinct. Cependant, le pavé tactile semble un peu fragile en bas à gauche et à droite.
Le TrackPoint vous permet de déplacer le pointeur de la souris sur l'écran de manière rapide et précise tout en gardant les mains sur le clavier. Les trois boutons du TrackPoint sont complètement plats, ont une faible course et permettent une action précise.
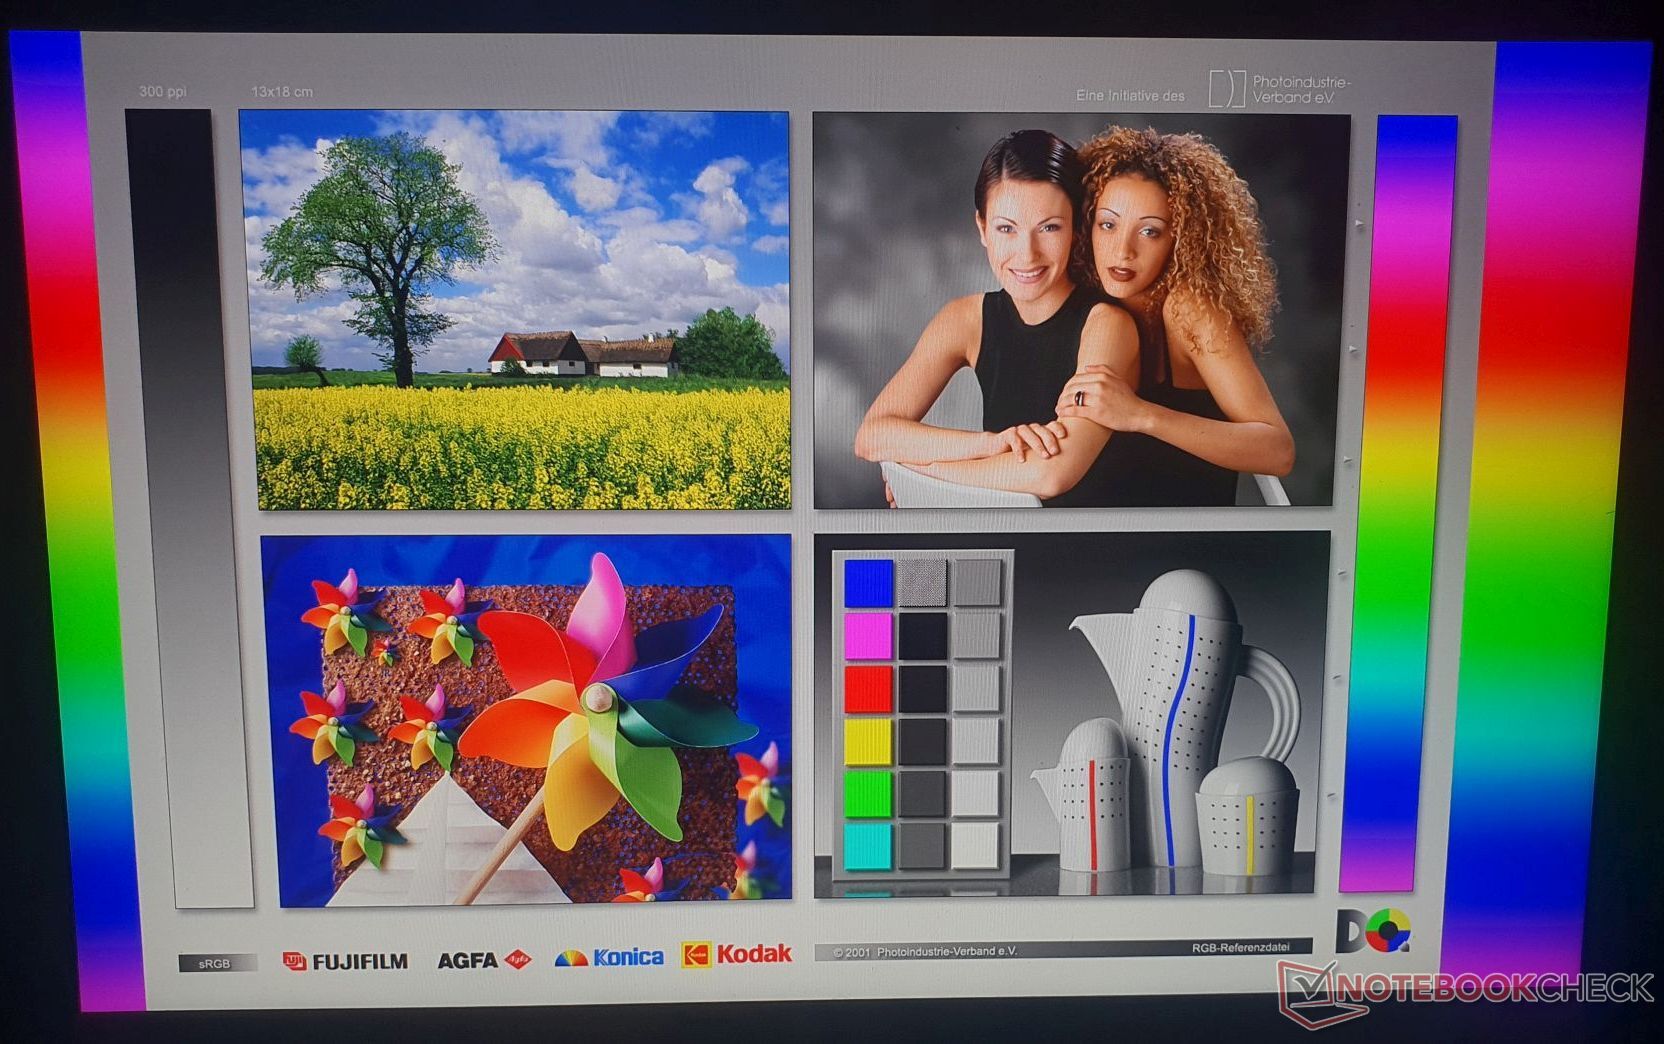
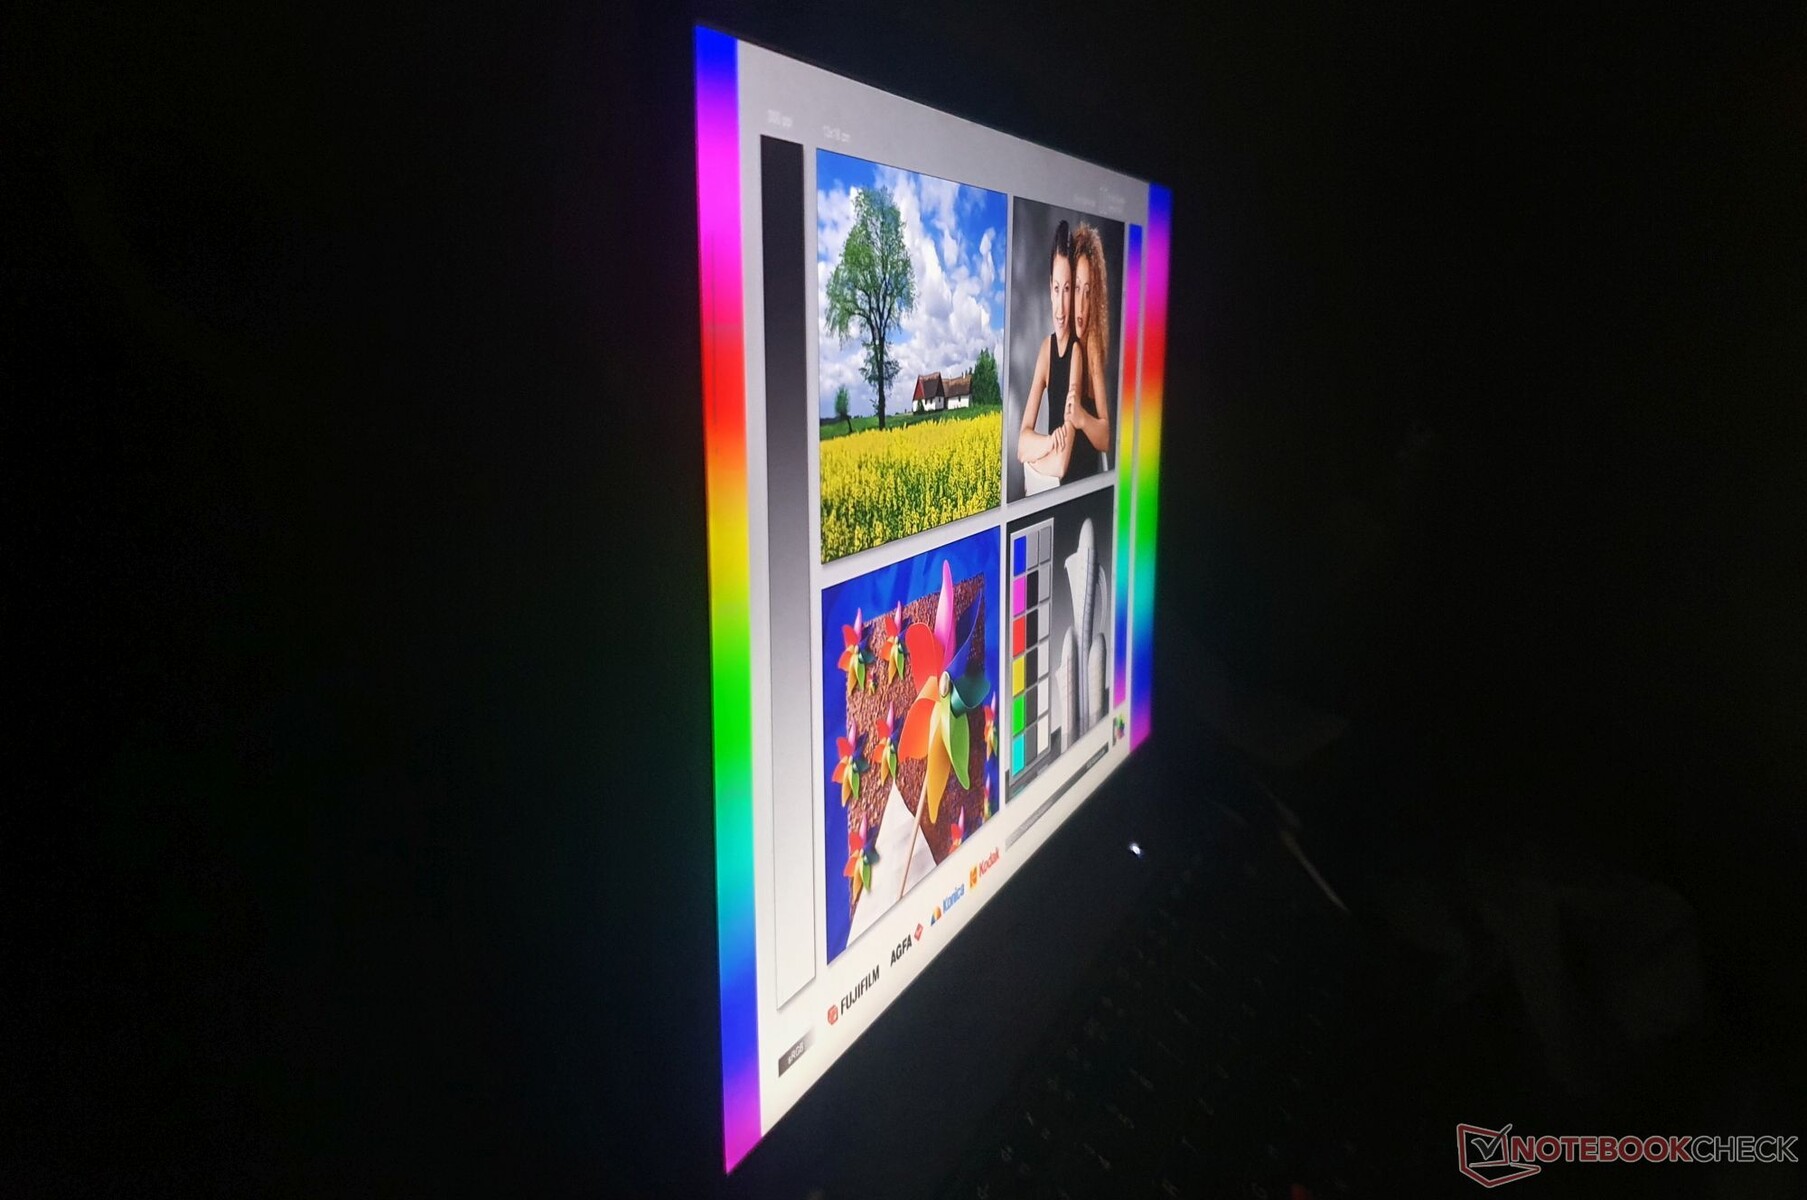
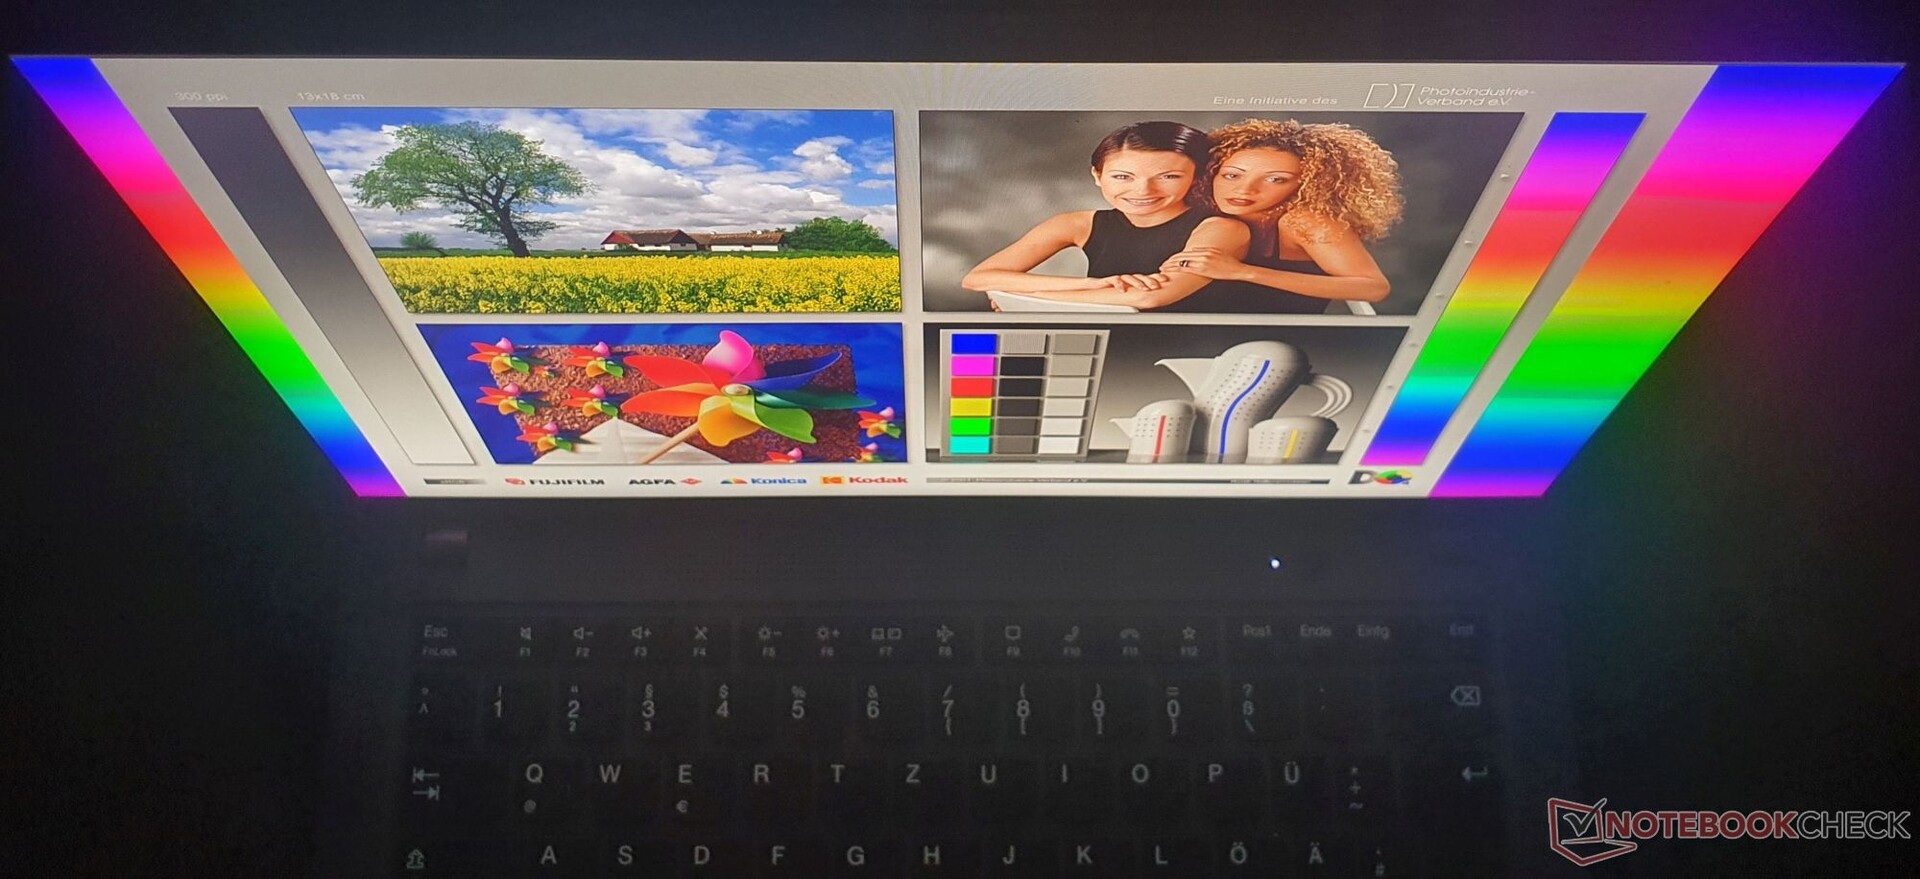
L'écran à faible consommation d'énergie n'est pas assez lumineux
L'écran basse consommation de notre unité de revue a une résolution de 1 920 x 1 200 (WUXGA/FHD+) et offre une netteté suffisante pour sa taille de 14 pouces. Le rapport d'aspect 16:10 a finalement fait son chemin vers la série T ; en revanche, le X13 l'a déjà eu l'année dernière.
Lors de nos tests, l'écran mat n'a réussi à obtenir qu'une luminosité de 300 cd/m² au lieu des 400 cd/m² annoncés par Lenovo. Cela pourrait poser un problème lorsque vous utilisez l'ordinateur portable en extérieur. Nous avons déjà testé le même écran lors de l'examen du X1 Yoga G7 et nous avons constaté qu'il ne répondait pas non plus aux spécifications avec 360 cd/m². À titre de comparaison, l'écran basse consommation du ThinkPad T14 G3 Test du Lenovo ThinkPad T14 G3 : le PC portable professionnel meilleur avec AMD Ryzen Pro était nettement plus lumineux avec 435 cd/m². Il s'agit encore une fois d'un exemple de loterie d'affichage causée par le fait que Lenovo utilise différents fournisseurs de pièces.
Lenovo propose six options d'affichage pour les T14. Cependant, l'écran 2.2K n'est pas arrivé sur le marché européen
- FHD+, 300 cd/m², 45% NTSC
- FHD+, 400 cd/m², 800:1, faible consommation, 100% sRGB
- FHD+, 300 cd/m², écran tactile, 45% NTSC
- FHD+, 500 cd/m², Privacy Guard + écran tactile, 100% sRGB,
- 2.2K, 300 cd/m², faible lumière bleue, 100% sRGB
- 2.8K, 400 cd/m², OLED, antireflet, 100% DCI-P3, HDR 500, Eyesafe
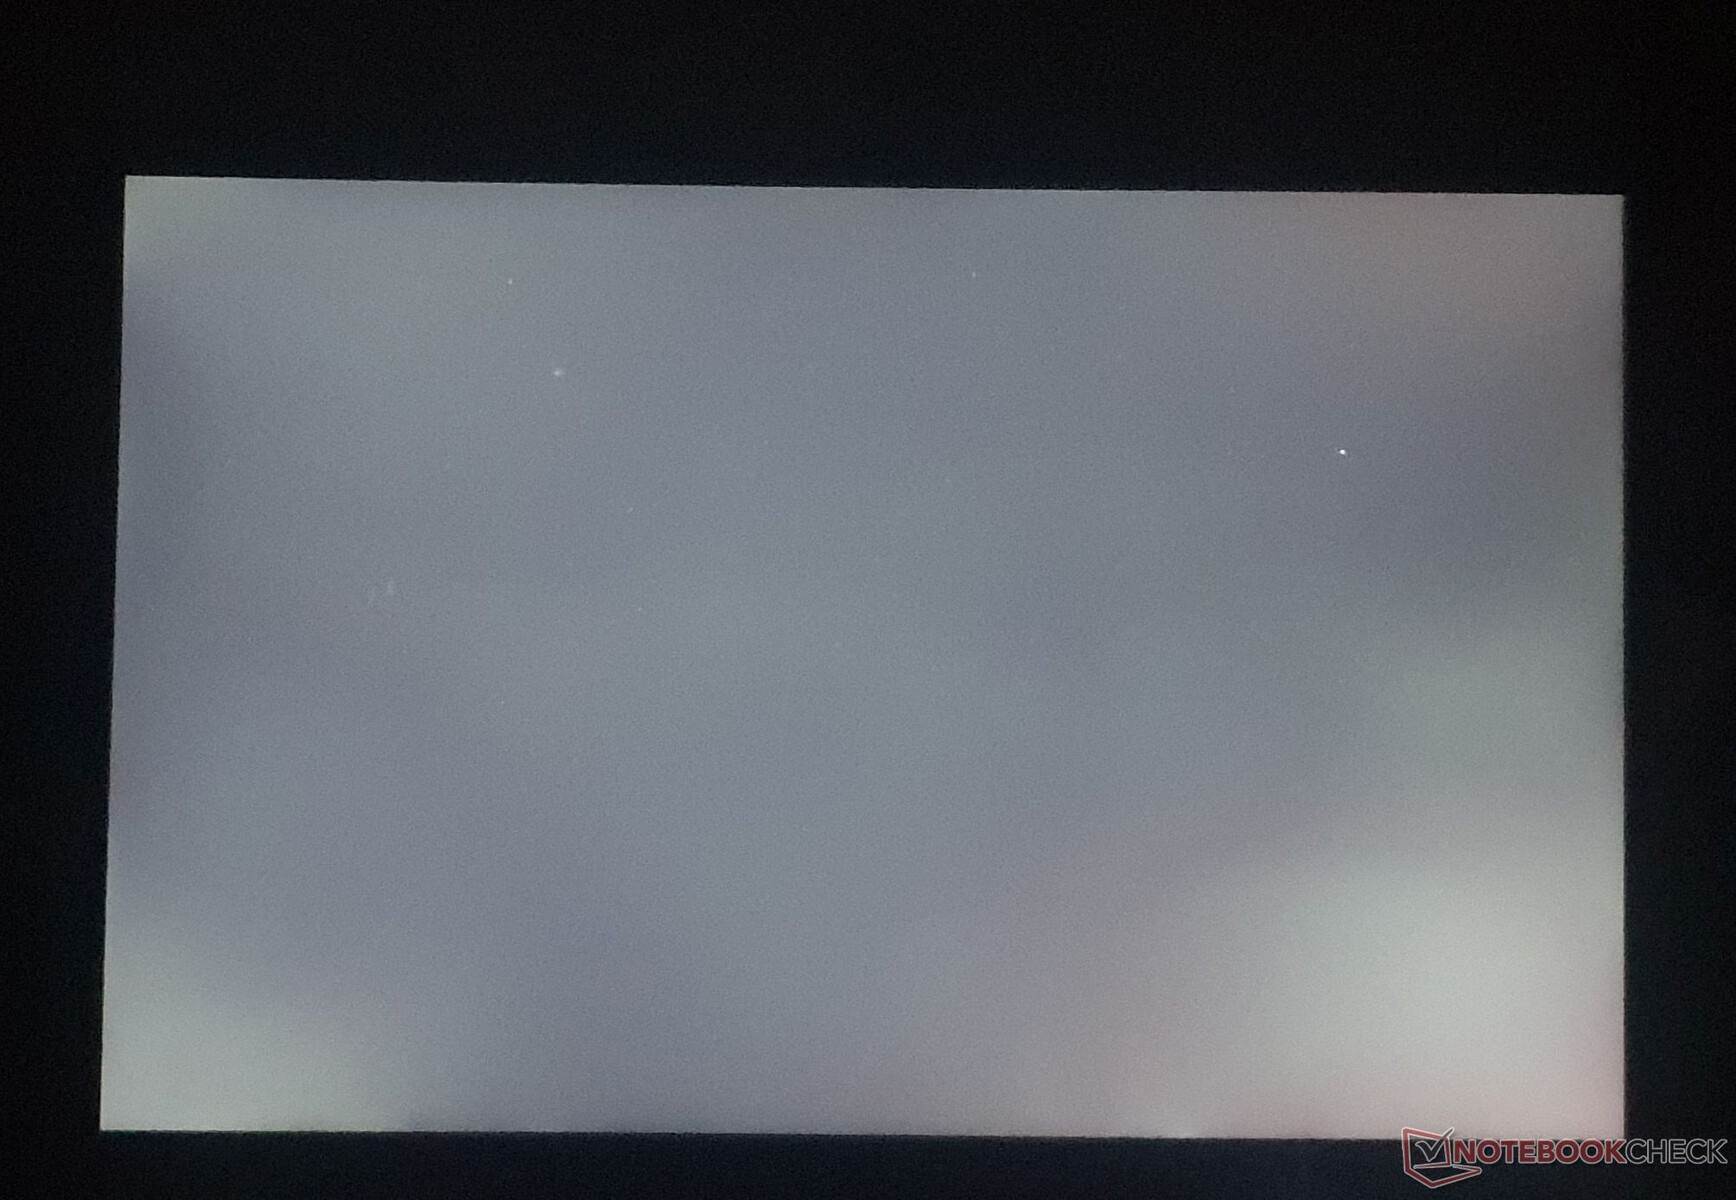
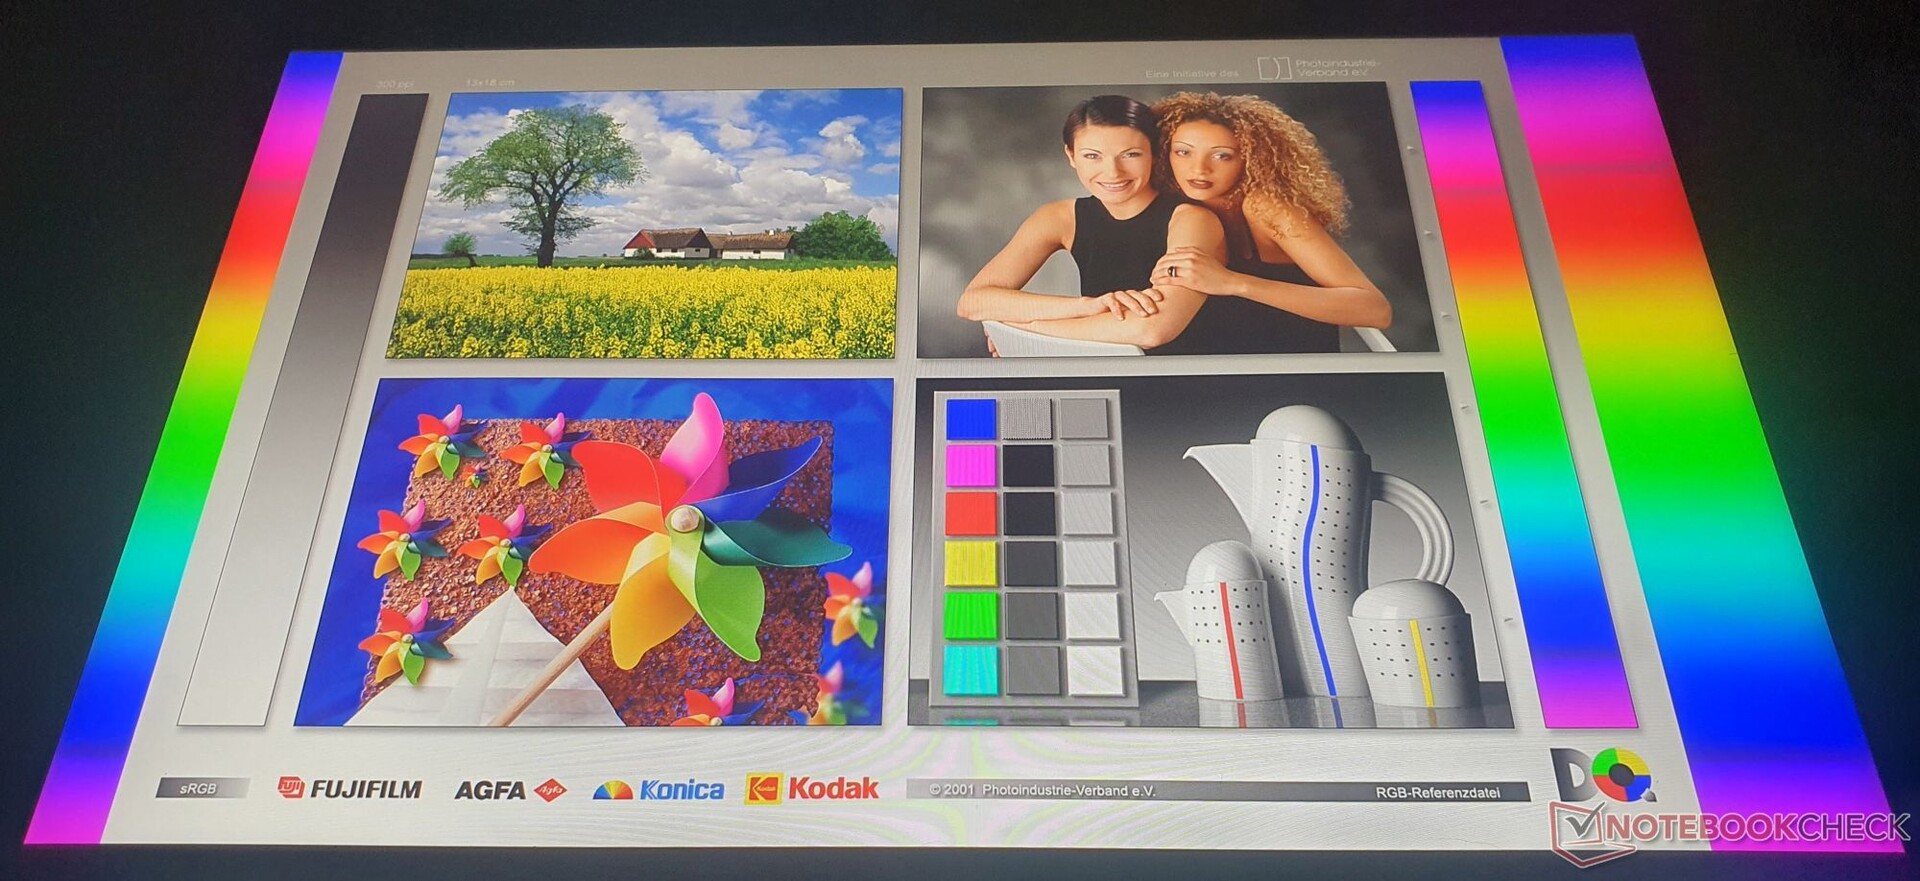
Le nouvel écran OLED remplace l'option 4K/UHD sur le T14s. Le contraste de 1 950:1 et le niveau de noir de 0,16 cd/m² sont excellents pour un écran IPS, ce qui donne des noirs riches et profonds. À 6 196 K, le point blanc de l'écran manque un peu le niveau optimal (6 500 K). L'un des inconvénients de l'écran est qu'il présente un trouble important, que l'on peut facilement constater sur un fond sombre. Sur notre unité d'examen, nous avons également trouvé un pixel défectueux mais n'avons pas détecté de scintillement PWM. Comme c'est souvent le cas avec les écrans à faible puissance, cette dalle présente un fort effet fantôme.
| |||||||||||||||||||||||||
Homogénéité de la luminosité: 93 %
Valeur mesurée au centre, sur batterie: 312 cd/m²
Contraste: 1950:1 (Valeurs des noirs: 0.16 cd/m²)
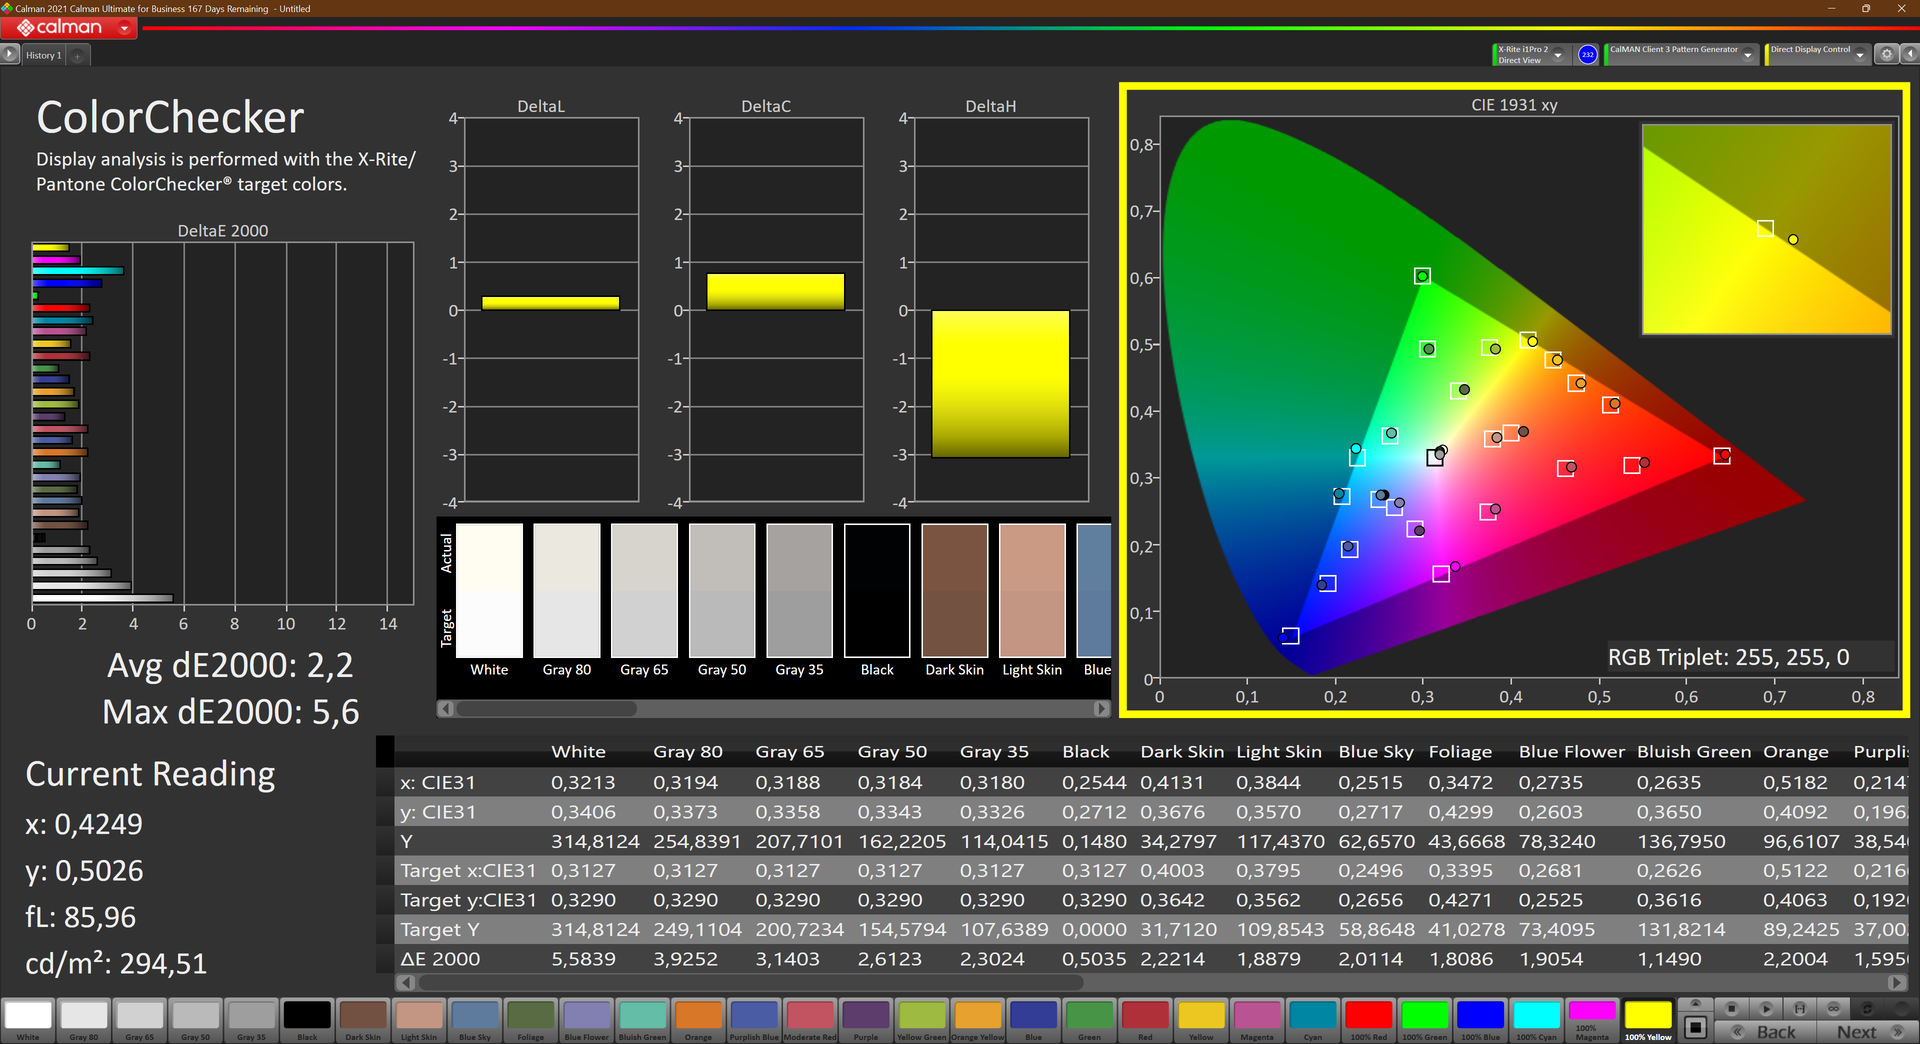
ΔE ColorChecker Calman: 2.2 | ∀{0.5-29.43 Ø4.71}
calibrated: 1.3
ΔE Greyscale Calman: 2.7 | ∀{0.09-98 Ø4.96}
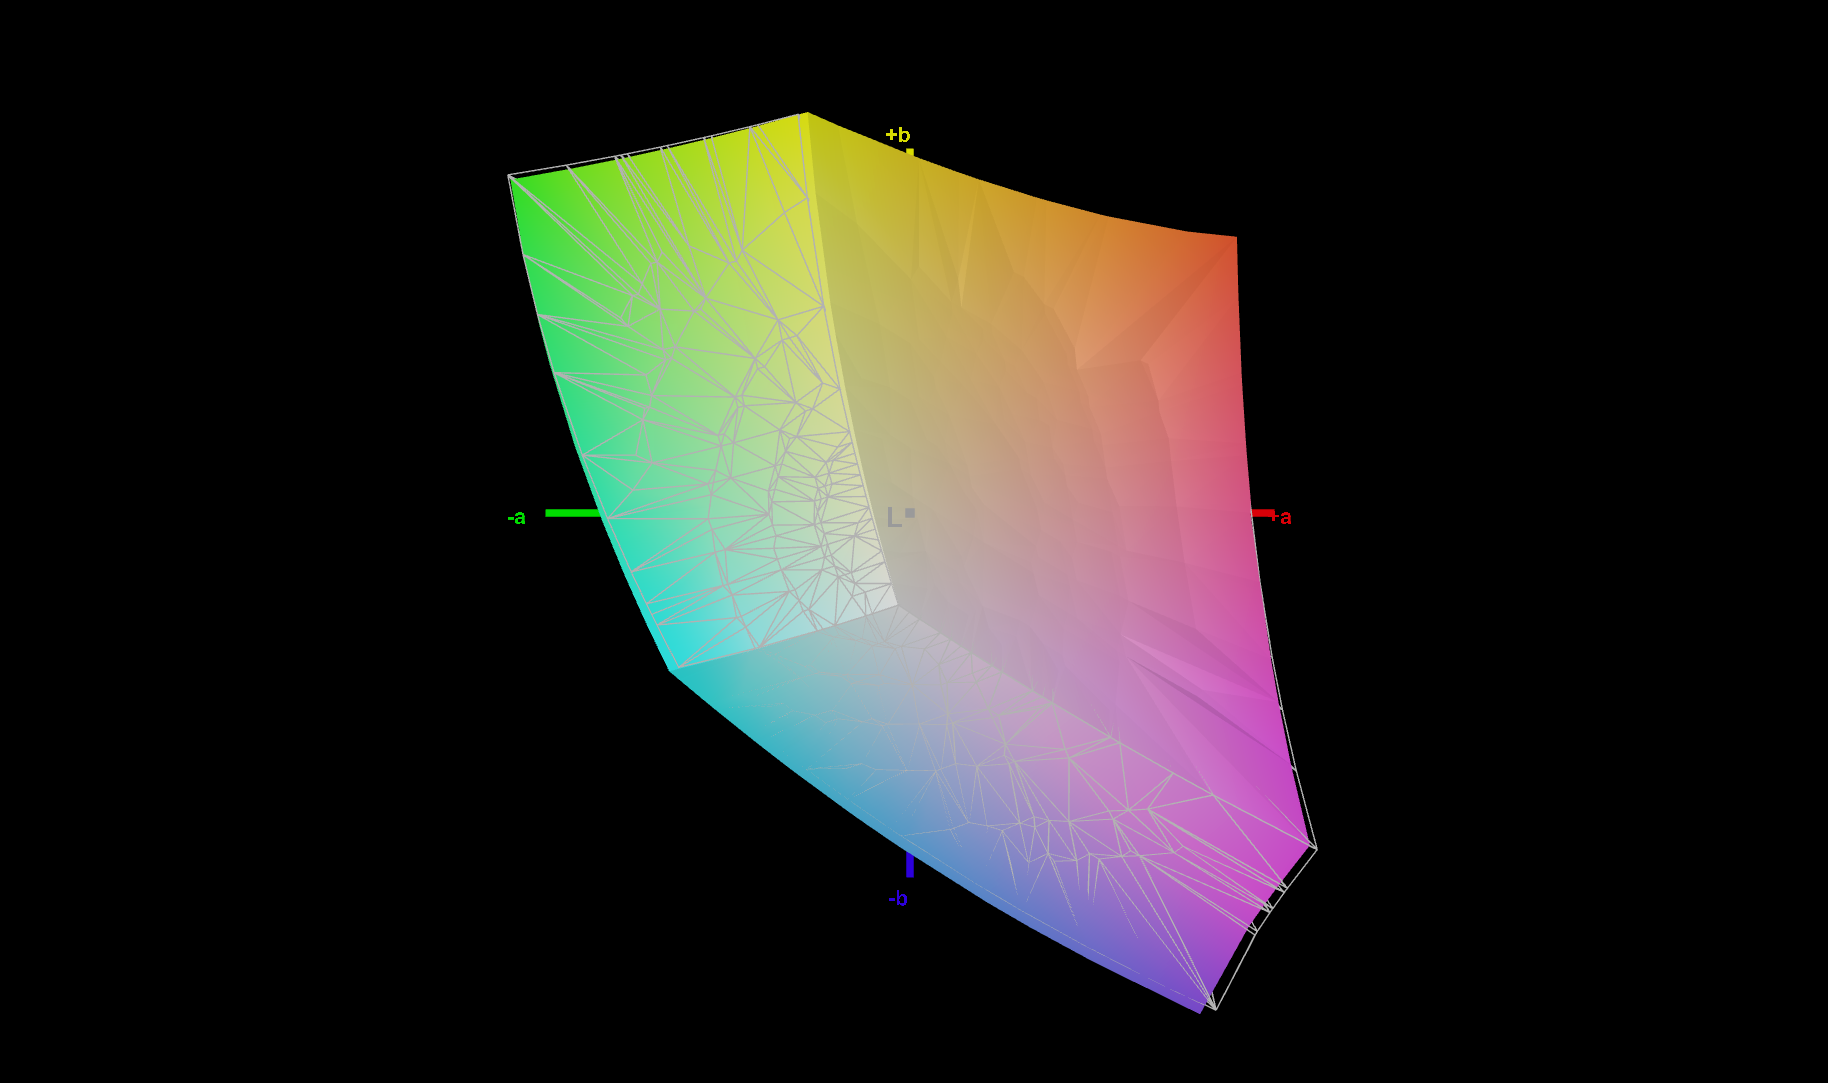
70.1% AdobeRGB 1998 (Argyll 3D)
98.6% sRGB (Argyll 3D)
67.8% Display P3 (Argyll 3D)
Gamma: 2.11
CCT: 6196 K
| Lenovo ThinkPad T14s G3 21BR00CDGE MNE007JA1-1, IPS LED, 1920x1200, 14" | Lenovo ThinkPad T14s G2 20WM003TGE NE140FHM-N61, IPS LED, 1920x1080, 14" | Lenovo ThinkPad T14 G3-21CF004NGE LP140WU1-SPB2, IPS, 1920x1200, 14" | Lenovo ThinkPad X1 Yoga G7 21CE002HGE MNE007JA1-1, IPS, 1920x1200, 14" | Lenovo ThinkPad X1 Carbon G10 21CC001RGE B140UAN02.1, IPS LED, 1920x1200, 14" | HP EliteBook 845 G9 6F6H9EA AUOA49A, IPS, 1920x1200, 14" | Dell Latitude 7420 JW6MH Chi Mei CMN1416 CHF07 140HCG, IPS, 1920x1080, 14" | Schenker Vision 14 2022 RTX 3050 Ti MNE007ZA1-1, IPS, 2880x1800, 14" | |
|---|---|---|---|---|---|---|---|---|
| Display | -4% | 1% | 2% | 6% | 7% | 0% | 5% | |
| Display P3 Coverage (%) | 67.8 | 68.1 0% | 69.2 2% | 69.3 2% | 74.6 10% | 75.4 11% | 68 0% | 74.1 9% |
| sRGB Coverage (%) | 98.6 | 91.7 -7% | 97.4 -1% | 99.7 1% | 98.6 0% | 100 1% | 99 0% | 97.4 -1% |
| AdobeRGB 1998 Coverage (%) | 70.1 | 67.1 -4% | 71.5 2% | 71.3 2% | 76.5 9% | 76.6 9% | 70 0% | 75.3 7% |
| Response Times | -45% | 15% | 9% | 1% | -20% | -15% | 36% | |
| Response Time Grey 50% / Grey 80% * (ms) | 41.4 ? | 68 ? -64% | 41.4 ? -0% | 42 ? -1% | 45.5 ? -10% | 58.8 ? -42% | 55 ? -33% | 31.5 ? 24% |
| Response Time Black / White * (ms) | 27.2 ? | 34 ? -25% | 19.2 ? 29% | 22.4 ? 18% | 24 ? 12% | 26.7 ? 2% | 26 ? 4% | 14.5 ? 47% |
| PWM Frequency (Hz) | 22730 ? | 53050 ? | ||||||
| Screen | -46% | 7% | 17% | -15% | 4% | 15% | -21% | |
| Brightness middle (cd/m²) | 312 | 422.9 36% | 451 45% | 371 19% | 372 19% | 408 31% | 408 31% | 421 35% |
| Brightness (cd/m²) | 301 | 397 32% | 435 45% | 363 21% | 362 20% | 402 34% | 378 26% | 416 38% |
| Brightness Distribution (%) | 93 | 91 -2% | 94 1% | 92 -1% | 94 1% | 92 -1% | 86 -8% | 89 -4% |
| Black Level * (cd/m²) | 0.16 | 0.32 -100% | 0.21 -31% | 0.21 -31% | 0.18 -13% | 0.24 -50% | 0.22 -38% | 0.28 -75% |
| Contrast (:1) | 1950 | 1322 -32% | 2148 10% | 1767 -9% | 2067 6% | 1700 -13% | 1855 -5% | 1504 -23% |
| Colorchecker dE 2000 * | 2.2 | 4.8 -118% | 2.4 -9% | 1.3 41% | 3.4 -55% | 2.09 5% | 1.54 30% | 3.2 -45% |
| Colorchecker dE 2000 max. * | 5.6 | 8.7 -55% | 4.1 27% | 2.6 54% | 6.7 -20% | 5.09 9% | 2.72 51% | 5.5 2% |
| Colorchecker dE 2000 calibrated * | 1.3 | 1.9 -46% | 1.3 -0% | 0.8 38% | 1.8 -38% | 1.56 -20% | 1.08 17% | 2 -54% |
| Greyscale dE 2000 * | 2.7 | 6.1 -126% | 3.3 -22% | 2.1 22% | 4.3 -59% | 1.7 37% | 1.95 28% | 4.4 -63% |
| Gamma | 2.11 104% | 2.23 99% | 2.13 103% | 2.15 102% | 2.13 103% | 2.138 103% | 2.33 94% | 2.22 99% |
| CCT | 6196 105% | 7635 85% | 6848 95% | 6759 96% | 6158 106% | 6628 98% | 6806 96% | 6384 102% |
| Moyenne finale (programmes/paramètres) | -32% /
-37% | 8% /
7% | 9% /
13% | -3% /
-8% | -3% /
1% | 0% /
7% | 7% /
-7% |
* ... Moindre est la valeur, meilleures sont les performances
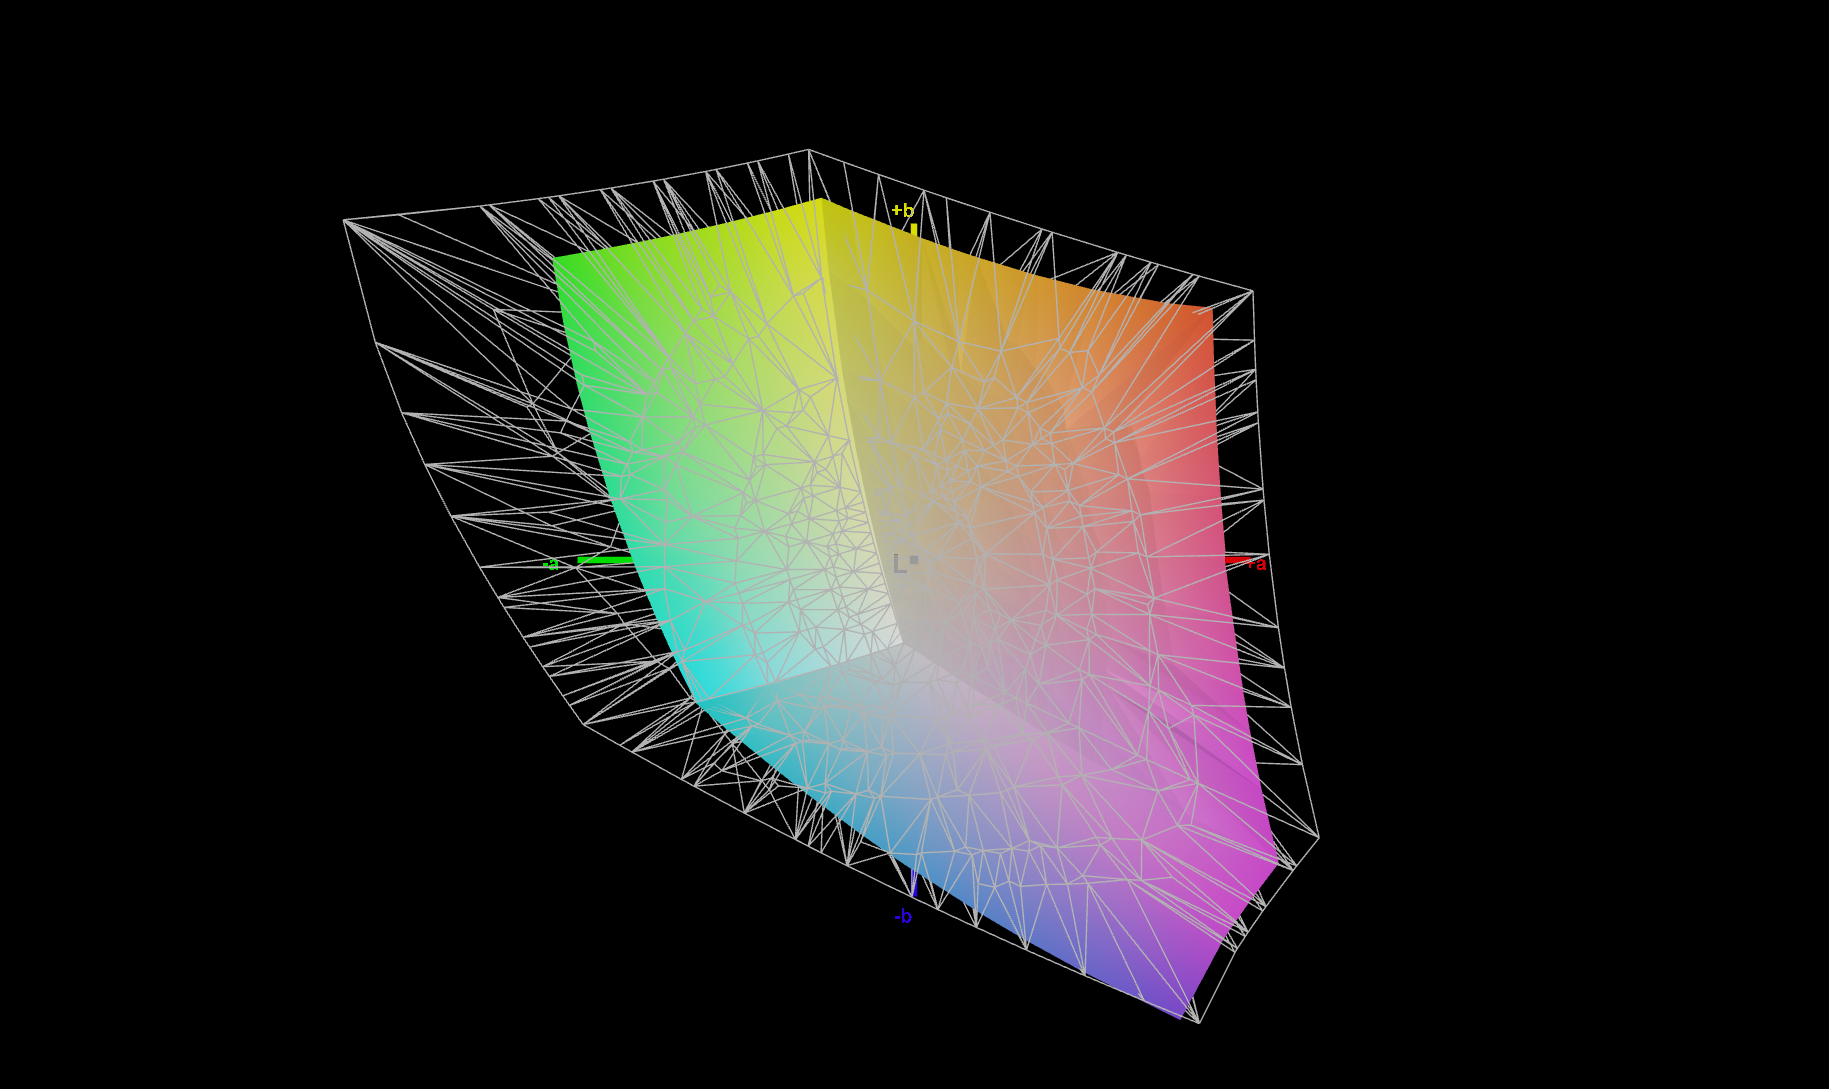
L'écran a une couverture sRGB de 99 %, ce qui signifie qu'il est adapté à la retouche photo professionnelle. Vous pouvez cliquer sur ici pour télécharger notre profil de couleur.
Au sortir de l'emballage, l'écran présentait une légère teinte rouge, qui a disparu après que nous l'ayons calibré. Les niveaux de Delta E sont restés pour la plupart en dessous du seuil de perceptibilité de 2,5. Le cyan était la seule exception, mais cela a également été corrigé par notre processus de calibrage. À son tour, la différence de couleur pour le bleu est passée à 3,1. Les nuances de gris s'écartaient considérablement des couleurs de référence au début, mais nous avons également pu réduire le delta E à une excellente valeur de moins de 1,5 grâce au calibrage.

Temps de réponse de l'écran
| ↔ Temps de réponse noir à blanc | ||
|---|---|---|
| 27.2 ms ... hausse ↗ et chute ↘ combinées | ↗ 14 ms hausse | 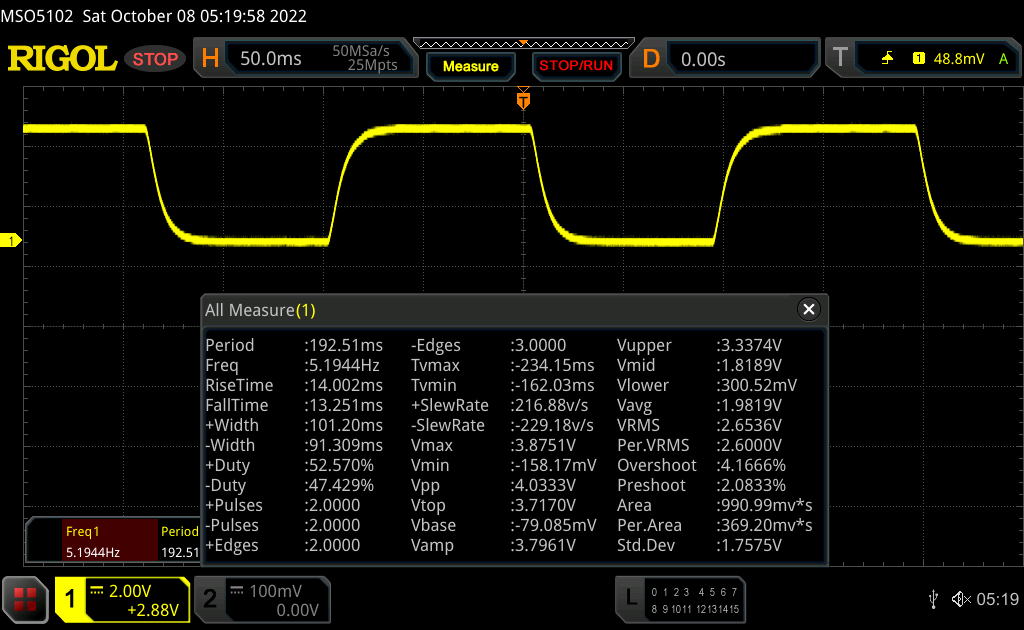 |
| ↘ 13.2 ms chute | ||
| L'écran souffre de latences relativement élevées, insuffisant pour le jeu. En comparaison, tous les appareils testés affichent entre 0.1 (minimum) et 240 (maximum) ms. » 69 % des appareils testés affichent de meilleures performances. Cela signifie que les latences relevées sont moins bonnes que la moyenne (19.8 ms) de tous les appareils testés. | ||
| ↔ Temps de réponse gris 50% à gris 80% | ||
| 41.4 ms ... hausse ↗ et chute ↘ combinées | ↗ 18.8 ms hausse | 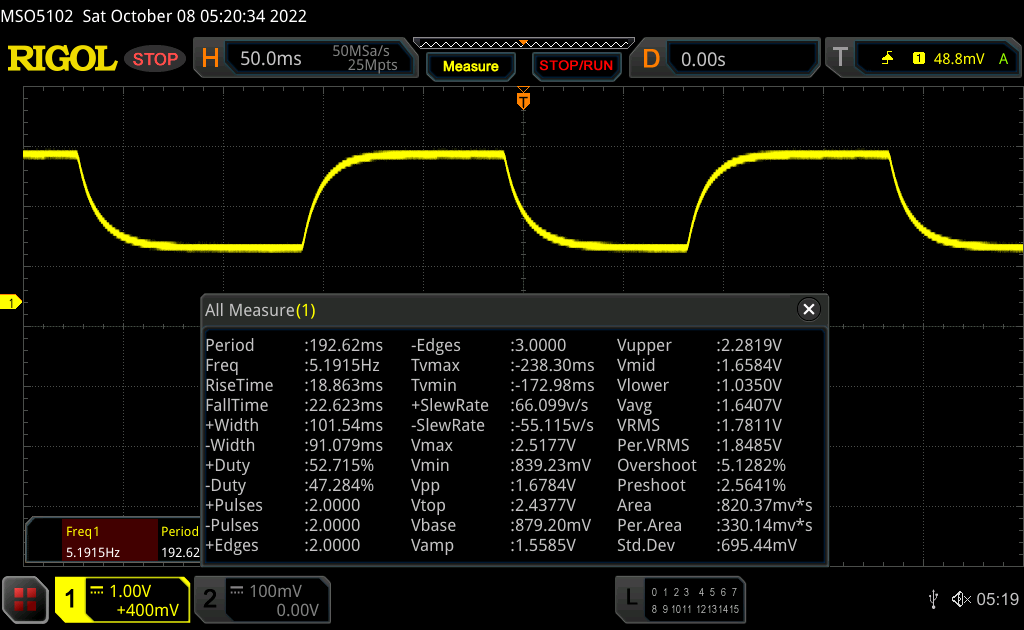 |
| ↘ 22.6 ms chute | ||
| L'écran souffre de latences très élevées, à éviter pour le jeu. En comparaison, tous les appareils testés affichent entre 0.165 (minimum) et 636 (maximum) ms. » 67 % des appareils testés affichent de meilleures performances. Cela signifie que les latences relevées sont moins bonnes que la moyenne (31 ms) de tous les appareils testés. | ||
Scintillement / MLI (Modulation de largeur d'impulsion)
| Scintillement / MLI (Modulation de largeur d'impulsion) non décelé |  | ||
En comparaison, 52 % des appareils testés n'emploient pas MDI pour assombrir leur écran. Nous avons relevé une moyenne à 7757 (minimum : 5 - maximum : 343500) Hz dans le cas où une MDI était active. | |||
L'écran étant mat et d'une luminosité juste suffisante (300 cd/m²), vous pourrez toujours lire le contenu de l'écran en extérieur, à condition que le temps soit nuageux ou que vous trouviez un endroit ombragé. Mais vous devez éviter d'utiliser l'ordinateur portable en plein soleil.
Performances : Alder Lake-U déploie son potentiel dans le ThinkPad T14s
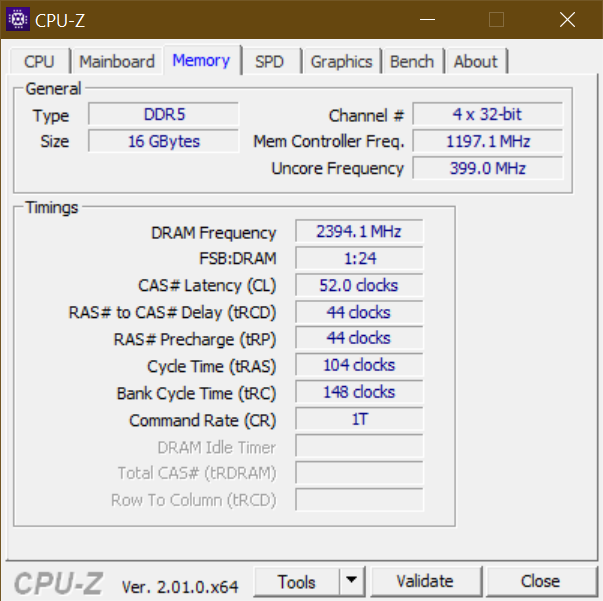
Notre ThinkPad T14s est équipé de 16 Go de RAM LPDDR5 4800 soudée (configurable jusqu'à 32 Go) et d'un SSD PCIe 4.0 d'une capacité de 512 Go. Il est alimenté par un Intel Core i5-1235U avec un iGPU Xe G7. Vous pouvez configurer le ThinkPad T14s G3 avec un puissant Core i7-1280P. Cet ordinateur portable est principalement destiné aux applications de bureau et d'entreprise plutôt qu'au montage vidéo et aux jeux. Au mieux, la variante basée sur AMD et dotée d'un processeur Ryzen 7 PRO 6850U et un processeur intégré Radeon 680Mintégrée, ne peut offrir qu'une performance globale acceptable pour de tels cas d'utilisation.
Conditions d'essai
Lenovo ne met pas ses propres profils de performances sur les ThinkPads, mais les intègre plutôt dans les paramètres d'alimentation de Windows. Lors de l'exécution des tests de performance, nous avons sélectionné le profil "Best Performance" et désactivé le mode automatique dans Intelligent Cooling (en appuyant sur Fn+T).
- Dans ce mode, nous avons mesuré des limites de puissance de 52 W (Turbo) et ~33 W (soutenu)
- Sur batterie, le mode "Better Performance" limite PL1 à 27,5 W.
- En mode "Plus d'efficacité énergétique", la consommation d'énergie est réduite des deux tiers, à 11 W.
Processeur
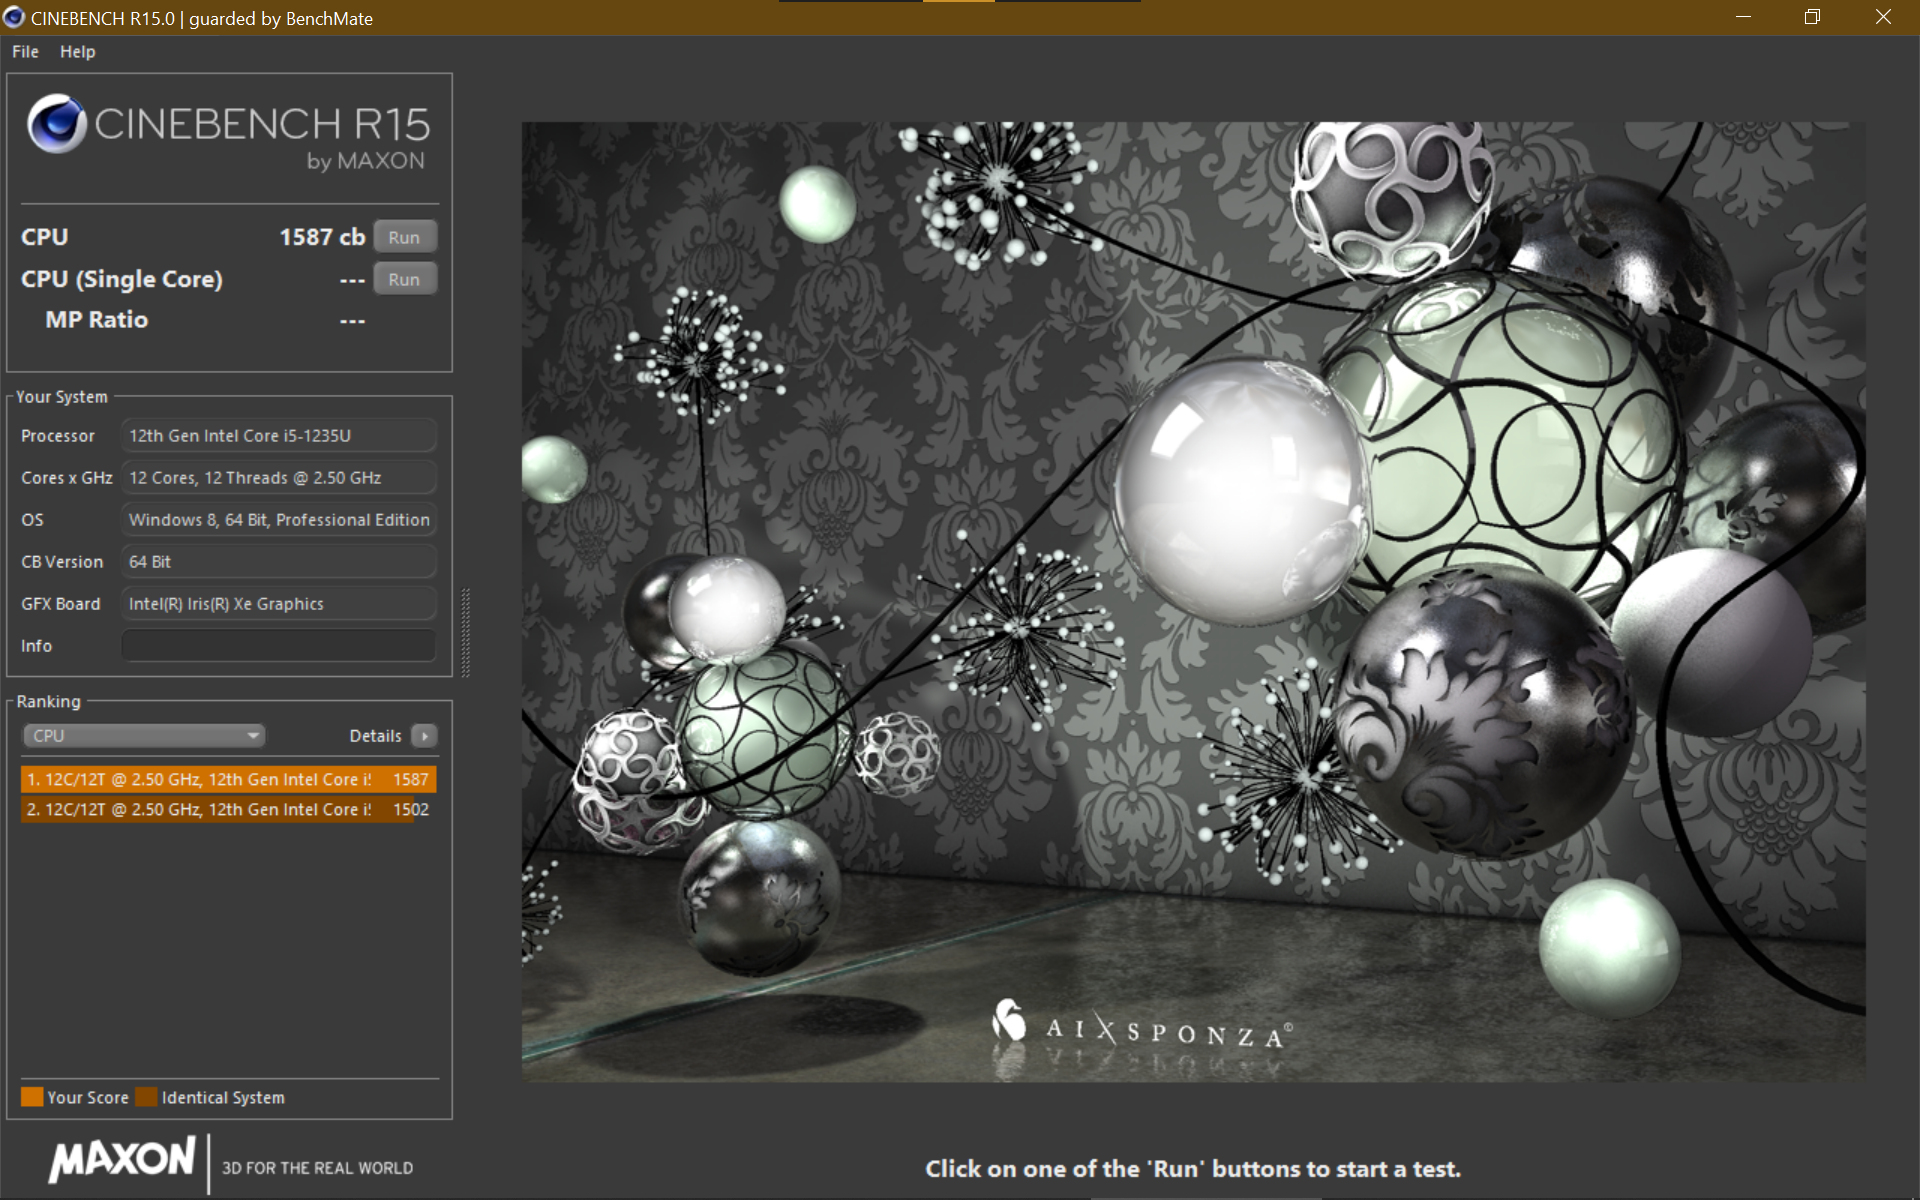
Le site Intel Core i5-1235U n'a que deux noyaux P et un TDP de 15 W, que Lenovo a porté à plus de 30 W. L'exécution de Cinebench R15 en boucle a révélé que les performances soutenues du processeur sont juste un peu inférieures à celles du Core i7-1270P dans le ThinkPad X1 Yoga G7 (PL1 de 28 W). Ses performances sont même supérieures d'environ 10 % à celles du Core i7 des CB R20/R23.
Bien qu'il ait deux fois plus de P-cores, le Core i5-1240Pdans le ThinkPad T16 (PL1 de 20 W) a obtenu des performances inférieures de 25 % dans le CB R15 et de 40 % dans le CB R23. Bien qu'ils aient la même dissipation d'énergie, les processeurs AMD Ryzen 7 PRO 6850U dans le ThinkPad T14 a une avance de 33 % sur le processeur du T14s G3. Le Ryzen 5 PRO 6650U dans le EliteBook 845 G9 et ThinkPad Z13 ont presque le même niveau de performance que le Core i5 de notre unité d'examen.
La technologie Turbo Boost est capable de déployer son potentiel mieux dans le CPU de la série U que dans le Core i5-1250P qui équipe le ThinkPad X1 Carbon G10tandis que le T14s G2 équipé d'un CPU Tiger Lake-Uest en retard de 50 % sur le T14s G3, ce qui représente un excellent gain de performances sur une génération de GPU. Le Schenker Vision 14 avec un Core i7-12700H est le vainqueur de cette comparaison. Ce processeur combine six P-cores avec un PL1 de 40 W, ce qui se traduit par des performances supérieures d'environ 60 %. A Core i7-1280P est tout aussi rapide, comme vous pouvez le constater sur le Lenovo Yoga Slim 9 (PL1 de 35 W). Vous pouvez également configurer les ThinkPad T14 avec ce processeur, mais il n'est pas disponible dans la région EMEA.
Cinebench R15 Multi Sustained Load
* ... Moindre est la valeur, meilleures sont les performances
AIDA64: FP32 Ray-Trace | FPU Julia | CPU SHA3 | CPU Queen | FPU SinJulia | FPU Mandel | CPU AES | CPU ZLib | FP64 Ray-Trace | CPU PhotoWorxx
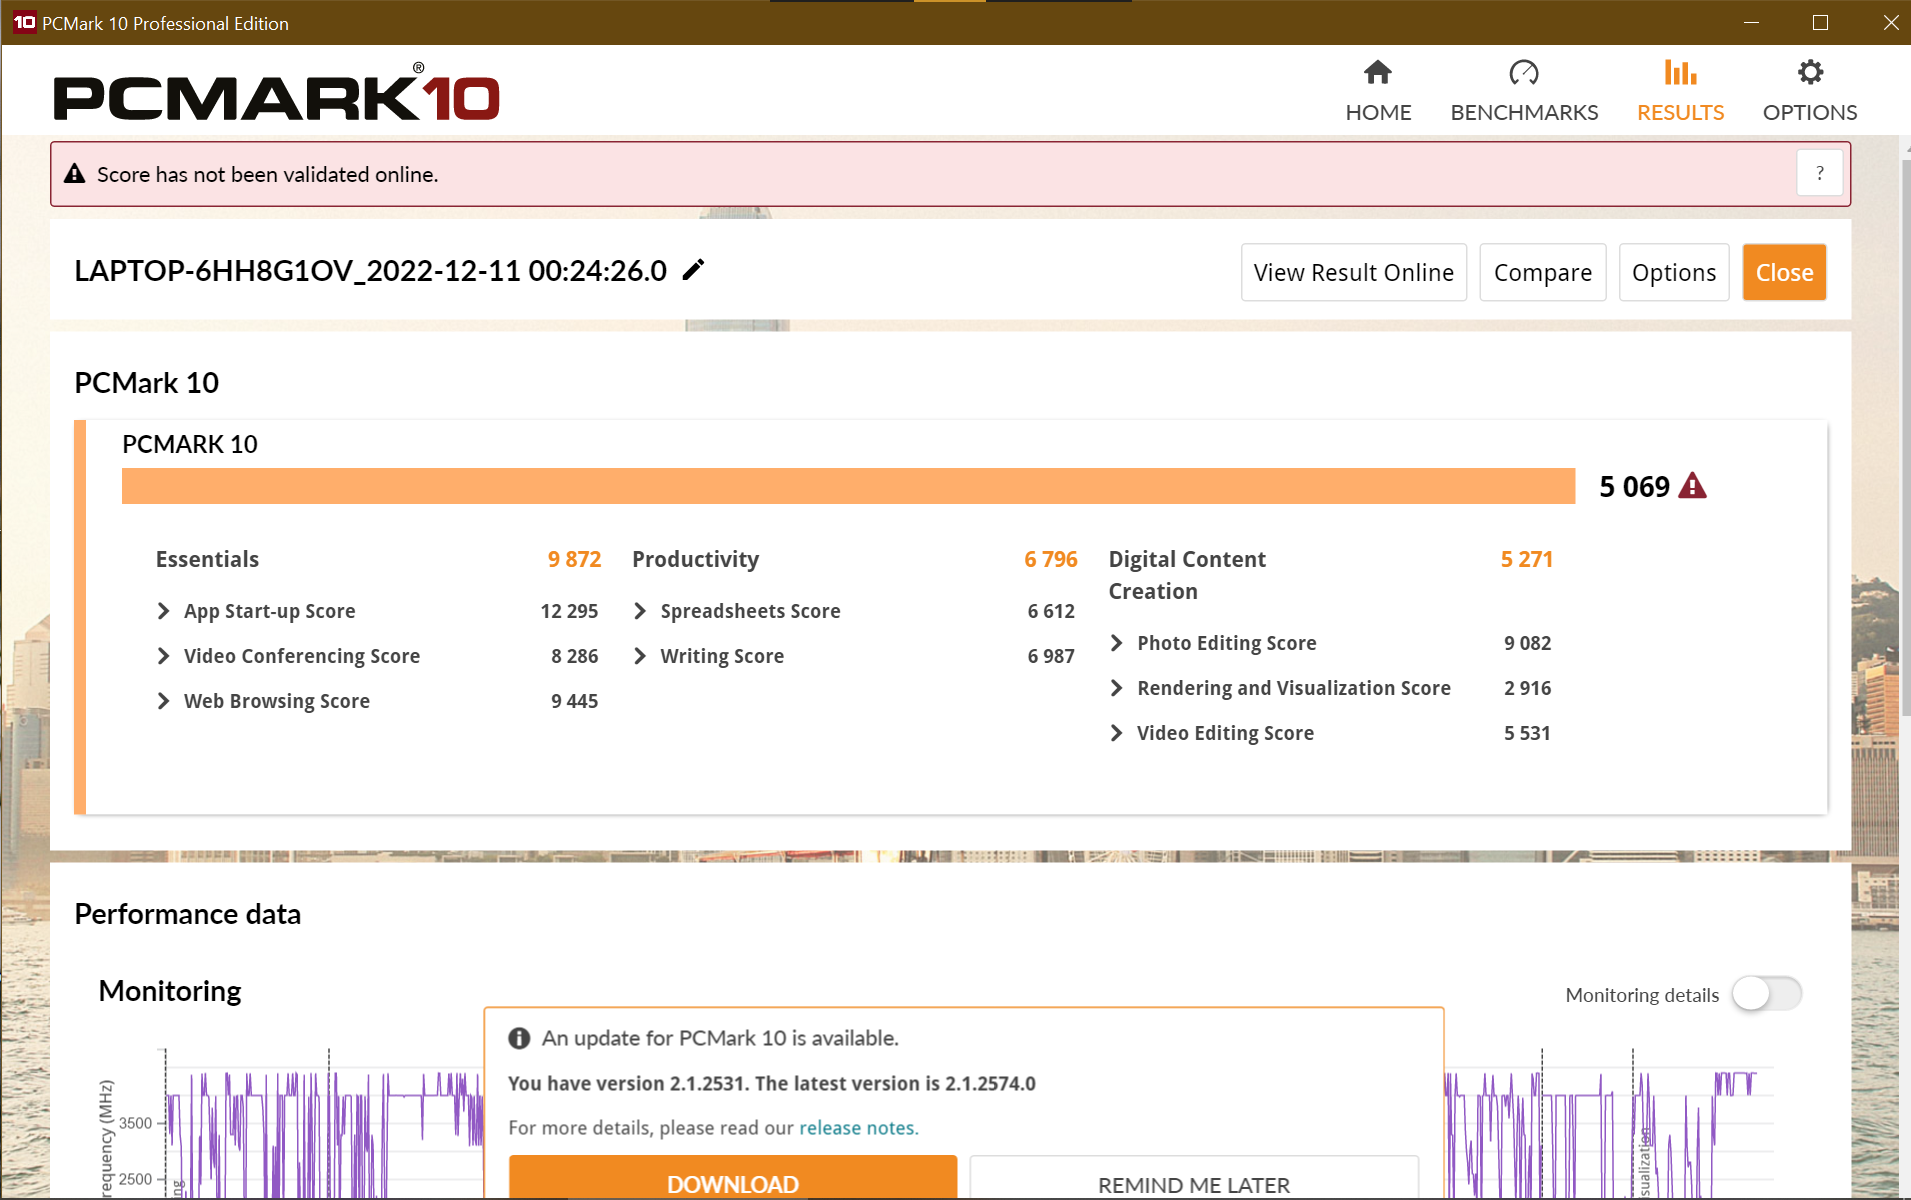
Performance du système
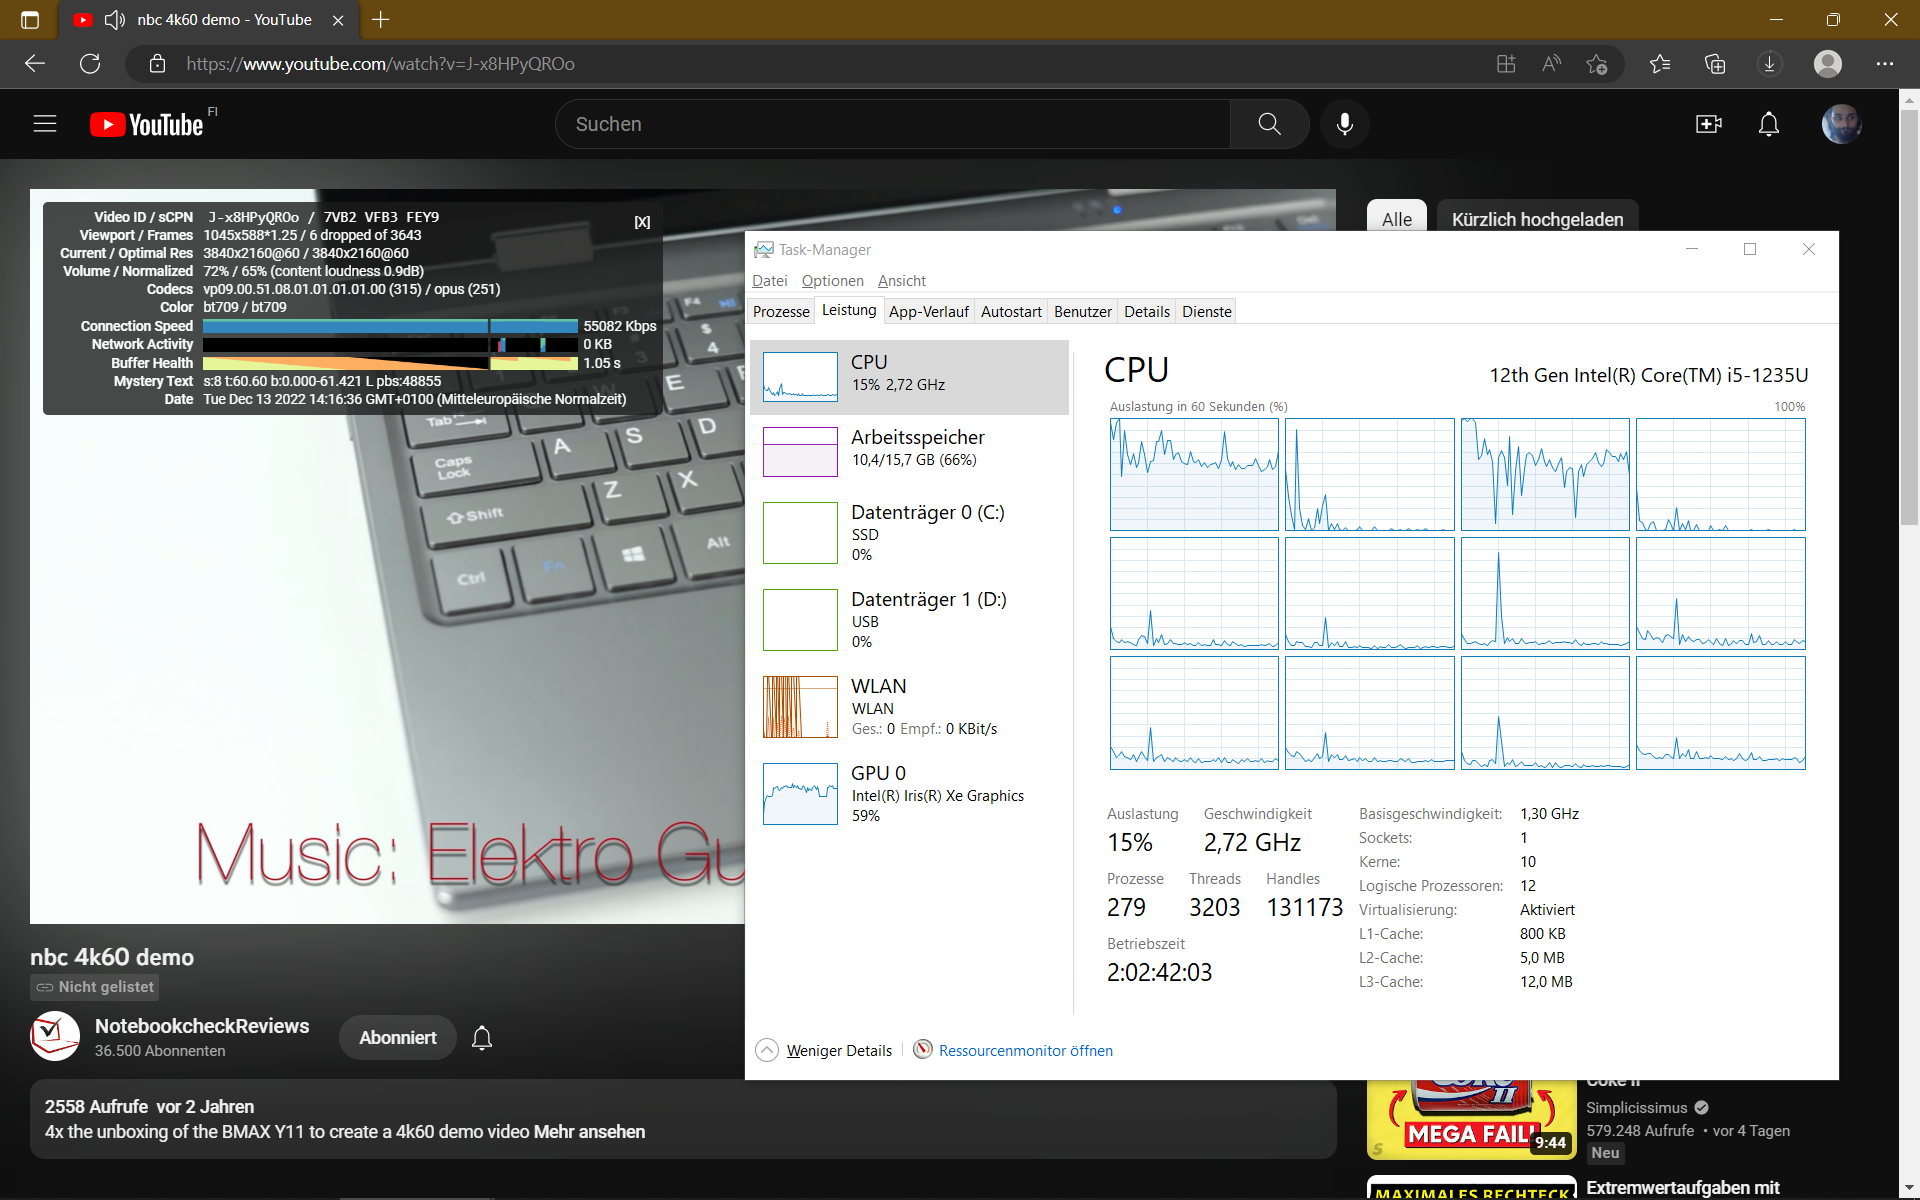
Grâce au puissant turbo et aux hautes performances monocœur, le système est très réactif, notamment lors de la navigation sur le web. Il ne perd pas en vivacité, même lorsqu'une vidéo YouTube 4K est lue en même temps. Dans PCMark 10, le ThinkPad T14 G3 AMD a une avance de 20 % sur les T14, et le Schenker Vision 14 est en tête avec une nette marge.
CrossMark: Overall | Productivity | Creativity | Responsiveness
Sunspider: 1.0 Total Score
Mozilla Kraken 1.1: Total
Speedometer 2.0: Result 2.0
Octane V2: Total Score
Jetstream 2: 2.0 Total
WebXPRT 3: Overall
WebXPRT 4: Overall
| PCMark 10 / Score | |
| Schenker Vision 14 2022 RTX 3050 Ti | |
| Moyenne de la classe Office (2601 - 9298, n=67, 2 dernières années) | |
| Lenovo ThinkPad T14 G3-21CF004NGE | |
| HP EliteBook 845 G9 6F6H9EA | |
| Lenovo ThinkPad T14s G2 20WM003TGE | |
| Lenovo ThinkPad T14s G3 21BR00CDGE | |
| Lenovo ThinkPad X1 Carbon G10 21CC001RGE | |
| Lenovo ThinkPad T16 G1 21BWS00200 | |
| Moyenne Intel Core i5-1235U, Intel Iris Xe Graphics G7 80EUs (4528 - 5543, n=8) | |
| Dell Latitude 7420 JW6MH | |
| Lenovo ThinkPad X13 G3 21BN0046GE | |
| PCMark 10 / Essentials | |
| Schenker Vision 14 2022 RTX 3050 Ti | |
| Lenovo ThinkPad T14s G2 20WM003TGE | |
| Lenovo ThinkPad X1 Carbon G10 21CC001RGE | |
| Moyenne de la classe Office (3245 - 11594, n=67, 2 dernières années) | |
| Moyenne Intel Core i5-1235U, Intel Iris Xe Graphics G7 80EUs (9143 - 11273, n=8) | |
| Lenovo ThinkPad T14s G3 21BR00CDGE | |
| Dell Latitude 7420 JW6MH | |
| Lenovo ThinkPad T14 G3-21CF004NGE | |
| HP EliteBook 845 G9 6F6H9EA | |
| Lenovo ThinkPad T16 G1 21BWS00200 | |
| Lenovo ThinkPad X13 G3 21BN0046GE | |
| PCMark 10 / Productivity | |
| Moyenne de la classe Office (5336 - 17243, n=67, 2 dernières années) | |
| HP EliteBook 845 G9 6F6H9EA | |
| Schenker Vision 14 2022 RTX 3050 Ti | |
| Lenovo ThinkPad T14 G3-21CF004NGE | |
| Lenovo ThinkPad T14s G2 20WM003TGE | |
| Lenovo ThinkPad T14s G3 21BR00CDGE | |
| Moyenne Intel Core i5-1235U, Intel Iris Xe Graphics G7 80EUs (6440 - 7354, n=8) | |
| Lenovo ThinkPad X1 Carbon G10 21CC001RGE | |
| Dell Latitude 7420 JW6MH | |
| Lenovo ThinkPad X13 G3 21BN0046GE | |
| Lenovo ThinkPad T16 G1 21BWS00200 | |
| PCMark 10 / Digital Content Creation | |
| Schenker Vision 14 2022 RTX 3050 Ti | |
| Moyenne de la classe Office (2049 - 13541, n=67, 2 dernières années) | |
| Lenovo ThinkPad T14 G3-21CF004NGE | |
| HP EliteBook 845 G9 6F6H9EA | |
| Lenovo ThinkPad T16 G1 21BWS00200 | |
| Lenovo ThinkPad T14s G2 20WM003TGE | |
| Lenovo ThinkPad T14s G3 21BR00CDGE | |
| Lenovo ThinkPad X1 Carbon G10 21CC001RGE | |
| Dell Latitude 7420 JW6MH | |
| Moyenne Intel Core i5-1235U, Intel Iris Xe Graphics G7 80EUs (4220 - 5839, n=8) | |
| Lenovo ThinkPad X13 G3 21BN0046GE | |
| CrossMark / Overall | |
| Schenker Vision 14 2022 RTX 3050 Ti | |
| Lenovo ThinkPad X1 Carbon G10 21CC001RGE | |
| Lenovo ThinkPad T14s G3 21BR00CDGE | |
| Moyenne de la classe Office (381 - 2010, n=74, 2 dernières années) | |
| Apple MacBook Air M2 Entry | |
| Apple MacBook Pro 14 2021 M1 Pro Entry | |
| Lenovo ThinkPad T14 G3-21CF004NGE | |
| Lenovo ThinkPad X13 G3 21BN0046GE | |
| Lenovo ThinkPad T16 G1 21BWS00200 | |
| Moyenne Intel Core i5-1235U, Intel Iris Xe Graphics G7 80EUs (983 - 1644, n=8) | |
| Dell Latitude 7420 JW6MH | |
| CrossMark / Productivity | |
| Schenker Vision 14 2022 RTX 3050 Ti | |
| Lenovo ThinkPad X1 Carbon G10 21CC001RGE | |
| Lenovo ThinkPad T14s G3 21BR00CDGE | |
| Moyenne de la classe Office (464 - 1880, n=74, 2 dernières années) | |
| Lenovo ThinkPad T16 G1 21BWS00200 | |
| Lenovo ThinkPad T14 G3-21CF004NGE | |
| Moyenne Intel Core i5-1235U, Intel Iris Xe Graphics G7 80EUs (1026 - 1676, n=8) | |
| Apple MacBook Air M2 Entry | |
| Lenovo ThinkPad X13 G3 21BN0046GE | |
| Dell Latitude 7420 JW6MH | |
| Apple MacBook Pro 14 2021 M1 Pro Entry | |
| CrossMark / Creativity | |
| Apple MacBook Pro 14 2021 M1 Pro Entry | |
| Apple MacBook Air M2 Entry | |
| Schenker Vision 14 2022 RTX 3050 Ti | |
| Lenovo ThinkPad X1 Carbon G10 21CC001RGE | |
| Moyenne de la classe Office (319 - 2361, n=74, 2 dernières années) | |
| Lenovo ThinkPad T14s G3 21BR00CDGE | |
| Lenovo ThinkPad T14 G3-21CF004NGE | |
| Lenovo ThinkPad X13 G3 21BN0046GE | |
| Moyenne Intel Core i5-1235U, Intel Iris Xe Graphics G7 80EUs (1032 - 1618, n=8) | |
| Lenovo ThinkPad T16 G1 21BWS00200 | |
| Dell Latitude 7420 JW6MH | |
| CrossMark / Responsiveness | |
| Schenker Vision 14 2022 RTX 3050 Ti | |
| Lenovo ThinkPad X1 Carbon G10 21CC001RGE | |
| Lenovo ThinkPad T14s G3 21BR00CDGE | |
| Lenovo ThinkPad X13 G3 21BN0046GE | |
| Lenovo ThinkPad T16 G1 21BWS00200 | |
| Moyenne de la classe Office (360 - 1820, n=74, 2 dernières années) | |
| Moyenne Intel Core i5-1235U, Intel Iris Xe Graphics G7 80EUs (746 - 1867, n=8) | |
| Dell Latitude 7420 JW6MH | |
| Lenovo ThinkPad T14 G3-21CF004NGE | |
| Apple MacBook Air M2 Entry | |
| Apple MacBook Pro 14 2021 M1 Pro Entry | |
| Sunspider / 1.0 Total Score | |
| Lenovo ThinkPad T16 G1 21BWS00200 | |
| Lenovo ThinkPad T14s G3 21BR00CDGE | |
| Moyenne Intel Core i5-1235U, Intel Iris Xe Graphics G7 80EUs (n=1) | |
| Moyenne de la classe Office (87.2 - 111.8, n=2, 2 dernières années) | |
| Apple MacBook Pro 14 2021 M1 Pro Entry | |
| Mozilla Kraken 1.1 / Total | |
| Lenovo ThinkPad X1 Carbon G10 21CC001RGE | |
| Dell Latitude 7420 JW6MH | |
| Lenovo ThinkPad T14s G2 20WM003TGE | |
| Lenovo ThinkPad X13 G3 21BN0046GE | |
| Lenovo ThinkPad X13 G3 21BN0046GE | |
| HP EliteBook 845 G9 6F6H9EA | |
| Lenovo ThinkPad T14 G3-21CF004NGE | |
| Lenovo ThinkPad T16 G1 21BWS00200 | |
| Moyenne Intel Core i5-1235U, Intel Iris Xe Graphics G7 80EUs (486 - 634, n=11) | |
| Moyenne de la classe Office (391 - 1297, n=77, 2 dernières années) | |
| Schenker Vision 14 2022 RTX 3050 Ti | |
| Lenovo ThinkPad T14s G3 21BR00CDGE | |
| Apple MacBook Air M2 Entry | |
| Apple MacBook Pro 14 2021 M1 Pro Entry | |
| Speedometer 2.0 / Result 2.0 | |
| Moyenne de la classe Office (173 - 640, n=17, 2 dernières années) | |
| Apple MacBook Air M2 Entry | |
| Schenker Vision 14 2022 RTX 3050 Ti | |
| Moyenne Intel Core i5-1235U, Intel Iris Xe Graphics G7 80EUs (235 - 292, n=5) | |
| Apple MacBook Pro 14 2021 M1 Pro Entry | |
| Lenovo ThinkPad T14s G3 21BR00CDGE | |
| Lenovo ThinkPad T16 G1 21BWS00200 | |
| Lenovo ThinkPad T14 G3-21CF004NGE | |
| Octane V2 / Total Score | |
| Moyenne de la classe Office (49011 - 126830, n=19, 2 dernières années) | |
| Schenker Vision 14 2022 RTX 3050 Ti | |
| Lenovo ThinkPad T14s G3 21BR00CDGE | |
| Lenovo ThinkPad T16 G1 21BWS00200 | |
| Moyenne Intel Core i5-1235U, Intel Iris Xe Graphics G7 80EUs (78578 - 83104, n=5) | |
| Apple MacBook Air M2 Entry | |
| Lenovo ThinkPad T14 G3-21CF004NGE | |
| Apple MacBook Pro 14 2021 M1 Pro Entry | |
| Lenovo ThinkPad T14s G2 20WM003TGE | |
| Jetstream 2 / 2.0 Total | |
| Moyenne de la classe Office (126.6 - 483, n=20, 2 dernières années) | |
| Schenker Vision 14 2022 RTX 3050 Ti | |
| Lenovo ThinkPad T16 G1 21BWS00200 | |
| Moyenne Intel Core i5-1235U, Intel Iris Xe Graphics G7 80EUs (191.9 - 254, n=7) | |
| Lenovo ThinkPad T14s G3 21BR00CDGE | |
| Apple MacBook Air M2 Entry | |
| Lenovo ThinkPad T14 G3-21CF004NGE | |
| Apple MacBook Pro 14 2021 M1 Pro Entry | |
| Lenovo ThinkPad T14s G2 20WM003TGE | |
| WebXPRT 3 / Overall | |
| Apple MacBook Air M2 Entry | |
| Apple MacBook Pro 14 2021 M1 Pro Entry | |
| Schenker Vision 14 2022 RTX 3050 Ti | |
| Moyenne de la classe Office (129.9 - 444, n=76, 2 dernières années) | |
| Moyenne Intel Core i5-1235U, Intel Iris Xe Graphics G7 80EUs (233 - 305, n=11) | |
| Lenovo ThinkPad T14s G2 20WM003TGE | |
| Lenovo ThinkPad X1 Carbon G10 21CC001RGE | |
| Lenovo ThinkPad T16 G1 21BWS00200 | |
| Lenovo ThinkPad T14s G3 21BR00CDGE | |
| Dell Latitude 7420 JW6MH | |
| Lenovo ThinkPad T14 G3-21CF004NGE | |
| Lenovo ThinkPad X13 G3 21BN0046GE | |
| Lenovo ThinkPad X13 G3 21BN0046GE | |
| HP EliteBook 845 G9 6F6H9EA | |
| WebXPRT 4 / Overall | |
| Schenker Vision 14 2022 RTX 3050 Ti | |
| Moyenne de la classe Office (104.2 - 313, n=76, 2 dernières années) | |
| Lenovo ThinkPad T16 G1 21BWS00200 | |
| Apple MacBook Air M2 Entry | |
| Moyenne Intel Core i5-1235U, Intel Iris Xe Graphics G7 80EUs (206 - 236, n=10) | |
| Lenovo ThinkPad T14s G3 21BR00CDGE | |
| Lenovo ThinkPad X13 G3 21BN0046GE | |
| Lenovo ThinkPad X13 G3 21BN0046GE | |
| Lenovo ThinkPad T14 G3-21CF004NGE | |
| HP EliteBook 845 G9 6F6H9EA | |
* ... Moindre est la valeur, meilleures sont les performances
| PCMark 10 Score | 5069 points | |
Aide | ||
| AIDA64 / Memory Copy | |
| Moyenne de la classe Office (20075 - 110930, n=79, 2 dernières années) | |
| Lenovo ThinkPad X13 G3 21BN0046GE | |
| Lenovo ThinkPad T14s G3 21BR00CDGE | |
| Dell Latitude 7420 JW6MH | |
| Lenovo ThinkPad T14s G2 20WM003TGE | |
| Moyenne Intel Core i5-1235U (24653 - 61921, n=8) | |
| Lenovo ThinkPad T14 G3-21CF004NGE | |
| Schenker Vision 14 2022 RTX 3050 Ti | |
| HP EliteBook 845 G9 6F6H9EA | |
| Lenovo ThinkPad T16 G1 21BWS00200 | |
| AIDA64 / Memory Read | |
| Moyenne de la classe Office (10084 - 128030, n=80, 2 dernières années) | |
| Lenovo ThinkPad X13 G3 21BN0046GE | |
| Lenovo ThinkPad T14s G3 21BR00CDGE | |
| Dell Latitude 7420 JW6MH | |
| Lenovo ThinkPad T14s G2 20WM003TGE | |
| Moyenne Intel Core i5-1235U (24441 - 66108, n=8) | |
| Lenovo ThinkPad T14 G3-21CF004NGE | |
| Schenker Vision 14 2022 RTX 3050 Ti | |
| HP EliteBook 845 G9 6F6H9EA | |
| Lenovo ThinkPad T16 G1 21BWS00200 | |
| AIDA64 / Memory Write | |
| Moyenne de la classe Office (20073 - 119858, n=80, 2 dernières années) | |
| Lenovo ThinkPad T14s G2 20WM003TGE | |
| Lenovo ThinkPad X13 G3 21BN0046GE | |
| Lenovo ThinkPad T14s G3 21BR00CDGE | |
| Dell Latitude 7420 JW6MH | |
| Moyenne Intel Core i5-1235U (25156 - 75808, n=8) | |
| Lenovo ThinkPad T14 G3-21CF004NGE | |
| Schenker Vision 14 2022 RTX 3050 Ti | |
| HP EliteBook 845 G9 6F6H9EA | |
| Lenovo ThinkPad T16 G1 21BWS00200 | |
| AIDA64 / Memory Latency | |
| Lenovo ThinkPad T14 G3-21CF004NGE | |
| Moyenne de la classe Office (7.6 - 162.9, n=75, 2 dernières années) | |
| Dell Latitude 7420 JW6MH | |
| Schenker Vision 14 2022 RTX 3050 Ti | |
| Lenovo ThinkPad T16 G1 21BWS00200 | |
| HP EliteBook 845 G9 6F6H9EA | |
| Lenovo ThinkPad T14s G3 21BR00CDGE | |
| Lenovo ThinkPad T14s G2 20WM003TGE | |
| Lenovo ThinkPad X13 G3 21BN0046GE | |
| Moyenne Intel Core i5-1235U (76.3 - 119, n=8) | |
* ... Moindre est la valeur, meilleures sont les performances
Latence DPC
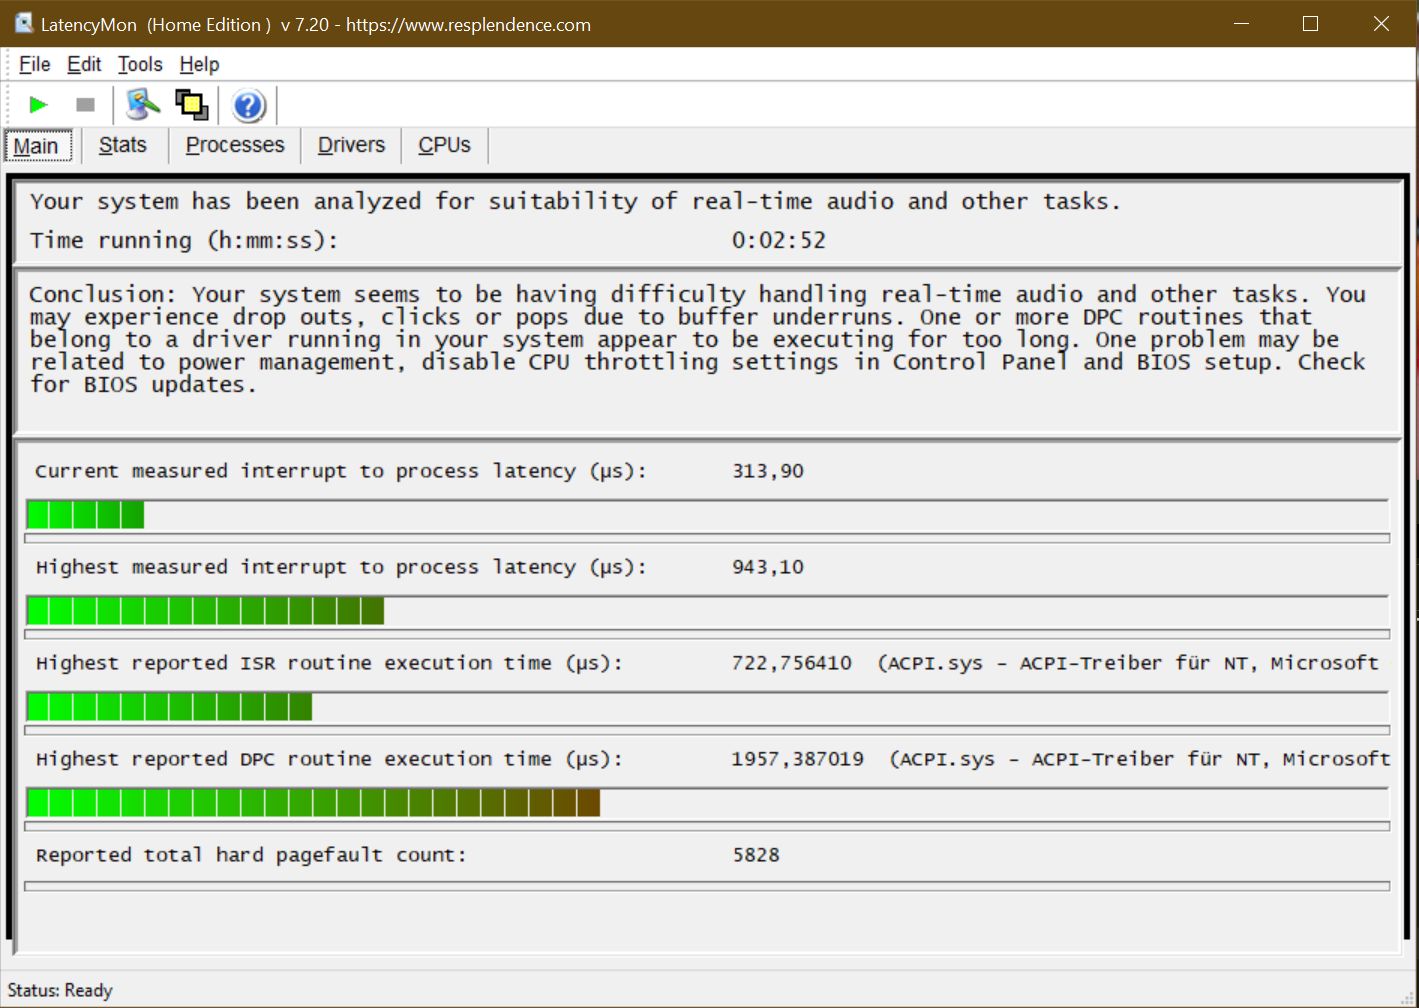
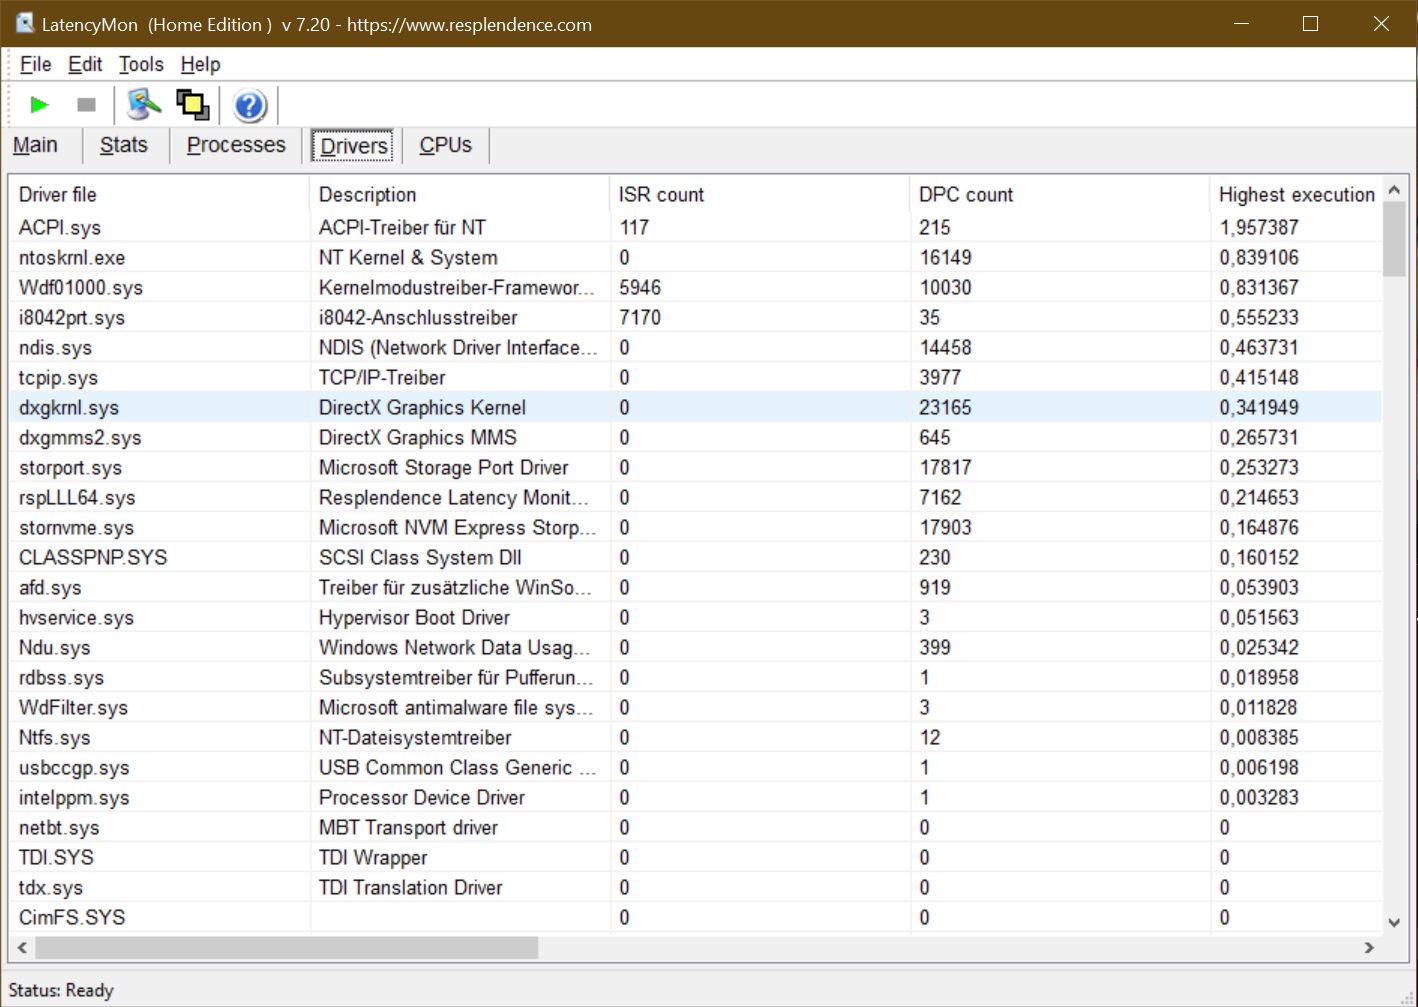
| DPC Latencies / LatencyMon - interrupt to process latency (max), Web, Youtube, Prime95 | |
| Lenovo ThinkPad T14s G2 20WM003TGE | |
| Lenovo ThinkPad X1 Carbon G10 21CC001RGE | |
| HP EliteBook 845 G9 6F6H9EA | |
| Dell Latitude 7420 JW6MH | |
| Lenovo ThinkPad T14s G3 21BR00CDGE | |
| Schenker Vision 14 2022 RTX 3050 Ti | |
* ... Moindre est la valeur, meilleures sont les performances
Mémoire de masse
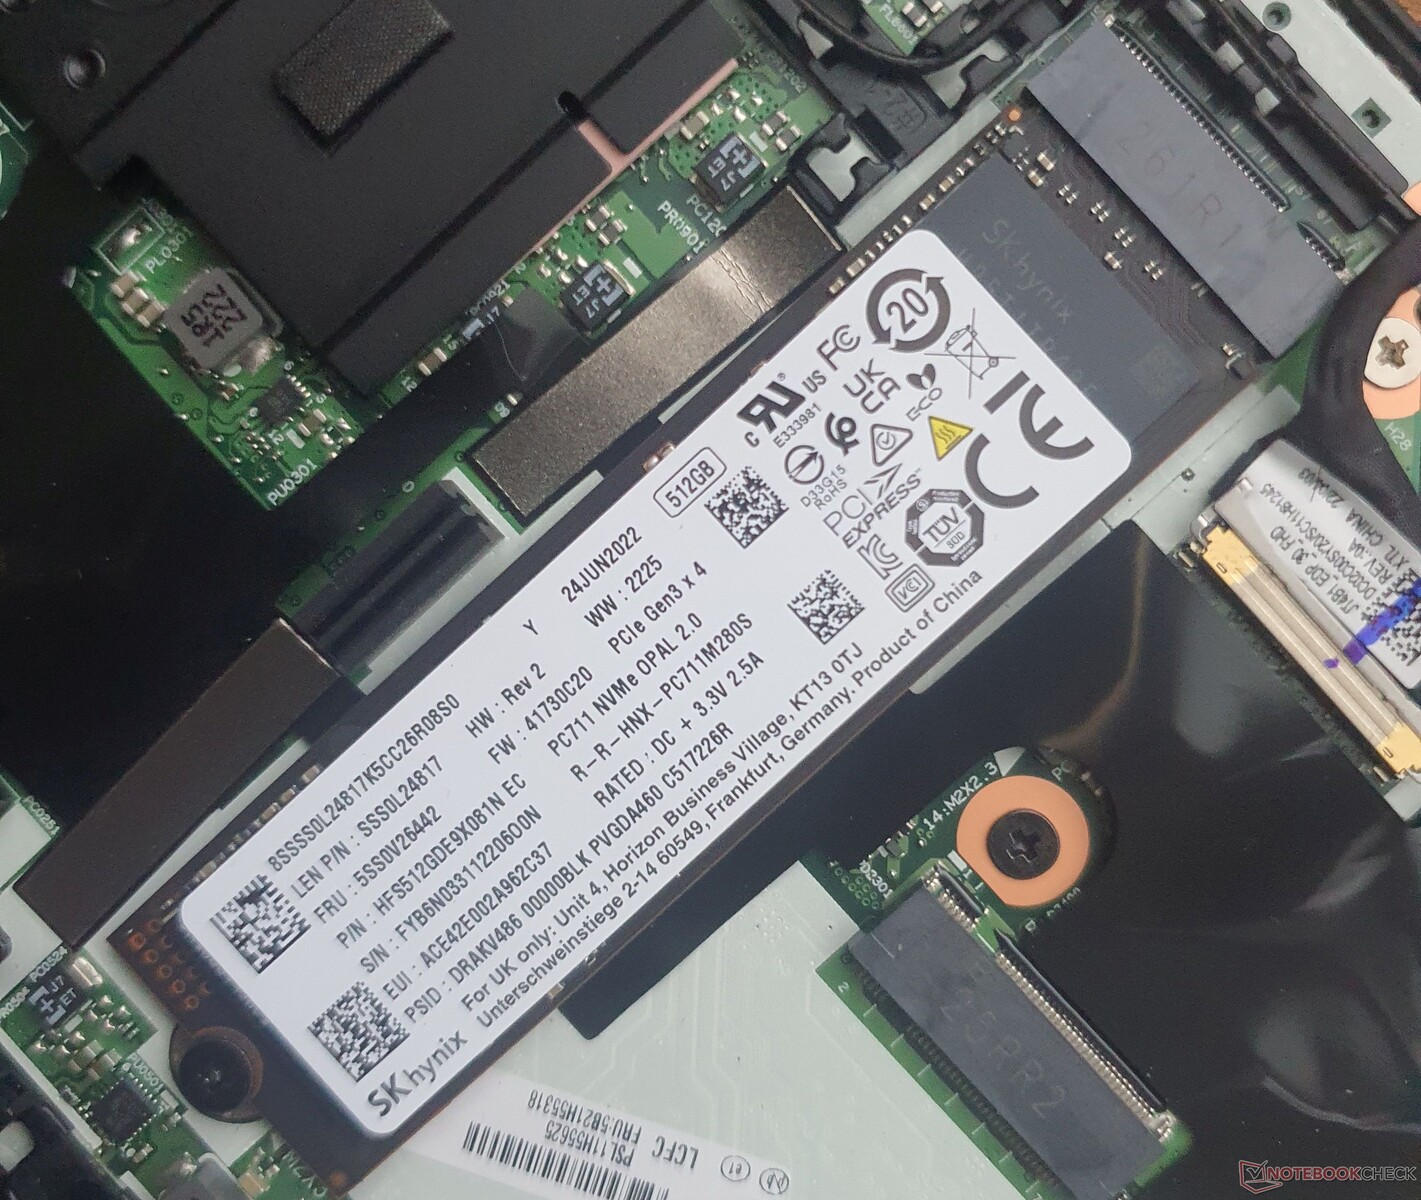
Le SK Hynix HFS512 dispose d'environ 412 Go d'espace libre et est capable d'atteindre des vitesses de transfert comparables à celles d'un SSD PCIe 3.0. Le disque peut maintenir des vitesses constantes sous une charge soutenue. Mais il a du mal à gérer jusqu'à 32 processus de lecture/écriture de 4K - ce que l'on peut trouver dans les serveurs, par exemple.
Le Samsung 980 Pro dans le Schenker Vision 14 fonctionne environ deux fois plus vite, tandis que le PM991 dans le HP EliteBook 845 G9 est légèrement plus lent.
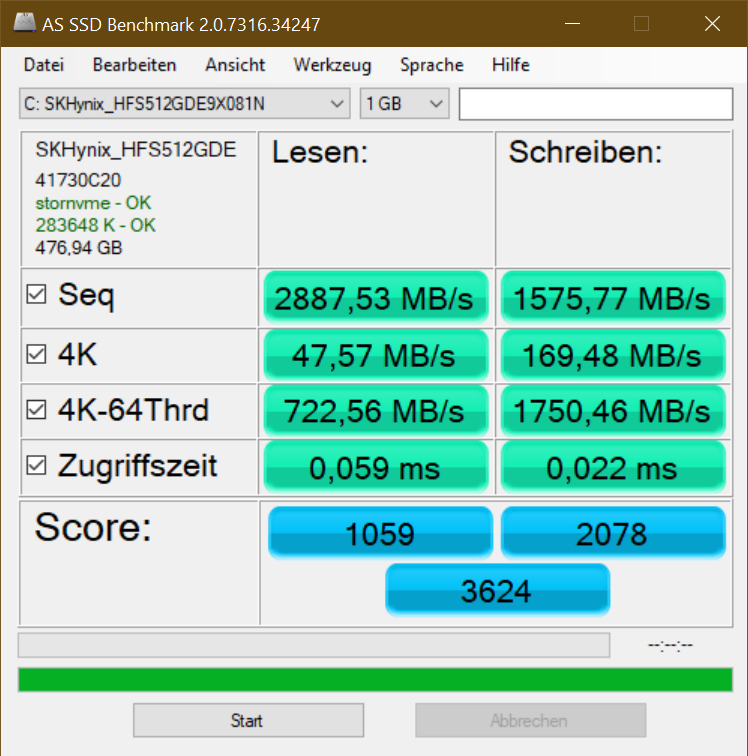
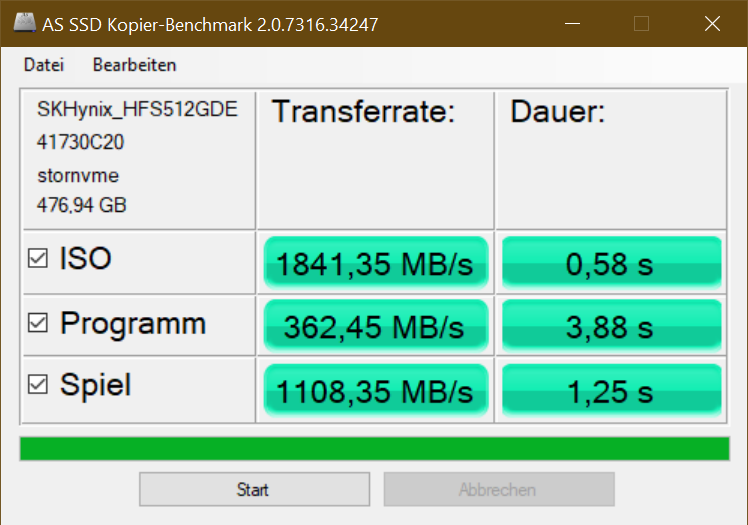
| Lenovo ThinkPad T14s G3 21BR00CDGE SK Hynix HFS512 GDE9X081N | Lenovo ThinkPad T14s G2 20WM003TGE Samsung PM981a MZVLB1T0HBLR | Lenovo ThinkPad T14 G3-21CF004NGE Kioxia BG5 KBG5AZNV512G | Lenovo ThinkPad X1 Carbon G10 21CC001RGE Samsung PM9A1 MZVL2512HCJQ | HP EliteBook 845 G9 6F6H9EA Samsung PM991 MZVLQ512HBLU | Dell Latitude 7420 JW6MH SK Hynix BC711 HFM512GD3HX015N | Schenker Vision 14 2022 RTX 3050 Ti Samsung SSD 980 Pro 1TB MZ-V8P1T0BW | |
|---|---|---|---|---|---|---|---|
| AS SSD | 15% | -28% | 17% | -28% | -12% | 100% | |
| Seq Read (MB/s) | 2888 | 2825 -2% | 2117 -27% | 3577.18 24% | 2472.02 -14% | 2674 -7% | 5315 84% |
| Seq Write (MB/s) | 1576 | 1288 -18% | 1059 -33% | 1503.79 -5% | 1309.38 -17% | 1311 -17% | 3766 139% |
| 4K Read (MB/s) | 48 | 61.2 28% | 51.29 7% | 52.64 10% | 44.98 -6% | 68.4 43% | 80.26 67% |
| 4K Write (MB/s) | 169 | 190.6 13% | 110.24 -35% | 182.62 8% | 118.54 -30% | 183.7 9% | 192.61 14% |
| 4K-64 Read (MB/s) | 723 | 1147 59% | 668.7 -8% | 1751.37 142% | 717.11 -1% | 924 28% | 2478.53 243% |
| 4K-64 Write (MB/s) | 1750 | 1827 4% | 332.54 -81% | 1492.76 -15% | 879.06 -50% | 809 -54% | 3195.52 83% |
| Access Time Read * (ms) | 0.059 | 0.055 7% | 0.067 -14% | 0.065 -10% | 0.093 -58% | 0.075 -27% | 0.022 63% |
| Access Time Write * (ms) | 0.022 | 0.019 14% | 0.035 -59% | 0.023 -5% | 0.033 -50% | 0.031 -41% | 0.022 -0% |
| Score Read (Points) | 1059 | 1491 41% | 932 -12% | 2162 104% | 1009 -5% | 1260 19% | 3090 192% |
| Score Write (Points) | 2078 | 2146 3% | 549 -74% | 1826 -12% | 1129 -46% | 1124 -46% | 3765 81% |
| Score Total (Points) | 3624 | 4336 20% | 1919 -47% | 4991 38% | 2607 -28% | 2980 -18% | 8363 131% |
| Copy ISO MB/s (MB/s) | 1841 | 1682.54 -9% | 1375.59 -25% | 1611 -12% | |||
| Copy Program MB/s (MB/s) | 362 | 402.12 11% | 336.59 -7% | 327 -10% | |||
| Copy Game MB/s (MB/s) | 1108 | 967.5 -13% | 940.22 -15% | 698 -37% | |||
| DiskSpd | 27% | 8% | 172% | -11% | 10% | 217% | |
| seq read (MB/s) | 1889 | 2479 31% | 2449 30% | 4277 126% | 1698 -10% | 2253 19% | 3878 105% |
| seq write (MB/s) | 1875 | 1896 1% | 2052 9% | 3968 112% | 1513 -19% | 1791 -4% | 4000 113% |
| seq q8 t1 read (MB/s) | 3567 | 3555 0% | 2836 -20% | 6588 85% | 2955 -17% | 3547 -1% | 6876 93% |
| seq q8 t1 write (MB/s) | 3150 | 2965 -6% | 2752 -13% | 4805 53% | 1632 -48% | 2519 -20% | 4970 58% |
| 4k q1 t1 read (MB/s) | 53.9 | 65.1 21% | 54.1 0% | 71.2 32% | 44.9 -17% | 64 19% | 88.6 64% |
| 4k q1 t1 write (MB/s) | 138.5 | 151 9% | 134.4 -3% | 213 54% | 117.4 -15% | 162 17% | 224 62% |
| 4k q32 t16 read (MB/s) | 667 | 1140 71% | 839 26% | 3241 386% | 784 18% | 648 -3% | 3484 422% |
| 4k q32 t16 write (MB/s) | 278 | 528 90% | 377 36% | 1750 529% | 337 21% | 425 53% | 2554 819% |
| Moyenne finale (programmes/paramètres) | 21% /
20% | -10% /
-15% | 95% /
73% | -20% /
-21% | -1% /
-4% | 159% /
149% |
* ... Moindre est la valeur, meilleures sont les performances
* ... Moindre est la valeur, meilleures sont les performances
Sustained Performance Read: DiskSpd Read Loop, Queue Depth 8
Carte graphique
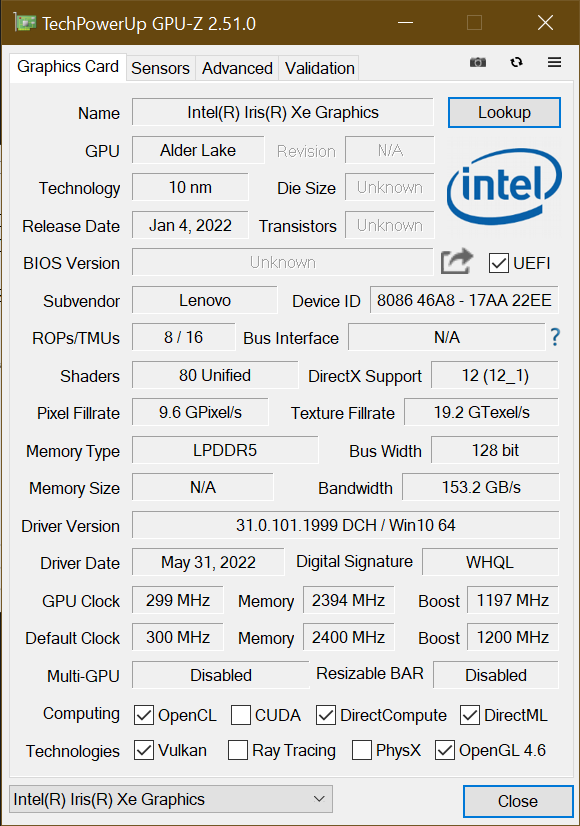
La carte intégrée Intel Xe G7 (80 EU)du Lenovo ThinkPad T14s G3 a accès à la RAM à double canal et fonctionne donc 58 % plus vite que l'iGPU identique du ThinkPad T16qui ne dispose que d'une RAM à canal unique. Par conséquent, le T14s G3 est au moins capable d'exécuter des jeux plus anciens avec des paramètres moyens.
Le ThinkPad T14s n'ayant pas été conçu pour les jeux vidéo, il n'y a pas de problème à ce que les jeux les plus récents ne fonctionnent correctement qu'avec des réglages bas. Le fait de débrancher l'ordinateur portable n'a pas d'incidence négative sur les performances graphiques. Une carte graphique dédiée n'est disponible qu'avec les ThinkPad T14 Intel et P14s Intel.
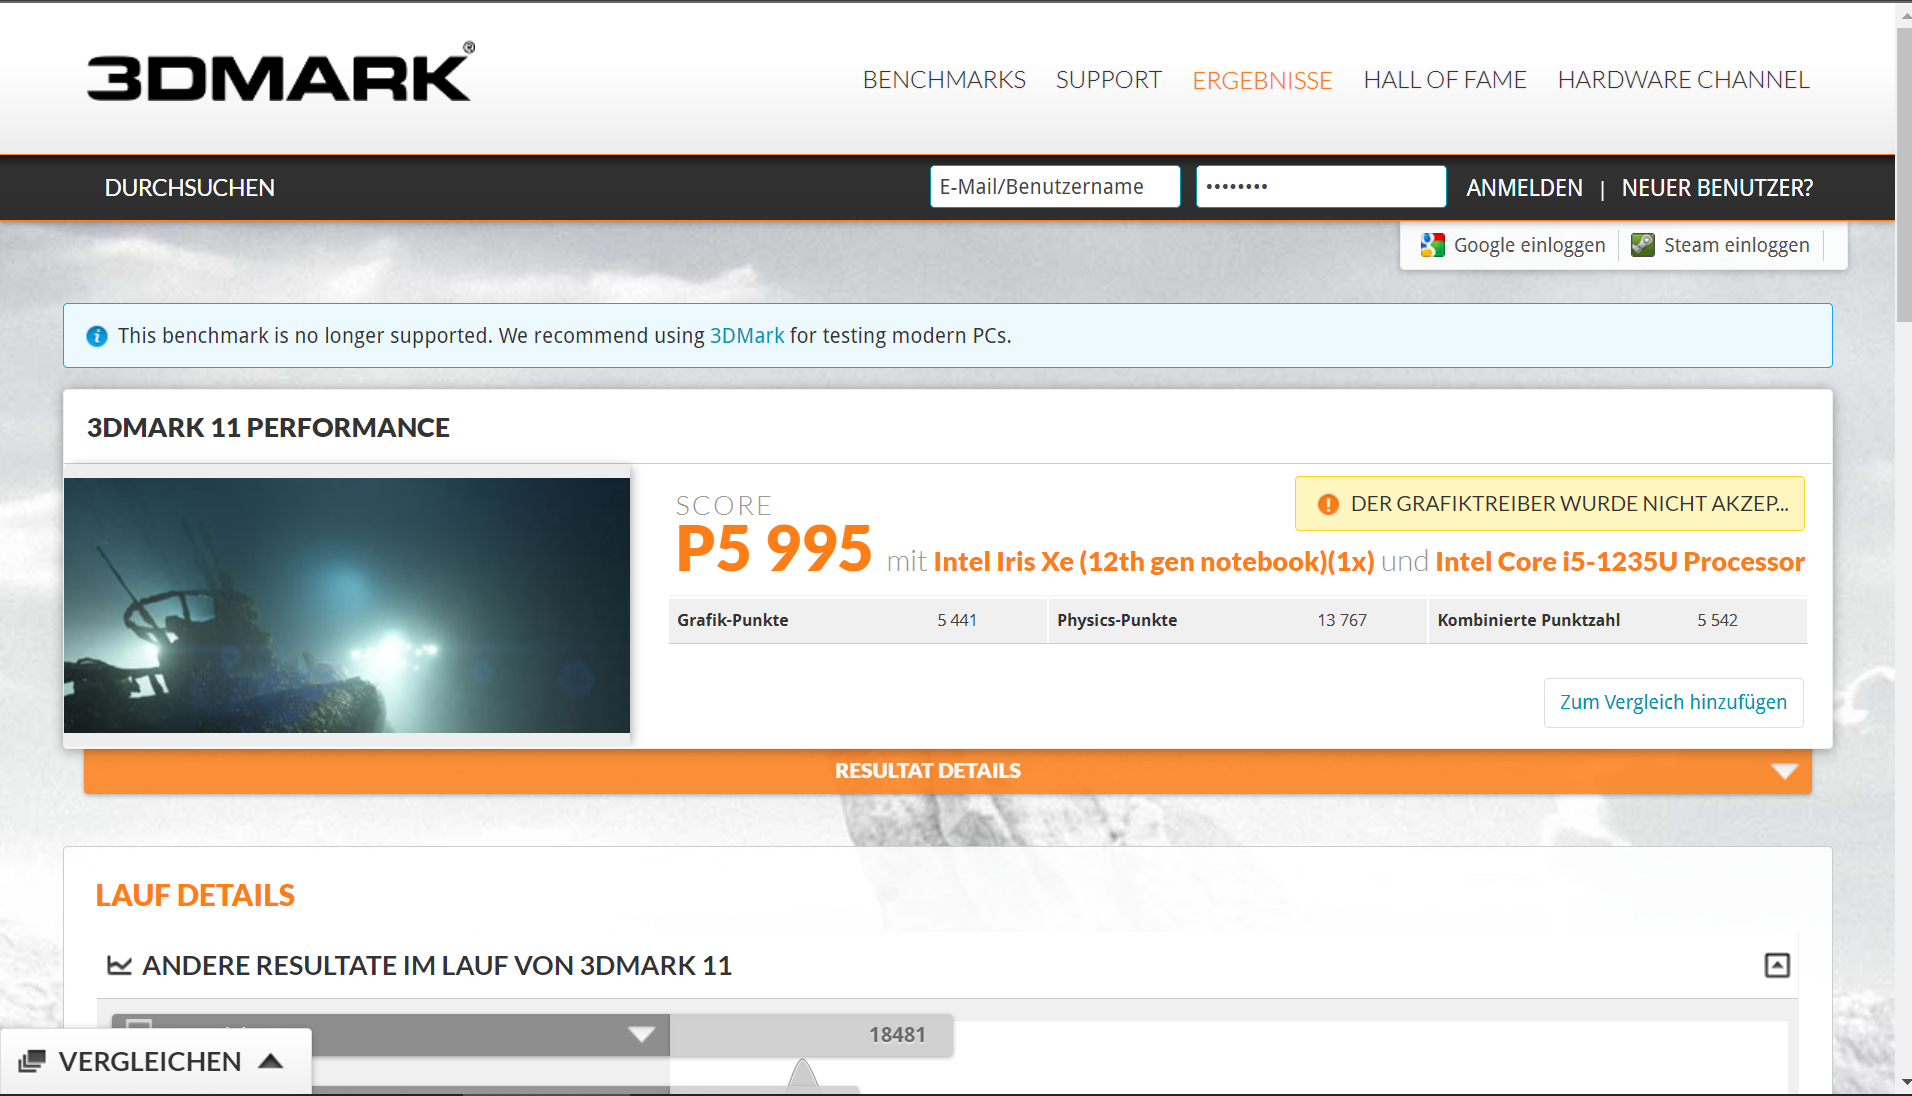
| 3DMark 11 Performance | 5995 points | |
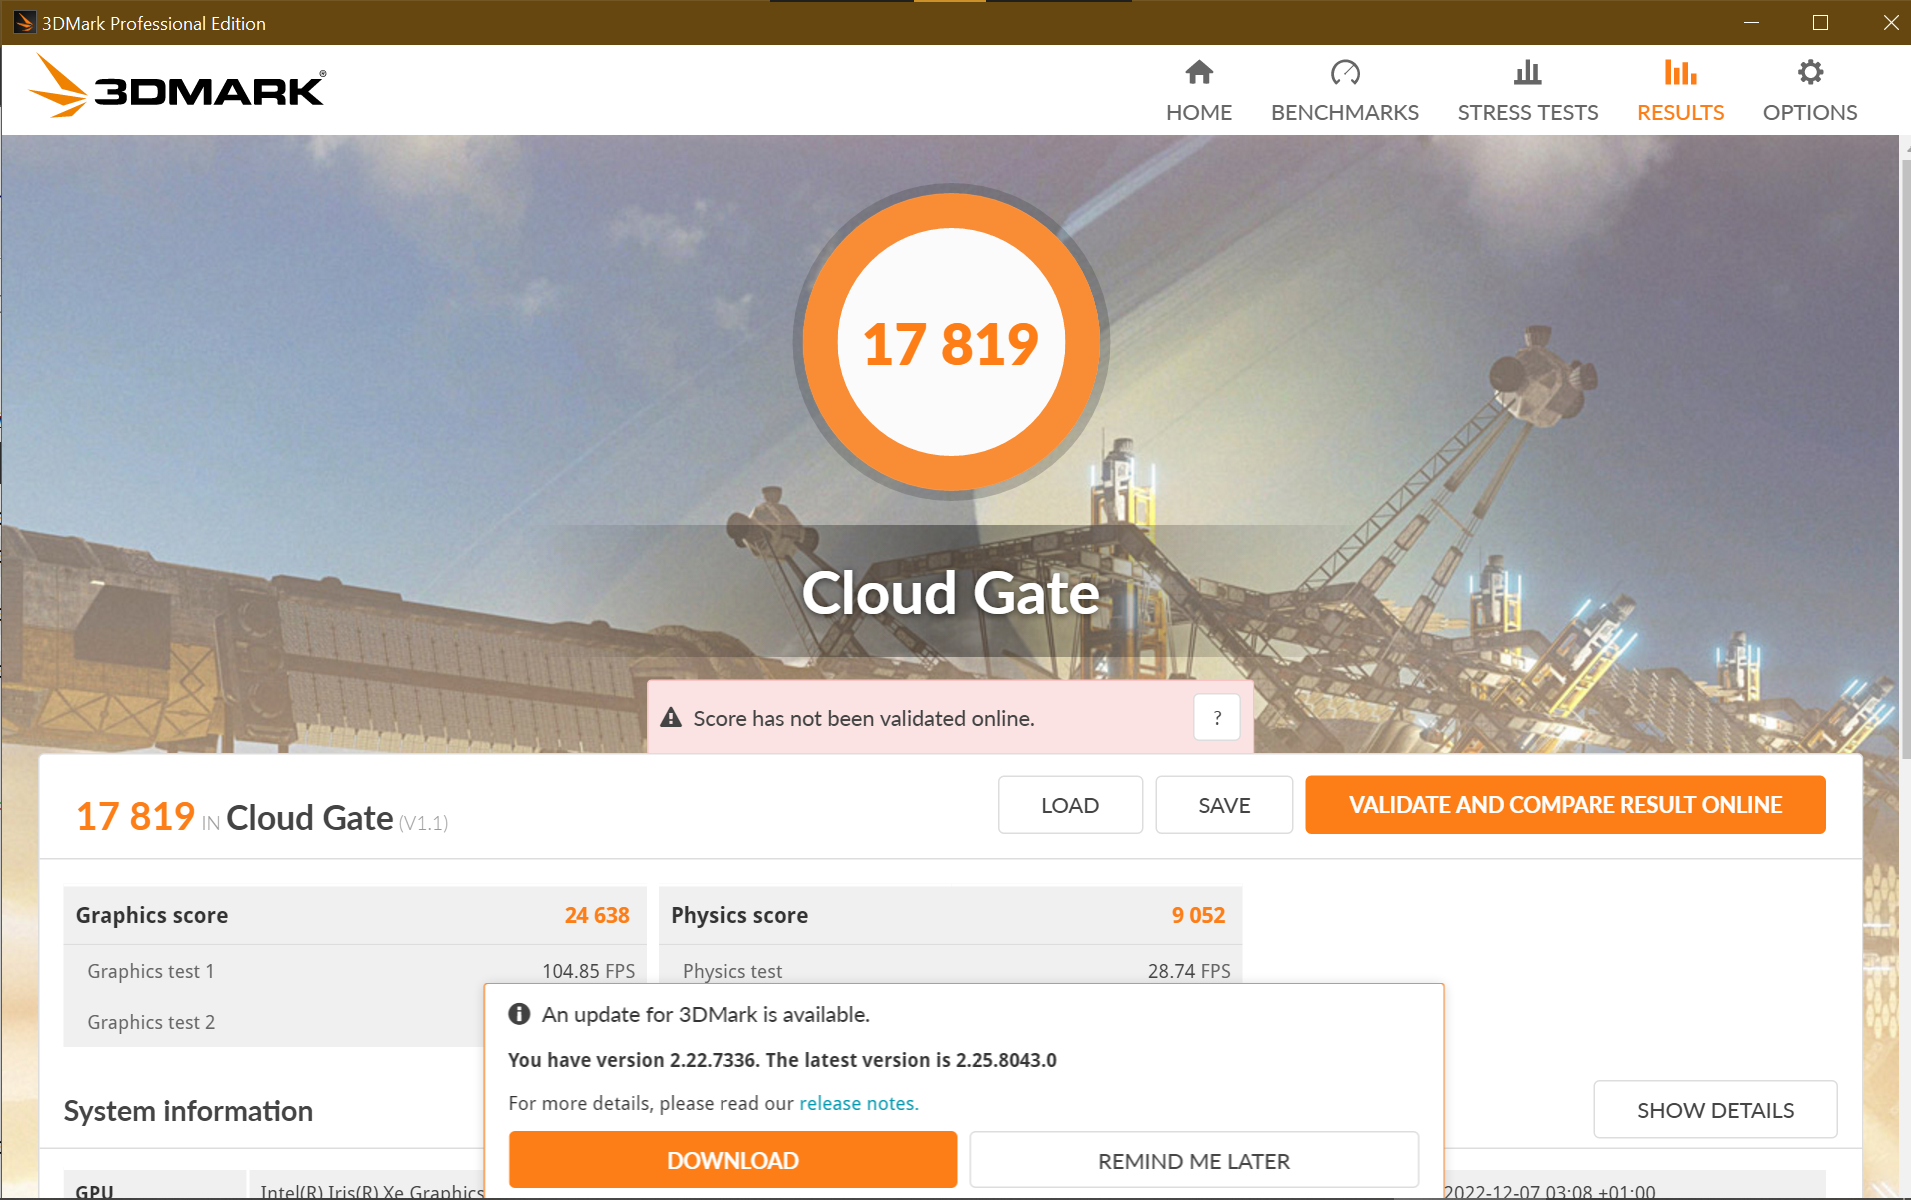
| 3DMark Cloud Gate Standard Score | 17819 points | |
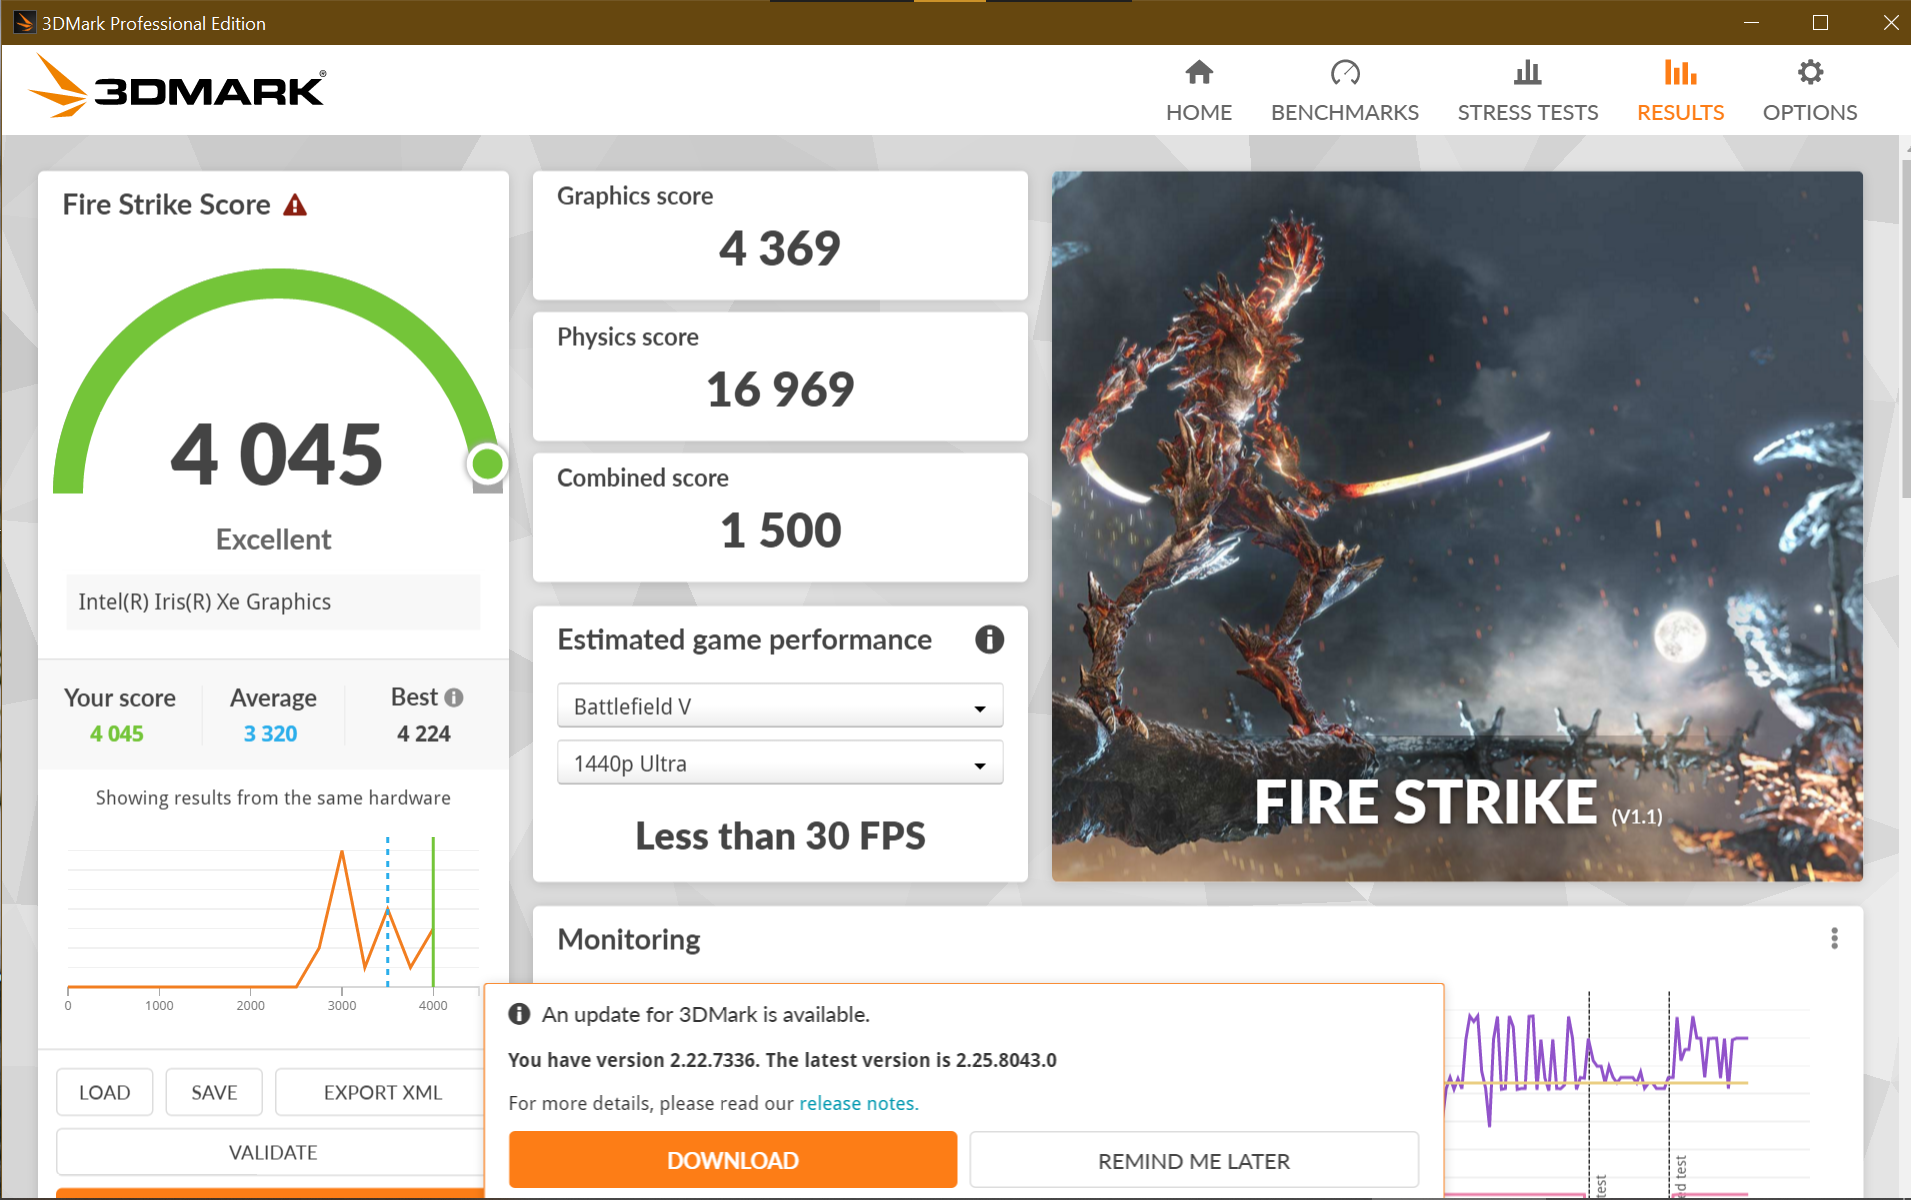
| 3DMark Fire Strike Score | 4045 points | |
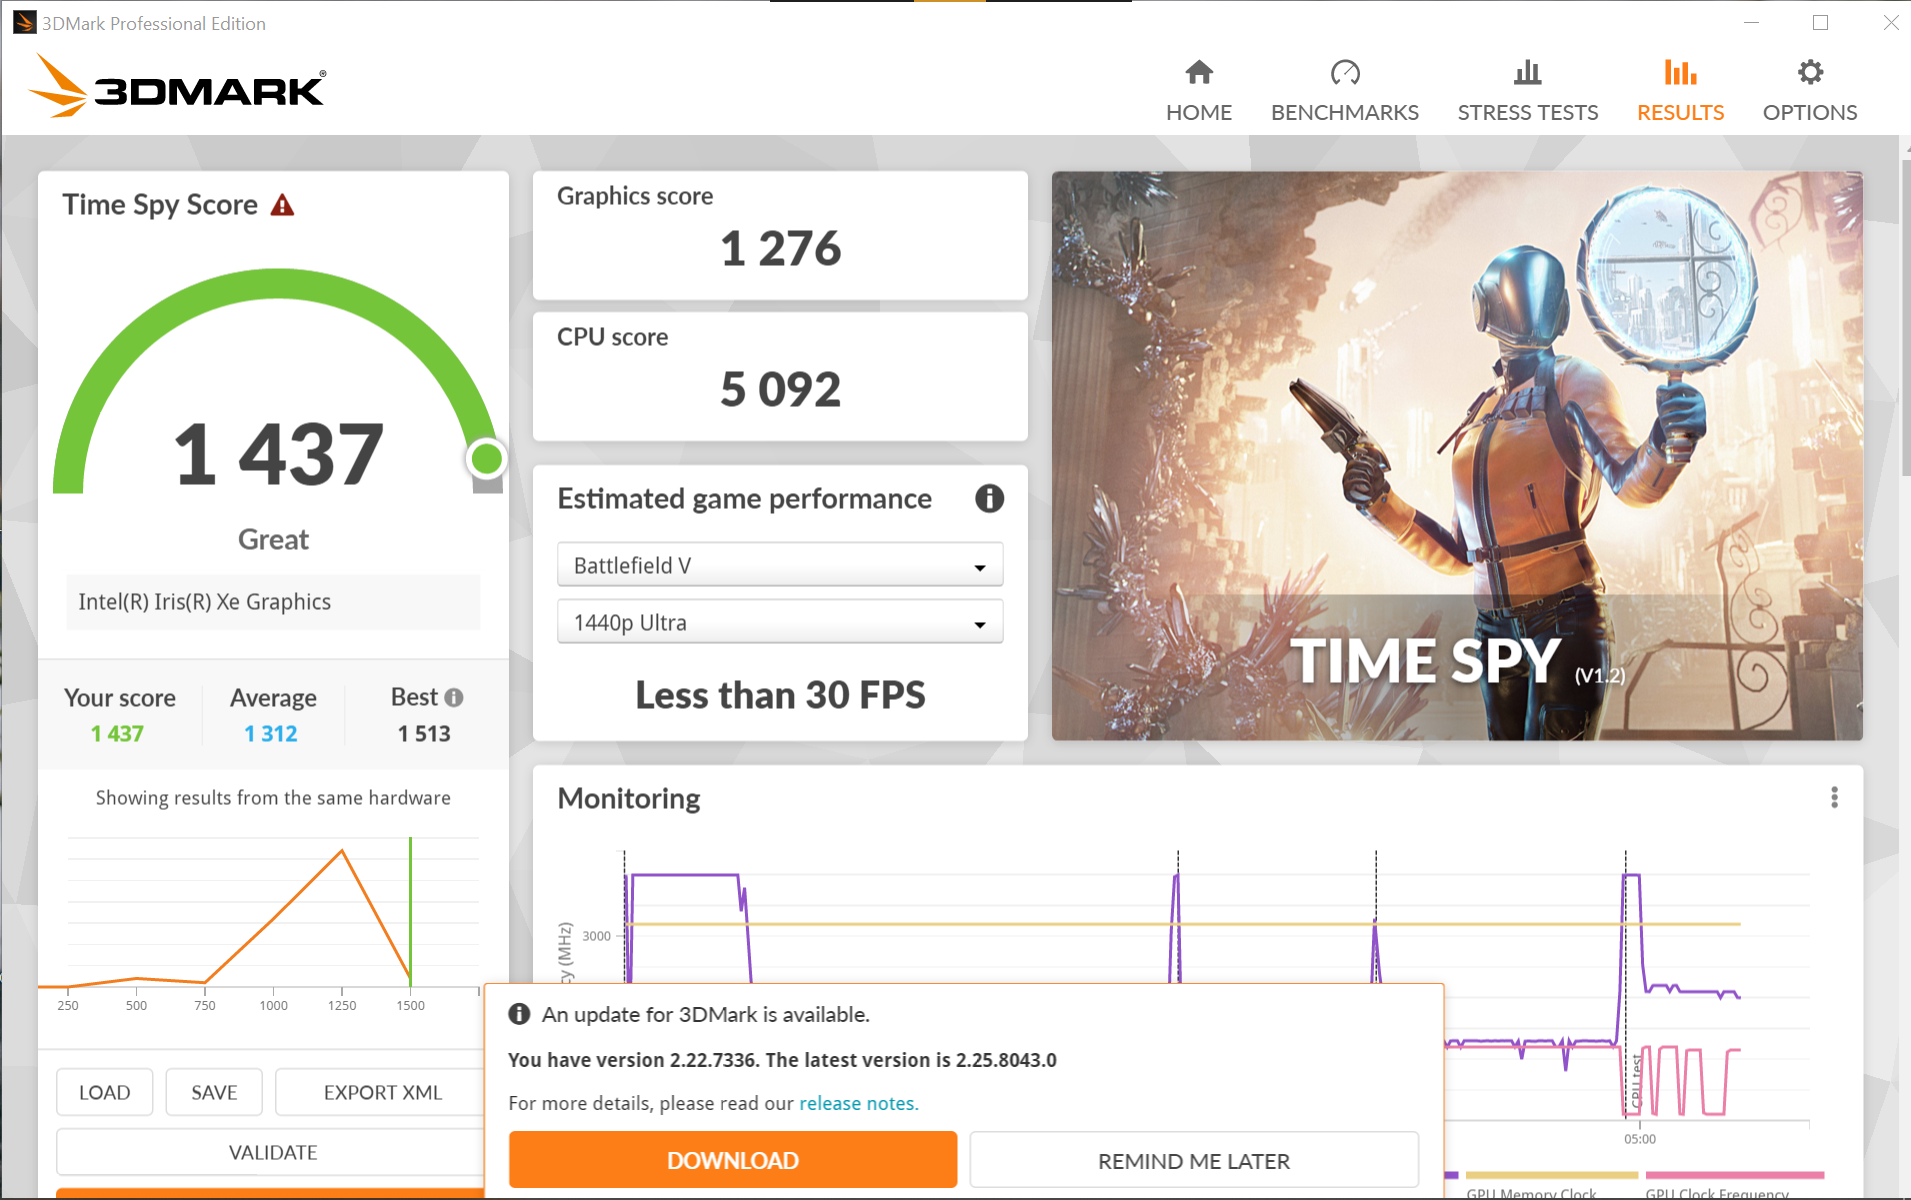
| 3DMark Time Spy Score | 1437 points | |
Aide | ||
* ... Moindre est la valeur, meilleures sont les performances
Witcher 3 FPS chart
| Bas | Moyen | Élevé | Ultra | |
|---|---|---|---|---|
| GTA V (2015) | 111.8 | 97 | 19.9 | 8.85 |
| The Witcher 3 (2015) | 74.9 | 48.6 | 26.2 | 12.5 |
| Dota 2 Reborn (2015) | 111.8 | 87.2 | 46.9 | 43.3 |
| Final Fantasy XV Benchmark (2018) | 39.5 | 20.7 | 14.6 | |
| X-Plane 11.11 (2018) | 51.2 | 34.6 | 30.8 | |
| Far Cry 5 (2018) | 43 | 25 | 23 | 21 |
| Strange Brigade (2018) | 70.3 | 30.7 | 24.1 | 19.7 |
| Shadow of the Tomb Raider (2018) | 42 | 21 | 21 | 18 |
| GRID Legends (2022) | 45 | 35.6 | 25.7 | 20 |
De faibles émissions pour le ThinkPad T14s G3
Émissions sonores
L'ordinateur portable Lenovo est totalement silencieux en mode veille. C'est également souvent le cas lorsque vous naviguez sur le web avec plusieurs onglets ouverts ainsi qu'en multitâche sur l'appareil, bien que ce dernier puisse aussi parfois produire un léger murmure (jusqu'à 26 dB(A) selon nos mesures). Mais vous ne pourrez rien entendre une fois le mode "Meilleures performances" activé dans Windows.
L'ordinateur portable reste étonnamment silencieux, même lorsque la charge du processeur est élevée. Le niveau sonore maximal que nous avons mesuré n'était que de 36 dB(A), ce qui s'est produit lorsque l'ordinateur portable était soumis à une charge combinée (comme les jeux). C'est encore assez silencieux, mais les hautes fréquences produites par le ventilateur sont perceptibles et peuvent être quelque peu gênantes. Notre unité d'examen n'a pas émis de gémissement de bobine.
Degré de la nuisance sonore
| Au repos |
| 24.6 / 24.6 / 24.6 dB(A) |
| Fortement sollicité |
| 26.1 / 36.3 dB(A) |
 | ||
30 dB silencieux 40 dB(A) audible 50 dB(A) bruyant |
||
min: | ||
| Lenovo ThinkPad T14s G3 21BR00CDGE Iris Xe G7 80EUs, i5-1235U, SK Hynix HFS512 GDE9X081N | Lenovo ThinkPad T14s G2 20WM003TGE Iris Xe G7 96EUs, i7-1165G7, Samsung PM981a MZVLB1T0HBLR | Lenovo ThinkPad T14 G3-21CF004NGE Radeon 680M, R7 PRO 6850U, Kioxia BG5 KBG5AZNV512G | Lenovo ThinkPad X13 G3 21BN0046GE Iris Xe G7 80EUs, i5-1235U, SK Hynix HFS512 GDE9X081N | Lenovo ThinkPad X1 Carbon G10 21CC001RGE Iris Xe G7 80EUs, i5-1250P, Samsung PM9A1 MZVL2512HCJQ | HP EliteBook 845 G9 6F6H9EA Radeon 660M, R5 PRO 6650U, Samsung PM991 MZVLQ512HBLU | Dell Latitude 7420 JW6MH Iris Xe G7 80EUs, i5-1145G7, SK Hynix BC711 HFM512GD3HX015N | Schenker Vision 14 2022 RTX 3050 Ti GeForce RTX 3050 Ti Laptop GPU, i7-12700H, Samsung SSD 980 Pro 1TB MZ-V8P1T0BW | |
|---|---|---|---|---|---|---|---|---|
| Noise | -6% | -3% | -2% | 1% | -6% | -18% | -21% | |
| arrêt / environnement * (dB) | 24.6 | 24.81 -1% | 24.2 2% | 24.6 -0% | 22.81 7% | 24 2% | 25.3 -3% | 24.4 1% |
| Idle Minimum * (dB) | 24.6 | 24.81 -1% | 24.2 2% | 24.6 -0% | 22.81 7% | 24 2% | 25.3 -3% | 24.4 1% |
| Idle Average * (dB) | 24.6 | 24.81 -1% | 24.2 2% | 24.6 -0% | 22.81 7% | 25 -2% | 25.3 -3% | 24.4 1% |
| Idle Maximum * (dB) | 24.6 | 24.81 -1% | 25.8 -5% | 25.9 -5% | 22.81 7% | 26 -6% | 25.3 -3% | 27.8 -13% |
| Load Average * (dB) | 26.1 | 35.14 -35% | 32.2 -23% | 30.7 -18% | 31.59 -21% | 34 -30% | 44.9 -72% | 43.3 -66% |
| Witcher 3 ultra * (dB) | 35.9 | 34.1 5% | 34.6 4% | 35.59 1% | 38 -6% | 48.2 -34% | ||
| Load Maximum * (dB) | 36.3 | 35.14 3% | 38.8 -7% | 34.6 5% | 35.47 2% | 38 -5% | 44.9 -24% | 48.8 -34% |
* ... Moindre est la valeur, meilleures sont les performances
Température
Le ThinkPad T14s avec le Intel Core i5-1235U est resté très frais, même à pleine charge. Le ThinkPad X13 G3équipé de la même carte mère, a également obtenu de bons résultats. En revanche, l'épais ThinkPad T14 G3 plus épais et équipé d'un AMD Ryzen 7 a été plus chaud d'environ 10°C (50°F) et a atteint des températures de 52,5°C (126,5°F) malgré la présence d'un deuxième caloduc.
(±) La température maximale du côté supérieur est de 43.6 °C / 110 F, par rapport à la moyenne de 34.3 °C / 94 F, allant de 21.2 à 62.5 °C pour la classe Office.
(±) Le fond chauffe jusqu'à un maximum de 42 °C / 108 F, contre une moyenne de 36.8 °C / 98 F
(+) En utilisation inactive, la température moyenne du côté supérieur est de 26.4 °C / 80 F, par rapport à la moyenne du dispositif de 29.5 °C / 85 F.
(+) En jouant à The Witcher 3, la température moyenne du côté supérieur est de 28.9 °C / 84 F, alors que la moyenne de l'appareil est de 29.5 °C / 85 F.
(+) Les repose-poignets et le pavé tactile sont plus froids que la température de la peau avec un maximum de 27.1 °C / 80.8 F et sont donc froids au toucher.
(±) La température moyenne de la zone de l'appui-paume de dispositifs similaires était de 27.5 °C / 81.5 F (+0.4 °C / #0.7 F).
| Lenovo ThinkPad T14s G3 21BR00CDGE Intel Core i5-1235U, Intel Iris Xe Graphics G7 80EUs | Lenovo ThinkPad T14s G2 20WM003TGE Intel Core i7-1165G7, Intel Iris Xe Graphics G7 96EUs | Lenovo ThinkPad T14 G3-21CF004NGE AMD Ryzen 7 PRO 6850U, AMD Radeon 680M | Lenovo ThinkPad X13 G3 21BN0046GE Intel Core i5-1235U, Intel Iris Xe Graphics G7 80EUs | Lenovo ThinkPad T16 G1 21BWS00200 Intel Core i5-1240P, Intel Iris Xe Graphics G7 80EUs | Lenovo ThinkPad X1 Carbon G10 21CC001RGE Intel Core i5-1250P, Intel Iris Xe Graphics G7 80EUs | HP EliteBook 845 G9 6F6H9EA AMD Ryzen 5 PRO 6650U, AMD Radeon 660M | Dell Latitude 7420 JW6MH Intel Core i5-1145G7, Intel Iris Xe Graphics G7 80EUs | Schenker Vision 14 2022 RTX 3050 Ti Intel Core i7-12700H, NVIDIA GeForce RTX 3050 Ti Laptop GPU | |
|---|---|---|---|---|---|---|---|---|---|
| Heat | -3% | -2% | -7% | -10% | -9% | 1% | 7% | -12% | |
| Maximum Upper Side * (°C) | 43.6 | 47.5 -9% | 48.2 -11% | 45.3 -4% | 45 -3% | 45 -3% | 44 -1% | 37.1 15% | 48.4 -11% |
| Maximum Bottom * (°C) | 42 | 43.4 -3% | 52.8 -26% | 41.8 -0% | 42.8 -2% | 44 -5% | 45 -7% | 38.7 8% | 57.1 -36% |
| Idle Upper Side * (°C) | 28.1 | 28.4 -1% | 24.4 13% | 31.6 -12% | 33 -17% | 31.2 -11% | 27 4% | 27.3 3% | 28.1 -0% |
| Idle Bottom * (°C) | 28.9 | 28.3 2% | 24.5 15% | 32.6 -13% | 33.6 -16% | 33.2 -15% | 27 7% | 28.1 3% | 29 -0% |
* ... Moindre est la valeur, meilleures sont les performances
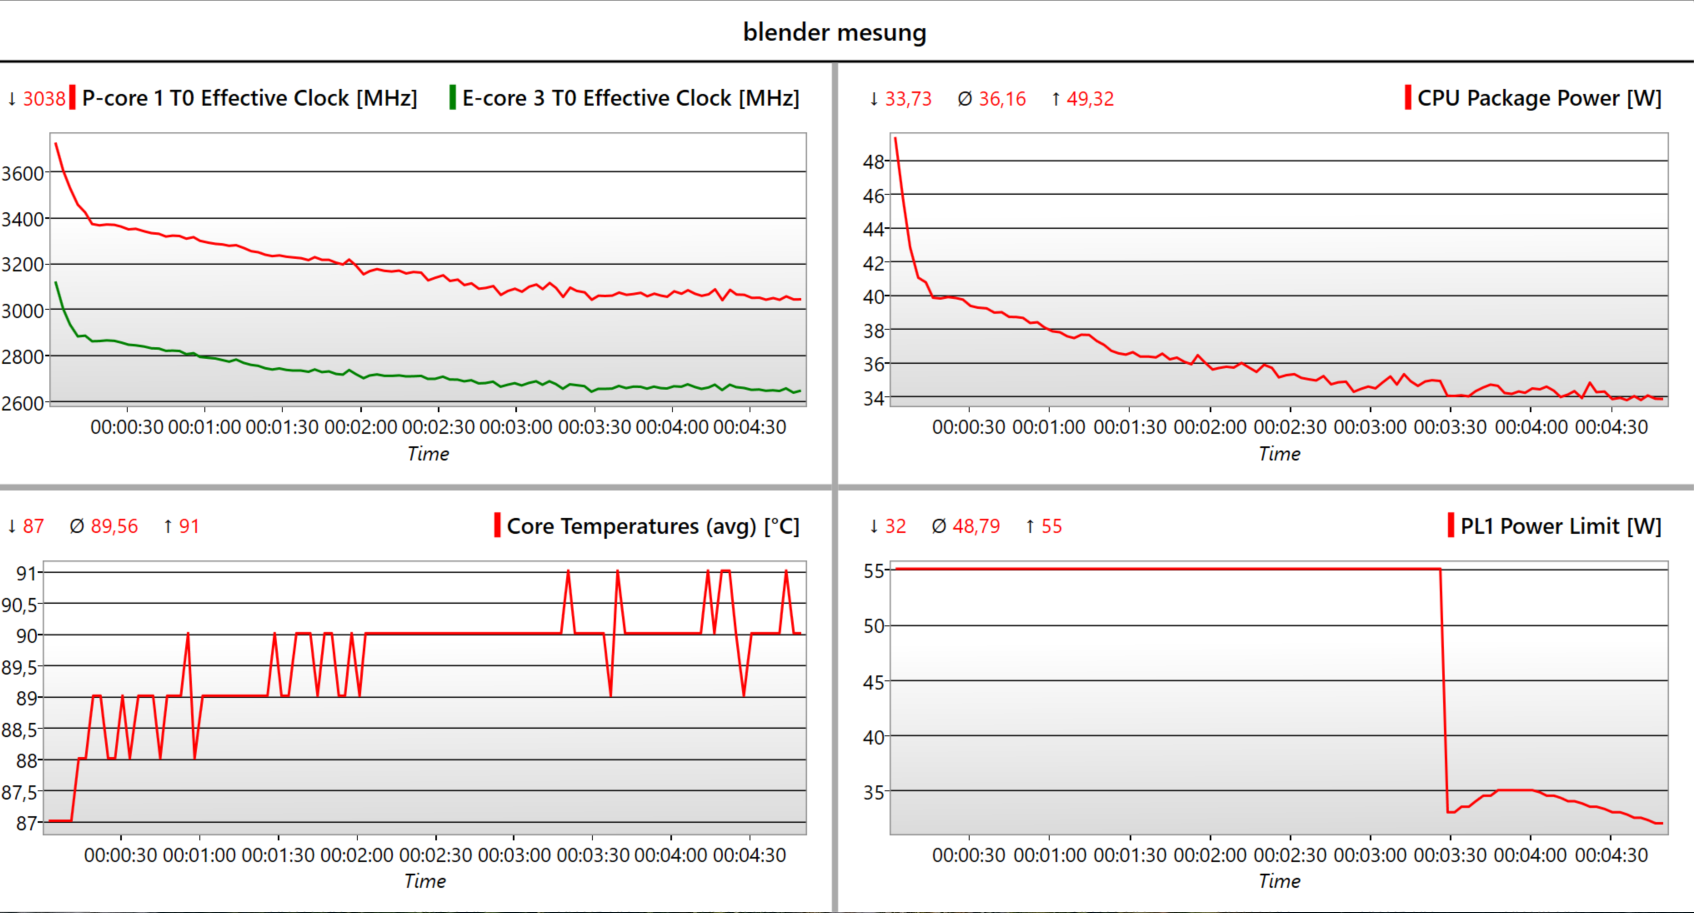
Test de stress
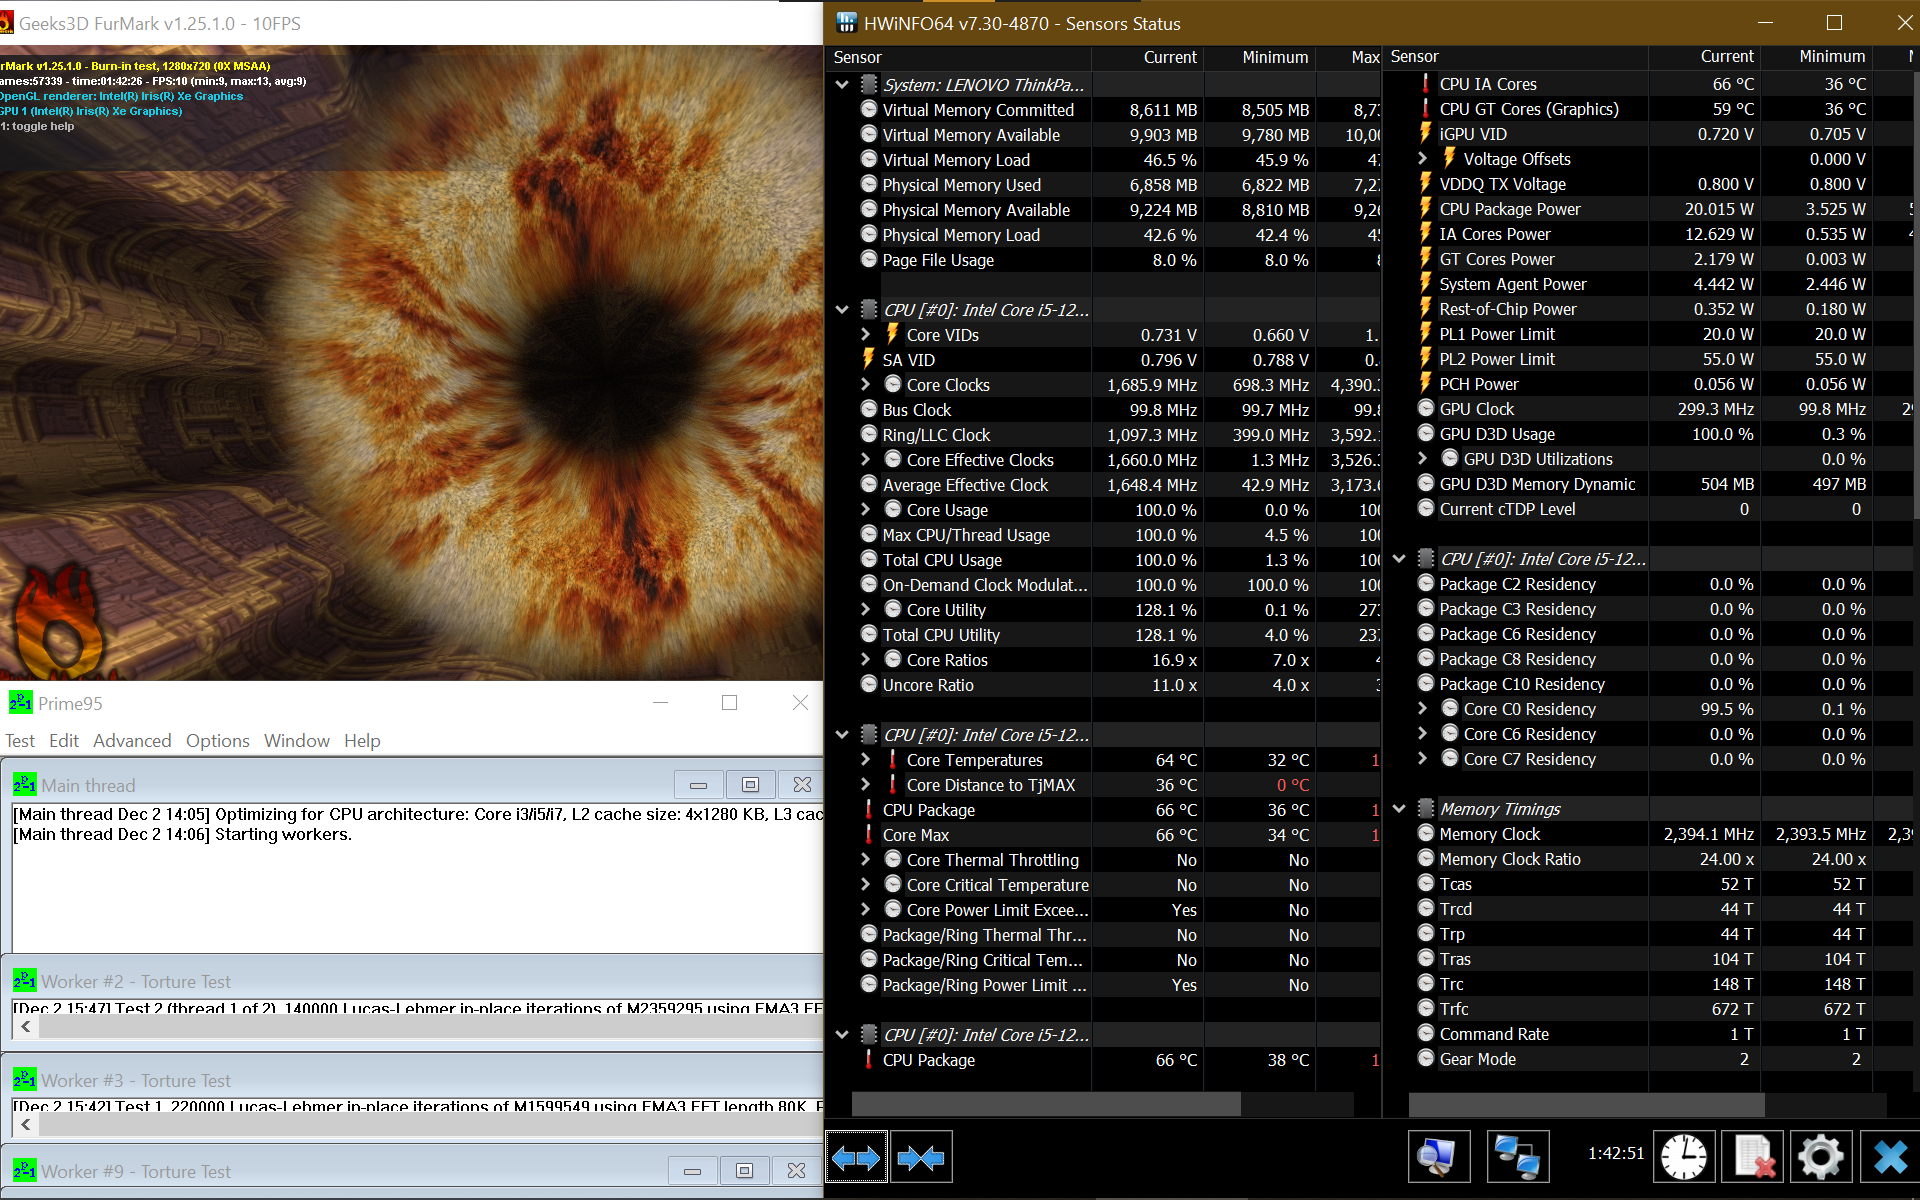
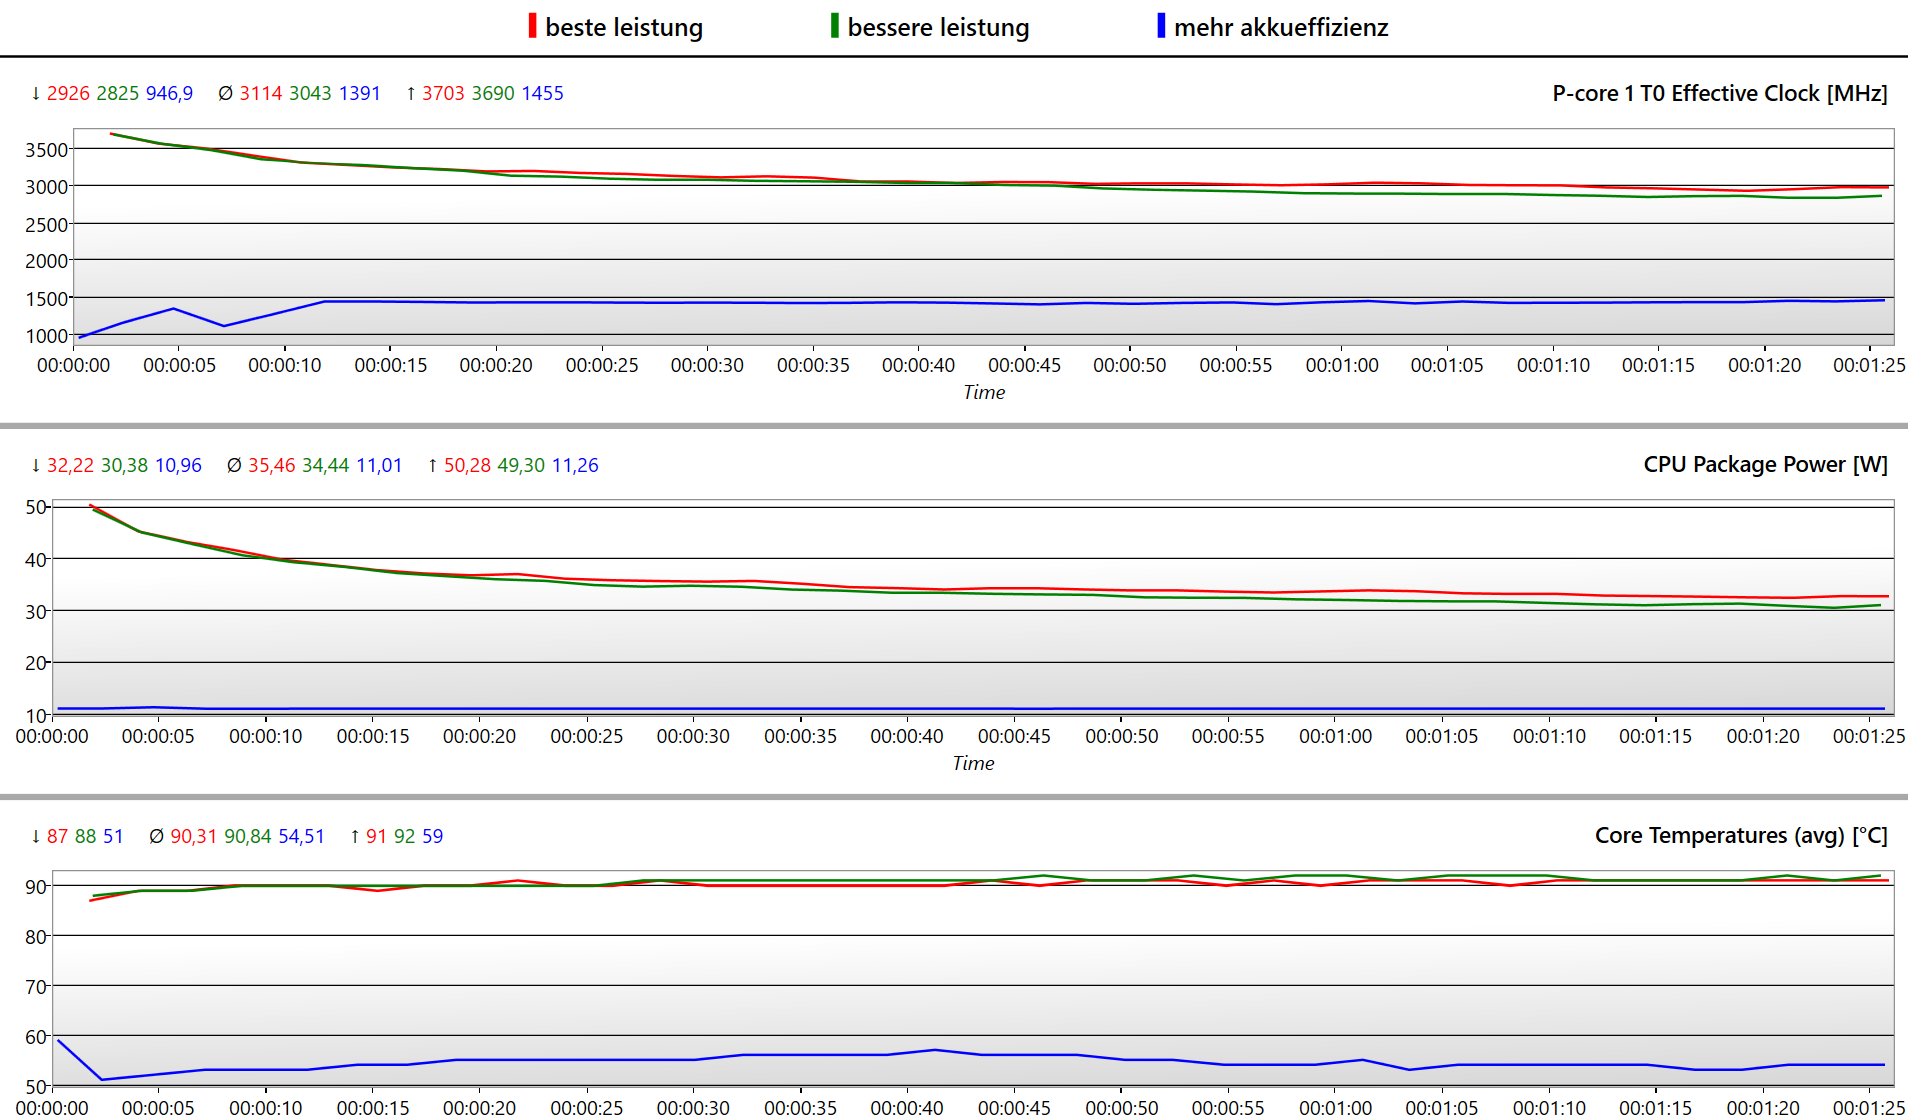
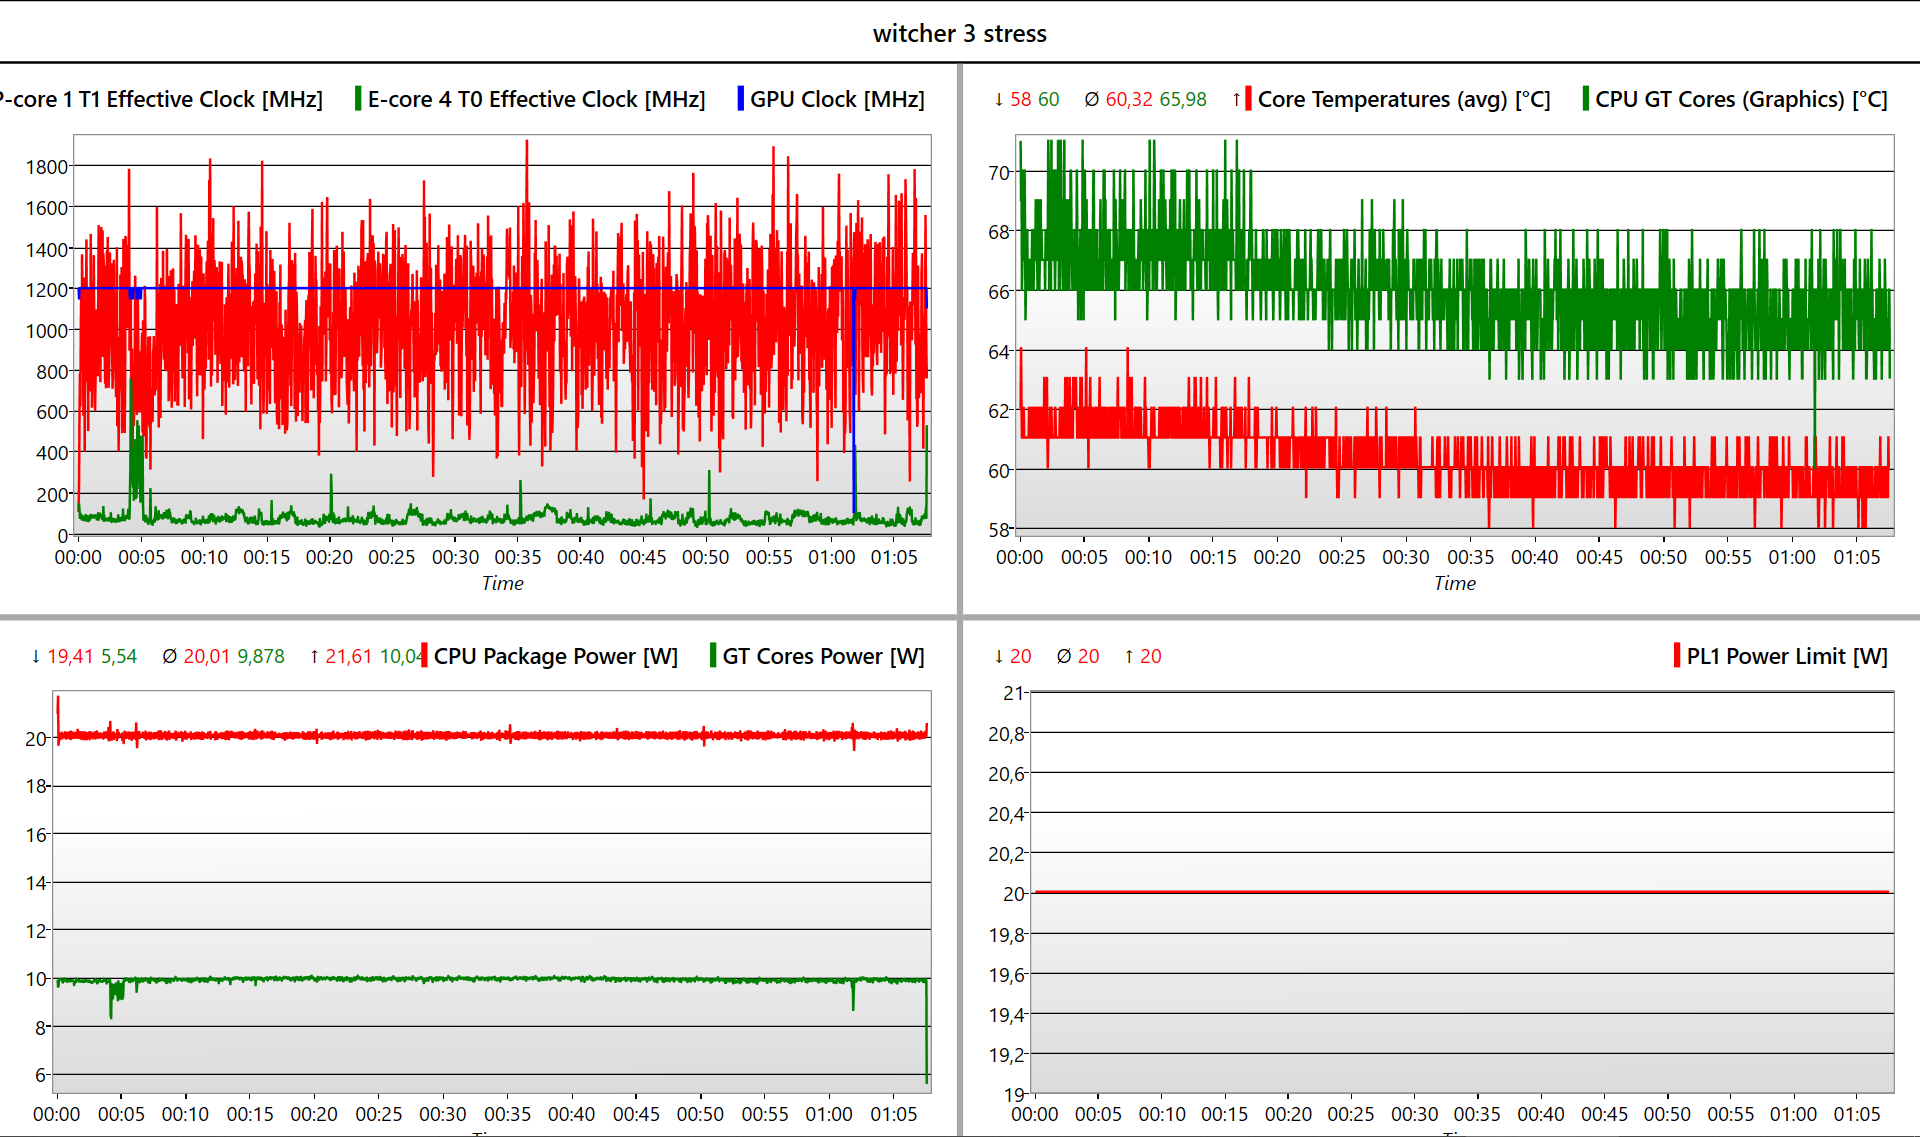
Sous une charge combinée (Prime95 + FurMark), les cœurs P ont réduit leur vitesse d'horloge de 3 GHz à environ 1,5 GHz après environ 6 minutes, ce qui est toujours supérieur à leur horloge de base de 1,3 GHz. Cela a ensuite fait chuter la température du cœur de 95°C à 64°C (203°F à 147°F). L'iGPU n'a fonctionné qu'à 300 MHz et à 58°C (136°F) au lieu des 1 300 MHz complets.
Sous une charge CPU pure, les P-cores ont fluctué entre 2 GHz et 2,5 GHz. Pendant le test de stress Witcher 3, l'iGPU a fonctionné à 1 200 MHz (seulement 100 MHz de moins que son horloge maximale), et ses températures se sont stabilisées à 65°C (149°F).

| Fréquence CPU (GHz) | Fréquence GPU (MHz) | Température CPU moyenne (°C) | Température GPU moyenne (°C) | |
| Système au repos | 0,04 | 100 | 27 | 31 |
| Prime95 Stress | 2 - 2.5 | 100 | 73 | 63 |
| Prime95 + FurMark Stress | 1.5 | 300 | 65 | 60 |
| Witcher 3 Stress | 0.9 | 1,200 | 60 | 65 |
Haut-parleurs
Lenovo a amélioré les haut-parleurs dans toute la série T. Ceux du T14s G3 sont déjà assez similaires à ceux du ThinkPad X1 Carbon. Les médiums et les aigus sont équilibrés et très linéaires, mais les basses manquent comme d'habitude. D'après nos mesures, ils peuvent monter jusqu'à 75 dB(A) - assez fort pour remplir une pièce de taille moyenne. Cela dit, vous devez utiliser un système audio externe ou une paire d'écouteurs (via Bluetooth ou la prise audio) si vous voulez profiter de la musique.
Lenovo ThinkPad T14s G3 21BR00CDGE analyse audio
(±) | le niveau sonore du haut-parleur est moyen mais bon (75.35# dB)
Basses 100 - 315 Hz
(-) | presque aucune basse - en moyenne 17.4% plus bas que la médiane
(±) | la linéarité des basses est moyenne (12.2% delta à la fréquence précédente)
Médiums 400 - 2000 Hz
(+) | médiane équilibrée - seulement 2.9% de la médiane
(+) | les médiums sont linéaires (5.5% delta à la fréquence précédente)
Aiguës 2 - 16 kHz
(+) | des sommets équilibrés - à seulement 2.1% de la médiane
(+) | les aigus sont linéaires (6.8% delta à la fréquence précédente)
Globalement 100 - 16 000 Hz
(±) | la linéarité du son global est moyenne (16% de différence avec la médiane)
Par rapport à la même classe
» 18% de tous les appareils testés de cette catégorie étaient meilleurs, 6% similaires, 76% pires
» Le meilleur avait un delta de 7%, la moyenne était de 21%, le pire était de 53%.
Par rapport à tous les appareils testés
» 25% de tous les appareils testés étaient meilleurs, 5% similaires, 69% pires
» Le meilleur avait un delta de 4%, la moyenne était de 23%, le pire était de 134%.
Lenovo ThinkPad T14 G3-21CF004NGE analyse audio
(±) | le niveau sonore du haut-parleur est moyen mais bon (77.2# dB)
Basses 100 - 315 Hz
(-) | presque aucune basse - en moyenne 24.6% plus bas que la médiane
(±) | la linéarité des basses est moyenne (10.1% delta à la fréquence précédente)
Médiums 400 - 2000 Hz
(+) | médiane équilibrée - seulement 2.6% de la médiane
(+) | les médiums sont linéaires (4.6% delta à la fréquence précédente)
Aiguës 2 - 16 kHz
(+) | des sommets équilibrés - à seulement 3.3% de la médiane
(+) | les aigus sont linéaires (3.8% delta à la fréquence précédente)
Globalement 100 - 16 000 Hz
(±) | la linéarité du son global est moyenne (18.8% de différence avec la médiane)
Par rapport à la même classe
» 35% de tous les appareils testés de cette catégorie étaient meilleurs, 7% similaires, 58% pires
» Le meilleur avait un delta de 7%, la moyenne était de 21%, le pire était de 53%.
Par rapport à tous les appareils testés
» 43% de tous les appareils testés étaient meilleurs, 8% similaires, 49% pires
» Le meilleur avait un delta de 4%, la moyenne était de 23%, le pire était de 134%.
Gestion de l'énergie : Le ThinkPad T14s G3 est très efficace avec Intel
Consommation électrique
Le ThinkPad T14s G3 avec le Intel Core i5-1235U nous a donné les mesures de consommation d'énergie les plus faibles du groupe de comparaison : en mode veille, il a utilisé 4,6 W en moyenne et 5,6 W au maximum. Le ThinkPad T14 AMD nécessite un peu plus d'énergie en comparaison. Le chargeur de 65 W fourni n'a été poussé à ses limites que lors du test de stress combiné, un scénario peu probable dans une utilisation quotidienne. Même dans ce cas, cela n'a pas posé de problème.
| Éteint/en veille | |
| Au repos | |
| Fortement sollicité |
|
Légende:
min: | |
| Lenovo ThinkPad T14s G3 21BR00CDGE i5-1235U, Iris Xe G7 80EUs, SK Hynix HFS512 GDE9X081N, IPS LED, 1920x1200, 14" | Lenovo ThinkPad T14s G2 20WM003TGE i7-1165G7, Iris Xe G7 96EUs, Samsung PM981a MZVLB1T0HBLR, IPS LED, 1920x1080, 14" | Lenovo ThinkPad T14 G3-21CF004NGE R7 PRO 6850U, Radeon 680M, Kioxia BG5 KBG5AZNV512G, IPS, 1920x1200, 14" | Lenovo ThinkPad X13 G3 21BN0046GE i5-1235U, Iris Xe G7 80EUs, SK Hynix HFS512 GDE9X081N, IPS Grade, 1920x1200, 13.3" | Lenovo ThinkPad T16 G1 21BWS00200 i5-1240P, Iris Xe G7 80EUs, Samsung PM9A1 MZVL2512HCJQ, IPS, 1920x1200, 16" | Lenovo ThinkPad X1 Carbon G10 21CC001RGE i5-1250P, Iris Xe G7 80EUs, Samsung PM9A1 MZVL2512HCJQ, IPS LED, 1920x1200, 14" | HP EliteBook 845 G9 6F6H9EA R5 PRO 6650U, Radeon 660M, Samsung PM991 MZVLQ512HBLU, IPS, 1920x1200, 14" | Dell Latitude 7420 JW6MH i5-1145G7, Iris Xe G7 80EUs, SK Hynix BC711 HFM512GD3HX015N, IPS, 1920x1080, 14" | Schenker Vision 14 2022 RTX 3050 Ti i7-12700H, GeForce RTX 3050 Ti Laptop GPU, Samsung SSD 980 Pro 1TB MZ-V8P1T0BW, IPS, 2880x1800, 14" | |
|---|---|---|---|---|---|---|---|---|---|
| Power Consumption | -7% | -6% | -12% | -18% | -5% | -14% | -14% | -139% | |
| Idle Minimum * (Watt) | 2.3 | 2.2 4% | 2.4 -4% | 2.7 -17% | 2.9 -26% | 2.9 -26% | 3 -30% | 2.7 -17% | 7.5 -226% |
| Idle Average * (Watt) | 4.6 | 5.5 -20% | 5.3 -15% | 5.2 -13% | 6 -30% | 4.9 -7% | 5 -9% | 6 -30% | 10.4 -126% |
| Idle Maximum * (Watt) | 5.6 | 6.1 -9% | 5.6 -0% | 6.2 -11% | 6.9 -23% | 6 -7% | 9 -61% | 7.6 -36% | 11.4 -104% |
| Load Average * (Watt) | 37.1 | 41.3 -11% | 39.7 -7% | 38.4 -4% | 27.3 26% | 29.3 21% | 41 -11% | 37 -0% | 83.3 -125% |
| Witcher 3 ultra * (Watt) | 32.8 | 34.5 -5% | 42.8 -30% | 41.9 -28% | 42.6 -30% | 36.6 -12% | 32.6 1% | 33.2 -1% | 92.7 -183% |
| Load Maximum * (Watt) | 65.8 | 67.3 -2% | 50.6 23% | 66.7 -1% | 81.53 -24% | 63.3 4% | 50 24% | 65 1% | 110.3 -68% |
* ... Moindre est la valeur, meilleures sont les performances
Power consumption Witcher 3 / Stress test
Power consumption with external monitor
Durée de vie de la batterie
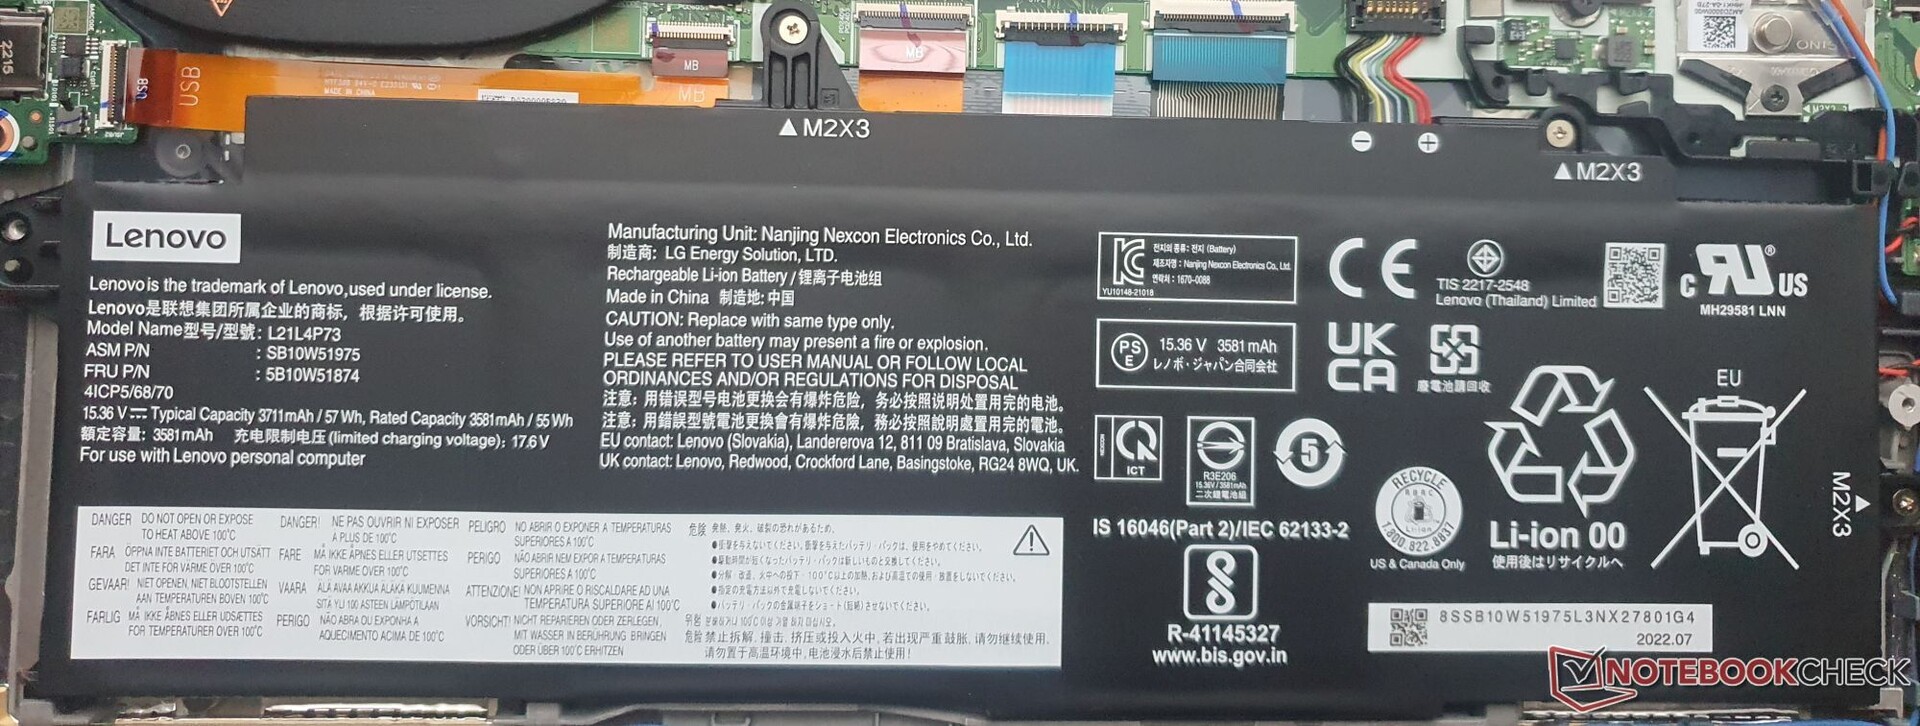
La batterie de 57 Wh a fourni 9h 36min d'utilisation (surf sur le web en Wi-Fi), soit presque aussi longtemps que sur les T14 de dernière génération. L'écran FHD+ à faible consommation d'énergie aide l'ordinateur portable à atteindre ce niveau d'autonomie. En particulier, le ThinkPad T14s G3 était encore capable de tenir plus de huit heures à pleine luminosité de l'écran. Il faut environ 90 minutes pour recharger complètement la batterie
Comme le HP EliteBook 845le ThinkPad T14 G3 AMD a duré 34 % de plus que le T14s G3, malgré une batterie 10 % plus petite. Le T14s a réussi à tenir pendant 116 minutes à pleine charge, ce qui signifie que les performances du processeur sont pleinement exploitées, même sur batterie.
| Lenovo ThinkPad T14s G3 21BR00CDGE i5-1235U, Iris Xe G7 80EUs, 57 Wh | Lenovo ThinkPad T14s G2 20WM003TGE i7-1165G7, Iris Xe G7 96EUs, 57 Wh | Lenovo ThinkPad T14 G3-21CF004NGE R7 PRO 6850U, Radeon 680M, 52.5 Wh | Lenovo ThinkPad X13 G3 21BN0046GE i5-1235U, Iris Xe G7 80EUs, 54.7 Wh | Lenovo ThinkPad X1 Yoga G7 21CE002HGE i7-1270P, Iris Xe G7 96EUs, 57 Wh | Lenovo ThinkPad X1 Carbon G10 21CC001RGE i5-1250P, Iris Xe G7 80EUs, 57 Wh | HP EliteBook 845 G9 6F6H9EA R5 PRO 6650U, Radeon 660M, 51 Wh | Dell Latitude 7420 JW6MH i5-1145G7, Iris Xe G7 80EUs, 63 Wh | Schenker Vision 14 2022 RTX 3050 Ti i7-12700H, GeForce RTX 3050 Ti Laptop GPU, 99.8 Wh | |
|---|---|---|---|---|---|---|---|---|---|
| Autonomie de la batterie | 31% | 47% | 30% | 26% | 43% | 26% | 74% | 36% | |
| H.264 (h) | 7.9 | 14.6 85% | 16.4 108% | 12.2 54% | 10.9 38% | 11.1 41% | |||
| WiFi v1.3 (h) | 9.6 | 9.7 1% | 12.9 34% | 10.2 6% | 8.9 -7% | 10.2 6% | 12.1 26% | 14.1 47% | 10.1 5% |
| Load (h) | 1.3 | 1.4 8% | 1.3 0% | 2 54% | 1.7 31% | 2.4 85% | 2.6 100% | 2.1 62% |
Points positifs
Points négatifs
Verdict : l'efficace ThinkPad T14s G3 est l'ordinateur portable professionnel idéal

Avec le T14s G3 Intel, Lenovo a créé l'un des meilleurs, sinon le meilleur, ThinkPads lorsqu'il s'agit de combiner un design compact avec des émissions très faibles et des performances élevées - des caractéristiques que les utilisateurs professionnels recherchent dans un ordinateur portable. L'appareil est doté d'un châssis robuste et d'un écran 16:10. Il a bénéficié d'une puissante mise à niveau du processeur (environ 50 % de performances en plus par rapport à son prédécesseur) sans sacrifier l'autonomie de la batterie.
Il s'agit du premier ThinkPad de la série T doté d'une option OLED, que nous n'avons pas eu l'occasion de tester dans le cadre de cet examen. Malheureusement, l'écran à faible consommation d'énergie de l'unité d'examen souffre d'un important effet fantôme et de nuages, ainsi que d'un manque de luminosité. Le contraste et la précision des couleurs sont excellents, mais les utilisateurs qui souhaitent un meilleur écran devraient probablement opter pour l'option OLED.
Le ThinkPad T14s G3 Intel est un choix solide pour ceux qui recherchent un ordinateur portable professionnel silencieux et rapide sans inconvénients majeurs et qui ne veulent pas se priver d'excellents périphériques d'entrée, d'un riche ensemble de fonctionnalités et d'un facteur de forme compact.
En termes d'options de mémoire vive, vous devriez vous demander si 16 Go sont suffisants ou si vous voulez obtenir 32 Go tout de suite. En effet, contrairement au HP EliteBook 845 G9, Schenker Vision 14 et ThinkPad T14le T14s n'a pas de RAM évolutive.
Le T14s est devenu encore plus similaire au ThinkPad X1 Carbonà l'exception de son poids. Mais le T14s a de meilleures performances durables. Si vous avez besoin d'un ordinateur portable encore plus compact, le ThinkPad X13 (qui a la même carte mère) peut valoir le coup d'œil. Le Vision 14 de Schenker est également plus petit que le T14s et offre une plus grande efficacité et une RTX 3050 Ti. Le site ThinkPad T14 AMD démontre le potentiel et l'efficacité des processeurs AMD. C'est quelque chose que le ThinkPad T14s G3 AMD doit encore prouver dans notre prochaine revue.
Prix et disponibilité
En Allemagne, notre modèle de référence(21BR00CDGE) coûte habituellement €1,865 (US$1,980) mais est actuellement disponible pour €1,699 (US$1,803) après remise pour les étudiants. Sinon, vous pouvez obtenir une version AMD avec le rapide Ryzen 7 PRO 6850U pour environ 50 € (53 $ US) de moins. Campuspoint propose même à un modèle OLED. Pour les personnes disposant d'un budget limité, il existe un modèle AMD moins cher avec 8 Go de RAM pour environ 1 600 € (1 699 $ US)
Pour les résidents américains, vous pouvez vous rendre sur le site Lenovo US pour configurer votre ThinkPad T14s G3. Des réductions sont également disponibles pour les étudiants et les éducateurs.
Lenovo ThinkPad T14s G3 21BR00CDGE
- 12/16/2022 v7 (old)
Marvin Gollor
Price comparison

