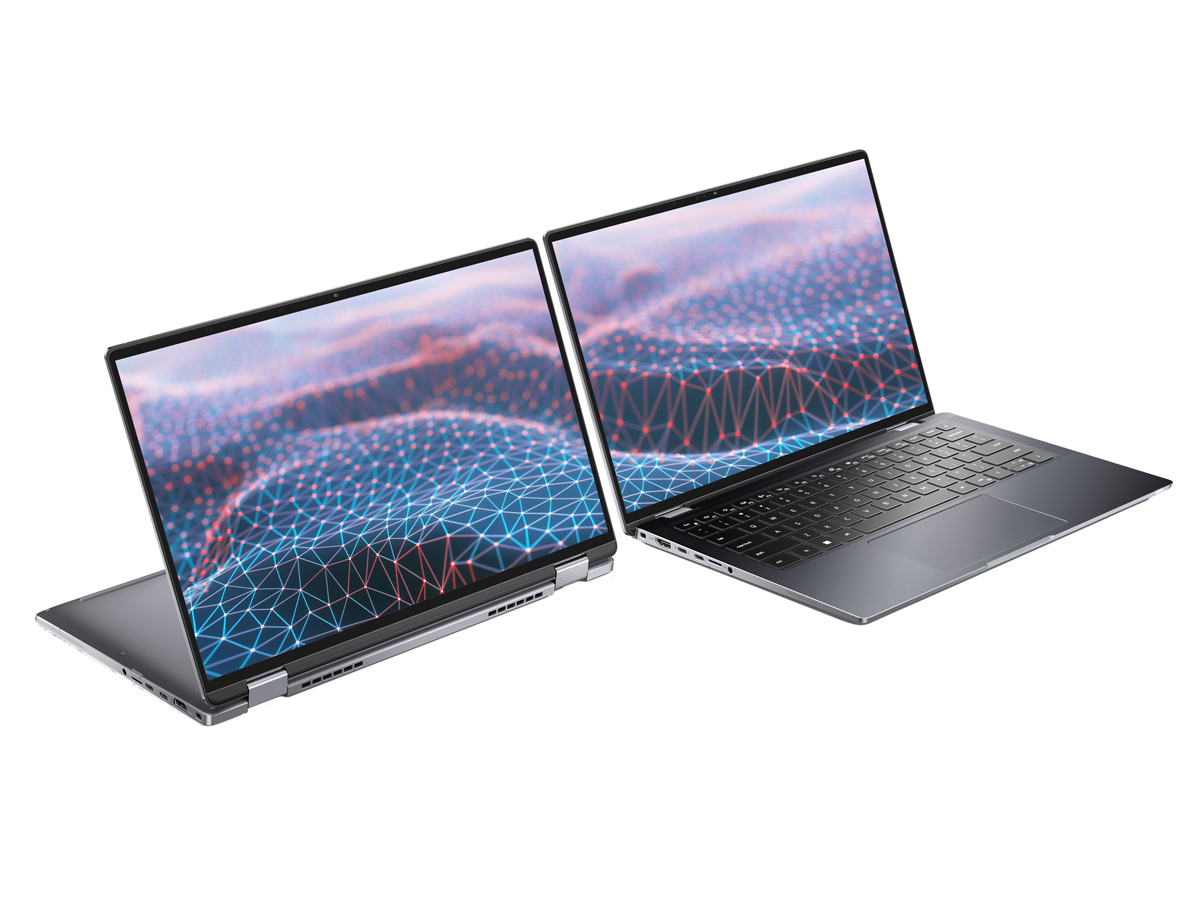
Test du Dell Latitude 9430 : mise à jour du 2-en-1 avec la 12e génération d'Intel
Après avoir entièrement rafraîchi la série l'année dernière avec le Latitude 9420 2-en-1le 9430 2-en-1 de cette année, Latitude, est un pas en avant relativement mineur pour la série. Le dernier modèle intègre des processeurs Intel Alder Lake-U de 12e génération qui remplacent les options de la 11e génération Tiger Lake-U de la Latitude 9420 2-en-1. Il y a également d'autres améliorations que nous aborderons dans notre article, mais le design du châssis reste inchangé et la plupart de nos commentaires sur le Latitude 9420 2-in-1 s'appliquent également au Latitude 9430 2-in-1.
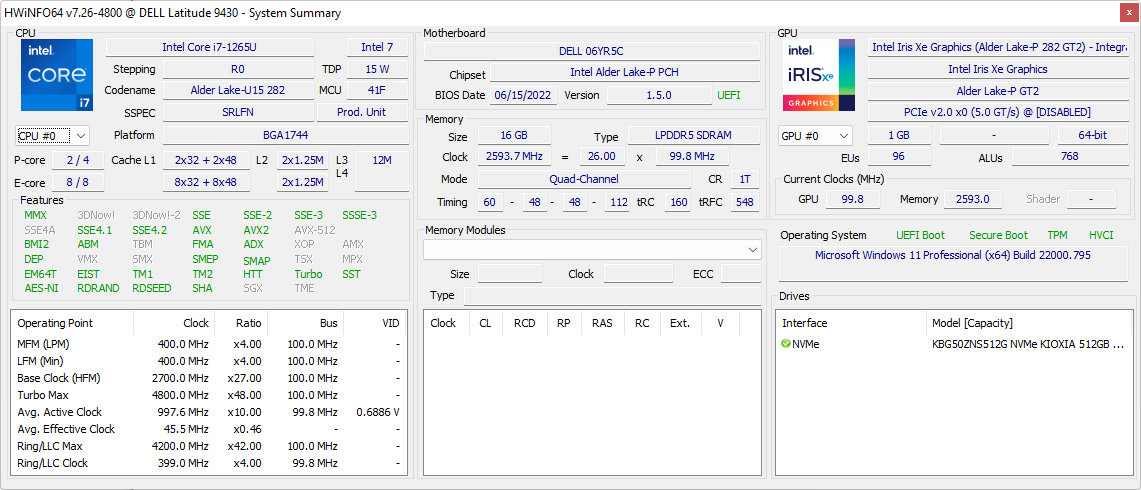
Notre unité de test avec le processeur Core i7-1265U, 16 Go de RAM soudée, un écran tactile QHD+ 1600p et un SSD NVMe de 512 Go peut être trouvée en ligne pour environ 2700 USD. Des SKU Core i5-1245U sont également disponibles, mais l'écran QHD+ est fixe pour le facteur de forme 2-en-1. Les concurrents dans cet espace comprennent d'autres ordinateurs portables de 14 pouces axés sur le bureau, comme leLenovo ThinkPad X1 Yoga G7, HP EliteBook 840 series,MSI Summit E14 Flip, LG Gram 14T90Pou Huawei MateBook 14.
Plus de commentaires sur Dell :
Comparaison avec les concurrents potentiels
Note | Date | Modèle | Poids | Épaisseur | Taille | Résolution | Prix |
|---|---|---|---|---|---|---|---|
| 89.8 % v7 (old) | 08/22 | Dell Latitude 9430 2-in-1 i7-1265U, Iris Xe G7 96EUs | 1.5 kg | 13.94 mm | 14.00" | 2560x1600 | |
| 89 % v7 (old) | 07/21 | Dell Latitude 9420 2-in-1 i7-1185G7, Iris Xe G7 96EUs | 1.5 kg | 13.94 mm | 14.00" | 2560x1600 | |
| 86.1 % v7 (old) | 07/22 | MSI Summit E14 Flip Evo A12MT i7-1260P, Iris Xe G7 96EUs | 1.6 kg | 17.9 mm | 14.00" | 2880x1800 | |
| 87.5 % v7 (old) | 05/22 | LG Gram 14T90P i5-1135G7, Iris Xe G7 80EUs | 1.2 kg | 17 mm | 14.00" | 1900x1200 | |
| 89.4 % v7 (old) | 05/22 | Lenovo ThinkPad X1 Yoga G7 21CE002HGE i7-1270P, Iris Xe G7 96EUs | 1.5 kg | 15.53 mm | 14.00" | 1920x1200 | |
| 86.5 % v7 (old) | 05/22 | Asus ZenBook Flip 14 UN5401QA-KN085W R7 5800H, Vega 8 | 1.4 kg | 15.9 mm | 14.00" | 2880x1800 |
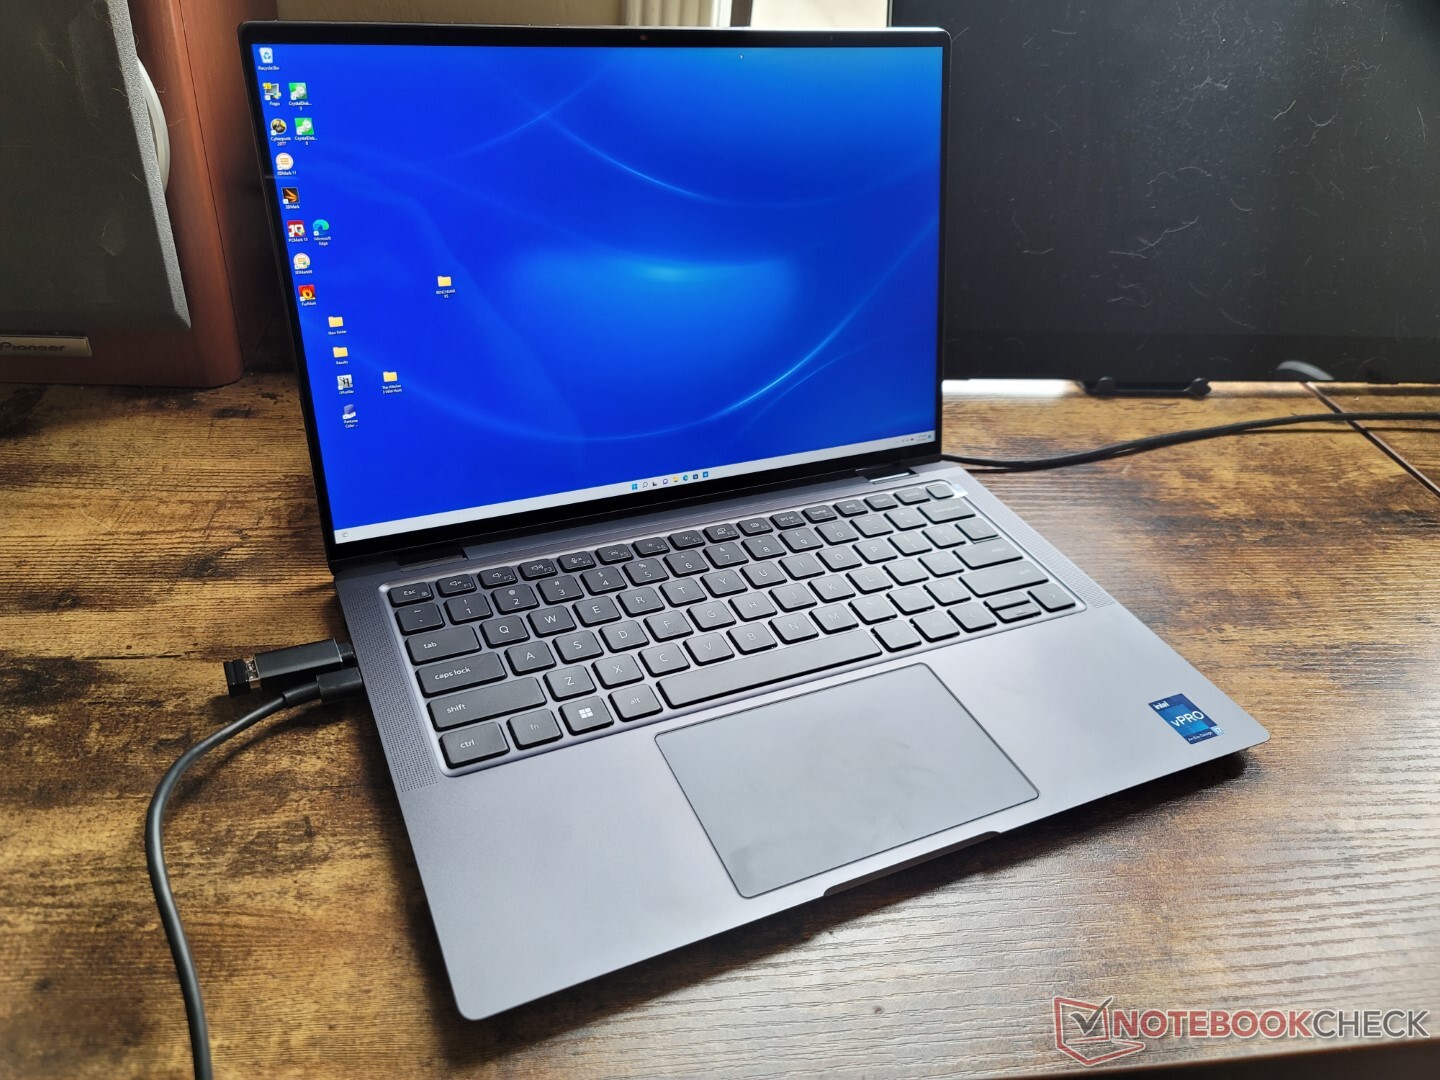
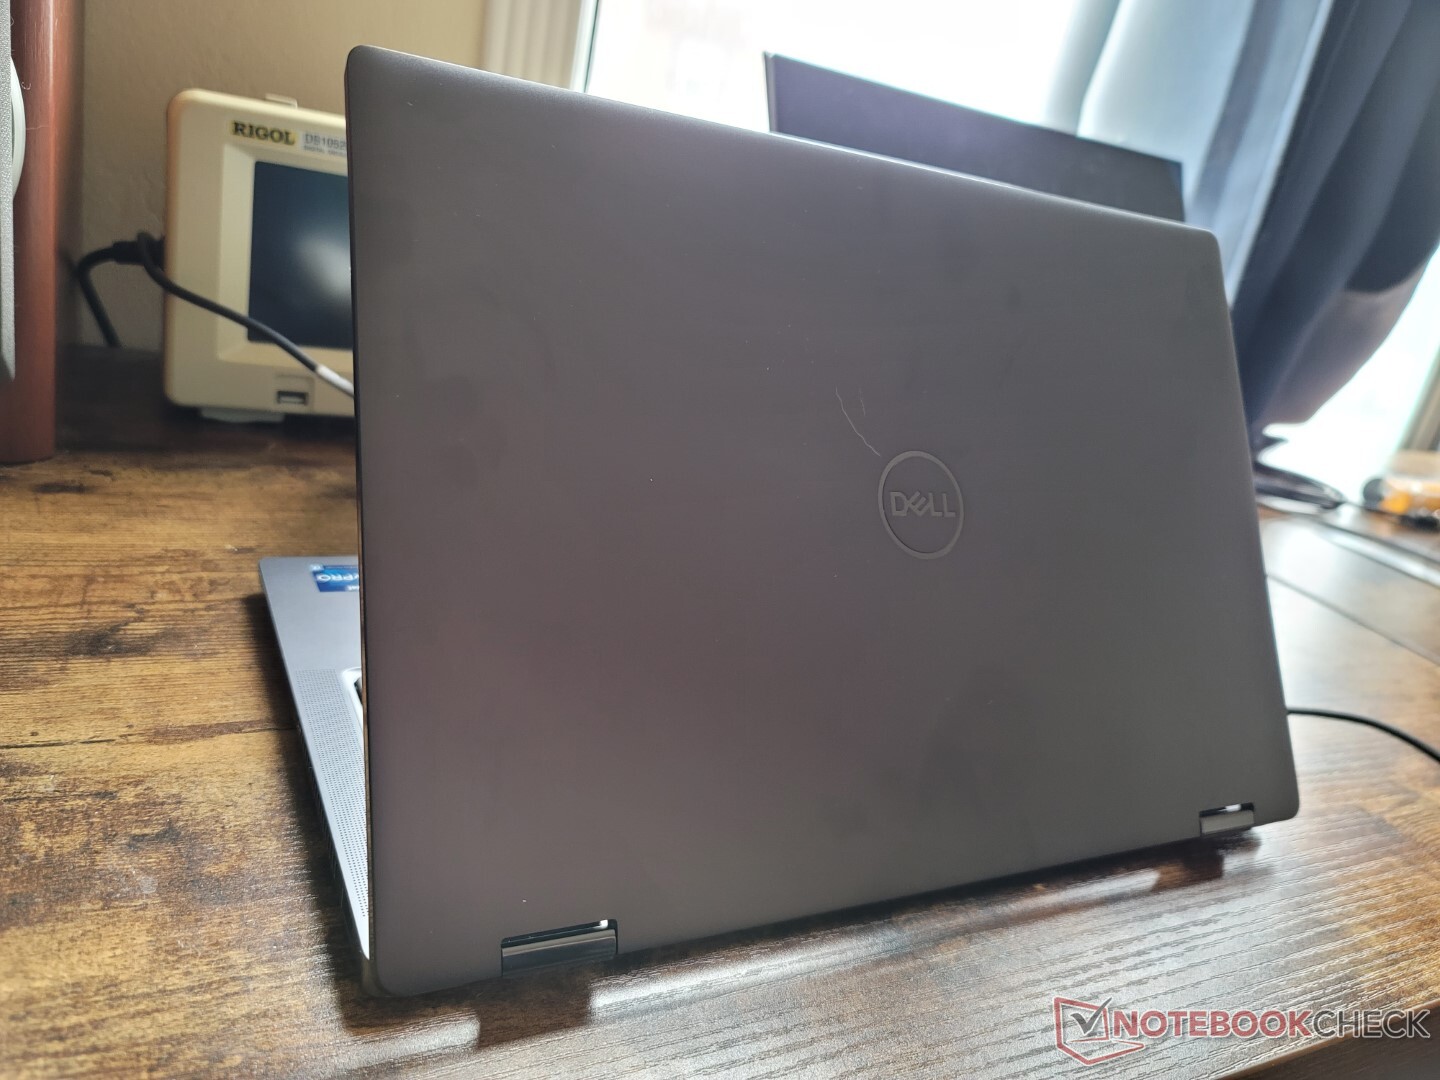
Cas
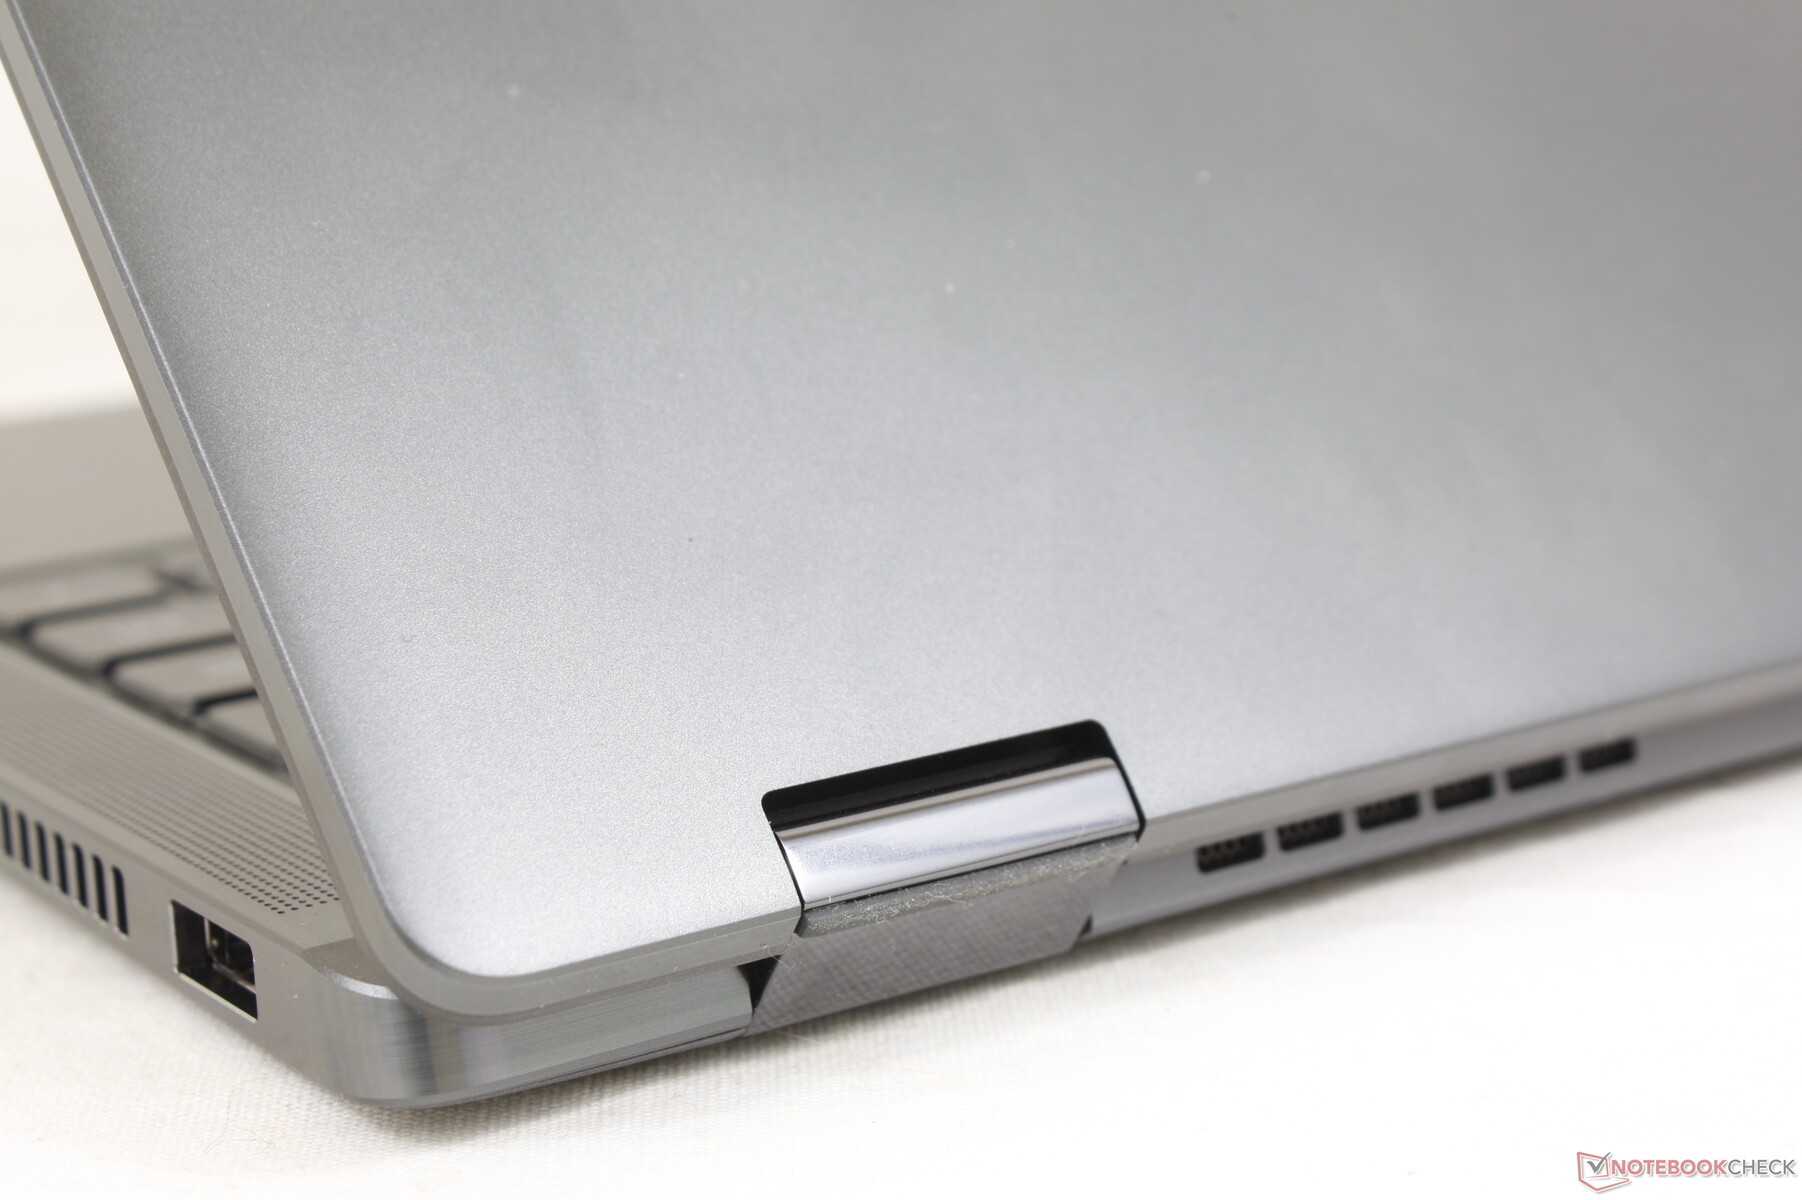
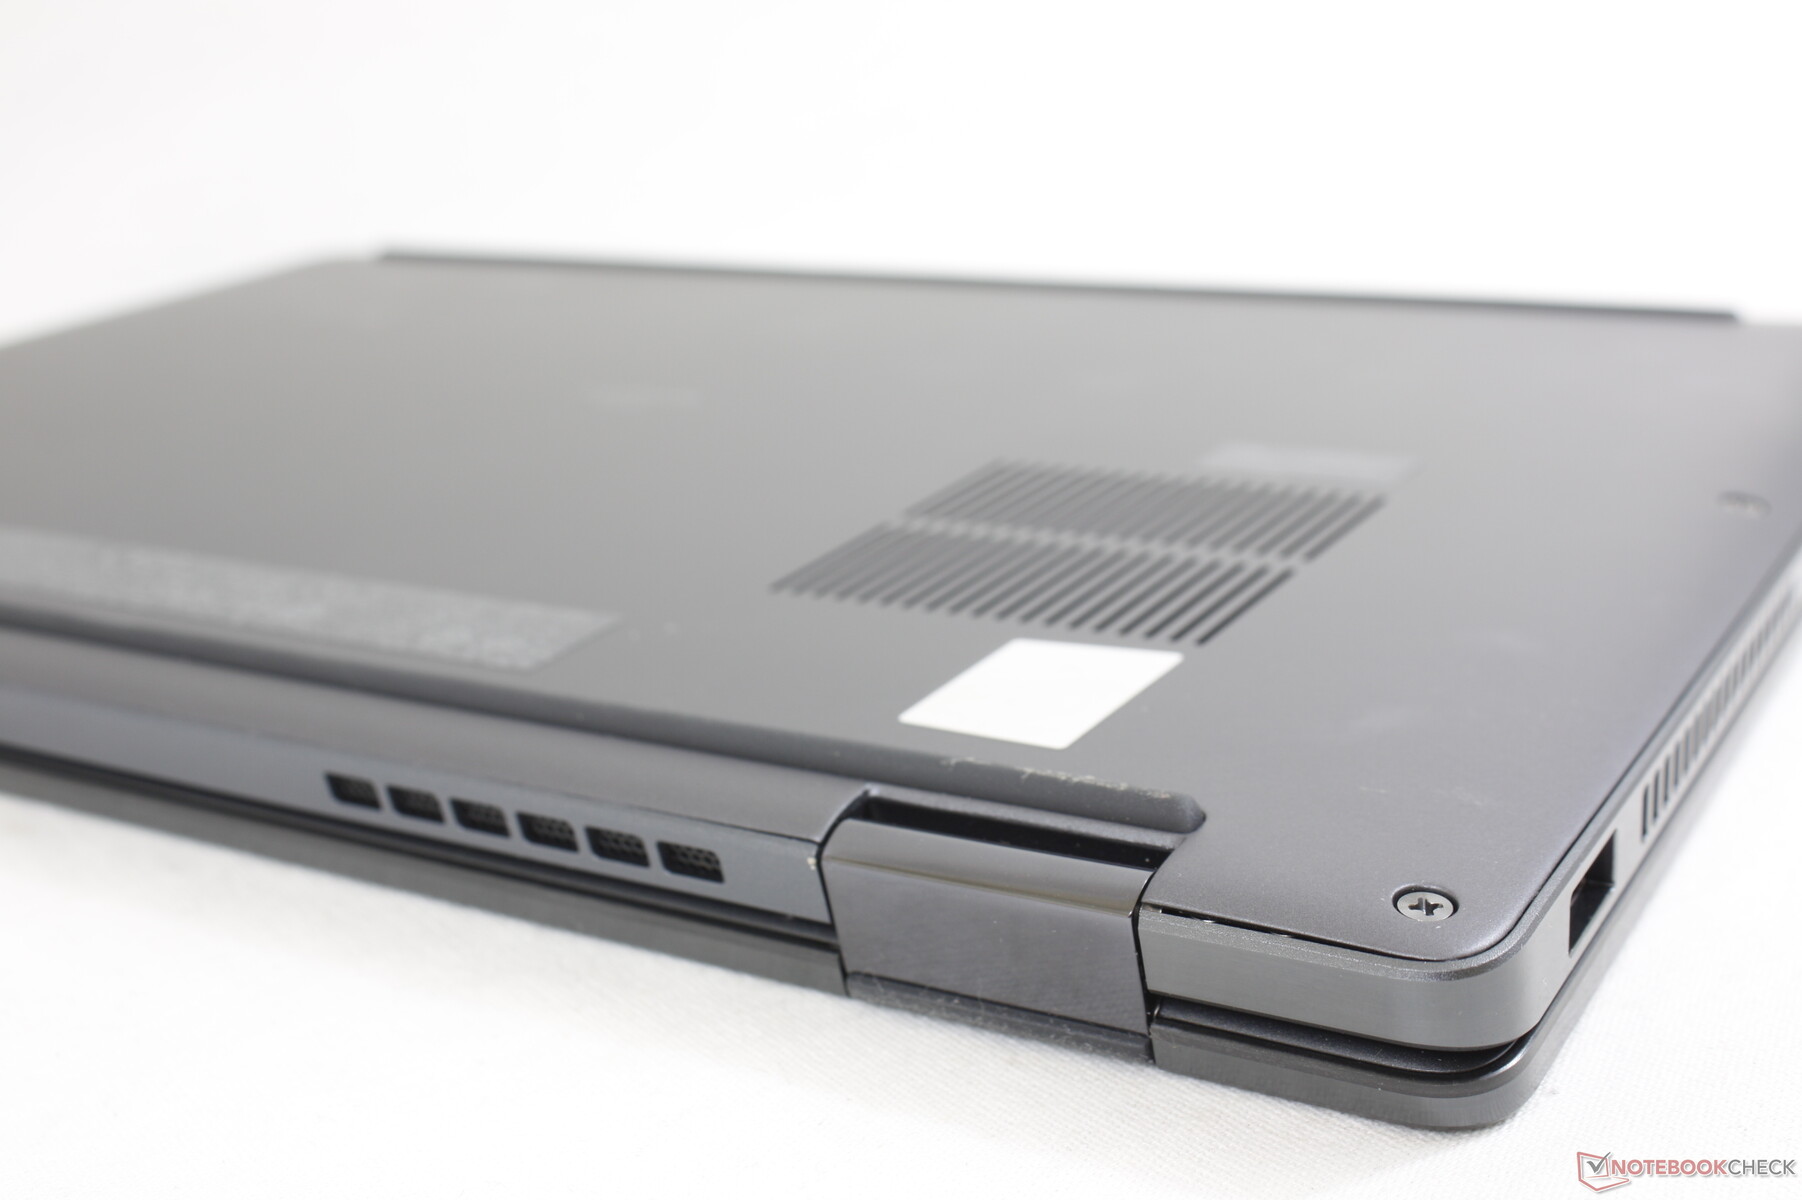
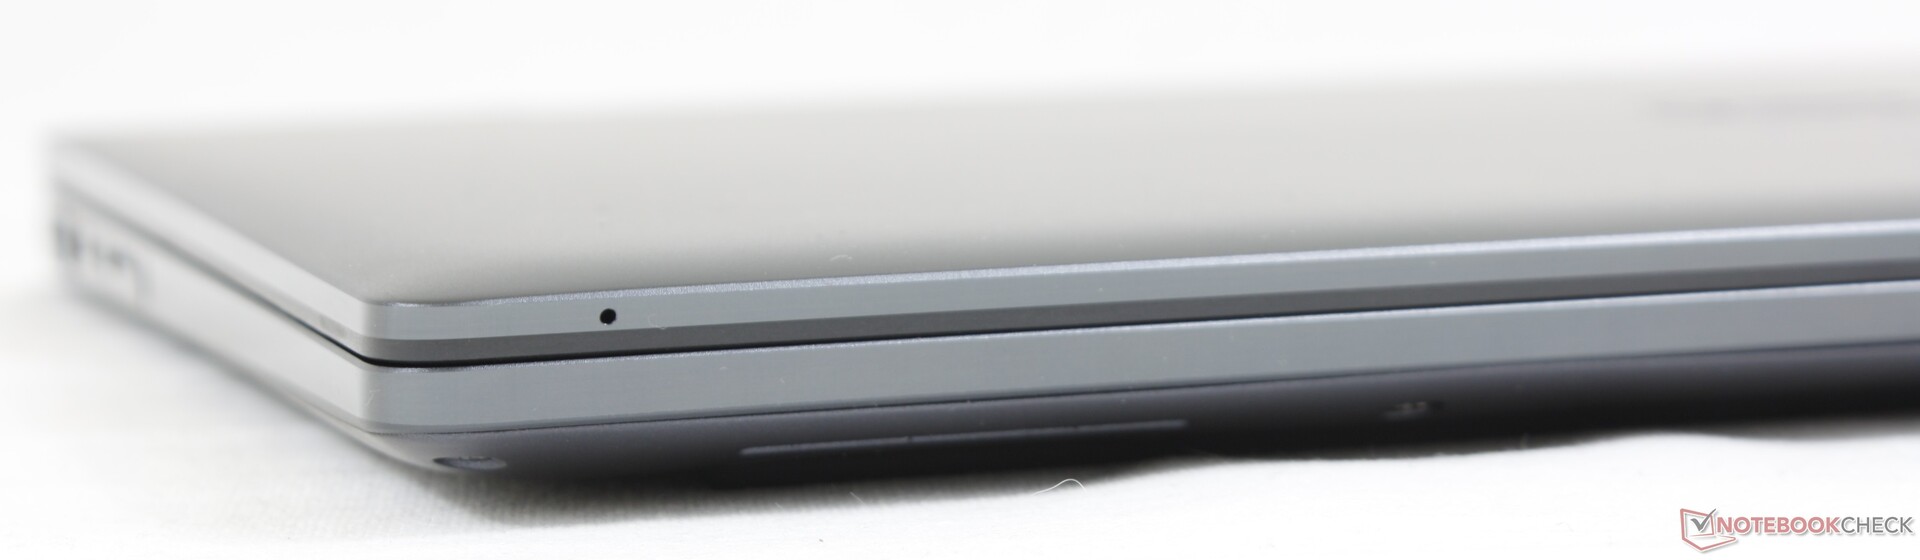
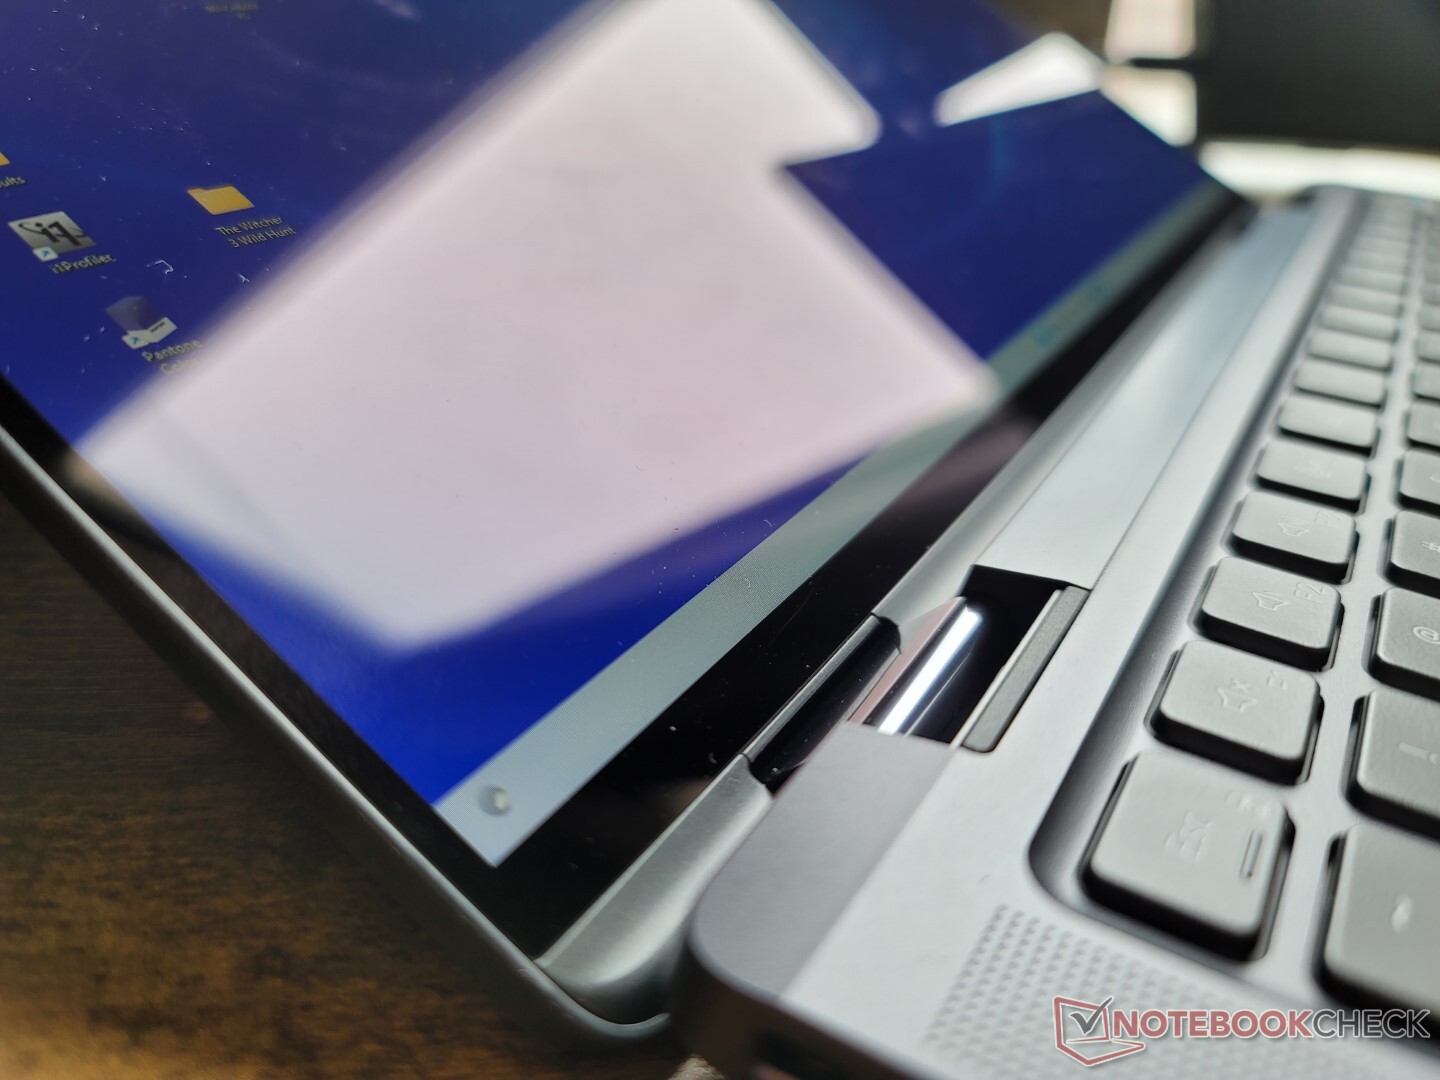
Dell a apparemment abandonné la couleur grise plus claire du Latitude 9420 2-en-1 pour des tons plus sombres sur le Latitude 9430 2-en-1. Il n'y a pas d'autre changement visuel majeur que la nouvelle couleur distinctive
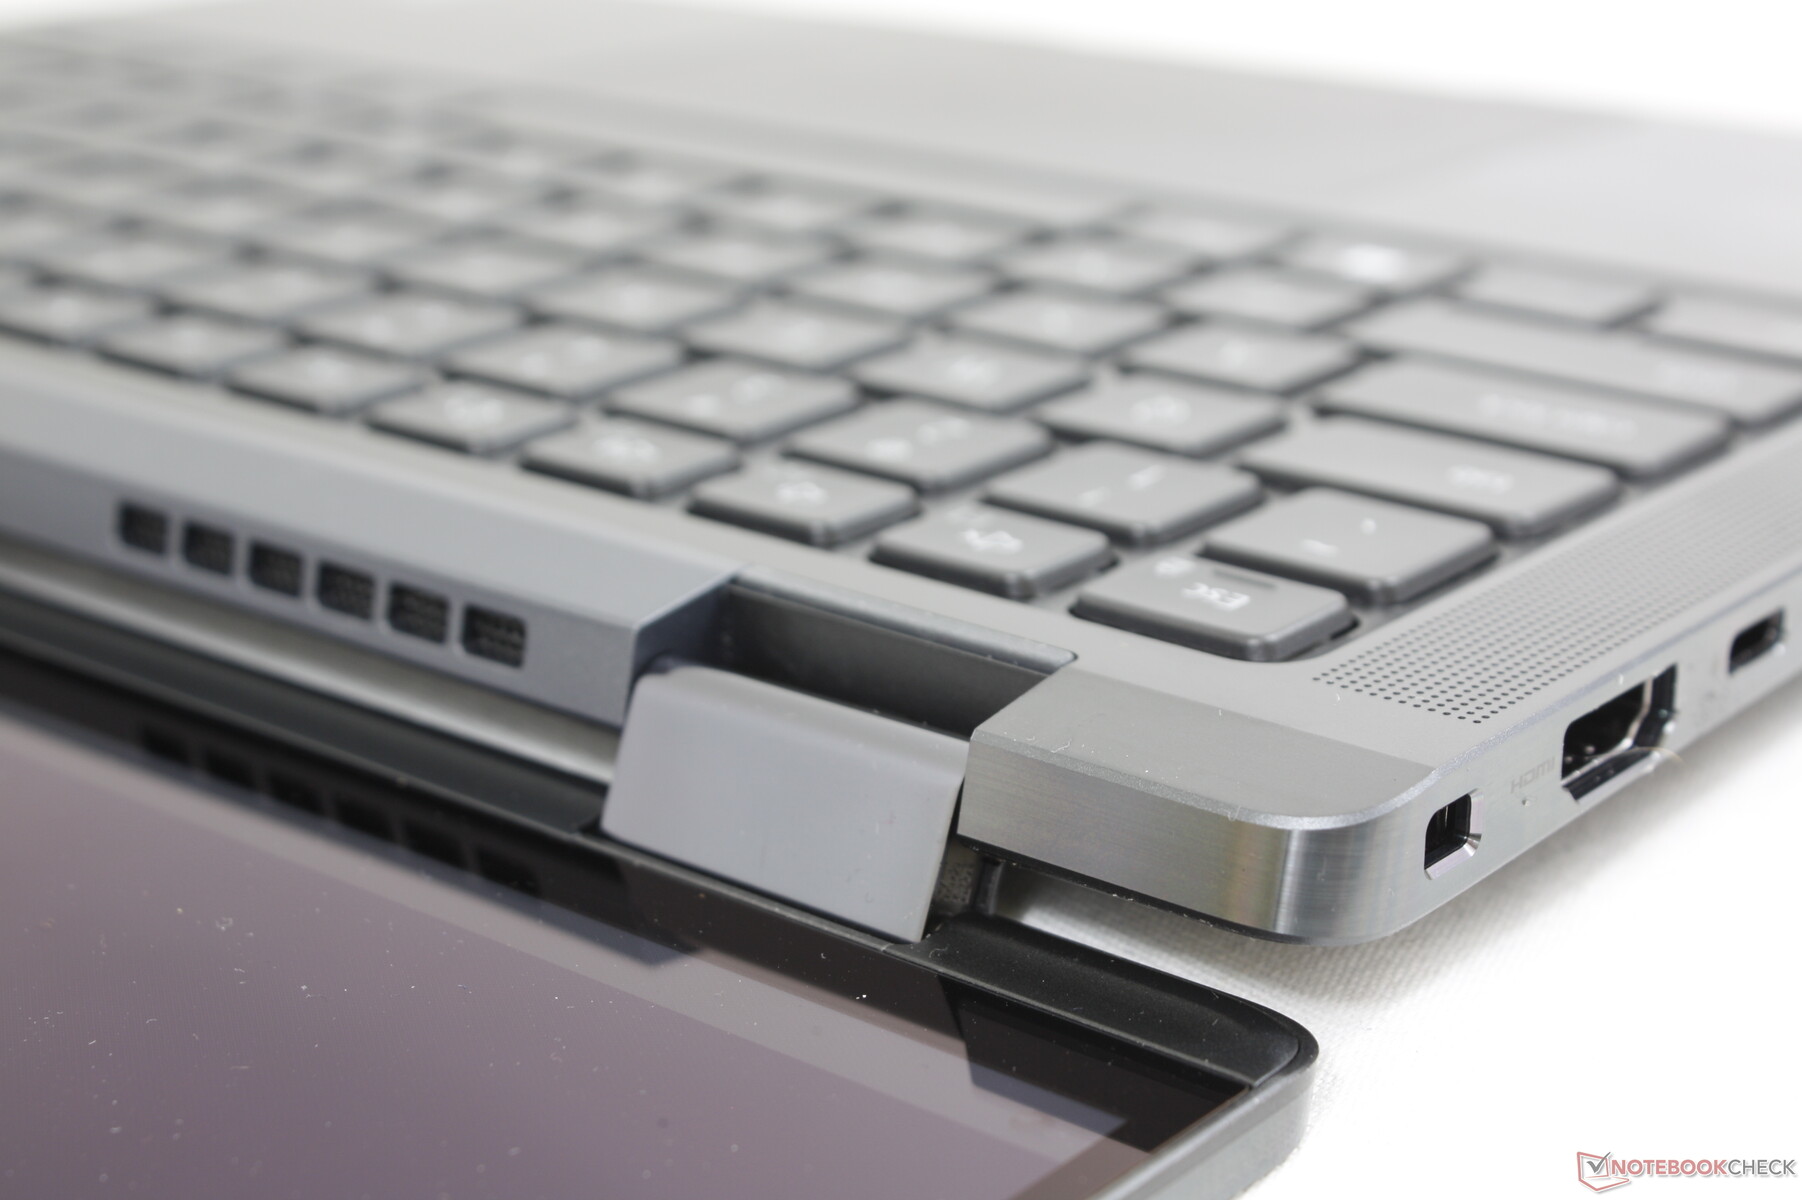
Le design est toujours l'un des plus petits et des plus fins dans la catégorie des 14 pouces, même après un an sur le marché. Il n'est pas plus léger pour autant, car le modèle est généralement doté de plus de fonctionnalités, notamment la connectivité 5G en option
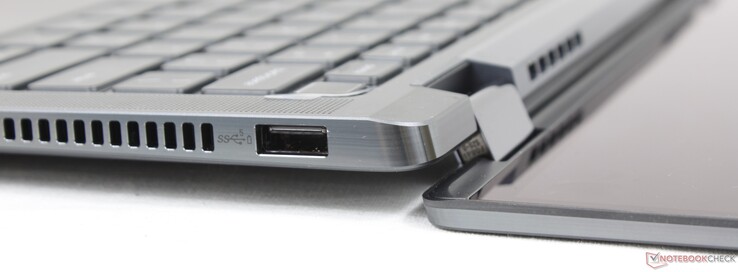
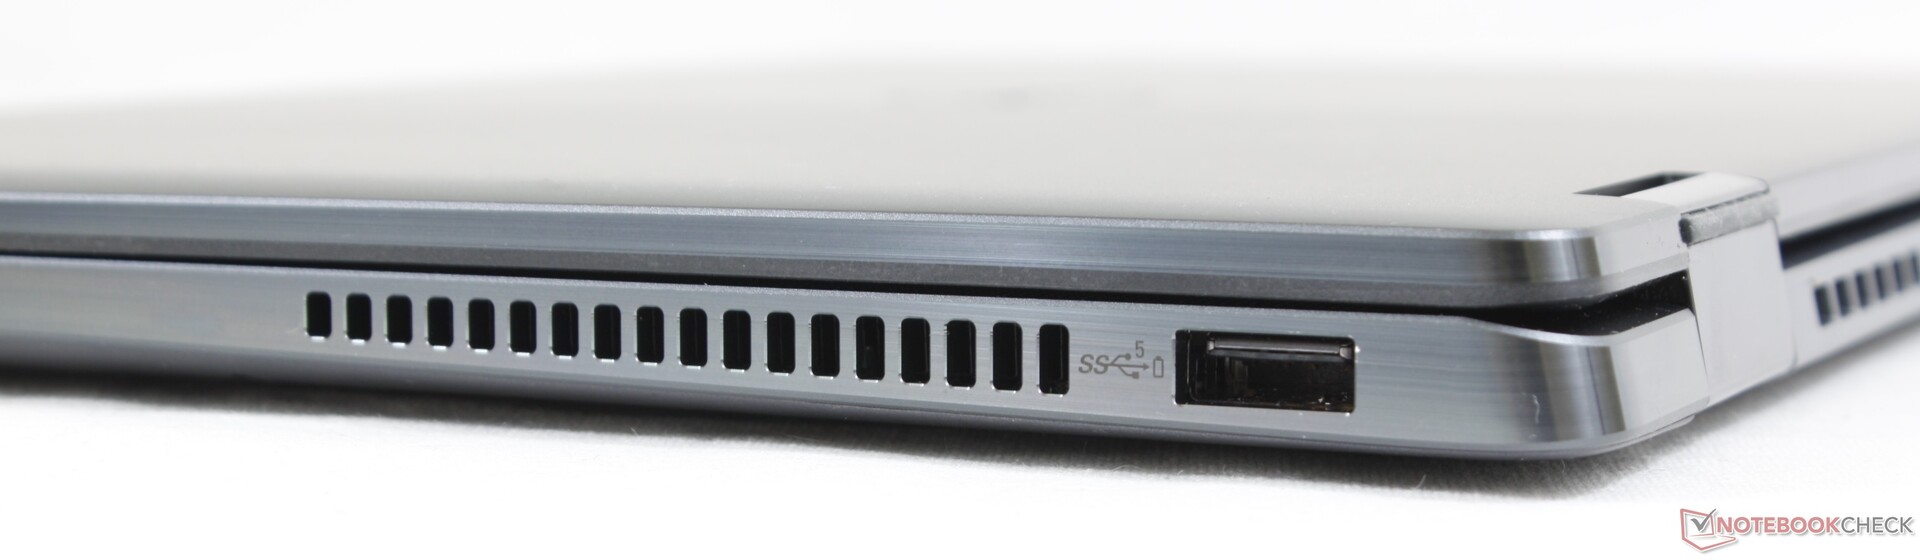
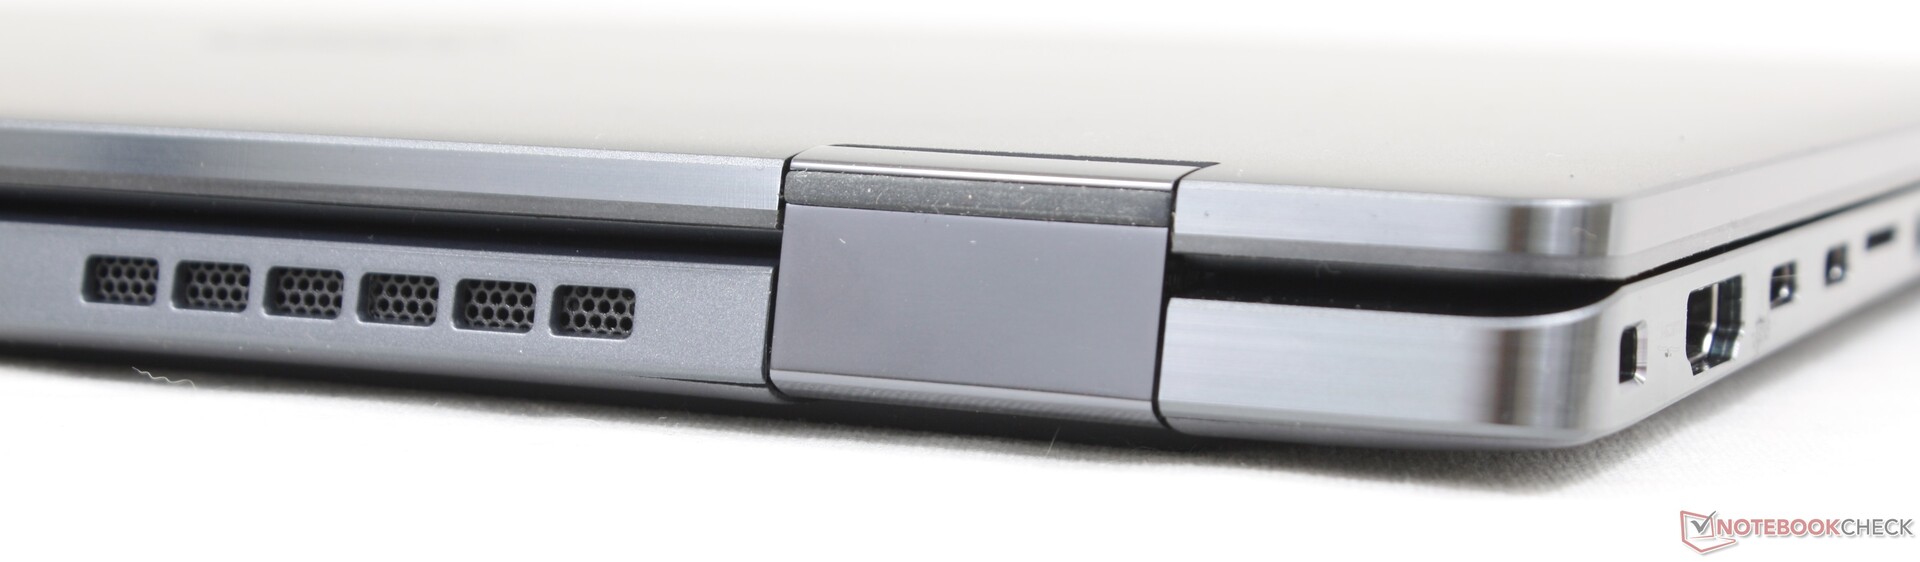
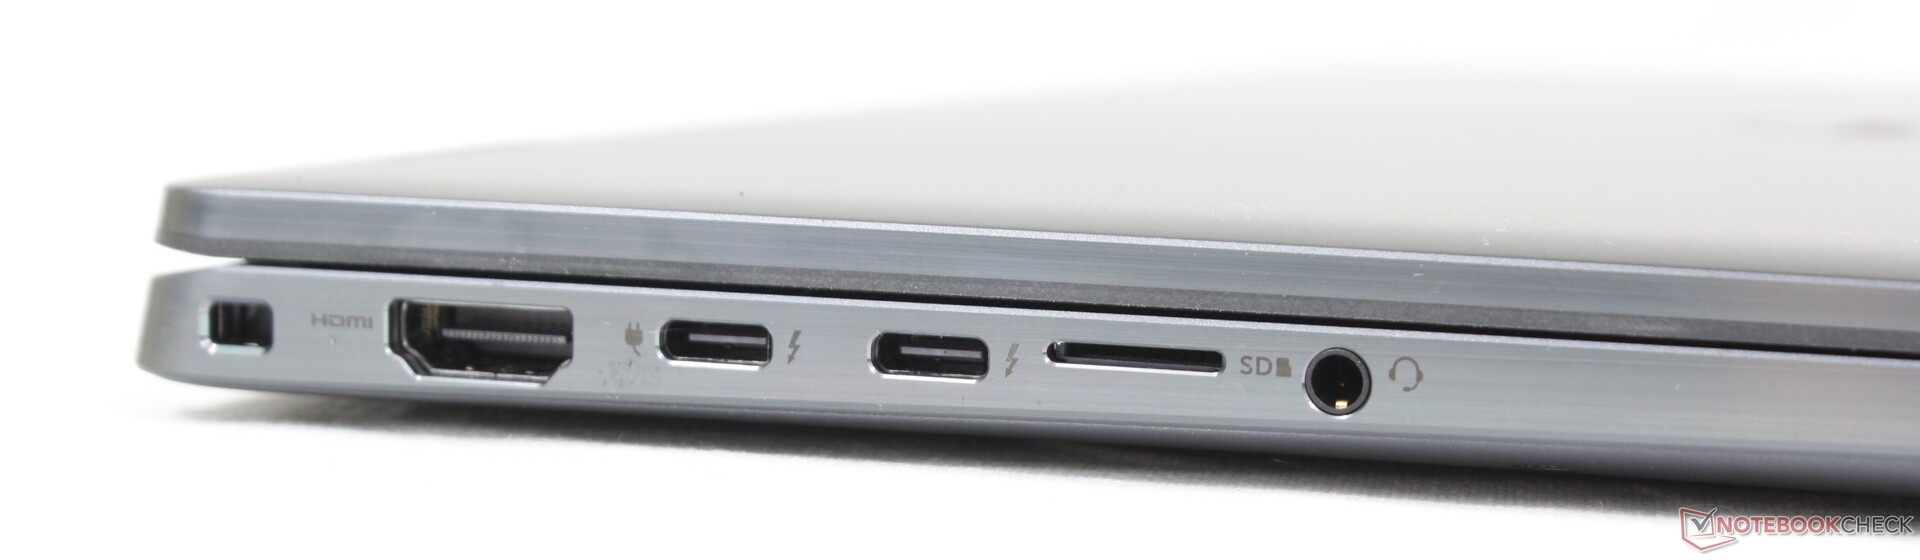
Connectivité
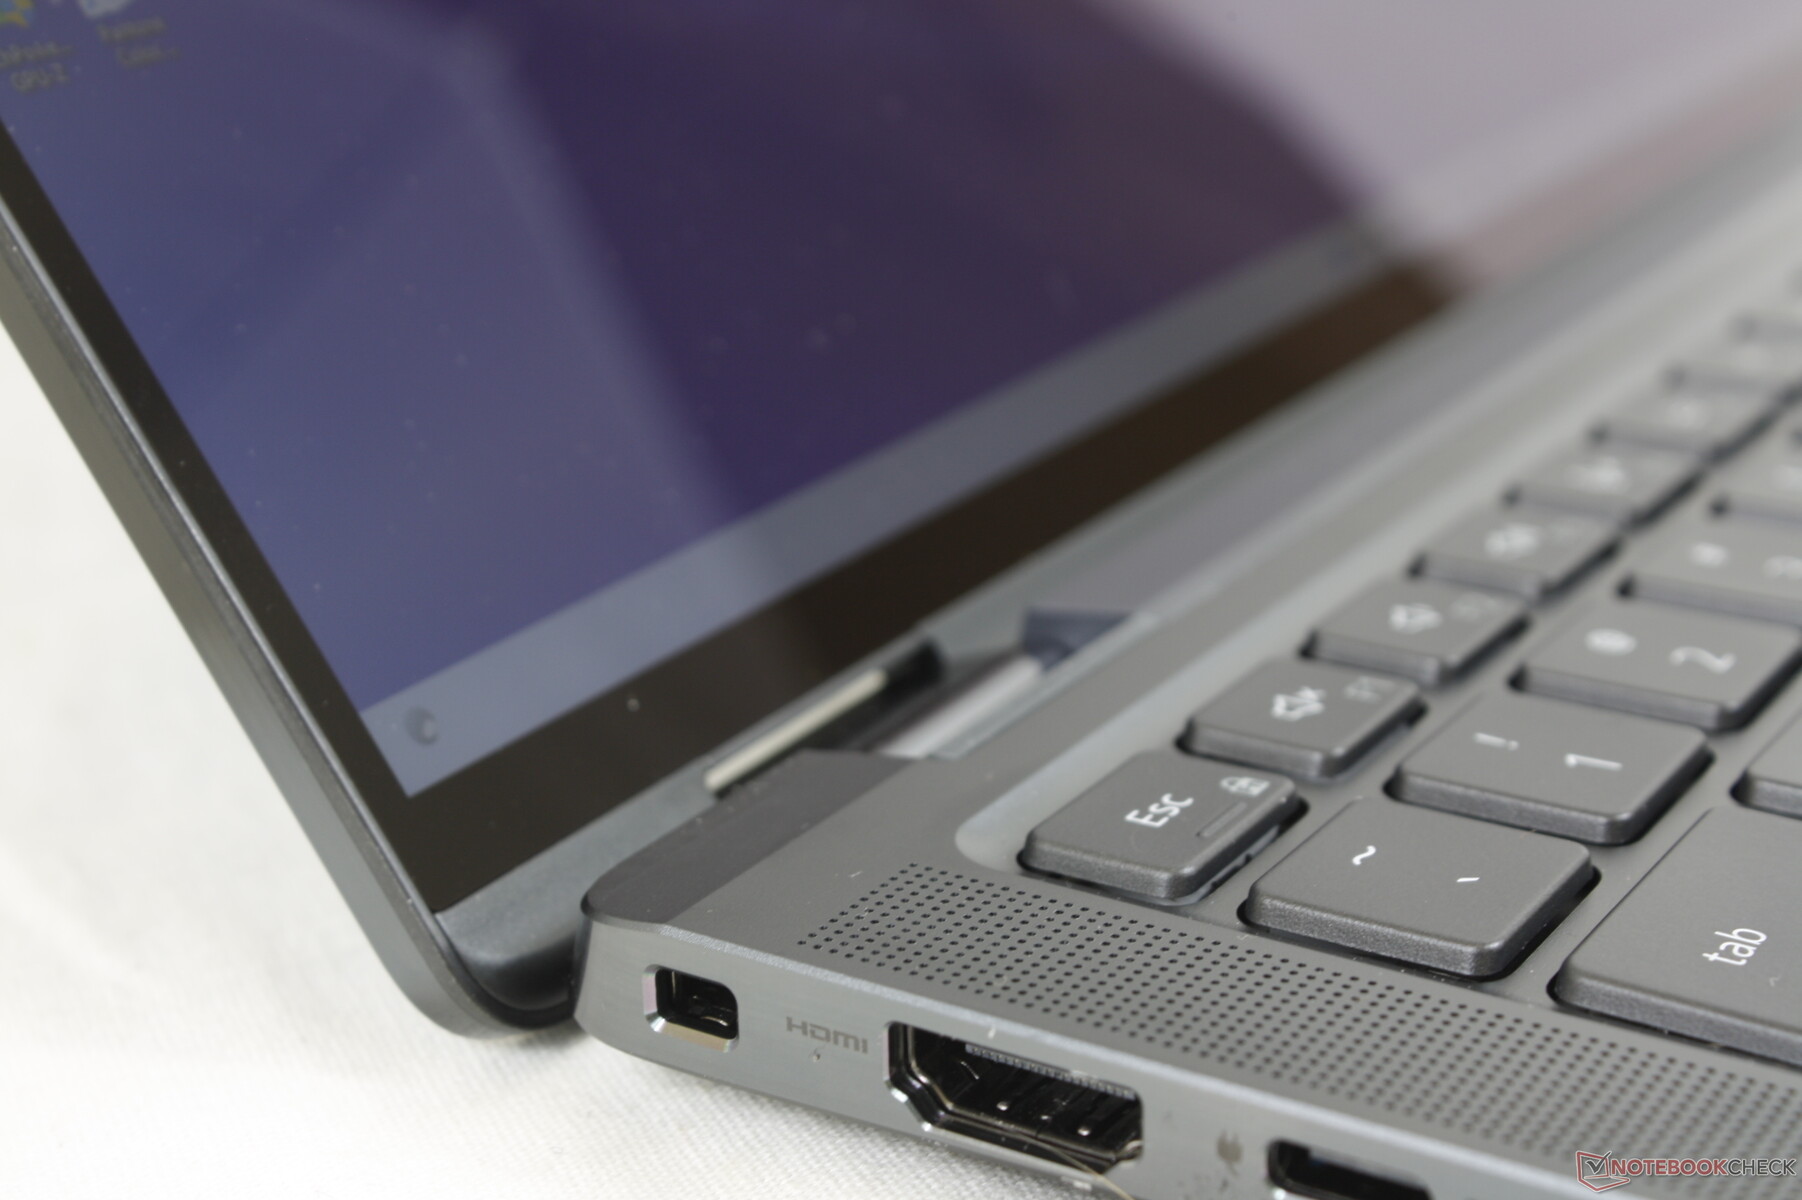
Les options de port n'ont pas changé depuis le Latitude 9420 2-en-1. Il aurait été formidable de voir des ports USB-A 3.2 Gen. 2 au lieu de Gen. 1, mais de toute façon, peu d'appareils profitent des vitesses de la Gen. 2.
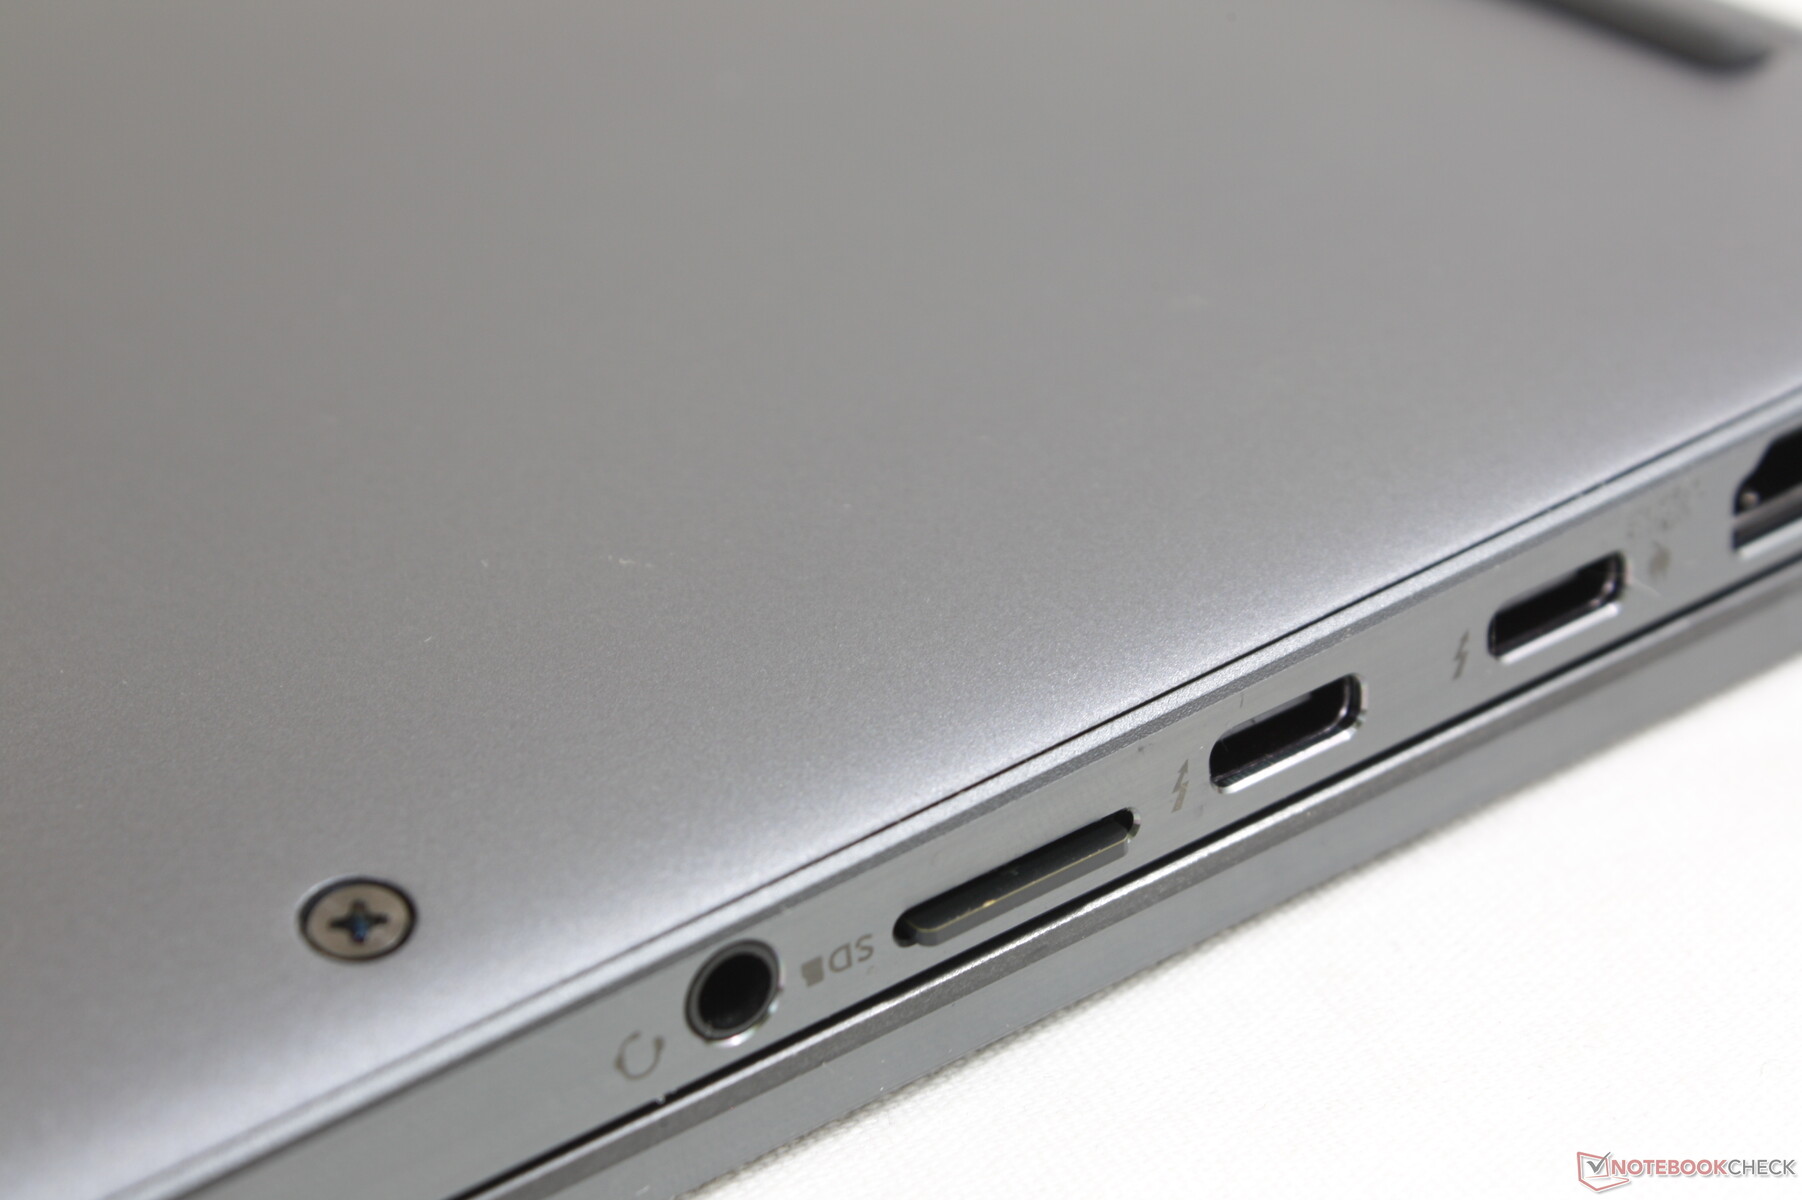
Lecteur de carte SD
Les taux de transfert à partir du lecteur de carte MicroSD sont parmi les plus rapides sur un subnotebook. En comparaison avec lAsus ZenBook Flip 14par exemple, les transferts de fichiers sont environ deux fois plus rapides sur le Dell lorsqu'il utilise une carte UHS-II.
| SD Card Reader | |
| average JPG Copy Test (av. of 3 runs) | |
| Dell Latitude 9430 2-in-1 (AV Pro UHS-II V60) | |
| Dell Latitude 9420 2-in-1 (AV PRO microSD 128 GB V60) | |
| Asus ZenBook Flip 14 UN5401QA-KN085W (AV Pro SD microSD 128 GB V60) | |
| LG Gram 14T90P (AV Pro V60) | |
| MSI Summit E14 Flip Evo A12MT (AV Pro V60) | |
| maximum AS SSD Seq Read Test (1GB) | |
| Dell Latitude 9420 2-in-1 (AV PRO microSD 128 GB V60) | |
| Dell Latitude 9430 2-in-1 (AV Pro UHS-II V60) | |
| Asus ZenBook Flip 14 UN5401QA-KN085W (AV Pro SD microSD 128 GB V60) | |
| LG Gram 14T90P (AV Pro V60) | |
| MSI Summit E14 Flip Evo A12MT (AV Pro V60) | |
Communication
la 5G est désormais une option pour la série. Cependant, la fonctionnalité doit être configurée avant l'achat, car les antennes ne sont par ailleurs pas incluses pour décourager les utilisateurs d'installer leurs propres modules 4G ou 5G.
| Networking | |
| iperf3 transmit AX12 | |
| Asus ZenBook Flip 14 UN5401QA-KN085W | |
| Dell Latitude 9420 2-in-1 | |
| iperf3 receive AX12 | |
| Asus ZenBook Flip 14 UN5401QA-KN085W | |
| Dell Latitude 9420 2-in-1 | |
| iperf3 receive AXE11000 6GHz | |
| Lenovo ThinkPad X1 Yoga G7 21CE002HGE | |
| Dell Latitude 9430 2-in-1 | |
| MSI Summit E14 Flip Evo A12MT | |
| iperf3 transmit AXE11000 6GHz | |
| Lenovo ThinkPad X1 Yoga G7 21CE002HGE | |
| MSI Summit E14 Flip Evo A12MT | |
| Dell Latitude 9430 2-in-1 | |
Webcam
Dell a augmenté la résolution de la webcam de 720p à 1080p pour obtenir des images plus nettes. HP a une longueur d'avance à cet égard, car un certain nombre d'ordinateurs de la gamme Spectre et EliteBook ont déjà commencé à être livrés avec des webcams de 5 MP.


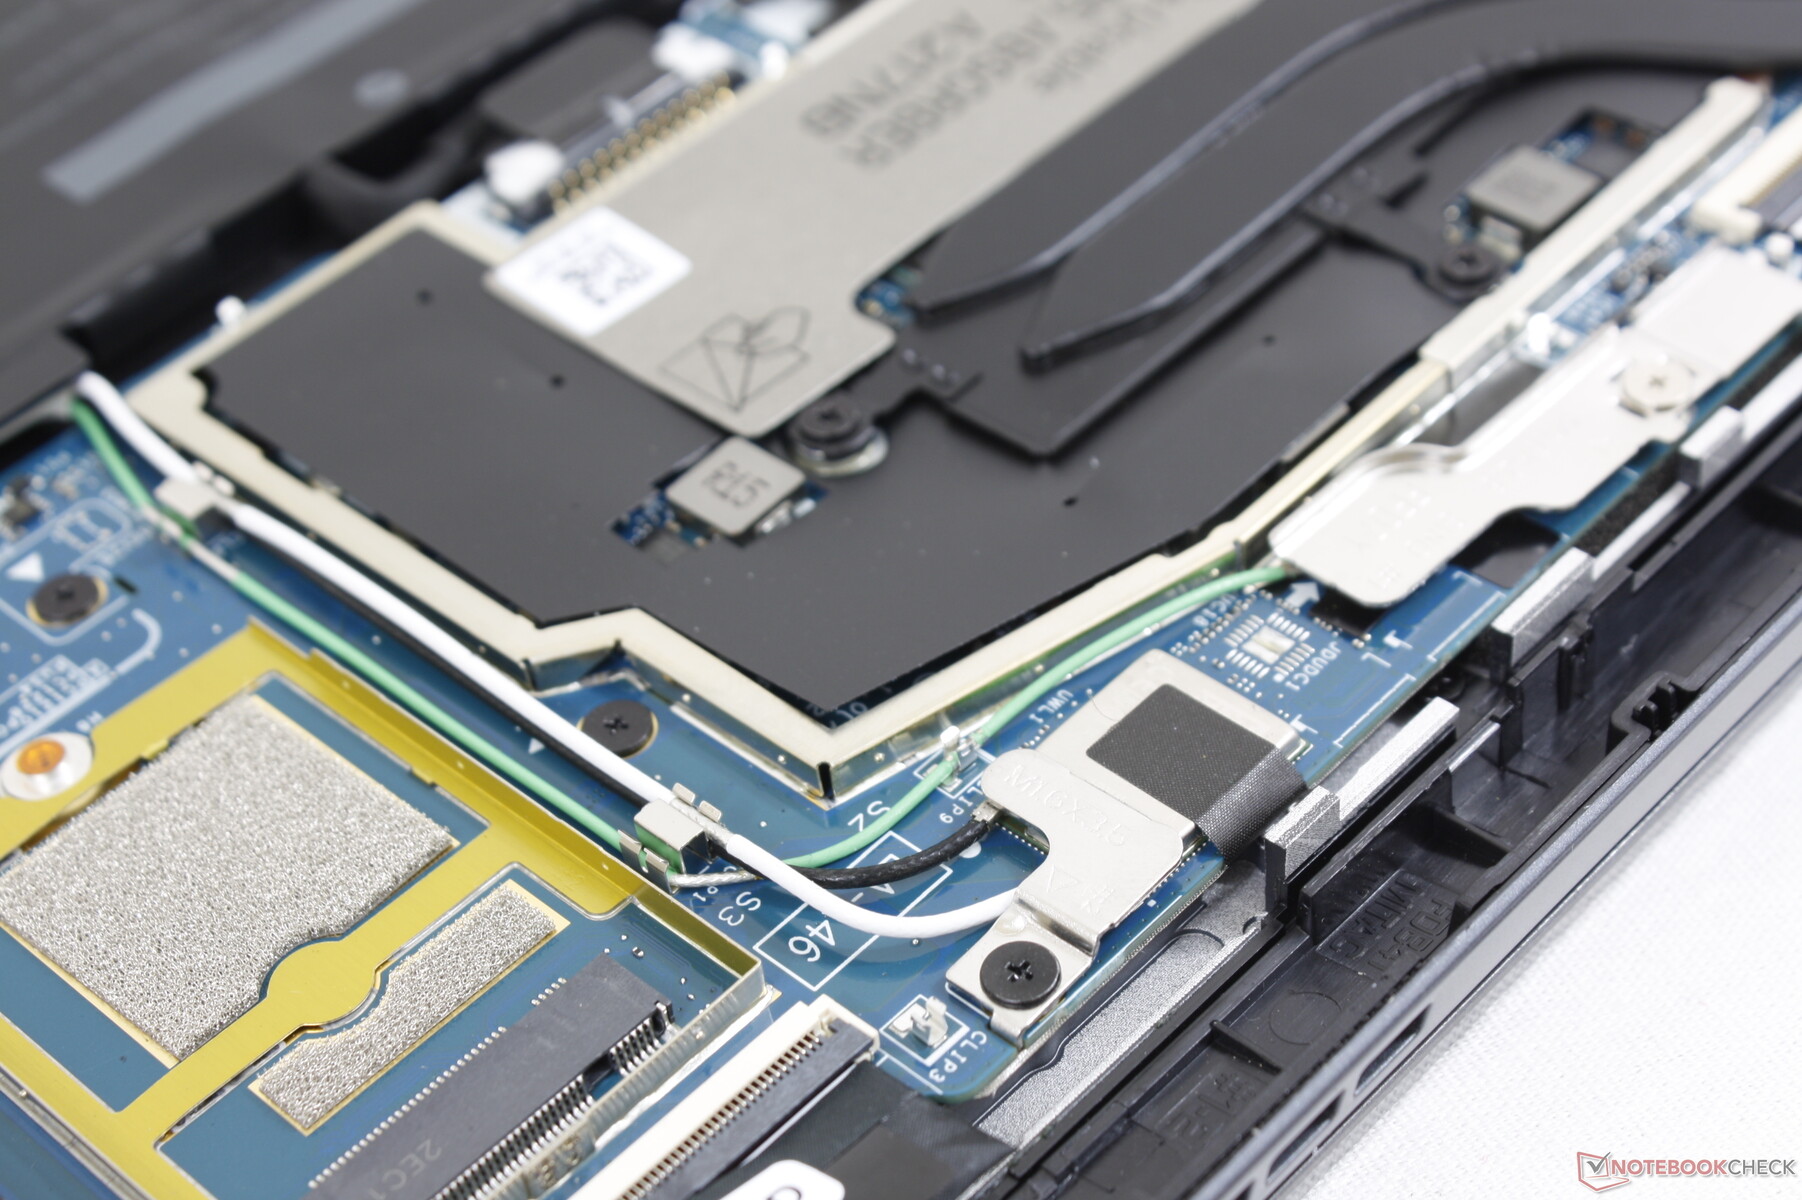
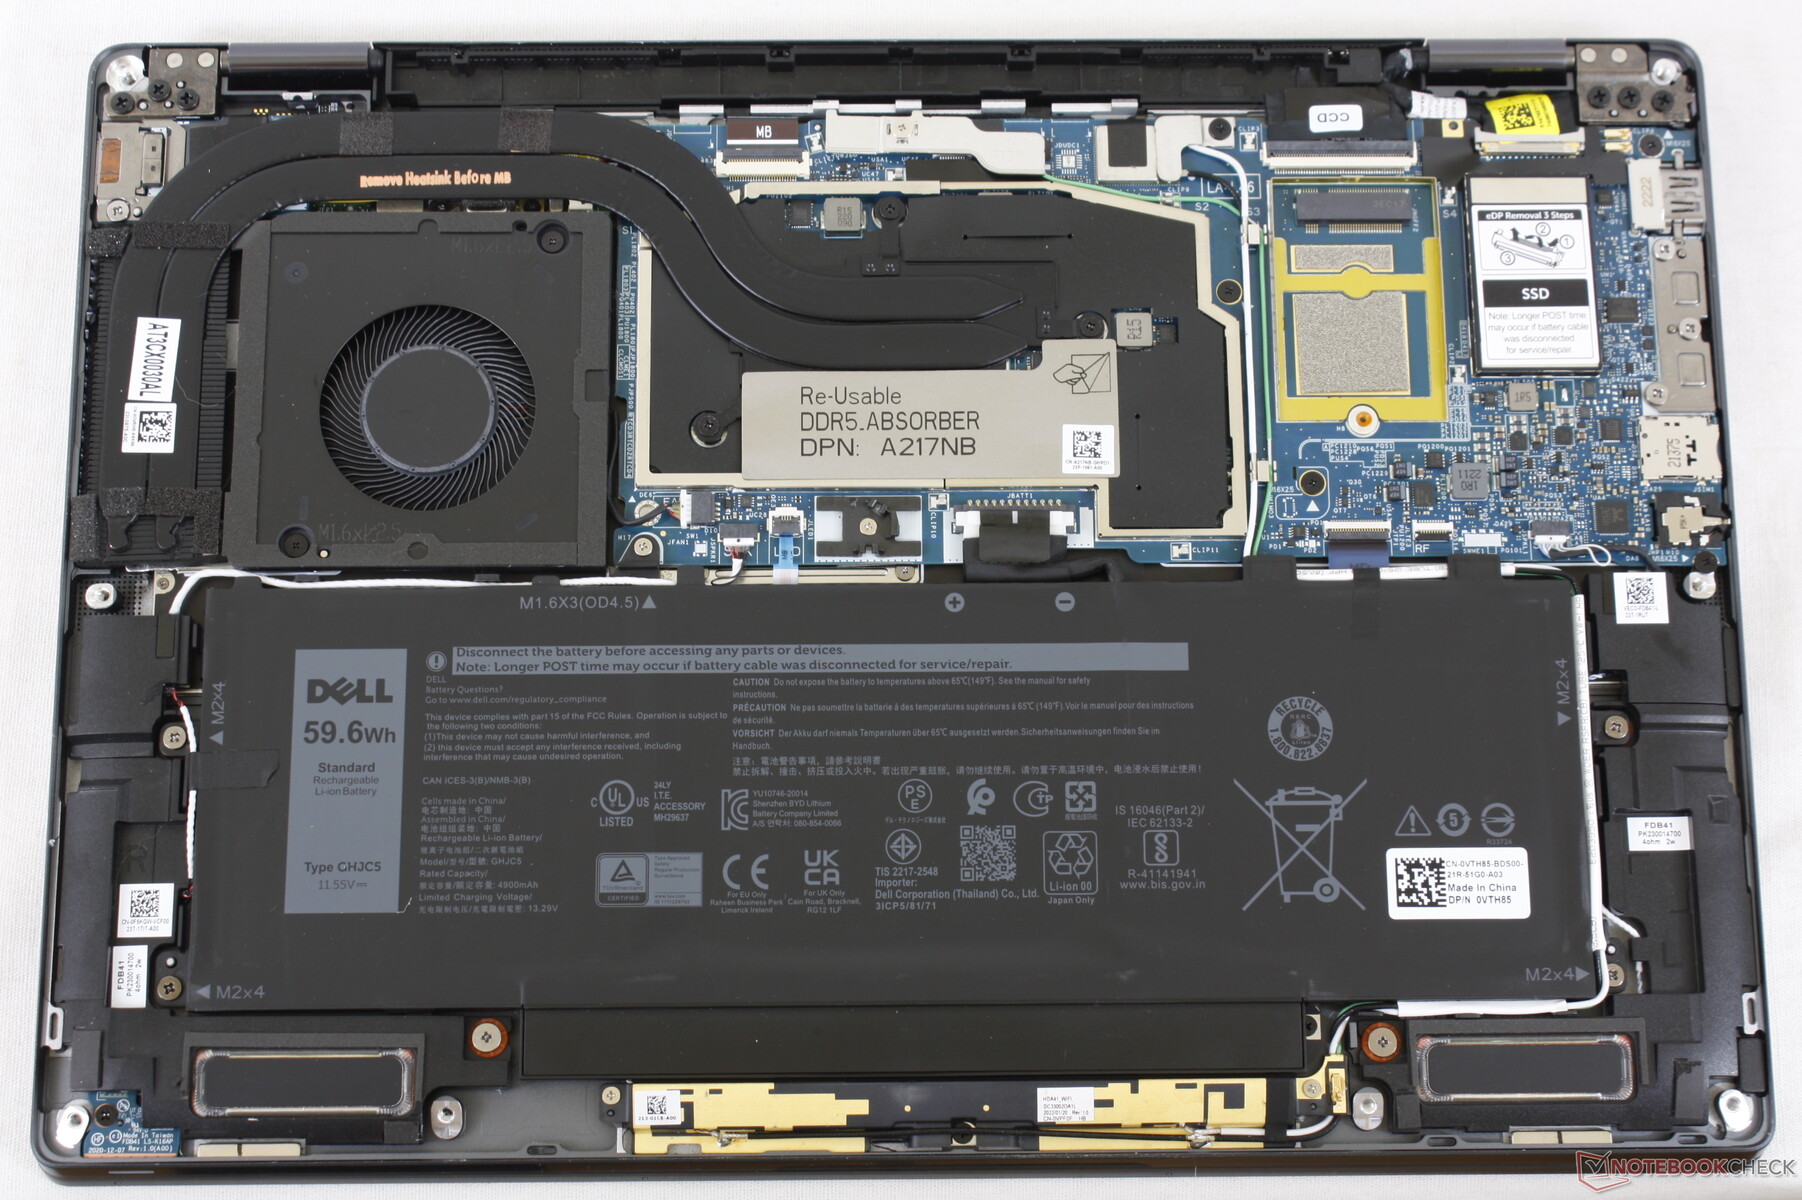
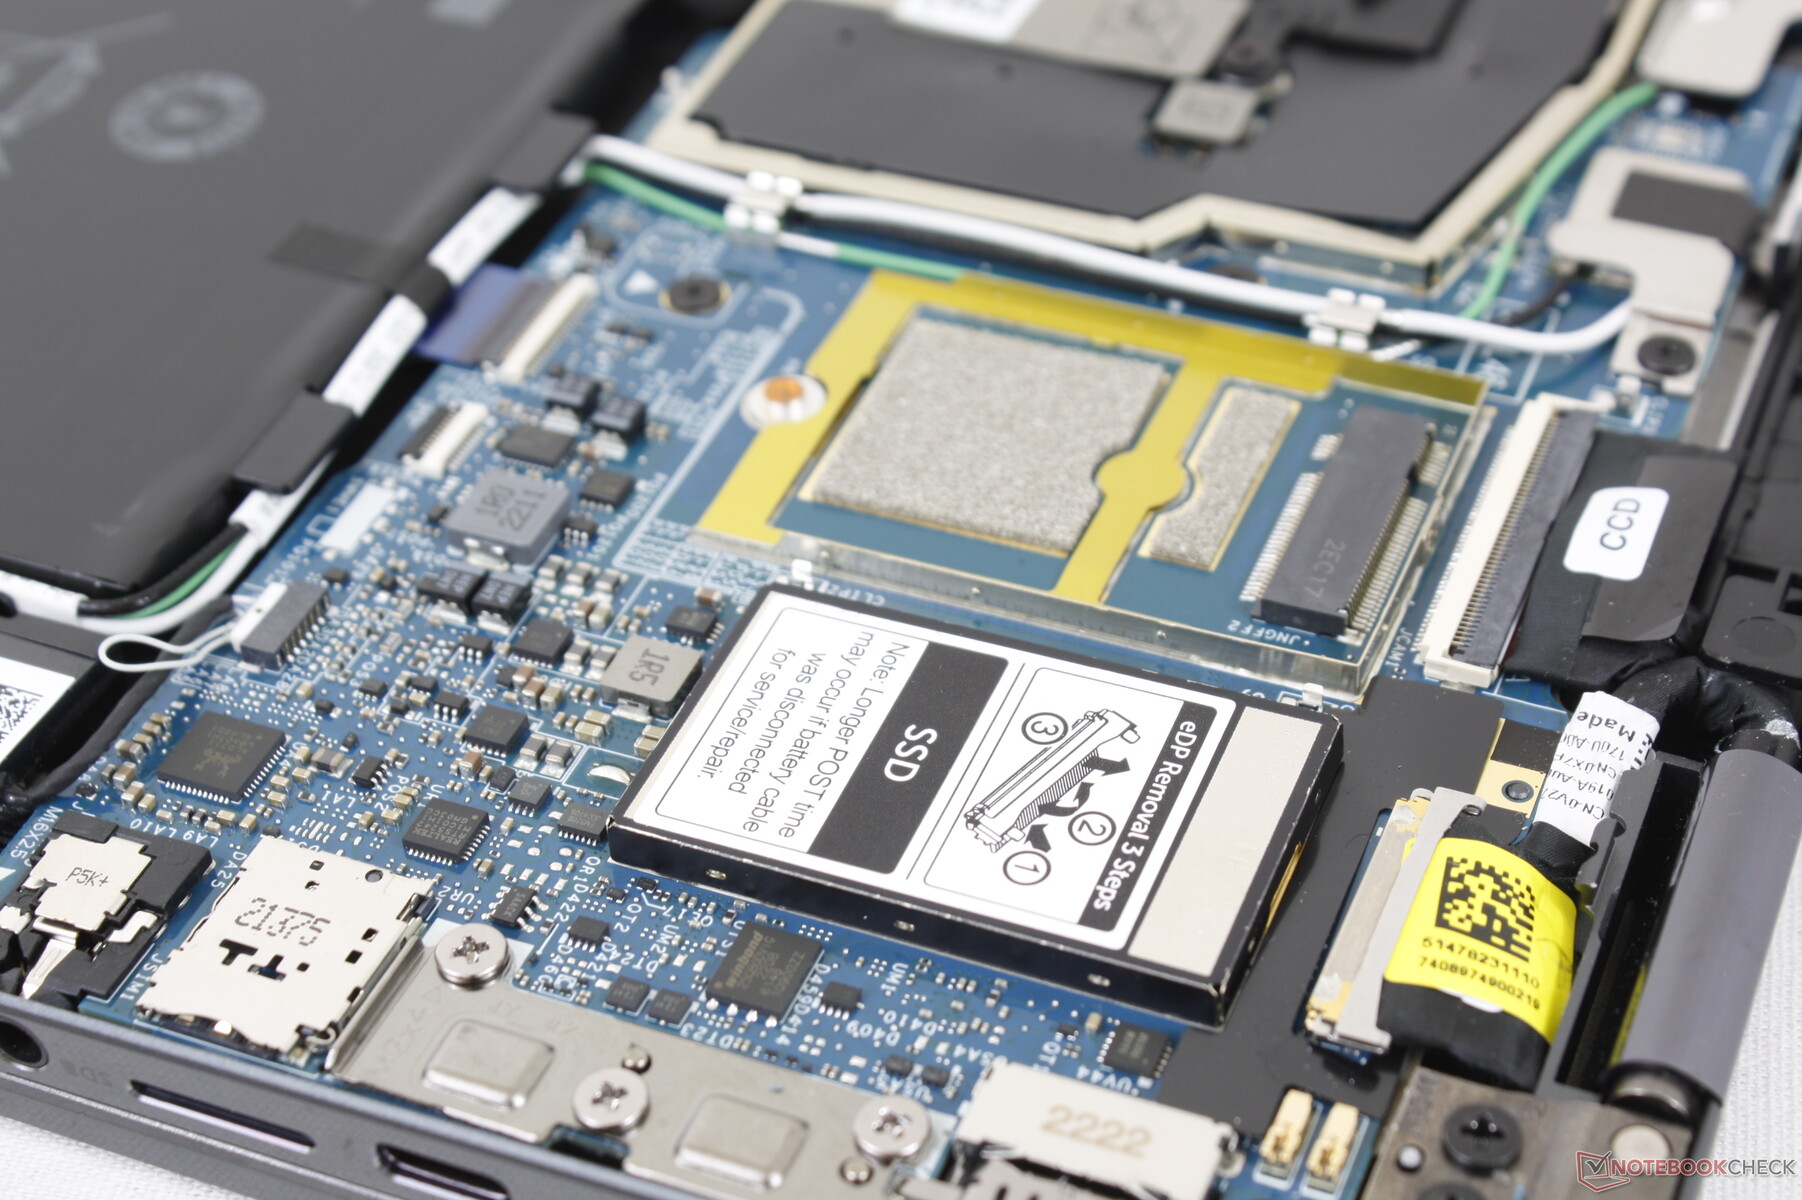
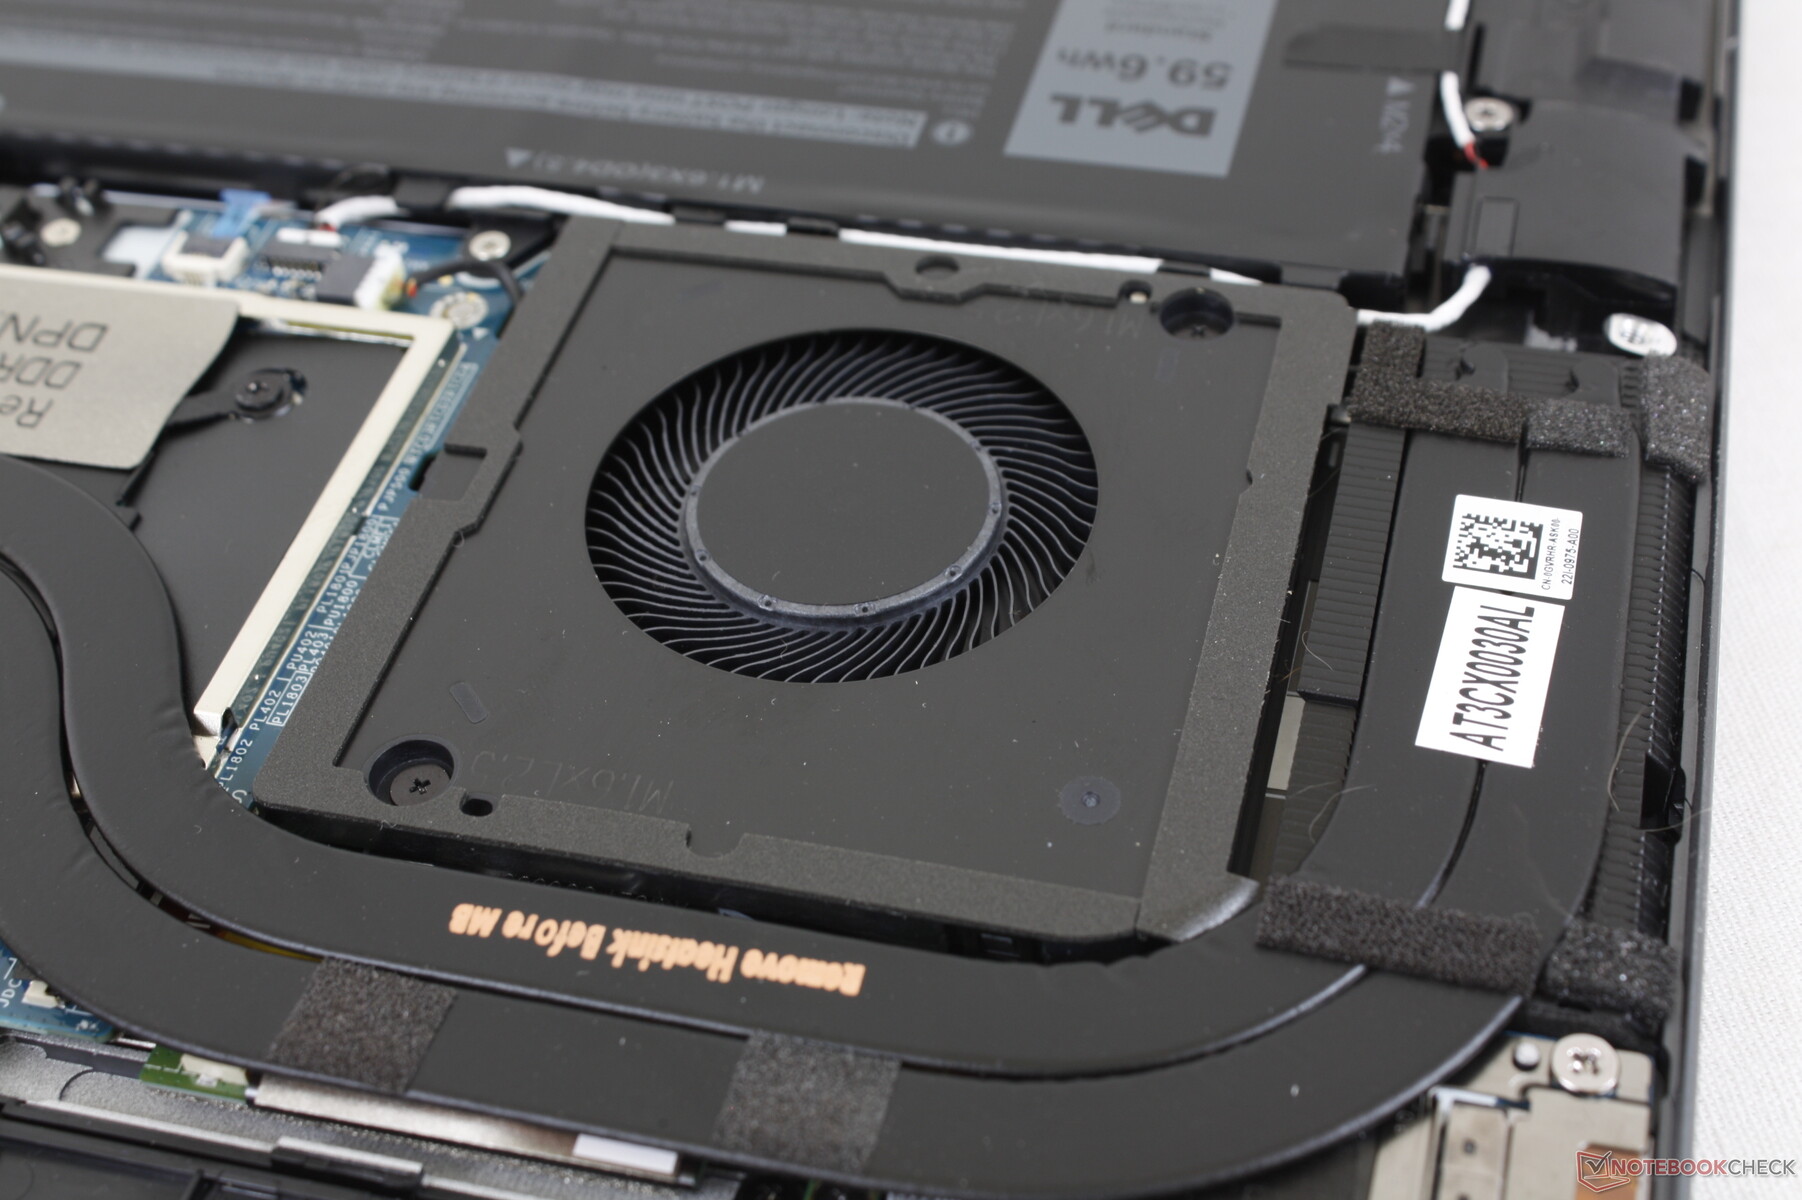
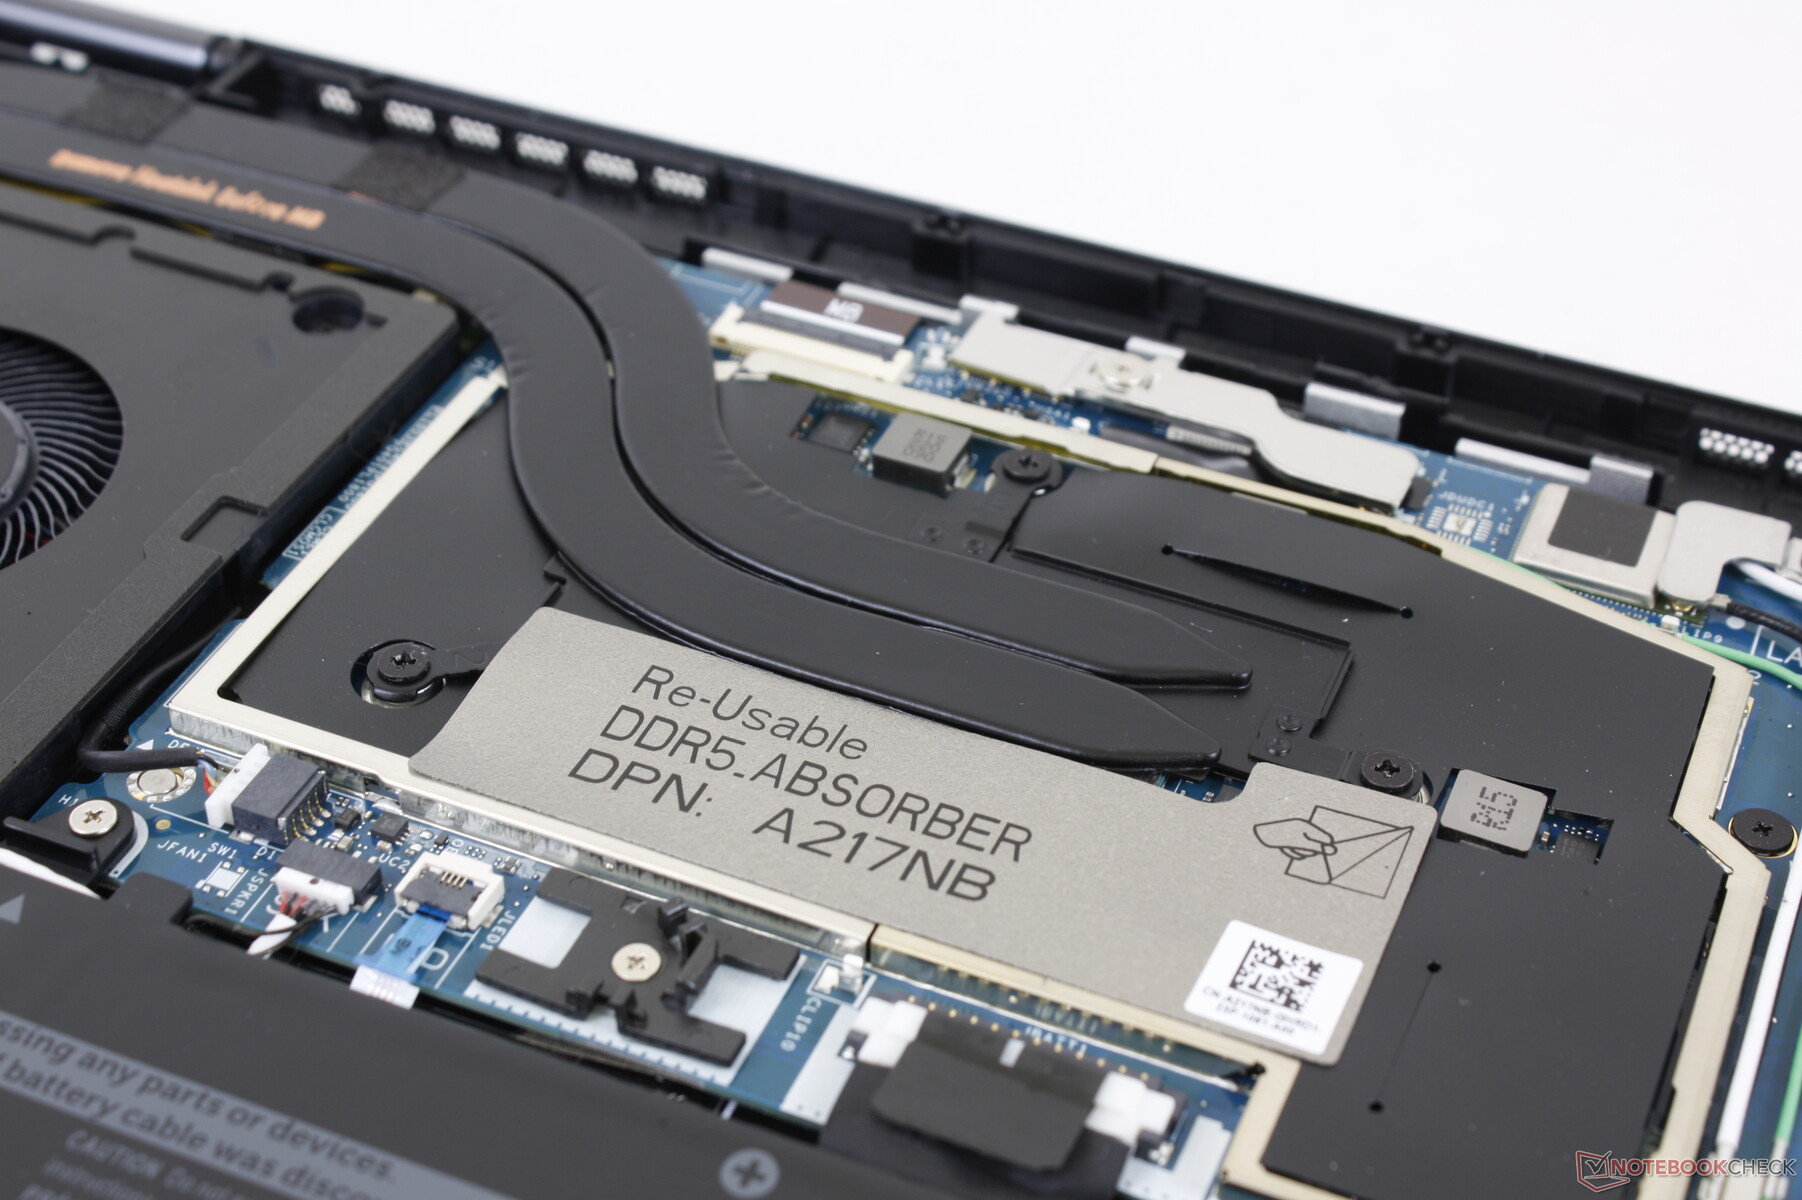
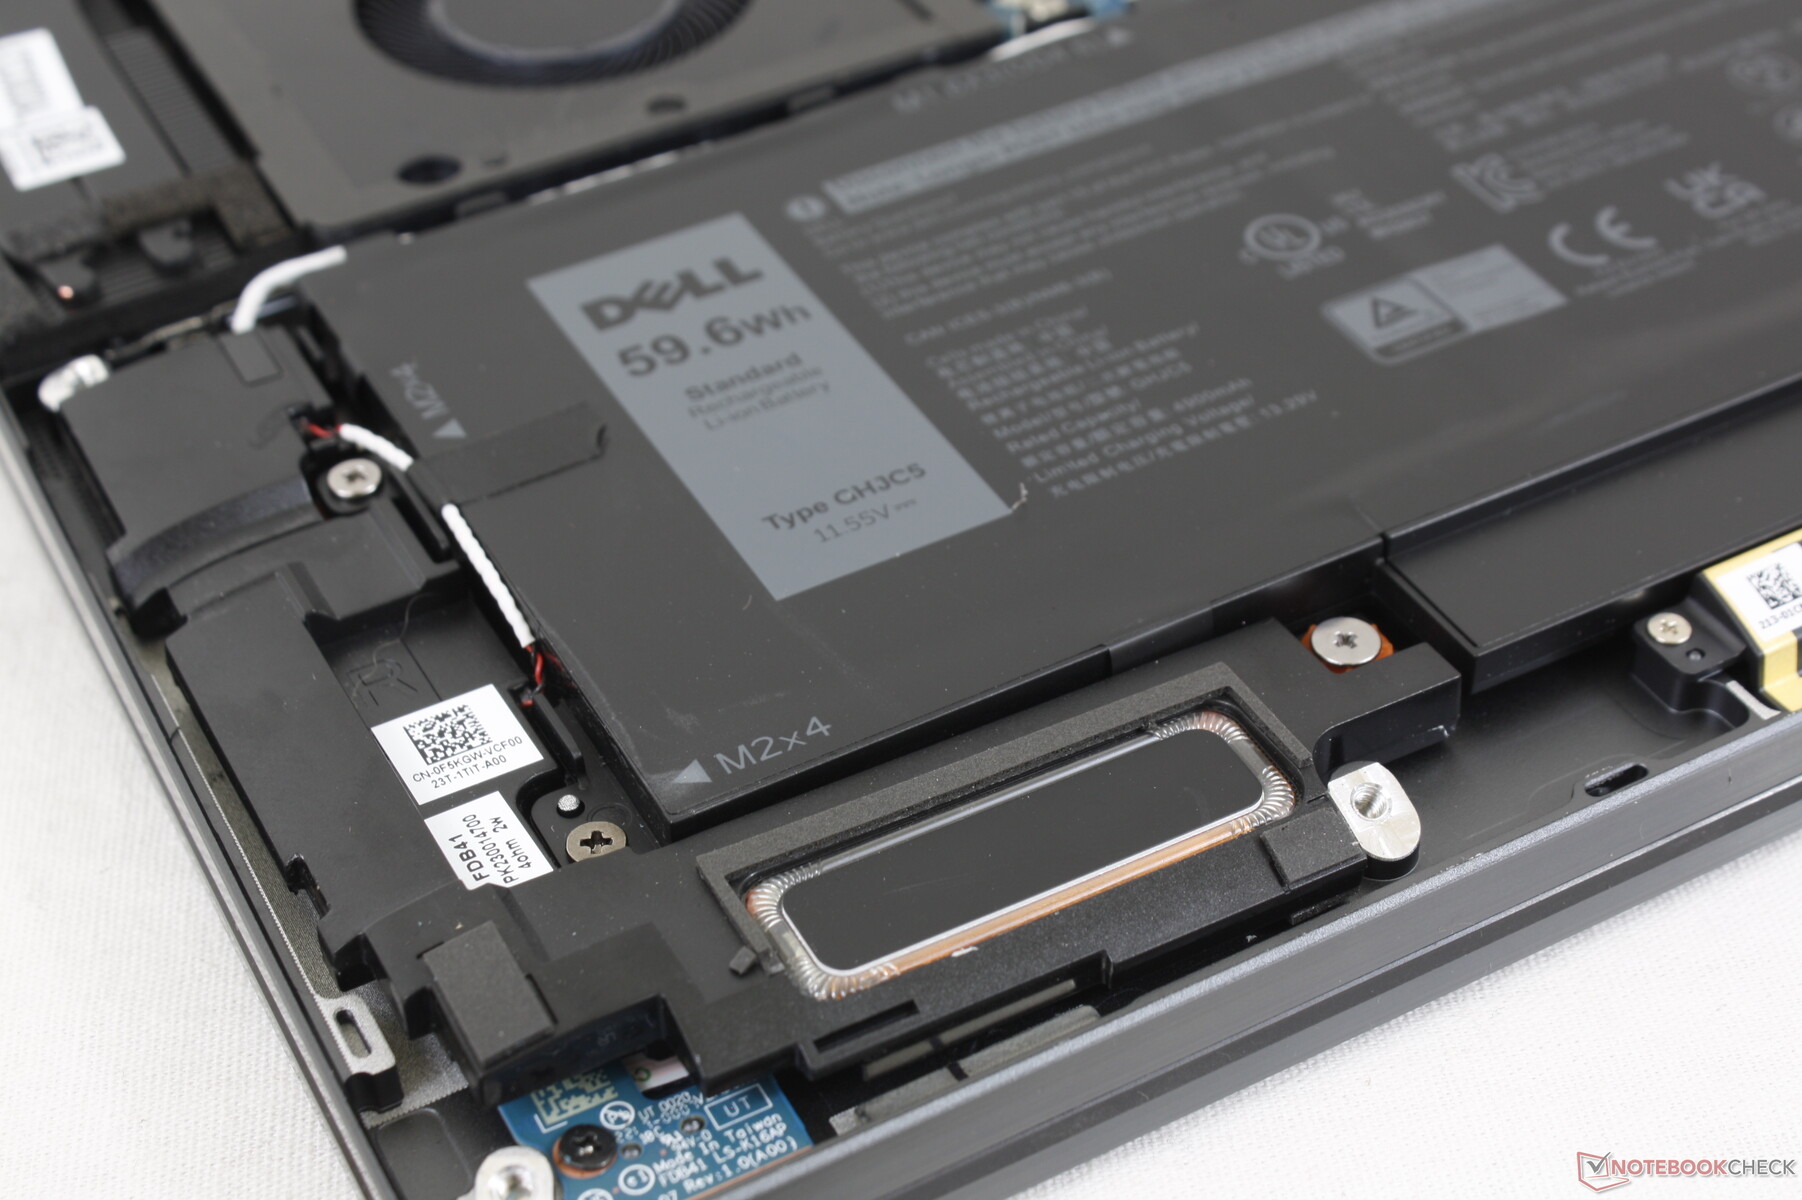
Maintenance
Le panneau inférieur reste très facile à retirer. Il n'y a pas grand-chose à réparer en dehors du SSD et de la batterie, cependant, car les modules WLAN et RAM sont soudés.
Accessoires et garantie
La boîte ne contient pas d'autres éléments que l'adaptateur secteur et les documents. Le stylo actif PN7522W doit être acheté séparément pour 80 à 110 dollars US.
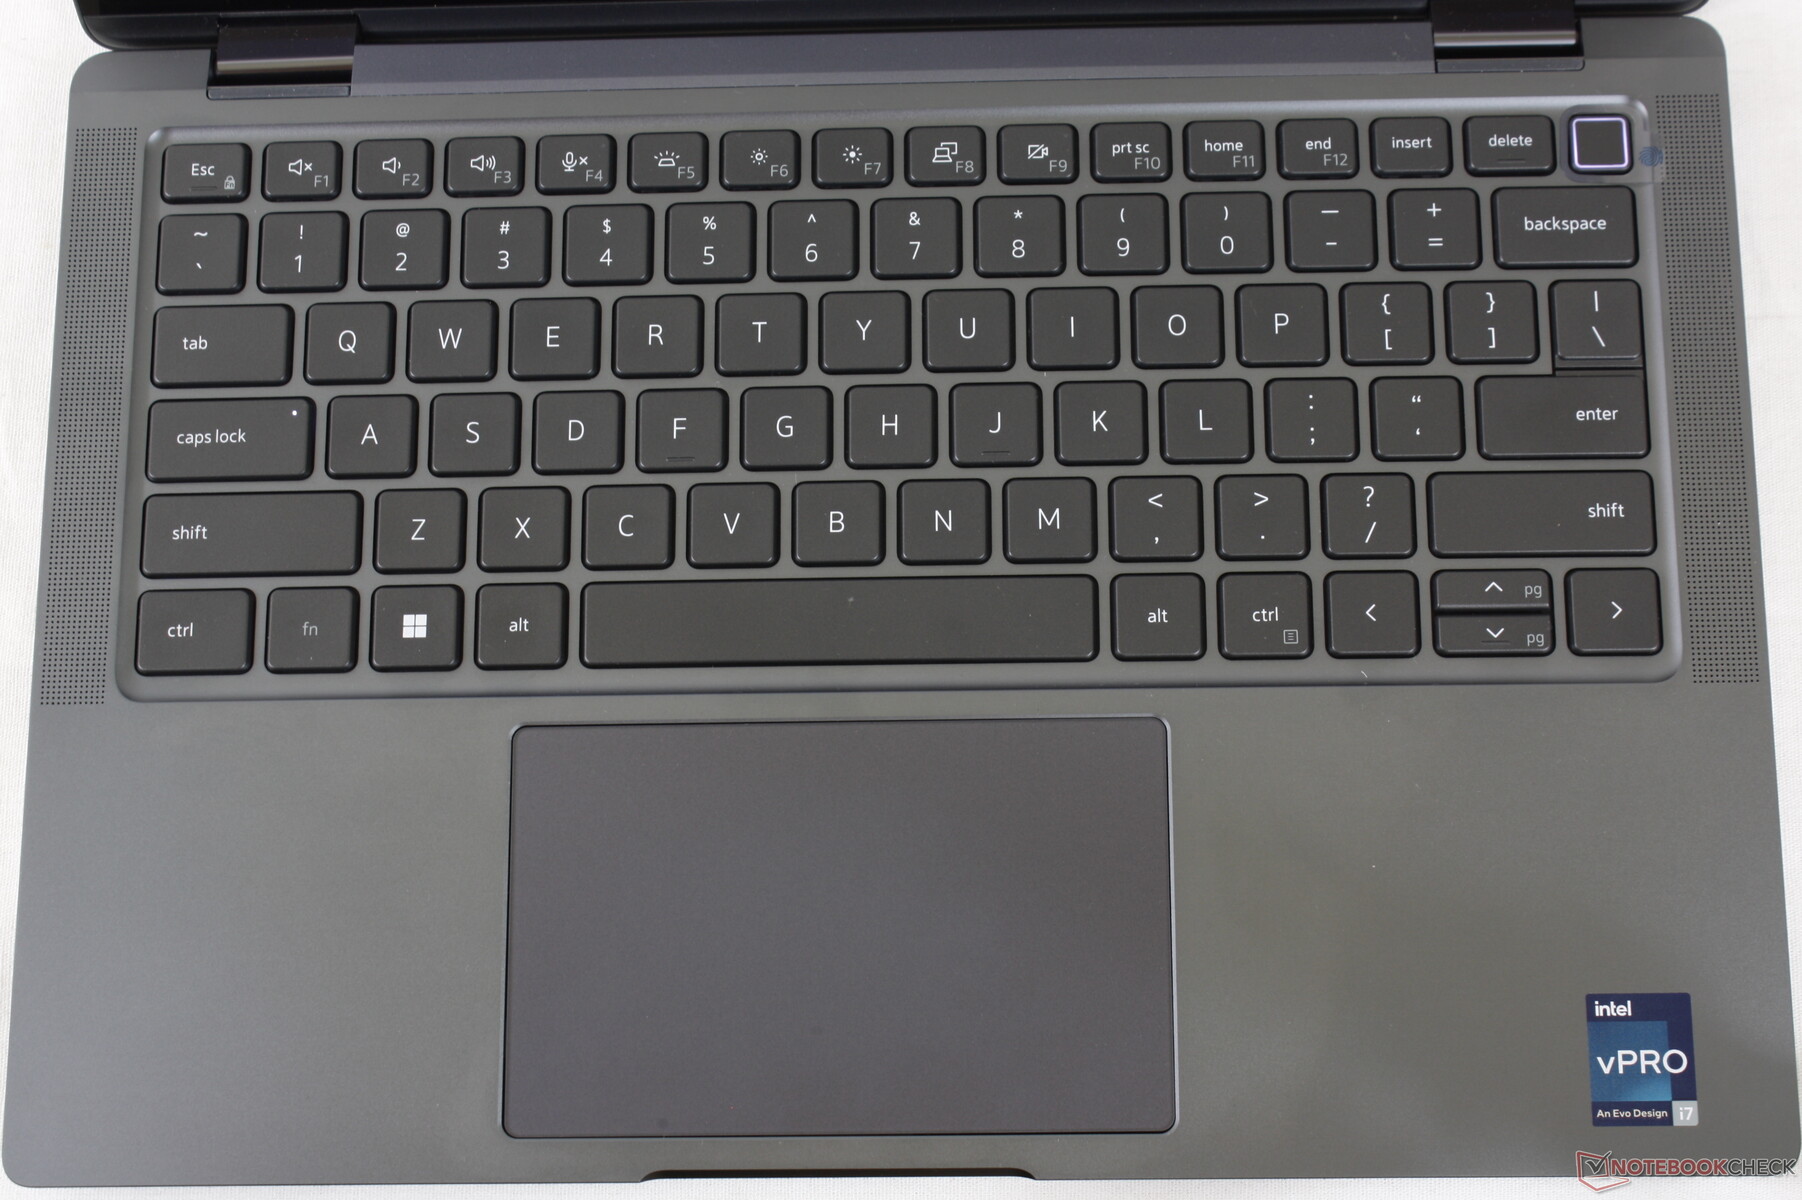
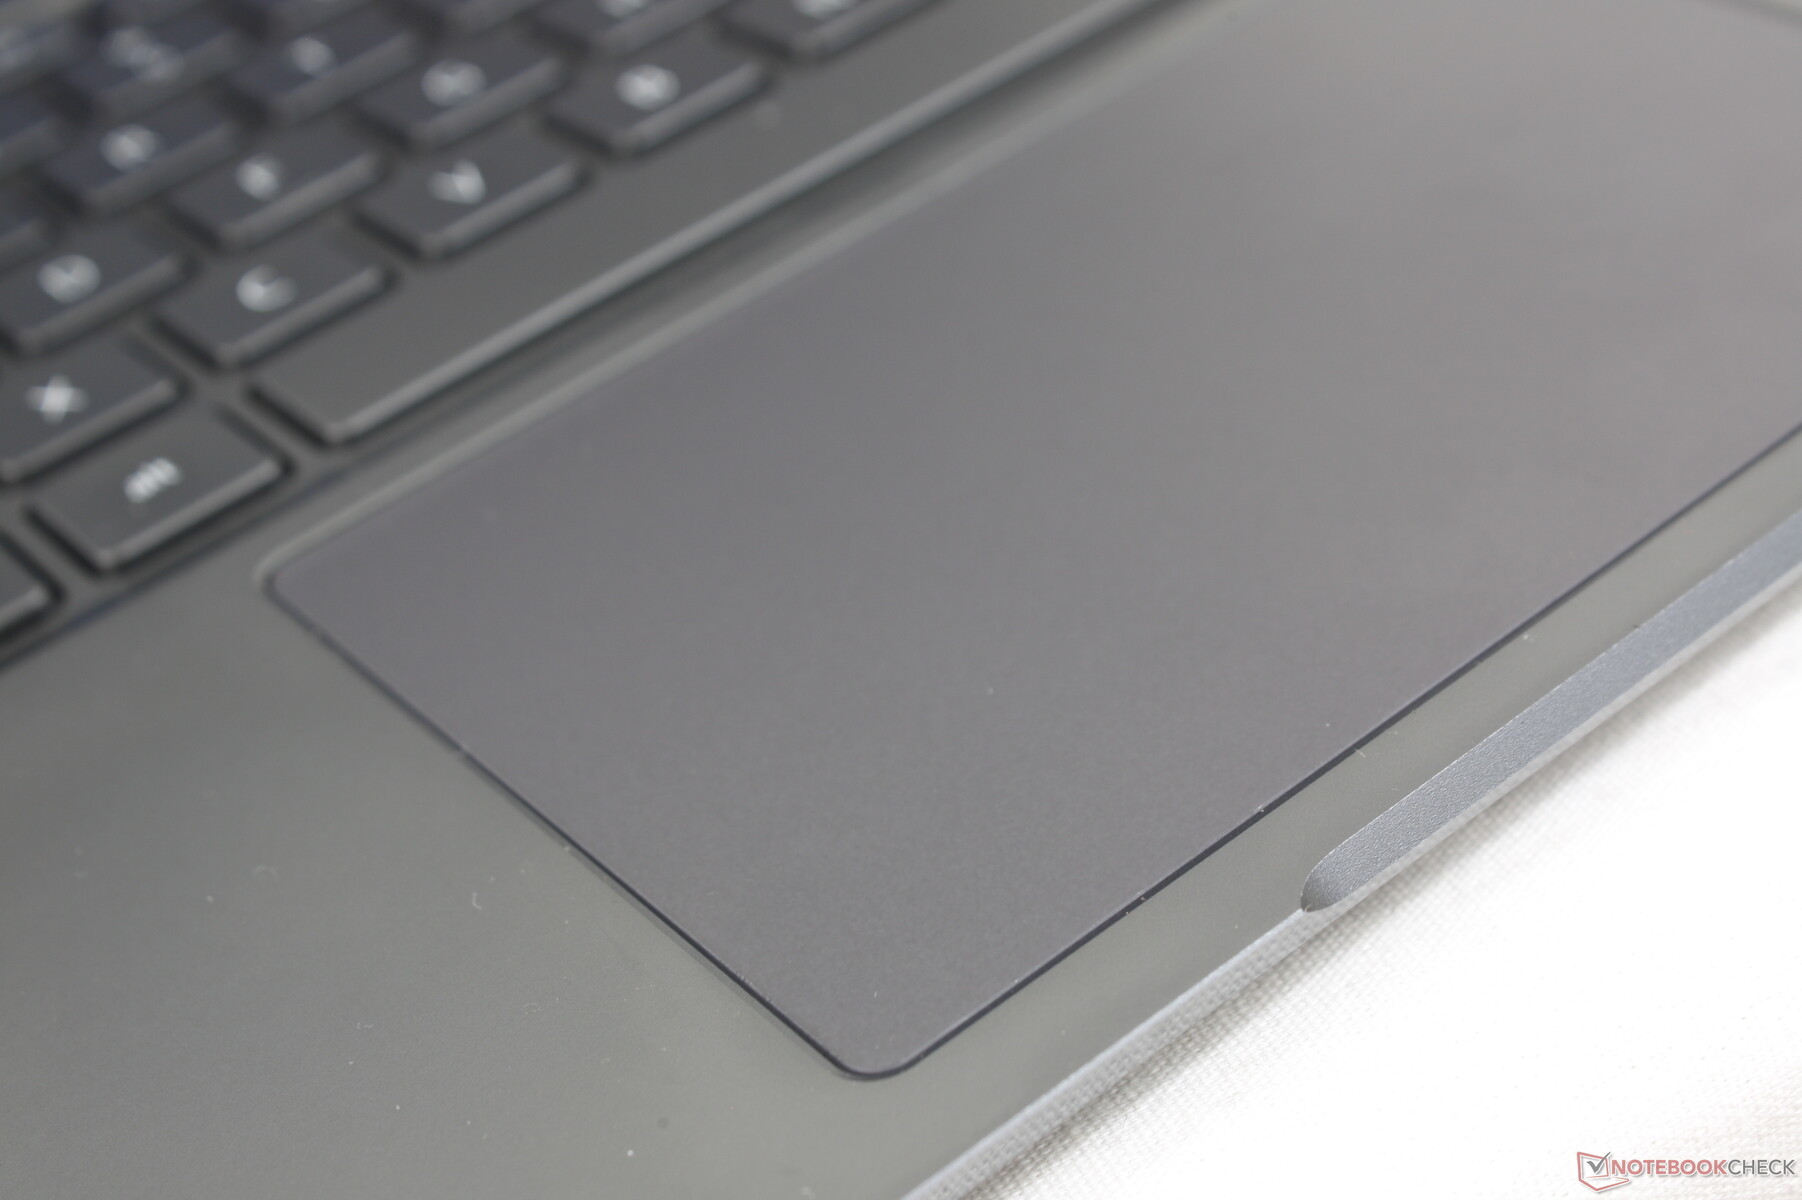
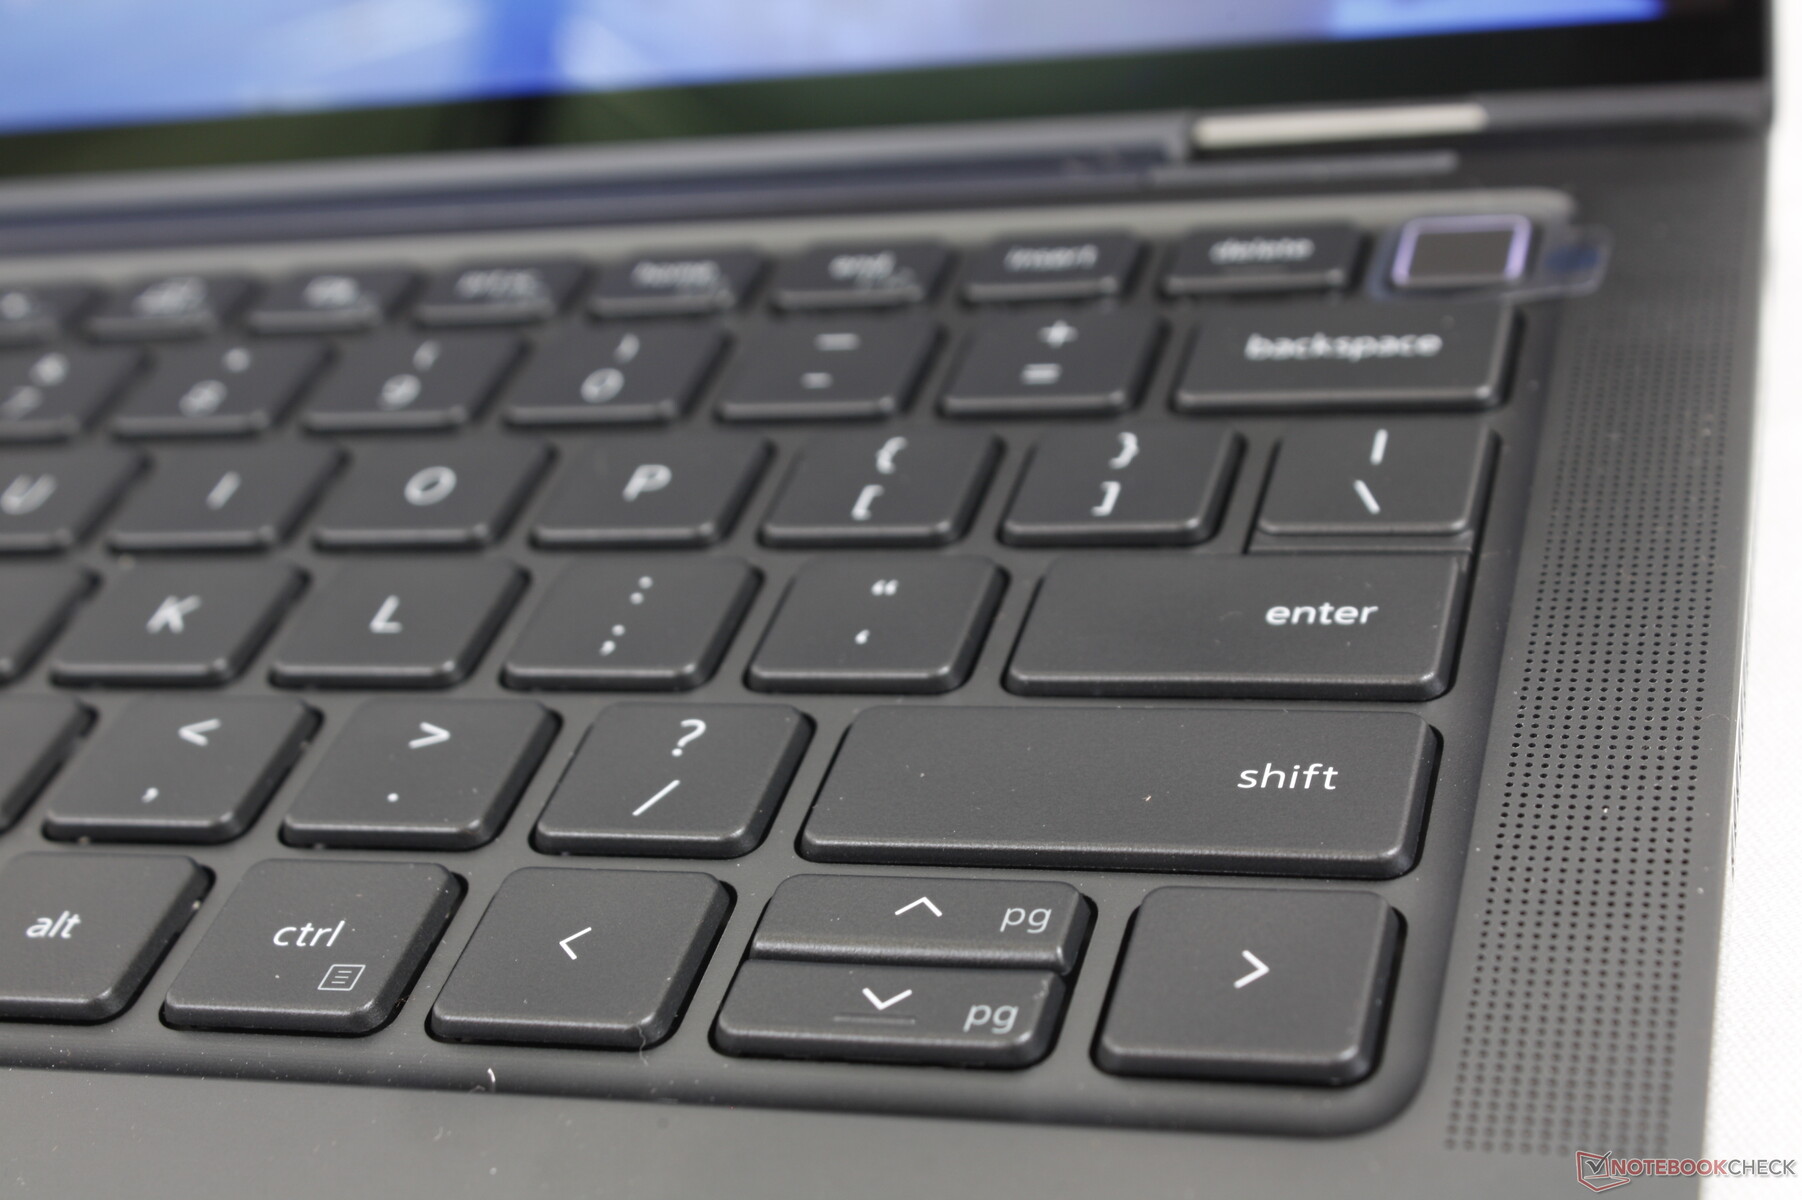
Périphériques d'entrée
Clavier et pavé tactile
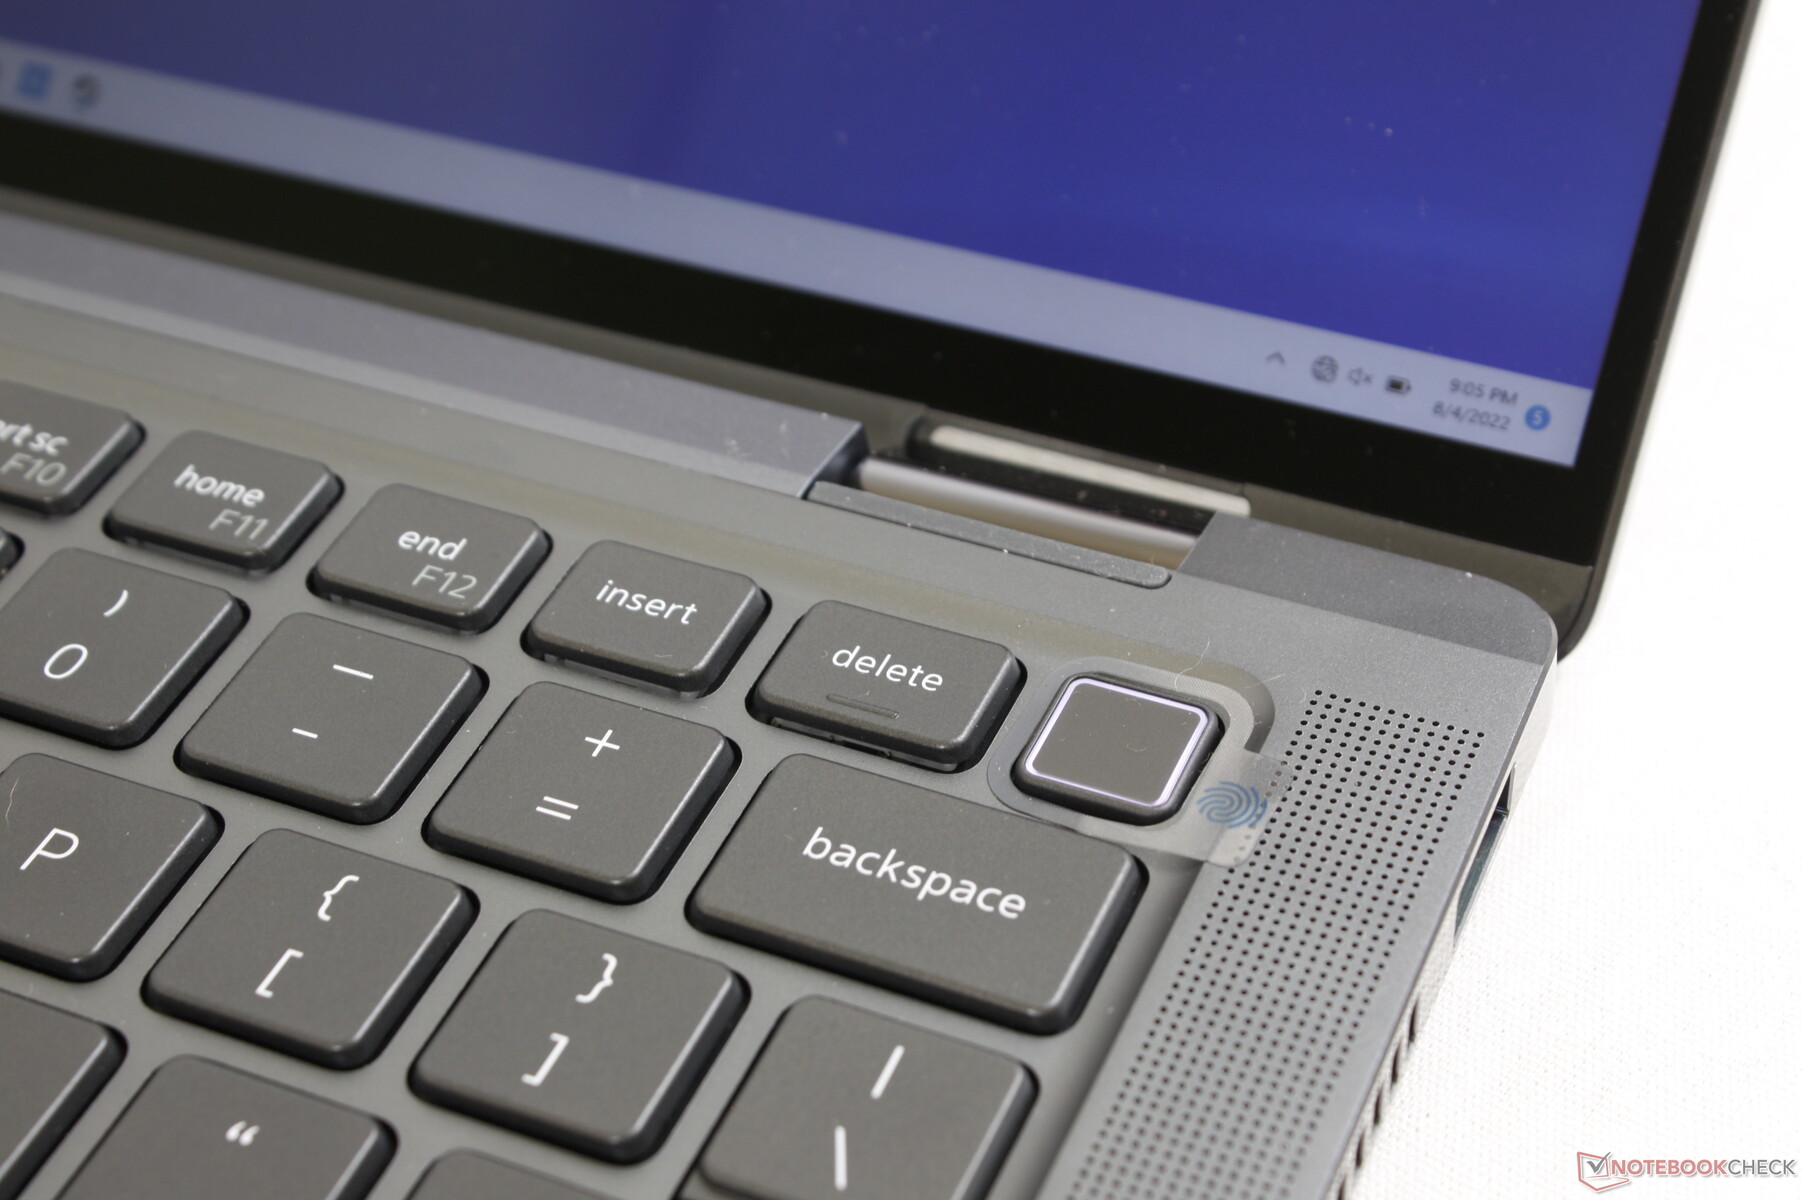
Comparé aux claviers des HP EliteBook ou Spectre, le clavier de notre Latitude est légèrement plus silencieux mais plus souple. Il n'est pas moins confortable, car c'est surtout une question de préférence de l'utilisateur. Cependant, un point supplémentaire va aux modèles HP car ils intègrent une touche dédiée pour lancer des applications spécifiques à HP comme Command Center ou myHP. Une telle touche sur le Dell Latitude pour lancer Optimizer ou Power Manager aurait été très utile.

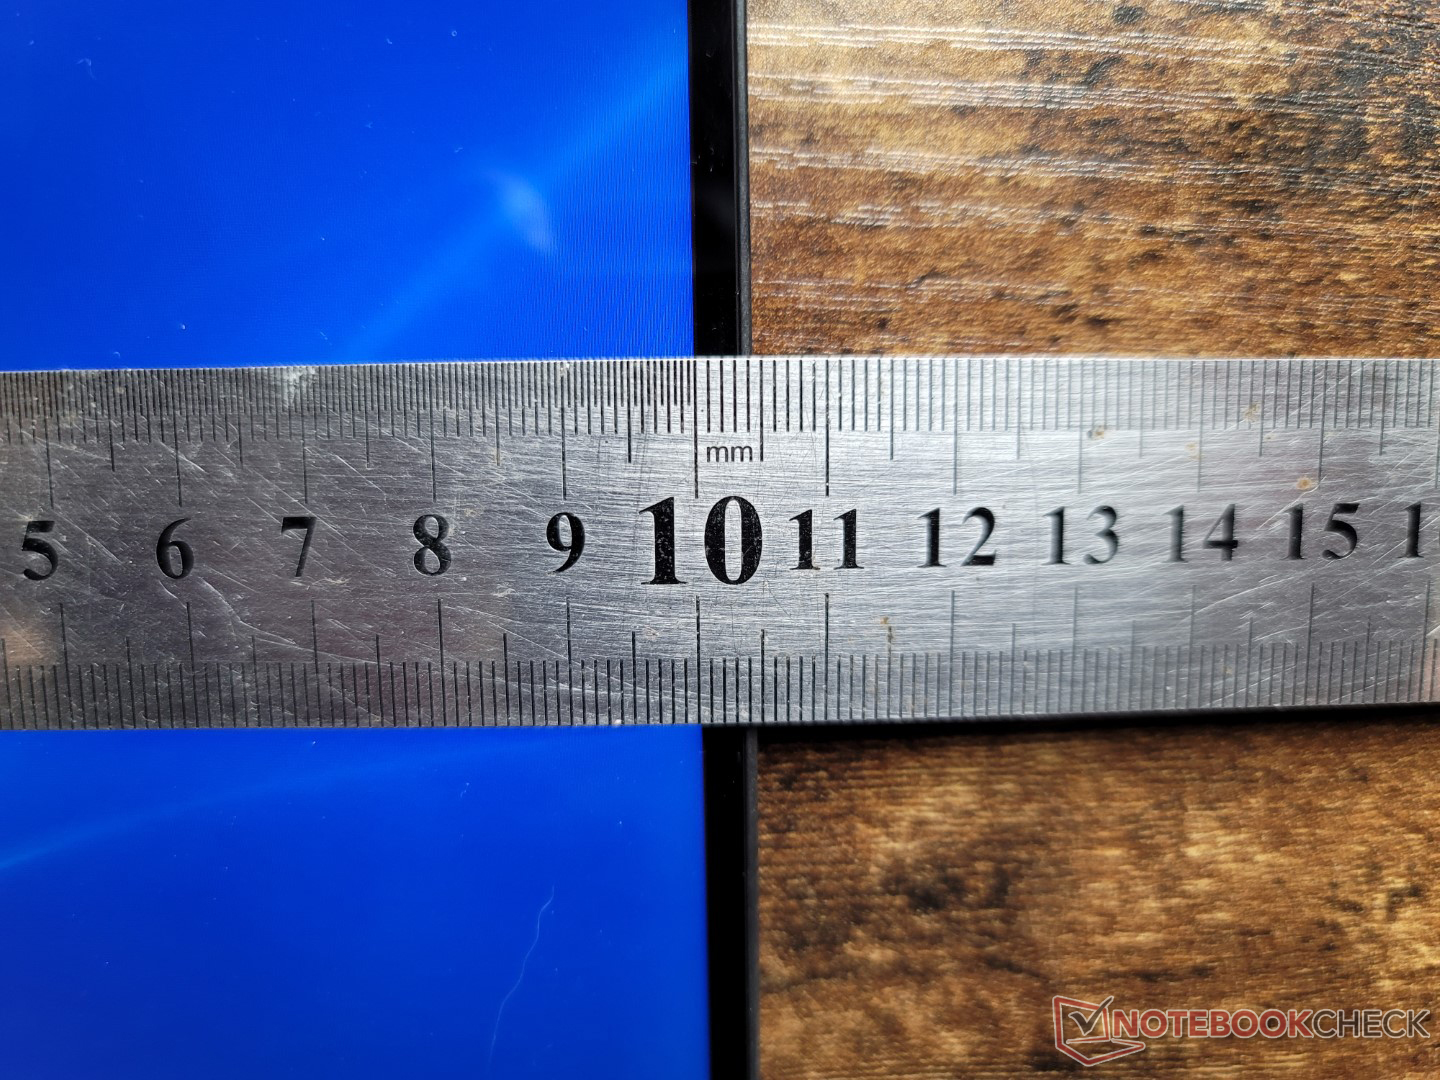
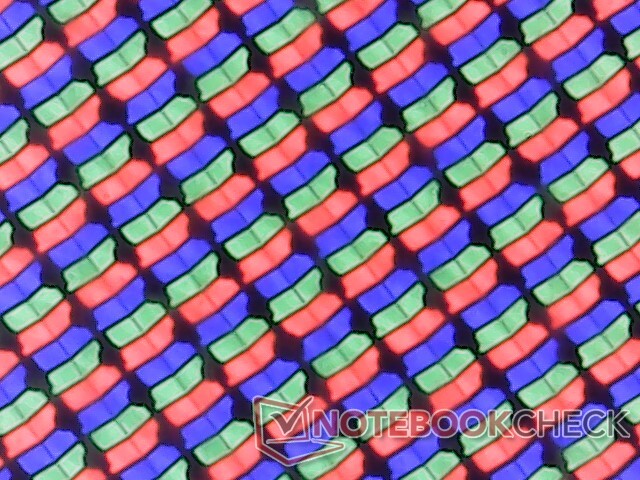
Afficher
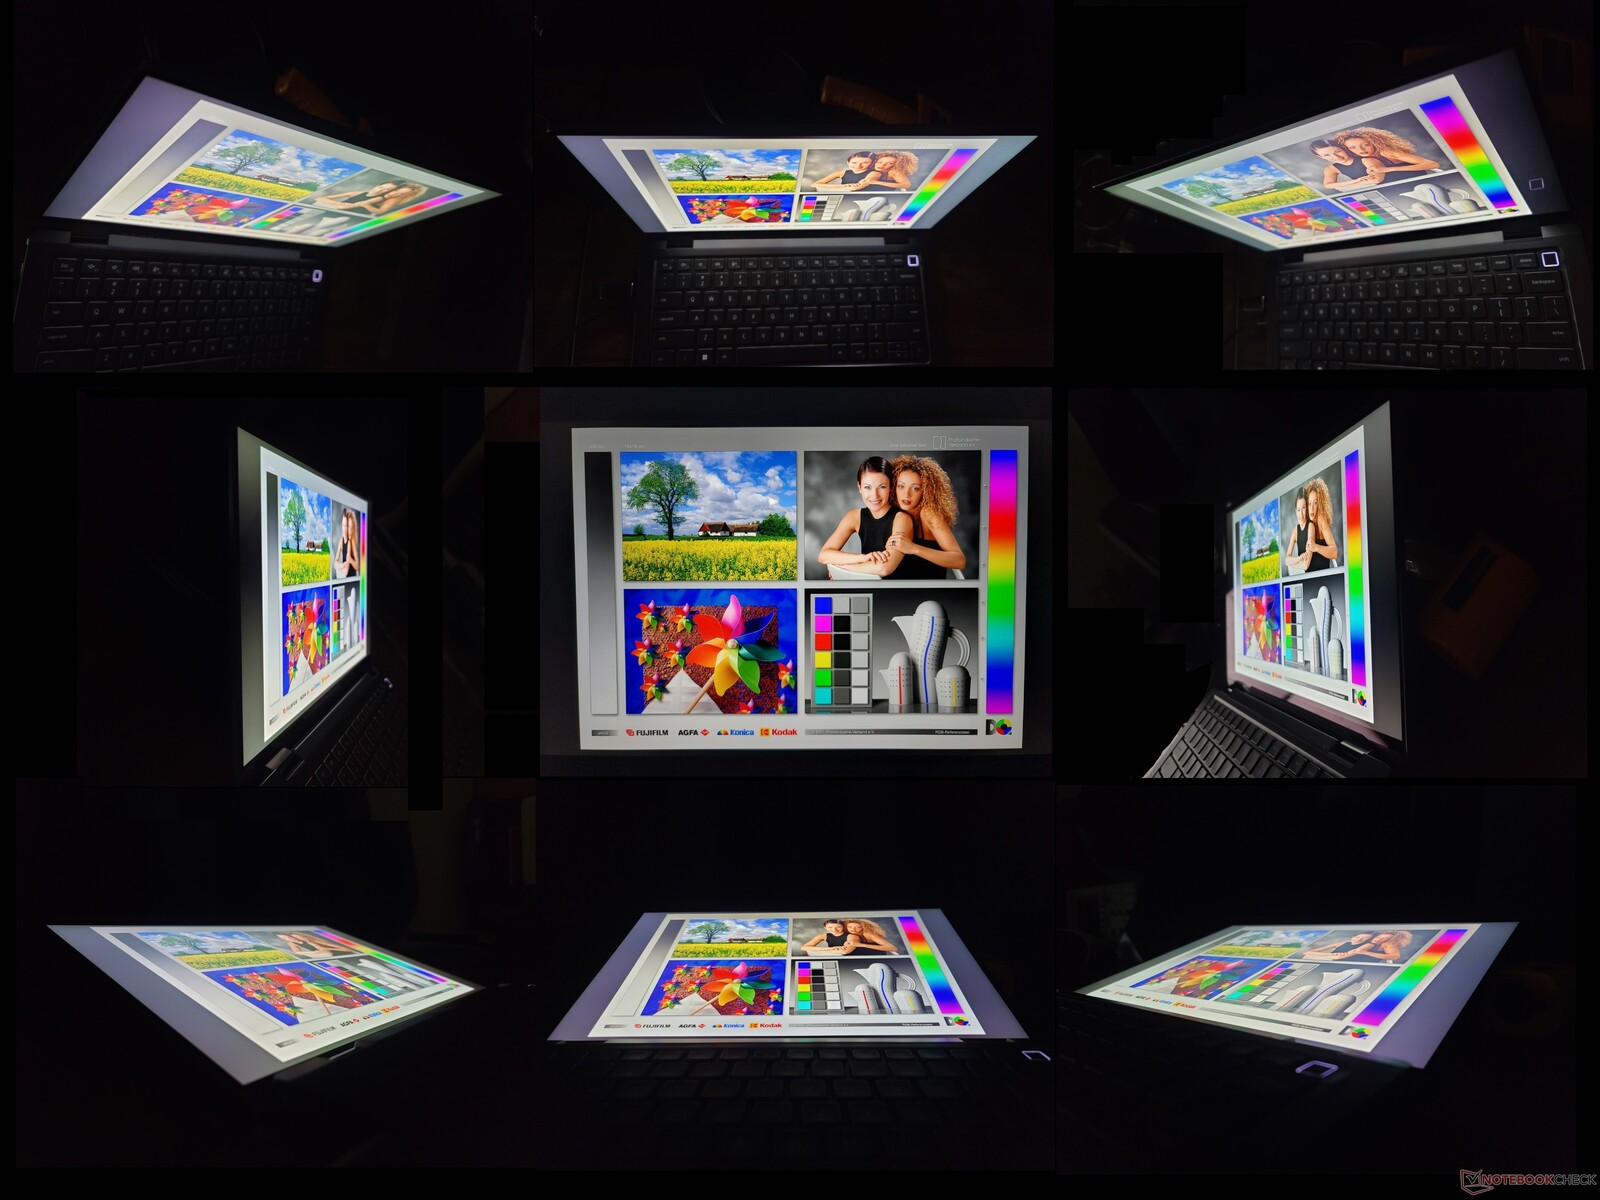
La dalle IPS AU Optronics B140QAN du modèle de l'année dernière est de retour, ce qui signifie que les utilisateurs peuvent s'attendre à la même expérience visuelle entre le Latitude 9420 2-en-1 et le Latitude 9430 2-en-1. Pourtant, il aurait été formidable de voir au moins de nouvelles options avec des taux de rafraîchissement plus rapides ou même des OLED comme sur le dernier Asus ZenBook 14 ou la série HP Spectre. Les temps de réponse très lents en noir-blanc et en gris-gris, notamment, continuent d'être perceptibles. Le panneau est néanmoins excellent pour les charges de travail de type bureautique où les temps de réponse lents ont moins d'impact.
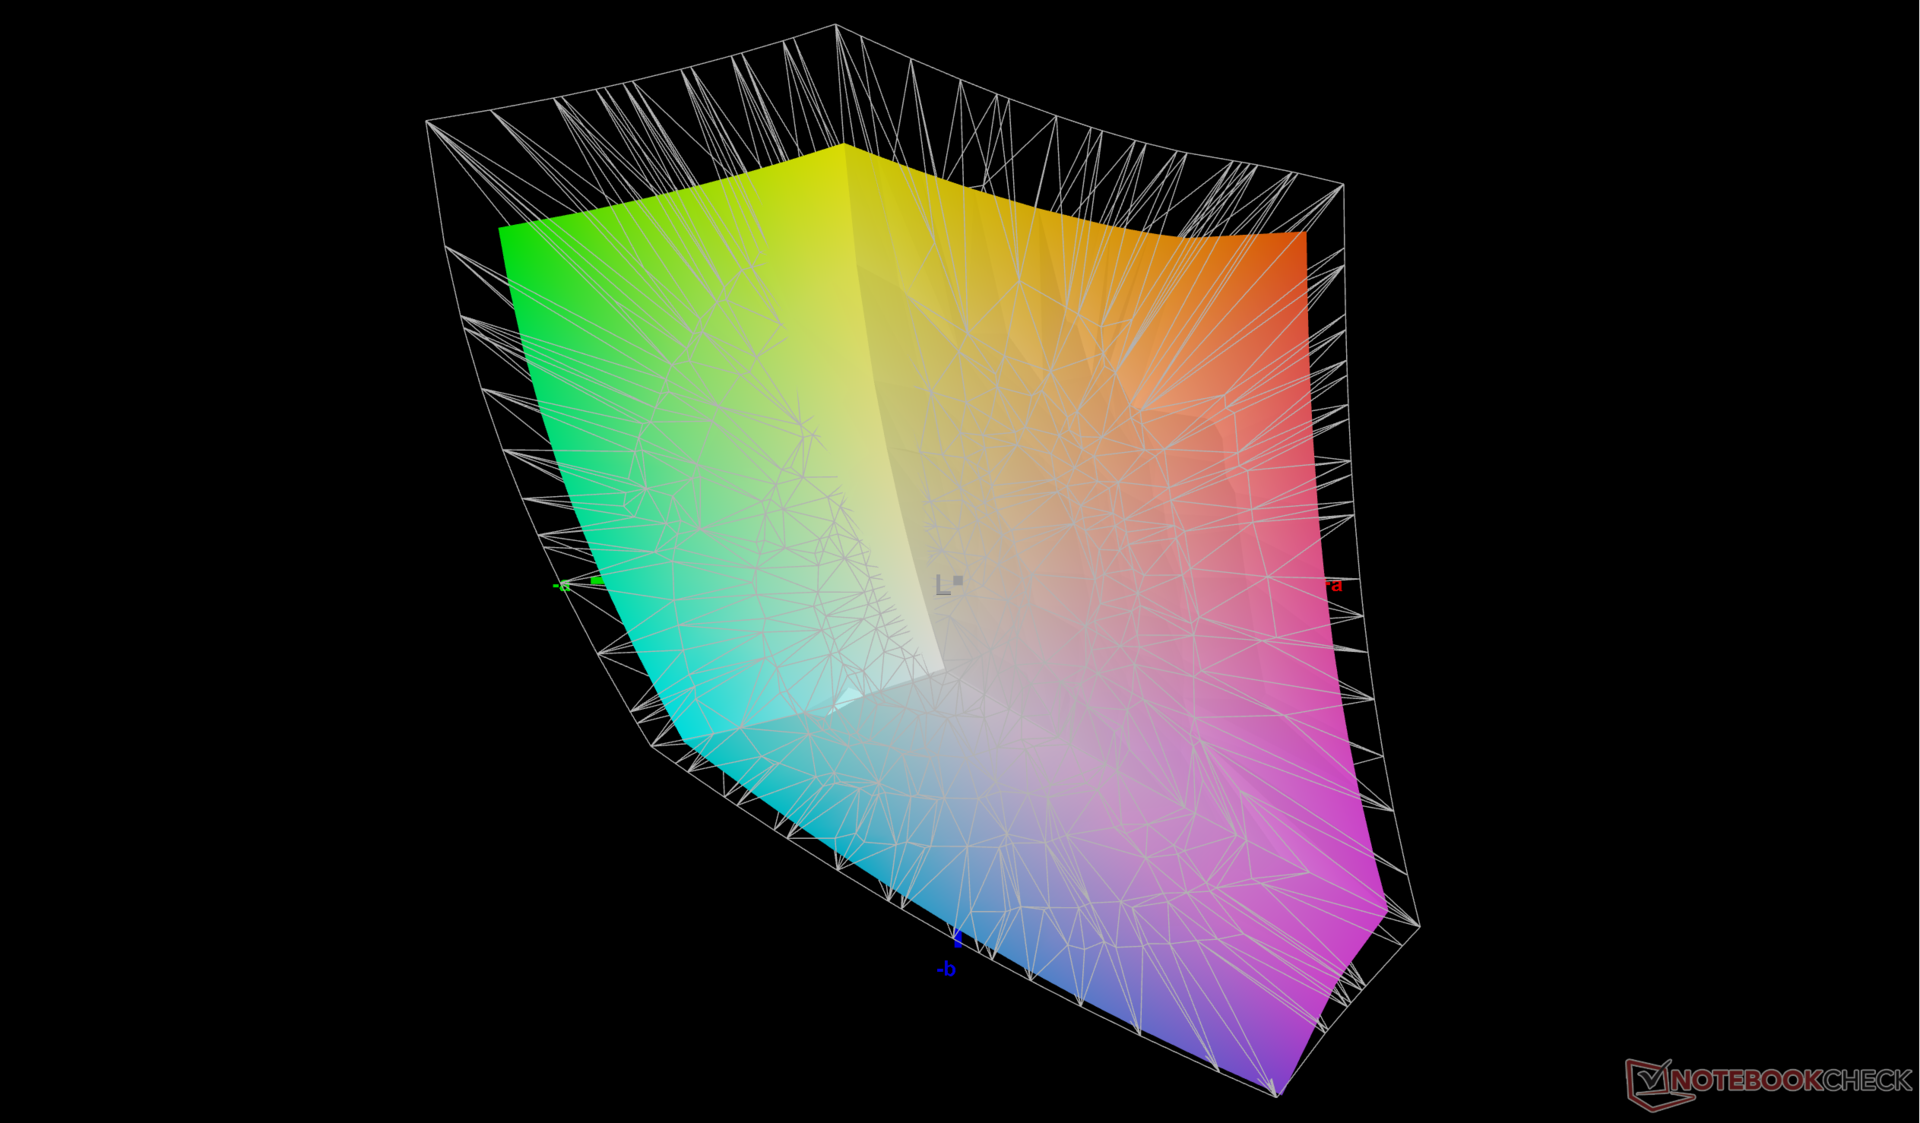
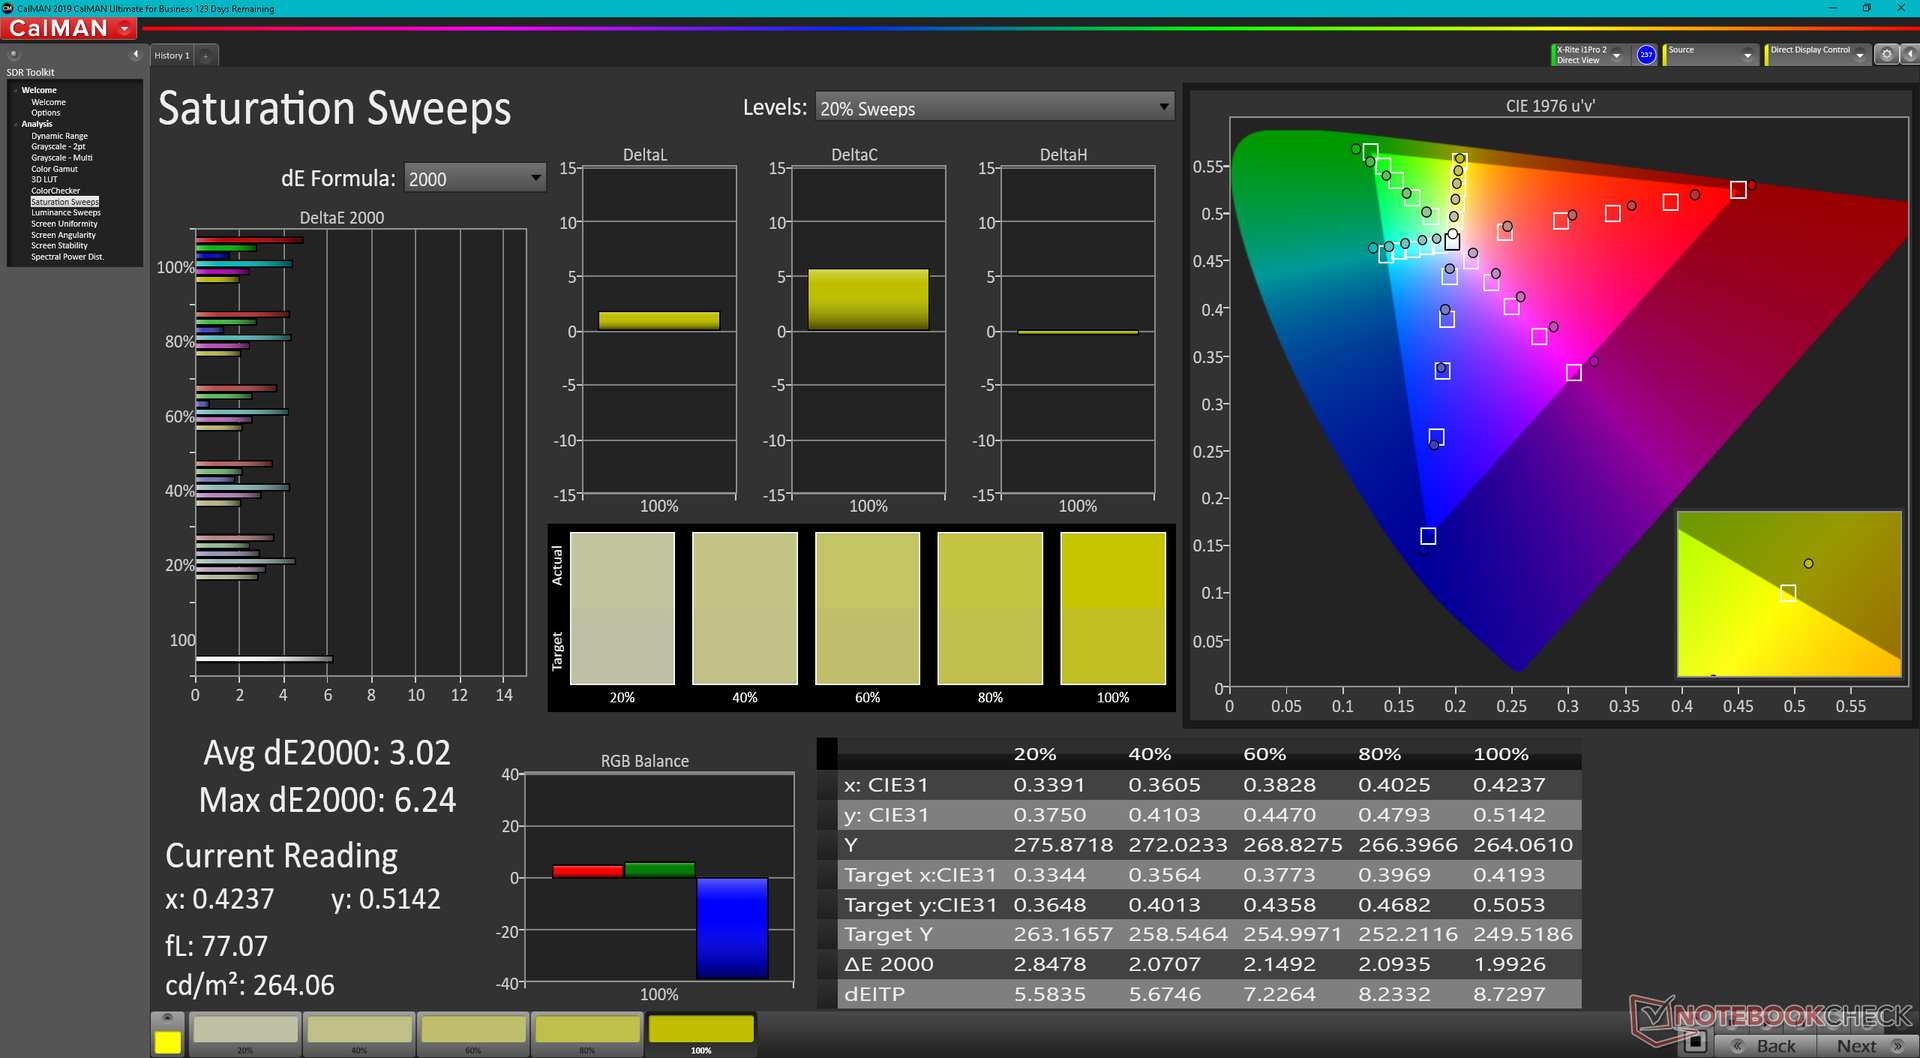
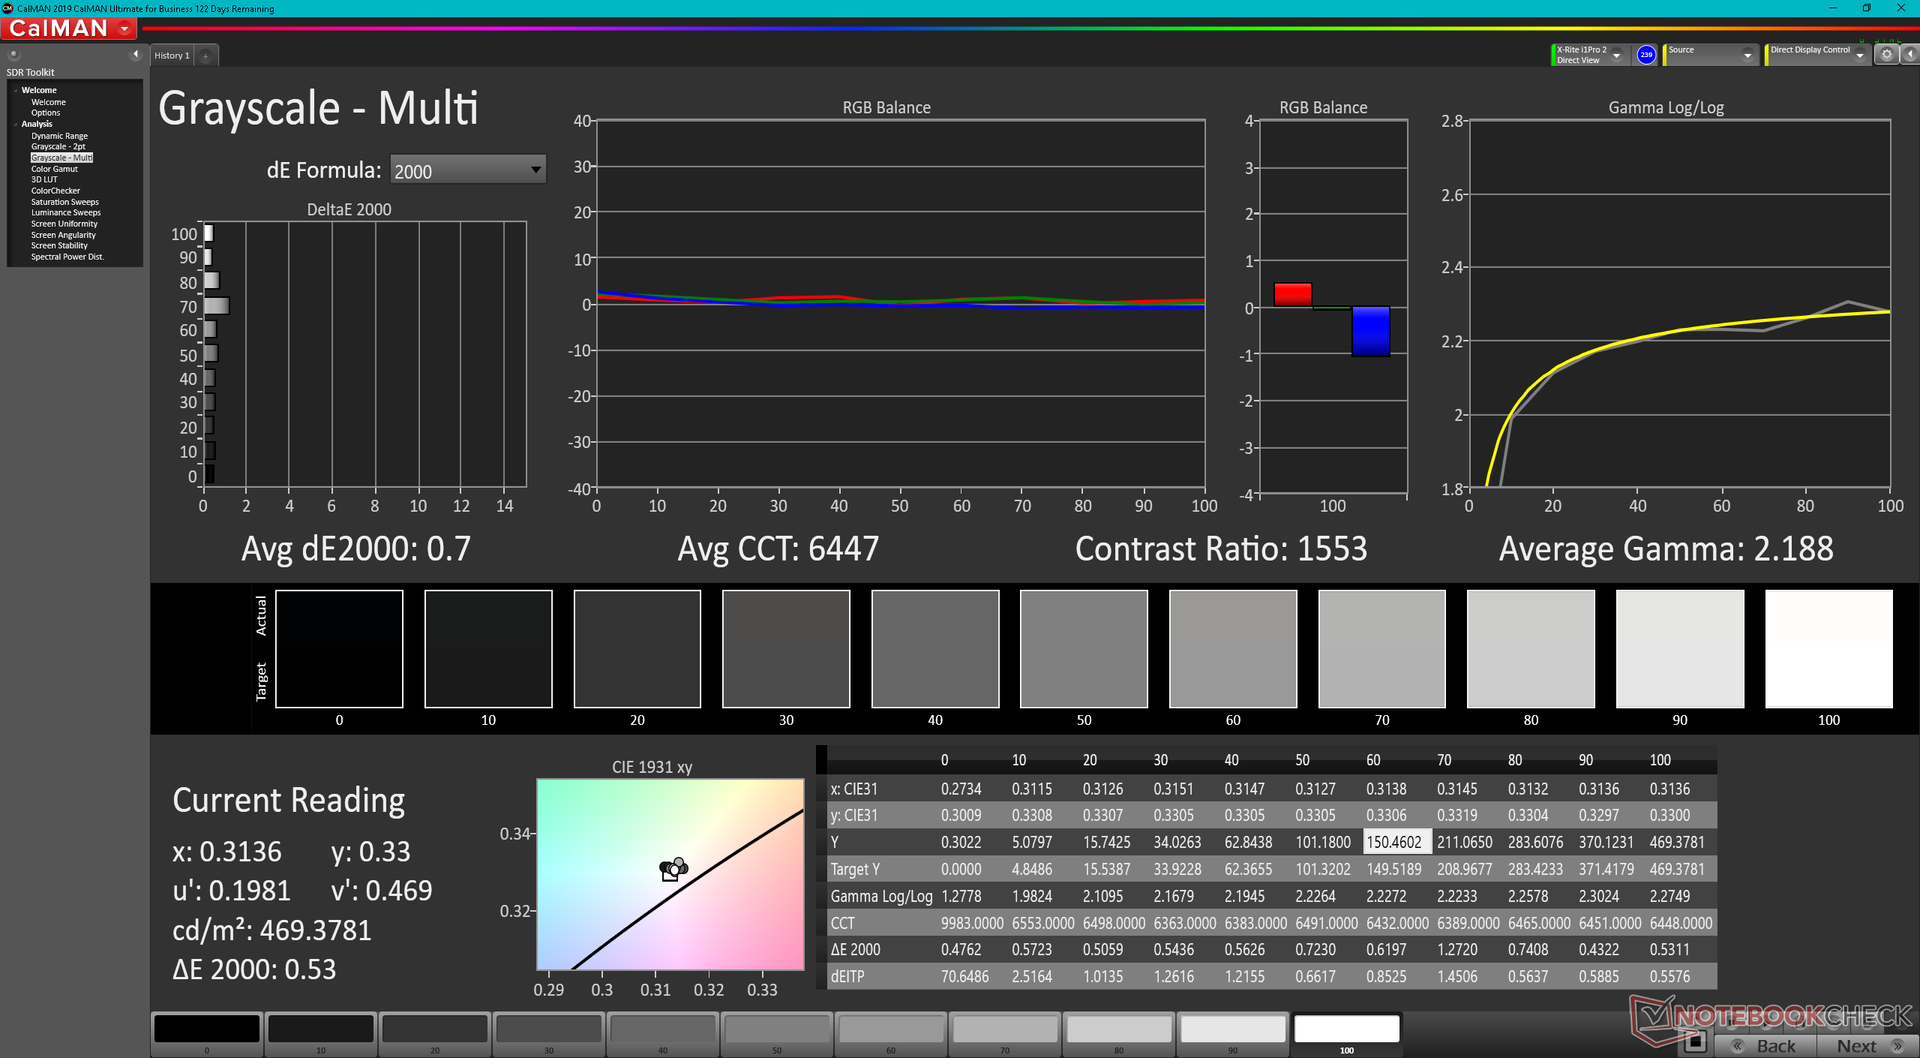
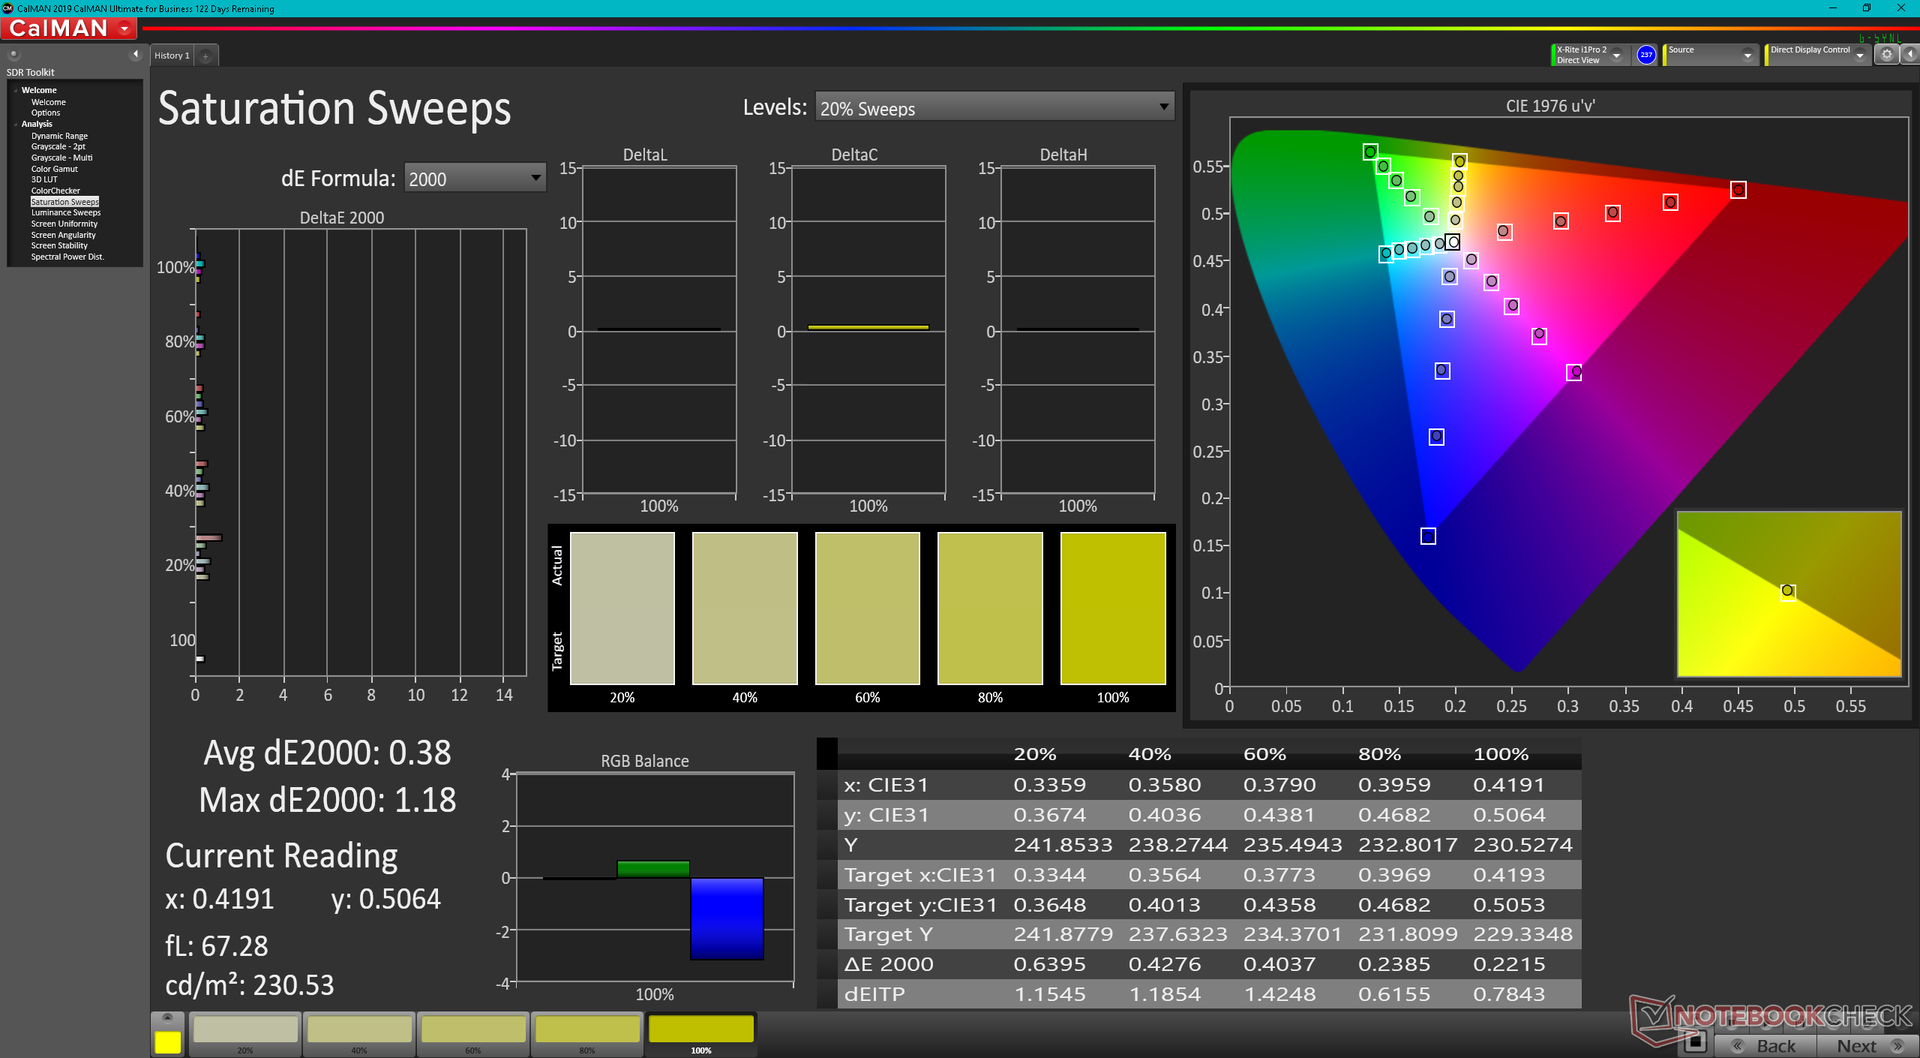
Dell annonce une couverture sRGB complète, ce que nous pouvons confirmer de manière indépendante. Nous n'en attendions pas moins d'un modèle haut de gamme de la série Latitude 9000.
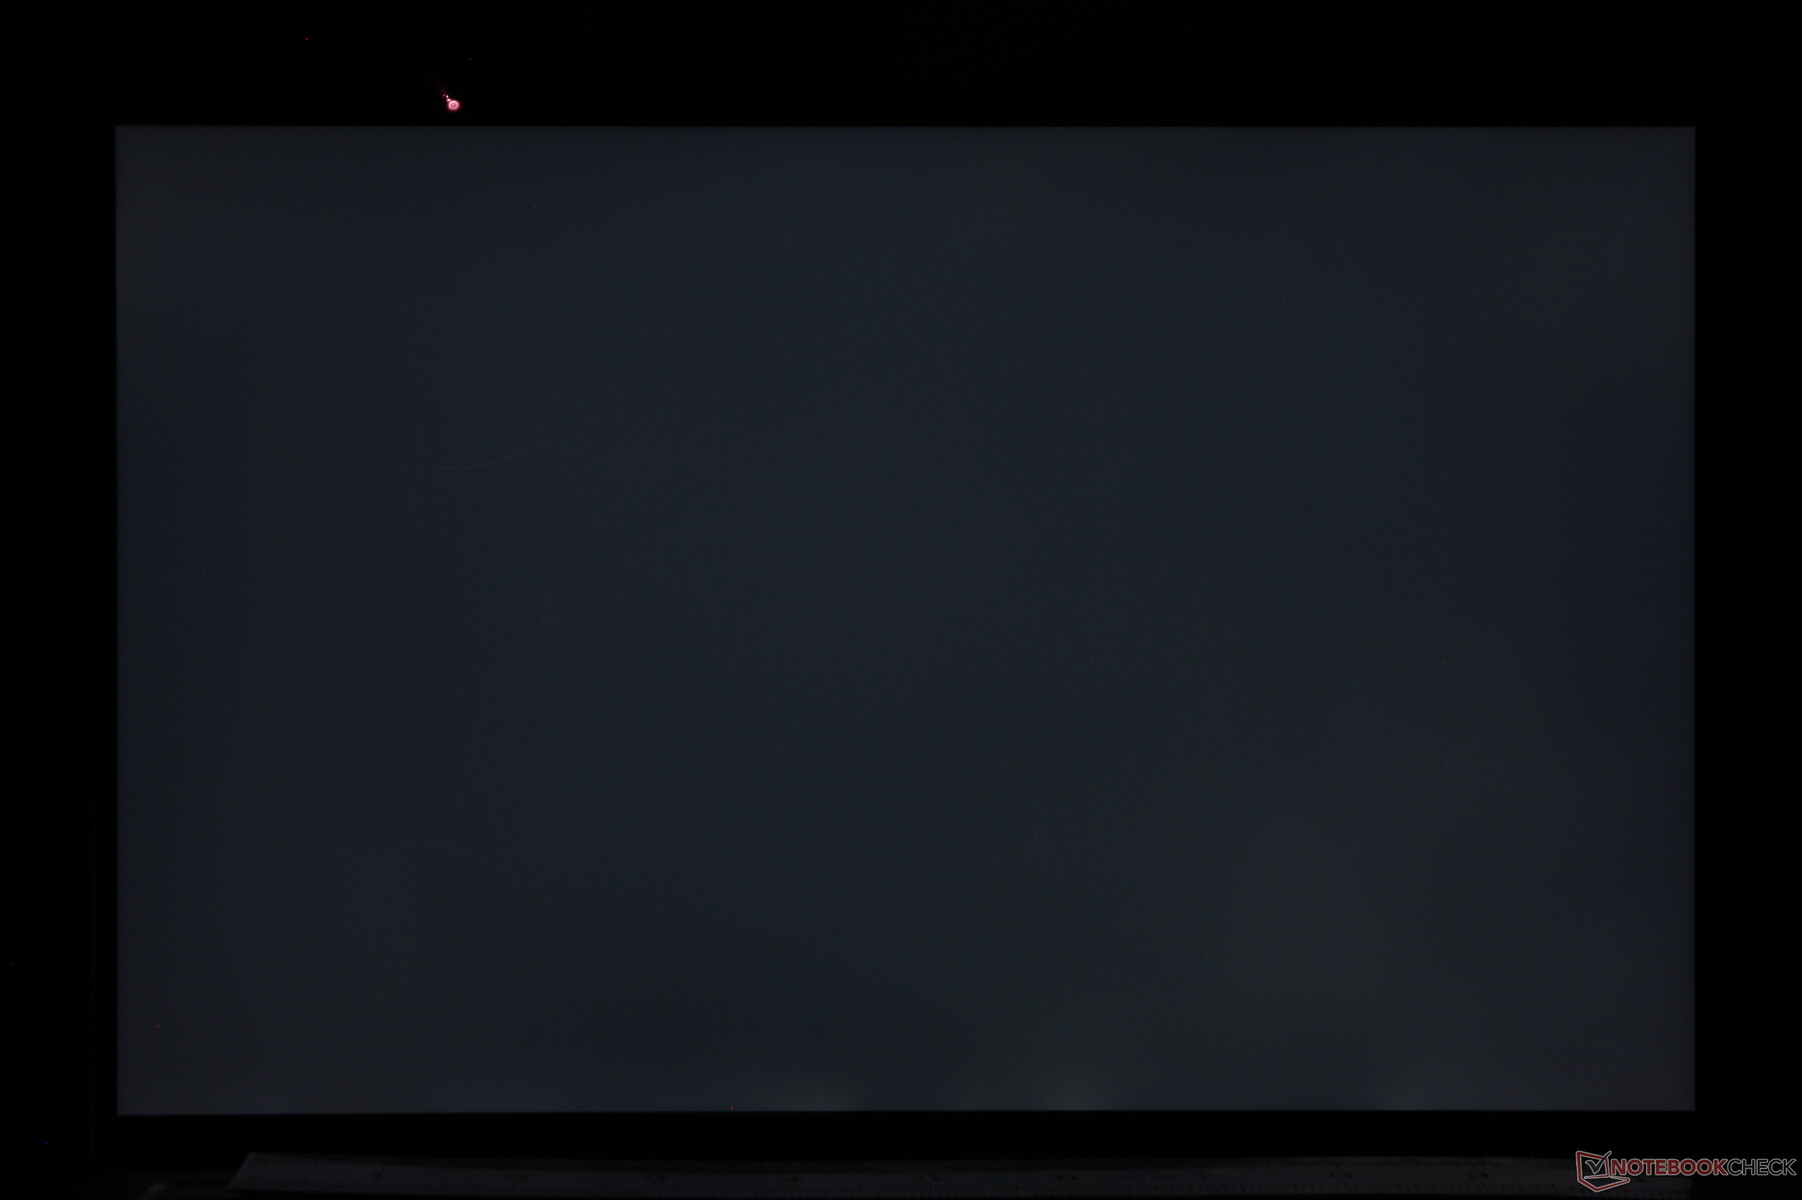
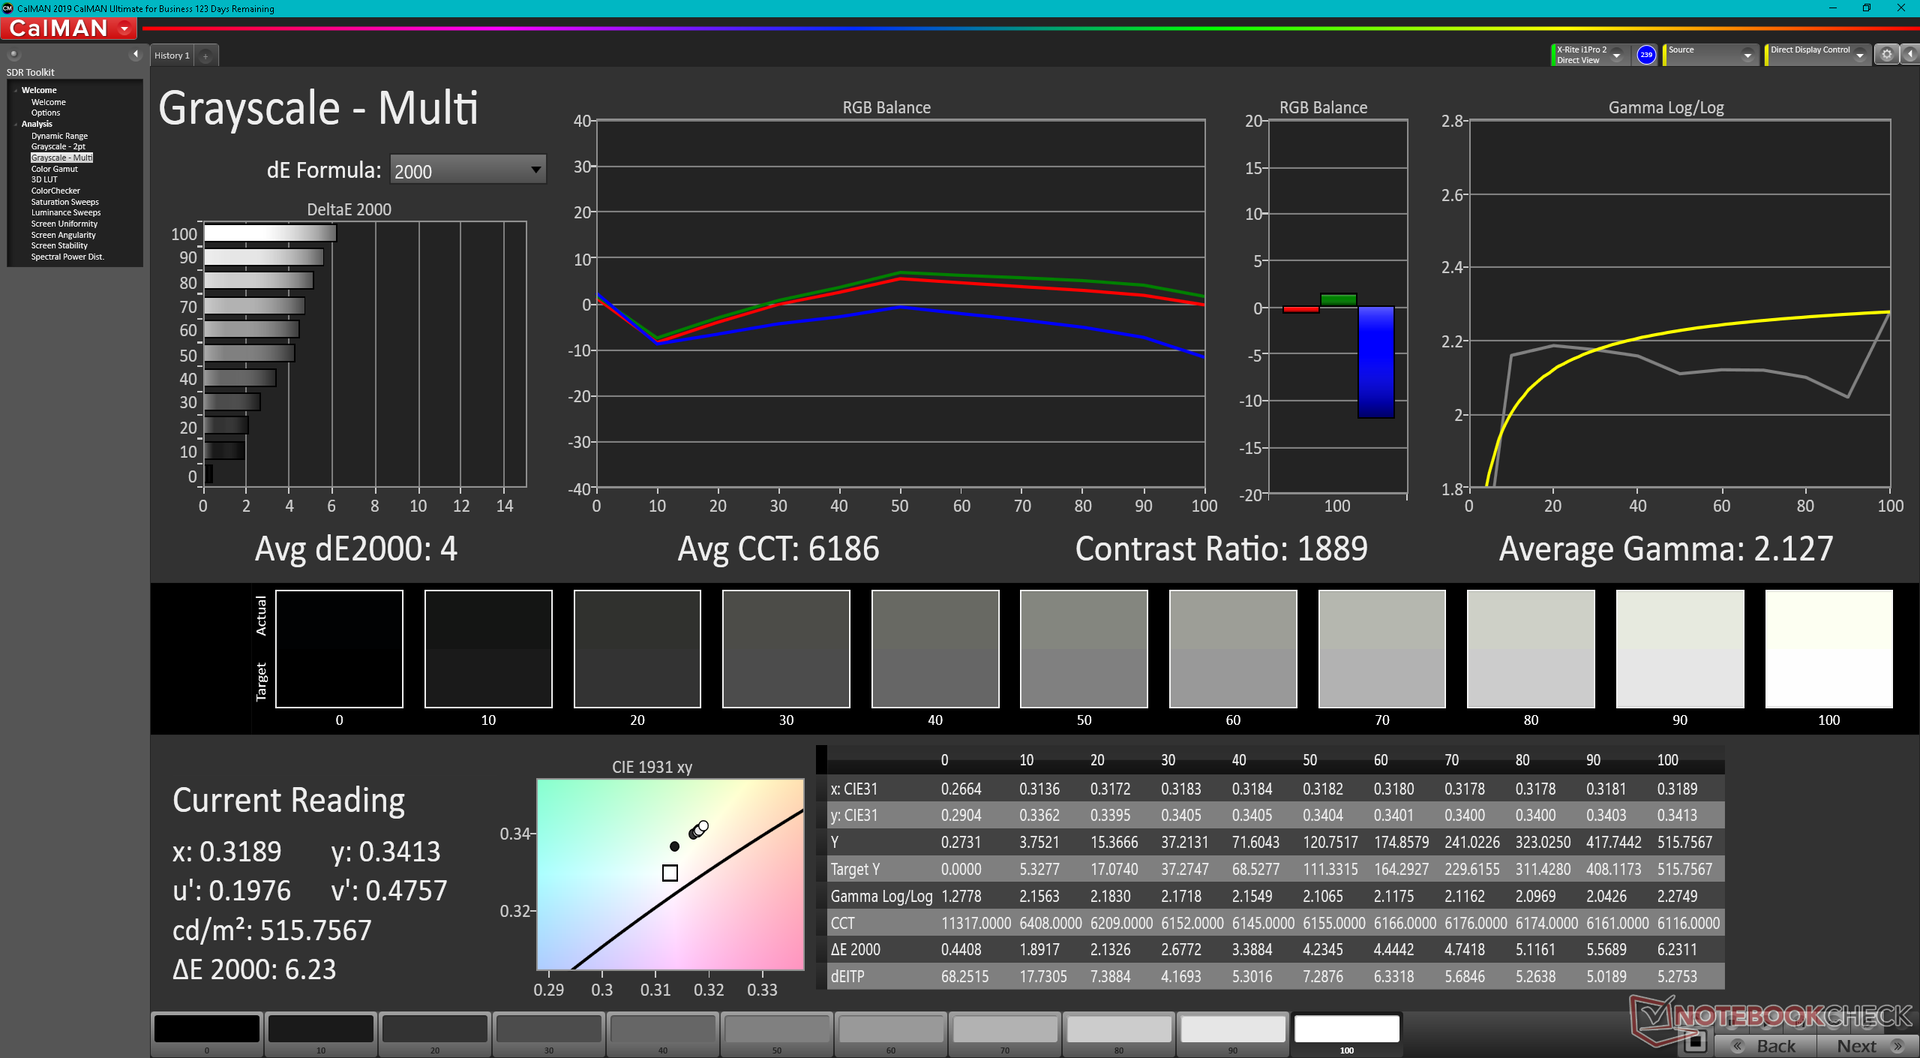
Nous avons rencontré un problème sur notre appareil : la luminosité ne changeait pas dans la plage de réglage de 0 à 28 %. La luminosité restait bloquée à 32 nits jusqu'à ce que le réglage atteigne 29 % ou plus. Dell est conscient de ce problème.
| |||||||||||||||||||||||||
Homogénéité de la luminosité: 90 %
Valeur mesurée au centre, sur batterie: 517.7 cd/m²
Contraste: 1569:1 (Valeurs des noirs: 0.33 cd/m²)
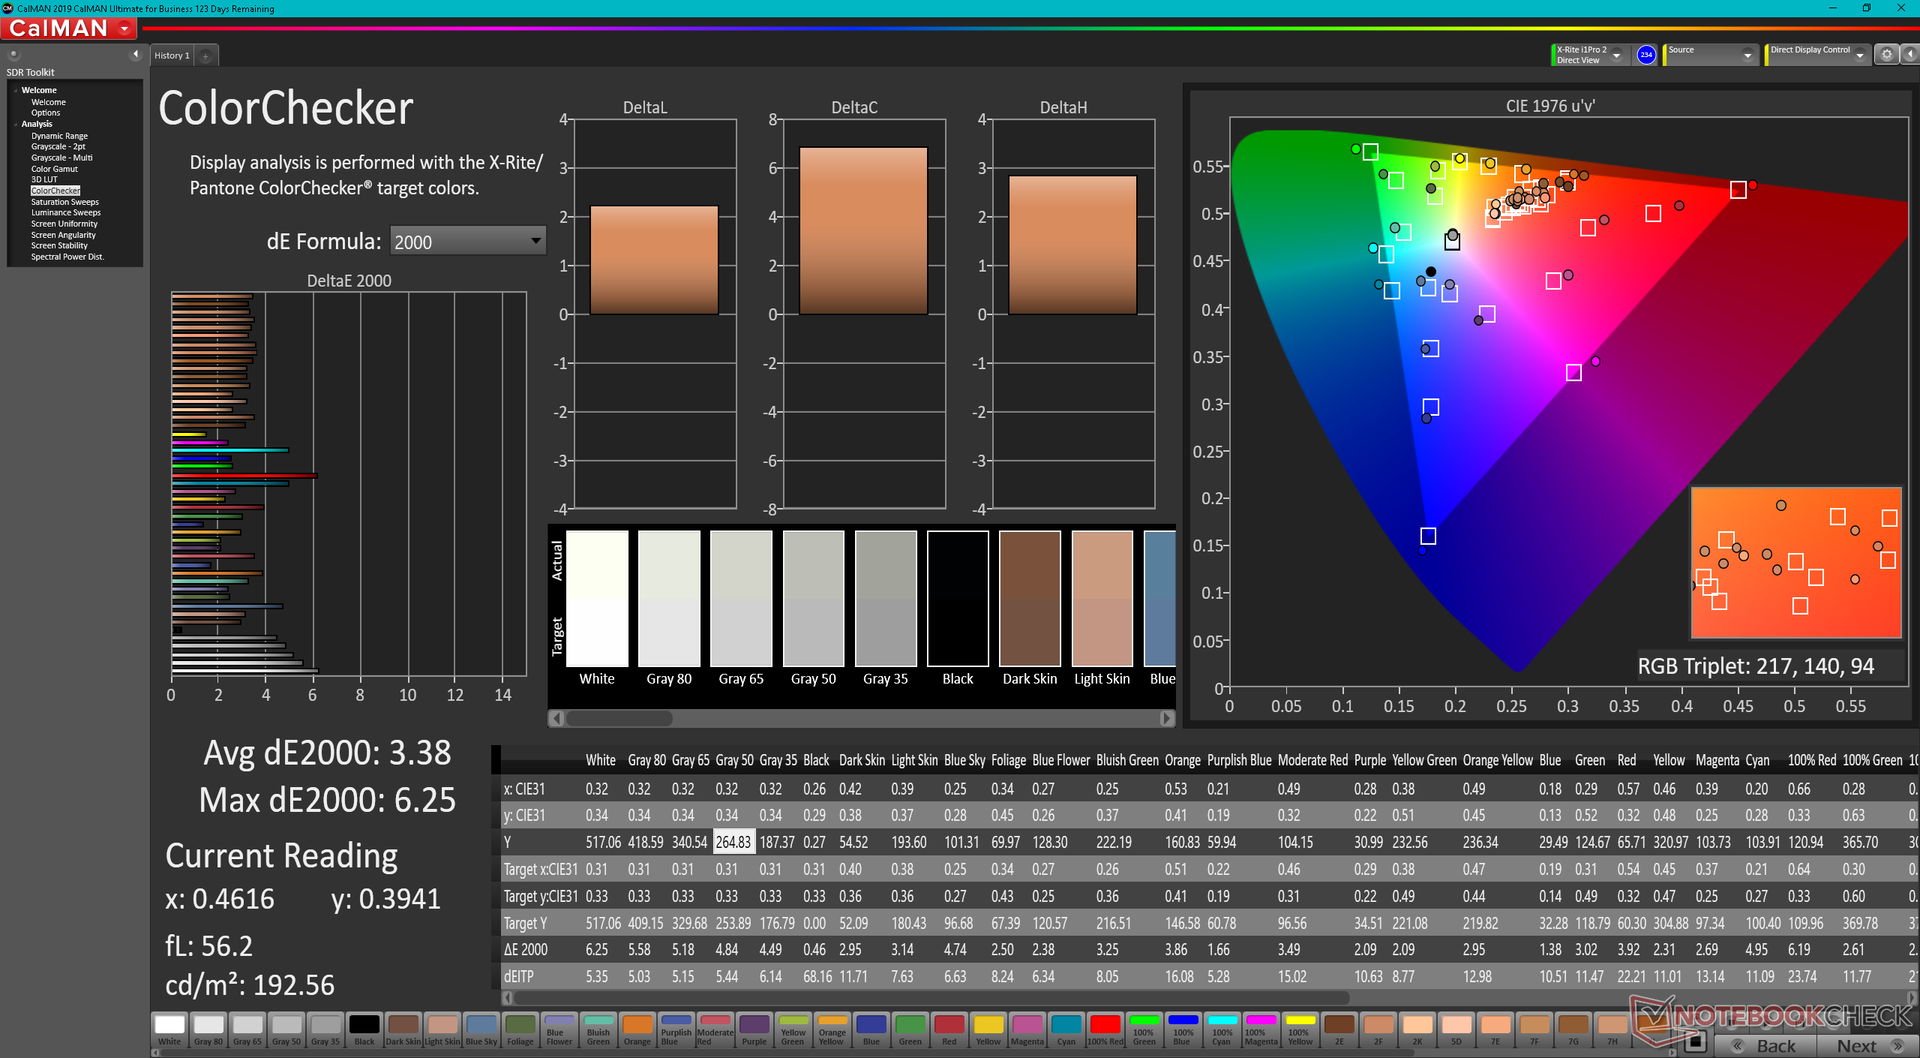
ΔE ColorChecker Calman: 3.38 | ∀{0.5-29.43 Ø4.73}
calibrated: 0.41
ΔE Greyscale Calman: 4 | ∀{0.09-98 Ø4.97}
79.4% AdobeRGB 1998 (Argyll 3D)
100% sRGB (Argyll 3D)
79.4% Display P3 (Argyll 3D)
Gamma: 2.13
CCT: 6186 K
| Dell Latitude 9430 2-in-1 AU Optronics B140QAN, IPS, 2560x1600, 14" | Dell Latitude 9420 2-in-1 AU Optronics B140QAN, IPS, 2560x1600, 14" | MSI Summit E14 Flip Evo A12MT AU Optronics B140QAN04.R, IPS, 2880x1800, 14" | LG Gram 14T90P LG Philips LP140WU1-SPA1, IPS, 1900x1200, 14" | Lenovo ThinkPad X1 Yoga G7 21CE002HGE MNE007JA1-1, IPS, 1920x1200, 14" | Asus ZenBook Flip 14 UN5401QA-KN085W SDC4154, OLED, 2880x1800, 14" | |
|---|---|---|---|---|---|---|
| Display | 1% | 10% | 12% | -8% | 17% | |
| Display P3 Coverage (%) | 79.4 | 80.7 2% | 97.8 23% | 98.8 24% | 69.3 -13% | 99.7 26% |
| sRGB Coverage (%) | 100 | 100 0% | 99.9 0% | 100 0% | 99.7 0% | 100 0% |
| AdobeRGB 1998 Coverage (%) | 79.4 | 79.7 0% | 85.9 8% | 71.3 -10% | 98.6 24% | |
| Response Times | 9% | 64% | 21% | 34% | 96% | |
| Response Time Grey 50% / Grey 80% * (ms) | 63.6 ? | 54 ? 15% | 16.9 ? 73% | 44 ? 31% | 42 ? 34% | 2 ? 97% |
| Response Time Black / White * (ms) | 33.6 ? | 32.8 ? 2% | 15.4 ? 54% | 30 ? 11% | 22.4 ? 33% | 2 ? 94% |
| PWM Frequency (Hz) | ||||||
| Screen | -45% | -33% | -5% | 8% | -80% | |
| Brightness middle (cd/m²) | 517.7 | 483.6 -7% | 496.7 -4% | 305.5 -41% | 371 -28% | 366 -29% |
| Brightness (cd/m²) | 493 | 465 -6% | 468 -5% | 289 -41% | 363 -26% | 369 -25% |
| Brightness Distribution (%) | 90 | 92 2% | 87 -3% | 87 -3% | 92 2% | 96 7% |
| Black Level * (cd/m²) | 0.33 | 0.32 3% | 0.3 9% | 0.27 18% | 0.21 36% | |
| Contrast (:1) | 1569 | 1511 -4% | 1656 6% | 1131 -28% | 1767 13% | |
| Colorchecker dE 2000 * | 3.38 | 3.69 -9% | 3.93 -16% | 3.31 2% | 1.3 62% | 2.84 16% |
| Colorchecker dE 2000 max. * | 6.25 | 5.97 4% | 7.9 -26% | 6.12 2% | 2.6 58% | 5.29 15% |
| Colorchecker dE 2000 calibrated * | 0.41 | 2.05 -400% | 1.27 -210% | 0.8 -95% | 2.81 -585% | |
| Greyscale dE 2000 * | 4 | 3.5 12% | 5.9 -48% | 1.9 52% | 2.1 47% | 2.32 42% |
| Gamma | 2.13 103% | 2.04 108% | 2.04 108% | 2.04 108% | 2.15 102% | 2.44 90% |
| CCT | 6186 105% | 6158 106% | 7618 85% | 6706 97% | 6759 96% | 6170 105% |
| Moyenne finale (programmes/paramètres) | -12% /
-28% | 14% /
-10% | 9% /
2% | 11% /
8% | 11% /
-27% |
* ... Moindre est la valeur, meilleures sont les performances
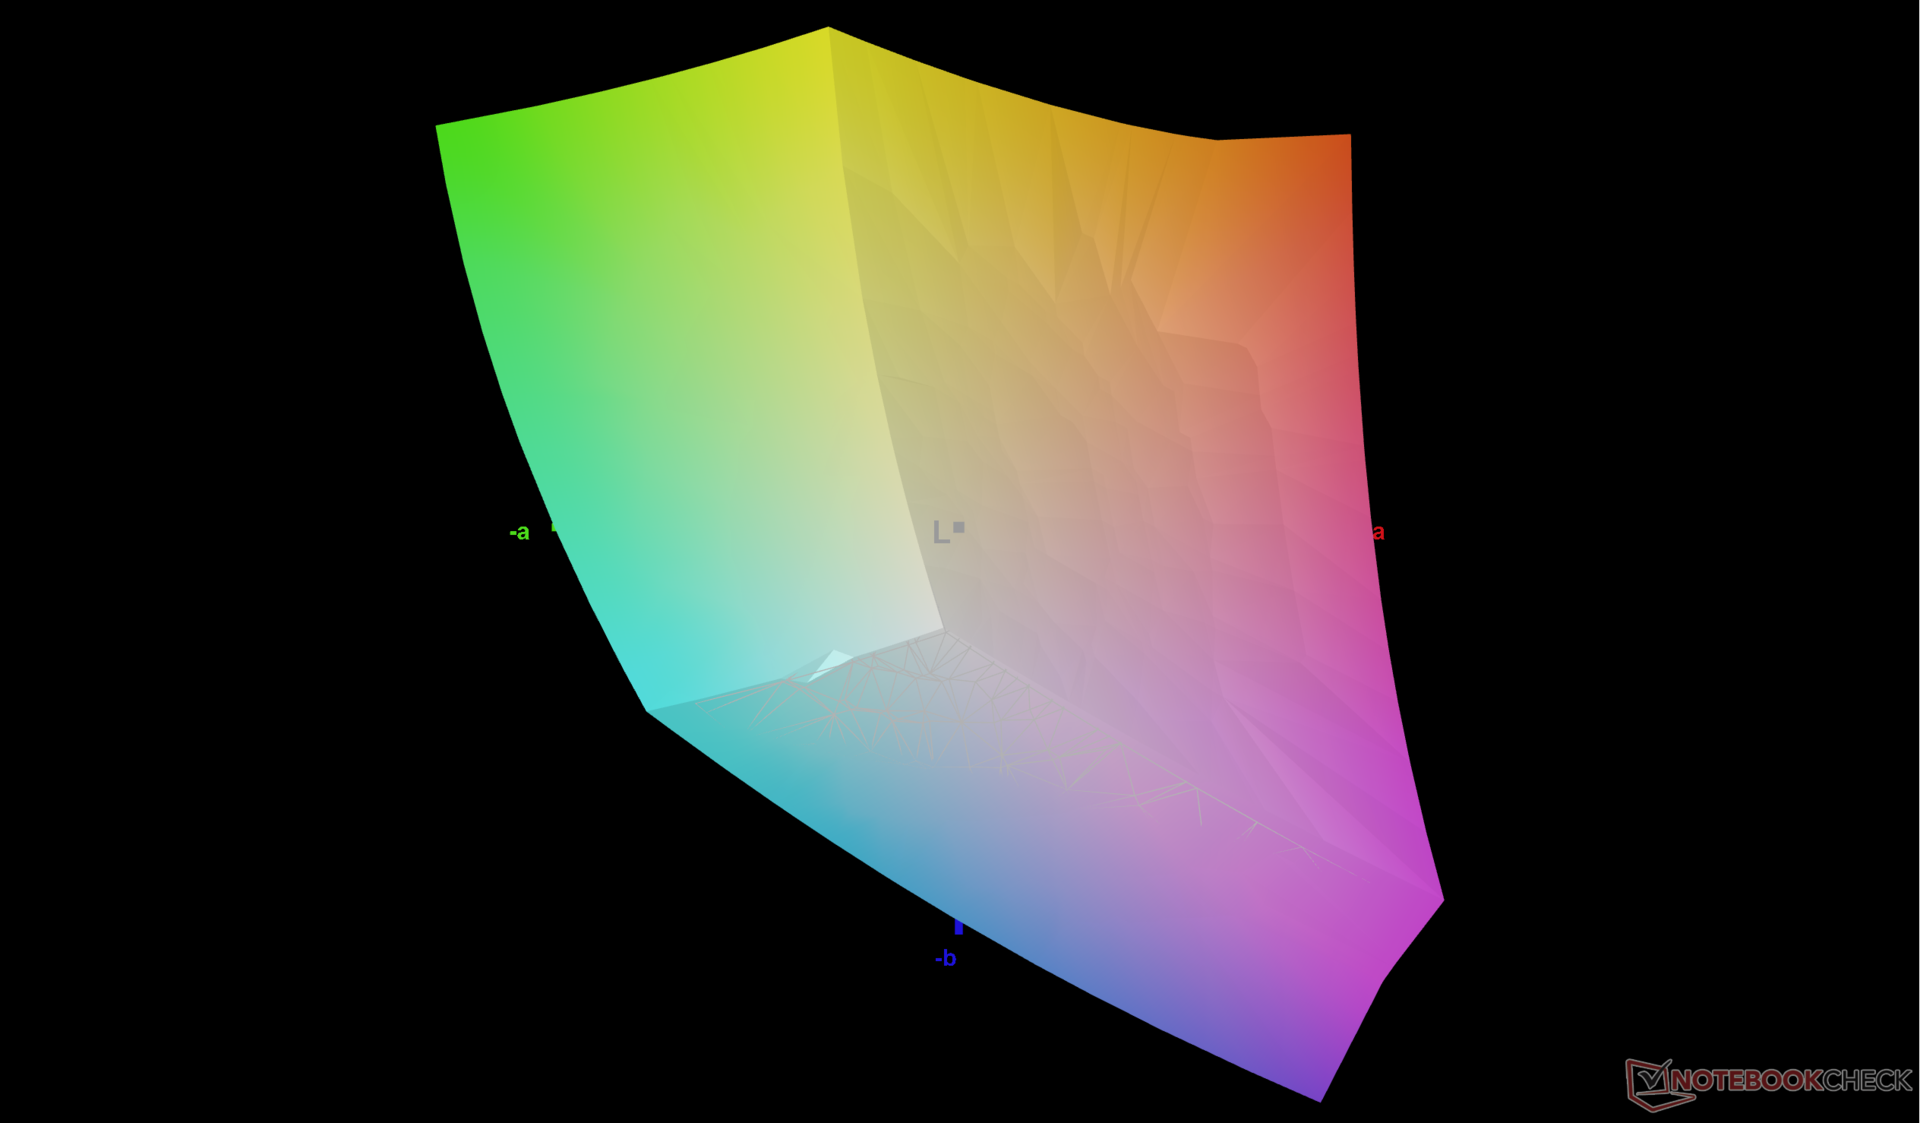
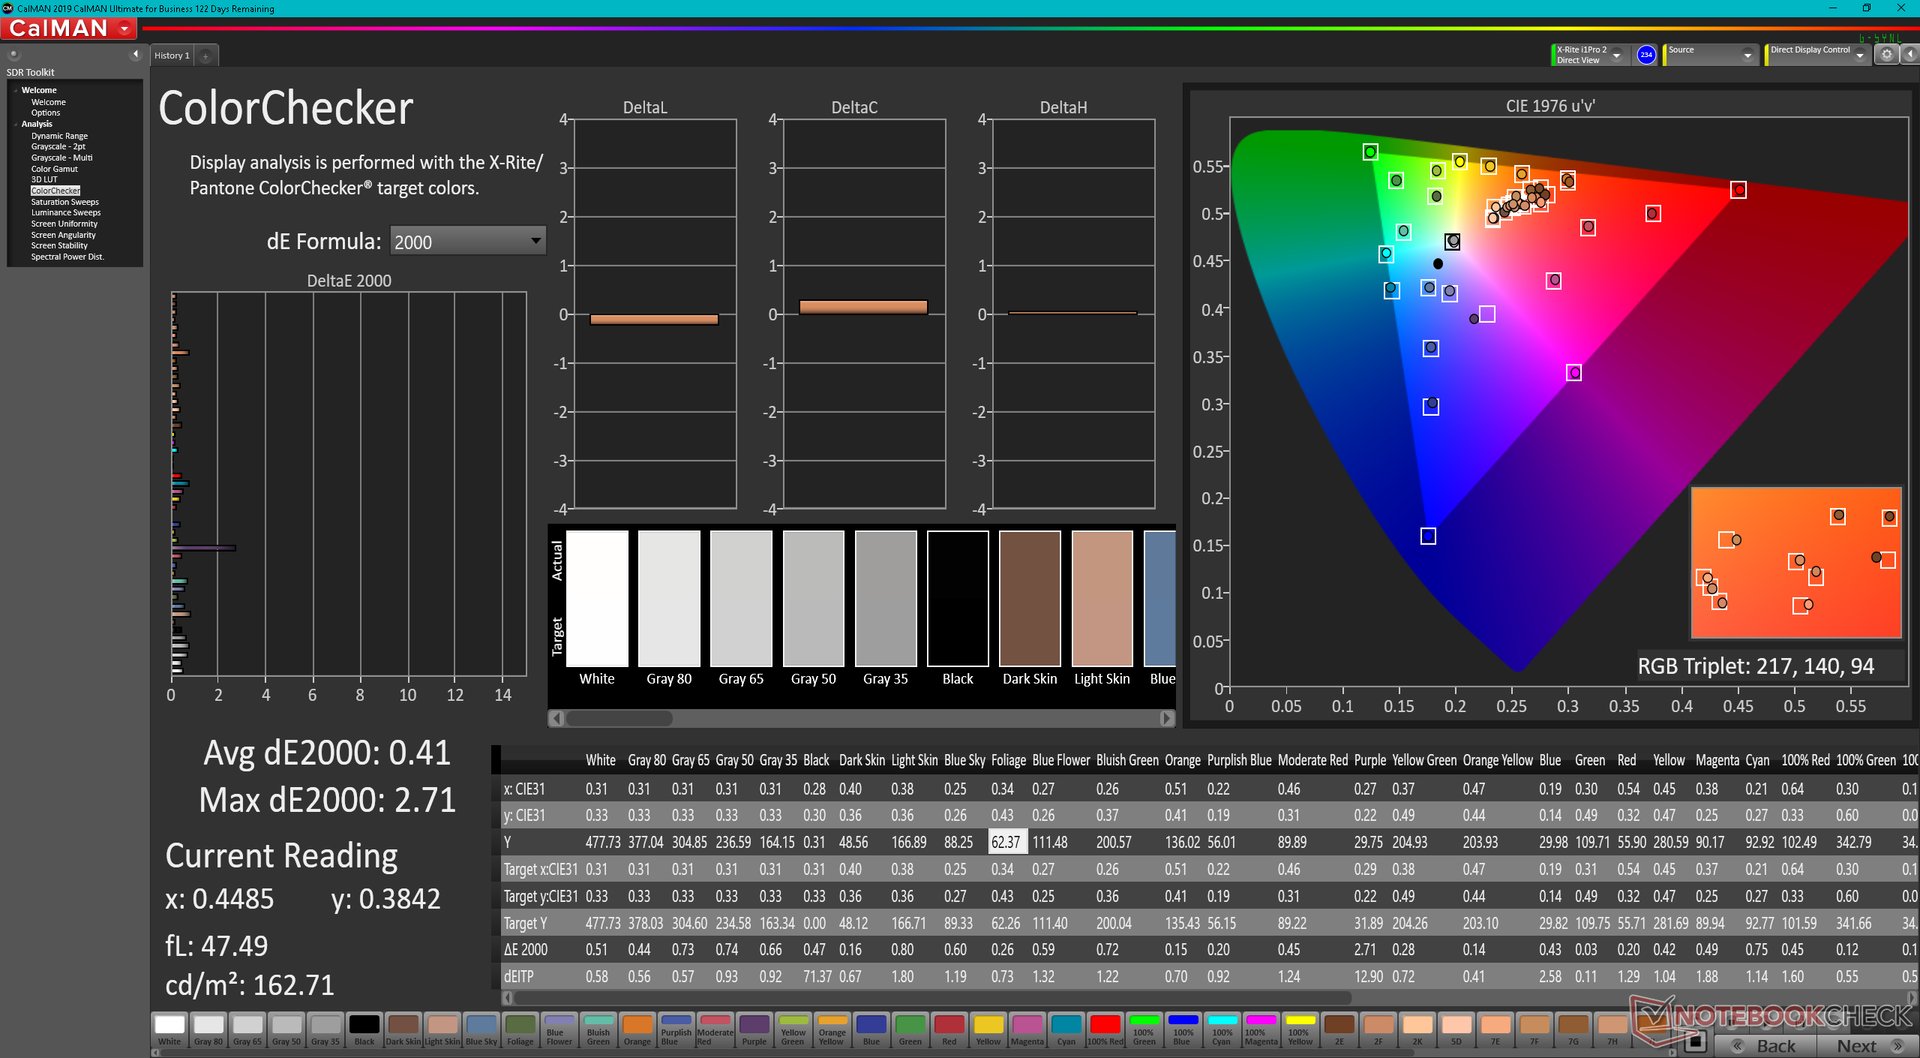
L'écran n'est pas très bien calibré, avec des valeurs moyennes de DeltaE pour les niveaux de gris et les couleurs de 4 et 3,38, respectivement. Nous sommes capables de ramener ces valeurs moyennes à seulement 0,7 et 0,41 avec un colorimètre X-Rite. Nous recommandons d'installer notre profil ICM ci-dessus pour mieux exploiter la couverture sRGB complète du panneau.
Temps de réponse de l'écran
| ↔ Temps de réponse noir à blanc | ||
|---|---|---|
| 33.6 ms ... hausse ↗ et chute ↘ combinées | ↗ 17.2 ms hausse | 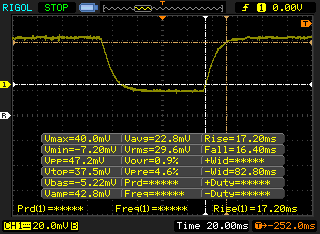 |
| ↘ 16.4 ms chute | ||
| L'écran souffre de latences très élevées, à éviter pour le jeu. En comparaison, tous les appareils testés affichent entre 0.1 (minimum) et 240 (maximum) ms. » 90 % des appareils testés affichent de meilleures performances. Cela signifie que les latences relevées sont moins bonnes que la moyenne (19.9 ms) de tous les appareils testés. | ||
| ↔ Temps de réponse gris 50% à gris 80% | ||
| 63.6 ms ... hausse ↗ et chute ↘ combinées | ↗ 33.2 ms hausse | 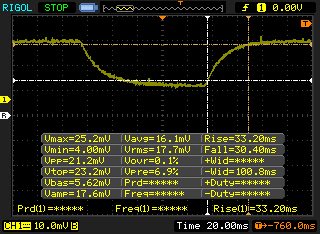 |
| ↘ 30.4 ms chute | ||
| L'écran souffre de latences très élevées, à éviter pour le jeu. En comparaison, tous les appareils testés affichent entre 0.165 (minimum) et 636 (maximum) ms. » 97 % des appareils testés affichent de meilleures performances. Cela signifie que les latences relevées sont moins bonnes que la moyenne (31.1 ms) de tous les appareils testés. | ||
Scintillement / MLI (Modulation de largeur d'impulsion)
| Scintillement / MLI (Modulation de largeur d'impulsion) non décelé | 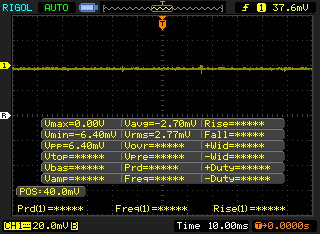 | ||
En comparaison, 52 % des appareils testés n'emploient pas MDI pour assombrir leur écran. Nous avons relevé une moyenne à 7784 (minimum : 5 - maximum : 343500) Hz dans le cas où une MDI était active. | |||
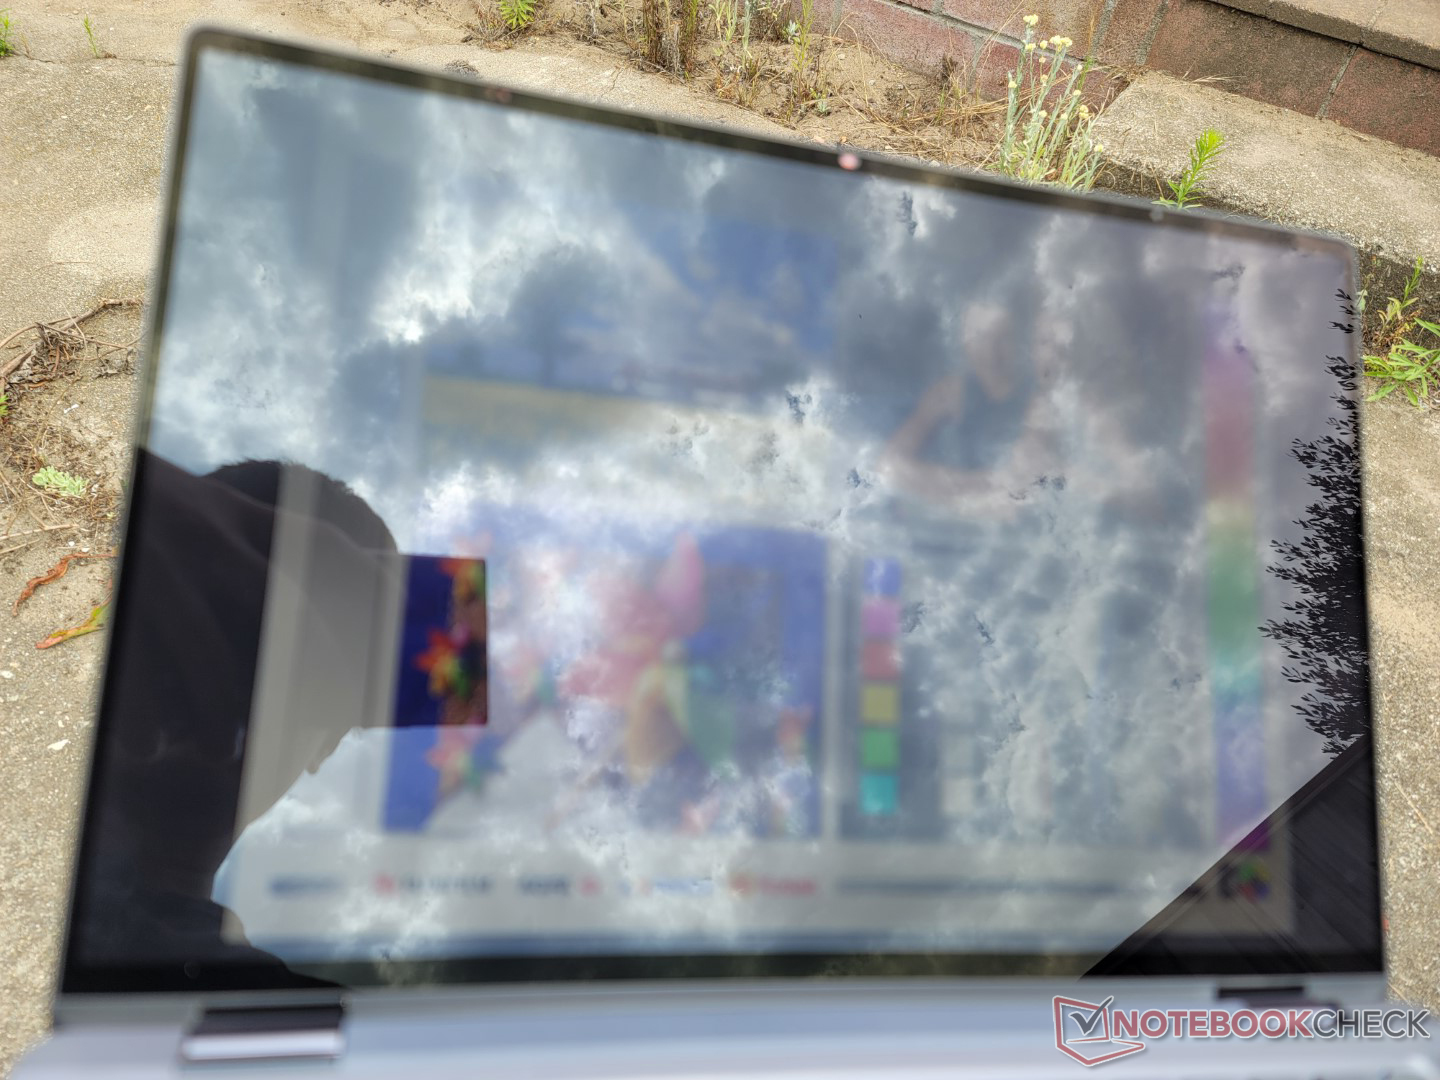
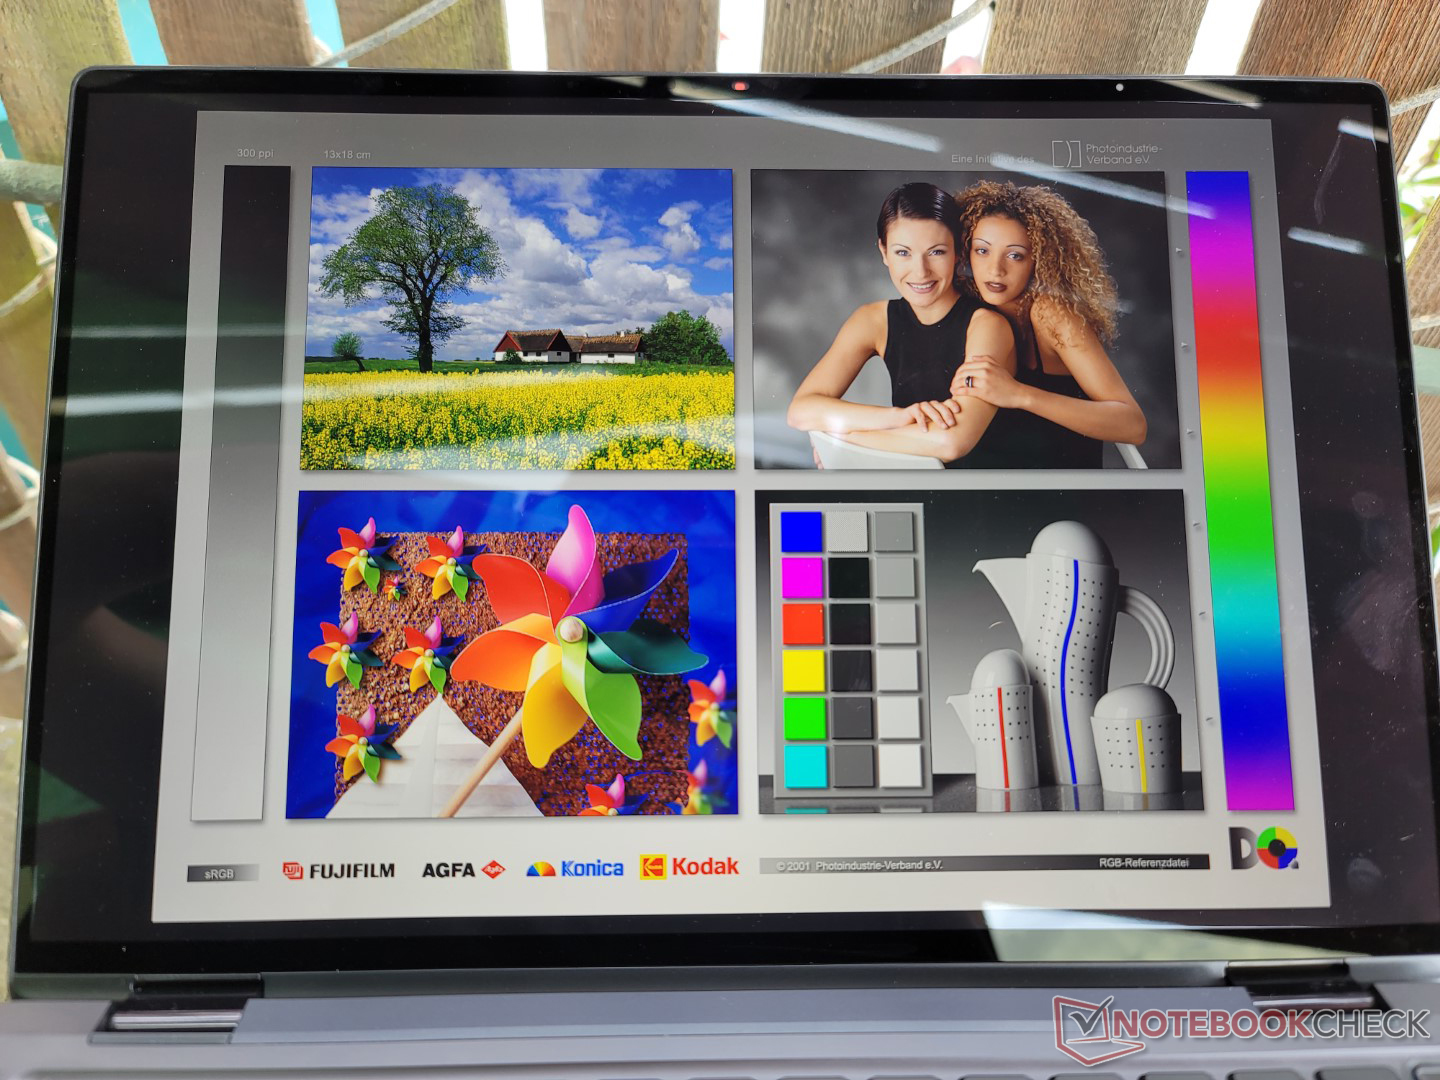
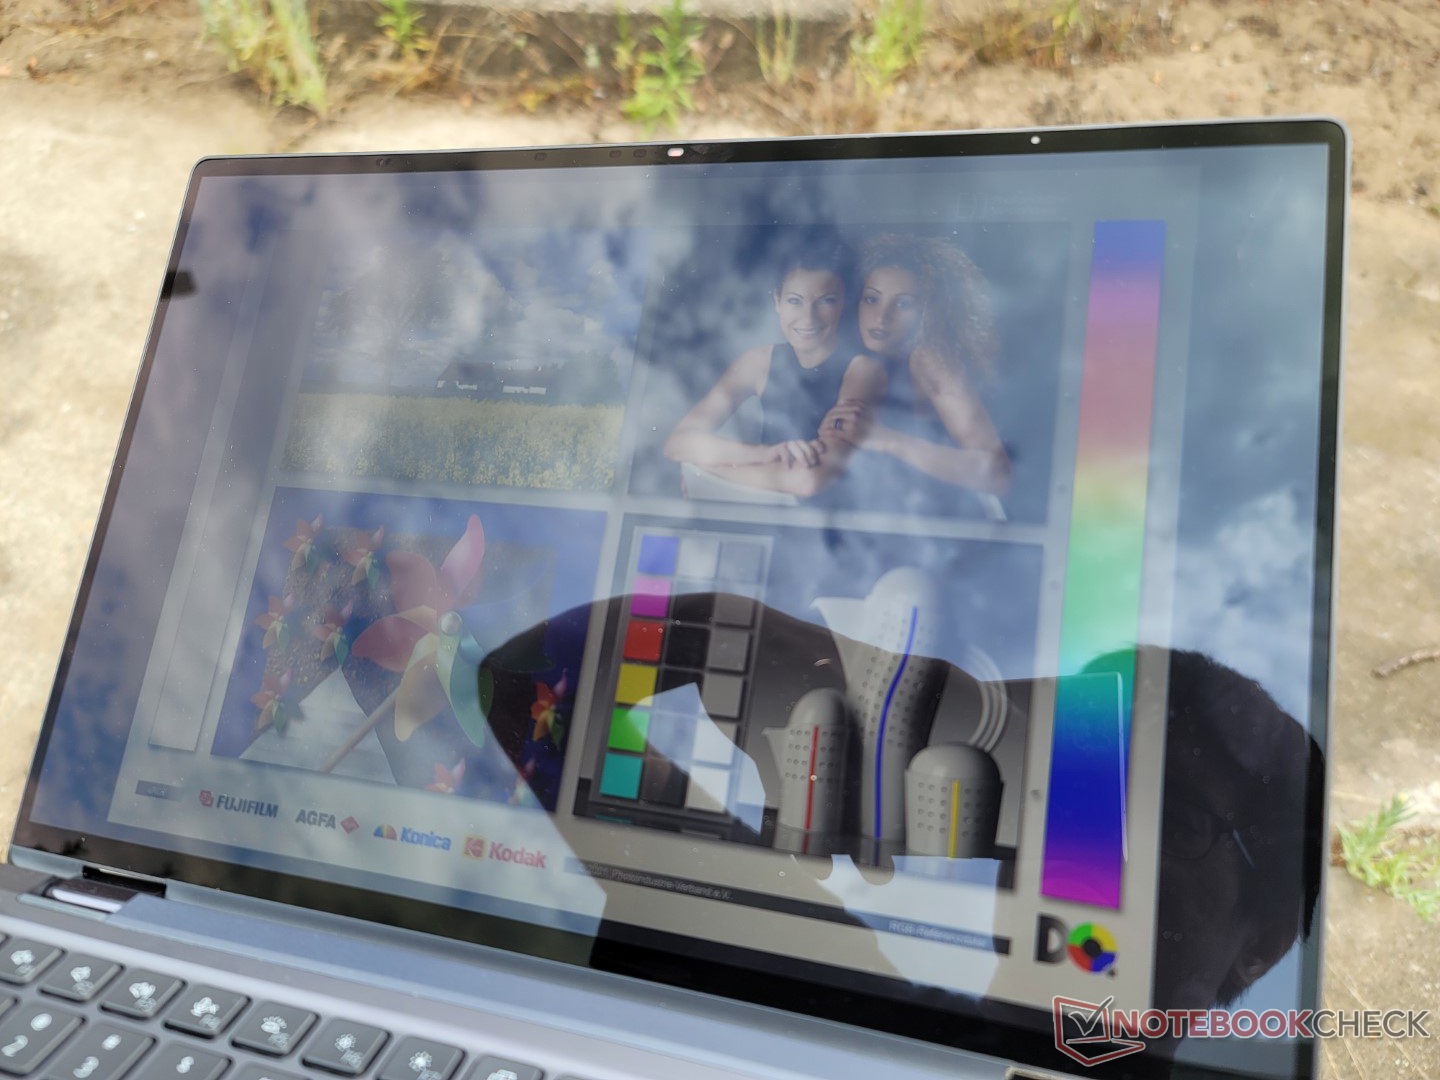
Avec 500 nits, l'écran est plus lumineux que sur de nombreux autres ordinateurs portables de 14 pouces, pour une meilleure visibilité en extérieur que leLenovo ThinkPad X1 Yoga G7 ou LG Gram 16 2-en-1. L'éblouissement reste cependant inévitable dans la plupart des scénarios, mais le texte et les images à l'écran restent clairs et colorés si l'on travaille à l'ombre.
Performance
Conditions d'essai
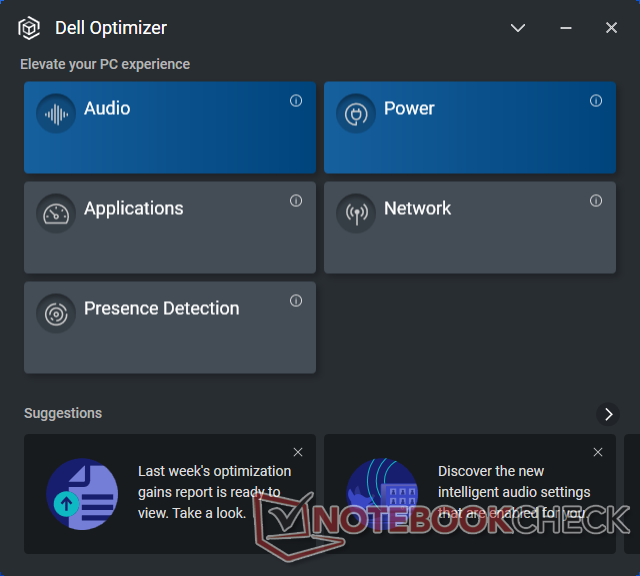
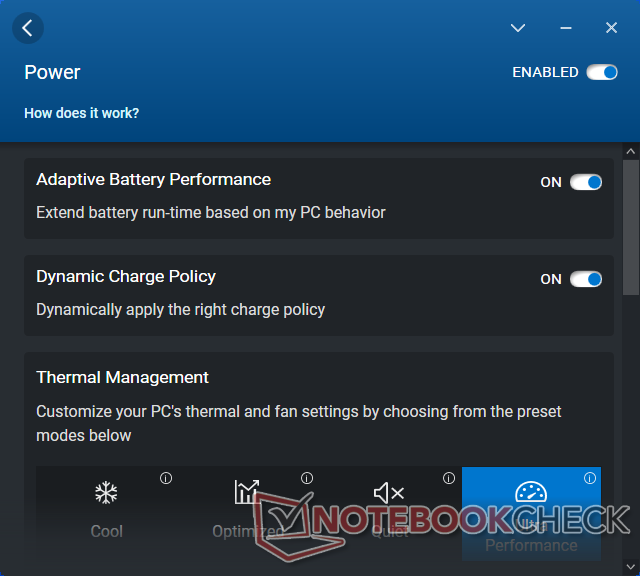
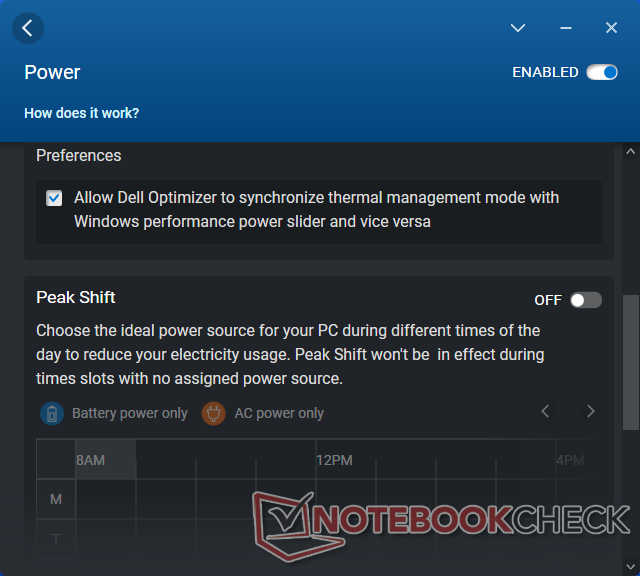
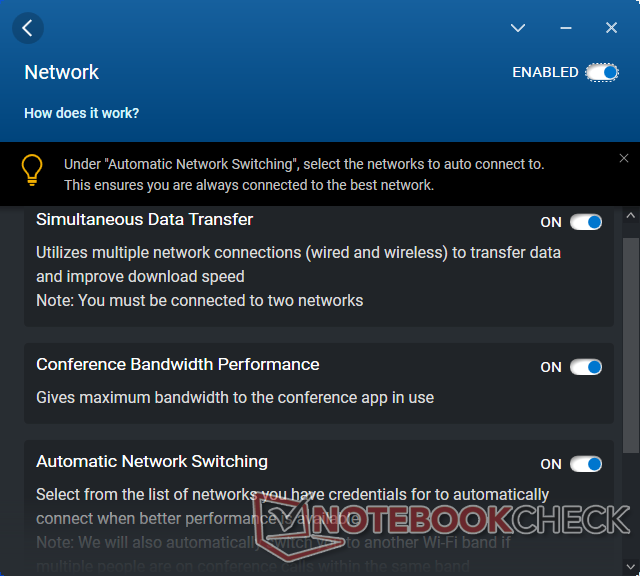
Nous avons réglé notre appareil en mode Ultra Performance via le logiciel Dell Optimizer avant d'effectuer les tests de référence ci-dessous. Nous apprécions le fait qu'Optimizer dispose d'un paramètre permettant de synchroniser les paramètres du profil d'alimentation de Windows avec le paramètre de performance Optimizer actuel. Par exemple, si Optimizer est réglé sur le mode Silencieux, le profil d'alimentation de Windows passe automatiquement en mode Economiseur d'énergie. Si Optimizer est réglé sur le mode Ultra Performance, Windows passera automatiquement au mode Performance équivalent, et ainsi de suite. Cela résout le problème des paramètres thermiques contradictoires entre plusieurs applications (c'est-à-dire que Windows est réglé sur le mode Économie d'énergie alors qu'Optimizer est réglé sur le mode Ultra Performance)
Il est regrettable que l'Optimizer ne puisse pas être maximisé et que la taille très réduite de sa fenêtre soit fixée. Pour avoir autant de boutons et d'options, l'application pourrait certainement bénéficier d'une interface utilisateur plus grande.
Processeur
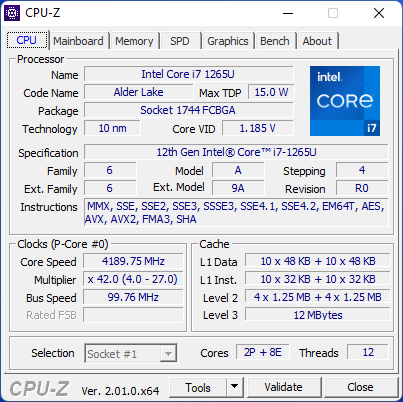
Gains du CPU par rapport à la 11e génération Core i7-1185G7 de l'année dernière ( Latitude 9420 2-in-1) sont significatifs, notamment en termes de performances multithread. Notre Core i7-1265U offre des performances monofil et multifil respectivement 20 % et 55 % plus rapides que le Core i7-1185G7. Le processeur est même capable de se mesurer au coude à coude avec le Core i7-1260P malgré le fait que la série Core P soit commercialisée comme la famille la plus rapide. Les résultats sont particulièrement bons après avoir fait l'expérience du très décevant Core i5-1235U.
La durabilité des performances aurait pu être meilleure. Lors de l'exécution de CineBench R15 xT en boucle, le score initial de 1 572 points baissait régulièrement pour se stabiliser à environ 1 230 points, ce qui représente une baisse des performances d'environ 20 % au fil du temps en raison des limitations thermiques.
Cinebench R15 Multi Loop
Cinebench R23: Multi Core | Single Core
Cinebench R15: CPU Multi 64Bit | CPU Single 64Bit
Blender: v2.79 BMW27 CPU
7-Zip 18.03: 7z b 4 | 7z b 4 -mmt1
Geekbench 5.5: Multi-Core | Single-Core
HWBOT x265 Benchmark v2.2: 4k Preset
LibreOffice : 20 Documents To PDF
R Benchmark 2.5: Overall mean
Cinebench R23: Multi Core | Single Core
Cinebench R15: CPU Multi 64Bit | CPU Single 64Bit
Blender: v2.79 BMW27 CPU
7-Zip 18.03: 7z b 4 | 7z b 4 -mmt1
Geekbench 5.5: Multi-Core | Single-Core
HWBOT x265 Benchmark v2.2: 4k Preset
LibreOffice : 20 Documents To PDF
R Benchmark 2.5: Overall mean
* ... Moindre est la valeur, meilleures sont les performances
AIDA64: FP32 Ray-Trace | FPU Julia | CPU SHA3 | CPU Queen | FPU SinJulia | FPU Mandel | CPU AES | CPU ZLib | FP64 Ray-Trace | CPU PhotoWorxx
| Performance rating | |
| Asus ZenBook Flip 14 UN5401QA-KN085W | |
| Dell Latitude 9430 2-in-1 | |
| Dell Latitude 9420 2-in-1 | |
| MSI Summit E14 Flip Evo A12MT | |
| LG Gram 14T90P | |
| Moyenne Intel Core i7-1265U | |
| Lenovo ThinkPad X1 Yoga G7 21CE002HGE | |
| AIDA64 / FP32 Ray-Trace | |
| Asus ZenBook Flip 14 UN5401QA-KN085W | |
| Dell Latitude 9430 2-in-1 | |
| Dell Latitude 9420 2-in-1 | |
| LG Gram 14T90P | |
| Moyenne Intel Core i7-1265U (2619 - 8178, n=10) | |
| MSI Summit E14 Flip Evo A12MT | |
| Lenovo ThinkPad X1 Yoga G7 21CE002HGE | |
| AIDA64 / FPU Julia | |
| Asus ZenBook Flip 14 UN5401QA-KN085W | |
| Dell Latitude 9430 2-in-1 | |
| Moyenne Intel Core i7-1265U (12909 - 41649, n=10) | |
| Dell Latitude 9420 2-in-1 | |
| LG Gram 14T90P | |
| MSI Summit E14 Flip Evo A12MT | |
| Lenovo ThinkPad X1 Yoga G7 21CE002HGE | |
| AIDA64 / CPU SHA3 | |
| Asus ZenBook Flip 14 UN5401QA-KN085W | |
| Dell Latitude 9430 2-in-1 | |
| Dell Latitude 9420 2-in-1 | |
| LG Gram 14T90P | |
| MSI Summit E14 Flip Evo A12MT | |
| Moyenne Intel Core i7-1265U (824 - 2183, n=10) | |
| Lenovo ThinkPad X1 Yoga G7 21CE002HGE | |
| AIDA64 / CPU Queen | |
| Asus ZenBook Flip 14 UN5401QA-KN085W | |
| MSI Summit E14 Flip Evo A12MT | |
| Dell Latitude 9430 2-in-1 | |
| Moyenne Intel Core i7-1265U (63615 - 67065, n=10) | |
| Lenovo ThinkPad X1 Yoga G7 21CE002HGE | |
| Dell Latitude 9420 2-in-1 | |
| LG Gram 14T90P | |
| AIDA64 / FPU SinJulia | |
| Asus ZenBook Flip 14 UN5401QA-KN085W | |
| MSI Summit E14 Flip Evo A12MT | |
| Lenovo ThinkPad X1 Yoga G7 21CE002HGE | |
| Dell Latitude 9430 2-in-1 | |
| Dell Latitude 9420 2-in-1 | |
| LG Gram 14T90P | |
| Moyenne Intel Core i7-1265U (3105 - 5135, n=10) | |
| AIDA64 / FPU Mandel | |
| Asus ZenBook Flip 14 UN5401QA-KN085W | |
| Dell Latitude 9430 2-in-1 | |
| Dell Latitude 9420 2-in-1 | |
| LG Gram 14T90P | |
| Moyenne Intel Core i7-1265U (6967 - 20804, n=10) | |
| MSI Summit E14 Flip Evo A12MT | |
| Lenovo ThinkPad X1 Yoga G7 21CE002HGE | |
| AIDA64 / CPU AES | |
| Asus ZenBook Flip 14 UN5401QA-KN085W | |
| Dell Latitude 9420 2-in-1 | |
| LG Gram 14T90P | |
| Dell Latitude 9430 2-in-1 | |
| MSI Summit E14 Flip Evo A12MT | |
| Moyenne Intel Core i7-1265U (19489 - 42966, n=10) | |
| Lenovo ThinkPad X1 Yoga G7 21CE002HGE | |
| AIDA64 / CPU ZLib | |
| Asus ZenBook Flip 14 UN5401QA-KN085W | |
| Dell Latitude 9430 2-in-1 | |
| MSI Summit E14 Flip Evo A12MT | |
| Lenovo ThinkPad X1 Yoga G7 21CE002HGE | |
| Moyenne Intel Core i7-1265U (314 - 632, n=10) | |
| Dell Latitude 9420 2-in-1 | |
| LG Gram 14T90P | |
| AIDA64 / FP64 Ray-Trace | |
| Asus ZenBook Flip 14 UN5401QA-KN085W | |
| Dell Latitude 9430 2-in-1 | |
| Dell Latitude 9420 2-in-1 | |
| LG Gram 14T90P | |
| Moyenne Intel Core i7-1265U (1473 - 4376, n=10) | |
| MSI Summit E14 Flip Evo A12MT | |
| Lenovo ThinkPad X1 Yoga G7 21CE002HGE | |
| AIDA64 / CPU PhotoWorxx | |
| Dell Latitude 9430 2-in-1 | |
| Dell Latitude 9420 2-in-1 | |
| LG Gram 14T90P | |
| MSI Summit E14 Flip Evo A12MT | |
| Moyenne Intel Core i7-1265U (20213 - 47031, n=10) | |
| Lenovo ThinkPad X1 Yoga G7 21CE002HGE | |
| Asus ZenBook Flip 14 UN5401QA-KN085W | |
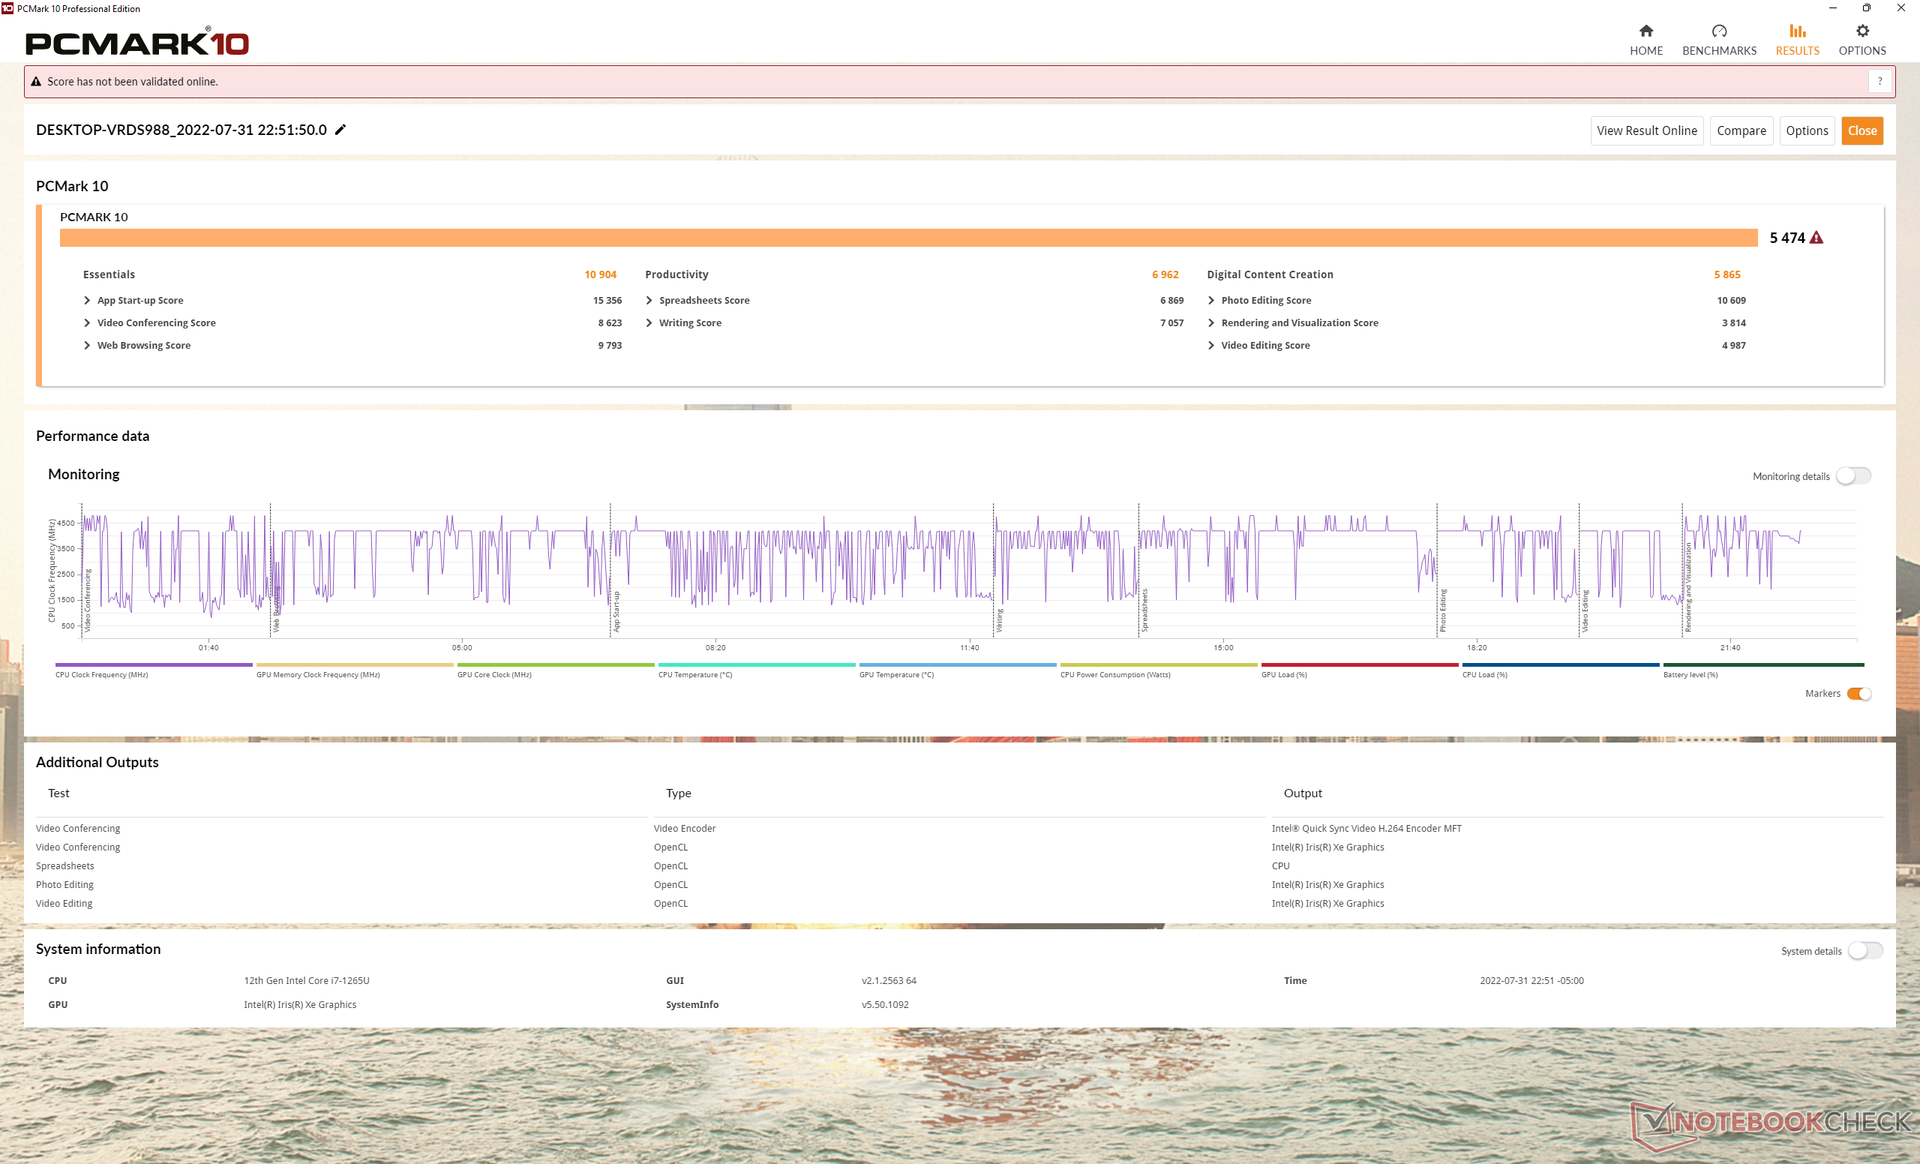
Performance du système
Les scores PCMark 10 sont systématiquement supérieurs à ceux que nous avons enregistrés sur l'ancien modèle Latitude 9420 2-en-1, mais de quelques points de pourcentage seulement. Les charges de bureau typiques comme la navigation web, le streaming vidéo ou l'édition légère ne vont pas sembler beaucoup plus rapides par rapport à la plupart des ordinateurs portables Core i7-1165G7 de 11e génération.
CrossMark: Overall | Productivity | Creativity | Responsiveness
| PCMark 10 / Score | |
| Asus ZenBook Flip 14 UN5401QA-KN085W | |
| Lenovo ThinkPad X1 Yoga G7 21CE002HGE | |
| Dell Latitude 9430 2-in-1 | |
| MSI Summit E14 Flip Evo A12MT | |
| Moyenne Intel Core i7-1265U, Intel Iris Xe Graphics G7 96EUs (4753 - 5766, n=7) | |
| Dell Latitude 9420 2-in-1 | |
| LG Gram 14T90P | |
| PCMark 10 / Essentials | |
| Lenovo ThinkPad X1 Yoga G7 21CE002HGE | |
| Dell Latitude 9430 2-in-1 | |
| MSI Summit E14 Flip Evo A12MT | |
| Moyenne Intel Core i7-1265U, Intel Iris Xe Graphics G7 96EUs (9278 - 11418, n=7) | |
| Dell Latitude 9420 2-in-1 | |
| Asus ZenBook Flip 14 UN5401QA-KN085W | |
| LG Gram 14T90P | |
| PCMark 10 / Productivity | |
| Asus ZenBook Flip 14 UN5401QA-KN085W | |
| Dell Latitude 9430 2-in-1 | |
| Dell Latitude 9420 2-in-1 | |
| MSI Summit E14 Flip Evo A12MT | |
| Lenovo ThinkPad X1 Yoga G7 21CE002HGE | |
| Moyenne Intel Core i7-1265U, Intel Iris Xe Graphics G7 96EUs (5828 - 7311, n=7) | |
| LG Gram 14T90P | |
| PCMark 10 / Digital Content Creation | |
| Lenovo ThinkPad X1 Yoga G7 21CE002HGE | |
| Asus ZenBook Flip 14 UN5401QA-KN085W | |
| Dell Latitude 9430 2-in-1 | |
| MSI Summit E14 Flip Evo A12MT | |
| Moyenne Intel Core i7-1265U, Intel Iris Xe Graphics G7 96EUs (5127 - 6330, n=7) | |
| Dell Latitude 9420 2-in-1 | |
| LG Gram 14T90P | |
| CrossMark / Overall | |
| MSI Summit E14 Flip Evo A12MT | |
| Lenovo ThinkPad X1 Yoga G7 21CE002HGE | |
| Dell Latitude 9430 2-in-1 | |
| Moyenne Intel Core i7-1265U, Intel Iris Xe Graphics G7 96EUs (1301 - 1615, n=7) | |
| LG Gram 14T90P | |
| CrossMark / Productivity | |
| MSI Summit E14 Flip Evo A12MT | |
| Lenovo ThinkPad X1 Yoga G7 21CE002HGE | |
| Dell Latitude 9430 2-in-1 | |
| Moyenne Intel Core i7-1265U, Intel Iris Xe Graphics G7 96EUs (1230 - 1586, n=7) | |
| LG Gram 14T90P | |
| CrossMark / Creativity | |
| MSI Summit E14 Flip Evo A12MT | |
| Lenovo ThinkPad X1 Yoga G7 21CE002HGE | |
| Dell Latitude 9430 2-in-1 | |
| Moyenne Intel Core i7-1265U, Intel Iris Xe Graphics G7 96EUs (1413 - 1706, n=7) | |
| LG Gram 14T90P | |
| CrossMark / Responsiveness | |
| MSI Summit E14 Flip Evo A12MT | |
| Lenovo ThinkPad X1 Yoga G7 21CE002HGE | |
| Dell Latitude 9430 2-in-1 | |
| Moyenne Intel Core i7-1265U, Intel Iris Xe Graphics G7 96EUs (1193 - 1521, n=7) | |
| LG Gram 14T90P | |
| PCMark 10 Score | 5474 points | |
Aide | ||
| AIDA64 / Memory Copy | |
| Dell Latitude 9430 2-in-1 | |
| MSI Summit E14 Flip Evo A12MT | |
| Dell Latitude 9420 2-in-1 | |
| LG Gram 14T90P | |
| Lenovo ThinkPad X1 Yoga G7 21CE002HGE | |
| Moyenne Intel Core i7-1265U (40212 - 72204, n=10) | |
| Asus ZenBook Flip 14 UN5401QA-KN085W | |
| AIDA64 / Memory Read | |
| Lenovo ThinkPad X1 Yoga G7 21CE002HGE | |
| MSI Summit E14 Flip Evo A12MT | |
| Dell Latitude 9420 2-in-1 | |
| LG Gram 14T90P | |
| Moyenne Intel Core i7-1265U (41808 - 69493, n=10) | |
| Dell Latitude 9430 2-in-1 | |
| Asus ZenBook Flip 14 UN5401QA-KN085W | |
| AIDA64 / Memory Write | |
| LG Gram 14T90P | |
| Dell Latitude 9420 2-in-1 | |
| Dell Latitude 9430 2-in-1 | |
| Lenovo ThinkPad X1 Yoga G7 21CE002HGE | |
| Moyenne Intel Core i7-1265U (41382 - 76027, n=10) | |
| MSI Summit E14 Flip Evo A12MT | |
| Asus ZenBook Flip 14 UN5401QA-KN085W | |
| AIDA64 / Memory Latency | |
| Asus ZenBook Flip 14 UN5401QA-KN085W | |
| Dell Latitude 9430 2-in-1 | |
| Moyenne Intel Core i7-1265U (74.6 - 112.4, n=10) | |
| Dell Latitude 9420 2-in-1 | |
| LG Gram 14T90P | |
| Lenovo ThinkPad X1 Yoga G7 21CE002HGE | |
| MSI Summit E14 Flip Evo A12MT | |
* ... Moindre est la valeur, meilleures sont les performances
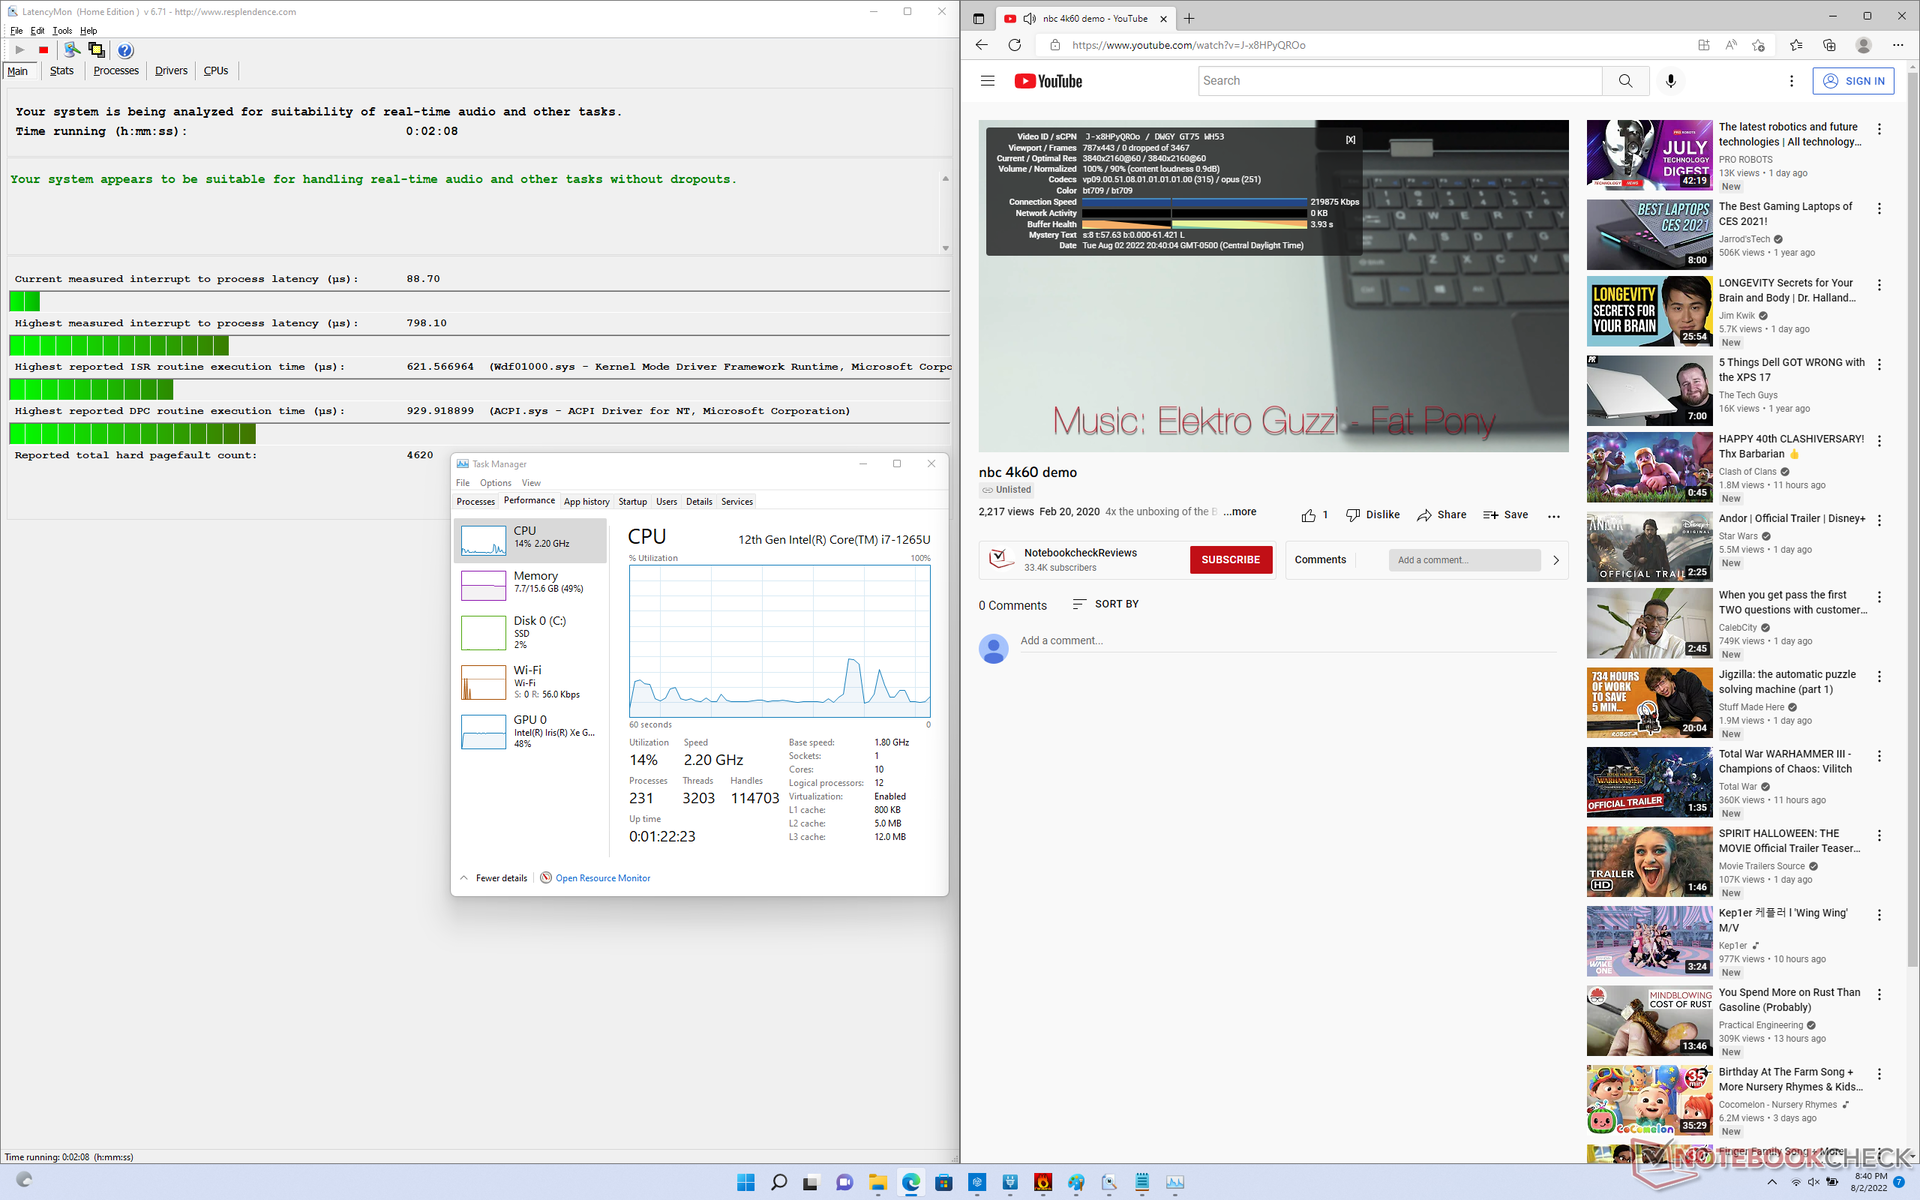
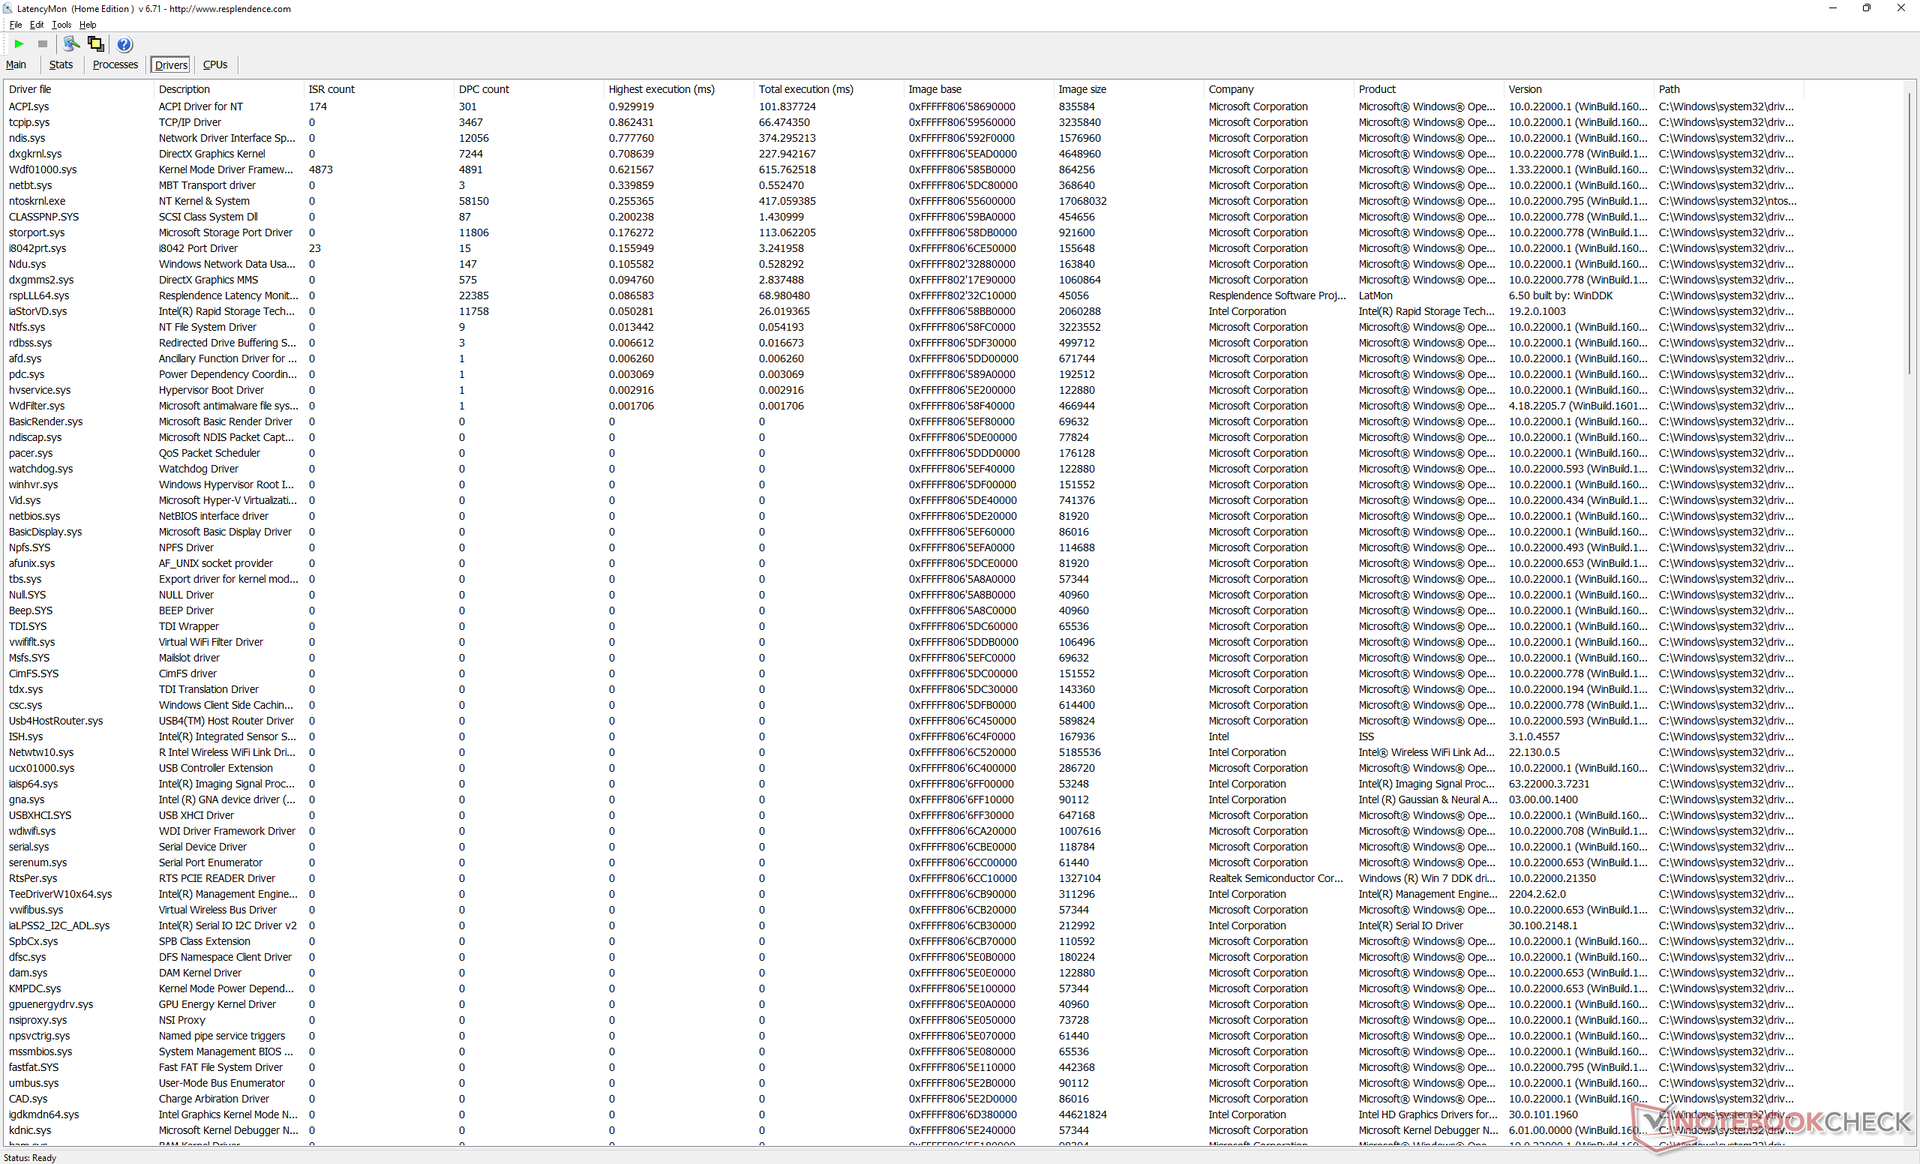
Latence DPC
LatencyMon ne révèle aucun problème majeur de CPD lors de l'ouverture de plusieurs onglets de notre page d'accueil ou lors de l'exécution du stress Prime95. la lecture de vidéos 4K à 60 FPS est également parfaite, sans aucune perte d'images.
| DPC Latencies / LatencyMon - interrupt to process latency (max), Web, Youtube, Prime95 | |
| MSI Summit E14 Flip Evo A12MT | |
| Lenovo ThinkPad X1 Yoga G7 21CE002HGE | |
| LG Gram 14T90P | |
| Asus ZenBook Flip 14 UN5401QA-KN085W | |
| Dell Latitude 9430 2-in-1 | |
| Dell Latitude 9420 2-in-1 | |
* ... Moindre est la valeur, meilleures sont les performances
Périphériques de stockage
Notre unité de test utilise un 512 Go Toshiba Kioxia NVMe SSD avec auto-cryptage Opal en option. Les taux de transfert sont bons et relativement stables, mais les taux d'écriture sont beaucoup plus lents que sur le Samsung PM981a que l'on trouve couramment sur les ultrabooks phares.
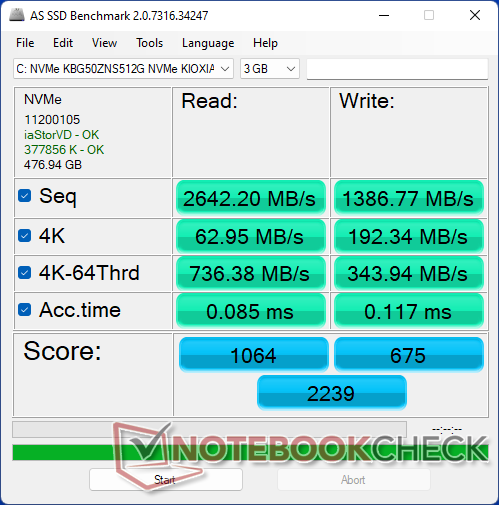
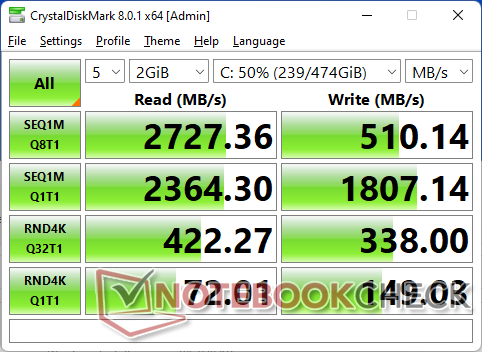

* ... Moindre est la valeur, meilleures sont les performances
Disk Throttling: DiskSpd Read Loop, Queue Depth 8
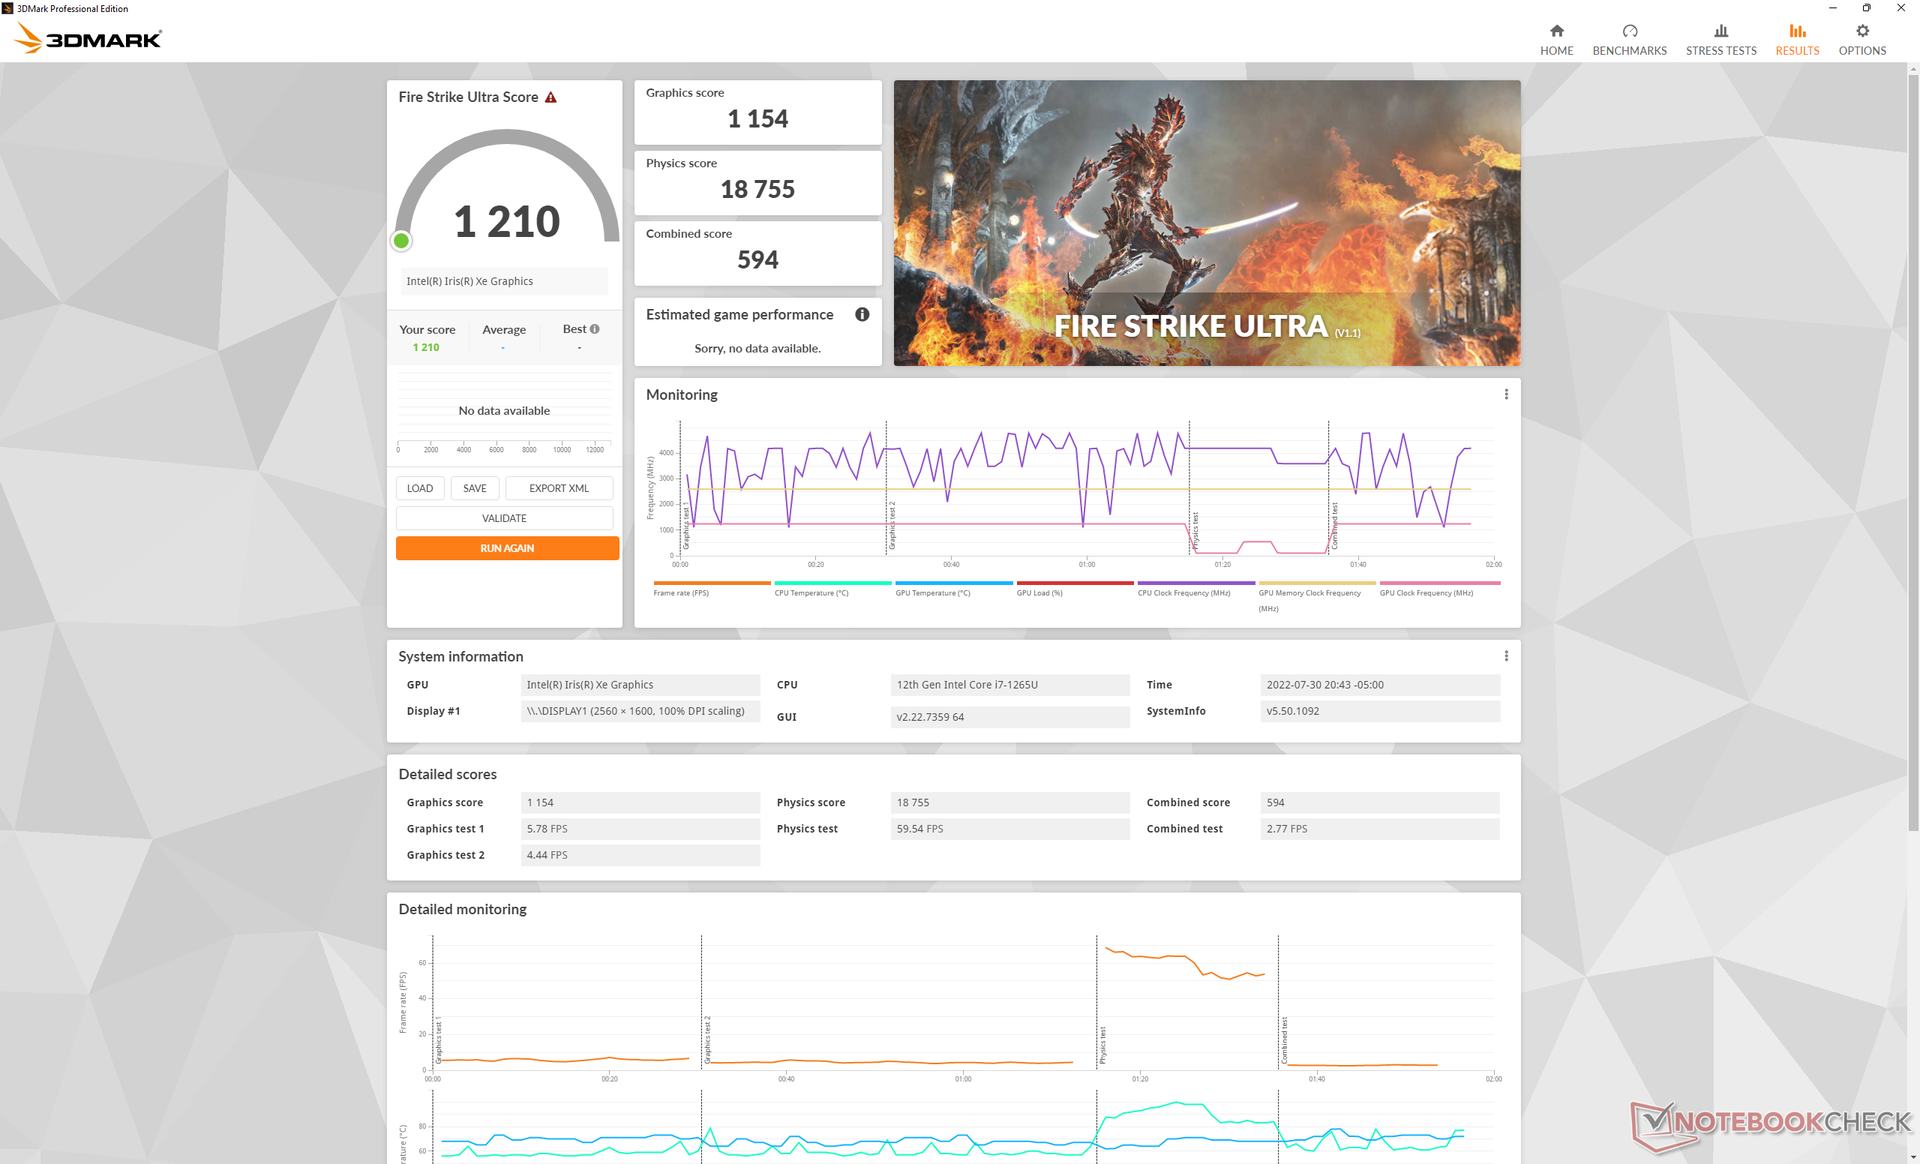
Performances du GPU
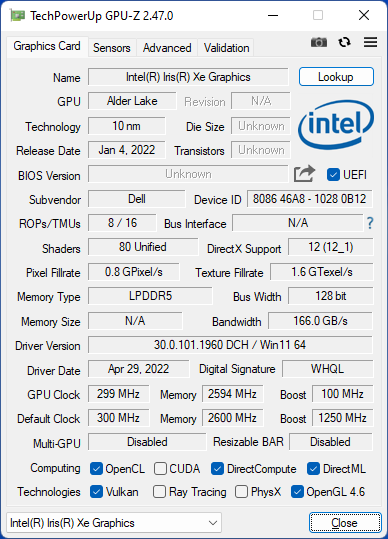
Les performances graphiques sont à peu près ce qu'elles devraient être si on les compare à celles d'autres ordinateurs portables équipés du même système intégré Iris Xe 96 EU intégrés même si le Latitude est équipé d'un processeur Intel de 12e génération plus récent. Ainsi, les utilisateurs ne doivent s'attendre qu'à des améliorations marginales des performances du GPU, au mieux d'une année sur l'autre. Les cartes concurrentes Radeon 680M ou GeForce MX450/550 sont capables d'offrir des performances nettement supérieures à celles de l'Iris Xe 96 EUs.
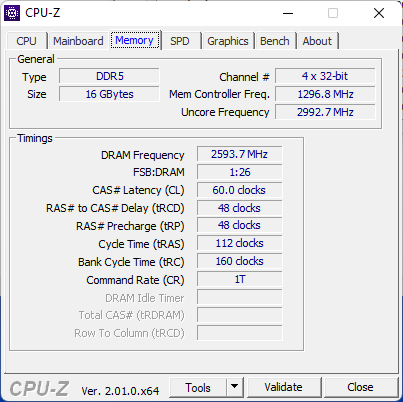
Le modèle utilise de la RAM LPDDR5 plus rapide que la LPDDR4 sur le Latitude 9420 2-in-1, mais l'augmentation des performances est mineure.
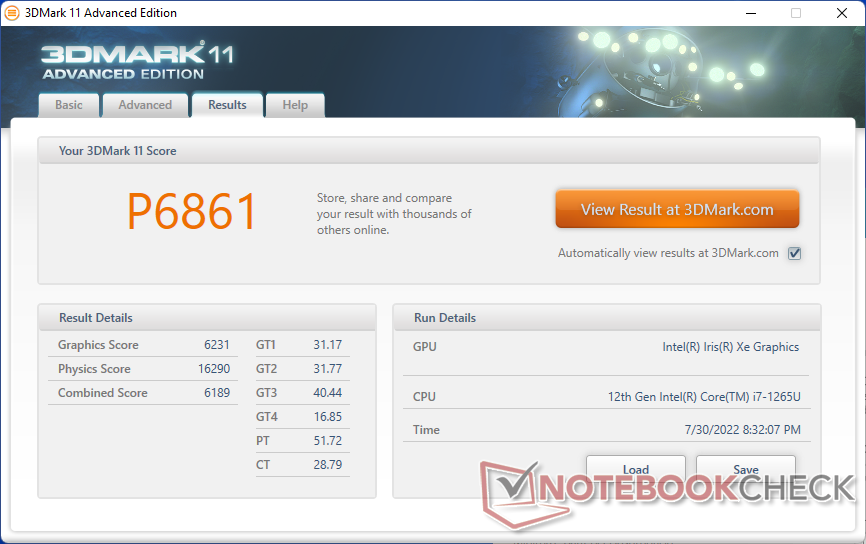
| 3DMark 11 Performance | 6861 points | |
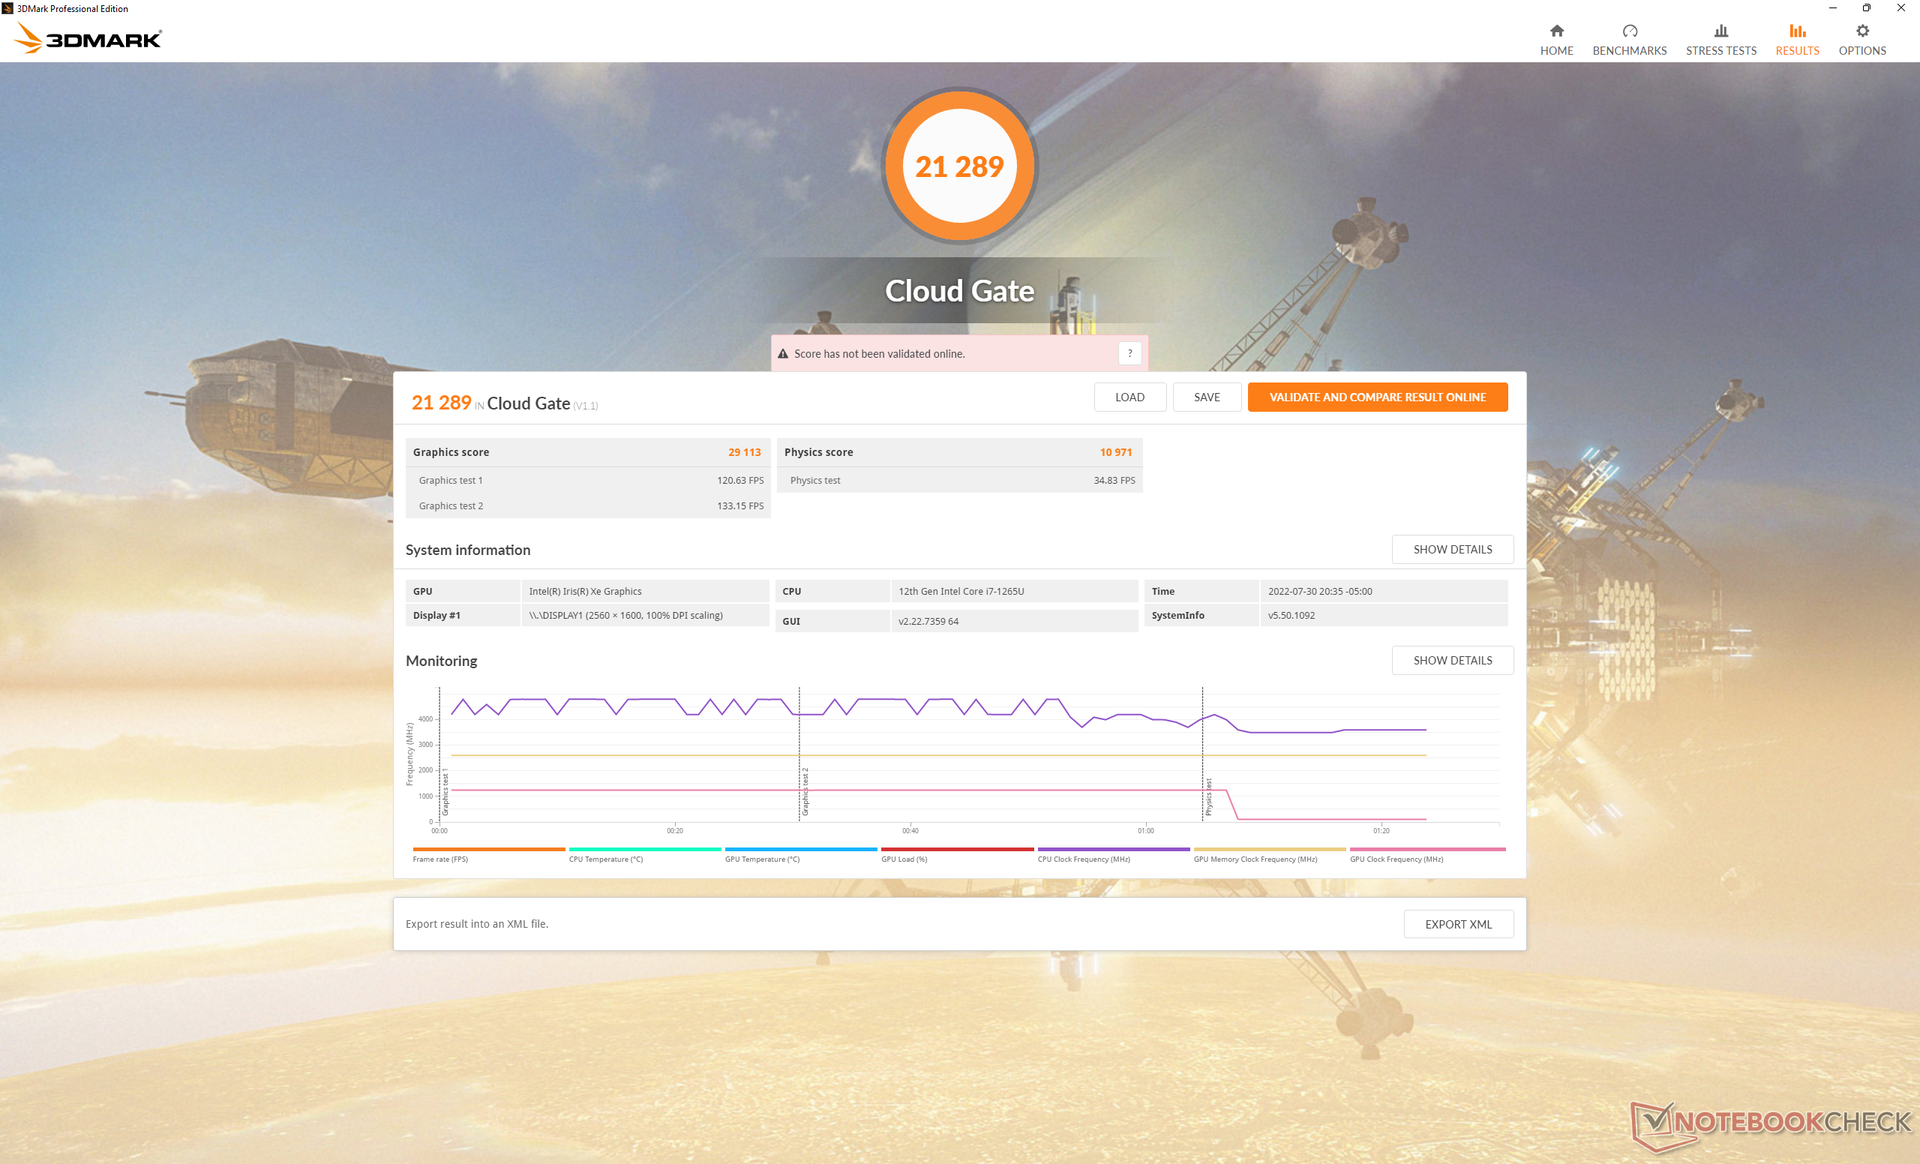
| 3DMark Cloud Gate Standard Score | 21289 points | |
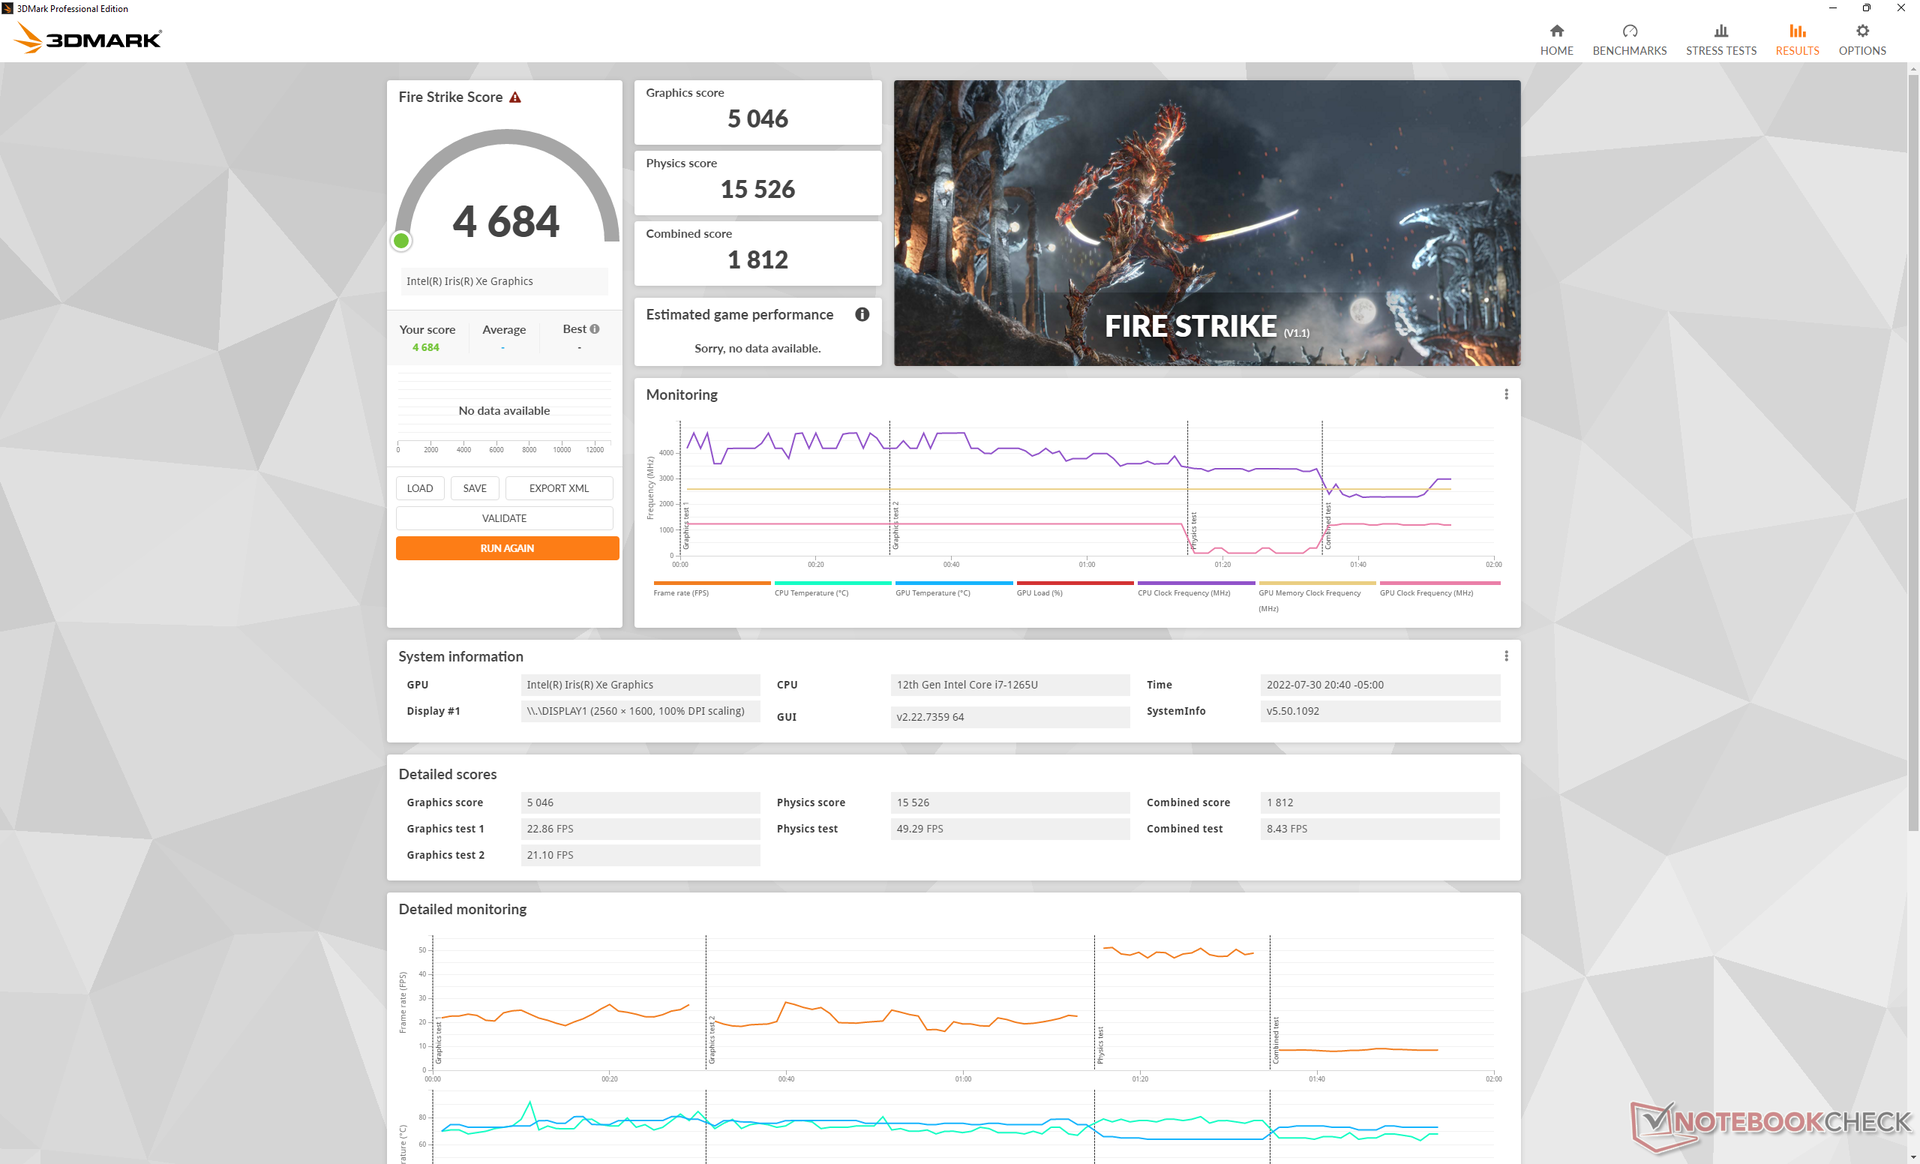
| 3DMark Fire Strike Score | 4684 points | |
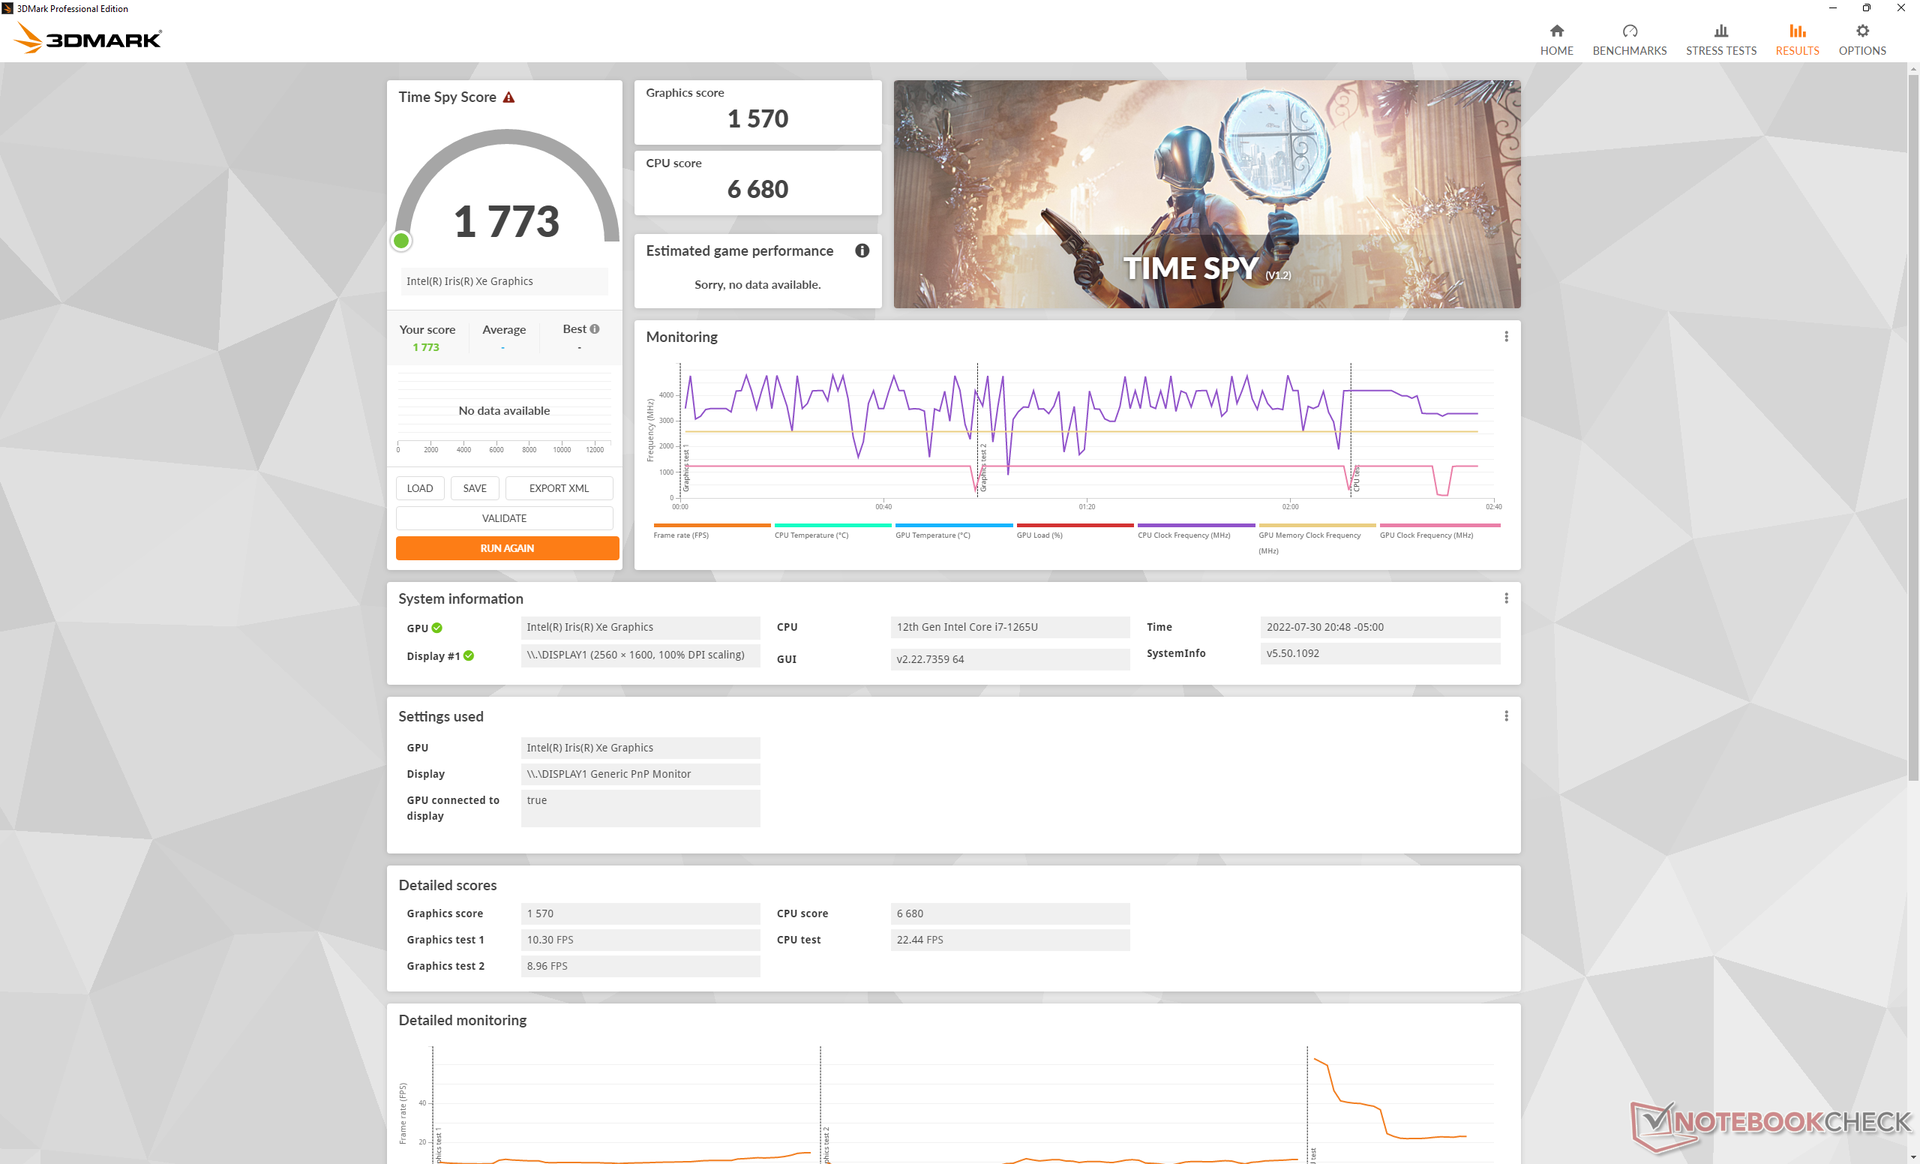
| 3DMark Time Spy Score | 1773 points | |
Aide | ||
| Cyberpunk 2077 1.6 | |
| 1920x1080 Low Preset | |
| MSI Summit E14 Flip Evo A12MT | |
| Dell Latitude 9430 2-in-1 | |
| Moyenne Intel Iris Xe Graphics G7 96EUs (13 - 25.9, n=42) | |
| 1920x1080 Medium Preset | |
| MSI Summit E14 Flip Evo A12MT | |
| Dell Latitude 9430 2-in-1 | |
| Moyenne Intel Iris Xe Graphics G7 96EUs (10.8 - 21.7, n=37) | |
| 1920x1080 High Preset | |
| MSI Summit E14 Flip Evo A12MT | |
| Dell Latitude 9430 2-in-1 | |
| Moyenne Intel Iris Xe Graphics G7 96EUs (9.8 - 16.9, n=34) | |
| 1920x1080 Ultra Preset | |
| MSI Summit E14 Flip Evo A12MT | |
| Dell Latitude 9430 2-in-1 | |
| Moyenne Intel Iris Xe Graphics G7 96EUs (7.4 - 16.8, n=32) | |
Witcher 3 FPS Chart
| Bas | Moyen | Élevé | Ultra | |
|---|---|---|---|---|
| GTA V (2015) | 111.6 | 93.9 | 24.8 | 10.7 |
| The Witcher 3 (2015) | 88 | 55.8 | 29.9 | 14.4 |
| Dota 2 Reborn (2015) | 114 | 87.9 | 67.6 | 57.4 |
| Final Fantasy XV Benchmark (2018) | 43.3 | 24.6 | 17 | |
| X-Plane 11.11 (2018) | 37.9 | 41.2 | 36.6 | |
| Strange Brigade (2018) | 89.6 | 41.7 | 32.5 | 26.4 |
| Cyberpunk 2077 1.6 (2022) | 22.2 | 18.8 | 14.1 | 11.3 |
Émissions
Bruit du système
Le système est silencieux ou presque dans la plupart des conditions de navigation sur Internet ou de streaming. Cependant, le ventilateur commence à monter en régime plus tôt que sur le Latitude 9420 2-in-1. Par exemple, lors de l'exécution de la première scène de benchmark de 90 secondes de 3DMark 06, le ventilateur du Latitude 9420 2-in-1 est resté silencieux pendant toute la durée de l'exécution. En revanche, le ventilateur du modèle Latitude 9430 2-in-1 est audible à 35 dB(A), alors que le bruit de fond est de 23,7 dB(A)
L'exécution de charges exigeantes comme des jeux en mode Ultra Performance se traduit par un bruit de ventilateur plus fort que sur leThinkPad X1 Yoga G7 ou LG Gram 14T90P.
Degré de la nuisance sonore
| Au repos |
| 23.7 / 23.7 / 23.7 dB(A) |
| Fortement sollicité |
| 35.1 / 43 dB(A) |
 | ||
30 dB silencieux 40 dB(A) audible 50 dB(A) bruyant |
||
min: | ||
| Dell Latitude 9430 2-in-1 Iris Xe G7 96EUs, i7-1265U | Dell Latitude 9420 2-in-1 Iris Xe G7 96EUs, i7-1185G7, WDC PC SN530 SDBPNPZ-512G | MSI Summit E14 Flip Evo A12MT Iris Xe G7 96EUs, i7-1260P, Samsung PM9A1 MZVL21T0HCLR | LG Gram 14T90P Iris Xe G7 80EUs, i5-1135G7, Samsung SSD PM981a MZVLB512HBJQ | Lenovo ThinkPad X1 Yoga G7 21CE002HGE Iris Xe G7 96EUs, i7-1270P, Samsung PM9A1 MZVL2512HCJQ | Asus ZenBook Flip 14 UN5401QA-KN085W Vega 8, R7 5800H, Intel SSD 600p SSDPEKKW512G7 | |
|---|---|---|---|---|---|---|
| Noise | 1% | 4% | 4% | 4% | -10% | |
| arrêt / environnement * (dB) | 23.7 | 25.4 -7% | 23.3 2% | 25.4 -7% | 22.7 4% | 26 -10% |
| Idle Minimum * (dB) | 23.7 | 25.4 -7% | 23.3 2% | 25.5 -8% | 22.7 4% | 26 -10% |
| Idle Average * (dB) | 23.7 | 25.4 -7% | 23.3 2% | 25.5 -8% | 22.7 4% | 26 -10% |
| Idle Maximum * (dB) | 23.7 | 25.4 -7% | 23.3 2% | 25.5 -8% | 27.1 -14% | 27.3 -15% |
| Load Average * (dB) | 35.1 | 25.4 28% | 24 32% | 28.3 19% | 34.5 2% | 39.8 -13% |
| Witcher 3 ultra * (dB) | 43.3 | 41.3 5% | 35.6 18% | 35 19% | 34.5 20% | |
| Load Maximum * (dB) | 43 | 41.3 4% | 55.8 -30% | 35 19% | 38.7 10% | 42.4 1% |
* ... Moindre est la valeur, meilleures sont les performances
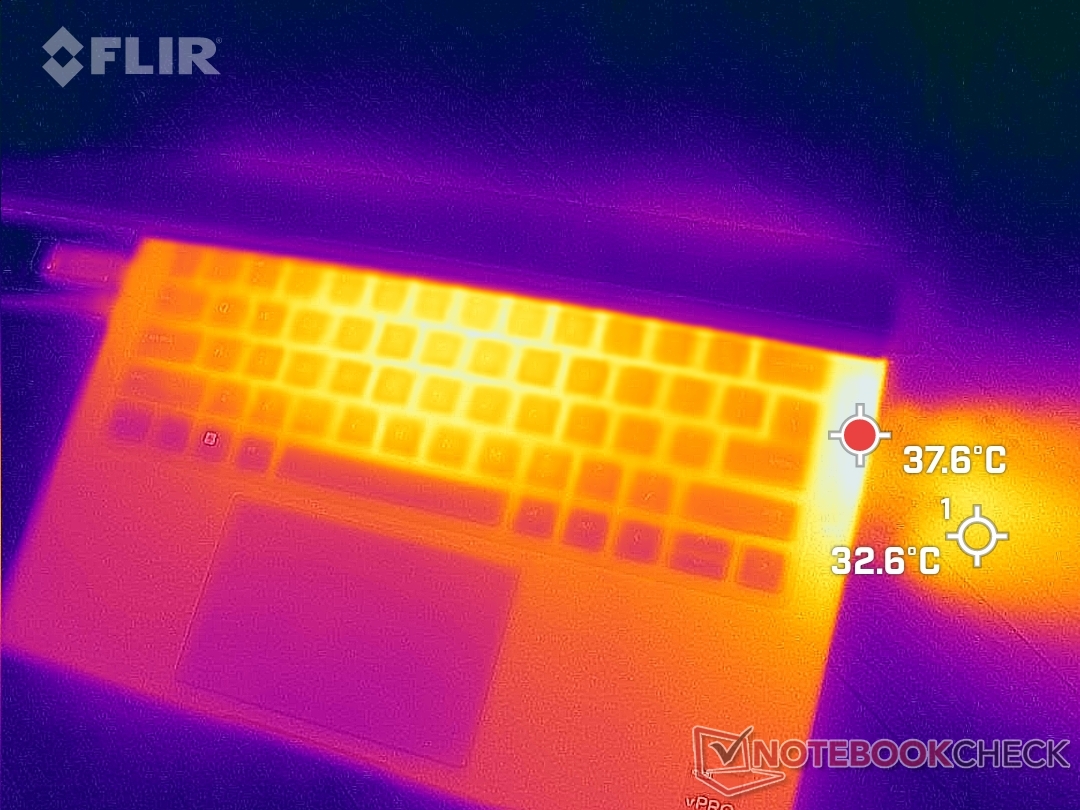
Température
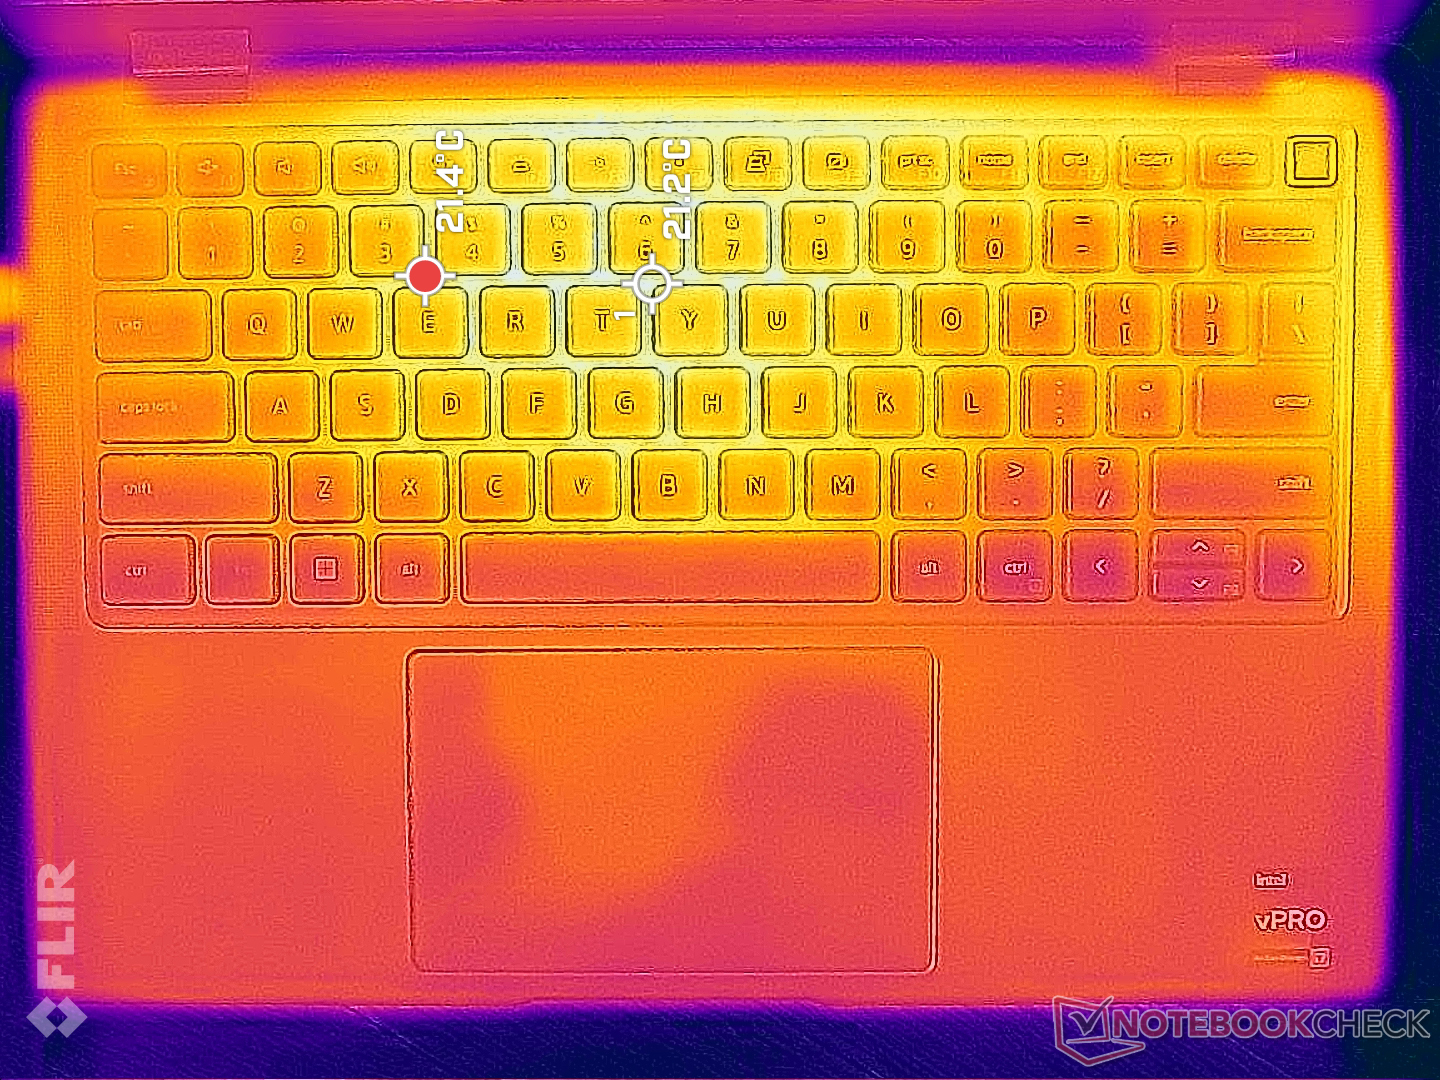
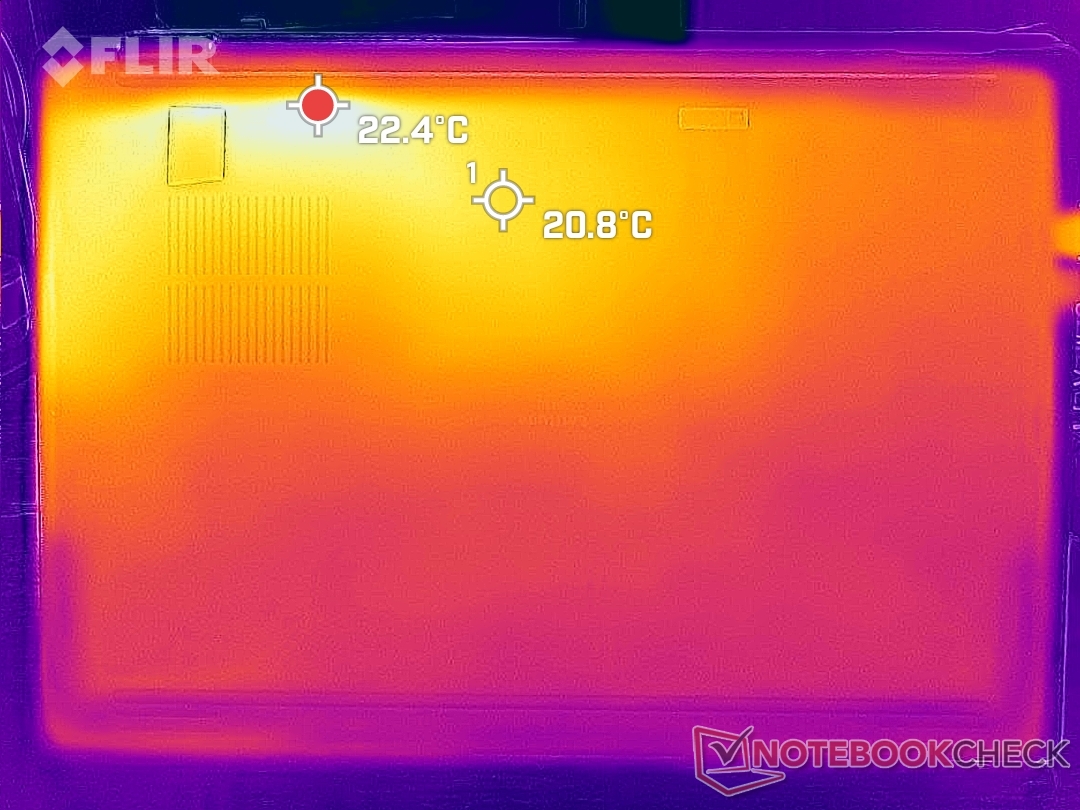
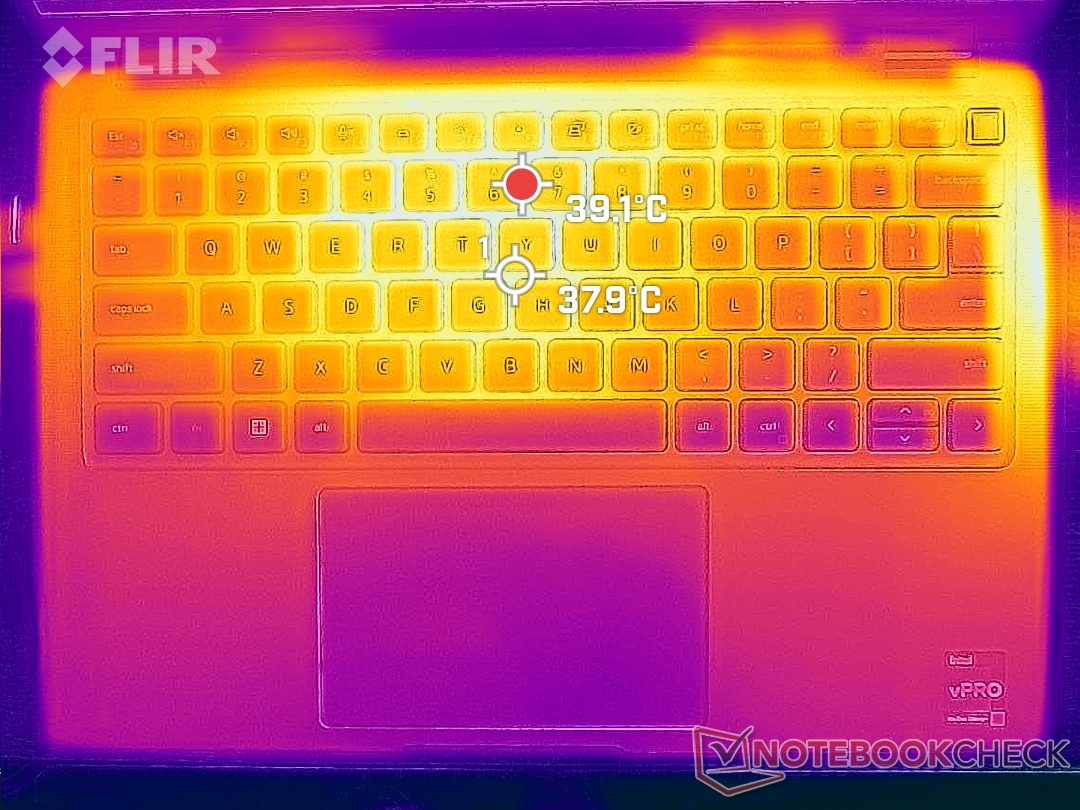
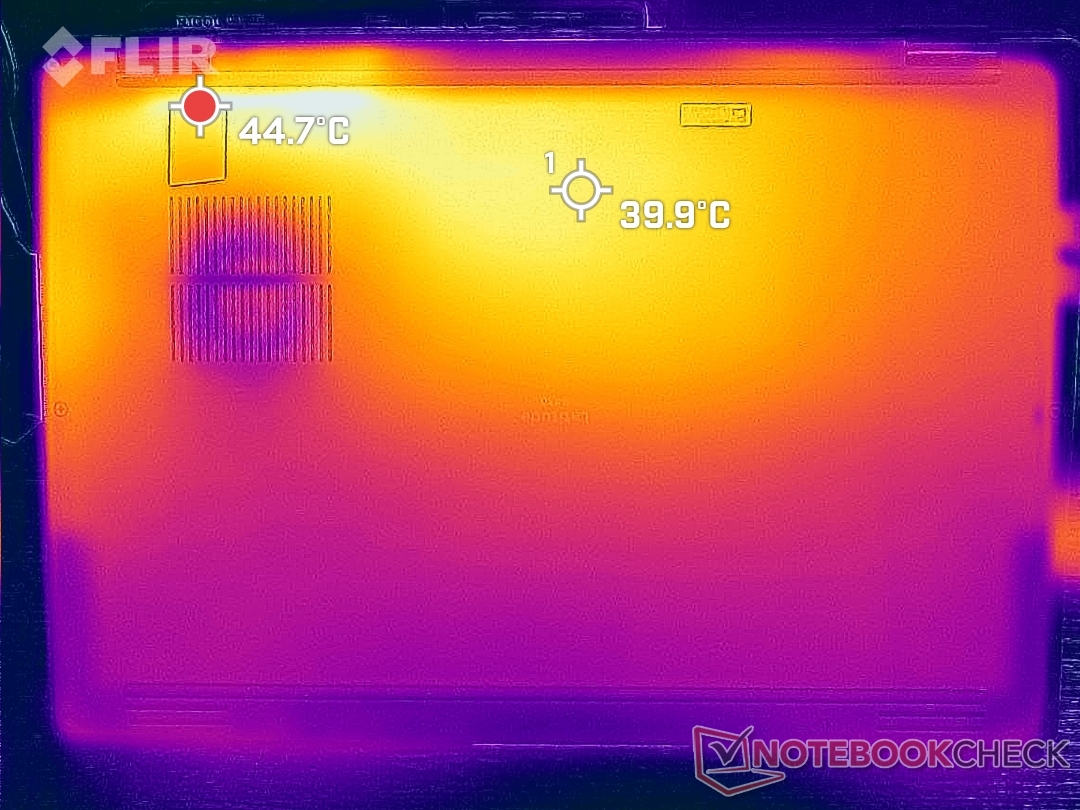
Les températures de surface sont les plus chaudes près du centre du clavier et de la moitié arrière de l'ordinateur portable où les points chauds peuvent atteindre 40 C sur le dessus et le dessous. Les résultats sont plus froids que ce que nous avons observé sur le Latitude 9420 2-in-1 et à peu près les mêmes que sur le MSI Summit E14 Flip sous des charges similaires. La chaleur s'échappe le long du bord droit et de l'arrière du châssis.
(+) La température maximale du côté supérieur est de 39.2 °C / 103 F, par rapport à la moyenne de 35.4 °C / 96 F, allant de 19.6 à 60 °C pour la classe Convertible.
(±) Le fond chauffe jusqu'à un maximum de 44.8 °C / 113 F, contre une moyenne de 36.9 °C / 98 F
(+) En utilisation inactive, la température moyenne du côté supérieur est de 19.7 °C / 67 F, par rapport à la moyenne du dispositif de 30.3 °C / 87 F.
(+) Les repose-poignets et le pavé tactile sont plus froids que la température de la peau avec un maximum de 28.4 °C / 83.1 F et sont donc froids au toucher.
(±) La température moyenne de la zone de l'appui-paume de dispositifs similaires était de 28 °C / 82.4 F (-0.4 °C / #-0.7 F).
| Dell Latitude 9430 2-in-1 Intel Core i7-1265U, Intel Iris Xe Graphics G7 96EUs | Dell Latitude 9420 2-in-1 Intel Core i7-1185G7, Intel Iris Xe Graphics G7 96EUs | MSI Summit E14 Flip Evo A12MT Intel Core i7-1260P, Intel Iris Xe Graphics G7 96EUs | LG Gram 14T90P Intel Core i5-1135G7, Intel Iris Xe Graphics G7 80EUs | Lenovo ThinkPad X1 Yoga G7 21CE002HGE Intel Core i7-1270P, Intel Iris Xe Graphics G7 96EUs | Asus ZenBook Flip 14 UN5401QA-KN085W AMD Ryzen 7 5800H, AMD Radeon RX Vega 8 (Ryzen 4000/5000) | |
|---|---|---|---|---|---|---|
| Heat | -21% | -1% | -5% | -15% | -35% | |
| Maximum Upper Side * (°C) | 39.2 | 43.4 -11% | 44.2 -13% | 41.6 -6% | 43.3 -10% | 42.7 -9% |
| Maximum Bottom * (°C) | 44.8 | 48 -7% | 45.8 -2% | 46.2 -3% | 45.1 -1% | 53.1 -19% |
| Idle Upper Side * (°C) | 21.4 | 29.8 -39% | 19.6 8% | 22.6 -6% | 26.5 -24% | 32.9 -54% |
| Idle Bottom * (°C) | 22.4 | 28 -25% | 22 2% | 23.2 -4% | 27.6 -23% | 35.2 -57% |
* ... Moindre est la valeur, meilleures sont les performances
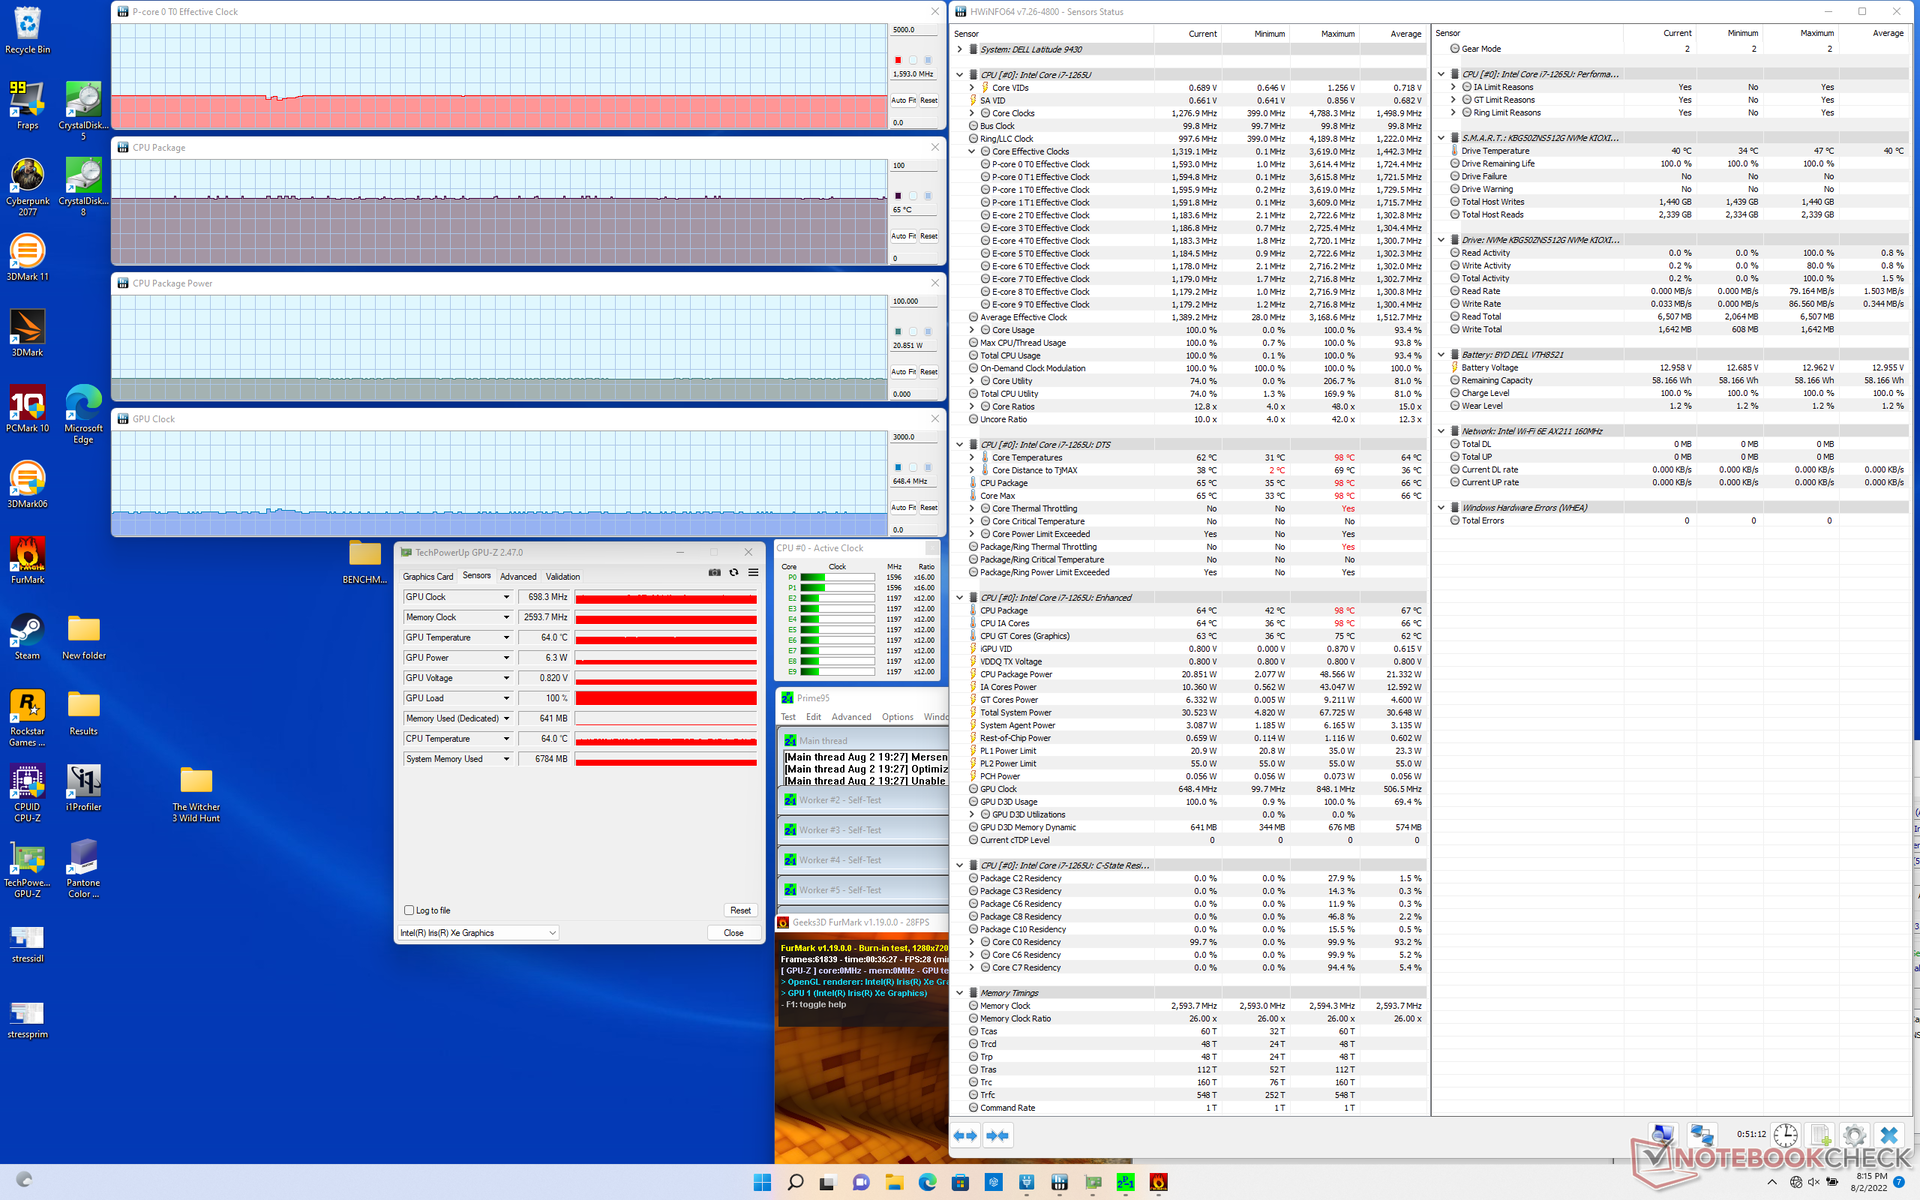
Test de stress
Les fréquences d'horloge, la température du cœur et la consommation d'énergie de la carte atteignaient 3,6 GHz, 98 C et 48 W, respectivement, pendant seulement quelques secondes lors de l'exécution de Prime95. Les fréquences d'horloge diminuaient ensuite régulièrement avant de se stabiliser à 2,4 GHz afin de maintenir une consommation électrique de la carte et une température du cœur plus raisonnables de 24 W et 74 C, respectivement. Nous apprécions les performances régulières et plus prévisibles cette fois-ci, alors que les fréquences d'horloge et la température sur le Latitude 9420 2-in-1 fluctuaient plus sauvagement dans des conditions similaires.
Les fréquences d'horloge et la température du GPU en fonctionnement Witcher 3 se stabiliseraient à 1097 MHz et 66 C, respectivement, contre ~1200 MHz et 73 C sur le Latitude 9420 2-in-1 ou 1197 MHz et 85 C sur le MSI Summit E14 Flip.
Le fonctionnement sur batterie limite les performances. Un test 3DMark 11 sur batterie donnerait des scores de physique et de graphisme de 9711 et 5679 points, respectivement, contre 16290 et 6231 points sur le secteur.
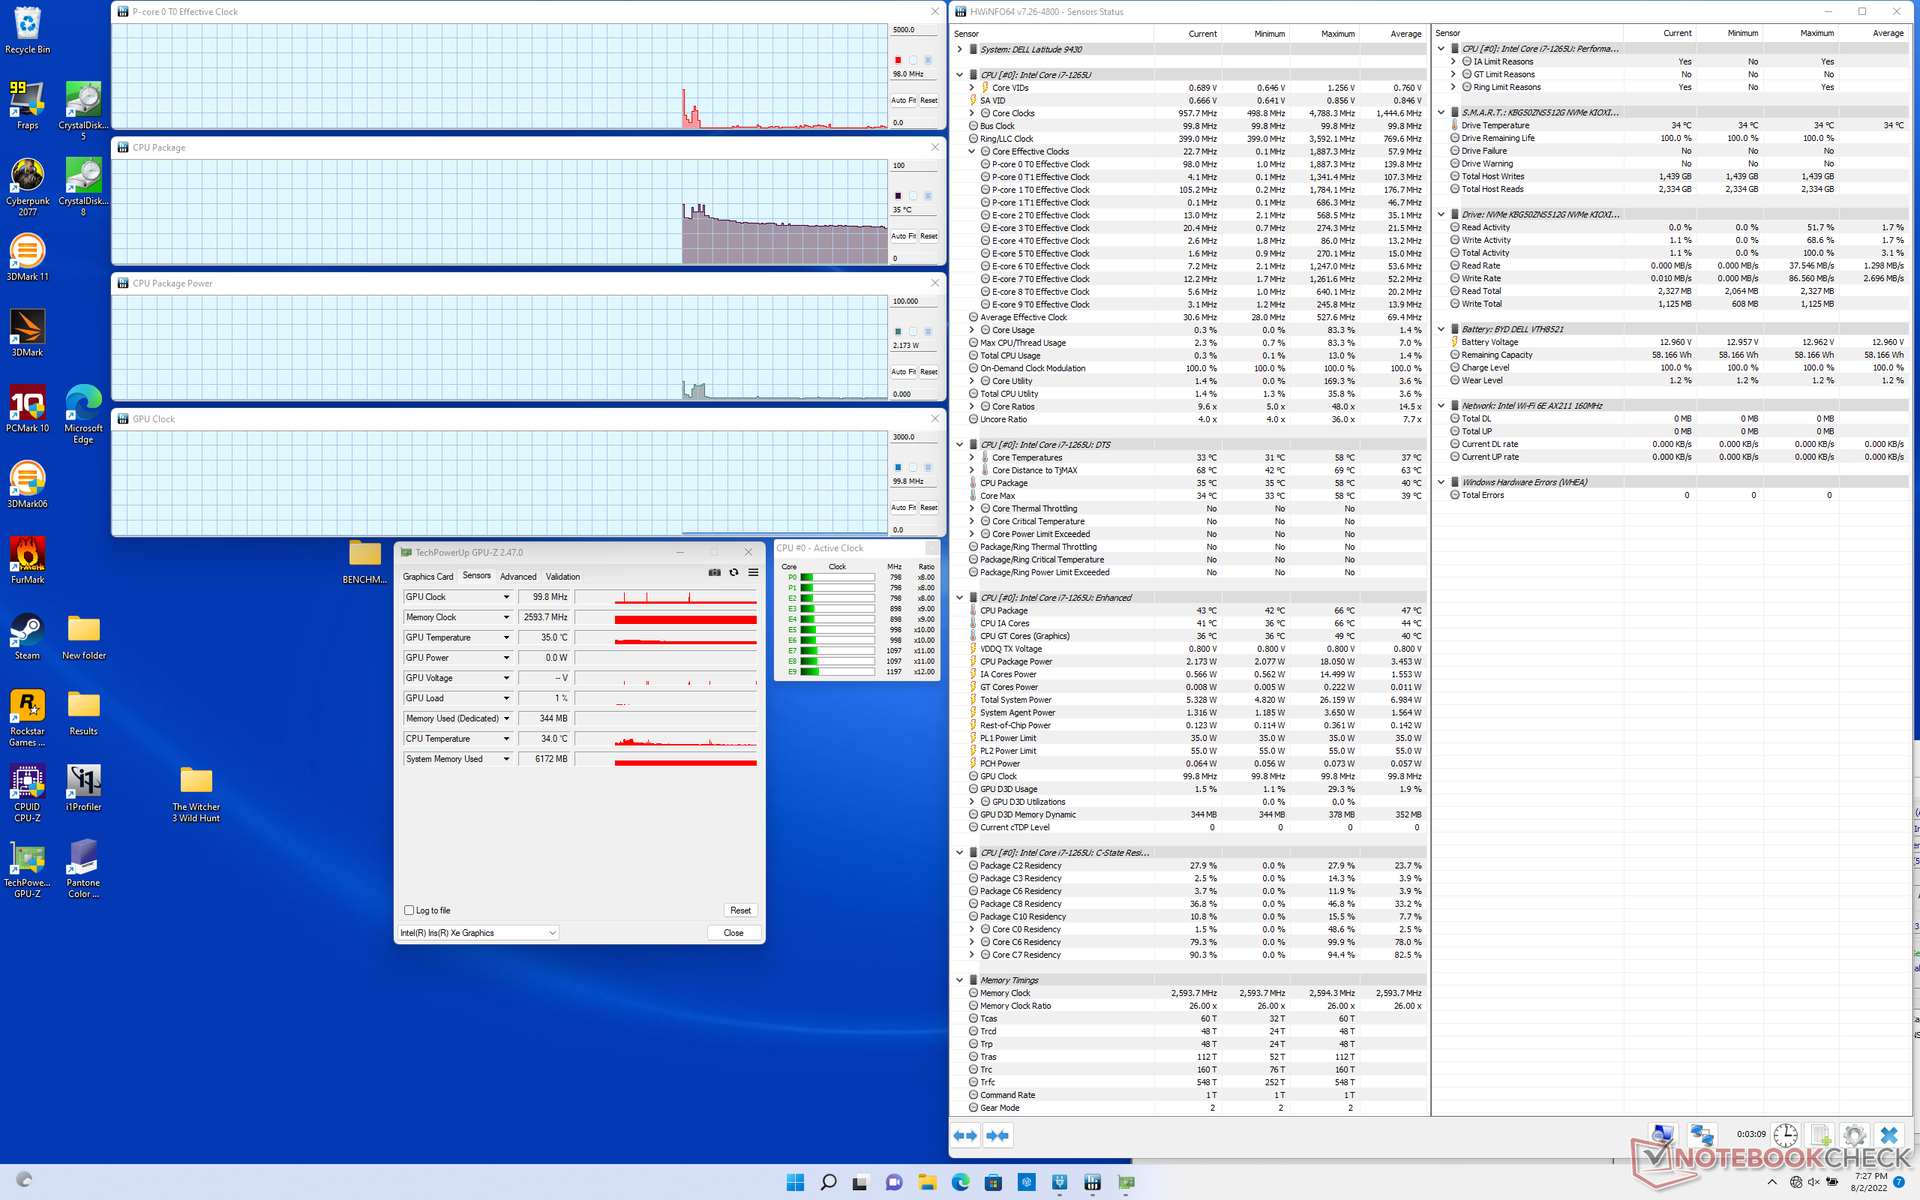
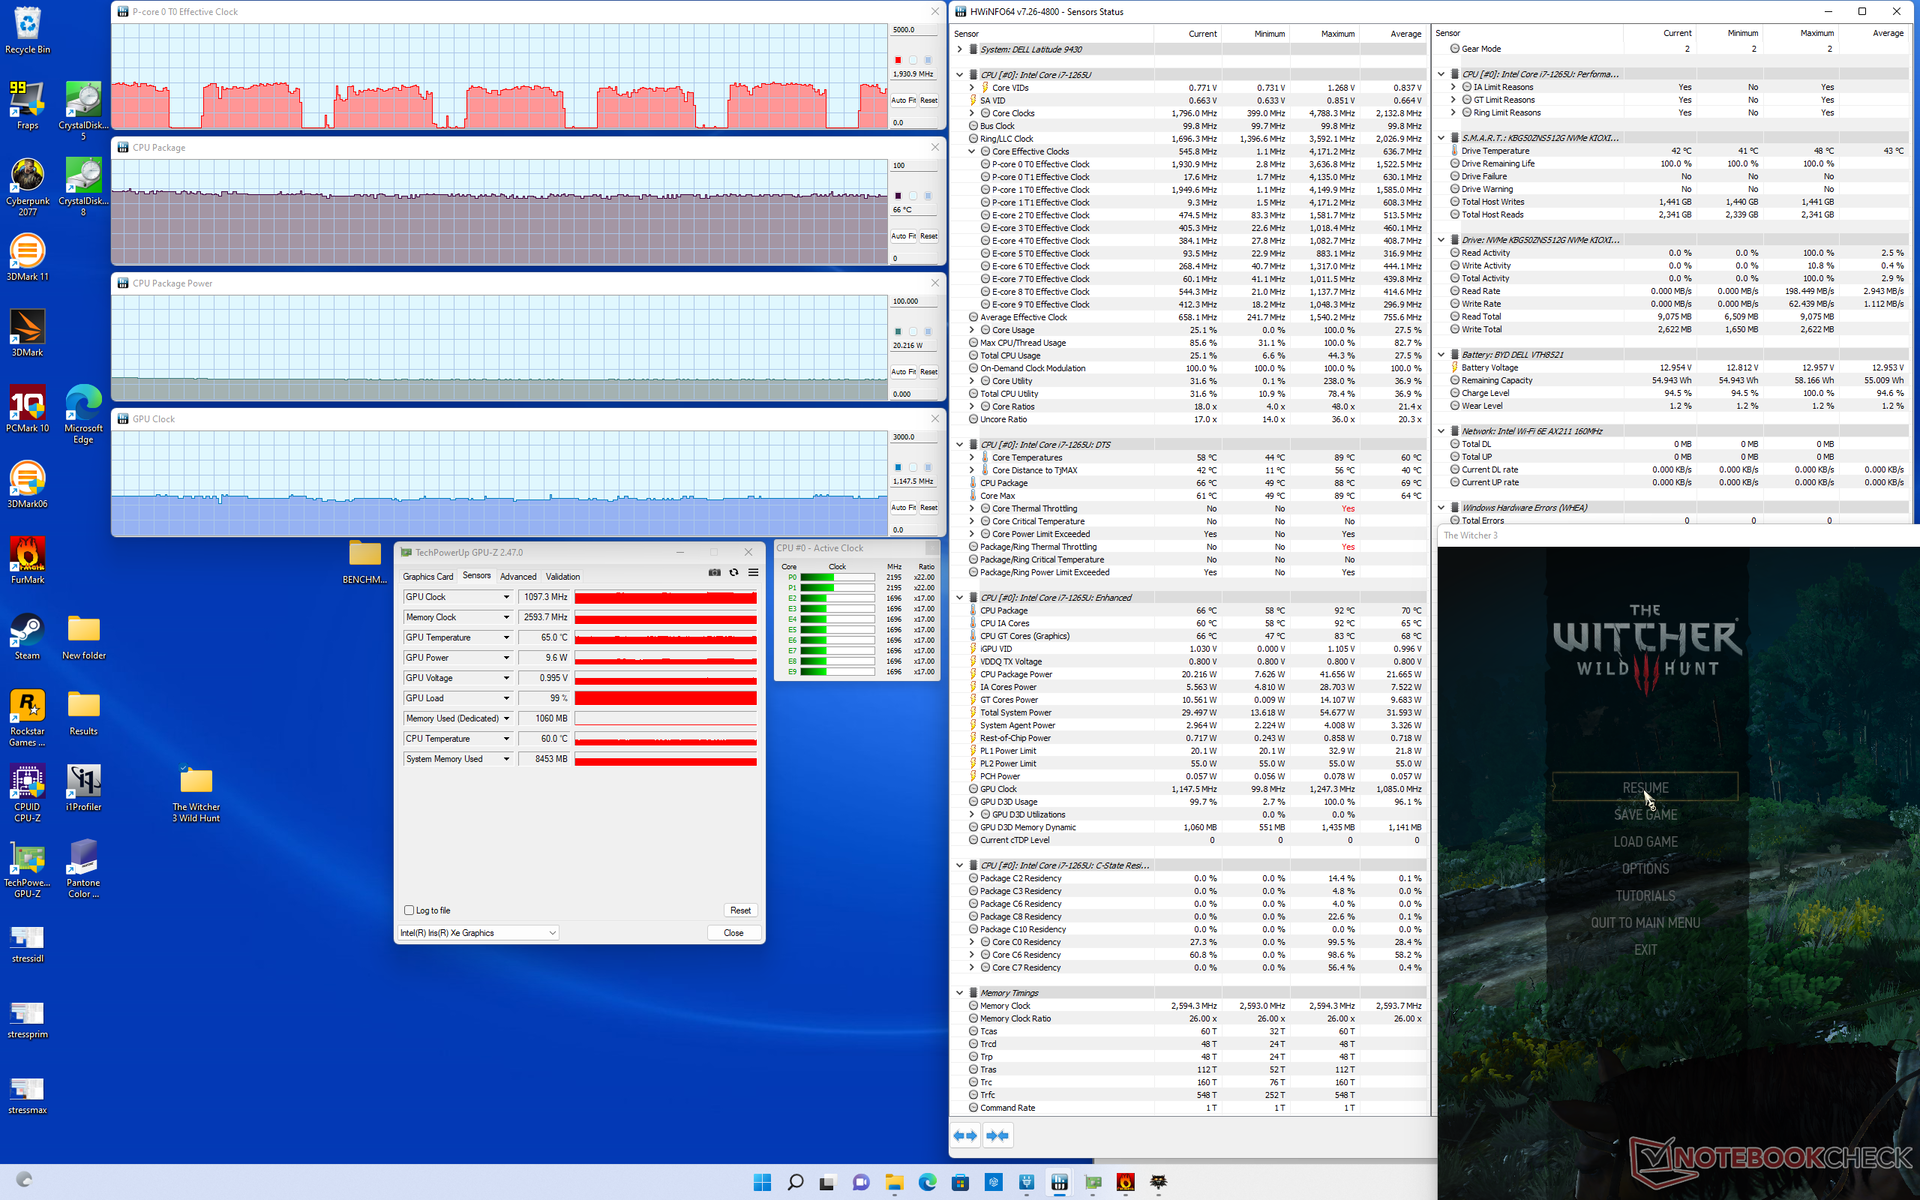
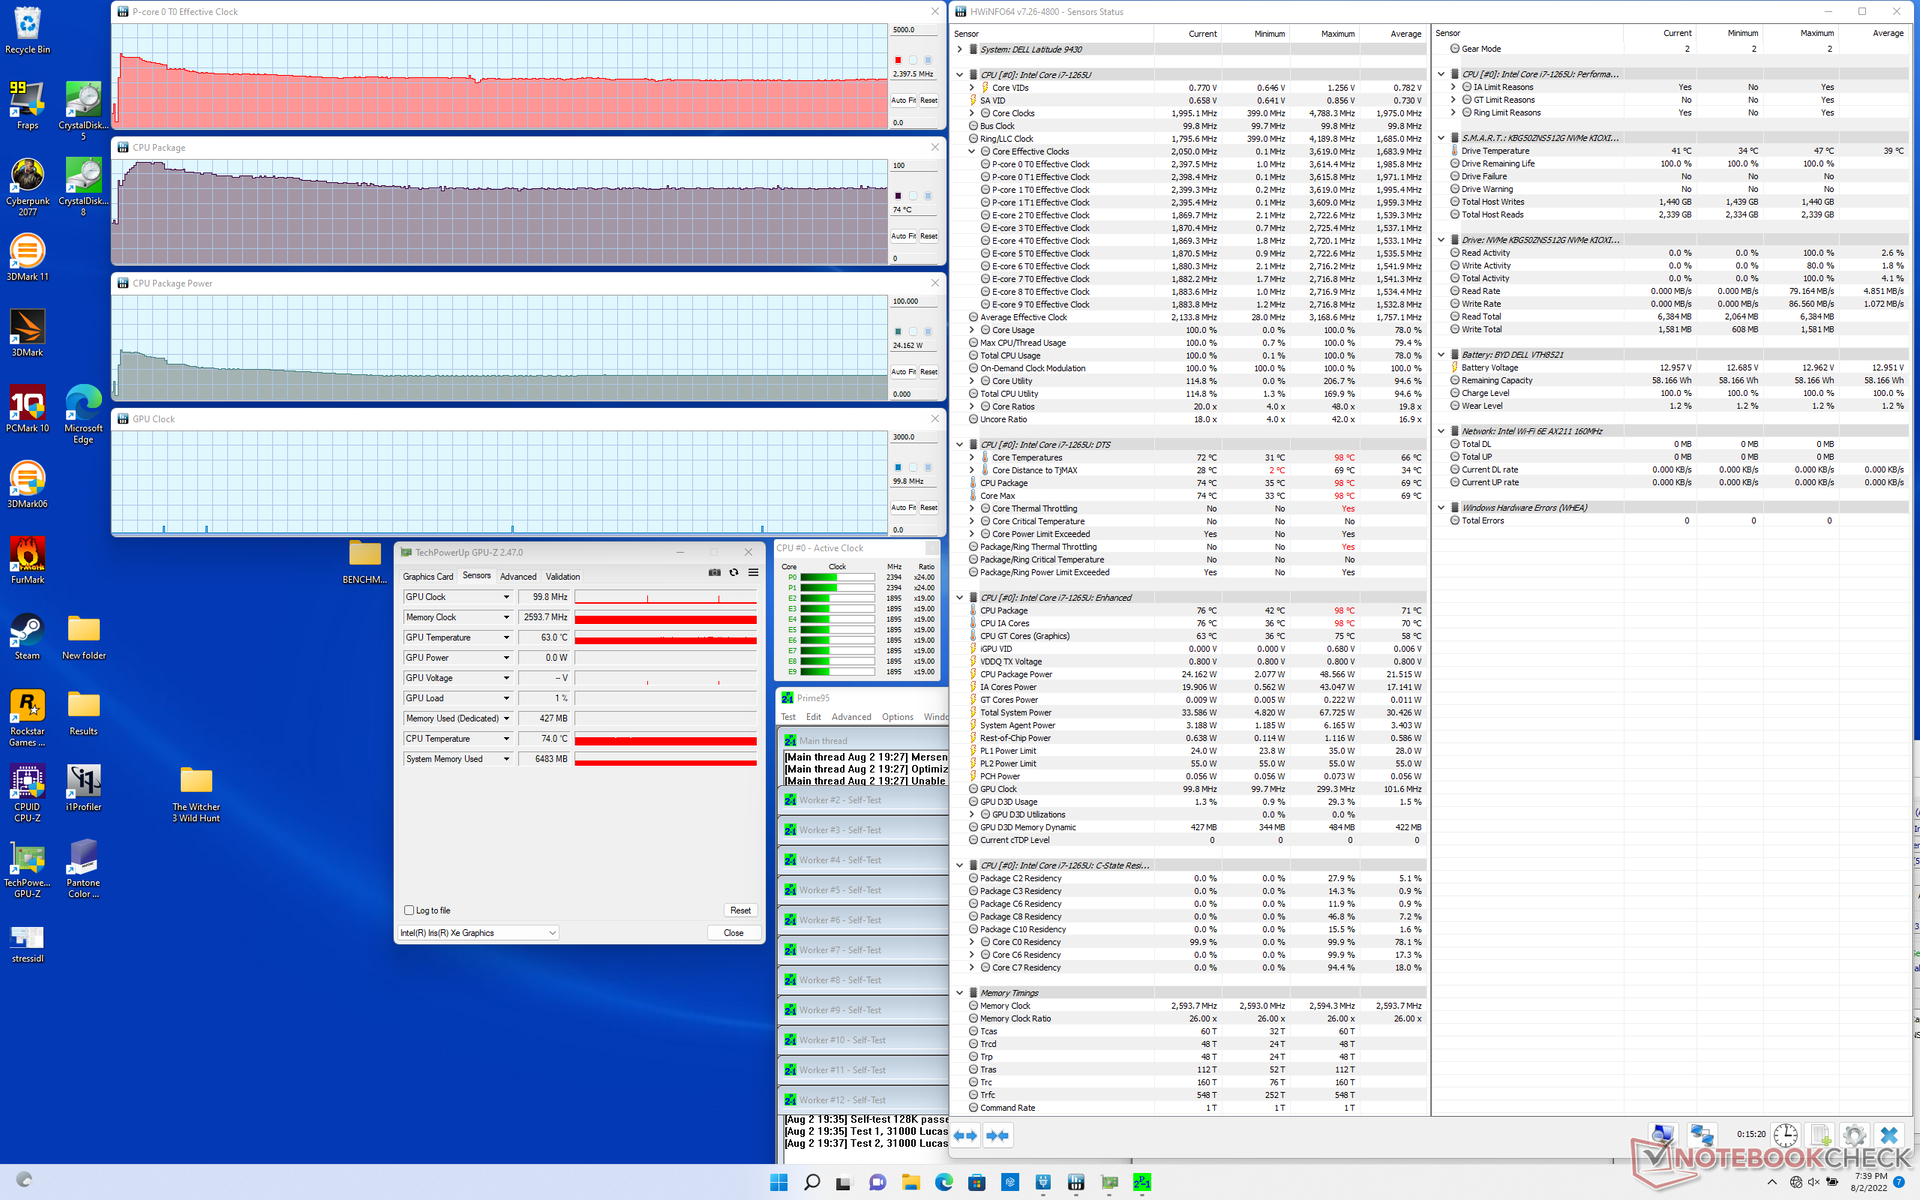
| Fréquence du CPU (GHz) | Fréquence du GPU (MHz) | Température moyenne du CPU (°C) | |
| Système au repos | -- | -- | 35 |
| Prime95 Stress | 2.4 | -- | 74 |
| Prime95 + FurMark Stress | 1.6 | 698 | 65 |
| Witcher 3 Stress | ~2.0 | 1097 | 66 |
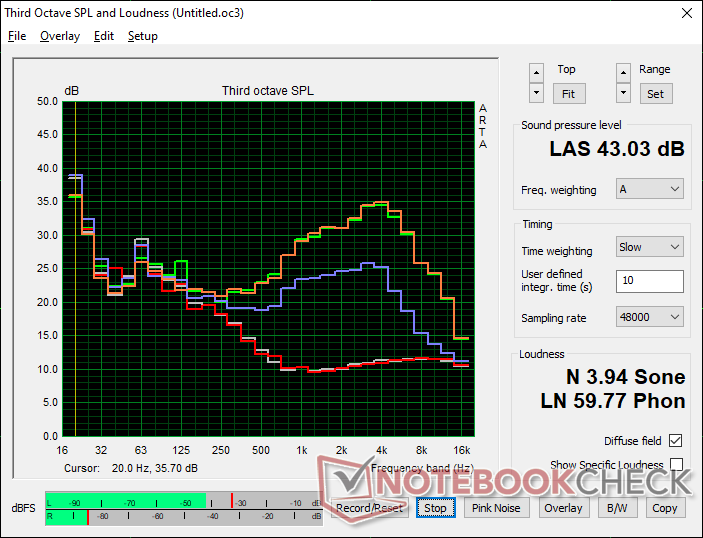
Haut-parleurs
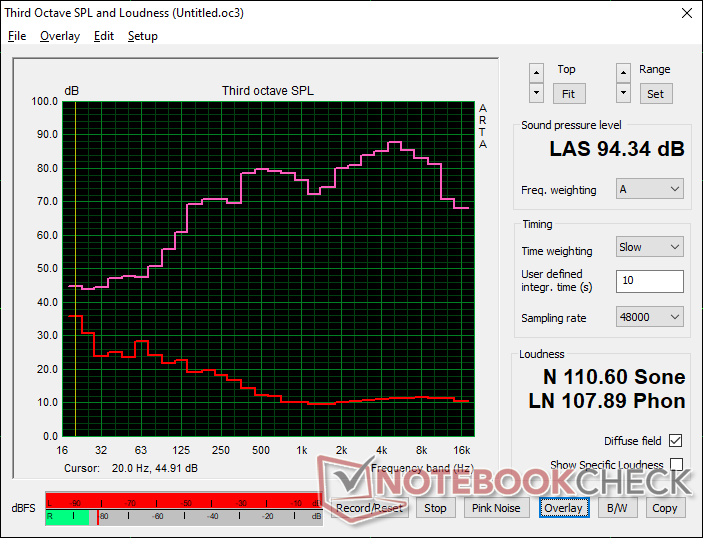
Dell Latitude 9430 2-in-1 analyse audio
(+) | les haut-parleurs peuvent jouer relativement fort (94.3# dB)
Basses 100 - 315 Hz
(±) | basse réduite - en moyenne 12.3% inférieure à la médiane
(+) | les basses sont linéaires (5.3% delta à la fréquence précédente)
Médiums 400 - 2000 Hz
(+) | médiane équilibrée - seulement 2% de la médiane
(+) | les médiums sont linéaires (4.7% delta à la fréquence précédente)
Aiguës 2 - 16 kHz
(±) | sommets plus élevés - en moyenne 5.4% plus élevés que la médiane
(+) | les aigus sont linéaires (3% delta à la fréquence précédente)
Globalement 100 - 16 000 Hz
(+) | le son global est linéaire (11.6% différence à la médiane)
Par rapport à la même classe
» 10% de tous les appareils testés de cette catégorie étaient meilleurs, 4% similaires, 86% pires
» Le meilleur avait un delta de 6%, la moyenne était de 20%, le pire était de 57%.
Par rapport à tous les appareils testés
» 8% de tous les appareils testés étaient meilleurs, 2% similaires, 90% pires
» Le meilleur avait un delta de 4%, la moyenne était de 24%, le pire était de 134%.
Apple MacBook Pro 16 2021 M1 Pro analyse audio
(+) | les haut-parleurs peuvent jouer relativement fort (84.7# dB)
Basses 100 - 315 Hz
(+) | bonne basse - seulement 3.8% loin de la médiane
(+) | les basses sont linéaires (5.2% delta à la fréquence précédente)
Médiums 400 - 2000 Hz
(+) | médiane équilibrée - seulement 1.3% de la médiane
(+) | les médiums sont linéaires (2.1% delta à la fréquence précédente)
Aiguës 2 - 16 kHz
(+) | des sommets équilibrés - à seulement 1.9% de la médiane
(+) | les aigus sont linéaires (2.7% delta à la fréquence précédente)
Globalement 100 - 16 000 Hz
(+) | le son global est linéaire (4.6% différence à la médiane)
Par rapport à la même classe
» 0% de tous les appareils testés de cette catégorie étaient meilleurs, 0% similaires, 100% pires
» Le meilleur avait un delta de 5%, la moyenne était de 17%, le pire était de 45%.
Par rapport à tous les appareils testés
» 0% de tous les appareils testés étaient meilleurs, 0% similaires, 100% pires
» Le meilleur avait un delta de 4%, la moyenne était de 24%, le pire était de 134%.
Gestion de l'énergie
Consommation d'énergie
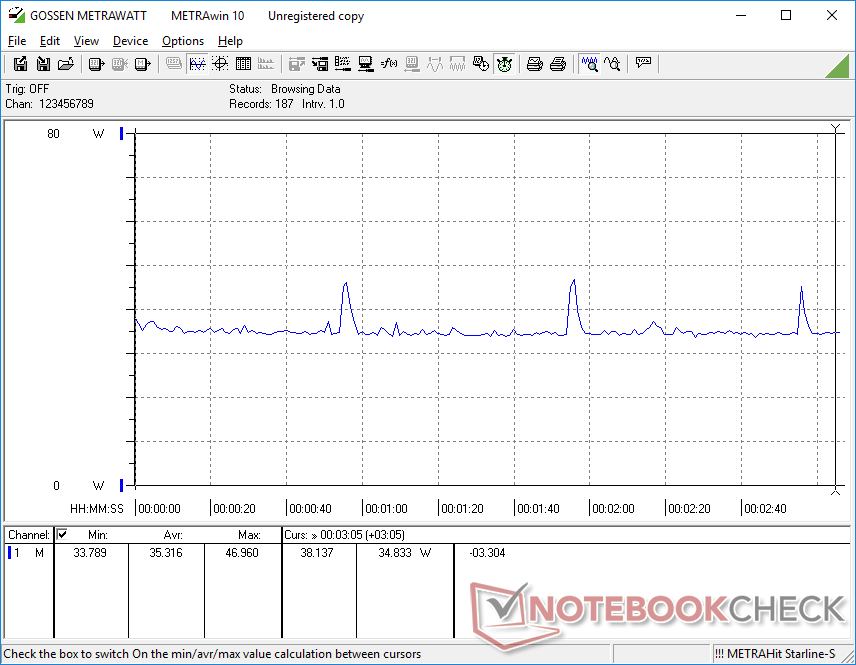
La marche au ralenti sur le bureau demande entre 3 et 7 W selon le profil de luminosité et le réglage de l'alimentation, ce qui est légèrement inférieur à ce que nous avons enregistré sur le Latitude 9420 2-in-1. Par ailleurs, l'exécution du programme Prime95 consomme environ 62 W, contre seulement 32 W sur le modèle de l'année dernière, soit une augmentation considérable de 94 % de la consommation d'énergie lorsque le processeur est sollicité. L'augmentation de 50 % des performances multithread lors du passage du Core i7-1185G7 au Core i7-1265U n'est pas gratuite à cet égard.
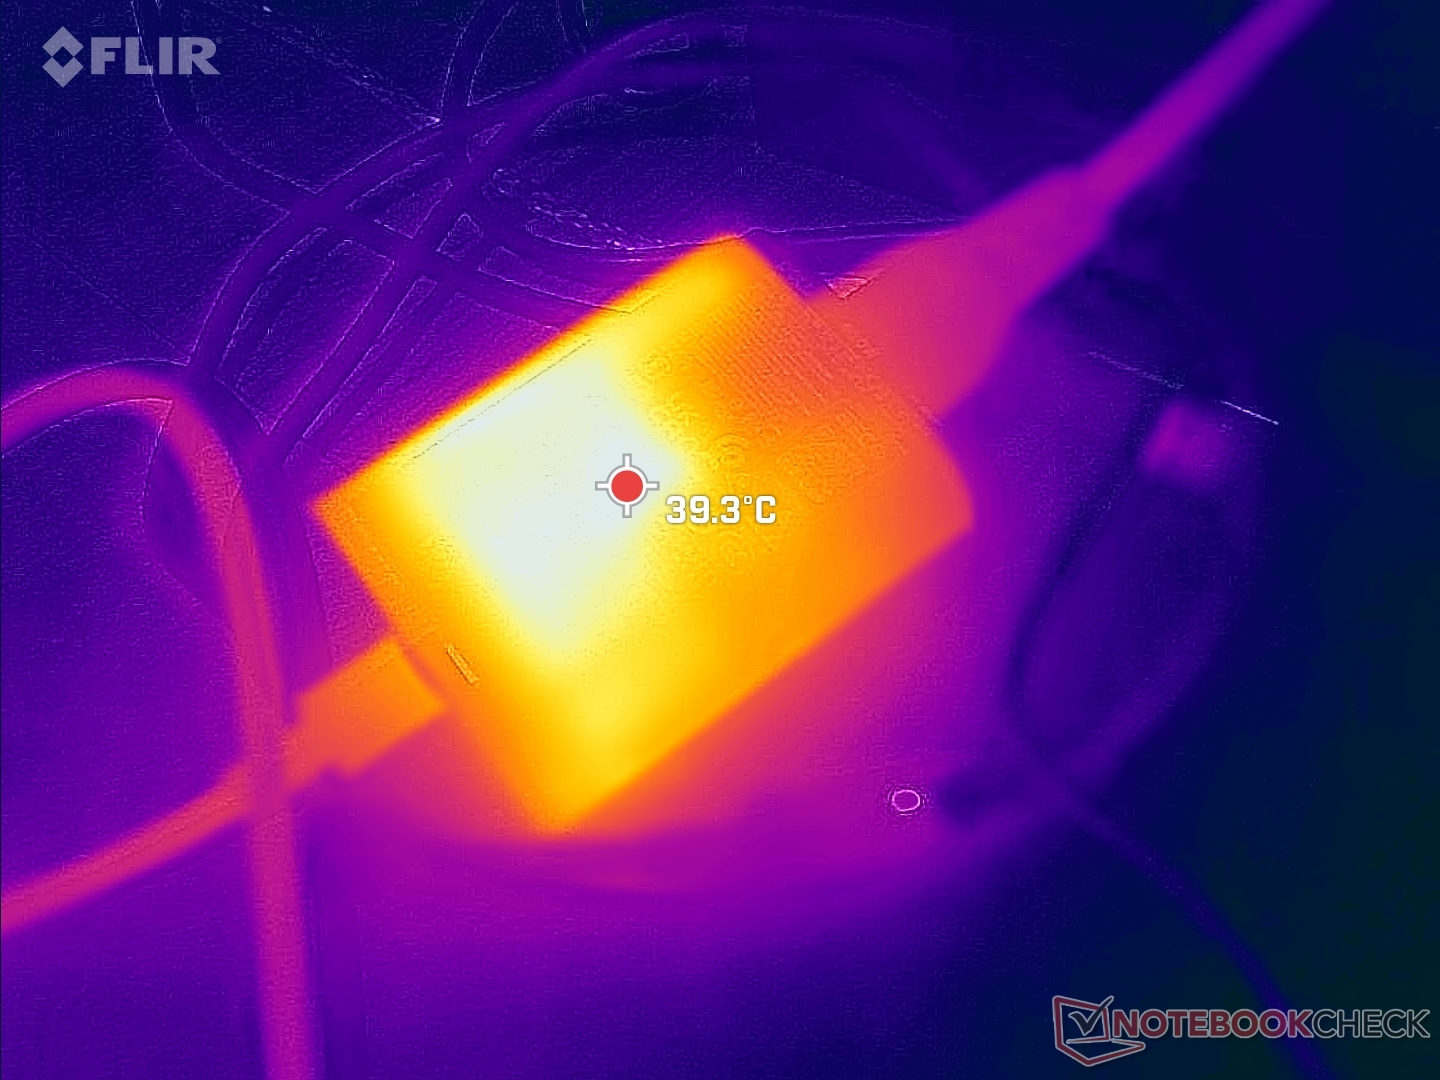
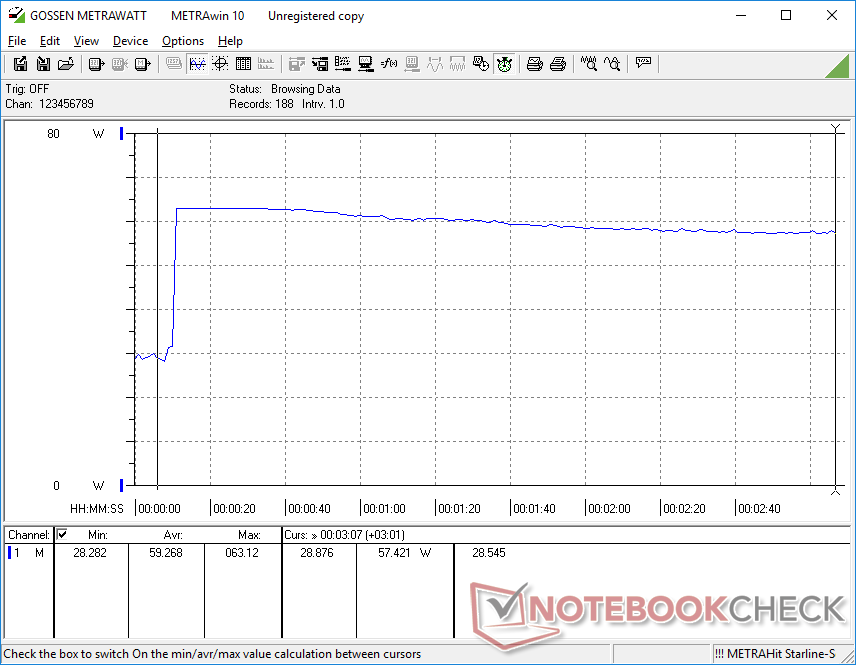
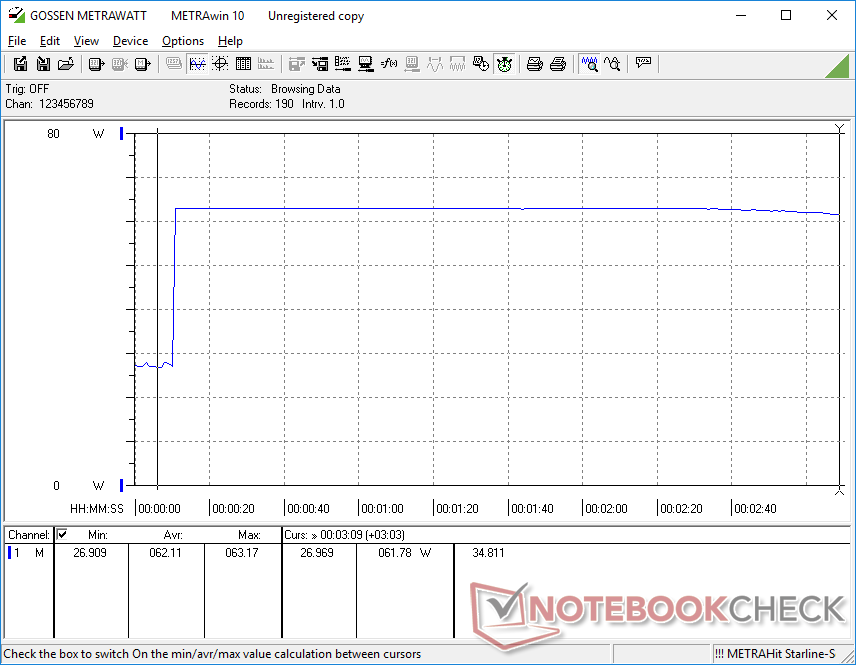
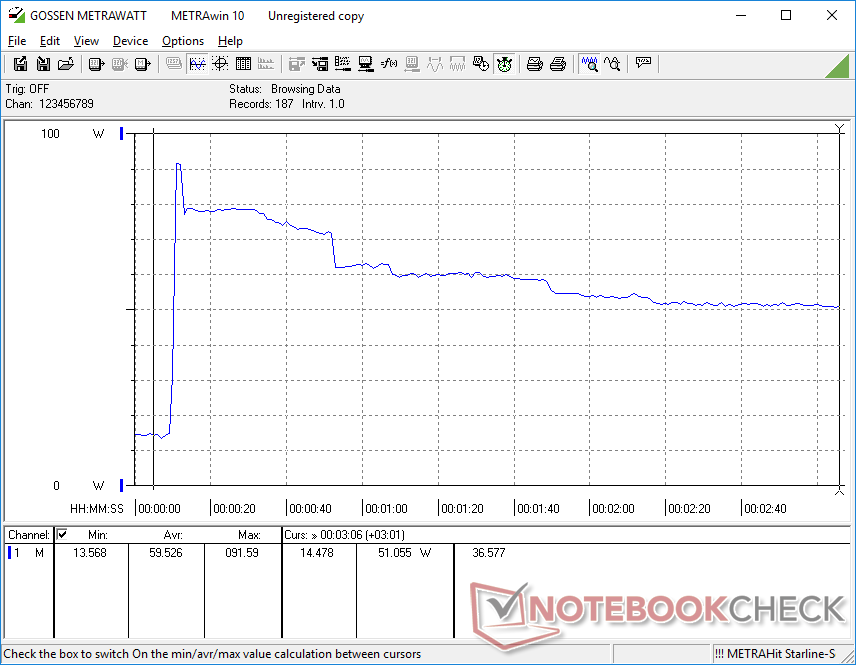
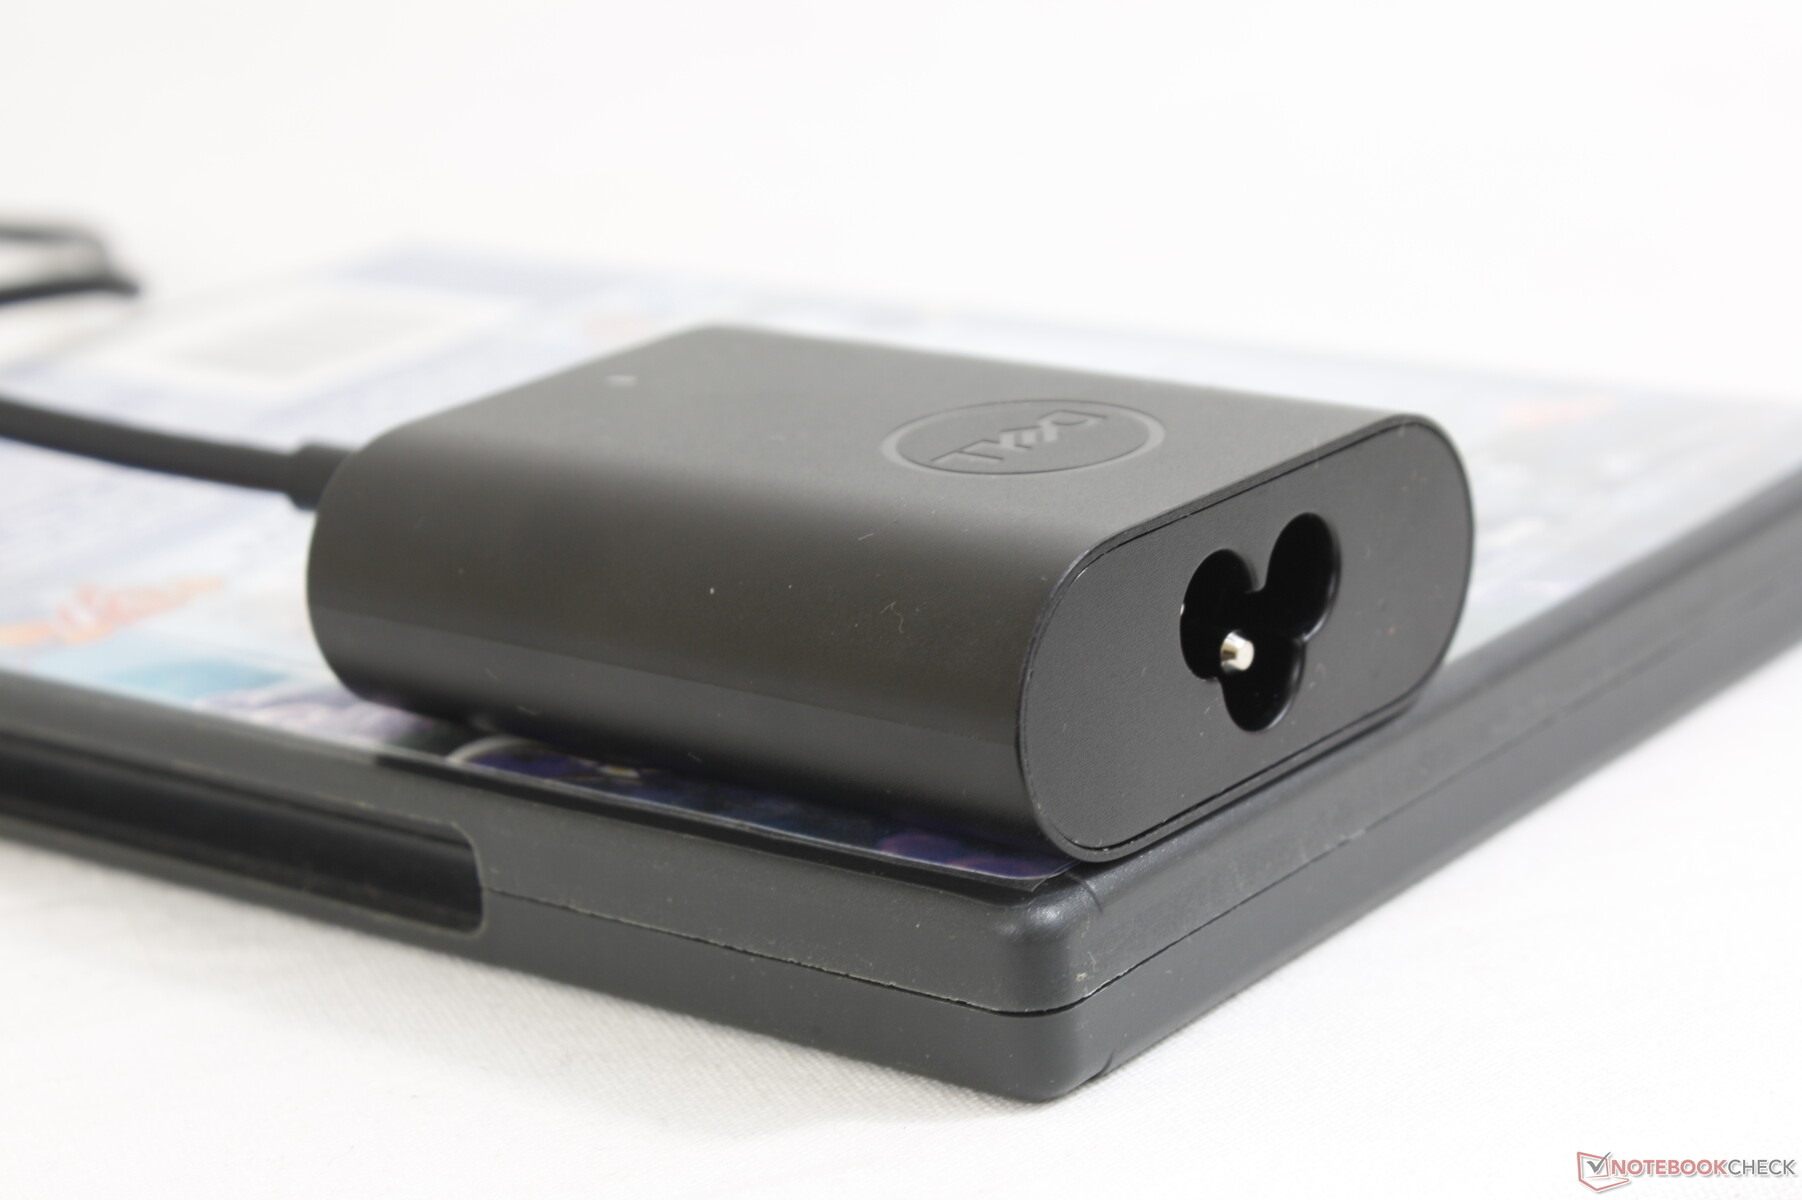
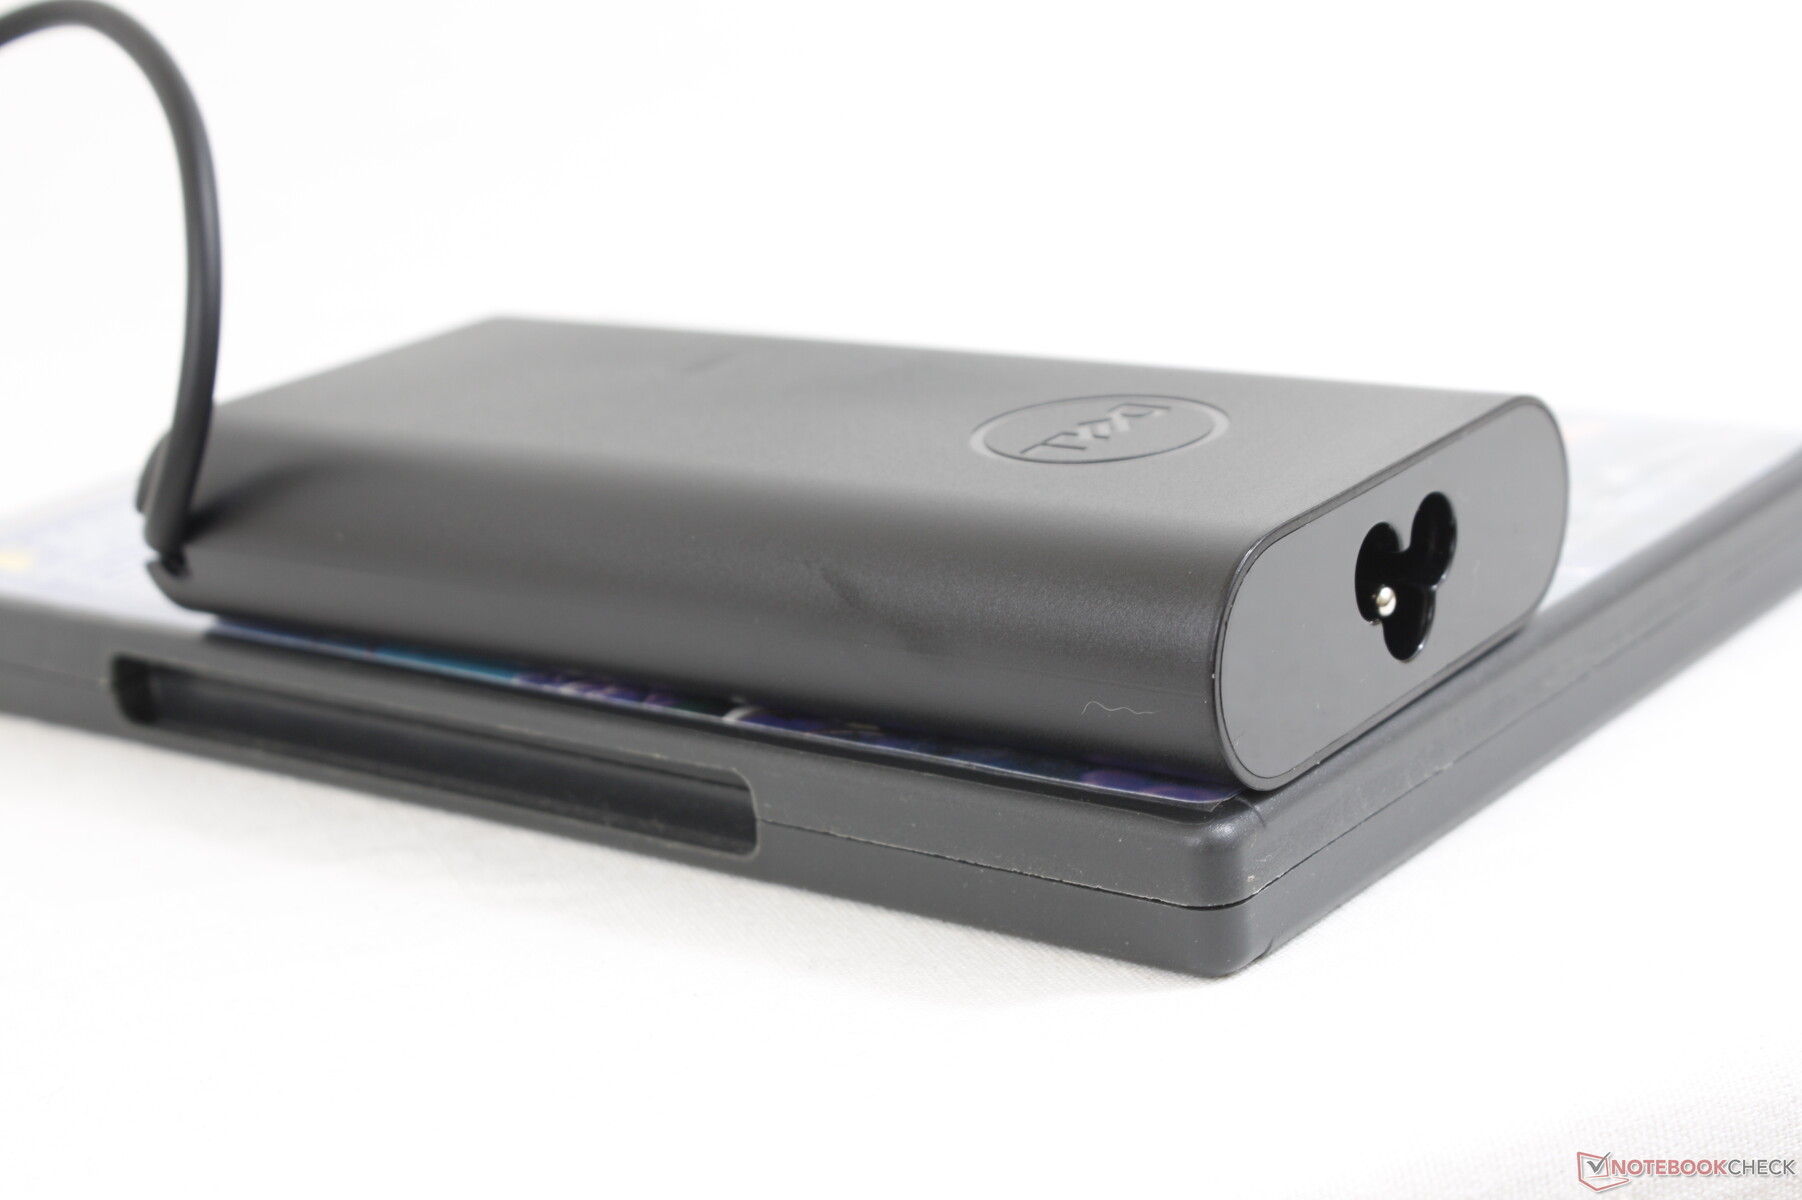
Contrairement à la plupart des autres ordinateurs portables, Dell propose trois options d'adaptateur secteur à la caisse : 60 W, 65 W et 90 W. L'option 90 W est utile pour alimenter le processeur afin d'obtenir des fréquences d'horloge Turbo Boost plus élevées et donc de meilleures performances. Cependant, nos tests de stress ont montré que le système ne peut de toute façon pas maintenir des fréquences d'horloge Turbo Boost très élevées pendant de longues périodes et donc que tout gain de performance provenant de l'adaptateur secteur 90 W sera de courte durée. Par exemple, la consommation d'énergie se stabilise à 61 W lors de l'exécution de Prime95 sur le petit (~6,7 x 5,5 x 2,2 cm) adaptateur CA 60 W. En répétant ce test avec le plus grand (~13 x 6,5 x 2,3 cm) adaptateur CA 90 W, la consommation peut atteindre 91,6 W au début du test avant de baisser et de se stabiliser à 51 W après environ 90 secondes, comme le montrent les graphiques ci-dessous. L'adaptateur de 90 W reste une bonne option si vous prévoyez d'exécuter des programmes exigeants, car les courtes poussées de performance du CPU peuvent vous faire gagner du temps lors du chargement des applications ou du traitement des images.
| Éteint/en veille | |
| Au repos | |
| Fortement sollicité |
|
Légende:
min: | |
| Dell Latitude 9430 2-in-1 i7-1265U, Iris Xe G7 96EUs, , IPS, 2560x1600, 14" | Dell Latitude 9420 2-in-1 i7-1185G7, Iris Xe G7 96EUs, WDC PC SN530 SDBPNPZ-512G, IPS, 2560x1600, 14" | MSI Summit E14 Flip Evo A12MT i7-1260P, Iris Xe G7 96EUs, Samsung PM9A1 MZVL21T0HCLR, IPS, 2880x1800, 14" | LG Gram 14T90P i5-1135G7, Iris Xe G7 80EUs, Samsung SSD PM981a MZVLB512HBJQ, IPS, 1900x1200, 14" | Lenovo ThinkPad X1 Yoga G7 21CE002HGE i7-1270P, Iris Xe G7 96EUs, Samsung PM9A1 MZVL2512HCJQ, IPS, 1920x1200, 14" | Asus ZenBook Flip 14 UN5401QA-KN085W R7 5800H, Vega 8, Intel SSD 600p SSDPEKKW512G7, OLED, 2880x1800, 14" | |
|---|---|---|---|---|---|---|
| Power Consumption | -27% | -49% | 3% | -13% | -52% | |
| Idle Minimum * (Watt) | 2.9 | 4.6 -59% | 5.4 -86% | 2.8 3% | 4.2 -45% | 6.4 -121% |
| Idle Average * (Watt) | 5.8 | 7.8 -34% | 9.5 -64% | 5.5 5% | 6.9 -19% | 9.4 -62% |
| Idle Maximum * (Watt) | 6.6 | 8.2 -24% | 12.4 -88% | 6.4 3% | 7.6 -15% | 10.7 -62% |
| Load Average * (Watt) | 49.2 | 47.9 3% | 54.7 -11% | 45.4 8% | 36.2 26% | 52.2 -6% |
| Witcher 3 ultra * (Watt) | 35.3 | 38.8 -10% | 52 -47% | 34 4% | 43.2 -22% | 53 -50% |
| Load Maximum * (Watt) | 63.1 | 87.1 -38% | 63.4 -0% | 65.9 -4% | 63.5 -1% | 69 -9% |
* ... Moindre est la valeur, meilleures sont les performances
Power Consumption Witcher 3 / Stresstest
Power Consumption external Monitor
Autonomie de la batterie
Attendez-vous à plus de 12 heures d'utilisation du WLAN dans le monde réel avant de devoir recharger la batterie de 60 Wh. Une option plus petite de 40 Wh est également disponible pour un poids total plus léger et une durée de fonctionnement environ deux tiers plus longue.
Le chargement de la batterie vide à pleine capacité avec l'adaptateur secteur de 60 W inclus prend un peu moins de 2 heures.
| Dell Latitude 9430 2-in-1 i7-1265U, Iris Xe G7 96EUs, 60 Wh | Dell Latitude 9420 2-in-1 i7-1185G7, Iris Xe G7 96EUs, 60 Wh | MSI Summit E14 Flip Evo A12MT i7-1260P, Iris Xe G7 96EUs, 72 Wh | LG Gram 14T90P i5-1135G7, Iris Xe G7 80EUs, 72 Wh | Lenovo ThinkPad X1 Yoga G7 21CE002HGE i7-1270P, Iris Xe G7 96EUs, 57 Wh | Asus ZenBook Flip 14 UN5401QA-KN085W R7 5800H, Vega 8, 63 Wh | |
|---|---|---|---|---|---|---|
| Autonomie de la batterie | -2% | -26% | -5% | -30% | -22% | |
| Reader / Idle (h) | 27.8 | 28.7 3% | 22.1 -21% | |||
| WiFi v1.3 (h) | 12.8 | 11.7 -9% | 8.2 -36% | 12.1 -5% | 8.9 -30% | 8.7 -32% |
| Load (h) | 2.4 | 2.4 0% | 1.9 -21% | 2.3 -4% | 1.7 -29% | 2.1 -12% |
| H.264 (h) | 12.2 | 9 |
Points positifs
Points négatifs
Verdict - Même emballage, nouveau nom
Tout ce que nous avons aimé dans le Latitude 9420 2-en-1 est de retour en force sur le Latitude 9430 2-in-1 puisque le nouveau modèle est principalement une mise à jour du processeur. Le CPU apporte des performances beaucoup plus rapides, bien qu'à des niveaux de consommation d'énergie plus élevés, ce qui est conforme à ce que nous avons observé sur d'autres ordinateurs portables Alder Lake en général. Si le processeur plus rapide, les options 5G ou la webcam de 2 mégapixels ne vous intéressent pas pour vos charges de travail quotidiennes, alors le Latitude 9420 2-en-1 peut vous offrir essentiellement la même expérience pour moins cher.
Le Latitude 9430 2-en-1 est destiné aux utilisateurs intensifs qui savent qu'ils peuvent exploiter le CPU Intel de 12e génération. Sinon, le modèle physiquement identique Latitude 9420 2-en-1 est déjà suffisant pour l'utilisateur de bureau cible.
Parmi les petits désagréments à garder à l'esprit, citons l'absence de prise en charge des SSD M.2 de 80 mm et des antennes WAN en cas de configuration sans support WAN. La fonction Turbo Boost du processeur est limitée et les performances sont réduites en cas de fonctionnement sur batterie. Il est également regrettable que le stylet actif soit vendu séparément alors que les concurrents comme leLenovo ThinkPad X1 Yoga G7 incluent le stylet à chaque achat. La plupart des ordinateurs portables prennent en charge le SSD de 80 mm, plus courant, ce qui peut rendre le remplacement du SSD un peu plus difficile sur le Dell. Pendant ce temps, le HP EliteBook 1040 a un écran tactile beaucoup plus lumineux, bien qu'avec une résolution inférieure de 1200p. Peut-être que Dell peut rendre le modèle de l'année prochaine plus attrayant avec des webcams de 5 MP et des écrans OLED à taux de rafraîchissement élevé pour améliorer l'expérience visuelle.
Prix et disponibilité
Dell expédie actuellement le Latitude 9430 clamshell et 2-in-1. Notre configuration spécifique avec le Core i7-1265U et 16 Go de RAM se vend environ 2800 $US.
Dell Latitude 9430 2-in-1
- 08/05/2022 v7 (old)
Allen Ngo
Price comparison

