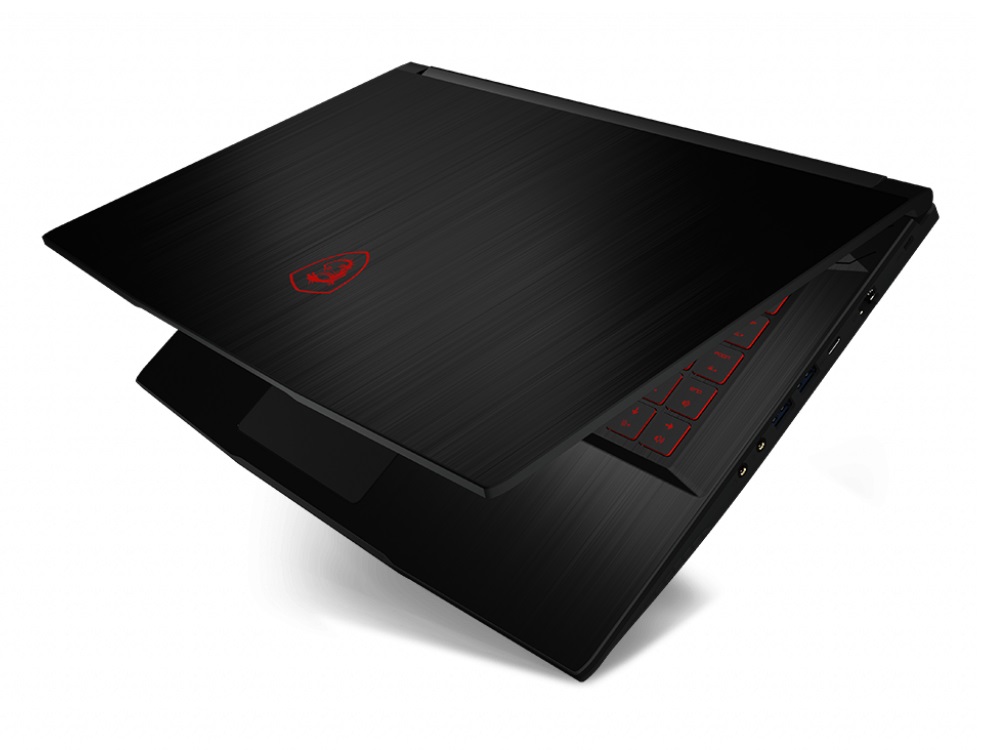
Test du MSI GF63 Thin 9SC (i5-9300H, GTX 1650 Max-Q, FHD, 60 Hz) : joueur léger à moins de 1000 €
Note | Date | Modèle | Poids | Épaisseur | Taille | Résolution | Prix |
|---|---|---|---|---|---|---|---|
| 77.6 % v7 (old) | 01/20 | MSI GF63 Thin 9SC i5-9300H, GeForce GTX 1650 Max-Q | 1.8 kg | 22 mm | 15.60" | 1920x1080 | |
| 79.6 % v7 (old) | 10/19 | Dell G5 15 5590-PCNJJ i5-9300H, GeForce GTX 1650 Mobile | 2.7 kg | 23.7 mm | 15.60" | 1920x1080 | |
| 82.5 % v6 (old) | 05/19 | Acer Aspire Nitro 5 AN515-54-53Z2 i5-9300H, GeForce GTX 1650 Mobile | 2.2 kg | 27 mm | 15.60" | 1920x1080 | |
| 81.5 % v7 (old) | 07/19 | HP Omen 15-dc1020ng i5-9300H, GeForce GTX 1650 Mobile | 2.3 kg | 25 mm | 15.60" | 1920x1080 | |
| 77 % v7 (old) | 10/19 | Lenovo IdeaPad L340-15IRH 81LK00BMGE i5-9300H, GeForce GTX 1650 Mobile | 2.1 kg | 23.9 mm | 15.60" | 1920x1080 |
| Networking | |
| iperf3 transmit AX12 | |
| MSI GF63 Thin 9SC | |
| iperf3 receive AX12 | |
| MSI GF63 Thin 9SC | |
| |||||||||||||||||||||||||
Homogénéité de la luminosité: 92 %
Valeur mesurée au centre, sur batterie: 260 cd/m²
Contraste: 1130:1 (Valeurs des noirs: 0.23 cd/m²)
ΔE ColorChecker Calman: 4.1 | ∀{0.5-29.43 Ø4.72}
calibrated: 3.56
ΔE Greyscale Calman: 2.83 | ∀{0.09-98 Ø4.97}
56% sRGB (Argyll 1.6.3 3D)
36% AdobeRGB 1998 (Argyll 1.6.3 3D)
39.01% AdobeRGB 1998 (Argyll 3D)
56.5% sRGB (Argyll 3D)
37.76% Display P3 (Argyll 3D)
Gamma: 2.53
CCT: 6158 K
| MSI GF63 Thin 9SC AU Optronics B156HAN02.1 (AUO21ED), IPS, 1920x1080 | Dell G5 15 5590-PCNJJ AU Optronics B156HAN (AUO23ED), IPS, 1920x1080 | Acer Aspire Nitro 5 AN515-54-53Z2 LG LP156WFC-SPD1 (LGD0563), IPS, 1920x1080 | HP Omen 15-dc1020ng LGD05CE, IPS, 1920x1080 | Lenovo IdeaPad L340-15IRH 81LK00BMGE CMN 156HCA-EAB, IPS, 1920x1080 | |
|---|---|---|---|---|---|
| Display | 115% | 1% | 2% | 13% | |
| Display P3 Coverage (%) | 37.76 | 83.1 120% | 37.97 1% | 38.37 2% | 42.81 13% |
| sRGB Coverage (%) | 56.5 | 99.9 77% | 57 1% | 57.6 2% | 63.8 13% |
| AdobeRGB 1998 Coverage (%) | 39.01 | 96.8 148% | 39.23 1% | 39.69 2% | 44.31 14% |
| Response Times | -1% | 11% | 9% | 1% | |
| Response Time Grey 50% / Grey 80% * (ms) | 44.8 ? | 48 ? -7% | 42 ? 6% | 40 ? 11% | 45.6 ? -2% |
| Response Time Black / White * (ms) | 31.6 ? | 30 ? 5% | 26.8 ? 15% | 29.6 ? 6% | 30.8 ? 3% |
| PWM Frequency (Hz) | 25910 ? | ||||
| Screen | -19% | -2% | -21% | -16% | |
| Brightness middle (cd/m²) | 260 | 234 -10% | 238 -8% | 251 -3% | 275 6% |
| Brightness (cd/m²) | 249 | 216 -13% | 226 -9% | 232 -7% | 253 2% |
| Brightness Distribution (%) | 92 | 87 -5% | 83 -10% | 76 -17% | 83 -10% |
| Black Level * (cd/m²) | 0.23 | 0.22 4% | 0.27 -17% | 0.17 26% | 0.18 22% |
| Contrast (:1) | 1130 | 1064 -6% | 881 -22% | 1476 31% | 1528 35% |
| Colorchecker dE 2000 * | 4.1 | 6.52 -59% | 4.11 -0% | 6.2 -51% | 5.4 -32% |
| Colorchecker dE 2000 max. * | 7.93 | 10.58 -33% | 6.89 13% | 18.6 -135% | 21.3 -169% |
| Colorchecker dE 2000 calibrated * | 3.56 | 3.56 -0% | 3.76 -6% | 4.8 -35% | 4.4 -24% |
| Greyscale dE 2000 * | 2.83 | 5.33 -88% | 1.78 37% | 4.2 -48% | 3.7 -31% |
| Gamma | 2.53 87% | 2.86 77% | 2.41 91% | 2.32 95% | 2.12 104% |
| CCT | 6158 106% | 5983 109% | 6311 103% | 7454 87% | 6376 102% |
| Color Space (Percent of AdobeRGB 1998) (%) | 36 | 36 0% | 36 0% | 36.5 1% | 40.8 13% |
| Color Space (Percent of sRGB) (%) | 56 | 57 2% | 57 2% | 57.4 2% | 63.6 14% |
| Moyenne finale (programmes/paramètres) | 32% /
8% | 3% /
0% | -3% /
-13% | -1% /
-8% |
* ... Moindre est la valeur, meilleures sont les performances
Temps de réponse de l'écran
| ↔ Temps de réponse noir à blanc | ||
|---|---|---|
| 31.6 ms ... hausse ↗ et chute ↘ combinées | ↗ 17.2 ms hausse | 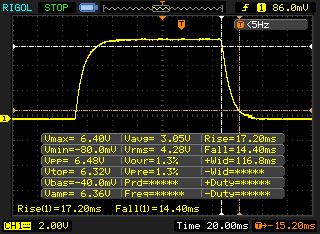 |
| ↘ 14.4 ms chute | ||
| L'écran souffre de latences très élevées, à éviter pour le jeu. En comparaison, tous les appareils testés affichent entre 0.1 (minimum) et 240 (maximum) ms. » 85 % des appareils testés affichent de meilleures performances. Cela signifie que les latences relevées sont moins bonnes que la moyenne (19.8 ms) de tous les appareils testés. | ||
| ↔ Temps de réponse gris 50% à gris 80% | ||
| 44.8 ms ... hausse ↗ et chute ↘ combinées | ↗ 22 ms hausse | 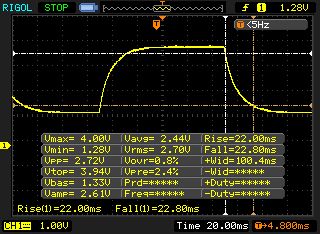 |
| ↘ 22.8 ms chute | ||
| L'écran souffre de latences très élevées, à éviter pour le jeu. En comparaison, tous les appareils testés affichent entre 0.165 (minimum) et 636 (maximum) ms. » 76 % des appareils testés affichent de meilleures performances. Cela signifie que les latences relevées sont moins bonnes que la moyenne (31 ms) de tous les appareils testés. | ||
Scintillement / MLI (Modulation de largeur d'impulsion)
| Scintillement / MLI (Modulation de largeur d'impulsion) non décelé | 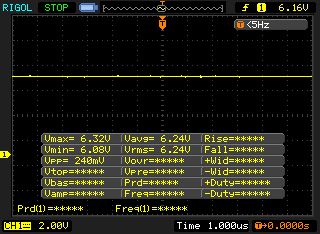 | ||
En comparaison, 52 % des appareils testés n'emploient pas MDI pour assombrir leur écran. Nous avons relevé une moyenne à 7769 (minimum : 5 - maximum : 343500) Hz dans le cas où une MDI était active. | |||
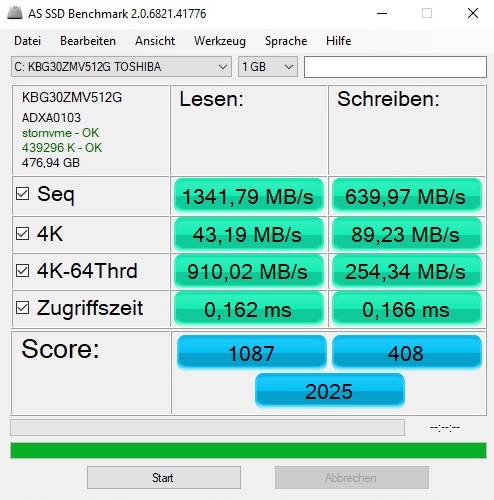
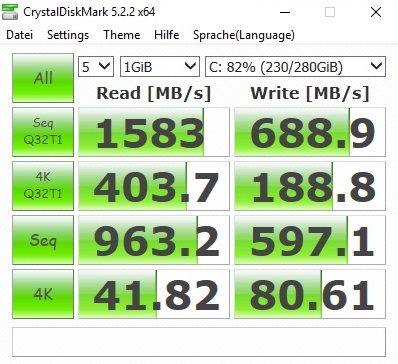
| MSI GF63 Thin 9SC Toshiba KBG30ZMV512G | Dell G5 15 5590-PCNJJ KBG30ZMS128G | Acer Aspire Nitro 5 AN515-54-53Z2 WDC PC SN520 SDAPNUW-512G | HP Omen 15-dc1020ng WDC PC SN720 SDAQNTW-512G | Lenovo IdeaPad L340-15IRH 81LK00BMGE WDC PC SN520 SDAPMUW-512 | |
|---|---|---|---|---|---|
| CrystalDiskMark 5.2 / 6 | -43% | 48% | 105% | 34% | |
| Write 4K (MB/s) | 80.6 | 65.3 -19% | 109.1 35% | 112.1 39% | 103.6 29% |
| Read 4K (MB/s) | 41.82 | 29.71 -29% | 42.05 1% | 42.01 0% | 39.91 -5% |
| Write Seq (MB/s) | 597 | 128.8 -78% | 1457 144% | 1964 229% | 1160 94% |
| Read Seq (MB/s) | 963 | 859 -11% | 1421 48% | 2065 114% | 990 3% |
| Write 4K Q32T1 (MB/s) | 188.8 | 95.8 -49% | 287.8 52% | 318.2 69% | 283.4 50% |
| Read 4K Q32T1 (MB/s) | 403.7 | 197.6 -51% | 317.9 -21% | 406.7 1% | 344.5 -15% |
| Write Seq Q32T1 (MB/s) | 689 | 132.5 -81% | 1455 111% | 2534 268% | 1455 111% |
| Read Seq Q32T1 (MB/s) | 1583 | 1208 -24% | 1739 10% | 3438 117% | 1690 7% |

| 3DMark 11 Performance | 10378 points | |
| 3DMark Cloud Gate Standard Score | 17713 points | |
| 3DMark Fire Strike Score | 7177 points | |
| 3DMark Time Spy Score | 3136 points | |
Aide | ||
| The Witcher 3 | |
| 1920x1080 High Graphics & Postprocessing (Nvidia HairWorks Off) | |
| Moyenne de la classe Gaming (181 - 341, n=3, 2 dernières années) | |
| HP Omen 15-dc1020ng | |
| Acer Aspire Nitro 5 AN515-54-53Z2 | |
| Dell G5 15 5590-PCNJJ | |
| MSI GF63 Thin 9SC | |
| 1920x1080 Ultra Graphics & Postprocessing (HBAO+) | |
| Moyenne de la classe Gaming (95 - 240, n=8, 2 dernières années) | |
| HP Omen 15-dc1020ng | |
| Acer Aspire Nitro 5 AN515-54-53Z2 | |
| Lenovo IdeaPad L340-15IRH 81LK00BMGE | |
| Dell G5 15 5590-PCNJJ | |
| MSI GF63 Thin 9SC | |
| Bas | Moyen | Élevé | Ultra | |
|---|---|---|---|---|
| The Witcher 3 (2015) | 146 | 99 | 53.2 | 30.4 |
| Apex Legends (2019) | 144 | 71.1 | 58.4 | 57 |
| Far Cry New Dawn (2019) | 72 | 52 | 49 | 46 |
| Metro Exodus (2019) | 73.3 | 36.9 | 27.5 | 22.6 |
| Dirt Rally 2.0 (2019) | 154 | 81.6 | 68.8 | 38.7 |
| The Division 2 (2019) | 82 | 56 | 45 | 32 |
| Anno 1800 (2019) | 60.4 | 52.2 | 34.7 | 18 |
| Rage 2 (2019) | 103 | 46.5 | 39.7 | 38.9 |
| F1 2019 (2019) | 127 | 83 | 69 | 46 |
| Control (2019) | 120 | 39.9 | 29.1 | |
| Borderlands 3 (2019) | 86 | 53.6 | 34.9 | 26 |
| FIFA 20 (2019) | 150 | 118 | 115 | 114 |
| Ghost Recon Breakpoint (2019) | 63 | 41 | 39 | 26 |
| GRID 2019 (2019) | 92.4 | 65.9 | 53.4 | 36.7 |
| Call of Duty Modern Warfare 2019 (2019) | 94.1 | 59 | 49.8 | 40.6 |
| Need for Speed Heat (2019) | 67.6 | 52.2 | 46.8 | 37.2 |
| Star Wars Jedi Fallen Order (2019) | 57.2 | 49.7 | 44.4 | |
| Red Dead Redemption 2 (2019) | 56.3 | 43.5 | 29.3 | 18.6 |
Degré de la nuisance sonore
| Au repos |
| 35 / 36 / 37 dB(A) |
| Fortement sollicité |
| 44 / 43 dB(A) |
 | ||
30 dB silencieux 40 dB(A) audible 50 dB(A) bruyant |
||
min: | ||
| MSI GF63 Thin 9SC i5-9300H, GeForce GTX 1650 Max-Q | Dell G5 15 5590-PCNJJ i5-9300H, GeForce GTX 1650 Mobile | Acer Aspire Nitro 5 AN515-54-53Z2 i5-9300H, GeForce GTX 1650 Mobile | HP Omen 15-dc1020ng i5-9300H, GeForce GTX 1650 Mobile | Lenovo IdeaPad L340-15IRH 81LK00BMGE i5-9300H, GeForce GTX 1650 Mobile | Moyenne de la classe Gaming | |
|---|---|---|---|---|---|---|
| Noise | -3% | 1% | 14% | 16% | 11% | |
| arrêt / environnement * (dB) | 30 | 30 -0% | 30 -0% | 28.8 4% | 28.4 5% | 24.1 ? 20% |
| Idle Minimum * (dB) | 35 | 31 11% | 30 14% | 28.8 18% | 28.4 19% | 25.9 ? 26% |
| Idle Average * (dB) | 36 | 32 11% | 31 14% | 29.5 18% | 28.4 21% | 27.4 ? 24% |
| Idle Maximum * (dB) | 37 | 35 5% | 33 11% | 31.1 16% | 28.4 23% | 29.9 ? 19% |
| Load Average * (dB) | 44 | 49 -11% | 46 -5% | 35.2 20% | 30.1 32% | 43 ? 2% |
| Witcher 3 ultra * (dB) | 41 | 47 -15% | 46 -12% | 35.2 14% | 40.2 2% | |
| Load Maximum * (dB) | 43 | 53 -23% | 49 -14% | 41 5% | 40.2 7% | 54.1 ? -26% |
* ... Moindre est la valeur, meilleures sont les performances
(-) La température maximale du côté supérieur est de 47 °C / 117 F, par rapport à la moyenne de 40.4 °C / 105 F, allant de 21.2 à 68.8 °C pour la classe Gaming.
(-) Le fond chauffe jusqu'à un maximum de 47 °C / 117 F, contre une moyenne de 43.2 °C / 110 F
(+) En utilisation inactive, la température moyenne du côté supérieur est de 23.8 °C / 75 F, par rapport à la moyenne du dispositif de 33.9 °C / 93 F.
(-) En jouant à The Witcher 3, la température moyenne du côté supérieur est de 38.8 °C / 102 F, alors que la moyenne de l'appareil est de 33.9 °C / 93 F.
(+) Les repose-poignets et le pavé tactile atteignent la température maximale de la peau (32 °C / 89.6 F) et ne sont donc pas chauds.
(-) La température moyenne de la zone de l'appui-paume de dispositifs similaires était de 28.8 °C / 83.8 F (-3.2 °C / #-5.8 F).
| MSI GF63 Thin 9SC i5-9300H, GeForce GTX 1650 Max-Q | Dell G5 15 5590-PCNJJ i5-9300H, GeForce GTX 1650 Mobile | Acer Aspire Nitro 5 AN515-54-53Z2 i5-9300H, GeForce GTX 1650 Mobile | HP Omen 15-dc1020ng i5-9300H, GeForce GTX 1650 Mobile | Lenovo IdeaPad L340-15IRH 81LK00BMGE i5-9300H, GeForce GTX 1650 Mobile | Moyenne de la classe Gaming | |
|---|---|---|---|---|---|---|
| Heat | -4% | 2% | 6% | -8% | -13% | |
| Maximum Upper Side * (°C) | 47 | 49 -4% | 47 -0% | 40.3 14% | 44.8 5% | 45.2 ? 4% |
| Maximum Bottom * (°C) | 47 | 55 -17% | 50 -6% | 48.5 -3% | 58.1 -24% | 48.1 ? -2% |
| Idle Upper Side * (°C) | 26 | 25 4% | 24 8% | 23.9 8% | 27.9 -7% | 31.1 ? -20% |
| Idle Bottom * (°C) | 26 | 26 -0% | 25 4% | 24.6 5% | 27.9 -7% | 34.3 ? -32% |
* ... Moindre est la valeur, meilleures sont les performances
MSI GF63 Thin 9SC analyse audio
(+) | les haut-parleurs peuvent jouer relativement fort (86# dB)
Basses 100 - 315 Hz
(-) | presque aucune basse - en moyenne 19.5% plus bas que la médiane
(±) | la linéarité des basses est moyenne (10.9% delta à la fréquence précédente)
Médiums 400 - 2000 Hz
(±) | médiane supérieure - en moyenne 7.7% supérieure à la médiane
(±) | la linéarité des médiums est moyenne (9.9% delta à la fréquence précédente)
Aiguës 2 - 16 kHz
(+) | des sommets équilibrés - à seulement 1.8% de la médiane
(+) | les aigus sont linéaires (6.3% delta à la fréquence précédente)
Globalement 100 - 16 000 Hz
(±) | la linéarité du son global est moyenne (18.9% de différence avec la médiane)
Par rapport à la même classe
» 63% de tous les appareils testés de cette catégorie étaient meilleurs, 8% similaires, 29% pires
» Le meilleur avait un delta de 6%, la moyenne était de 18%, le pire était de 132%.
Par rapport à tous les appareils testés
» 44% de tous les appareils testés étaient meilleurs, 8% similaires, 48% pires
» Le meilleur avait un delta de 4%, la moyenne était de 24%, le pire était de 134%.
Dell G5 15 5590-PCNJJ analyse audio
(+) | les haut-parleurs peuvent jouer relativement fort (87# dB)
Basses 100 - 315 Hz
(-) | presque aucune basse - en moyenne 19.7% plus bas que la médiane
(±) | la linéarité des basses est moyenne (11.9% delta à la fréquence précédente)
Médiums 400 - 2000 Hz
(±) | médiane supérieure - en moyenne 5.7% supérieure à la médiane
(+) | les médiums sont linéaires (4.9% delta à la fréquence précédente)
Aiguës 2 - 16 kHz
(±) | sommets réduits - en moyenne 6.5% plus bas que la médiane
(±) | la linéarité des aigus est moyenne (9.6% delta à la fréquence précédente)
Globalement 100 - 16 000 Hz
(±) | la linéarité du son global est moyenne (17.4% de différence avec la médiane)
Par rapport à la même classe
» 48% de tous les appareils testés de cette catégorie étaient meilleurs, 12% similaires, 40% pires
» Le meilleur avait un delta de 6%, la moyenne était de 18%, le pire était de 132%.
Par rapport à tous les appareils testés
» 33% de tous les appareils testés étaient meilleurs, 8% similaires, 59% pires
» Le meilleur avait un delta de 4%, la moyenne était de 24%, le pire était de 134%.
| Éteint/en veille | |
| Au repos | |
| Fortement sollicité |
|
Légende:
min: | |
| MSI GF63 Thin 9SC i5-9300H, GeForce GTX 1650 Max-Q | Dell G5 15 5590-PCNJJ i5-9300H, GeForce GTX 1650 Mobile | Acer Aspire Nitro 5 AN515-54-53Z2 i5-9300H, GeForce GTX 1650 Mobile | HP Omen 15-dc1020ng i5-9300H, GeForce GTX 1650 Mobile | Lenovo IdeaPad L340-15IRH 81LK00BMGE i5-9300H, GeForce GTX 1650 Mobile | Moyenne de la classe Gaming | |
|---|---|---|---|---|---|---|
| Power Consumption | 9% | 8% | 9% | 20% | -76% | |
| Idle Minimum * (Watt) | 7 | 4 43% | 5 29% | 4.04 42% | 3.8 46% | 13.2 ? -89% |
| Idle Average * (Watt) | 9 | 7 22% | 7 22% | 7.2 20% | 6.6 27% | 18.9 ? -110% |
| Idle Maximum * (Watt) | 13 | 12 8% | 11 15% | 11.4 12% | 8.9 32% | 24.5 ? -88% |
| Load Average * (Watt) | 79 | 95 -20% | 89 -13% | 80.8 -2% | 78.4 1% | 108.8 ? -38% |
| Witcher 3 ultra * (Watt) | 73 | 86 -18% | 90 -23% | 93.6 -28% | 82 -12% | |
| Load Maximum * (Watt) | 164 | 135 18% | 132 20% | 144.5 12% | 124 24% | 254 ? -55% |
* ... Moindre est la valeur, meilleures sont les performances
| MSI GF63 Thin 9SC i5-9300H, GeForce GTX 1650 Max-Q, 51 Wh | Dell G5 15 5590-PCNJJ i5-9300H, GeForce GTX 1650 Mobile, 60 Wh | Acer Aspire Nitro 5 AN515-54-53Z2 i5-9300H, GeForce GTX 1650 Mobile, 57 Wh | HP Omen 15-dc1020ng i5-9300H, GeForce GTX 1650 Mobile, 52.5 Wh | Lenovo IdeaPad L340-15IRH 81LK00BMGE i5-9300H, GeForce GTX 1650 Mobile, 45 Wh | Moyenne de la classe Gaming | |
|---|---|---|---|---|---|---|
| Autonomie de la batterie | 79% | 71% | 44% | 5% | 28% | |
| Reader / Idle (h) | 8.5 | 14.5 71% | 17.4 105% | 15.9 87% | 7.8 -8% | 8.71 ? 2% |
| WiFi v1.3 (h) | 4.4 | 8 82% | 8.1 84% | 6.4 45% | 6.1 39% | 6.96 ? 58% |
| Load (h) | 1.2 | 2.2 83% | 1.5 25% | 1.2 0% | 1 -17% | 1.47 ? 23% |
| H.264 (h) | 8 | 8.28 ? | ||||
| Witcher 3 ultra (h) | 1 |
Points positifs
Points négatifs
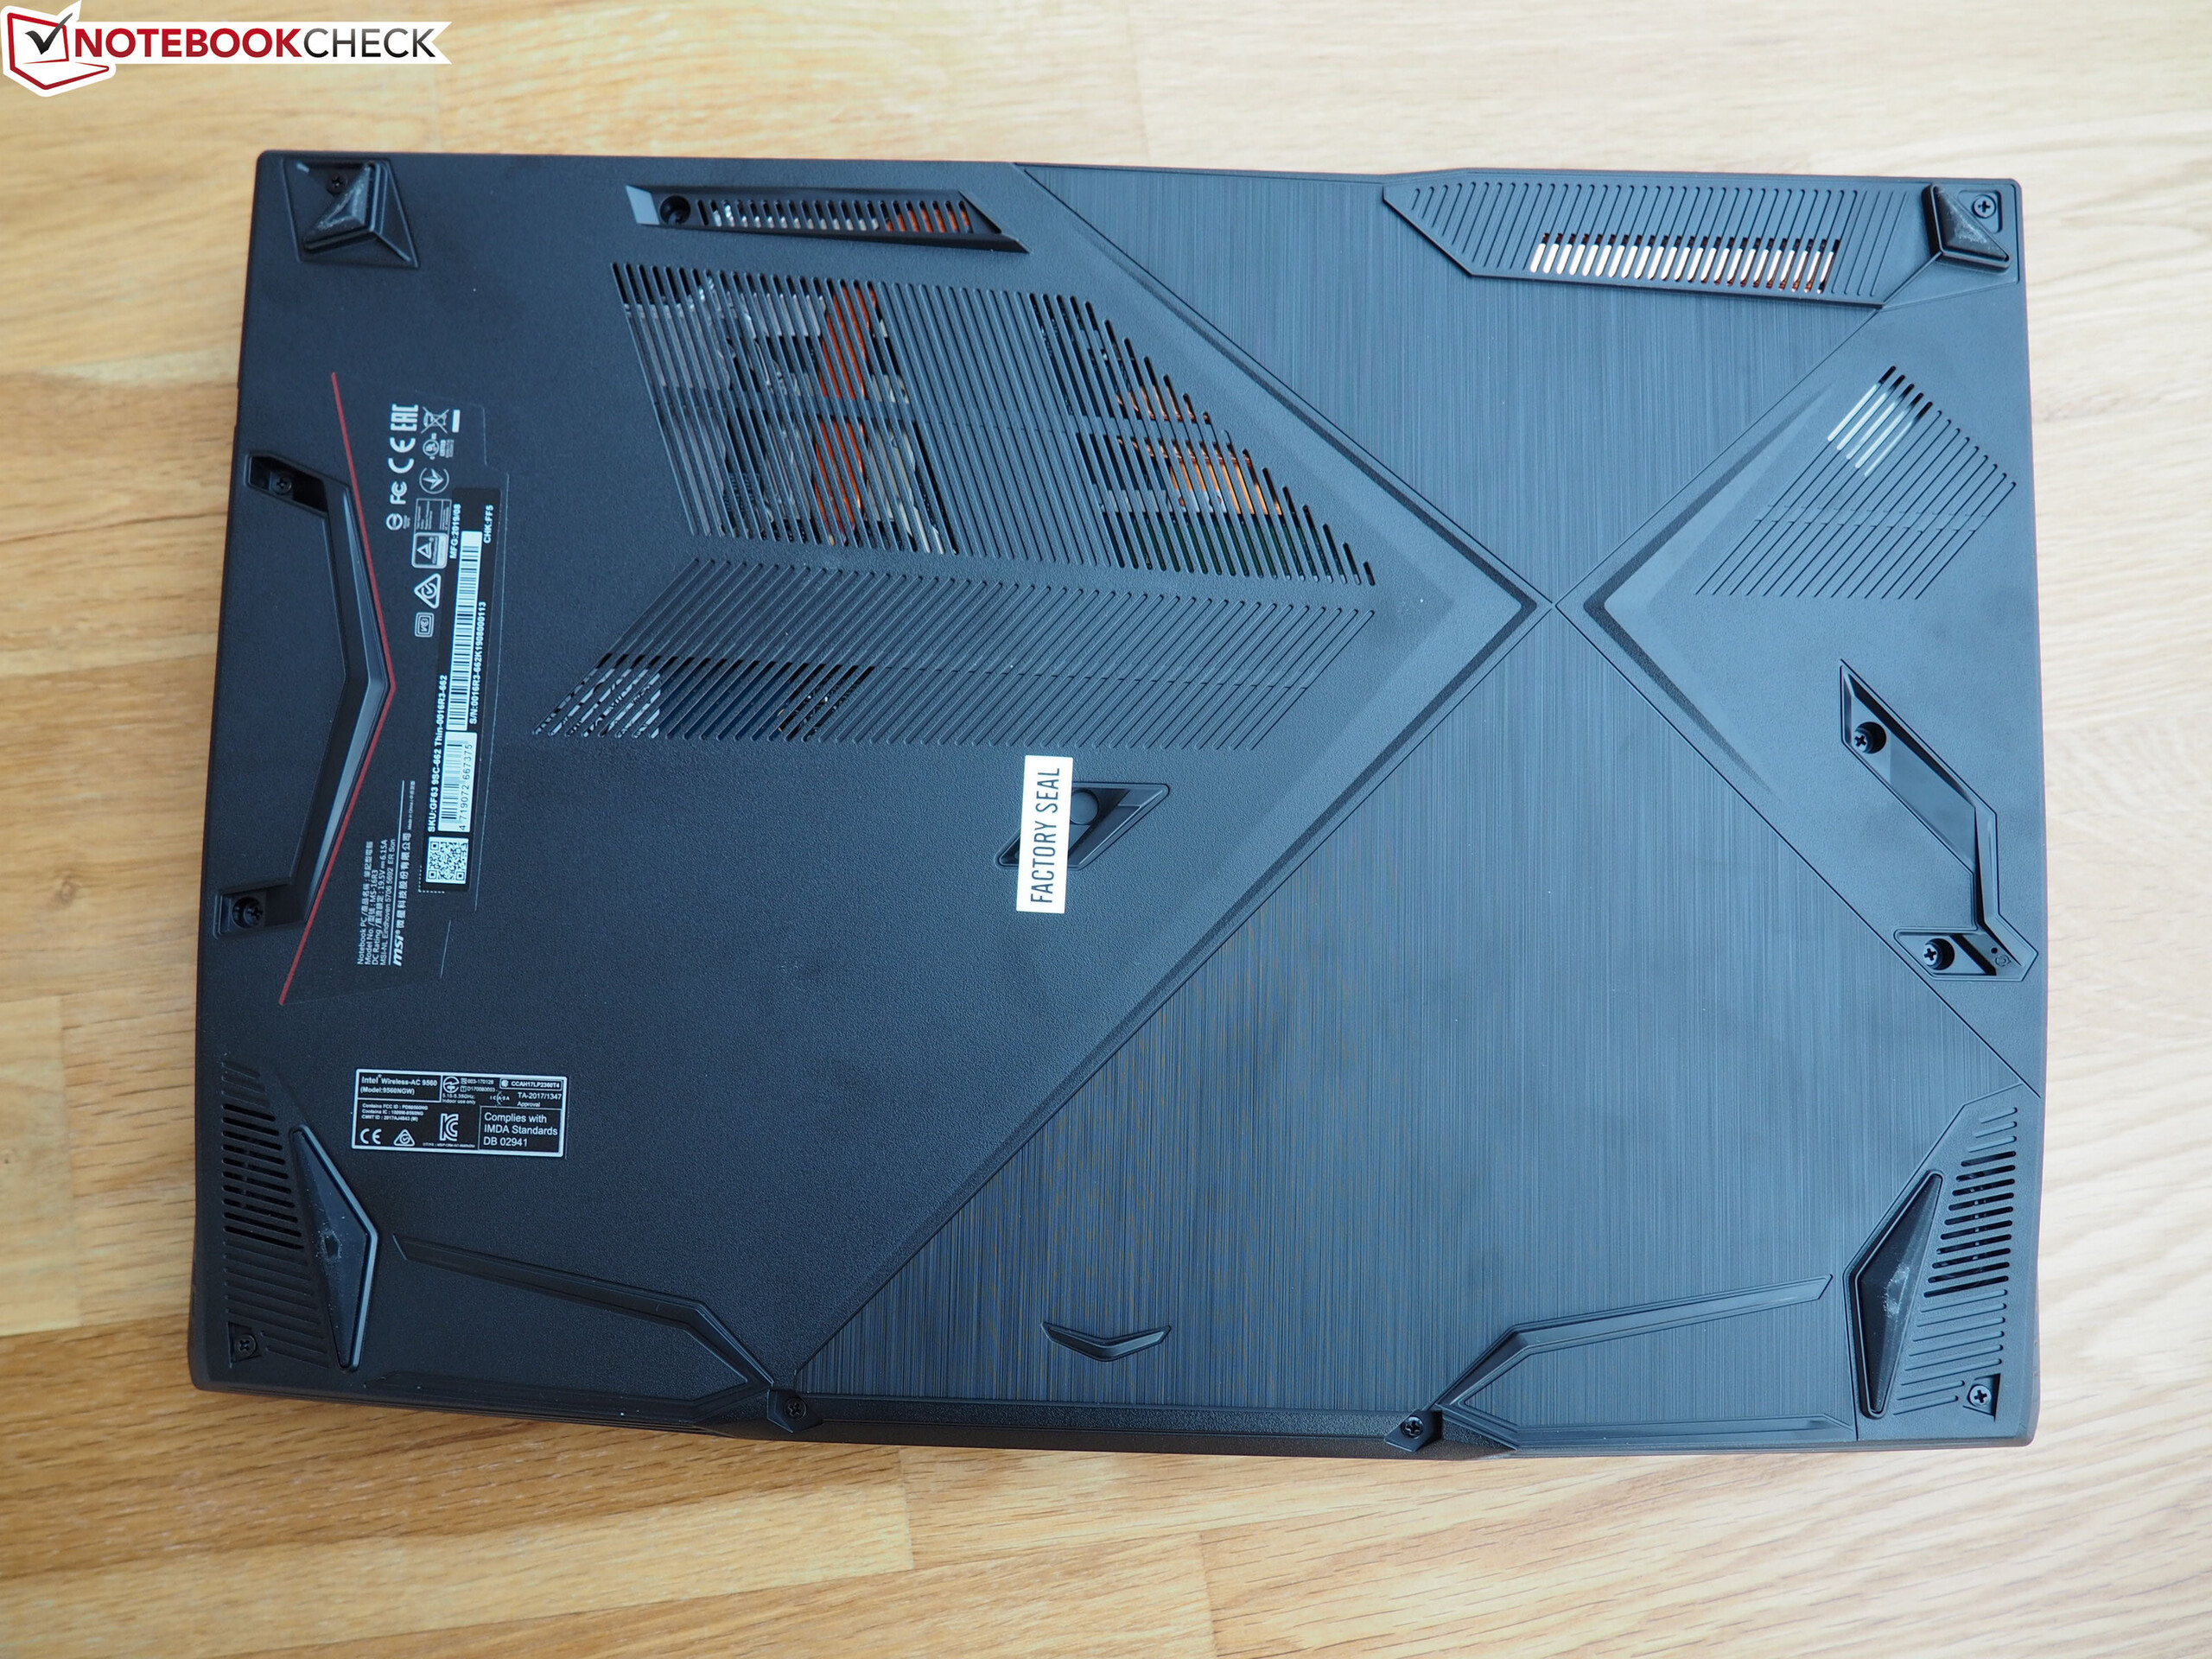
Si l’on oublie la sélection réduite des ports (absence de lecteur de carte, de DisplayPort, de Thunderbolt 3 ou d’USB 3.1 Gen. 2), le contrôle du ventilateur qui pourrait être mieux ajusté (mode ralenti !) et l’écran relativement peu lumineux et lent, le MSI GF63 Thin 9SC ne possède pas de gros défaut.
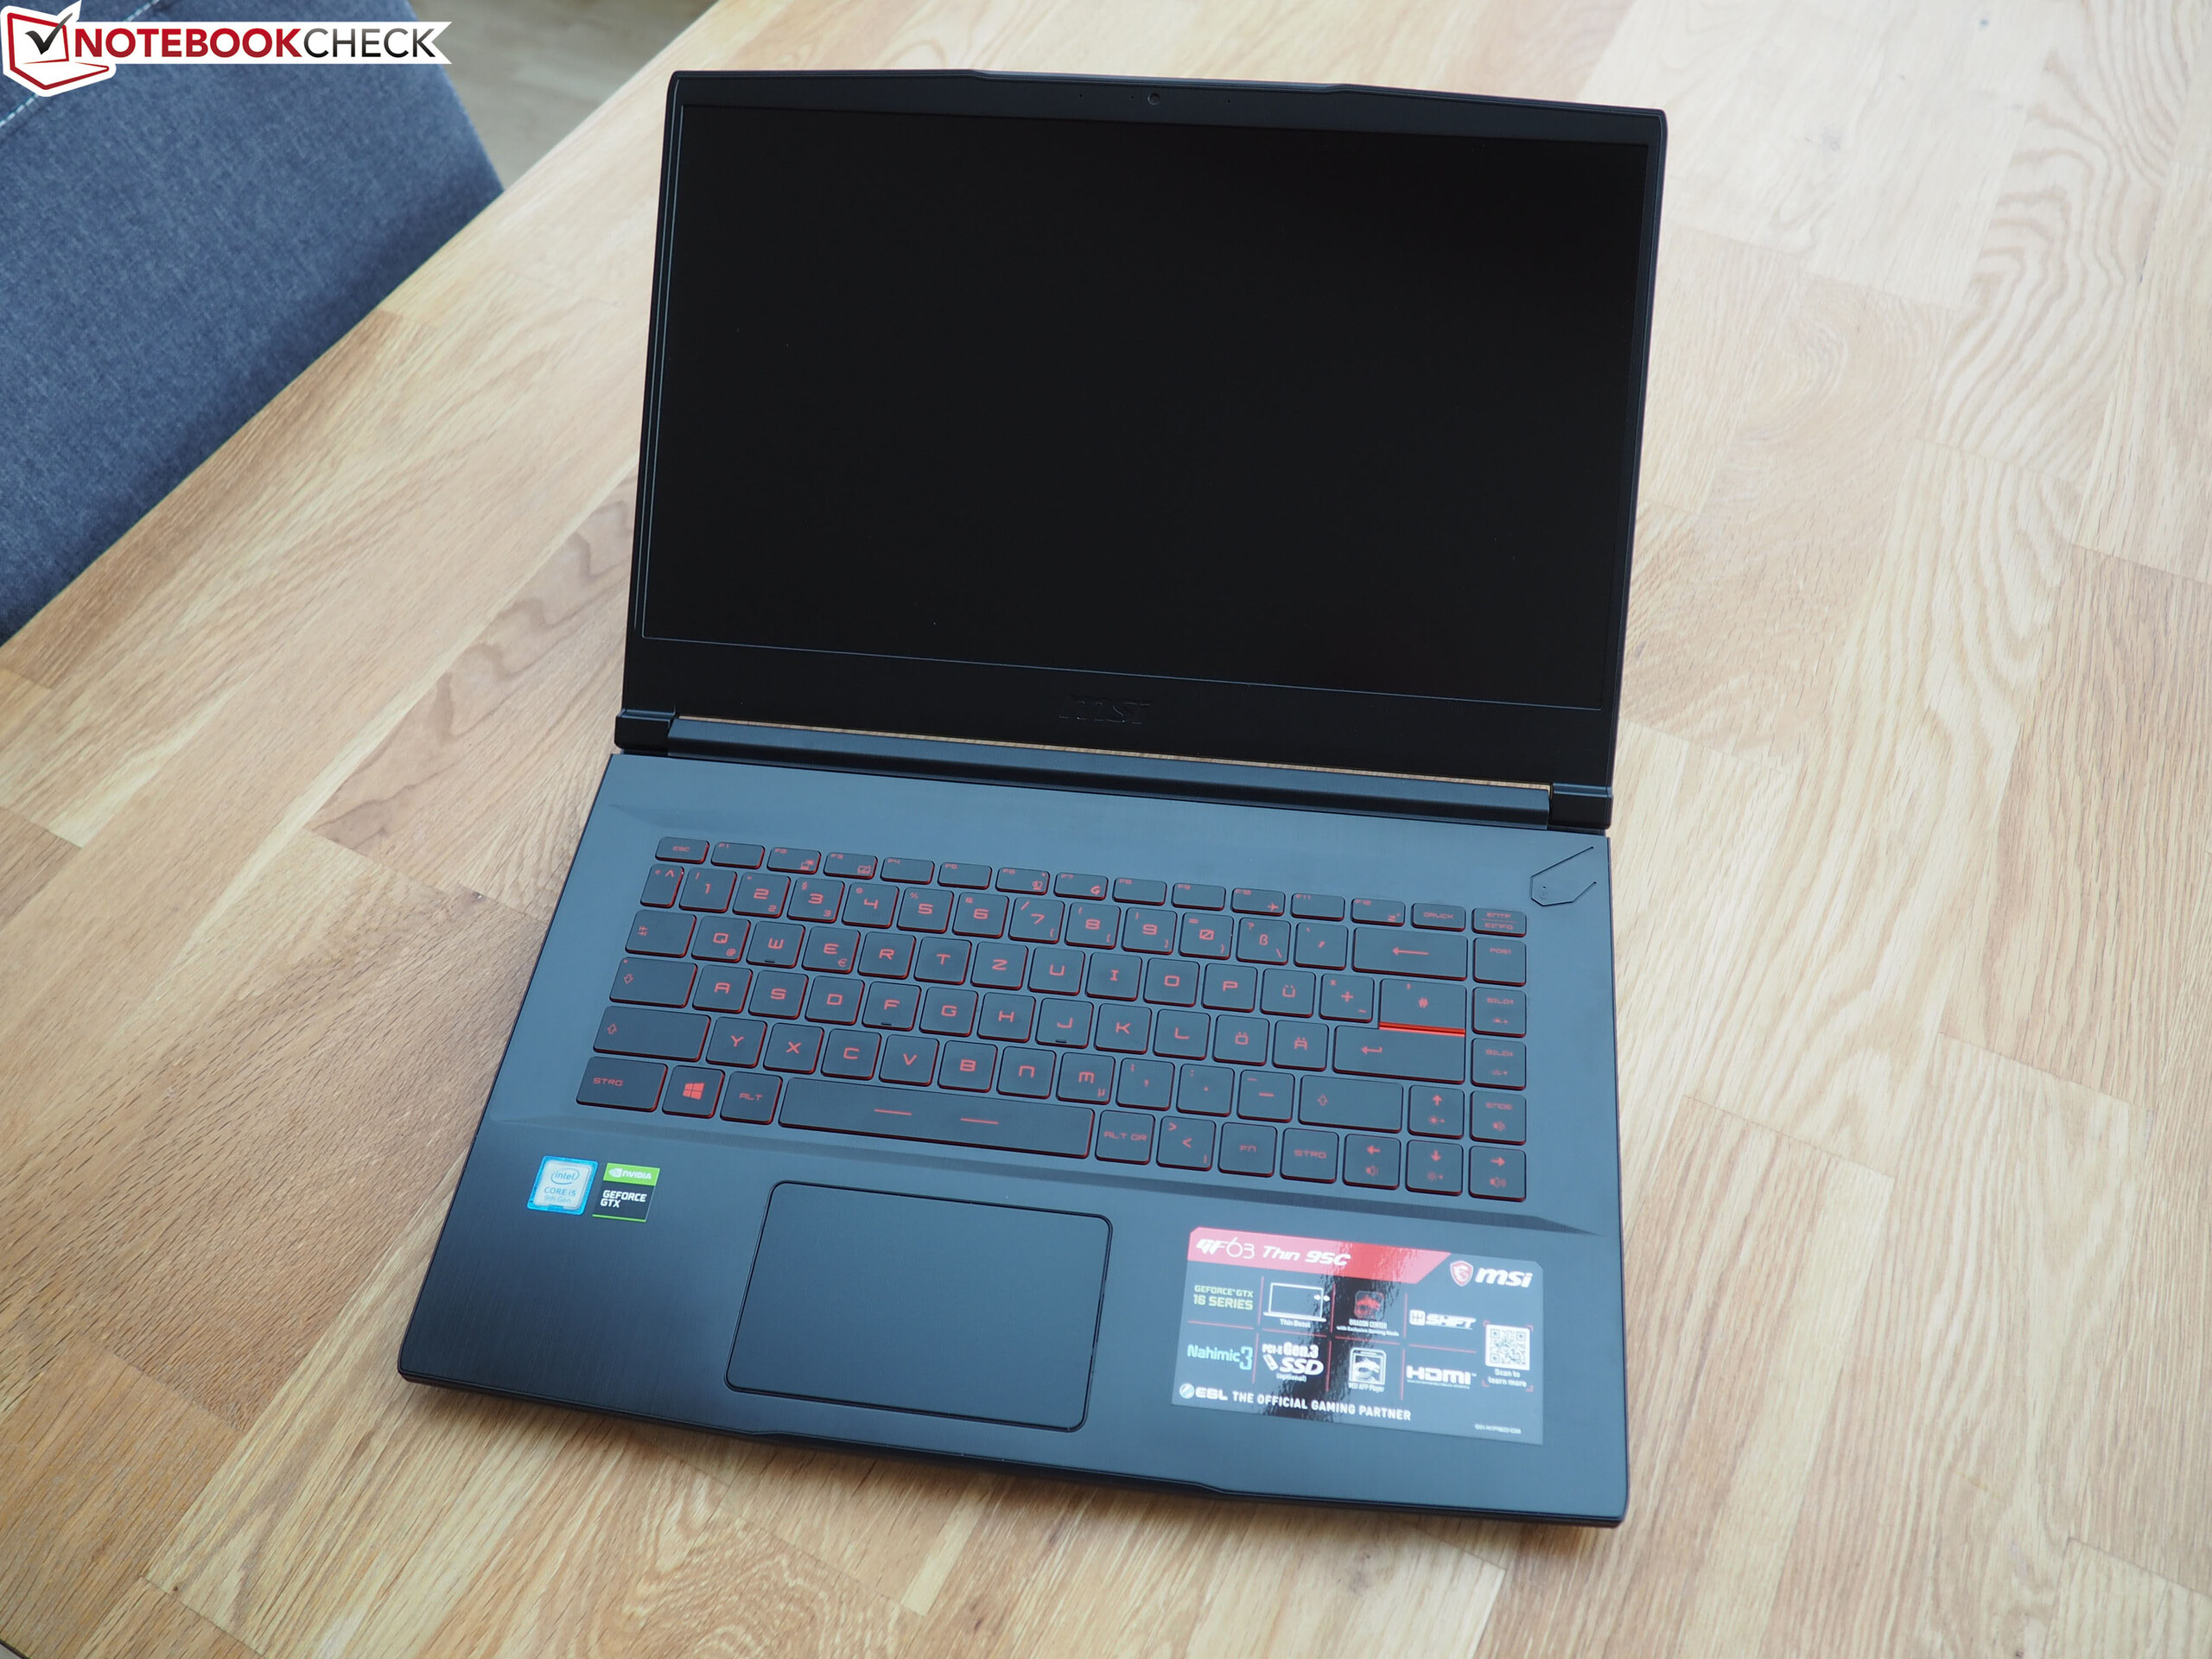
Le portable de jeu de 15 pouces est compact, léger, et possède un bon rapport prix / performances, ce qui devrait séduire les joueurs à la recherche d’un portable de jeu à la fois portable et abordable. Les périphériques d’entrée, l’autonomie, la qualité du châssis et les performances sont tous au bon niveau vu le prix de la machine.
Mais ce secteur est très compétitif, et il y a beaucoup d’alternatives similaires voire meilleurs proposées par les autres fabricants (Dell, Acer, HP, Lenovo par exemple).
L’intégralité de cette critique est disponible en anglais en suivant ce lien.
MSI GF63 Thin 9SC
- 05/14/2020 v7 (old)
Florian Glaser
Price comparison