Verdict - Faibles performances du processeur, performances de jeu médiocres
Il est ennuyeux de constater que les performances de l'unité centrale du Vector 17 chutent brutalement lors du test d'endurance, d'autant plus que le Vector 16 est toujours aussi performant avec un processeur plus faible. Les performances de jeu sont au mieux médiocres, mais assez constantes. Malheureusement, le Vector 17 est assez bruyant.
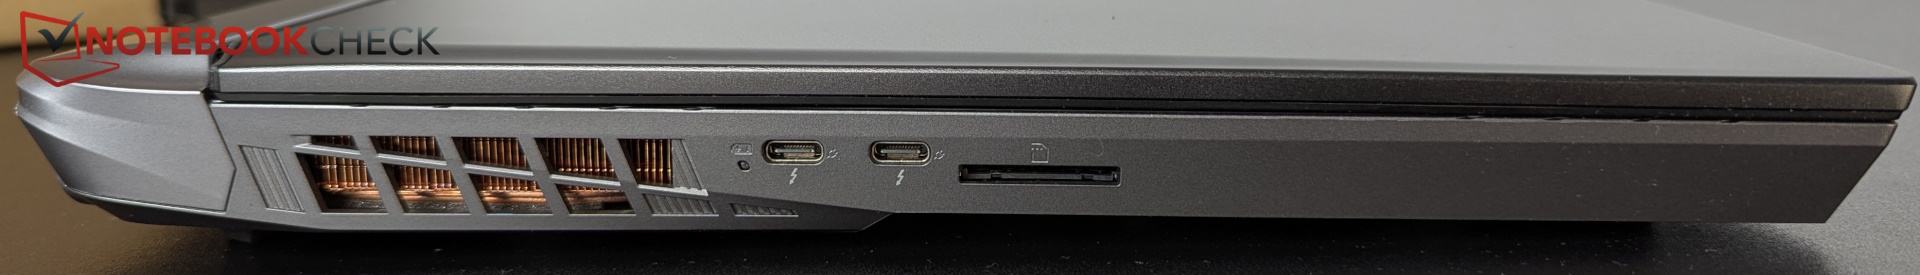
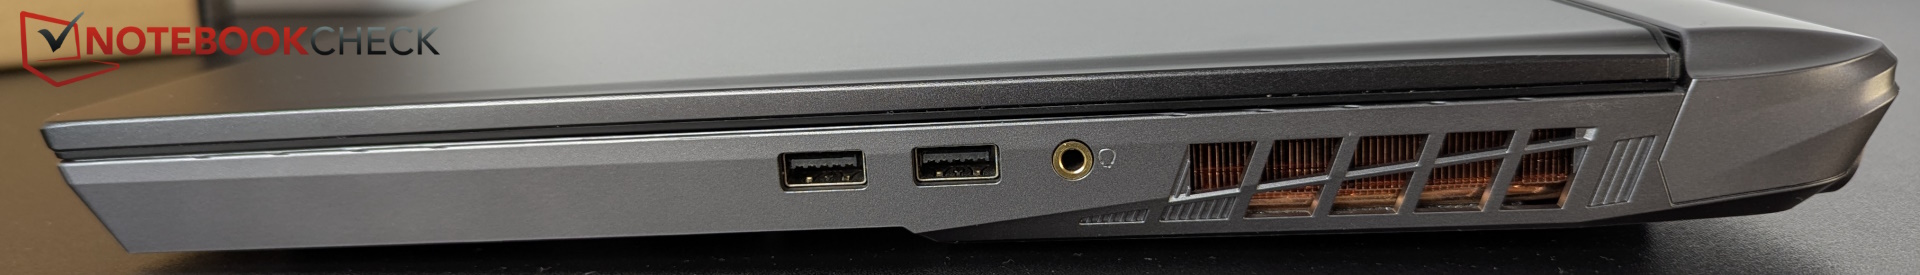
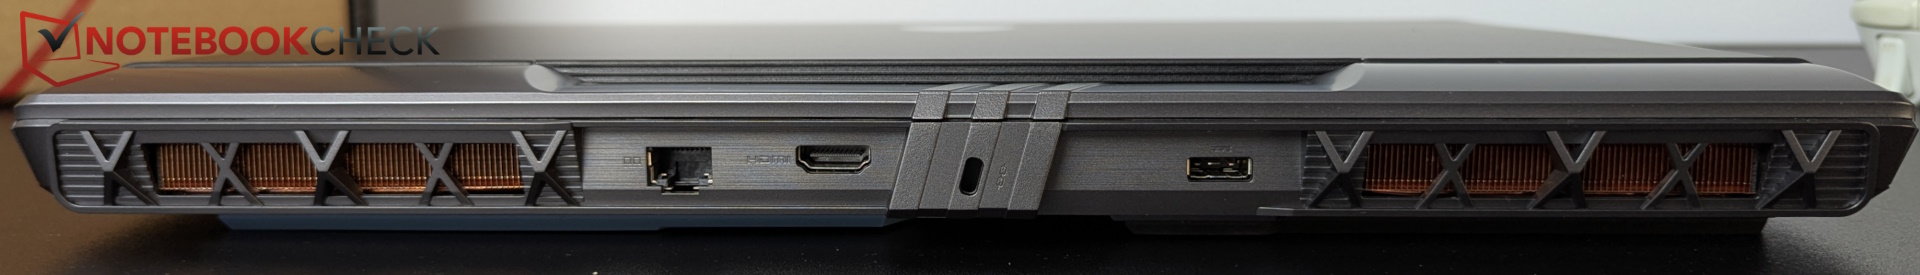
L'écran laisse une impression ambivalente : Il se distingue par une luminosité décente et l'espace colorimétrique P3, mais perd un peu de sympathie en raison d'une valeur de noir beaucoup trop élevée. D'un autre côté, l'équipement avec double Thunderbolt 5, lecteur SD complet et Wi-Fi 7 laisse une impression positive.
Il s'agit d'un ordinateur portable de jeu moyen à bon qui, hormis ses caractéristiques, ne sort pas du lot. Pour un prix à peu près équivalent, vous pouvez aussi vous procurer le Legion Pro 7i Gen 10 avec le même GPU, qui nous a beaucoup plus impressionnés lors du test.
Points positifs
Points négatifs
Prix et disponibilité
Le Vector 17 avec RTX 5080 coûte normalement 3,499 Euros (~$4066). Il vient d'être réduit à 3,099 Euros (~$3602) sur Amazon.
- $99.99400W 20V 20A AC Adapter for MSI Raider Titan 18 HX AI A2XWJG A2XWIG Vector A18 HX A9WIG A9WHG Laptop Charger A23-400P1A A400A001P ADP-400CB B Power Supply
- $1,899.99msi Vector 16 HX AI A2XWHG-285US WQXGA 240Hz Gaming Laptop, Intel Core Ultra 7 255HX 2.4GHz, 32GB RAM, 1TB SSD, NVIDIA GeForce RTX 5070 Ti 12GB, Window 11 Home, Cosmo Gray
- $2,709.00msi Vector 16 HX AI 400 Gaming Laptop, Intel Ultra 9-275HX, 32 GB DDR5 RAM, 1 TB PCIe SSD, 16" WQXGA (2560x1600) 240Hz Display, Nvidia G-Force RTX 5080, RGB Backlit Keyboard, W11 Pro, Cosmo Gray
Table des matières
- Verdict - Faibles performances du processeur, performances de jeu médiocres
- Spécifications
- Boîtier et caractéristiques - Aussi massif qu'un Alienware
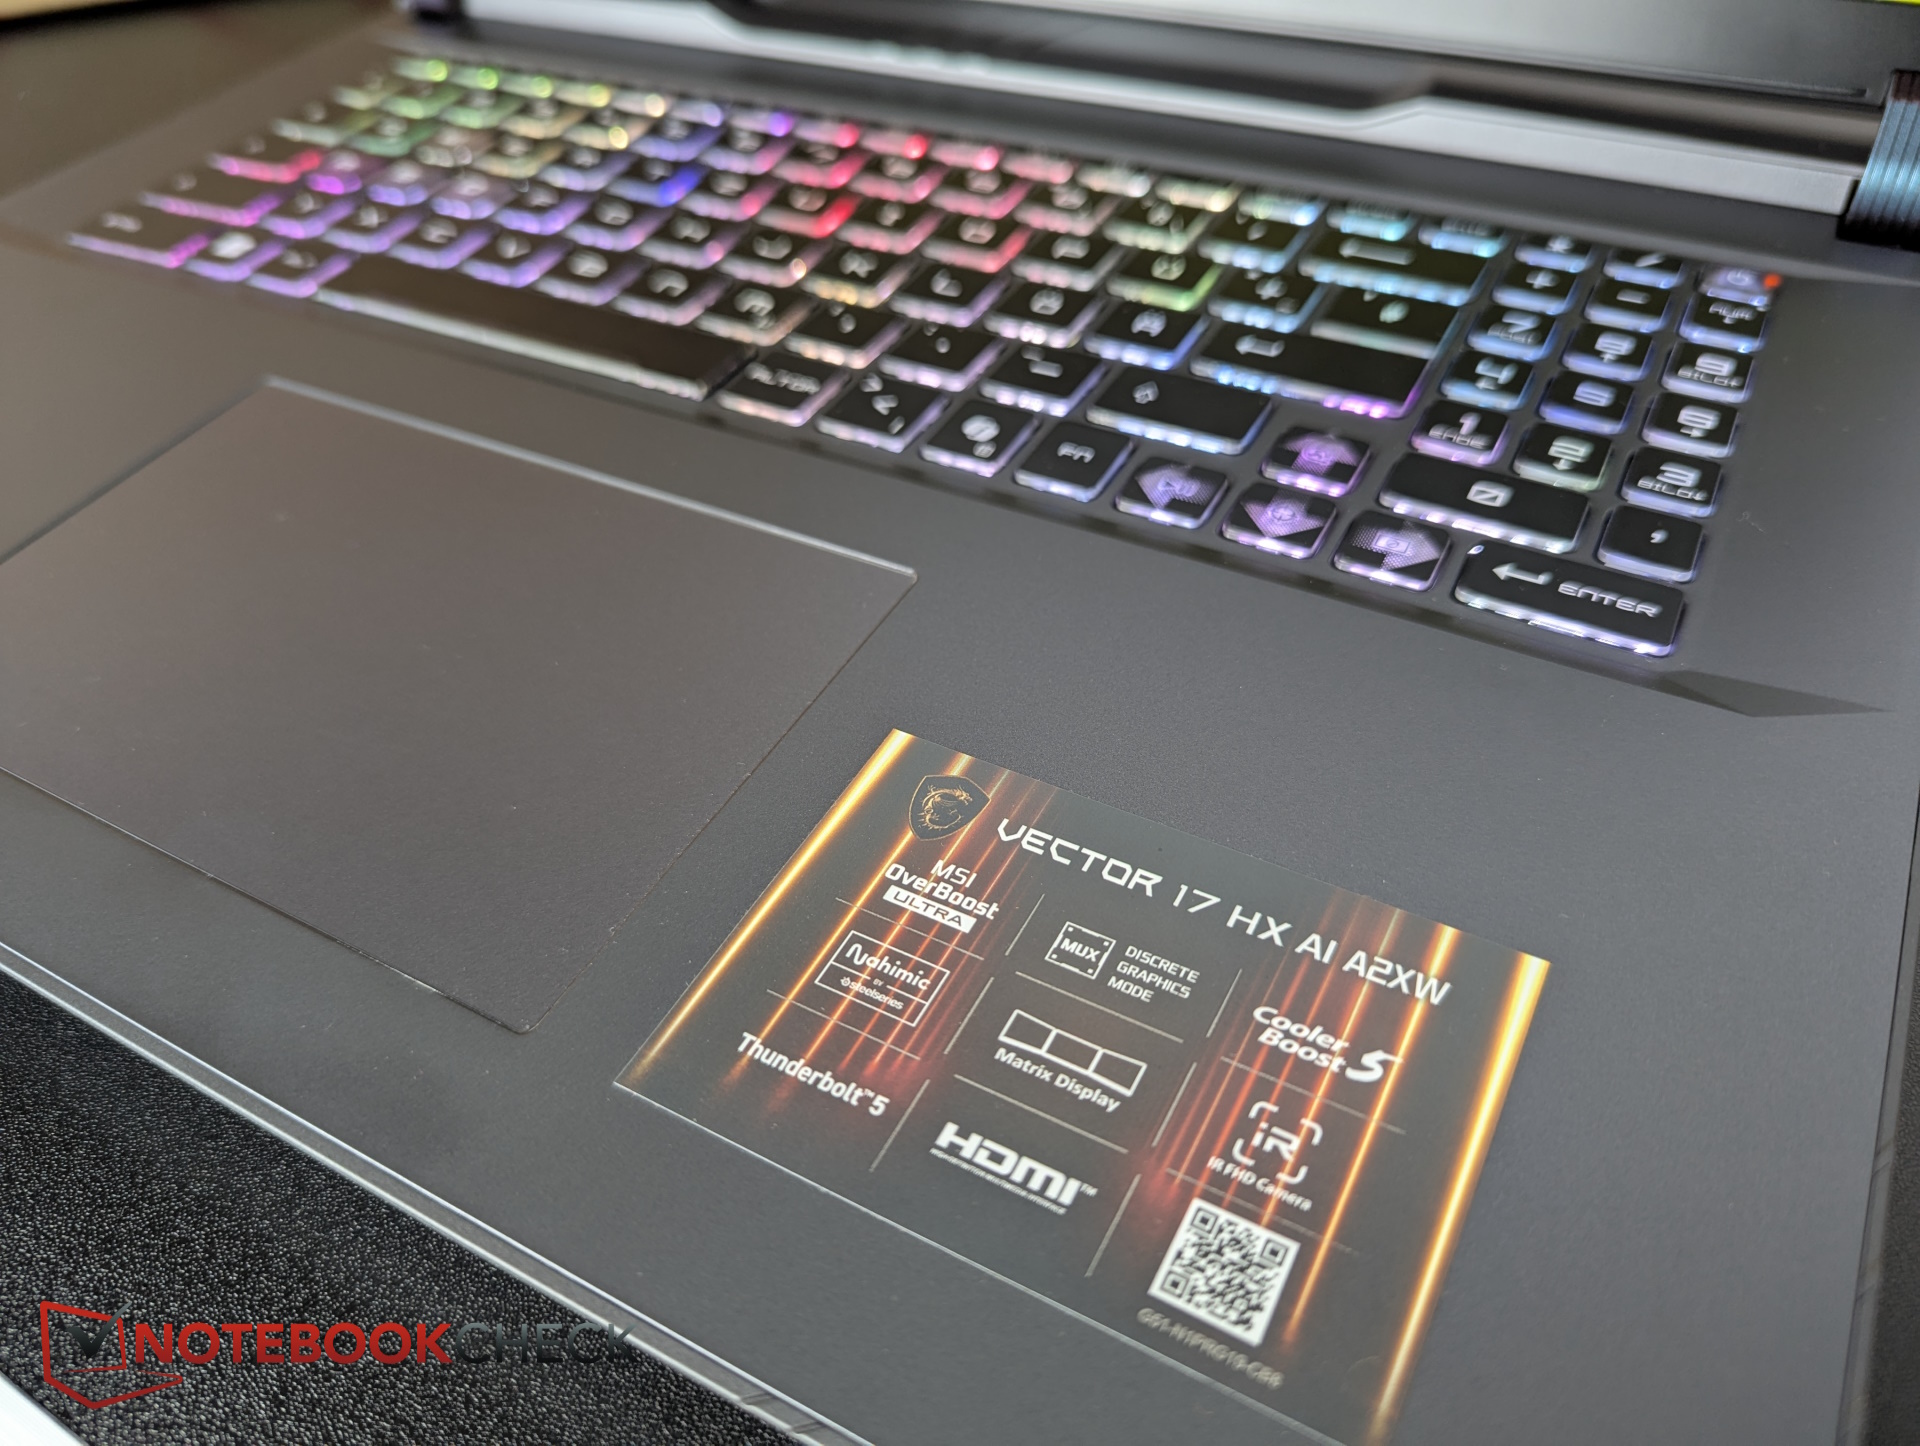
- Périphériques d'entrée - Cette présentation MSI !
- Écran - QHD+ IPS avec 470 nits
- Performance - Effondrement du processeur en cas de charge continue
- Émissions et énergie - Jusqu'à 60 dB(A), c'est assez bruyant en comparaison
- Notebookcheck note globale
- Comparaison des alternatives possibles
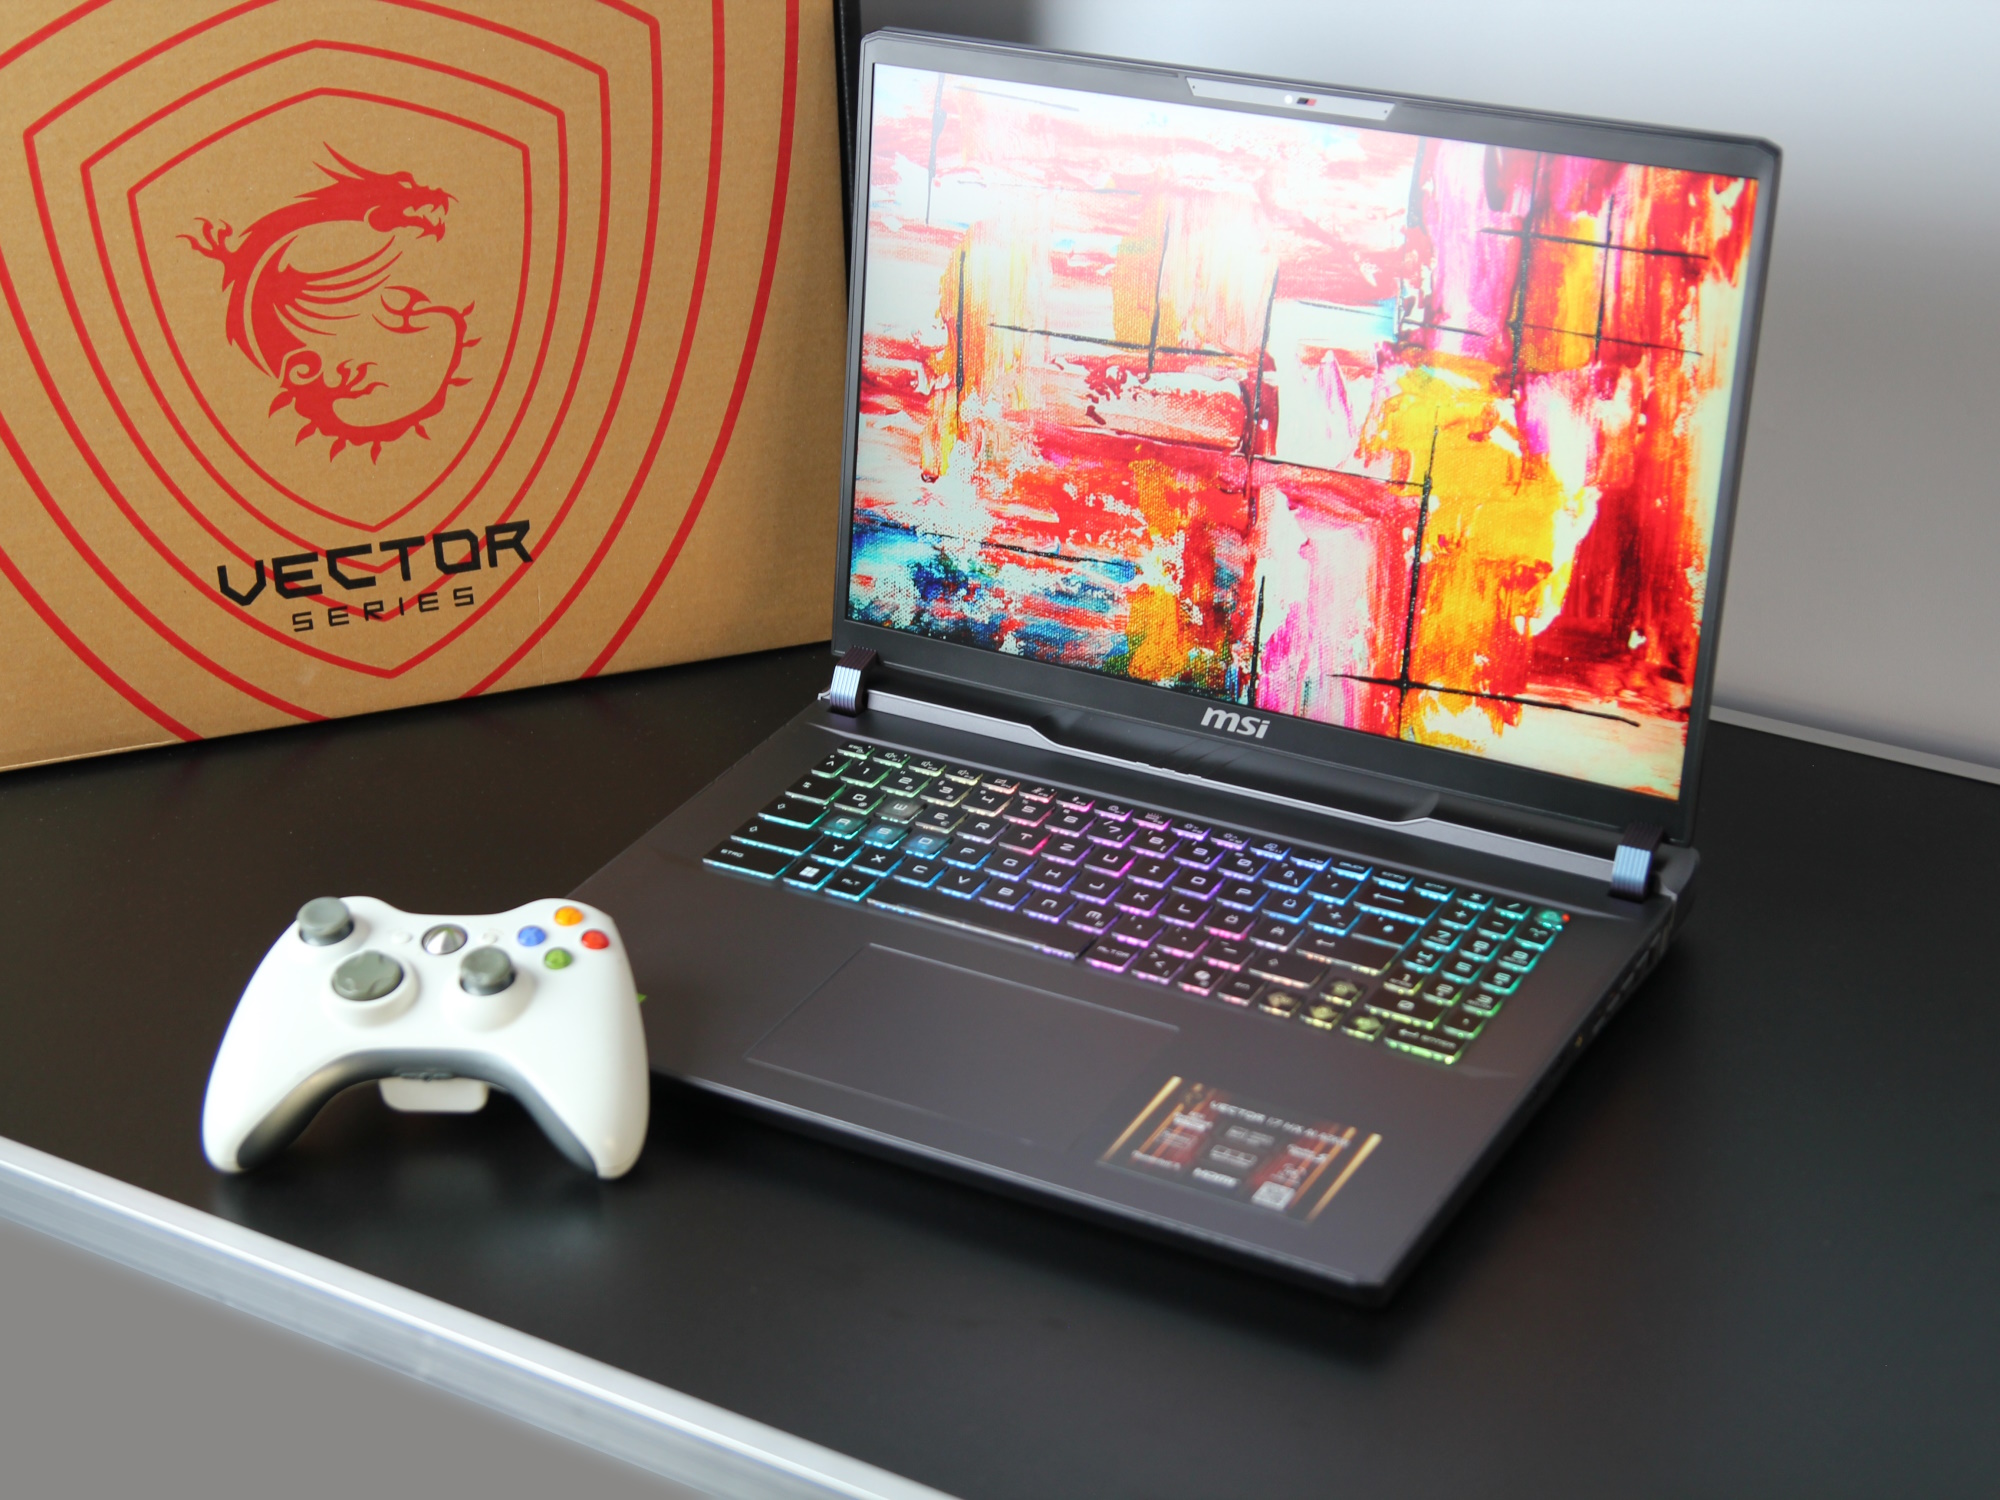
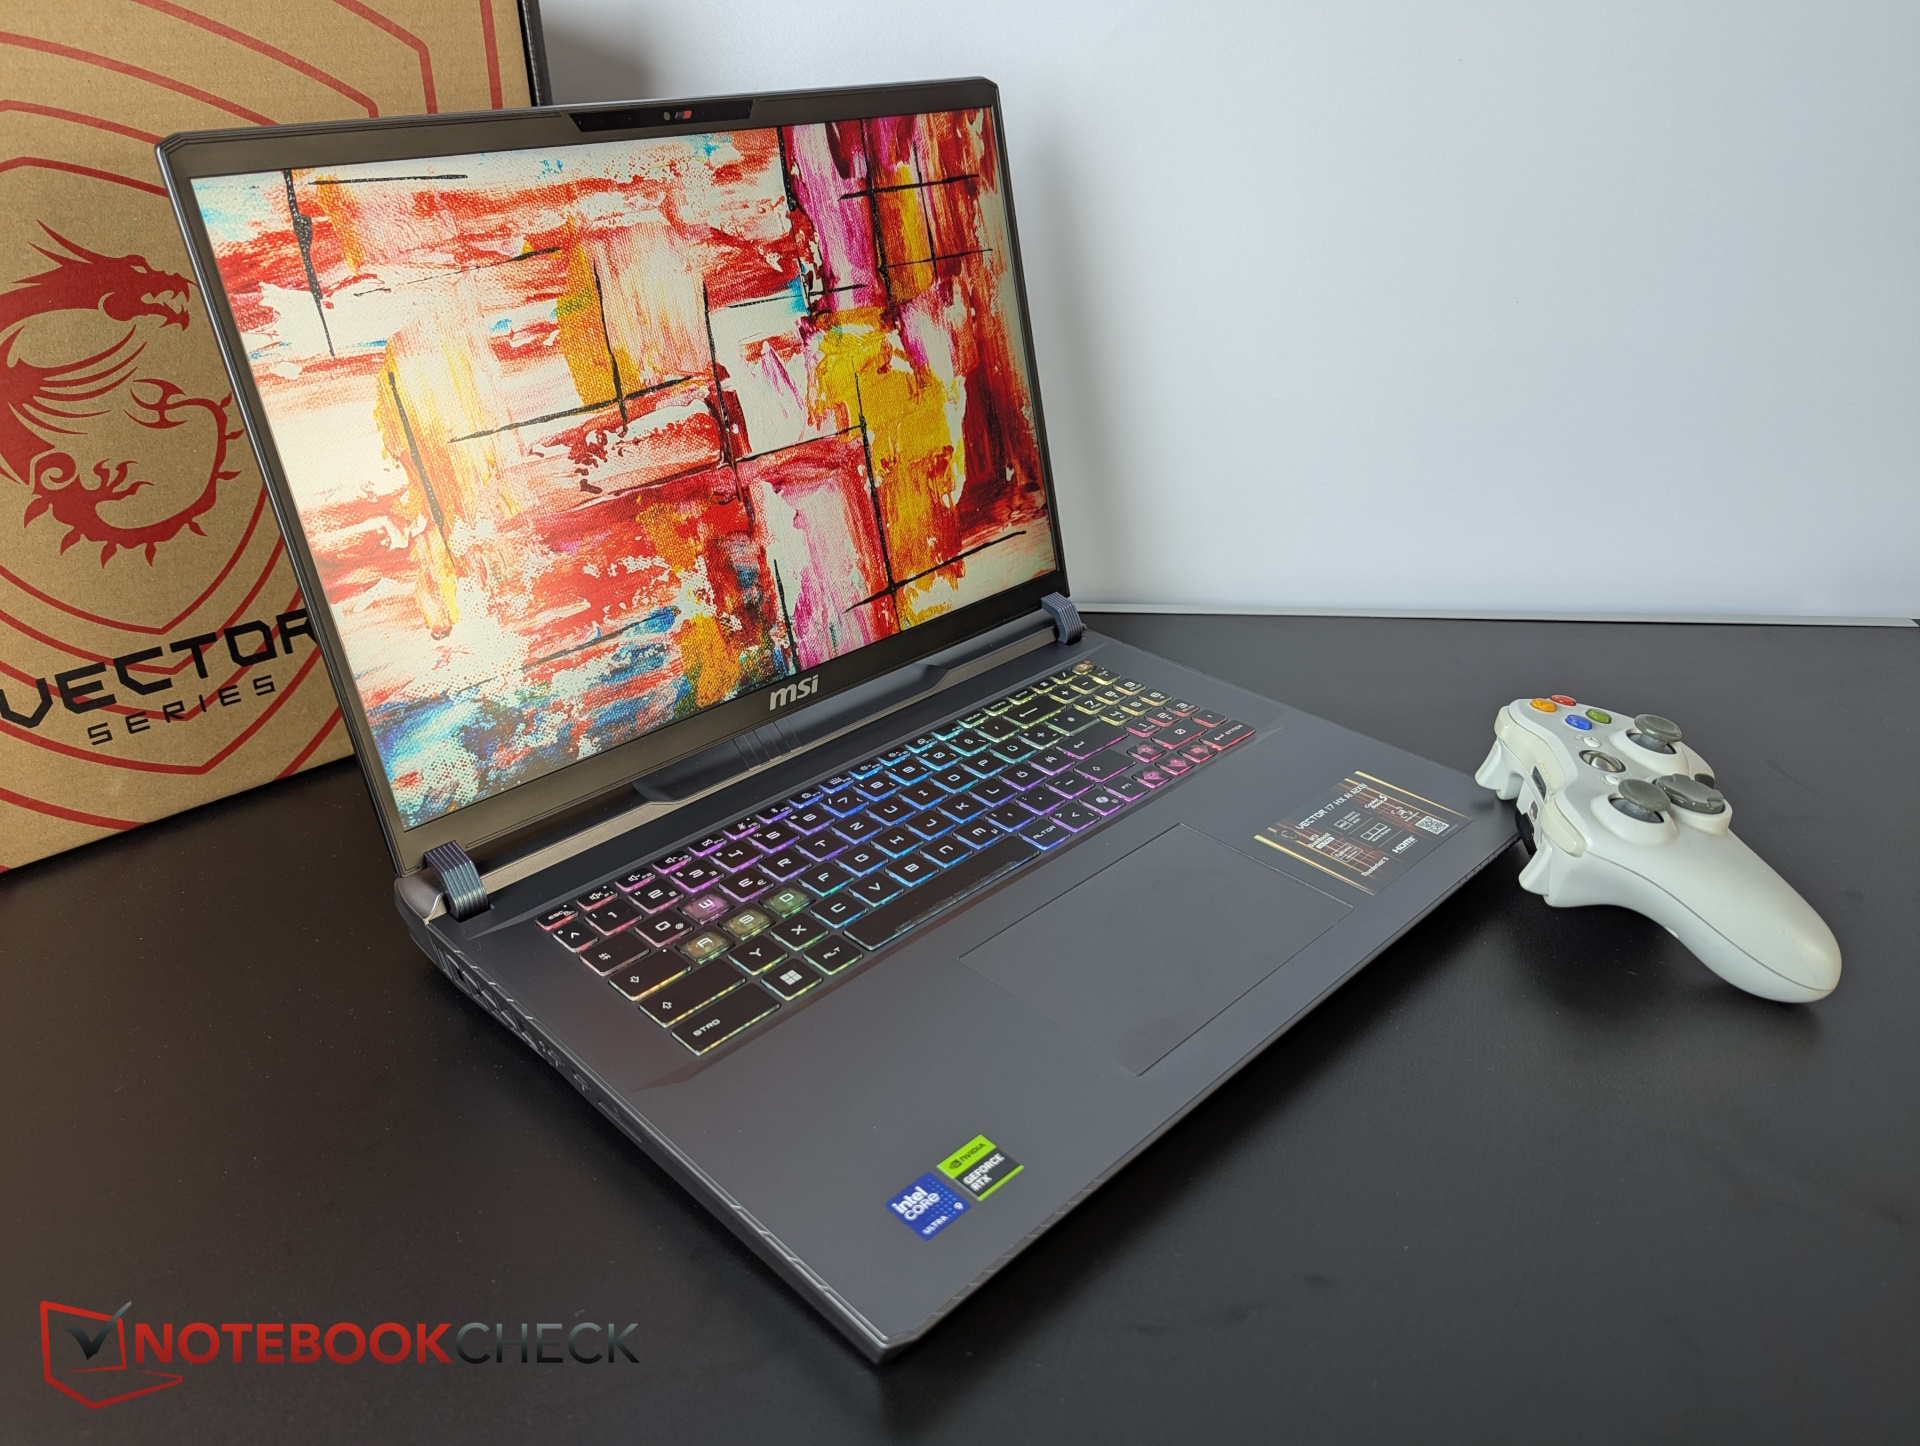
les gamers de 17 pouces avec des graphismes Blackwell sont extrêmement rares et le gamer se situe donc juste entre les nombreux appareils de 16 et 18 pouces. Notre Vector 17 HX AI est disponible avec RTX 5090, 5080 ou 5070 Ti, nous testons la configuration intermédiaire.
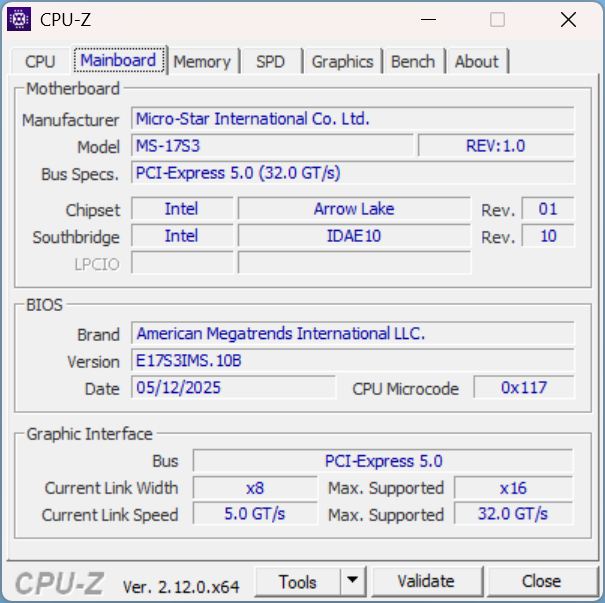
Spécifications
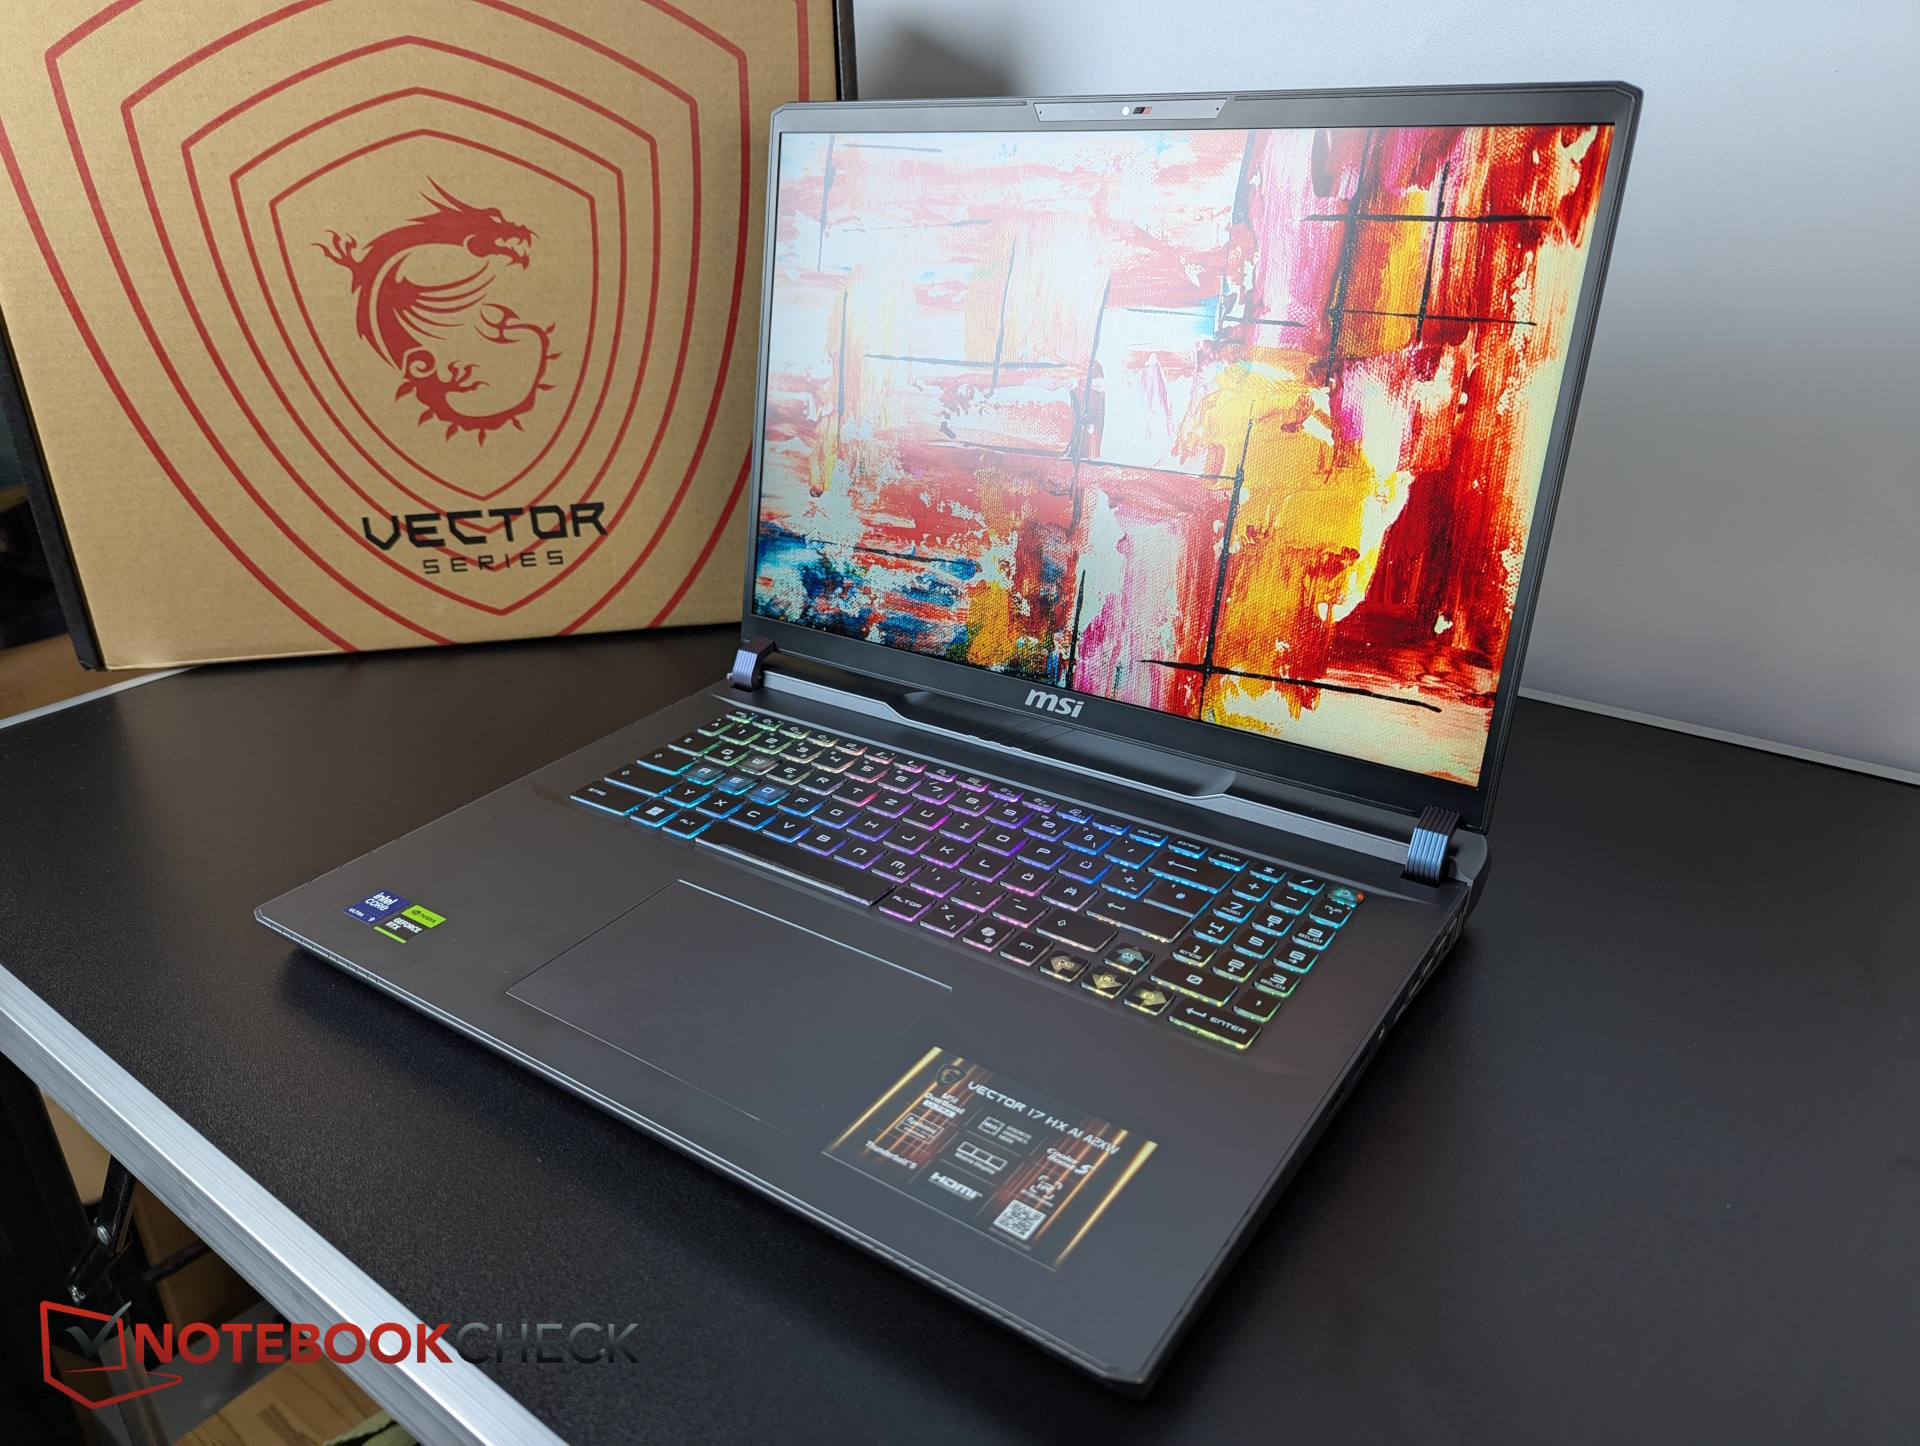
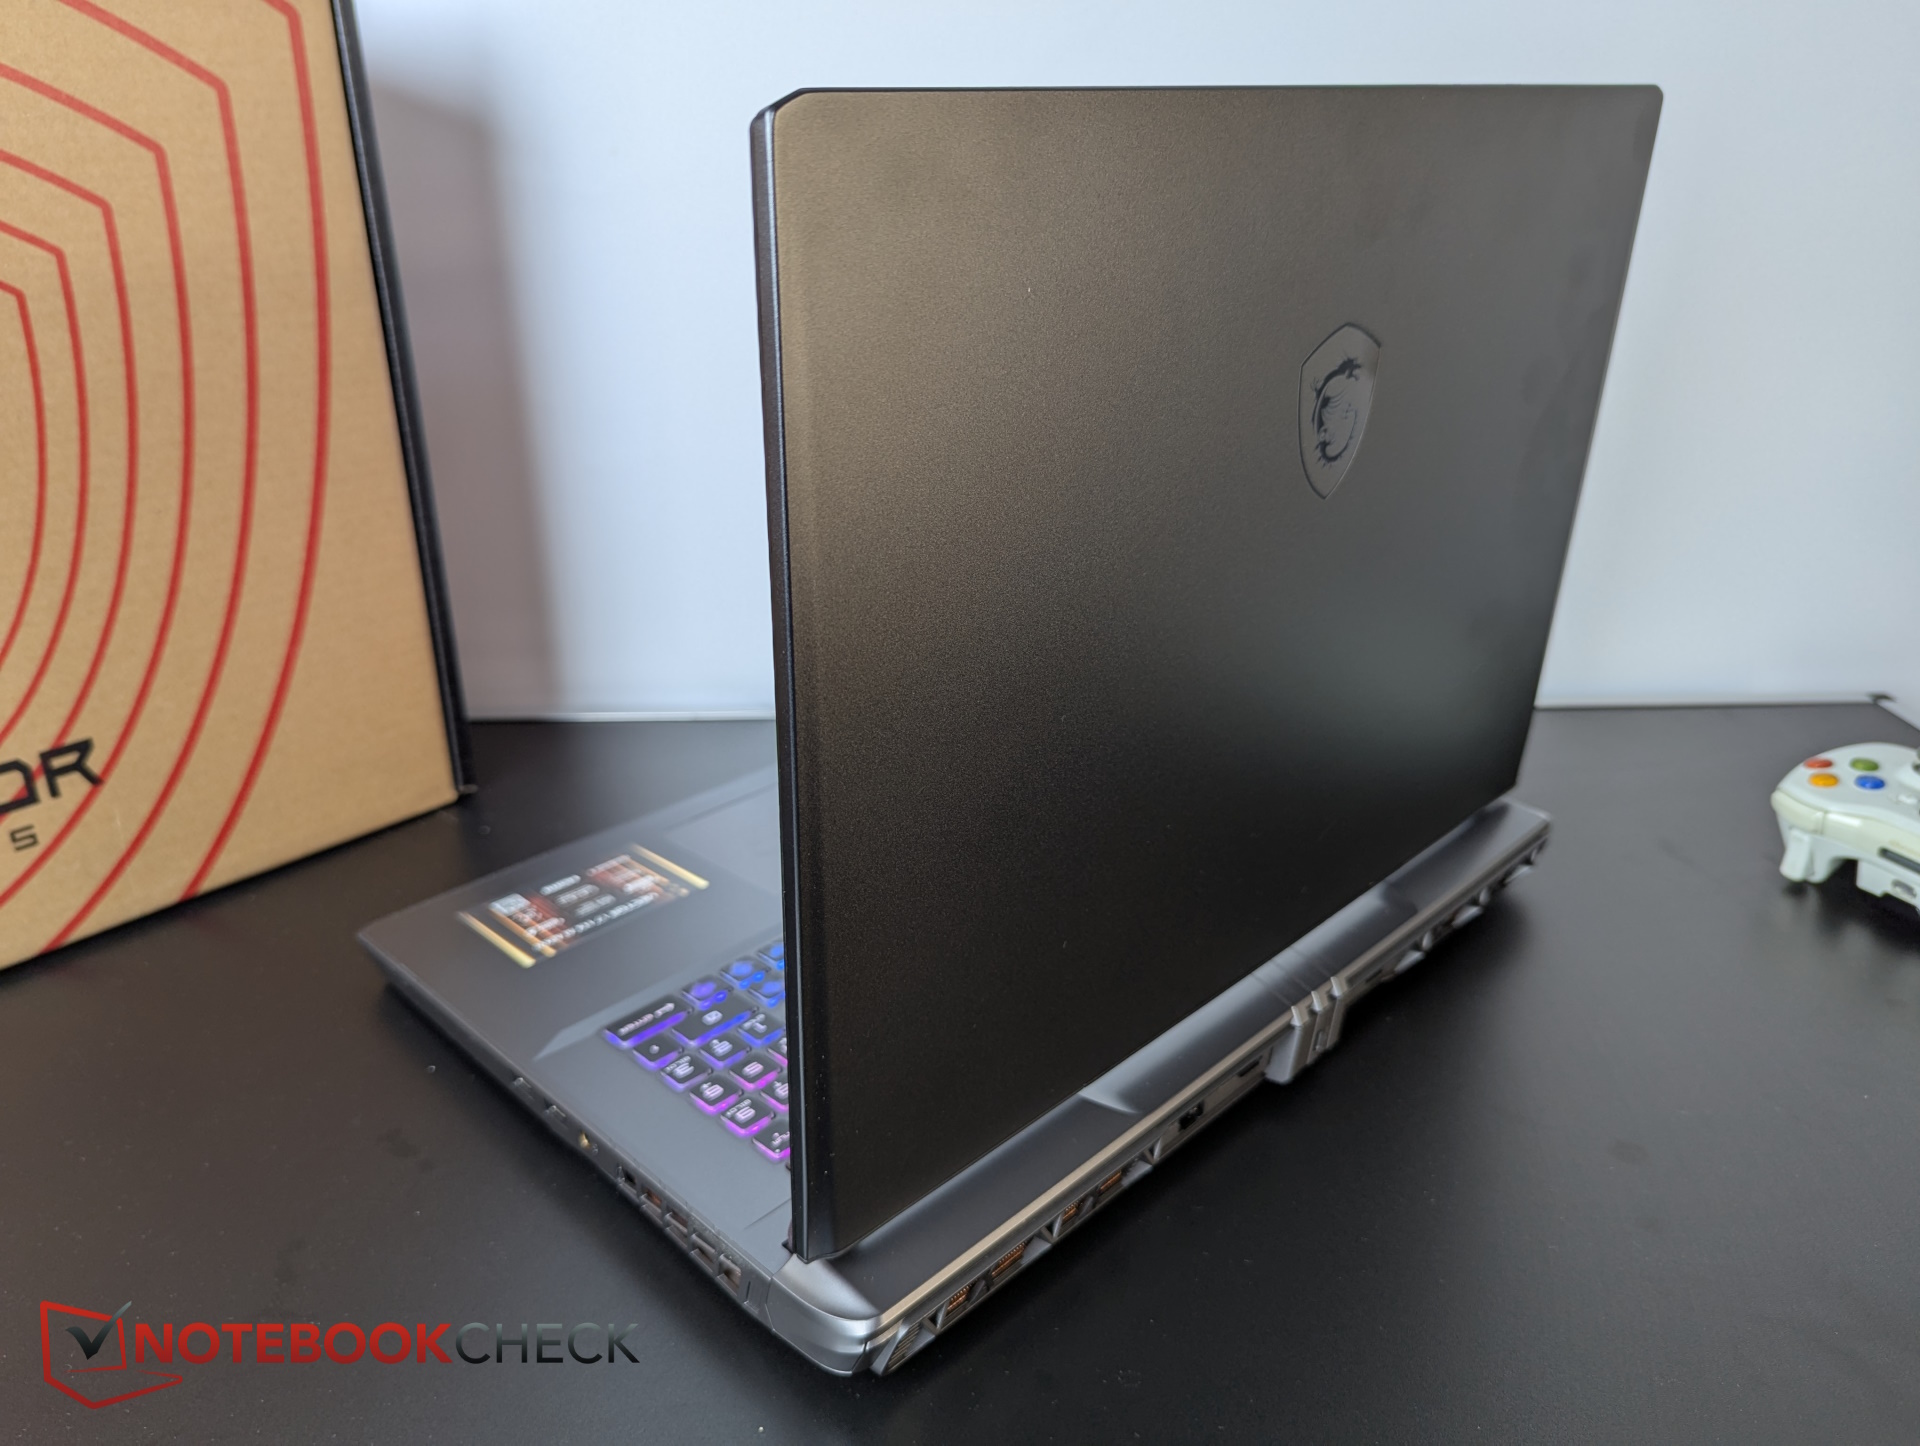
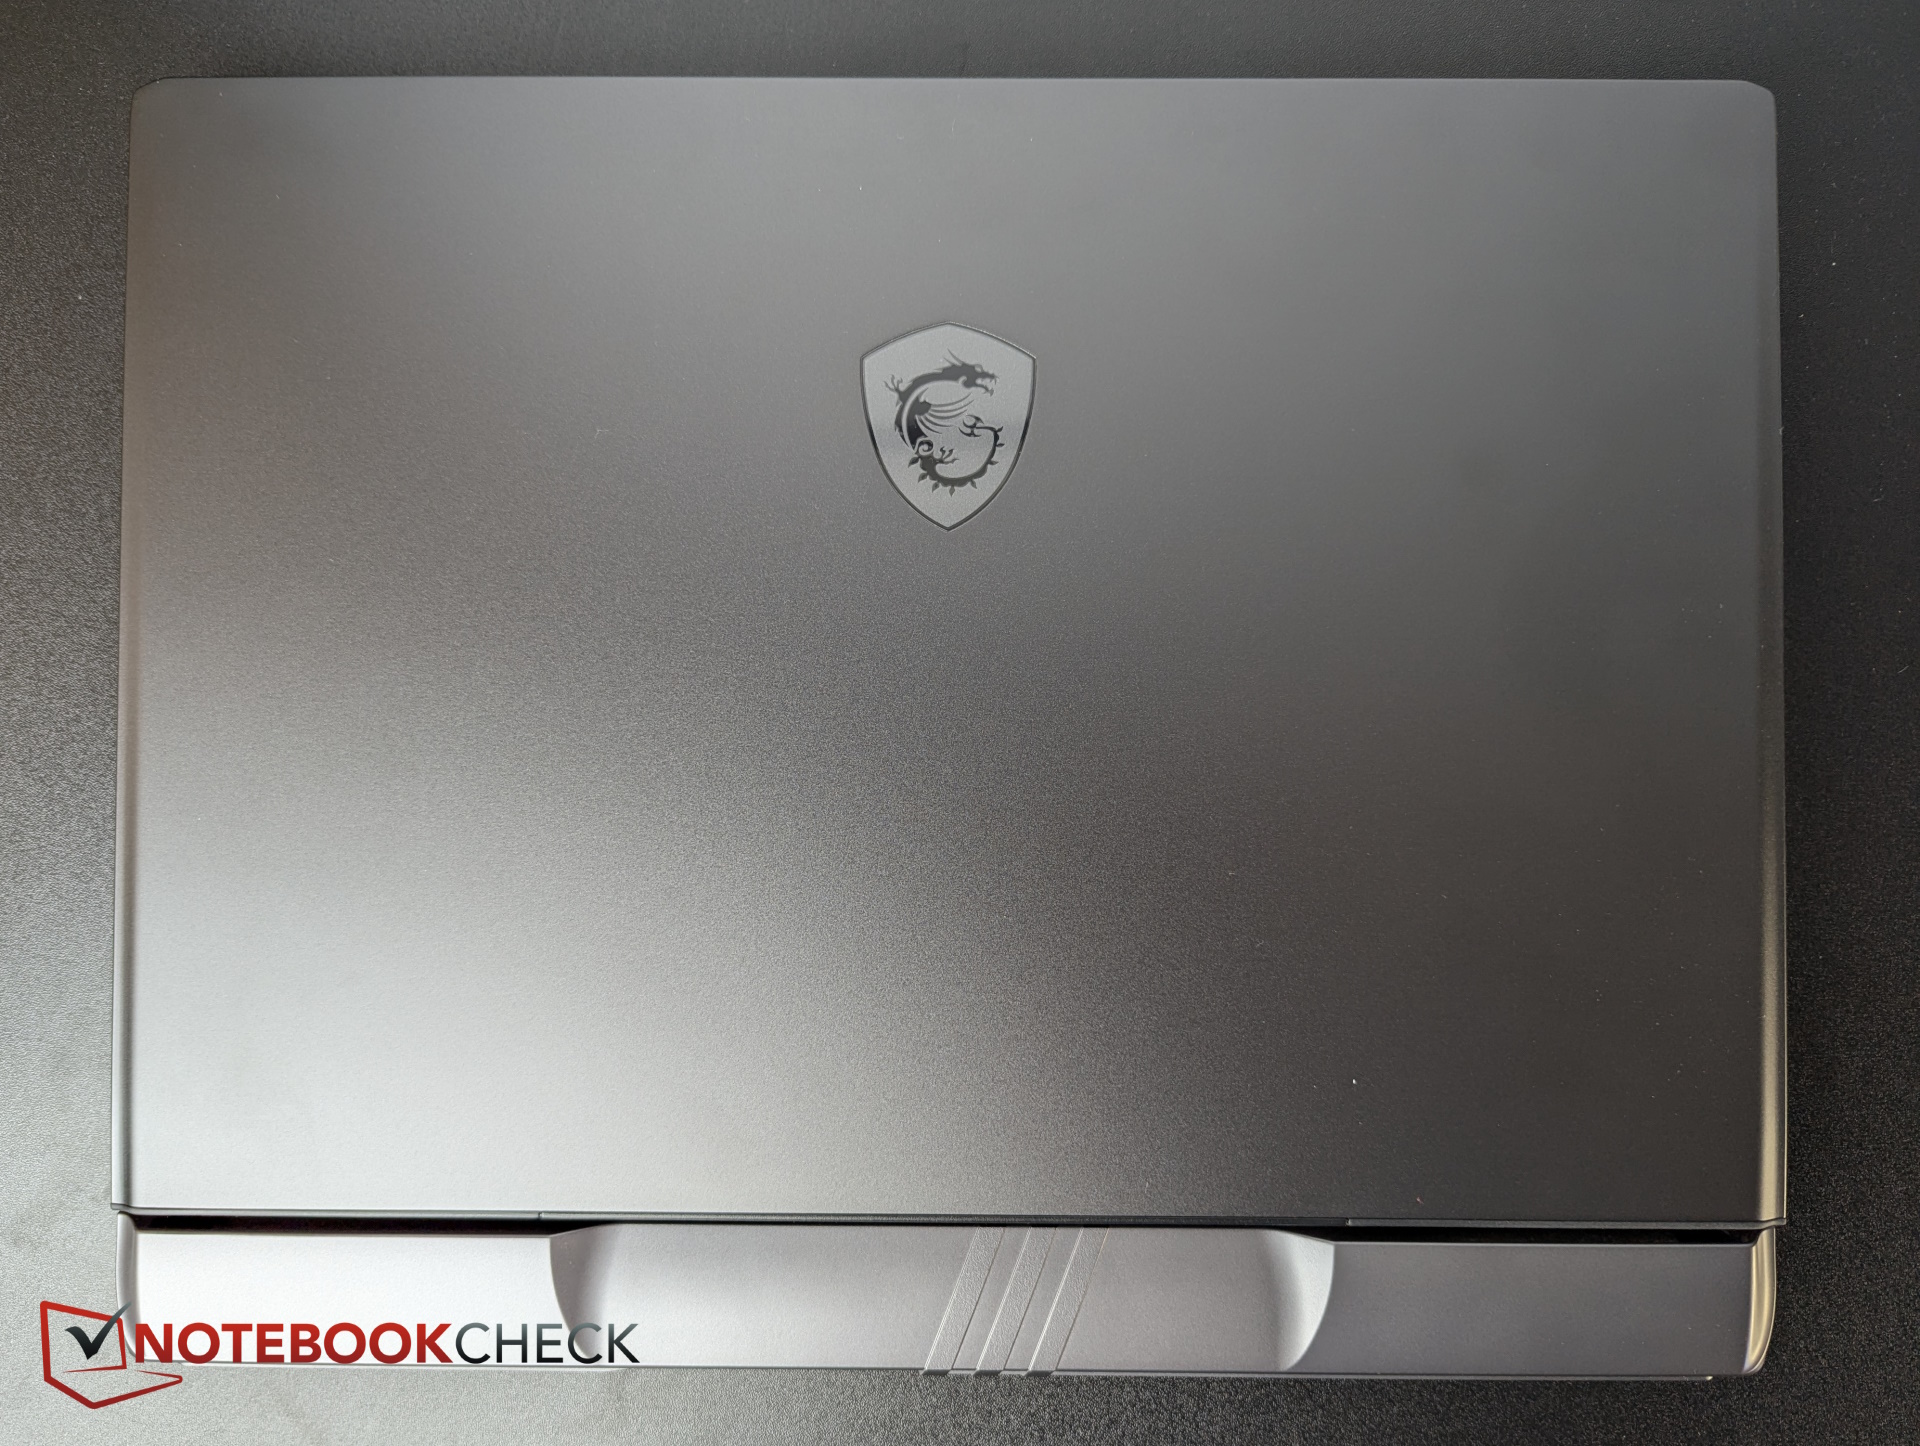
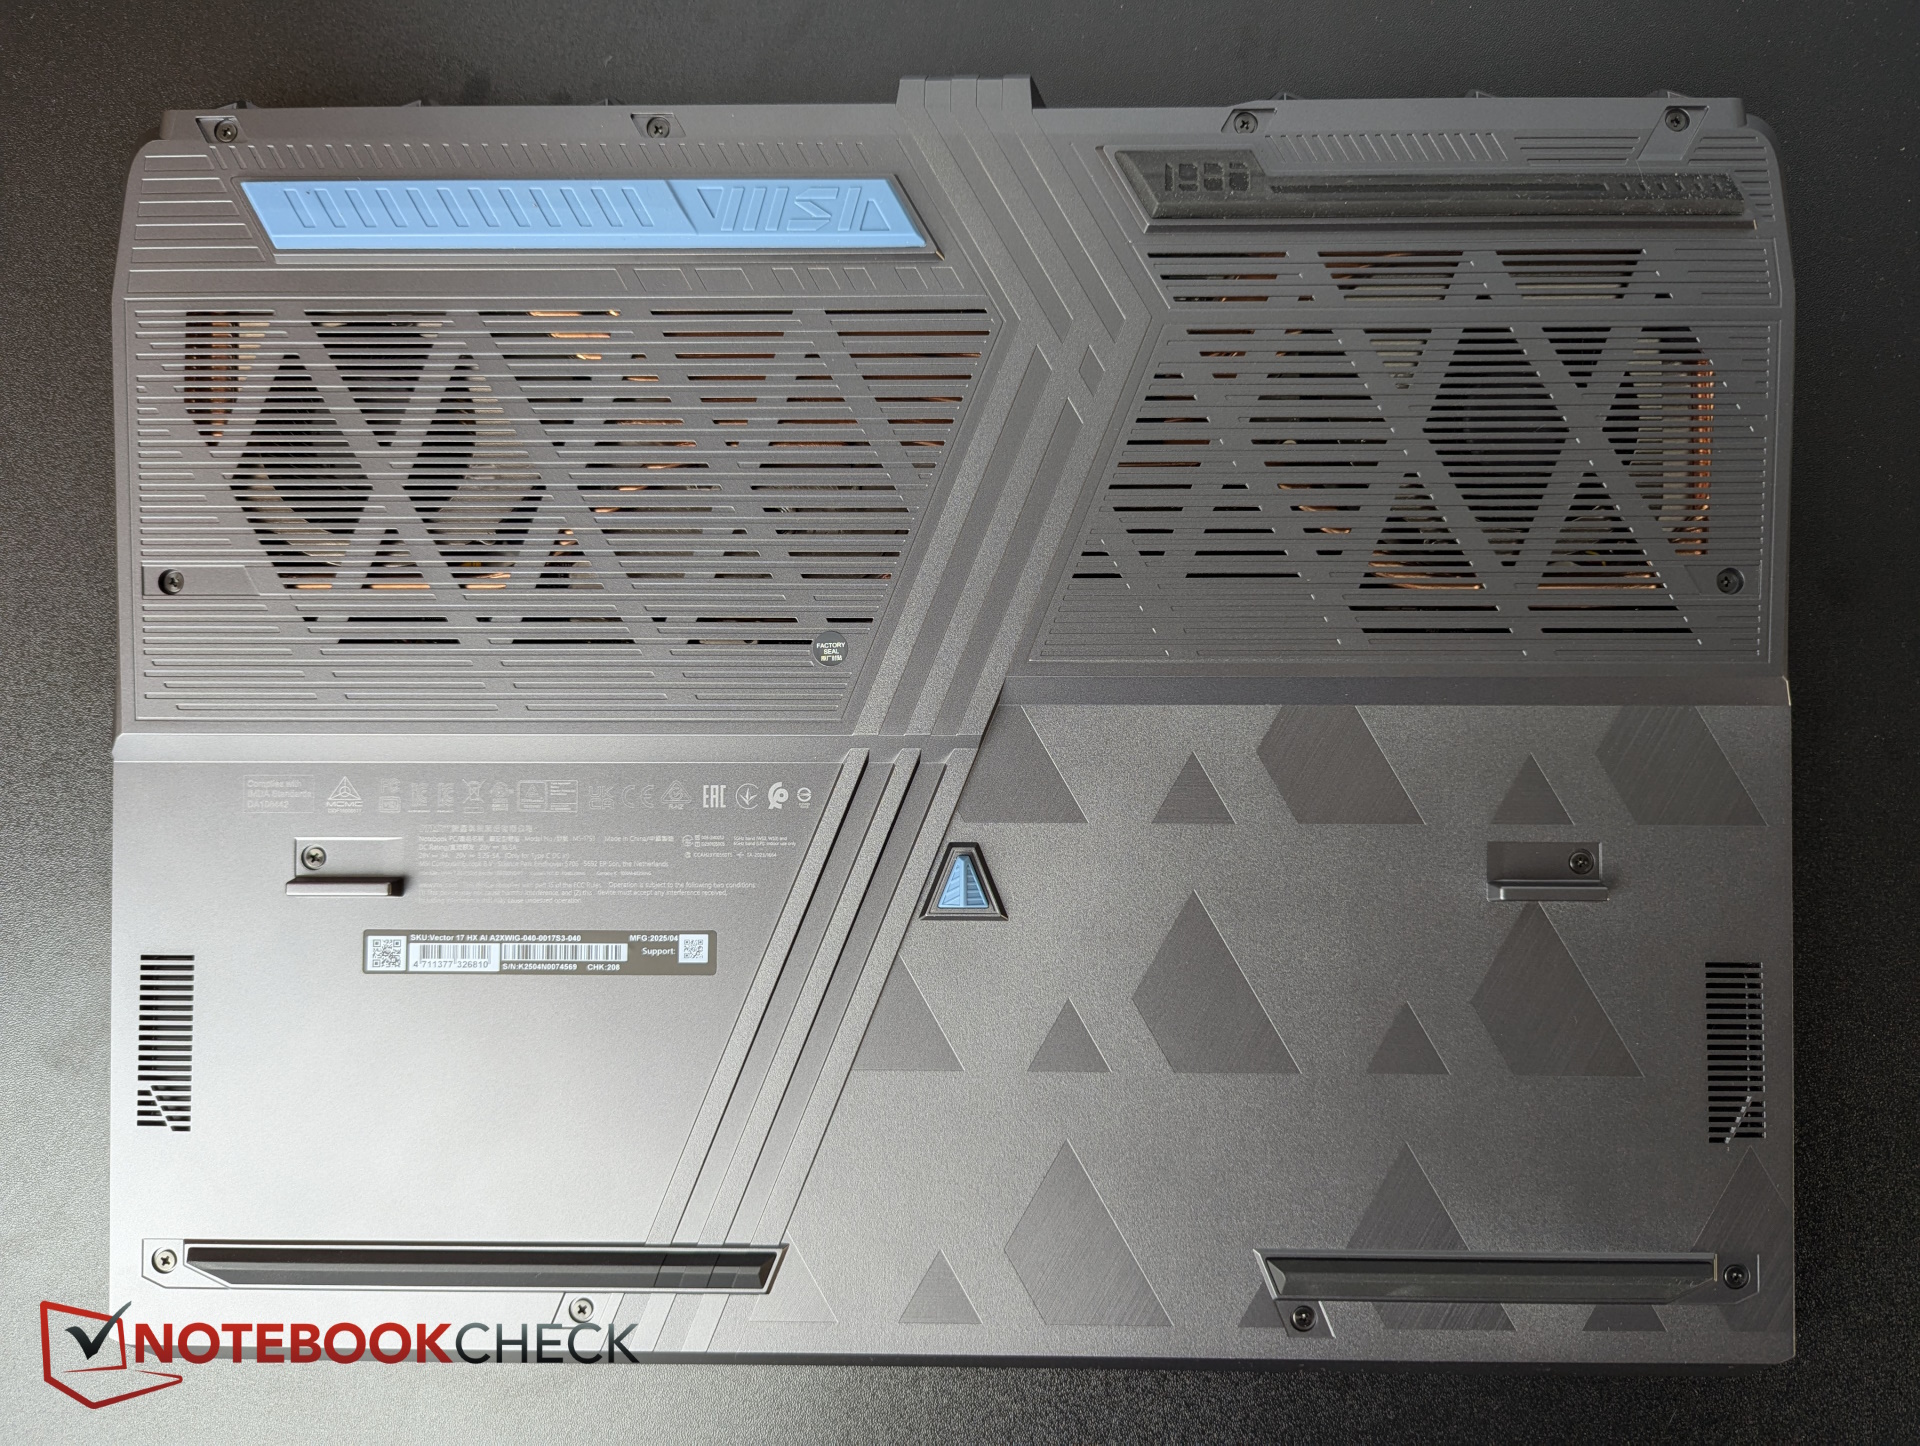
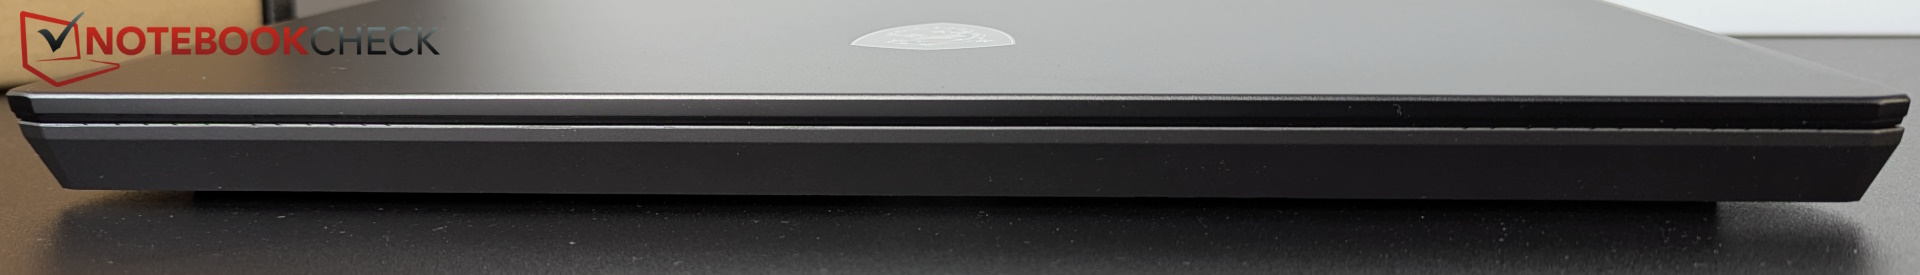
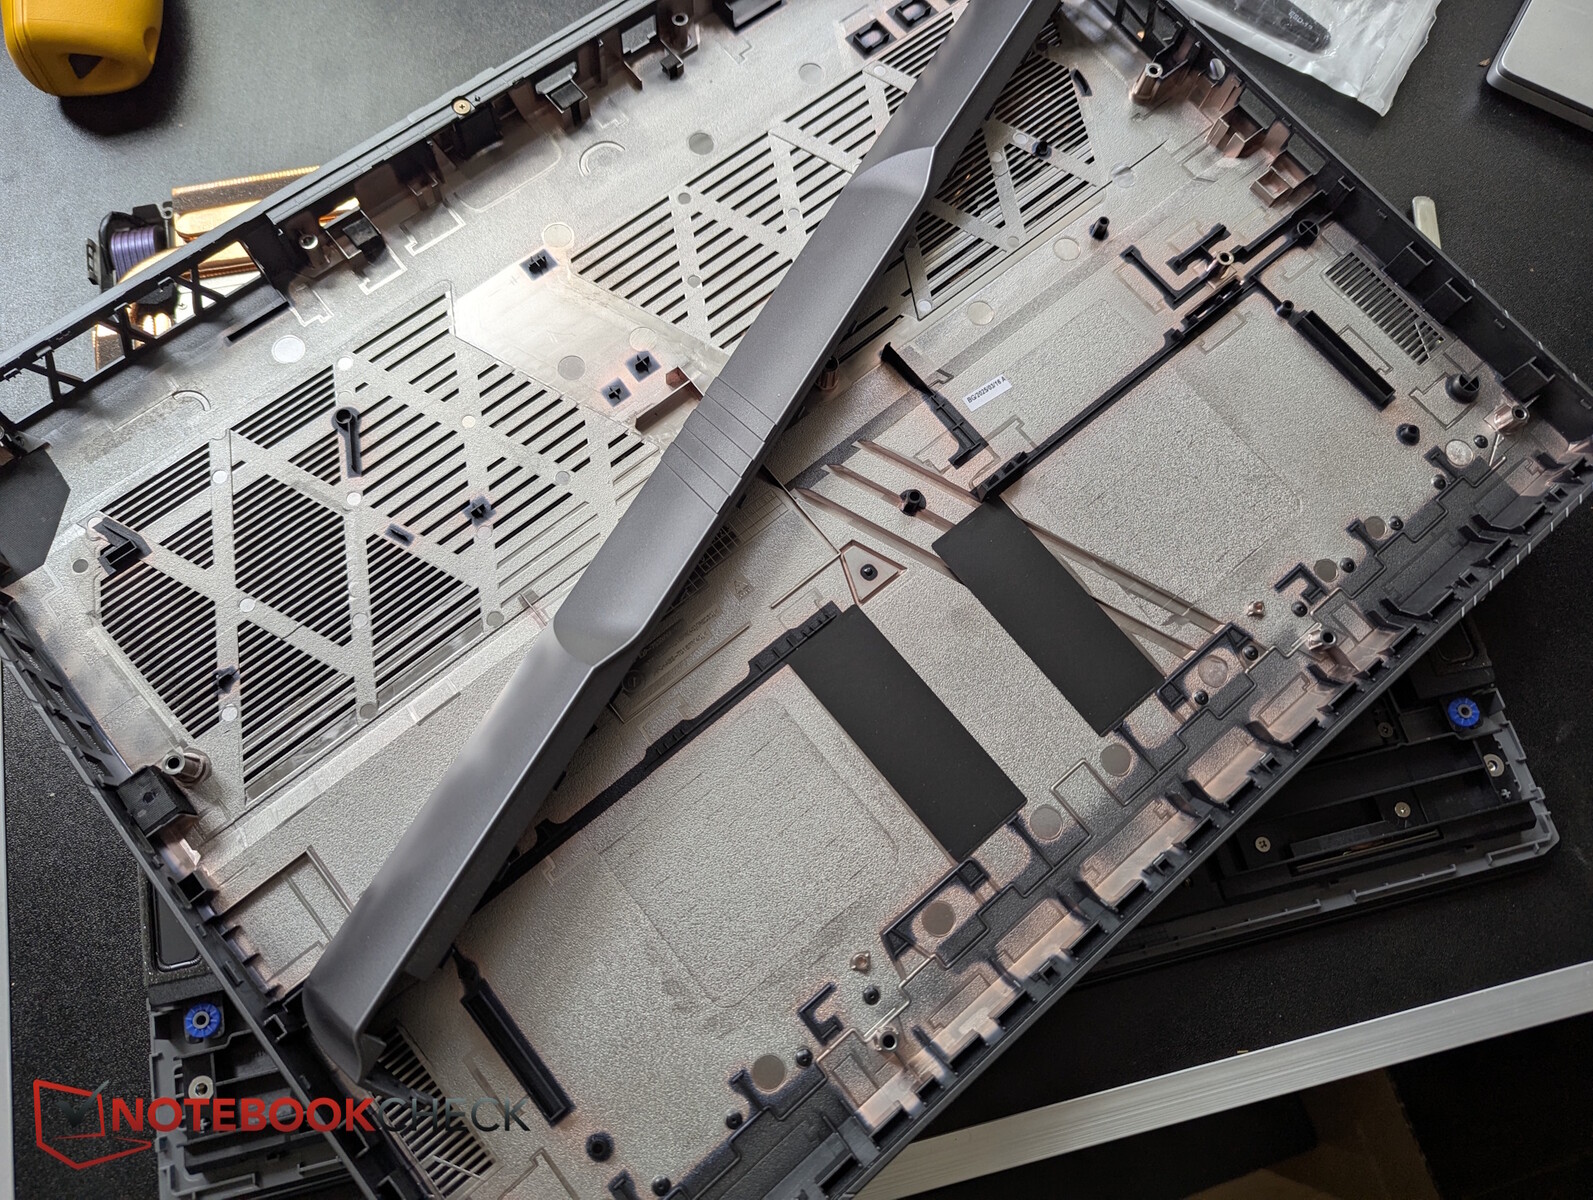
Boîtier et caractéristiques - Aussi massif qu'un Alienware
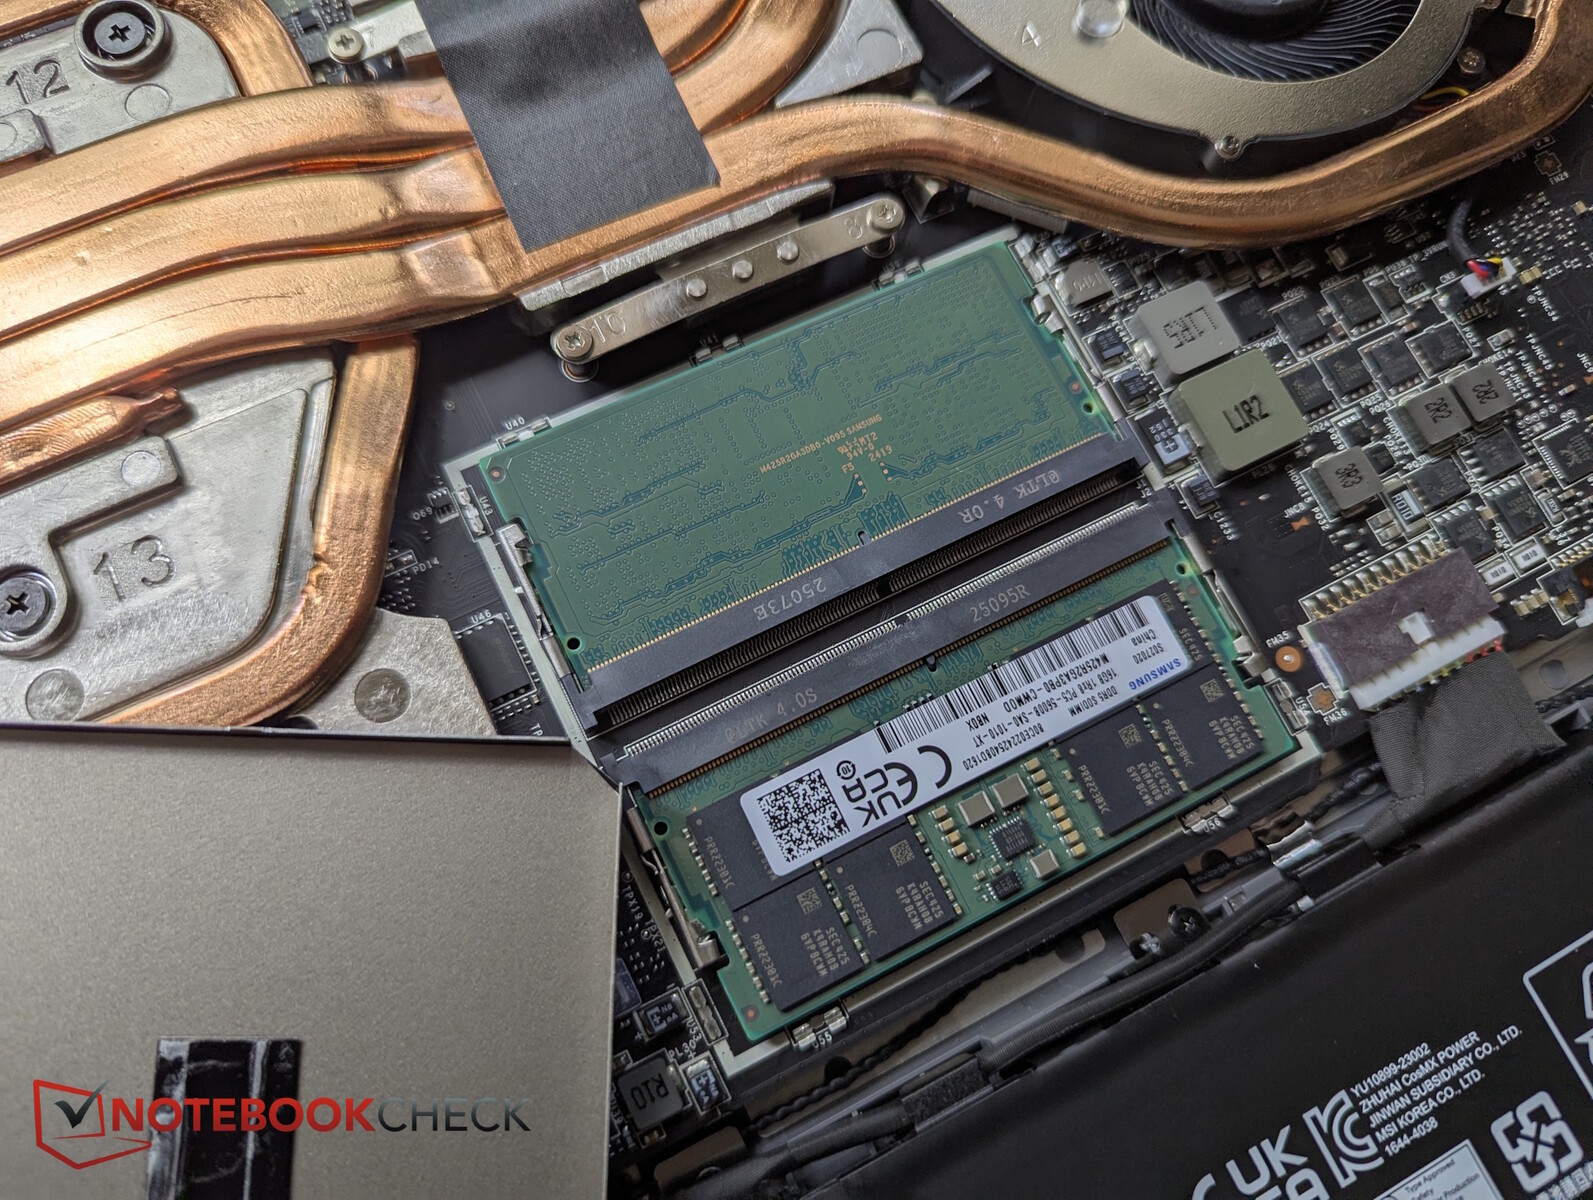
Puisque nous avons déjà le MSI Vector 16 HX AI avec presque le même boîtier, nous nous référons à ce stade à son Test et passons les sections relatives au boîtier, à l'entretien et aux périphériques d'entrée.
| SD Card Reader | |
| average JPG Copy Test (av. of 3 runs) | |
| Alienware 16 Area-51 (Toshiba Exceria Pro SDXC 64 GB UHS-II) | |
| Moyenne de la classe Gaming (20.9 - 210, n=54, 2 dernières années) | |
| Schenker XMG Neo 16 A25 5090 (Angelbird AV Pro V60) | |
| Aorus MASTER 16 AM6H | |
| MSI Vector 17 HX AI A2XWIG | |
| MSI Titan 18 HX AI A2XWJG (AV PRO microSD 128 GB V60) | |
| MSI Raider A18 HX A9WIG-080 | |
| maximum AS SSD Seq Read Test (1GB) | |
| Schenker XMG Neo 16 A25 5090 (Angelbird AV Pro V60) | |
| Alienware 16 Area-51 (Toshiba Exceria Pro SDXC 64 GB UHS-II) | |
| MSI Vector 17 HX AI A2XWIG | |
| Aorus MASTER 16 AM6H | |
| MSI Raider A18 HX A9WIG-080 | |
| Moyenne de la classe Gaming (25.5 - 261, n=51, 2 dernières années) | |
| MSI Titan 18 HX AI A2XWJG (AV PRO microSD 128 GB V60) | |
Webcam
Une webcam Full HD avec obturateur manuel, bonne fidélité des couleurs et netteté moyenne est installée.


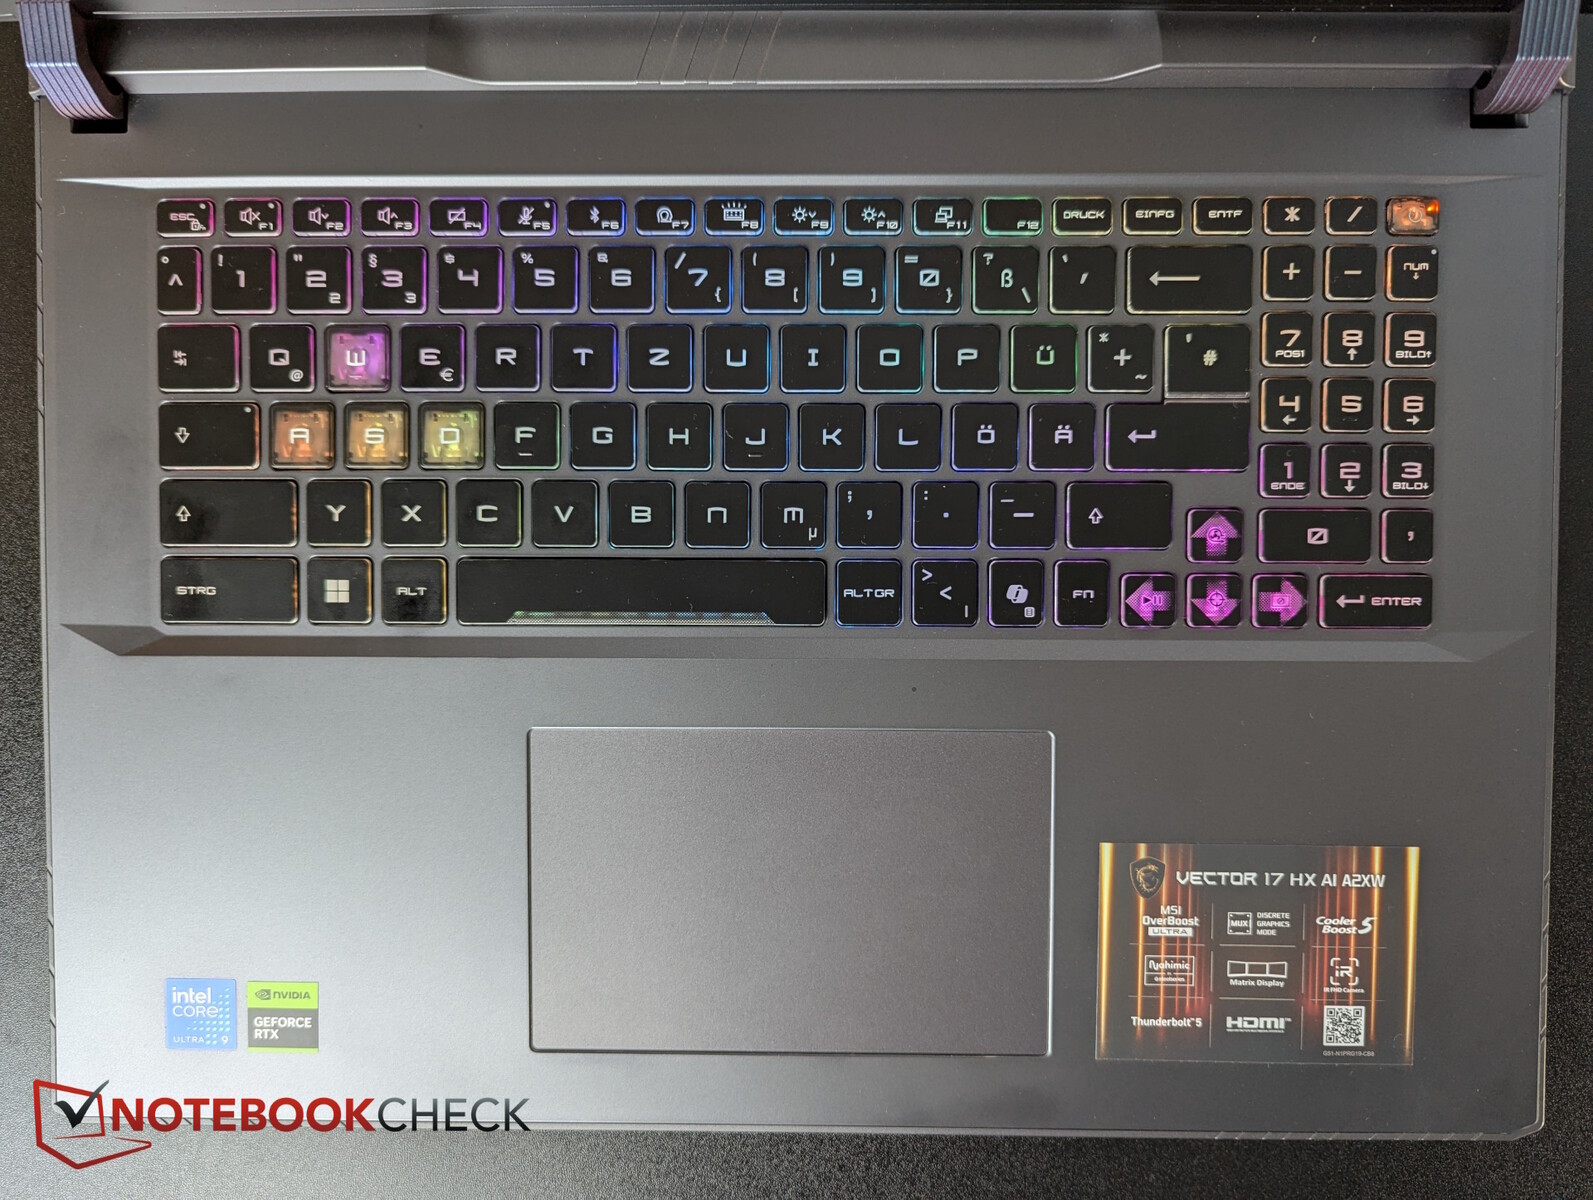
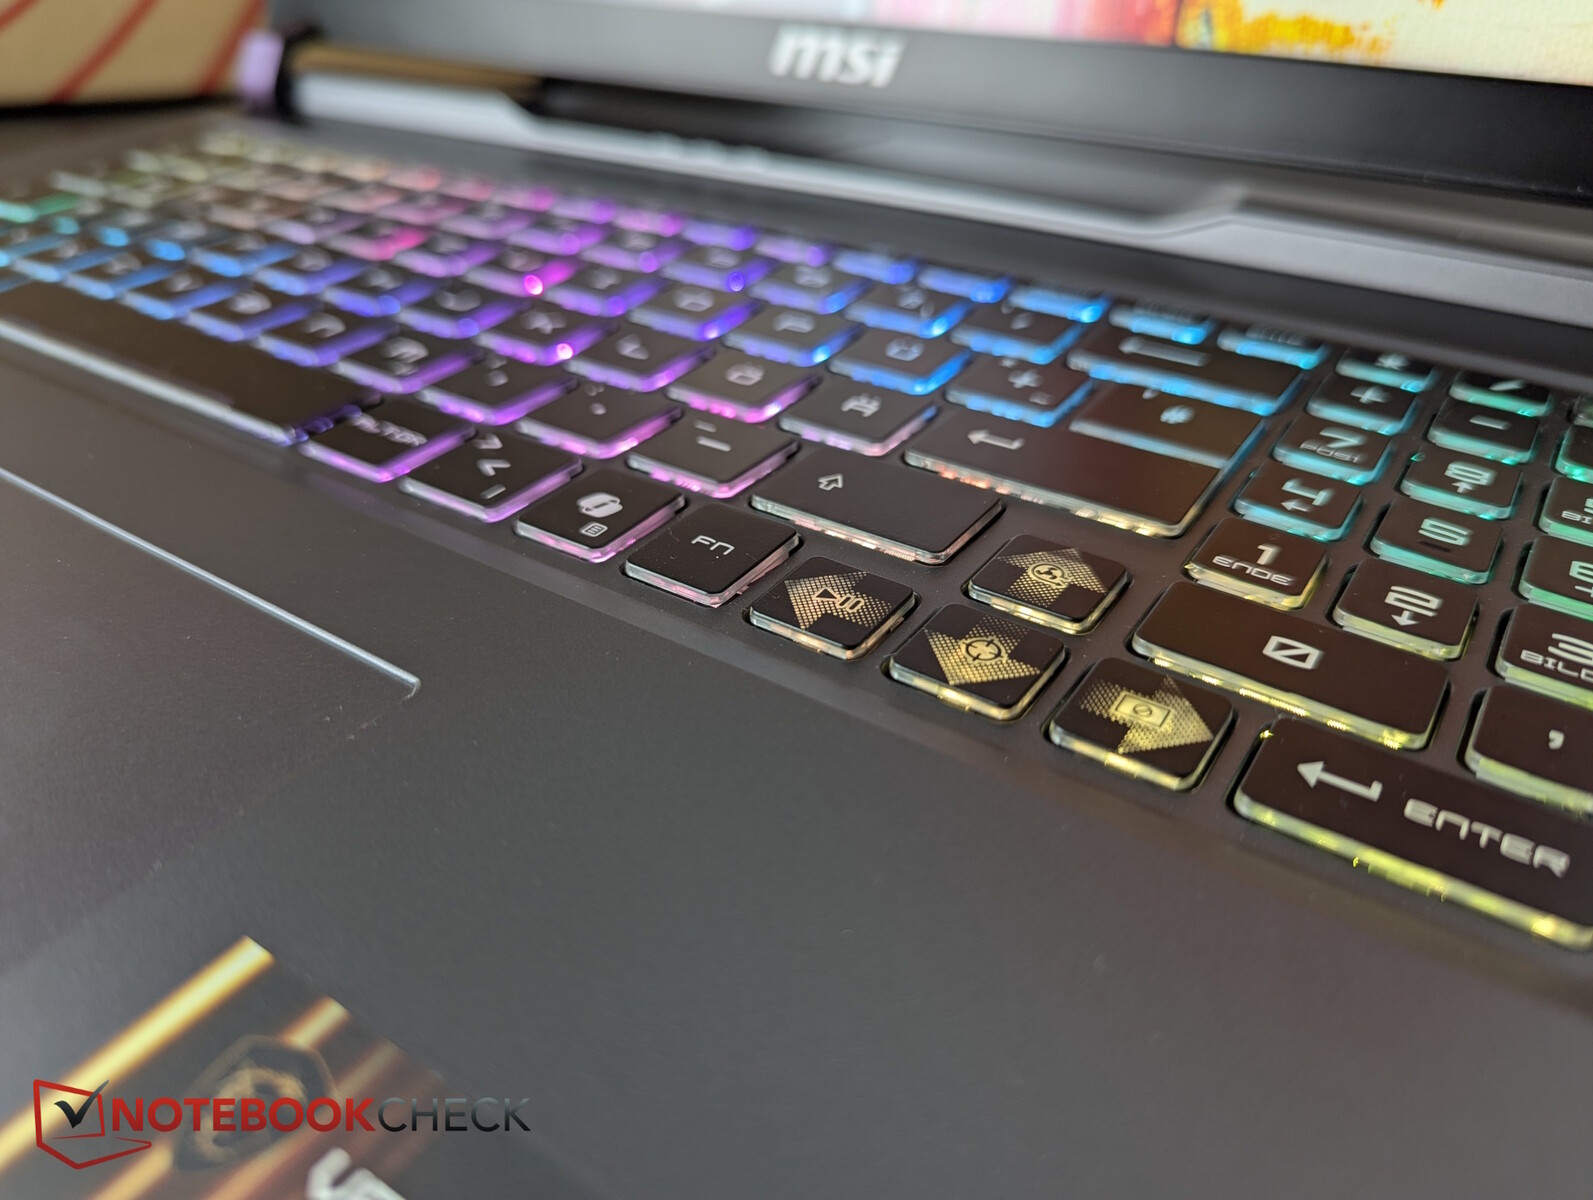
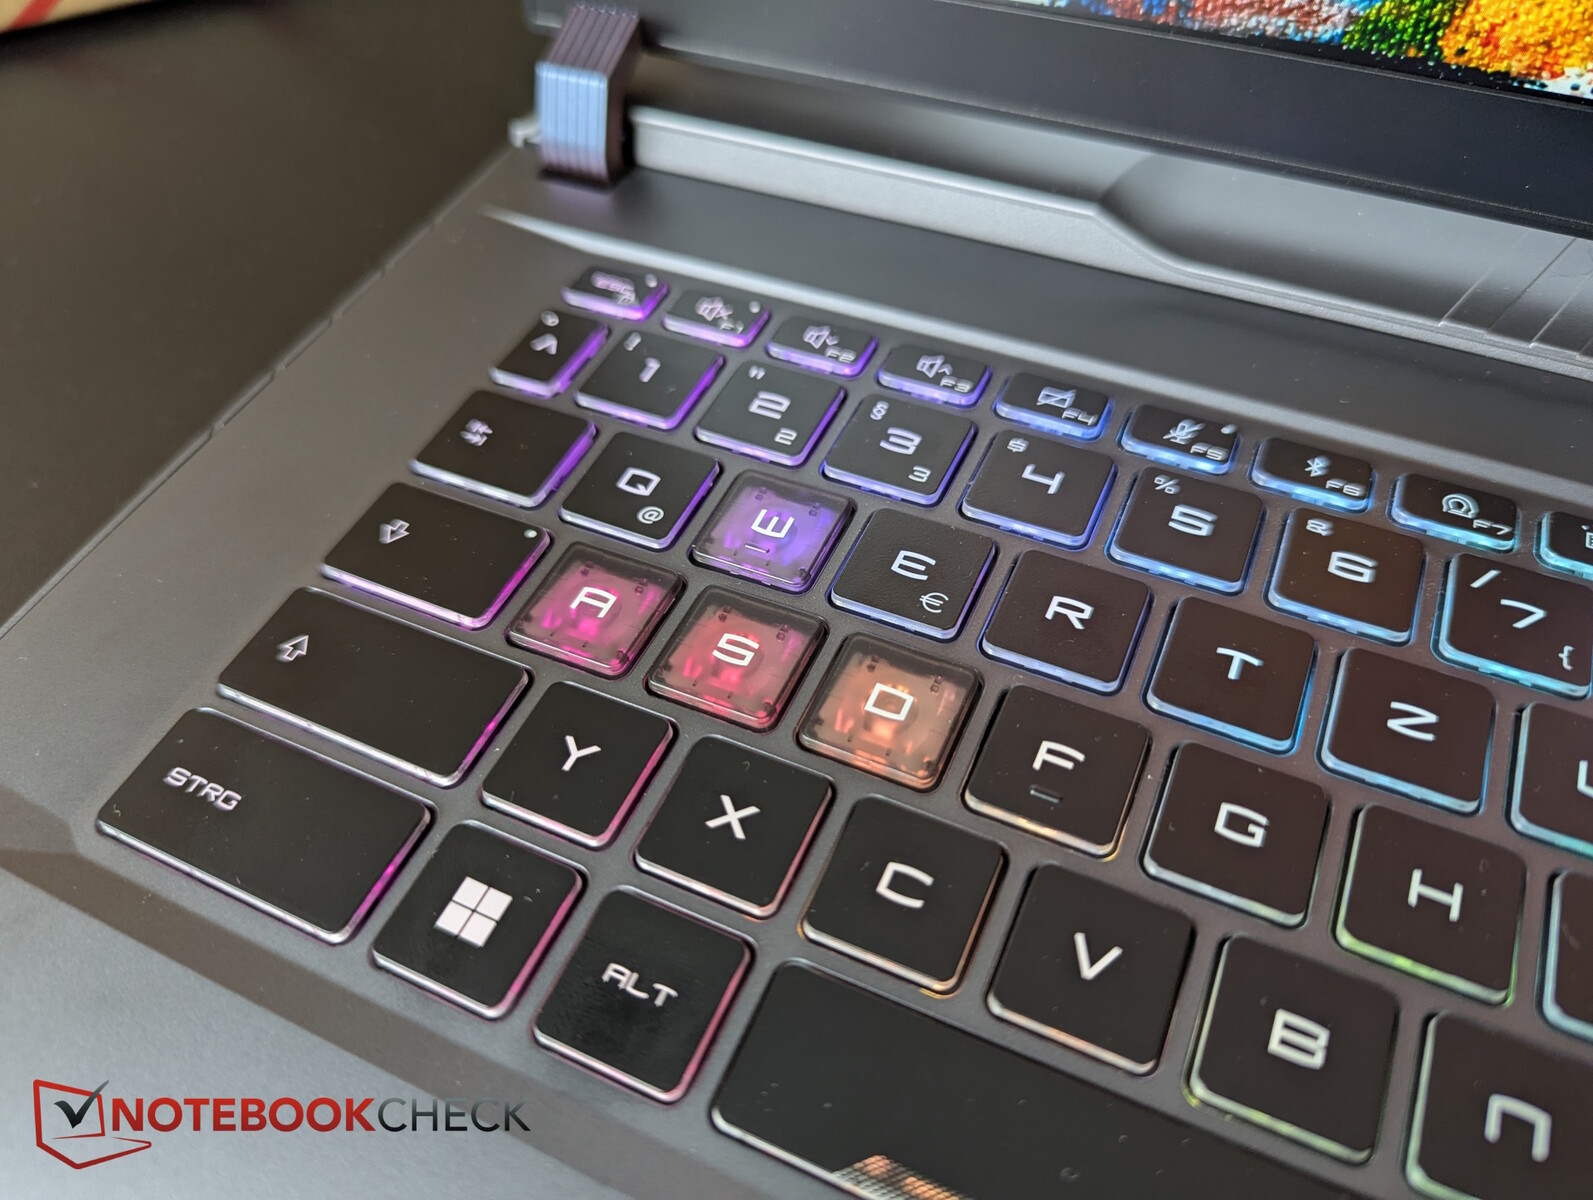
Périphériques d'entrée - Cette présentation MSI !
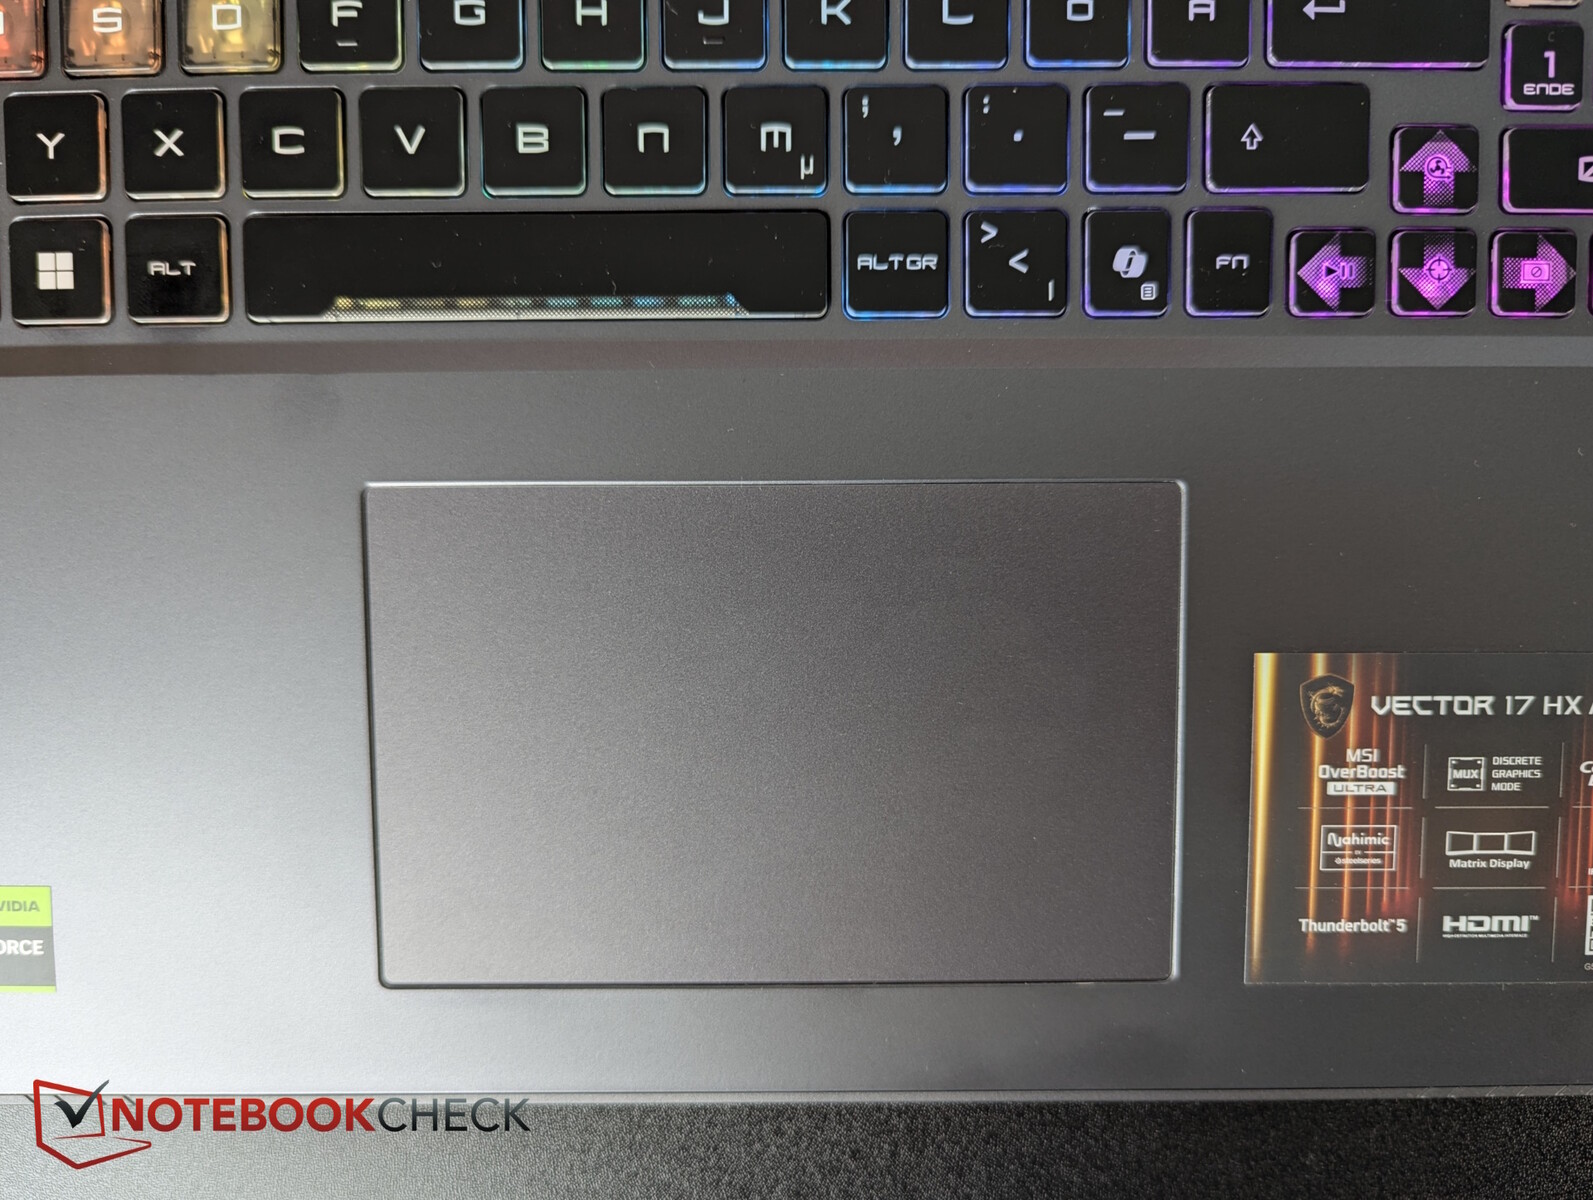
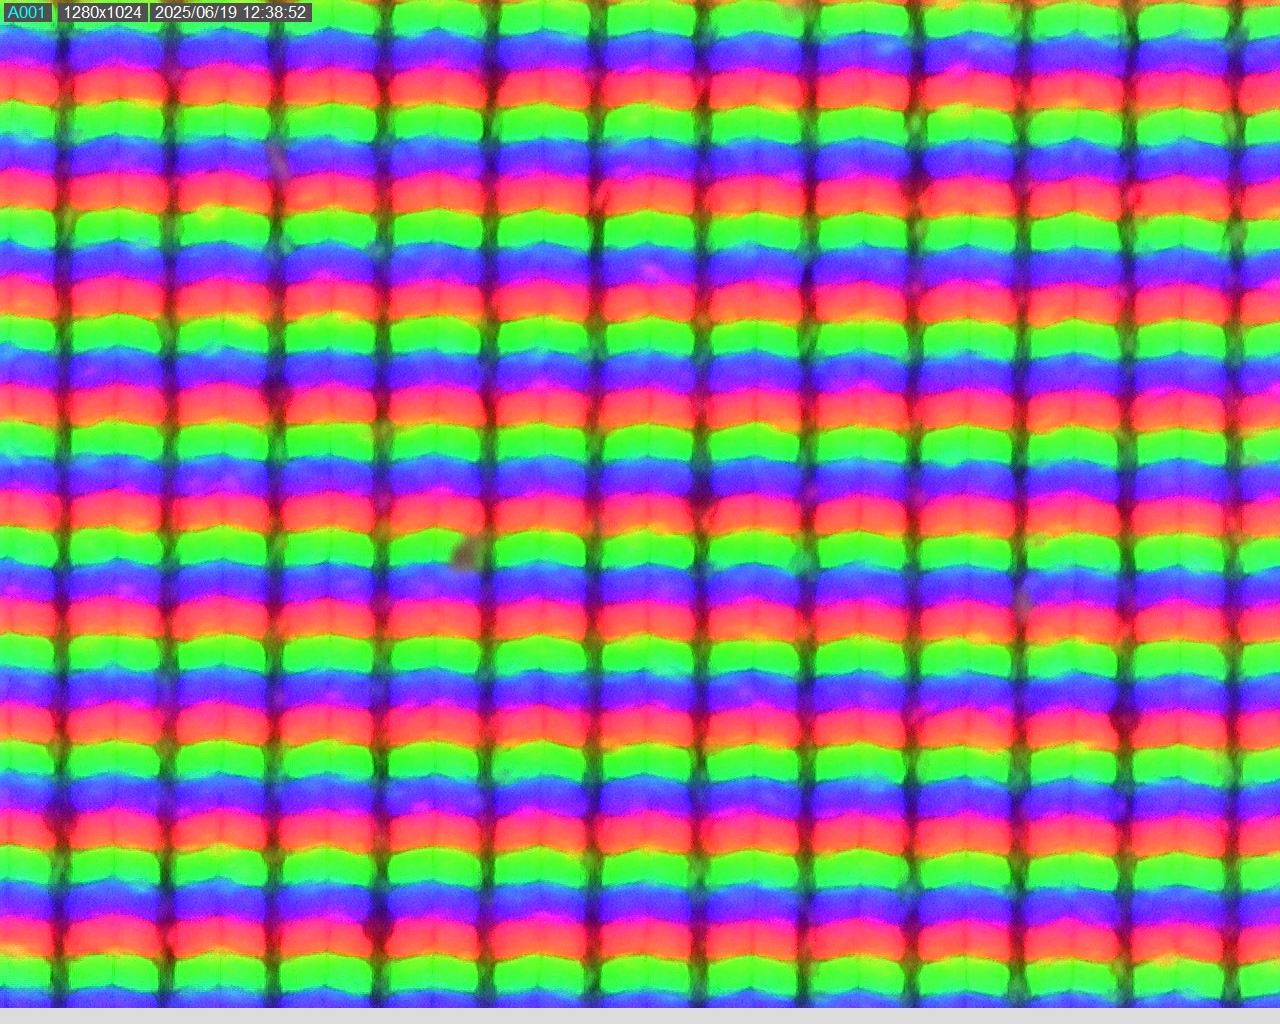
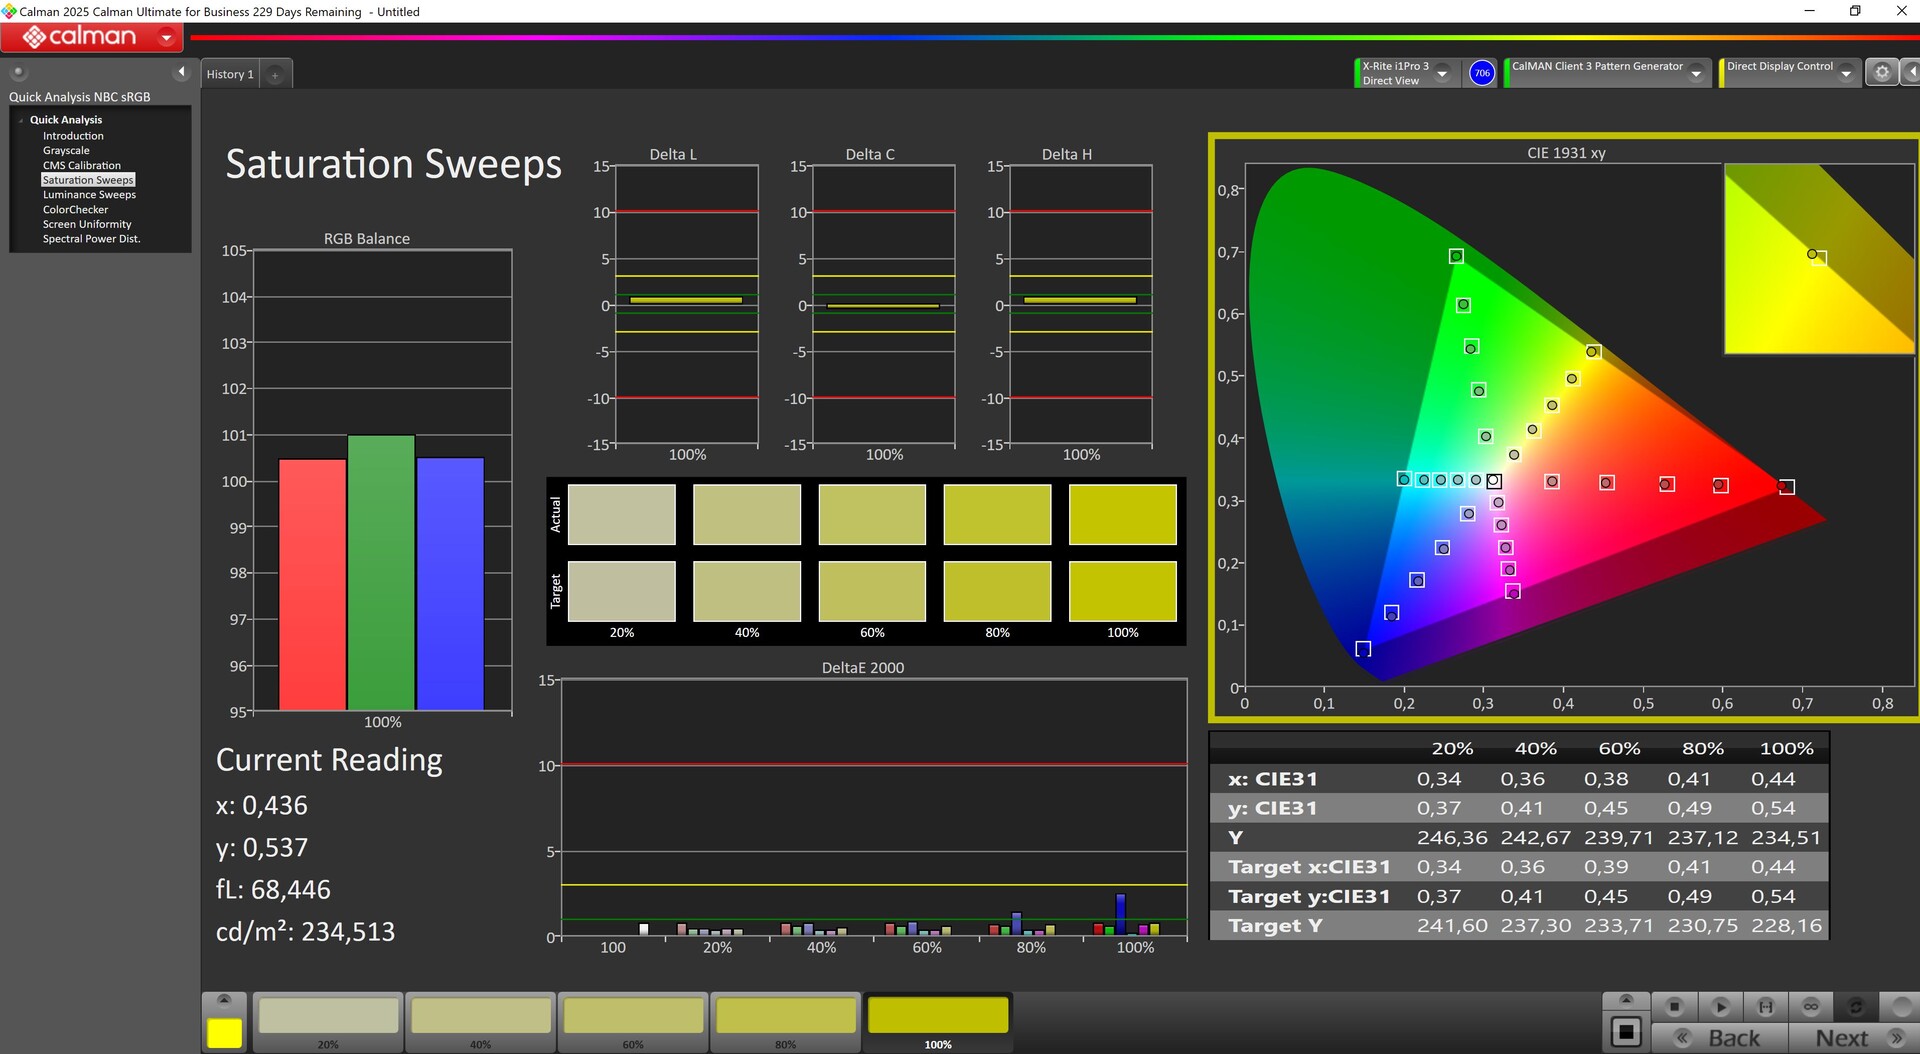
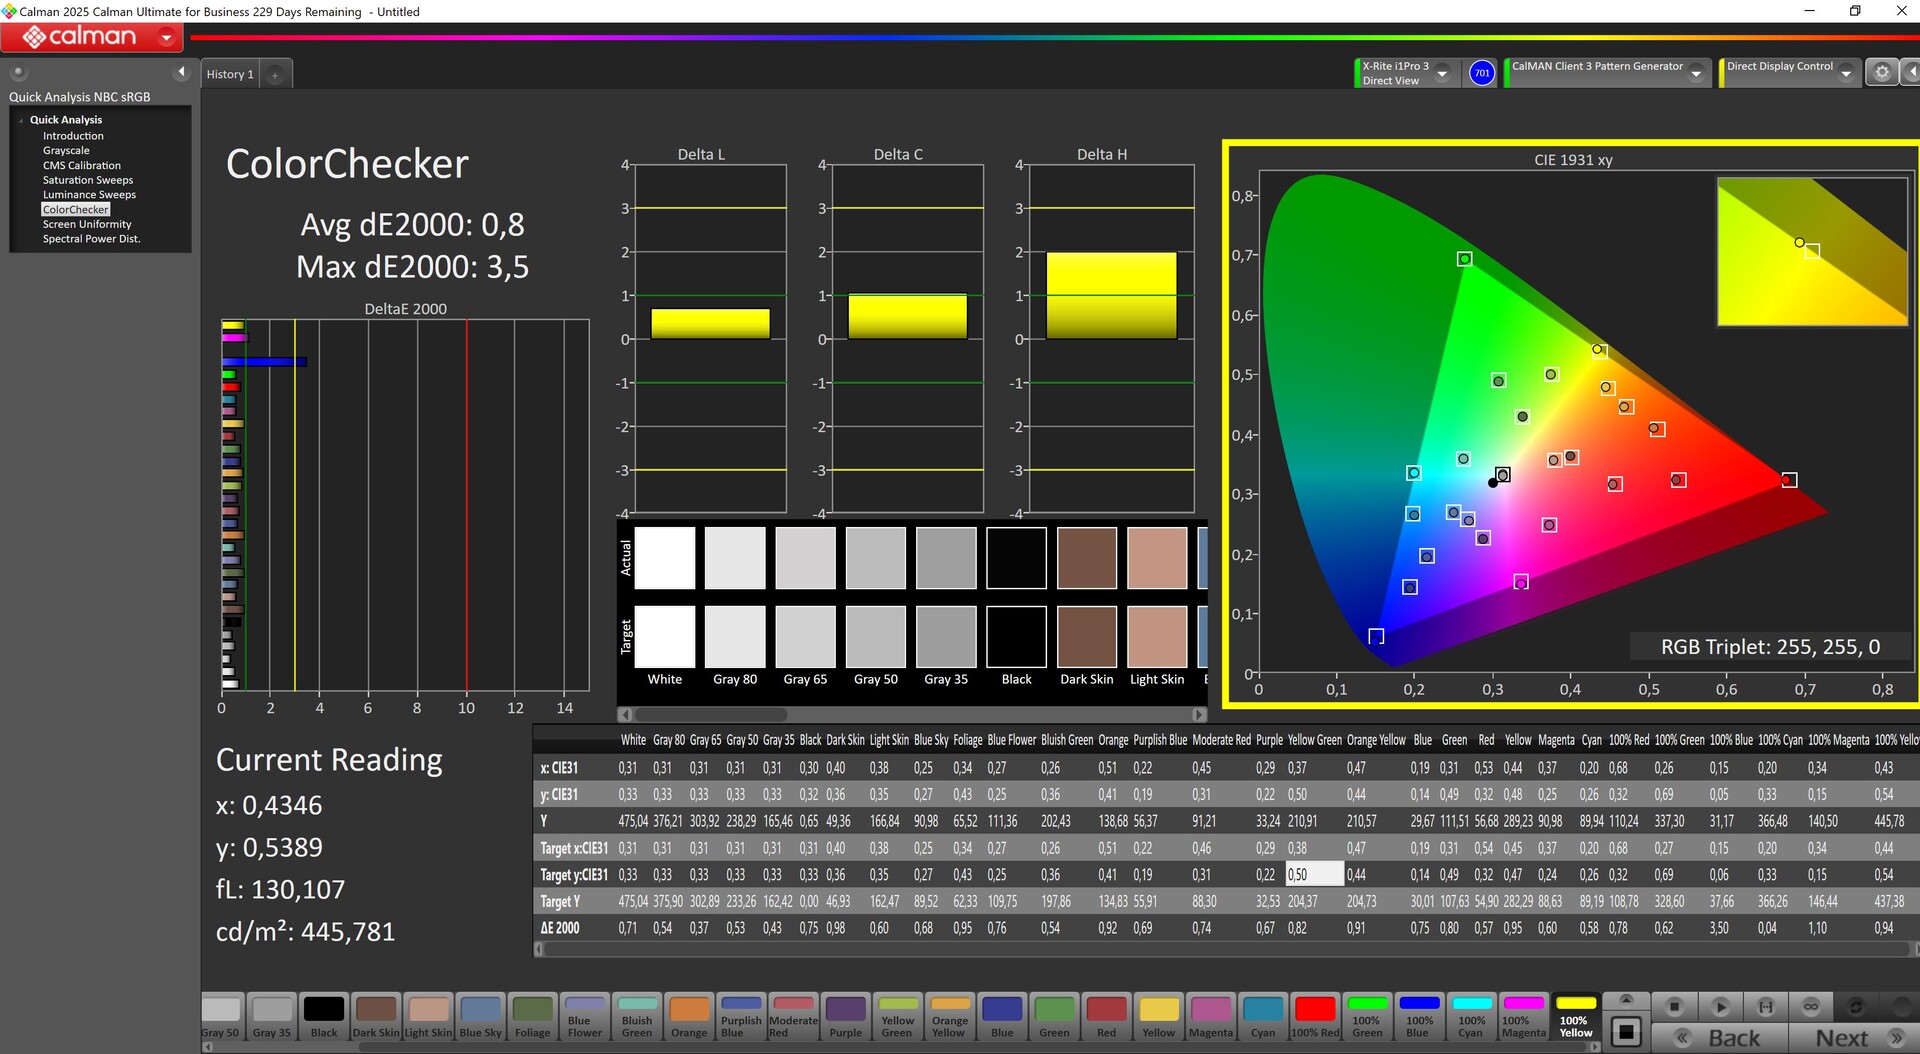
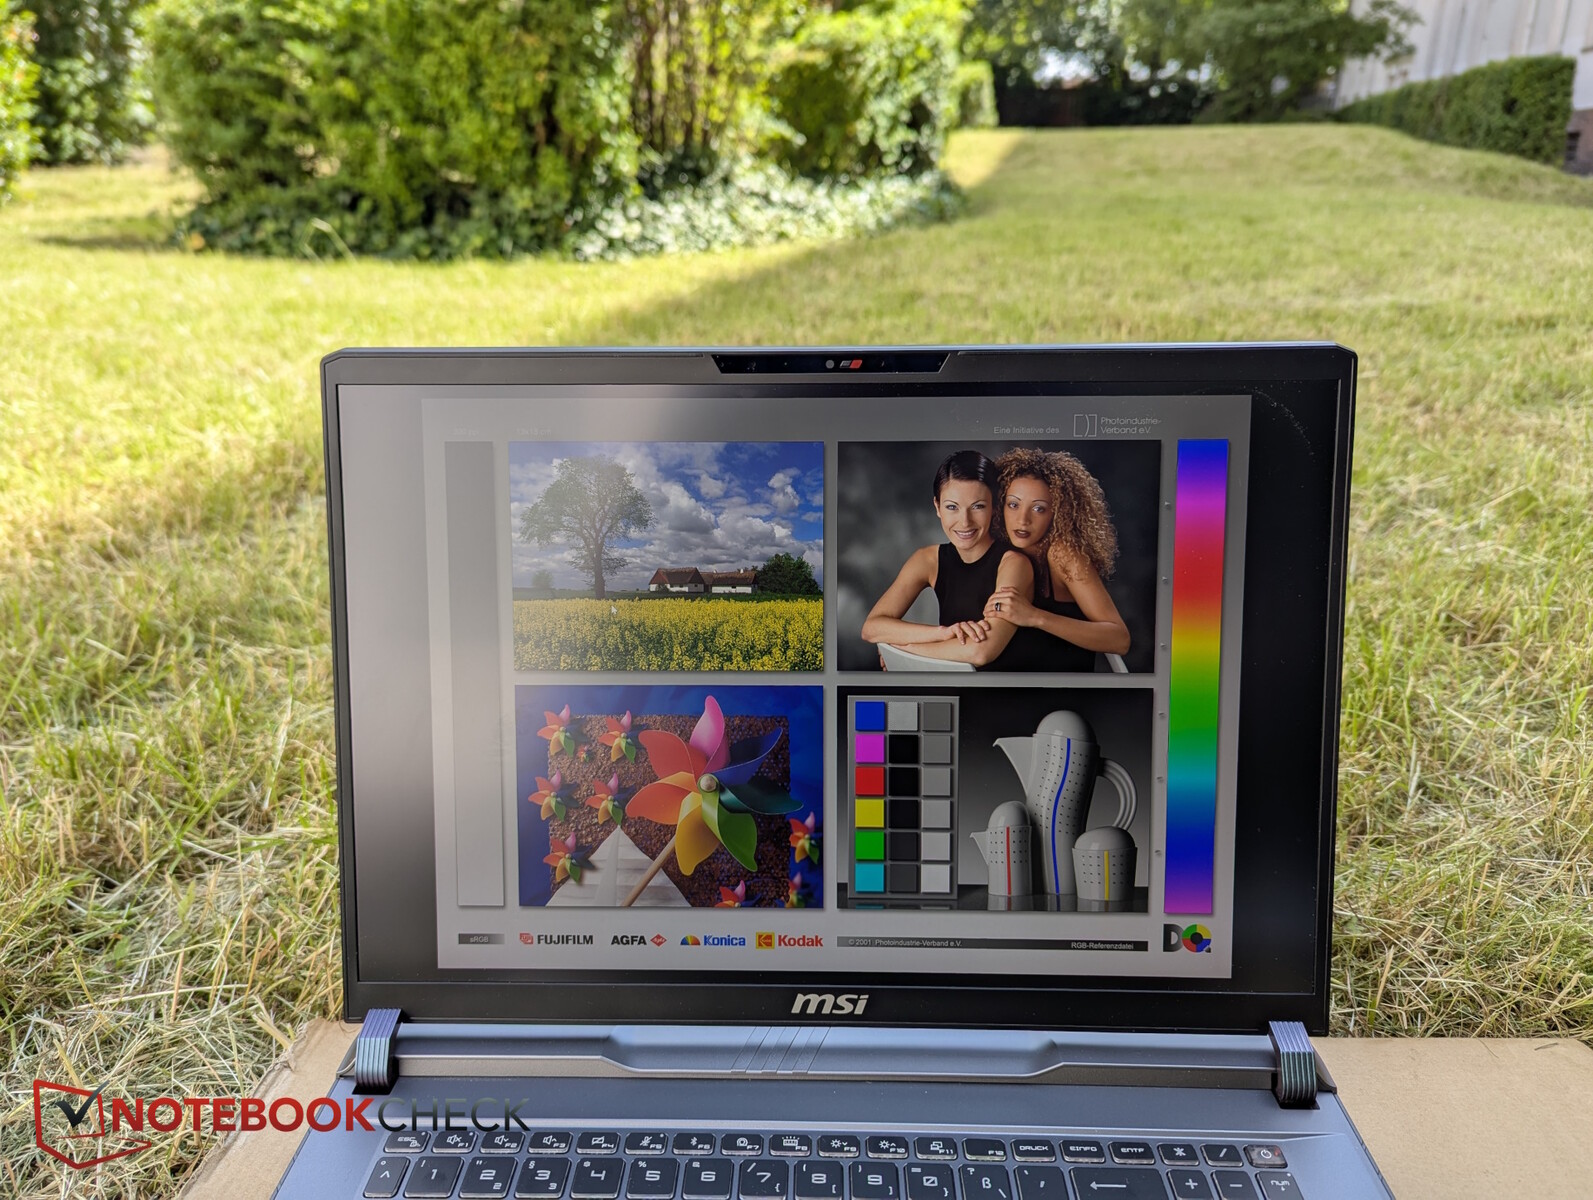
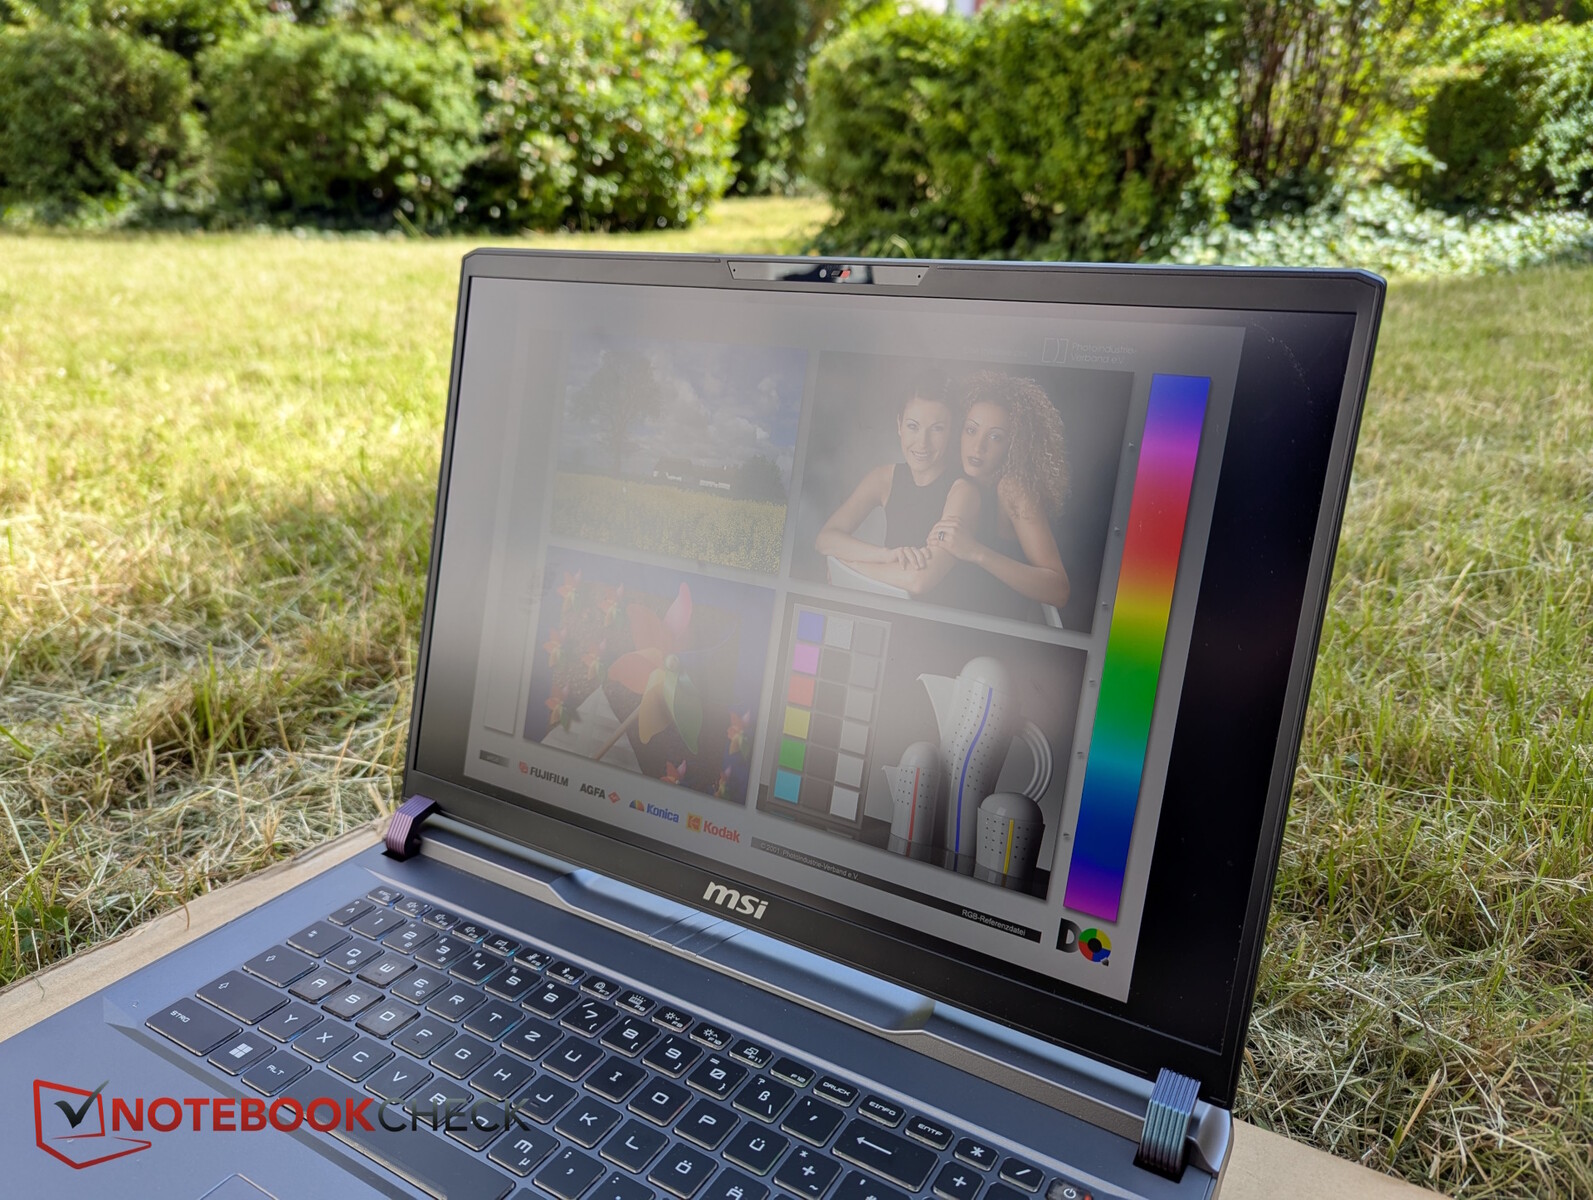
Écran - QHD+ IPS avec 470 nits
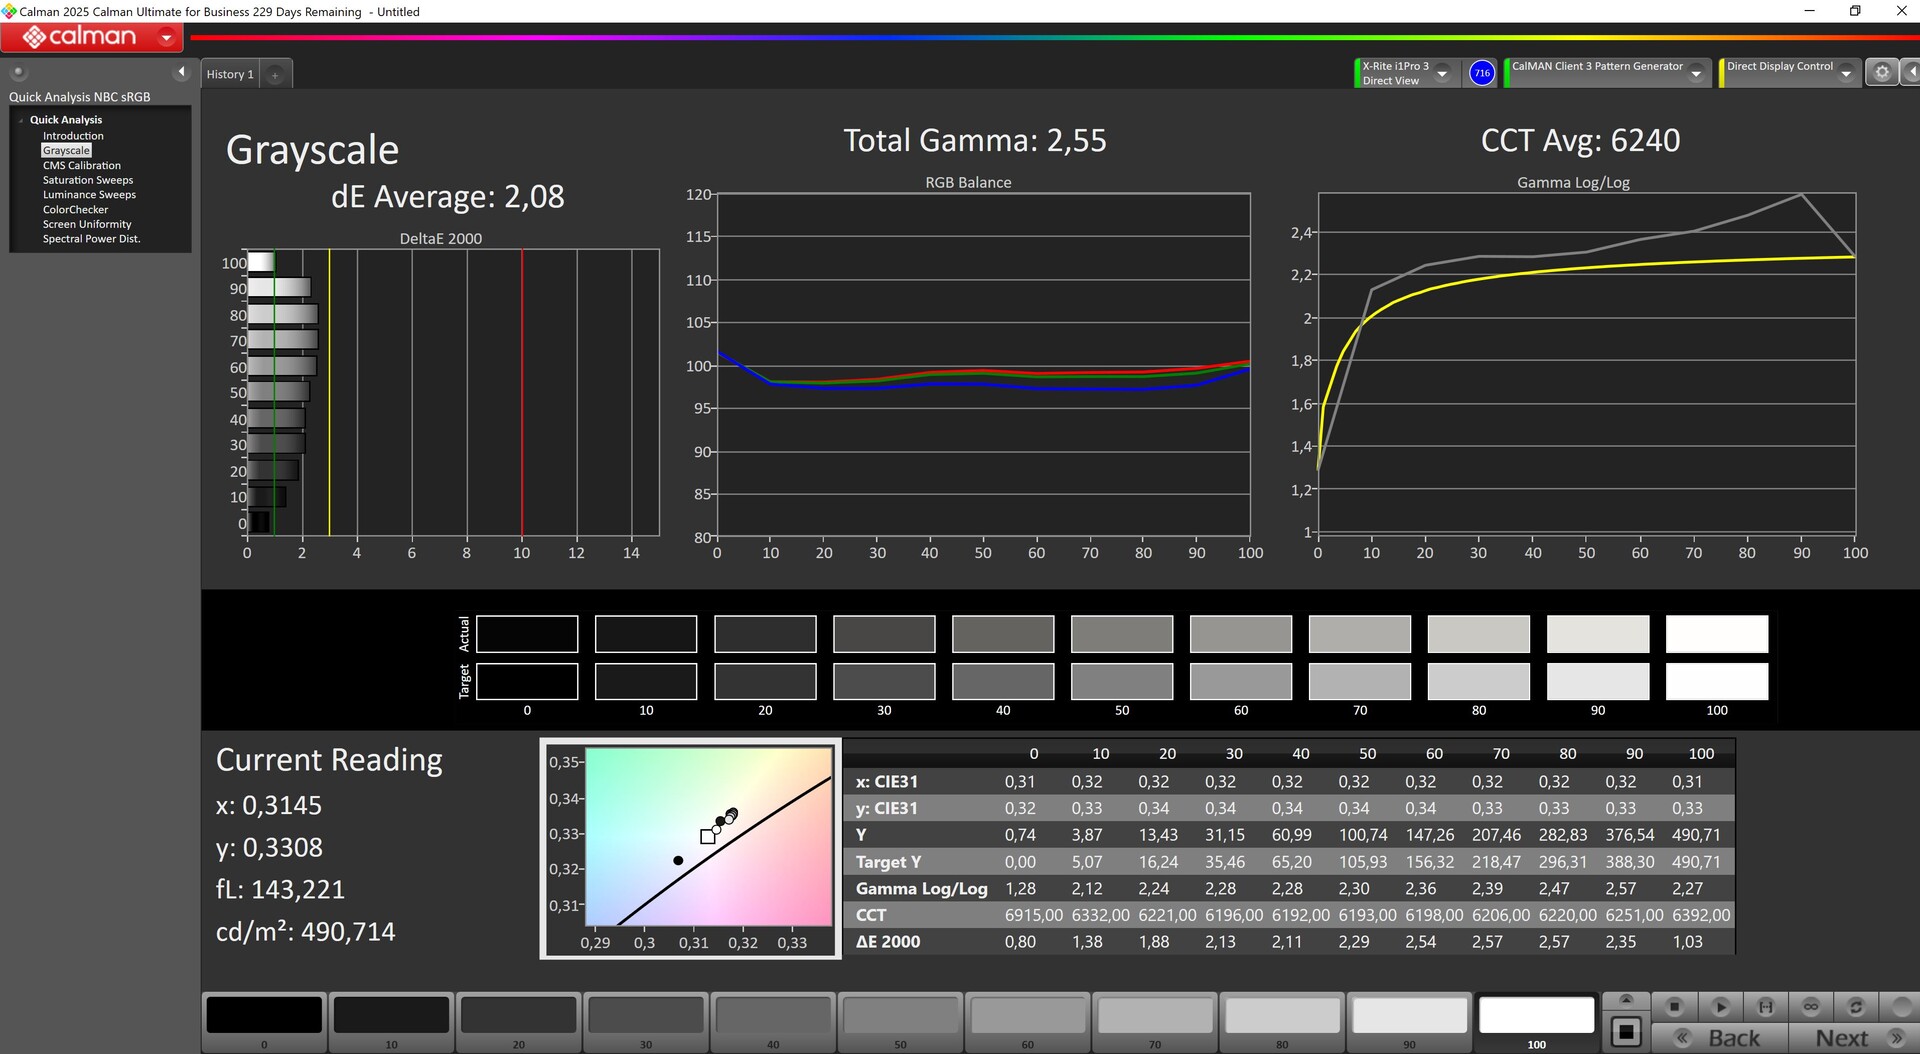
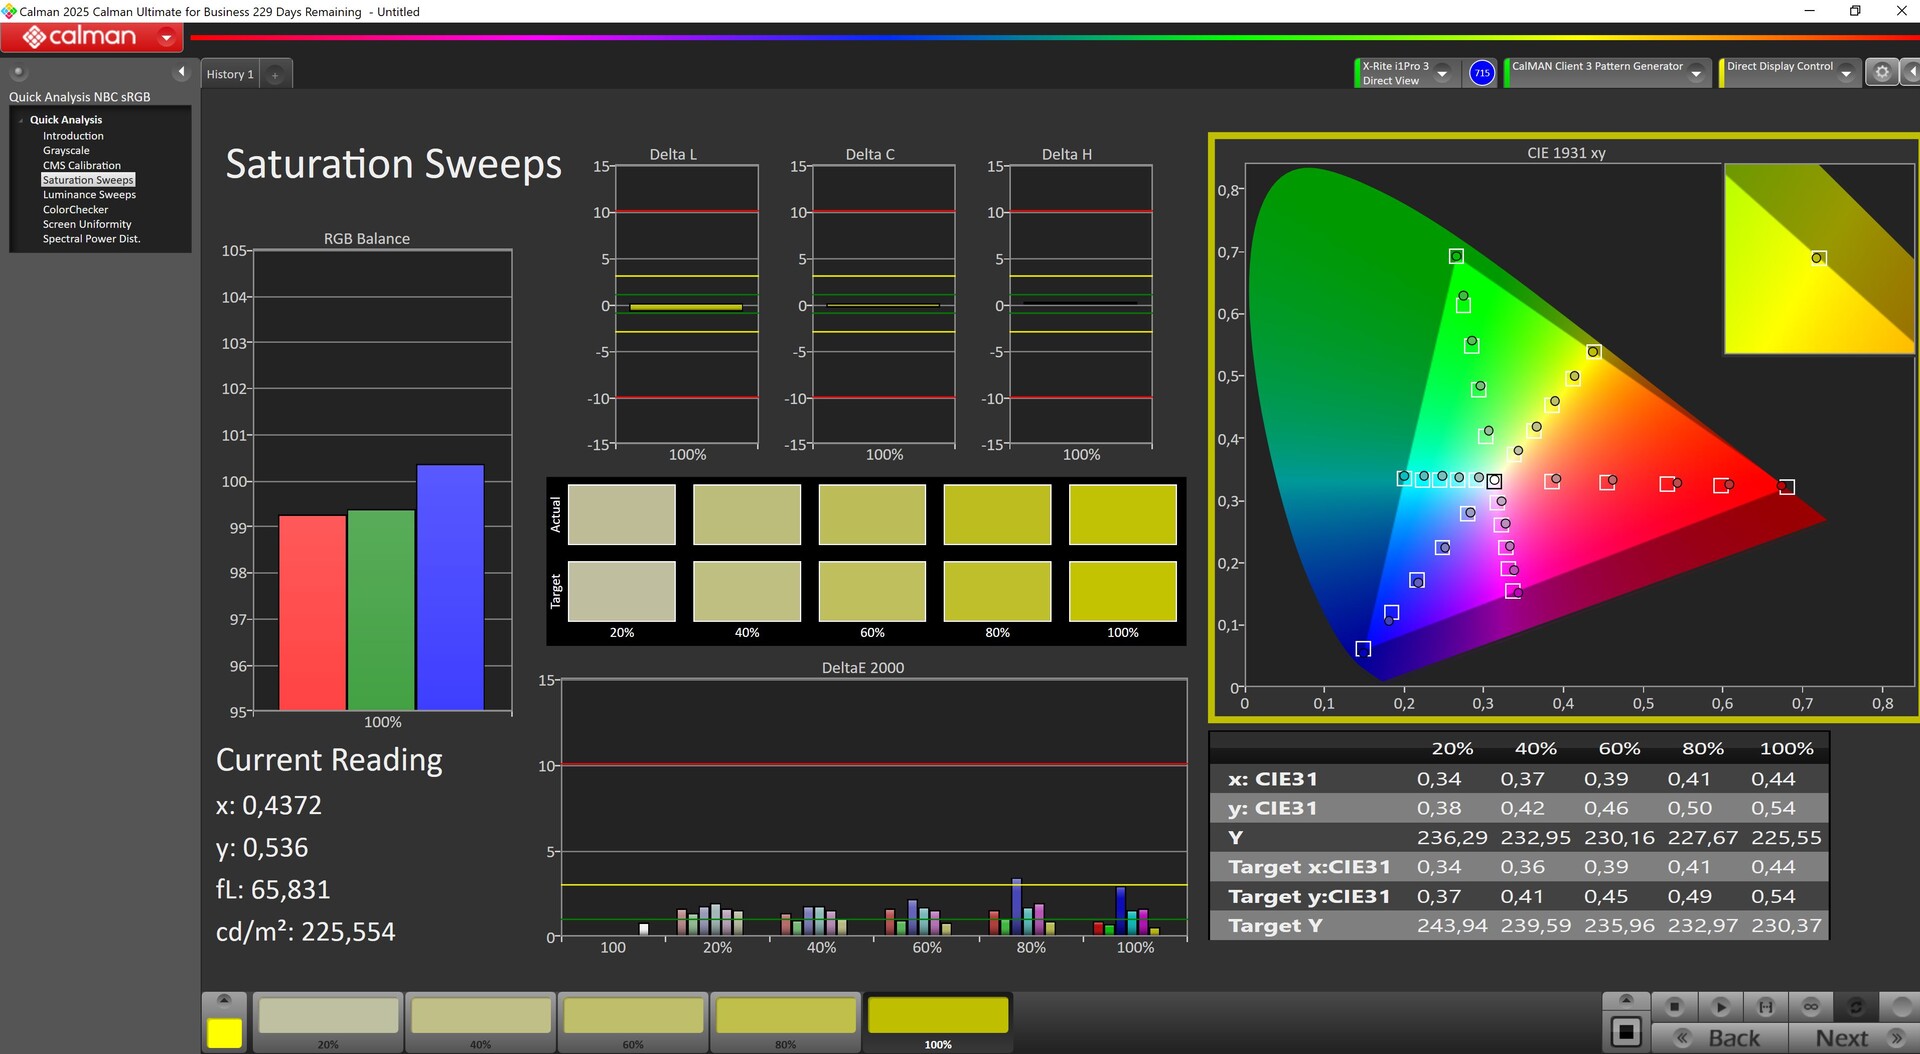
L'écran QHD+ IPS (2 560 x 1 600 pixels) est mat et rapide (environ 4 ms), avec une fréquence de 240 Hz. La luminosité moyenne est d'environ 470 nits et l'éclairage est assez homogène. Cependant, la valeur du noir est clairement trop élevée, ce qui nuit au contraste.
Remarque : MSI propose également un écran IPS Full HD à 165 Hz.

| |||||||||||||||||||||||||
Homogénéité de la luminosité: 91 %
Valeur mesurée au centre, sur batterie: 486 cd/m²
Contraste: 659:1 (Valeurs des noirs: 0.74 cd/m²)
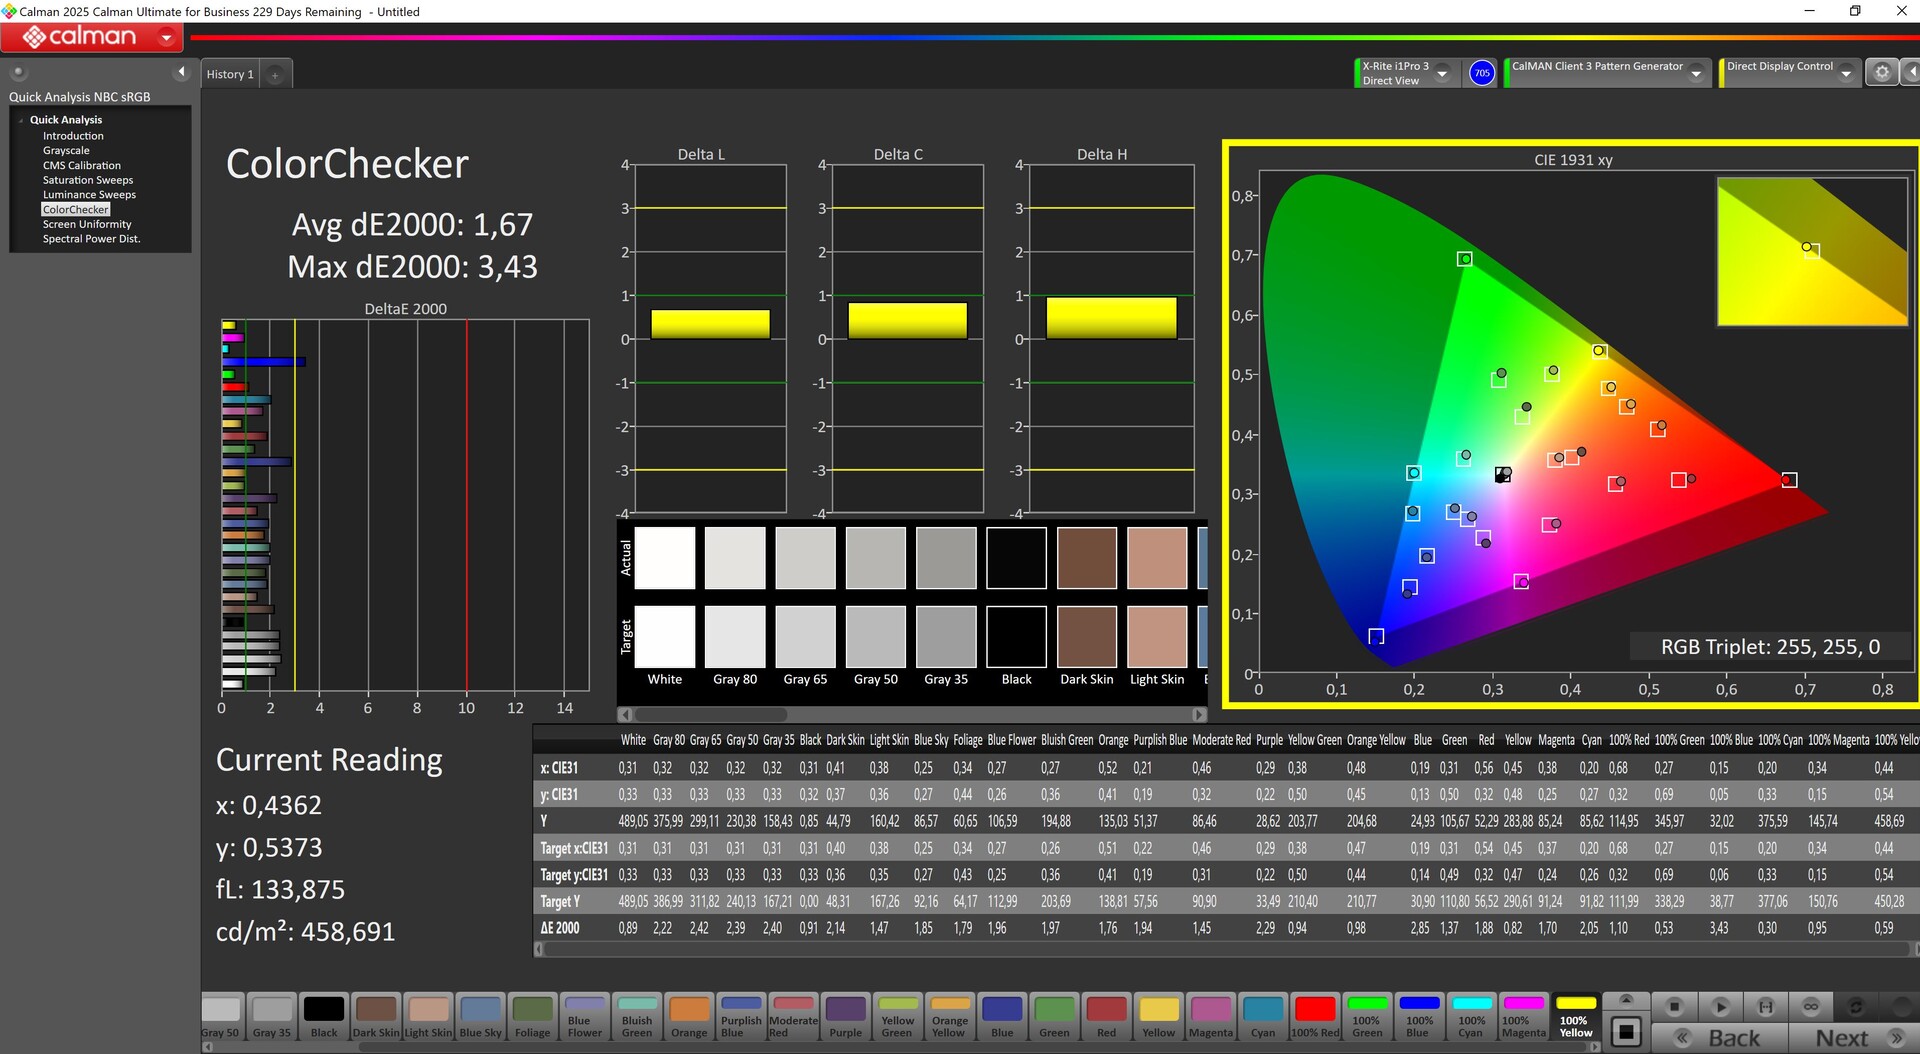
ΔE ColorChecker Calman: 1.67 | ∀{0.5-29.43 Ø4.72}
calibrated: 0.8
ΔE Greyscale Calman: 2.08 | ∀{0.09-98 Ø4.97}
87.4% AdobeRGB 1998 (Argyll 3D)
100% sRGB (Argyll 3D)
99.6% Display P3 (Argyll 3D)
Gamma: 2.55
CCT: 6240 K
| MSI Vector 17 HX AI A2XWIG B170QAN01.2 (AUO84A6), IPS, 2560x1600, 17", 240 Hz | Alienware 16 Area-51 AU Optronics B160QAN, IPS, 2560x1600, 16", 240 Hz | MSI Raider A18 HX A9WIG-080 B180ZAN01.0, MiniLED IPS, 3840x2400, 18", 120 Hz | Aorus MASTER 16 AM6H ATNA60DL03-0 (SDC41AB), OLED, 2560x1600, 16", 240 Hz | MSI Titan 18 HX AI A2XWJG AU Optronics B180ZAN01.0, Mini-LED, 3840x2160, 18", 120 Hz | Schenker XMG Neo 16 A25 5090 NE160QDM-NM9, Mini-LED, 2560x1600, 16", 300 Hz | |
|---|---|---|---|---|---|---|
| Display | -1% | 2% | 1% | 1% | 0% | |
| HDR Peak Brightness (cd/m²) | 1153 | |||||
| Display P3 Coverage (%) | 99.6 | 96 -4% | 99.9 0% | 95.3 -4% | 99.7 0% | 99.9 0% |
| sRGB Coverage (%) | 100 | 100 0% | 100 0% | 98.8 -1% | 99.9 0% | 100 0% |
| AdobeRGB 1998 Coverage (%) | 87.4 | 89.2 2% | 93.9 7% | 94.1 8% | 90.4 3% | 88.5 1% |
| Response Times | -42% | -377% | 92% | -179% | -277% | |
| Response Time Grey 50% / Grey 80% * (ms) | 3.6 ? | 4.8 ? -33% | 23 ? -539% | 0.24 ? 93% | 8.8 ? -144% | 17.4 ? -383% |
| Response Time Black / White * (ms) | 4.8 ? | 7.2 ? -50% | 15.1 ? -215% | 0.43 ? 91% | 15 ? -213% | 13 ? -171% |
| PWM Frequency (Hz) | 15203 | 960 | 15430 ? | 20253 | ||
| PWM Amplitude * (%) | 100 | 47 | 50 | 75 | ||
| Screen | -23% | 759% | 57% | -71% | -23% | |
| Brightness middle (cd/m²) | 488 | 554 14% | 510 5% | 435 -11% | 704 44% | 888 82% |
| Brightness (cd/m²) | 473 | 532 12% | 470 -1% | 437 -8% | 680 44% | 859 82% |
| Brightness Distribution (%) | 91 | 88 -3% | 85 -7% | 96 5% | 88 -3% | 94 3% |
| Black Level * (cd/m²) | 0.74 | 0.52 30% | 0.01 99% | 0.08 89% | ||
| Contrast (:1) | 659 | 1065 62% | 51000 7639% | 5438 725% | ||
| Colorchecker dE 2000 * | 1.67 | 2.81 -68% | 4.5 -169% | 2.42 -45% | 4.11 -146% | 3.3 -98% |
| Colorchecker dE 2000 max. * | 3.43 | 8.32 -143% | 7.3 -113% | 4.81 -40% | 6.43 -87% | 5.5 -60% |
| Colorchecker dE 2000 calibrated * | 0.8 | 0.65 19% | 5.7 -613% | 2.03 -154% | 2.5 -213% | 1.5 -88% |
| Greyscale dE 2000 * | 2.08 | 4.7 -126% | 2.3 -11% | 3.11 -50% | 4.9 -136% | 3.8 -83% |
| Gamma | 2.55 86% | 2.3 96% | 2.08 106% | 2.48 89% | 2.03 108% | 2.46 89% |
| CCT | 6240 104% | 6476 100% | 6648 98% | 6270 104% | 6331 103% | 6267 104% |
| Moyenne finale (programmes/paramètres) | -22% /
-21% | 128% /
434% | 50% /
50% | -83% /
-71% | -100% /
-60% |
* ... Moindre est la valeur, meilleures sont les performances
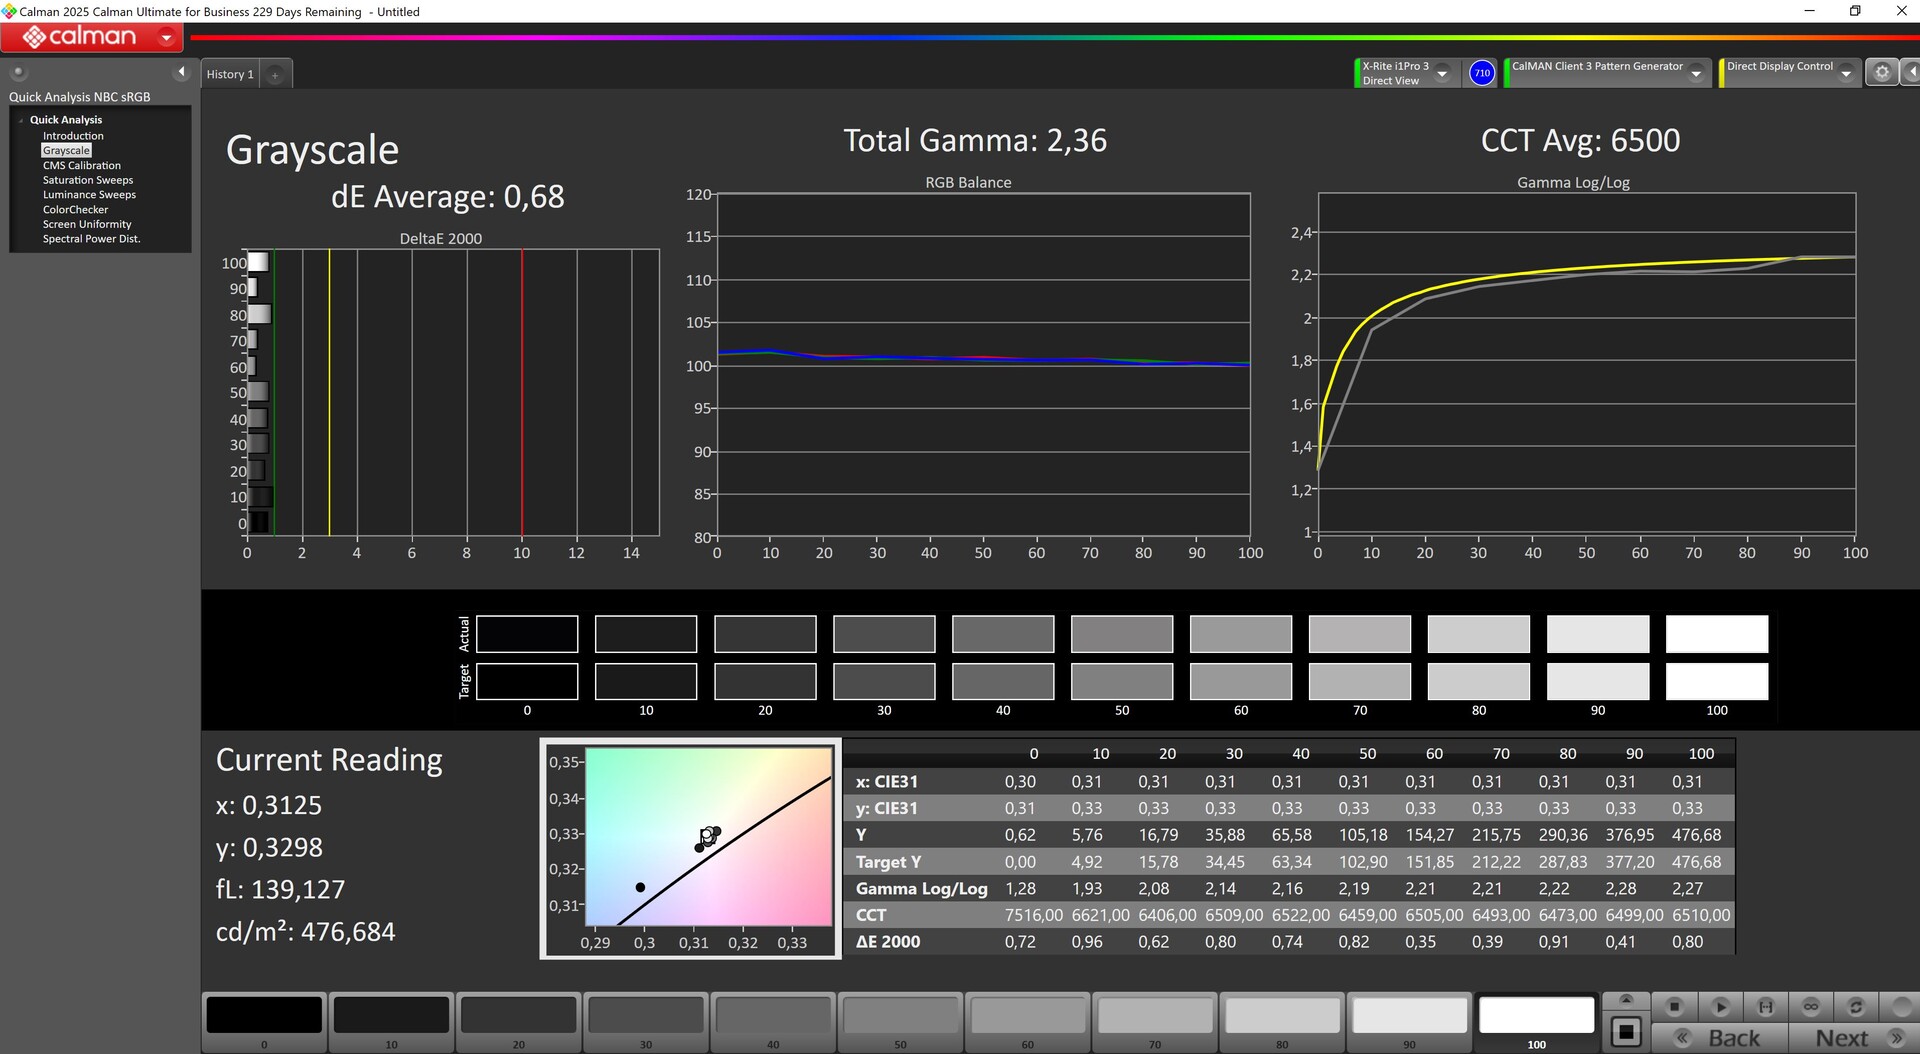
Nous mesurons déjà des valeurs bien calibrées au départ de l'usine. Après notre propre étalonnage, nous réduisons même les écarts à moins de 1.
Temps de réponse de l'écran
| ↔ Temps de réponse noir à blanc | ||
|---|---|---|
| 4.8 ms ... hausse ↗ et chute ↘ combinées | ↗ 1.8 ms hausse | 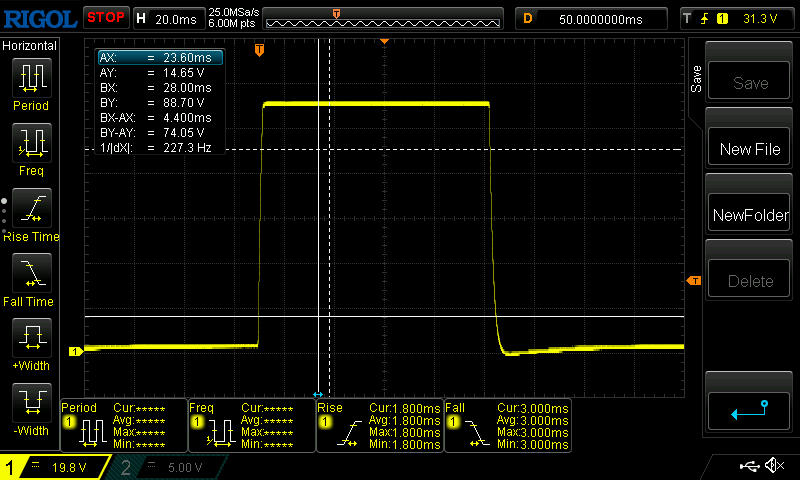 |
| ↘ 3 ms chute | ||
| L'écran montre de très faibles temps de réponse, parfait pour le jeu. En comparaison, tous les appareils testés affichent entre 0.1 (minimum) et 240 (maximum) ms. » 17 % des appareils testés affichent de meilleures performances. Cela signifie que les latences relevées sont meilleures que la moyenne (19.8 ms) de tous les appareils testés. | ||
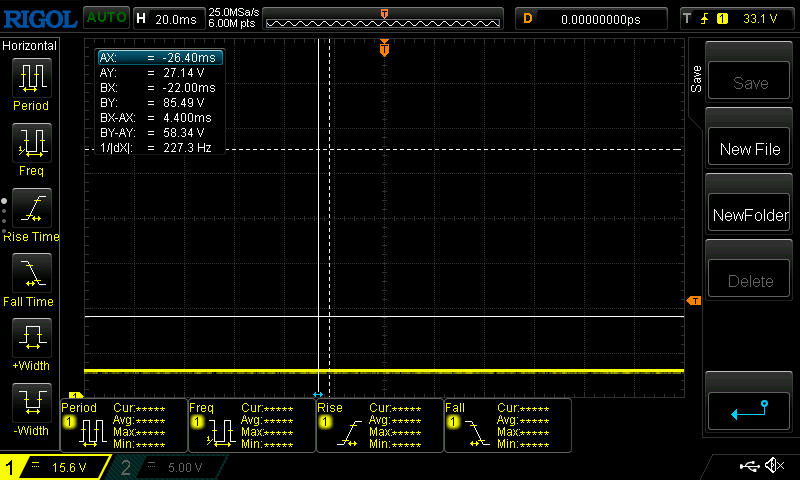
| ↔ Temps de réponse gris 50% à gris 80% | ||
| 3.6 ms ... hausse ↗ et chute ↘ combinées | ↗ 1.8 ms hausse |  |
| ↘ 1.8 ms chute | ||
| L'écran montre de très faibles temps de réponse, parfait pour le jeu. En comparaison, tous les appareils testés affichent entre 0.165 (minimum) et 636 (maximum) ms. » 14 % des appareils testés affichent de meilleures performances. Cela signifie que les latences relevées sont meilleures que la moyenne (31 ms) de tous les appareils testés. | ||
Scintillement / MLI (Modulation de largeur d'impulsion)
| Scintillement / MLI (Modulation de largeur d'impulsion) non décelé |  | ||
En comparaison, 52 % des appareils testés n'emploient pas MDI pour assombrir leur écran. Nous avons relevé une moyenne à 7747 (minimum : 5 - maximum : 343500) Hz dans le cas où une MDI était active. | |||


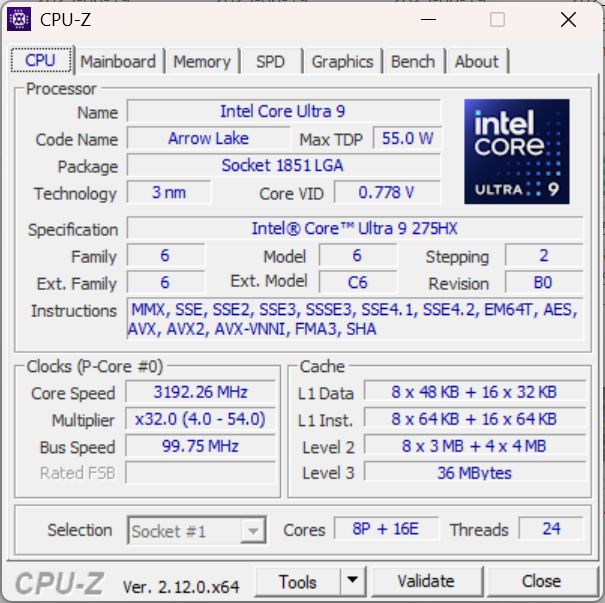
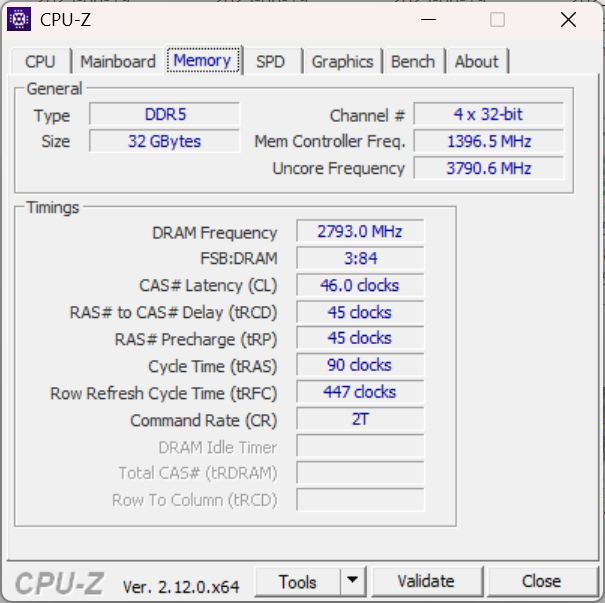
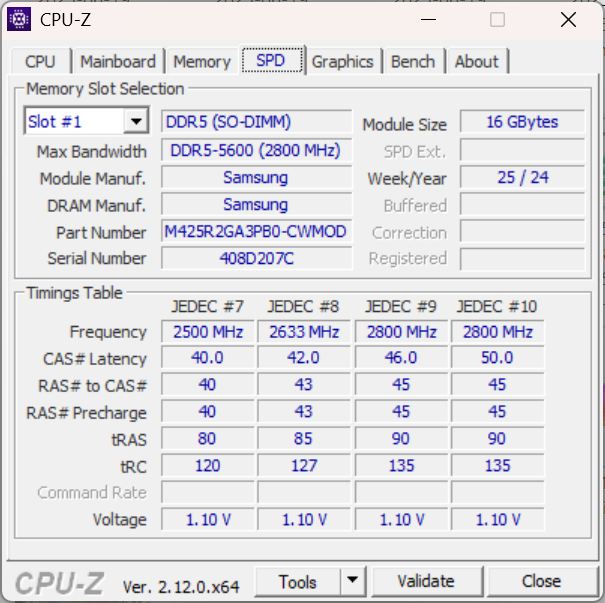
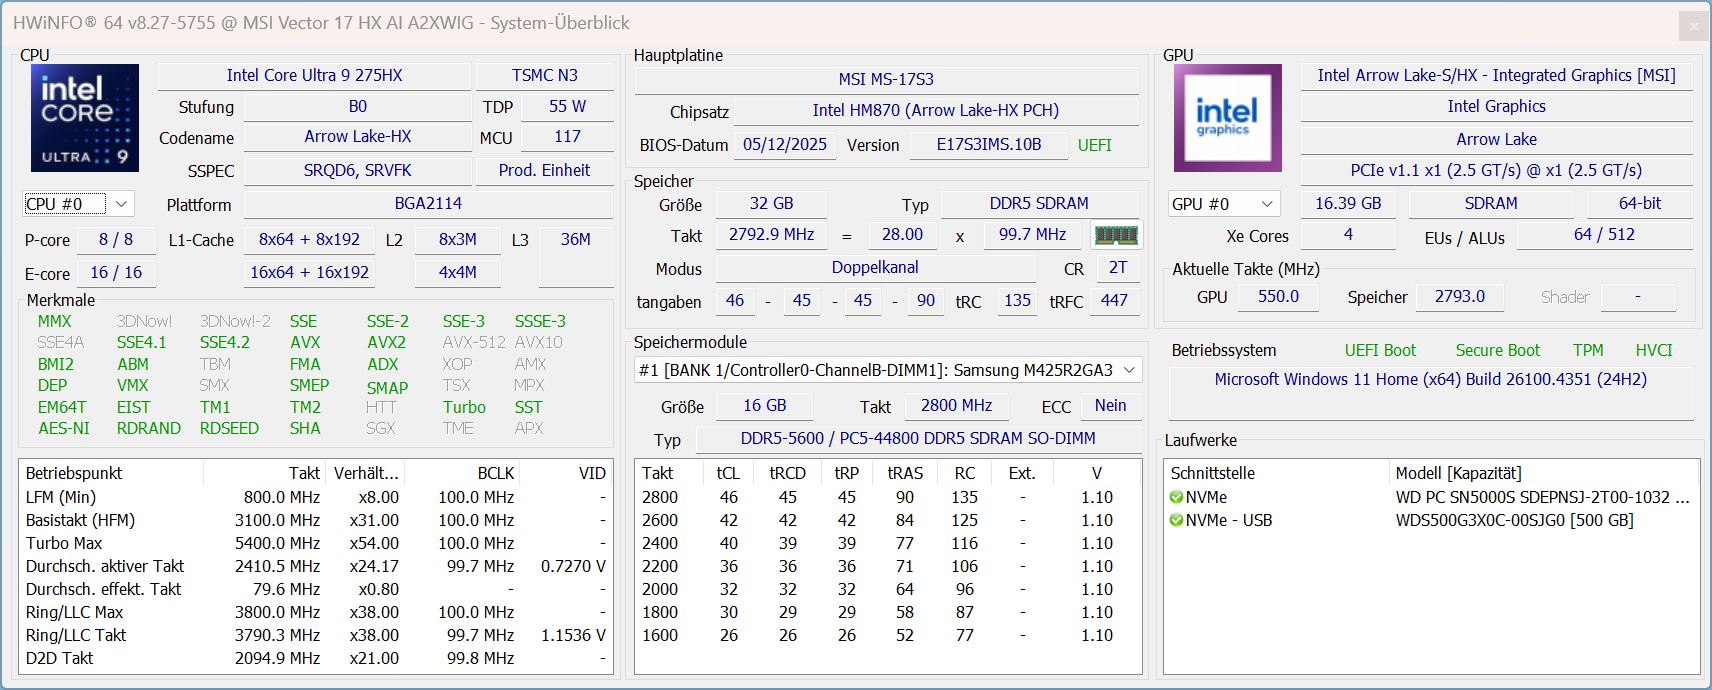
Performance - Effondrement du processeur en cas de charge continue
Avec Intel Core Ultra 9 275HX, RTX 5080 laptopavec un SSD de 2 To et 32 Go de RAM, le Vector 17 HX est un gamer haut de gamme et devrait être équipé pour tous les titres actuels.
Conditions d'essai
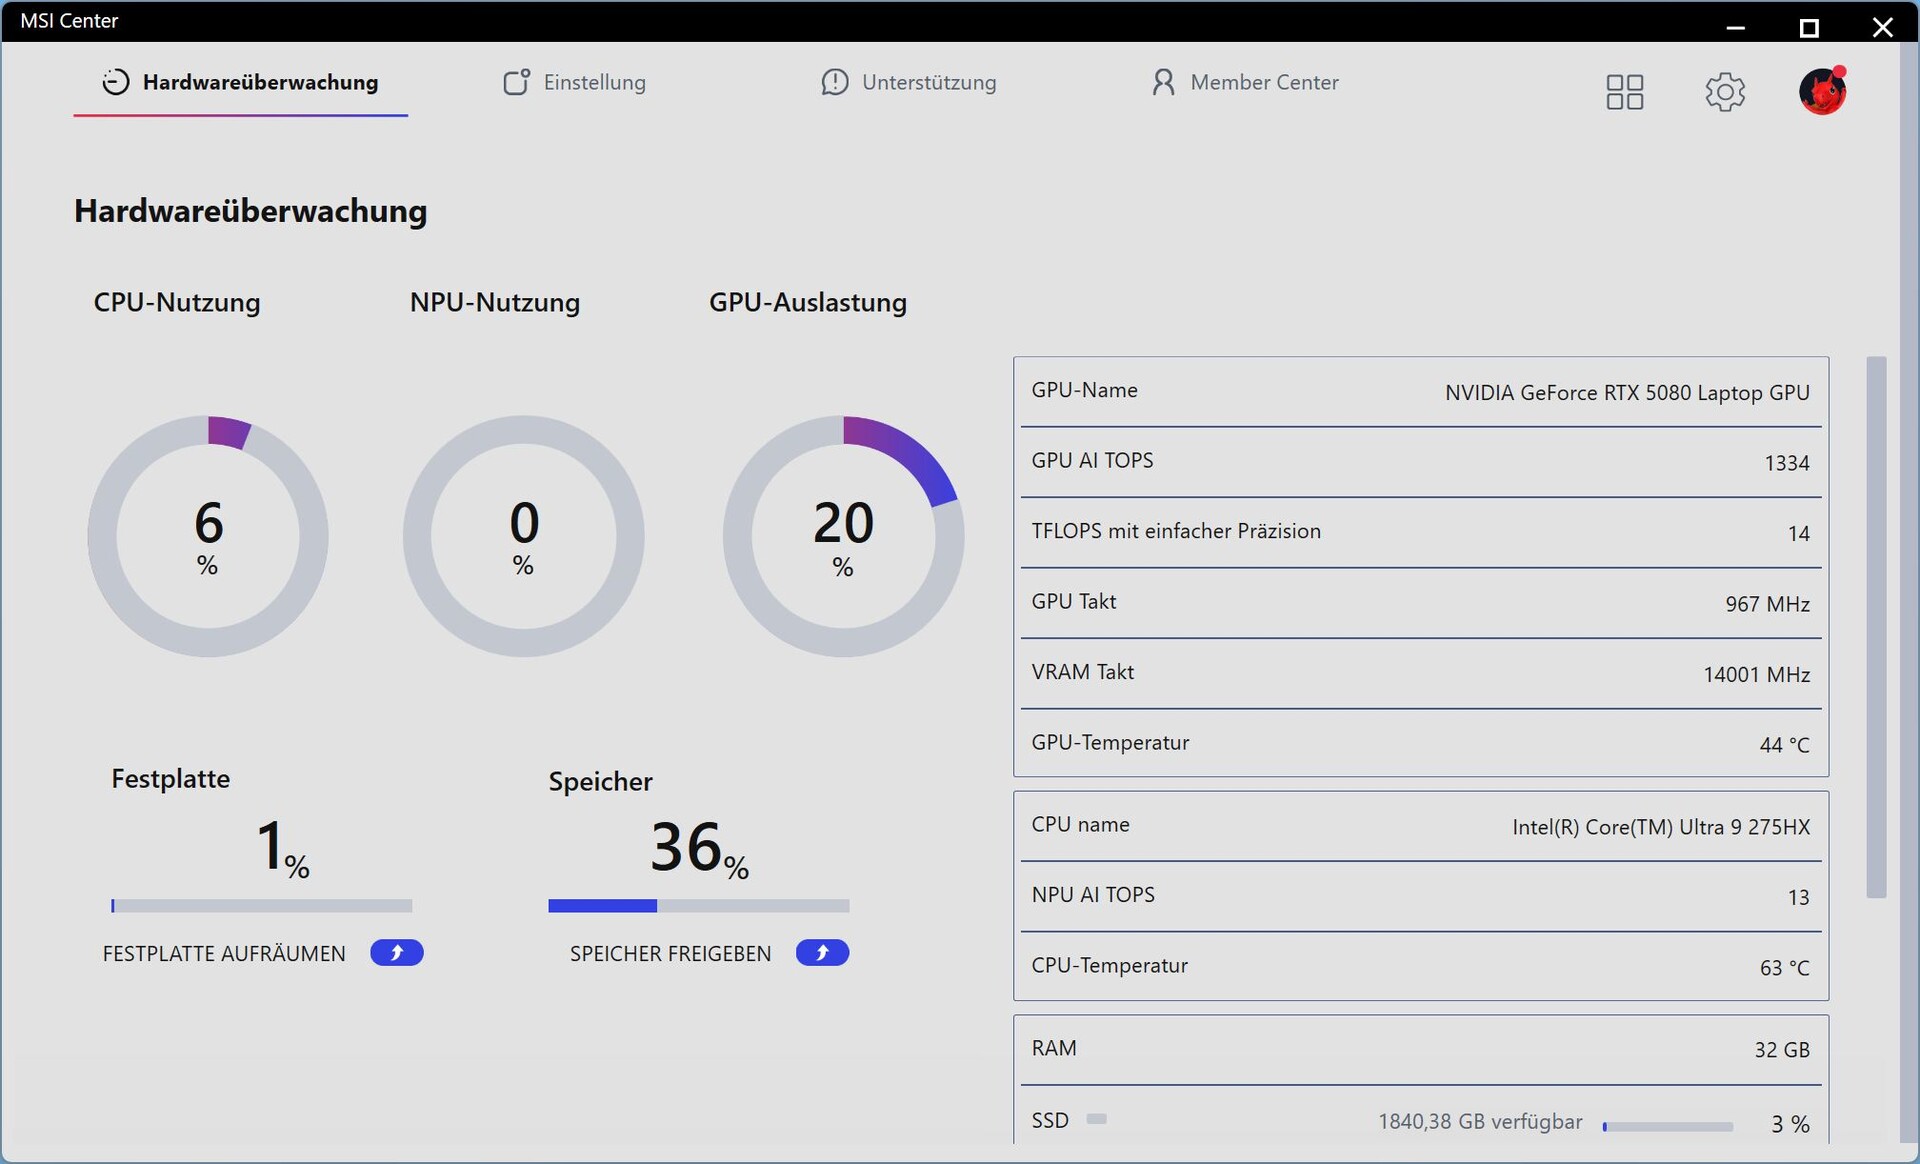
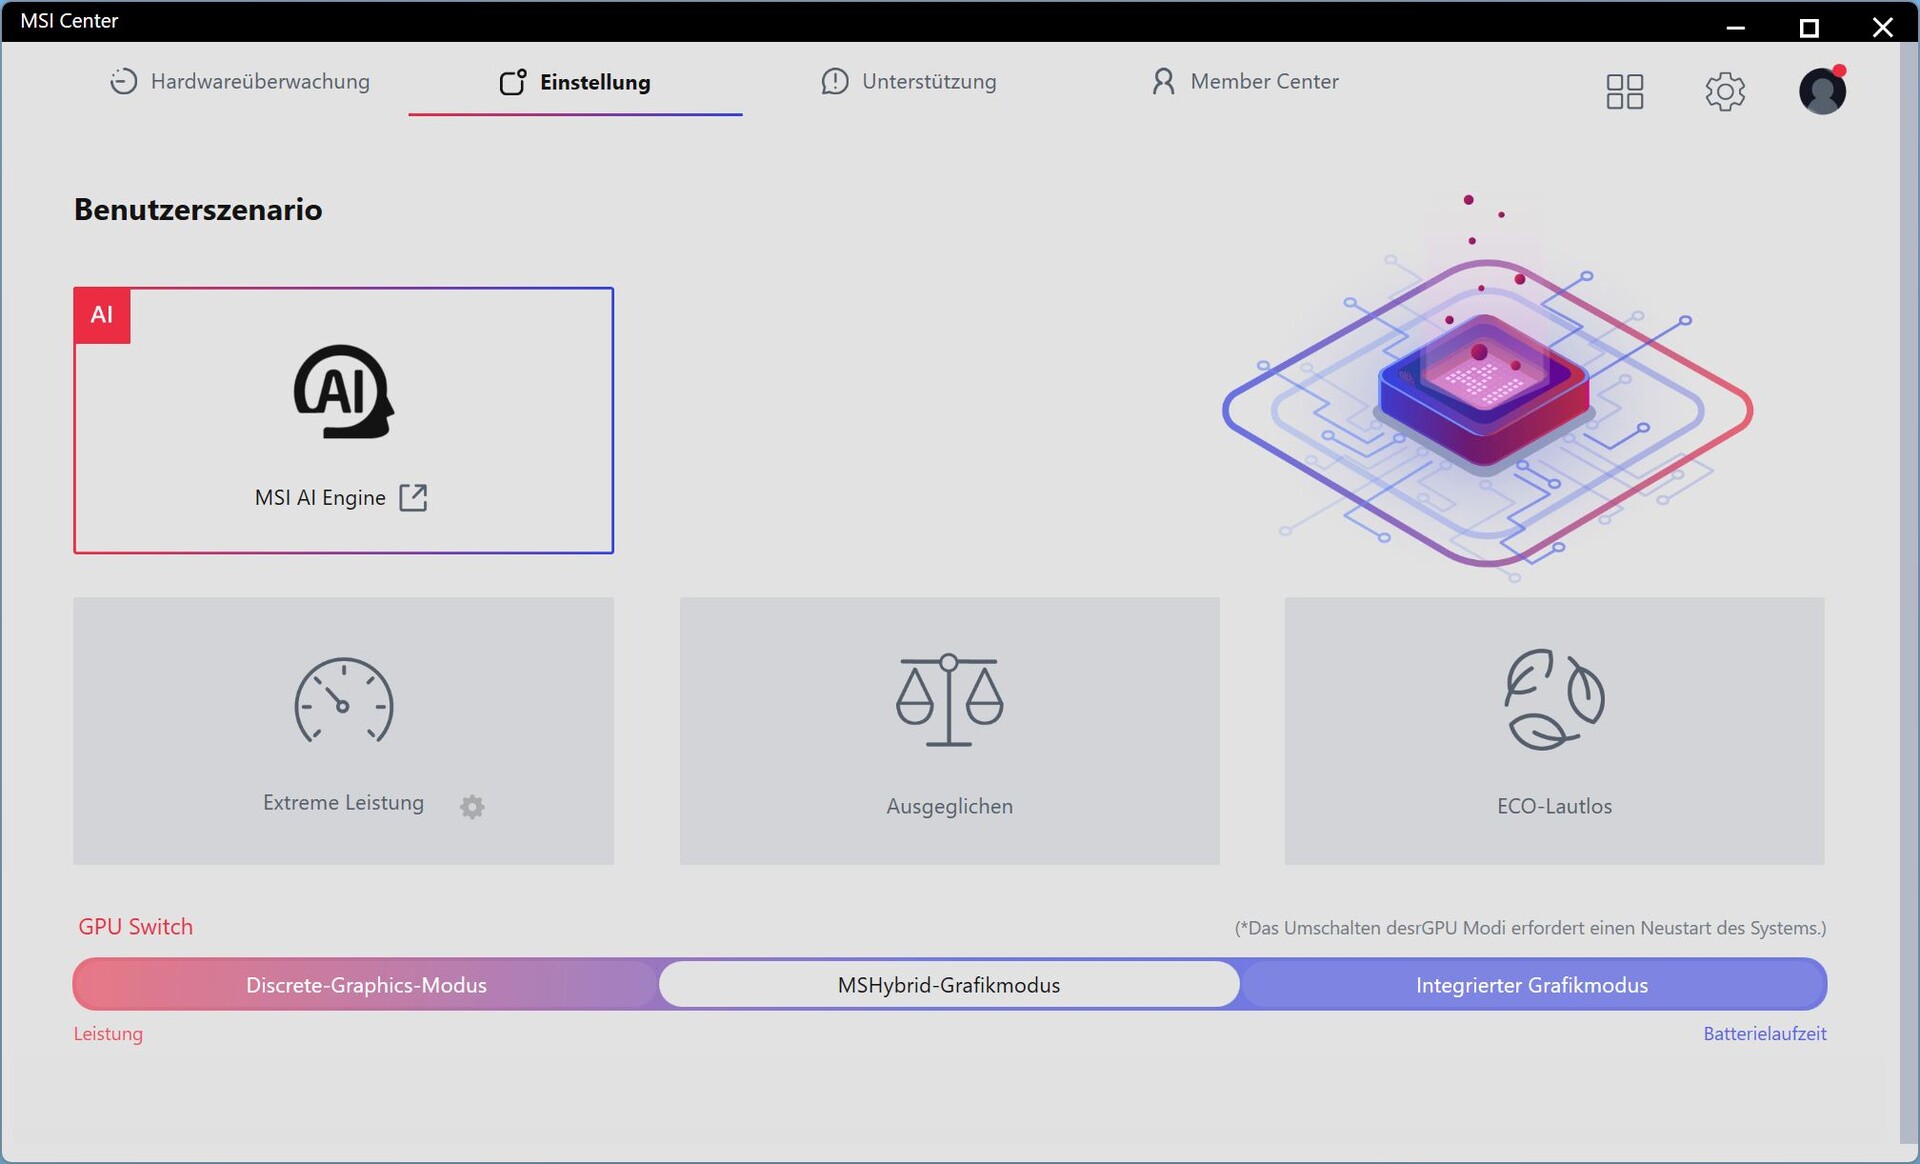
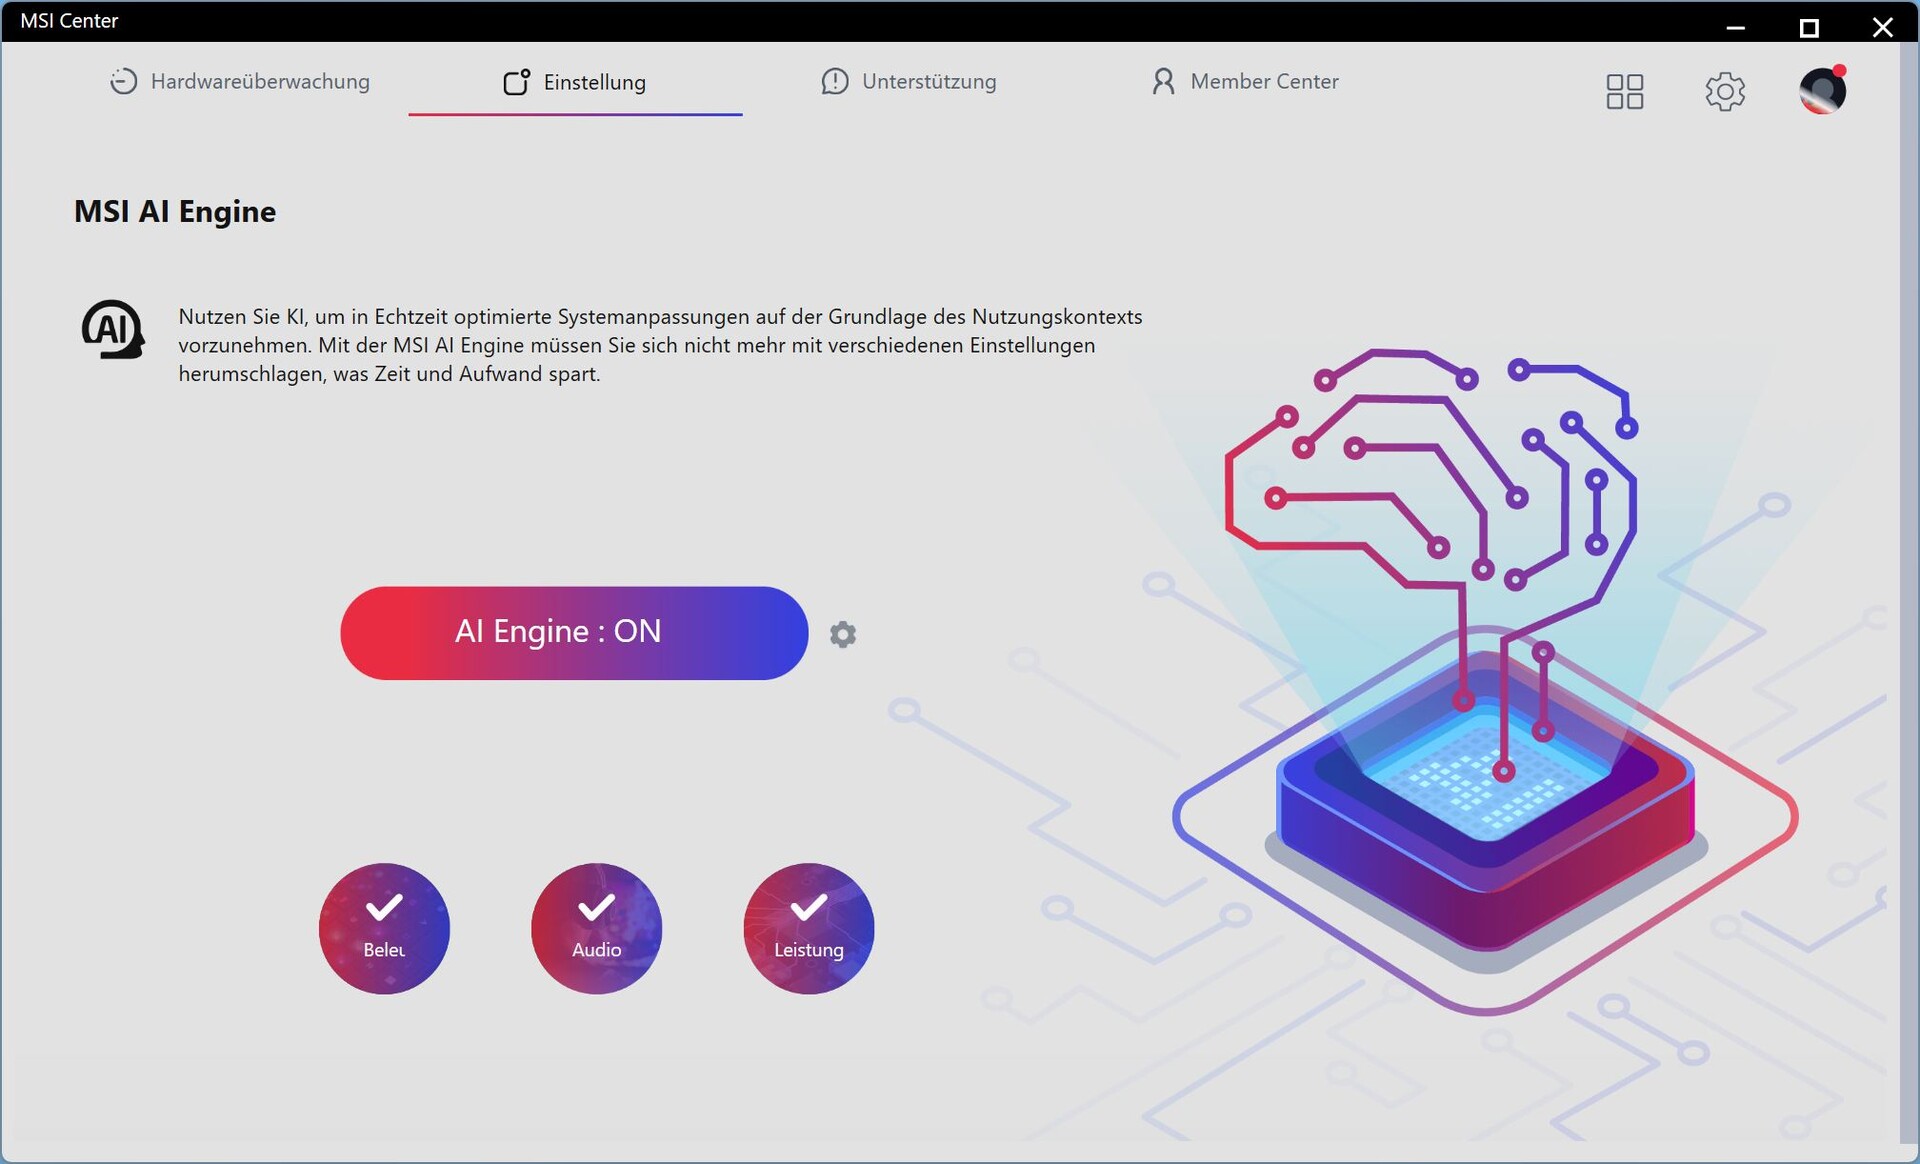
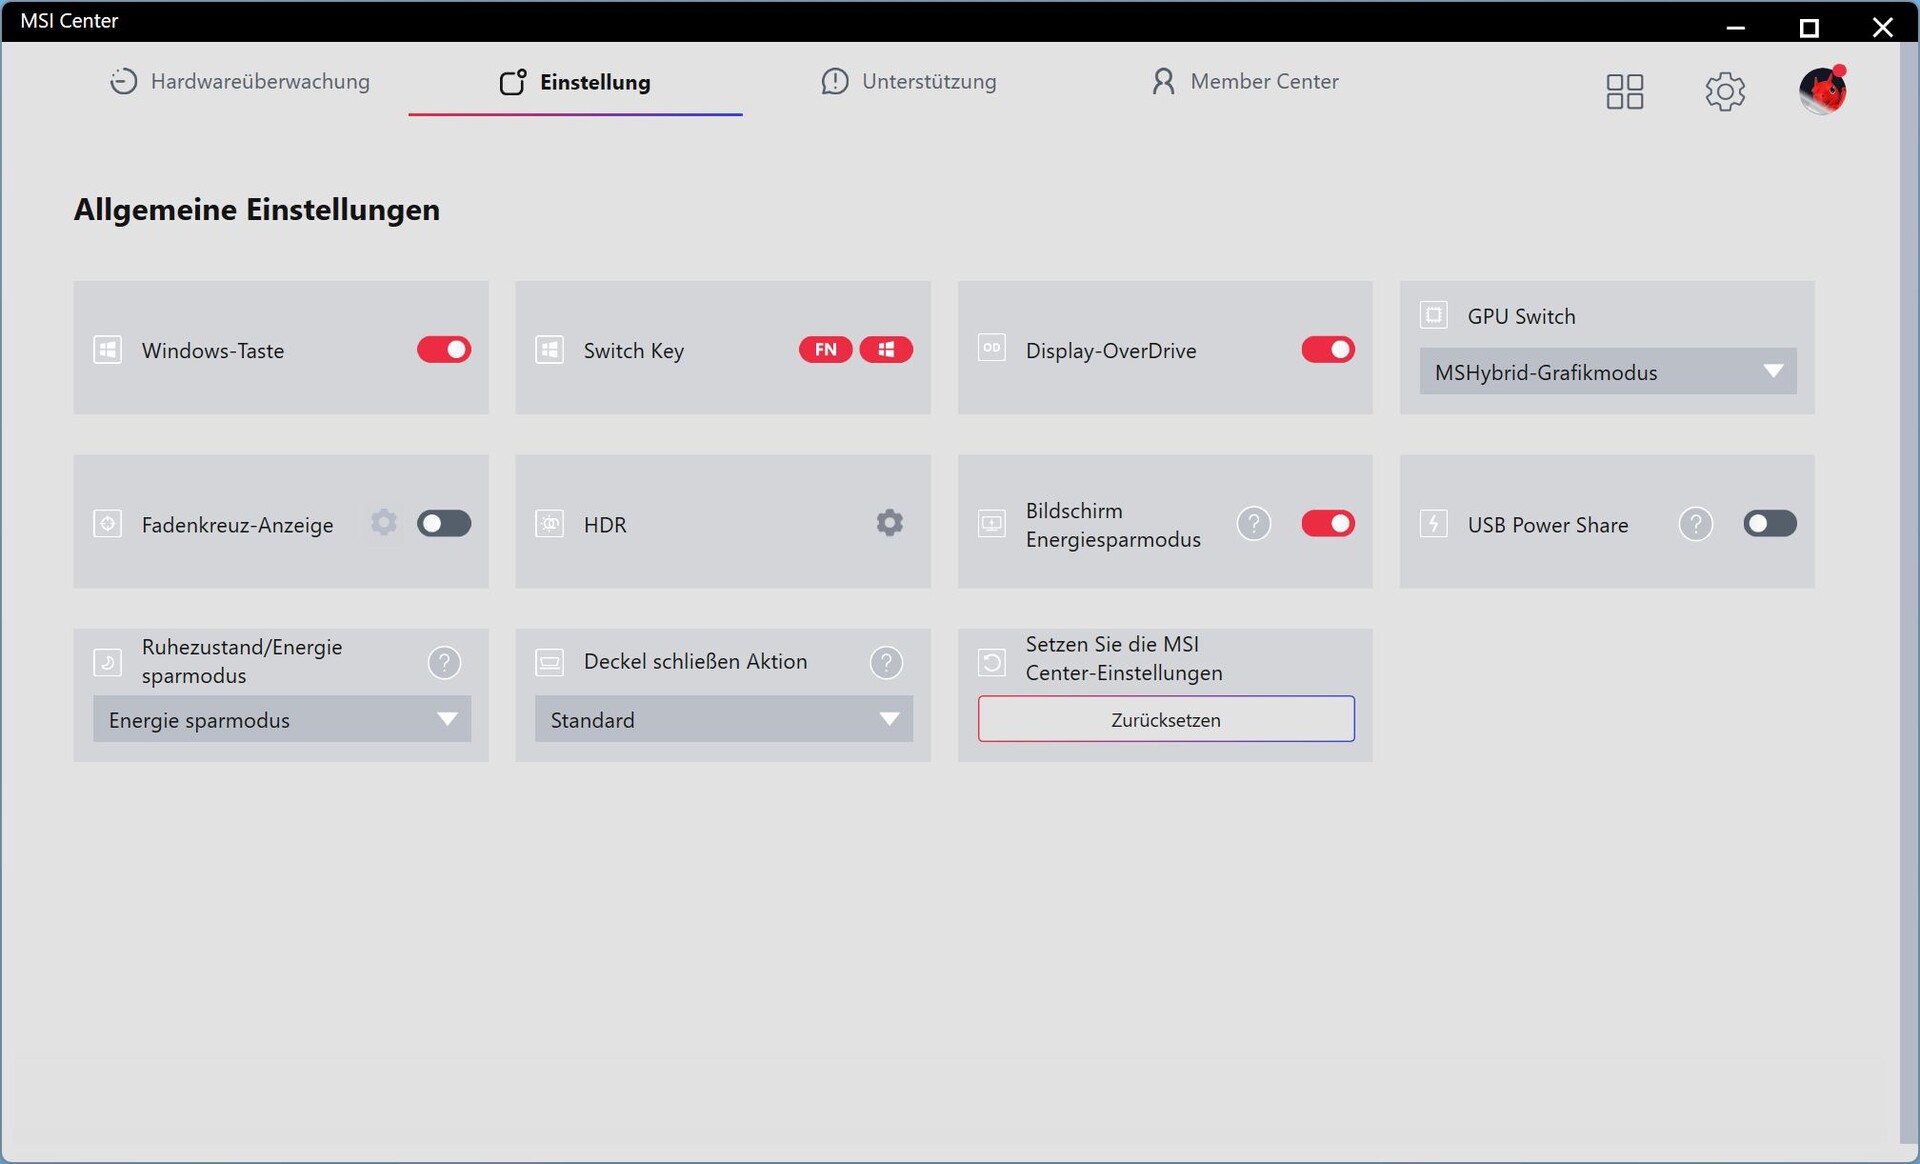
Parmi les quatre profils de performance, nous sélectionnons le moteur AI ; un MUX est également intégré dans le MSI Center.
A l'origine, nous avons dû faire face à une consommation au ralenti très élevée (jusqu'à 60 W) et à un niveau de bruit excessif pendant le test. Une mise à jour du BIOS et du MSI Center n'a apporté aucune amélioration dans un premier temps. Le problème n'a été résolu qu'après une réinstallation supplémentaire de Windows. Nous avons dû effectuer à nouveau diverses mesures.
| MSI Center Mode | MSIAI Engine | Extreme performance | Balanced | ECO Silent |
| Cyberpunk 2077 Bruit en dB(A) | 60,35 | 60,35 | 47,4 | 36,21 |
| Consommation électrique Cyberpunk | 313 W | 313 W | 253 W | 134 W |
| Consommation du GPU | 160 W | 160 W | 130 W | 80 W |
| Performances de Cyberpunk 2077 (FHD/Ultra) | 134,6 fps | 134,5 fps | 123 fps | 78,4 fps |
| Cinebench R15 Multi Score | 5112 Points | 5430 Points | 4813 Points | 2019 Points |
| CPU PL1 | 110 watts | 150 watts | 65 watts | 20 watts |
| CPU PL2 | 150 watts | 150 watts | 110 watts | 25 watts |
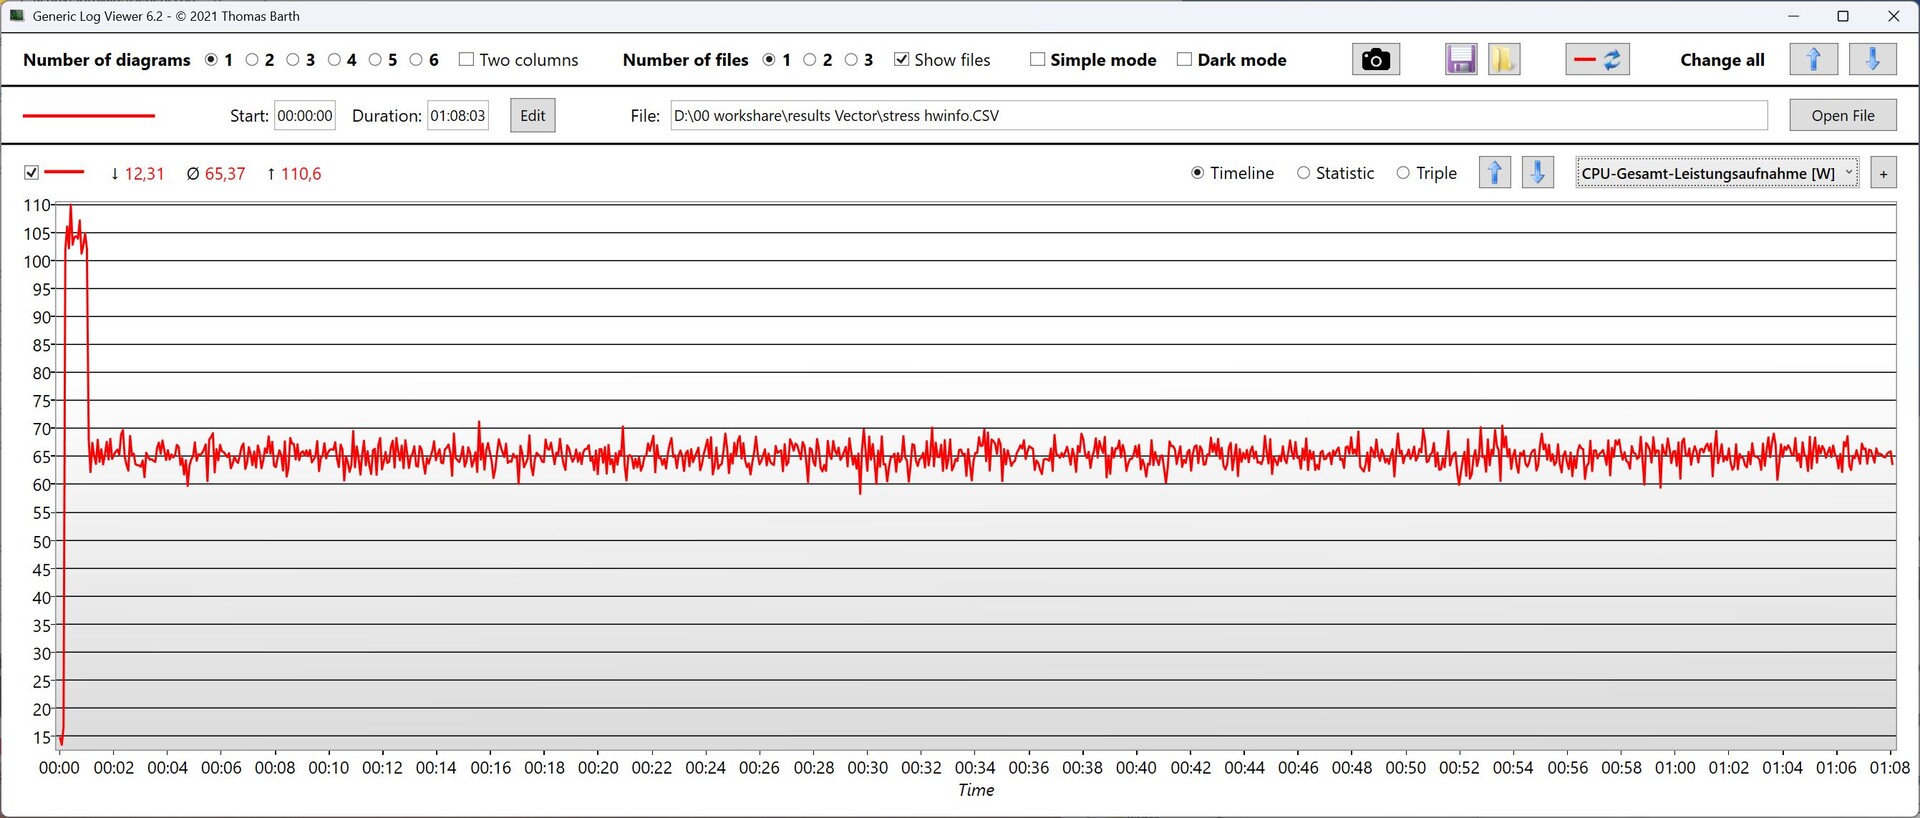
Processeur
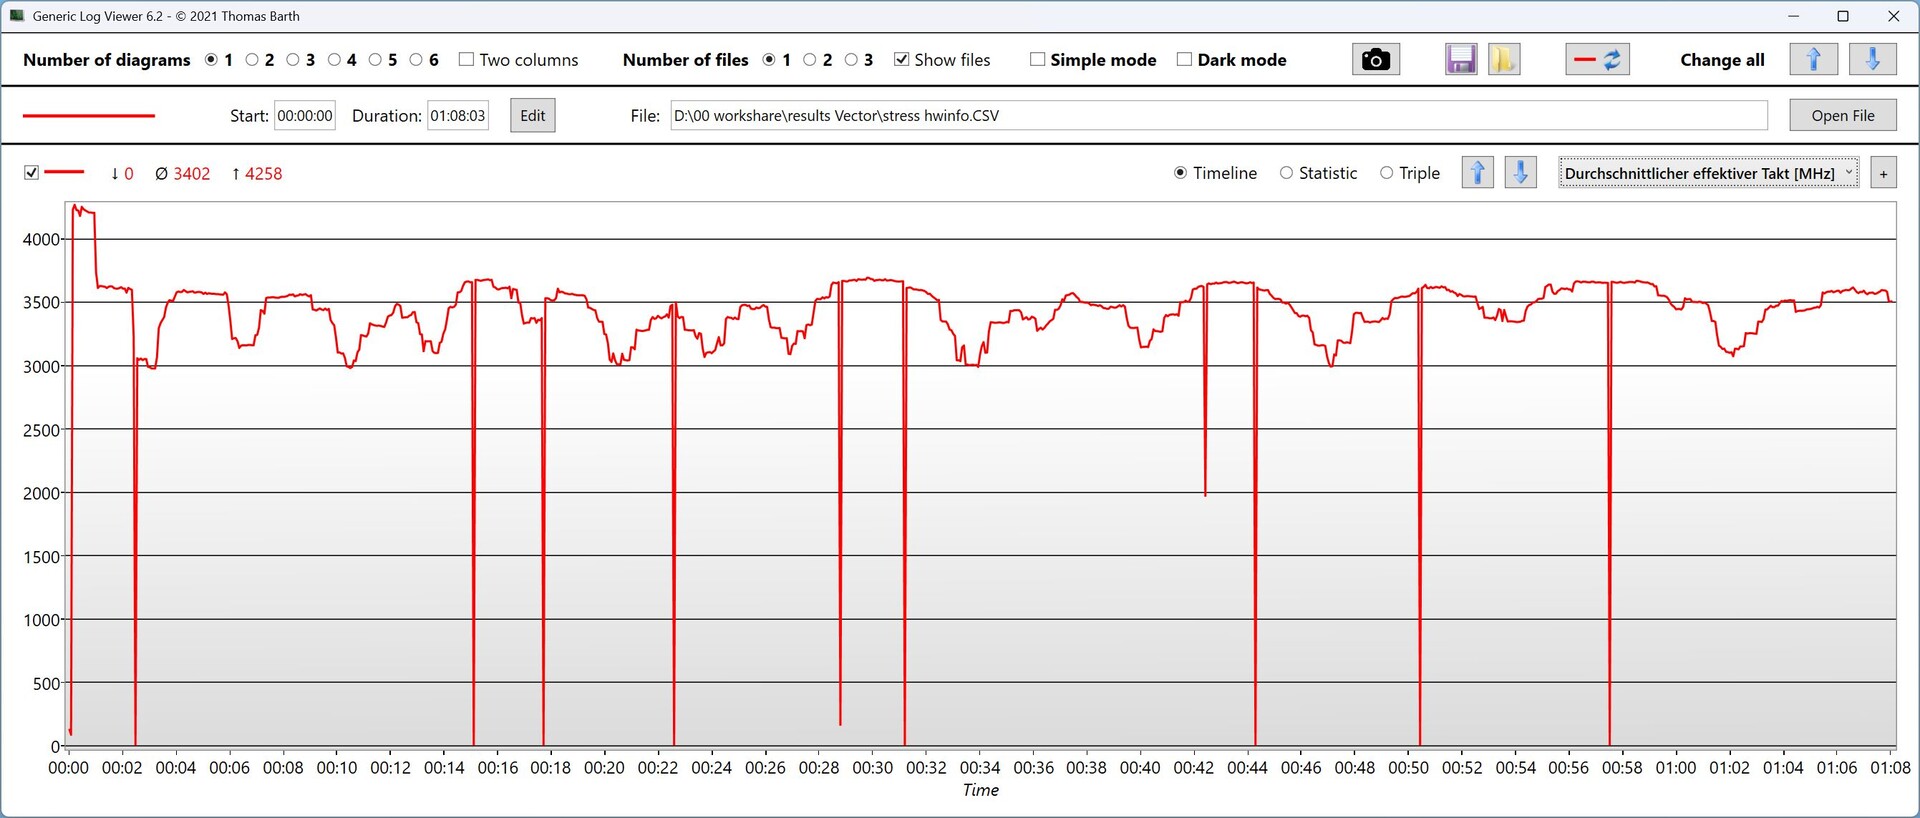
Le Core Ultra 9 275HX avec 24 cœurs (8 cœurs P et 16 cœurs E, jusqu'à 5,4 GHz) est étranglé en cas de charge continue : il maintient une performance moyenne pendant 2 cycles, après quoi il perd plus de 1 000 points. Les performances à long terme sont donc inférieures à celles d'un Core Ultra 7 255HX. En revanche, en mode Extreme Performance, les performances sont stables.
Sur l'ensemble des tests CPU, le Vector 17 HX est environ 6 % en dessous de la moyenne avec le même CPU. Environ 59 % des performances du processeur sont perdues en mode batterie.
Cinebench R15 Multi Endurance test
Cinebench R23: Multi Core | Single Core
Cinebench R20: CPU (Multi Core) | CPU (Single Core)
Cinebench R15: CPU Multi 64Bit | CPU Single 64Bit
Blender: v2.79 BMW27 CPU
7-Zip 18.03: 7z b 4 | 7z b 4 -mmt1
Geekbench 6.7: Multi-Core | Single-Core
Geekbench 5.5: Multi-Core | Single-Core
HWBOT x265 Benchmark v2.2: 4k Preset
LibreOffice : 20 Documents To PDF
R Benchmark 2.5: Overall mean
| CPU Performance rating | |
| Schenker XMG Neo 16 A25 5090 | |
| MSI Raider A18 HX A9WIG-080 | |
| MSI Titan 18 HX AI A2XWJG | |
| Aorus MASTER 16 AM6H | |
| Moyenne Intel Core Ultra 9 275HX | |
| MSI Vector 17 HX AI A2XWIG | |
| Alienware 16 Area-51 | |
| Moyenne de la classe Gaming | |
| Cinebench R23 / Multi Core | |
| MSI Titan 18 HX AI A2XWJG | |
| Schenker XMG Neo 16 A25 5090 | |
| MSI Raider A18 HX A9WIG-080 | |
| Aorus MASTER 16 AM6H | |
| Moyenne Intel Core Ultra 9 275HX (30712 - 40970, n=31) | |
| MSI Vector 17 HX AI A2XWIG | |
| Alienware 16 Area-51 | |
| Moyenne de la classe Gaming (10488 - 40970, n=106, 2 dernières années) | |
| Cinebench R23 / Single Core | |
| Aorus MASTER 16 AM6H | |
| Moyenne Intel Core Ultra 9 275HX (2009 - 2267, n=31) | |
| MSI Titan 18 HX AI A2XWJG | |
| MSI Vector 17 HX AI A2XWIG | |
| Schenker XMG Neo 16 A25 5090 | |
| MSI Raider A18 HX A9WIG-080 | |
| Moyenne de la classe Gaming (1166 - 2387, n=106, 2 dernières années) | |
| Alienware 16 Area-51 | |
| Cinebench R20 / CPU (Multi Core) | |
| MSI Titan 18 HX AI A2XWJG | |
| Schenker XMG Neo 16 A25 5090 | |
| MSI Raider A18 HX A9WIG-080 | |
| Aorus MASTER 16 AM6H | |
| Moyenne Intel Core Ultra 9 275HX (12026 - 16108, n=30) | |
| Alienware 16 Area-51 | |
| MSI Vector 17 HX AI A2XWIG | |
| Moyenne de la classe Gaming (4029 - 16108, n=105, 2 dernières années) | |
| Cinebench R20 / CPU (Single Core) | |
| Aorus MASTER 16 AM6H | |
| MSI Raider A18 HX A9WIG-080 | |
| Schenker XMG Neo 16 A25 5090 | |
| Moyenne Intel Core Ultra 9 275HX (774 - 870, n=30) | |
| MSI Titan 18 HX AI A2XWJG | |
| MSI Vector 17 HX AI A2XWIG | |
| Moyenne de la classe Gaming (442 - 904, n=105, 2 dernières années) | |
| Alienware 16 Area-51 | |
| Cinebench R15 / CPU Multi 64Bit | |
| MSI Titan 18 HX AI A2XWJG | |
| Schenker XMG Neo 16 A25 5090 | |
| MSI Raider A18 HX A9WIG-080 | |
| Aorus MASTER 16 AM6H | |
| Moyenne Intel Core Ultra 9 275HX (4737 - 6271, n=30) | |
| MSI Vector 17 HX AI A2XWIG | |
| Alienware 16 Area-51 | |
| Moyenne de la classe Gaming (1578 - 6271, n=104, 2 dernières années) | |
| Cinebench R15 / CPU Single 64Bit | |
| MSI Vector 17 HX AI A2XWIG | |
| MSI Vector 17 HX AI A2XWIG | |
| Schenker XMG Neo 16 A25 5090 | |
| Aorus MASTER 16 AM6H | |
| Moyenne Intel Core Ultra 9 275HX (306 - 343, n=31) | |
| MSI Titan 18 HX AI A2XWJG | |
| MSI Raider A18 HX A9WIG-080 | |
| Alienware 16 Area-51 | |
| Moyenne de la classe Gaming (188.8 - 344, n=105, 2 dernières années) | |
| Blender / v2.79 BMW27 CPU | |
| Moyenne de la classe Gaming (80 - 330, n=103, 2 dernières années) | |
| MSI Vector 17 HX AI A2XWIG | |
| Alienware 16 Area-51 | |
| Moyenne Intel Core Ultra 9 275HX (82 - 116, n=29) | |
| Aorus MASTER 16 AM6H | |
| MSI Titan 18 HX AI A2XWJG | |
| MSI Raider A18 HX A9WIG-080 | |
| Schenker XMG Neo 16 A25 5090 | |
| 7-Zip 18.03 / 7z b 4 | |
| Schenker XMG Neo 16 A25 5090 | |
| MSI Raider A18 HX A9WIG-080 | |
| MSI Titan 18 HX AI A2XWJG | |
| Moyenne Intel Core Ultra 9 275HX (98236 - 124155, n=30) | |
| Aorus MASTER 16 AM6H | |
| Alienware 16 Area-51 | |
| MSI Vector 17 HX AI A2XWIG | |
| Moyenne de la classe Gaming (33491 - 148086, n=104, 2 dernières années) | |
| 7-Zip 18.03 / 7z b 4 -mmt1 | |
| Schenker XMG Neo 16 A25 5090 | |
| MSI Raider A18 HX A9WIG-080 | |
| MSI Titan 18 HX AI A2XWJG | |
| Moyenne Intel Core Ultra 9 275HX (6026 - 7149, n=30) | |
| Aorus MASTER 16 AM6H | |
| MSI Vector 17 HX AI A2XWIG | |
| Moyenne de la classe Gaming (4199 - 7436, n=104, 2 dernières années) | |
| Alienware 16 Area-51 | |
| Geekbench 6.7 / Multi-Core | |
| MSI Titan 18 HX AI A2XWJG | |
| Schenker XMG Neo 16 A25 5090 | |
| MSI Raider A18 HX A9WIG-080 | |
| Moyenne Intel Core Ultra 9 275HX (16033 - 21668, n=33) | |
| Aorus MASTER 16 AM6H | |
| MSI Vector 17 HX AI A2XWIG | |
| Alienware 16 Area-51 | |
| Moyenne de la classe Gaming (6625 - 22104, n=105, 2 dernières années) | |
| Geekbench 6.7 / Single-Core | |
| Schenker XMG Neo 16 A25 5090 | |
| MSI Raider A18 HX A9WIG-080 | |
| MSI Vector 17 HX AI A2XWIG | |
| MSI Titan 18 HX AI A2XWJG | |
| Aorus MASTER 16 AM6H | |
| Moyenne Intel Core Ultra 9 275HX (2843 - 3160, n=33) | |
| Alienware 16 Area-51 | |
| Moyenne de la classe Gaming (1490 - 3259, n=105, 2 dernières années) | |
| Geekbench 5.5 / Multi-Core | |
| MSI Titan 18 HX AI A2XWJG | |
| Schenker XMG Neo 16 A25 5090 | |
| MSI Raider A18 HX A9WIG-080 | |
| Moyenne Intel Core Ultra 9 275HX (19105 - 25855, n=31) | |
| Aorus MASTER 16 AM6H | |
| Alienware 16 Area-51 | |
| MSI Vector 17 HX AI A2XWIG | |
| Moyenne de la classe Gaming (6460 - 27010, n=104, 2 dernières années) | |
| Geekbench 5.5 / Single-Core | |
| MSI Raider A18 HX A9WIG-080 | |
| Schenker XMG Neo 16 A25 5090 | |
| MSI Titan 18 HX AI A2XWJG | |
| MSI Vector 17 HX AI A2XWIG | |
| Aorus MASTER 16 AM6H | |
| Moyenne Intel Core Ultra 9 275HX (2033 - 2292, n=31) | |
| Alienware 16 Area-51 | |
| Moyenne de la classe Gaming (986 - 2474, n=104, 2 dernières années) | |
| HWBOT x265 Benchmark v2.2 / 4k Preset | |
| MSI Titan 18 HX AI A2XWJG | |
| MSI Raider A18 HX A9WIG-080 | |
| Schenker XMG Neo 16 A25 5090 | |
| Moyenne Intel Core Ultra 9 275HX (30.7 - 43.8, n=30) | |
| Aorus MASTER 16 AM6H | |
| MSI Vector 17 HX AI A2XWIG | |
| Alienware 16 Area-51 | |
| Moyenne de la classe Gaming (11.5 - 44.3, n=104, 2 dernières années) | |
| LibreOffice / 20 Documents To PDF | |
| Moyenne de la classe Gaming (33.2 - 88.8, n=104, 2 dernières années) | |
| MSI Titan 18 HX AI A2XWJG | |
| Schenker XMG Neo 16 A25 5090 | |
| MSI Raider A18 HX A9WIG-080 | |
| Moyenne Intel Core Ultra 9 275HX (33.2 - 62.1, n=30) | |
| Aorus MASTER 16 AM6H | |
| MSI Vector 17 HX AI A2XWIG | |
| Alienware 16 Area-51 | |
| R Benchmark 2.5 / Overall mean | |
| Aorus MASTER 16 AM6H | |
| Alienware 16 Area-51 | |
| Moyenne de la classe Gaming (0.3439 - 0.759, n=105, 2 dernières années) | |
| Moyenne Intel Core Ultra 9 275HX (0.3943 - 0.4568, n=30) | |
| MSI Vector 17 HX AI A2XWIG | |
| MSI Titan 18 HX AI A2XWJG | |
| MSI Raider A18 HX A9WIG-080 | |
| Schenker XMG Neo 16 A25 5090 | |
* ... Moindre est la valeur, meilleures sont les performances
AIDA64: FP32 Ray-Trace | FPU Julia | CPU SHA3 | CPU Queen | FPU SinJulia | FPU Mandel | CPU AES | CPU ZLib | FP64 Ray-Trace | CPU PhotoWorxx
| Performance rating | |
| Schenker XMG Neo 16 E25 RTX 5090 Laptop | |
| Medion Erazer Beast 16 X1 Ultimate | |
| Aorus MASTER 16 AM6H | |
| Lenovo Legion 5 Pro 16IAX10H | |
| Moyenne Intel Core Ultra 9 275HX | |
| Alienware 16 Area-51 | |
| Moyenne de la classe Gaming | |
| MSI Vector 17 HX AI A2XWIG | |
| MSI Vector 16 HX AI A2XWHG | |
| AIDA64 / FP32 Ray-Trace | |
| Schenker XMG Neo 16 E25 RTX 5090 Laptop | |
| Medion Erazer Beast 16 X1 Ultimate | |
| Aorus MASTER 16 AM6H | |
| Moyenne Intel Core Ultra 9 275HX (28039 - 39895, n=30) | |
| Lenovo Legion 5 Pro 16IAX10H | |
| Alienware 16 Area-51 | |
| Moyenne de la classe Gaming (10227 - 85542, n=103, 2 dernières années) | |
| MSI Vector 17 HX AI A2XWIG | |
| MSI Vector 16 HX AI A2XWHG | |
| AIDA64 / FPU Julia | |
| Schenker XMG Neo 16 E25 RTX 5090 Laptop | |
| Medion Erazer Beast 16 X1 Ultimate | |
| Aorus MASTER 16 AM6H | |
| Lenovo Legion 5 Pro 16IAX10H | |
| Moyenne Intel Core Ultra 9 275HX (140254 - 200744, n=30) | |
| Alienware 16 Area-51 | |
| MSI Vector 17 HX AI A2XWIG | |
| MSI Vector 16 HX AI A2XWHG | |
| Moyenne de la classe Gaming (51376 - 238426, n=103, 2 dernières années) | |
| AIDA64 / CPU SHA3 | |
| Schenker XMG Neo 16 E25 RTX 5090 Laptop | |
| Medion Erazer Beast 16 X1 Ultimate | |
| Aorus MASTER 16 AM6H | |
| Moyenne Intel Core Ultra 9 275HX (6710 - 9817, n=30) | |
| Lenovo Legion 5 Pro 16IAX10H | |
| Alienware 16 Area-51 | |
| MSI Vector 17 HX AI A2XWIG | |
| MSI Vector 16 HX AI A2XWHG | |
| Moyenne de la classe Gaming (2180 - 9817, n=103, 2 dernières années) | |
| AIDA64 / CPU Queen | |
| Schenker XMG Neo 16 E25 RTX 5090 Laptop | |
| Medion Erazer Beast 16 X1 Ultimate | |
| Lenovo Legion 5 Pro 16IAX10H | |
| Aorus MASTER 16 AM6H | |
| Moyenne Intel Core Ultra 9 275HX (113887 - 140937, n=30) | |
| Alienware 16 Area-51 | |
| MSI Vector 17 HX AI A2XWIG | |
| Moyenne de la classe Gaming (49785 - 173351, n=89, 2 dernières années) | |
| MSI Vector 16 HX AI A2XWHG | |
| AIDA64 / FPU SinJulia | |
| Moyenne de la classe Gaming (4424 - 33636, n=103, 2 dernières années) | |
| Medion Erazer Beast 16 X1 Ultimate | |
| Schenker XMG Neo 16 E25 RTX 5090 Laptop | |
| Lenovo Legion 5 Pro 16IAX10H | |
| Alienware 16 Area-51 | |
| Aorus MASTER 16 AM6H | |
| Moyenne Intel Core Ultra 9 275HX (11172 - 14425, n=30) | |
| MSI Vector 17 HX AI A2XWIG | |
| MSI Vector 16 HX AI A2XWHG | |
| AIDA64 / FPU Mandel | |
| Schenker XMG Neo 16 E25 RTX 5090 Laptop | |
| Aorus MASTER 16 AM6H | |
| Medion Erazer Beast 16 X1 Ultimate | |
| Moyenne Intel Core Ultra 9 275HX (72596 - 104508, n=30) | |
| Lenovo Legion 5 Pro 16IAX10H | |
| Alienware 16 Area-51 | |
| MSI Vector 17 HX AI A2XWIG | |
| MSI Vector 16 HX AI A2XWHG | |
| Moyenne de la classe Gaming (25115 - 128721, n=103, 2 dernières années) | |
| AIDA64 / CPU AES | |
| Schenker XMG Neo 16 E25 RTX 5090 Laptop | |
| Medion Erazer Beast 16 X1 Ultimate | |
| Lenovo Legion 5 Pro 16IAX10H | |
| Moyenne Intel Core Ultra 9 275HX (105608 - 247074, n=30) | |
| Alienware 16 Area-51 | |
| Aorus MASTER 16 AM6H | |
| Moyenne de la classe Gaming (39258 - 247074, n=103, 2 dernières années) | |
| MSI Vector 17 HX AI A2XWIG | |
| MSI Vector 16 HX AI A2XWHG | |
| AIDA64 / CPU ZLib | |
| Schenker XMG Neo 16 E25 RTX 5090 Laptop | |
| Medion Erazer Beast 16 X1 Ultimate | |
| Lenovo Legion 5 Pro 16IAX10H | |
| Aorus MASTER 16 AM6H | |
| Moyenne Intel Core Ultra 9 275HX (1582 - 2263, n=30) | |
| Alienware 16 Area-51 | |
| MSI Vector 17 HX AI A2XWIG | |
| Moyenne de la classe Gaming (574 - 2531, n=103, 2 dernières années) | |
| MSI Vector 16 HX AI A2XWHG | |
| AIDA64 / FP64 Ray-Trace | |
| Schenker XMG Neo 16 E25 RTX 5090 Laptop | |
| Medion Erazer Beast 16 X1 Ultimate | |
| Aorus MASTER 16 AM6H | |
| Moyenne Intel Core Ultra 9 275HX (14847 - 21854, n=30) | |
| Lenovo Legion 5 Pro 16IAX10H | |
| Alienware 16 Area-51 | |
| Moyenne de la classe Gaming (5509 - 45446, n=103, 2 dernières années) | |
| MSI Vector 16 HX AI A2XWHG | |
| MSI Vector 17 HX AI A2XWIG | |
| AIDA64 / CPU PhotoWorxx | |
| Schenker XMG Neo 16 E25 RTX 5090 Laptop | |
| Alienware 16 Area-51 | |
| Moyenne Intel Core Ultra 9 275HX (37482 - 62916, n=30) | |
| Lenovo Legion 5 Pro 16IAX10H | |
| Medion Erazer Beast 16 X1 Ultimate | |
| MSI Vector 17 HX AI A2XWIG | |
| Aorus MASTER 16 AM6H | |
| Moyenne de la classe Gaming (12271 - 89891, n=103, 2 dernières années) | |
| MSI Vector 16 HX AI A2XWHG | |
Performance du système
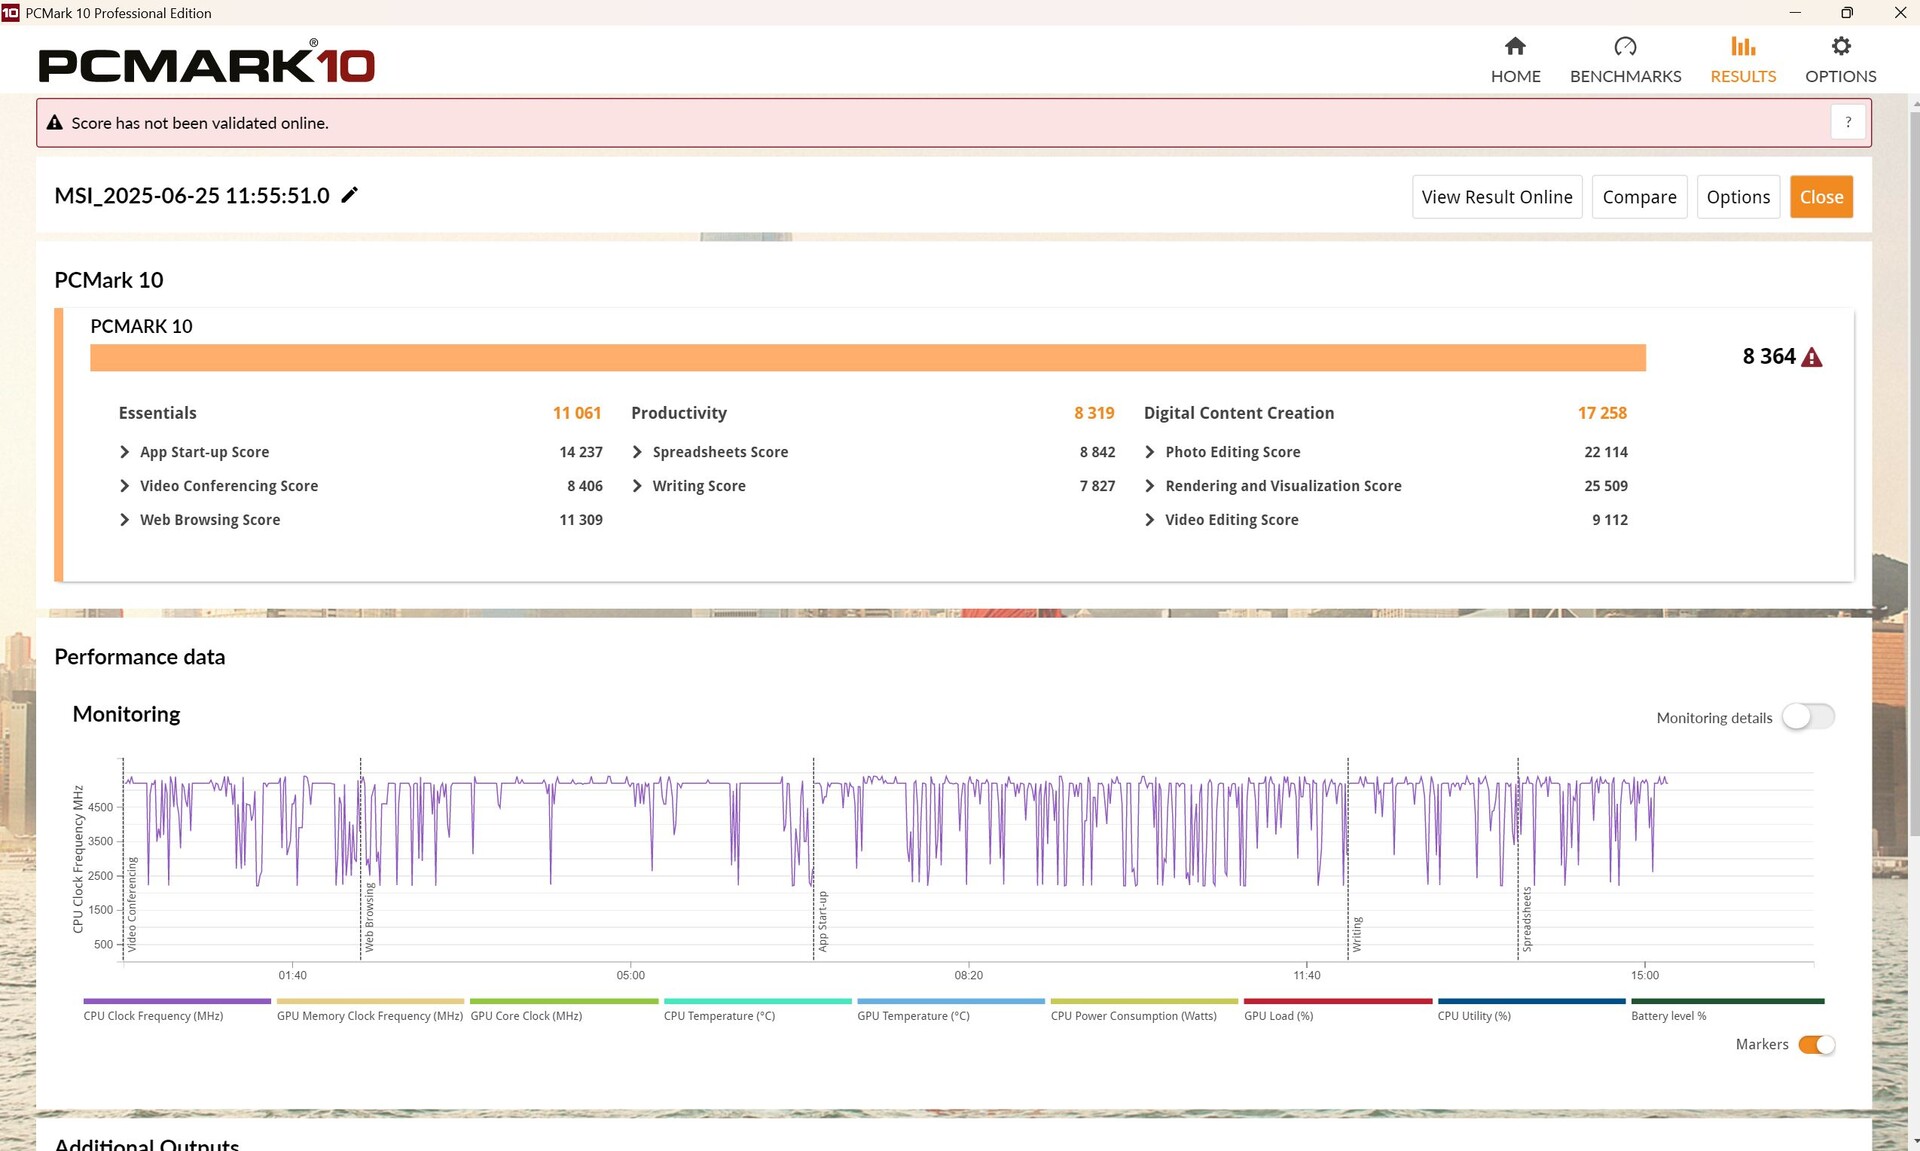
Le Vector 17 affiche des performances légèrement inférieures à la moyenne dans PCMark 10, mais légèrement supérieures à la moyenne dans CrossMark, de sorte que nous constatons une performance globale au niveau attendu.
PCMark 10: Score | Essentials | Productivity | Digital Content Creation
CrossMark: Overall | Productivity | Creativity | Responsiveness
WebXPRT 3: Overall
WebXPRT 4: Overall
Mozilla Kraken 1.1: Total
| Performance rating | |
| MSI Raider A18 HX A9WIG-080 | |
| Lenovo Legion 5 Pro 16IAX10H | |
| Alienware 16 Area-51 | |
| Moyenne Intel Core Ultra 9 275HX, NVIDIA GeForce RTX 5080 Laptop | |
| Lenovo Legion Pro 7i 16 Gen 10 | |
| MSI Vector 17 HX AI A2XWIG | |
| Moyenne de la classe Gaming | |
| Medion Erazer Beast 18 X1 MD62731 | |
| MSI Vector 16 HX AI A2XWHG | |
| PCMark 10 / Score | |
| Lenovo Legion Pro 7i 16 Gen 10 | |
| MSI Raider A18 HX A9WIG-080 | |
| Alienware 16 Area-51 | |
| Moyenne Intel Core Ultra 9 275HX, NVIDIA GeForce RTX 5080 Laptop (7805 - 10409, n=9) | |
| Moyenne de la classe Gaming (5828 - 11730, n=92, 2 dernières années) | |
| Medion Erazer Beast 18 X1 MD62731 | |
| MSI Vector 17 HX AI A2XWIG | |
| Lenovo Legion 5 Pro 16IAX10H | |
| MSI Vector 16 HX AI A2XWHG | |
| PCMark 10 / Essentials | |
| MSI Raider A18 HX A9WIG-080 | |
| Lenovo Legion Pro 7i 16 Gen 10 | |
| Alienware 16 Area-51 | |
| MSI Vector 17 HX AI A2XWIG | |
| Moyenne Intel Core Ultra 9 275HX, NVIDIA GeForce RTX 5080 Laptop (10206 - 11472, n=9) | |
| Lenovo Legion 5 Pro 16IAX10H | |
| MSI Vector 16 HX AI A2XWHG | |
| Moyenne de la classe Gaming (8810 - 11935, n=96, 2 dernières années) | |
| Medion Erazer Beast 18 X1 MD62731 | |
| PCMark 10 / Productivity | |
| Moyenne de la classe Gaming (6845 - 21327, n=94, 2 dernières années) | |
| MSI Raider A18 HX A9WIG-080 | |
| Moyenne Intel Core Ultra 9 275HX, NVIDIA GeForce RTX 5080 Laptop (8319 - 20616, n=9) | |
| Medion Erazer Beast 18 X1 MD62731 | |
| Lenovo Legion 5 Pro 16IAX10H | |
| Lenovo Legion Pro 7i 16 Gen 10 | |
| MSI Vector 16 HX AI A2XWHG | |
| Alienware 16 Area-51 | |
| MSI Vector 17 HX AI A2XWIG | |
| PCMark 10 / Digital Content Creation | |
| Lenovo Legion Pro 7i 16 Gen 10 | |
| Alienware 16 Area-51 | |
| MSI Vector 17 HX AI A2XWIG | |
| Moyenne Intel Core Ultra 9 275HX, NVIDIA GeForce RTX 5080 Laptop (10505 - 19351, n=9) | |
| Medion Erazer Beast 18 X1 MD62731 | |
| Lenovo Legion 5 Pro 16IAX10H | |
| MSI Raider A18 HX A9WIG-080 | |
| Moyenne de la classe Gaming (7602 - 19954, n=94, 2 dernières années) | |
| MSI Vector 16 HX AI A2XWHG | |
| CrossMark / Overall | |
| MSI Raider A18 HX A9WIG-080 | |
| MSI Vector 17 HX AI A2XWIG | |
| Lenovo Legion 5 Pro 16IAX10H | |
| Alienware 16 Area-51 | |
| Moyenne Intel Core Ultra 9 275HX, NVIDIA GeForce RTX 5080 Laptop (1857 - 2244, n=9) | |
| Lenovo Legion Pro 7i 16 Gen 10 | |
| Moyenne de la classe Gaming (1366 - 2409, n=93, 2 dernières années) | |
| MSI Vector 16 HX AI A2XWHG | |
| Medion Erazer Beast 18 X1 MD62731 | |
| CrossMark / Productivity | |
| MSI Vector 17 HX AI A2XWIG | |
| Lenovo Legion 5 Pro 16IAX10H | |
| Alienware 16 Area-51 | |
| MSI Raider A18 HX A9WIG-080 | |
| Moyenne Intel Core Ultra 9 275HX, NVIDIA GeForce RTX 5080 Laptop (1764 - 2122, n=9) | |
| Lenovo Legion Pro 7i 16 Gen 10 | |
| Moyenne de la classe Gaming (1386 - 2254, n=93, 2 dernières années) | |
| MSI Vector 16 HX AI A2XWHG | |
| Medion Erazer Beast 18 X1 MD62731 | |
| CrossMark / Creativity | |
| MSI Raider A18 HX A9WIG-080 | |
| Lenovo Legion 5 Pro 16IAX10H | |
| MSI Vector 17 HX AI A2XWIG | |
| Alienware 16 Area-51 | |
| Moyenne Intel Core Ultra 9 275HX, NVIDIA GeForce RTX 5080 Laptop (2115 - 2498, n=9) | |
| Lenovo Legion Pro 7i 16 Gen 10 | |
| MSI Vector 16 HX AI A2XWHG | |
| Moyenne de la classe Gaming (1343 - 2729, n=93, 2 dernières années) | |
| Medion Erazer Beast 18 X1 MD62731 | |
| CrossMark / Responsiveness | |
| Alienware 16 Area-51 | |
| MSI Vector 17 HX AI A2XWIG | |
| Lenovo Legion 5 Pro 16IAX10H | |
| Moyenne Intel Core Ultra 9 275HX, NVIDIA GeForce RTX 5080 Laptop (1466 - 2096, n=9) | |
| MSI Raider A18 HX A9WIG-080 | |
| Moyenne de la classe Gaming (1226 - 2334, n=93, 2 dernières années) | |
| Lenovo Legion Pro 7i 16 Gen 10 | |
| MSI Vector 16 HX AI A2XWHG | |
| Medion Erazer Beast 18 X1 MD62731 | |
| WebXPRT 3 / Overall | |
| Lenovo Legion 5 Pro 16IAX10H | |
| MSI Raider A18 HX A9WIG-080 | |
| Lenovo Legion Pro 7i 16 Gen 10 | |
| Alienware 16 Area-51 | |
| Moyenne Intel Core Ultra 9 275HX, NVIDIA GeForce RTX 5080 Laptop (306 - 378, n=9) | |
| Medion Erazer Beast 18 X1 MD62731 | |
| MSI Vector 17 HX AI A2XWIG | |
| MSI Vector 16 HX AI A2XWHG | |
| Moyenne de la classe Gaming (220 - 532, n=97, 2 dernières années) | |
| WebXPRT 4 / Overall | |
| MSI Vector 17 HX AI A2XWIG | |
| Lenovo Legion Pro 7i 16 Gen 10 | |
| MSI Raider A18 HX A9WIG-080 | |
| Alienware 16 Area-51 | |
| Lenovo Legion 5 Pro 16IAX10H | |
| Medion Erazer Beast 18 X1 MD62731 | |
| Moyenne Intel Core Ultra 9 275HX, NVIDIA GeForce RTX 5080 Laptop (285 - 336, n=9) | |
| MSI Vector 16 HX AI A2XWHG | |
| Moyenne de la classe Gaming (165 - 354, n=97, 2 dernières années) | |
| Mozilla Kraken 1.1 / Total | |
| Moyenne de la classe Gaming (391 - 590, n=99, 2 dernières années) | |
| MSI Vector 16 HX AI A2XWHG | |
| MSI Vector 17 HX AI A2XWIG | |
| Medion Erazer Beast 18 X1 MD62731 | |
| Moyenne Intel Core Ultra 9 275HX, NVIDIA GeForce RTX 5080 Laptop (405 - 432, n=9) | |
| Lenovo Legion 5 Pro 16IAX10H | |
| Alienware 16 Area-51 | |
| Lenovo Legion Pro 7i 16 Gen 10 | |
| MSI Raider A18 HX A9WIG-080 | |
* ... Moindre est la valeur, meilleures sont les performances
| PCMark 10 Score | 8364 points | |
Aide | ||
| AIDA64 / Memory Copy | |
| Alienware 16 Area-51 | |
| Lenovo Legion Pro 7i 16 Gen 10 | |
| Moyenne Intel Core Ultra 9 275HX (56003 - 94460, n=30) | |
| Lenovo Legion 5 Pro 16IAX10H | |
| MSI Vector 17 HX AI A2XWIG | |
| Medion Erazer Beast 18 X1 MD62731 | |
| Moyenne de la classe Gaming (21750 - 129946, n=103, 2 dernières années) | |
| MSI Vector 16 HX AI A2XWHG | |
| MSI Raider A18 HX A9WIG-080 | |
| AIDA64 / Memory Read | |
| Lenovo Legion Pro 7i 16 Gen 10 | |
| Alienware 16 Area-51 | |
| Lenovo Legion 5 Pro 16IAX10H | |
| Medion Erazer Beast 18 X1 MD62731 | |
| MSI Vector 17 HX AI A2XWIG | |
| Moyenne Intel Core Ultra 9 275HX (55795 - 97151, n=30) | |
| MSI Vector 16 HX AI A2XWHG | |
| Moyenne de la classe Gaming (22956 - 118858, n=103, 2 dernières années) | |
| MSI Raider A18 HX A9WIG-080 | |
| AIDA64 / Memory Write | |
| Lenovo Legion Pro 7i 16 Gen 10 | |
| Alienware 16 Area-51 | |
| Moyenne Intel Core Ultra 9 275HX (55663 - 116129, n=30) | |
| Lenovo Legion 5 Pro 16IAX10H | |
| Medion Erazer Beast 18 X1 MD62731 | |
| MSI Vector 17 HX AI A2XWIG | |
| Moyenne de la classe Gaming (22297 - 135096, n=103, 2 dernières années) | |
| MSI Vector 16 HX AI A2XWHG | |
| MSI Raider A18 HX A9WIG-080 | |
| AIDA64 / Memory Latency | |
| Alienware 16 Area-51 | |
| Moyenne Intel Core Ultra 9 275HX (105.8 - 161.6, n=30) | |
| MSI Vector 17 HX AI A2XWIG | |
| Lenovo Legion 5 Pro 16IAX10H | |
| Medion Erazer Beast 18 X1 MD62731 | |
| Lenovo Legion Pro 7i 16 Gen 10 | |
| Moyenne de la classe Gaming (75.3 - 259, n=103, 2 dernières années) | |
| MSI Vector 16 HX AI A2XWHG | |
| MSI Raider A18 HX A9WIG-080 | |
* ... Moindre est la valeur, meilleures sont les performances
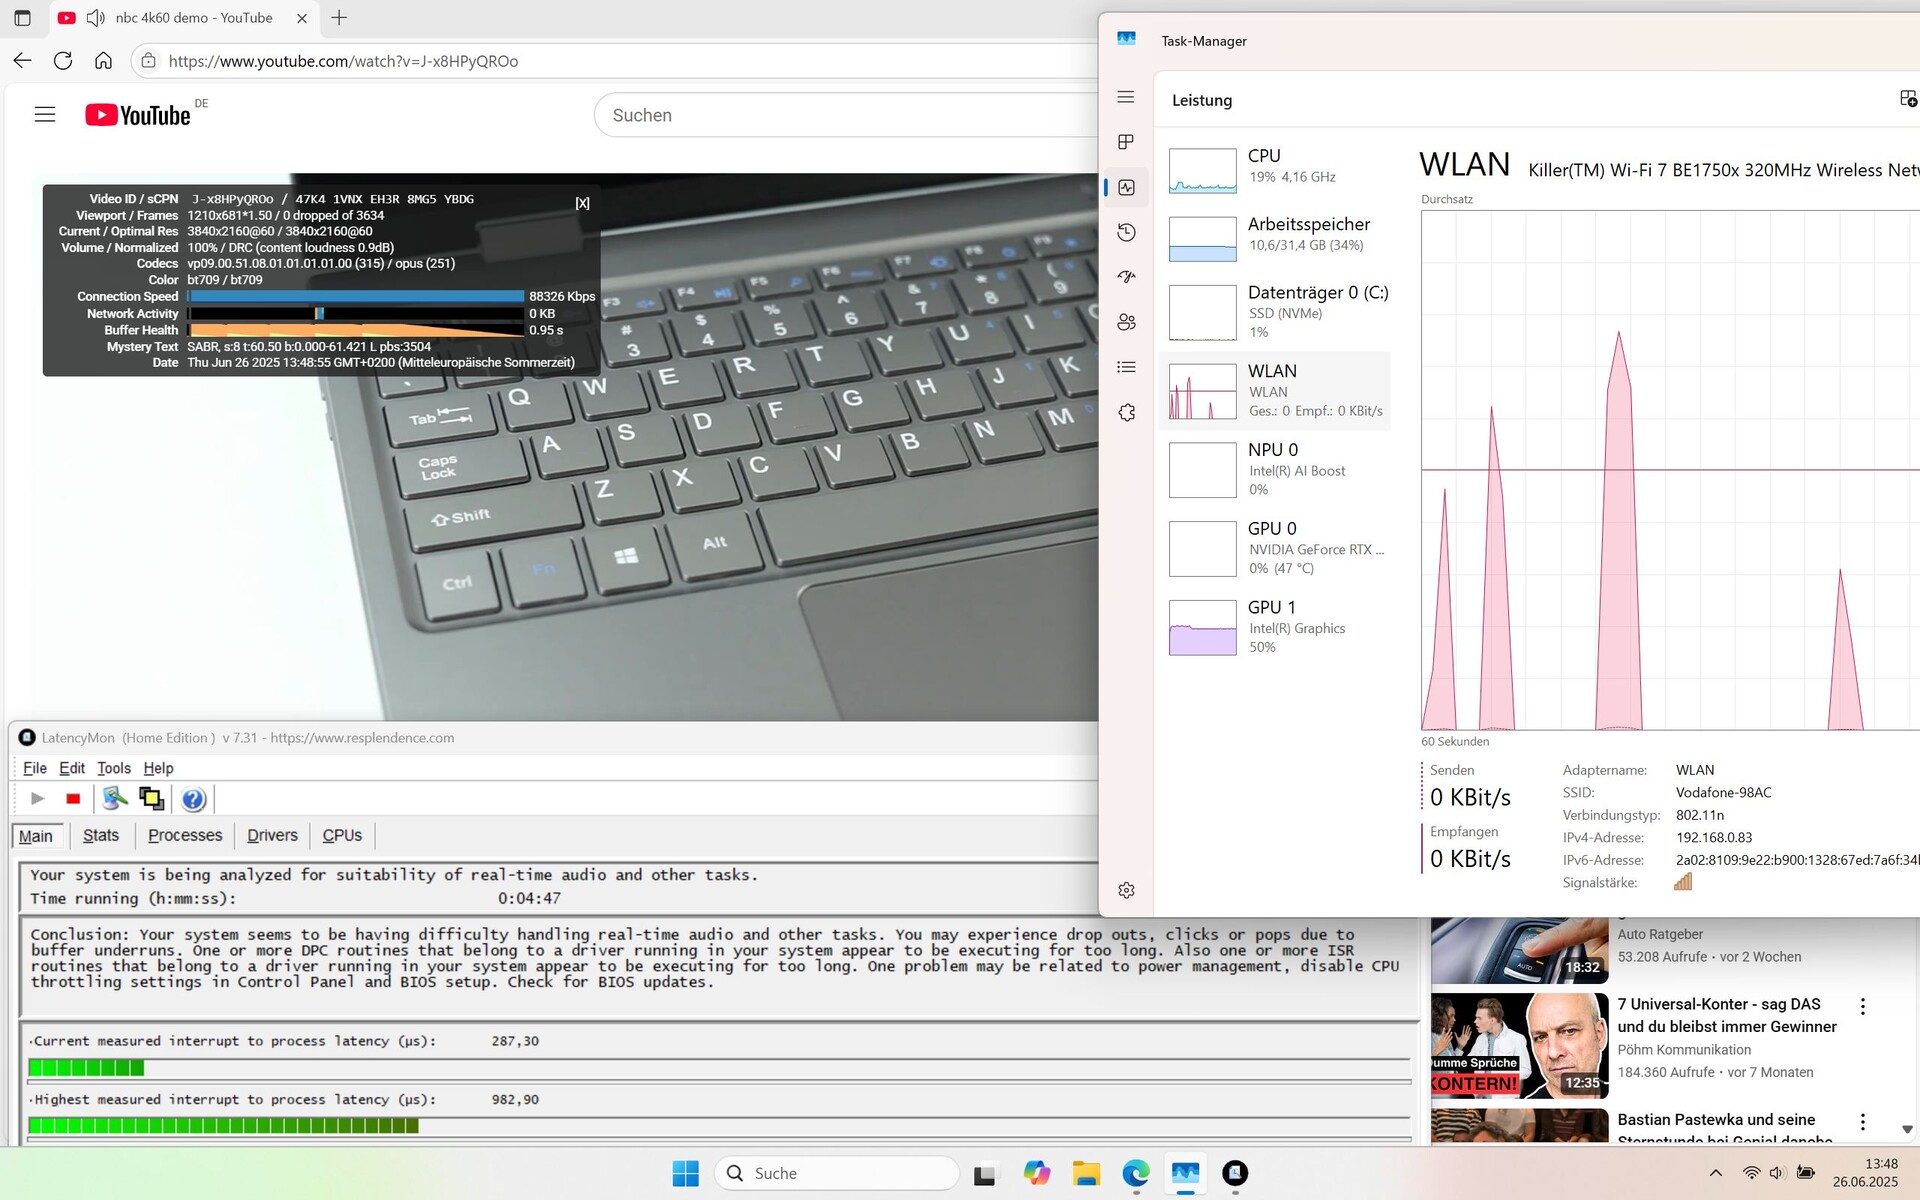
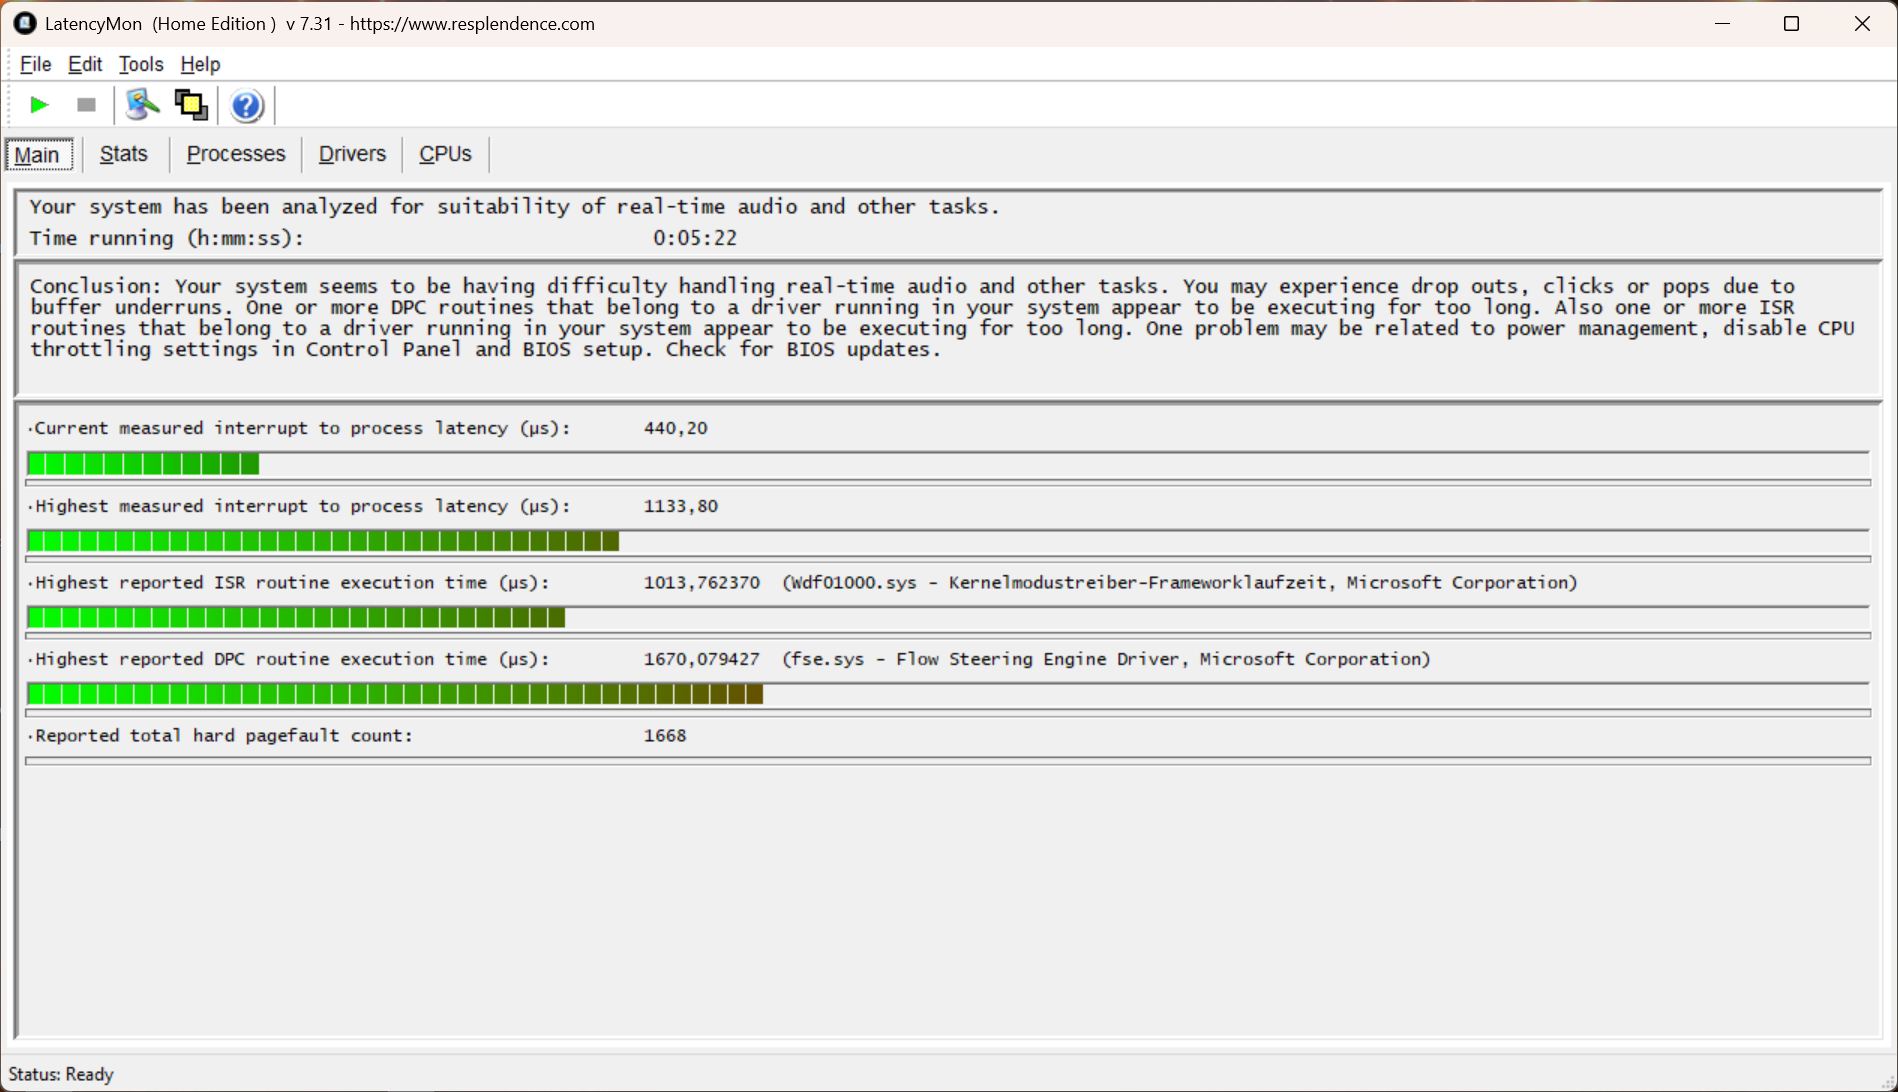
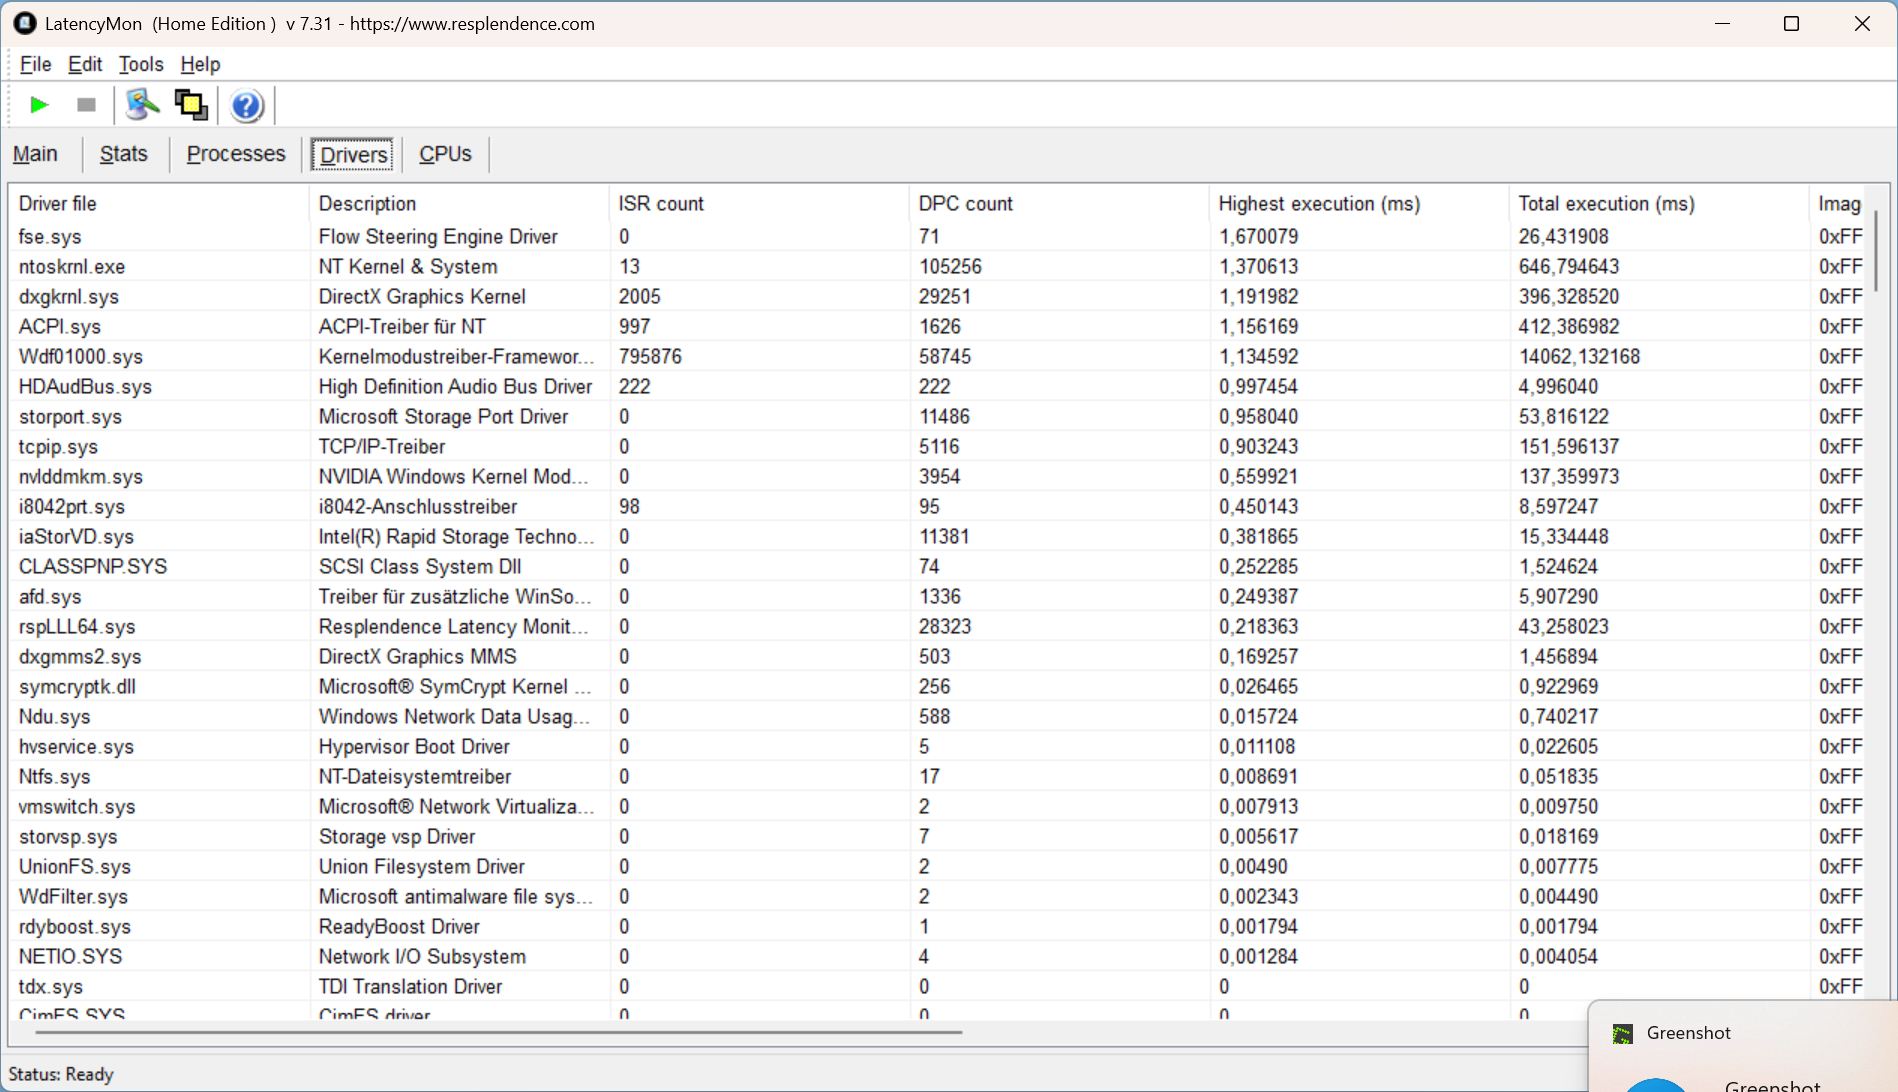
Latences DPC
Les latences ne se produisent que lors de l'ouverture de plusieurs onglets du navigateur et sont relativement faibles même après. Notre vidéo 4K/60 fps est lue sans aucune perte d'images.
| DPC Latencies / LatencyMon - interrupt to process latency (max), Web, Youtube, Prime95 | |
| Medion Erazer Beast 18 X1 MD62731 | |
| MSI Vector 16 HX AI A2XWHG | |
| Alienware 16 Area-51 | |
| MSI Vector 17 HX AI A2XWIG | |
| Lenovo Legion 5 Pro 16IAX10H | |
| MSI Raider A18 HX A9WIG-080 | |
| Lenovo Legion Pro 7i 16 Gen 10 | |
* ... Moindre est la valeur, meilleures sont les performances
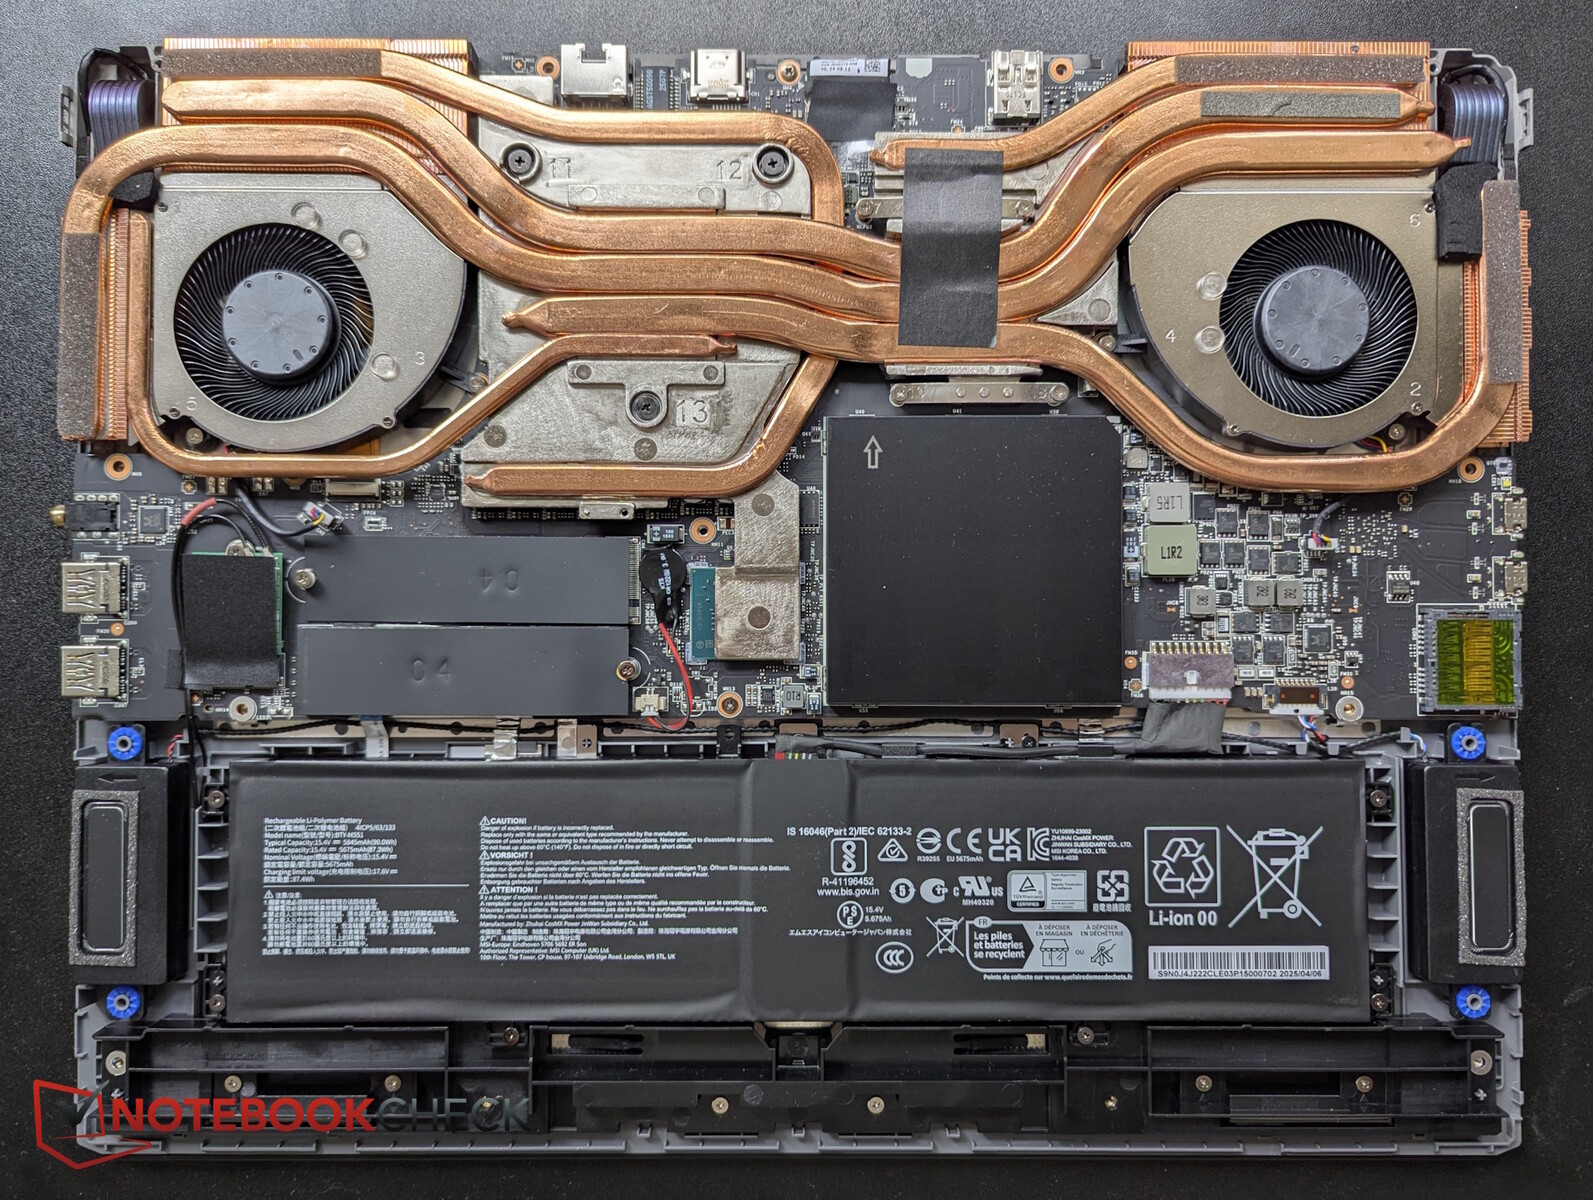
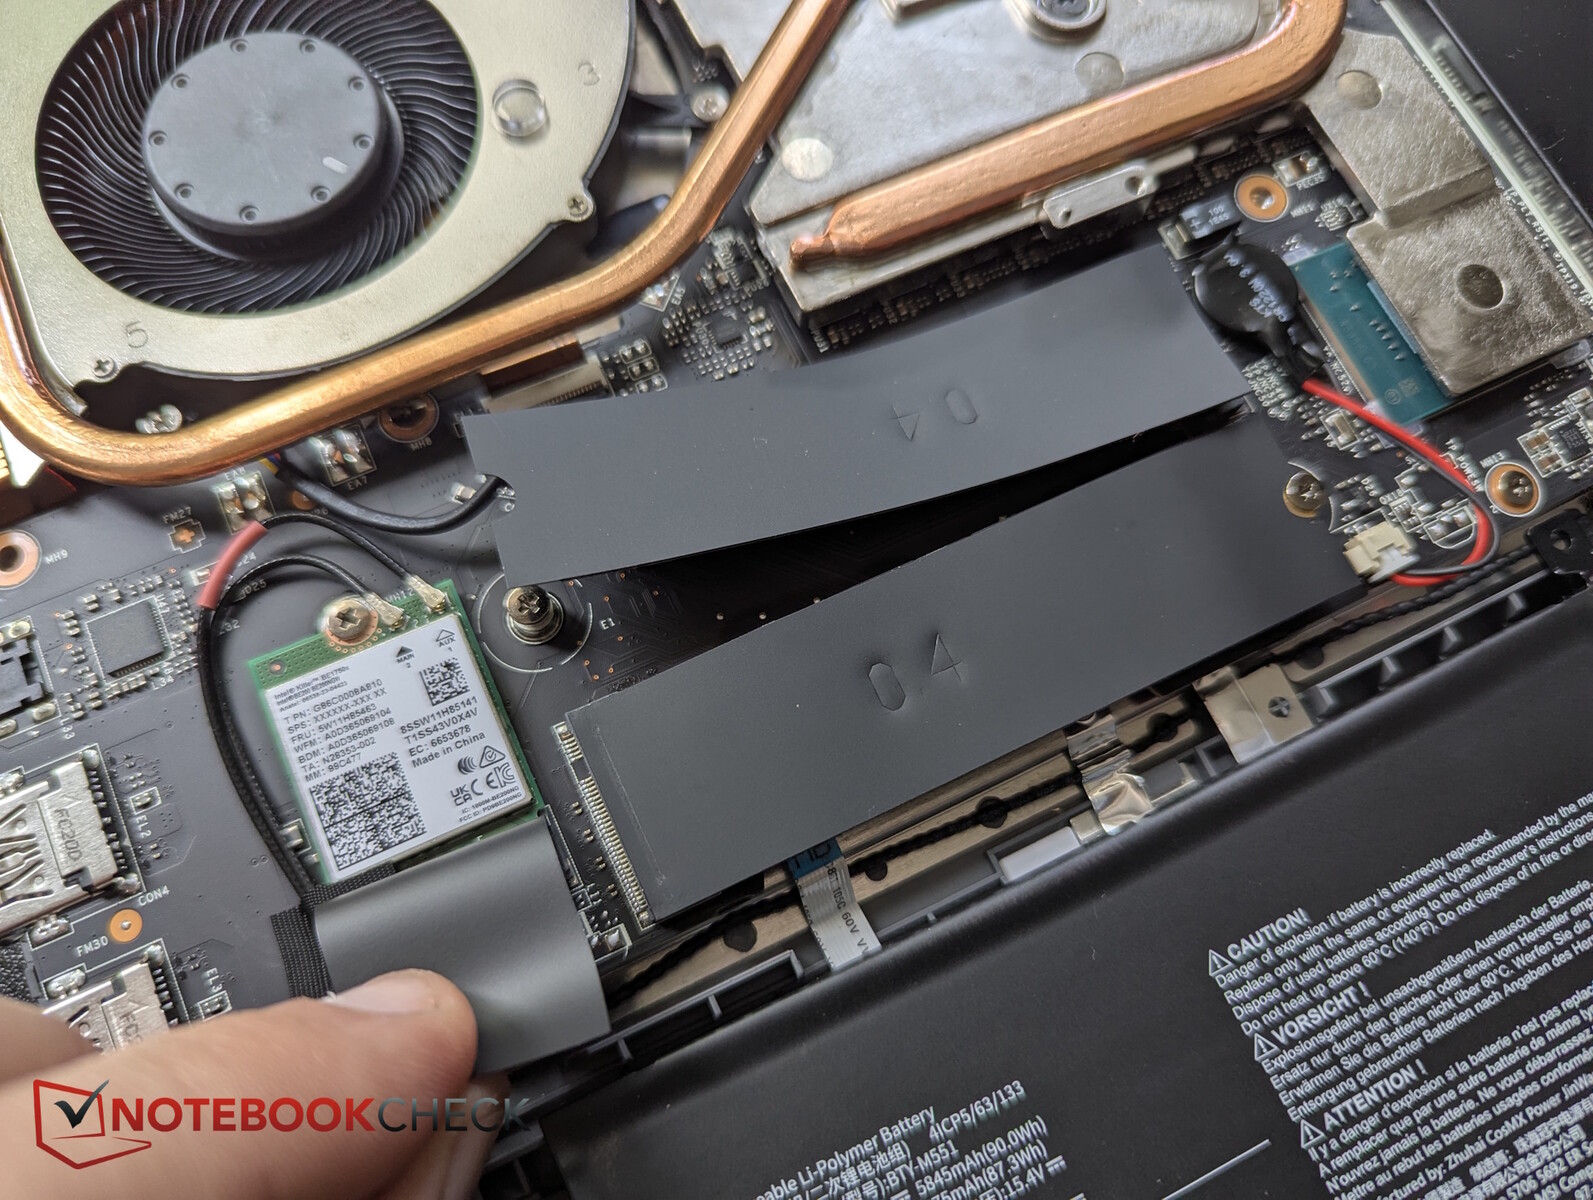
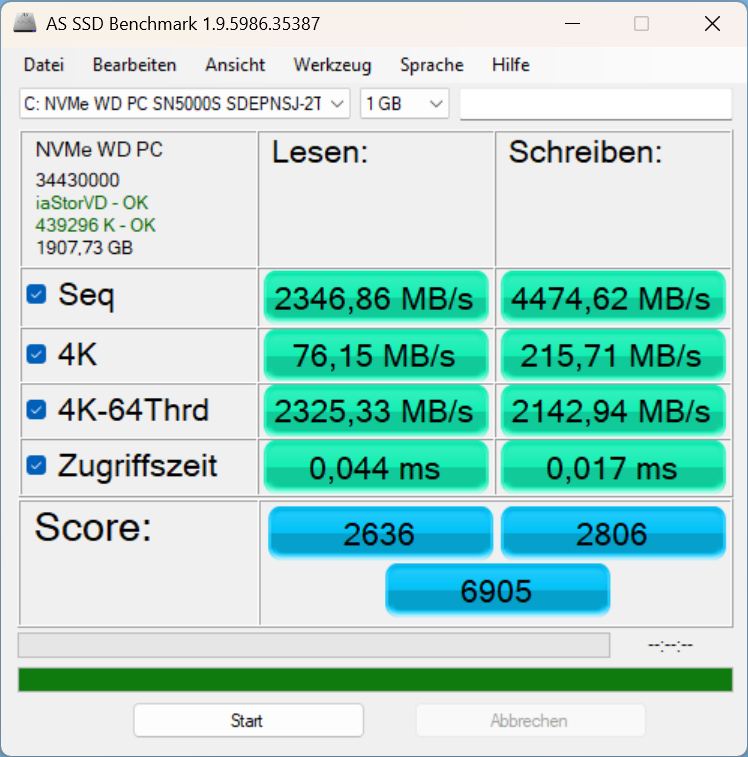
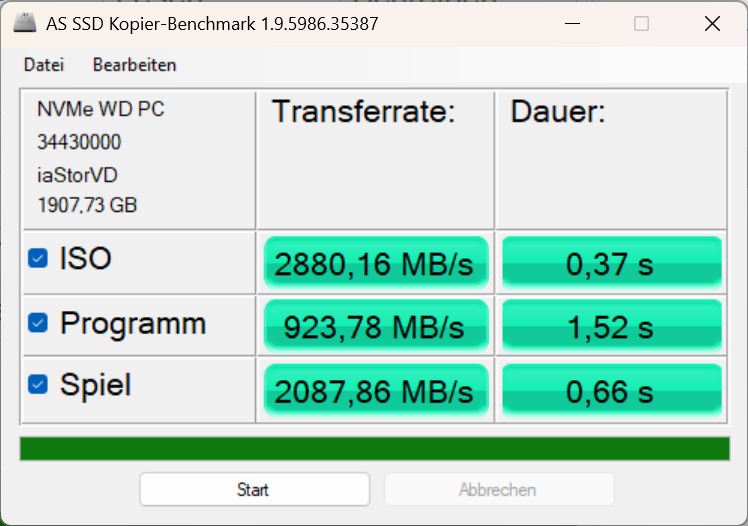
Mémoire de masse
Le Western Digital SSD de 2 To atteint des valeurs moyennes à bonnes et n'est pas étranglé, même en cas de charge prolongée.
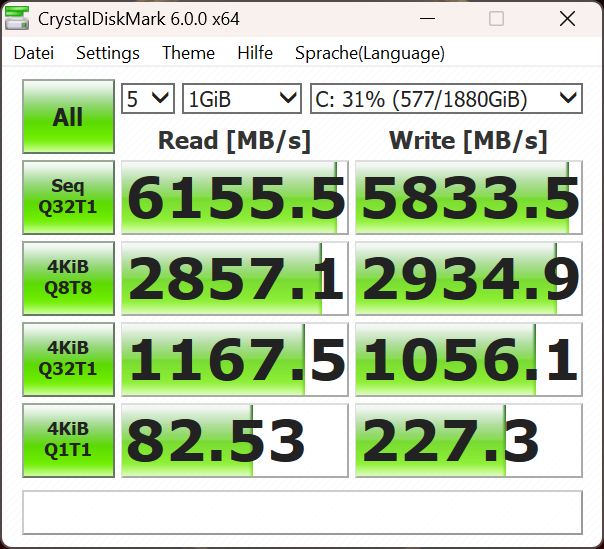

* ... Moindre est la valeur, meilleures sont les performances
Continuous Reading: DiskSpd Read Loop, Queue Depth 8
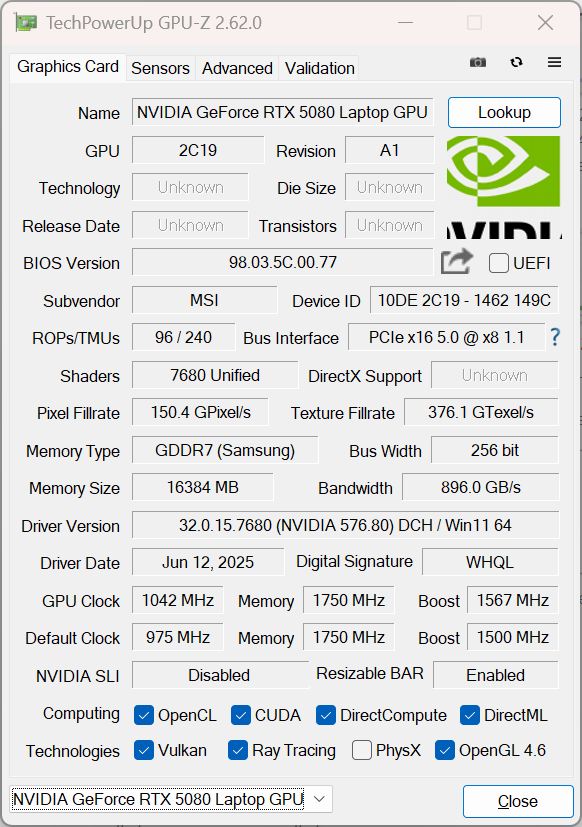
Performance du GPU
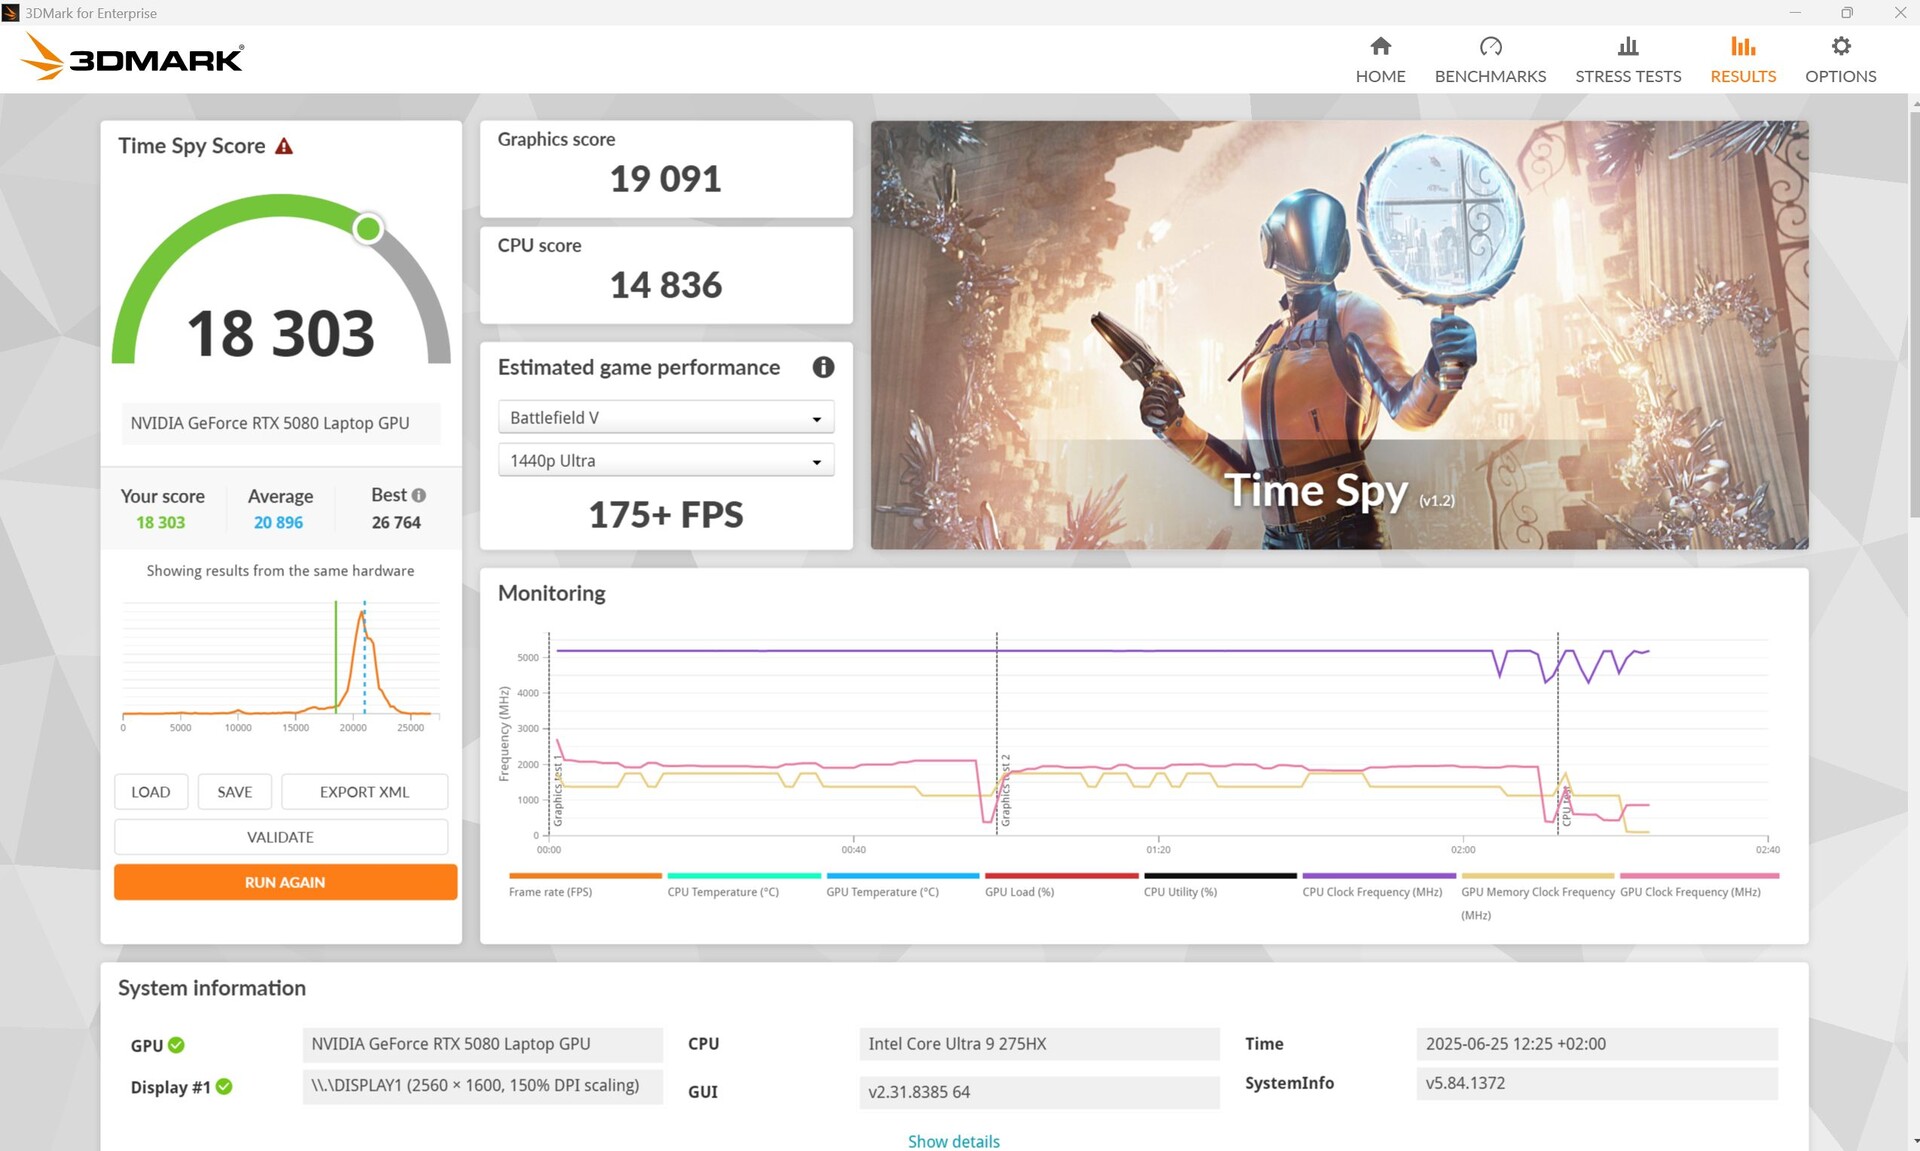
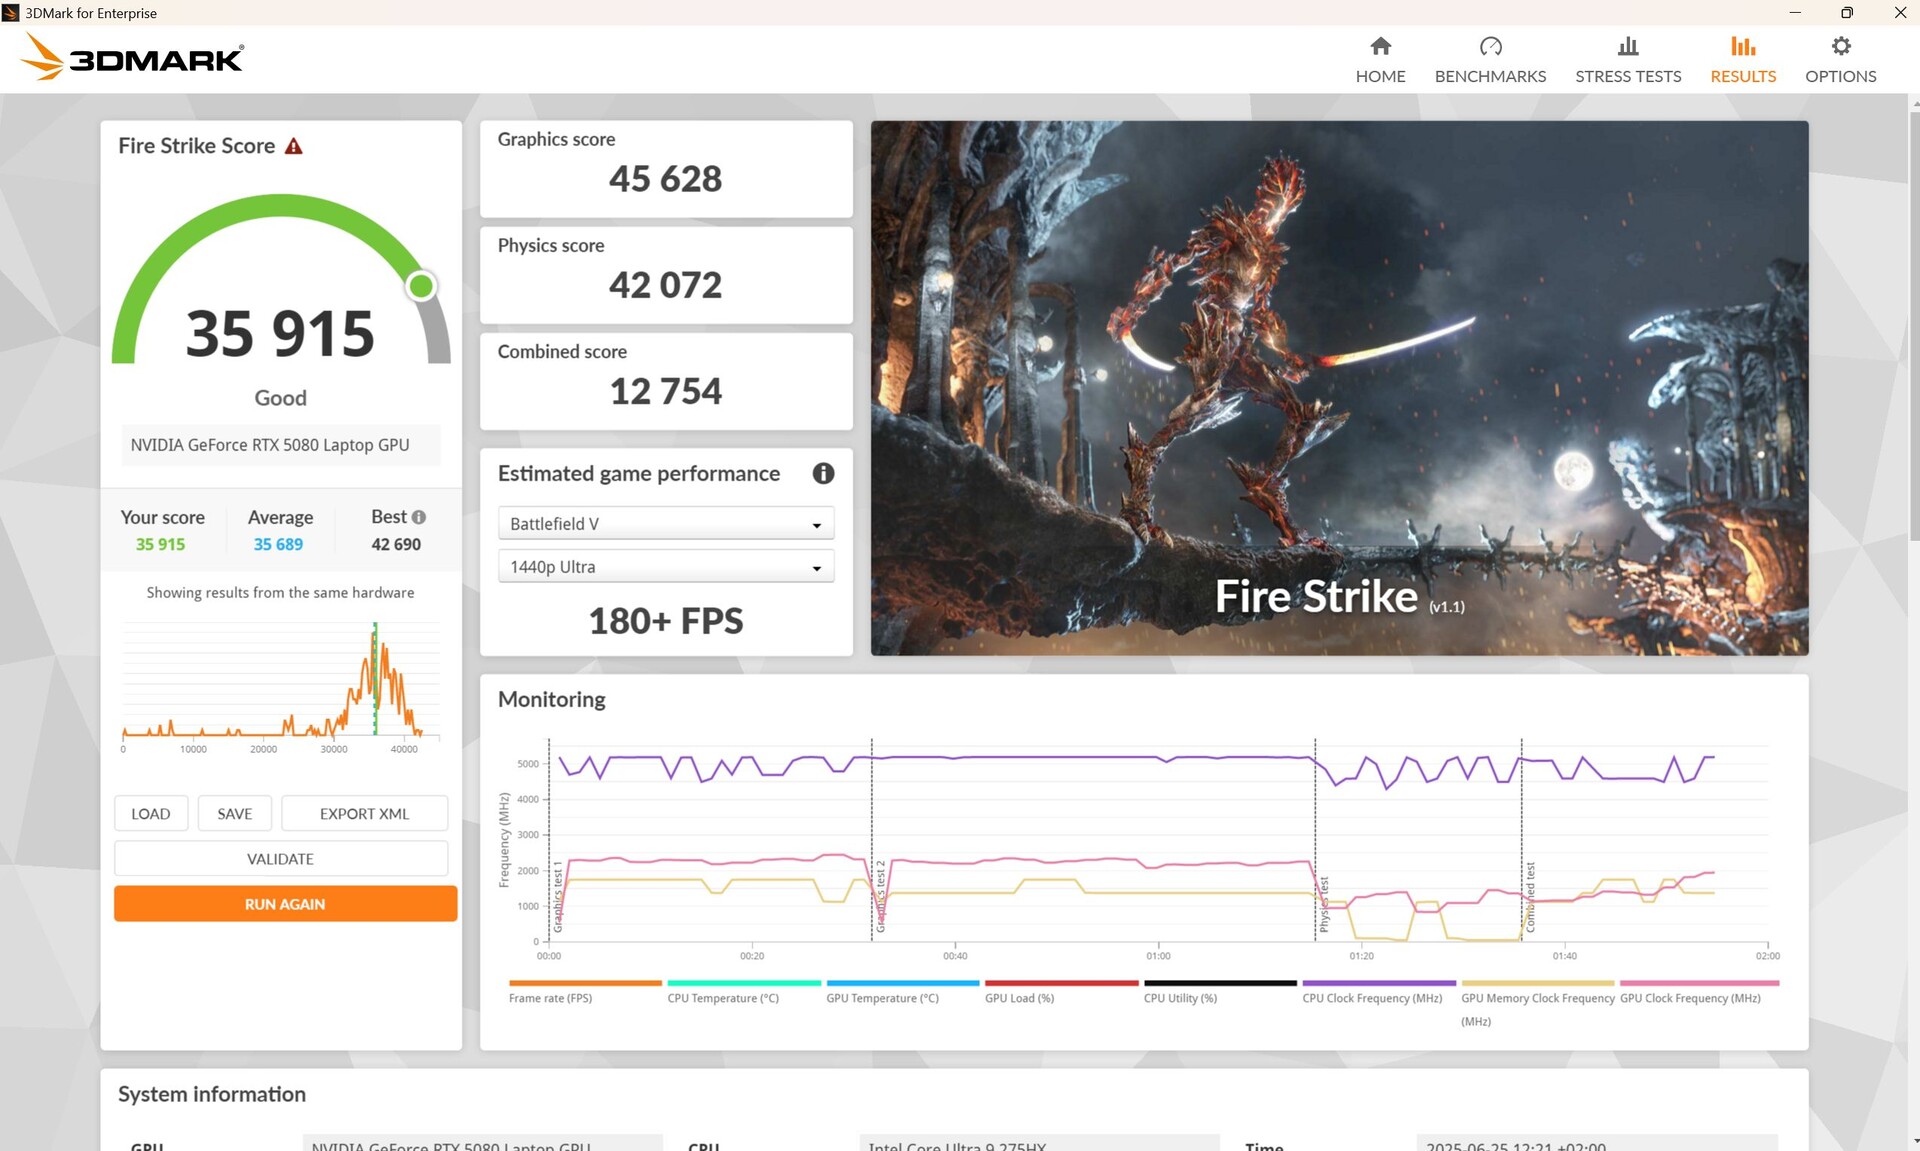
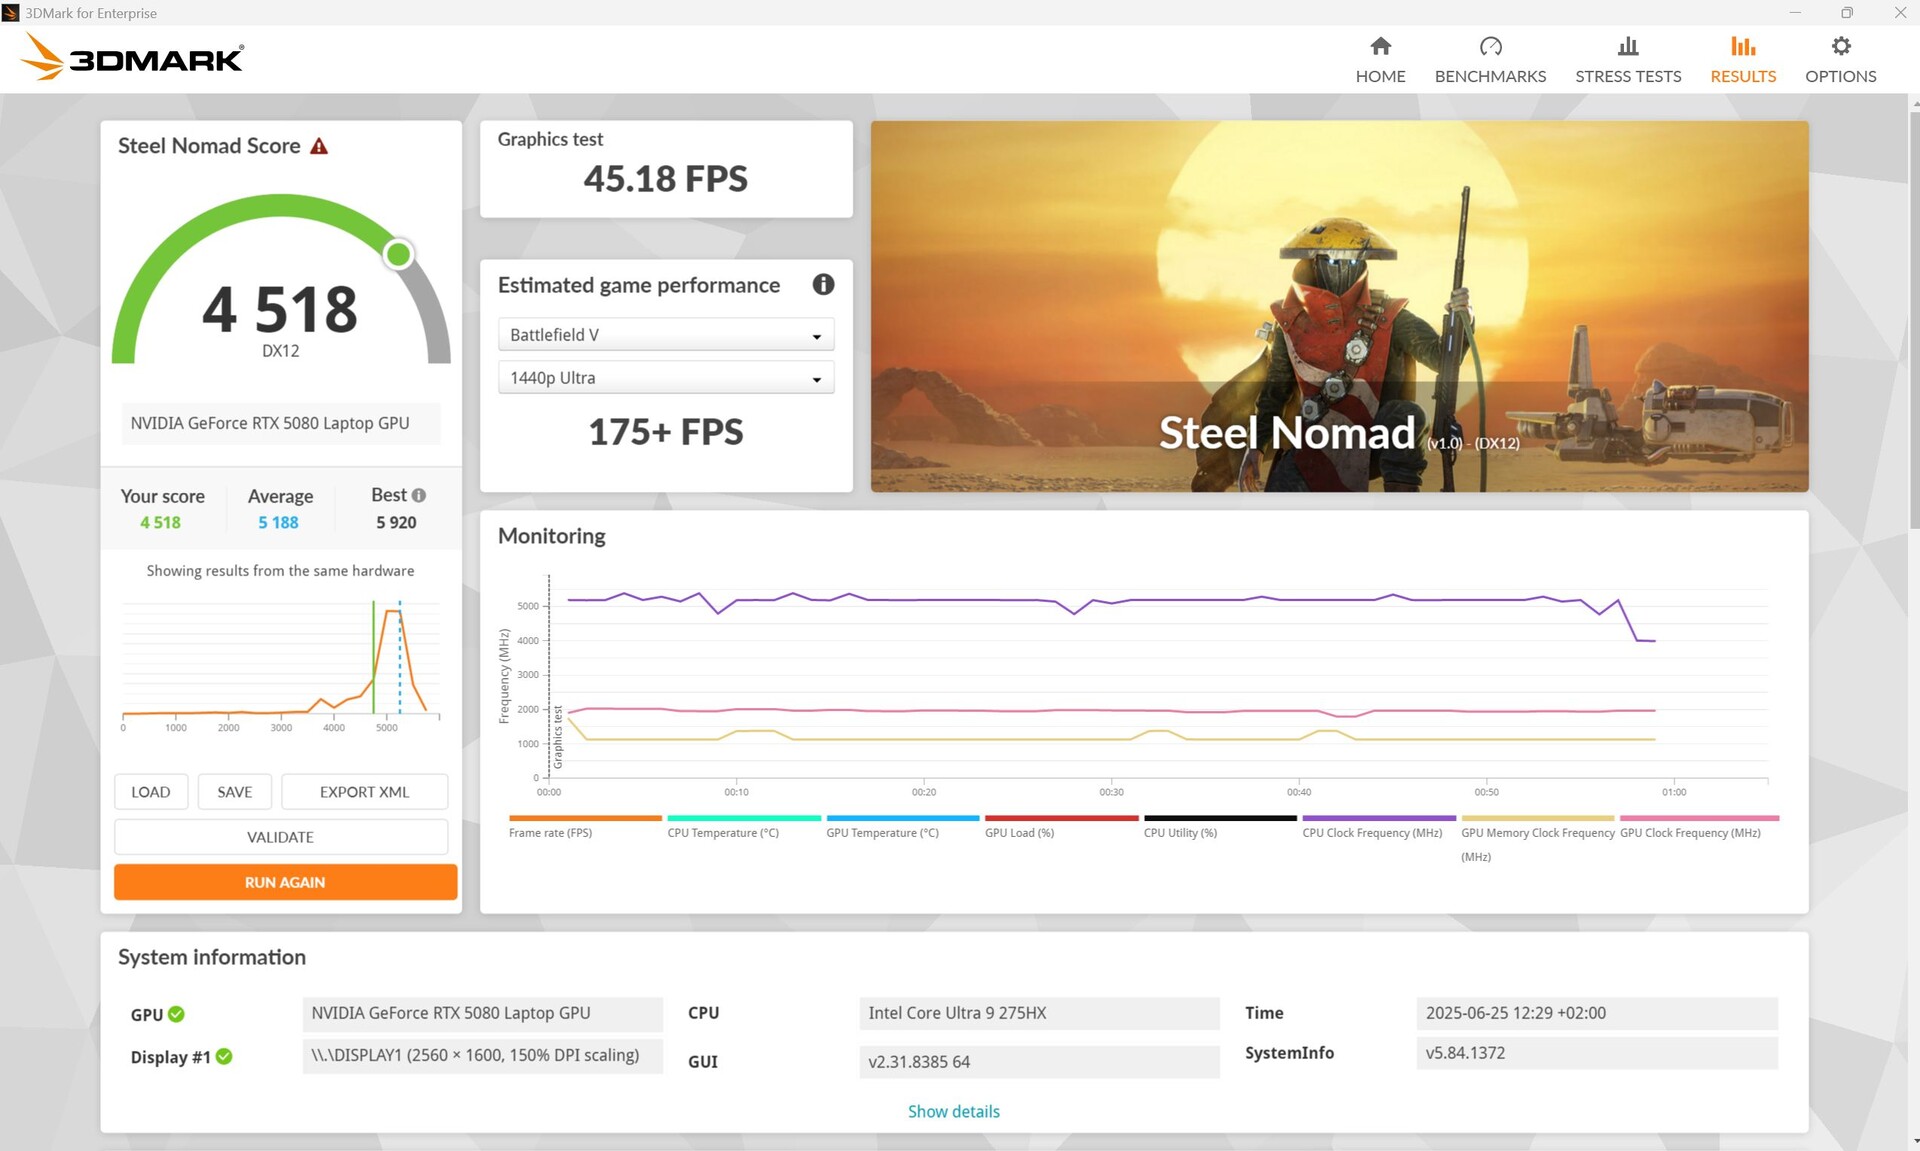
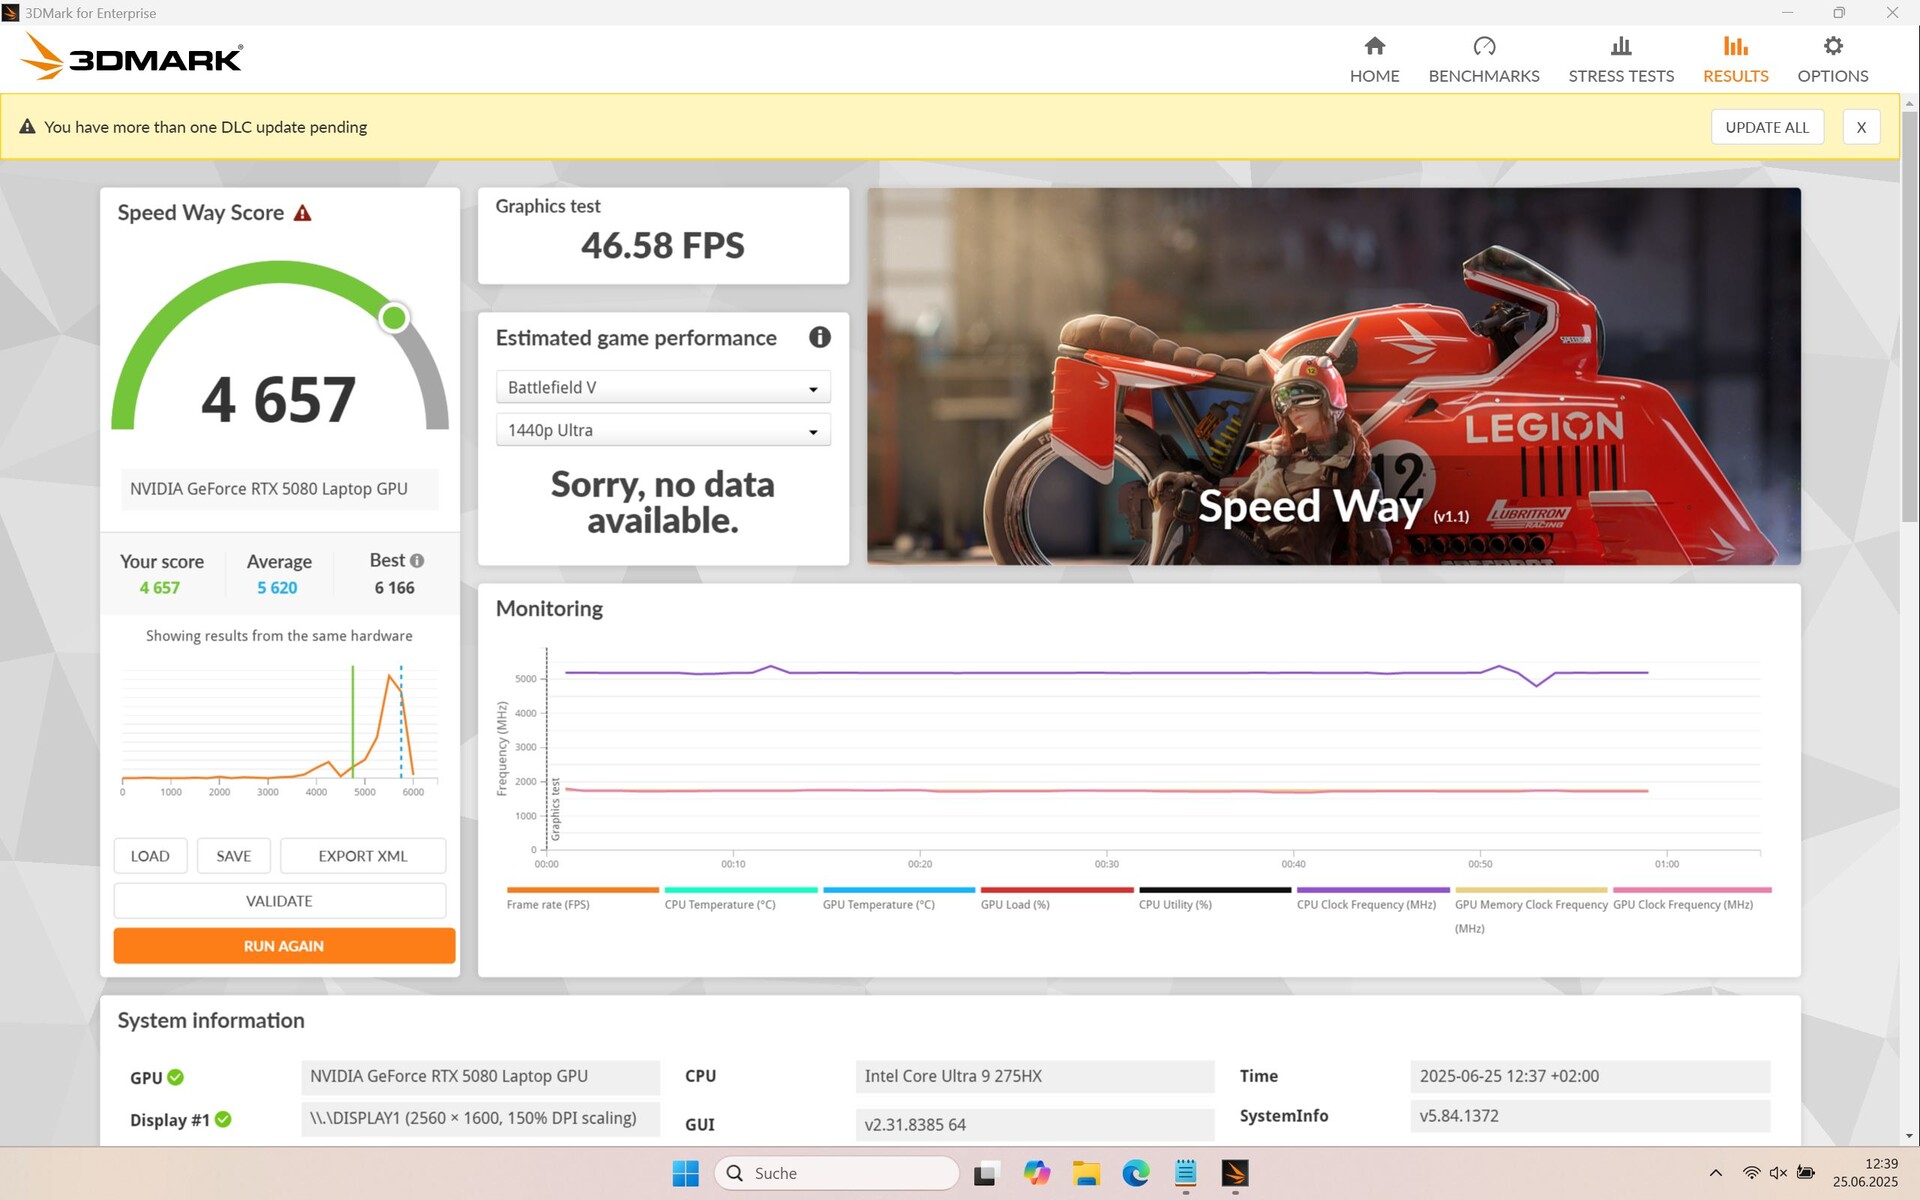
L'ordinateur portable Ordinateur portable RTX 5080 affiche des performances inférieures de 4 % à la moyenne dans le test 3DMarks. Un test Fire Strike en mode batterie révèle une perte de performance 3D de 50 %.
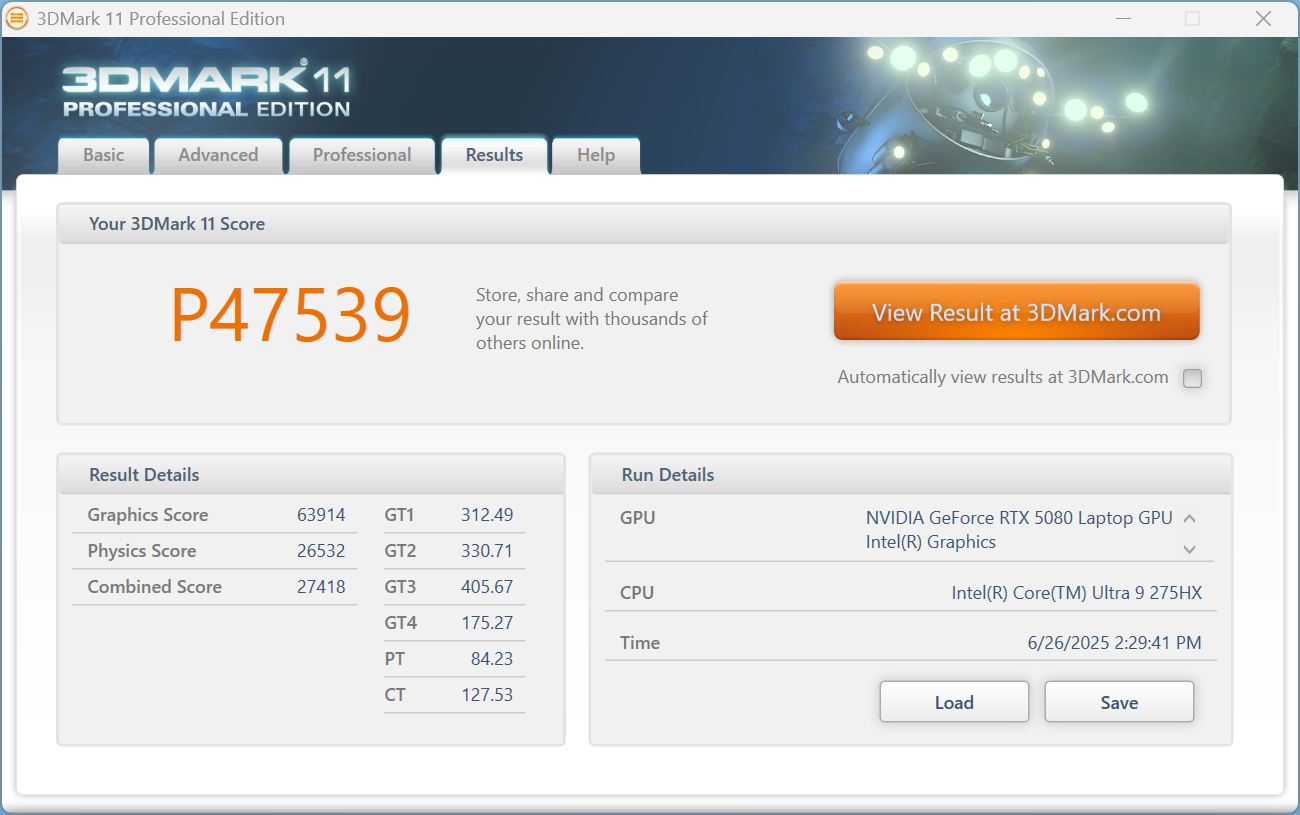
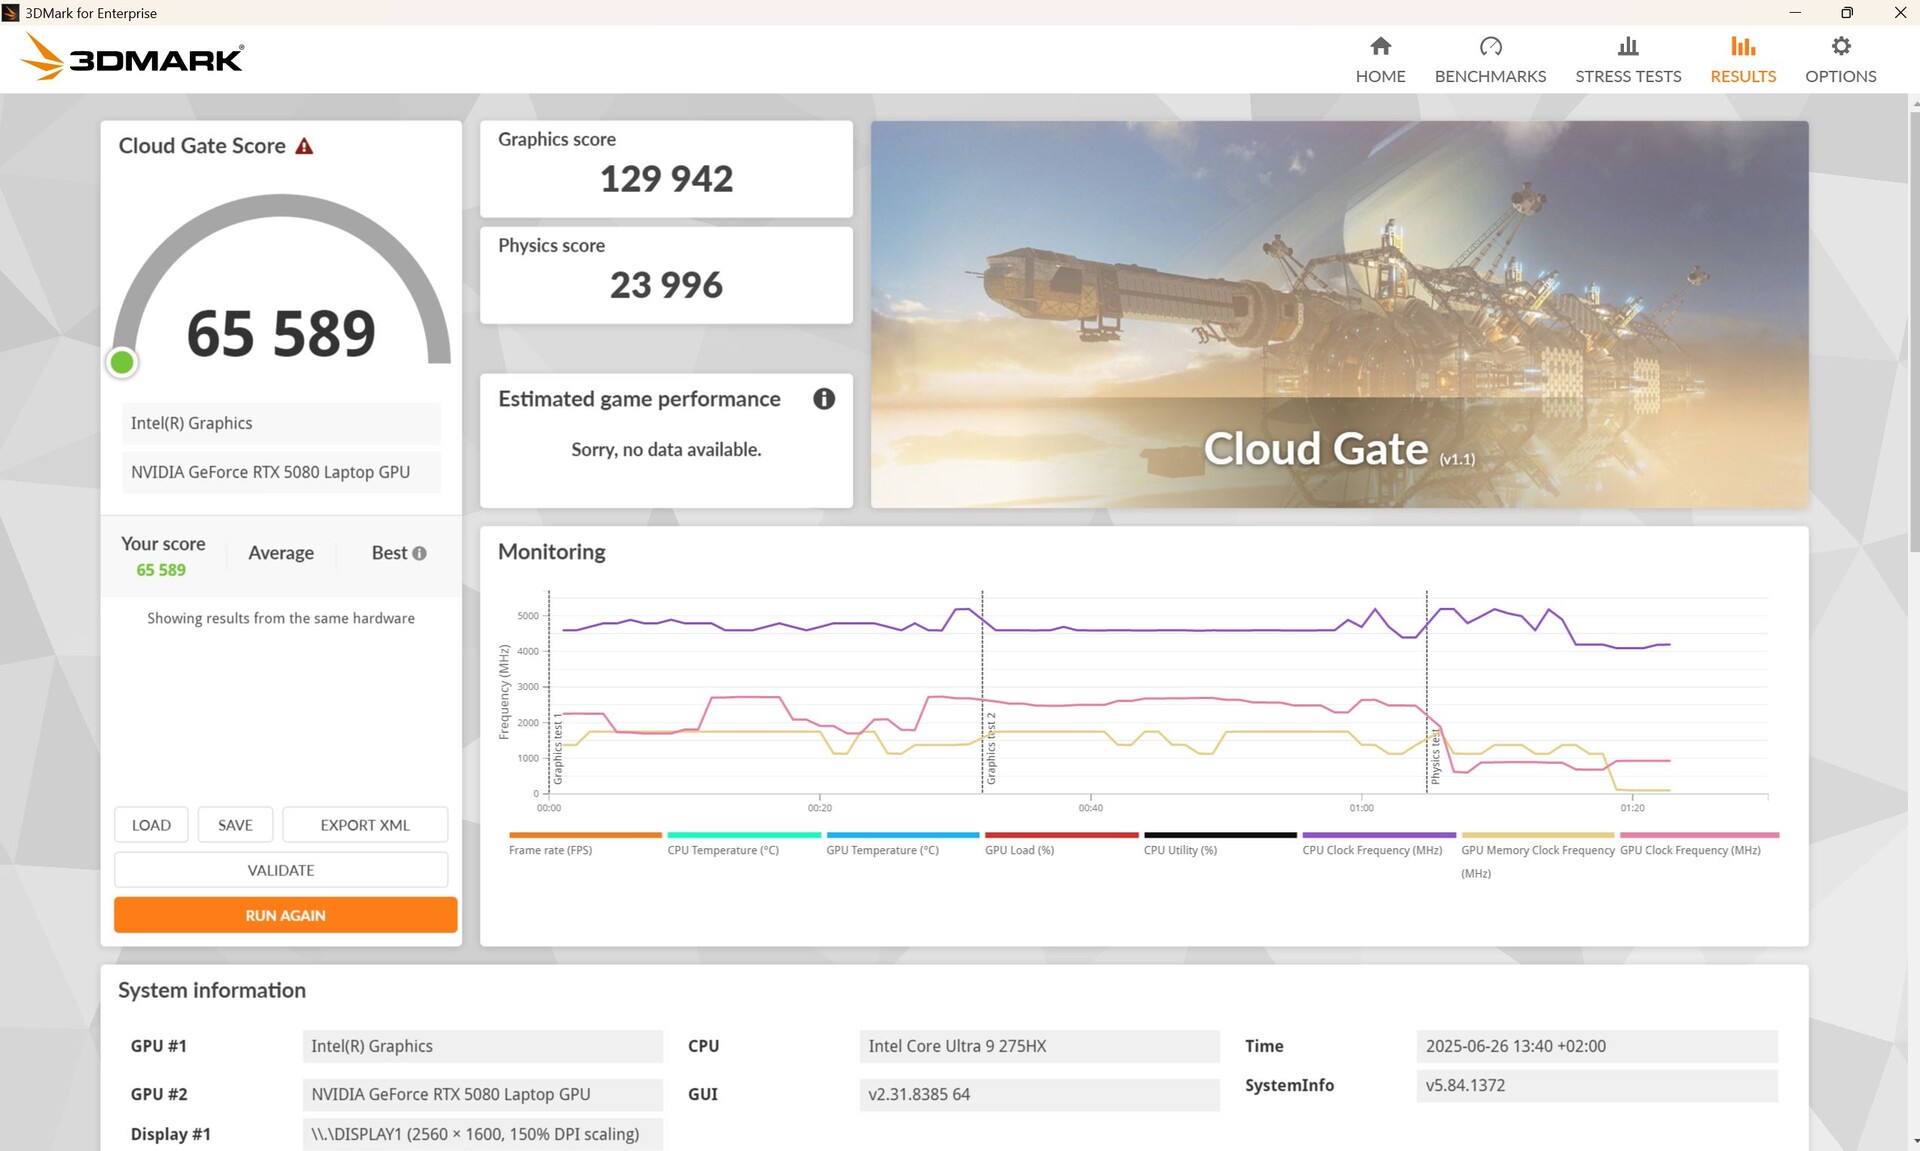
| 3DMark 11 Performance | 47539 points | |
| 3DMark Cloud Gate Standard Score | 65589 points | |
| 3DMark Fire Strike Score | 35915 points | |
| 3DMark Time Spy Score | 18303 points | |
| 3DMark Steel Nomad Score | 4518 points | |
Aide | ||
* ... Moindre est la valeur, meilleures sont les performances
Performances des jeux
Dans nos jeux, le Vector 17 en Full HD est à la hauteur d'un Erazer Beast 18 X1 de Medion Medion Erazer Beast 18 X1 et donc légèrement en dessous de la moyenne des joueurs RTX 5080. La performance continue dans Cyberpunk est très cohérente.
C'est en QHD qu'elle se sent le plus à l'aise, principalement grâce à DLSS. Par exemple, Doom : The Dark Ages peut être joué en QHD avec DLSS à peu près au même taux de rafraîchissement qu'en Full HD (85 - 88 fps). Combiné à la génération d'images 4x, notre Vector 17 atteint même 214 fps, ce qui est proche du taux de rafraîchissement natif de l'écran. Nous n'avons pas remarqué d'augmentation de la latence, mais l'expérience subjective peut varier ici.
| Strange Brigade - 1920x1080 ultra AA:ultra AF:16 | |
| Lenovo Legion Pro 7i 16 Gen 10 | |
| Alienware 16 Area-51 | |
| Medion Erazer Beast 18 X1 MD62731 | |
| MSI Vector 17 HX AI A2XWIG | |
| Lenovo Legion 5 Pro 16IAX10H | |
| Moyenne de la classe Gaming (76.3 - 456, n=86, 2 dernières années) | |
Cyberpunk 2077 ultra FPS-Diagram
Cyberpunk 2077 Données GPU

| Bas | Moyen | Élevé | Ultra | QHD DLSS | QHD | 4K DLSS | 4K | |
|---|---|---|---|---|---|---|---|---|
| GTA V (2015) | 186.5 | 184.1 | 181.5 | 158.7 | 151.7 | |||
| Dota 2 Reborn (2015) | 220 | 193.1 | 185.9 | 171.7 | 167.9 | |||
| Final Fantasy XV Benchmark (2018) | 231 | 207 | 183.7 | 111.2 | 68.6 | |||
| X-Plane 11.11 (2018) | 163.7 | 139.5 | 108.8 | 98.7 | ||||
| Strange Brigade (2018) | 549 | 429 | 393 | 356 | 265 | 144 | ||
| Baldur's Gate 3 (2023) | 203 | 160 | 141 | 166.3 | 167.3 | 118.3 | 83.2 | 55.7 |
| Cyberpunk 2077 (2023) | 171.8 | 136.6 | 103.9 | 90 | 39.1 | |||
| Doom: The Dark Ages (2025) | 88 | 85 | 64 |
Émissions et énergie - Jusqu'à 60 dB(A), c'est assez bruyant en comparaison
Émissions sonores
Les ventilateurs sont souvent éteints lorsqu'ils tournent au ralenti, mais ils ne s'éteignent pas complètement pendant très longtemps après une charge, même en mode Eco. Dans les jeux, ils ont tendance à être plus bruyants que ceux de la concurrence, malgré des performances 3D moyennes.
Degré de la nuisance sonore
| Au repos |
| 24 / 30.82 / 31.31 dB(A) |
| Fortement sollicité |
| 31.12 / 59.24 dB(A) |
 | ||
30 dB silencieux 40 dB(A) audible 50 dB(A) bruyant |
||
min: | ||
| MSI Vector 17 HX AI A2XWIG GeForce RTX 5080 Laptop, Ultra 9 275HX, Western Digital PC SN5000S SDEPNSJ-2T00-1032 | Alienware 16 Area-51 GeForce RTX 5080 Laptop, Ultra 9 275HX, Samsung PM9C1a MZ9L81T0HDLB | MSI Vector 16 HX AI A2XWHG GeForce RTX 5070 Ti Laptop, Ultra 7 255HX, Micron 2400 MTFDKBA512QFM | Lenovo Legion Pro 7i 16 Gen 10 GeForce RTX 5080 Laptop, Ultra 9 275HX, SK Hynix HFS001TEJ9X115N | Lenovo Legion 5 Pro 16IAX10H GeForce RTX 5070 Ti Laptop, Ultra 9 275HX, Western Digital PC SN8000S SDEPNRK-1T00 | MSI Raider A18 HX A9WIG-080 GeForce RTX 5080 Laptop, R9 9955HX3D, Samsung PM9E1 MZVLC2T0HBLD | Medion Erazer Beast 18 X1 MD62731 GeForce RTX 5080 Laptop, Ultra 9 275HX, Phison E31 2 TB | |
|---|---|---|---|---|---|---|---|
| Noise | 6% | -12% | 12% | -7% | -4% | -17% | |
| arrêt / environnement * (dB) | 24 | 23.6 2% | 25 -4% | 22.9 5% | 24 -0% | 25.1 -5% | 25 -4% |
| Idle Minimum * (dB) | 24 | 25.4 -6% | 33 -38% | 22.9 5% | 24 -0% | 28.6 -19% | 25 -4% |
| Idle Average * (dB) | 30.82 | 27.8 10% | 34 -10% | 22.9 26% | 24 22% | 28.9 6% | 39 -27% |
| Idle Maximum * (dB) | 31.31 | 28.1 10% | 38 -21% | 26.3 16% | 30.9 1% | 29.2 7% | 42 -34% |
| Load Average * (dB) | 31.12 | 28.8 7% | 46 -48% | 27.8 11% | 55.9 -80% | 45.6 -47% | 52 -67% |
| Cyberpunk 2077 ultra * (dB) | 59.24 | 50.4 15% | 47 21% | 54.2 9% | 56.72 4% | 55.6 6% | 53 11% |
| Load Maximum * (dB) | 59.24 | 56.4 5% | 49 17% | 53.9 9% | 56.72 4% | 45.8 23% | 55 7% |
* ... Moindre est la valeur, meilleures sont les performances
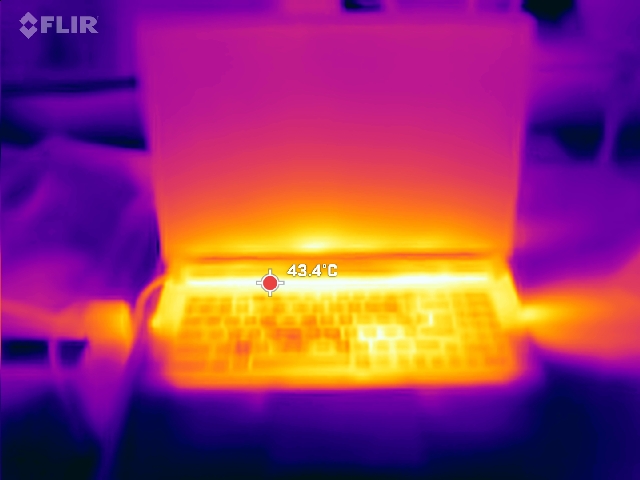
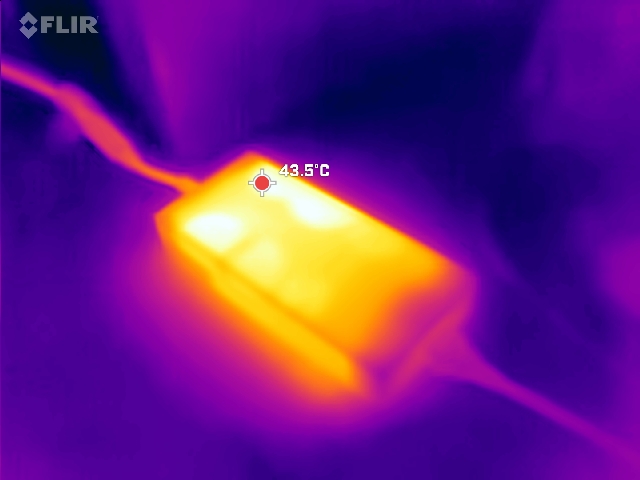
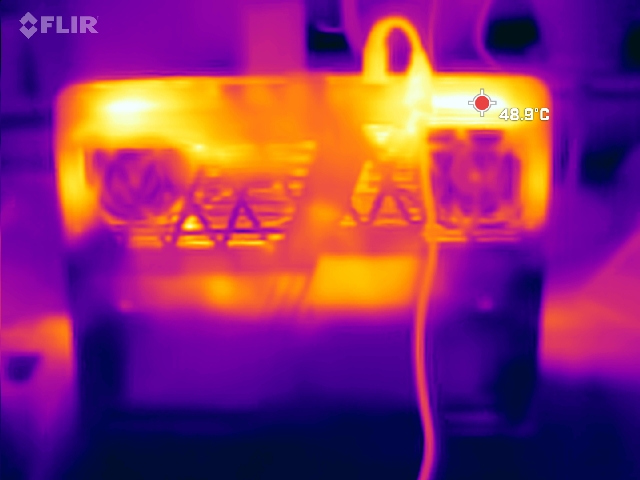
Température
En cas de stress, les températures de surface atteignent 53 °C (127,4 °F), tandis que les températures de jeu sont plus modérées (47 °C (116,6 °F)), la zone clé WASD étant à 38 °C (100,4 °F).
(-) La température maximale du côté supérieur est de 53 °C / 127 F, par rapport à la moyenne de 40.4 °C / 105 F, allant de 21.2 à 68.8 °C pour la classe Gaming.
(-) Le fond chauffe jusqu'à un maximum de 54 °C / 129 F, contre une moyenne de 43.2 °C / 110 F
(+) En utilisation inactive, la température moyenne du côté supérieur est de 31.4 °C / 89 F, par rapport à la moyenne du dispositif de 33.9 °C / 93 F.
(±) 3: The average temperature for the upper side is 36.4 °C / 98 F, compared to the average of 33.9 °C / 93 F for the class Gaming.
(+) Les repose-poignets et le pavé tactile sont plus froids que la température de la peau avec un maximum de 29 °C / 84.2 F et sont donc froids au toucher.
(±) La température moyenne de la zone de l'appui-paume de dispositifs similaires était de 28.8 °C / 83.8 F (-0.2 °C / #-0.4 F).
| MSI Vector 17 HX AI A2XWIG Intel Core Ultra 9 275HX, NVIDIA GeForce RTX 5080 Laptop | Alienware 16 Area-51 Intel Core Ultra 9 275HX, NVIDIA GeForce RTX 5080 Laptop | MSI Vector 16 HX AI A2XWHG Intel Core Ultra 7 255HX, NVIDIA GeForce RTX 5070 Ti Laptop | Lenovo Legion Pro 7i 16 Gen 10 Intel Core Ultra 9 275HX, NVIDIA GeForce RTX 5080 Laptop | Lenovo Legion 5 Pro 16IAX10H Intel Core Ultra 9 275HX, NVIDIA GeForce RTX 5070 Ti Laptop | MSI Raider A18 HX A9WIG-080 AMD Ryzen 9 9955HX3D, NVIDIA GeForce RTX 5080 Laptop | Medion Erazer Beast 18 X1 MD62731 Intel Core Ultra 9 275HX, NVIDIA GeForce RTX 5080 Laptop | |
|---|---|---|---|---|---|---|---|
| Heat | 12% | 9% | 16% | -1% | 6% | 13% | |
| Maximum Upper Side * (°C) | 53 | 43.8 17% | 53 -0% | 42.6 20% | 48 9% | 49.3 7% | 47 11% |
| Maximum Bottom * (°C) | 54 | 40 26% | 52 4% | 41.2 24% | 50 7% | 50.9 6% | 48 11% |
| Idle Upper Side * (°C) | 39 | 35.8 8% | 33 15% | 32.6 16% | 38 3% | 35.2 10% | 29 26% |
| Idle Bottom * (°C) | 34 | 35.2 -4% | 29 15% | 32.4 5% | 42 -24% | 33.5 1% | 33 3% |
* ... Moindre est la valeur, meilleures sont les performances
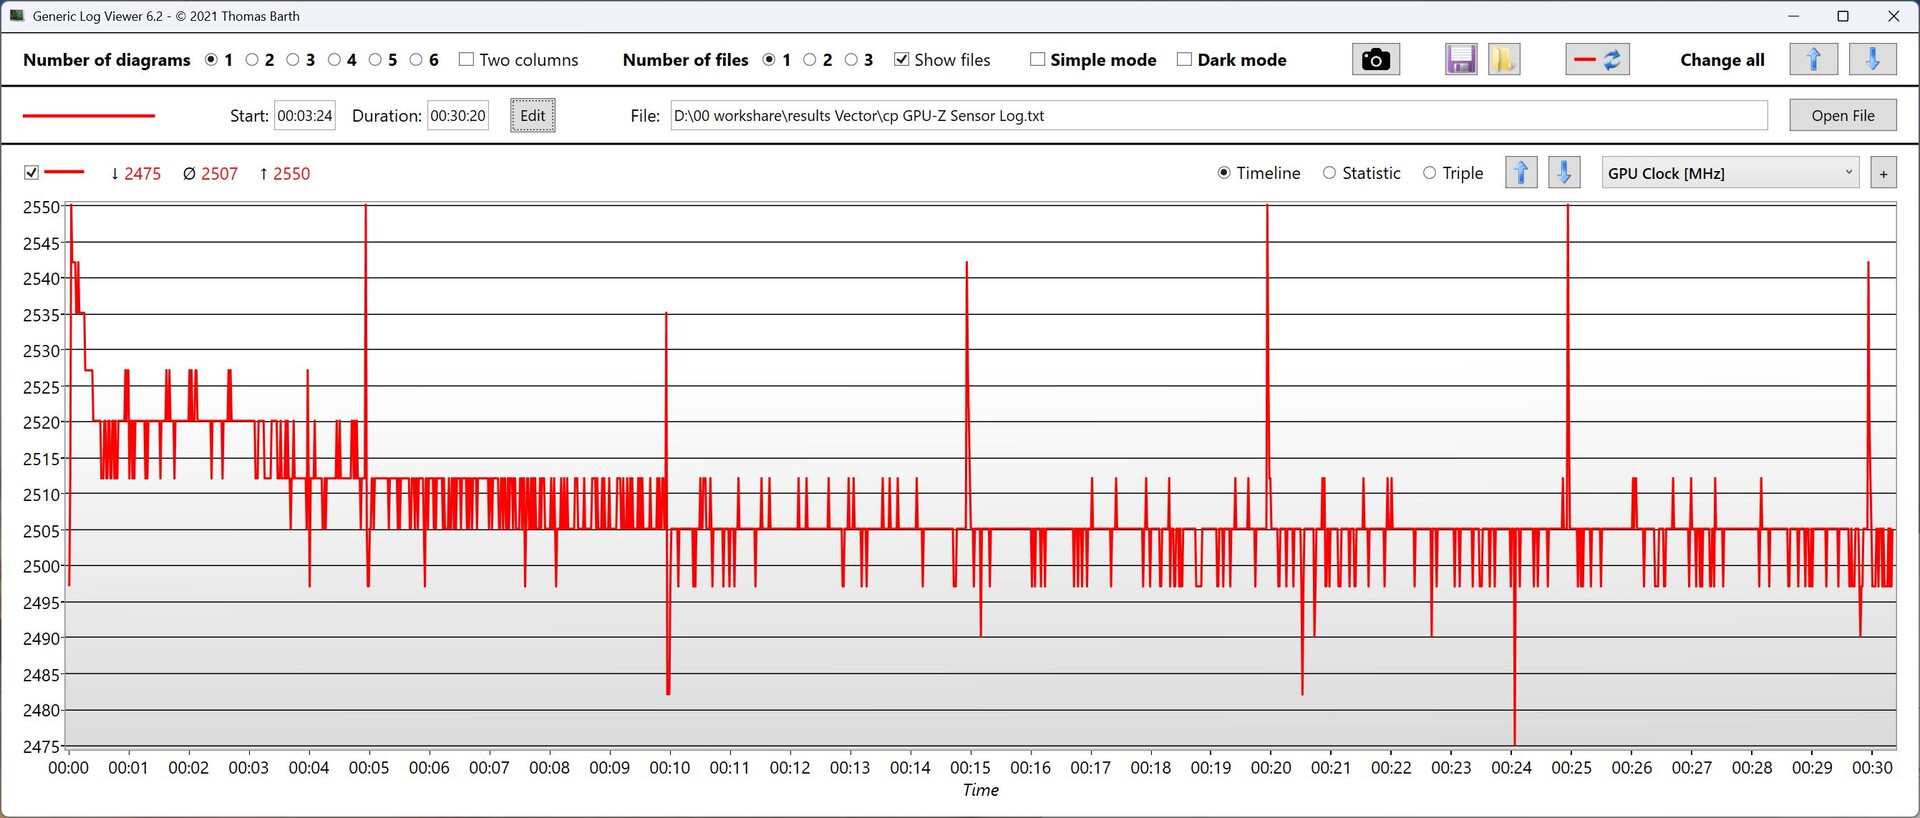
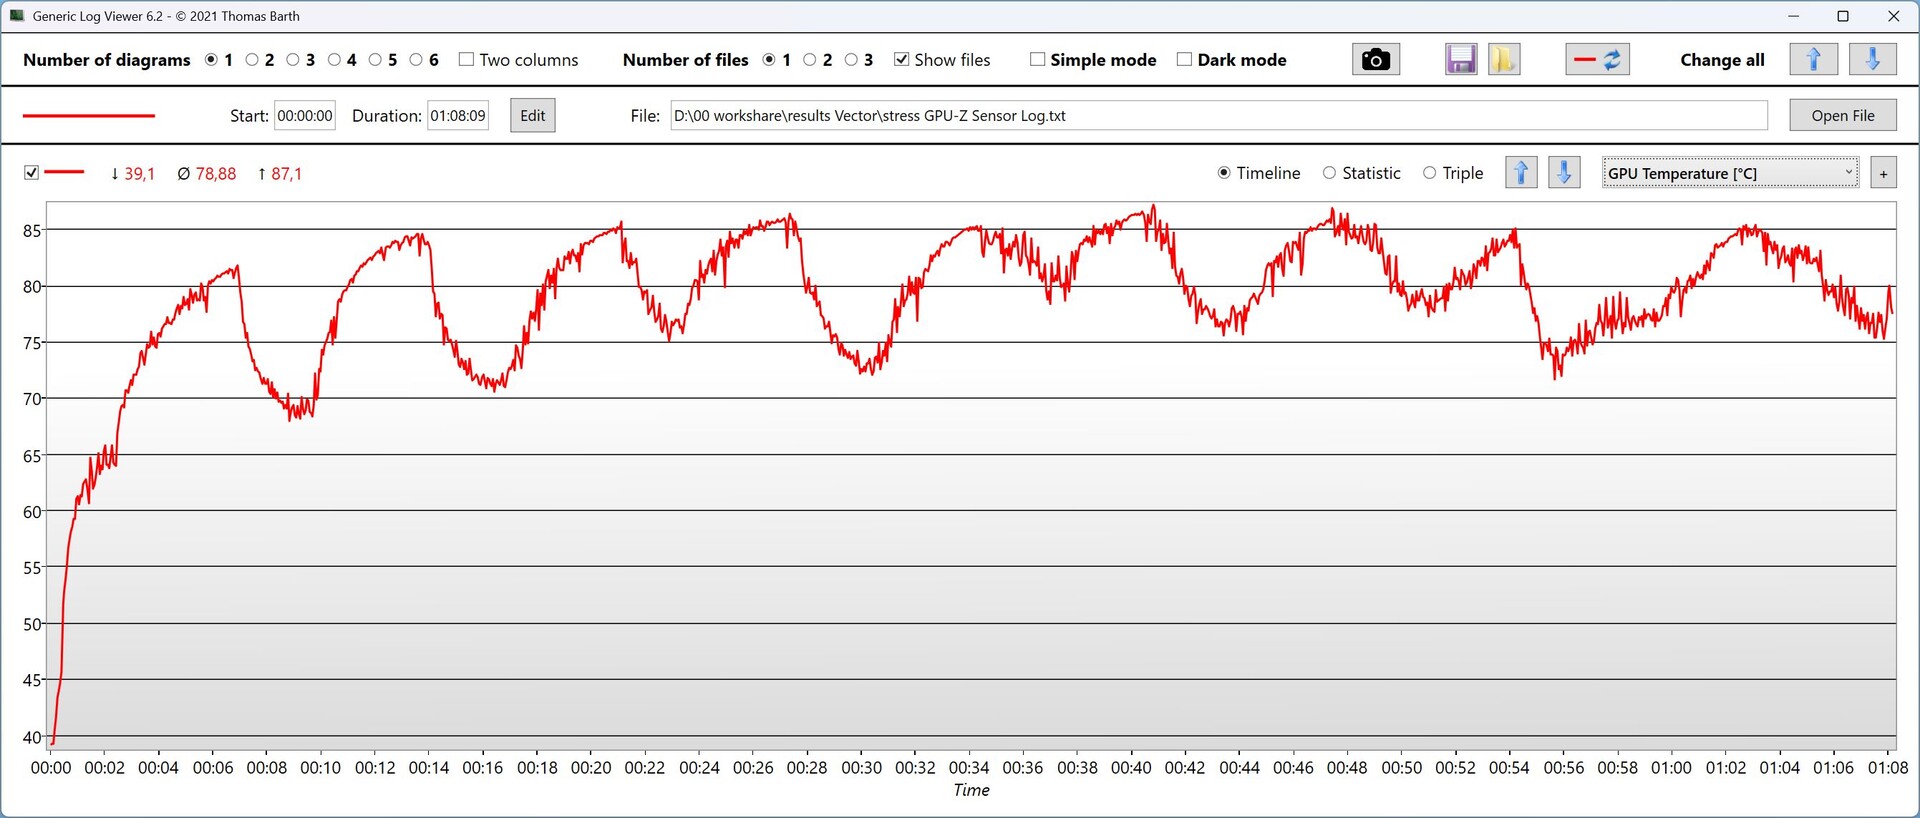
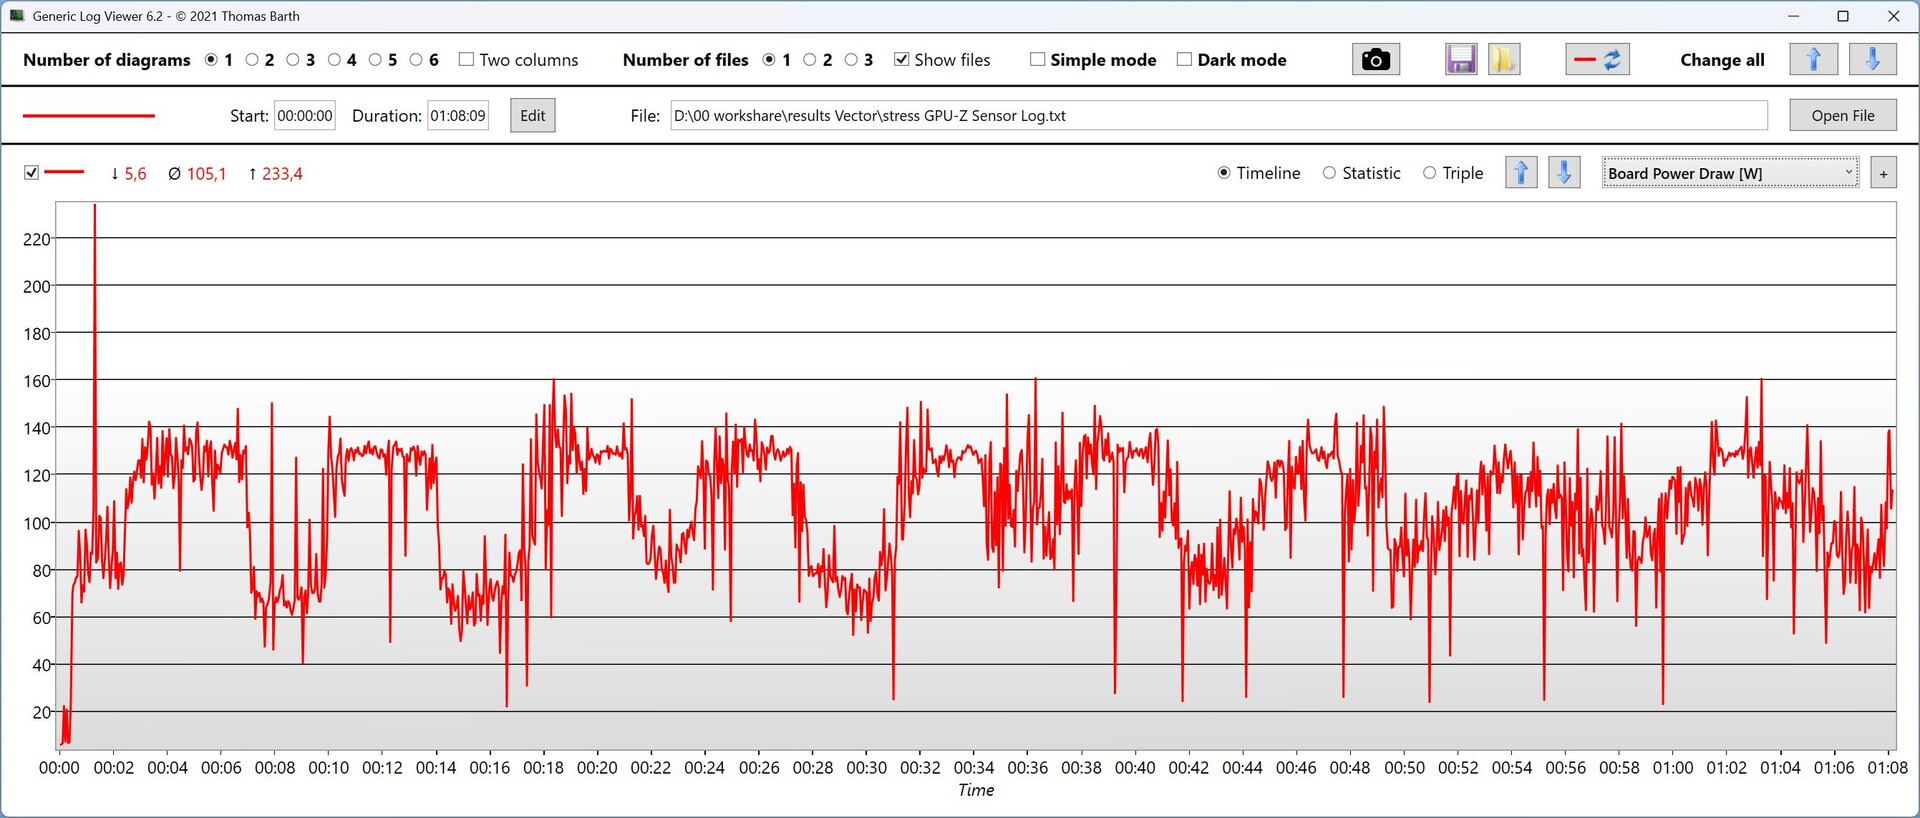
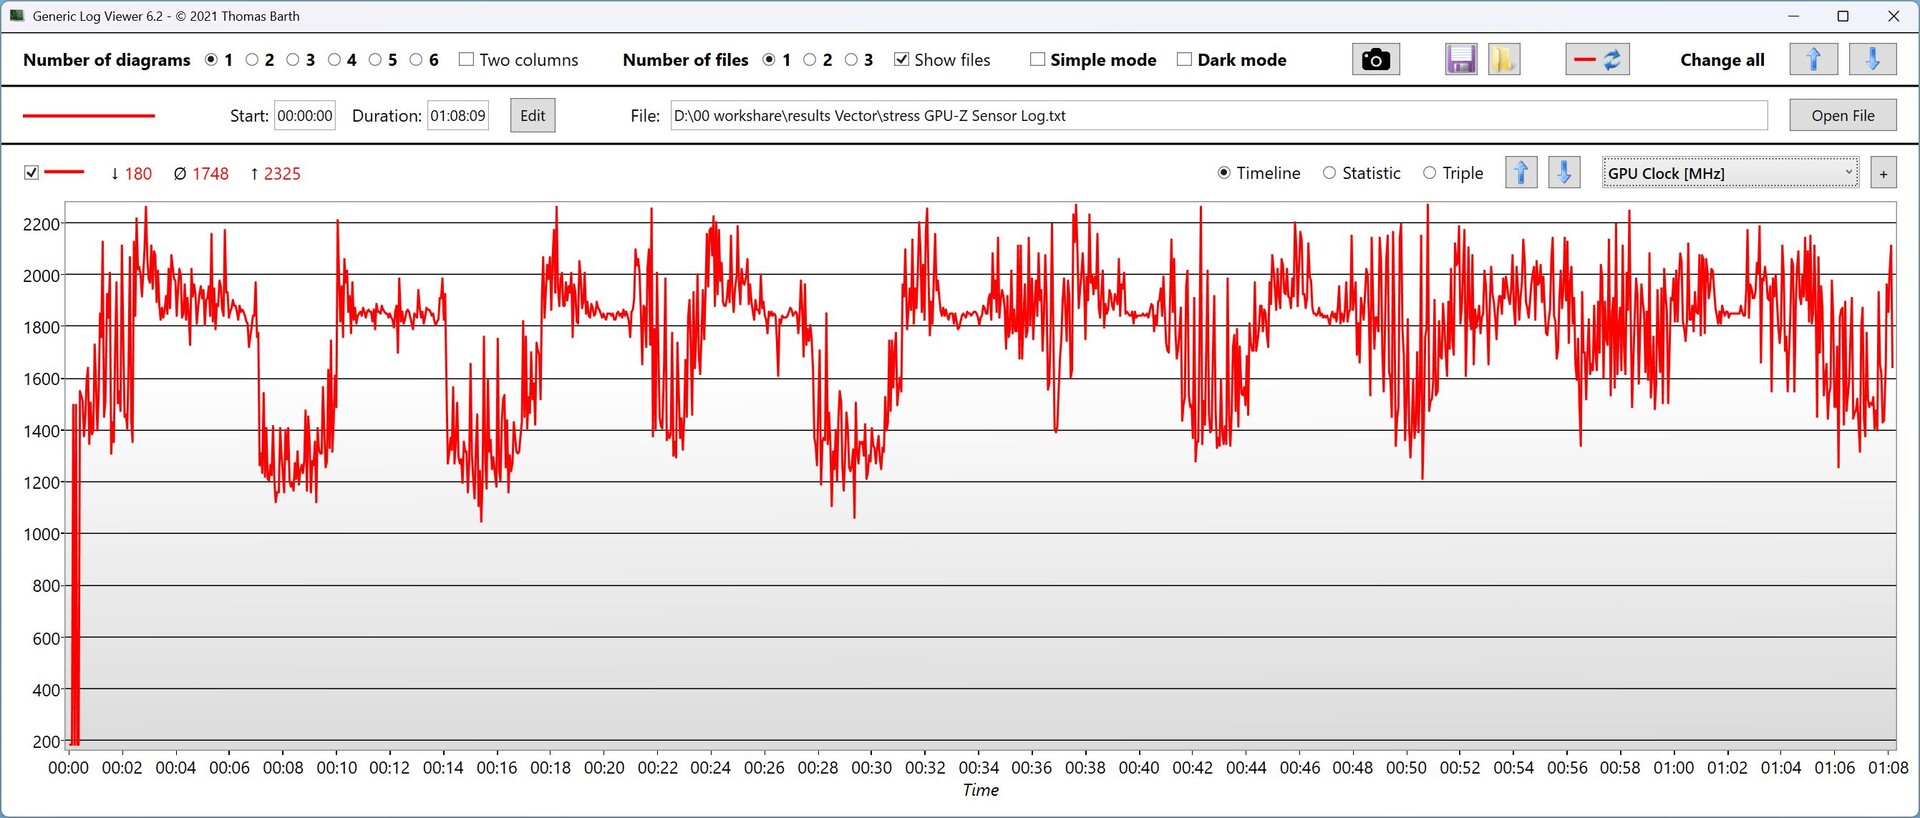
| Horloge du CPU (GHz) | Horloge du GPU (MHz) | Température moyenne du CPU (°C) | Température moyenne du GPU (°C) | |
| Prime95 Stress | 4.25 | 750 | 80 | 45 |
| Prime95 + FurMark Stress | 3.4 | 1,750 | 74 - 81 | 70 - 87 |
| Cyberpunk 2077 Stress | 1.9 | 2,500 | 81 - 89 | jusqu'à 80 |
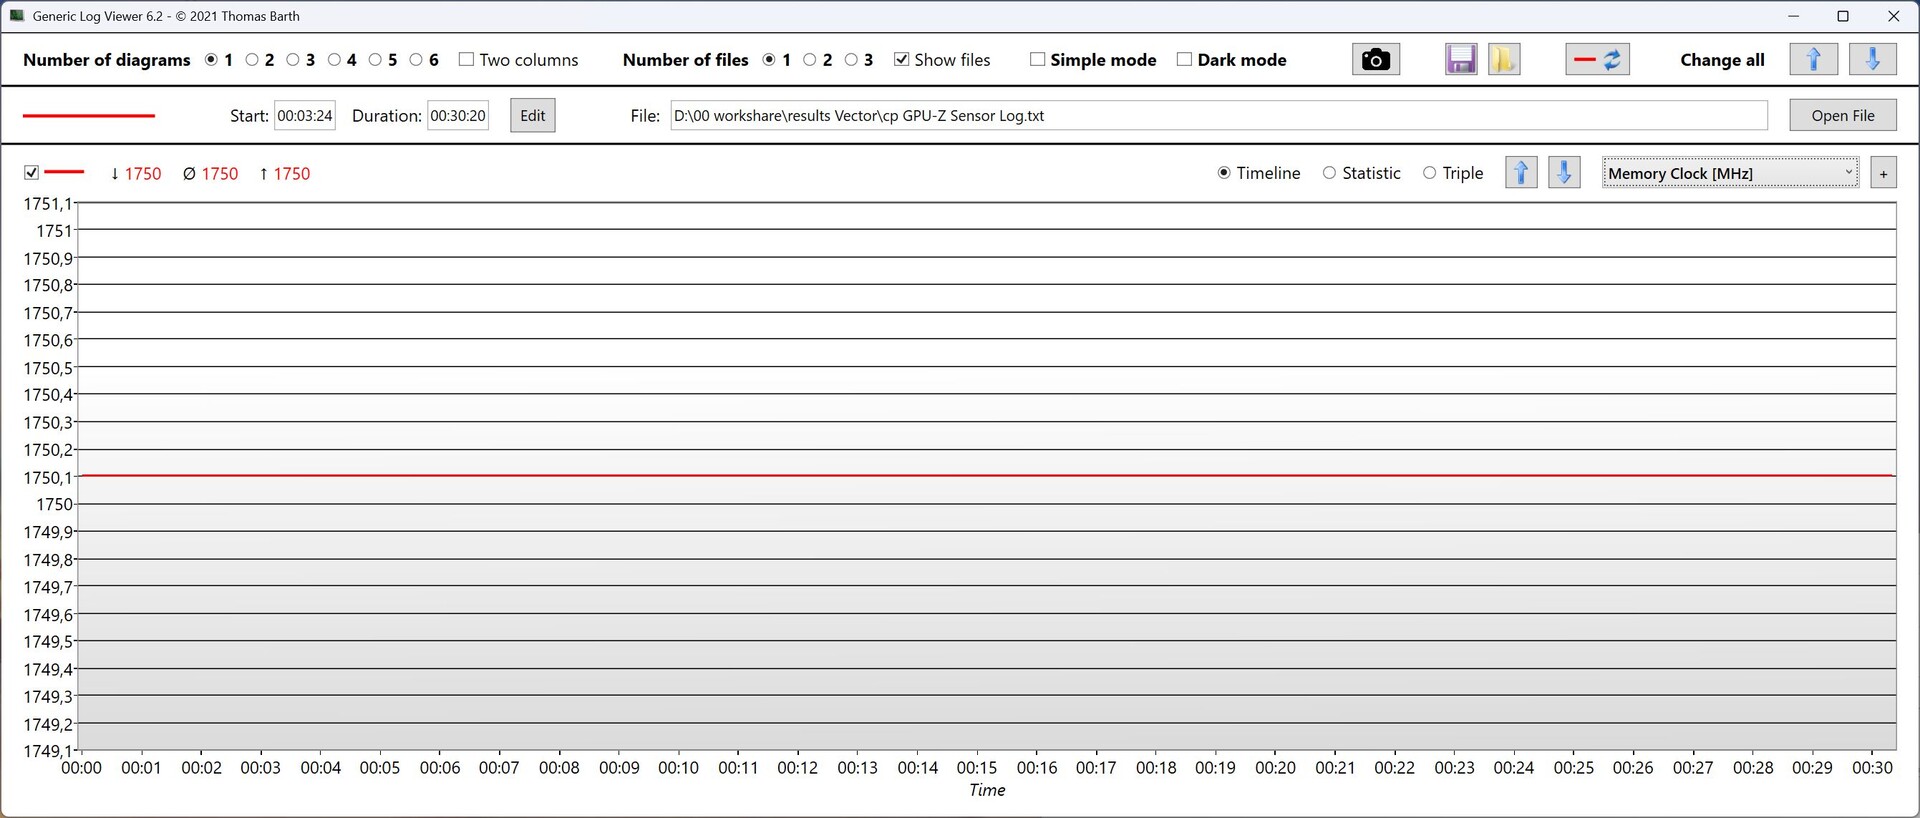
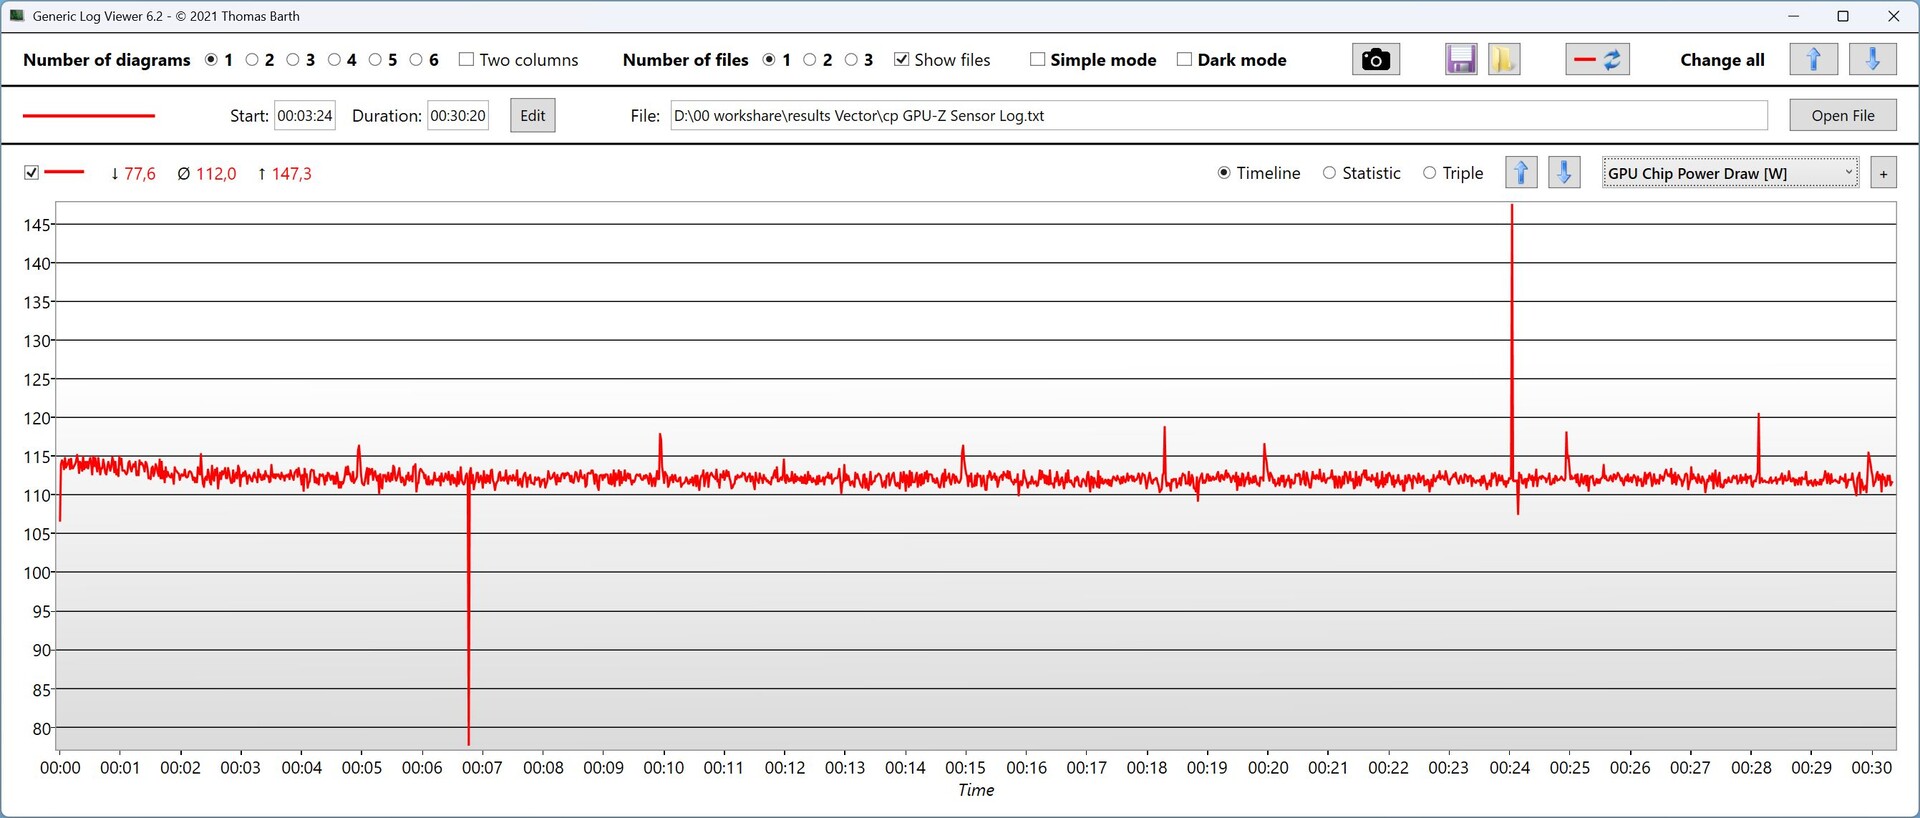
Épreuve d'effort

Intervenants
Les haut-parleurs font un travail moyen. Un port jack de 3,5 mm est disponible pour les écouteurs et autres.
MSI Vector 17 HX AI A2XWIG analyse audio
(±) | le niveau sonore du haut-parleur est moyen mais bon (80.39# dB)
Basses 100 - 315 Hz
(±) | basse réduite - en moyenne 10.4% inférieure à la médiane
(±) | la linéarité des basses est moyenne (7.4% delta à la fréquence précédente)
Médiums 400 - 2000 Hz
(±) | médiane supérieure - en moyenne 6.2% supérieure à la médiane
(+) | les médiums sont linéaires (4.7% delta à la fréquence précédente)
Aiguës 2 - 16 kHz
(+) | des sommets équilibrés - à seulement 4.3% de la médiane
(±) | la linéarité des aigus est moyenne (8.7% delta à la fréquence précédente)
Globalement 100 - 16 000 Hz
(±) | la linéarité du son global est moyenne (15.6% de différence avec la médiane)
Par rapport à la même classe
» 36% de tous les appareils testés de cette catégorie étaient meilleurs, 6% similaires, 58% pires
» Le meilleur avait un delta de 6%, la moyenne était de 18%, le pire était de 132%.
Par rapport à tous les appareils testés
» 23% de tous les appareils testés étaient meilleurs, 5% similaires, 72% pires
» Le meilleur avait un delta de 4%, la moyenne était de 23%, le pire était de 134%.
Lenovo Legion 5 Pro 16IAX10H analyse audio
(±) | le niveau sonore du haut-parleur est moyen mais bon (78.2# dB)
Basses 100 - 315 Hz
(-) | presque aucune basse - en moyenne 21.1% plus bas que la médiane
(±) | la linéarité des basses est moyenne (8% delta à la fréquence précédente)
Médiums 400 - 2000 Hz
(±) | médiane supérieure - en moyenne 6.3% supérieure à la médiane
(+) | les médiums sont linéaires (6.5% delta à la fréquence précédente)
Aiguës 2 - 16 kHz
(+) | des sommets équilibrés - à seulement 1.6% de la médiane
(+) | les aigus sont linéaires (4.9% delta à la fréquence précédente)
Globalement 100 - 16 000 Hz
(±) | la linéarité du son global est moyenne (18.3% de différence avec la médiane)
Par rapport à la même classe
» 58% de tous les appareils testés de cette catégorie étaient meilleurs, 9% similaires, 33% pires
» Le meilleur avait un delta de 6%, la moyenne était de 18%, le pire était de 132%.
Par rapport à tous les appareils testés
» 40% de tous les appareils testés étaient meilleurs, 8% similaires, 52% pires
» Le meilleur avait un delta de 4%, la moyenne était de 23%, le pire était de 134%.
Consommation d'énergie
Après les mises à jour, la consommation en veille est maintenant correcte. Dans les jeux, elle est encore trop élevée par rapport aux performances offertes. Si un moniteur externe est connecté via HDMI, le dGPU est actif et consomme plus d'énergie en mode inactif.
| Éteint/en veille | |
| Au repos | |
| Fortement sollicité |
|
Légende:
min: | |
| MSI Vector 17 HX AI A2XWIG Ultra 9 275HX, GeForce RTX 5080 Laptop, Western Digital PC SN5000S SDEPNSJ-2T00-1032, IPS, 2560x1600, 17" | Alienware 16 Area-51 Ultra 9 275HX, GeForce RTX 5080 Laptop, Samsung PM9C1a MZ9L81T0HDLB, IPS, 2560x1600, 16" | MSI Vector 16 HX AI A2XWHG Ultra 7 255HX, GeForce RTX 5070 Ti Laptop, Micron 2400 MTFDKBA512QFM, IPS, 2560x1600, 16" | Lenovo Legion Pro 7i 16 Gen 10 Ultra 9 275HX, GeForce RTX 5080 Laptop, SK Hynix HFS001TEJ9X115N, OLED, 2560x1600, 16" | Lenovo Legion 5 Pro 16IAX10H Ultra 9 275HX, GeForce RTX 5070 Ti Laptop, Western Digital PC SN8000S SDEPNRK-1T00, OLED, 2560x1600, 16" | MSI Raider A18 HX A9WIG-080 R9 9955HX3D, GeForce RTX 5080 Laptop, Samsung PM9E1 MZVLC2T0HBLD, MiniLED IPS, 3840x2400, 18" | Medion Erazer Beast 18 X1 MD62731 Ultra 9 275HX, GeForce RTX 5080 Laptop, Phison E31 2 TB, IPS, 2560x1600, 18" | Moyenne NVIDIA GeForce RTX 5080 Laptop | Moyenne de la classe Gaming | |
|---|---|---|---|---|---|---|---|---|---|
| Power Consumption | -61% | -3% | -80% | -14% | -119% | 6% | -52% | -17% | |
| Idle Minimum * (Watt) | 10 | 27 -170% | 7.1 29% | 28.5 -185% | 14 -40% | 41.5 -315% | 7.9 21% | 19.1 ? -91% | 13 ? -30% |
| Idle Average * (Watt) | 15.4 | 33.5 -118% | 15.9 -3% | 38.8 -152% | 14.3 7% | 53.5 -247% | 11.5 25% | 25.3 ? -64% | 18.7 ? -21% |
| Idle Maximum * (Watt) | 18.7 | 41.4 -121% | 29.5 -58% | 45.6 -144% | 20.1 -7% | 53.8 -188% | 16.6 11% | 30.4 ? -63% | 24.3 ? -30% |
| Load Average * (Watt) | 89.7 | 124.7 -39% | 124 -38% | 132.2 -47% | 177 -97% | 168.5 -88% | 130 -45% | 128.5 ? -43% | 110.2 ? -23% |
| Cyberpunk 2077 ultra * (Watt) | 308 | 256 17% | 222 28% | 318 -3% | 255 17% | 298 3% | 253 18% | ||
| Cyberpunk 2077 ultra external monitor * (Watt) | 300 | 249 17% | 217 28% | 319 -6% | 255 15% | 295 2% | 245 18% | ||
| Load Maximum * (Watt) | 321 | 367.2 -14% | 336 -5% | 384 -20% | 294 8% | 323.7 -1% | 330 -3% | 314 ? 2% | 258 ? 20% |
* ... Moindre est la valeur, meilleures sont les performances
Energy consumption Cyberpunk / Stress test
Energy consumption with external Monitor
Durée de vie de la batterie
Avec la batterie de 90 Wh, le Vector 17 atteint environ 6,75 heures dans notre test Wi-Fi avec la luminosité réduite (mode Eco). Il s'agit d'un bon rapport qualité-prix en comparaison.
| MSI Vector 17 HX AI A2XWIG Ultra 9 275HX, GeForce RTX 5080 Laptop, 90 Wh | Alienware 16 Area-51 Ultra 9 275HX, GeForce RTX 5080 Laptop, 96 Wh | MSI Vector 16 HX AI A2XWHG Ultra 7 255HX, GeForce RTX 5070 Ti Laptop, 90 Wh | Lenovo Legion Pro 7i 16 Gen 10 Ultra 9 275HX, GeForce RTX 5080 Laptop, 99 Wh | Lenovo Legion 5 Pro 16IAX10H Ultra 9 275HX, GeForce RTX 5070 Ti Laptop, 80 Wh | MSI Raider A18 HX A9WIG-080 R9 9955HX3D, GeForce RTX 5080 Laptop, 99 Wh | Medion Erazer Beast 18 X1 MD62731 Ultra 9 275HX, GeForce RTX 5080 Laptop, 99 Wh | Moyenne de la classe Gaming | |
|---|---|---|---|---|---|---|---|---|
| Autonomie de la batterie | -58% | 4% | -39% | -19% | -56% | 18% | -7% | |
| WiFi v1.3 (h) | 6.7 | 2.8 -58% | 7 4% | 5.4 -19% | 4.9 -27% | 2.1 -69% | 7.9 18% | 7.15 ? 7% |
| Load (h) | 1.9 | 0.8 -58% | 1.7 -11% | 1.1 -42% | 1.502 ? -21% | |||
| Reader / Idle (h) | 3.1 | 8.71 ? | ||||||
| H.264 (h) | 4.8 | 8.64 ? |
Notebookcheck note globale
Le MSI Vector 17 HX AI est un ordinateur portable de jeu moyen qui marque quelques points supplémentaires grâce au double Thunderbolt 5 et au Wi-Fi 7.
MSI Vector 17 HX AI A2XWIG
- 07/16/2025 v8
Christian Hintze
 Total Sustainability Score:
 Comparaison des alternatives possibles
Transparency
La sélection des appareils à examiner est effectuée par notre équipe éditoriale. L'échantillon de test a été prêté à l'auteur par le fabricant ou le détaillant pour les besoins de cet examen. Le prêteur n'a pas eu d'influence sur cette évaluation et le fabricant n'a pas reçu de copie de cette évaluation avant sa publication. Il n'y avait aucune obligation de publier cet article. En tant que média indépendant, Notebookcheck n'est pas soumis à l'autorité des fabricants, des détaillants ou des éditeurs.
Voici comment Notebookcheck teste
Chaque année, Notebookcheck examine de manière indépendante des centaines d'ordinateurs portables et de smartphones en utilisant des procédures standardisées afin de garantir que tous les résultats sont comparables. Nous avons continuellement développé nos méthodes de test depuis environ 20 ans et avons établi des normes industrielles dans le processus. Dans nos laboratoires de test, des équipements de mesure de haute qualité sont utilisés par des techniciens et des rédacteurs expérimentés. Ces tests impliquent un processus de validation en plusieurs étapes. Notre système d'évaluation complexe repose sur des centaines de mesures et de points de référence bien fondés, ce qui garantit l'objectivité.