Testés dans les ordinateurs portables : NVIDIA GeForce RTX 5080 Laptop carte graphique
Test de l'Alienware 16 Area-51 : nouveau Core Ultra 9 290HX Plus, la puissance à tout prix
Intel Arrow Lake-H monte d'un cran avec un SKU encore plus puissant cette année pour remplacer le Core Ultra 9 275HX. Toutefois, l'augmentation des performances de la même architecture sous-jacente a des conséquences.
Intel Core Ultra 9 290HX Plus, NVIDIA GeForce RTX 5080 Laptop, 16", 3.3 kgTest du Lenovo ThinkPad T16g Gen 3 : station de travail mobile aux performances décevantes
Le ThinkPad T16g est une puissante station de travail mobile de Lenovo qui utilise des GPU ordinaires GeForce au lieu de GPU RTX PRO. Le nouveau modèle (dont le design est identique à celui du ThinkPad P16 Gen 3) se distingue par son ensemble de fonctionnalités, mais présente des faiblesses, notamment en termes de performances.
Intel Core Ultra 9 275HX, NVIDIA GeForce RTX 5080 Laptop, 16", 2.6 kgTest de l'Asus ROG NUC 15 avec RTX 5080 et Core Ultra 9 : le meilleur mini PC de jeu 2025
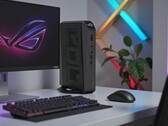
L'Asus ROG NUC 15 est un ordinateur de jeu compact qui s'adresse clairement aux joueurs. Avec l'Intel Core Ultra 9 275HX et le GPU portable Nvidia GeForce RTX 5080, il promet des performances puissantes dans les espaces les plus réduits. Notre examen actuel montre en détail les performances de ce mini PC.
Intel Core Ultra 9 275HX, NVIDIA GeForce RTX 5080 Laptop, 3 kgTest du Legion 9 18IAX10 : le premier PC portable de jeu de 18 pouces de Lenovo est presque un coup de maître
Bien que le Lenovo Legion 9 18 soit arrivé un peu tard sur le ring des jeux de 18 pouces, il est facilement l'un des meilleurs dans sa catégorie de taille, même face à des modèles chevronnés comme le MSI Titan ou le Razer Blade 18.
Intel Core Ultra 9 275HX, NVIDIA GeForce RTX 5080 Laptop, 18", 3.5 kgTest du MSI Vector 17 HX AI : le dernier des Mohicans du jeu, GPU Blackwell en 17 pouces
Après le MSI Vector 16, nous testons le nouveau Vector 17 avec RTX 5080, l'un des derniers portables de 17 pouces équipés d'un GPU Blackwell, les modèles de 16 et 18 pouces signifiant que les 17 sont désormais presque éteints. Nous testons la raison d'être du Vector 17.
Intel Core Ultra 9 275HX, NVIDIA GeForce RTX 5080 Laptop, 17", 3 kgAcer Predator Helios 18 AI: Intel Core Ultra 9 275HX, 18.00", 3.5 kg
Critique » Test de l'Acer Predator Helios 18 AI : enfin un PC portable de jeu plus silencieux, mais à quel prix ?
Alienware 16 Area-51: Intel Core Ultra 9 275HX, 16.00", 3.3 kg
Critique » Test de l'Alienware 16 Area-51 : le meilleur ordinateur portable de jeu de Dell à ce jour
MSI Raider A18 HX A9WIG-080: AMD Ryzen 9 9955HX3D, 18.00", 3.6 kg
Critique » Test du MSI Raider A18 HX A9W : AMD met le feu aux poudres avec le Ryzen 9 9955HX3D
Razer Blade 16 RTX 5080: AMD Ryzen AI 9 365, 16.00", 2.1 kg
Critique » Test du Razer Blade 16 RTX 5080 : presque aussi rapide mais tellement moins cher
Medion Erazer Beast 18 X1 MD62731: Intel Core Ultra 9 275HX, 18.00", 3.6 kg
Critique » Test du Medion Erazer Beast 18 X1 : quel résultat pour la RTX 5080 chez le géant du jeu ?
Asus ROG Zephyrus G14 2025 GA403WW: AMD Ryzen AI 9 HX 370, 14.00", 1.6 kg
Critique » Test de l'Asus ROG Zephyrus G14 2025 : 14 pouces avec GeForce RTX 5080 pour PC portables
Asus ROG Strix G16 G615: Intel Core Ultra 9 275HX, 16.00", 2.6 kg
Critique » Test de l'Asus ROG Strix G16 G615 : PC portable RTX 5080 optimal pour le jeu en WQHD
Lenovo Legion Pro 7i 16 Gen 10: Intel Core Ultra 9 275HX, 16.00", 2.6 kg
Critique » Test du Lenovo Legion Pro 7i 16 Gen 10 : alimentation de 400 W presque sans compromis
Schenker XMG Neo 16 A25 5080 Engineering Sample: AMD Ryzen 9 9955HX
Critique » Test du XMG Neo 16 2025 : le PC portable de jeu le plus rapide avec AMD, RTX 5000 et Mini-LED 300 Hz
Critique » Test de la Nvidia GeForce RTX 5090 : plus puissante, mais il y a plus à venir
MSI Stealth 16 AI+ B3WI: Intel Core Ultra 9 386H, 16.00", 2 kg
Autres tests » MSI Stealth 16 AI+ B3WI - Tests et caractéristiques
MSI Raider 16 Max HX B2WI: Intel Core Ultra 9 290HX Plus, 16.00", 2.6 kg
Autres tests » MSI Raider 16 Max HX B2WI - Tests et Caractéristiques
MSI Raider A16 HX B8WI: AMD Ryzen 9 8940HX, 16.00", 2.5 kg
Autres tests » MSI Raider A16 HX B8WI - Tests et Caractéristiques
Asus ROG Zephyrus G16 GU606AW: Intel Core Ultra 9 386H, 16.00", 2 kg
Autres tests » Asus ROG Zephyrus G16 GU606AW - Tests et caractéristiques
Aorus Master 16 AM6J: AMD Ryzen 9 9955HX3D, 16.00", 2.3 kg
Autres tests » Aorus Master 16 AM6J - Tests et caractéristiques
Asus ROG Zephyrus G14 GU405AW: Intel Core Ultra 9 386H, 14.00", 1.6 kg
Autres tests » Asus ROG Zephyrus G14 GU405AW
Alienware 16 Area-51 Core Ultra 9 290HX Plus: Intel Core Ultra 9 290HX Plus, 16.00", 3.3 kg
Autres tests » Alienware 16 Area-51 Core Ultra 9 290HX Plus
HP Omen Max 16 ah000: Intel Core Ultra 9 275HX, 16.00"
Autres tests » HP Omen Max 16 ah000
Asus ProArt P16 H7606WW: AMD Ryzen AI 9 HX 370, 16.00", 1.9 kg
Autres tests » Asus ProArt P16 H7606WW
HP Omen Max 16-ak0000: AMD Ryzen AI 9 HX 375, 16.00", 2.7 kg
Autres tests » HP Omen Max 16-ak0000
Gigabyte Gaming A16 Pro GA6DH: Intel Core 7 240H, 16.00", 2.3 kg
Autres tests » Gigabyte Gaming A16 Pro GA6DH
Asus ROG Strix G16 G615LW: Intel Core Ultra 9 275HX, 16.00", 2.5 kg
Autres tests » Asus ROG Strix G16 G615LW
Lenovo Legion 9 18IAX10: Intel Core Ultra 9 275HX, 18.00", 3.5 kg
Autres tests » Lenovo Legion 9 18IAX10
Lenovo Legion 9 18IAX10, RTX 5080: Intel Core Ultra 9 275HX, 18.00", 3.5 kg
Autres tests » Lenovo Legion 9 18IAX10, RTX 5080
MSI Raider A18 HX A9WIG-080: AMD Ryzen 9 9955HX3D, 18.00", 3.6 kg
Autres tests » MSI Raider A18 HX A9WIG-080
Asus ROG Strix G18 G815LW: Intel Core Ultra 9 275HX, 18.00", 3.2 kg
Autres tests » Asus ROG Strix G18 G815LW
Alienware 16 Area-51: Intel Core Ultra 9 275HX, 16.00", 3.3 kg
Autres tests » Alienware 16 Area-51
Acer Predator Helios 18 AI PH18-73, RTX 5080: Intel Core Ultra 9 275HX, 18.00", 3.2 kg
Autres tests » Acer Predator Helios 18 AI PH18-73, RTX 5080
MSI Vector 17 HX AI A2XWIG: Intel Core Ultra 9 275HX, 17.00", 3 kg
Autres tests » MSI Vector 17 HX AI A2XWIG
Razer Blade 18 2025 RTX 5080: Intel Core Ultra 9 275HX, 18.00", 3 kg
Autres tests » Razer Blade 18 2025 RTX 5080
Alienware 18 Area-51, RTX 5080: Intel Core Ultra 9 275HX, 18.00", 4.3 kg
Autres tests » Alienware 18 Area-51, RTX 5080
MSI Titan 18 HX AI A2XWIG: Intel Core Ultra 9 285HX, 18.00", 3.6 kg
Autres tests » MSI Titan 18 HX AI A2XWIG
Asus ROG Zephyrus G14 2025 GA403WW: AMD Ryzen AI 9 HX 370, 14.00", 1.6 kg
Autres tests » Asus ROG Zephyrus G14 2025 GA403WW
MSI Stealth 18 HX AI A2XWIG: Intel Core Ultra 9 275HX, 17.00", 2.9 kg
Autres tests » MSI Stealth 18 HX AI A2XWIG
Asus ROG Zephyrus G16 GU605CW: Intel Core Ultra 9 285H, 16.00", 2 kg
Autres tests » Asus ROG Zephyrus G16 GU605CW
Alienware 16 Area-51, RTX 5080: Intel Core Ultra 9 275HX, 16.00", 3.4 kg
Autres tests » Alienware 16 Area-51, RTX 5080
Asus ROG Strix G16 G615: Intel Core Ultra 9 275HX, 16.00", 2.6 kg
Autres tests » Asus ROG Strix G16 G615
Asus ROG Strix Scar 16 G635LW: Intel Core Ultra 9 275HX, 16.00", 2.8 kg
Autres tests » Asus ROG Strix Scar 16 G635LW
Lenovo Legion Pro 7i 16 Gen 10: Intel Core Ultra 9 275HX, 16.00", 2.6 kg
Autres tests » Lenovo Legion Pro 7i 16 Gen 10
MSI Vector A18 HX A9WIG: AMD Ryzen 9 9955HX, 18.00", 3.6 kg
Autres tests » MSI Vector A18 HX A9WIG
Asus ROG Strix Scar 18 G835LW: Intel Core Ultra 9 275HX, 18.00", 3.3 kg
Autres tests » Asus ROG Strix Scar 18 G835LW
MSI Vector 16 HX AI A2XWIG: Intel Core Ultra 9 275HX, 16.00", 2.7 kg
Autres tests » MSI Vector 16 HX AI A2XWIG
Aorus Master 16 AM6H, RTX 5080 (BYH): Intel Core Ultra 9 275HX, 16.00", 2.5 kg
Autres tests » Aorus Master 16 AM6H, RTX 5080 (BYH)
MSI Raider 18 HX AI A2XWIG: Intel Core Ultra 9 285HX, 18.00", 3.6 kg
Autres tests » MSI Raider 18 HX AI A2XWIG
Razer Blade 16 RTX 5080: AMD Ryzen AI 9 365, 16.00", 2.1 kg
Autres tests » Razer Blade 16 RTX 5080
Lenovo Legion Pro 7 16IAX10H : Intel Core Ultra 9 275HX, 16.00", 2.3 kg
Autres tests » Lenovo Legion Pro 7 16IAX10H
HP Omen Max 16-ah0000ng: Intel Core Ultra 9 275HX, 16.00", 2.7 kg
Autres tests » HP Omen Max 16-ah0000ng
Alienware 16 Area-51 Core Ultra 9 290HX Plus: Intel Core Ultra 9 290HX Plus, 16.00", 3.3 kg
» Le mode Overdrive de l'Alienware 16, très bruyant, n'est pas nécessaire pour les jeux
» Le Core Ultra 9 290HX Plus est l'un des processeurs mobiles les plus chauds, avec plus de 100 °C sous charge
» Le nouvel Alienware 16 équipé d'un Core Ultra 9 290HX Plus est incroyablement rapide, mais il n'est pas sans conséquences
» La nouvelle option OLED est exactement ce dont l'Alienware 16 avait besoin s'il n'y avait pas un gros problème
Lenovo ThinkPad T16g Gen 3 RTX 5080: Intel Core Ultra 9 275HX, 16.00", 2.6 kg
» Le ThinkPad T16g Gen 3 de Lenovo est équipé de Thunderbolt 5 et d'un écran Tandem OLED, mais seulement d'une version lente de la RTX 5080
Asus ROG NUC 15-90AS00I1: Intel Core Ultra 9 275HX, 3 kg
» Le ROG NUC 15 d'Asus impressionne et prend la tête des mini PC de jeu - Le duo Intel-Nvidia offre des performances haut de gamme
Lenovo Legion 9 18IAX10: Intel Core Ultra 9 275HX, 18.00", 3.5 kg
» Le sous-estimé Lenovo Legion 9 18 offre plus d'options de mise à niveau que les ordinateurs portables de Razer, MSI et d'autres
» Les performances du Lenovo Legion 9 18 chutent de plus de 20 % s'il est réglé sur le mode équilibré
Alienware 16 Area-51: Intel Core Ultra 9 275HX, 16.00", 3.3 kg
» La taille compte toujours : L'Alienware 16 Area-51 RTX 5080 peut surpasser le Razer Blade 16 RTX 5090
» L'Alienware 16 Area-51 verrouille son mode graphique TGP de 175 W le plus rapide derrière le réglage du ventilateur le plus bruyant
MSI Raider A18 HX A9WIG-080: AMD Ryzen 9 9955HX3D, 18.00", 3.6 kg
» Ordinateurs portables de 18 pouces : Cette catégorie ne devrait pas se limiter aux ordinateurs portables de jeu comme le MSI Raider A18
Asus ROG Zephyrus G14 2025 GA403WW: AMD Ryzen AI 9 HX 370, 14.00", 1.6 kg
» Asus ROG Zephyrus G14 : Le 14 pouces le plus rapide pour les joueurs, mais l'absence de 5090 est une occasion manquée