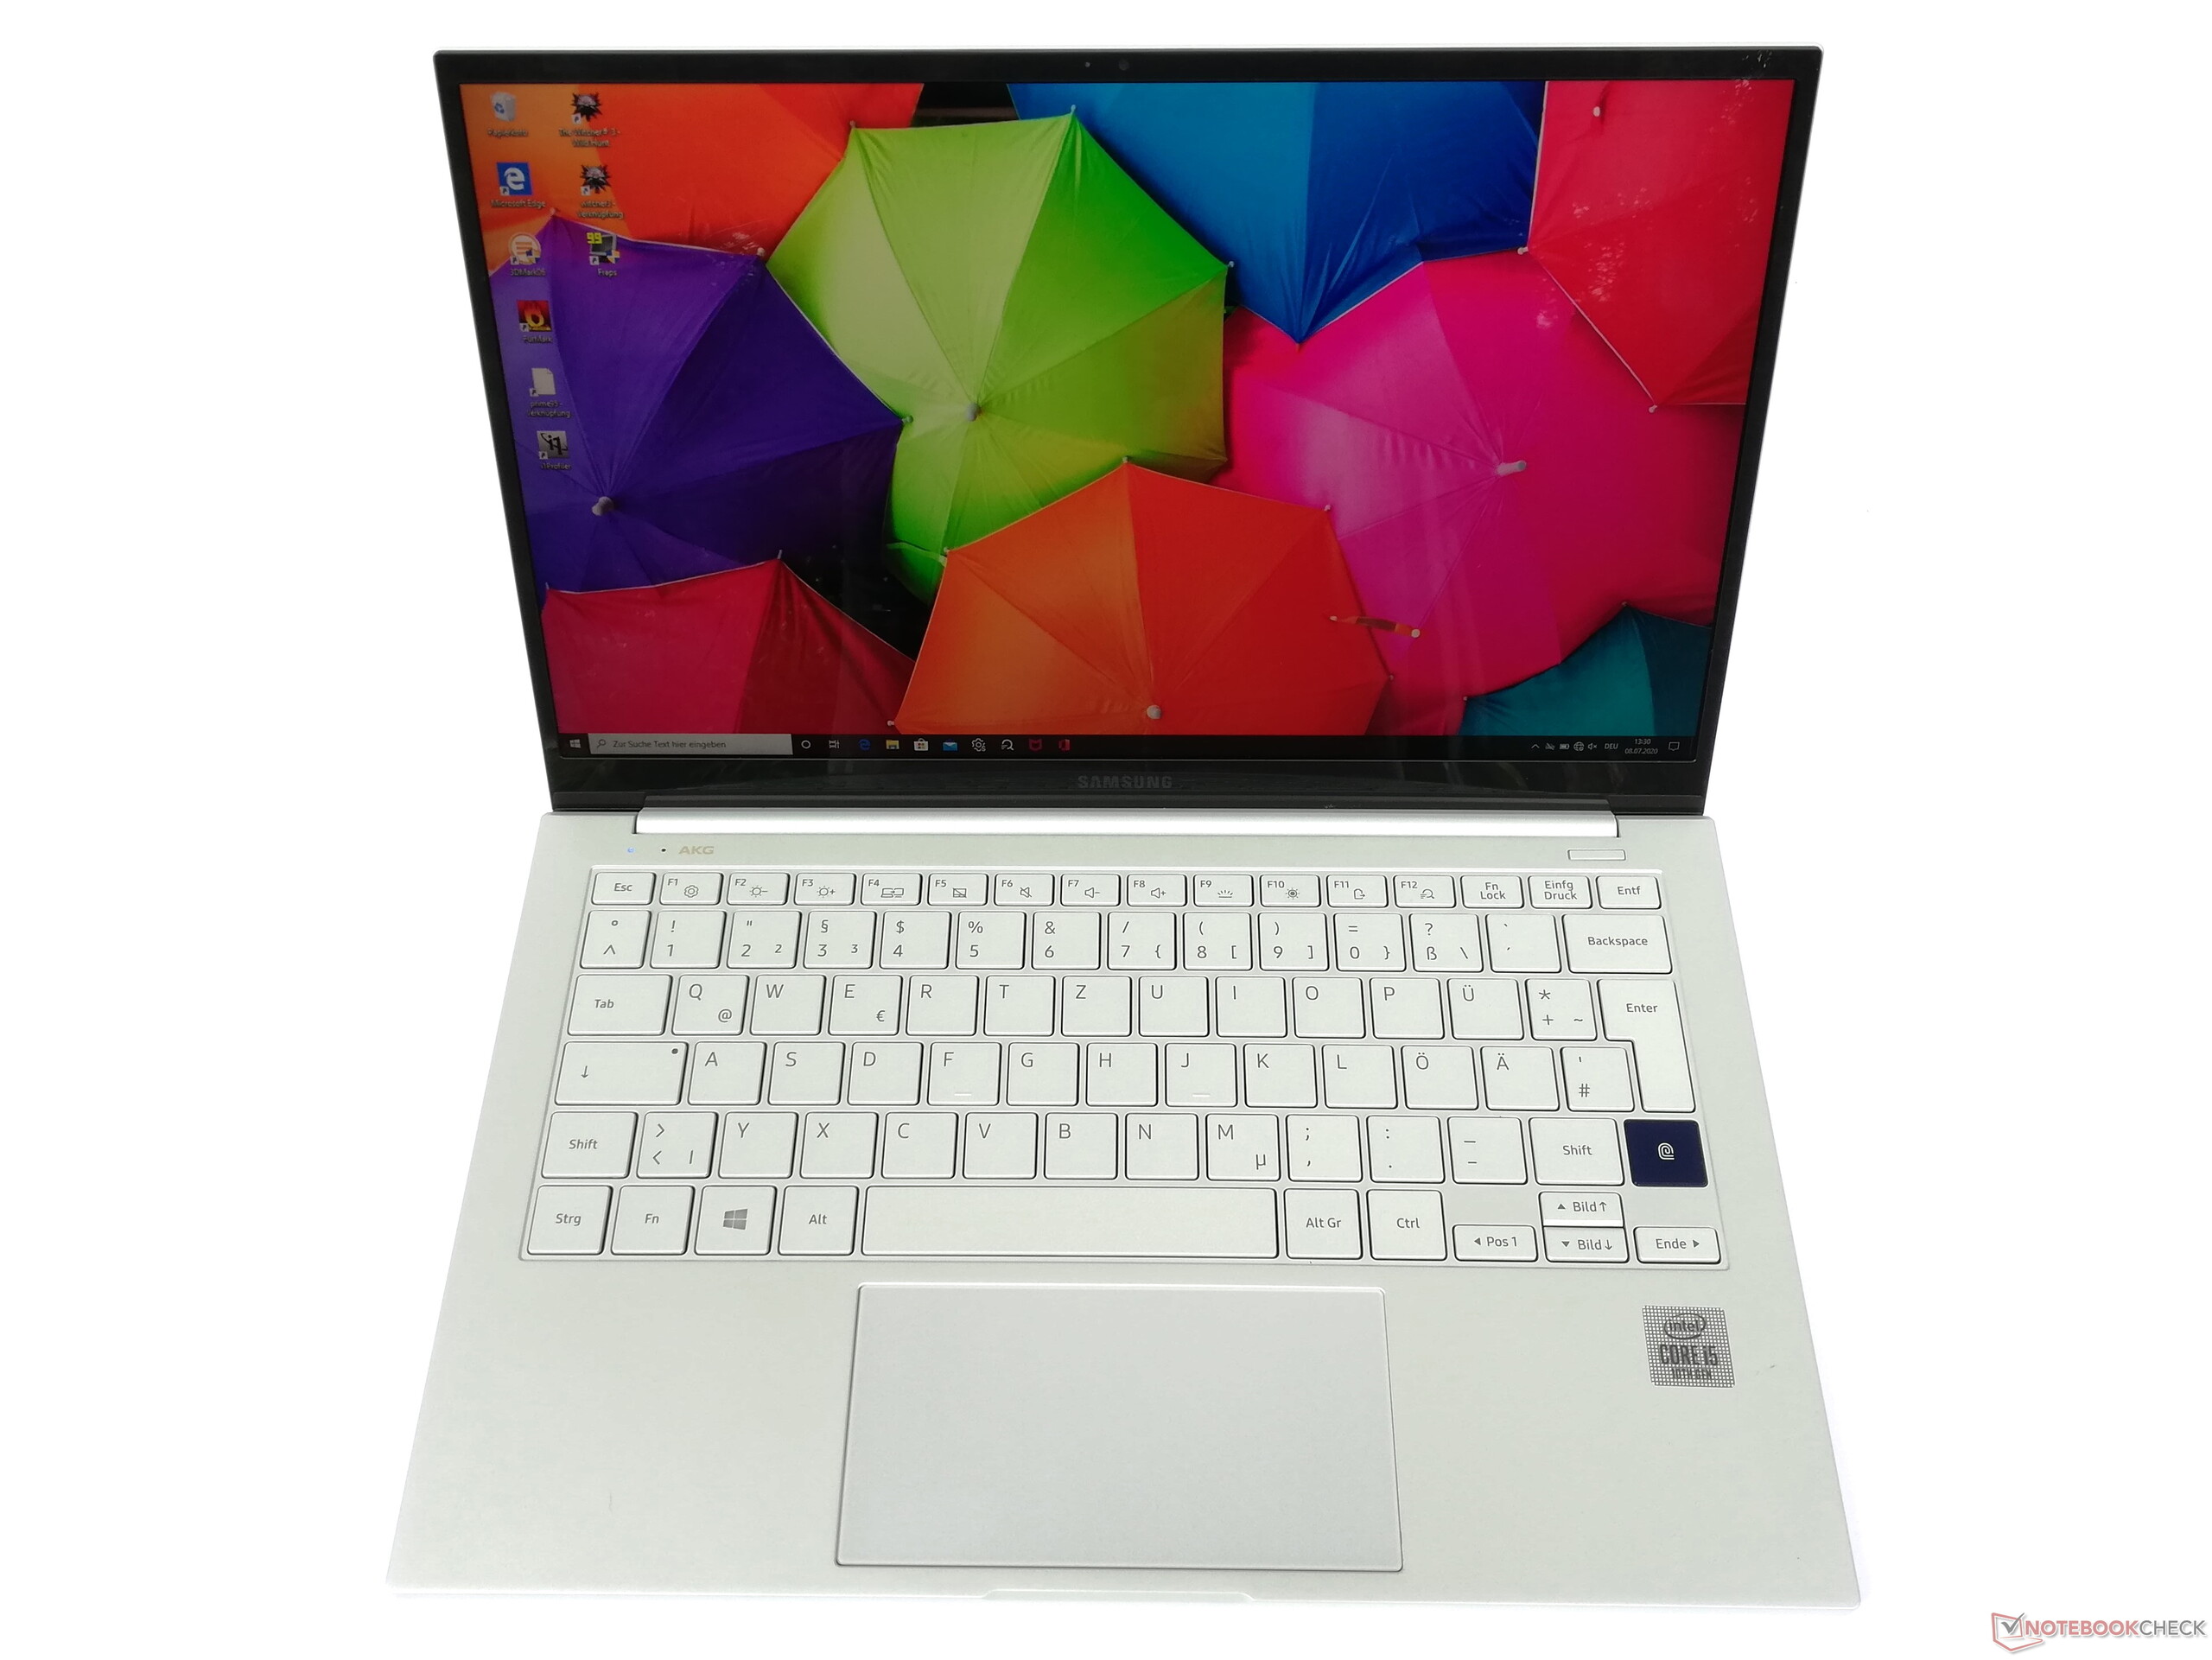
Test du Samsung Galaxy Book Ion 13.3 (i5-10210U, UHD 620, FHD, HDR) : ultrabook avec écran QLED
Note | Date | Modèle | Poids | Épaisseur | Taille | Résolution | Prix |
|---|---|---|---|---|---|---|---|
| 83.8 % v7 (old) | 09/20 | Samsung Galaxy Book Ion 13.3 i5-10210U, UHD Graphics 620 | 970 g | 12.9 mm | 13.30" | 1920x1080 | |
| 83.7 % v7 (old) | Fujitsu Lifebook U939 i5 i5-8265U, UHD Graphics 620 | 900 g | 15 mm | 13.30" | 1920x1080 | ||
| 84 % v7 (old) | 08/20 | Huawei MateBook 13 2020 AMD R5 3500U, Vega 8 | 1.3 kg | 14.9 mm | 13.00" | 2160x1440 | |
| 84.4 % v7 (old) | 07/20 | Huawei MateBook 13 2020 i5 i5-10210U, UHD Graphics 620 | 1.3 kg | 14.9 mm | 13.00" | 2160x1440 | |
| 85.9 % v7 (old) | 07/20 | Acer Swift 3 SF313-52-52AS i5-1035G4, Iris Plus Graphics G4 (Ice Lake 48 EU) | 1.2 kg | 16.6 mm | 13.50" | 2256x1504 |


| SD Card Reader | |
| average JPG Copy Test (av. of 3 runs) | |
| Fujitsu Lifebook U939 i5 (Toshiba Exceria Pro SDXC 64 GB UHS-II) | |
| Moyenne de la classe Subnotebook (23.7 - 188, n=9, 2 dernières années) | |
| Samsung Galaxy Book Ion 13.3 (Toshiba Exceria Pro M501 microSDXC 64GB) | |
| maximum AS SSD Seq Read Test (1GB) | |
| Fujitsu Lifebook U939 i5 (Toshiba Exceria Pro SDXC 64 GB UHS-II) | |
| Moyenne de la classe Subnotebook (24.9 - 195, n=8, 2 dernières années) | |
| Samsung Galaxy Book Ion 13.3 (Toshiba Exceria Pro M501 microSDXC 64GB) | |
| Networking | |
| iperf3 transmit AX12 | |
| Moyenne Intel Wi-Fi 6 AX201 (49.8 - 1775, n=324) | |
| Huawei MateBook 13 2020 i5 | |
| Acer Swift 3 SF313-52-52AS | |
| Fujitsu Lifebook U939 i5 | |
| Samsung Galaxy Book Ion 13.3 | |
| iperf3 receive AX12 | |
| Moyenne Intel Wi-Fi 6 AX201 (136 - 1743, n=324) | |
| Acer Swift 3 SF313-52-52AS | |
| Samsung Galaxy Book Ion 13.3 | |
| Fujitsu Lifebook U939 i5 | |
| Huawei MateBook 13 2020 i5 | |


| |||||||||||||||||||||||||
Homogénéité de la luminosité: 88 %
Valeur mesurée au centre, sur batterie: 470 cd/m²
Contraste: 1610:1 (Valeurs des noirs: 0.29 cd/m²)
ΔE ColorChecker Calman: 4.73 | ∀{0.5-29.43 Ø4.73}
ΔE Greyscale Calman: 4.33 | ∀{0.09-98 Ø4.97}
Gamma: 2.34
CCT: 6954 K
| Samsung Galaxy Book Ion 13.3 BOE087A, IPS (QLED), 1920x1080, 13.3" | Fujitsu Lifebook U939 i5 Sharp SHP14BD, IPS, 1920x1080, 13.3" | Huawei MateBook 13 2020 i5 CMN8201 P130ZFA-BA1, IPS, 2160x1440, 13" | Acer Swift 3 SF313-52-52AS BOE08BC, IPS, 2256x1504, 13.5" | |
|---|---|---|---|---|
| Display | ||||
| Display P3 Coverage (%) | 65.3 | 67.9 | 70.3 | |
| sRGB Coverage (%) | 95 | 98.5 | 99.8 | |
| AdobeRGB 1998 Coverage (%) | 66 | 69.6 | 71.3 | |
| Response Times | -10% | 14% | -7% | |
| Response Time Grey 50% / Grey 80% * (ms) | 47 ? | 55.2 ? -17% | 41.6 ? 11% | 50 ? -6% |
| Response Time Black / White * (ms) | 29 ? | 29.6 ? -2% | 24 ? 17% | 31 ? -7% |
| PWM Frequency (Hz) | 211.9 ? | 62500 ? | 192 ? | |
| Screen | -21% | -29% | -8% | |
| Brightness middle (cd/m²) | 467 | 384 -18% | 427 -9% | 456 -2% |
| Brightness (cd/m²) | 437 | 362 -17% | 415 -5% | 432 -1% |
| Brightness Distribution (%) | 88 | 90 2% | 94 7% | 88 0% |
| Black Level * (cd/m²) | 0.29 | 0.31 -7% | 0.41 -41% | 0.32 -10% |
| Contrast (:1) | 1610 | 1239 -23% | 1041 -35% | 1425 -11% |
| Colorchecker dE 2000 * | 4.73 | 4.8 -1% | 4.4 7% | 3.49 26% |
| Colorchecker dE 2000 max. * | 6.07 | 9.4 -55% | 11 -81% | 8.4 -38% |
| Greyscale dE 2000 * | 4.33 | 6.6 -52% | 7.5 -73% | 5.53 -28% |
| Gamma | 2.34 94% | 2.2 100% | 2.16 102% | 2.41 91% |
| CCT | 6954 93% | 7999 81% | 6642 98% | 6675 97% |
| Colorchecker dE 2000 calibrated * | 1.4 | 1.1 | 0.72 | |
| Color Space (Percent of AdobeRGB 1998) (%) | 61.2 | 64 | 65 | |
| Color Space (Percent of sRGB) (%) | 95 | 98.6 | 100 | |
| Moyenne finale (programmes/paramètres) | -16% /
-19% | -8% /
-20% | -8% /
-8% |
* ... Moindre est la valeur, meilleures sont les performances
Temps de réponse de l'écran
| ↔ Temps de réponse noir à blanc | ||
|---|---|---|
| 29 ms ... hausse ↗ et chute ↘ combinées | ↗ 18 ms hausse | 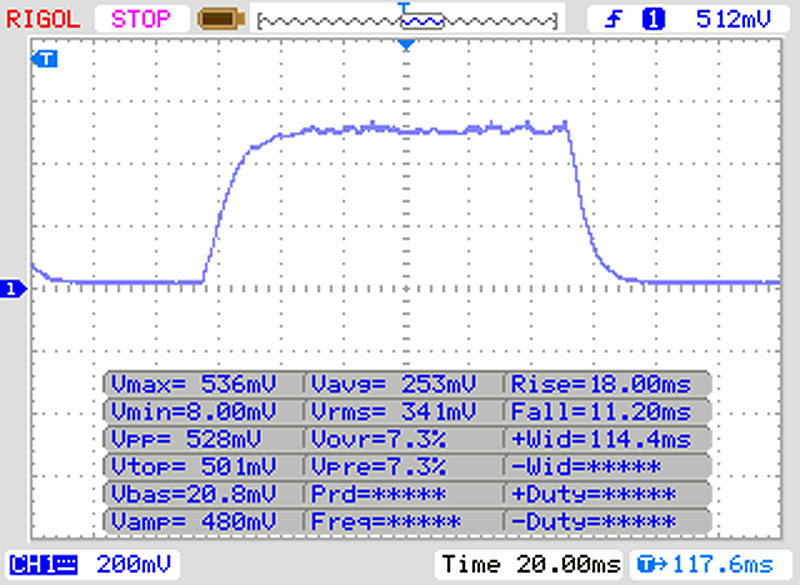 |
| ↘ 11 ms chute | ||
| L'écran souffre de latences relativement élevées, insuffisant pour le jeu. En comparaison, tous les appareils testés affichent entre 0.1 (minimum) et 240 (maximum) ms. » 77 % des appareils testés affichent de meilleures performances. Cela signifie que les latences relevées sont moins bonnes que la moyenne (19.9 ms) de tous les appareils testés. | ||
| ↔ Temps de réponse gris 50% à gris 80% | ||
| 47 ms ... hausse ↗ et chute ↘ combinées | ↗ 22 ms hausse | 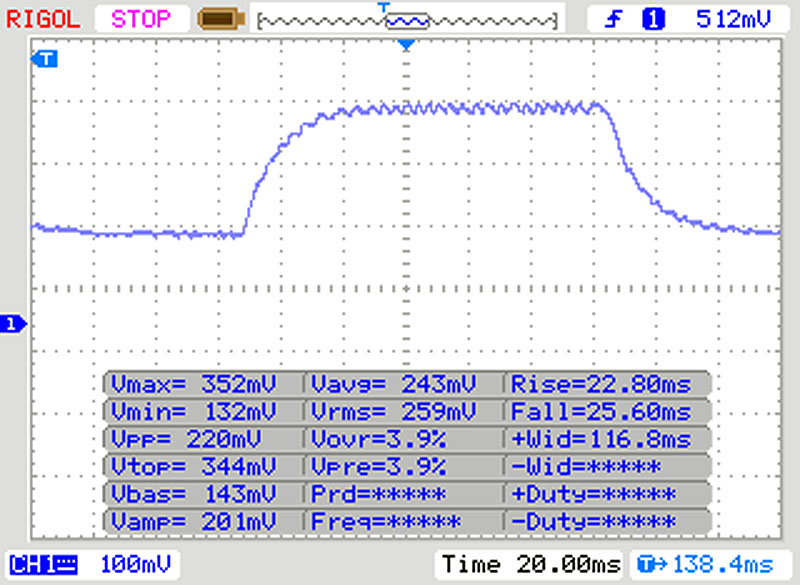 |
| ↘ 25 ms chute | ||
| L'écran souffre de latences très élevées, à éviter pour le jeu. En comparaison, tous les appareils testés affichent entre 0.165 (minimum) et 636 (maximum) ms. » 81 % des appareils testés affichent de meilleures performances. Cela signifie que les latences relevées sont moins bonnes que la moyenne (31.1 ms) de tous les appareils testés. | ||
Scintillement / MLI (Modulation de largeur d'impulsion)
| Scintillement / MLI (Modulation de largeur d'impulsion) non décelé | 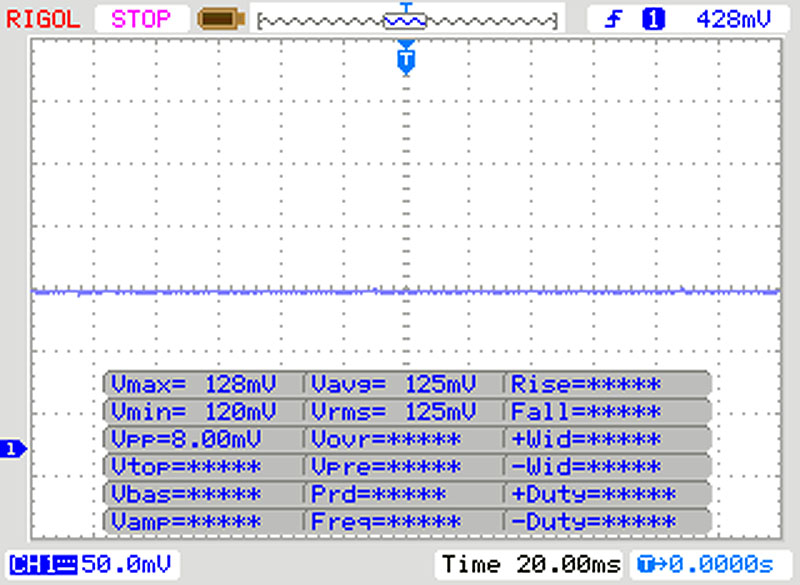 | ||
En comparaison, 52 % des appareils testés n'emploient pas MDI pour assombrir leur écran. Nous avons relevé une moyenne à 7798 (minimum : 5 - maximum : 343500) Hz dans le cas où une MDI était active. | |||
Cinebench R15: CPU Single 64Bit | CPU Multi 64Bit
Blender: v2.79 BMW27 CPU
7-Zip 18.03: 7z b 4 -mmt1 | 7z b 4
Geekbench 5.5: Single-Core | Multi-Core
HWBOT x265 Benchmark v2.2: 4k Preset
LibreOffice : 20 Documents To PDF
R Benchmark 2.5: Overall mean
| Cinebench R20 / CPU (Single Core) | |
| Moyenne de la classe Subnotebook (128 - 832, n=58, 2 dernières années) | |
| Huawei MateBook 13 2020 i5 | |
| Samsung Galaxy Book Ion 13.3 | |
| Moyenne Intel Core i5-10210U (322 - 428, n=30) | |
| Fujitsu Lifebook U939 i5 | |
| Huawei MateBook 13 2020 AMD | |
| Acer Swift 3 SF313-52-52AS | |
| Acer Swift 3 SF313-52-52AS | |
| Cinebench R20 / CPU (Multi Core) | |
| Moyenne de la classe Subnotebook (579 - 8541, n=58, 2 dernières années) | |
| Huawei MateBook 13 2020 AMD | |
| Huawei MateBook 13 2020 i5 | |
| Moyenne Intel Core i5-10210U (722 - 1820, n=30) | |
| Samsung Galaxy Book Ion 13.3 | |
| Fujitsu Lifebook U939 i5 | |
| Acer Swift 3 SF313-52-52AS | |
| Acer Swift 3 SF313-52-52AS | |
| Cinebench R15 / CPU Single 64Bit | |
| Moyenne de la classe Subnotebook (72.4 - 322, n=58, 2 dernières années) | |
| Huawei MateBook 13 2020 i5 | |
| Moyenne Intel Core i5-10210U (134 - 174, n=35) | |
| Samsung Galaxy Book Ion 13.3 | |
| Fujitsu Lifebook U939 i5 | |
| Acer Swift 3 SF313-52-52AS | |
| Huawei MateBook 13 2020 AMD | |
| Cinebench R15 / CPU Multi 64Bit | |
| Moyenne de la classe Subnotebook (327 - 3345, n=58, 2 dernières années) | |
| Huawei MateBook 13 2020 i5 | |
| Huawei MateBook 13 2020 AMD | |
| Moyenne Intel Core i5-10210U (320 - 790, n=35) | |
| Fujitsu Lifebook U939 i5 | |
| Acer Swift 3 SF313-52-52AS | |
| Samsung Galaxy Book Ion 13.3 | |
| Blender / v2.79 BMW27 CPU | |
| Acer Swift 3 SF313-52-52AS | |
| Acer Swift 3 SF313-52-52AS | |
| Samsung Galaxy Book Ion 13.3 | |
| Fujitsu Lifebook U939 i5 | |
| Moyenne Intel Core i5-10210U (585 - 1339, n=24) | |
| Huawei MateBook 13 2020 i5 | |
| Huawei MateBook 13 2020 AMD | |
| Moyenne de la classe Subnotebook (159 - 2271, n=59, 2 dernières années) | |
| 7-Zip 18.03 / 7z b 4 -mmt1 | |
| Moyenne de la classe Subnotebook (2643 - 6699, n=60, 2 dernières années) | |
| Huawei MateBook 13 2020 i5 | |
| Samsung Galaxy Book Ion 13.3 | |
| Moyenne Intel Core i5-10210U (3504 - 4467, n=24) | |
| Acer Swift 3 SF313-52-52AS | |
| Acer Swift 3 SF313-52-52AS | |
| Fujitsu Lifebook U939 i5 | |
| Huawei MateBook 13 2020 AMD | |
| 7-Zip 18.03 / 7z b 4 | |
| Moyenne de la classe Subnotebook (11668 - 77867, n=58, 2 dernières années) | |
| Moyenne Intel Core i5-10210U (10920 - 21679, n=24) | |
| Huawei MateBook 13 2020 i5 | |
| Huawei MateBook 13 2020 AMD | |
| Fujitsu Lifebook U939 i5 | |
| Samsung Galaxy Book Ion 13.3 | |
| Acer Swift 3 SF313-52-52AS | |
| Acer Swift 3 SF313-52-52AS | |
| Geekbench 5.5 / Single-Core | |
| Moyenne de la classe Subnotebook (726 - 2224, n=49, 2 dernières années) | |
| Huawei MateBook 13 2020 i5 | |
| Acer Swift 3 SF313-52-52AS | |
| Acer Swift 3 SF313-52-52AS | |
| Samsung Galaxy Book Ion 13.3 | |
| Moyenne Intel Core i5-10210U (949 - 1133, n=27) | |
| Fujitsu Lifebook U939 i5 | |
| Huawei MateBook 13 2020 AMD | |
| Geekbench 5.5 / Multi-Core | |
| Moyenne de la classe Subnotebook (2557 - 17218, n=49, 2 dernières années) | |
| Huawei MateBook 13 2020 i5 | |
| Samsung Galaxy Book Ion 13.3 | |
| Moyenne Intel Core i5-10210U (2079 - 4256, n=27) | |
| Fujitsu Lifebook U939 i5 | |
| Acer Swift 3 SF313-52-52AS | |
| Acer Swift 3 SF313-52-52AS | |
| Huawei MateBook 13 2020 AMD | |
| HWBOT x265 Benchmark v2.2 / 4k Preset | |
| Moyenne de la classe Subnotebook (0.97 - 25.1, n=58, 2 dernières années) | |
| Huawei MateBook 13 2020 i5 | |
| Moyenne Intel Core i5-10210U (2.36 - 6.28, n=24) | |
| Fujitsu Lifebook U939 i5 | |
| Samsung Galaxy Book Ion 13.3 | |
| Acer Swift 3 SF313-52-52AS | |
| Acer Swift 3 SF313-52-52AS | |
| Huawei MateBook 13 2020 AMD | |
| LibreOffice / 20 Documents To PDF | |
| Huawei MateBook 13 2020 AMD | |
| Acer Swift 3 SF313-52-52AS | |
| Acer Swift 3 SF313-52-52AS | |
| Moyenne Intel Core i5-10210U (49.6 - 80.3, n=18) | |
| Fujitsu Lifebook U939 i5 | |
| Huawei MateBook 13 2020 i5 | |
| Moyenne de la classe Subnotebook (39.9 - 220, n=57, 2 dernières années) | |
| Samsung Galaxy Book Ion 13.3 | |
| R Benchmark 2.5 / Overall mean | |
| Acer Swift 3 SF313-52-52AS | |
| Acer Swift 3 SF313-52-52AS | |
| Huawei MateBook 13 2020 AMD | |
| Moyenne Intel Core i5-10210U (0.658 - 0.901, n=24) | |
| Fujitsu Lifebook U939 i5 | |
| Samsung Galaxy Book Ion 13.3 | |
| Huawei MateBook 13 2020 i5 | |
| Moyenne de la classe Subnotebook (0.4024 - 1.456, n=59, 2 dernières années) | |
* ... Moindre est la valeur, meilleures sont les performances
| DPC Latencies / LatencyMon - interrupt to process latency (max), Web, Youtube, Prime95 | |
| Acer Swift 3 SF313-52-52AS | |
| Samsung Galaxy Book Ion 13.3 | |
| Huawei MateBook 13 2020 i5 | |
| Huawei MateBook 13 2020 AMD | |
| Fujitsu Lifebook U939 i5 | |
* ... Moindre est la valeur, meilleures sont les performances
| Samsung Galaxy Book Ion 13.3 Samsung SSD PM981a MZVLB256HBHQ | Fujitsu Lifebook U939 i5 Samsung SSD PM981 MZVLB512HAJQ | Huawei MateBook 13 2020 AMD WDC PC SN730 SDBPNTY-512G | Huawei MateBook 13 2020 i5 WDC PC SN730 SDBPNTY-512G | Acer Swift 3 SF313-52-52AS SK Hynix BC501 HFM512GDJTNG | Moyenne Samsung SSD PM981a MZVLB256HBHQ | |
|---|---|---|---|---|---|---|
| CrystalDiskMark 5.2 / 6 | -10% | -18% | -6% | -29% | -8% | |
| Write 4K (MB/s) | 159.6 | 159 0% | 143.9 -10% | 190.5 19% | 120.6 -24% | 135.2 ? -15% |
| Read 4K (MB/s) | 48.22 | 48.12 0% | 45.91 -5% | 53.7 11% | 46.88 -3% | 44.6 ? -8% |
| Write Seq (MB/s) | 2343 | 1657 -29% | 1307 -44% | 1436 -39% | 1044 -55% | 2091 ? -11% |
| Read Seq (MB/s) | 2184 | 1522 -30% | 1435 -34% | 1356 -38% | 1147 -47% | 2097 ? -4% |
| Write 4K Q32T1 (MB/s) | 342.2 | 349.2 2% | 237.1 -31% | 382.5 12% | 332.4 -3% | 370 ? 8% |
| Read 4K Q32T1 (MB/s) | 485.4 | 452.2 -7% | 332.7 -31% | 502 3% | 443.3 -9% | 372 ? -23% |
| Write Seq Q32T1 (MB/s) | 2354 | 1941 -18% | 2698 15% | 2114 -10% | 1052 -55% | 2308 ? -2% |
| Read Seq Q32T1 (MB/s) | 3555 | 3510 -1% | 3394 -5% | 3410 -4% | 2171 -39% | 3395 ? -5% |
| AS SSD | 74% | 58% | 98% | 9% | 19% | |
| Seq Read (MB/s) | 2980 | 2677 -10% | 2844 -5% | 2912 -2% | 1370 -54% | 2276 ? -24% |
| Seq Write (MB/s) | 2175 | 1819 -16% | 2316 6% | 2190 1% | 1019 -53% | 1486 ? -32% |
| 4K Read (MB/s) | 52.8 | 53.7 2% | 40.76 -23% | 49.52 -6% | 50.8 -4% | 49.6 ? -6% |
| 4K Write (MB/s) | 147.8 | 145.8 -1% | 96.9 -34% | 167.1 13% | 111.2 -25% | 129.5 ? -12% |
| 4K-64 Read (MB/s) | 542 | 1202 122% | 1275 135% | 1447 167% | 770 42% | 683 ? 26% |
| 4K-64 Write (MB/s) | 282.4 | 1290 357% | 1156 309% | 1513 436% | 713 152% | 895 ? 217% |
| Access Time Read * (ms) | 0.077 | 0.044 43% | 0.074 4% | 0.05 35% | 0.06433 ? 16% | |
| Access Time Write * (ms) | 0.025 | 0.026 -4% | 0.039 -56% | 0.023 8% | 0.034 -36% | 0.04793 ? -92% |
| Score Read (Points) | 893 | 1523 71% | 1600 79% | 1787 100% | 958 7% | 960 ? 8% |
| Score Write (Points) | 648 | 1618 150% | 1485 129% | 1899 193% | 926 43% | 1173 ? 81% |
| Score Total (Points) | 1974 | 3887 97% | 3879 97% | 4569 131% | 2370 20% | 2598 ? 32% |
| Moyenne finale (programmes/paramètres) | 32% /
38% | 20% /
26% | 46% /
54% | -10% /
-8% | 6% /
8% |
* ... Moindre est la valeur, meilleures sont les performances

Sustained Read: DiskSpd Read Loop, Queue Depth 8
| 3DMark 11 - 1280x720 Performance GPU | |
| Moyenne de la classe Subnotebook (995 - 18489, n=56, 2 dernières années) | |
| Huawei MateBook 13 2020 AMD | |
| Acer Swift 3 SF313-52-52AS | |
| Huawei MateBook 13 2020 i5 | |
| Moyenne Intel UHD Graphics 620 (1144 - 3432, n=244) | |
| Fujitsu Lifebook U939 i5 | |
| Samsung Galaxy Book Ion 13.3 | |
| 3DMark 11 Performance | 1858 points | |
| 3DMark Fire Strike Score | 1004 points | |
| 3DMark Time Spy Score | 404 points | |
Aide | ||
| The Witcher 3 - 1024x768 Low Graphics & Postprocessing | |
| Moyenne de la classe Subnotebook (38.8 - 176, n=14, 2 dernières années) | |
| Huawei MateBook 13 2020 AMD | |
| Huawei MateBook 13 2020 i5 | |
| Moyenne Intel UHD Graphics 620 (8.8 - 50.9, n=64) | |
| Samsung Galaxy Book Ion 13.3 | |
| Fujitsu Lifebook U939 i5 | |
| Bas | Moyen | Élevé | Ultra | |
|---|---|---|---|---|
| The Witcher 3 (2015) | 16.16 | |||
| Dota 2 Reborn (2015) | 60.9 | 34.8 | 16.8 | 15.3 |
| X-Plane 11.11 (2018) | 14.5 | 10.2 | 9.45 | |
| Far Cry 5 (2018) | 11 |
Degré de la nuisance sonore
| Au repos |
| 30.7 / 30.7 / 30.7 dB(A) |
| Fortement sollicité |
| 36.6 / 36.3 dB(A) |
 | ||
30 dB silencieux 40 dB(A) audible 50 dB(A) bruyant |
||
min: | ||
(±) La température maximale du côté supérieur est de 41.8 °C / 107 F, par rapport à la moyenne de 35.9 °C / 97 F, allant de 21.4 à 59 °C pour la classe Subnotebook.
(±) Le fond chauffe jusqu'à un maximum de 43 °C / 109 F, contre une moyenne de 39.2 °C / 103 F
(+) En utilisation inactive, la température moyenne du côté supérieur est de 25.8 °C / 78 F, par rapport à la moyenne du dispositif de 30.8 °C / 87 F.
(±) En jouant à The Witcher 3, la température moyenne du côté supérieur est de 34.8 °C / 95 F, alors que la moyenne de l'appareil est de 30.8 °C / 87 F.
(+) Les repose-poignets et le pavé tactile sont plus froids que la température de la peau avec un maximum de 31.5 °C / 88.7 F et sont donc froids au toucher.
(-) La température moyenne de la zone de l'appui-paume de dispositifs similaires était de 28.2 °C / 82.8 F (-3.3 °C / #-5.9 F).
Samsung Galaxy Book Ion 13.3 analyse audio
(-) | haut-parleurs pas très forts (67.8 dB)
Basses 100 - 315 Hz
(-) | presque aucune basse - en moyenne 19.3% plus bas que la médiane
(±) | la linéarité des basses est moyenne (12.6% delta à la fréquence précédente)
Médiums 400 - 2000 Hz
(+) | médiane équilibrée - seulement 2.7% de la médiane
(+) | les médiums sont linéaires (5.9% delta à la fréquence précédente)
Aiguës 2 - 16 kHz
(+) | des sommets équilibrés - à seulement 4.5% de la médiane
(+) | les aigus sont linéaires (6.1% delta à la fréquence précédente)
Globalement 100 - 16 000 Hz
(±) | la linéarité du son global est moyenne (21.5% de différence avec la médiane)
Par rapport à la même classe
» 73% de tous les appareils testés de cette catégorie étaient meilleurs, 5% similaires, 22% pires
» Le meilleur avait un delta de 5%, la moyenne était de 18%, le pire était de 53%.
Par rapport à tous les appareils testés
» 61% de tous les appareils testés étaient meilleurs, 7% similaires, 33% pires
» Le meilleur avait un delta de 4%, la moyenne était de 24%, le pire était de 134%.
Apple MacBook 12 (Early 2016) 1.1 GHz analyse audio
(+) | les haut-parleurs peuvent jouer relativement fort (83.6# dB)
Basses 100 - 315 Hz
(±) | basse réduite - en moyenne 11.3% inférieure à la médiane
(±) | la linéarité des basses est moyenne (14.2% delta à la fréquence précédente)
Médiums 400 - 2000 Hz
(+) | médiane équilibrée - seulement 2.4% de la médiane
(+) | les médiums sont linéaires (5.5% delta à la fréquence précédente)
Aiguës 2 - 16 kHz
(+) | des sommets équilibrés - à seulement 2% de la médiane
(+) | les aigus sont linéaires (4.5% delta à la fréquence précédente)
Globalement 100 - 16 000 Hz
(+) | le son global est linéaire (10.2% différence à la médiane)
Par rapport à la même classe
» 7% de tous les appareils testés de cette catégorie étaient meilleurs, 2% similaires, 91% pires
» Le meilleur avait un delta de 5%, la moyenne était de 18%, le pire était de 53%.
Par rapport à tous les appareils testés
» 5% de tous les appareils testés étaient meilleurs, 1% similaires, 94% pires
» Le meilleur avait un delta de 4%, la moyenne était de 24%, le pire était de 134%.
| Éteint/en veille | |
| Au repos | |
| Fortement sollicité |
|
Légende:
min: | |
| Samsung Galaxy Book Ion 13.3 i5-10210U, UHD Graphics 620, Samsung SSD PM981a MZVLB256HBHQ, IPS (QLED), 1920x1080, 13.3" | Fujitsu Lifebook U939 i5 i5-8265U, UHD Graphics 620, Samsung SSD PM981 MZVLB512HAJQ, IPS, 1920x1080, 13.3" | Huawei MateBook 13 2020 AMD R5 3500U, Vega 8, WDC PC SN730 SDBPNTY-512G, IPS, 2160x1440, 13" | Huawei MateBook 13 2020 i5 i5-10210U, UHD Graphics 620, WDC PC SN730 SDBPNTY-512G, IPS, 2160x1440, 13" | Acer Swift 3 SF313-52-52AS i5-1035G4, Iris Plus Graphics G4 (Ice Lake 48 EU), SK Hynix BC501 HFM512GDJTNG, IPS, 2256x1504, 13.5" | Moyenne Intel UHD Graphics 620 | Moyenne de la classe Subnotebook | |
|---|---|---|---|---|---|---|---|
| Power Consumption | -15% | -36% | -30% | 6% | -21% | -30% | |
| Idle Minimum * (Watt) | 2.2 | 3.1 -41% | 4.71 -114% | 2.97 -35% | 3 -36% | 3.81 ? -73% | 3.79 ? -72% |
| Idle Average * (Watt) | 5.9 | 5.9 -0% | 8.65 -47% | 7.5 -27% | 6.1 -3% | 6.94 ? -18% | 6.57 ? -11% |
| Idle Maximum * (Watt) | 8.9 | 9.2 -3% | 9.42 -6% | 9.6 -8% | 8.4 6% | 8.75 ? 2% | 7.94 ? 11% |
| Load Average * (Watt) | 46 | 35.8 22% | 34.23 26% | 38.9 15% | 25.7 44% | 35 ? 24% | 41.8 ? 9% |
| Witcher 3 ultra * (Watt) | 25.5 | ||||||
| Load Maximum * (Watt) | 34 | 51.9 -53% | 47.1 -39% | 66.7 -96% | 27.6 19% | 47.5 ? -40% | 64.1 ? -89% |
* ... Moindre est la valeur, meilleures sont les performances
| Samsung Galaxy Book Ion 13.3 i5-10210U, UHD Graphics 620, 66.9 Wh | Fujitsu Lifebook U939 i5 i5-8265U, UHD Graphics 620, 50 Wh | Huawei MateBook 13 2020 AMD R5 3500U, Vega 8, 41.7 Wh | Huawei MateBook 13 2020 i5 i5-10210U, UHD Graphics 620, 41.7 Wh | Acer Swift 3 SF313-52-52AS i5-1035G4, Iris Plus Graphics G4 (Ice Lake 48 EU), 54.5 Wh | Moyenne de la classe Subnotebook | |
|---|---|---|---|---|---|---|
| Autonomie de la batterie | -14% | -39% | -32% | 14% | 6% | |
| Reader / Idle (h) | 31.5 | 28.6 ? -9% | ||||
| WiFi v1.3 (h) | 9.5 | 8.2 -14% | 5.3 -44% | 7.4 -22% | 10.8 14% | 14 ? 47% |
| Load (h) | 2.4 | 1.6 -33% | 1.4 -42% | 1.946 ? -19% |
Points positifs
Points négatifs
Verdict
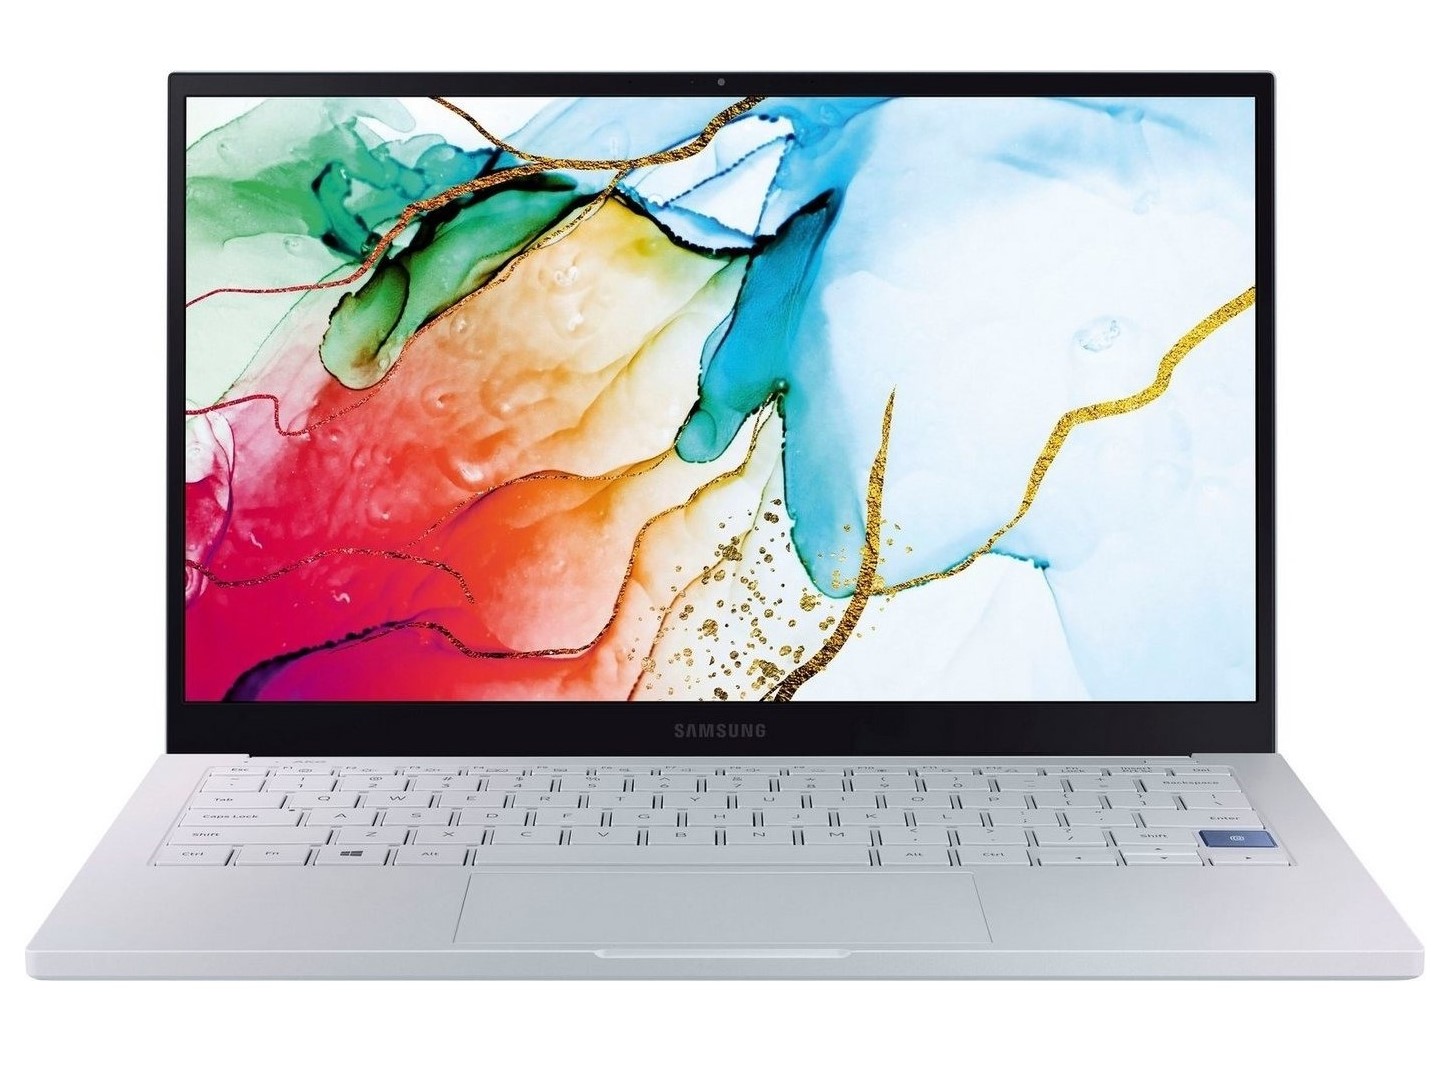
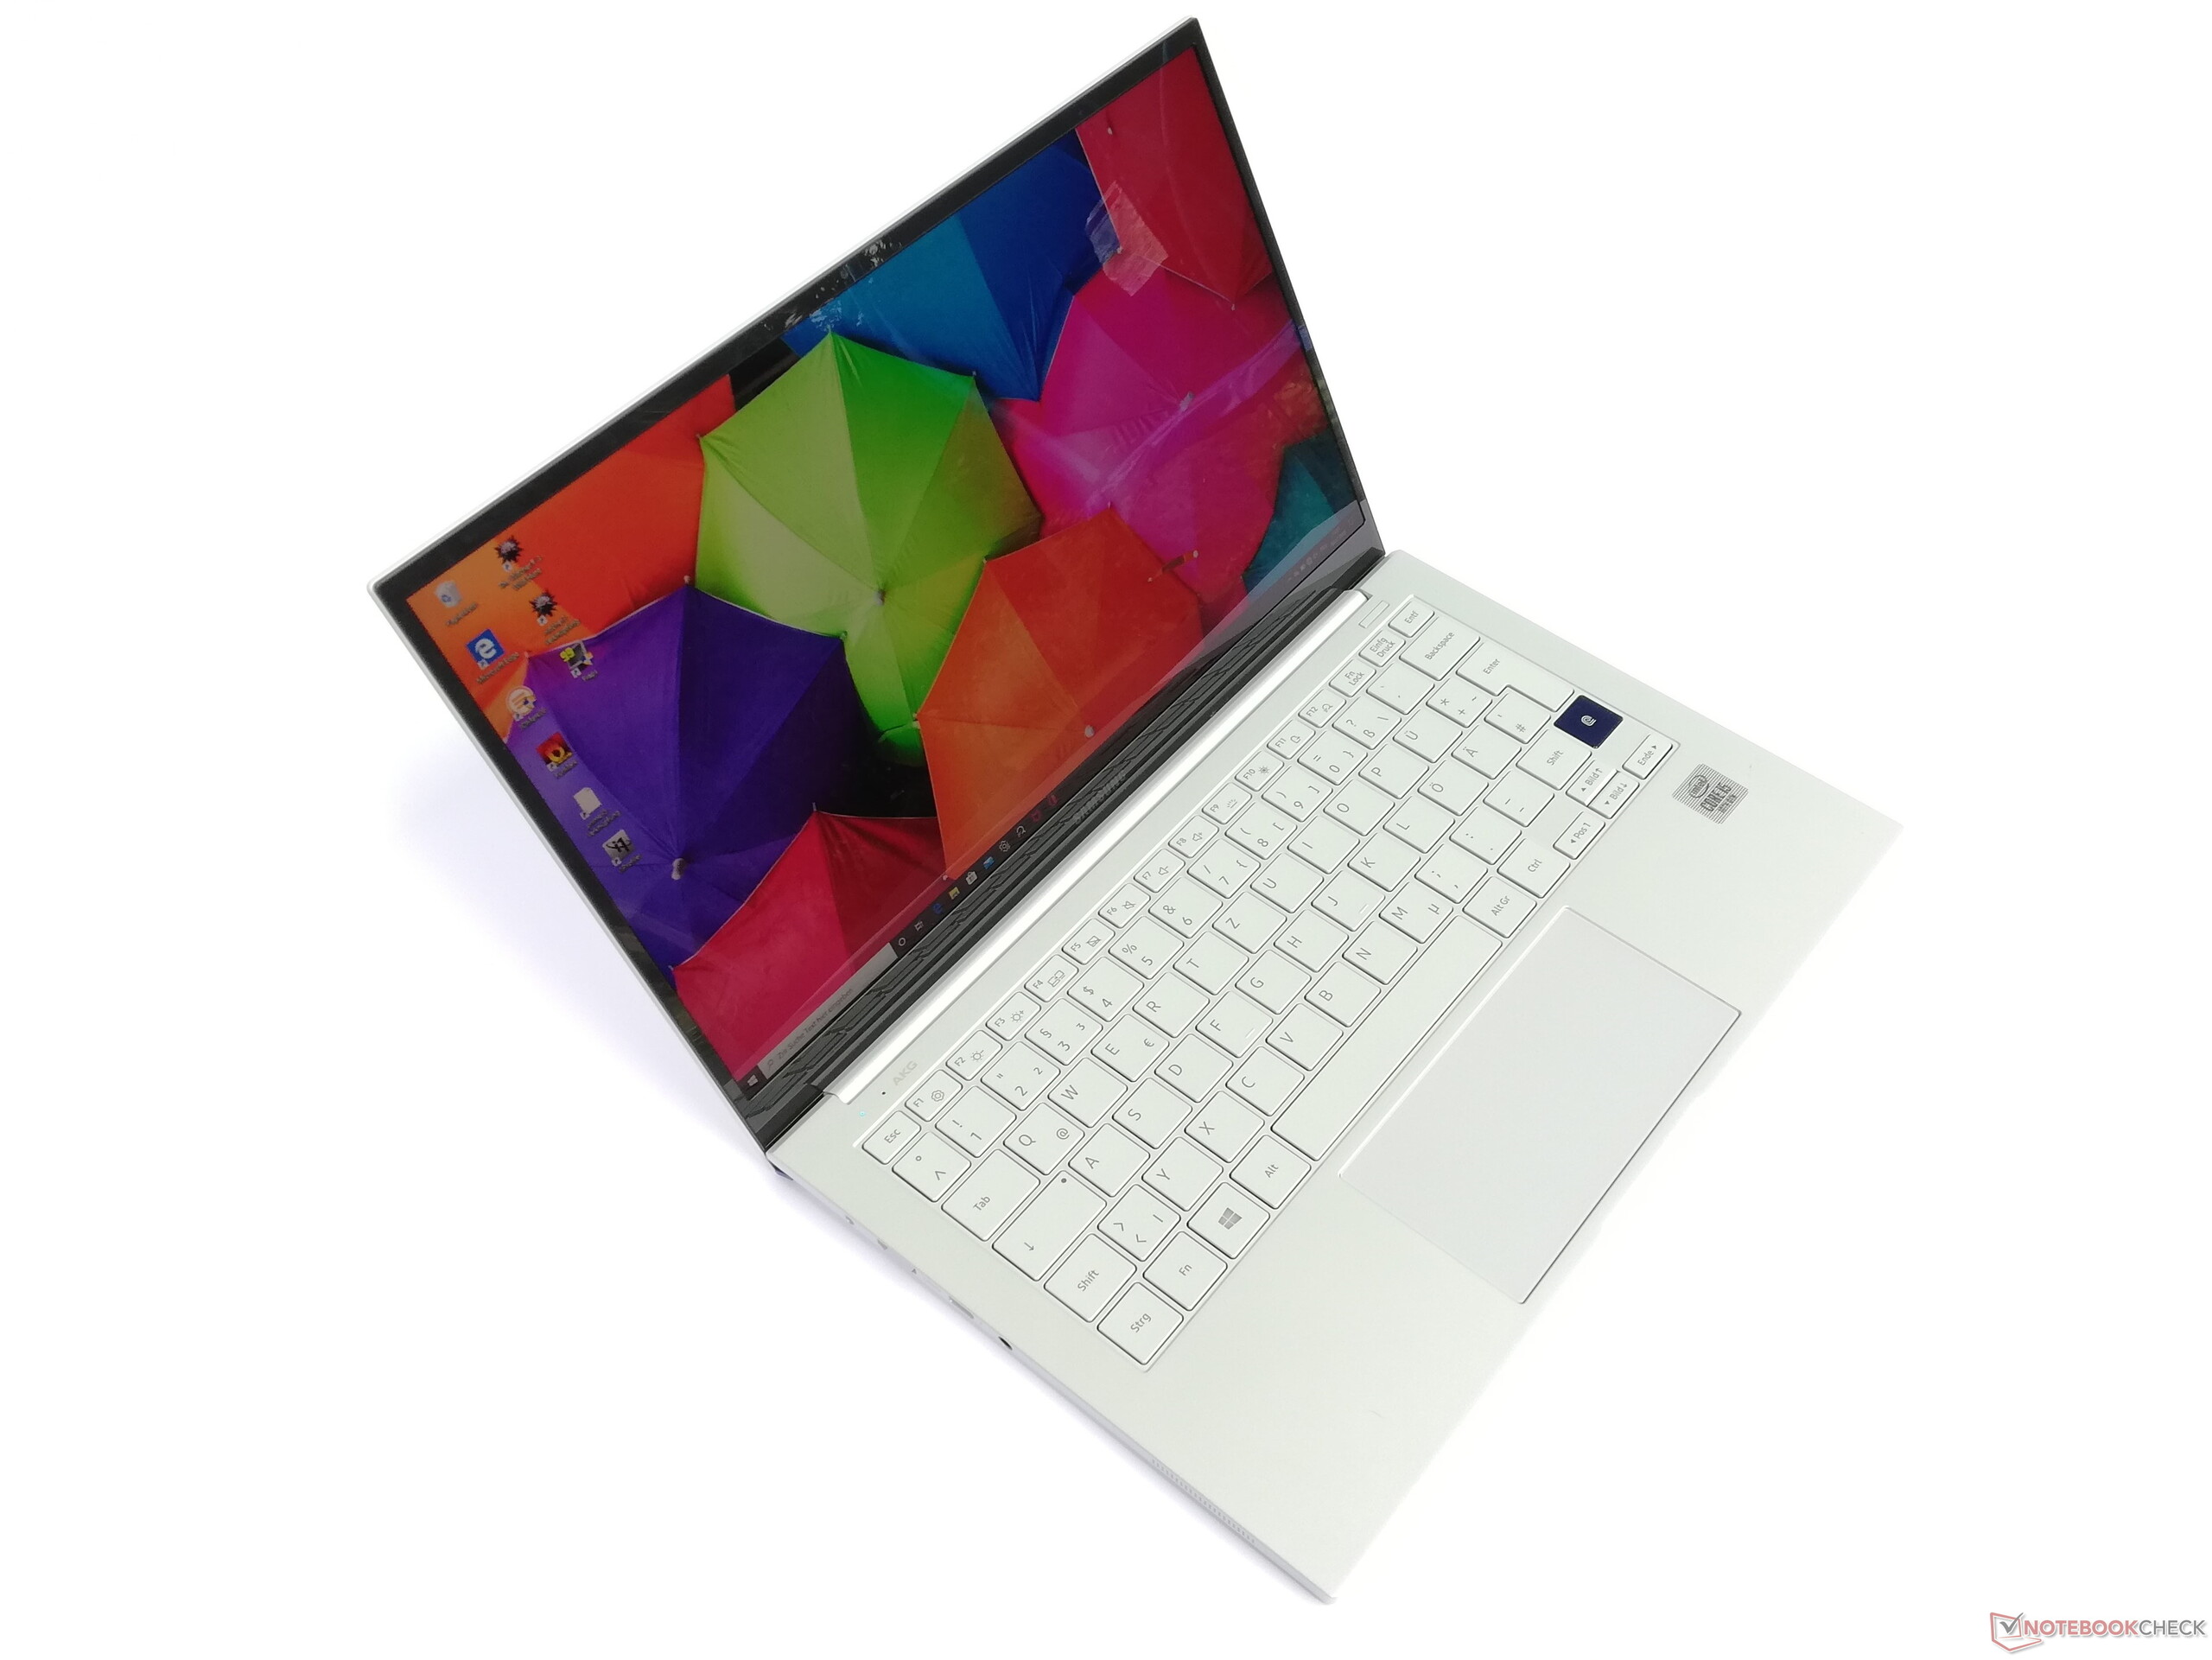
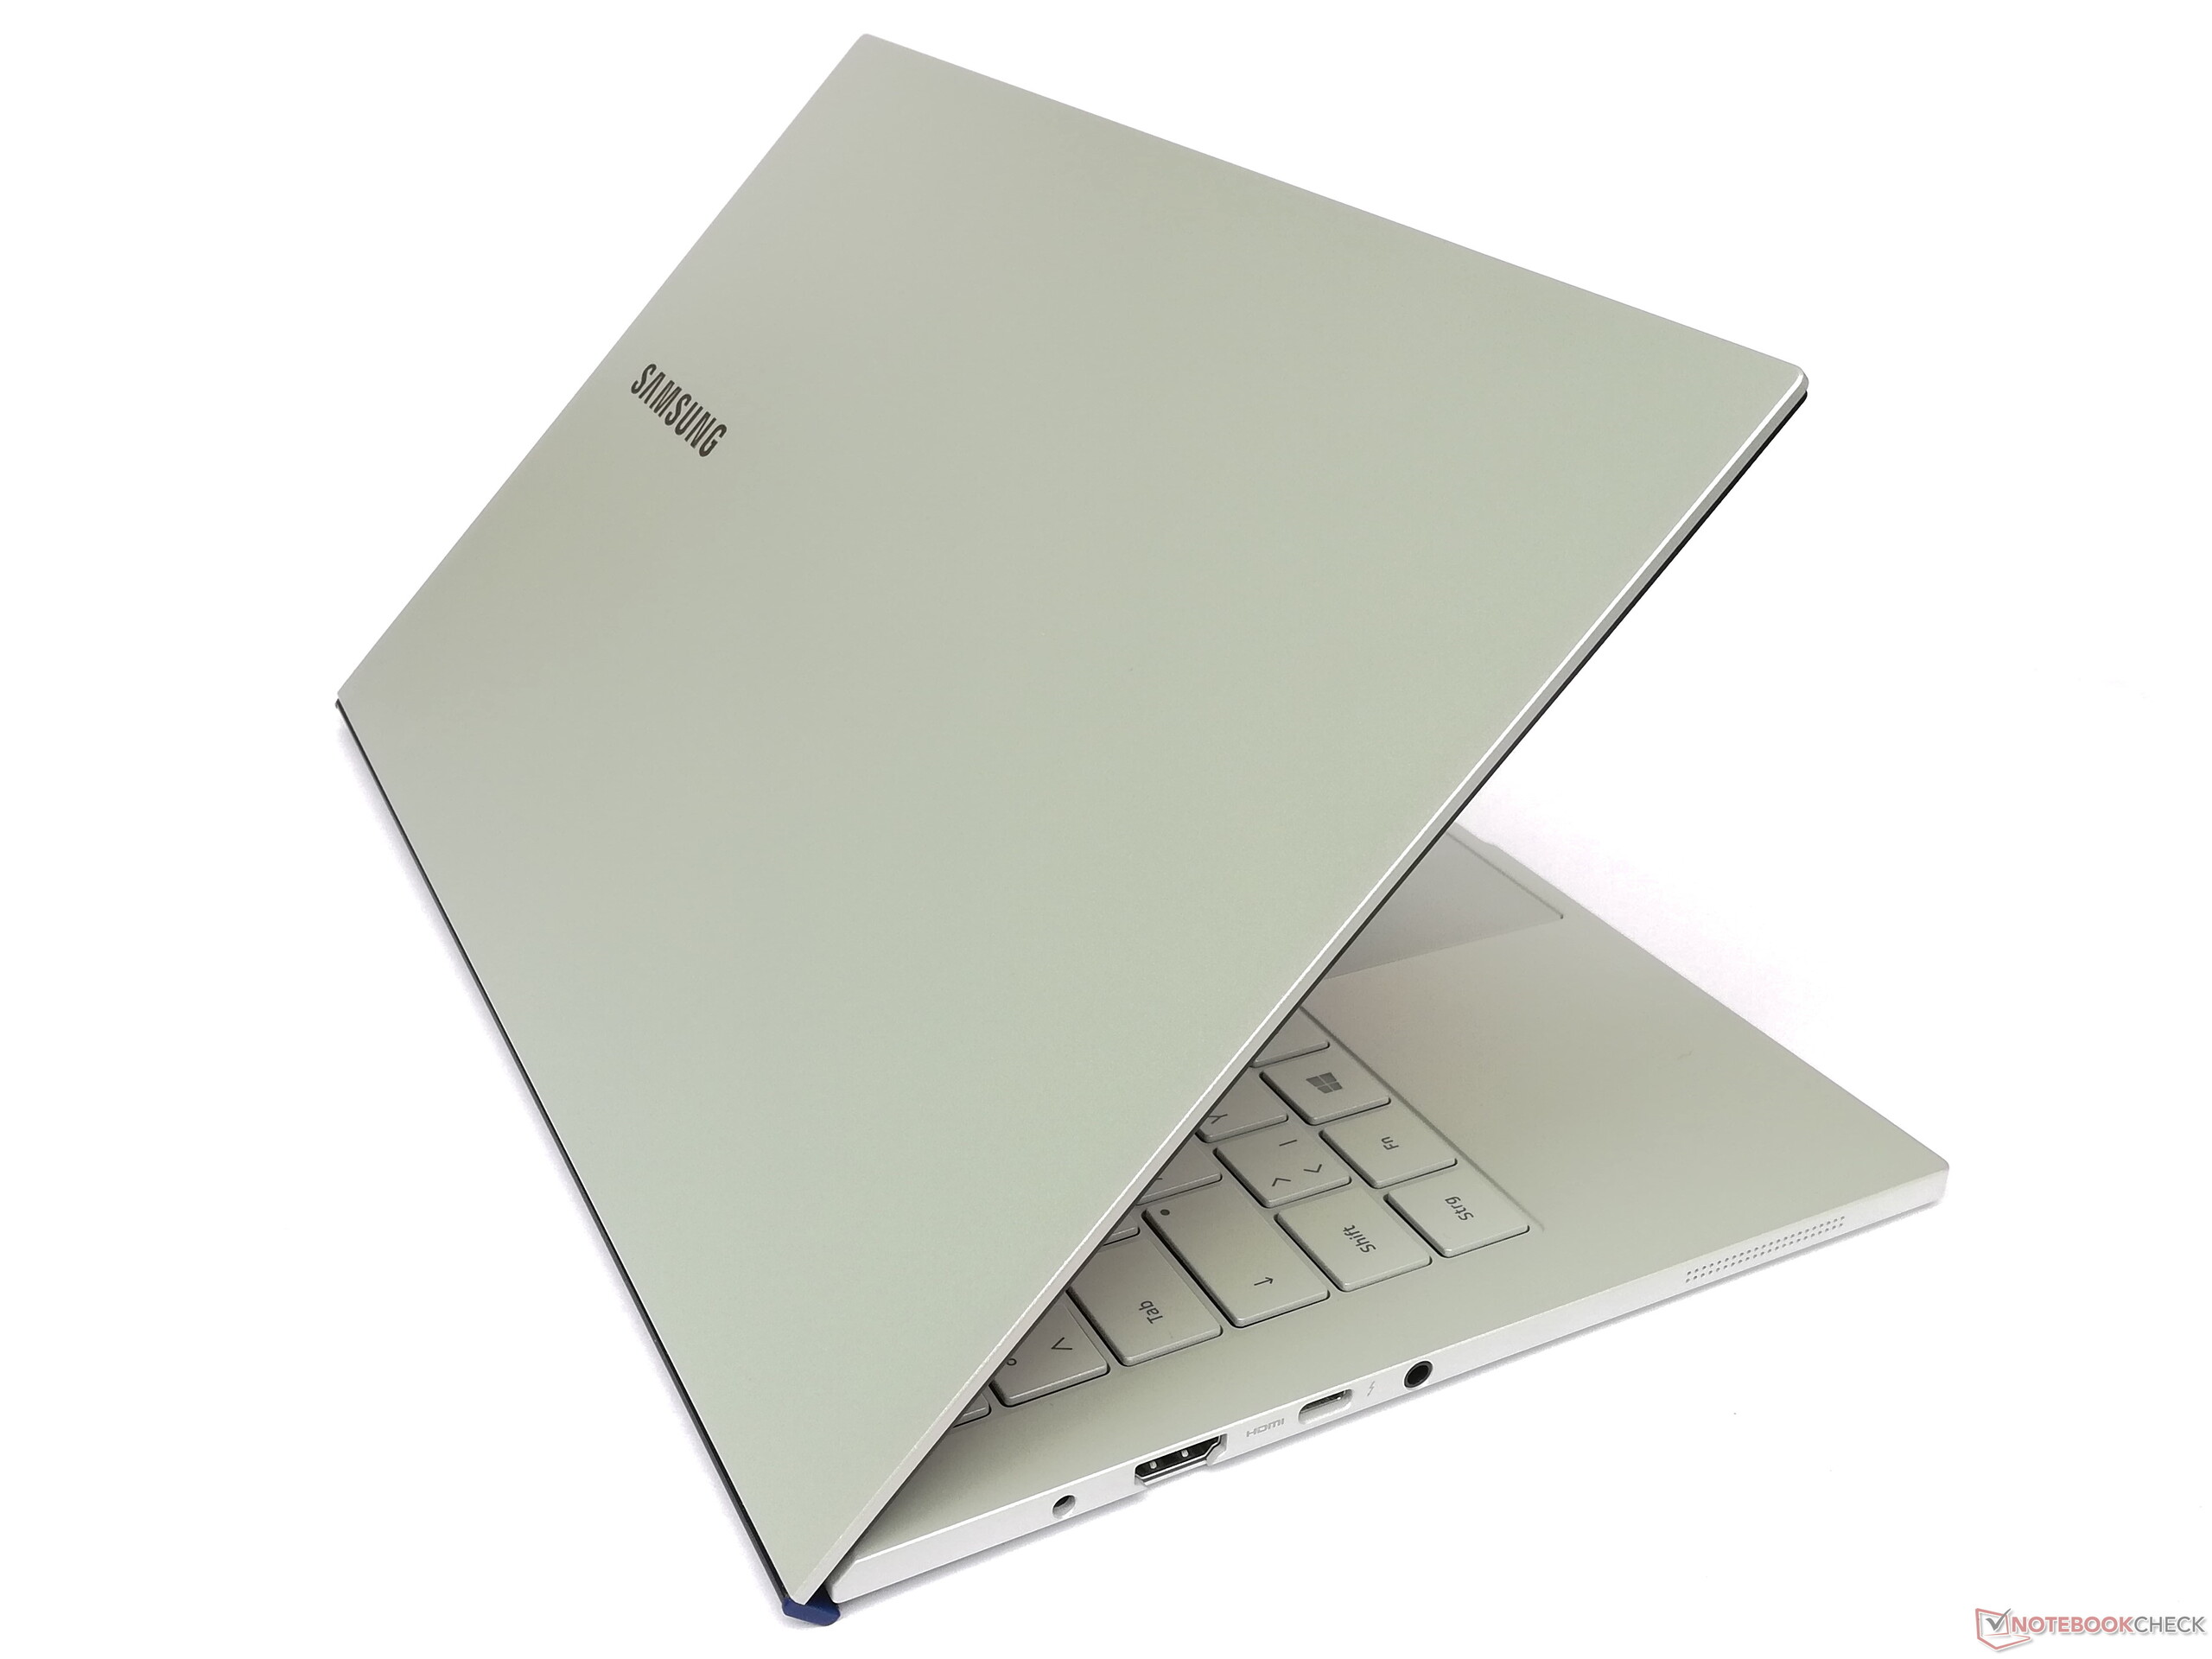
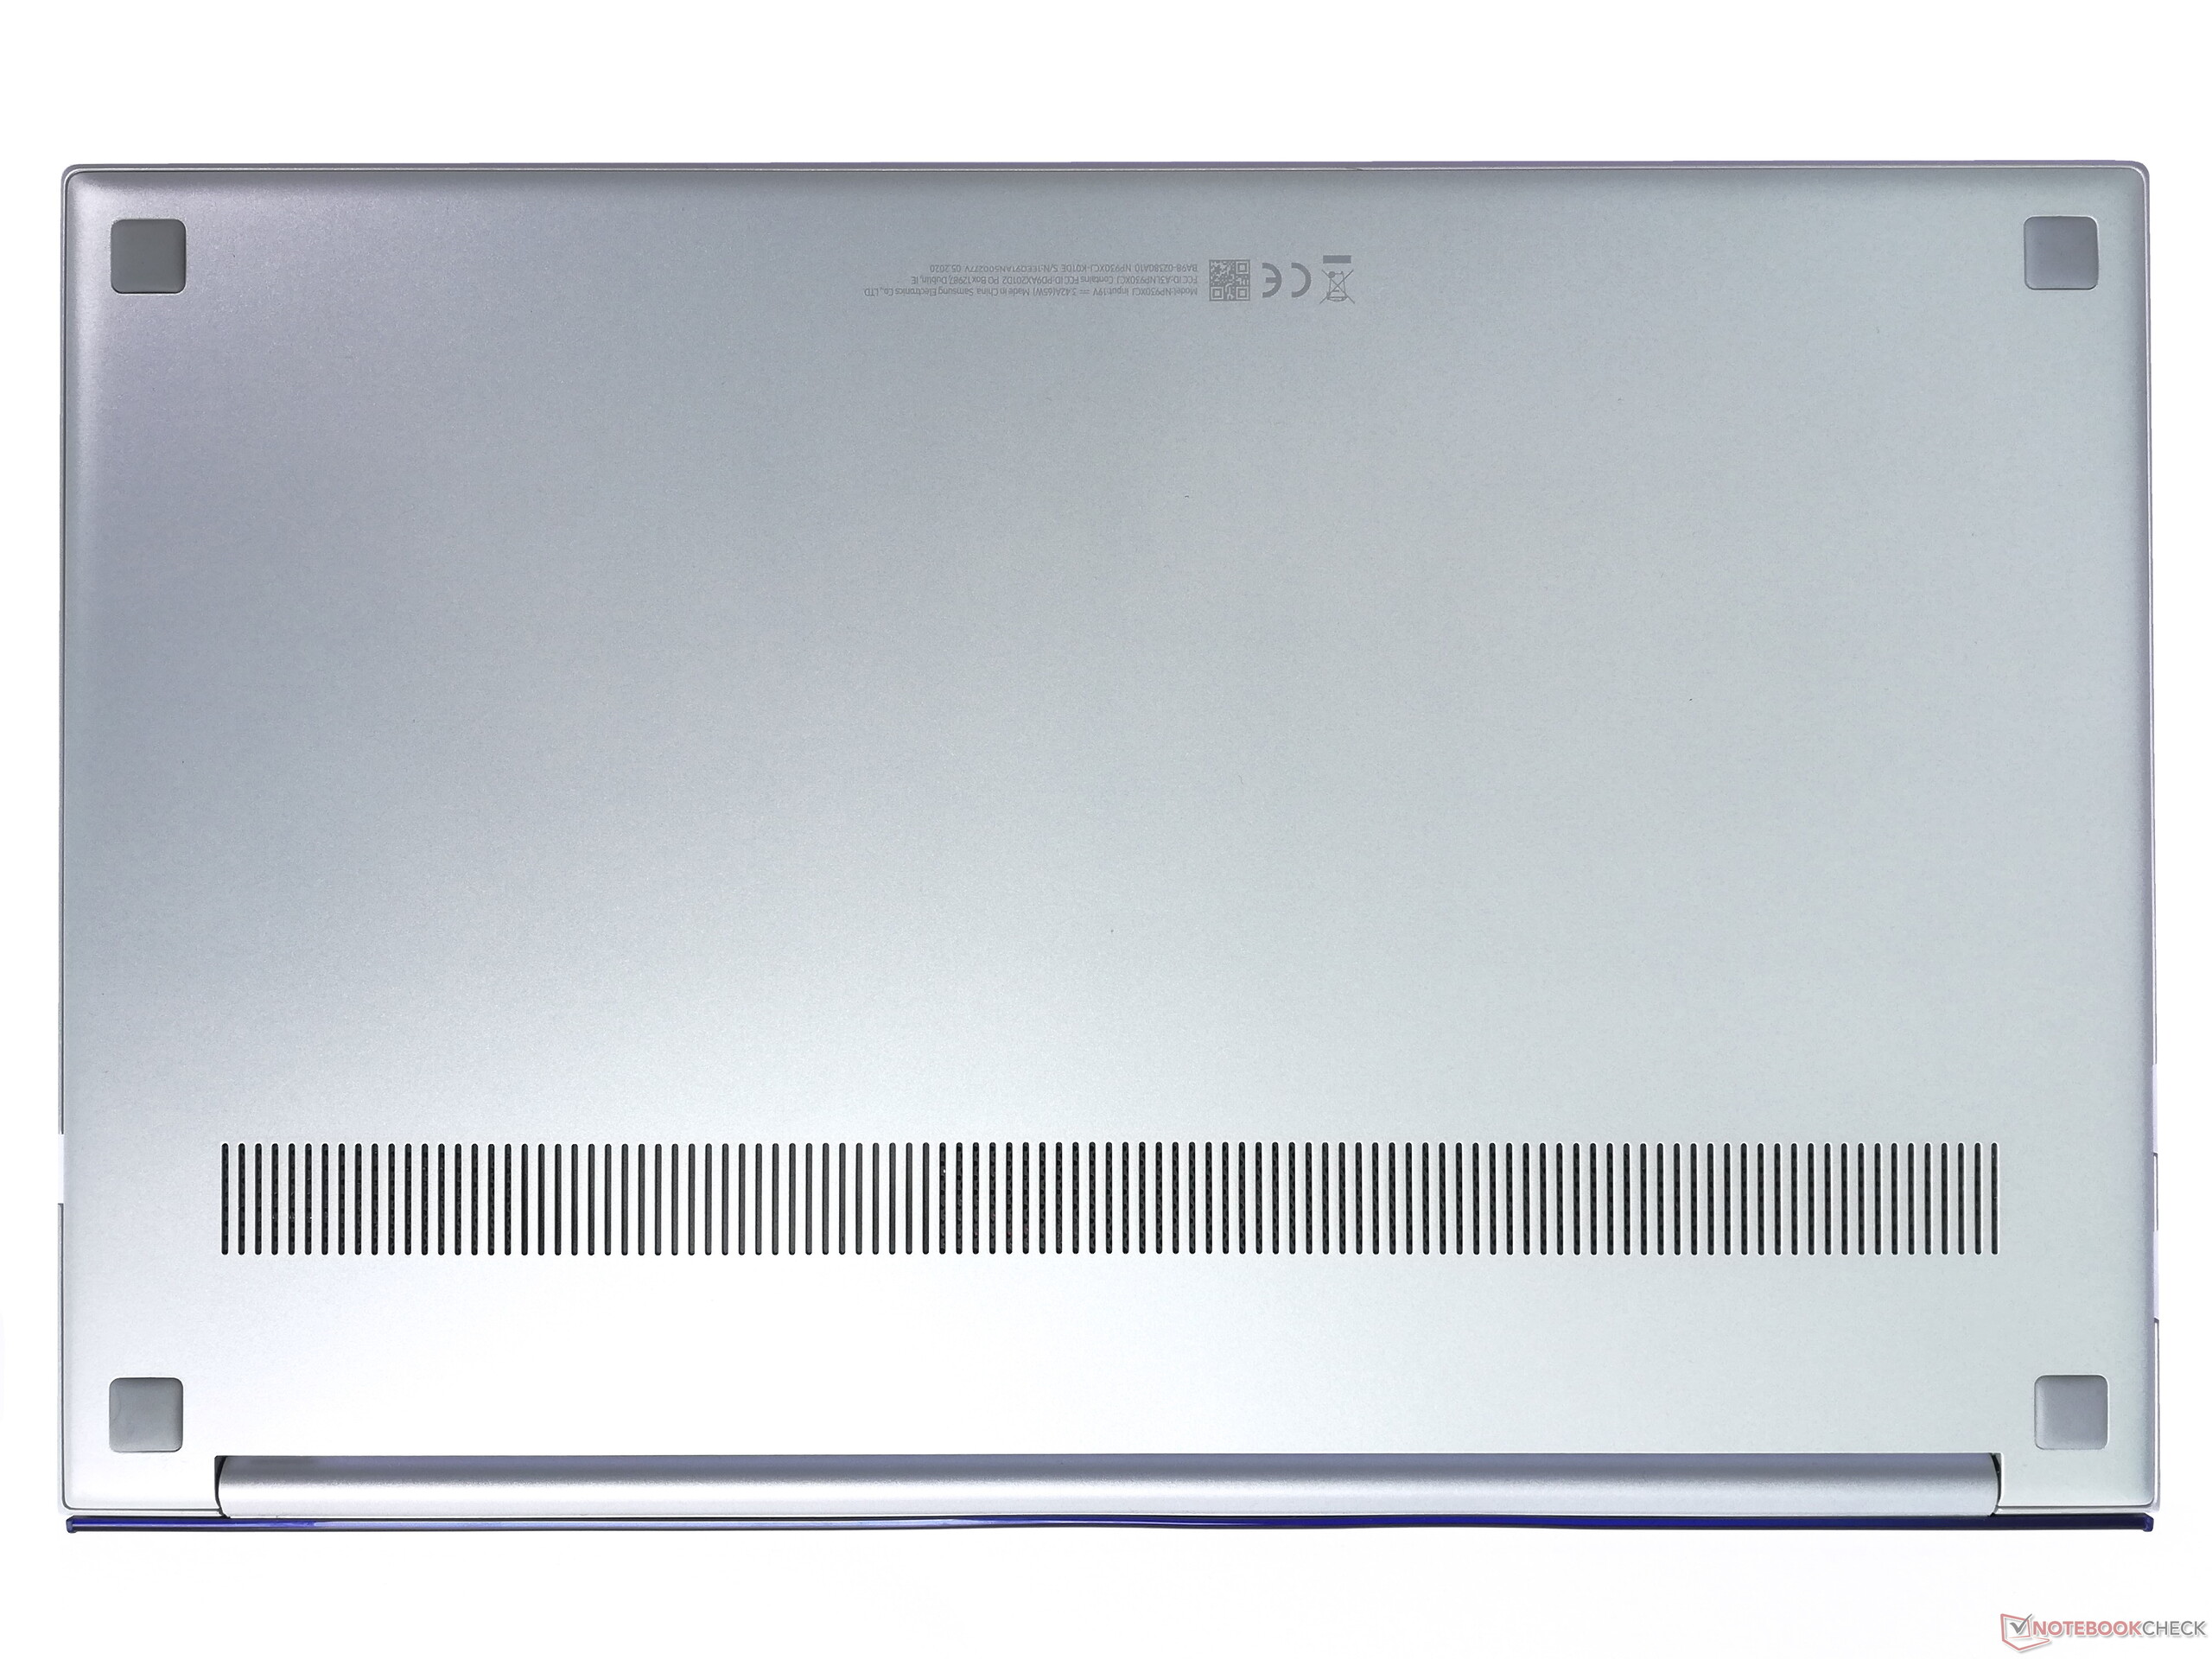
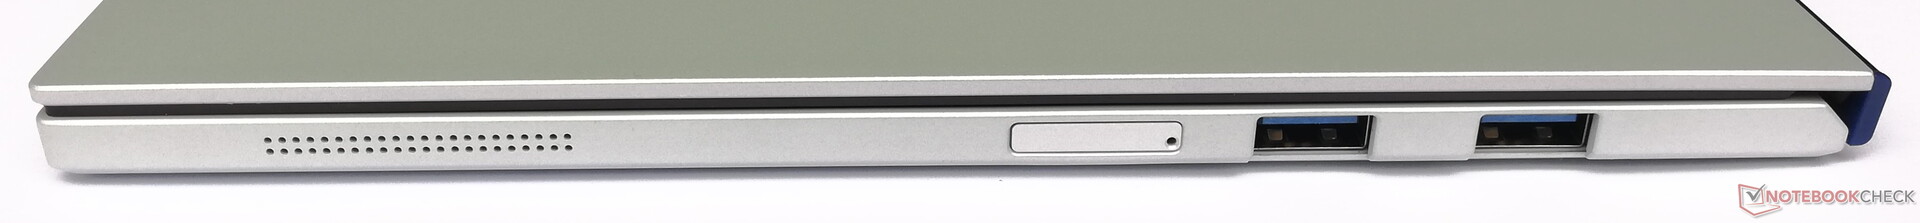
Notre sentiment après avoir testé le Samsung Galaxy Book Ion 13.3 est mitigé. Le design est moderne et séduisant, tout comme les ports, qui incluent non seulement un port HDMI souvent sacrifié sur l'autel de la finesse, mais également le Thunderbolt 3. La difficulté à changer la carte micro SD est plus discutable.
Le Galaxy Book Ion 13.3 sera excellent une fois que Samsung aura réussi à corriger le problème du bruit des ventilateurs.
En plus de son très bon écran, le Galaxy Book Ion possède également un Wifi plutôt bon. Le ClickPad est une bonne surprise, mais le clavier est trop mou. Certes, ce ne sont que des problèmes mineurs faciles à ignorer, tout comme le fait que le processeur soit incapable d'exploiter tout son potentiel, et doive être bridé pour sauvegarder l'autonomie et la consommation.
Notre expérience a pu constater un bon fonctionnement des outils de bureautique et d'Internet, ainsi que du montage photo. Cependant le bruit constant des ventilateurs est vraiment gênant. Après le démarrage, on profitera du silence, mais dès que l'on ouvre le logiciel le plus léger soit-il, les ventilateurs montent en cadence... Espérons que Samsung corrige cela dans une mise à jour future.
L’intégralité de cette critique est disponible en anglais en suivant ce lien.
Samsung Galaxy Book Ion 13.3
- 07/13/2020 v7 (old)
Mike Wobker
Price comparison
