Critiques du Intel Core i5-10210U processeur
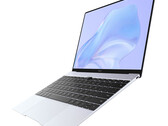
Test du Huawei MateBook X : ultra-fin, extrêmement léger et totalement silencieux
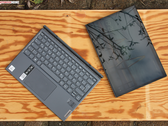
Léger d'un kilo et fin de seulement 13,6 mm, le Huawei MateBook X Silver Frost (2020) est l'un des ordinateurs portables les plus compacts qui soient. Il est ultra-mobile et totalement silencieux. Mais comment cela affecte-t-il les performances ? Pouvez-vous travailler raisonnablement avec l'appareil ? Notre test révèle la réponse.
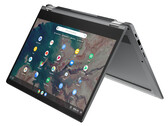
Intel Core i5-10210U, UHD Graphics 620, 13", 1 kgTest du Lenovo IdeaPad Flex 5 Chromebook 13IML05 : 2-en-1 avec stylet en option
Le 2-en-1 de Lenovo Chromebook est équipé d'un processeur basé sur Comet Lake, d'un SSD NVMe et d'un clavier rétroéclairé. L'écran tactile peut être utilisé non seulement avec les doigts, mais aussi avec le stylo Lenovo USI Pen, qui est vendu séparément. Le Chromebook prend également en charge Power Delivery sur USB-C.
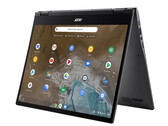
Intel Core i5-10210U, UHD Graphics 620, 13.3", 1.4 kgTest de l'Acer Chromebook Spin 713 CP713-2W : écran tactile en 3:2
Le Spin 713 offre un écran tactile 3:2, une bonne autonomie et des ports USB-C avec prise en charge de Power Delivery. Le convertible de 800 euros (~970 dollars) ne fait pas partie des Chromebooks les moins chers (aux États-Unis, le prix est bien meilleur : 529 dollars).
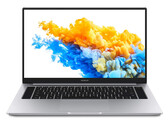
Intel Core i5-10210U, UHD Graphics 620, 13.5", 1.4 kgTest du Honor MagicBook Pro : PC mobile compact et polyvalent de 16,1 pouces avec une bonne autonomie
Le MagicBook Pro offre un niveau d'équipement bien équilibré : un processeur Core i5, un GPU GeForce MX350, 16 Go de mémoire de travail (en mode bicanal), un SSD NVMe et un écran IPS mat. Le tout est accompagné d'une très bonne autonomie de la batterie.
Intel Core i5-10210U, NVIDIA GeForce MX350, 16.1", 1.7 kgTest du Lenovo Yoga Duet 7 (i5-10210U, UHD 620, FHD+) : concurrent de la Surface Pro 7 avec peu de défauts
Le Duet 7 cherche à être l'ultime outil de productivité avec une autonomie sans fin, des performances du meilleur niveau, des périphériques d'entrée efficaces, des images superbes, et des fonctionnalités intelligentes comme la reconnaissance faciale ou l'assistant vocal Alexa d'Amazon. L'appareil parvient au niveau voulu dans presque tous ces domaines, mais pas tous. L'écart avec la Microsoft Surface Pro 7 est toujours présent.
Intel Core i5-10210U, UHD Graphics 620, 13", 1.2 kgFujitsu LifeBook U7310: Intel UHD Graphics 620, 13.30", 1.2 kg
Critique » Test du Fujitsu LifeBook U7310 (i5-10210U, UHD 620, FHD) : argument unique pour ce PC portable pro de 13 pouces, mais aux performances à la traîne
LG Ultra 17U70N: NVIDIA GeForce GTX 1650 Mobile, 17.00", 2 kg
Critique » Test du LG Ultra 17 (i5-10210U, GTX 1650, FHD+) : tel un Dell XPS 17, mais en moins bien
Lenovo ThinkPad X13-20T20033GE: Intel UHD Graphics 620, 13.30", 1.3 kg
Critique » Test du Lenovo ThinkPad X13 (i5-10210U, UHD 620, FHD) : petit, léger, compatible 4G
Lenovo ThinkPad T14s-20T00044GE: Intel UHD Graphics 620, 14.00", 1.3 kg
Critique » Test du Lenovo ThinkPad T14s Gen 1 (i5-10210U, UHD 620, FHD) : Intel est le moins bon choix...
Samsung Galaxy Book Ion 13.3: Intel UHD Graphics 620, 13.30", 1 kg
Critique » Test du Samsung Galaxy Book Ion 13.3 (i5-10210U, UHD 620, FHD, HDR) : ultrabook avec écran QLED
Lenovo ThinkPad T14-20S1S06B00: Intel UHD Graphics 620, 14.00", 1.5 kg
Critique » Test du Lenovo ThinkPad T14 (i5-10210U, UHD 620, FHD) : Comet Lake n'apporte pas grand-chose
Huawei MateBook 13 2020 i5: Intel UHD Graphics 620, 13.00", 1.3 kg
Critique » Test du Huawei MateBook 13 2020 (i5-10210U, UHD 620, FHD+) : Comet Lake sans gains de performances
Asus ZenBook Flip 14 UX463FA-AI039T: Intel UHD Graphics 620, 14.00", 1.4 kg
Critique » Test de l'Asus ZenBook Flip 14 UX463FA (i5-210U, UHD 620, FHD) : convertible élégant à petit prix
Dynabook Portege X30L-G1331: Intel UHD Graphics 620, 13.30", 0.9 kg
Critique » Test du Dynabook Portege X30L-G (i5-10210U, UHD 620, FHD) : un nouvel appareil léger
Schenker VIA 14: Intel UHD Graphics 620, 14.00", 1.1 kg
Critique » Test du Schenker VIA 14 (i5-10210U, UHD 620, FHD) : léger mais avec une grosse batterie
Acer Aspire 5 A515-54G: NVIDIA GeForce MX250, 15.60", 1.7 kg
Critique » Test de l'Acer Aspire 5 A515-54G (i5-10210U, MX250, FHD) : PC portable pour les joueurs occasionnels
Lenovo ThinkPad L13 Yoga 20R6S00800: Intel UHD Graphics 620, 13.30", 1.4 kg
Critique » Test du Lenovo ThinkPad L13 Yoga (i5-10210U, UHD 620, FHD) : convertible pro bien équipé
Lenovo ThinkPad E14 20RA001MGE: Intel UHD Graphics 620, 14.00", 1.6 kg
Critique » Test du Lenovo ThinkPad E14 (i5-10210U, UHD 620, FHD) : la finesse plus que l'évolutivité
Lenovo ThinkBook 14-IML-20RV006TGE: Intel UHD Graphics 620, 14.00", 1.6 kg
Critique » Test du Lenovo ThinkBook 14 (i5-10210U, UHD 620, FHD) : portable pro avec une excellente connectivité
Lenovo Yoga C740-14IML: Intel UHD Graphics 620, 14.00", 1.4 kg
Critique » Test du Lenovo Yoga C740-14IML (i5-10210U, UHD 620, FHD) : allure haut de gamme à prix intermédiaire
Acer Aspire 5 A514-52: Intel UHD Graphics 620, 14.00", 1.7 kg
Critique » Test de l'Acer Aspire 5 A514 (i5-10210U, UHD 620, FHD) : Intel Comet Lake en berne
HP Pavilion x360 14-dh1153ng: Intel UHD Graphics 620, 14.00", 1.6 kg
Critique » Test du HP Pavilion x360 14 (i5-10210U, UHD 620, FHD) : un convertible de 14 pouces avec stylet en option
Intel NUC10i5FNK: Intel UHD Graphics 620, 0.00", 0.5 kg
Critique » Test de l'Intel Frost Canyon (i5-10210U, UHD 620) : NUC avec i5 Comet Lake
Acer Extensa 15 EX215-51-56UX: Intel UHD Graphics 620, 15.60", 1.9 kg
Critique » Test de l'Acer Extensa 15 EX215-51 (i5-10210U, UHD 620, FHD) : surpuissant, mais avec un écran décevant
Lenovo ThinkBook 15 : Intel UHD Graphics 620, 15.60", 1.9 kg
Critique » Test du Lenovo ThinkBook 15 (i5-10210U, UHD 620, FHD) : appareil de bureau abordable avec processeur Comet Lake
Lenovo Ideapad S540-15IML: NVIDIA GeForce MX250, 15.60", 1.9 kg
Critique » Test du Lenovo IdeaPad S540-15IML (i5-10210U, MX250, FHD, 60 Hz) : autonomie au sommet
MSI Modern 14 A10RB-459US: NVIDIA GeForce MX250, 14.00", 1.2 kg
Critique » Test du MSI Modern 14 A10RB (i5-10210U, MX250, FHD) : plus léger qu'il n'y paraît
Schenker Slim 15 L19: Intel UHD Graphics 620, 15.60", 1.6 kg
Critique » Test du Schenker Slim 15 (i5-10210U, UHD 620, FHD) : portable Wifi 6 en retrait
Medion Akoya E15415-MD62481: Intel UHD Graphics 620, 15.60", 1.9 kg
Autres tests » Medion Akoya E15415-MD62481
Huawei MateBook D 15 2020, i5-10210U: Intel UHD Graphics 620, 15.60", 1.5 kg
Autres tests » Huawei MateBook D 15 2020, i5-10210U
HP 14-ck2010tu: Intel UHD Graphics 620, 14.00", 1.5 kg
Autres tests » HP 14-ck2010tu
MSI Modern 14 B10MW-421XES: Intel UHD Graphics 620, 14.00", 1.3 kg
Autres tests » MSI Modern 14 B10MW-421XES
Acer Chromebook Spin 713 CP713-2W-5719: Intel HD Graphics 620, 13.50", 1.5 kg
Autres tests » Acer Chromebook Spin 713 CP713-2W-5719
Asus VivoBook Flip 14 TP412FA-EC707T: Intel UHD Graphics 620, 14.00", 1.5 kg
Autres tests » Asus VivoBook Flip 14 TP412FA-EC707T
MSI Modern 14 B10MW-604: Intel UHD Graphics 620, 14.00", 1.3 kg
Autres tests » MSI Modern 14 B10MW-604
Lenovo ThinkPad E14-20RA0016S: Intel UHD Graphics 620, 14.00", 1.7 kg
Autres tests » Lenovo ThinkPad E14-20RA0016S
Acer Aspire 5 A514-52-582Y: Intel UHD Graphics 620, 14.00", 1.6 kg
Autres tests » Acer Aspire 5 A514-52-582Y
Asus ExpertBook P2451FA, i5-10210U: Intel UHD Graphics 620, 14.00", 1.5 kg
Autres tests » Asus ExpertBook P2451FA, i5-10210U
Dell Latitude 12 7210 2-in-1, i5-10210U: Intel UHD Graphics 620, 12.30", 0.9 kg
Autres tests » Dell Latitude 12 7210 2-in-1, i5-10210U
Lenovo ThinkPad E14-20RA003WSP: Intel UHD Graphics 620, 14.00", 2.2 kg
Autres tests » Lenovo ThinkPad E14-20RA003WSP
HP 15-dw1023ns: Intel UHD Graphics 620, 15.60", 1.8 kg
Autres tests » HP 15-dw1023ns
HP EliteBook x360 1040 G7, i5-10210U: Intel HD Graphics 620, 14.00", 1.3 kg
Autres tests » HP EliteBook x360 1040 G7, i5-10210U
Huawei MateBook D 14-53012BMY: Intel HD Graphics 620, 14.00", 1.4 kg
Autres tests » Huawei MateBook D 14-53012BMY
Honor MagicBook X 14, i5-10210U: Intel UHD Graphics 620, 14.00", 1.4 kg
Autres tests » Honor MagicBook X 14, i5-10210U
Lenovo IdeaPad 3 14IML-81WA004PPB: Intel UHD Graphics 620, 14.00", 1.5 kg
Autres tests » Lenovo IdeaPad 3 14IML-81WA004PPB
Honor MagicBook X 15, i5-10210U: Intel UHD Graphics 620, 15.60", 1.6 kg
Autres tests » Honor MagicBook X 15, i5-10210U
Huawei Matebook D 14, i5-10210U MX250: NVIDIA GeForce MX250, 14.00", 1.4 kg
Autres tests » Huawei Matebook D 14, i5-10210U MX250
HP Chromebook x360 13c-ca0013dx: Intel UHD Graphics 620, 13.50", 1.4 kg
Autres tests » HP Chromebook x360 13c-ca0013dx
Honor MagicBook Pro 10210U: NVIDIA GeForce MX350, 16.10", 1.7 kg
Autres tests » Honor MagicBook Pro 10210U
HP Chromebook x360 14c-ca0004nd: Intel UHD Graphics 620, 14.00", 1.7 kg
Autres tests » HP Chromebook x360 14c-ca0004nd
HP EliteBook x360 1040 1Q6B5ES: Intel UHD Graphics 620, 14.00", 1.4 kg
Autres tests » HP EliteBook x360 1040 1Q6B5ES
Lenovo IdeaPad Flex 5 CB 13IML05-82B80000MX : Intel UHD Graphics 620, 13.30", 1.4 kg
Autres tests » Lenovo IdeaPad Flex 5 CB 13IML05-82B80000MX
Lenovo ThinkPad X13 Yoga-20SX002UGE: Intel UHD Graphics 620, 13.30", 1.3 kg
Autres tests » Lenovo ThinkPad X13 Yoga-20SX002UGE
Acer Chromebook Spin 713 CP713-2W-59SE: Intel UHD Graphics 620, 13.50", 1.4 kg
Autres tests » Acer Chromebook Spin 713 CP713-2W-59SE
Acer Enduro N3 EN314-51W-563C: Intel UHD Graphics 620, 14.00", 2 kg
Autres tests » Acer Enduro N3 EN314-51W-563C
Acer Aspire 5 A514-52-531Q: Intel UHD Graphics 620, 14.00", 1.7 kg
Autres tests » Acer Aspire 5 A514-52-531Q
Lenovo Thinkpad E15-20RD004JSP: Intel UHD Graphics 620, 15.60"
Autres tests » Lenovo Thinkpad E15-20RD004JSP
Lenovo ThinkPad T14s-20T00044GE: Intel UHD Graphics 620, 14.00", 1.3 kg
Autres tests » Lenovo ThinkPad T14s-20T00044GE
Lenovo IdeaPad Flex 5 CB 13IML05, i5-10210U: Intel UHD Graphics 620, 13.30", 1.4 kg
Autres tests » Lenovo Chromebook Flex 5 13, i5-10210U
HP EliteBook 840 G7, i5-10210U: Intel UHD Graphics 620, 14.00", 1.3 kg
Autres tests » HP EliteBook 840 G7, i5-10210U
Huawei MateBook X 2020 i5: NVIDIA GeForce MX250, 13.90", 1.3 kg
Autres tests » Huawei MateBook X 2020 i5
Lenovo ThinkPad L14, i5-10210U: Intel UHD Graphics 620, 14.00", 1.6 kg
Autres tests » Lenovo ThinkPad L14, i5-10210U
Acer Chromebook Spin 713 CP713-2W-51EJ: Intel UHD Graphics 620, 13.50", 1.4 kg
Autres tests » Acer Chromebook Spin 713 CP713-2W-51EJ
Samsung Book X45: NVIDIA GeForce MX110, 15.60", 2 kg
Autres tests » Samsung Book X45
Asus VivoBook 14 A413, i5-10210U MX330: NVIDIA GeForce MX330, 14.00", 1.4 kg
Autres tests » Asus VivoBook 14 A413, i5-10210U MX330
Acer Enduro N3 EN314-51W-54EA: Intel UHD Graphics 620, 14.00", 2 kg
Autres tests » Acer Enduro N3 EN314-51W-54EA
MSI Modern 14 A10M-1034XES: Intel UHD Graphics 620, 14.00", 1.2 kg
Autres tests » MSI Modern 14 A10M-1034XES
Lenovo Yoga Duet 7 13IML05, i5-10210U: Intel UHD Graphics 620, 13.00", 0.8 kg
Autres tests » Lenovo Yoga Duet 7 13IML05, i5-10210U
Xiaomi Mi Notebook 14, i5-10210U MX250: NVIDIA GeForce MX250, 14.00", 1.5 kg
Autres tests » Xiaomi Mi Notebook 14, i5-10210U MX250
Asus VivoBook Flip 14 TP412FA-EC369T: Intel UHD Graphics 620, 14.00", 1.5 kg
Autres tests » Asus VivoBook Flip 14 TP412FA-EC369T
Lenovo ThinkPad X13-20T20033GE: Intel UHD Graphics 620, 13.30", 1.3 kg
Autres tests » Lenovo ThinkPad X13-20T20033GE
Asus VivoBook S14 S412FA-EK678T: Intel UHD Graphics 620, 14.00", 1.5 kg
Autres tests » Asus VivoBook S14 S412FA-EK678T
MSI Modern 15 A10RAS-089XES: NVIDIA GeForce MX330, 15.60", 1.6 kg
Autres tests » MSI Modern 15 A10RAS-089XES
Fujitsu LifeBook U9310X, i5-10210U: Intel UHD Graphics 620, 13.30", 1 kg
Autres tests » Fujitsu LifeBook U9310X, i5-10210U
Lenovo ThinkPad T15, i5-10210U: Intel UHD Graphics 620, 15.60", 1.9 kg
Autres tests » Lenovo ThinkPad T15, i5-10210U
Lenovo ThinkPad L15, i5-10210U: Intel UHD Graphics 620, 15.60", 2 kg
Autres tests » Lenovo ThinkPad L15, i5-10210U
Acer Chromebook Spin 713 CP713-2W-560V: Intel UHD Graphics 620, 13.50", 1.4 kg
Autres tests » Acer Chromebook Spin 13 CP713-2W-560V
Acer Aspire 3 A317-51-51DW: Intel UHD Graphics 620, 17.30", 2.7 kg
Autres tests » Acer Aspire 3 A317-51-51DW
Dell Vostro 15 3590, i5-10210U: Intel UHD Graphics 620, 15.60"
Autres tests » Dell Vostro 15 3590, i5-10210U
Huawei MateBook 14 (2020): NVIDIA GeForce MX350, 14.00", 1.5 kg
Autres tests » Huawei MateBook 14 (2020)
Lenovo ThinkPad X1 Carbon 2020 i5-10210U: Intel UHD Graphics 620, 14.00", 1.1 kg
Autres tests » Lenovo ThinkPad X1 Carbon 2020 i5-10210U
Asus VivoBook S15 S533F-LBQ536T: NVIDIA GeForce MX250, 15.60", 1.8 kg
Autres tests » Asus VivoBook S15 S533F-LBQ536T
Lenovo ThinkBook Plus 13 i5: Intel UHD Graphics 620, 13.30", 1.4 kg
Autres tests » Lenovo ThinkBook Plus 13 i5
Lenovo ThinkPad L13 Yoga 20R6S00800: Intel UHD Graphics 620, 13.30", 1.4 kg
Autres tests » Lenovo ThinkPad L13 Yoga 20R6S00800
Acer Swift 3 SF314-58G-77JX: NVIDIA GeForce MX250, 14.00", 1.6 kg
Autres tests » Acer Swift 3 SF314-58G-77JX
Acer Aspire 5 A515-54-59W2: Intel UHD Graphics 620, 15.60", 1.8 kg
Autres tests » Acer Aspire 5 A515-54-59W2
HP Pavilion x360 14-dh1012ns: Intel UHD Graphics 620, 14.00", 1.6 kg
Autres tests » HP Pavilion x360 14-dh1012ns
MSI Modern 14 A10M-812XES: Intel UHD Graphics 620, 14.00", 1.2 kg
Autres tests » MSI Modern 14 A10M-812XES
Acer Swift 3 SF314-58-59KV: Intel UHD Graphics 620, 14.00", 1.5 kg
Autres tests » Acer Swift 3 SF314-58-59KV
Huawei MateBook 13 2020 MX250: NVIDIA GeForce MX250, 13.00", 1.3 kg
Autres tests » Huawei MateBook 13 2020 MX250
HP ProBook 430 G7, i5-10210U: Intel UHD Graphics 620, 13.30", 1.5 kg
Autres tests » HP ProBook 430 G7, i5-10210U
HP Pavilion x360 14-dh1153ng: Intel UHD Graphics 620, 14.00", 1.6 kg
Autres tests » HP Pavilion x360 14-dh1153ng
Samsung Galaxy Book Ion 13.3: Intel UHD Graphics 620, 13.30", 1 kg
Autres tests » Samsung Galaxy Book Ion 13.3
MSI Modern 15 A10M-088XES: Intel UHD Graphics 620, 15.60", 1.6 kg
Autres tests » MSI Modern 15 A10M-088XES
Huawei MateBook 13 2020 i5: Intel UHD Graphics 620, 13.00", 1.3 kg
Autres tests » Huawei MateBook 13 2020 i5
Acer TravelMate P614-51-G2-57MS: Intel UHD Graphics 620, 14.00", 1.2 kg
Autres tests » Acer TravelMate P614-51-G2-57MS
Lenovo ThinkPad L13 Yoga 20R50004GE: Intel UHD Graphics 620, 13.30", 1.4 kg
Autres tests » Lenovo ThinkPad L13 Yoga 20R50004GE
HP 470 G7, i5-10210U, Radeon 530: AMD Radeon 530, 17.30", 2.4 kg
Autres tests » HP 470 G7, i5-10210U, Radeon 530
Asus VivoBook S14 S433FA-EB010T: Intel UHD Graphics 620, 14.00", 1.5 kg
Autres tests » Asus VivoBook S14 S433FA-EB010T
Lenovo ThinkPad E15, i5-10210U: Intel UHD Graphics 620, 15.60", 1.9 kg
Autres tests » Lenovo ThinkPad E15, i5-10210U
HP ProBook 450 G7-8VU93EA: Intel UHD Graphics 620, 15.60", 2 kg
Autres tests » HP ProBook 450 G7-8VU93EA
HP ProBook 440 G7-3C084ES: Intel UHD Graphics 620, 14.00", 1.6 kg
Autres tests » HP ProBook 440 G7-3C084ES
Asus VivoBook S15 S533FA-BQ009T: Intel UHD Graphics 620, 15.60", 1.8 kg
Autres tests » Asus VivoBook S15 S533FA-BQ009T
HP Pavilion x360 14-dh1004ns: Intel UHD Graphics 620, 14.00", 1.6 kg
Autres tests » HP Pavilion x360 14-dh1004ns
Lenovo Yoga C740-14IML-81TC006VGE: Intel UHD Graphics 620, 14.00", 1.4 kg
Autres tests » Lenovo Yoga C740-14IML-81TC006VGE
Asus ZenBook Flip 14 UX463FA-AI027T: Intel UHD Graphics 620, 14.00", 1.4 kg
Autres tests » Asus ZenBook Flip 14 UX463FA-AI027T
Lenovo ThinkPad E14 20RA001MGE: Intel UHD Graphics 620, 14.00", 1.6 kg
Autres tests » Lenovo ThinkPad E14 20RA001MGE
Acer Aspire 3 A317-51G-569Z: Intel UHD Graphics 620, 17.30", 2.7 kg
Autres tests » Acer Aspire 3 A317-51G-569Z
Asus ZenBook 14 UX431FA-AM149T: Intel UHD Graphics 620, 14.00", 1.4 kg
Autres tests » Asus ZenBook 14 UX431FA-AM149T
Asus VivoBook S14 S432FL-EB074T: NVIDIA GeForce MX250, 14.00", 1.5 kg
Autres tests » Asus VivoBook S14 S432FL-EB074T
Asus VivoBook S14 S433FL-EB008T: NVIDIA GeForce MX250, 14.00", 1.5 kg
Autres tests » Asus VivoBook S14 S433FL-EB008T
Acer Aspire 3 A315-55G-55WZ: NVIDIA GeForce MX230, 15.60", 1.9 kg
Autres tests » Acer Aspire 3 A315-55G-55WZ
Acer Aspire 3 A315-54-52UL: Intel UHD Graphics 620, 15.60", 1.9 kg
Autres tests » Acer Aspire 3 A315-54-52UL
HP Envy 13-aq1048tu: Intel UHD Graphics 620, 13.30", 1.2 kg
Autres tests » HP Envy 13-aq1048tu
HP 348 G7-9PH06PA: Intel UHD Graphics 620, 14.00", 1.5 kg
Autres tests » HP 348 G7-9PH06PA
HP Envy 13-aq1004ns: Intel UHD Graphics 620, 13.30", 1.3 kg
Autres tests » HP Envy 13-aq1004ns
Asus VivoBook 14 A412F-EK739T: Intel UHD Graphics 620, 14.00", 1.4 kg
Autres tests » Asus VivoBook 14 A412F-EK739T
Lenovo Yoga C740-15IML-81TD001MGE: Intel UHD Graphics 620, 15.60", 1.9 kg
Autres tests » Lenovo Yoga C740-15IML-81TD001MGE
Acer TravelMate P6 TMP614-51T-G2-59VT: Intel UHD Graphics 620, 14.00", 1.2 kg
Autres tests » Acer TravelMate P6 TMP614-51T-G2-59VT
Schenker VIA 14: Intel UHD Graphics 620, 14.00", 1.1 kg
Autres tests » Schenker VIA 14
Acer Aspire 3 A315-55G-54BN: NVIDIA GeForce MX230, 15.60", 2 kg
Autres tests » Acer Aspire 3 A315-55G-54BN
Asus ZenBook 14 UX431FA-AM132T : Intel UHD Graphics 620, 14.00", 1.5 kg
Autres tests » Asus ZenBook 14 UX431FA-AM132T
MSI Modern 14 A10M-669: Intel UHD Graphics 620, 14.00", 1.2 kg
Autres tests » MSI Modern 14 A10M-669
Huawei MateBook X Pro 2020, Core i5-10210U: Intel UHD Graphics 620, 13.90", 1.3 kg
Autres tests » Huawei MateBook X Pro 2020, Core i5-10210U
Dell Inspiron 14 5491-3WDPX, 2-in-1: Intel UHD Graphics 620, 14.00", 1.7 kg
Autres tests » Dell Inspiron 14 5491-3WDPX, 2-in-1
Lenovo ThinkBook 15 : Intel UHD Graphics 620, 15.60", 1.9 kg
Autres tests » Lenovo ThinkBook 15
Asus VivoBook A512FL, i5 10210U, MX250: NVIDIA GeForce MX250, 15.60", 1.7 kg
Autres tests » Asus VivoBook A512FL, i5 10210U, MX250
Asus Chromebook Flip C436FA, i5-10210U: Intel UHD Graphics 620, 14.00", 1.1 kg
Autres tests » Asus Chromebook Flip C436FA, i5-10210U
Samsung Galaxy Chromebook XE930QCA-K01US: Intel UHD Graphics 620, 13.30", 1 kg
Autres tests » Samsung Galaxy Chromebook XE930QCA-K01US
Dell Inspiron 14 7490-99DXP: Intel UHD Graphics 620, 14.00", 1.3 kg
Autres tests » Dell Inspiron 14 7490-99DXP
Dell Latitude 9510 2in1: Intel UHD Graphics 620, 15.60", 1.5 kg
Autres tests » Dell Latitude 9510 2in1
Acer Aspire 3 A317-51-58S7: Intel UHD Graphics 620, 17.30", 2.7 kg
Autres tests » Acer Aspire 3 A317-51-58S7
Acer Aspire 5 A514-52-570U: Intel UHD Graphics 620, 14.00", 1.5 kg
Autres tests » Acer Aspire 5 A514-52-570U
Dell Vostro 15 5590, i5-10210U: Intel UHD Graphics 620, 15.60", 1.7 kg
Autres tests » Dell Vostro 15 5590, i5-10210U
Xiaomi RedmiBook 13, i5-10210U: NVIDIA GeForce MX250, 13.30", 1.2 kg
Autres tests » Xiaomi RedmiBook 13, i5-10210U
Acer Aspire 5 A515-54G-54PC: NVIDIA GeForce MX250, 15.60", 1.9 kg
Autres tests » Acer Aspire 5 A515-54G-54PC
Acer Aspire 3 A315-54K-59N: Intel UHD Graphics 620, 15.60", 1.9 kg
Autres tests » Acer Aspire 3 A315-54K-59N
Asus ZenBook Duo UX481FL-BM040T: Intel UHD Graphics 620, 14.00", 1.5 kg
Autres tests » Asus ZenBook Duo UX481FL-BM040T
Asus ZenBook 14 UX434FAC-A5225T: Intel UHD Graphics 620, 14.00", 1.3 kg
Autres tests » Asus ZenBook 14 UX434FAC-A5225T
Lenovo ThinkBook 14-IML-20RV006TGE: Intel UHD Graphics 620, 14.00", 1.6 kg
Autres tests » Lenovo ThinkBook 14-IML-20RV006TGE
MSI Modern 14 A10M-600XES: Intel UHD Graphics 620, 14.00", 1.2 kg
Autres tests » MSI Modern 14 A10M-600XES
Dell XPS 13 7390 Core i5-10210U: Intel UHD Graphics 620, 13.30", 1.3 kg
Autres tests » Dell XPS 13 7390 Core i5-10210U
Dell Inspiron 13 7391 2-in-1, i5-10210U: Intel UHD Graphics 620, 13.30", 1.4 kg
Autres tests » Dell Inspiron 13 7391 2-in-1, i5-10210U
Asus ZenBook Duo UX481FA-BM025R: Intel UHD Graphics 620, 14.00", 1.5 kg
Autres tests » Asus ZenBook Duo UX481FA-BM025R
HP Envy 13-aq1015TX: Intel UHD Graphics 620, 13.30", 1.2 kg
Autres tests » HP Envy 13-aq1015TX
Acer Aspire A514-52-516K: Intel UHD Graphics 620, 14.00", 1.6 kg
Autres tests » Acer Aspire A514-52-516K
Lenovo Yoga C740-14IML-81TC002RGE: Intel UHD Graphics 620, 14.00", 1.4 kg
Autres tests » Lenovo Yoga C740-14IML-81TC002RGE
Acer Aspire 5 A514-52G-516T: NVIDIA GeForce MX250, 14.00", 1.6 kg
Autres tests » Acer Aspire 5 A514-52G-516T
Lenovo Yoga C640-13IML-81UE0003GE: Intel UHD Graphics 620, 13.30", 1.4 kg
Autres tests » Lenovo Yoga C640-13IML-81UE0003GE
Lenovo Yoga Duet 7 13IML05-82AS000WGE: Intel UHD Graphics 620, 13.00", 1.2 kg
» Lenovo Yoga Duet 7 ne peut pas suivre le rapport prix/performance de Microsoft Surface Pro 7
Lenovo ThinkPad X13-20T20033GE: Intel UHD Graphics 620, 13.30", 1.3 kg
» Premiers repères : L'AMD Ryzen 4000 excelle dans le ThinkPad X13 Gen 1 de Lenovo
Lenovo ThinkPad T14-20S1S06B00: Intel UHD Graphics 620, 14.00", 1.5 kg
» Le Lenovo ThinkPad T14 équipé d'un processeur Intel fonctionne à plein régime lors du test