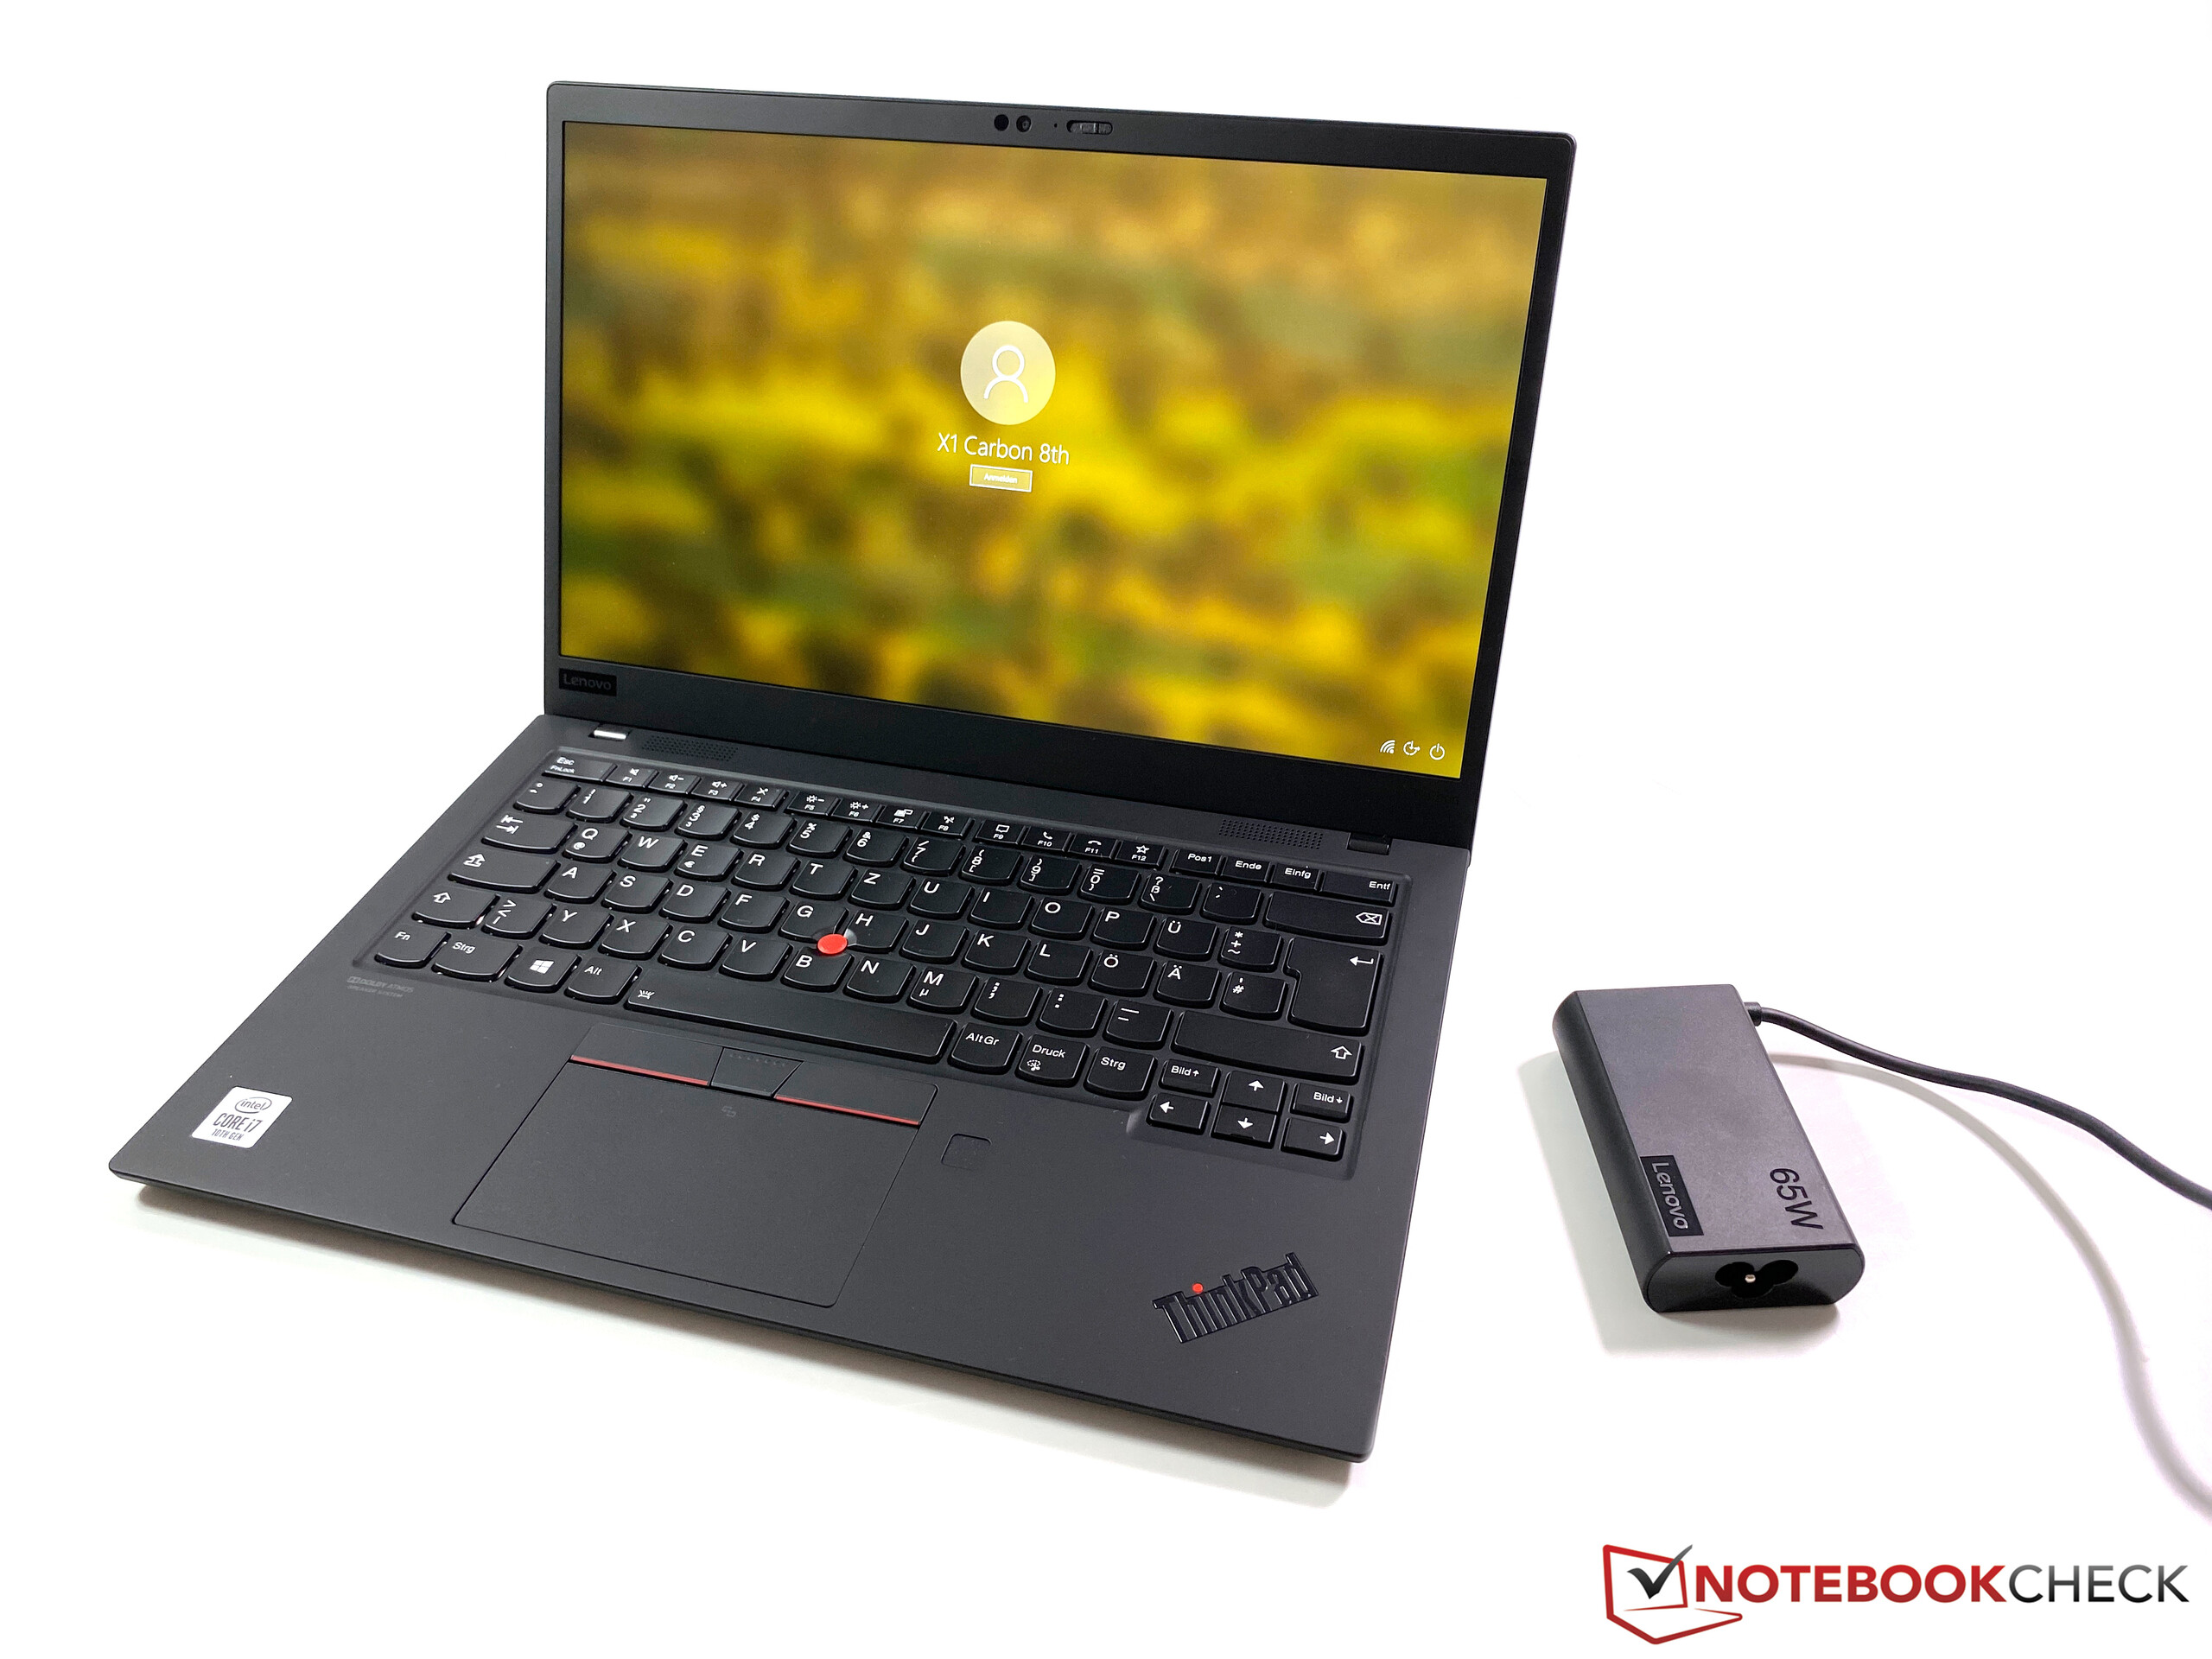
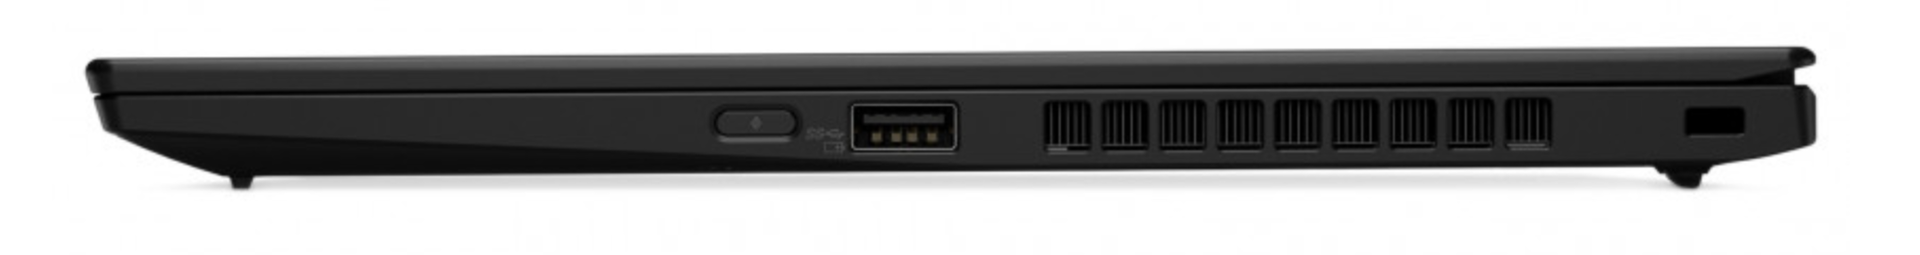
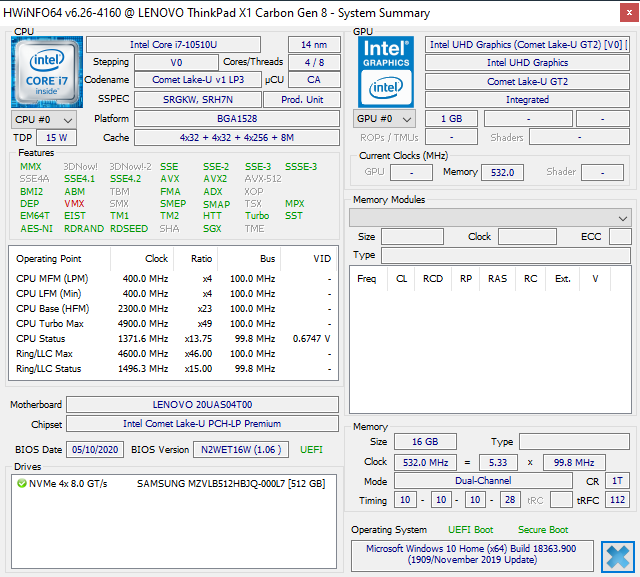
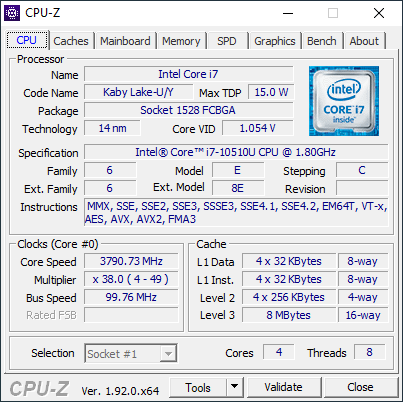
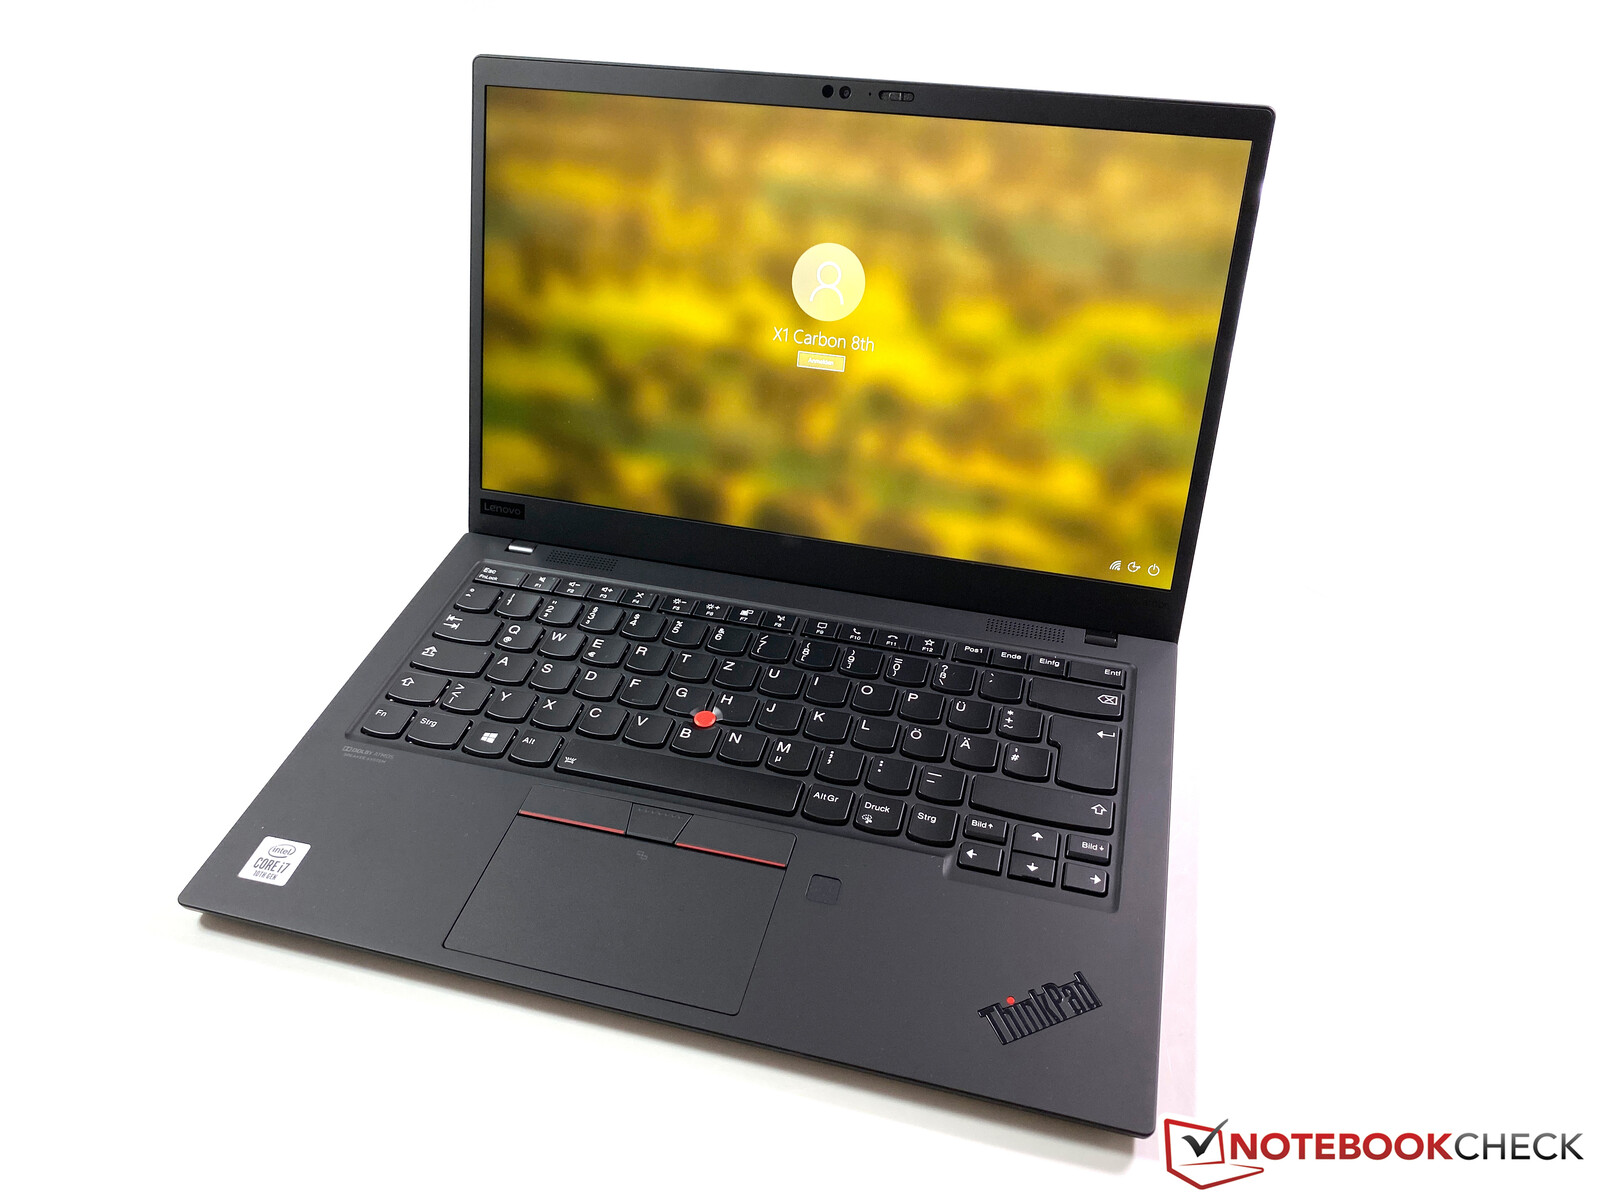
Test du ThinkPad X1 Carbon G8 2020 (i7-10510U, UHD 620, FHD) : PC portable pro connu avec un nouvel adaptateur
Note | Date | Modèle | Poids | Épaisseur | Taille | Résolution | Prix |
|---|---|---|---|---|---|---|---|
| 90.2 % v7 (old) | 08/20 | Lenovo ThinkPad X1 Carbon 2020-20UAS04T00 i7-10510U, UHD Graphics 620 | 1.1 kg | 14.9 mm | 14.00" | 1920x1080 | |
| 90.5 % v7 (old) | 02/19 | HP Elitebook x360 1040 G5 i7-8650U, UHD Graphics 620 | 1.4 kg | 16.9 mm | 14.00" | 1920x1080 | |
| 92.1 % v7 (old) | 07/20 | Apple MacBook Pro 13 2020 2GHz i5 10th-Gen i5-1038NG7, Iris Plus Graphics G7 (Ice Lake 64 EU) | 1.4 kg | 15.6 mm | 13.30" | 2560x1600 | |
| 87.2 % v7 (old) | 09/19 | Dell Latitude 7400-8N6DH i7-8665U, UHD Graphics 620 | 1.5 kg | 18.9 mm | 14.00" | 1920x1080 | |
| 88.5 % v7 (old) | 05/20 | Lenovo ThinkPad X1 Carbon G7 20R1-000YUS i7-10510U, UHD Graphics 620 | 1.2 kg | 15.4 mm | 14.00" | 3840x2160 |


| |||||||||||||||||||||||||
Homogénéité de la luminosité: 90 %
Valeur mesurée au centre, sur batterie: 421 cd/m²
Contraste: 1563:1 (Valeurs des noirs: 0.27 cd/m²)
ΔE ColorChecker Calman: 4.7 | ∀{0.5-29.43 Ø4.72}
calibrated: 2
ΔE Greyscale Calman: 6.4 | ∀{0.09-98 Ø4.97}
91.5% sRGB (Argyll 1.6.3 3D)
59.5% AdobeRGB 1998 (Argyll 1.6.3 3D)
67.1% AdobeRGB 1998 (Argyll 3D)
91.6% sRGB (Argyll 3D)
68.9% Display P3 (Argyll 3D)
Gamma: 2.12
CCT: 7106 K
| Lenovo ThinkPad X1 Carbon 2020-20UAS04T00 BOE NE140FHM-N61, IPS, 1920x1080, 14" | HP Elitebook x360 1040 G5 AU Optronics AUO533D, IPS, 1920x1080, 14" | Apple MacBook Pro 13 2020 2GHz i5 10th-Gen APPA03D, IPS, 2560x1600, 13.3" | Dell Latitude 7400-8N6DH AU Optronics B140HAN, IPS, 1920x1080, 14" | Lenovo ThinkPad X1 Carbon G7 20R1-000YUS BOE NV140QUM-N53, IPS, 3840x2160, 14" | |
|---|---|---|---|---|---|
| Display | -2% | 27% | 0% | 18% | |
| Display P3 Coverage (%) | 68.9 | 64.3 -7% | 98.8 43% | 66.1 -4% | 83 20% |
| sRGB Coverage (%) | 91.6 | 94.1 3% | 99.9 9% | 95.3 4% | 99.7 9% |
| AdobeRGB 1998 Coverage (%) | 67.1 | 65.5 -2% | 86.4 29% | 67.5 1% | 83.1 24% |
| Response Times | -11% | 11% | -10% | 9% | |
| Response Time Grey 50% / Grey 80% * (ms) | 64.8 ? | 70.8 ? -9% | 46 ? 29% | 62 ? 4% | 49.2 ? 24% |
| Response Time Black / White * (ms) | 30.4 ? | 34.4 ? -13% | 32.4 ? -7% | 37.6 ? -24% | 32.2 ? -6% |
| PWM Frequency (Hz) | 2404 ? | 735 ? | 113600 ? | 201.6 ? | |
| Screen | 12% | 29% | 5% | -13% | |
| Brightness middle (cd/m²) | 422 | 416.3 -1% | 512 21% | 289 -32% | 532 26% |
| Brightness (cd/m²) | 395 | 400 1% | 491 24% | 286 -28% | 513 30% |
| Brightness Distribution (%) | 90 | 89 -1% | 91 1% | 91 1% | 90 0% |
| Black Level * (cd/m²) | 0.27 | 0.29 -7% | 0.32 -19% | 0.16 41% | 0.41 -52% |
| Contrast (:1) | 1563 | 1436 -8% | 1600 2% | 1806 16% | 1298 -17% |
| Colorchecker dE 2000 * | 4.7 | 2.69 43% | 1.7 64% | 4.7 -0% | 6.88 -46% |
| Colorchecker dE 2000 max. * | 10 | 4.95 50% | 3.4 66% | 8.7 13% | 12.65 -27% |
| Colorchecker dE 2000 calibrated * | 2 | 2.13 -7% | 1 50% | 1.3 35% | 2.52 -26% |
| Greyscale dE 2000 * | 6.4 | 2.9 55% | 1.9 70% | 6.4 -0% | 10.5 -64% |
| Gamma | 2.12 104% | 2.4 92% | 2.19 100% | 2.54 87% | 1.98 111% |
| CCT | 7106 91% | 6623 98% | 6817 95% | 5977 109% | 7394 88% |
| Color Space (Percent of AdobeRGB 1998) (%) | 59.5 | 60.1 1% | 77.4 30% | 61.2 3% | 74.1 25% |
| Color Space (Percent of sRGB) (%) | 91.5 | 94.5 3% | 99.9 9% | 95.1 4% | 99.7 9% |
| Moyenne finale (programmes/paramètres) | -0% /
6% | 22% /
26% | -2% /
2% | 5% /
-4% |
* ... Moindre est la valeur, meilleures sont les performances
Temps de réponse de l'écran
| ↔ Temps de réponse noir à blanc | ||
|---|---|---|
| 30.4 ms ... hausse ↗ et chute ↘ combinées | ↗ 10.8 ms hausse | 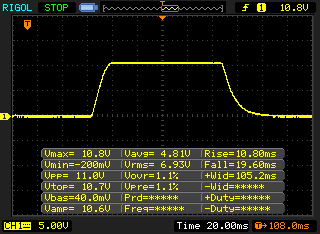 |
| ↘ 19.6 ms chute | ||
| L'écran souffre de latences très élevées, à éviter pour le jeu. En comparaison, tous les appareils testés affichent entre 0.1 (minimum) et 240 (maximum) ms. » 82 % des appareils testés affichent de meilleures performances. Cela signifie que les latences relevées sont moins bonnes que la moyenne (19.8 ms) de tous les appareils testés. | ||
| ↔ Temps de réponse gris 50% à gris 80% | ||
| 64.8 ms ... hausse ↗ et chute ↘ combinées | ↗ 30.8 ms hausse | 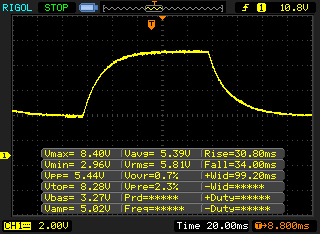 |
| ↘ 34 ms chute | ||
| L'écran souffre de latences très élevées, à éviter pour le jeu. En comparaison, tous les appareils testés affichent entre 0.165 (minimum) et 636 (maximum) ms. » 98 % des appareils testés affichent de meilleures performances. Cela signifie que les latences relevées sont moins bonnes que la moyenne (31 ms) de tous les appareils testés. | ||
Scintillement / MLI (Modulation de largeur d'impulsion)
| Scintillement / MLI (Modulation de largeur d'impulsion) décelé | 2404 Hz | ≤ 50 Niveau de luminosité | 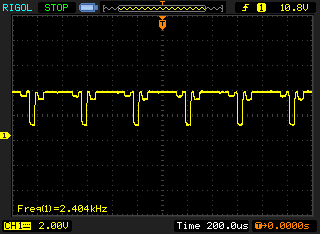 |
Le rétroéclairage de l'écran scintille à la fréquence de 2404 Hz (certainement du fait de l'utilisation d'une MDI - Modulation de largeur d'impulsion) à un niveau de luminosité inférieur ou égal à 50 % . Aucun scintillement ne devrait être perceptible au-dessus de cette valeur. La fréquence de rafraîchissement de 2404 Hz est élevée, la grande majorité des utilisateurs ne devrait pas percevoir de scintillements et être sujette à une fatigue oculaire accrue. En comparaison, 52 % des appareils testés n'emploient pas MDI pour assombrir leur écran. Nous avons relevé une moyenne à 7778 (minimum : 5 - maximum : 343500) Hz dans le cas où une MDI était active. | |||


Cinebench R15: CPU Single 64Bit | CPU Multi 64Bit
Blender: v2.79 BMW27 CPU
7-Zip 18.03: 7z b 4 -mmt1 | 7z b 4
Geekbench 5.5: Single-Core | Multi-Core
HWBOT x265 Benchmark v2.2: 4k Preset
LibreOffice : 20 Documents To PDF
R Benchmark 2.5: Overall mean
| Cinebench R20 / CPU (Single Core) | |
| Moyenne de la classe Subnotebook (128 - 832, n=56, 2 dernières années) | |
| Lenovo ThinkPad X1 Carbon G7 20R1-000YUS | |
| Dell Latitude 7400-8N6DH | |
| Lenovo ThinkPad X1 Carbon 2020-20UAS04T00 | |
| Apple MacBook Pro 13 2020 2GHz i5 10th-Gen | |
| Moyenne Intel Core i7-10510U (362 - 497, n=37) | |
| Cinebench R20 / CPU (Multi Core) | |
| Moyenne de la classe Subnotebook (579 - 8541, n=56, 2 dernières années) | |
| Apple MacBook Pro 13 2020 2GHz i5 10th-Gen | |
| Lenovo ThinkPad X1 Carbon G7 20R1-000YUS | |
| Dell Latitude 7400-8N6DH | |
| Lenovo ThinkPad X1 Carbon 2020-20UAS04T00 | |
| Moyenne Intel Core i7-10510U (1015 - 1897, n=38) | |
| Cinebench R15 / CPU Single 64Bit | |
| Moyenne de la classe Subnotebook (72.4 - 322, n=56, 2 dernières années) | |
| Lenovo ThinkPad X1 Carbon 2020-20UAS04T00 | |
| Lenovo ThinkPad X1 Carbon G7 20R1-000YUS | |
| Dell Latitude 7400-8N6DH | |
| Moyenne Intel Core i7-10510U (113 - 202, n=42) | |
| HP Elitebook x360 1040 G5 | |
| Apple MacBook Pro 13 2020 2GHz i5 10th-Gen | |
| Cinebench R15 / CPU Multi 64Bit | |
| Moyenne de la classe Subnotebook (327 - 3345, n=56, 2 dernières années) | |
| Lenovo ThinkPad X1 Carbon G7 20R1-000YUS | |
| Apple MacBook Pro 13 2020 2GHz i5 10th-Gen | |
| Lenovo ThinkPad X1 Carbon 2020-20UAS04T00 | |
| Dell Latitude 7400-8N6DH | |
| Moyenne Intel Core i7-10510U (482 - 856, n=45) | |
| HP Elitebook x360 1040 G5 | |
| Blender / v2.79 BMW27 CPU | |
| Moyenne Intel Core i7-10510U (628 - 1051, n=31) | |
| Dell Latitude 7400-8N6DH | |
| Lenovo ThinkPad X1 Carbon 2020-20UAS04T00 | |
| Moyenne de la classe Subnotebook (159 - 2271, n=57, 2 dernières années) | |
| Apple MacBook Pro 13 2020 2GHz i5 10th-Gen | |
| 7-Zip 18.03 / 7z b 4 -mmt1 | |
| Moyenne de la classe Subnotebook (2643 - 6699, n=58, 2 dernières années) | |
| Dell Latitude 7400-8N6DH | |
| Moyenne Intel Core i7-10510U (3747 - 4981, n=31) | |
| Lenovo ThinkPad X1 Carbon 2020-20UAS04T00 | |
| Apple MacBook Pro 13 2020 2GHz i5 10th-Gen | |
| 7-Zip 18.03 / 7z b 4 | |
| Moyenne de la classe Subnotebook (11668 - 77867, n=56, 2 dernières années) | |
| Apple MacBook Pro 13 2020 2GHz i5 10th-Gen | |
| Lenovo ThinkPad X1 Carbon 2020-20UAS04T00 | |
| Dell Latitude 7400-8N6DH | |
| Moyenne Intel Core i7-10510U (12196 - 21298, n=31) | |
| Geekbench 5.5 / Single-Core | |
| Moyenne de la classe Subnotebook (726 - 2224, n=48, 2 dernières années) | |
| Apple MacBook Pro 13 2020 2GHz i5 10th-Gen | |
| Lenovo ThinkPad X1 Carbon 2020-20UAS04T00 | |
| Moyenne Intel Core i7-10510U (977 - 1287, n=31) | |
| Geekbench 5.5 / Multi-Core | |
| Moyenne de la classe Subnotebook (2557 - 17218, n=48, 2 dernières années) | |
| Apple MacBook Pro 13 2020 2GHz i5 10th-Gen | |
| Lenovo ThinkPad X1 Carbon 2020-20UAS04T00 | |
| Moyenne Intel Core i7-10510U (2474 - 4484, n=31) | |
| HWBOT x265 Benchmark v2.2 / 4k Preset | |
| Moyenne de la classe Subnotebook (0.97 - 25.1, n=56, 2 dernières années) | |
| Apple MacBook Pro 13 2020 2GHz i5 10th-Gen | |
| Lenovo ThinkPad X1 Carbon 2020-20UAS04T00 | |
| Moyenne Intel Core i7-10510U (3.41 - 6.04, n=31) | |
| Dell Latitude 7400-8N6DH | |
| LibreOffice / 20 Documents To PDF | |
| Apple MacBook Pro 13 2020 2GHz i5 10th-Gen | |
| Moyenne Intel Core i7-10510U (50.7 - 77.8, n=27) | |
| Moyenne de la classe Subnotebook (39.9 - 220, n=55, 2 dernières années) | |
| Lenovo ThinkPad X1 Carbon 2020-20UAS04T00 | |
| R Benchmark 2.5 / Overall mean | |
| Apple MacBook Pro 13 2020 2GHz i5 10th-Gen | |
| Moyenne Intel Core i7-10510U (0.637 - 0.81, n=28) | |
| Lenovo ThinkPad X1 Carbon 2020-20UAS04T00 | |
| Moyenne de la classe Subnotebook (0.4024 - 1.456, n=57, 2 dernières années) | |
* ... Moindre est la valeur, meilleures sont les performances
| PCMark 8 Home Score Accelerated v2 | 4251 points | |
| PCMark 8 Creative Score Accelerated v2 | 5447 points | |
| PCMark 8 Work Score Accelerated v2 | 5296 points | |
| PCMark 10 Score | 4527 points | |
Aide | ||
| DPC Latencies / LatencyMon - interrupt to process latency (max), Web, Youtube, Prime95 | |
| Lenovo ThinkPad X1 Carbon 2020-20UAS04T00 | |
* ... Moindre est la valeur, meilleures sont les performances
| Lenovo ThinkPad X1 Carbon 2020-20UAS04T00 Samsung SSD PM981a MZVLB512HBJQ | HP Elitebook x360 1040 G5 Samsung SSD PM981 MZVLB512HAJQ | Apple MacBook Pro 13 2020 2GHz i5 10th-Gen Apple SSD SM0512F | Dell Latitude 7400-8N6DH Samsung SSD PM981 MZVLB512HAJQ | Lenovo ThinkPad X1 Carbon G7 20R1-000YUS WDC PC SN730 SDBPNTY-512G | Moyenne Samsung SSD PM981a MZVLB512HBJQ | |
|---|---|---|---|---|---|---|
| CrystalDiskMark 5.2 / 6 | -8% | -39% | -12% | -1% | 2% | |
| Write 4K (MB/s) | 185 | 122.7 -34% | 28.16 -85% | 118.6 -36% | 151.5 -18% | 140.8 ? -24% |
| Read 4K (MB/s) | 50.6 | 46.57 -8% | 17.5 -65% | 44.68 -12% | 45.83 -9% | 48.6 ? -4% |
| Write Seq (MB/s) | 1543 | 1725 12% | 1195 -23% | 1866 21% | 2060 34% | 2106 ? 36% |
| Read Seq (MB/s) | 1509 | 2392 59% | 1470 -3% | 2173 44% | 1973 31% | 2099 ? 39% |
| Write 4K Q32T1 (MB/s) | 488.8 | 470.6 -4% | 205 -58% | 330.9 -32% | 489.8 0% | 451 ? -8% |
| Read 4K Q32T1 (MB/s) | 579 | 313.2 -46% | 692 20% | 343.1 -41% | 386.2 -33% | 482 ? -17% |
| Write Seq Q32T1 (MB/s) | 2986 | 1869 -37% | 1475 -51% | 1927 -35% | 2703 -9% | 2903 ? -3% |
| Read Seq Q32T1 (MB/s) | 3555 | 3380 -5% | 1920 -46% | 3528 -1% | 3376 -5% | 3511 ? -1% |
| AS SSD | -24% | -127% | -31% | -49% | -21% | |
| Seq Read (MB/s) | 2659 | 1816 -32% | 1300 -51% | 2381 -10% | 1786 -33% | 2412 ? -9% |
| Seq Write (MB/s) | 2551 | 1270 -50% | 1518 -40% | 1290 -49% | 1259 -51% | 1983 ? -22% |
| 4K Read (MB/s) | 56.4 | 46.25 -18% | 14.09 -75% | 52 -8% | 45.86 -19% | 53.1 ? -6% |
| 4K Write (MB/s) | 158 | 104.1 -34% | 24.25 -85% | 134.8 -15% | 147.9 -6% | 131.1 ? -17% |
| 4K-64 Read (MB/s) | 1317 | 1342 2% | 725 -45% | 530 -60% | 885 -33% | 1201 ? -9% |
| 4K-64 Write (MB/s) | 1786 | 1209 -32% | 169.6 -91% | 1177 -34% | 950 -47% | 1726 ? -3% |
| Access Time Read * (ms) | 0.047 | 0.043 9% | 0.172 -266% | 0.05 -6% | 0.058 -23% | 0.05525 ? -18% |
| Access Time Write * (ms) | 0.024 | 0.035 -46% | 0.155 -546% | 0.032 -33% | 0.074 -208% | 0.05394 ? -125% |
| Score Read (Points) | 1640 | 1569 -4% | 869 -47% | 820 -50% | 1110 -32% | 1495 ? -9% |
| Score Write (Points) | 2199 | 1440 -35% | 346 -84% | 1441 -34% | 1224 -44% | 2055 ? -7% |
| Score Total (Points) | 4682 | 3790 -19% | 1667 -64% | 2652 -43% | 2885 -38% | 4303 ? -8% |
| Copy ISO MB/s (MB/s) | 2034 | 1719 | 1384 | 1894 ? | ||
| Copy Program MB/s (MB/s) | 450.3 | 499.6 | 525 | 539 ? | ||
| Copy Game MB/s (MB/s) | 1024 | 1091 | 1008 | 1193 ? | ||
| Moyenne finale (programmes/paramètres) | -16% /
-17% | -83% /
-90% | -22% /
-23% | -25% /
-29% | -10% /
-11% |
* ... Moindre est la valeur, meilleures sont les performances

Dauerleistung Lesen: DiskSpd Read Loop, Queue Depth 8
| 3DMark 11 Performance | 2240 points | |
| 3DMark Ice Storm Standard Score | 71820 points | |
| 3DMark Cloud Gate Standard Score | 9816 points | |
| 3DMark Fire Strike Score | 1239 points | |
| 3DMark Time Spy Score | 497 points | |
Aide | ||
| Bas | Moyen | Élevé | Ultra | 4K | |
|---|---|---|---|---|---|
| The Witcher 3 (2015) | 18.2 | 12.1 | |||
| Dota 2 Reborn (2015) | 85.8 | 49.6 | 23 | 20.2 | 7.3 |
| X-Plane 11.11 (2018) | 13.9 | 10.3 | 10.9 | 6.59 | |
| Far Cry 5 (2018) | 16 | ||||
| F1 2019 (2019) | 30 | 12 |
Degré de la nuisance sonore
| Au repos |
| 29.5 / 29.5 / 29.5 dB(A) |
| Fortement sollicité |
| 31.6 / 33.9 dB(A) |
 | ||
30 dB silencieux 40 dB(A) audible 50 dB(A) bruyant |
||
min: | ||
| Lenovo ThinkPad X1 Carbon 2020-20UAS04T00 UHD Graphics 620, i7-10510U, Samsung SSD PM981a MZVLB512HBJQ | HP Elitebook x360 1040 G5 UHD Graphics 620, i7-8650U, Samsung SSD PM981 MZVLB512HAJQ | Apple MacBook Pro 13 2020 2GHz i5 10th-Gen Iris Plus Graphics G7 (Ice Lake 64 EU), i5-1038NG7, Apple SSD SM0512F | Dell Latitude 7400-8N6DH UHD Graphics 620, i7-8665U, Samsung SSD PM981 MZVLB512HAJQ | Lenovo ThinkPad X1 Carbon G7 20R1-000YUS UHD Graphics 620, i7-10510U, WDC PC SN730 SDBPNTY-512G | Lenovo ThinkPad X1 Carbon 2019-20QE000VGE UHD Graphics 620, i7-8665U, WDC PC SN720 SDAQNTW-512G | |
|---|---|---|---|---|---|---|
| Noise | 1% | -6% | 0% | -2% | 3% | |
| arrêt / environnement * (dB) | 29.5 | 28.3 4% | 29.6 -0% | 28.6 3% | 28.2 4% | 28.4 4% |
| Idle Minimum * (dB) | 29.5 | 28.3 4% | 29.6 -0% | 28.6 3% | 28.2 4% | 28.4 4% |
| Idle Average * (dB) | 29.5 | 28.3 4% | 29.6 -0% | 28.6 3% | 28.2 4% | 28.4 4% |
| Idle Maximum * (dB) | 29.5 | 28.3 4% | 29.6 -0% | 29.1 1% | 29.4 -0% | 28.6 3% |
| Load Average * (dB) | 31.6 | 32.6 -3% | 34.4 -9% | 31.5 -0% | 31.5 -0% | 31.5 -0% |
| Load Maximum * (dB) | 33.9 | 36.6 -8% | 42.1 -24% | 36.9 -9% | 41.2 -22% | 33.1 2% |
| Witcher 3 ultra * (dB) | 36.1 |
* ... Moindre est la valeur, meilleures sont les performances
(-) La température maximale du côté supérieur est de 45.2 °C / 113 F, par rapport à la moyenne de 35.9 °C / 97 F, allant de 21.4 à 59 °C pour la classe Subnotebook.
(-) Le fond chauffe jusqu'à un maximum de 45.7 °C / 114 F, contre une moyenne de 39.2 °C / 103 F
(+) En utilisation inactive, la température moyenne du côté supérieur est de 24.1 °C / 75 F, par rapport à la moyenne du dispositif de 30.8 °C / 87 F.
(+) Les repose-poignets et le pavé tactile sont plus froids que la température de la peau avec un maximum de 28.8 °C / 83.8 F et sont donc froids au toucher.
(±) La température moyenne de la zone de l'appui-paume de dispositifs similaires était de 28.2 °C / 82.8 F (-0.6 °C / #-1 F).
| Éteint/en veille | |
| Au repos | |
| Fortement sollicité |
|
Légende:
min: | |
| Lenovo ThinkPad X1 Carbon 2020-20UAS04T00 i7-10510U, UHD Graphics 620, Samsung SSD PM981a MZVLB512HBJQ, IPS, 1920x1080, 14" | HP Elitebook x360 1040 G5 i7-8650U, UHD Graphics 620, Samsung SSD PM981 MZVLB512HAJQ, IPS, 1920x1080, 14" | Apple MacBook Pro 13 2020 2GHz i5 10th-Gen i5-1038NG7, Iris Plus Graphics G7 (Ice Lake 64 EU), Apple SSD SM0512F, IPS, 2560x1600, 13.3" | Dell Latitude 7400-8N6DH i7-8665U, UHD Graphics 620, Samsung SSD PM981 MZVLB512HAJQ, IPS, 1920x1080, 14" | Lenovo ThinkPad X1 Carbon G7 20R1-000YUS i7-10510U, UHD Graphics 620, WDC PC SN730 SDBPNTY-512G, IPS, 3840x2160, 14" | Moyenne Intel UHD Graphics 620 | Moyenne de la classe Subnotebook | |
|---|---|---|---|---|---|---|---|
| Power Consumption | 1% | -22% | -6% | -31% | 0% | -6% | |
| Idle Minimum * (Watt) | 2.96 | 2.7 9% | 3.8 -28% | 3.9 -32% | 3.5 -18% | 3.81 ? -29% | 3.86 ? -30% |
| Idle Average * (Watt) | 5.9 | 6.5 -10% | 8.6 -46% | 6.1 -3% | 10.8 -83% | 6.94 ? -18% | 6.61 ? -12% |
| Idle Maximum * (Watt) | 9.1 | 11.5 -26% | 10.3 -13% | 8.2 10% | 12.5 -37% | 8.75 ? 4% | 8 ? 12% |
| Load Average * (Watt) | 42.1 | 38.7 8% | 52.1 -24% | 41 3% | 47.2 -12% | 35 ? 17% | 42.2 ? -0% |
| Load Maximum * (Watt) | 65.1 | 50.5 22% | 65.2 -0% | 69.7 -7% | 68.8 -6% | 47.5 ? 27% | 64.5 ? 1% |
| Witcher 3 ultra * (Watt) | 48.2 |
* ... Moindre est la valeur, meilleures sont les performances
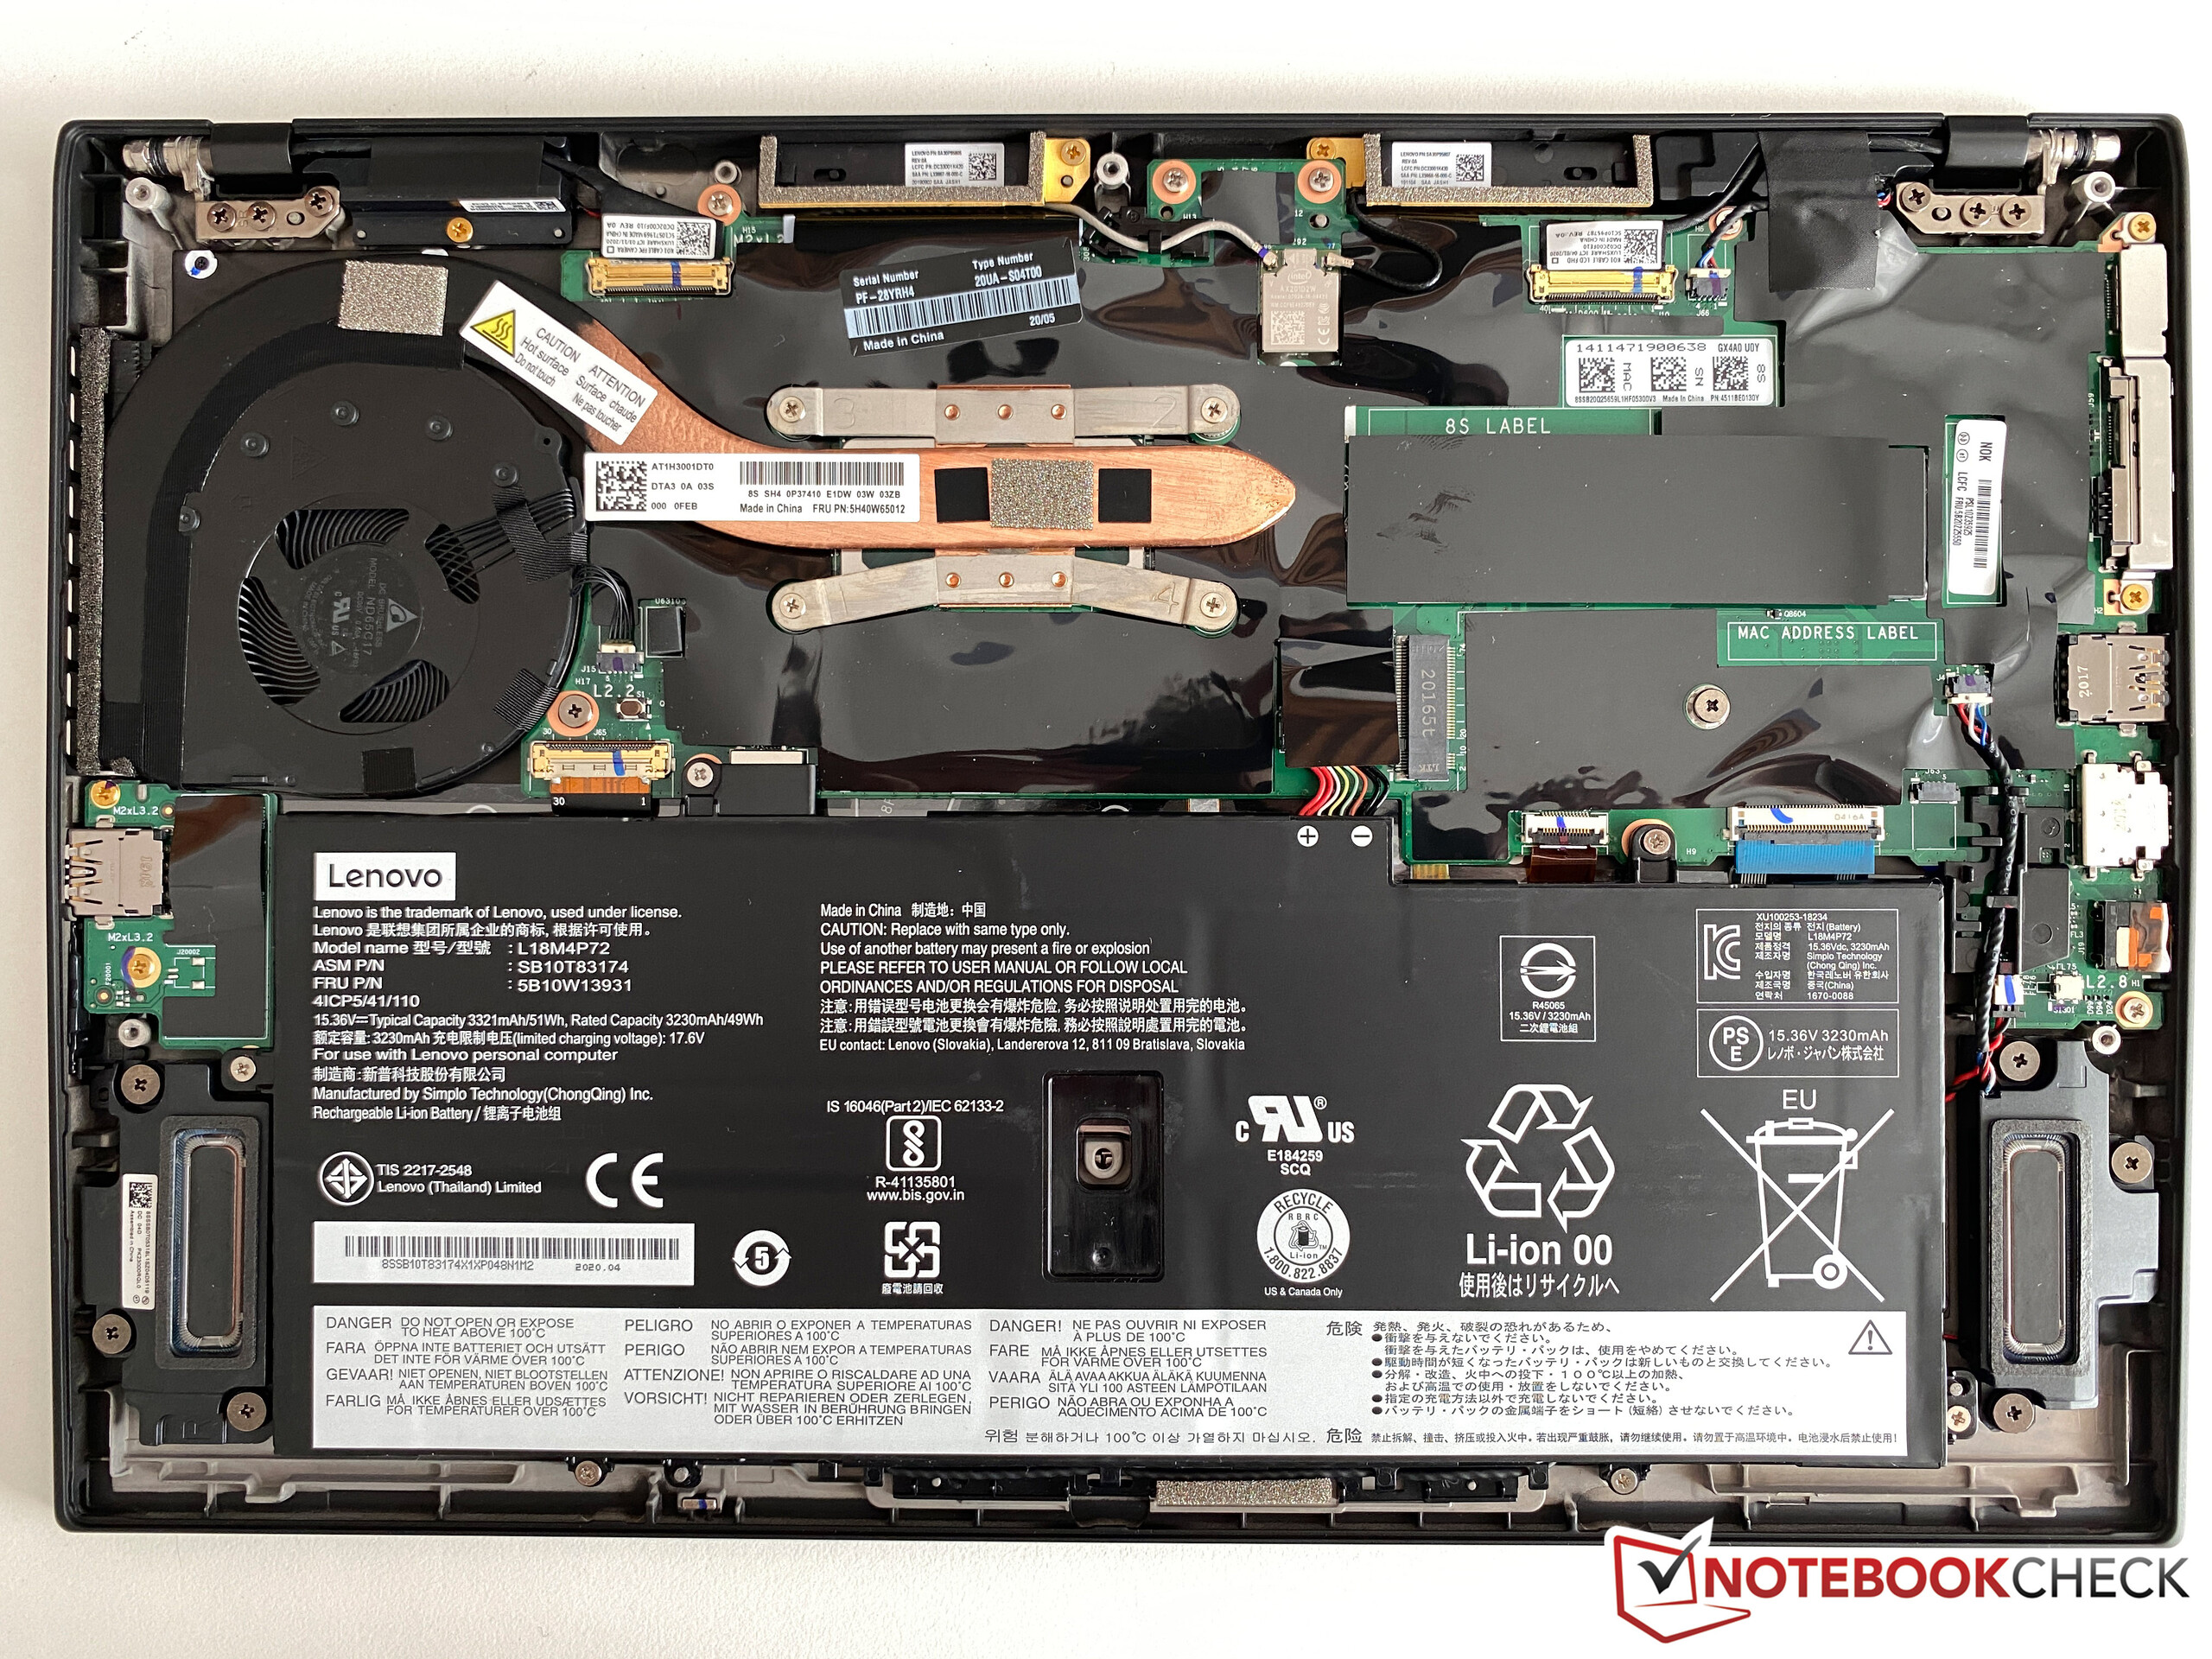
| Lenovo ThinkPad X1 Carbon 2020-20UAS04T00 i7-10510U, UHD Graphics 620, 51 Wh | HP Elitebook x360 1040 G5 i7-8650U, UHD Graphics 620, 56 Wh | Apple MacBook Pro 13 2020 2GHz i5 10th-Gen i5-1038NG7, Iris Plus Graphics G7 (Ice Lake 64 EU), 58 Wh | Dell Latitude 7400-8N6DH i7-8665U, UHD Graphics 620, 60 Wh | Lenovo ThinkPad X1 Carbon G7 20R1-000YUS i7-10510U, UHD Graphics 620, 51 Wh | Lenovo ThinkPad X1 Carbon 2019-20QES01L00 i7-8565U, UHD Graphics 620, 51 Wh | Moyenne de la classe Subnotebook | |
|---|---|---|---|---|---|---|---|
| Autonomie de la batterie | 49% | 5% | 26% | -1% | -12% | 27% | |
| H.264 (h) | 12.8 | 11.5 -10% | 14.4 13% | 11.5 -10% | 15.4 ? 20% | ||
| WiFi v1.3 (h) | 10.1 | 10.4 3% | 12.1 20% | 11.6 15% | 10 -1% | 9.4 -7% | 14 ? 39% |
| Load (h) | 1.6 | 3.1 94% | 2.4 50% | 1.3 -19% | 1.969 ? 23% | ||
| Reader / Idle (h) | 27.9 | 28.6 ? |
Points positifs
Points négatifs
Verdict
Après que le ThinkPad X1 Carbon ait eu une mise à niveau majeure l'an dernier, il faudra cette fois se contenter d'une petite évolution. Certaines régions avaient déjà eu un processeur Comet Lake dans la génération G7 de 2019 ; la 8e génération du X1 Carbone utilise maintenant un nouveau processeur partout dans le monde. Cependant, les différences de processeur et de graphismes sont négligeables, et ne justifient pas le remplacement de l'appareil. La seule vraie nouveauté est le module Wifi 6.
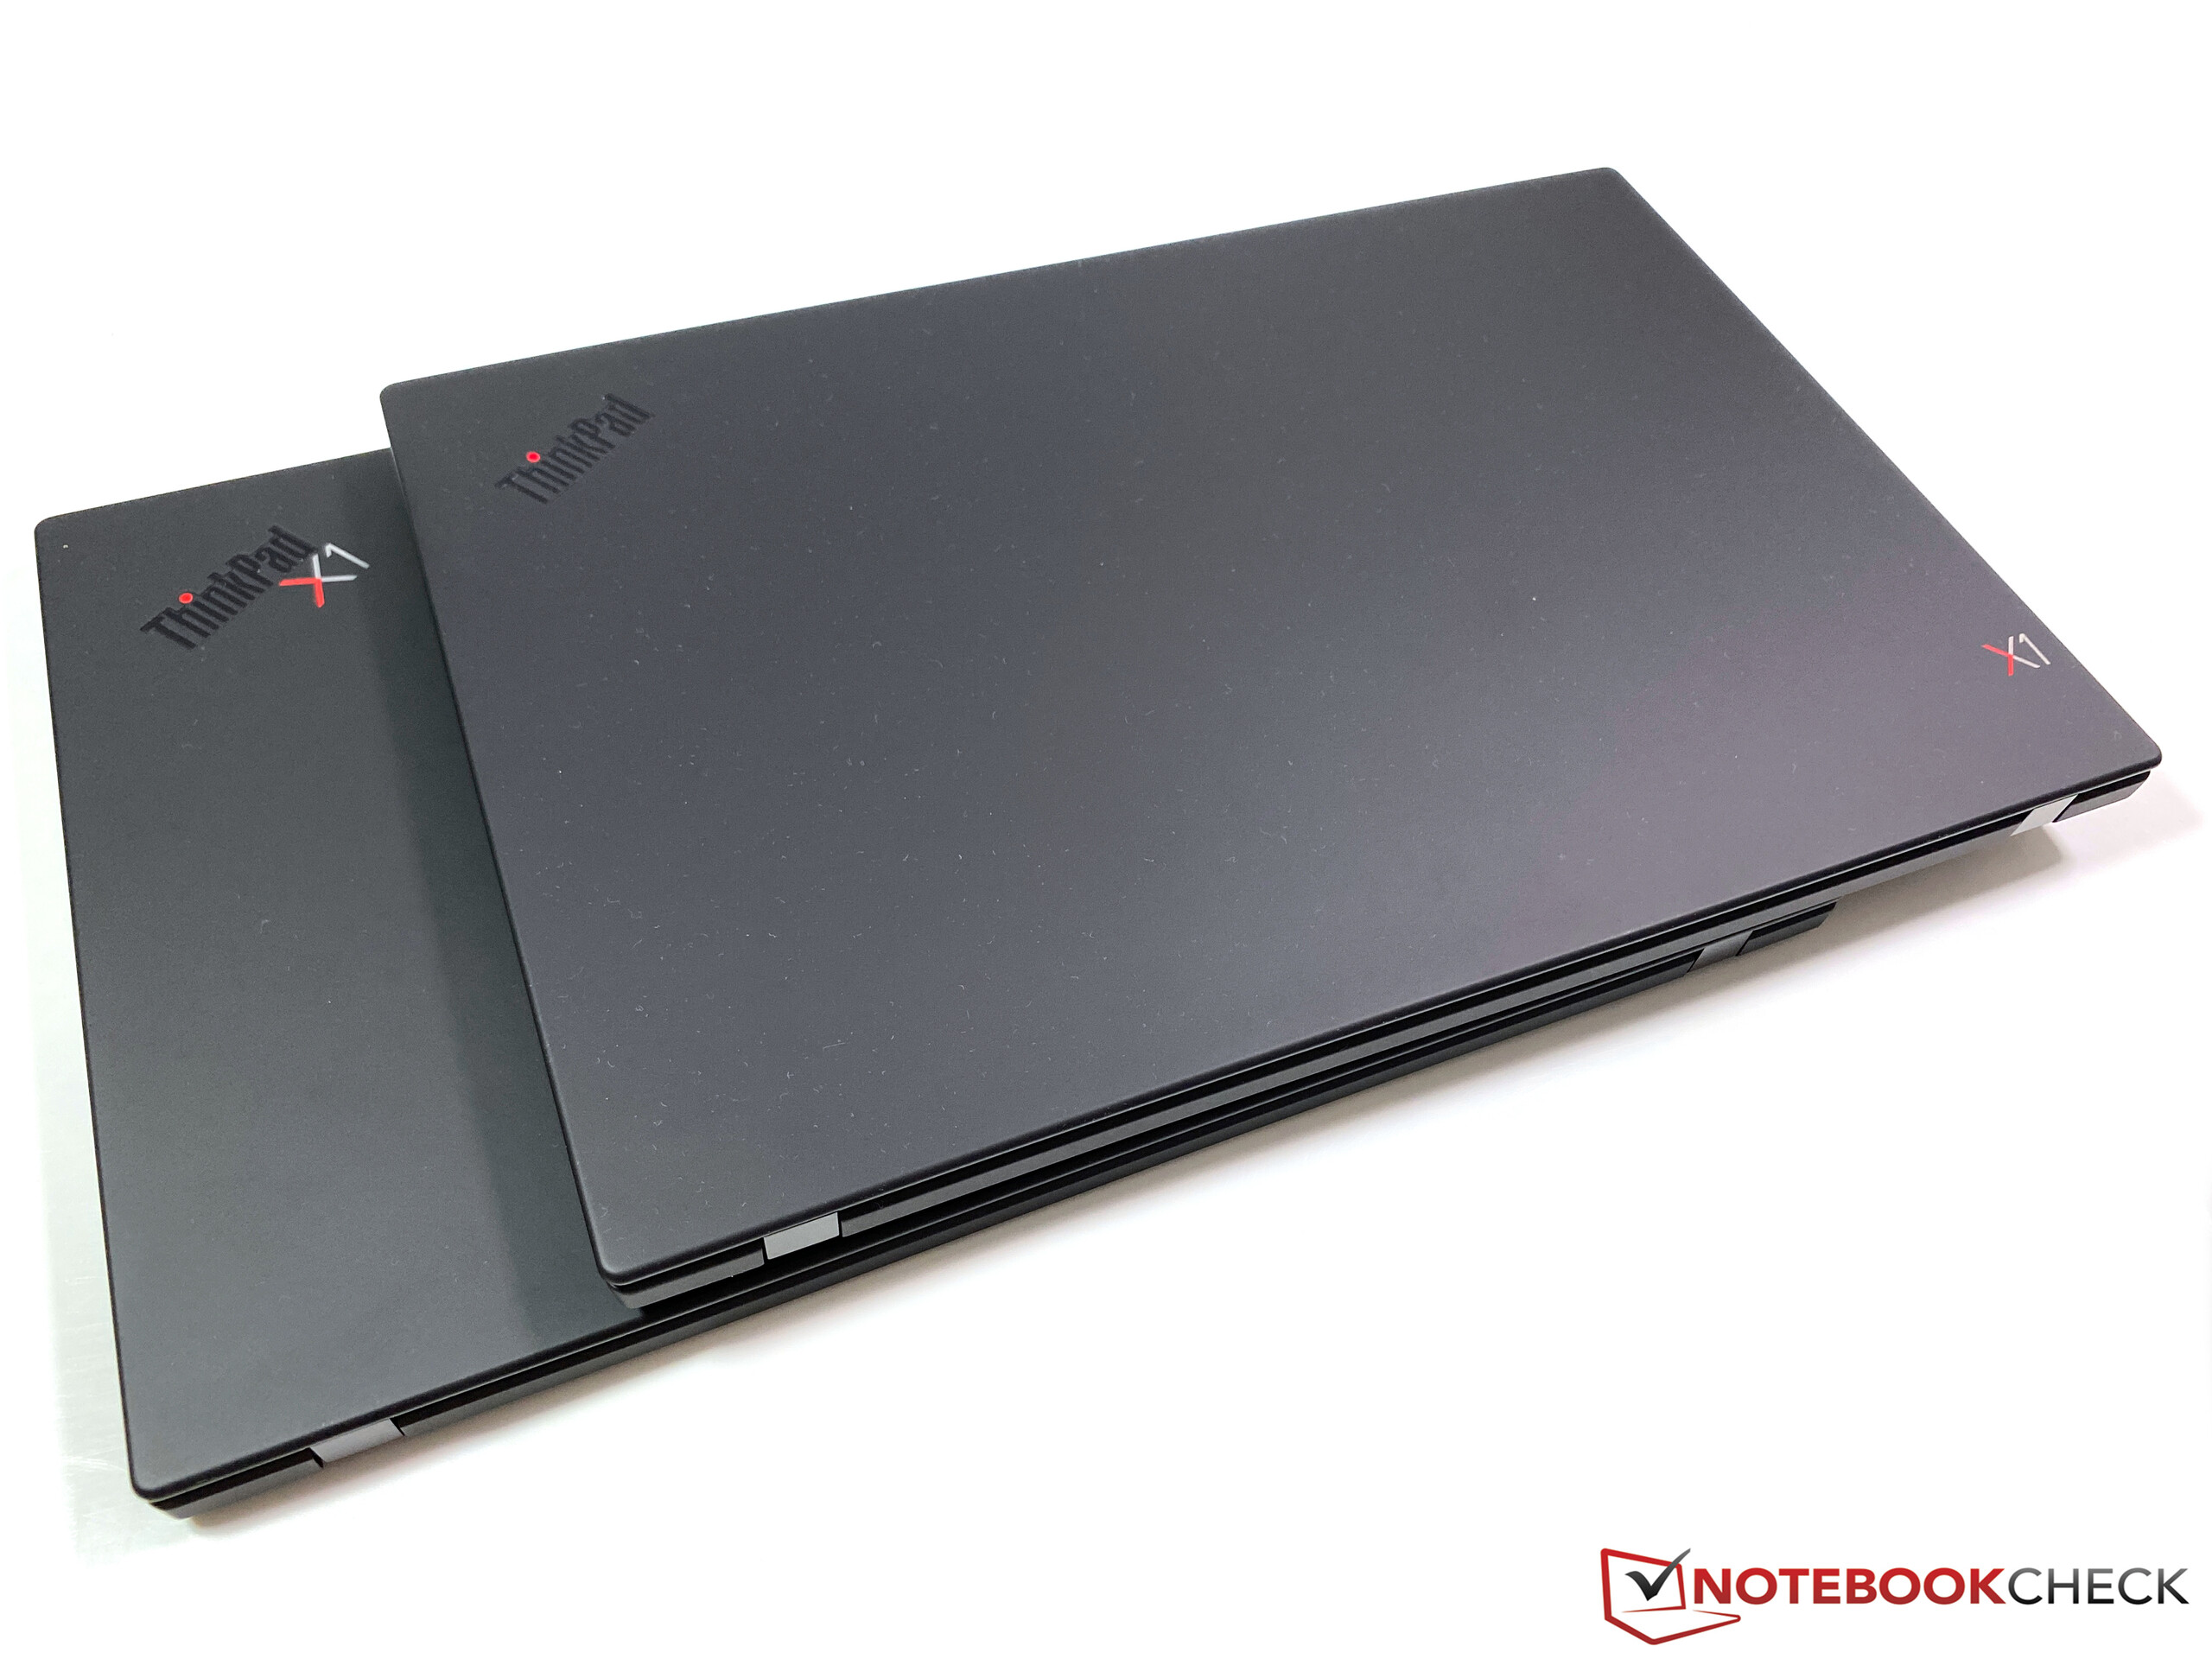
Même s'il n'y a pas de grosse mise à jour, le ThinkPad X1 Carbon reste un très bon PC portable professionnel, avec un châssis extrêmement léger et rigide. Mais on retrouve les mêmes problèmes, comme la loterie d'écran pour la version 1080p LowPower. Le clavier est également un peu moins bon depuis le changement de châssis l'an dernier - il faut avouer que nous chipotons, mais le fleuron des ThinkPad ne possède plus le meilleur châssis possible, les machines plus épaisses (comme la série T) ont pris l'avantage à cet égard.
Lenovo n'utilise pas de processeur AMD pour la série X1, si bien que le passage à la 8e génération n'est qu'une mise à jour mineure. C'est toujours un très bon PC portable pro, mais le nouveau ThinkPad T14S de Lenovo (avec SoC AMD) pourrait être son principal concurrent.
Alors une mise à niveau s'impose-t-elle ? Le seul vrai avantage par rapport au modèle 2019 est le passage au Wifi 6 - ainsi que l'adaptateur légèrement plus compact. Mais cela ne suffit pas vraiment pour justifier un changement. Nous avons également hâte de tester le nouveau ThinkPad T14s. Il intègre un nouveau châssis et devrait se rapprocher encore un peu plus du X1 Carbon, avec en plus des versions AMD. Si nous regardons les premiers résultats du ThinkPad E15 à petit prix avec AMD 4000, alors le T14s AMD devrait être bien plus performant que le X1 Carbon.
L’intégralité de cette critique est disponible en anglais en suivant ce lien.
Lenovo ThinkPad X1 Carbon 2020-20UAS04T00
- 07/01/2020 v7 (old)
Andreas Osthoff
Price comparison
