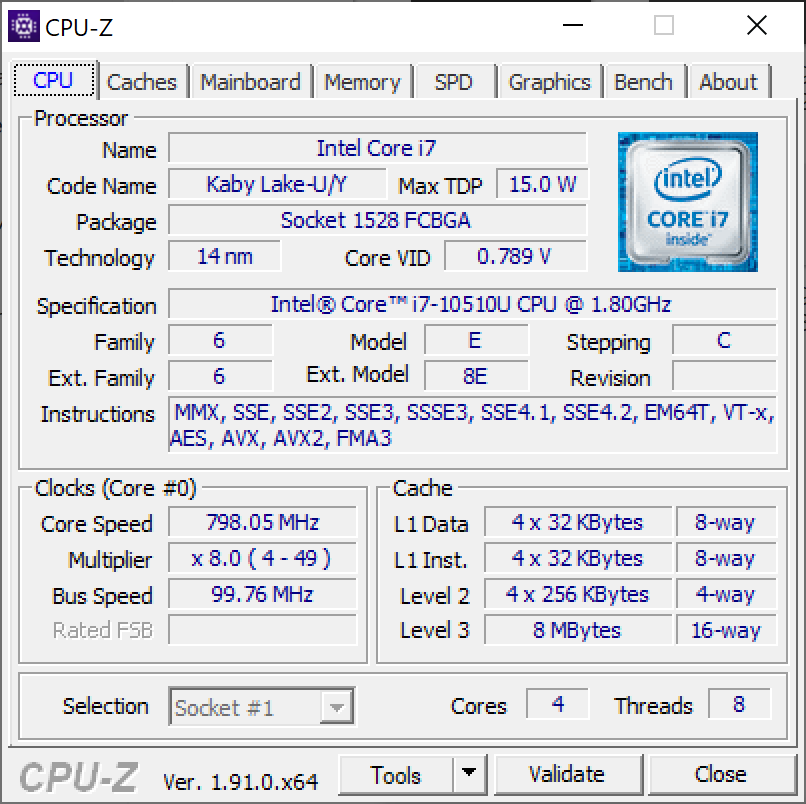
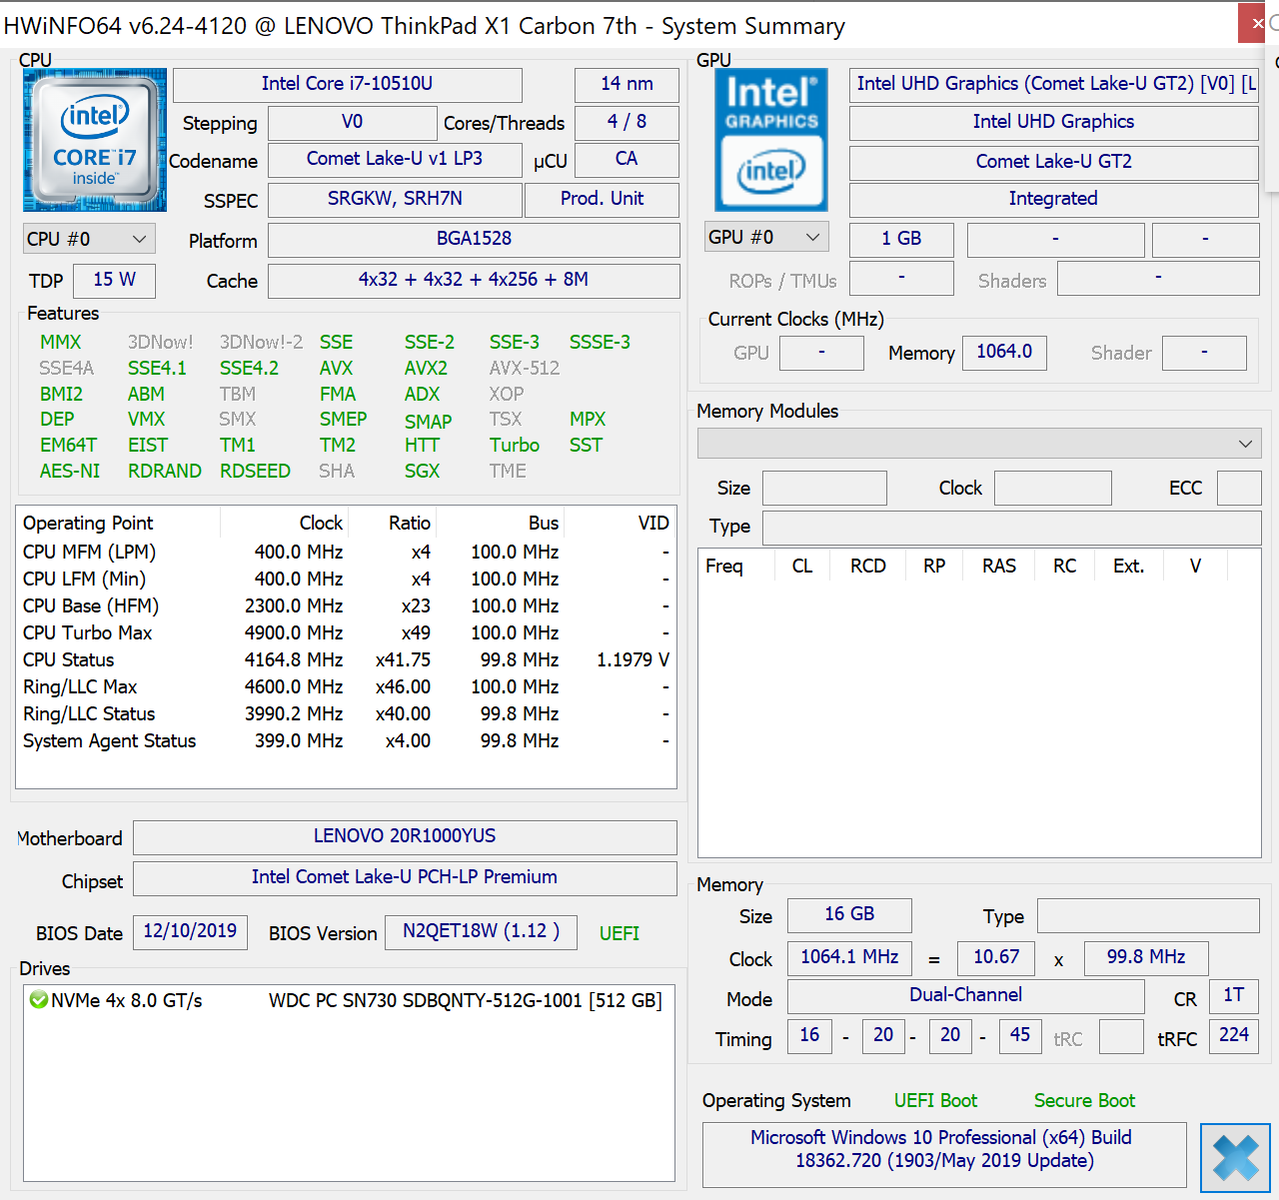
Test du Lenovo ThinkPad X1 Carbon G7 2020 (i7-10510U, UHD 620, 4K UHD) : même apparence, nouveau processeur
Note | Date | Modèle | Poids | Épaisseur | Taille | Résolution | Prix |
|---|---|---|---|---|---|---|---|
| 88.5 % v7 (old) | 05/20 | Lenovo ThinkPad X1 Carbon G7 20R1-000YUS i7-10510U, UHD Graphics 620 | 1.2 kg | 15.4 mm | 14.00" | 3840x2160 | |
| 89.6 % v7 (old) | 08/19 | Lenovo ThinkPad X1 Yoga 2019-20QGS00A00 i7-8565U, UHD Graphics 620 | 1.3 kg | 15.5 mm | 14.00" | 1920x1080 | |
| 87.4 % v7 (old) | 06/19 | Lenovo ThinkPad T490-20N3S02L00 i7-8565U, GeForce MX250 | 1.5 kg | 17.9 mm | 14.00" | 1920x1080 | |
| 90.1 % v7 (old) | 04/20 | Lenovo ThinkPad X1 Carbon 2019-20QE000VGE i7-8665U, UHD Graphics 620 | 1.1 kg | 14.9 mm | 14.00" | 2560x1440 | |
| 83.9 % v7 (old) | 01/20 | Microsoft Surface Laptop 3 15 i7-1065G7 i7-1065G7, Iris Plus Graphics G7 (Ice Lake 64 EU) | 1.5 kg | 14.7 mm | 15.00" | 2496x1664 |

| |||||||||||||||||||||||||
Homogénéité de la luminosité: 90 %
Valeur mesurée au centre, sur batterie: 532 cd/m²
Contraste: 1298:1 (Valeurs des noirs: 0.41 cd/m²)
ΔE ColorChecker Calman: 6.88 | ∀{0.5-29.43 Ø4.71}
calibrated: 2.52
ΔE Greyscale Calman: 10.5 | ∀{0.09-98 Ø4.96}
99.7% sRGB (Argyll 1.6.3 3D)
74.1% AdobeRGB 1998 (Argyll 1.6.3 3D)
83.1% AdobeRGB 1998 (Argyll 3D)
99.7% sRGB (Argyll 3D)
83% Display P3 (Argyll 3D)
Gamma: 1.98
CCT: 7394 K
| Lenovo ThinkPad X1 Carbon G7 20R1-000YUS BOE NV140QUM-N53, IPS, 14", 3840x2160 | Lenovo ThinkPad X1 Carbon 2019-20QD00M7GE N140HCR-GA2, IPS, 14", 1920x1080 | Lenovo ThinkPad X1 Carbon 2018-20KGS5DU00 LP140QH2-SPB1, IPS, 14", 2560x1440 | Lenovo ThinkPad X1 Carbon G6-20KG0025UK Lenovo LEN40A9 / AUO B140HAK02.3, IPS, 14", 1920x1080 | Lenovo ThinkPad X1 Carbon 2017-20HR0021GE B140HAN03_1, IPS, 14", 1920x1080 | Lenovo ThinkPad X1 Carbon Touch 20A7-002DGE LG Philips LP140GH1-SPA2, IPS-Panel, 14", 2560x1440 | |
|---|---|---|---|---|---|---|
| Display | -11% | -8% | -13% | -21% | -30% | |
| Display P3 Coverage (%) | 83 | 68.3 -18% | 72.7 -12% | 68.3 -18% | 61.6 -26% | 54.1 -35% |
| sRGB Coverage (%) | 99.7 | 98.6 -1% | 97.9 -2% | 94.9 -5% | 87.6 -12% | 77.5 -22% |
| AdobeRGB 1998 Coverage (%) | 83.1 | 70.3 -15% | 74.6 -10% | 69.3 -17% | 62.6 -25% | 55.2 -34% |
| Response Times | 17% | 21% | 21% | 4% | ||
| Response Time Grey 50% / Grey 80% * (ms) | 49.2 ? | 40.8 ? 17% | 38 ? 23% | 40 ? 19% | 48 ? 2% | |
| Response Time Black / White * (ms) | 32.2 ? | 27.2 ? 16% | 26 ? 19% | 25 ? 22% | 30.4 ? 6% | |
| PWM Frequency (Hz) | 201.6 ? | 25000 ? | ||||
| Screen | 20% | 1% | 19% | 11% | -11% | |
| Brightness middle (cd/m²) | 532 | 406 -24% | 316 -41% | 298 -44% | 278 -48% | 228 -57% |
| Brightness (cd/m²) | 513 | 372 -27% | 311 -39% | 287 -44% | 271 -47% | 226 -56% |
| Brightness Distribution (%) | 90 | 88 -2% | 84 -7% | 91 1% | 91 1% | 89 -1% |
| Black Level * (cd/m²) | 0.41 | 0.25 39% | 0.35 15% | 0.2 51% | 0.16 61% | 0.23 44% |
| Contrast (:1) | 1298 | 1624 25% | 903 -30% | 1490 15% | 1738 34% | 991 -24% |
| Colorchecker dE 2000 * | 6.88 | 2.9 58% | 4.5 35% | 2.19 68% | 4.5 35% | 6.29 9% |
| Colorchecker dE 2000 max. * | 12.65 | 6.1 52% | 10.3 19% | 4.39 65% | 8.4 34% | |
| Colorchecker dE 2000 calibrated * | 2.52 | 1.1 56% | 1.6 37% | 1.67 34% | ||
| Greyscale dE 2000 * | 10.5 | 4.4 58% | 7.7 27% | 1.97 81% | 3.2 70% | 7.79 26% |
| Gamma | 1.98 111% | 2.24 98% | 2.2 100% | 2.43 91% | 2.02 109% | 2.36 93% |
| CCT | 7394 88% | 5967 109% | 6639 98% | 6571 99% | 7042 92% | 5531 118% |
| Color Space (Percent of AdobeRGB 1998) (%) | 74.1 | 63.4 -14% | 68.6 -7% | 62 -16% | 57 -23% | 51.7 -30% |
| Color Space (Percent of sRGB) (%) | 99.7 | 98.6 -1% | 97.9 -2% | 95 -5% | 87.5 -12% | |
| Moyenne finale (programmes/paramètres) | 9% /
14% | 5% /
2% | 9% /
13% | -2% /
3% | -21% /
-16% |
* ... Moindre est la valeur, meilleures sont les performances
Temps de réponse de l'écran
| ↔ Temps de réponse noir à blanc | ||
|---|---|---|
| 32.2 ms ... hausse ↗ et chute ↘ combinées | ↗ 19.2 ms hausse | 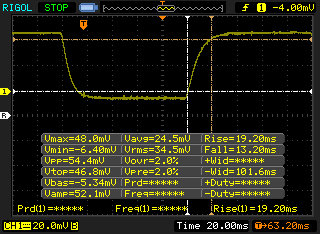 |
| ↘ 13.2 ms chute | ||
| L'écran souffre de latences très élevées, à éviter pour le jeu. En comparaison, tous les appareils testés affichent entre 0.1 (minimum) et 240 (maximum) ms. » 88 % des appareils testés affichent de meilleures performances. Cela signifie que les latences relevées sont moins bonnes que la moyenne (19.8 ms) de tous les appareils testés. | ||
| ↔ Temps de réponse gris 50% à gris 80% | ||
| 49.2 ms ... hausse ↗ et chute ↘ combinées | ↗ 22 ms hausse | 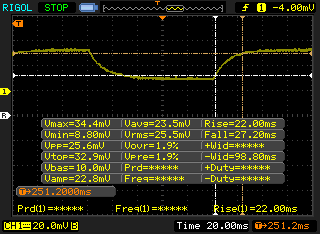 |
| ↘ 27.2 ms chute | ||
| L'écran souffre de latences très élevées, à éviter pour le jeu. En comparaison, tous les appareils testés affichent entre 0.165 (minimum) et 636 (maximum) ms. » 85 % des appareils testés affichent de meilleures performances. Cela signifie que les latences relevées sont moins bonnes que la moyenne (30.9 ms) de tous les appareils testés. | ||
Scintillement / MLI (Modulation de largeur d'impulsion)
| Scintillement / MLI (Modulation de largeur d'impulsion) décelé | 201.6 Hz | ≤ 99 Niveau de luminosité | 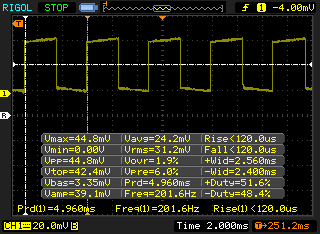 |
Le rétroéclairage de l'écran scintille à la fréquence de 201.6 Hz (certainement du fait de l'utilisation d'une MDI - Modulation de largeur d'impulsion) à un niveau de luminosité inférieur ou égal à 99 % . Aucun scintillement ne devrait être perceptible au-dessus de cette valeur. La fréquence de rafraîchissement de 201.6 Hz est relativement faible, les personnes les plus sensibles devraient percevoir un scintillement et être sujettes à une fatigue oculaire accrue (avec le niveau de luminosité indiqué) En comparaison, 52 % des appareils testés n'emploient pas MDI pour assombrir leur écran. Nous avons relevé une moyenne à 7744 (minimum : 5 - maximum : 343500) Hz dans le cas où une MDI était active. | |||
| Cinebench R11.5 | |
| CPU Single 64Bit | |
| Dell XPS 13 7390 Core i7-10710U | |
| Moyenne Intel Core i7-10510U (n=1) | |
| Lenovo ThinkPad L13 Yoga 20R6S00800 | |
| CPU Multi 64Bit | |
| Dell XPS 13 7390 Core i7-10710U | |
| Moyenne Intel Core i7-10510U (n=1) | |
| Lenovo ThinkPad L13 Yoga 20R6S00800 | |
| Cinebench R10 | |
| Rendering Multiple CPUs 32Bit | |
| Dell XPS 13 7390 Core i7-10710U | |
| Moyenne Intel Core i7-10510U (6763 - 26265, n=3) | |
| Rendering Single 32Bit | |
| Dell XPS 13 7390 Core i7-10710U | |
| Moyenne Intel Core i7-10510U (5740 - 7748, n=3) | |
| wPrime 2.10 - 1024m | |
| Dell XPS 13 7390 Core i7-10710U | |
* ... Moindre est la valeur, meilleures sont les performances
| PCMark 8 Home Score Accelerated v2 | 3182 points | |
| PCMark 8 Work Score Accelerated v2 | 4396 points | |
| PCMark 10 Score | 4219 points | |
Aide | ||
| Lenovo ThinkPad X1 Carbon G7 20R1-000YUS WDC PC SN730 SDBPNTY-512G | Lenovo ThinkPad X1 Carbon 2019-20QE000VGE WDC PC SN720 SDAQNTW-512G | Lenovo ThinkPad X1 Extreme 2019 20QV000WGE Samsung SSD PM981 MZVLB512HAJQ | Lenovo ThinkPad X1 Yoga 2019-20QGS00A00 WDC PC SN720 SDAPNTW-512G | Lenovo ThinkPad X1 Carbon 2018-20KGS5DU00 Samsung SSD PM981 MZVLB512HAJQ | |
|---|---|---|---|---|---|
| AS SSD | 40% | 47% | 31% | 3% | |
| Seq Read (MB/s) | 1786 | 2978 67% | 2352 32% | 2888 62% | 2399 34% |
| Seq Write (MB/s) | 1259 | 2287 82% | 2106 67% | 2381 89% | 1343 7% |
| 4K Read (MB/s) | 45.86 | 47.39 3% | 55 20% | 45.66 0% | 46.21 1% |
| 4K Write (MB/s) | 147.9 | 175.6 19% | 138.1 -7% | 162.4 10% | 109.4 -26% |
| 4K-64 Read (MB/s) | 885 | 1209 37% | 1265 43% | 1276 44% | 664 -25% |
| 4K-64 Write (MB/s) | 950 | 1148 21% | 1952 105% | 1432 51% | 1020 7% |
| Access Time Read * (ms) | 0.058 | 0.053 9% | 0.088 -52% | 0.056 3% | |
| Access Time Write * (ms) | 0.074 | 0.023 69% | 0.027 64% | 0.023 69% | 0.033 55% |
| Score Read (Points) | 1110 | 1554 40% | 1556 40% | 1610 45% | 950 -14% |
| Score Write (Points) | 1224 | 1553 27% | 2301 88% | 1832 50% | 1264 3% |
| Score Total (Points) | 2885 | 3874 34% | 4650 61% | 4245 47% | 2659 -8% |
| Copy ISO MB/s (MB/s) | 1384 | 1810 31% | |||
| Copy Program MB/s (MB/s) | 525 | 498.3 -5% | |||
| Copy Game MB/s (MB/s) | 1008 | 921 -9% | |||
| CrystalDiskMark 5.2 / 6 | 9% | 1% | 10% | -24% | |
| Write 4K (MB/s) | 151.5 | 196.9 30% | 148.1 -2% | 194.3 28% | 98.6 -35% |
| Read 4K (MB/s) | 45.83 | 51.3 12% | 47.31 3% | 51.2 12% | 39.75 -13% |
| Write Seq (MB/s) | 2060 | 1715 -17% | 1414 -31% | 1773 -14% | 1757 -15% |
| Read Seq (MB/s) | 1973 | 2464 25% | 1320 -33% | 2512 27% | 1169 -41% |
| Write 4K Q32T1 (MB/s) | 489.8 | 429.1 -12% | 493.6 1% | 431.7 -12% | 333.8 -32% |
| Read 4K Q32T1 (MB/s) | 386.2 | 542 40% | 594 54% | 539 40% | 268 -31% |
| Write Seq Q32T1 (MB/s) | 2703 | 2521 -7% | 2970 10% | 2538 -6% | 2069 -23% |
| Read Seq Q32T1 (MB/s) | 3376 | 3481 3% | 3472 3% | 3489 3% | 3426 1% |
| Write 4K Q8T8 (MB/s) | 867 | ||||
| Read 4K Q8T8 (MB/s) | 1315 | ||||
| Moyenne finale (programmes/paramètres) | 25% /
26% | 24% /
28% | 21% /
23% | -11% /
-8% |
* ... Moindre est la valeur, meilleures sont les performances

| 3DMark 11 Performance | 2232 points | |
| 3DMark Ice Storm Standard Score | 61083 points | |
| 3DMark Cloud Gate Standard Score | 9117 points | |
| 3DMark Fire Strike Score | 1218 points | |
| 3DMark Time Spy Score | 485 points | |
Aide | ||
| Bas | Moyen | Élevé | Ultra | |
|---|---|---|---|---|
| BioShock Infinite (2013) | 81.2 | 39.7 | 34.3 | 11 |
| The Witcher 3 (2015) | 20.7 | 11 | ||
| Rocket League (2017) | 44 | 27.7 | 20.6 | |
| Shadow of the Tomb Raider (2018) | 14 |
| Lenovo ThinkPad X1 Carbon G7 20R1-000YUS UHD Graphics 620, i7-10510U, WDC PC SN730 SDBPNTY-512G | Lenovo ThinkPad X1 Extreme 2019 20QV000WGE GeForce GTX 1650 Mobile, i7-9750H, Samsung SSD PM981 MZVLB512HAJQ | Lenovo ThinkPad X1 Yoga 2019-20QGS00A00 UHD Graphics 620, i7-8565U, WDC PC SN720 SDAPNTW-512G | Lenovo ThinkPad X1 Carbon 2017-20HR0021GE HD Graphics 620, i5-7200U, Toshiba THNSF5256GPUK | Lenovo ThinkPad X1 Carbon G6-20KG0025UK UHD Graphics 620, i5-8350U, Lenovo LENSE20256GMSP34MEAT2TA | Lenovo ThinkPad X1 Carbon Touch 20A7-002DGE HD Graphics 5000, 4550U, Samsung MZNTD512HAGL | |
|---|---|---|---|---|---|---|
| Noise | -1% | -0% | -4% | 0% | 2% | |
| arrêt / environnement * (dB) | 28.2 | 28.5 -1% | 29.3 -4% | 29.6 -5% | 30.25 -7% | |
| Idle Minimum * (dB) | 28.2 | 28.5 -1% | 29.3 -4% | 29.6 -5% | 30.25 -7% | 28.8 -2% |
| Idle Average * (dB) | 28.2 | 28.5 -1% | 29.3 -4% | 29.6 -5% | 30.25 -7% | 28.8 -2% |
| Idle Maximum * (dB) | 29.4 | 28.5 3% | 31.1 -6% | 32.2 -10% | 30.25 -3% | 28.8 2% |
| Load Average * (dB) | 31.5 | 36.3 -15% | 32.7 -4% | 34.2 -9% | 31.3 1% | 33.7 -7% |
| Load Maximum * (dB) | 41.2 | 36.3 12% | 32.7 21% | 36.1 12% | 31.3 24% | 34 17% |
| Witcher 3 ultra * (dB) | 36.3 |
* ... Moindre est la valeur, meilleures sont les performances
Degré de la nuisance sonore
| Au repos |
| 28.2 / 28.2 / 29.4 dB(A) |
| Fortement sollicité |
| 31.5 / 41.2 dB(A) |
 | ||
30 dB silencieux 40 dB(A) audible 50 dB(A) bruyant |
||
min: | ||
(+) La température maximale du côté supérieur est de 33.6 °C / 92 F, par rapport à la moyenne de 34.3 °C / 94 F, allant de 21.2 à 62.5 °C pour la classe Office.
(+) Le fond chauffe jusqu'à un maximum de 32.2 °C / 90 F, contre une moyenne de 36.8 °C / 98 F
(+) En utilisation inactive, la température moyenne du côté supérieur est de 22.6 °C / 73 F, par rapport à la moyenne du dispositif de 29.5 °C / 85 F.
(+) Les repose-poignets et le pavé tactile sont plus froids que la température de la peau avec un maximum de 22.6 °C / 72.7 F et sont donc froids au toucher.
(+) La température moyenne de la zone de l'appui-paume de dispositifs similaires était de 27.6 °C / 81.7 F (+5 °C / #9 F).
| Éteint/en veille | |
| Au repos | |
| Fortement sollicité |
|
Légende:
min: | |
| Lenovo ThinkPad X1 Carbon G7 20R1-000YUS i7-10510U, UHD Graphics 620, WDC PC SN730 SDBPNTY-512G, IPS, 3840x2160, 14" | Lenovo ThinkPad X1 Extreme 2019 20QV000WGE i7-9750H, GeForce GTX 1650 Mobile, Samsung SSD PM981 MZVLB512HAJQ, IPS, 3840x2160, 15.6" | Lenovo ThinkPad X1 Carbon 2019-20QE000VGE i7-8665U, UHD Graphics 620, WDC PC SN720 SDAQNTW-512G, IPS, 2560x1440, 14" | Lenovo ThinkPad X1 Carbon G6-20KG0025UK i5-8350U, UHD Graphics 620, Lenovo LENSE20256GMSP34MEAT2TA, IPS, 1920x1080, 14" | Lenovo ThinkPad X1 Carbon 2017-20HR0021GE i5-7200U, HD Graphics 620, Toshiba THNSF5256GPUK, IPS, 1920x1080, 14" | Lenovo ThinkPad X1 Carbon Touch 20A7-002DGE 4550U, HD Graphics 5000, Samsung MZNTD512HAGL, IPS-Panel, 2560x1440, 14" | |
|---|---|---|---|---|---|---|
| Power Consumption | -83% | 20% | 25% | 25% | 25% | |
| Idle Minimum * (Watt) | 3.5 | 8.5 -143% | 3 14% | 4.7 -34% | 3.8 -9% | 4.1 -17% |
| Idle Average * (Watt) | 10.8 | 14.7 -36% | 6.3 42% | 7.3 32% | 7.1 34% | 8.7 19% |
| Idle Maximum * (Watt) | 12.5 | 19.4 -55% | 8.9 29% | 9.4 25% | 8.3 34% | 10.2 18% |
| Load Average * (Watt) | 47.2 | 89.6 -90% | 40.8 14% | 28 41% | 34.2 28% | 26.3 44% |
| Load Maximum * (Watt) | 68.8 | 129.8 -89% | 67.5 2% | 28.2 59% | 43.3 37% | 26.7 61% |
| Witcher 3 ultra * (Watt) | 96.1 |
* ... Moindre est la valeur, meilleures sont les performances
| Lenovo ThinkPad X1 Carbon G7 20R1-000YUS i7-10510U, UHD Graphics 620, 51 Wh | Lenovo ThinkPad X1 Carbon 2019-20QD00M7GE i5-8265U, UHD Graphics 620, 51 Wh | Lenovo ThinkPad X1 Carbon 2018-20KGS5DU00 i5-8550U, UHD Graphics 620, 57 Wh | Lenovo ThinkPad X1 Carbon G6-20KG0025UK i5-8350U, UHD Graphics 620, 57 Wh | Lenovo ThinkPad X1 Carbon 2017-20HR0021GE i5-7200U, HD Graphics 620, 57 Wh | Lenovo ThinkPad X1 Carbon Touch 20A7-002DGE 4550U, HD Graphics 5000, 45 Wh | |
|---|---|---|---|---|---|---|
| Autonomie de la batterie | -24% | -10% | 4% | -9% | ||
| WiFi v1.3 (h) | 10 | 7.6 -24% | 9 -10% | 10.4 4% | 9.1 -9% | |
| Reader / Idle (h) | 24.5 | 13.7 | 12.1 | |||
| Load (h) | 1.9 | 2 | 1.8 | |||
| WiFi (h) | 6.5 |
Points positifs
Points négatifs

Ceux qui voudraient un nouveau Lenovo ThinkPad X1 Carbon ont tout intérêt à bien choisir la meilleure version possible, d’autant que la machine n’est pas donnée. Nous recommandons d’éviter la version Core i7-10510U, qui est à peu près aussi performante que les versions Core i5-8265U ou Core i7-8565U. Seule la version hexacœur Core i7-10710U permettra une hausse substantielle des performances du processeur par rapport aux générations précédentes. Pour le quotidien, investir dans plus de RAM, dans la 4G LTE ou dans un écran plus lumineux sera plus utile que de prendre un processeur de 10e génération.
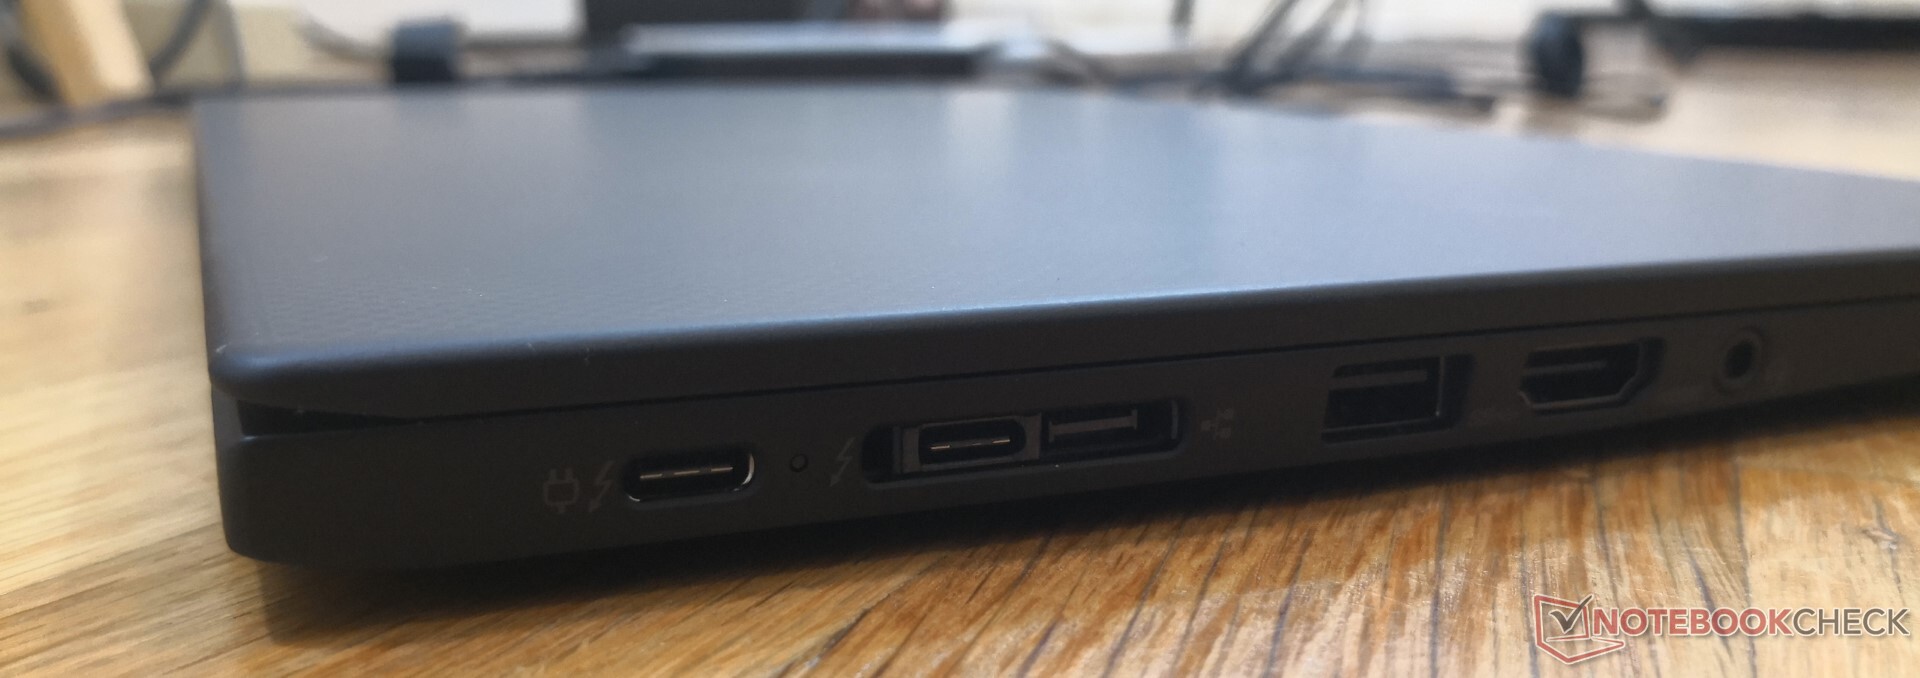
Les défauts principaux de l’appareil nécessiteront une refonte totale pour être corrigés. L’absence de Wifi 6, de lecteur de carte SD, et de meilleure option graphique gâchent le potentiel du X1 Carbon. La présence de MLI sur l’écran le plus lumineux est également décevante, les versions précédentes n’ayant pas ce problème. La fréquence cyclique du processeur en cas de grosses sollicitations empêche d’exploiter un bon Turbo Boost sur de longues périodes - il est tout de suite moins intéressant d’acquérir les processeurs dernier cri quand on ne peut les exploiter à leur maximum.
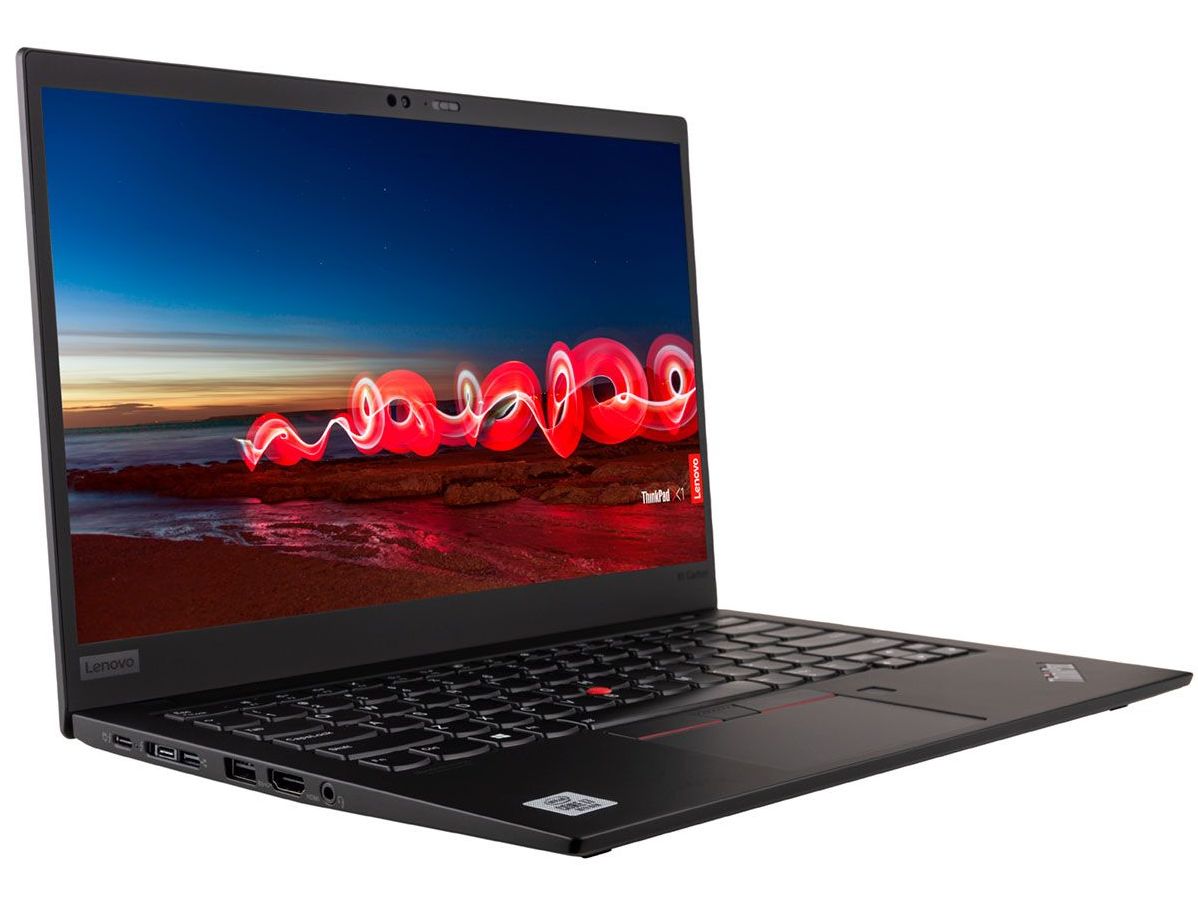
Combinez un portable Yoga fin et un ThinkPad de série T, et vous aurez le ThinkPad X1 Carbon. C’est l’un des ThinkPad les plus portables et les plus séduisants du moment, mais il faut accepter des compromis. Et le choix d’un modèle de l’an dernier permettra d’avoir à peu près le même niveau de performances, pour un prix moins élevé…
L’intégralité de cette critique est disponible en anglais en suivant ce lien.
Lenovo ThinkPad X1 Carbon G7 20R1-000YUS
- 06/22/2020 v7 (old)
Allen Ngo
Price comparison
