Courte critique de la station de travail Fujitsu Celsius H980 (i7-8750H, Quadro P3200, FHD)
| SD Card Reader | |
| average JPG Copy Test (av. of 3 runs) | |
| HP ZBook 17 G5-2ZC48EA (Toshiba Exceria Pro SDXC 64 GB UHS-II) | |
| Lenovo ThinkPad P72-20MB000EGE (Toshiba Exceria Pro SDXC 64 GB UHS-II) | |
| Fujitsu Celsius H980 (Toshiba Exceria Pro SDXC 64 GB UHS-II) | |
| Moyenne de la classe Workstation (49.6 - 681, n=14, 2 dernières années) | |
| Fujitsu Celsius H970 (Toshiba Exceria Pro SDXC 64 GB UHS-II) | |
| maximum AS SSD Seq Read Test (1GB) | |
| Moyenne de la classe Workstation (87.6 - 1455, n=14, 2 dernières années) | |
| Lenovo ThinkPad P72-20MB000EGE (Toshiba Exceria Pro SDXC 64 GB UHS-II) | |
| HP ZBook 17 G5-2ZC48EA (Toshiba Exceria Pro SDXC 64 GB UHS-II) | |
| Fujitsu Celsius H980 (Toshiba Exceria Pro SDXC 64 GB UHS-II) | |
| Fujitsu Celsius H970 (Toshiba Exceria Pro SDXC 64 GB UHS-II) | |
| Networking | |
| iperf3 transmit AX12 | |
| HP ZBook 17 G5-2ZC48EA | |
| Fujitsu Celsius H980 | |
| Lenovo ThinkPad P72-20MB000EGE | |
| Dell Precision 7720 | |
| Fujitsu Celsius H970 | |
| iperf3 receive AX12 | |
| Fujitsu Celsius H980 | |
| Lenovo ThinkPad P72-20MB000EGE | |
| Fujitsu Celsius H970 | |
| HP ZBook 17 G5-2ZC48EA | |
| Dell Precision 7720 | |
| |||||||||||||||||||||||||
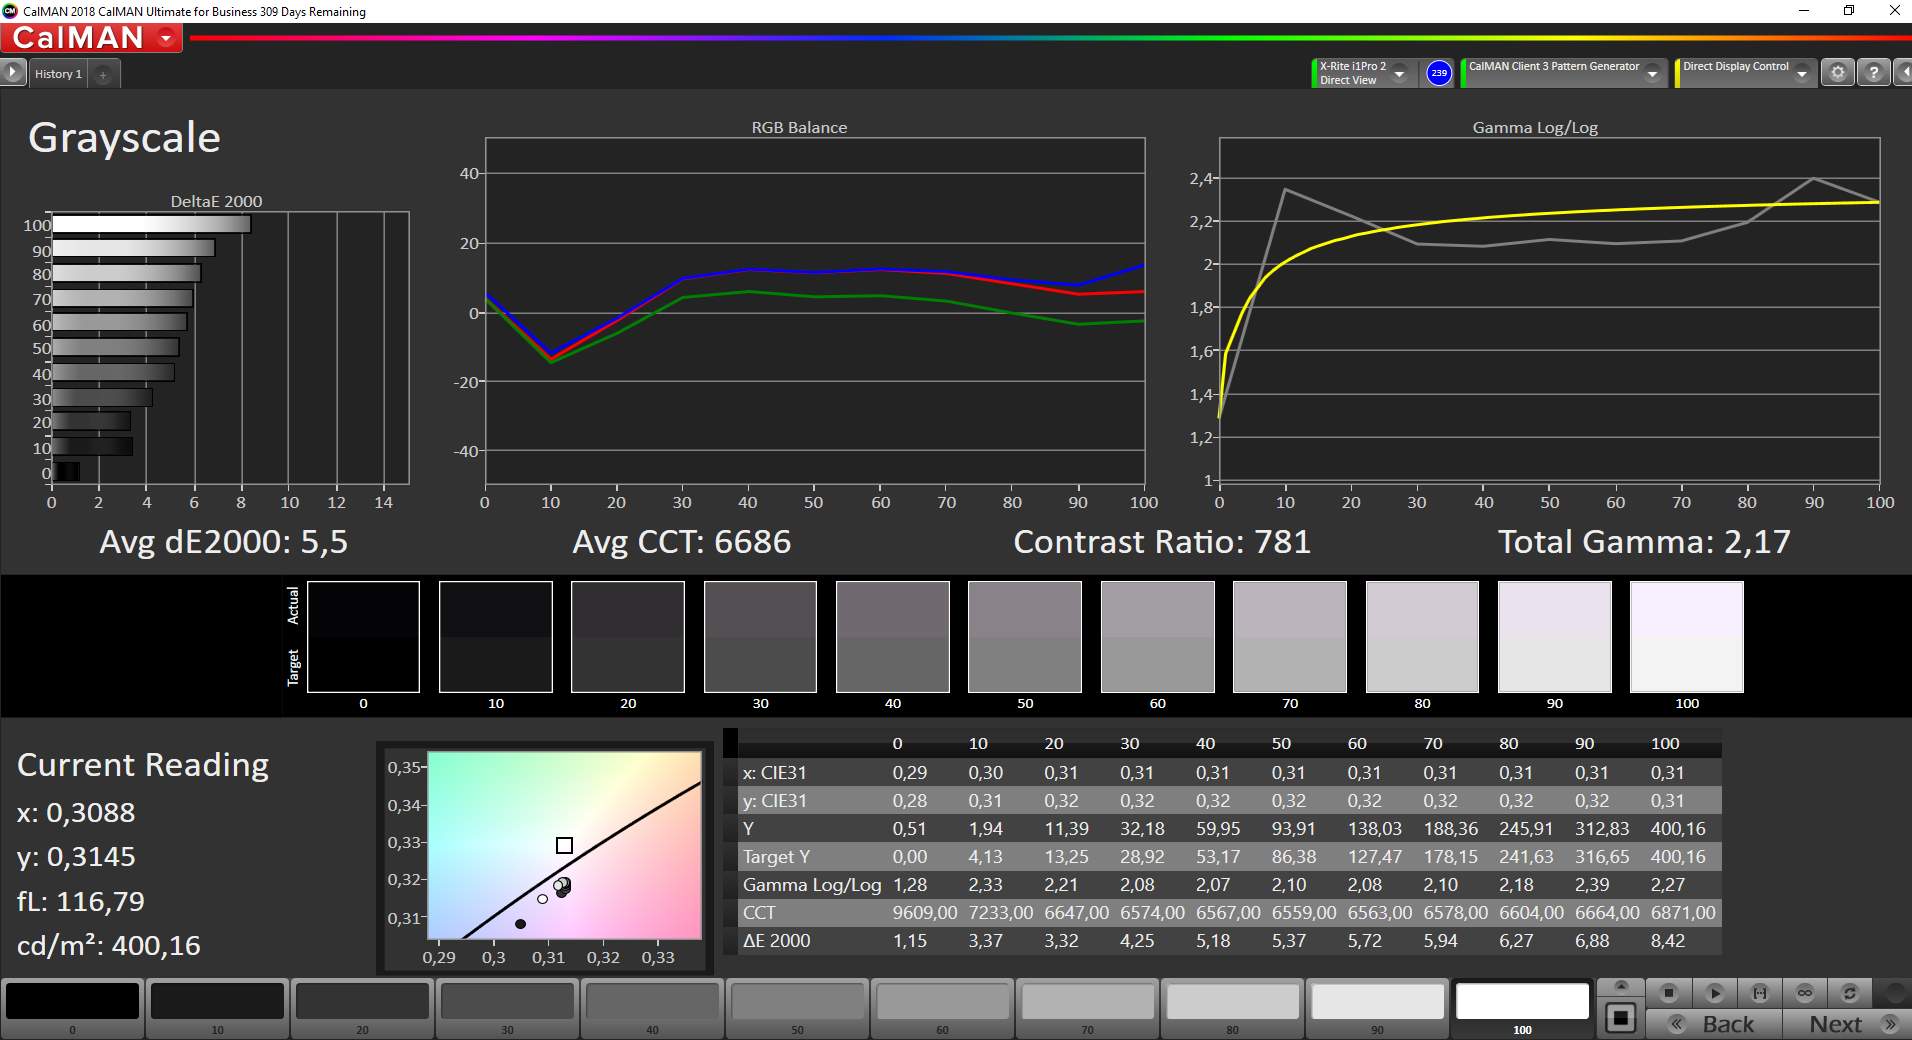
Homogénéité de la luminosité: 92 %
Valeur mesurée au centre, sur batterie: 401 cd/m²
Contraste: 784:1 (Valeurs des noirs: 0.51 cd/m²)
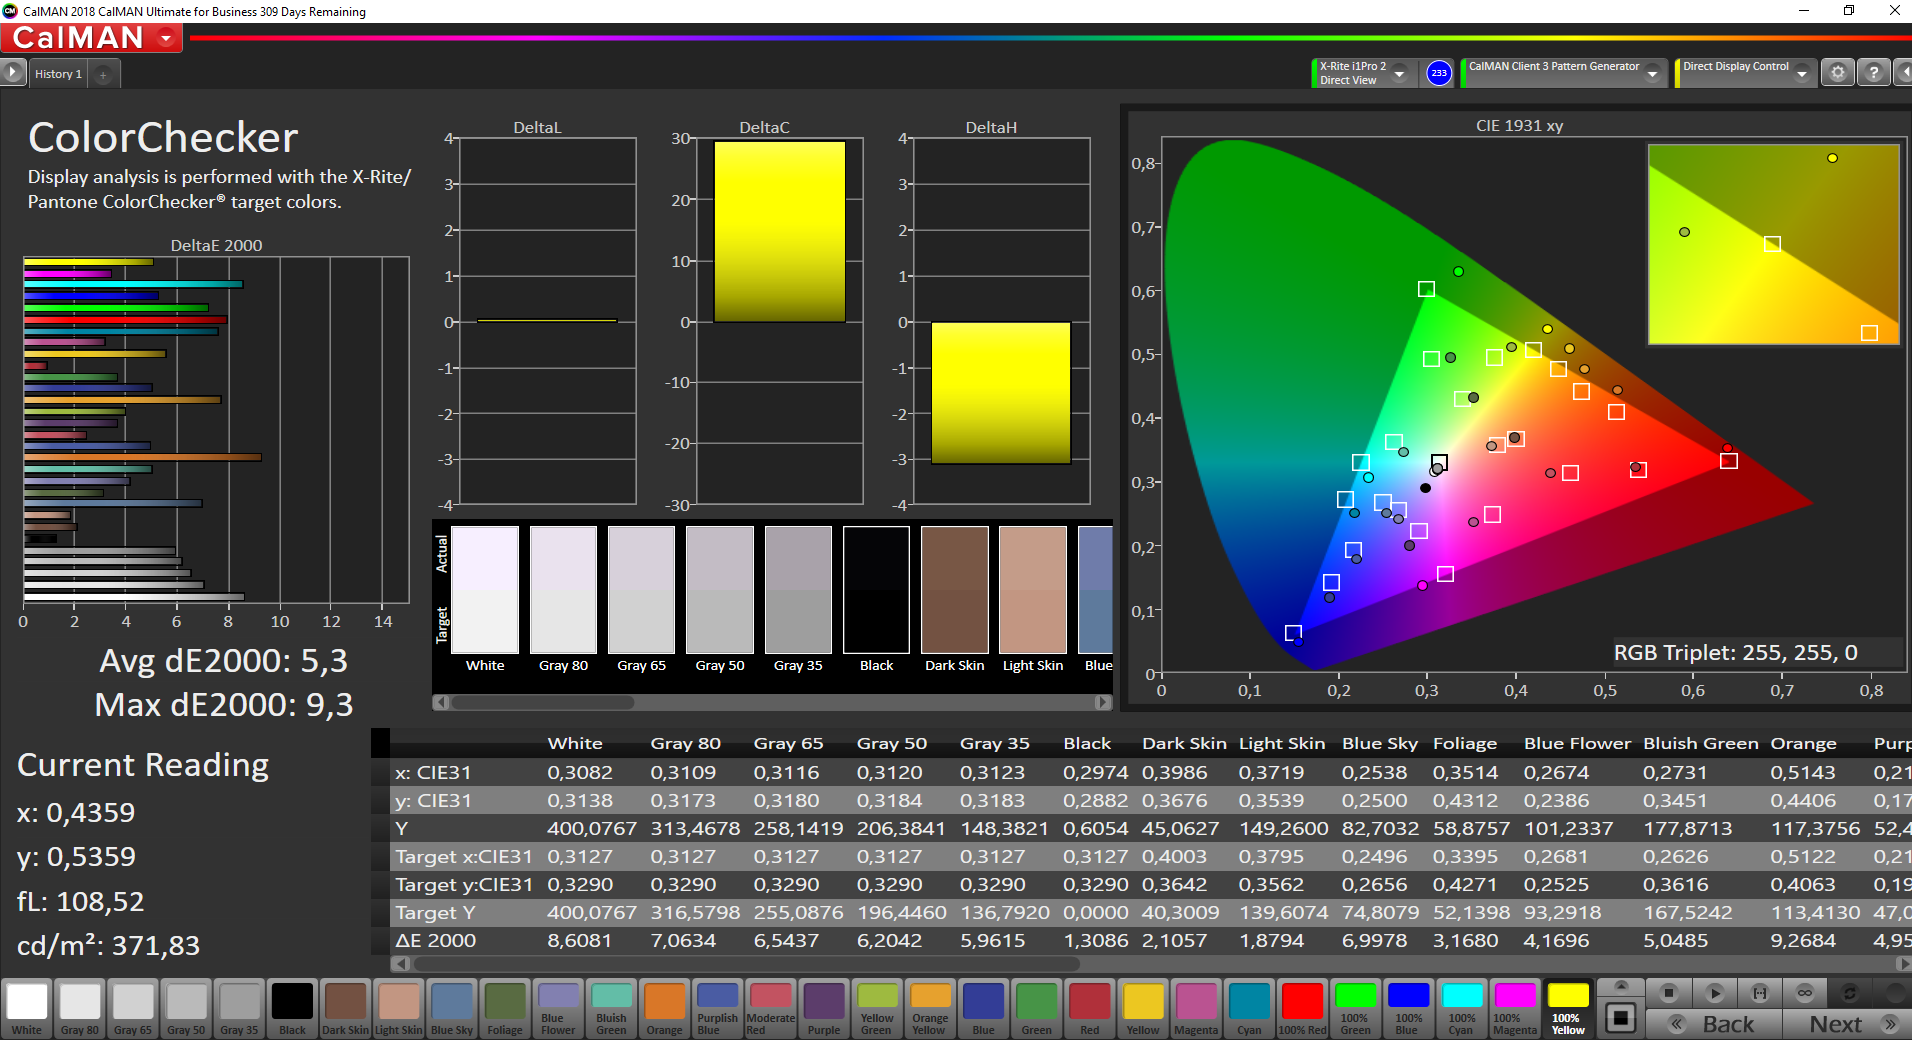
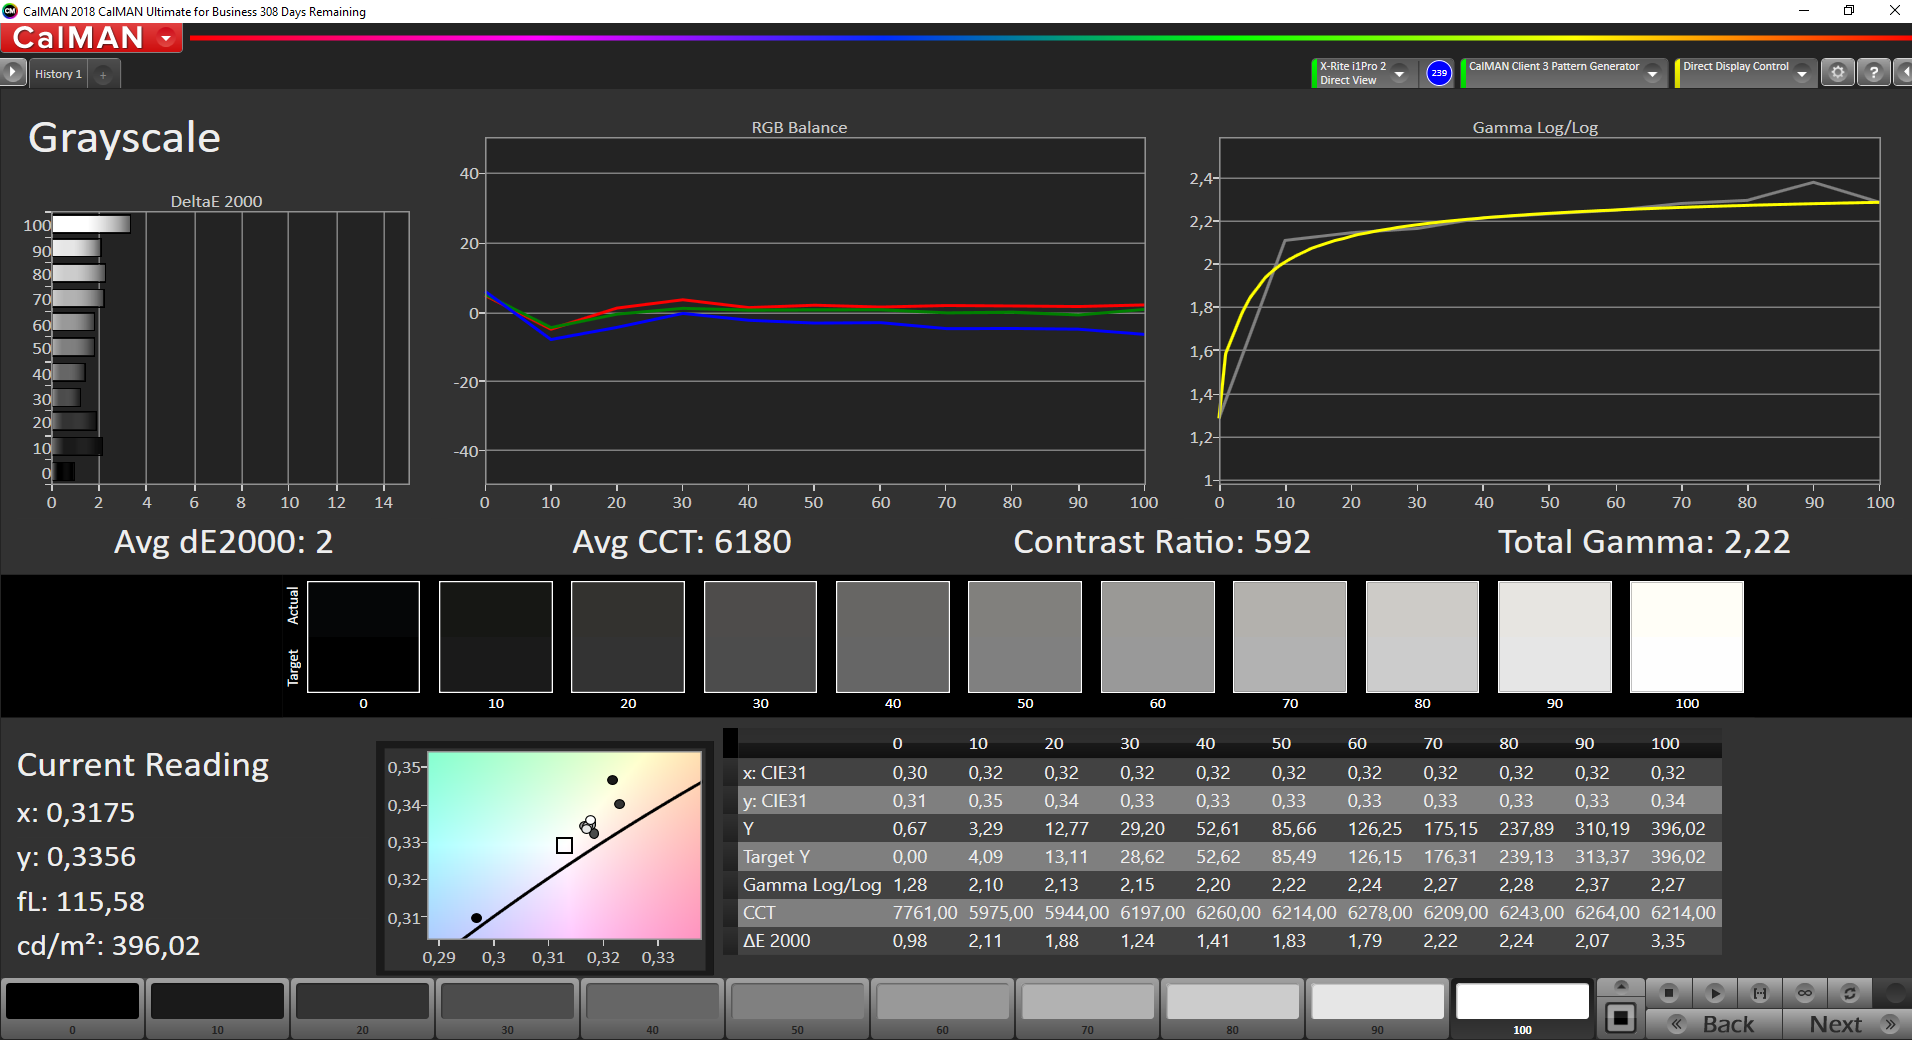
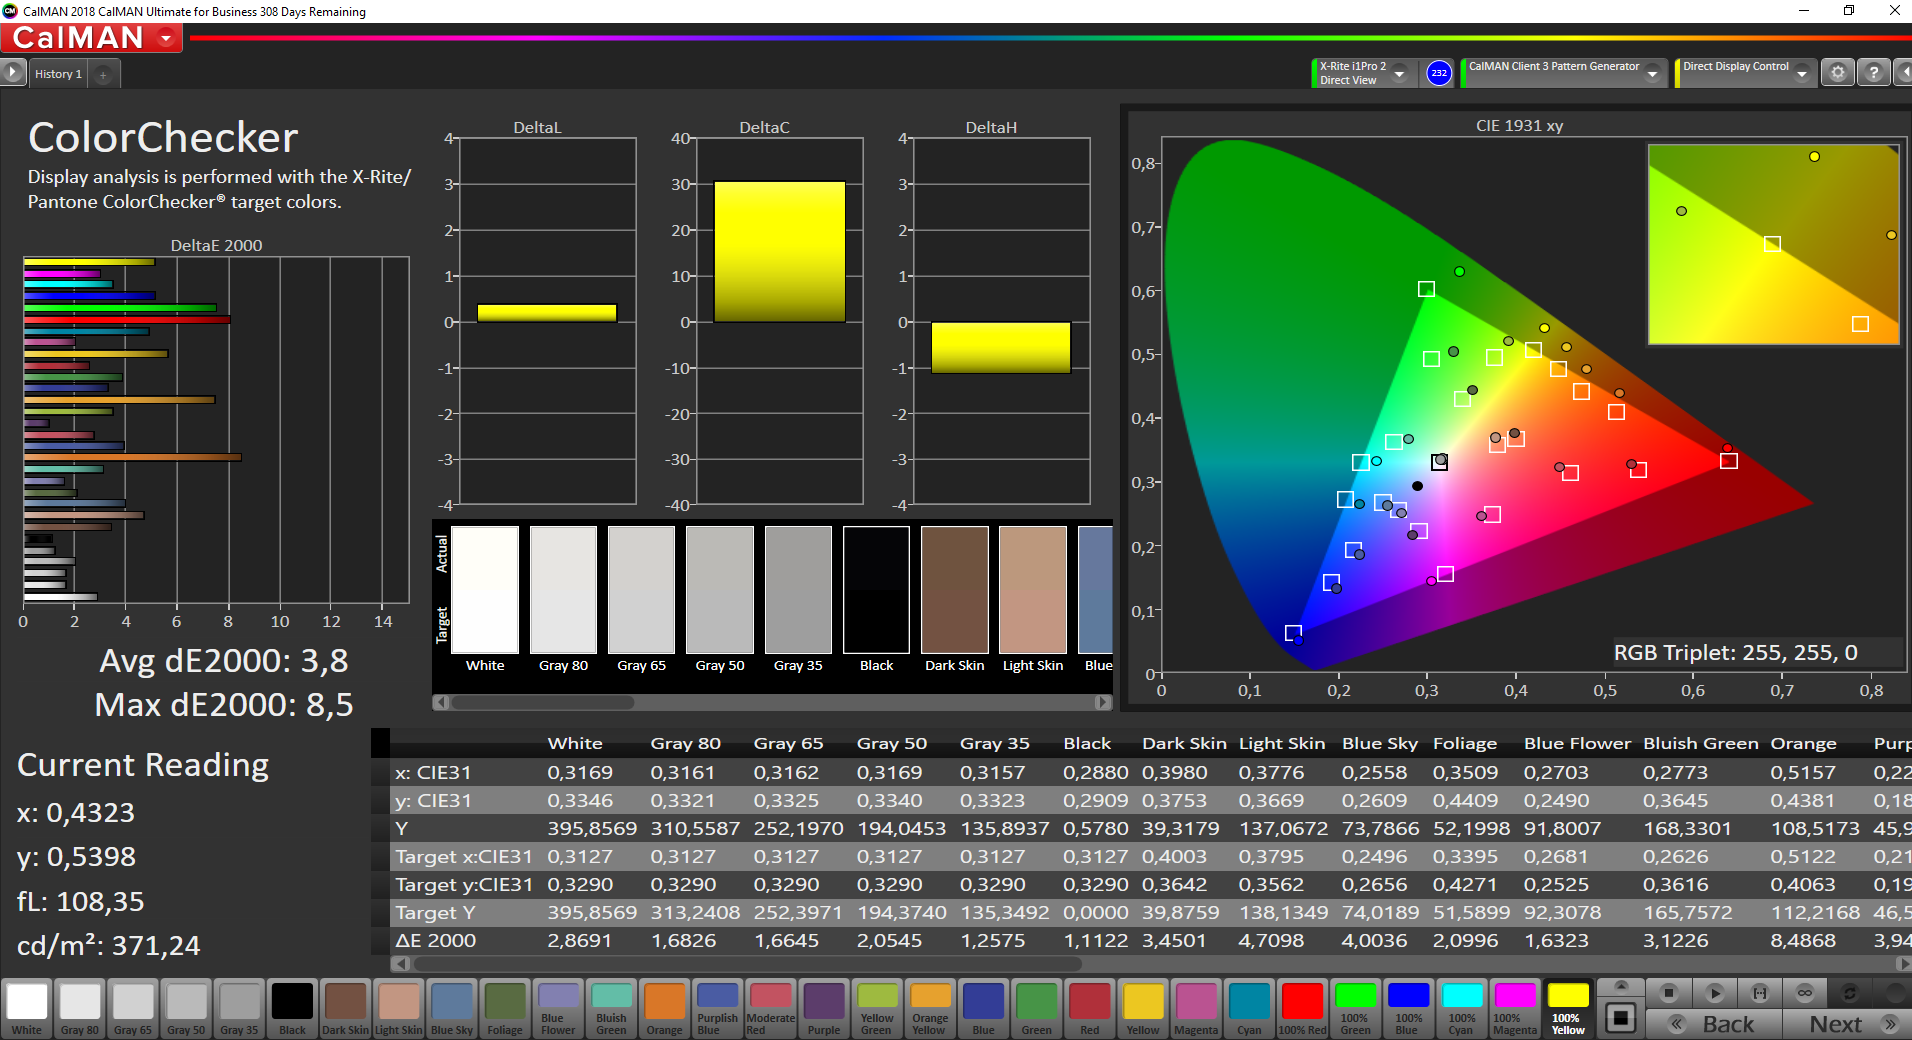
ΔE ColorChecker Calman: 5.3 | ∀{0.5-29.43 Ø4.72}
calibrated: 3.8
ΔE Greyscale Calman: 5.5 | ∀{0.09-98 Ø4.97}
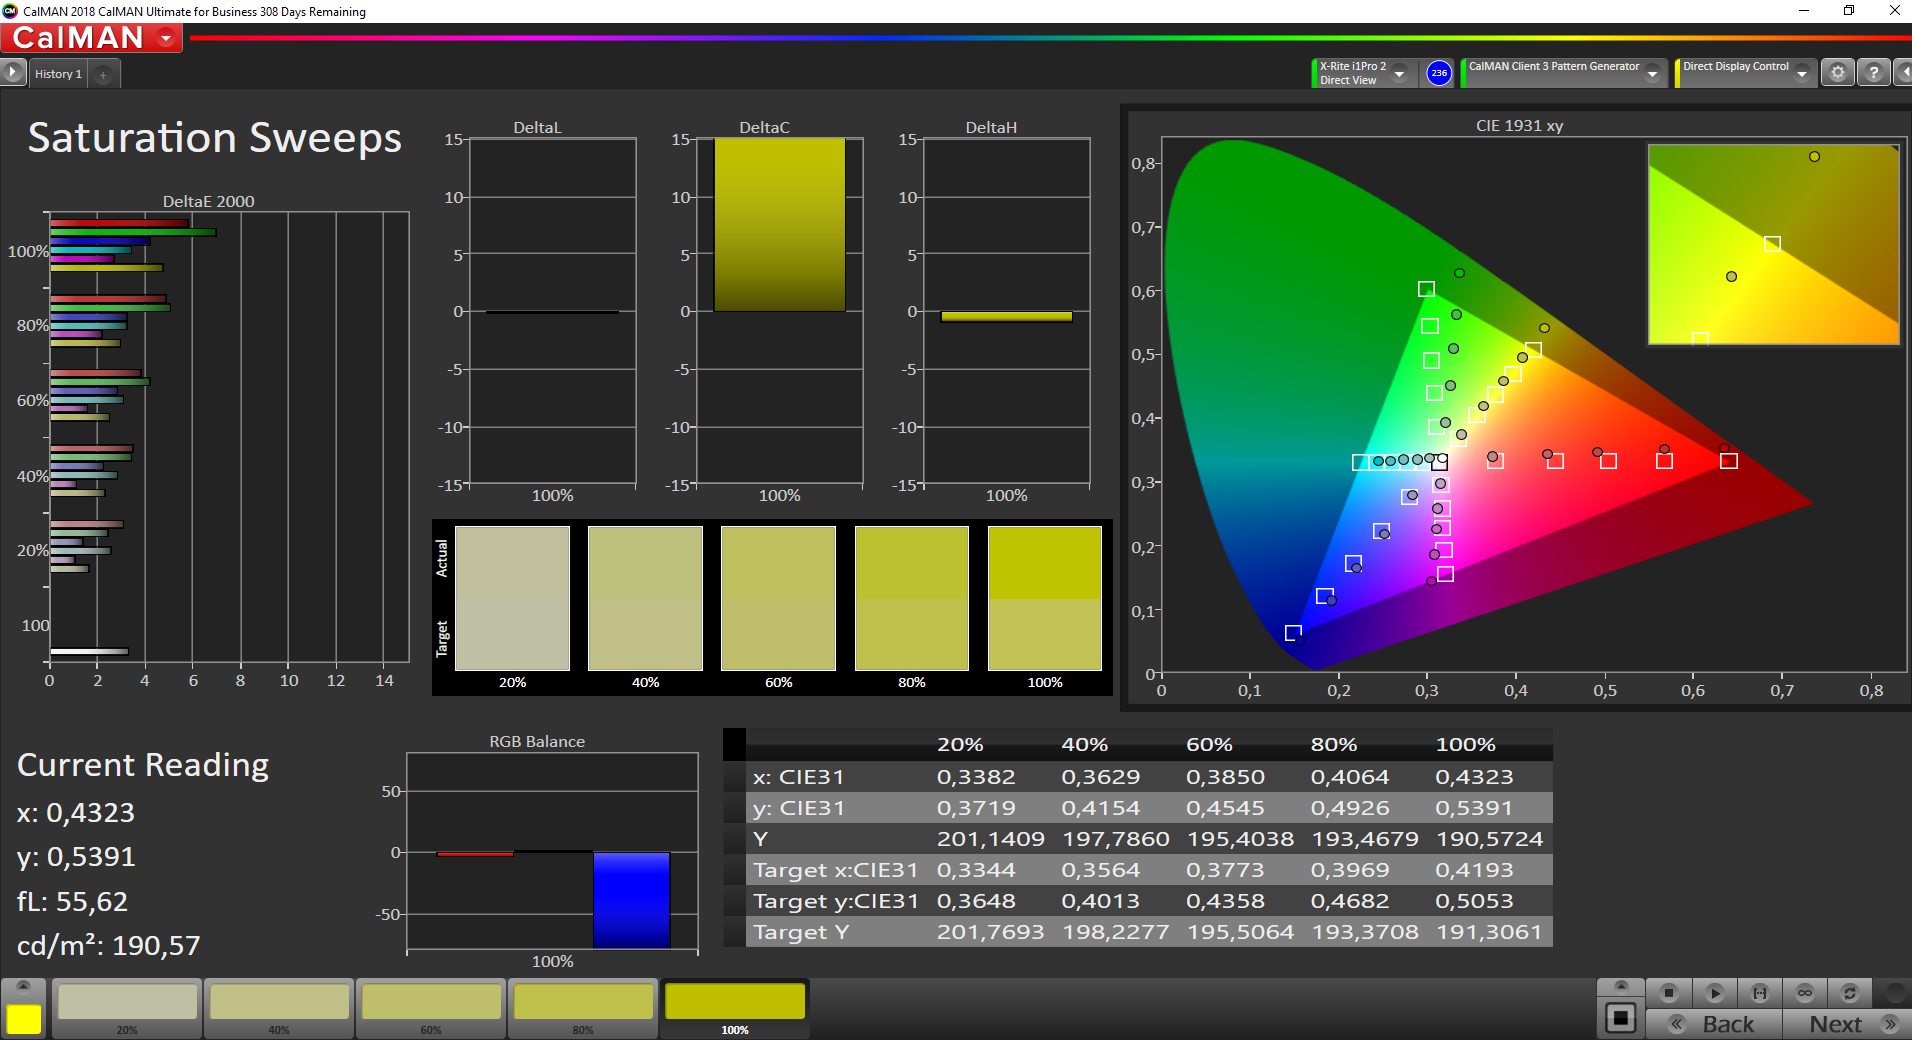
84.9% sRGB (Argyll 1.6.3 3D)
55.8% AdobeRGB 1998 (Argyll 1.6.3 3D)
62.2% AdobeRGB 1998 (Argyll 3D)
85% sRGB (Argyll 3D)
67.3% Display P3 (Argyll 3D)
Gamma: 2.17
CCT: 6686 K
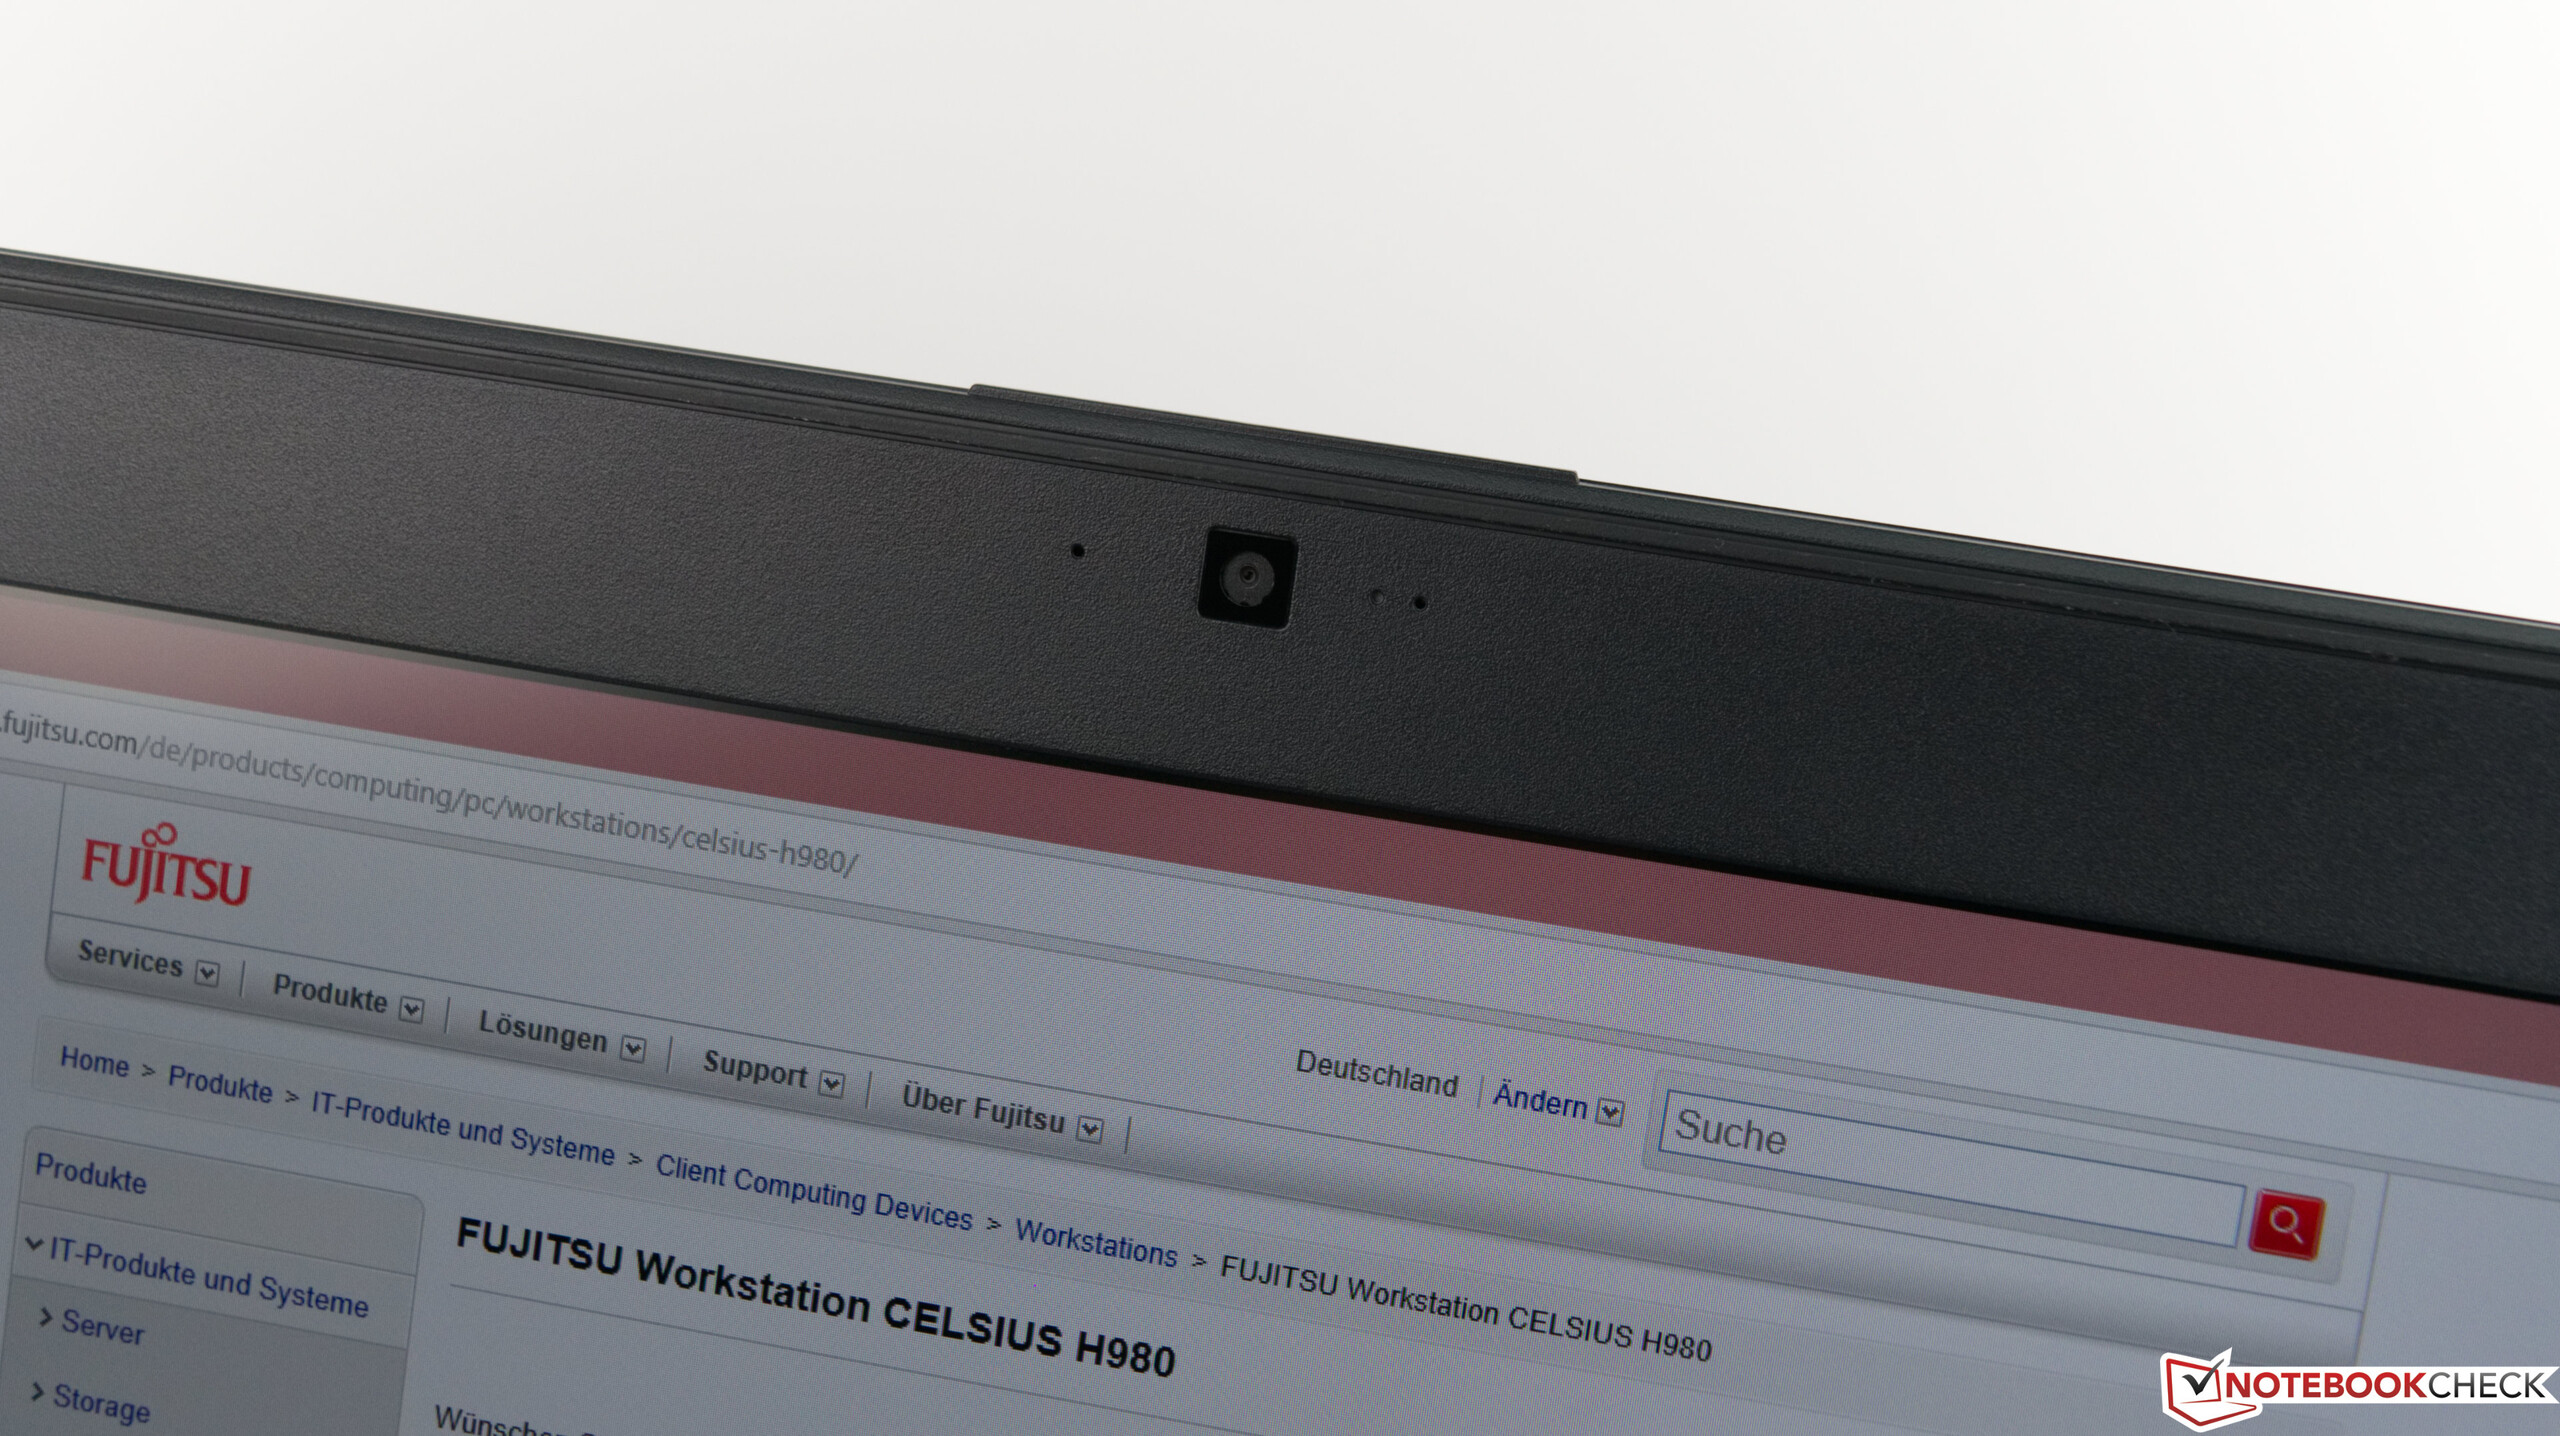
| Fujitsu Celsius H980 LG Philips, LP173WF4-SPF5, IPS, 1920x1080, 17.3" | Fujitsu Celsius H970 LP173WF4-SPF3, IPS LED, 1920x1080, 17.3" | Dell Precision 7720 SHP1446 (LQ173D1), IGZO, 3840x2160, 17.3" | Lenovo ThinkPad P72-20MB000EGE LP173WF4_SPF7, IPS, 1920x1080, 17.3" | HP ZBook 17 G5-2ZC48EA AUO B173HW01 V0, , 1920x1080, 17.3" | |
|---|---|---|---|---|---|
| Display | -1% | 36% | 0% | 3% | |
| Display P3 Coverage (%) | 67.3 | 66.8 -1% | 87.6 30% | 67.4 0% | 66.3 -1% |
| sRGB Coverage (%) | 85 | 84.6 0% | 100 18% | 85 0% | 89.9 6% |
| AdobeRGB 1998 Coverage (%) | 62.2 | 61.8 -1% | 99.2 59% | 62.2 0% | |
| Response Times | 1% | -79% | -16% | -17% | |
| Response Time Grey 50% / Grey 80% * (ms) | 38 ? | 32 ? 16% | 60 ? -58% | 40.8 ? -7% | 42.4 ? -12% |
| Response Time Black / White * (ms) | 23.2 ? | 26.4 ? -14% | 46.4 ? -100% | 28.8 ? -24% | 28.4 ? -22% |
| PWM Frequency (Hz) | 120500 ? | 1020 ? | |||
| Screen | 2% | 24% | 12% | 14% | |
| Brightness middle (cd/m²) | 400 | 368 -8% | 464 16% | 338 -15% | 335 -16% |
| Brightness (cd/m²) | 394 | 360 -9% | 441 12% | 317 -20% | 326 -17% |
| Brightness Distribution (%) | 92 | 91 -1% | 89 -3% | 86 -7% | 92 0% |
| Black Level * (cd/m²) | 0.51 | 0.3 41% | 0.45 12% | 0.28 45% | 0.22 57% |
| Contrast (:1) | 784 | 1227 57% | 1031 32% | 1207 54% | 1523 94% |
| Colorchecker dE 2000 * | 5.3 | 6.4 -21% | 3.2 40% | 4.3 19% | 4.7 11% |
| Colorchecker dE 2000 max. * | 9.3 | 10.1 -9% | 6.1 34% | 10.2 -10% | 8.7 6% |
| Colorchecker dE 2000 calibrated * | 3.8 | 3.7 3% | 2.7 29% | ||
| Greyscale dE 2000 * | 5.5 | 7.2 -31% | 4.2 24% | 2.2 60% | 6.5 -18% |
| Gamma | 2.17 101% | 2.02 109% | 2.01 109% | 2.17 101% | 2.23 99% |
| CCT | 6686 97% | 6882 94% | 6736 96% | 6621 98% | 6108 106% |
| Color Space (Percent of AdobeRGB 1998) (%) | 55.8 | 55.5 -1% | 88.1 58% | 55.8 0% | 58.7 5% |
| Color Space (Percent of sRGB) (%) | 84.9 | 84.4 -1% | 100 18% | 84.7 0% | 89.7 6% |
| Moyenne finale (programmes/paramètres) | 1% /
1% | -6% /
13% | -1% /
6% | 0% /
9% |
* ... Moindre est la valeur, meilleures sont les performances
Temps de réponse de l'écran
| ↔ Temps de réponse noir à blanc | ||
|---|---|---|
| 23.2 ms ... hausse ↗ et chute ↘ combinées | ↗ 10 ms hausse | 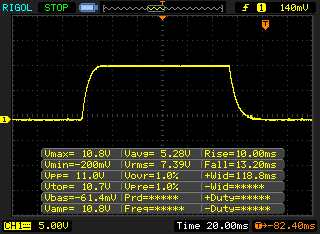 |
| ↘ 13.2 ms chute | ||
| L'écran montre de bons temps de réponse, mais insuffisant pour du jeu compétitif. En comparaison, tous les appareils testés affichent entre 0.1 (minimum) et 240 (maximum) ms. » 53 % des appareils testés affichent de meilleures performances. Cela signifie que les latences relevées sont moins bonnes que la moyenne (19.8 ms) de tous les appareils testés. | ||
| ↔ Temps de réponse gris 50% à gris 80% | ||
| 38 ms ... hausse ↗ et chute ↘ combinées | ↗ 19.2 ms hausse | 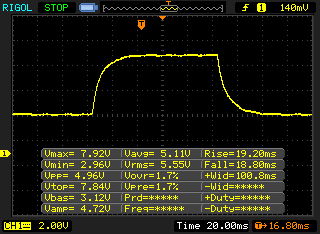 |
| ↘ 18.8 ms chute | ||
| L'écran souffre de latences très élevées, à éviter pour le jeu. En comparaison, tous les appareils testés affichent entre 0.165 (minimum) et 636 (maximum) ms. » 55 % des appareils testés affichent de meilleures performances. Cela signifie que les latences relevées sont moins bonnes que la moyenne (31 ms) de tous les appareils testés. | ||
Scintillement / MLI (Modulation de largeur d'impulsion)
| Scintillement / MLI (Modulation de largeur d'impulsion) décelé | 120500 Hz | ≤ 99 Niveau de luminosité | 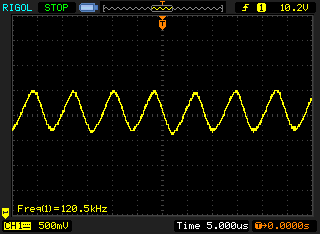 |
Le rétroéclairage de l'écran scintille à la fréquence de 120500 Hz (certainement du fait de l'utilisation d'une MDI - Modulation de largeur d'impulsion) à un niveau de luminosité inférieur ou égal à 99 % . Aucun scintillement ne devrait être perceptible au-dessus de cette valeur. La fréquence de rafraîchissement de 120500 Hz est élevée, la grande majorité des utilisateurs ne devrait pas percevoir de scintillements et être sujette à une fatigue oculaire accrue. En comparaison, 52 % des appareils testés n'emploient pas MDI pour assombrir leur écran. Nous avons relevé une moyenne à 7753 (minimum : 5 - maximum : 343500) Hz dans le cas où une MDI était active. | |||

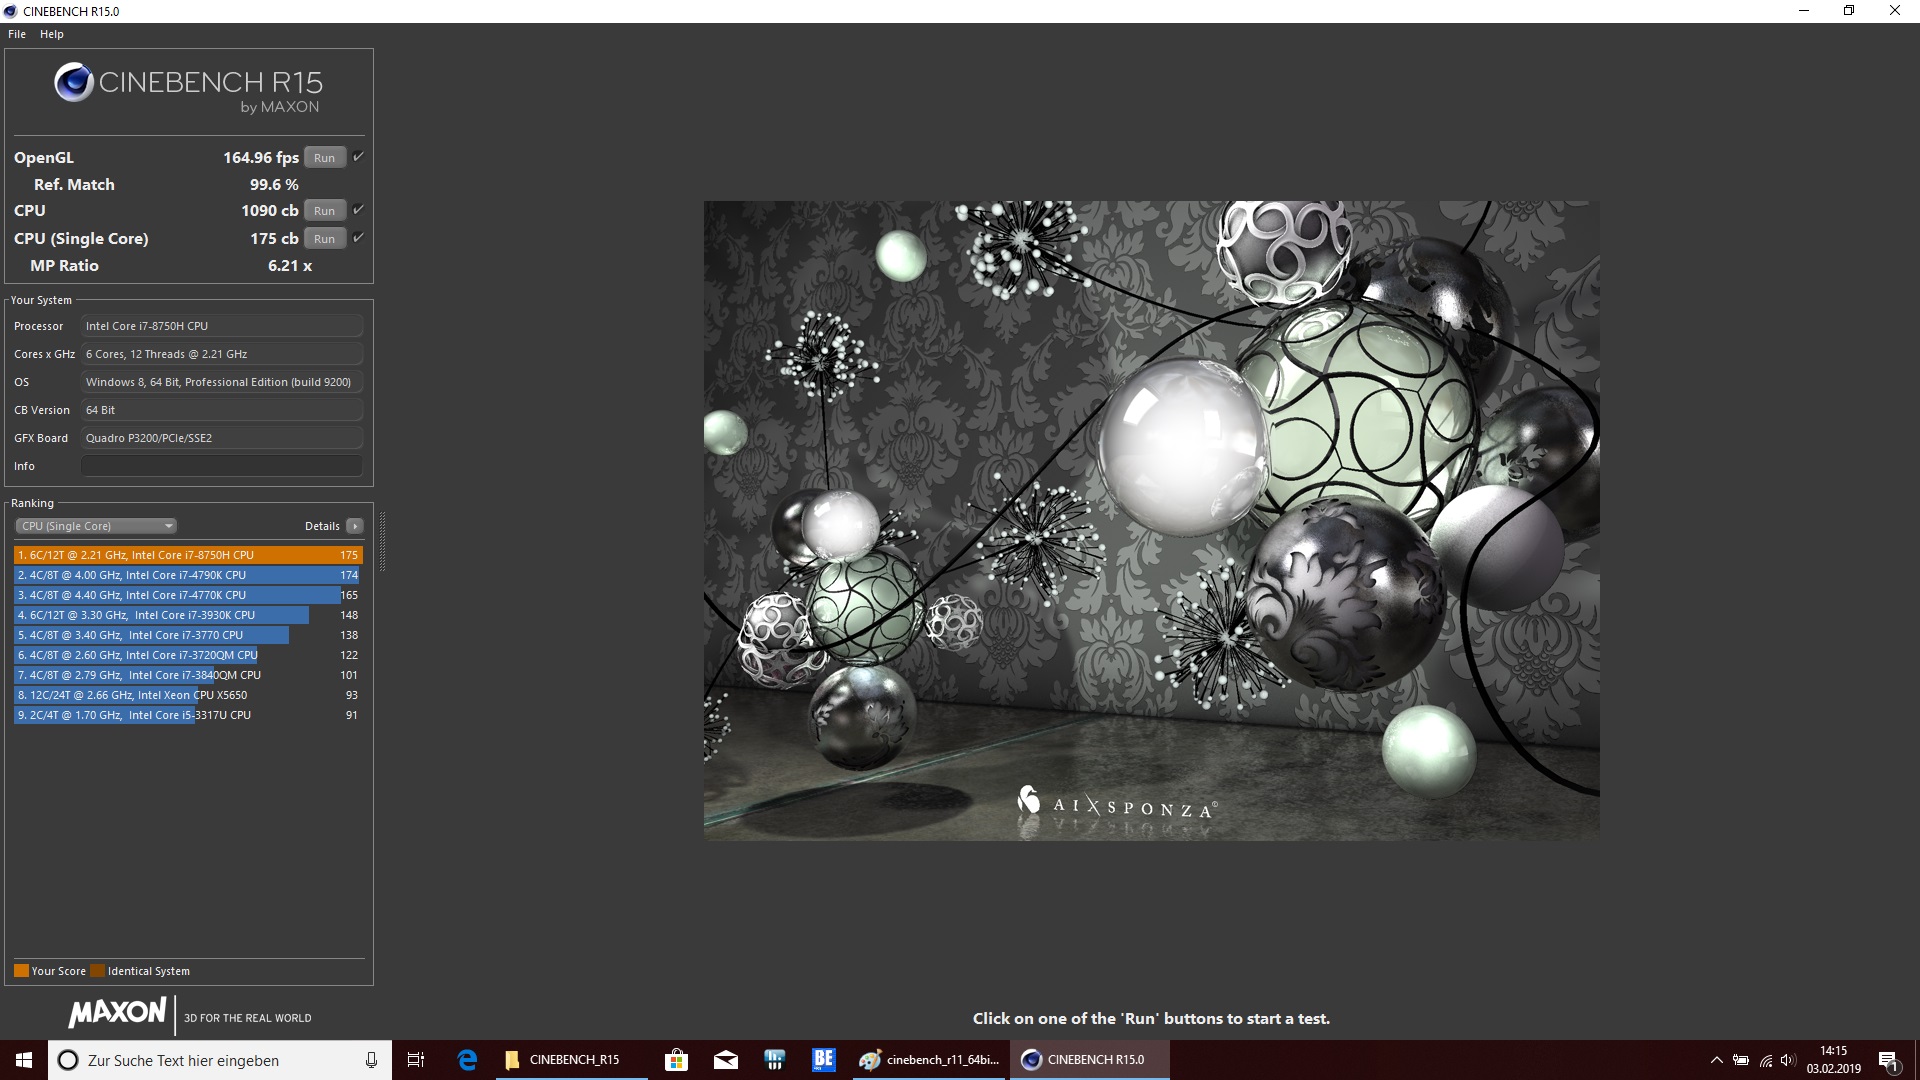
| Cinebench R15 | |
| CPU Single 64Bit | |
| Moyenne de la classe Workstation (191.4 - 328, n=24, 2 dernières années) | |
| Eurocom Tornado F7W | |
| Lenovo ThinkPad P72-20MB000EGE | |
| HP ZBook 17 G5-2ZC48EA | |
| Dell Precision 7720 | |
| Fujitsu Celsius H980 | |
| Moyenne Intel Core i7-8750H (163 - 177, n=86) | |
| Fujitsu Celsius H970 | |
| CPU Multi 64Bit | |
| Moyenne de la classe Workstation (2489 - 5810, n=24, 2 dernières années) | |
| Eurocom Tornado F7W | |
| Lenovo ThinkPad P72-20MB000EGE | |
| Lenovo ThinkPad P72-20MB000EGE | |
| HP ZBook 17 G5-2ZC48EA | |
| Moyenne Intel Core i7-8750H (863 - 1251, n=93) | |
| Fujitsu Celsius H980 | |
| Dell Precision 7720 | |
| Fujitsu Celsius H970 | |
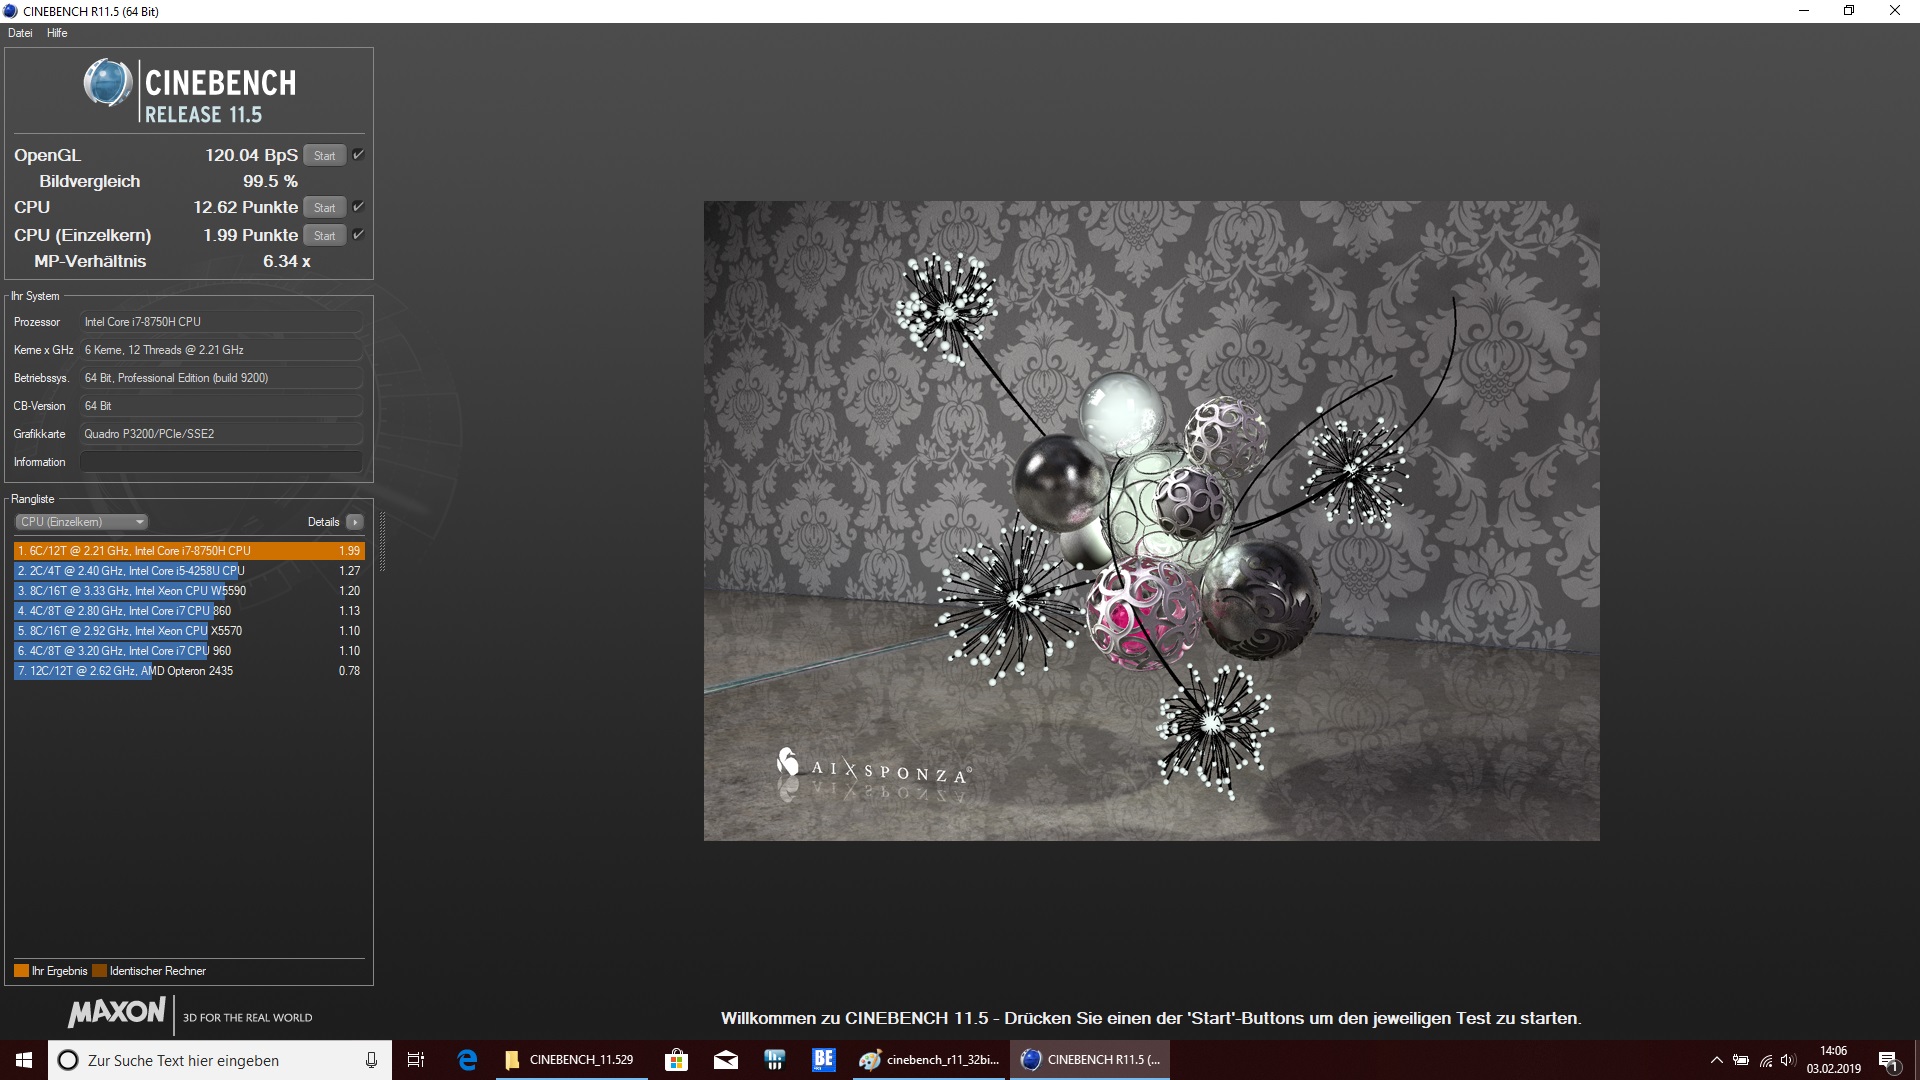
| Cinebench R11.5 | |
| CPU Single 64Bit | |
| Moyenne de la classe Workstation (n=12 dernières années) | |
| Eurocom Tornado F7W | |
| Fujitsu Celsius H980 | |
| Moyenne Intel Core i7-8750H (1.89 - 2, n=40) | |
| Fujitsu Celsius H970 | |
| CPU Multi 64Bit | |
| Moyenne de la classe Workstation (n=12 dernières années) | |
| Eurocom Tornado F7W | |
| Lenovo ThinkPad P72-20MB000EGE | |
| Fujitsu Celsius H980 | |
| Moyenne Intel Core i7-8750H (9.54 - 13.5, n=41) | |
| Fujitsu Celsius H970 | |
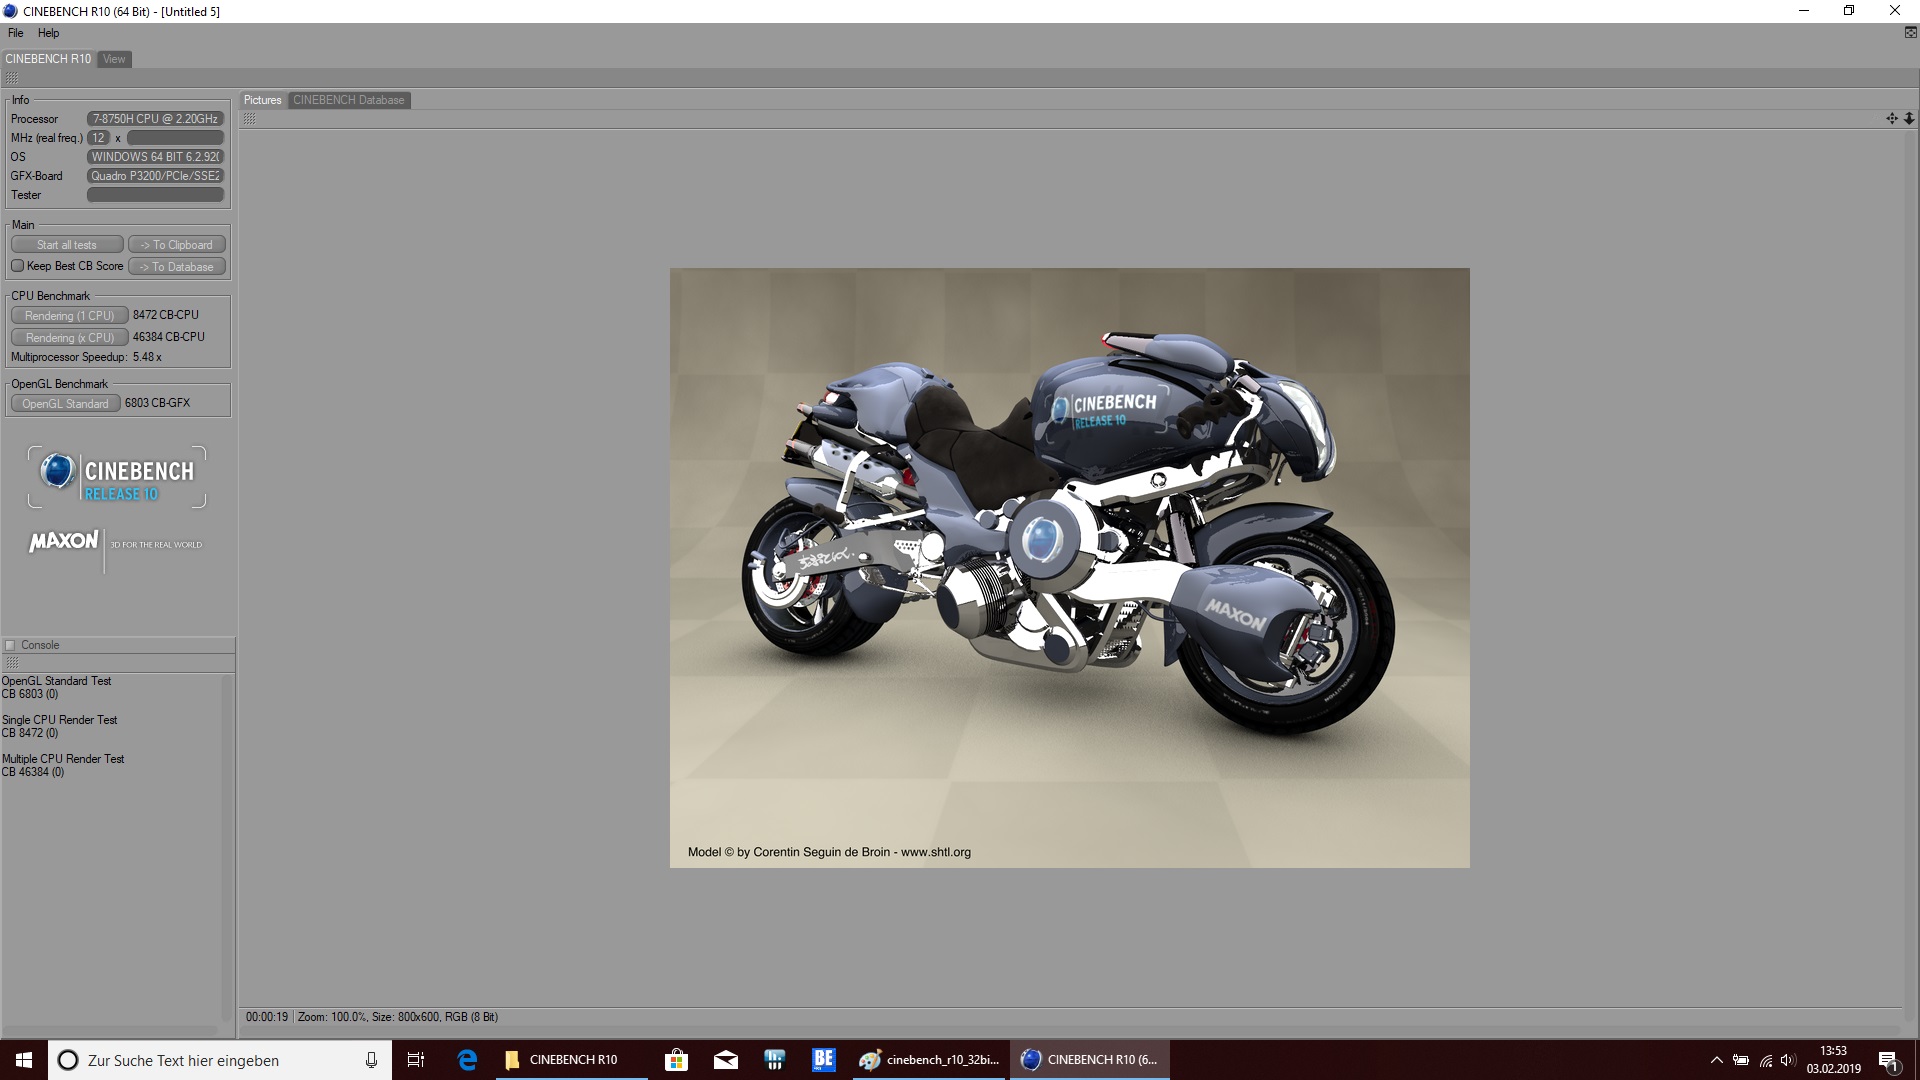
| Cinebench R10 | |
| Rendering Single CPUs 64Bit | |
| Moyenne de la classe Workstation (n=12 dernières années) | |
| Moyenne Intel Core i7-8750H (8472 - 8665, n=5) | |
| Fujitsu Celsius H980 | |
| Fujitsu Celsius H970 | |
| Rendering Multiple CPUs 64Bit | |
| Moyenne de la classe Workstation (n=12 dernières années) | |
| Fujitsu Celsius H980 | |
| Moyenne Intel Core i7-8750H (33944 - 46384, n=5) | |
| Fujitsu Celsius H970 | |
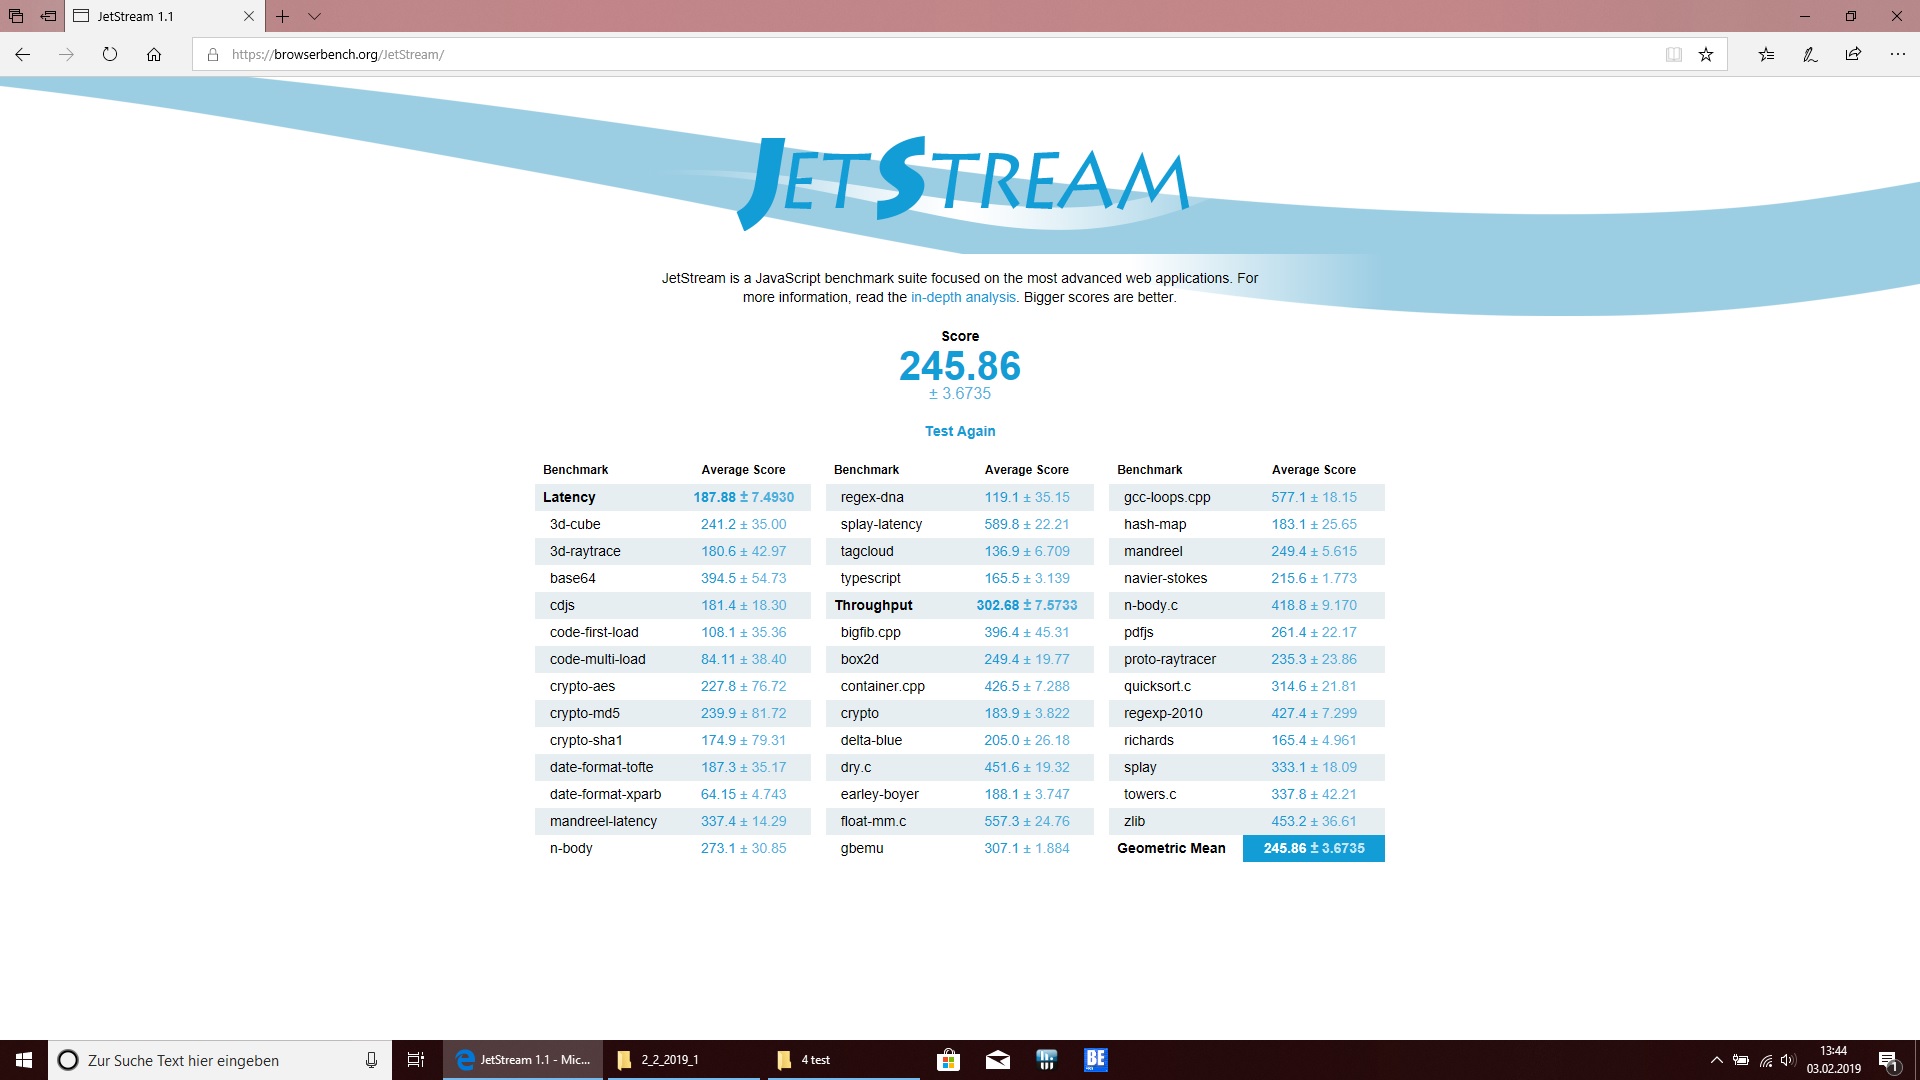
| JetStream 1.1 - 1.1 Total | |
| Eurocom Tornado F7W | |
| Dell Precision 7720 | |
| Fujitsu Celsius H970 | |
| HP ZBook 17 G5-2ZC48EA | |
| Lenovo ThinkPad P72-20MB000EGE | |
| Moyenne Intel Core i7-8750H (205 - 299, n=49) | |
| Fujitsu Celsius H980 | |
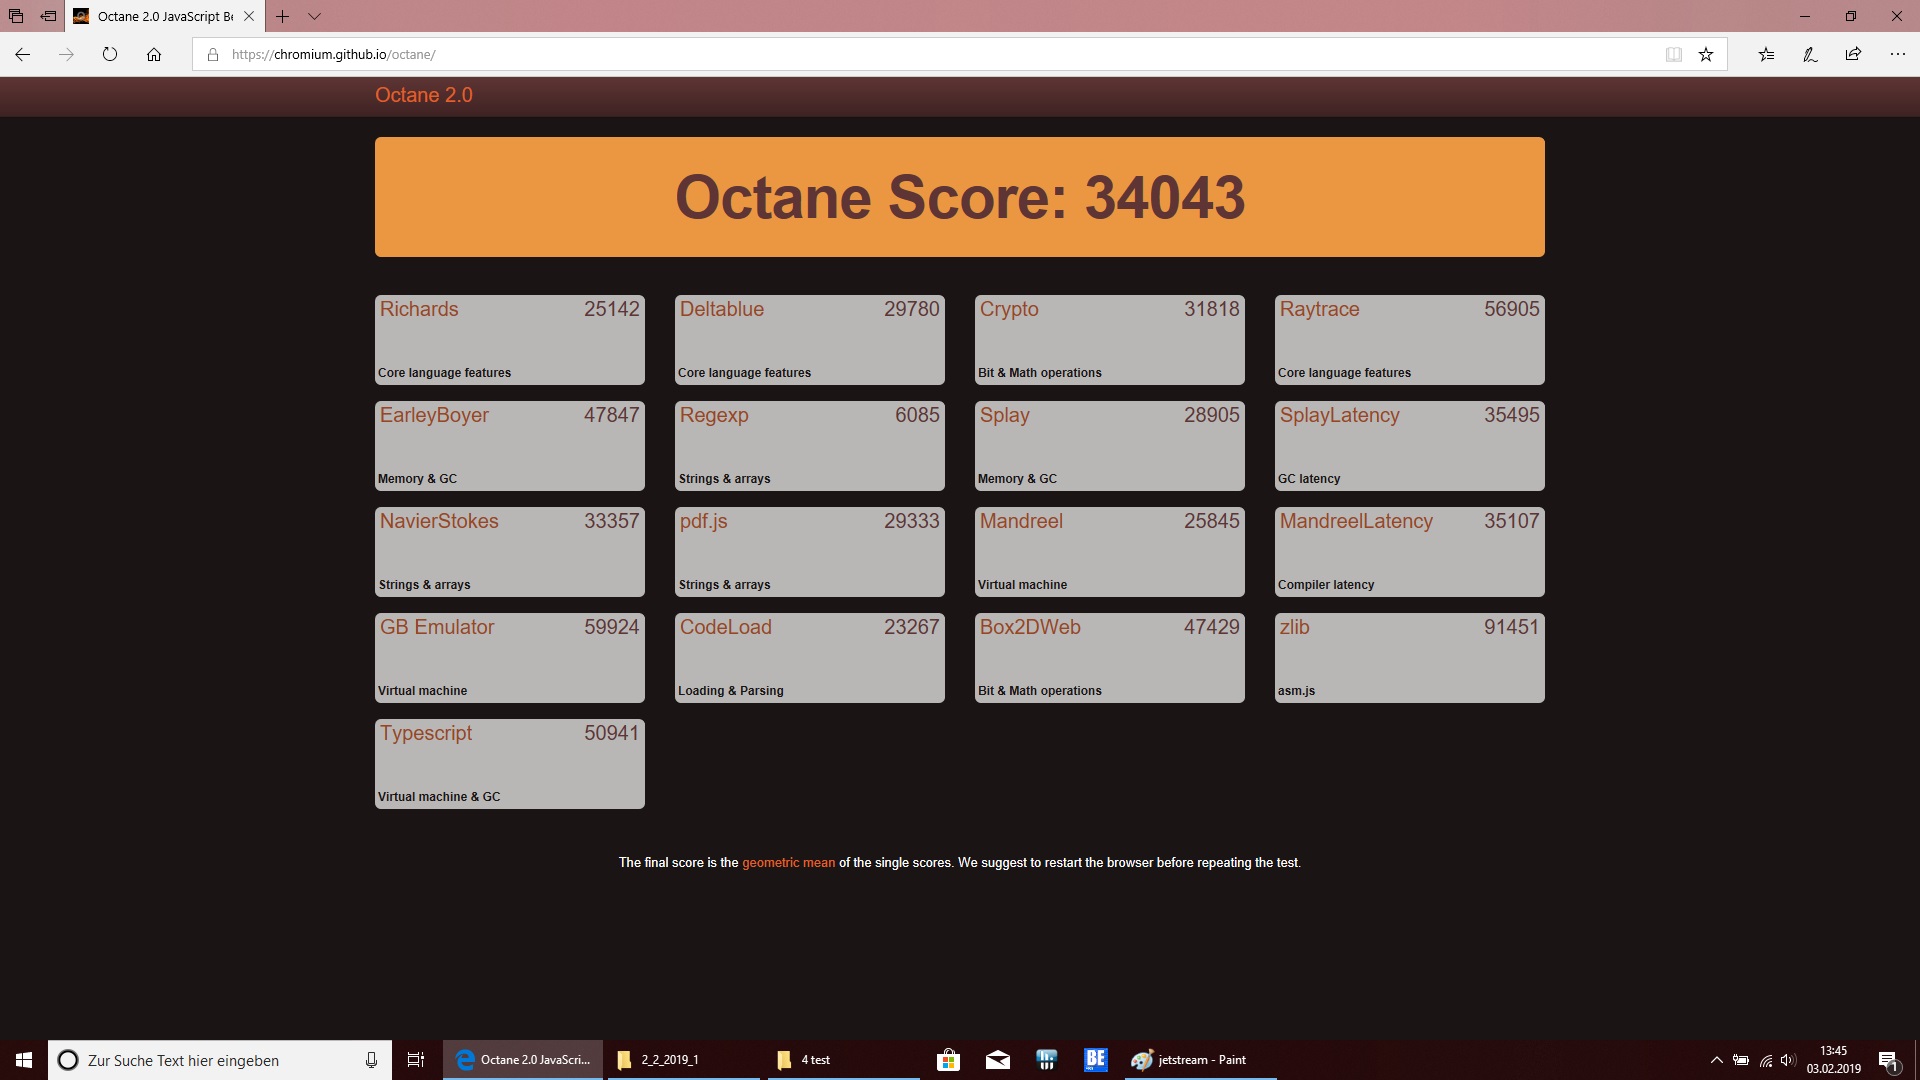
| Octane V2 - Total Score | |
| Moyenne de la classe Workstation (92715 - 129420, n=4, 2 dernières années) | |
| Fujitsu Celsius H970 | |
| Dell Precision 7720 | |
| HP ZBook 17 G5-2ZC48EA | |
| Lenovo ThinkPad P72-20MB000EGE | |
| Moyenne Intel Core i7-8750H (27460 - 44549, n=47) | |
| Fujitsu Celsius H980 | |
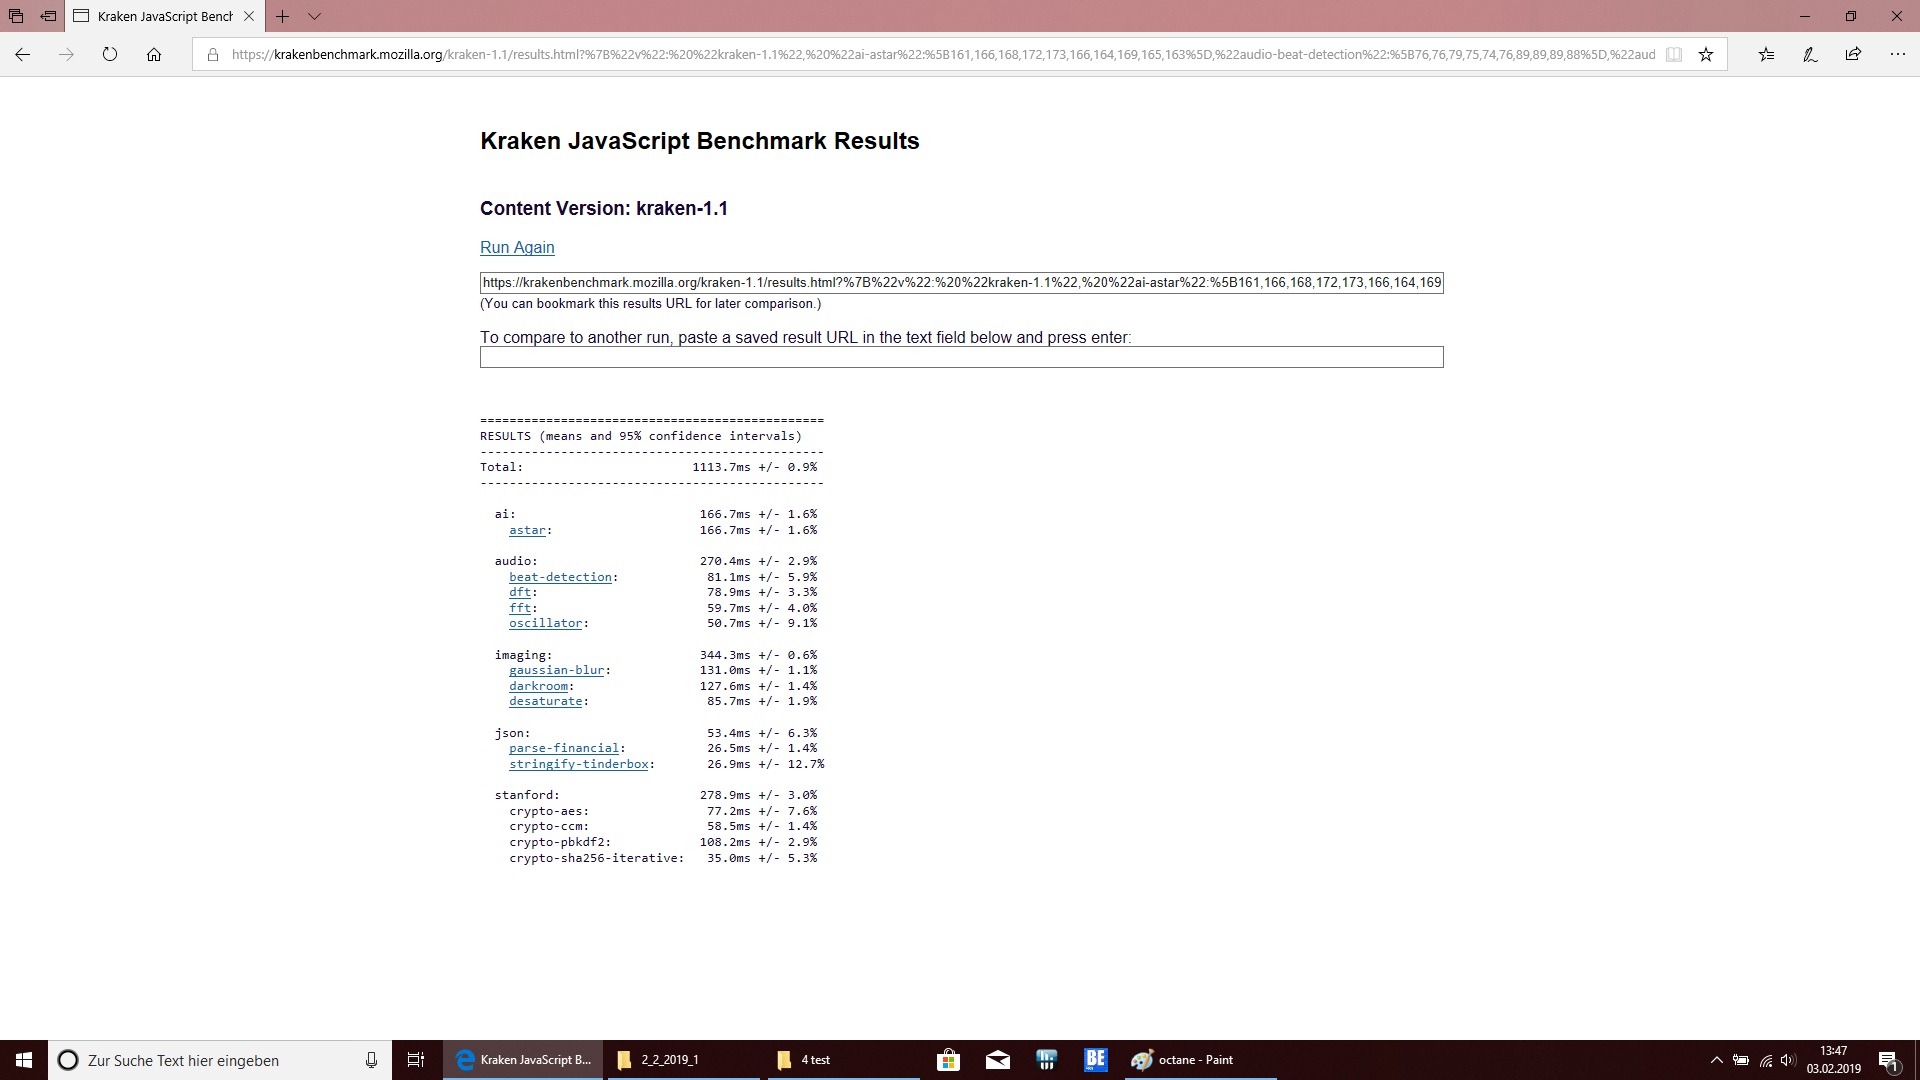
| Mozilla Kraken 1.1 - Total | |
| Lenovo ThinkPad P72-20MB000EGE | |
| Fujitsu Celsius H980 | |
| Moyenne Intel Core i7-8750H (695 - 1272, n=50) | |
| HP ZBook 17 G5-2ZC48EA | |
| Fujitsu Celsius H970 | |
| Dell Precision 7720 | |
| Moyenne de la classe Workstation (411 - 538, n=24, 2 dernières années) | |
| Blender - v2.79 BMW27 CPU | |
| Moyenne Intel Core i7-8750H (396 - 486, n=6) | |
| Fujitsu Celsius H980 | |
| Eurocom Tornado F7W | |
| Moyenne de la classe Workstation (91 - 222, n=24, 2 dernières années) | |
* ... Moindre est la valeur, meilleures sont les performances
| PCMark 8 | |
| Home Score Accelerated v2 | |
| Eurocom Tornado F7W | |
| Lenovo ThinkPad P72-20MB000EGE | |
| Fujitsu Celsius H980 | |
| Moyenne Intel Core i7-8750H, NVIDIA Quadro P3200 (n=1) | |
| HP ZBook 17 G5-2ZC48EA | |
| Dell Precision 7720 | |
| Work Score Accelerated v2 | |
| Lenovo ThinkPad P72-20MB000EGE | |
| Fujitsu Celsius H970 | |
| HP ZBook 17 G5-2ZC48EA | |
| Fujitsu Celsius H980 | |
| Moyenne Intel Core i7-8750H, NVIDIA Quadro P3200 (n=1) | |
| Dell Precision 7720 | |
| PCMark 8 Home Score Accelerated v2 | 4376 points | |
| PCMark 8 Work Score Accelerated v2 | 5132 points | |
| PCMark 10 Score | 5206 points | |
Aide | ||
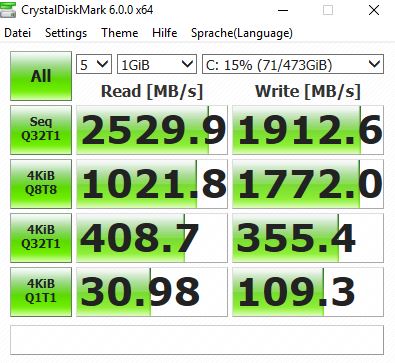
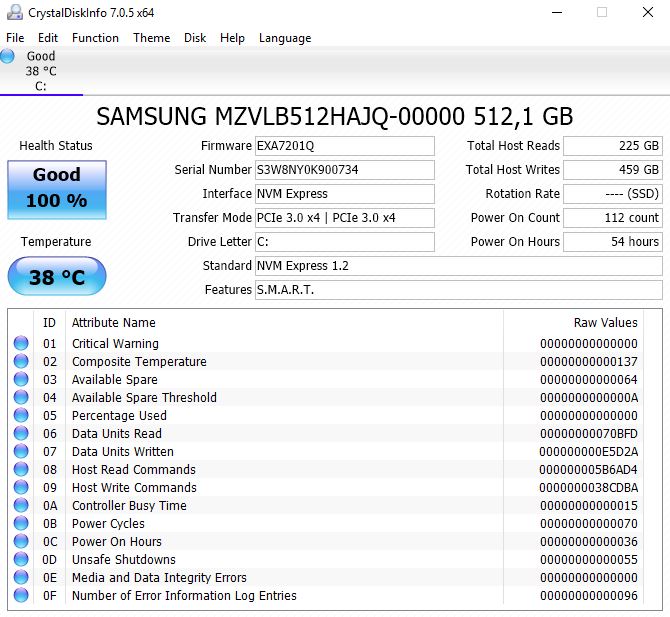
| Fujitsu Celsius H980 Samsung SSD PM981 MZVLB512HAJQ | Fujitsu Celsius H970 Samsung SM961 MZVKW512HMJP m.2 PCI-e | Dell Precision 7720 Toshiba NVMe THNSN5512GPU7 | Lenovo ThinkPad P72-20MB000EGE Lenovo LENSE20256GMSP34MEAT2TA | HP ZBook 17 G5-2ZC48EA Toshiba XG5 KXG50ZNV256G | Moyenne Samsung SSD PM981 MZVLB512HAJQ | |
|---|---|---|---|---|---|---|
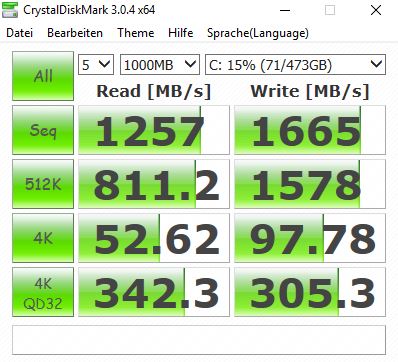
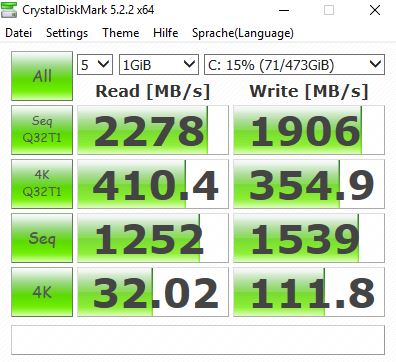
| CrystalDiskMark 5.2 / 6 | 33% | 15% | 8% | 13% | ||
| Write 4K (MB/s) | 111.8 | 176.1 58% | 169.2 51% | 101 -10% | 126.7 ? 13% | |
| Read 4K (MB/s) | 32.02 | 44.53 39% | 46.03 44% | 45.37 42% | 44 ? 37% | |
| Write Seq (MB/s) | 1539 | 1637 6% | 1234 -20% | 1409 -8% | 1617 ? 5% | |
| Read Seq (MB/s) | 1252 | 1714 37% | 1854 48% | 2129 70% | 1716 ? 37% | |
| Write 4K Q32T1 (MB/s) | 355.4 | 534 50% | 364.8 3% | 320.3 -10% | 413 ? 16% | |
| Read 4K Q32T1 (MB/s) | 408.7 | 635 55% | 552 35% | 348.3 -15% | 420 ? 3% | |
| Write Seq Q32T1 (MB/s) | 1913 | 1632 -15% | 1088 -43% | 1529 -20% | 2076 ? 9% | |
| Read Seq Q32T1 (MB/s) | 2530 | 3310 31% | 2582 2% | 2957 17% | 3130 ? 24% | |
| Write 4K Q8T8 (MB/s) | 1772 | 1264 ? -29% | ||||
| Read 4K Q8T8 (MB/s) | 1022 | 1193 ? 17% | ||||
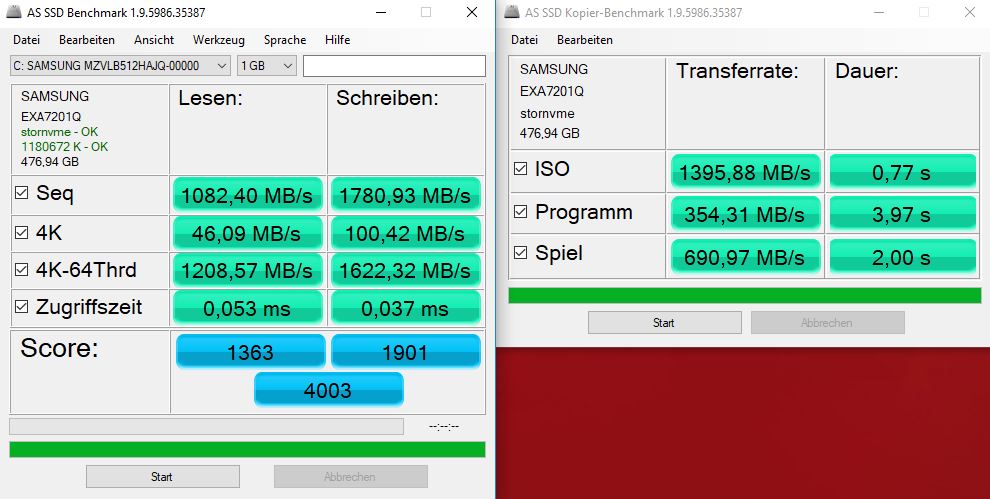
| AS SSD | 3% | 2% | 5% | |||
| Seq Read (MB/s) | 1082 | 2726 152% | 2935 171% | 1976 ? 83% | ||
| Seq Write (MB/s) | 1781 | 1609 -10% | 1451 -19% | 1637 ? -8% | ||
| 4K Read (MB/s) | 46.09 | 38.88 -16% | 46.64 1% | 50.5 ? 10% | ||
| 4K Write (MB/s) | 100.4 | 78.1 -22% | 105.8 5% | 112 ? 12% | ||
| 4K-64 Read (MB/s) | 1209 | 1246 3% | 704 -42% | 1203 ? 0% | ||
| 4K-64 Write (MB/s) | 1622 | 971 -40% | 540 -67% | 1504 ? -7% | ||
| Access Time Read * (ms) | 0.053 | 0.05 6% | 0.044 17% | 0.05092 ? 4% | ||
| Access Time Write * (ms) | 0.037 | 0.048 -30% | 0.037 -0% | 0.08337 ? -125% | ||
| Score Read (Points) | 1363 | 1557 14% | 1044 -23% | 1451 ? 6% | ||
| Score Write (Points) | 1901 | 1210 -36% | 791 -58% | 1780 ? -6% | ||
| Score Total (Points) | 4003 | 3509 -12% | 2305 -42% | 3966 ? -1% | ||
| Copy ISO MB/s (MB/s) | 1396 | 1722 23% | 1545 11% | 1755 ? 26% | ||
| Copy Program MB/s (MB/s) | 354.3 | 297.5 -16% | 520 47% | 454 ? 28% | ||
| Copy Game MB/s (MB/s) | 691 | 839 21% | 909 32% | 1057 ? 53% | ||
| Moyenne finale (programmes/paramètres) | 18% /
14% | 15% /
15% | 5% /
5% | 9% /
9% |
* ... Moindre est la valeur, meilleures sont les performances

| 3DMark 11 - 1280x720 Performance GPU | |
| Moyenne de la classe Workstation (12535 - 69594, n=24, 2 dernières années) | |
| Dell Precision 7720 | |
| Lenovo ThinkPad P72-20MB000EGE | |
| Fujitsu Celsius H980 | |
| Moyenne NVIDIA Quadro P3200 (14673 - 17021, n=4) | |
| Fujitsu Celsius H970 | |
| 3DMark | |
| 1280x720 Cloud Gate Standard Graphics | |
| Moyenne de la classe Workstation (58392 - 152418, n=14, 2 dernières années) | |
| Dell Precision 7720 | |
| Lenovo ThinkPad P72-20MB000EGE | |
| Fujitsu Celsius H980 | |
| Moyenne NVIDIA Quadro P3200 (57501 - 84059, n=4) | |
| Fujitsu Celsius H970 | |
| 1920x1080 Fire Strike Graphics | |
| Moyenne de la classe Workstation (8293 - 52560, n=24, 2 dernières années) | |
| Dell Precision 7720 | |
| Lenovo ThinkPad P72-20MB000EGE | |
| Fujitsu Celsius H980 | |
| Fujitsu Celsius H970 | |
| Moyenne NVIDIA Quadro P3200 (11316 - 12558, n=4) | |
| 2560x1440 Time Spy Graphics | |
| Moyenne de la classe Workstation (2725 - 24806, n=24, 2 dernières années) | |
| Lenovo ThinkPad P72-20MB000EGE | |
| Fujitsu Celsius H980 | |
| Moyenne NVIDIA Quadro P3200 (3732 - 4378, n=3) | |
| Fujitsu Celsius H970 | |
| Dell Precision 7720 | |
| LuxMark v2.0 64Bit | |
| Room GPUs-only | |
| Moyenne de la classe Workstation (1760 - 6990, n=4, 2 dernières années) | |
| Dell Precision 7720 | |
| Fujitsu Celsius H980 | |
| Moyenne NVIDIA Quadro P3200 (1842 - 2206, n=5) | |
| Lenovo ThinkPad P72-20MB000EGE | |
| Fujitsu Celsius H970 | |
| HP ZBook 17 G5-2ZC48EA | |
| Sala GPUs-only | |
| Moyenne de la classe Workstation (5177 - 13967, n=4, 2 dernières années) | |
| Fujitsu Celsius H980 | |
| Dell Precision 7720 | |
| Moyenne NVIDIA Quadro P3200 (3612 - 4383, n=5) | |
| Lenovo ThinkPad P72-20MB000EGE | |
| HP ZBook 17 G5-2ZC48EA | |
| Fujitsu Celsius H970 | |
| Unigine Heaven 4.0 | |
| Extreme Preset OpenGL | |
| Moyenne de la classe Workstation (72.4 - 185.3, n=4, 2 dernières années) | |
| Dell Precision 7720 | |
| Fujitsu Celsius H980 | |
| Moyenne NVIDIA Quadro P3200 (70.3 - 73, n=3) | |
| Lenovo ThinkPad P72-20MB000EGE | |
| HP ZBook 17 G5-2ZC48EA | |
| Extreme Preset DX11 | |
| Moyenne de la classe Workstation (77.7 - 222, n=4, 2 dernières années) | |
| Dell Precision 7720 | |
| Fujitsu Celsius H980 | |
| HP ZBook 17 G5-2ZC48EA | |
| Lenovo ThinkPad P72-20MB000EGE | |
| Moyenne NVIDIA Quadro P3200 (71.4 - 77.2, n=4) | |
| Unigine Valley 1.0 | |
| 1920x1080 Extreme HD DirectX AA:x8 | |
| Dell Precision 7720 | |
| Lenovo ThinkPad P72-20MB000EGE | |
| Moyenne NVIDIA Quadro P3200 (57.1 - 63, n=3) | |
| Fujitsu Celsius H980 | |
| Moyenne de la classe Workstation (n=12 dernières années) | |
| HP ZBook 17 G5-2ZC48EA | |
| 1920x1080 Extreme HD Preset OpenGL AA:x8 | |
| Dell Precision 7720 | |
| Fujitsu Celsius H980 | |
| Moyenne de la classe Workstation (n=12 dernières années) | |
| HP ZBook 17 G5-2ZC48EA | |
| Moyenne NVIDIA Quadro P3200 (49.3 - 50.2, n=3) | |
| Lenovo ThinkPad P72-20MB000EGE | |
| SiSoft Sandra 2016 | |
| Image Processing | |
| Fujitsu Celsius H980 | |
| Lenovo ThinkPad P72-20MB000EGE | |
| Moyenne NVIDIA Quadro P3200 (691 - 830, n=4) | |
| Dell Precision 7720 | |
| HP ZBook 17 G5-2ZC48EA | |
| GP Cryptography (Higher Security AES256+SHA2-512) | |
| Dell Precision 7720 | |
| Lenovo ThinkPad P72-20MB000EGE | |
| Fujitsu Celsius H980 | |
| Moyenne NVIDIA Quadro P3200 (28.1 - 30.2, n=4) | |
| HP ZBook 17 G5-2ZC48EA | |
| GP Financial Analysis (FP High/Double Precision) | |
| Dell Precision 7720 | |
| Fujitsu Celsius H980 | |
| Lenovo ThinkPad P72-20MB000EGE | |
| Moyenne NVIDIA Quadro P3200 (84.5 - 86.6, n=4) | |
| HP ZBook 17 G5-2ZC48EA | |
| 3DMark 11 Performance | 15178 points | |
| 3DMark Ice Storm Standard Score | 90781 points | |
| 3DMark Cloud Gate Standard Score | 34178 points | |
| 3DMark Fire Strike Score | 11114 points | |
| 3DMark Fire Strike Extreme Score | 5856 points | |
| 3DMark Time Spy Score | 4593 points | |
Aide | ||
| Bas | Moyen | Élevé | Ultra | |
|---|---|---|---|---|
| BioShock Infinite (2013) | 284.9 | 246.5 | 231.5 | 112.3 |
| Dota 2 Reborn (2015) | 129.6 | 121.2 | 114.7 | 107.8 |
| Rise of the Tomb Raider (2016) | 182 | 144 | 86 | 73 |
| X-Plane 11.11 (2018) | 100 | 86 | 72 | |
| Far Cry 5 (2018) | 120 | 79 | 74 | 70 |
Degré de la nuisance sonore
| Au repos |
| 29.6 / 32.5 / 32.5 dB(A) |
| Fortement sollicité |
| 34.9 / 49.1 dB(A) |
 | ||
30 dB silencieux 40 dB(A) audible 50 dB(A) bruyant |
||
min: | ||
| Fujitsu Celsius H980 Quadro P3200, i7-8750H, Samsung SSD PM981 MZVLB512HAJQ | Fujitsu Celsius H970 Quadro P4000, E3-1535M v6, Samsung SM961 MZVKW512HMJP m.2 PCI-e | Dell Precision 7720 Quadro P5000, E3-1535M v6, Toshiba NVMe THNSN5512GPU7 | Lenovo ThinkPad P72-20MB000EGE Quadro P3200, i7-8850H, Lenovo LENSE20256GMSP34MEAT2TA | HP ZBook 17 G5-2ZC48EA Quadro P3200, i7-8850H, Toshiba XG5 KXG50ZNV256G | |
|---|---|---|---|---|---|
| Noise | -6% | 4% | 10% | 5% | |
| arrêt / environnement * (dB) | 29.6 | 30.2 -2% | 29.5 -0% | 28.6 3% | 28.7 3% |
| Idle Minimum * (dB) | 29.6 | 30.2 -2% | 29.5 -0% | 28.6 3% | 28.7 3% |
| Idle Average * (dB) | 32.5 | 32.8 -1% | 29.5 9% | 28.6 12% | 28.7 12% |
| Idle Maximum * (dB) | 32.5 | 32.8 -1% | 29.5 9% | 28.6 12% | 30.9 5% |
| Load Average * (dB) | 34.9 | 47.3 -36% | 35 -0% | 31.9 9% | 37.3 -7% |
| Load Maximum * (dB) | 49.1 | 47.3 4% | 47.8 3% | 37.7 23% | 41.4 16% |
| Witcher 3 ultra * (dB) | 41 | 35.7 | 41.1 |
* ... Moindre est la valeur, meilleures sont les performances
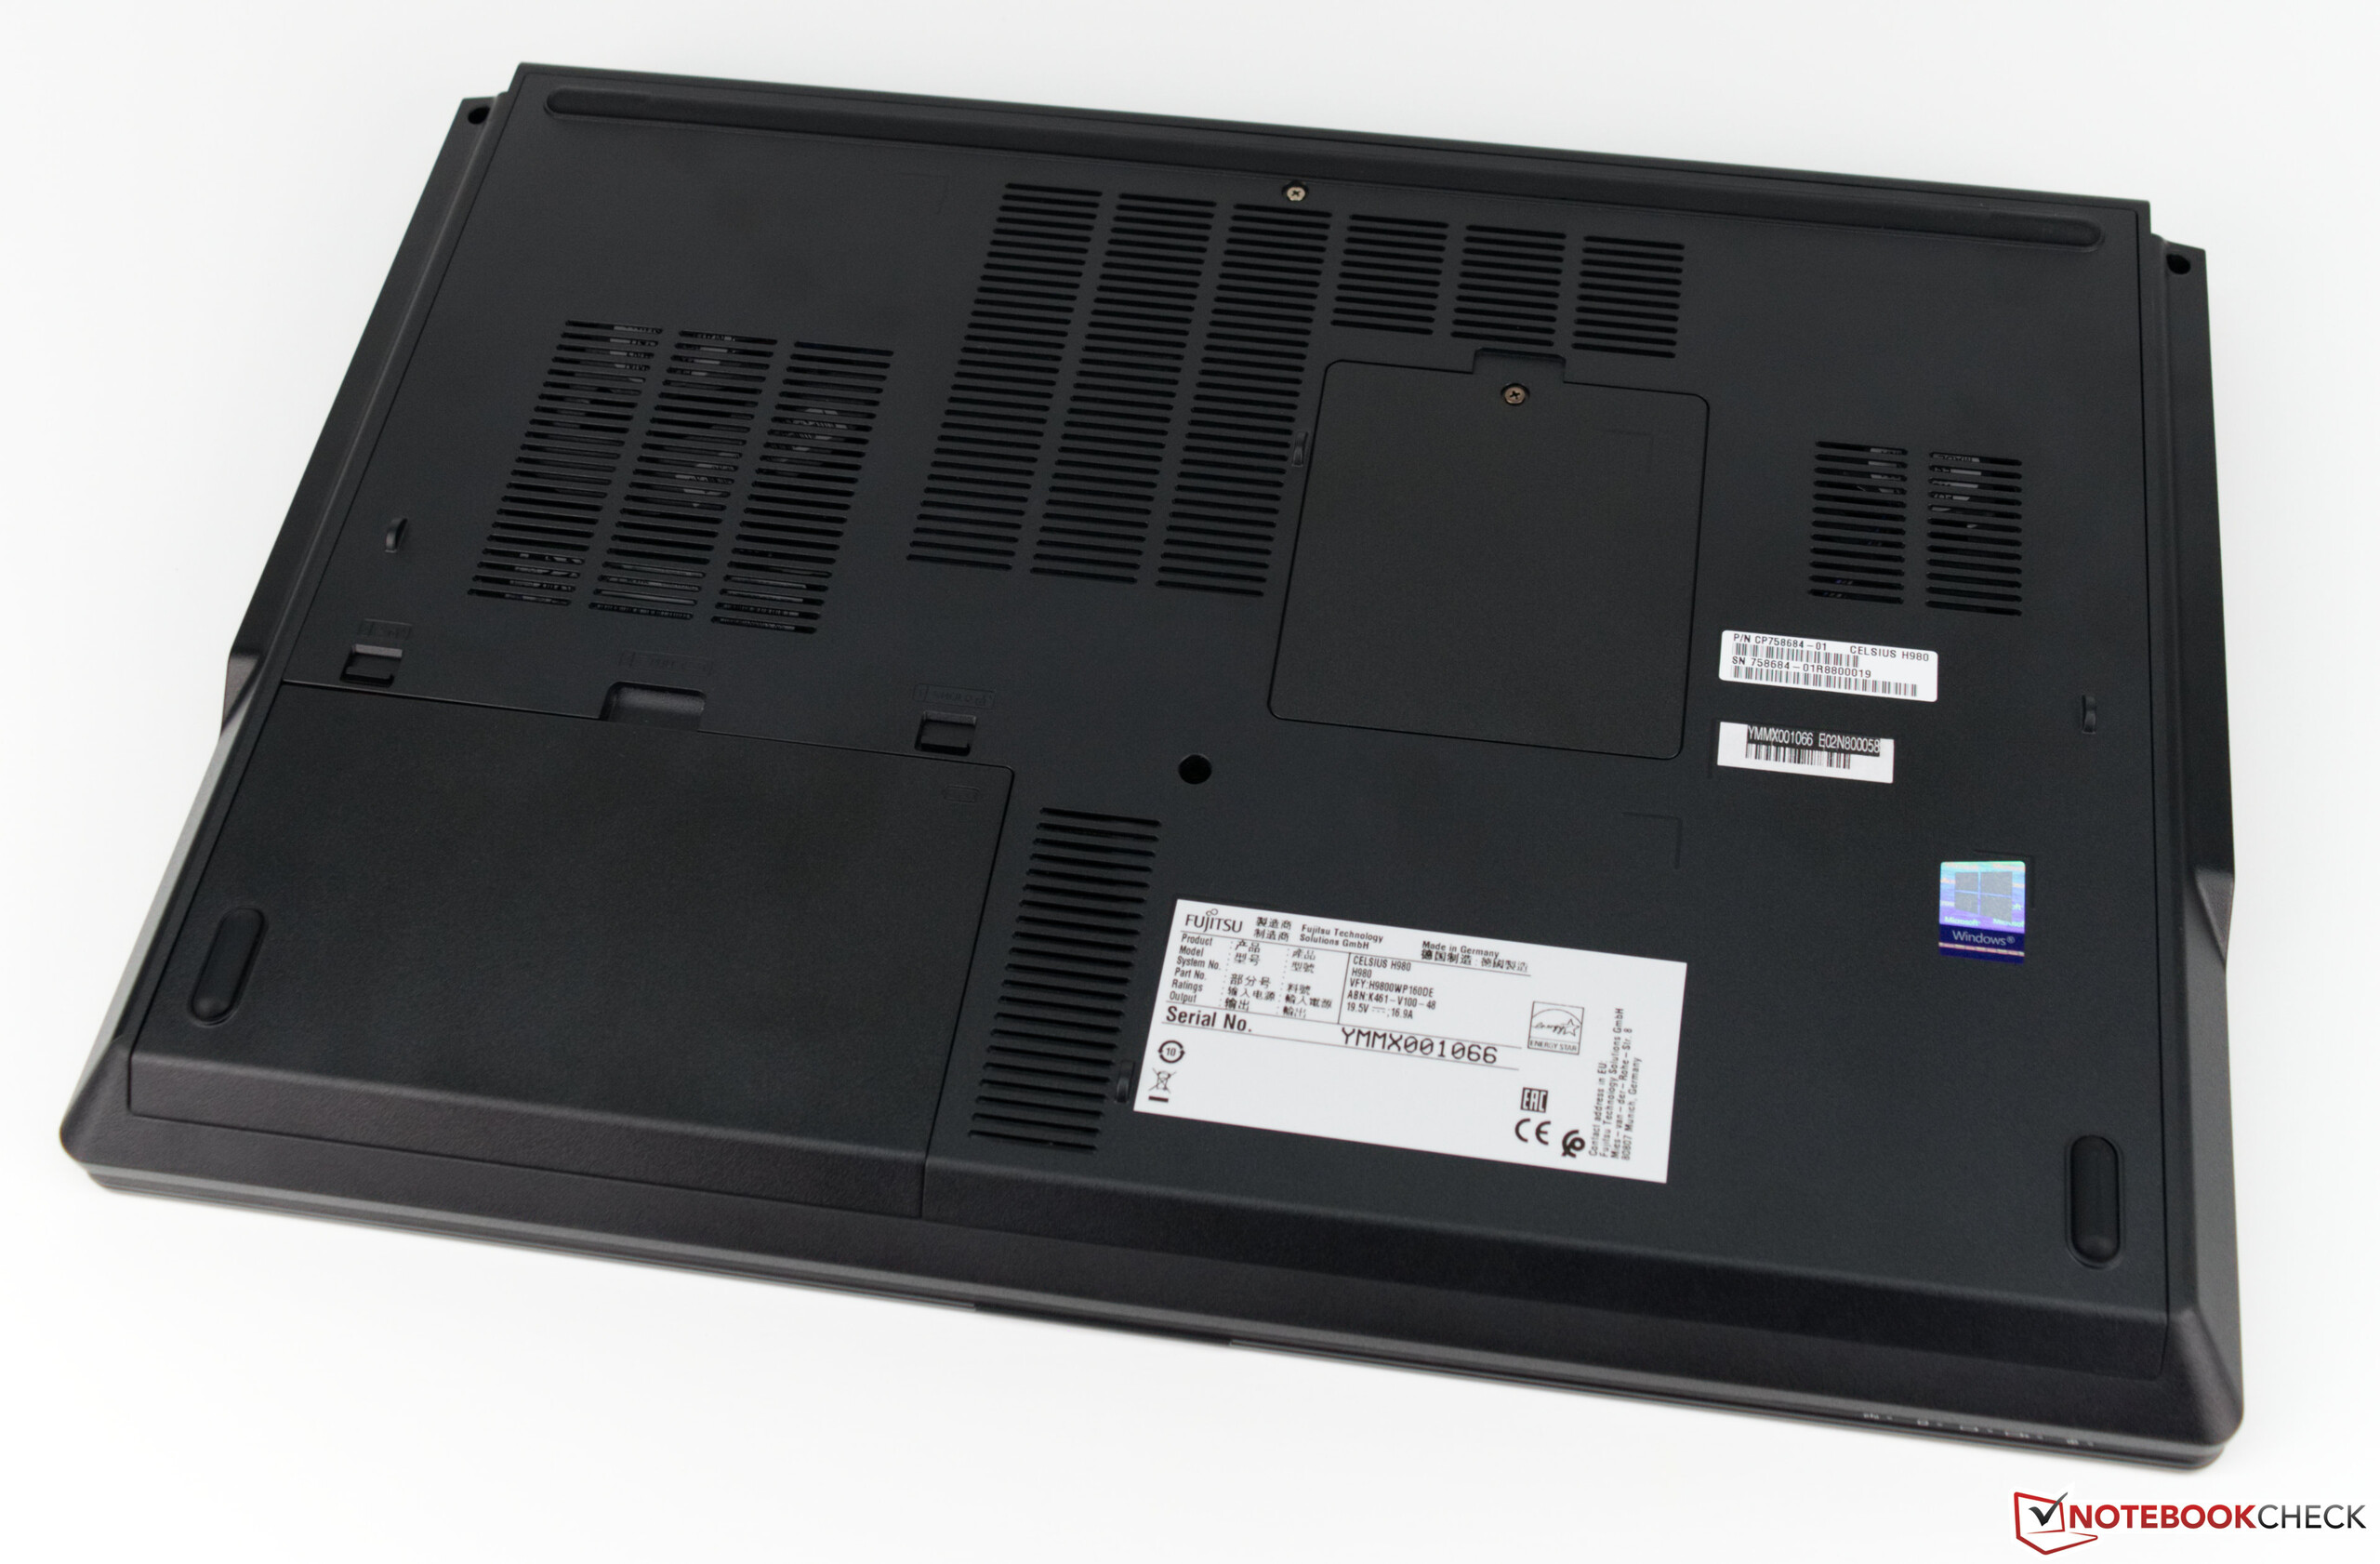
(±) La température maximale du côté supérieur est de 41.8 °C / 107 F, par rapport à la moyenne de 38.2 °C / 101 F, allant de 22.2 à 69.8 °C pour la classe Workstation.
(-) Le fond chauffe jusqu'à un maximum de 46.2 °C / 115 F, contre une moyenne de 41.1 °C / 106 F
(+) En utilisation inactive, la température moyenne du côté supérieur est de 24.1 °C / 75 F, par rapport à la moyenne du dispositif de 32 °C / 90 F.
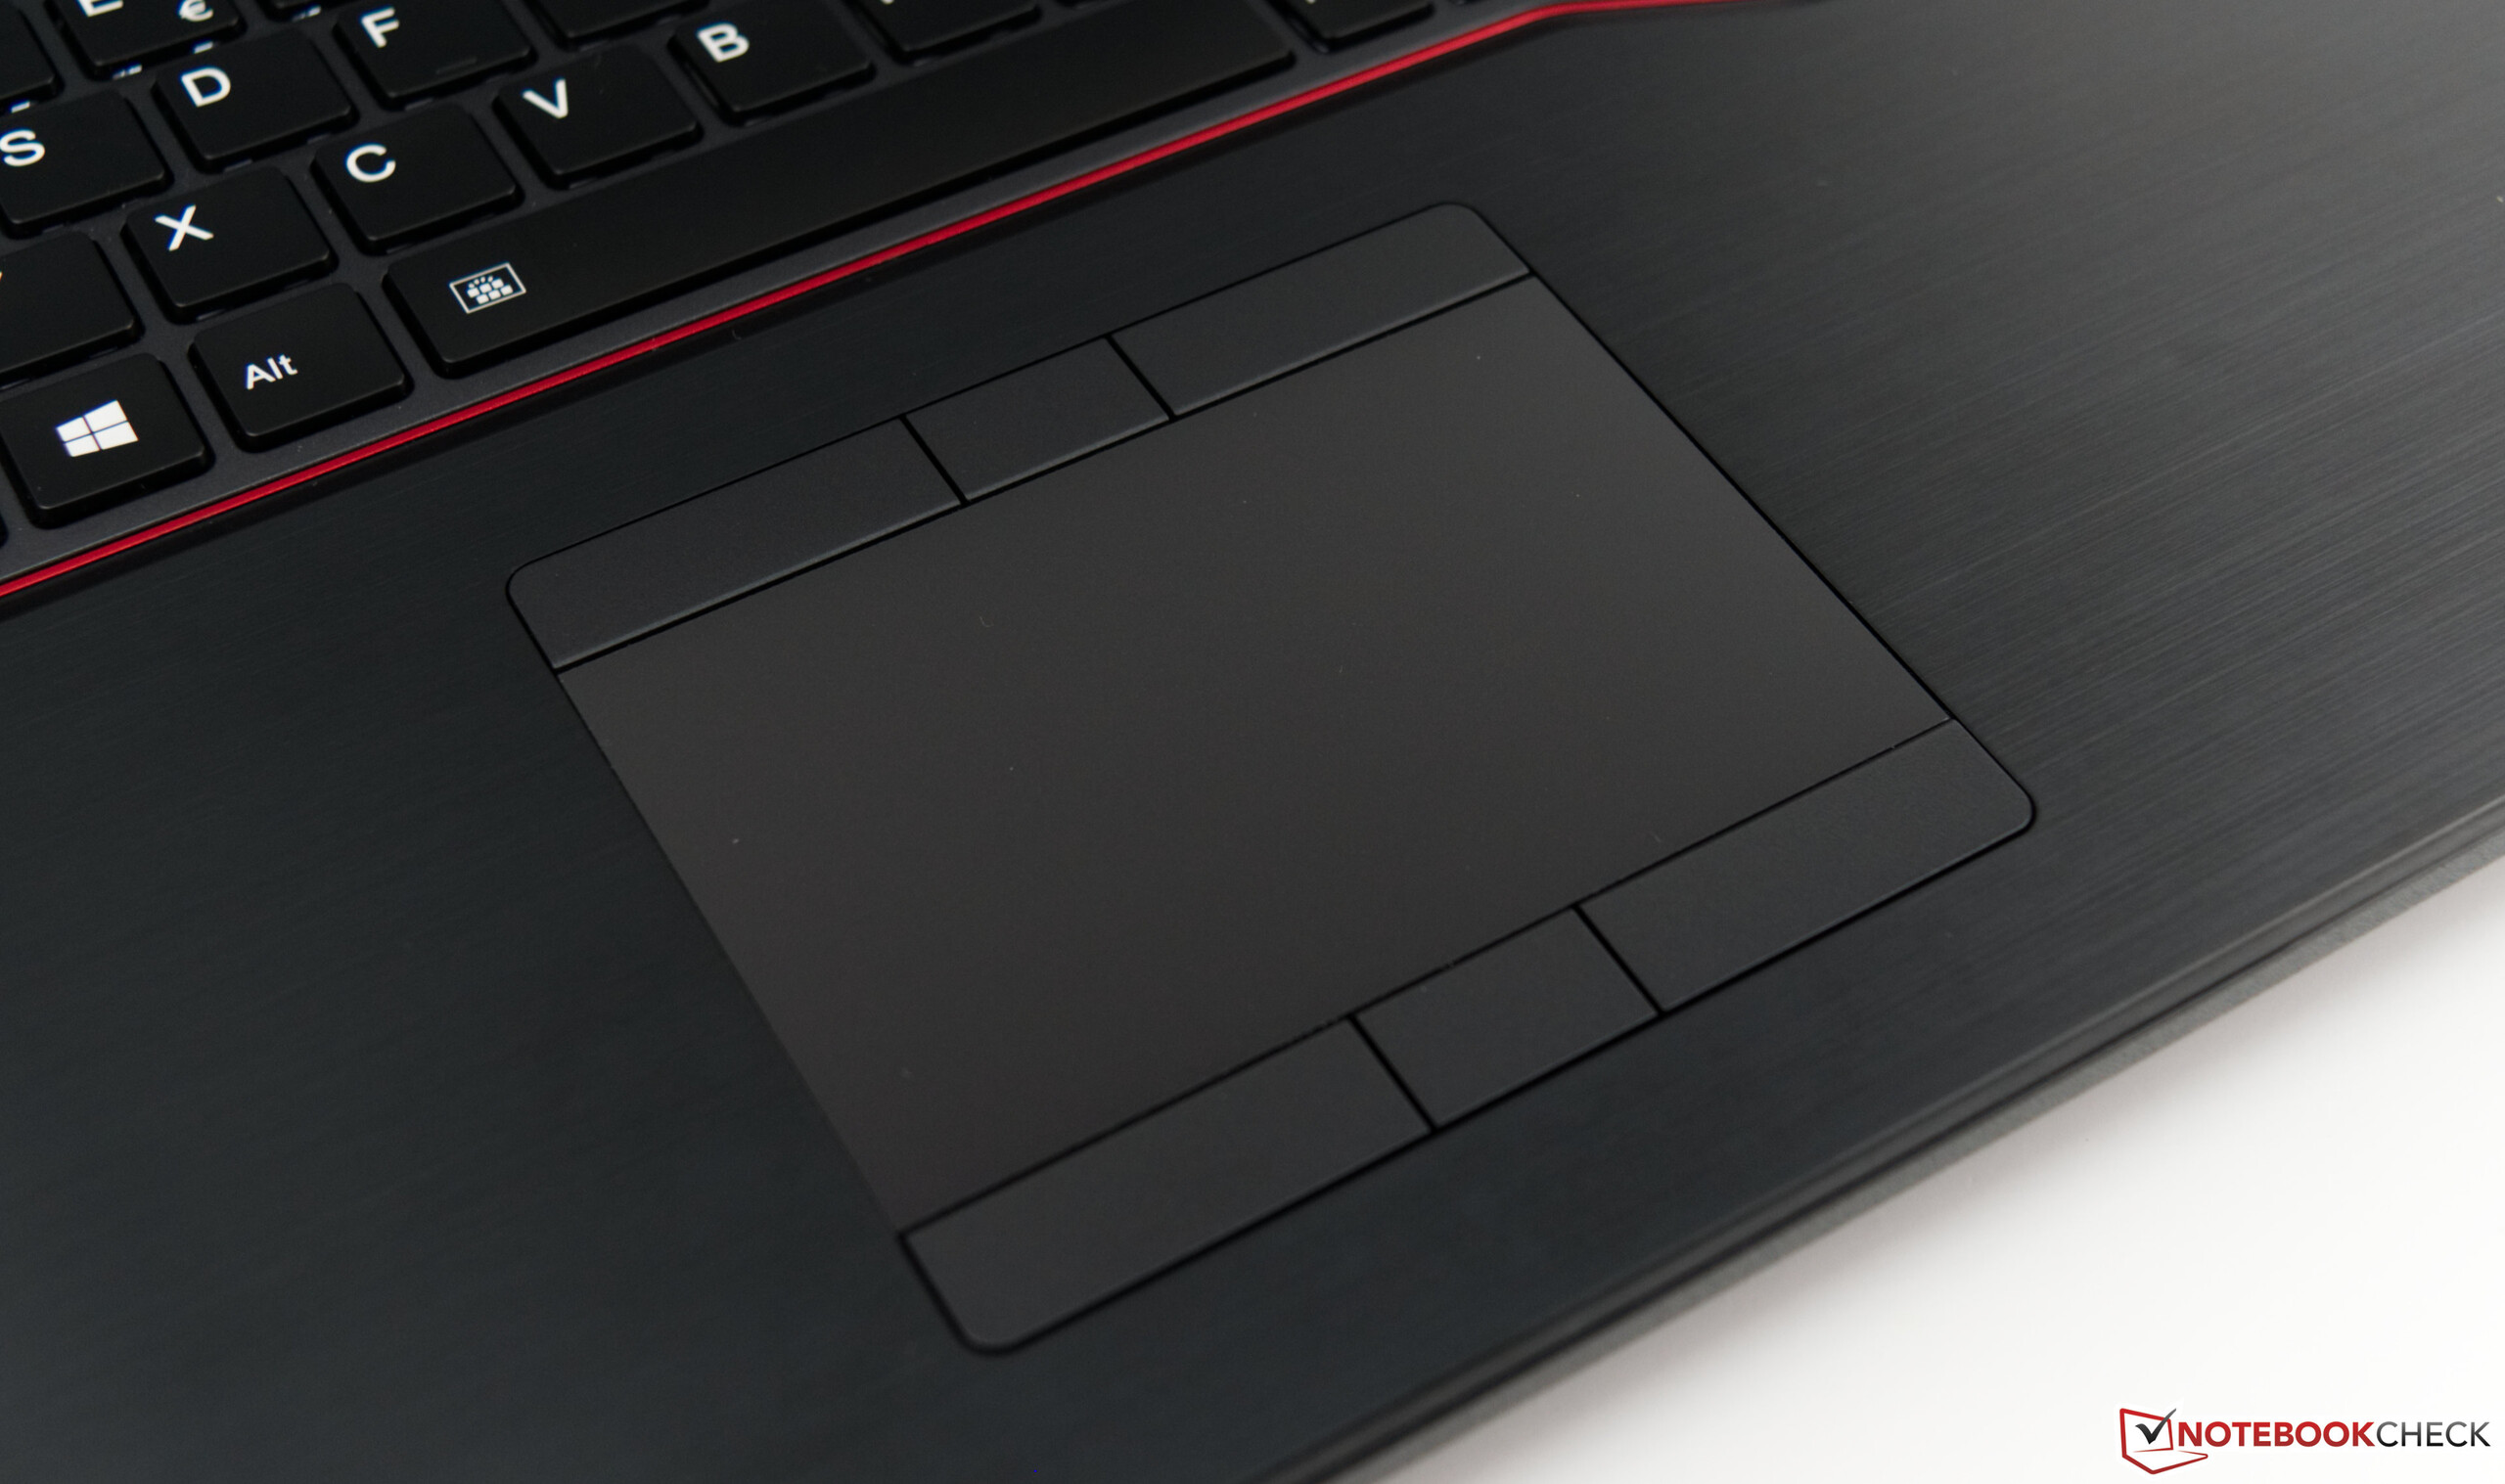
(+) Les repose-poignets et le pavé tactile sont plus froids que la température de la peau avec un maximum de 23.8 °C / 74.8 F et sont donc froids au toucher.
(+) La température moyenne de la zone de l'appui-paume de dispositifs similaires était de 27.8 °C / 82 F (+4 °C / #7.2 F).
| Fujitsu Celsius H980 Quadro P3200, i7-8750H, Samsung SSD PM981 MZVLB512HAJQ | Fujitsu Celsius H970 Quadro P4000, E3-1535M v6, Samsung SM961 MZVKW512HMJP m.2 PCI-e | Dell Precision 7720 Quadro P5000, E3-1535M v6, Toshiba NVMe THNSN5512GPU7 | Lenovo ThinkPad P72-20MB000EGE Quadro P3200, i7-8850H, Lenovo LENSE20256GMSP34MEAT2TA | HP ZBook 17 G5-2ZC48EA Quadro P3200, i7-8850H, Toshiba XG5 KXG50ZNV256G | |
|---|---|---|---|---|---|
| Heat | -1% | -1% | 9% | 2% | |
| Maximum Upper Side * (°C) | 41.8 | 41.4 1% | 42.3 -1% | 42.8 -2% | 42.9 -3% |
| Maximum Bottom * (°C) | 46.2 | 48.7 -5% | 44.9 3% | 39.5 15% | 46.3 -0% |
| Idle Upper Side * (°C) | 25.6 | 26.2 -2% | 26.1 -2% | 23.1 10% | 24.8 3% |
| Idle Bottom * (°C) | 26.6 | 26.4 1% | 27.9 -5% | 23.5 12% | 24.9 6% |
* ... Moindre est la valeur, meilleures sont les performances
Fujitsu Celsius H980 analyse audio
(-) | haut-parleurs pas très forts (69.8 dB)
Basses 100 - 315 Hz
(-) | presque aucune basse - en moyenne 26.5% plus bas que la médiane
(+) | les basses sont linéaires (4.7% delta à la fréquence précédente)
Médiums 400 - 2000 Hz
(±) | médiane réduite - en moyenne 6.2% inférieure à la médiane
(±) | la linéarité des médiums est moyenne (10.8% delta à la fréquence précédente)
Aiguës 2 - 16 kHz
(+) | des sommets équilibrés - à seulement 3.7% de la médiane
(±) | la linéarité des aigus est moyenne (10% delta à la fréquence précédente)
Globalement 100 - 16 000 Hz
(-) | le son global n'est pas linéaire (32.2% de différence à la médiane)
Par rapport à la même classe
» 99% de tous les appareils testés de cette catégorie étaient meilleurs, 1% similaires, 1% pires
» Le meilleur avait un delta de 7%, la moyenne était de 17%, le pire était de 35%.
Par rapport à tous les appareils testés
» 91% de tous les appareils testés étaient meilleurs, 2% similaires, 7% pires
» Le meilleur avait un delta de 4%, la moyenne était de 23%, le pire était de 134%.
Lenovo ThinkPad P72-20MB000EGE analyse audio
(-) | haut-parleurs pas très forts (69.6 dB)
Basses 100 - 315 Hz
(-) | presque aucune basse - en moyenne 17.4% plus bas que la médiane
(±) | la linéarité des basses est moyenne (13.5% delta à la fréquence précédente)
Médiums 400 - 2000 Hz
(±) | médiane supérieure - en moyenne 7.2% supérieure à la médiane
(±) | la linéarité des médiums est moyenne (8.7% delta à la fréquence précédente)
Aiguës 2 - 16 kHz
(+) | des sommets équilibrés - à seulement 4.4% de la médiane
(±) | la linéarité des aigus est moyenne (12.7% delta à la fréquence précédente)
Globalement 100 - 16 000 Hz
(-) | le son global n'est pas linéaire (30.7% de différence à la médiane)
Par rapport à la même classe
» 97% de tous les appareils testés de cette catégorie étaient meilleurs, 1% similaires, 1% pires
» Le meilleur avait un delta de 7%, la moyenne était de 17%, le pire était de 35%.
Par rapport à tous les appareils testés
» 89% de tous les appareils testés étaient meilleurs, 3% similaires, 8% pires
» Le meilleur avait un delta de 4%, la moyenne était de 23%, le pire était de 134%.
| Éteint/en veille | |
| Au repos | |
| Fortement sollicité |
|
Légende:
min: | |
| Fujitsu Celsius H980 i7-8750H, Quadro P3200, Samsung SSD PM981 MZVLB512HAJQ, IPS, 1920x1080, 17.3" | Fujitsu Celsius H970 E3-1535M v6, Quadro P4000, Samsung SM961 MZVKW512HMJP m.2 PCI-e, IPS LED, 1920x1080, 17.3" | Dell Precision 7720 E3-1535M v6, Quadro P5000, Toshiba NVMe THNSN5512GPU7, IGZO, 3840x2160, 17.3" | Lenovo ThinkPad P72-20MB000EGE i7-8850H, Quadro P3200, Lenovo LENSE20256GMSP34MEAT2TA, IPS, 1920x1080, 17.3" | HP ZBook 17 G5-2ZC48EA i7-8850H, Quadro P3200, Toshiba XG5 KXG50ZNV256G, , 1920x1080, 17.3" | Moyenne NVIDIA Quadro P3200 | Moyenne de la classe Workstation | |
|---|---|---|---|---|---|---|---|
| Power Consumption | 22% | 7% | 35% | 23% | 13% | 21% | |
| Idle Minimum * (Watt) | 14.8 | 10.7 28% | 9.6 35% | 4.6 69% | 9.3 37% | 10.9 ? 26% | 9.04 ? 39% |
| Idle Average * (Watt) | 20.4 | 15.8 23% | 20.5 -0% | 12.2 40% | 14.4 29% | 17.1 ? 16% | 13.8 ? 32% |
| Idle Maximum * (Watt) | 21.5 | 17.8 17% | 22.9 -7% | 15.4 28% | 15.8 27% | 19.6 ? 9% | 17.7 ? 18% |
| Load Average * (Watt) | 98.4 | 92 7% | 96.8 2% | 79.6 19% | 89.2 9% | 95.1 ? 3% | 96.2 ? 2% |
| Load Maximum * (Watt) | 213.5 | 137 36% | 202.1 5% | 176 18% | 189 11% | 191.3 ? 10% | 178.5 ? 16% |
| Witcher 3 ultra * (Watt) | 86 | 123 |
* ... Moindre est la valeur, meilleures sont les performances
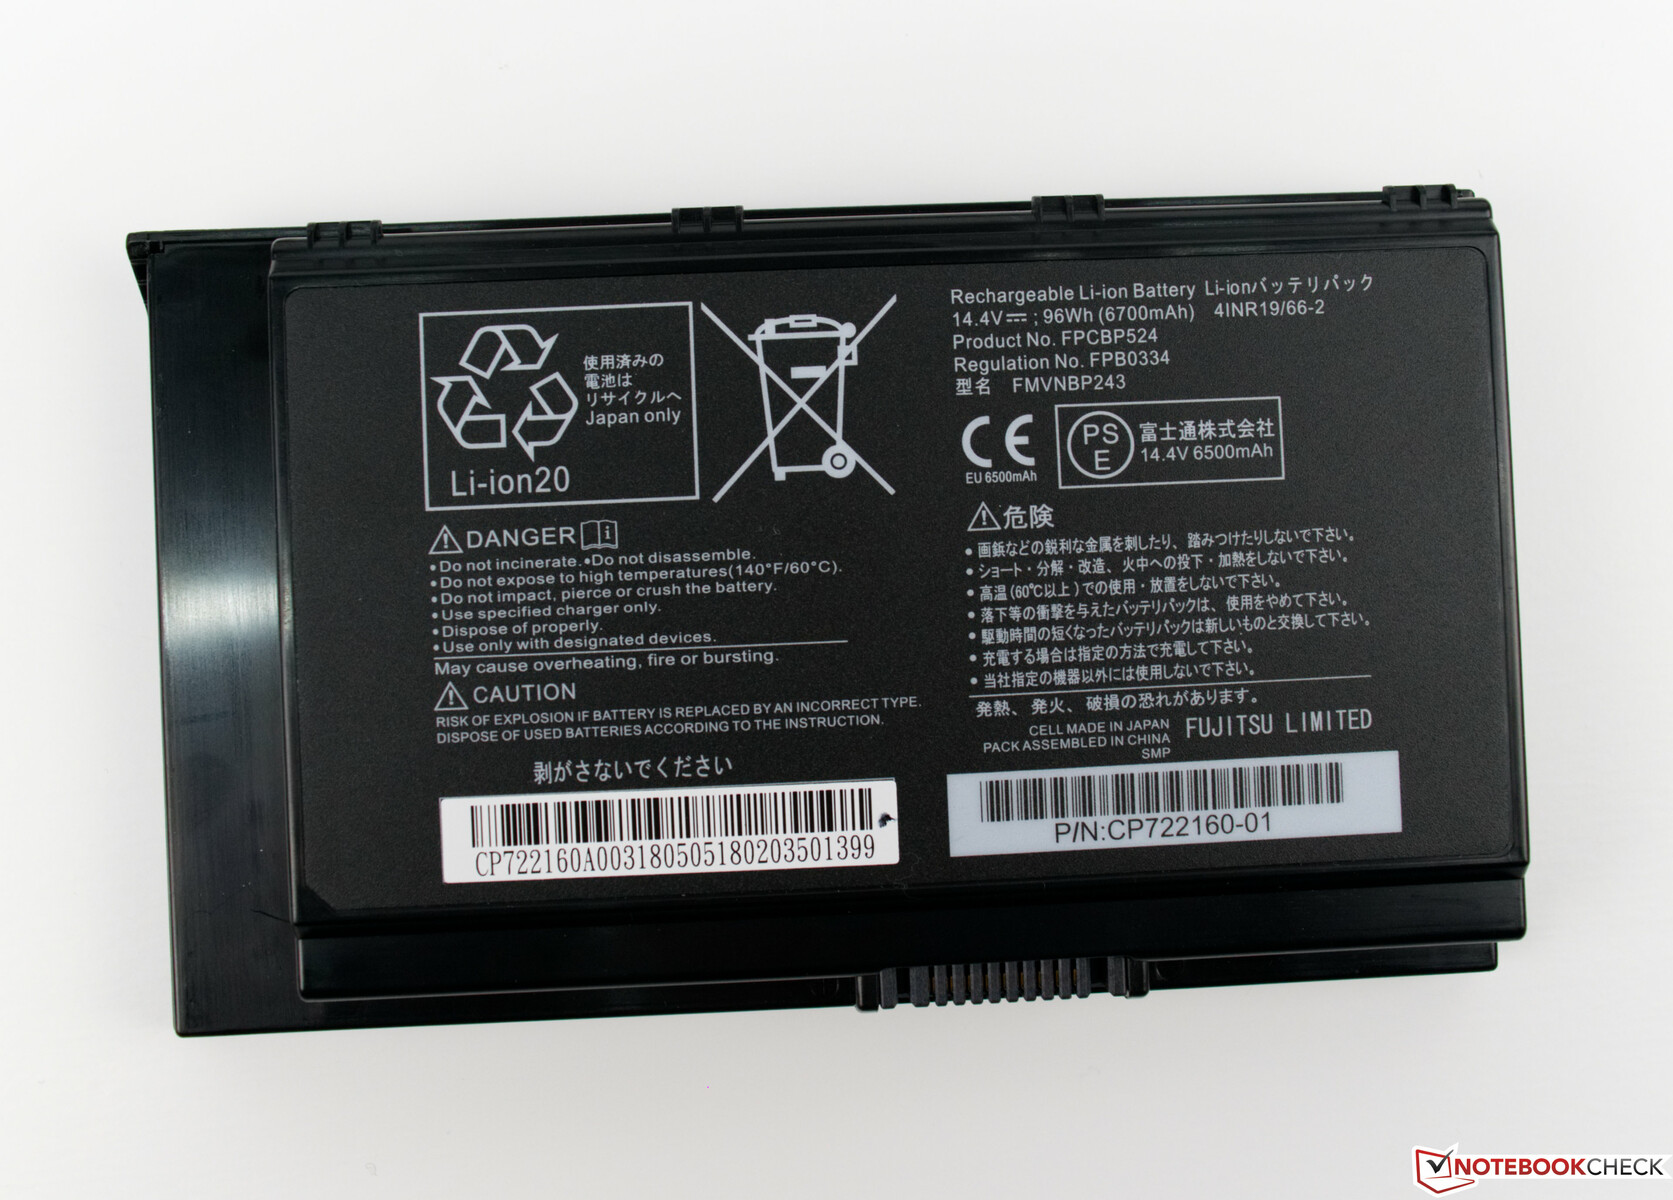
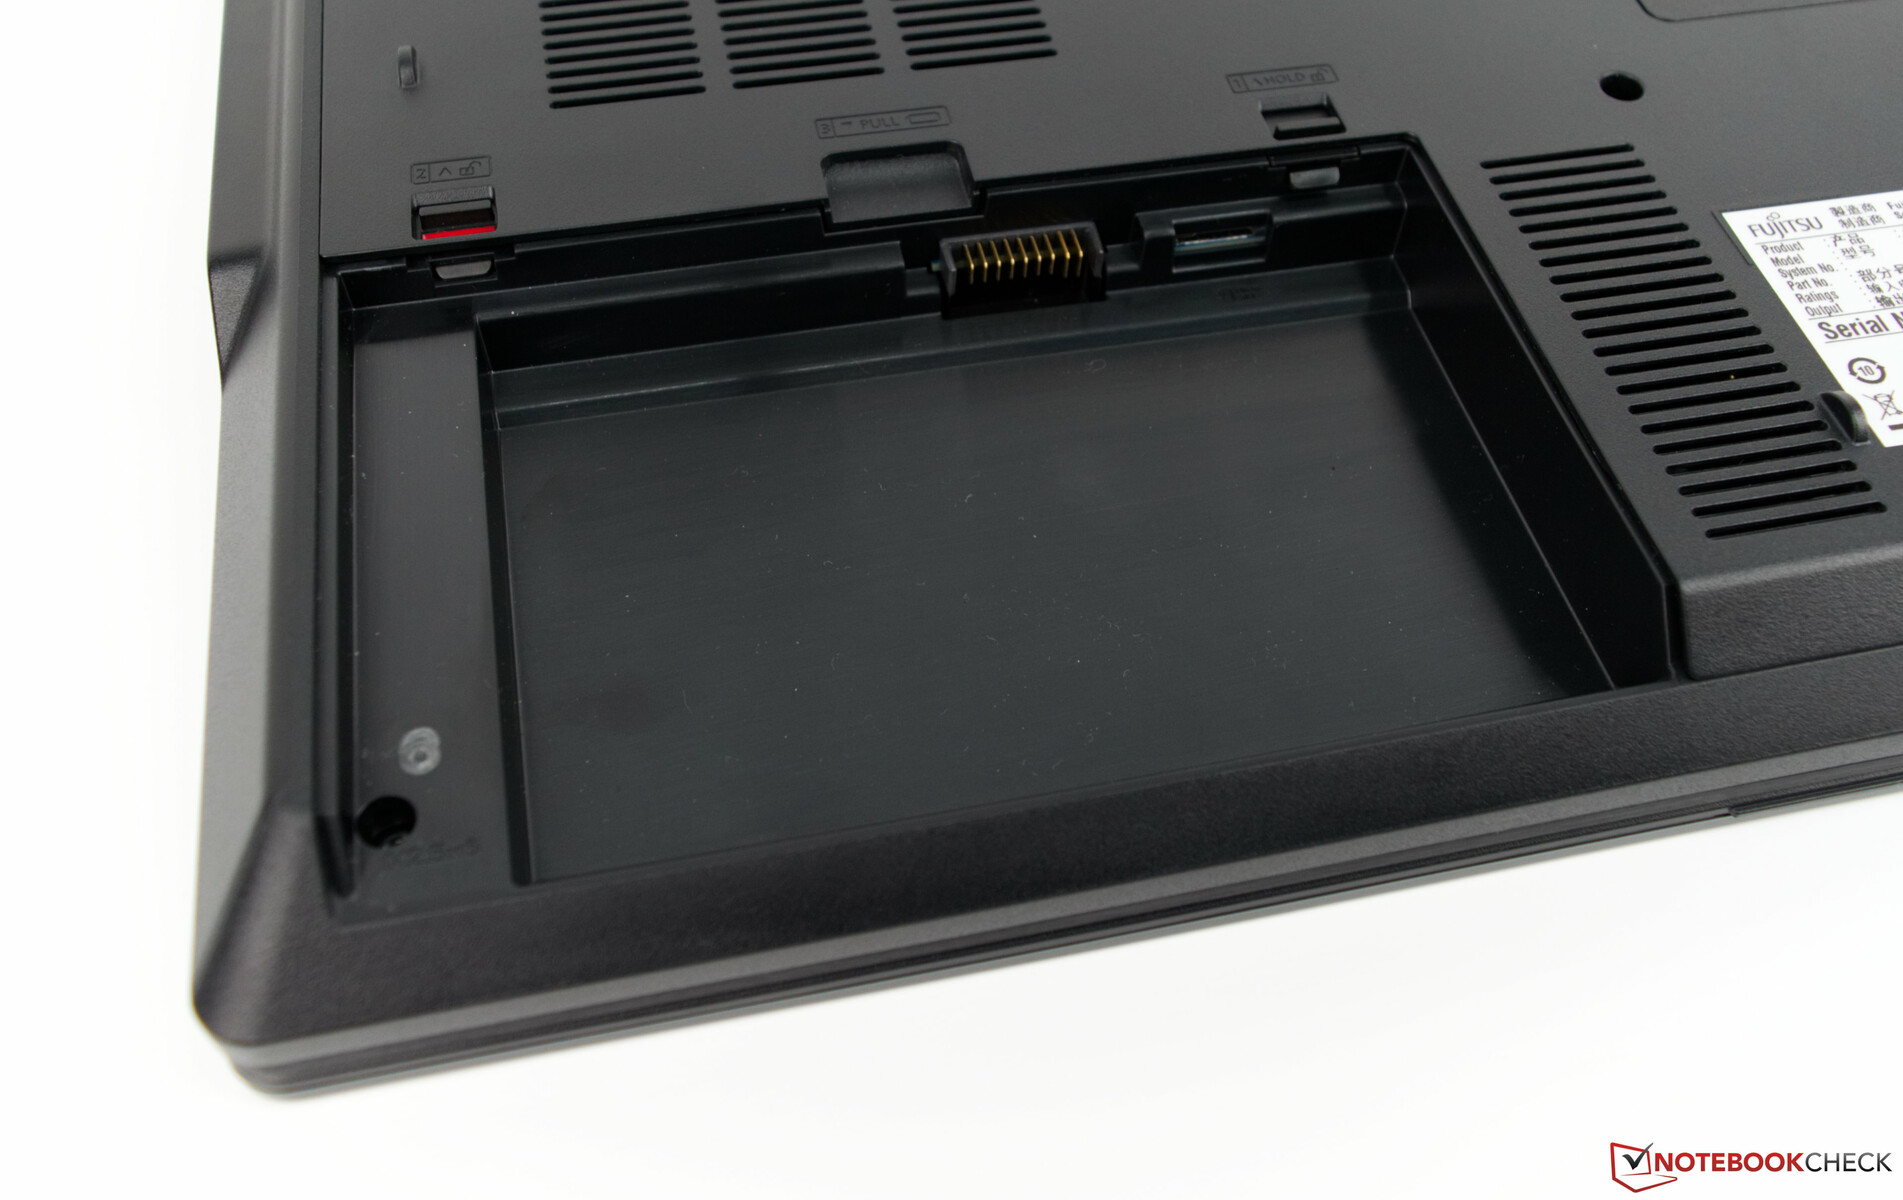
| Fujitsu Celsius H980 i7-8750H, Quadro P3200, 96 Wh | Fujitsu Celsius H970 E3-1535M v6, Quadro P4000, 96 Wh | Dell Precision 7720 E3-1535M v6, Quadro P5000, 91 Wh | Lenovo ThinkPad P72-20MB000EGE i7-8850H, Quadro P3200, 99 Wh | HP ZBook 17 G5-2ZC48EA i7-8850H, Quadro P3200, Wh | Moyenne de la classe Workstation | |
|---|---|---|---|---|---|---|
| Autonomie de la batterie | 20% | -10% | 62% | 56% | 40% | |
| Reader / Idle (h) | 13.5 | 16.7 24% | 11.4 -16% | 28.3 110% | 21.9 62% | 26.1 ? 93% |
| H.264 (h) | 5.9 | 9.6 63% | 6.8 15% | 12.3 108% | 9.2 56% | 9.51 ? 61% |
| WiFi v1.3 (h) | 8.3 | 9 8% | 6.3 -24% | 11.2 35% | 8.52 ? 3% | |
| Load (h) | 1.4 | 1.2 -14% | 1.2 -14% | 1.3 -7% | 2.1 50% | 1.429 ? 2% |
Points positifs
Points négatifs
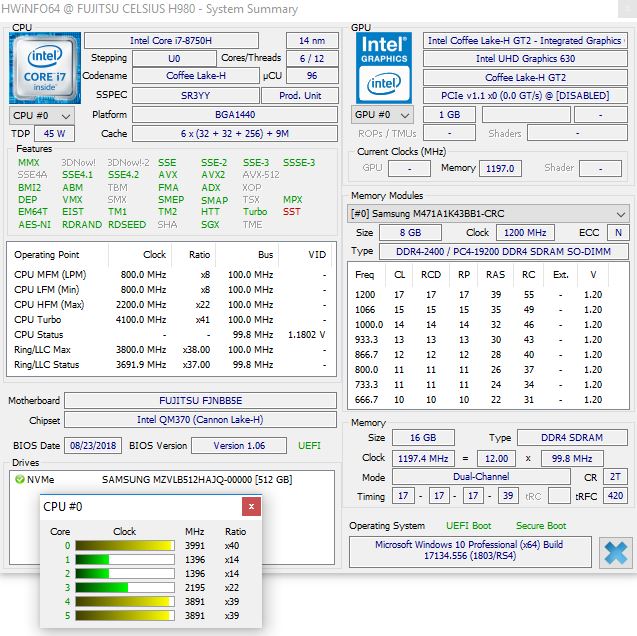
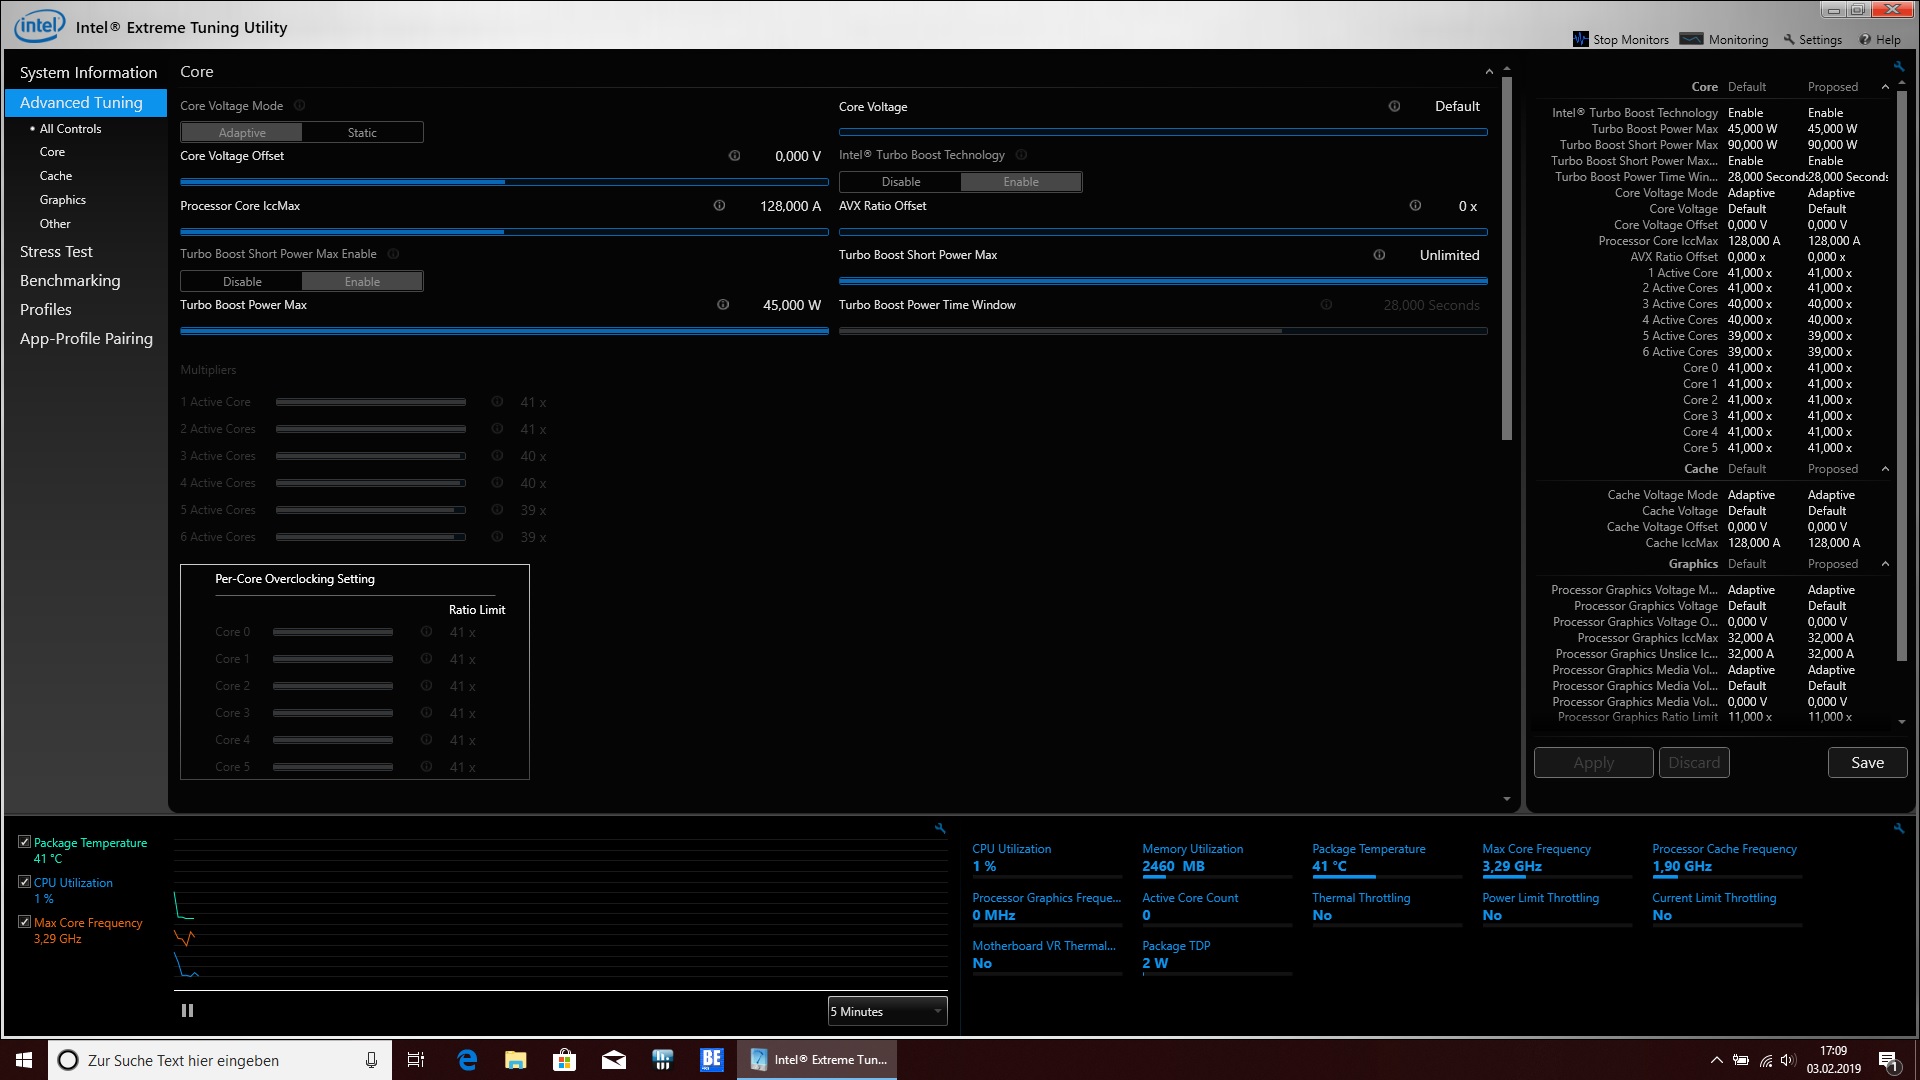
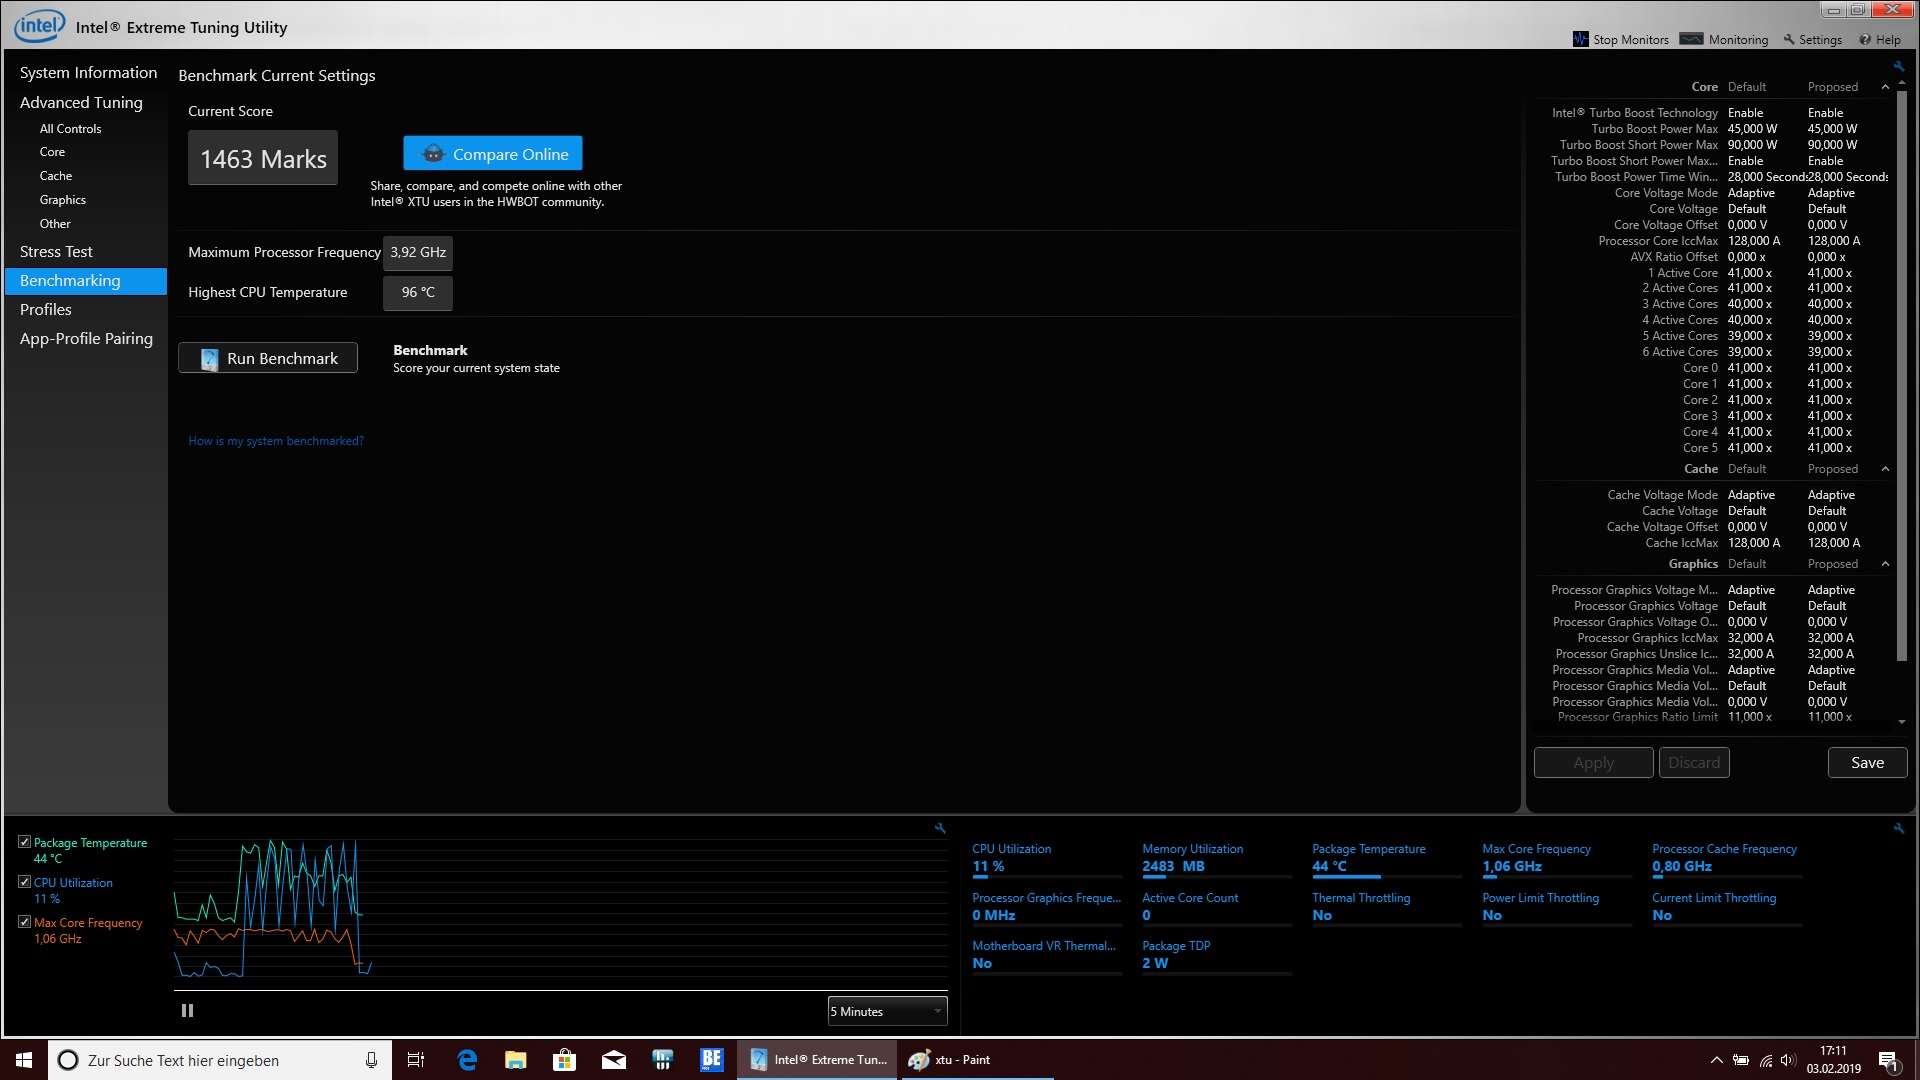
Le marché des stations de travail n’est pas étendu, seulement quelques constructeurs produisant des appareils répondant aux besoins d’une station de travail. Fujitsu sait de quoi sont faites de telles machines, grâce à des années d’expérience. Le Celsius peut exploiter le potentiel de son processeur hexacœur, tout particulièrement dans les logiciels multithread, sans thermal throttling, ce qui est excellent. Cependant, le Core i7-8750H du modèle que nous testons est le processeur le moins puissant que Fujitsu propose avec le Celsius H980, si bien que nous serions intéressés de voir comment il s’en tirerait avec un Intel Xeon E-2186M.
Le Celsius Celsius H970 possédait un refroidissement du GPU efficace, et cela reste heureusement le cas avec le H980. La Nvidia Quadro P3200 s’est bien comportée dans nos tests, et se combine bien avec le Core i7-8750H.
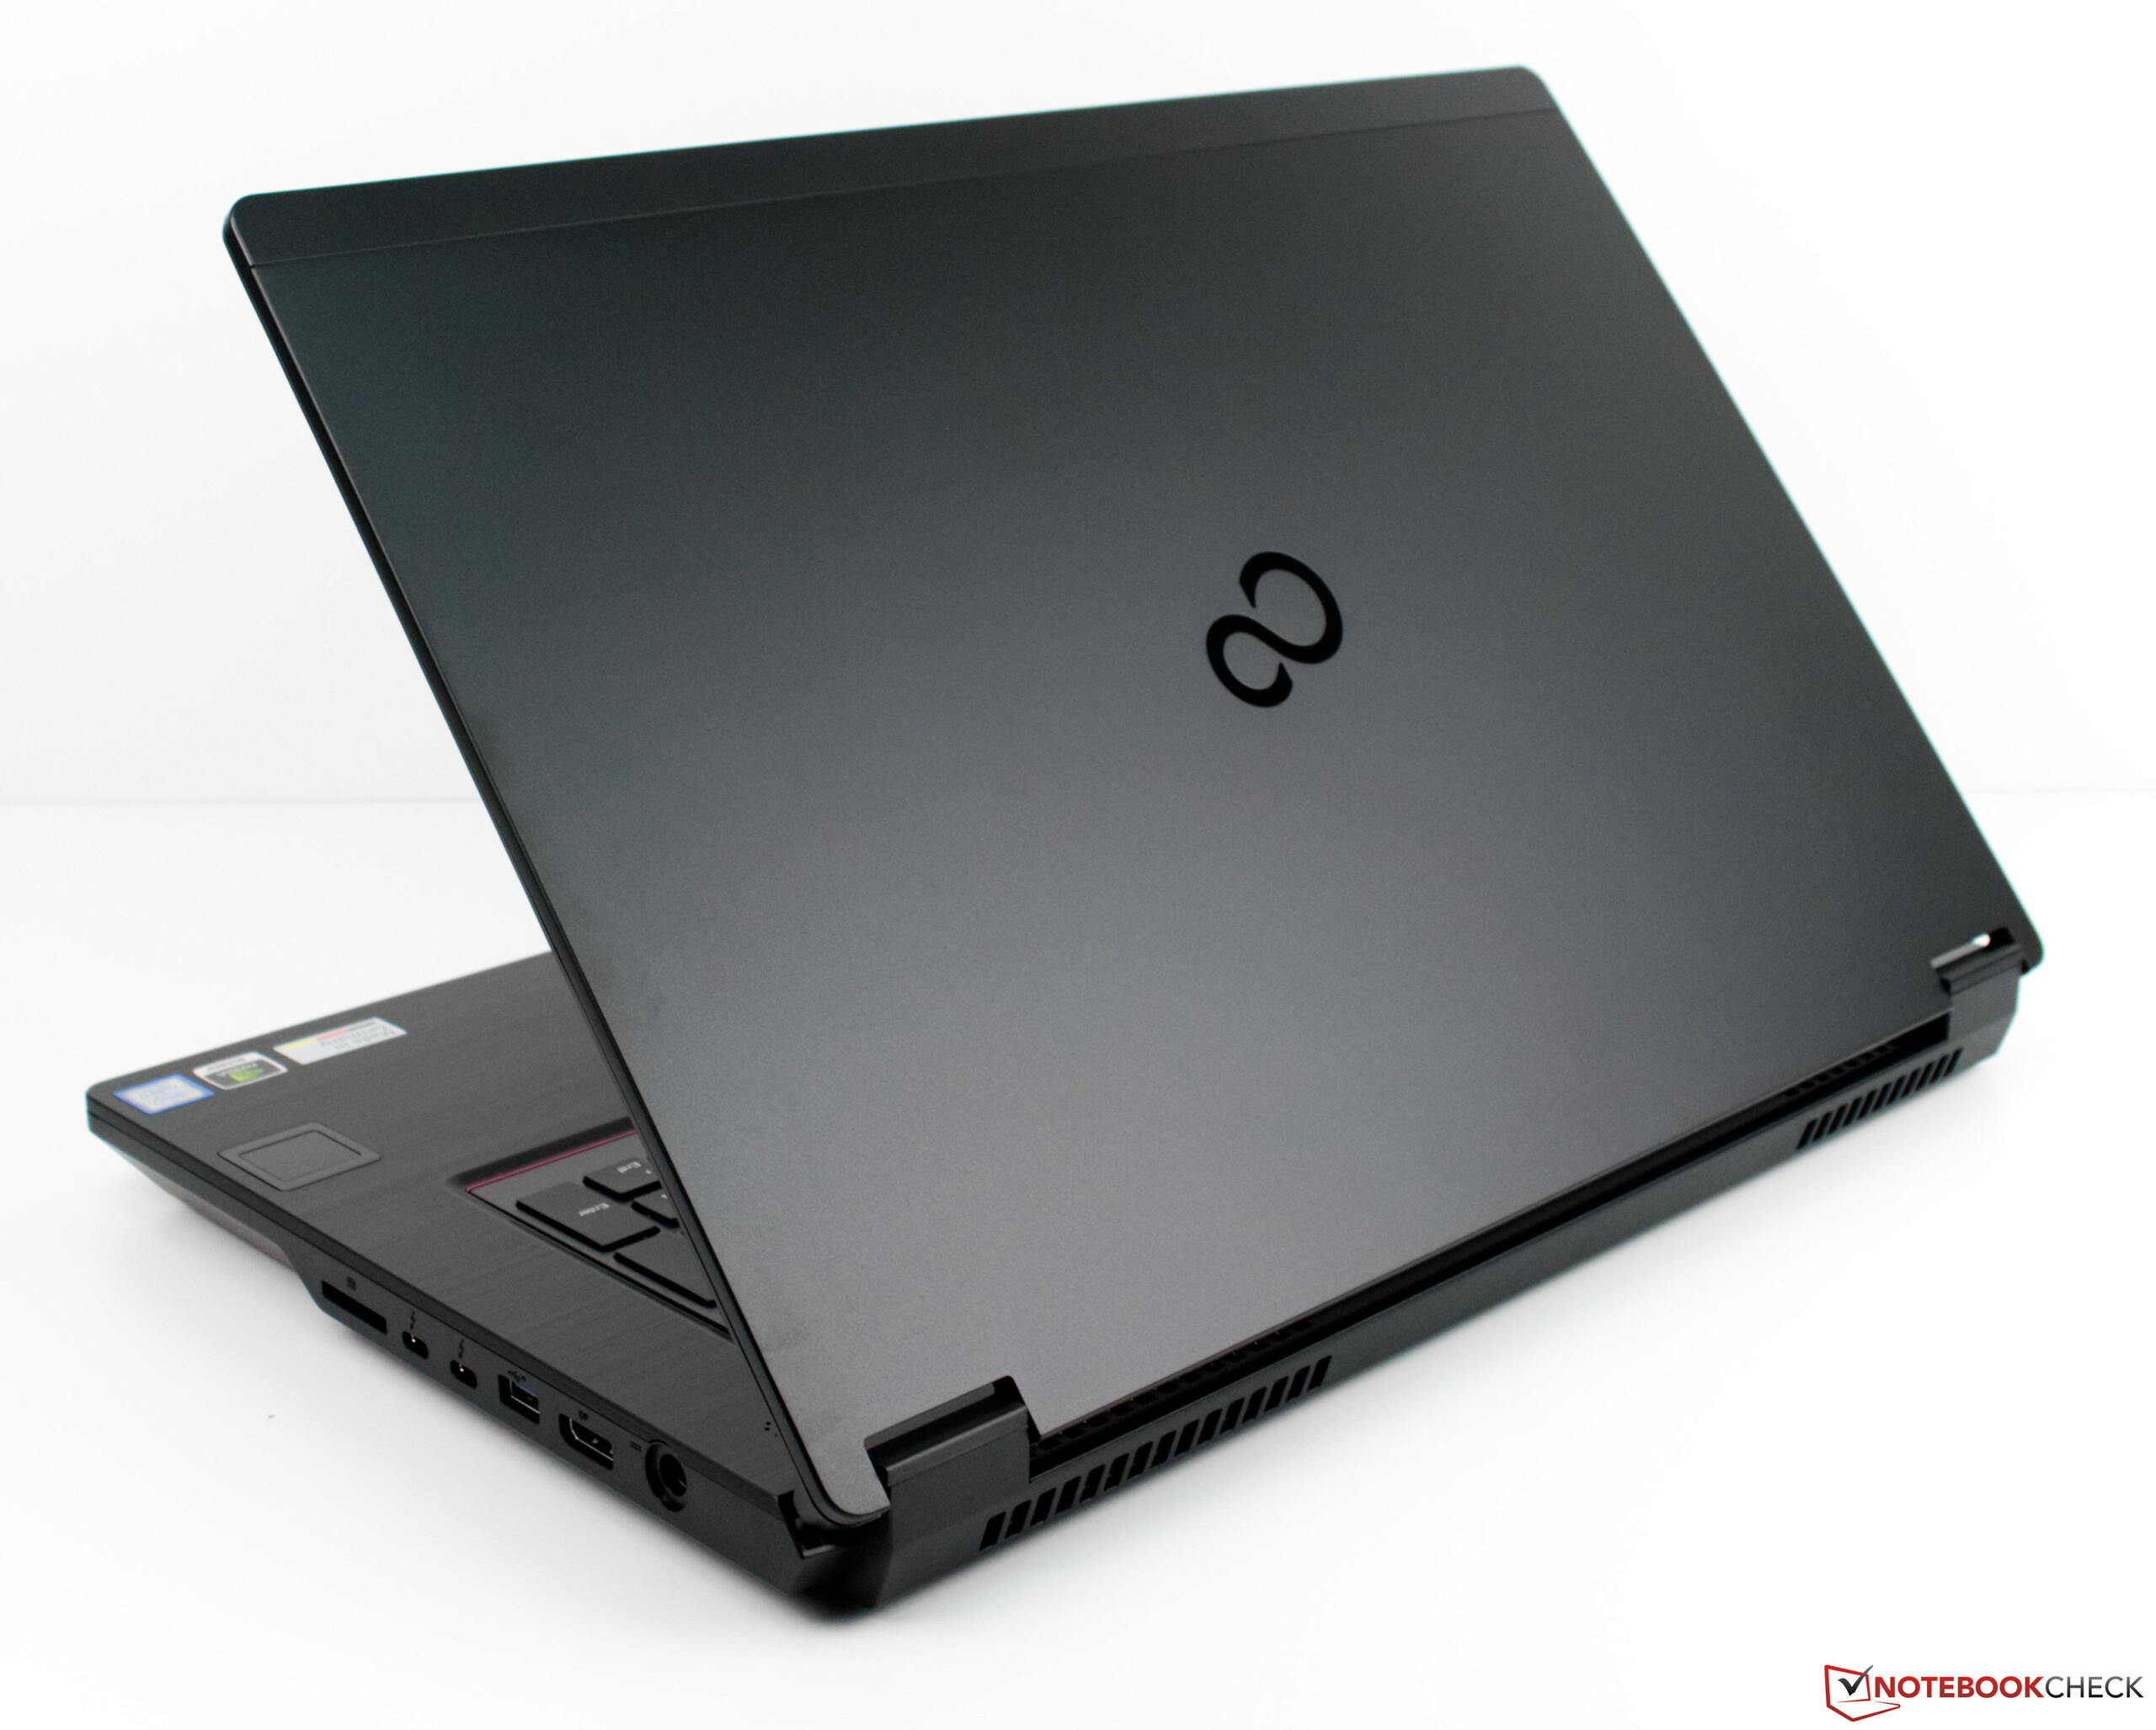
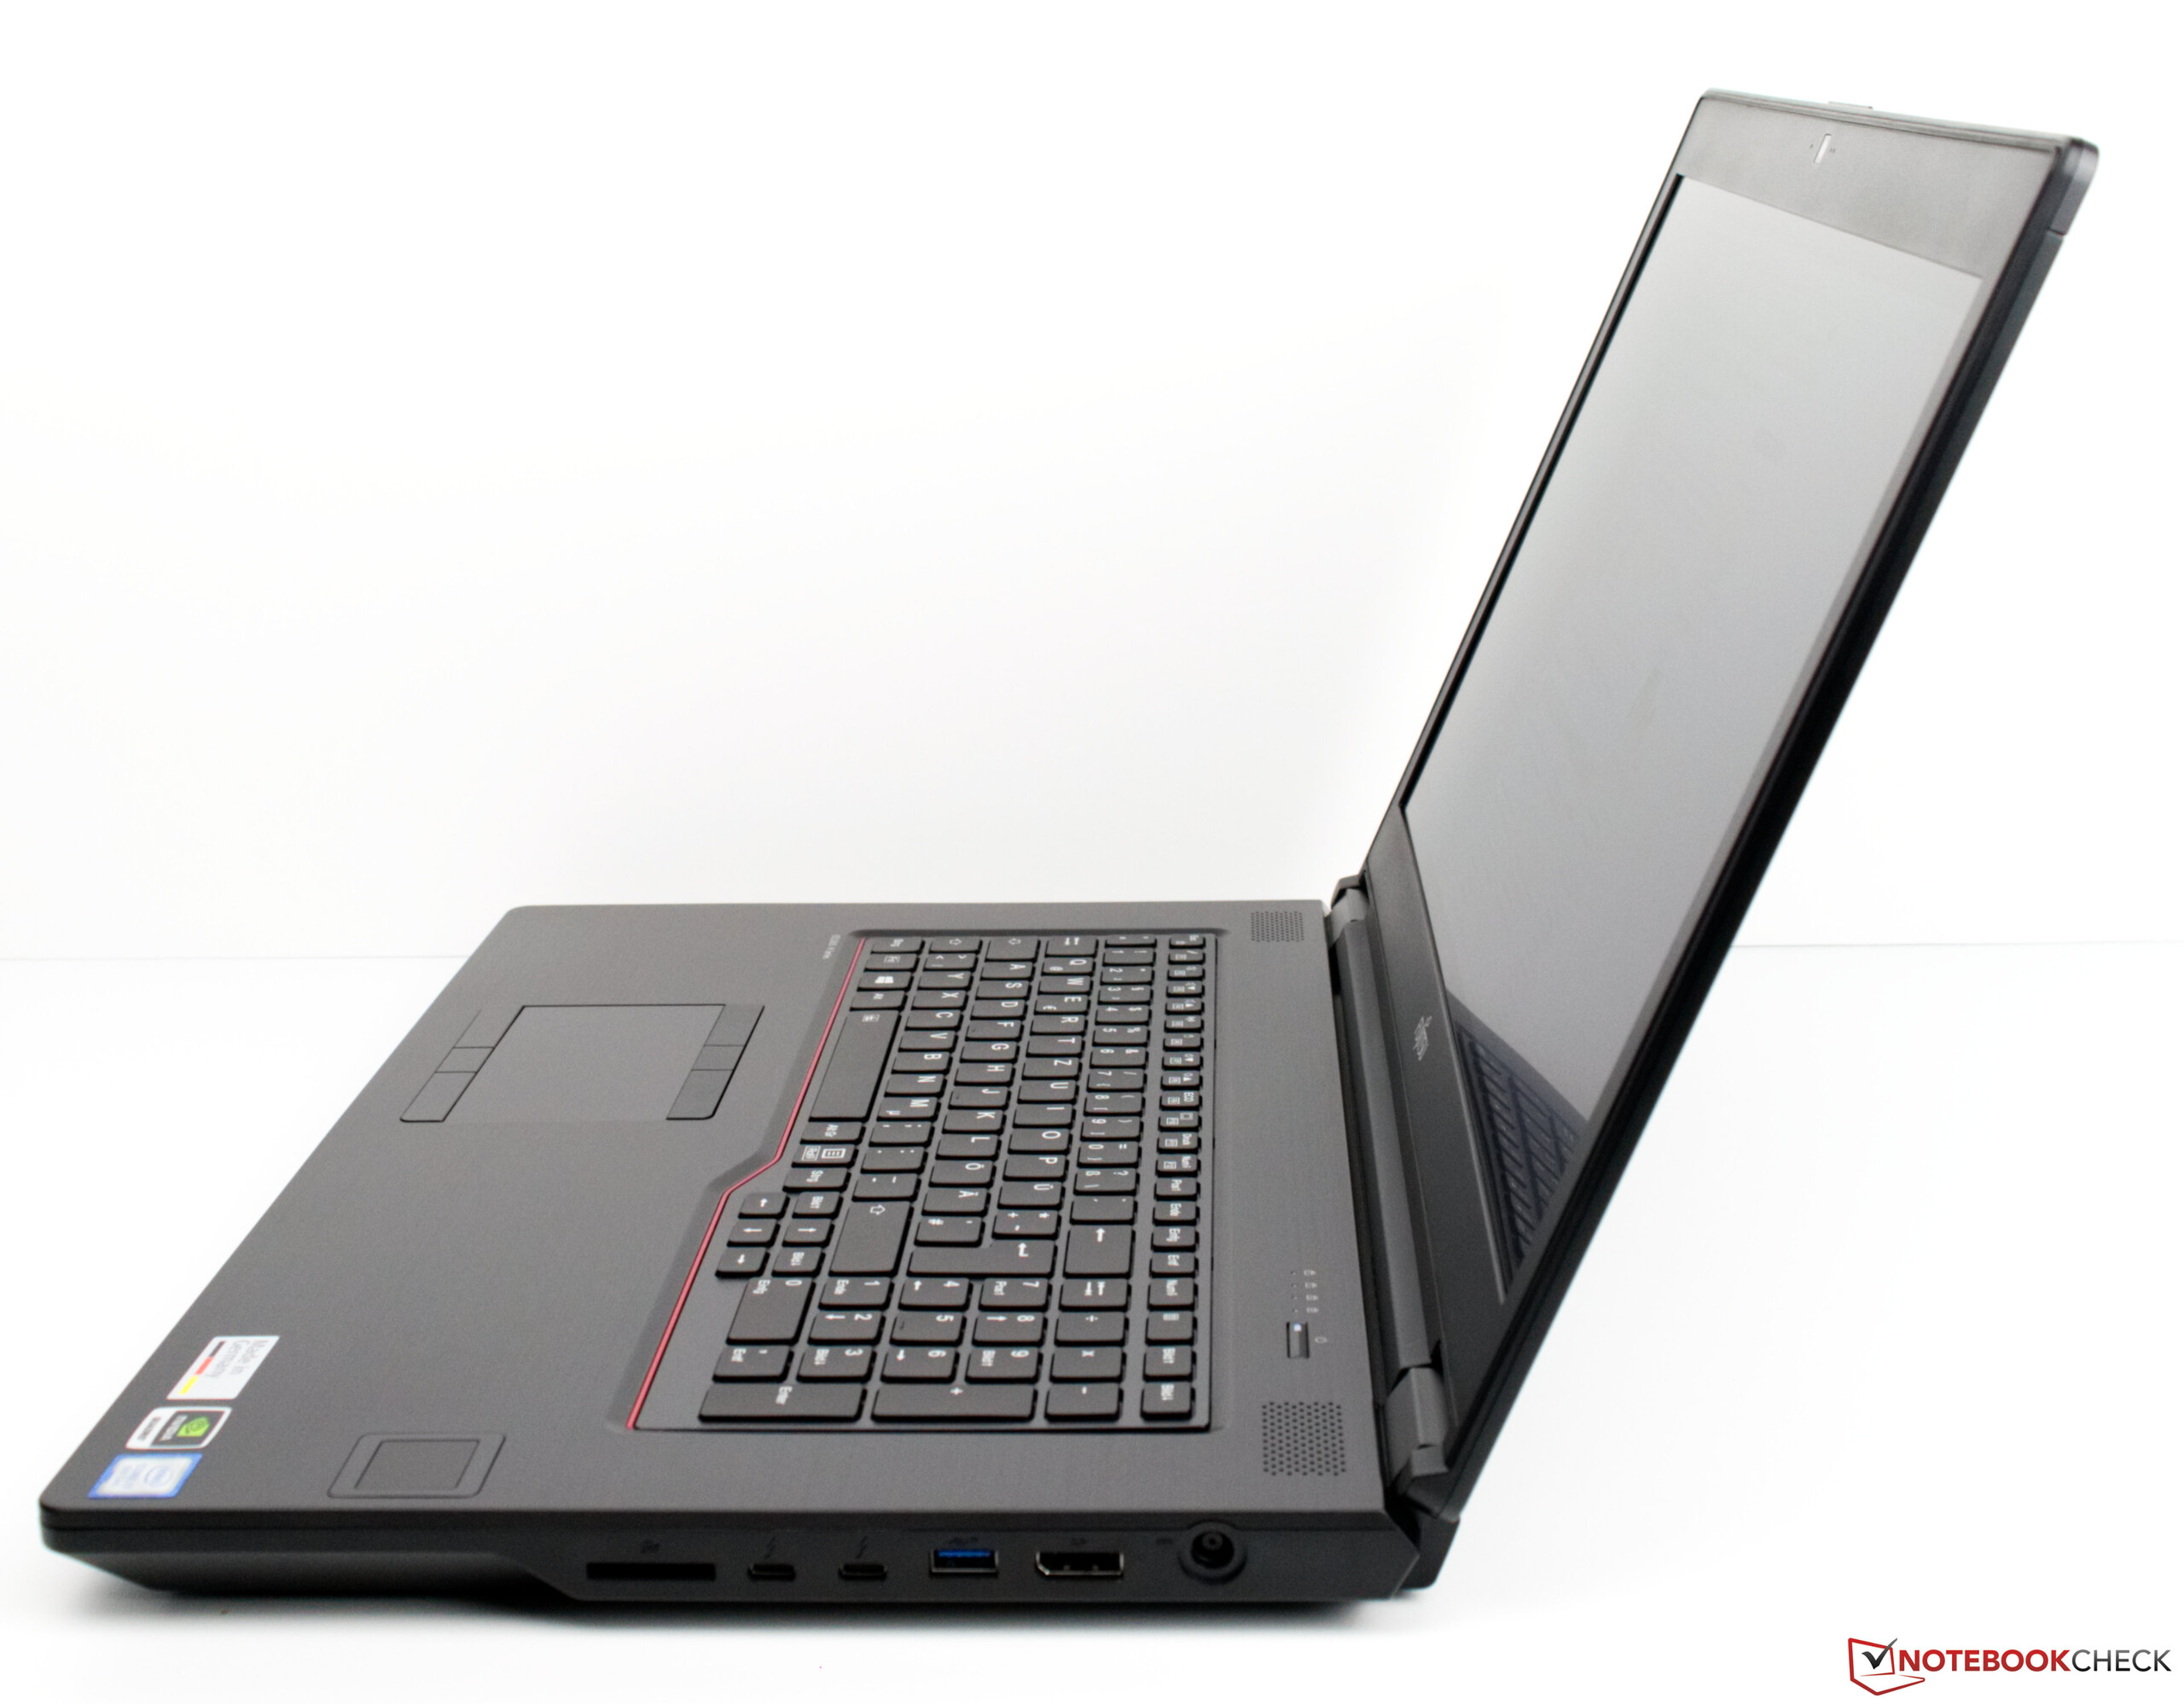
Le Fujitsu Celsius H980 possède un meilleur refroidissement du processeur et de meilleures performances que son prédécesseur, mais son écran 1080p ne peut lutter en résolution ou en fidélité des couleurs face à des concurrents comme le Dell Precision 7720.
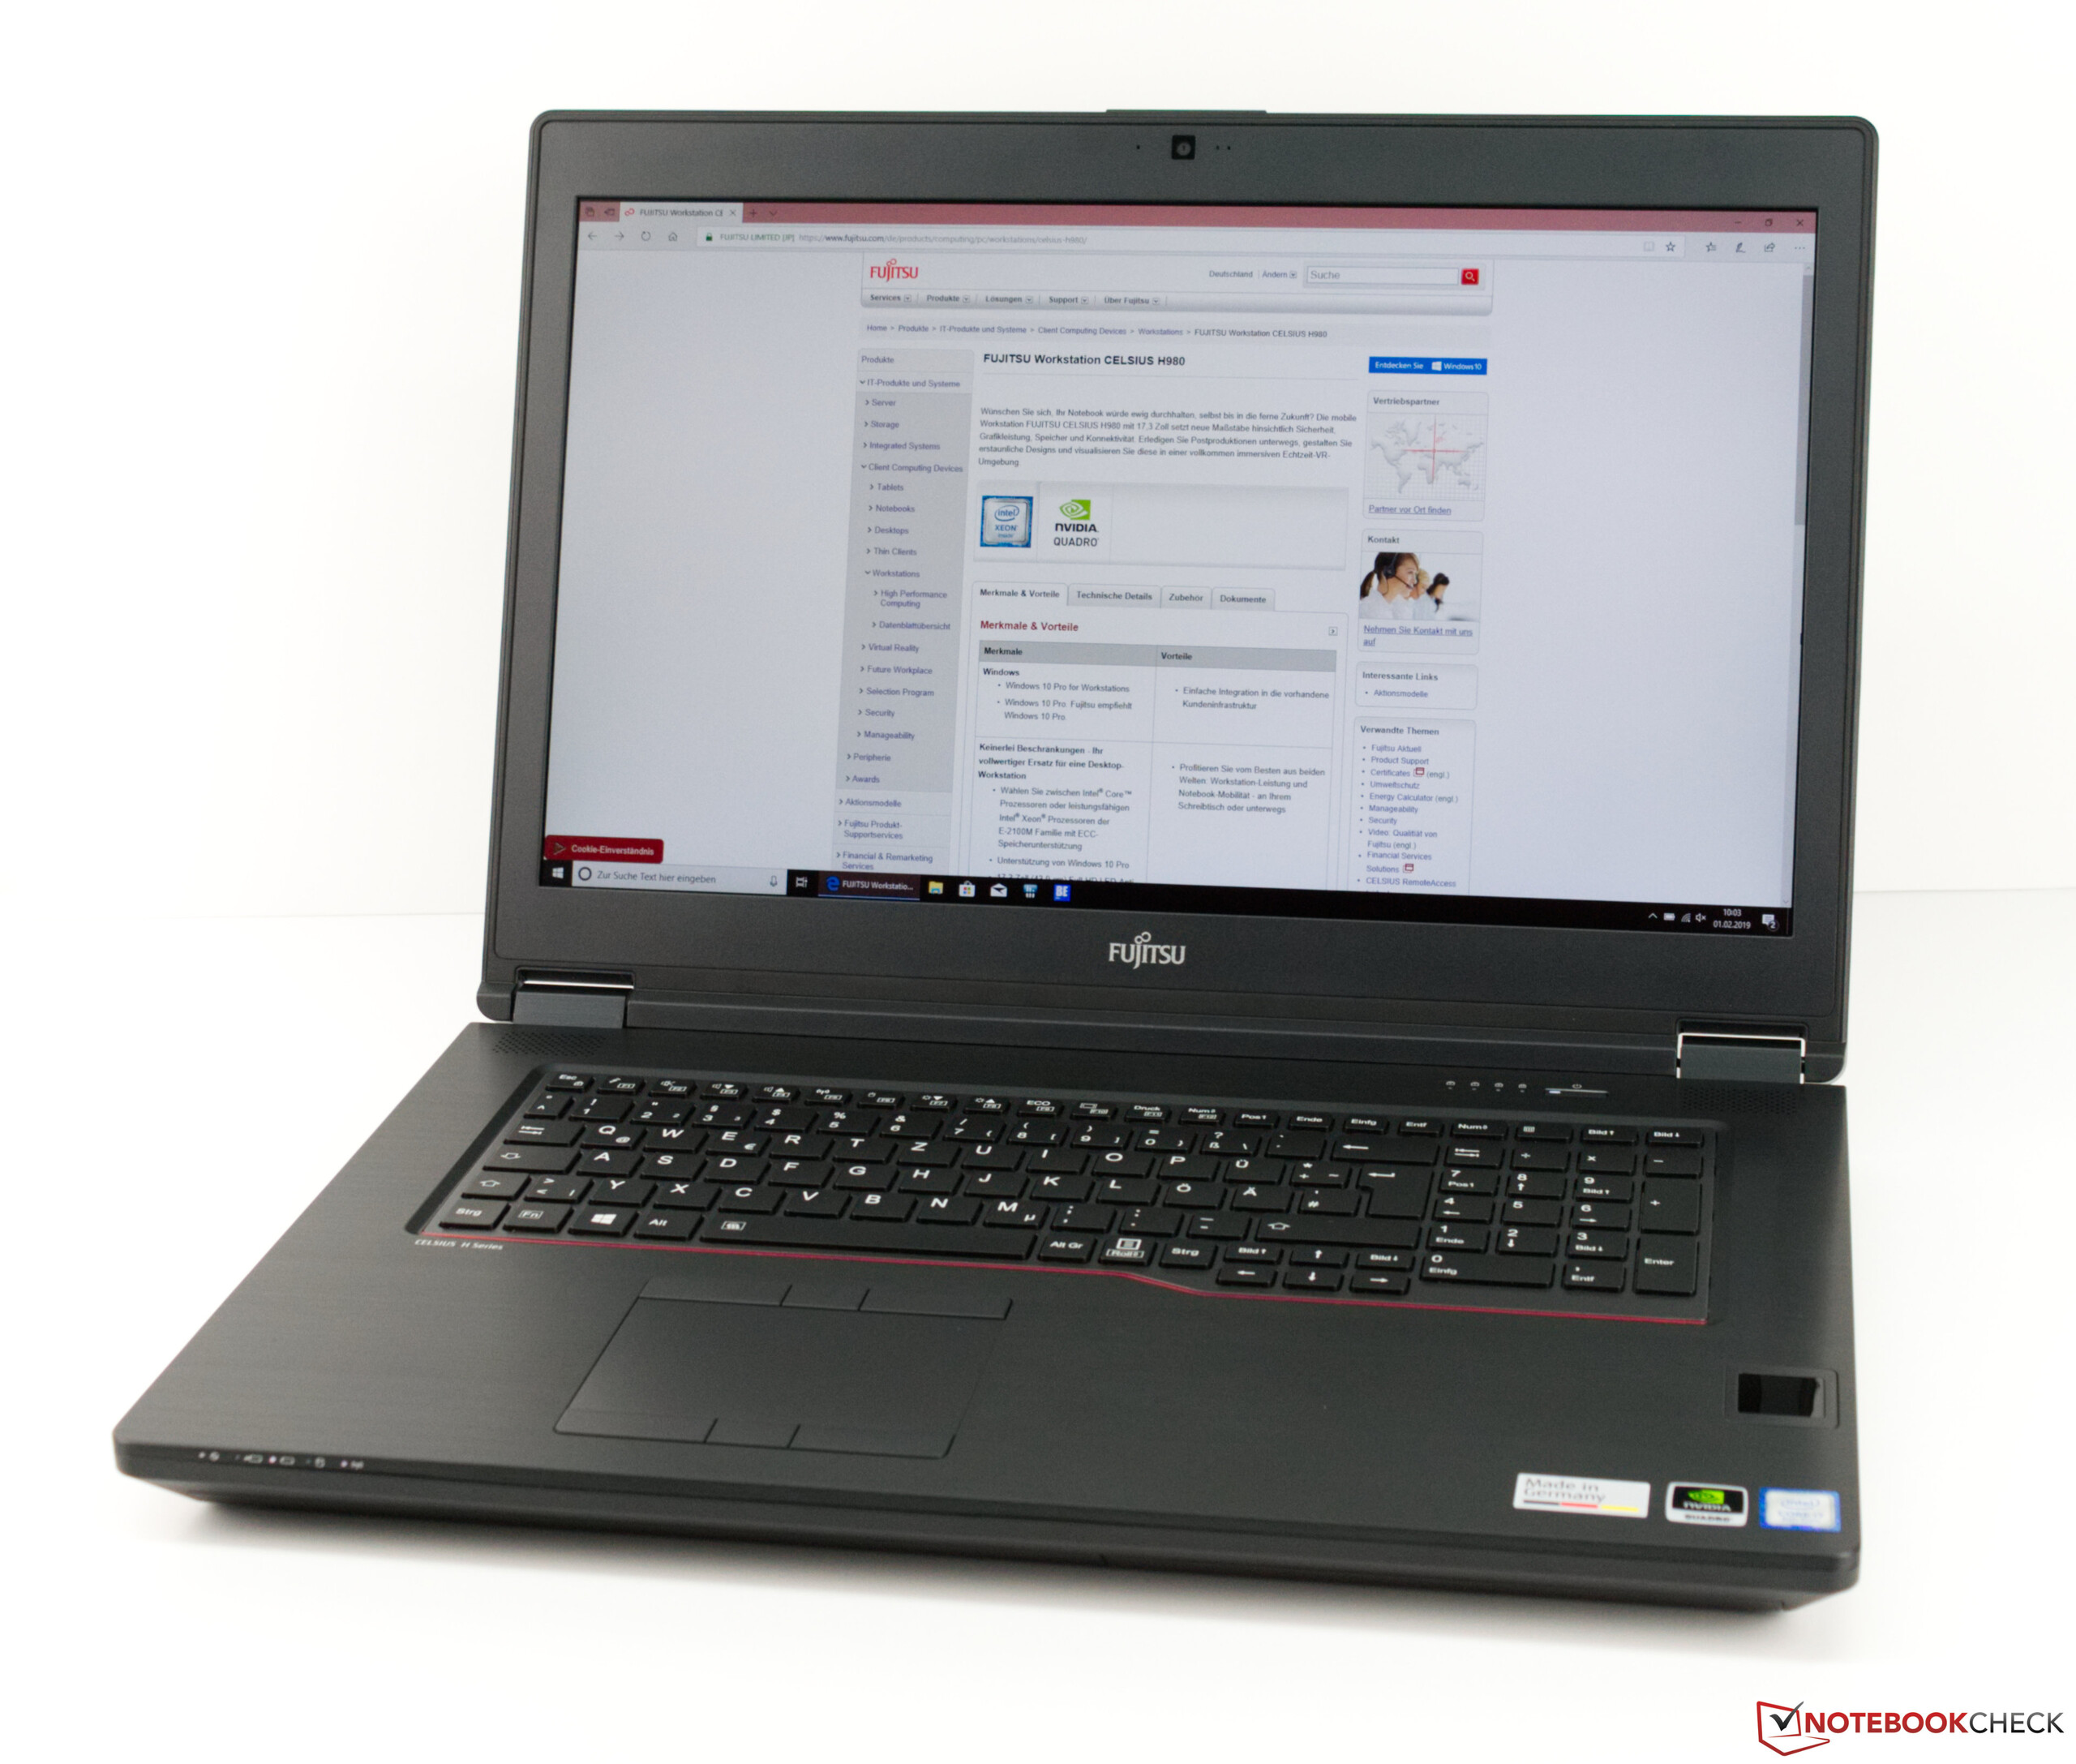
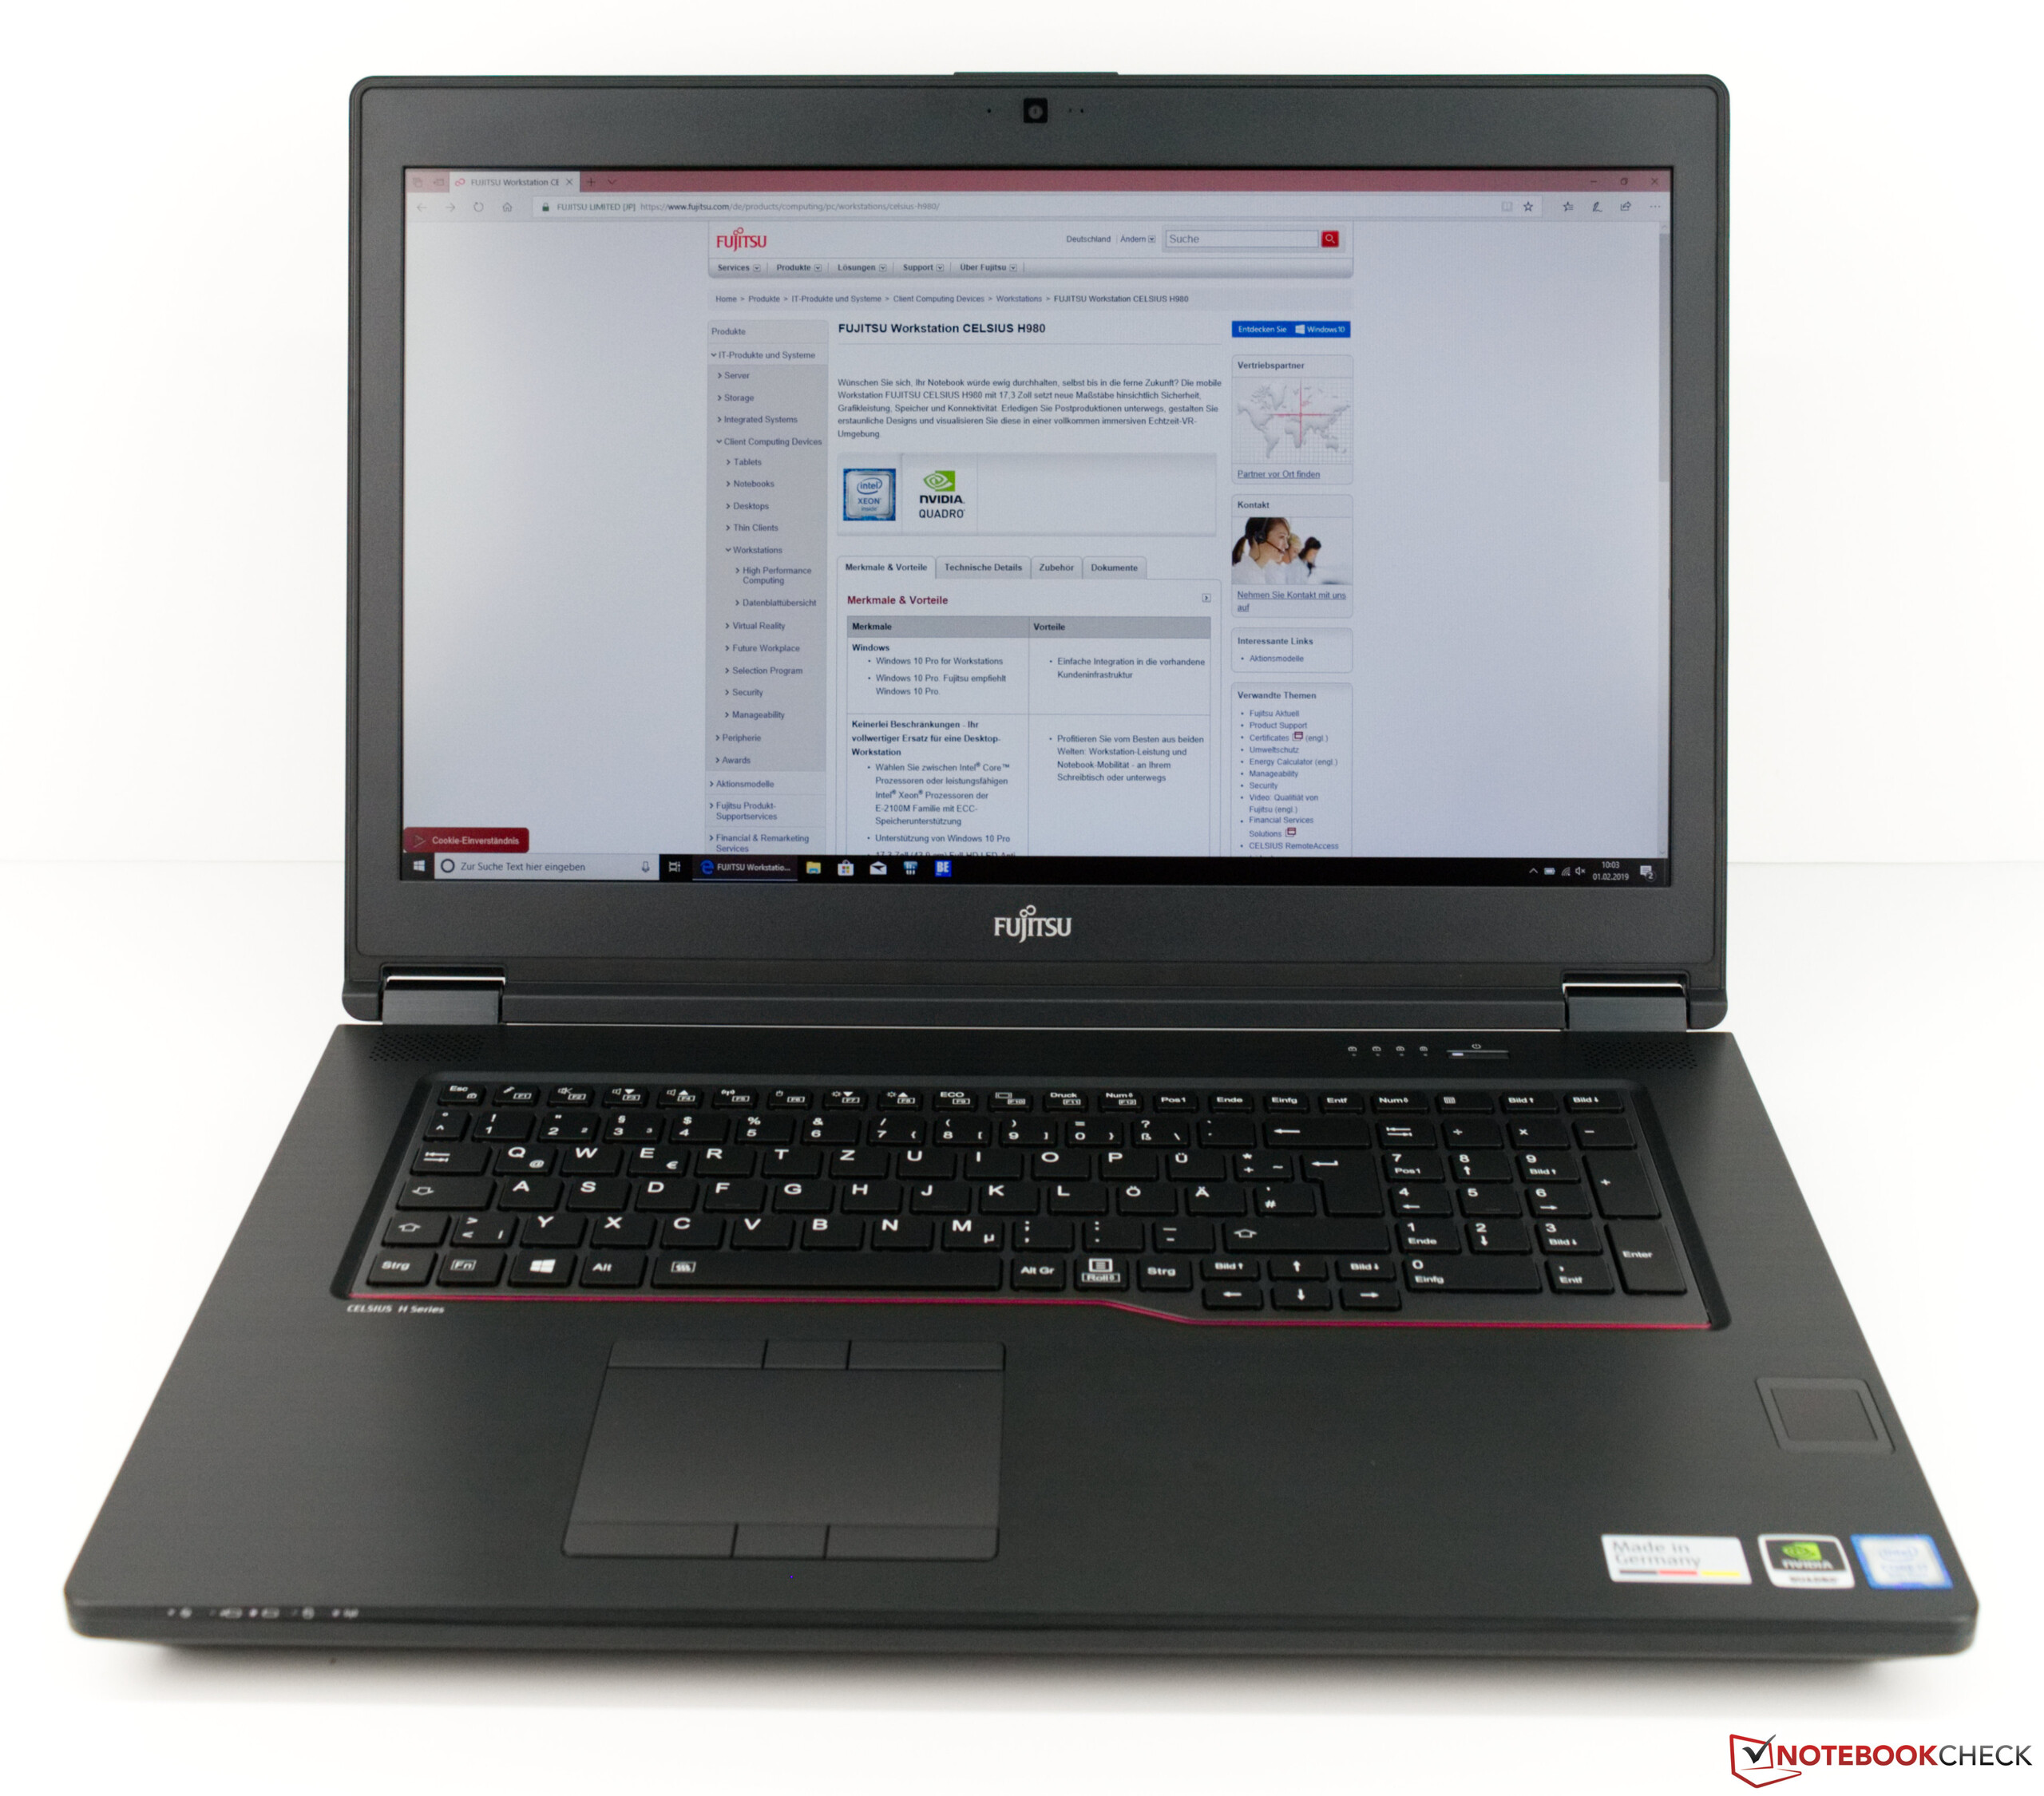
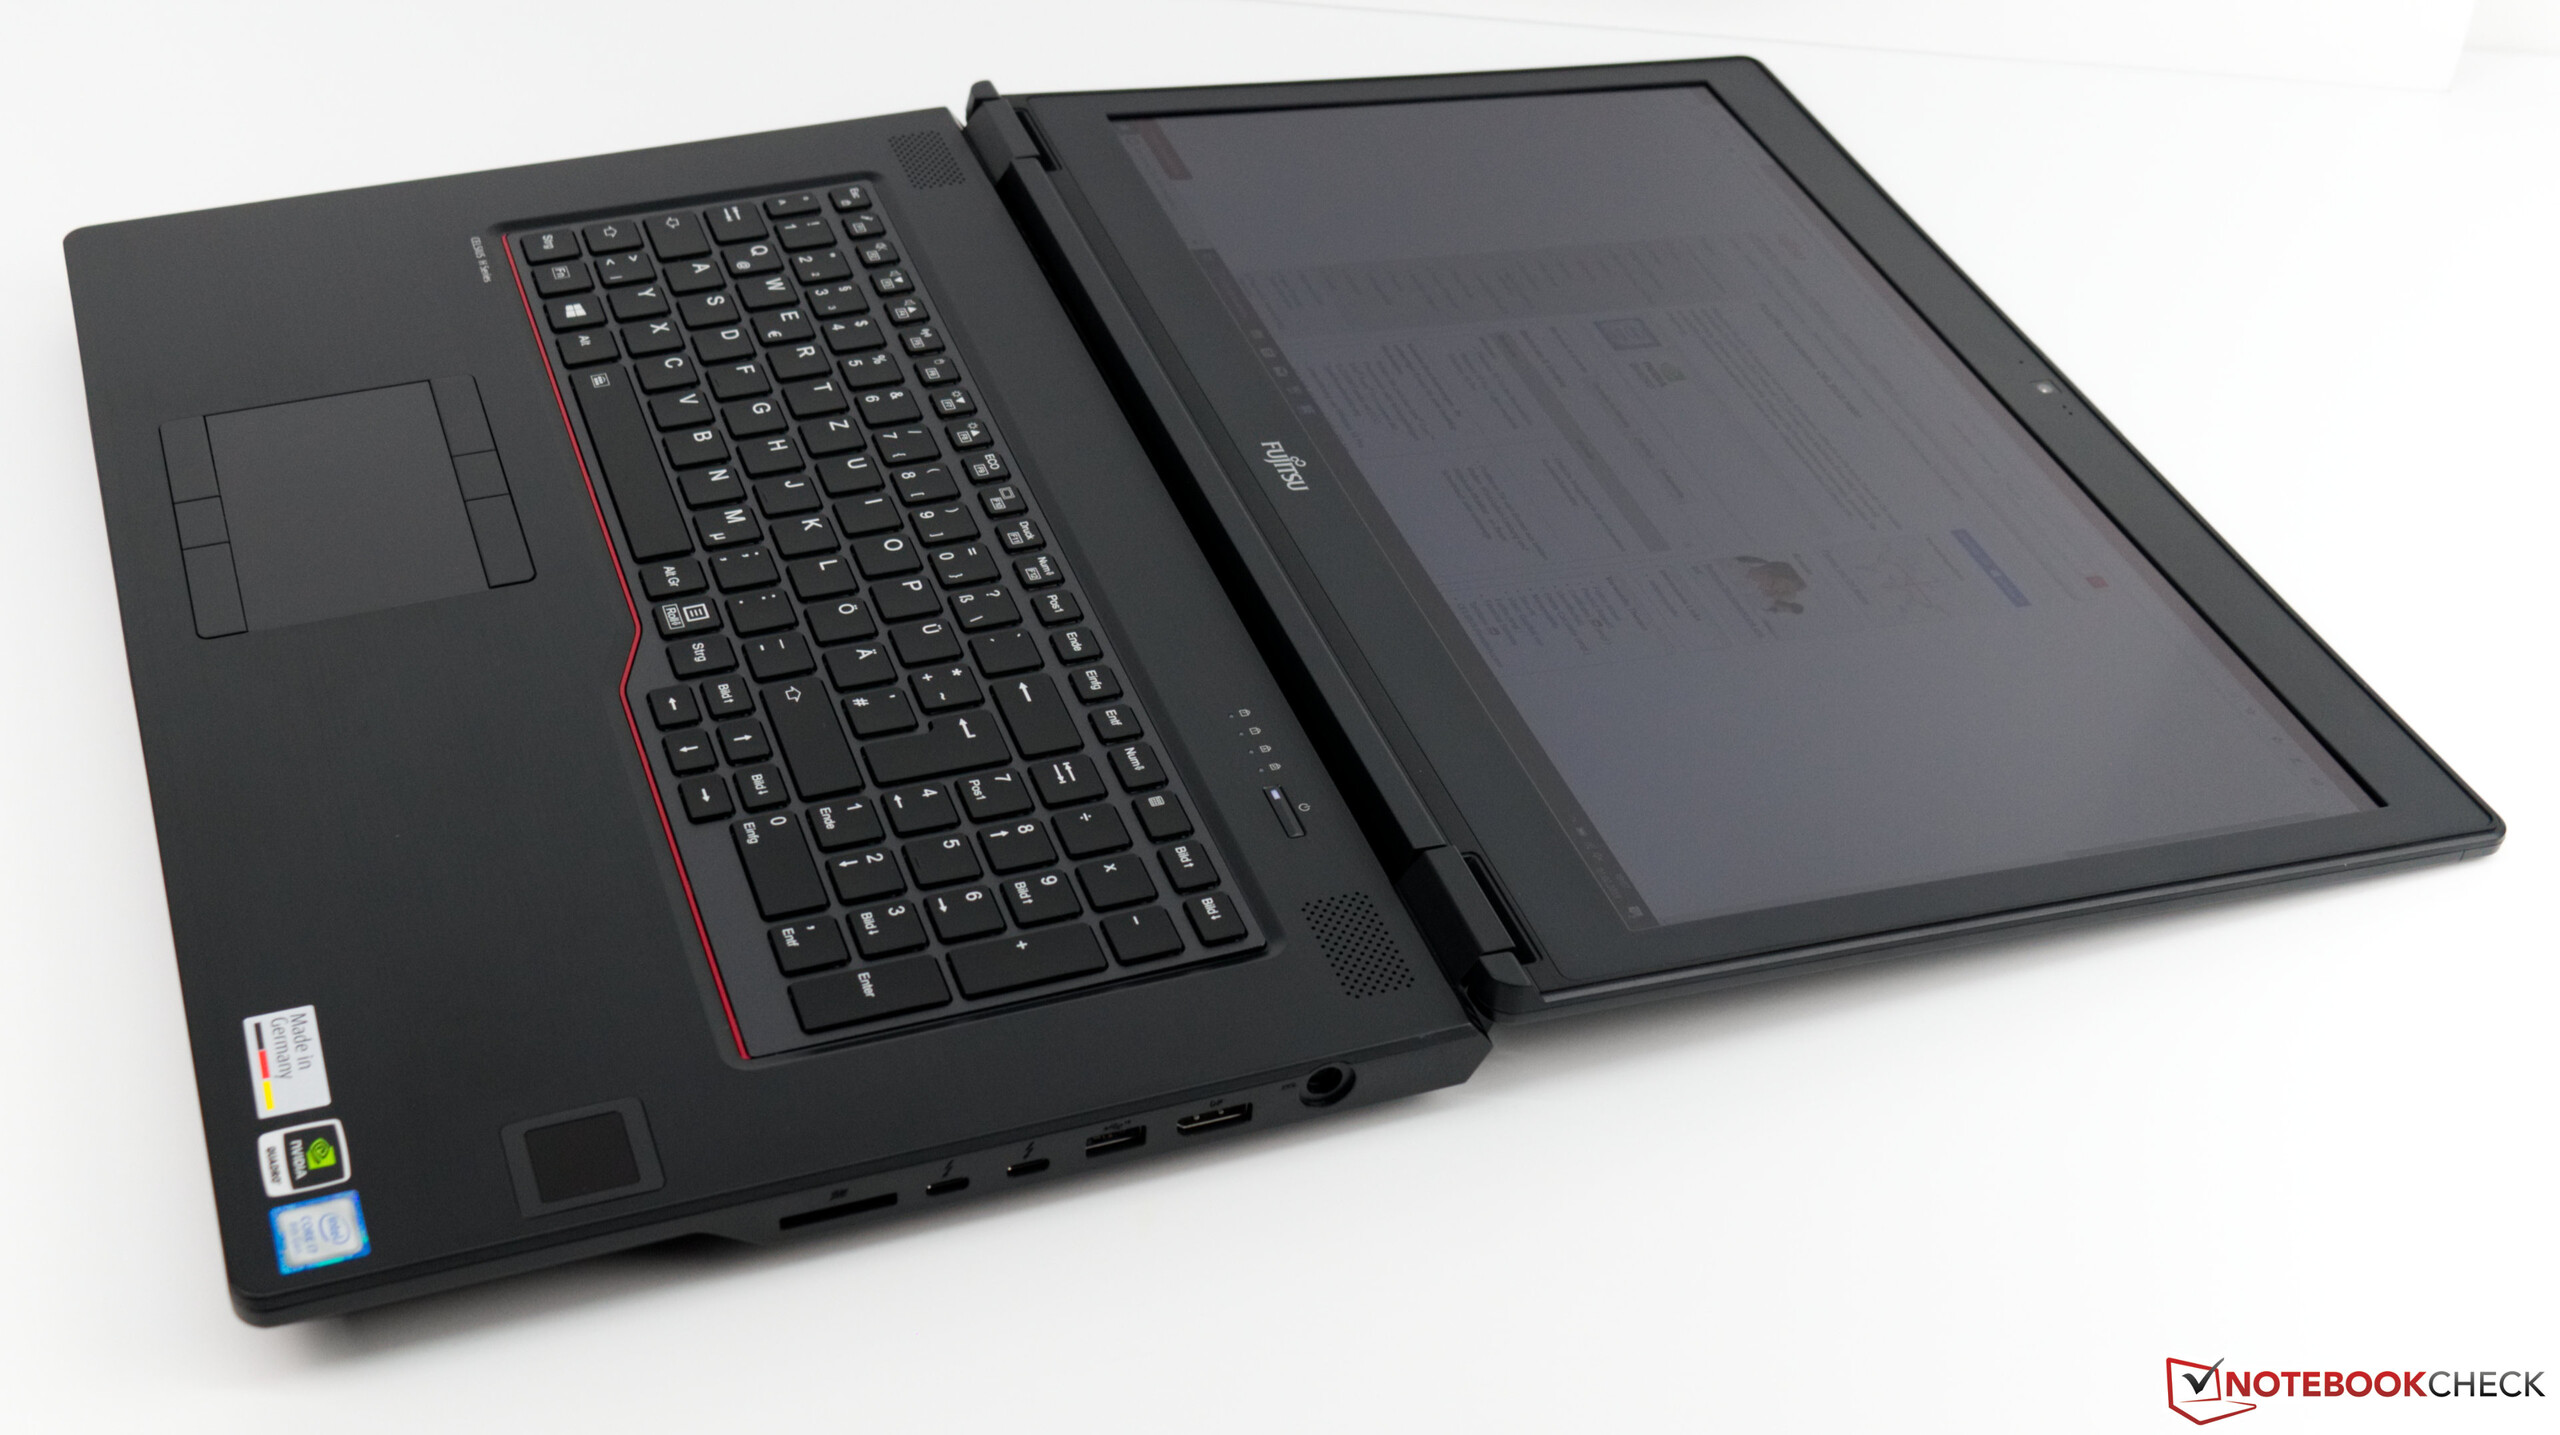
Le Celsius H980 est un appareil encombrant et qui consomme beaucoup, comme la plupart des stations de travail. L’appareil réussit à fournir d’excellentes performances globales, et prend la tête des tests de performance avec aisance. Mais si sa dalle de 17,3 pouces est lumineuse et possède une finition matte, qui vont tous les deux s’avérer utiles pour l’utiliser à l’extérieur, il n’a pas la même fidélité de couleurs que ses concurrents. Notre modèle possède une couverture des espaces colorimétriques trop faible, et des déviations DeltaE trop élevées. Pire, Fujitsu ne propose le Celsius H980 qu’avec un écran 1080p, ce qui désavantage l’appareil face à ses concurrents qui peuvent être équipés d’écrans 4K, tel le Dell Precision 7720.
Ces défauts vont donner la vie dure au Celsius H980 malgré ses bonnes performances CPU et GPU, surtout parce qu’il fait face à une concurrence solide des Dell Precision 7720, HP ZBook 17 G5 et Lenovo ThinkPad P72.
Il faut également garder à l’esprit que le Celsius H980 possède une moins bonne autonomie que son prédécesseur, mais cela ne devrait pas trop gêner les utilisateurs traditionnels de stations de travail, ces machines ayant tendance à être plus utilisées au bureau qu’en déplacement. Au final, le Fujitsu Celsius H980 est une excellente station de travail qui n’est freinée que par son écran aux couleurs peu fidèles.
L’intégralité de cette critique est disponible en anglais en suivant ce lien.
Fujitsu Celsius H980
- 01/08/2020 v7 (old)
Sebastian Bade
Price comparison
