Courte critique de la station de travail Dell Precision 7720 (Xeon, P5000, 4K)
Scintillement / MLI (Modulation de largeur d'impulsion)
| Scintillement / MLI (Modulation de largeur d'impulsion) décelé | 1020 Hz | ≤ 20 Niveau de luminosité | 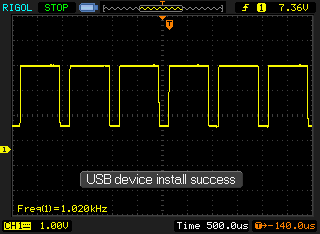 |
Le rétroéclairage de l'écran scintille à la fréquence de 1020 Hz (certainement du fait de l'utilisation d'une MDI - Modulation de largeur d'impulsion) à un niveau de luminosité inférieur ou égal à 20 % . Aucun scintillement ne devrait être perceptible au-dessus de cette valeur. La fréquence de rafraîchissement de 1020 Hz est élevée, la grande majorité des utilisateurs ne devrait pas percevoir de scintillements et être sujette à une fatigue oculaire accrue. En comparaison, 52 % des appareils testés n'emploient pas MDI pour assombrir leur écran. Nous avons relevé une moyenne à 7791 (minimum : 5 - maximum : 343500) Hz dans le cas où une MDI était active. | |||
| |||||||||||||||||||||||||
Homogénéité de la luminosité: 89 %
Valeur mesurée au centre, sur batterie: 462 cd/m²
Contraste: 1031:1 (Valeurs des noirs: 0.45 cd/m²)
ΔE ColorChecker Calman: 3.2 | ∀{0.5-29.43 Ø4.73}
ΔE Greyscale Calman: 4.2 | ∀{0.09-98 Ø4.97}
100% sRGB (Argyll 1.6.3 3D)
88.1% AdobeRGB 1998 (Argyll 1.6.3 3D)
99.2% AdobeRGB 1998 (Argyll 3D)
100% sRGB (Argyll 3D)
87.6% Display P3 (Argyll 3D)
Gamma: 2.01
CCT: 6736 K
| Dell Precision 7720 SHP1446 (LQ173D1), , 3840x2160, 17.3" | Lenovo ThinkPad P71-20HK0004GE LEN4123, VVX17P051J00, , 3840x2160, 17.3" | HP ZBook 17 G4-Y3J82AV Sharp SHP144C, , 3840x2160, 17.3" | MSI WE72 7RJ LP173WF4-SPF1, , 1920x1080, 17.3" | Fujitsu Celsius H970 LP173WF4-SPF3, , 1920x1080, 17.3" | Dell Precision 7710 SDC8151, VHN17_173HL, , 1920x1080, 17.3" | |
|---|---|---|---|---|---|---|
| Display | 0% | -25% | -26% | -19% | ||
| Display P3 Coverage (%) | 87.6 | 88 0% | 67.4 -23% | 66.8 -24% | 66.6 -24% | |
| sRGB Coverage (%) | 100 | 100 0% | 85.3 -15% | 84.6 -15% | 96.9 -3% | |
| AdobeRGB 1998 Coverage (%) | 99.2 | 99.6 0% | 62.4 -37% | 61.8 -38% | 68.6 -31% | |
| Response Times | 43% | 11% | 34% | 45% | 20% | |
| Response Time Grey 50% / Grey 80% * (ms) | 60 ? | 39.2 ? 35% | 56.8 ? 5% | 45.2 ? 25% | 32 ? 47% | 50 ? 17% |
| Response Time Black / White * (ms) | 46.4 ? | 23.2 ? 50% | 38.4 ? 17% | 26.4 ? 43% | 26.4 ? 43% | 36 ? 22% |
| PWM Frequency (Hz) | 1020 ? | 1412 ? | 1020 ? | 198 ? | ||
| Screen | 10% | 17% | -33% | -28% | -7% | |
| Brightness middle (cd/m²) | 464 | 358 -23% | 391 -16% | 302 -35% | 368 -21% | 332 -28% |
| Brightness (cd/m²) | 441 | 338 -23% | 360 -18% | 306 -31% | 360 -18% | 307 -30% |
| Brightness Distribution (%) | 89 | 83 -7% | 87 -2% | 93 4% | 91 2% | 83 -7% |
| Black Level * (cd/m²) | 0.45 | 0.31 31% | 0.35 22% | 0.31 31% | 0.3 33% | 0.33 27% |
| Contrast (:1) | 1031 | 1155 12% | 1117 8% | 974 -6% | 1227 19% | 1006 -2% |
| Colorchecker dE 2000 * | 3.2 | 2.1 34% | 1.3 59% | 6.2 -94% | 6.4 -100% | 3 6% |
| Colorchecker dE 2000 max. * | 6.1 | 3.6 41% | 2.5 59% | 10.6 -74% | 10.1 -66% | |
| Greyscale dE 2000 * | 4.2 | 2 52% | 1.8 57% | 7.3 -74% | 7.2 -71% | 4 5% |
| Gamma | 2.01 109% | 2.16 102% | 2.11 104% | 2.08 106% | 2.02 109% | 2 110% |
| CCT | 6736 96% | 6216 105% | 6461 101% | 7020 93% | 6882 94% | 7089 92% |
| Color Space (Percent of AdobeRGB 1998) (%) | 88.1 | 77 -13% | 87.9 0% | 56 -36% | 55.5 -37% | 62 -30% |
| Color Space (Percent of sRGB) (%) | 100 | 99.97 0% | 100 0% | 85.2 -15% | 84.4 -16% | 97 -3% |
| Moyenne finale (programmes/paramètres) | 27% /
16% | 9% /
13% | -8% /
-22% | -3% /
-17% | -2% /
-6% |
* ... Moindre est la valeur, meilleures sont les performances
Temps de réponse de l'écran
| ↔ Temps de réponse noir à blanc | ||
|---|---|---|
| 46.4 ms ... hausse ↗ et chute ↘ combinées | ↗ 28.4 ms hausse | 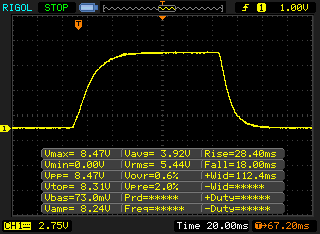 |
| ↘ 18 ms chute | ||
| L'écran souffre de latences très élevées, à éviter pour le jeu. En comparaison, tous les appareils testés affichent entre 0.1 (minimum) et 240 (maximum) ms. » 99 % des appareils testés affichent de meilleures performances. Cela signifie que les latences relevées sont moins bonnes que la moyenne (19.9 ms) de tous les appareils testés. | ||
| ↔ Temps de réponse gris 50% à gris 80% | ||
| 60 ms ... hausse ↗ et chute ↘ combinées | ↗ 26.8 ms hausse | 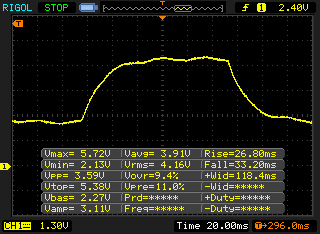 |
| ↘ 33.2 ms chute | ||
| L'écran souffre de latences très élevées, à éviter pour le jeu. En comparaison, tous les appareils testés affichent entre 0.165 (minimum) et 636 (maximum) ms. » 96 % des appareils testés affichent de meilleures performances. Cela signifie que les latences relevées sont moins bonnes que la moyenne (31.1 ms) de tous les appareils testés. | ||
| PCMark 8 | |
| Home Score Accelerated v2 | |
| Dell Precision 7710 | |
| HP ZBook 17 G4-Y3J82AV | |
| MSI WE72 7RJ | |
| Dell Precision 7720 | |
| Lenovo ThinkPad P71-20HK0004GE | |
| Work Score Accelerated v2 | |
| Dell Precision 7710 | |
| Fujitsu Celsius H970 | |
| MSI WE72 7RJ | |
| HP ZBook 17 G4-Y3J82AV | |
| Dell Precision 7720 | |
| Creative Score Accelerated v2 | |
| HP ZBook 17 G4-Y3J82AV | |
| Fujitsu Celsius H970 | |
| Lenovo ThinkPad P71-20HK0004GE | |
| Dell Precision 7710 | |
| Dell Precision 7720 | |
| PCMark 10 - Score | |
| HP ZBook 17 G4-Y3J82AV | |
| Dell Precision 7720 | |
| Fujitsu Celsius H970 | |
| PCMark 8 Home Score Accelerated v2 | 3772 points | |
| PCMark 8 Creative Score Accelerated v2 | 5498 points | |
| PCMark 8 Work Score Accelerated v2 | 4460 points | |
| PCMark 10 Score | 5248 points | |
Aide | ||

| SiSoft Sandra 2016 | |
| Image Processing | |
| Dell Precision 7720 | |
| HP ZBook 17 G4-Y3J82AV | |
| Dell Precision 7710 | |
| Lenovo ThinkPad P71-20HK0004GE | |
| GP Cryptography (Higher Security AES256+SHA2-512) | |
| HP ZBook 17 G4-Y3J82AV | |
| Dell Precision 7720 | |
| Lenovo ThinkPad P71-20HK0004GE | |
| Dell Precision 7710 | |
| GP Financial Analysis (FP High/Double Precision) | |
| Dell Precision 7720 | |
| HP ZBook 17 G4-Y3J82AV | |
| Dell Precision 7710 | |
| Lenovo ThinkPad P71-20HK0004GE | |
| Unigine Heaven 4.0 | |
| Extreme Preset DX11 | |
| Schenker XMG U507 2017 | |
| Asus Zephyrus GX501 | |
| Dell Precision 7720 | |
| HP ZBook 17 G4-Y3J82AV | |
| Lenovo ThinkPad P71-20HK0004GE | |
| MSI WE72 7RJ | |
| Extreme Preset OpenGL | |
| Dell Precision 7720 | |
| HP ZBook 17 G4-Y3J82AV | |
| Lenovo ThinkPad P71-20HK0004GE | |
| MSI WE72 7RJ | |
| Unigine Valley 1.0 | |
| 1920x1080 Extreme HD DirectX AA:x8 | |
| HP ZBook 17 G4-Y3J82AV | |
| Dell Precision 7720 | |
| Lenovo ThinkPad P71-20HK0004GE | |
| MSI WT72-6QM | |
| Dell Precision 7710 | |
| MSI WE72 7RJ | |
| 1920x1080 Extreme HD Preset OpenGL AA:x8 | |
| HP ZBook 17 G4-Y3J82AV | |
| Dell Precision 7720 | |
| Lenovo ThinkPad P71-20HK0004GE | |
| Dell Precision 7710 | |
| MSI WE72 7RJ | |
| 3DMark 11 Performance | 16158 points | |
| 3DMark Ice Storm Standard Score | 58131 points | |
| 3DMark Cloud Gate Standard Score | 28999 points | |
| 3DMark Fire Strike Score | 12298 points | |
| 3DMark Time Spy Score | 4823 points | |
Aide | ||
| Bas | Moyen | Élevé | Ultra | 4K | |
|---|---|---|---|---|---|
| The Witcher 3 (2015) | 53.4 | 36 | |||
| Star Wars Battlefront (2015) | 118.5 | 44 | |||
| Rainbow Six Siege (2015) | 55.6 | ||||
| Rise of the Tomb Raider (2016) | 97.9 | 84 | 35.8 | ||
| Battlefield 1 (2016) | 40.8 | ||||
| For Honor (2017) | 127.9 | 121.1 | 95.1 | 37.6 | |
| Ghost Recon Wildlands (2017) | 83.9 | 76.5 | 42.8 | 27.5 | |
| Prey (2017) | 125.2 | 47.8 |
Degré de la nuisance sonore
| Au repos |
| 29.5 / 29.5 / 29.5 dB(A) |
| Fortement sollicité |
| 35 / 47.8 dB(A) |
 | ||
30 dB silencieux 40 dB(A) audible 50 dB(A) bruyant |
||
min: | ||
| Dell Precision 7720 Quadro P5000, E3-1535M v6, Toshiba NVMe THNSN5512GPU7 | Lenovo ThinkPad P71-20HK0004GE Quadro P3000, i7-7820HQ, Samsung PM961 NVMe MZVLW512HMJP | HP ZBook 17 G4-Y3J82AV Quadro P5000, E3-1535M v6, Samsung SSD SM961 1TB M.2 MZVKW1T0HMLH | MSI WE72 7RJ Quadro M2200, i7-7700HQ, Samsung SM961 MZVPW256 m.2 PCI-e | Fujitsu Celsius H970 Quadro P4000, E3-1535M v6, Samsung SM961 MZVKW512HMJP m.2 PCI-e | |
|---|---|---|---|---|---|
| Noise | 2% | -7% | -14% | -10% | |
| arrêt / environnement * (dB) | 29.5 | 29.2 1% | 29.6 -0% | 29.3 1% | 30.2 -2% |
| Idle Minimum * (dB) | 29.5 | 29.2 1% | 29.6 -0% | 36.3 -23% | 30.2 -2% |
| Idle Average * (dB) | 29.5 | 29.2 1% | 31.7 -7% | 36.3 -23% | 32.8 -11% |
| Idle Maximum * (dB) | 29.5 | 32.2 -9% | 34.4 -17% | 36.6 -24% | 32.8 -11% |
| Load Average * (dB) | 35 | 34.7 1% | 41.3 -18% | 40.4 -15% | 47.3 -35% |
| Witcher 3 ultra * (dB) | 41 | 45.6 -11% | |||
| Load Maximum * (dB) | 47.8 | 39.1 18% | 45.6 5% | 46.6 3% | 47.3 1% |
* ... Moindre est la valeur, meilleures sont les performances
(±) La température maximale du côté supérieur est de 42.3 °C / 108 F, par rapport à la moyenne de 38.2 °C / 101 F, allant de 22.2 à 69.8 °C pour la classe Workstation.
(±) Le fond chauffe jusqu'à un maximum de 44.9 °C / 113 F, contre une moyenne de 41.1 °C / 106 F
(+) En utilisation inactive, la température moyenne du côté supérieur est de 25.2 °C / 77 F, par rapport à la moyenne du dispositif de 32 °C / 90 F.
(±) En jouant à The Witcher 3, la température moyenne du côté supérieur est de 35.1 °C / 95 F, alors que la moyenne de l'appareil est de 32 °C / 90 F.
(+) Les repose-poignets et le pavé tactile sont plus froids que la température de la peau avec un maximum de 27.3 °C / 81.1 F et sont donc froids au toucher.
(±) La température moyenne de la zone de l'appui-paume de dispositifs similaires était de 27.8 °C / 82 F (+0.5 °C / #0.9 F).
| Éteint/en veille | |
| Au repos | |
| Fortement sollicité |
|
Légende:
min: | |
| Dell Precision 7720 E3-1535M v6, Quadro P5000, Toshiba NVMe THNSN5512GPU7, IGZO, 3840x2160, 17.3" | Lenovo ThinkPad P71-20HK0004GE i7-7820HQ, Quadro P3000, Samsung PM961 NVMe MZVLW512HMJP, IPS, 3840x2160, 17.3" | HP ZBook 17 G4-Y3J82AV E3-1535M v6, Quadro P5000, Samsung SSD SM961 1TB M.2 MZVKW1T0HMLH, IPS, 3840x2160, 17.3" | MSI WE72 7RJ i7-7700HQ, Quadro M2200, Samsung SM961 MZVPW256 m.2 PCI-e, IPS, 1920x1080, 17.3" | Fujitsu Celsius H970 E3-1535M v6, Quadro P4000, Samsung SM961 MZVKW512HMJP m.2 PCI-e, IPS LED, 1920x1080, 17.3" | MSI WT72-6QM E3-1505M v5, Quadro M5000M, Toshiba NVMe THNSN5256GPU7, IPS, 1920x1080, 17.3" | |
|---|---|---|---|---|---|---|
| Power Consumption | 17% | -5% | -2% | 14% | -48% | |
| Idle Minimum * (Watt) | 9.6 | 7.44 22% | 12.9 -34% | 15 -56% | 10.7 -11% | 24.8 -158% |
| Idle Average * (Watt) | 20.5 | 18 12% | 19.6 4% | 20.1 2% | 15.8 23% | 29.7 -45% |
| Idle Maximum * (Watt) | 22.9 | 21.8 5% | 23.6 -3% | 23.8 -4% | 17.8 22% | 30.1 -31% |
| Load Average * (Watt) | 96.8 | 77.1 20% | 92.8 4% | 85.6 12% | 92 5% | 105.2 -9% |
| Load Maximum * (Watt) | 202.1 | 150.5 26% | 190 6% | 128 37% | 137 32% | 192.2 5% |
| Witcher 3 ultra * (Watt) | 148.5 |
* ... Moindre est la valeur, meilleures sont les performances
| Dell Precision 7720 E3-1535M v6, Quadro P5000, 91 Wh | Lenovo ThinkPad P71-20HK0004GE i7-7820HQ, Quadro P3000, 96 Wh | HP ZBook 17 G4-Y3J82AV E3-1535M v6, Quadro P5000, 95 Wh | MSI WE72 7RJ i7-7700HQ, Quadro M2200, 51 Wh | Fujitsu Celsius H970 E3-1535M v6, Quadro P4000, 96 Wh | Dell Precision 7710 E3-1535M v5, FirePro W7170M, 72 Wh | |
|---|---|---|---|---|---|---|
| Autonomie de la batterie | 10% | -13% | -53% | 33% | -1% | |
| Reader / Idle (h) | 11.4 | 14.5 27% | 7.8 -32% | 4.5 -61% | 16.7 46% | 12.9 13% |
| H.264 (h) | 6.8 | 8.6 26% | 5.3 -22% | 3 -56% | 9.6 41% | 4.7 -31% |
| WiFi v1.3 (h) | 6.3 | 6 -5% | 4.9 -22% | 3 -52% | 9 43% | 6.1 -3% |
| Load (h) | 1.2 | 1.1 -8% | 1.5 25% | 0.7 -42% | 1.2 0% | 1.4 17% |
Points positifs
Points négatifs
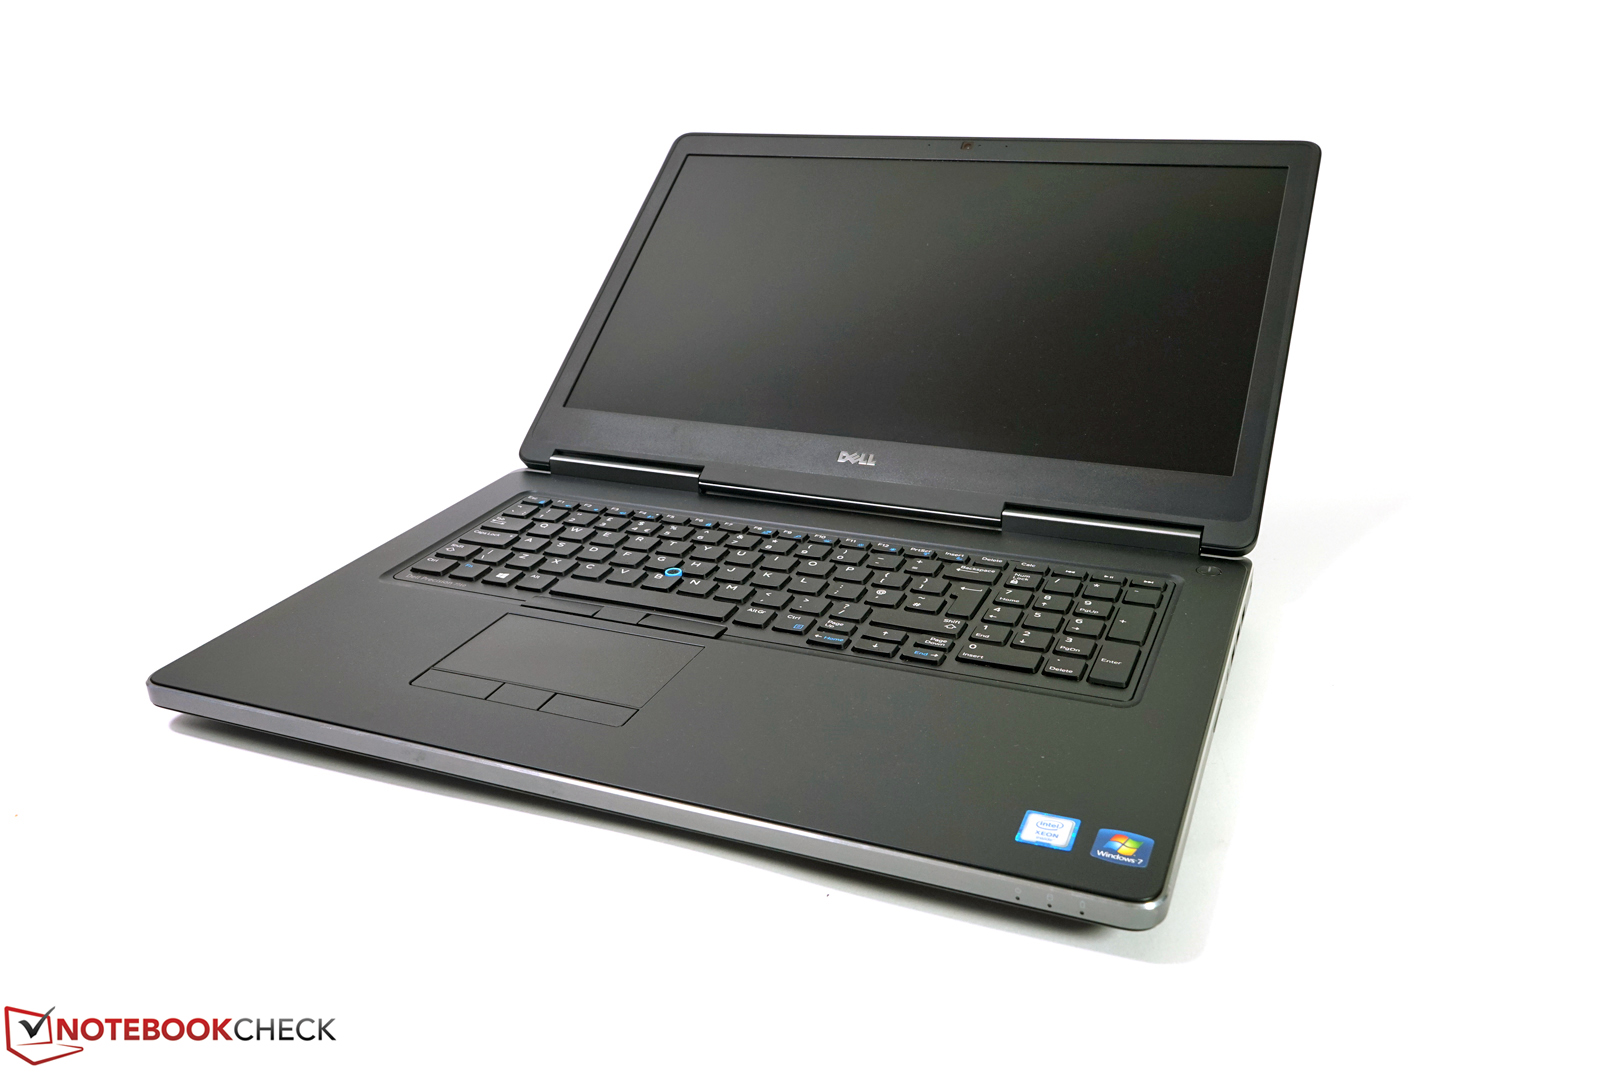
Le Precision 7720 de Dell est une station de travail puissante. Le châssis de haute qualité reste grosso modo le même que sur la génération précédente, mais ajoute un port Thunderbolt 3 par défaut. Le prédécesseur avait encore des difficultés à utiliser tout son potentiel dans le cas de sollicitations combinées CPU + GPU, mais le fabricant a amélioré cela. Notre modèle de test est équipé des composants les plus puissants du moment, mais leur optimisation est très bonne, même en cas de sollicitations extrêmes. Que vous ayez besoin ou non d’une telle puissance est une autre question. La carte graphique par exemple n’est pas nécessaire dans de nombreux cas.
Nous sommes plutôt déçus par l’écran 4K Premier Color. Nous sommes un peu tatillons, mais nous aurions apprécié de meilleurs résultats en sortie d’usine, vu le niveau de prix. Un calibrage est hautement recommandé. Les fuites de lumière le long de la bordure d'écran inférieur sont également un peu gênantes, ainsi que la MLI aux niveaux de luminosité les plus faibles.
Le Precision 7720 est un bon choix pour ceux qui ont besoin de performances élevées, la station de travail mobile pouvant utiliser tout le potentiel de ses composants de haute volée et coûteux.
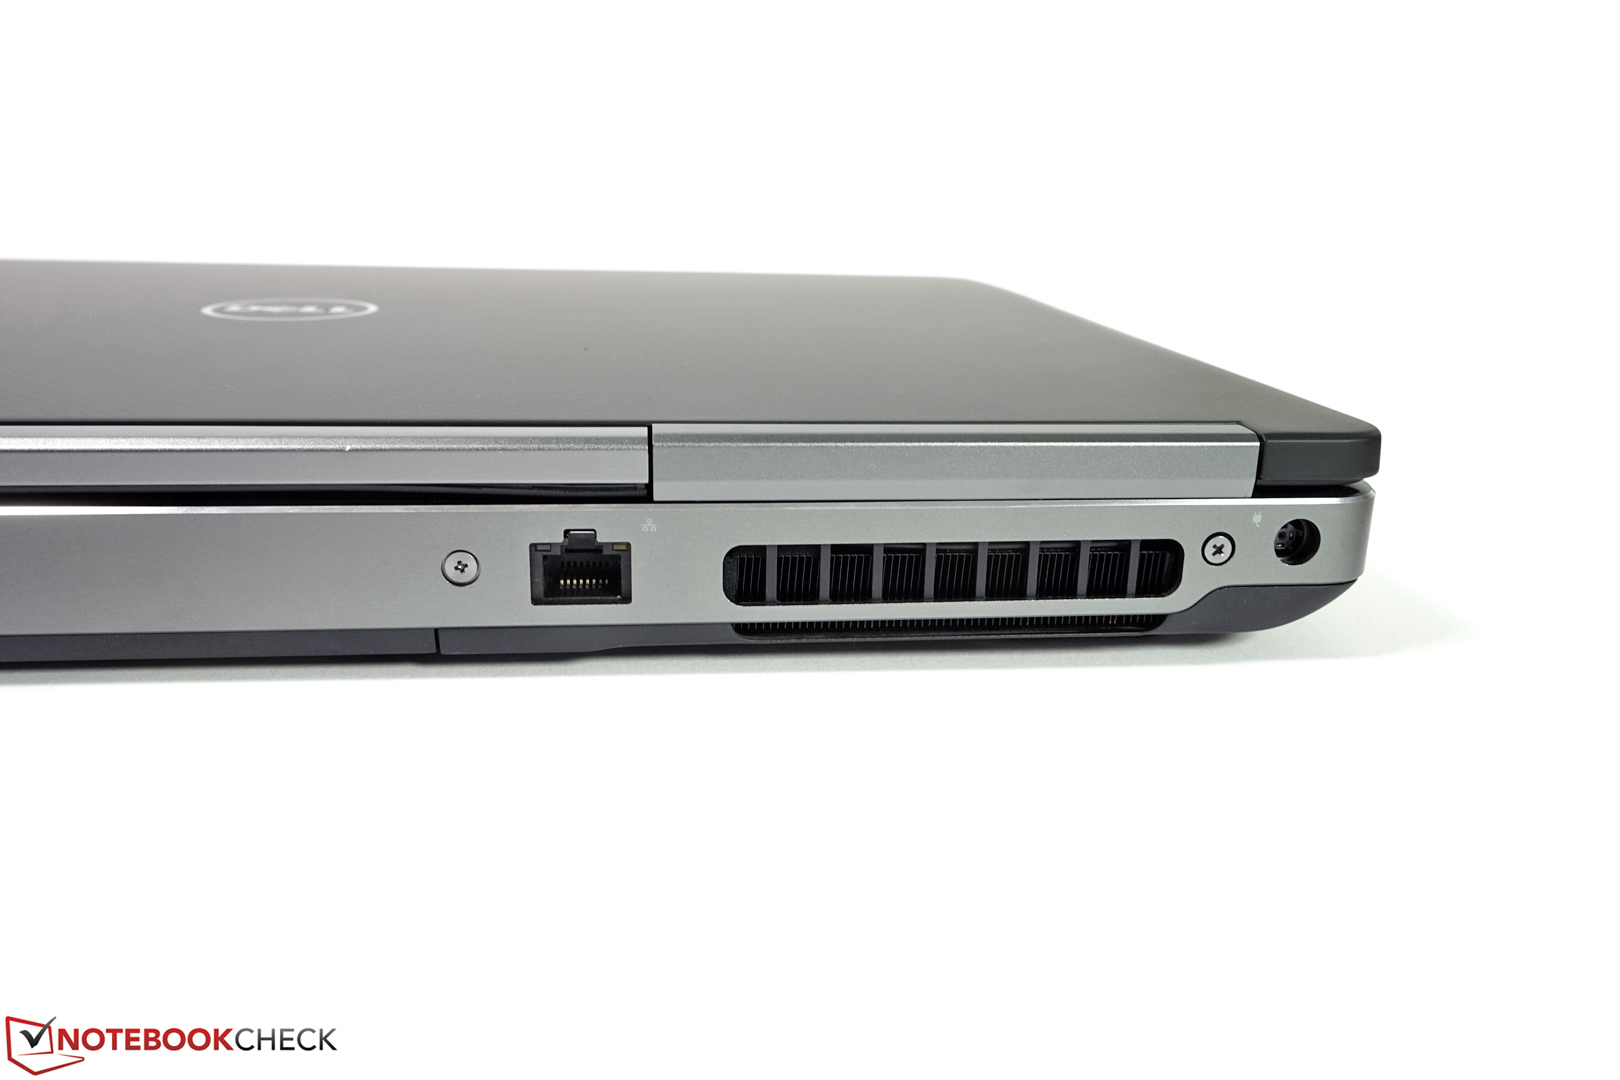
Il n’y a de plus pas de problème de ventilateurs, malgré ces performances. On peut les entendre lors de fortes sollicitations, mais ils sont le plus souvent éteints lors des tâches classiques. La chauffe est également bien maîtrisée, ainsi que l’autonomie.
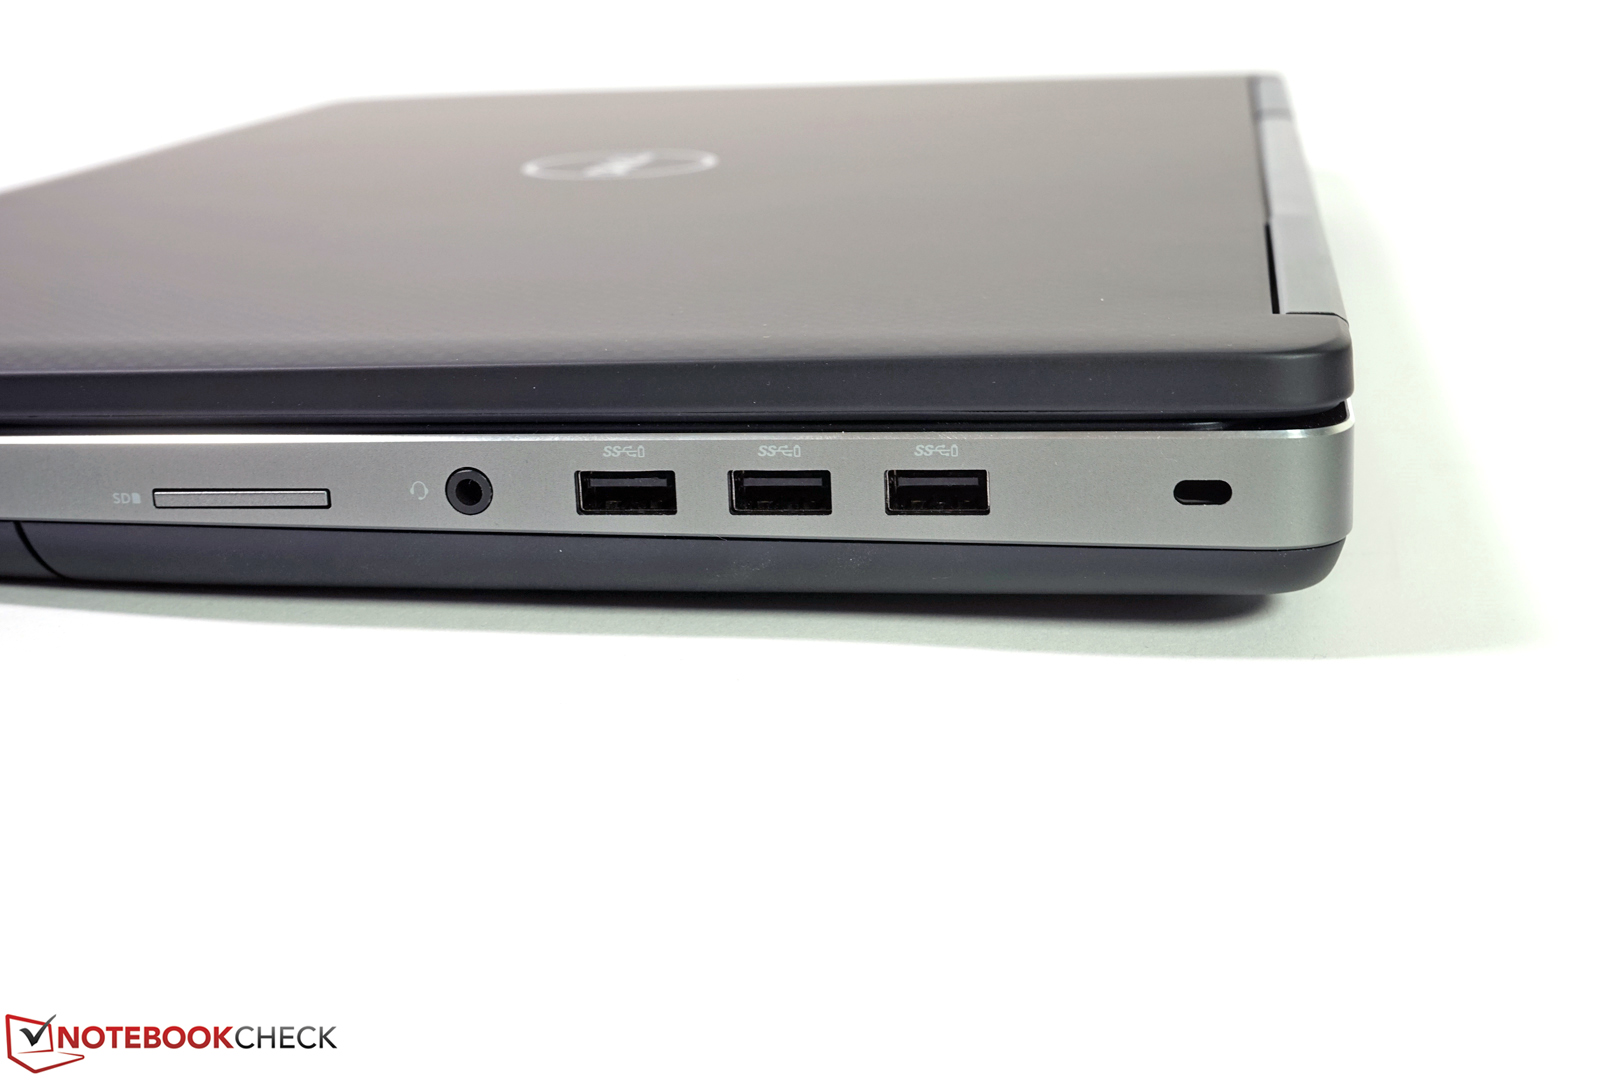
Mis à part nos réserves concernant l’écran, il faut regarder de près pour trouver des faiblesses à l’appareil. On peut néanmoins noter le lecteur de carte SD, qui ne fonctionnait pas sur notre appareil (il s’agit sans doute d’un problème isolé), ou l’emplacement SIM, qui est localisé à l’intérieur du châssis (cela ne facilite pas son utilisation, et empêche un changement rapide de carte dans les autres pays, par exemple).
Toutes ces performances s'obtiennent au prix fort, mais il en va de même des concurrents. Au final, le Precision 7729 obtient une très bonne note (89 %).
L’intégralité de cette critique est disponible en anglais en suivant ce lien.
Dell Precision 7720
- 01/21/2018 v6 (old)
Andreas Osthoff
