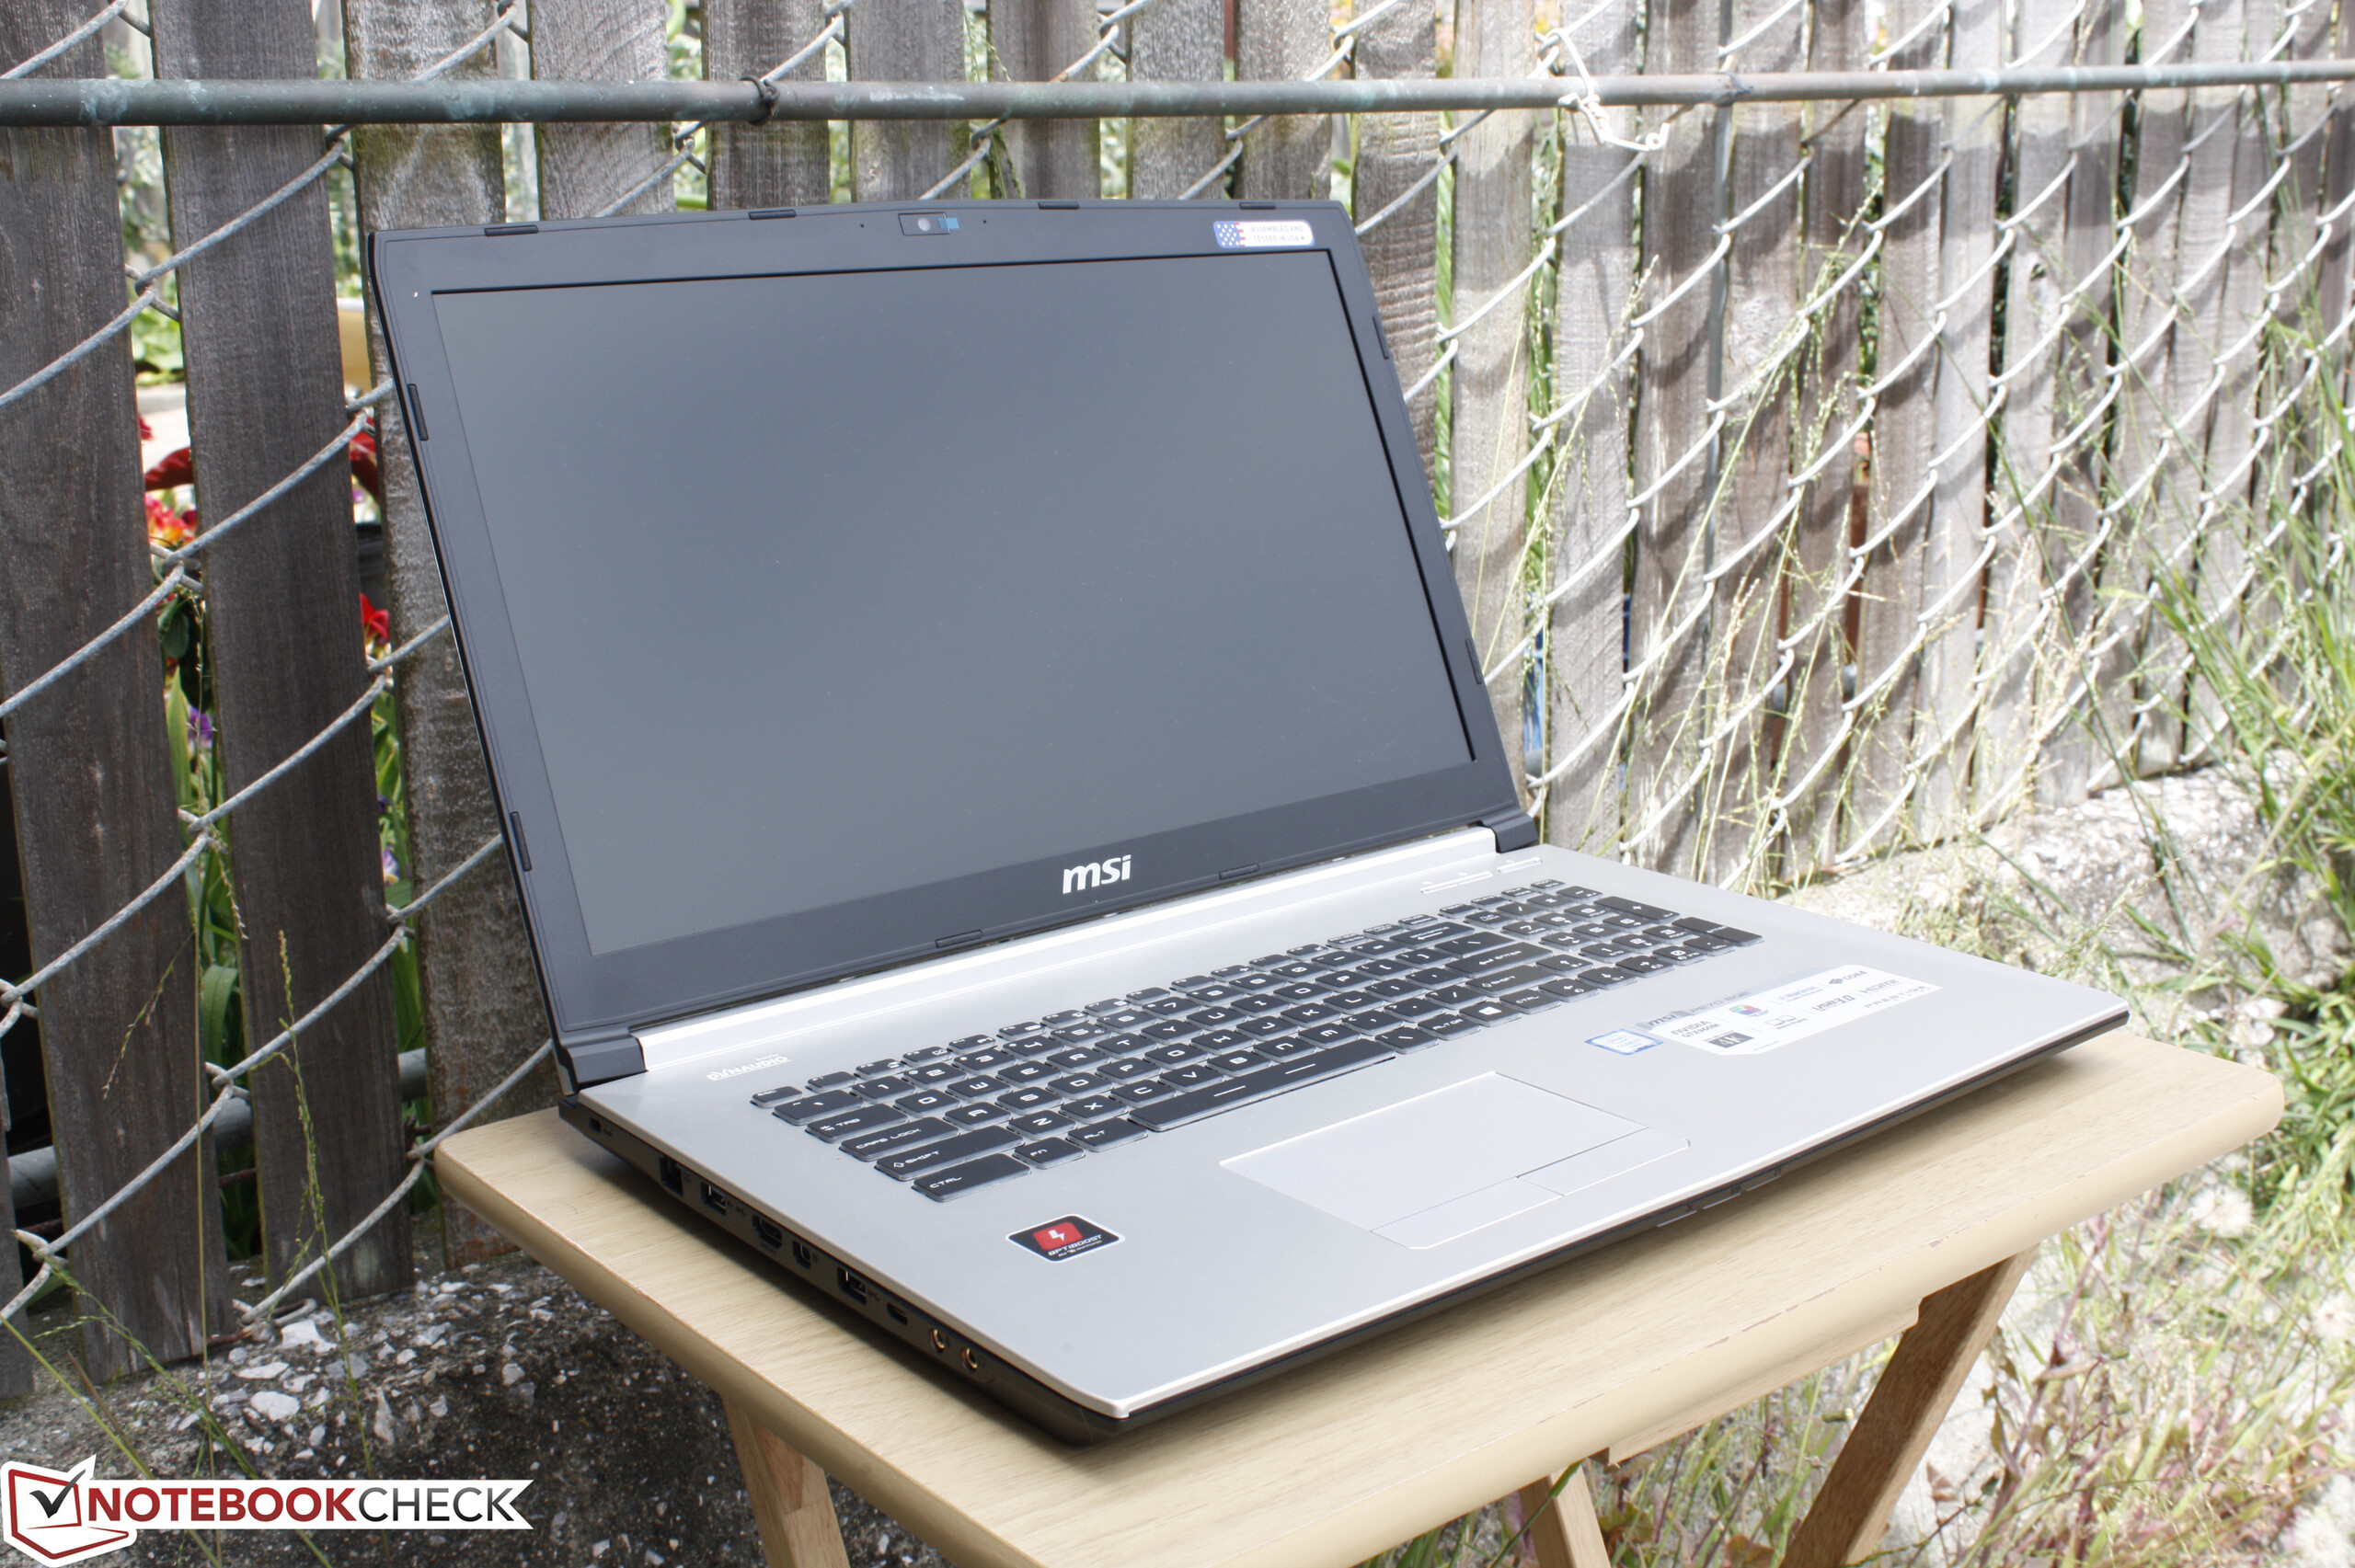
Courte critique du PC portable MSI PE70 6QE Prestige iBuyPower Edition


| |||||||||||||||||||||||||
Homogénéité de la luminosité: 74 %
Valeur mesurée au centre, sur batterie: 206.7 cd/m²
Contraste: 827:1 (Valeurs des noirs: 0.25 cd/m²)
ΔE ColorChecker Calman: 11.15 | ∀{0.5-29.43 Ø4.73}
ΔE Greyscale Calman: 11.03 | ∀{0.09-98 Ø4.97}
93.4% sRGB (Argyll 1.6.3 3D)
59.2% AdobeRGB 1998 (Argyll 1.6.3 3D)
64.6% AdobeRGB 1998 (Argyll 3D)
93.6% sRGB (Argyll 3D)
63.9% Display P3 (Argyll 3D)
Gamma: 2.29
CCT: 12972 K
| MSI Prestige PE70 6QE-055XUS 17.3", 1920x1080 | MSI PE70-2QEi581 17.3", 1920x1080 | MSI WT72-6QM 17.3", 1920x1080 | MSI GL72 6QF 17.3", 1920x1080 | Lenovo Ideapad Y700 17ISK 80Q0 17.3", 1920x1080 | |
|---|---|---|---|---|---|
| Display | -3% | -2% | 3% | -3% | |
| Display P3 Coverage (%) | 63.9 | 66.6 4% | 67.3 5% | 65.9 3% | 67.4 5% |
| sRGB Coverage (%) | 93.6 | 84.6 -10% | 85.4 -9% | 95.6 2% | 84.8 -9% |
| AdobeRGB 1998 Coverage (%) | 64.6 | 61.9 -4% | 62.5 -3% | 66.7 3% | 62 -4% |
| Response Times | -6% | -10% | -36% | ||
| Response Time Grey 50% / Grey 80% * (ms) | 41.2 ? | 42 ? -2% | 45.6 ? -11% | 51.6 ? -25% | |
| Response Time Black / White * (ms) | 23.6 ? | 26 ? -10% | 25.6 ? -8% | 34.4 ? -46% | |
| PWM Frequency (Hz) | 1000 ? | 86 ? | 980 ? | ||
| Screen | 8% | 12% | -1% | 35% | |
| Brightness middle (cd/m²) | 206.7 | 305 48% | 303 47% | 194.7 -6% | 349.7 69% |
| Brightness (cd/m²) | 196 | 265 35% | 298 52% | 183 -7% | 332 69% |
| Brightness Distribution (%) | 74 | 79 7% | 94 27% | 79 7% | 90 22% |
| Black Level * (cd/m²) | 0.25 | 0.5 -100% | 0.46 -84% | 0.247 1% | 0.304 -22% |
| Contrast (:1) | 827 | 610 -26% | 659 -20% | 788 -5% | 1150 39% |
| Colorchecker dE 2000 * | 11.15 | 4.83 57% | 5.77 48% | 11.44 -3% | 3.99 64% |
| Colorchecker dE 2000 max. * | 18.21 | 18.78 -3% | 8.74 52% | ||
| Greyscale dE 2000 * | 11.03 | 3.29 70% | 4.87 56% | 11.36 -3% | 3.34 70% |
| Gamma | 2.29 96% | 2.39 92% | 1.99 111% | 2.12 104% | 2.23 99% |
| CCT | 12972 50% | 7080 92% | 7363 88% | 12948 50% | 6111 106% |
| Color Space (Percent of AdobeRGB 1998) (%) | 59.2 | 56 -5% | 56.04 -5% | 60.8 3% | 55.8 -6% |
| Color Space (Percent of sRGB) (%) | 93.4 | 84 -10% | 85.27 -9% | 95.3 2% | 84.8 -9% |
| Moyenne finale (programmes/paramètres) | 3% /
6% | 1% /
7% | -3% /
-2% | -1% /
18% |
* ... Moindre est la valeur, meilleures sont les performances
Temps de réponse de l'écran
| ↔ Temps de réponse noir à blanc | ||
|---|---|---|
| 23.6 ms ... hausse ↗ et chute ↘ combinées | ↗ 7.6 ms hausse | 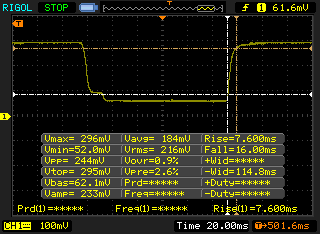 |
| ↘ 16 ms chute | ||
| L'écran montre de bons temps de réponse, mais insuffisant pour du jeu compétitif. En comparaison, tous les appareils testés affichent entre 0.1 (minimum) et 240 (maximum) ms. » 54 % des appareils testés affichent de meilleures performances. Cela signifie que les latences relevées sont moins bonnes que la moyenne (19.9 ms) de tous les appareils testés. | ||
| ↔ Temps de réponse gris 50% à gris 80% | ||
| 41.2 ms ... hausse ↗ et chute ↘ combinées | ↗ 22 ms hausse | 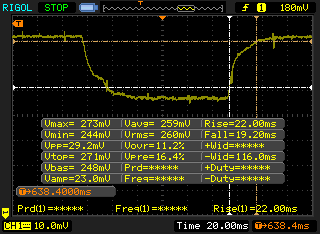 |
| ↘ 19.2 ms chute | ||
| L'écran souffre de latences très élevées, à éviter pour le jeu. En comparaison, tous les appareils testés affichent entre 0.165 (minimum) et 636 (maximum) ms. » 66 % des appareils testés affichent de meilleures performances. Cela signifie que les latences relevées sont moins bonnes que la moyenne (31.1 ms) de tous les appareils testés. | ||
Scintillement / MLI (Modulation de largeur d'impulsion)
| Scintillement / MLI (Modulation de largeur d'impulsion) décelé | 1000 Hz | ≤ 99 Niveau de luminosité | 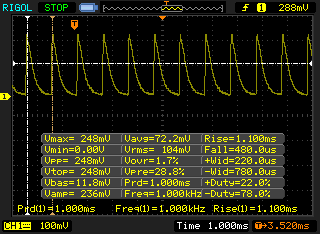 |
Le rétroéclairage de l'écran scintille à la fréquence de 1000 Hz (certainement du fait de l'utilisation d'une MDI - Modulation de largeur d'impulsion) à un niveau de luminosité inférieur ou égal à 99 % . Aucun scintillement ne devrait être perceptible au-dessus de cette valeur. La fréquence de rafraîchissement de 1000 Hz est élevée, la grande majorité des utilisateurs ne devrait pas percevoir de scintillements et être sujette à une fatigue oculaire accrue. En comparaison, 52 % des appareils testés n'emploient pas MDI pour assombrir leur écran. Nous avons relevé une moyenne à 7798 (minimum : 5 - maximum : 343500) Hz dans le cas où une MDI était active. | |||
| Cinebench R15 | |
| CPU Single 64Bit (Classer selon les valeurs) | |
| MSI Prestige PE70 6QE-055XUS | |
| DogHouse Systems Mobius SS | |
| MSI GE62 2QC-468XPL | |
| Lenovo ThinkPad P70 | |
| Clevo P150SM-A | |
| CPU Multi 64Bit (Classer selon les valeurs) | |
| MSI Prestige PE70 6QE-055XUS | |
| DogHouse Systems Mobius SS | |
| MSI GE62 2QC-468XPL | |
| Lenovo ThinkPad P70 | |
| Clevo P150SM-A | |
| Cinebench R11.5 | |
| CPU Single 64Bit (Classer selon les valeurs) | |
| MSI Prestige PE70 6QE-055XUS | |
| DogHouse Systems Mobius SS | |
| MSI GE62 2QC-468XPL | |
| Lenovo ThinkPad P70 | |
| Clevo P150SM-A | |
| CPU Multi 64Bit (Classer selon les valeurs) | |
| MSI Prestige PE70 6QE-055XUS | |
| DogHouse Systems Mobius SS | |
| MSI GE62 2QC-468XPL | |
| Lenovo ThinkPad P70 | |
| Clevo P150SM-A | |
| Cinebench R10 | |
| Rendering Single 32Bit (Classer selon les valeurs) | |
| MSI Prestige PE70 6QE-055XUS | |
| DogHouse Systems Mobius SS | |
| MSI GE62 2QC-468XPL | |
| Lenovo ThinkPad P70 | |
| Clevo P150SM-A | |
| Rendering Multiple CPUs 32Bit (Classer selon les valeurs) | |
| MSI Prestige PE70 6QE-055XUS | |
| DogHouse Systems Mobius SS | |
| MSI GE62 2QC-468XPL | |
| Lenovo ThinkPad P70 | |
| Clevo P150SM-A | |
| wPrime 2.10 - 1024m (Classer selon les valeurs) | |
| MSI Prestige PE70 6QE-055XUS | |
| DogHouse Systems Mobius SS | |
| MSI GE62 2QC-468XPL | |
| Lenovo ThinkPad P70 | |
| Clevo P150SM-A | |
| Super Pi Mod 1.5 XS 32M - 32M (Classer selon les valeurs) | |
| MSI Prestige PE70 6QE-055XUS | |
| DogHouse Systems Mobius SS | |
| MSI GE62 2QC-468XPL | |
| Lenovo ThinkPad P70 | |
| Clevo P150SM-A | |
* ... Moindre est la valeur, meilleures sont les performances
| PCMark 8 | |
| Home Score Accelerated v2 (Classer selon les valeurs) | |
| MSI Prestige PE70 6QE-055XUS | |
| DogHouse Systems Mobius SS | |
| MSI GE62-6QD16H11 | |
| Lenovo ThinkPad P70 | |
| MSI PE70-2QEi581 | |
| Work Score Accelerated v2 (Classer selon les valeurs) | |
| MSI Prestige PE70 6QE-055XUS | |
| DogHouse Systems Mobius SS | |
| MSI GE62-6QD16H11 | |
| Lenovo ThinkPad P70 | |
| MSI PE70-2QEi581 | |
| Creative Score Accelerated v2 (Classer selon les valeurs) | |
| MSI Prestige PE70 6QE-055XUS | |
| DogHouse Systems Mobius SS | |
| MSI GE62-6QD16H11 | |
| PCMark 8 Home Score Accelerated v2 | 3854 points | |
| PCMark 8 Creative Score Accelerated v2 | 4834 points | |
| PCMark 8 Work Score Accelerated v2 | 4945 points | |
Aide | ||
| MSI Prestige PE70 6QE-055XUS GeForce GTX 960M, 6700HQ, Intel SSD 535 SSDSCKJW120H6 | MSI WT72-6QJ Quadro M2000M, 6700HQ, Samsung SSD 850 PRO 512GB | MSI GL72 6QF GeForce GTX 960M, 6700HQ, Samsung SSD 950 Pro 256GB m.2 NVMe | Lenovo ThinkPad P70 Quadro M3000M, 6820HQ, Samsung SSD PM871 MZNLN512HCJH | Lenovo Ideapad Y700 17ISK 80Q0 GeForce GTX 960M, 6700HQ, Samsung MZNLN128HCGR-000L2 | |
|---|---|---|---|---|---|
| AS SSD | 78% | 248% | 53% | 26% | |
| Copy Game MB/s (MB/s) | 351.8 | 1140 224% | 355.4 1% | 232.6 -34% | |
| Copy Program MB/s (MB/s) | 210.1 | 491.1 134% | 246.2 17% | 164.9 -22% | |
| Copy ISO MB/s (MB/s) | 317.6 | 1520 379% | 389 22% | 255.9 -19% | |
| Score Total (Points) | 568 | 1092 92% | 2340 312% | 1012 78% | 842 48% |
| Score Write (Points) | 292 | 426 46% | 501 72% | 384 32% | 222 -24% |
| Score Read (Points) | 185 | 434 135% | 1248 575% | 412 123% | 414 124% |
| Access Time Write * (ms) | 0.2 | 0.037 82% | 0.032 84% | 0.056 72% | 0.043 79% |
| Access Time Read * (ms) | 0.145 | 0.07 52% | 0.04 72% | 0.069 52% | 0.09 38% |
| 4K-64 Write (MB/s) | 184.9 | 288.8 56% | 296.4 60% | 255.5 38% | 123.6 -33% |
| 4K-64 Read (MB/s) | 116.3 | 347.4 199% | 998 758% | 341.7 194% | 329.3 183% |
| 4K Write (MB/s) | 85.2 | 88.6 4% | 115.2 35% | 82.7 -3% | 83.8 -2% |
| 4K Read (MB/s) | 22.51 | 34.15 52% | 46.38 106% | 22.61 0% | 34.03 51% |
| Seq Write (MB/s) | 217.2 | 490.6 126% | 897 313% | 458.1 111% | 146.3 -33% |
| Seq Read (MB/s) | 458.6 | 520 13% | 2039 345% | 477.8 4% | 503 10% |
* ... Moindre est la valeur, meilleures sont les performances

| 3DMark 11 | |
| 1280x720 Performance GPU (Classer selon les valeurs) | |
| MSI Prestige PE70 6QE-055XUS | |
| Aorus X5S v5 | |
| Gigabyte P55W v5 | |
| MSI PE60 6QE-056XUS | |
| MSI PE60 2QD | |
| Lenovo Ideapad 500s-14ISK | |
| 1280x720 Performance Combined (Classer selon les valeurs) | |
| MSI Prestige PE70 6QE-055XUS | |
| Aorus X5S v5 | |
| Gigabyte P55W v5 | |
| MSI PE60 6QE-056XUS | |
| MSI PE60 2QD | |
| Lenovo Ideapad 500s-14ISK | |
| 3DMark | |
| 1920x1080 Fire Strike Graphics (Classer selon les valeurs) | |
| MSI Prestige PE70 6QE-055XUS | |
| Aorus X5S v5 | |
| Gigabyte P55W v5 | |
| MSI PE60 6QE-056XUS | |
| MSI PE60 2QD | |
| Lenovo Ideapad 500s-14ISK | |
| 1920x1080 Fire Strike Combined (Classer selon les valeurs) | |
| MSI Prestige PE70 6QE-055XUS | |
| Aorus X5S v5 | |
| Gigabyte P55W v5 | |
| MSI PE60 6QE-056XUS | |
| MSI PE60 2QD | |
| Lenovo Ideapad 500s-14ISK | |
| Fire Strike Extreme Graphics (Classer selon les valeurs) | |
| MSI Prestige PE70 6QE-055XUS | |
| Aorus X5S v5 | |
| MSI PE60 6QE-056XUS | |
| Fire Strike Extreme Combined (Classer selon les valeurs) | |
| MSI Prestige PE70 6QE-055XUS | |
| Aorus X5S v5 | |
| MSI PE60 6QE-056XUS | |
| 3DMark 11 Performance | 5538 points | |
| 3DMark Ice Storm Standard Score | 77859 points | |
| 3DMark Cloud Gate Standard Score | 10872 points | |
| 3DMark Fire Strike Score | 3557 points | |
| 3DMark Fire Strike Extreme Score | 1786 points | |
Aide | ||
| BioShock Infinite | |
| 1366x768 High Preset (Classer selon les valeurs) | |
| MSI Prestige PE70 6QE-055XUS | |
| DogHouse Systems Mobius SS | |
| Aorus X3 Plus v5 | |
| MSI PE60 6QE-056XUS | |
| MSI GP62-2QEi781FD | |
| 1920x1080 Ultra Preset, DX11 (DDOF) (Classer selon les valeurs) | |
| MSI Prestige PE70 6QE-055XUS | |
| DogHouse Systems Mobius SS | |
| Aorus X3 Plus v5 | |
| MSI PE60 6QE-056XUS | |
| MSI GP62-2QEi781FD | |
| Batman: Arkham Knight - 1920x1080 High / On (Interactive Smoke & Paper Debris Off) AA:SM AF:8x (Classer selon les valeurs) | |
| MSI Prestige PE70 6QE-055XUS | |
| DogHouse Systems Mobius SS | |
| Aorus X3 Plus v5 | |
| MSI PE60 6QE-056XUS | |
| MSI GP62-2QEi781FD | |
| Rise of the Tomb Raider | |
| 1920x1080 High Preset AA:FX AF:4x (Classer selon les valeurs) | |
| MSI Prestige PE70 6QE-055XUS | |
| DogHouse Systems Mobius SS | |
| MSI PE60 6QE-056XUS | |
| 1920x1080 Very High Preset AA:FX AF:16x (Classer selon les valeurs) | |
| MSI Prestige PE70 6QE-055XUS | |
| DogHouse Systems Mobius SS | |
| MSI PE60 6QE-056XUS | |
| Thief | |
| 1366x768 High Preset AA:FXAA & Low SS AF:4x (Classer selon les valeurs) | |
| MSI Prestige PE70 6QE-055XUS | |
| DogHouse Systems Mobius SS | |
| Aorus X3 Plus v5 | |
| MSI PE60 6QE-056XUS | |
| MSI GP62-2QEi781FD | |
| 1920x1080 Very High Preset AA:FXAA & High SS AF:8x (Classer selon les valeurs) | |
| MSI Prestige PE70 6QE-055XUS | |
| DogHouse Systems Mobius SS | |
| Aorus X3 Plus v5 | |
| MSI PE60 6QE-056XUS | |
| MSI GP62-2QEi781FD | |
| Metro: Last Light | |
| 1366x768 High (DX11) AF:16x (Classer selon les valeurs) | |
| MSI Prestige PE70 6QE-055XUS | |
| DogHouse Systems Mobius SS | |
| Aorus X3 Plus v5 | |
| MSI PE60 6QE-056XUS | |
| MSI GP62-2QEi781FD | |
| 1920x1080 Very High (DX11) AF:16x (Classer selon les valeurs) | |
| MSI Prestige PE70 6QE-055XUS | |
| DogHouse Systems Mobius SS | |
| Aorus X3 Plus v5 | |
| MSI PE60 6QE-056XUS | |
| MSI GP62-2QEi781FD | |
| Sleeping Dogs | |
| 1366x768 High Preset AA:High (Classer selon les valeurs) | |
| MSI Prestige PE70 6QE-055XUS | |
| DogHouse Systems Mobius SS | |
| Aorus X3 Plus v5 | |
| MSI GP62-2QEi781FD | |
| 1920x1080 Extreme Preset AA:Extreme (Classer selon les valeurs) | |
| MSI Prestige PE70 6QE-055XUS | |
| DogHouse Systems Mobius SS | |
| Aorus X3 Plus v5 | |
| MSI GP62-2QEi781FD | |
| Fallout 4 | |
| 1920x1080 High Preset AA:T AF:16x (Classer selon les valeurs) | |
| MSI Prestige PE70 6QE-055XUS | |
| DogHouse Systems Mobius SS | |
| Aorus X3 Plus v5 | |
| MSI PE60 6QE-056XUS | |
| 1920x1080 Ultra Preset AA:T AF:16x (Classer selon les valeurs) | |
| MSI Prestige PE70 6QE-055XUS | |
| DogHouse Systems Mobius SS | |
| Aorus X3 Plus v5 | |
| MSI PE60 6QE-056XUS | |
| Metal Gear Solid V | |
| 1920x1080 High / On (Classer selon les valeurs) | |
| MSI Prestige PE70 6QE-055XUS | |
| DogHouse Systems Mobius SS | |
| Aorus X3 Plus v5 | |
| MSI PE60 6QE-056XUS | |
| 1920x1080 Extra High / On (Classer selon les valeurs) | |
| MSI Prestige PE70 6QE-055XUS | |
| DogHouse Systems Mobius SS | |
| Aorus X3 Plus v5 | |
| MSI PE60 6QE-056XUS | |
| Bas | Moyen | Élevé | Ultra | |
|---|---|---|---|---|
| Sleeping Dogs (2012) | 94.2 | 24.7 | ||
| BioShock Infinite (2013) | 119.9 | 46.2 | ||
| Metro: Last Light (2013) | 59.2 | 31.9 | ||
| Thief (2014) | 55.9 | 27.8 | ||
| Batman: Arkham Knight (2015) | 42 | |||
| Metal Gear Solid V (2015) | 58 | 38 | ||
| Fallout 4 (2015) | 31.8 | 25.6 | ||
| Rise of the Tomb Raider (2016) | 29.4 | 24.4 |
| MSI Prestige PE70 6QE-055XUS GeForce GTX 960M, 6700HQ, Intel SSD 535 SSDSCKJW120H6 | MSI PE70-2QEi581 GeForce GTX 960M, 4210H, Toshiba HG5d THNSNH256GMCT | Asus GL752VW-T4168T GeForce GTX 960M, 6700HQ, Micron M600 MTFDDAV256MBF mSATA | MSI GL72 6QF GeForce GTX 960M, 6700HQ, Samsung SSD 950 Pro 256GB m.2 NVMe | Lenovo Ideapad Y700 17ISK 80Q0 GeForce GTX 960M, 6700HQ, Samsung MZNLN128HCGR-000L2 | |
|---|---|---|---|---|---|
| Noise | -2% | 0% | -3% | 5% | |
| arrêt / environnement * (dB) | 28.7 | 30.5 -6% | 29.3 -2% | ||
| Idle Minimum * (dB) | 33.3 | 33 1% | 32 4% | 35.3 -6% | 28 16% |
| Idle Average * (dB) | 34.6 | 34 2% | 32 8% | 35.4 -2% | 28.1 19% |
| Idle Maximum * (dB) | 34.7 | 36.2 -4% | 32 8% | 35.4 -2% | 31.5 9% |
| Load Average * (dB) | 38 | 39.1 -3% | 43.8 -15% | 40.9 -8% | 40.6 -7% |
| Load Maximum * (dB) | 45.2 | 48.1 -6% | 44 3% | 45 -0% | 51 -13% |
* ... Moindre est la valeur, meilleures sont les performances
Degré de la nuisance sonore
| Au repos |
| 33.3 / 34.6 / 34.7 dB(A) |
| Lecteur DVD |
| 40.4 / dB(A) |
| Fortement sollicité |
| 38 / 45.2 dB(A) |
 | ||
30 dB silencieux 40 dB(A) audible 50 dB(A) bruyant |
||
min: | ||
(-) La température maximale du côté supérieur est de 48.2 °C / 119 F, par rapport à la moyenne de 36.8 °C / 98 F, allant de 21 à 71 °C pour la classe Multimedia.
(-) Le fond chauffe jusqu'à un maximum de 54 °C / 129 F, contre une moyenne de 39.1 °C / 102 F
(+) En utilisation inactive, la température moyenne du côté supérieur est de 23.9 °C / 75 F, par rapport à la moyenne du dispositif de 31.3 °C / 88 F.
(±) Les repose-poignets et le pavé tactile peuvent devenir très chauds au toucher, avec un maximum de 36.4 °C / 97.5# F.
(-) La température moyenne de la zone de l'appui-paume de dispositifs similaires était de 28.7 °C / 83.7 F (-7.7 °C / #-13.8 F).
| MSI Prestige PE70 6QE-055XUS GeForce GTX 960M, 6700HQ, Intel SSD 535 SSDSCKJW120H6 | MSI PE70-2QEi581 GeForce GTX 960M, 4210H, Toshiba HG5d THNSNH256GMCT | Asus GL752VW-T4168T GeForce GTX 960M, 6700HQ, Micron M600 MTFDDAV256MBF mSATA | MSI GL72 6QF GeForce GTX 960M, 6700HQ, Samsung SSD 950 Pro 256GB m.2 NVMe | Lenovo Ideapad Y700-17 80QK7709PB GeForce GTX 960M, 6700HQ, Samsung SSD 850 EVO 500GB | |
|---|---|---|---|---|---|
| Power Consumption | -10% | 14% | -19% | 18% | |
| Idle Minimum * (Watt) | 16.7 | 19.1 -14% | 14.5 13% | 22.1 -32% | 4.3 74% |
| Idle Average * (Watt) | 22.4 | 24.3 -8% | 19.3 14% | 28.3 -26% | 13.8 38% |
| Idle Maximum * (Watt) | 22.9 | 29.2 -28% | 19.5 15% | 29.8 -30% | 19.8 14% |
| Load Average * (Watt) | 81.6 | 88.6 -9% | 78 4% | 87 -7% | 115.9 -42% |
| Load Maximum * (Watt) | 130.9 | 122 7% | 100 24% | 134.1 -2% | 123.5 6% |
* ... Moindre est la valeur, meilleures sont les performances
| Éteint/en veille | |
| Au repos | |
| Fortement sollicité |
|
Légende:
min: | |
| MSI Prestige PE70 6QE-055XUS 42 Wh | MSI PE70-2QEi581 42 Wh | Asus GL752VW-T4168T 48 Wh | MSI GL72 6QF 43 Wh | Lenovo Ideapad Y700 17ISK 80Q0 60 Wh | |
|---|---|---|---|---|---|
| Autonomie de la batterie | 4% | 7% | -18% | 98% | |
| Reader / Idle (h) | 4.6 | 5.8 26% | 5.1 11% | 4 -13% | 11.5 150% |
| WiFi v1.3 (h) | 2.7 | 2.6 -4% | 3 11% | 1.8 -33% | 5.6 107% |
| Load (h) | 1.1 | 1 -9% | 1.1 0% | 1 -9% | 1.5 36% |
Points positifs
Points négatifs
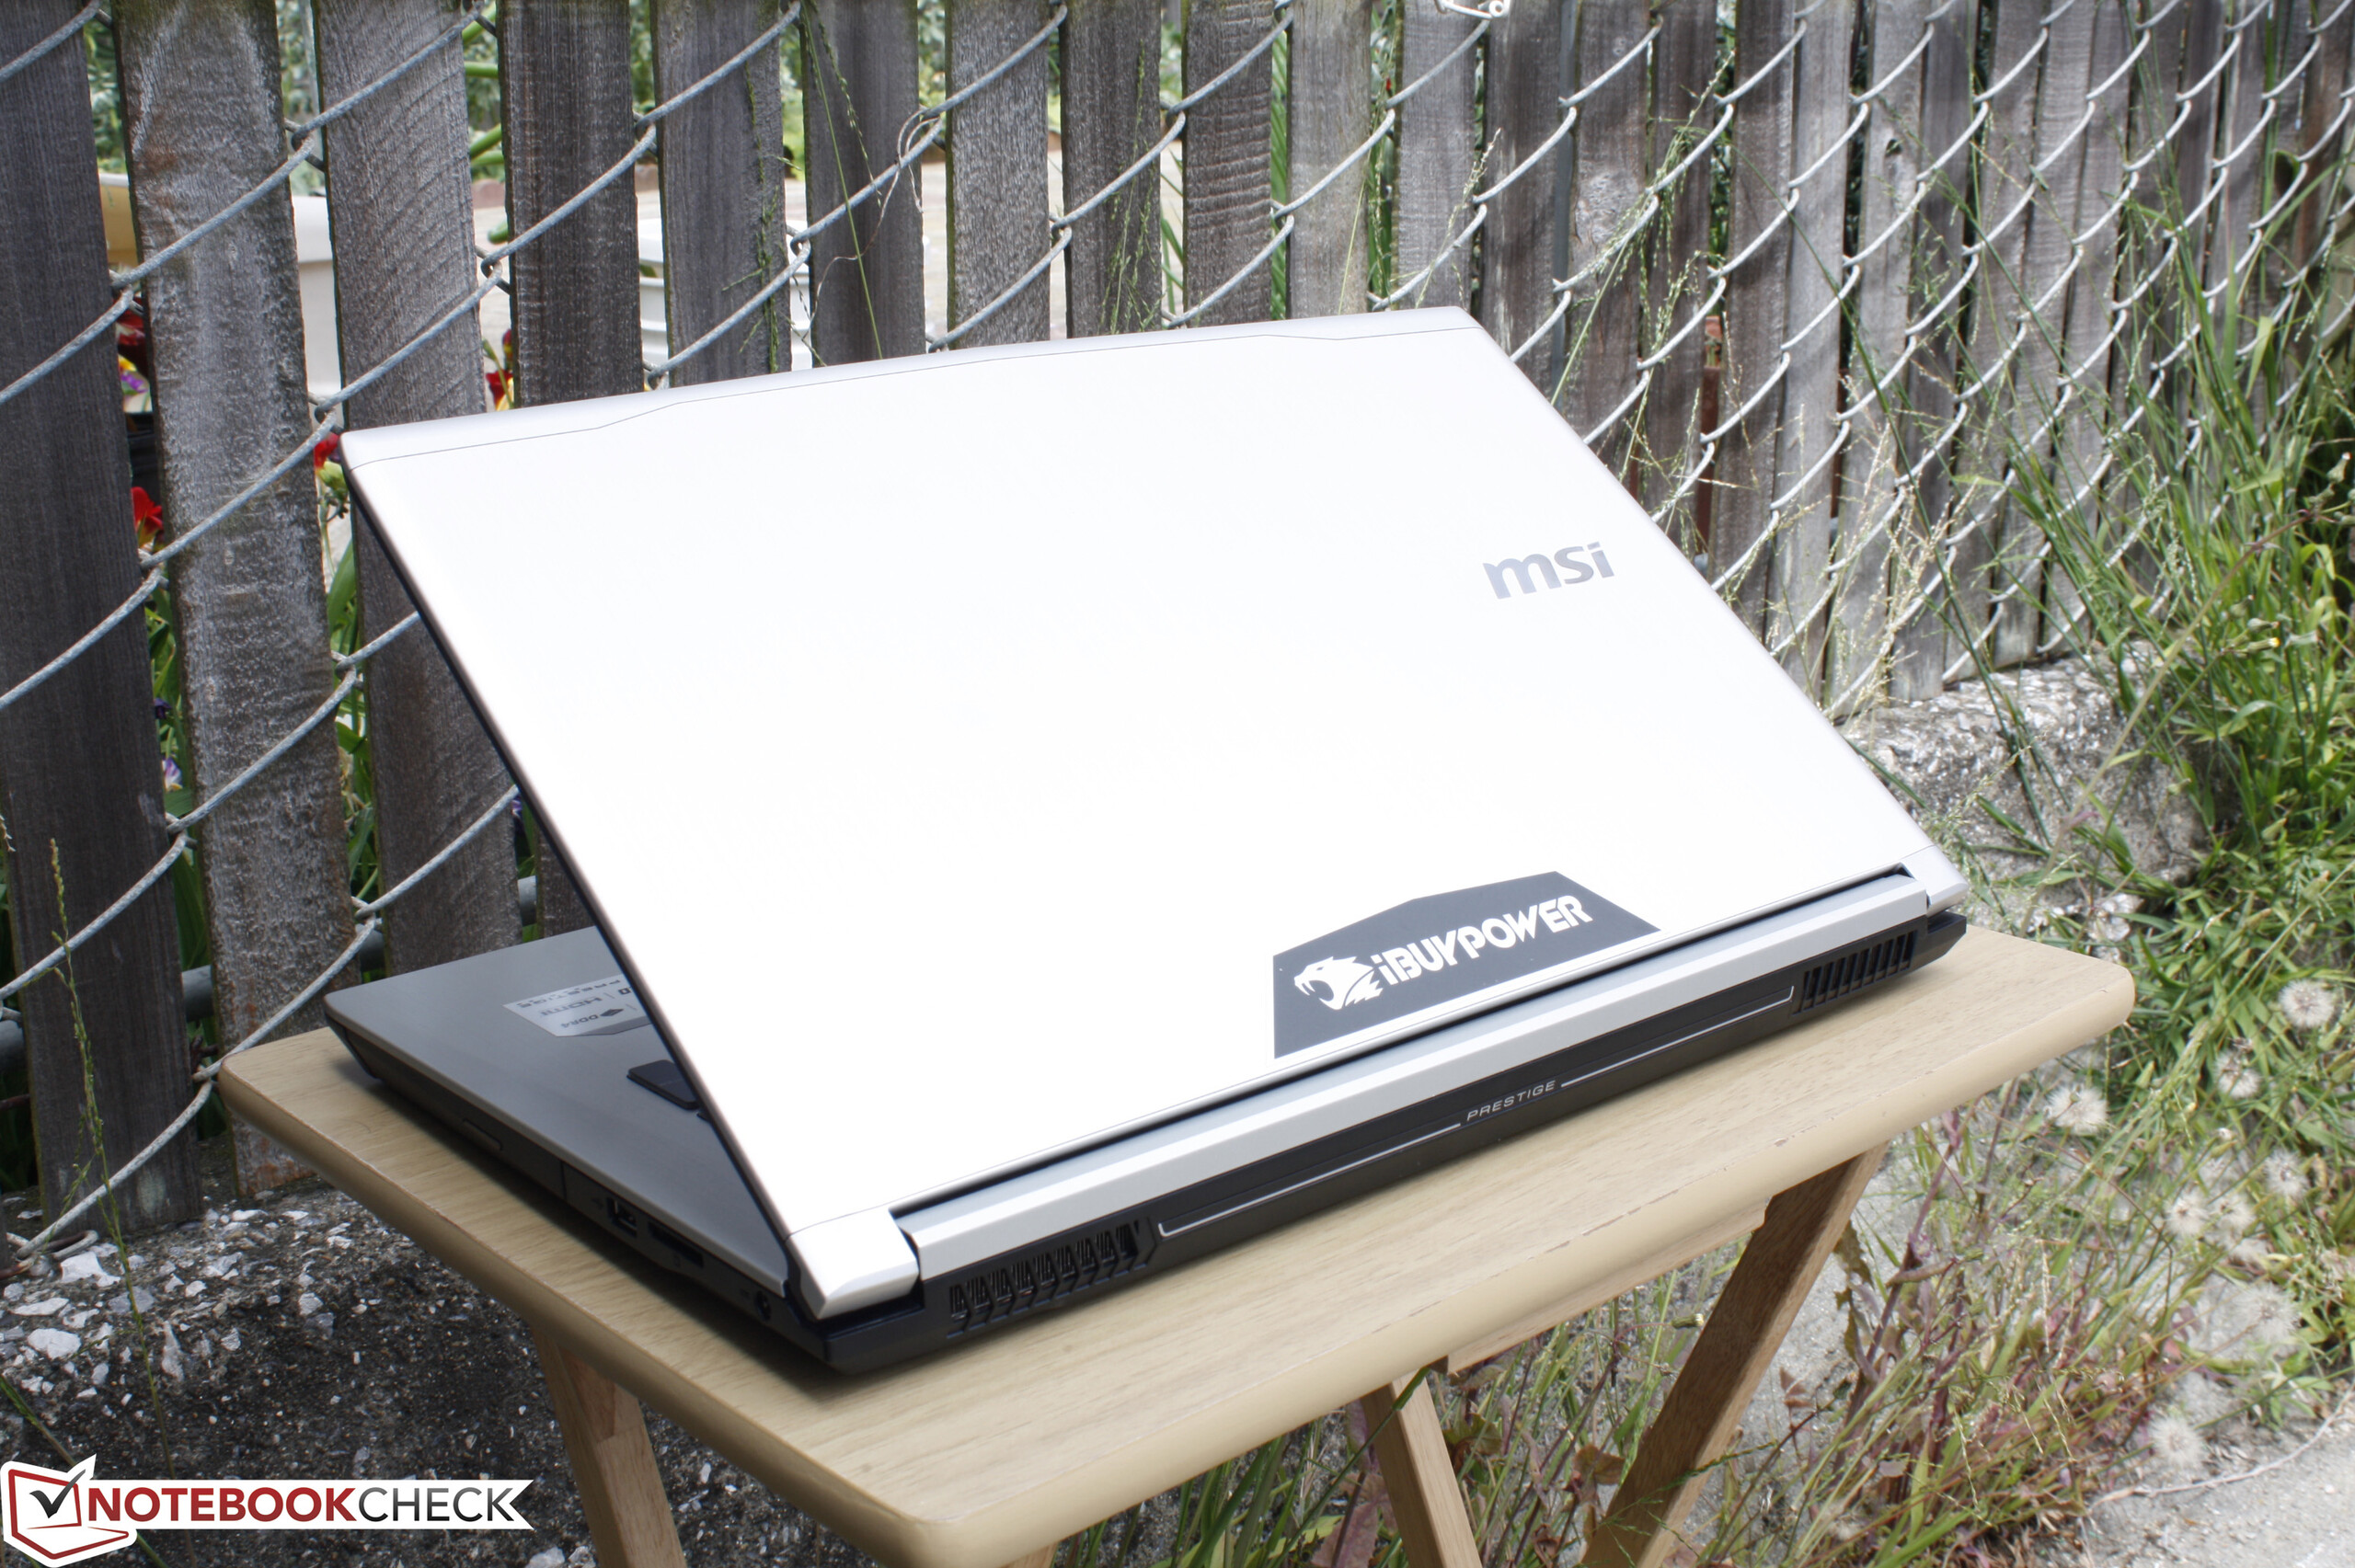
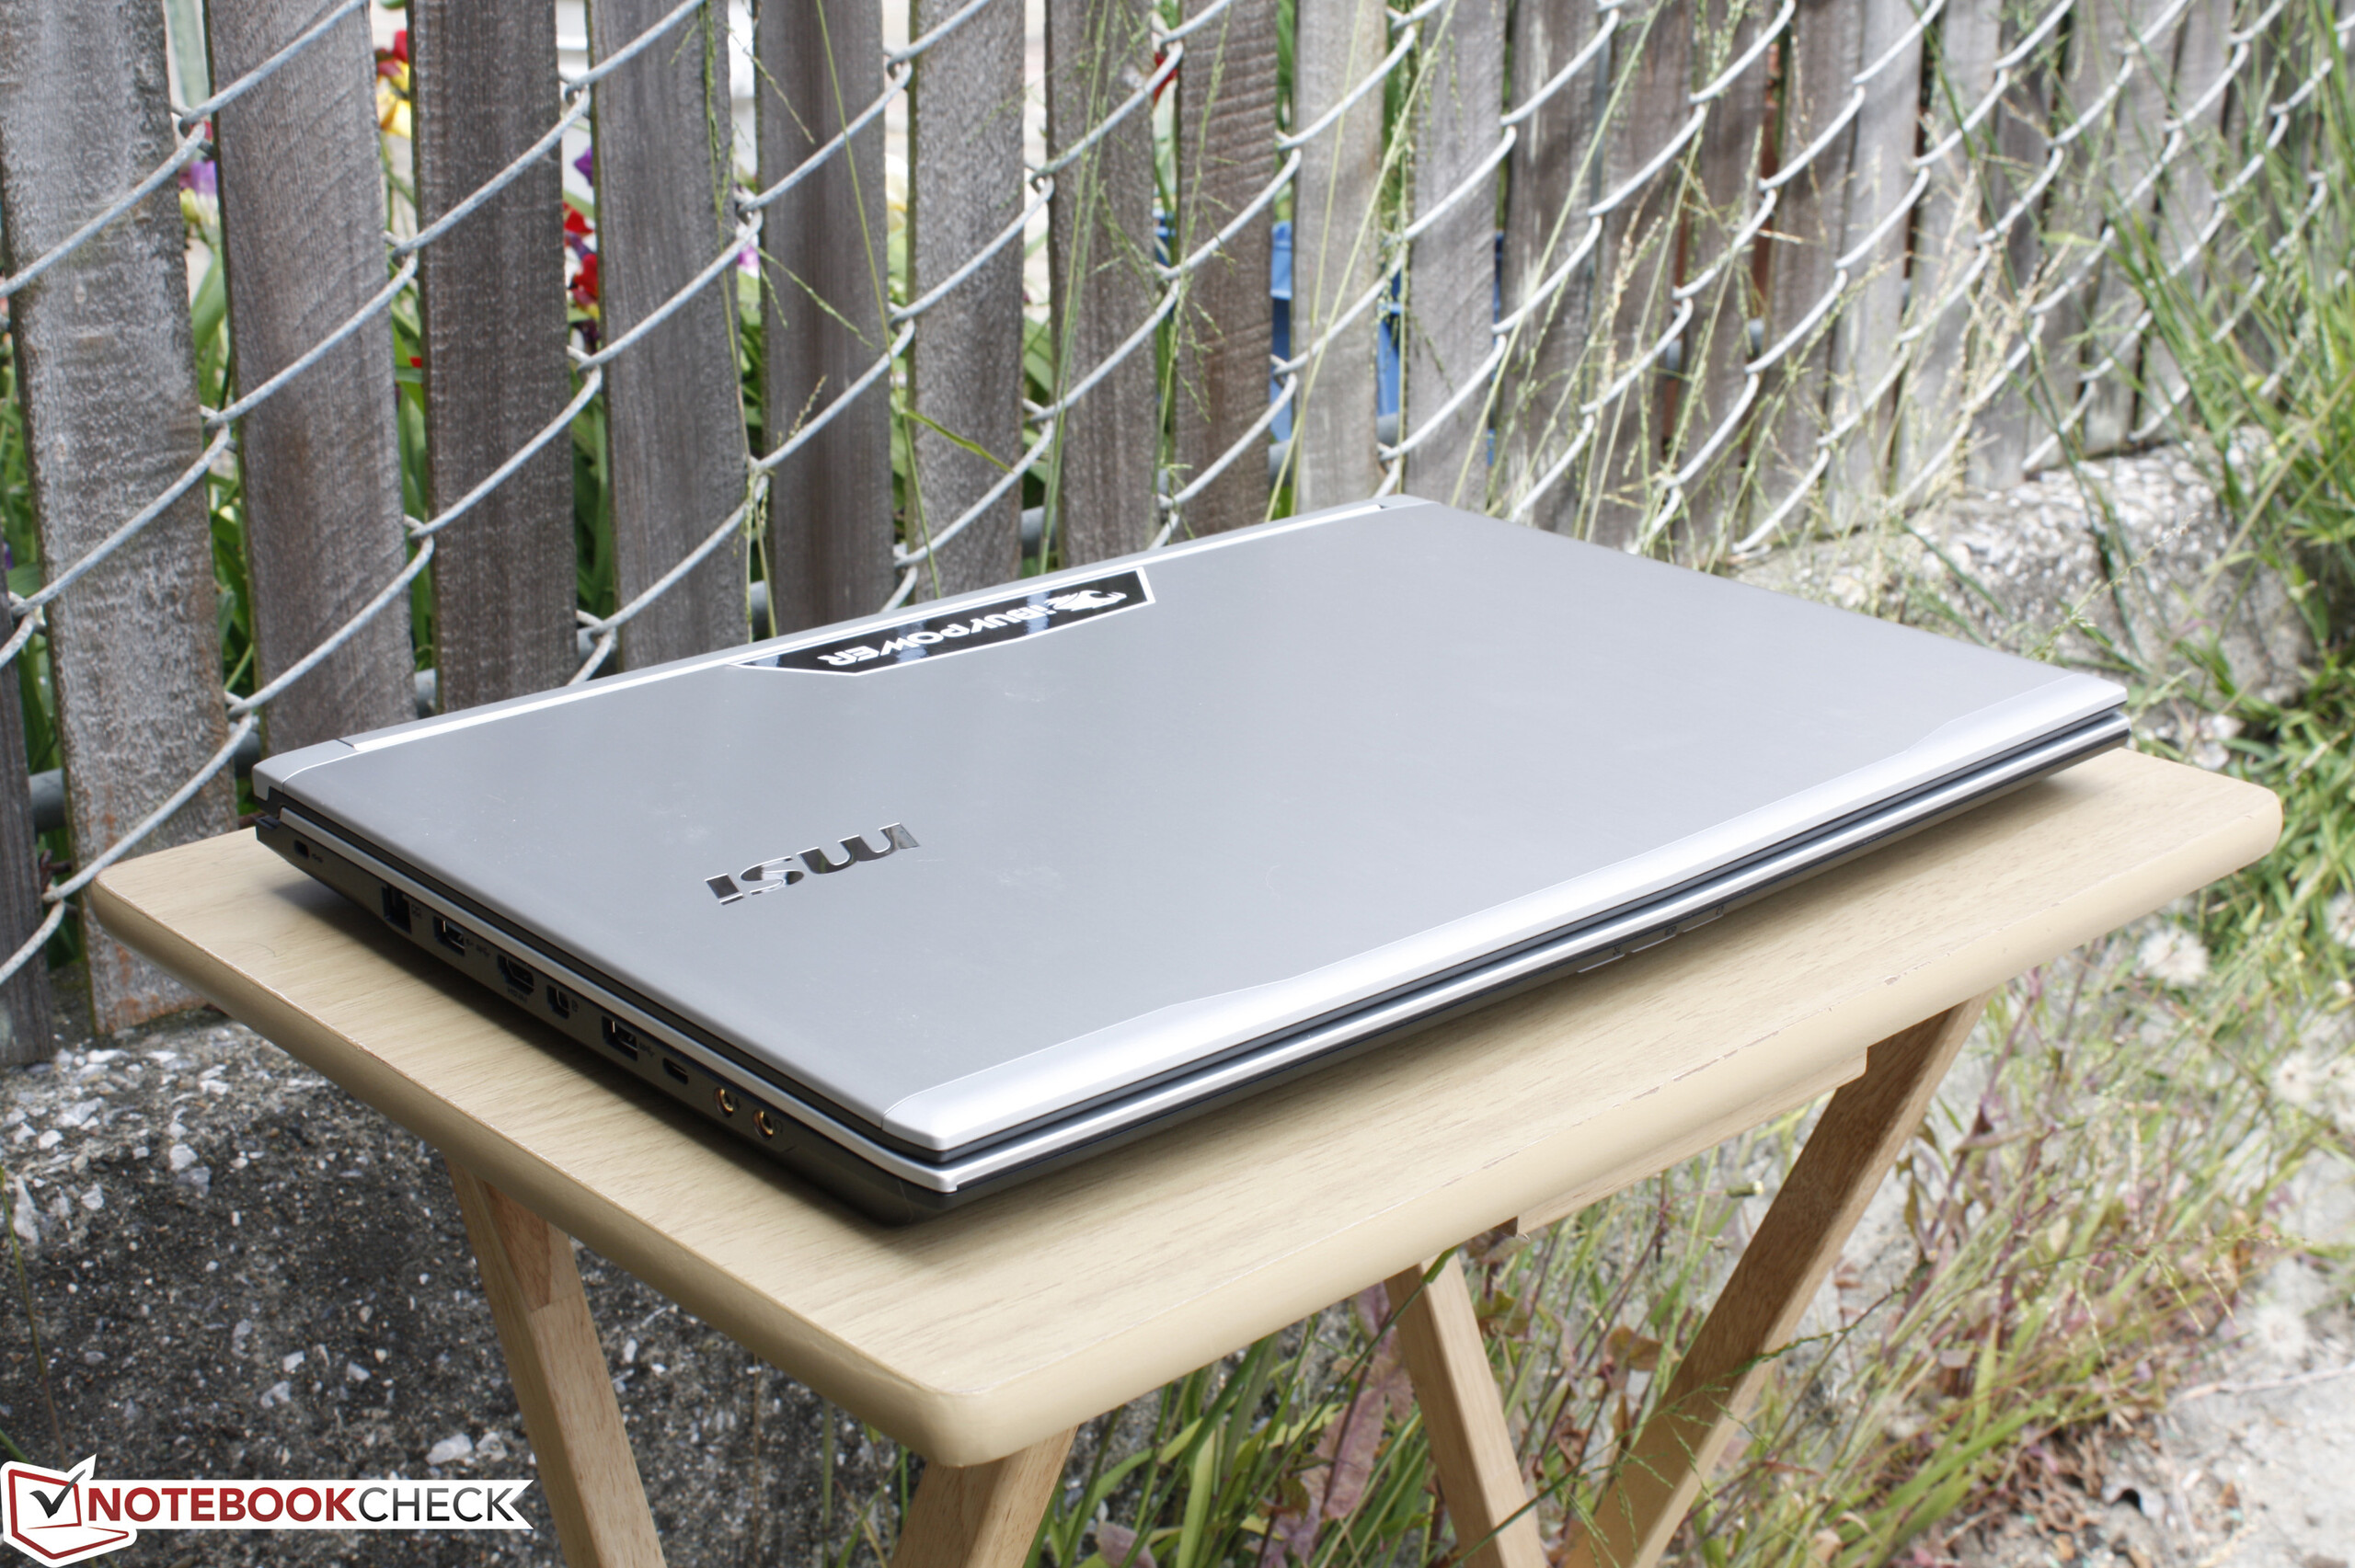
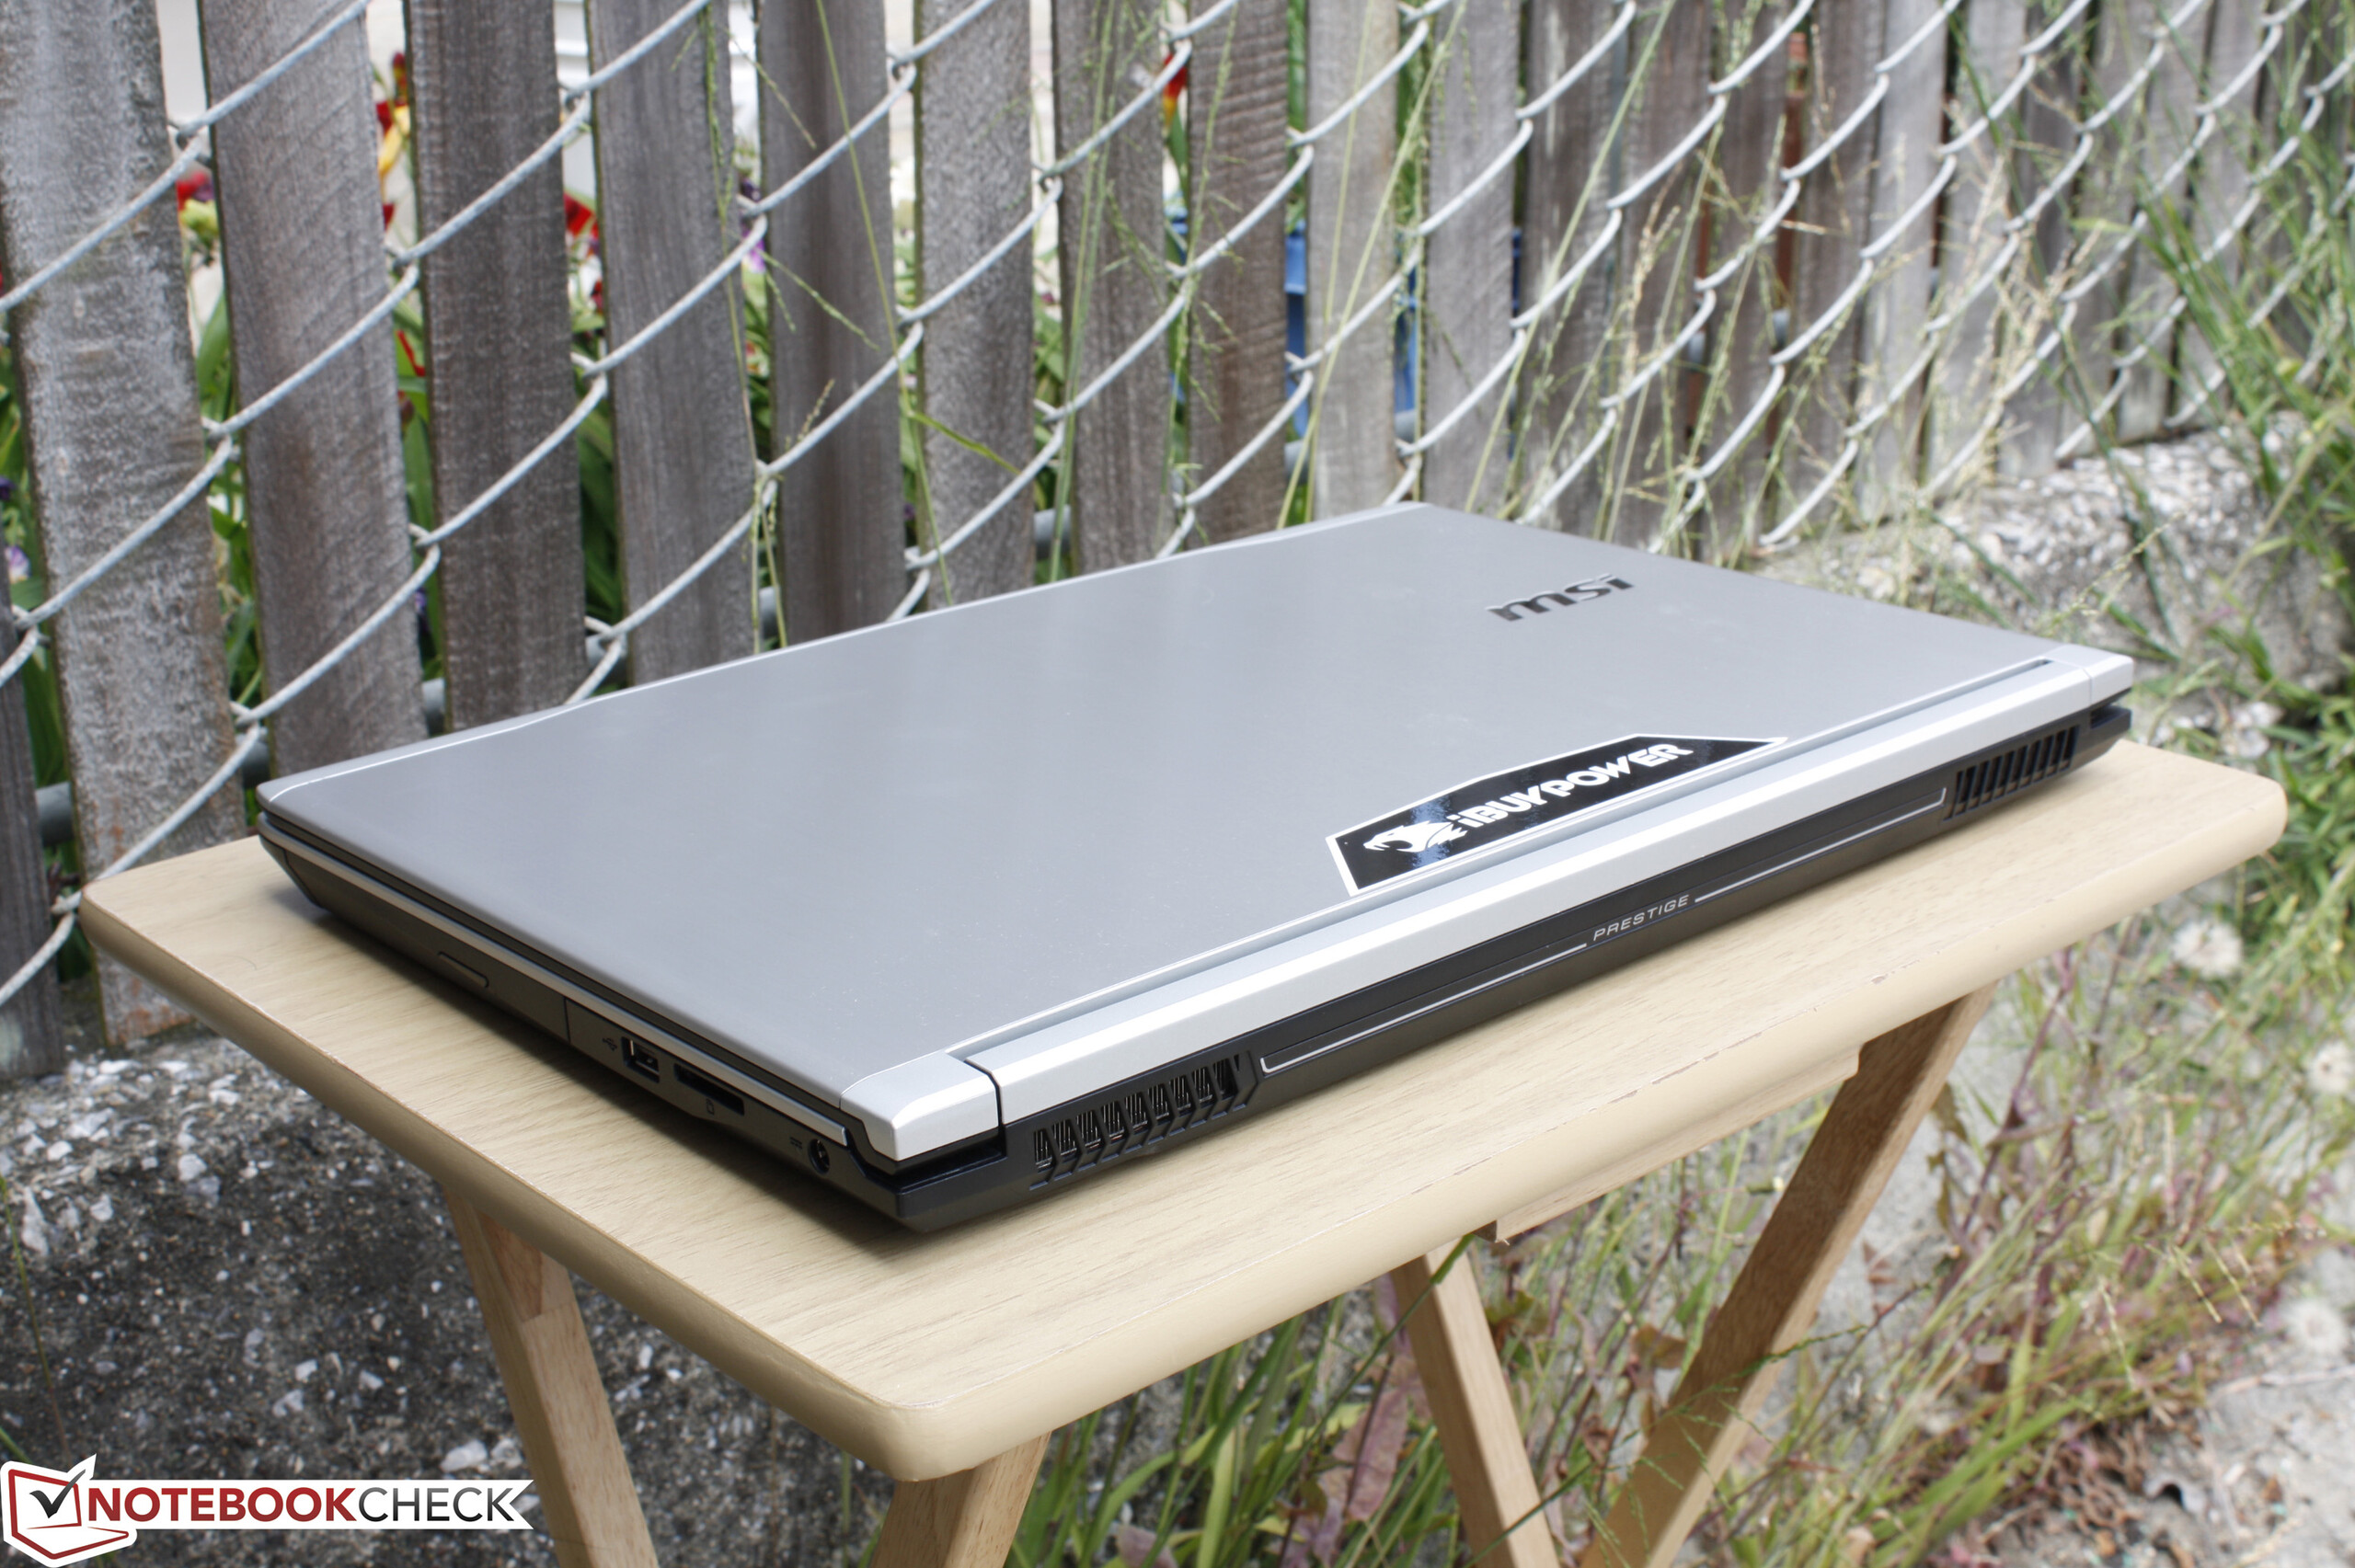
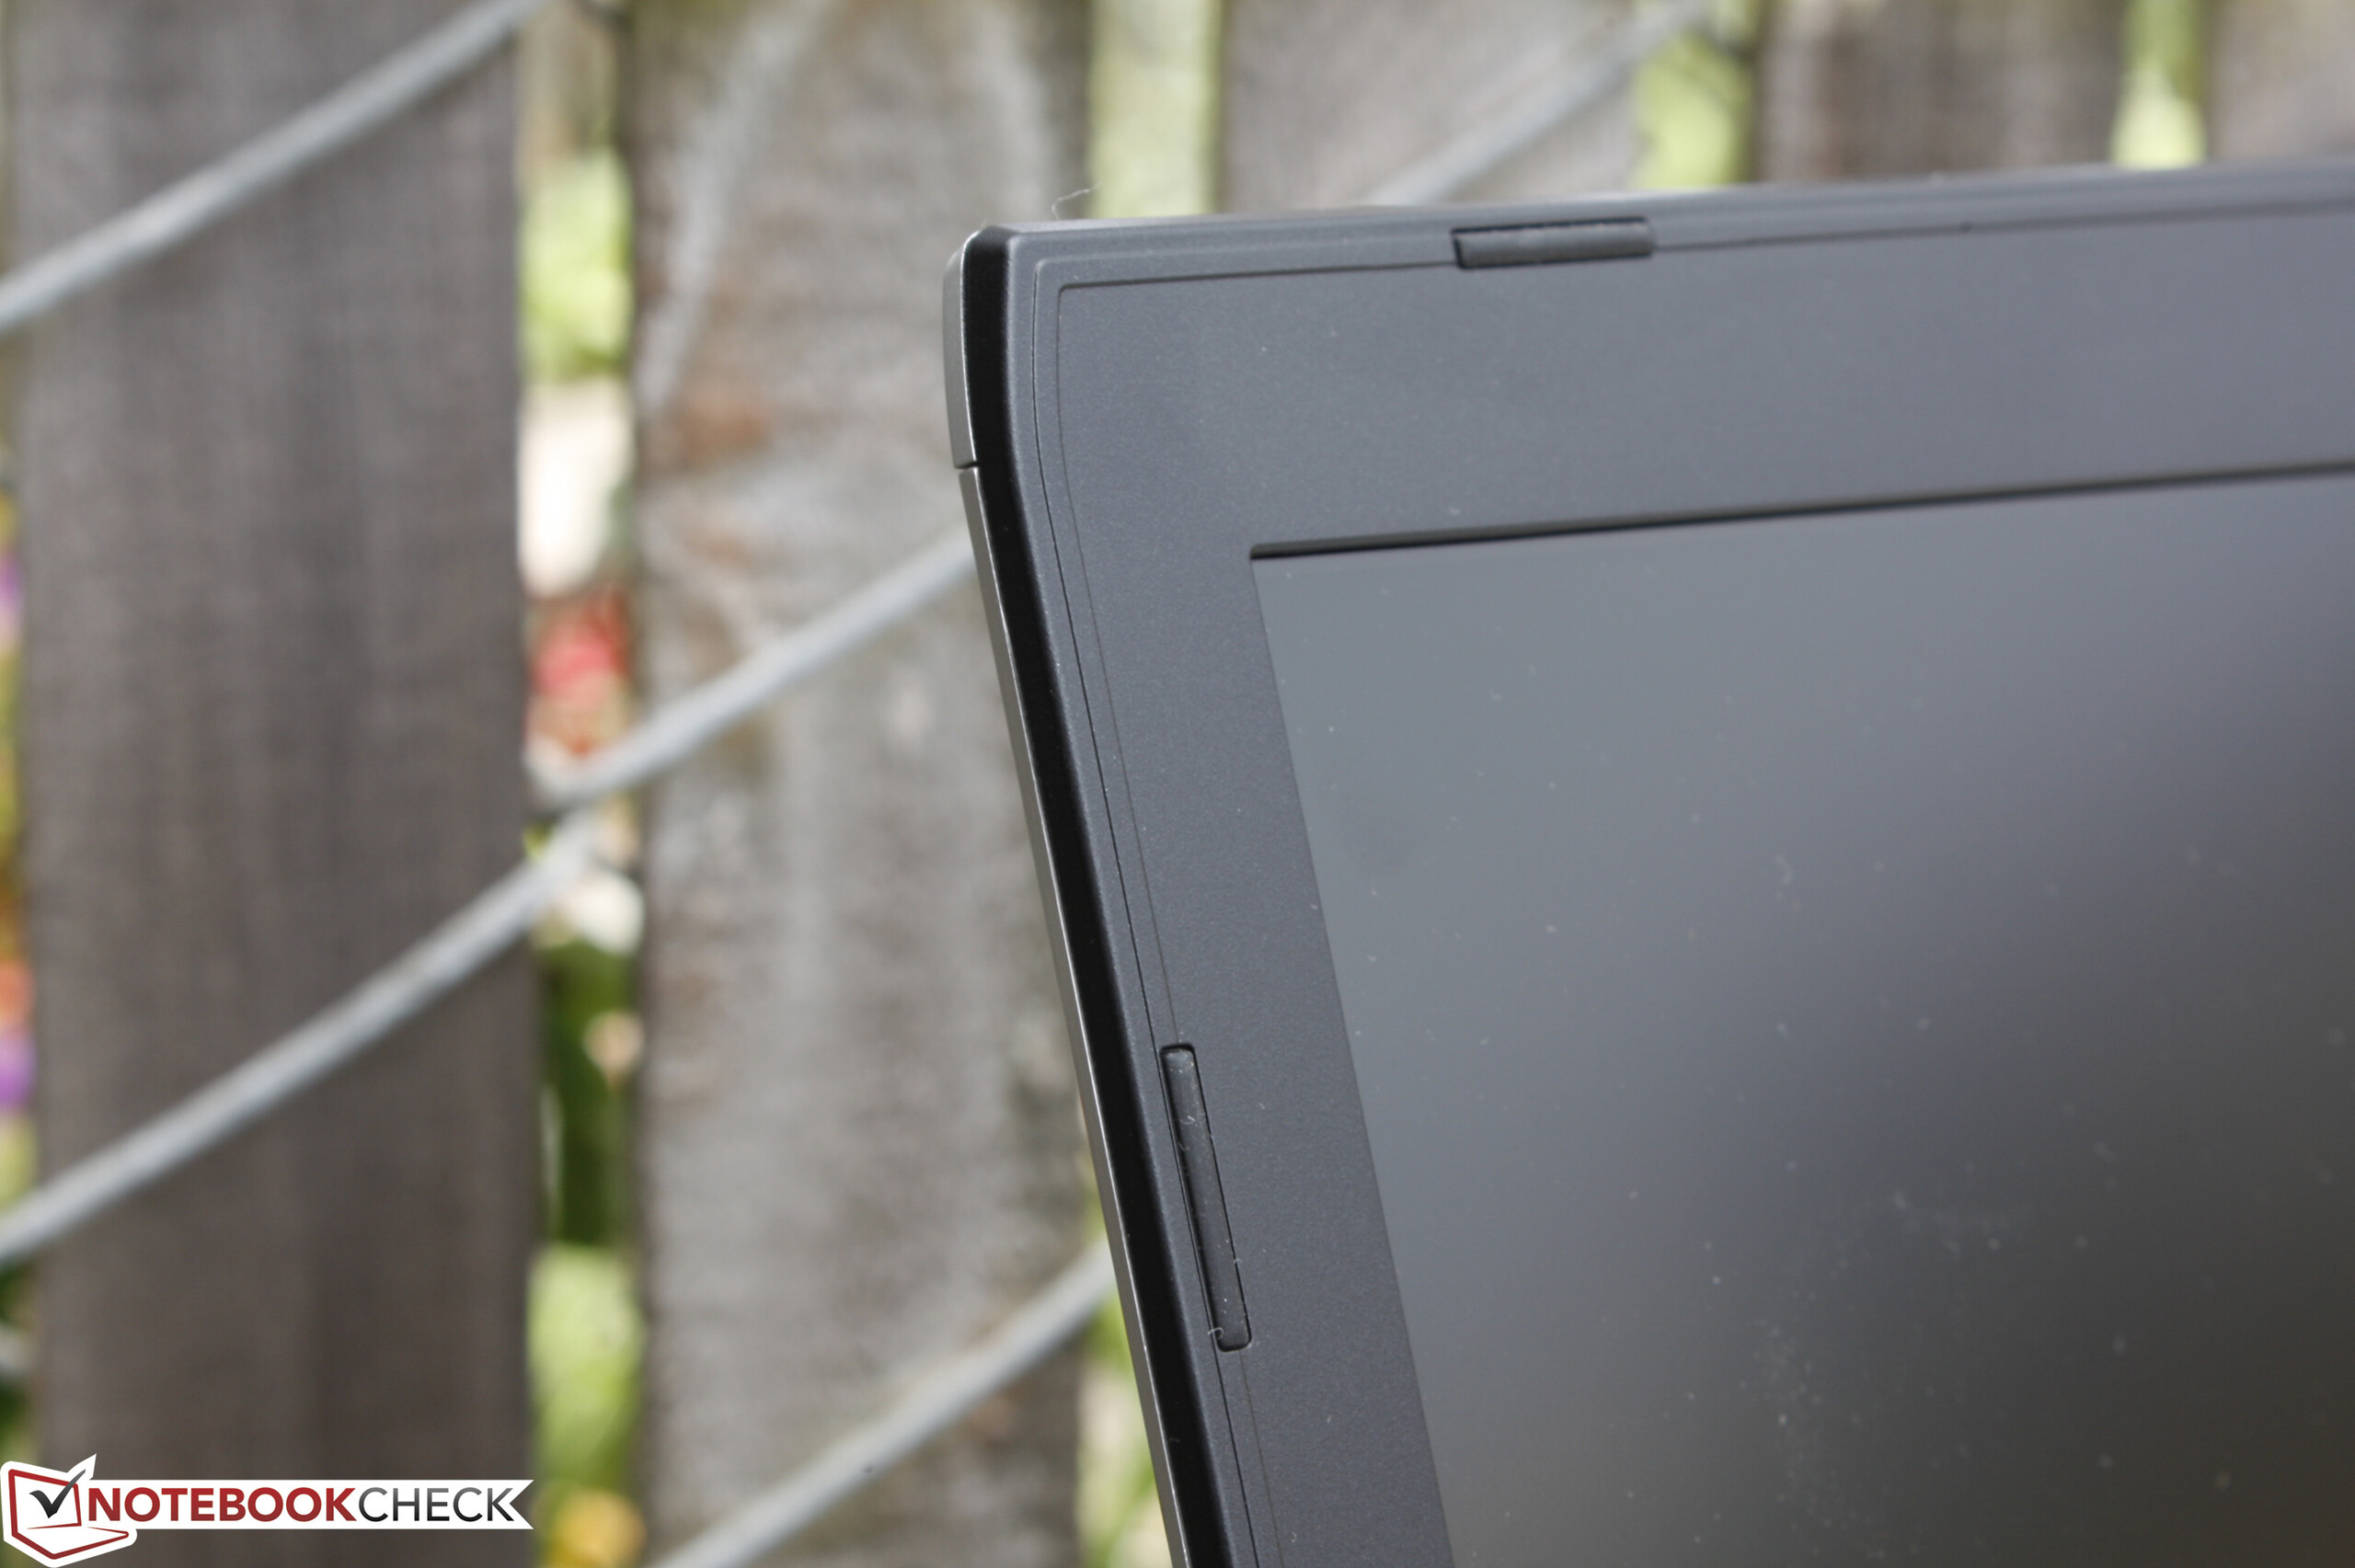
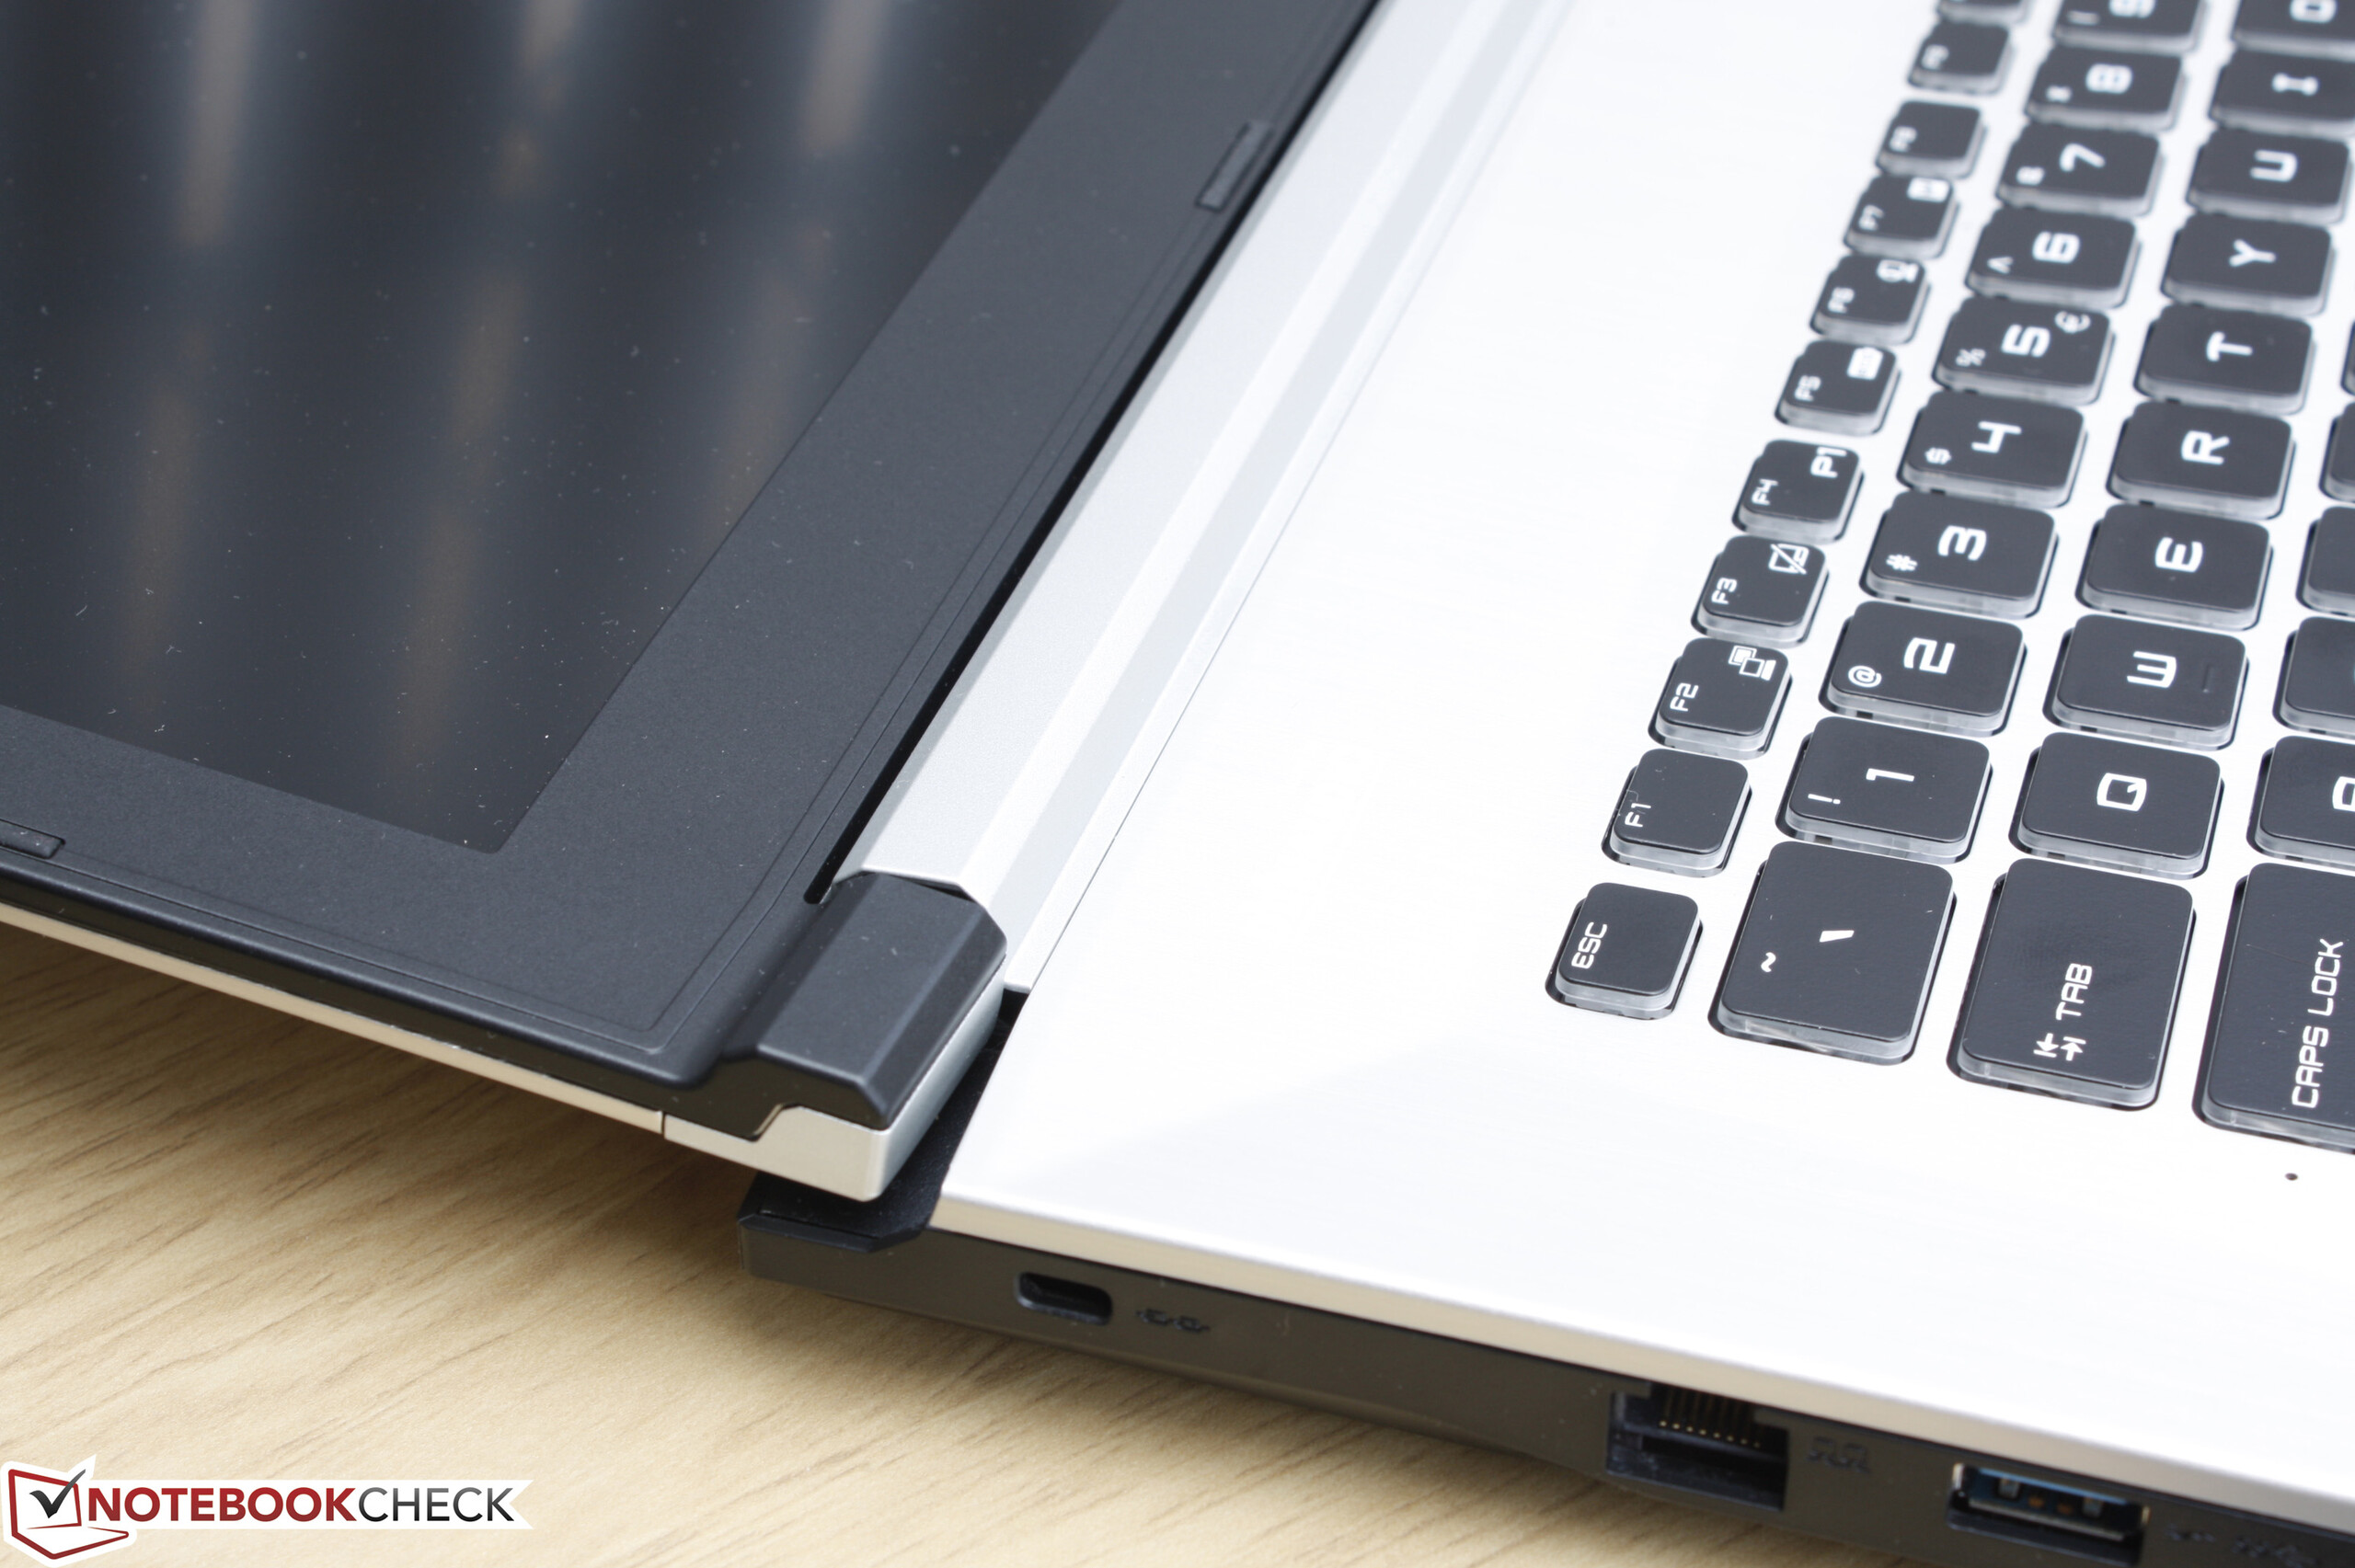
Tout comme ses petits frères et sœurs les PE60 et PX60, le PE70 Prestige devra offrir bien plus qu'un simple travail de peinture pour se démarquer des GE62 et GE72. À l'état actuel des choses, la série Prestige est presque inutile, sauf si les utilisateurs aiment étalonner leur écran ou préfèrent tout simplement l'extérieur argenté par rapport aux GE tout de noir vêtus. Le poids plus faible peut aider pour voyager, mais la luminosité est faible et l'autonomie relativement courte
Comme ordinateur portable multimédia, plus silencieux, plus endurant, et offrant dans l'ensemble de meilleures options, il faudra plutôt aller voir du côté des Lenovo Y700, Acer Aspire Nitro, ou Asus GL771. Ces modèles sont plus lourds que le MSI, mais ils sont meilleurs que le MSI sur de nombreux points, les rendant plus faciles à vous recommander.
Pour plus de détails, vous trouverez la version complète (en anglais) de ce test ici.
MSI Prestige PE70 6QE-055XUS
- 05/16/2016 v5.1 (old)
Allen Ngo
Price comparison
