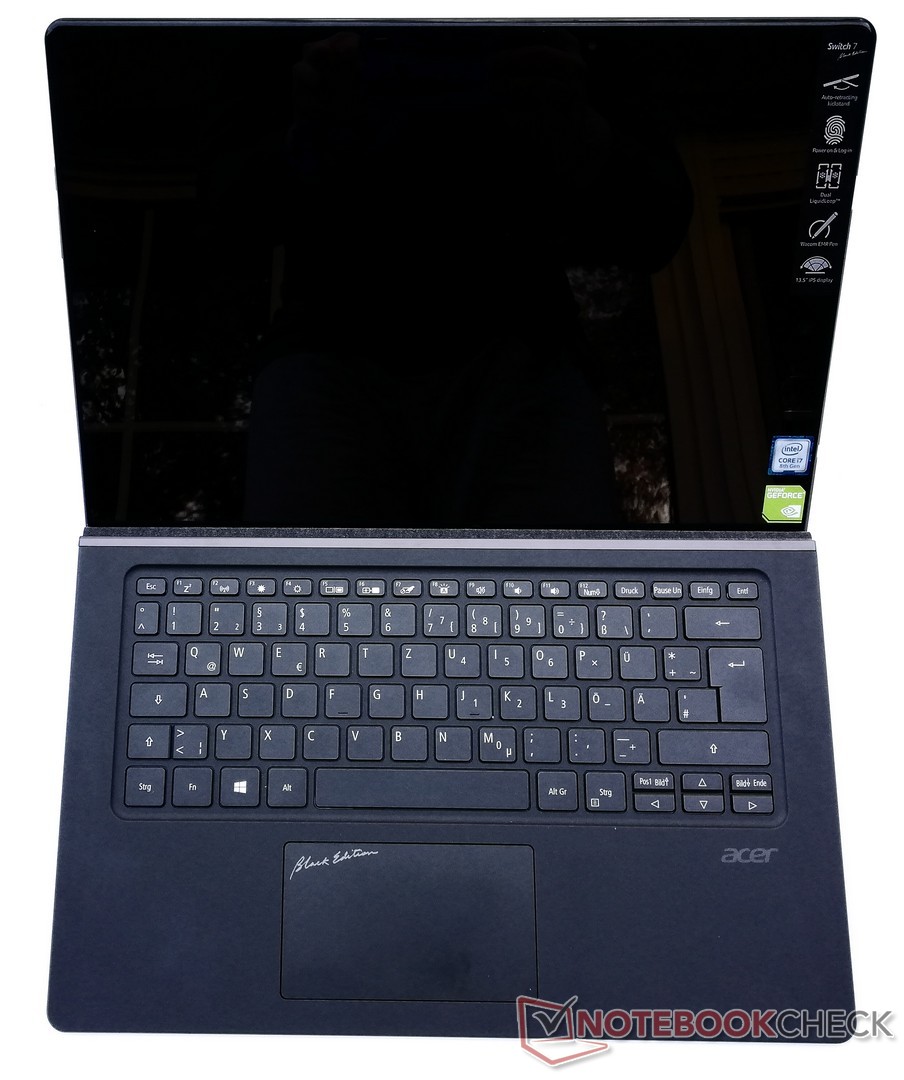
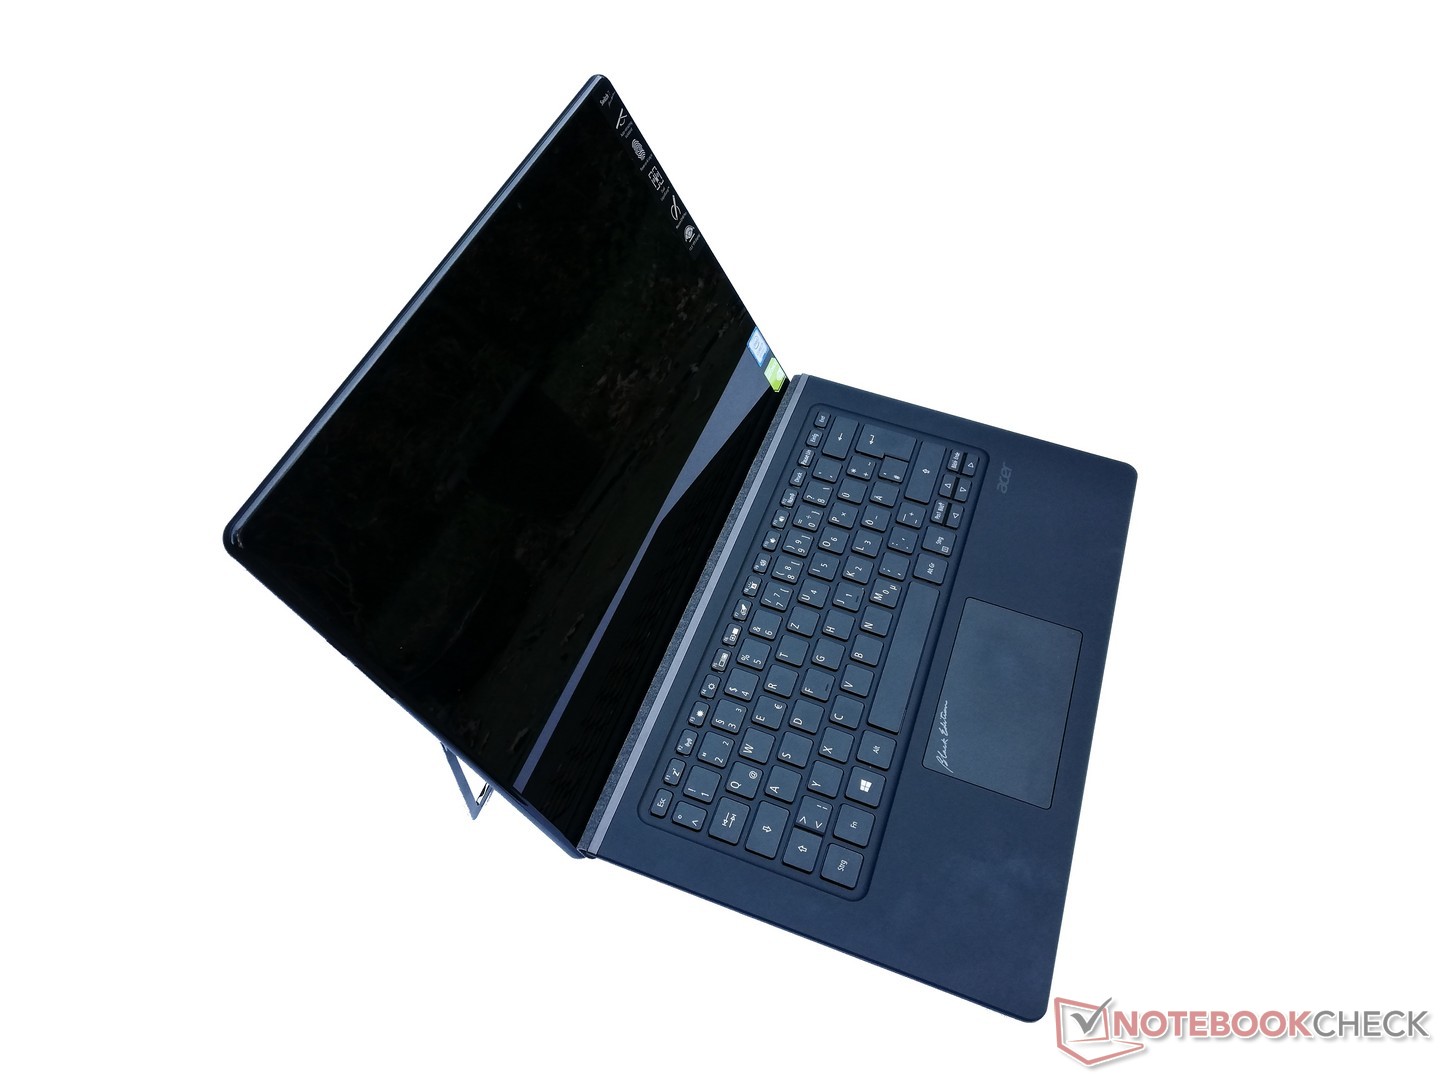
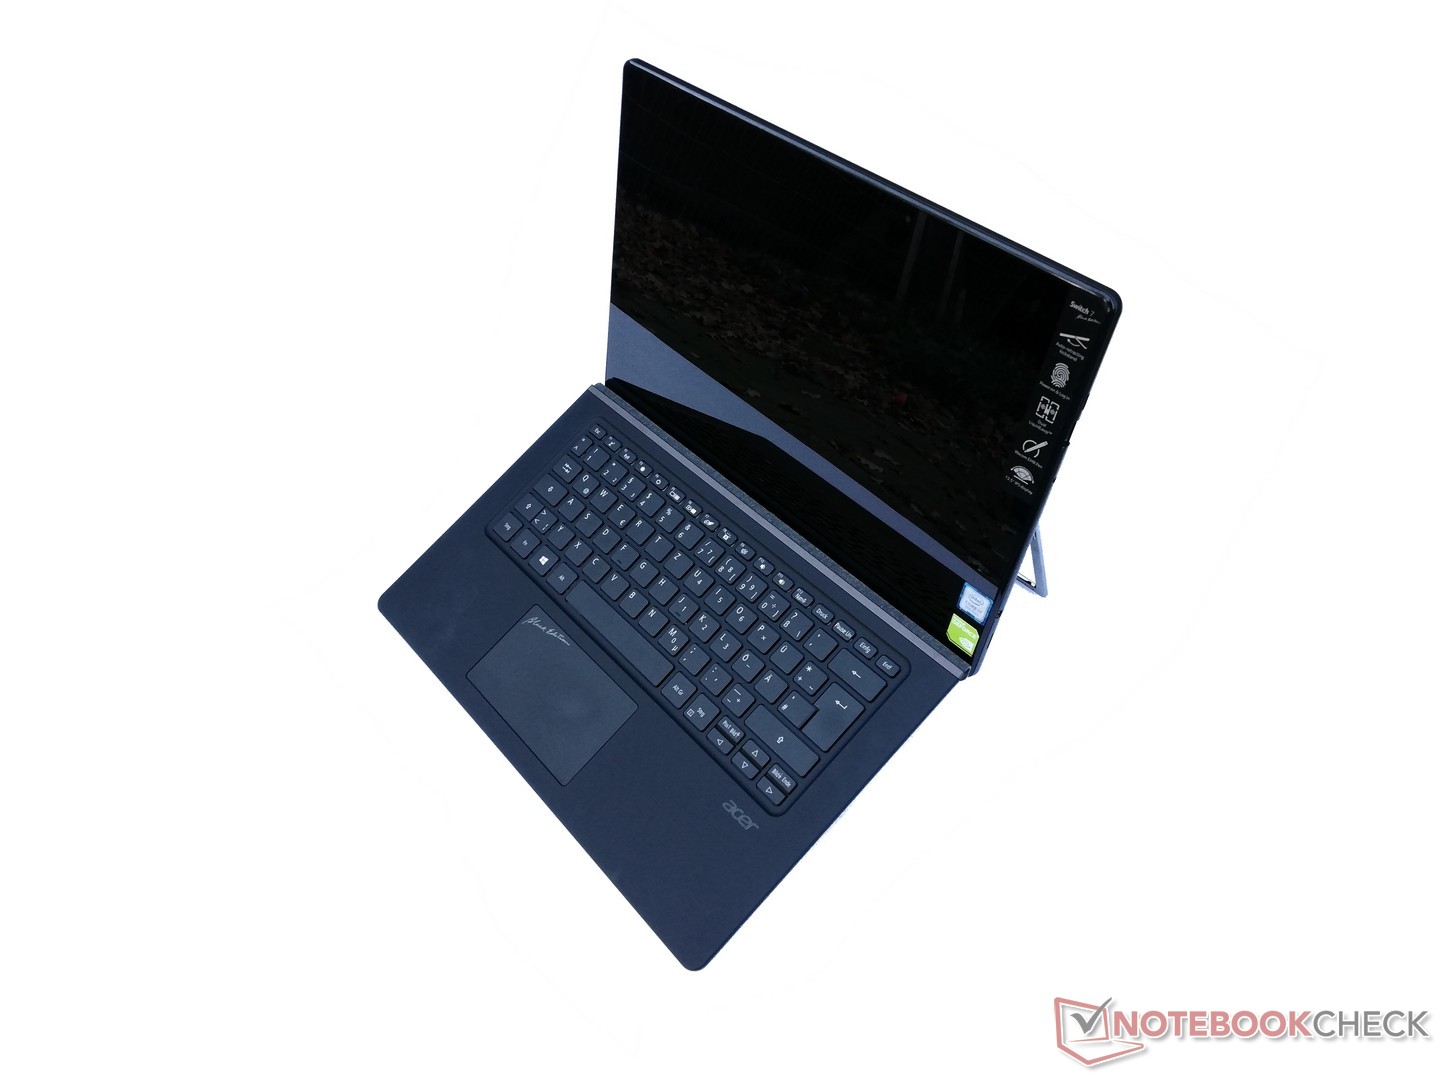
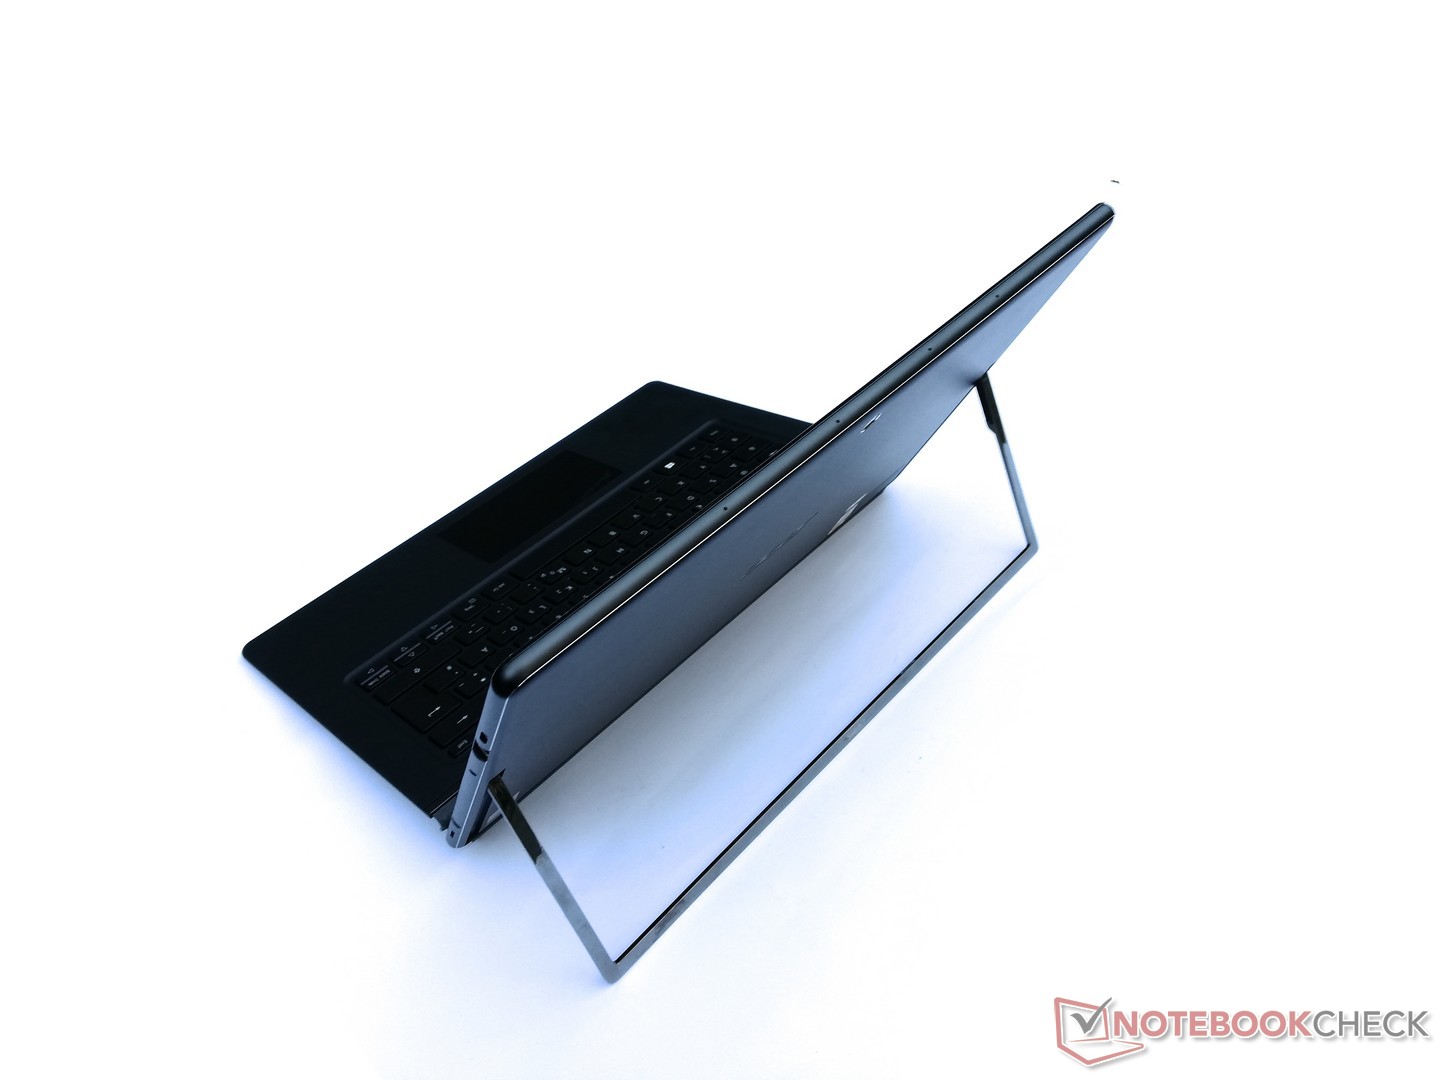
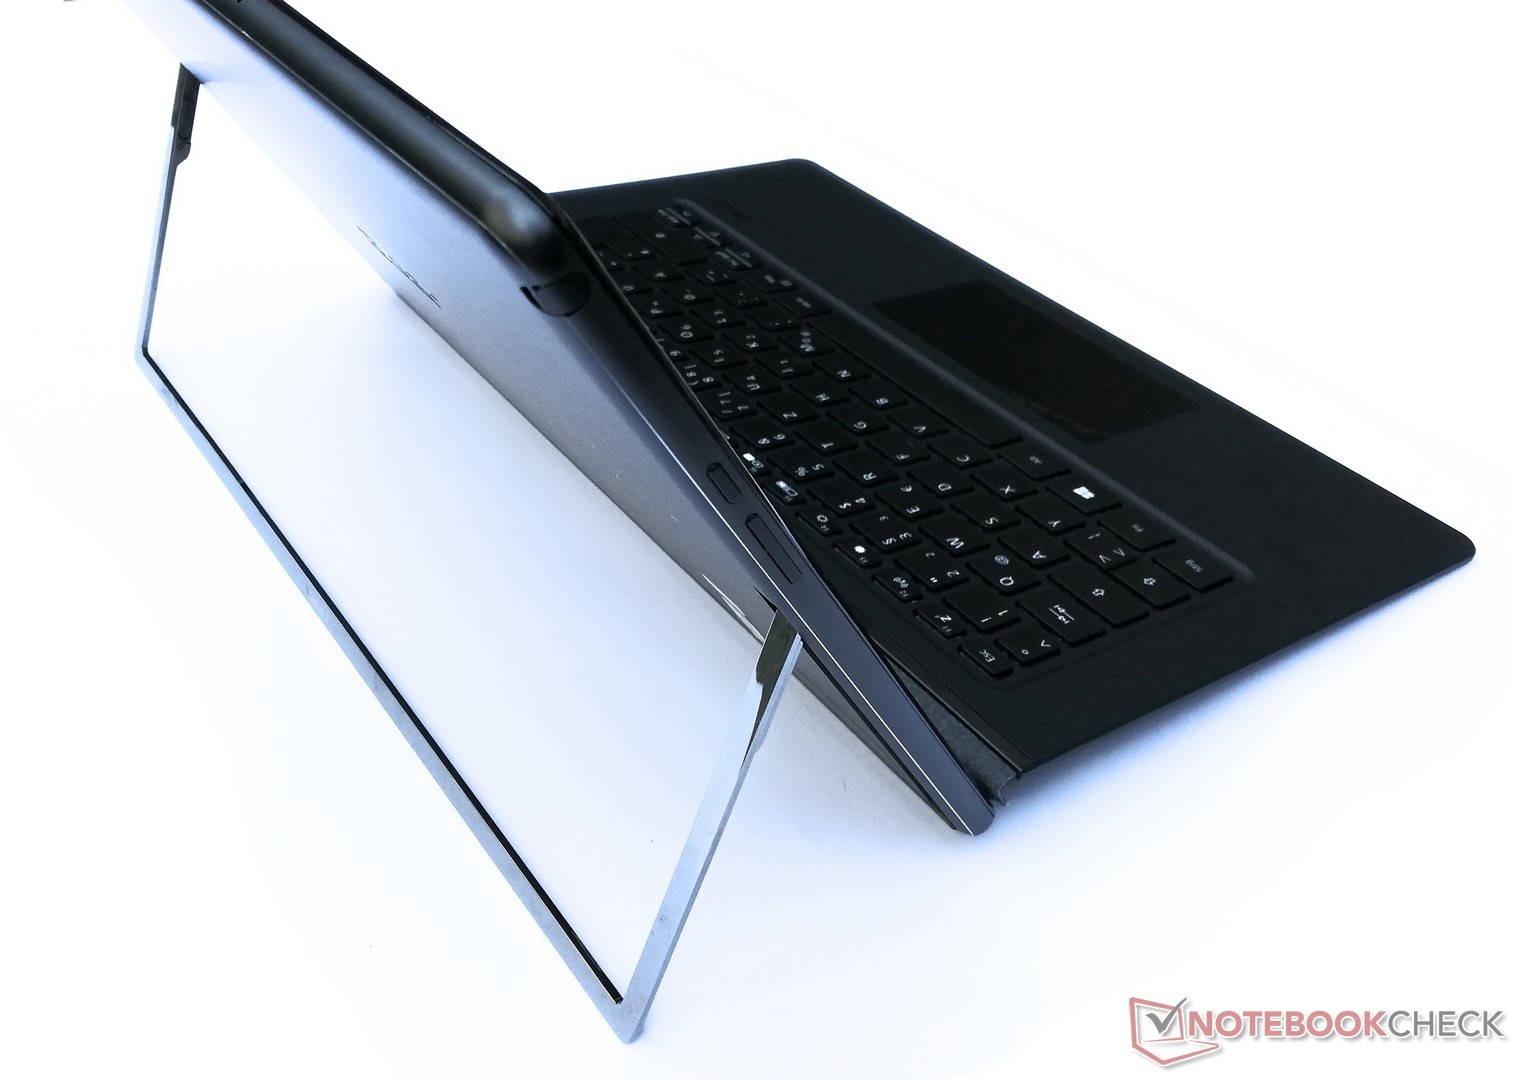
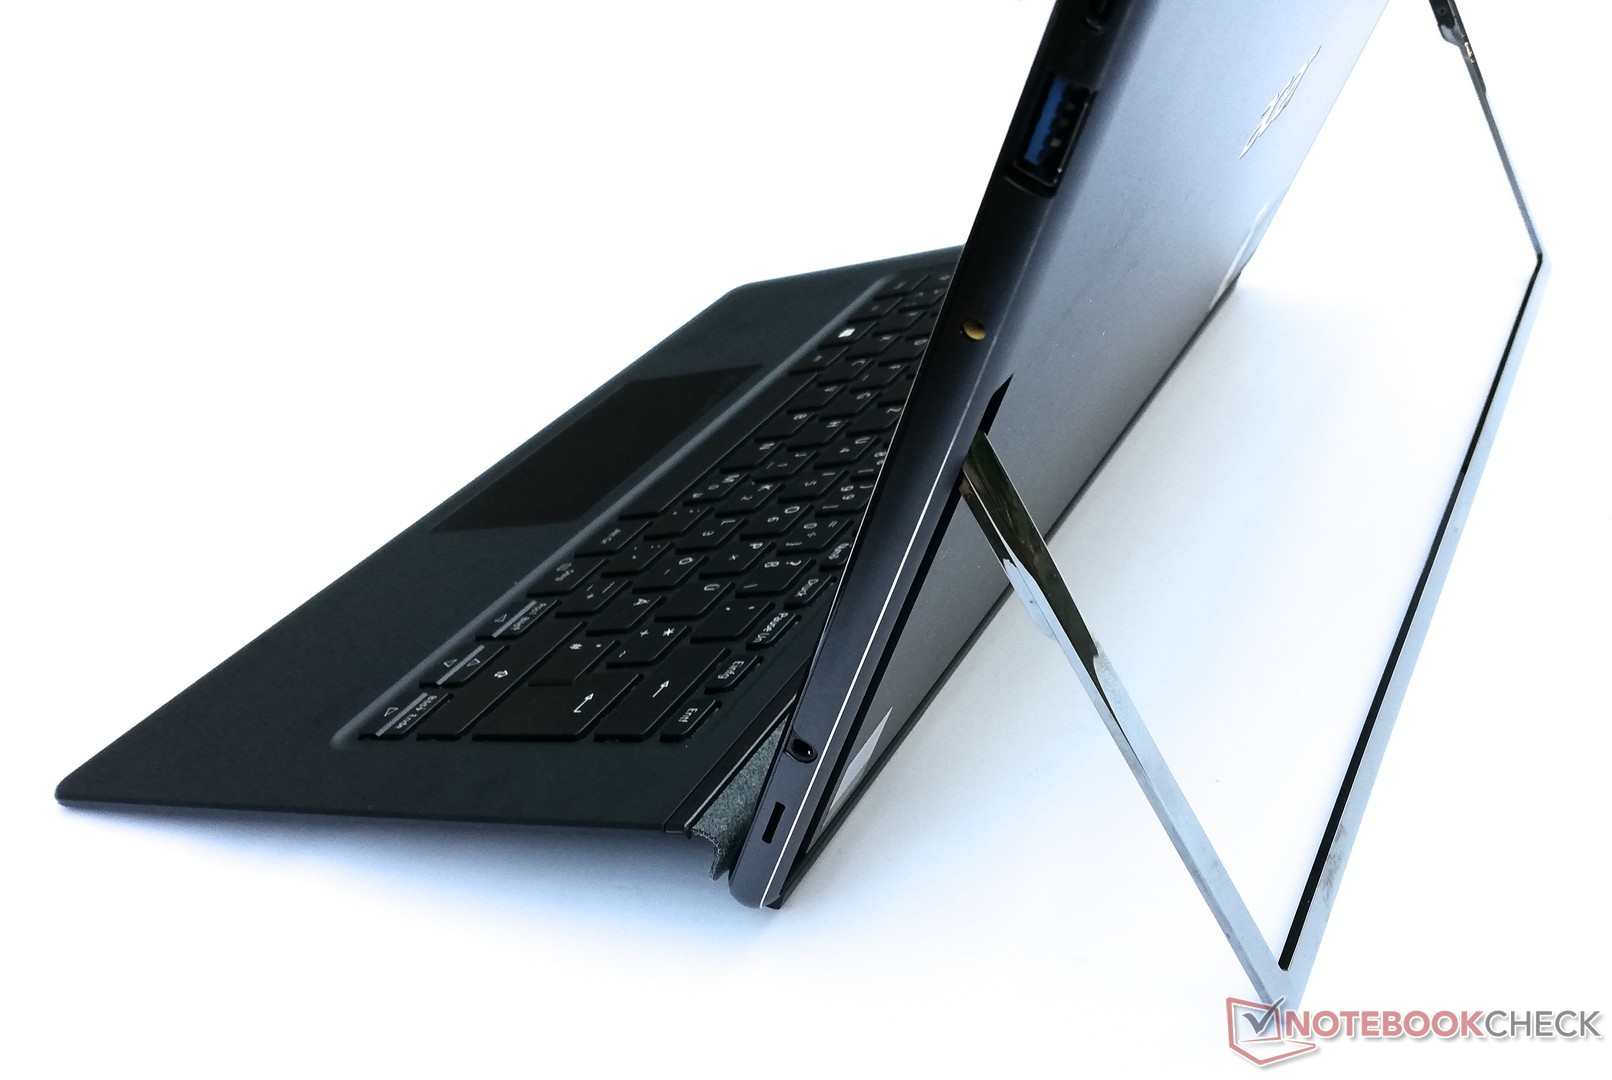
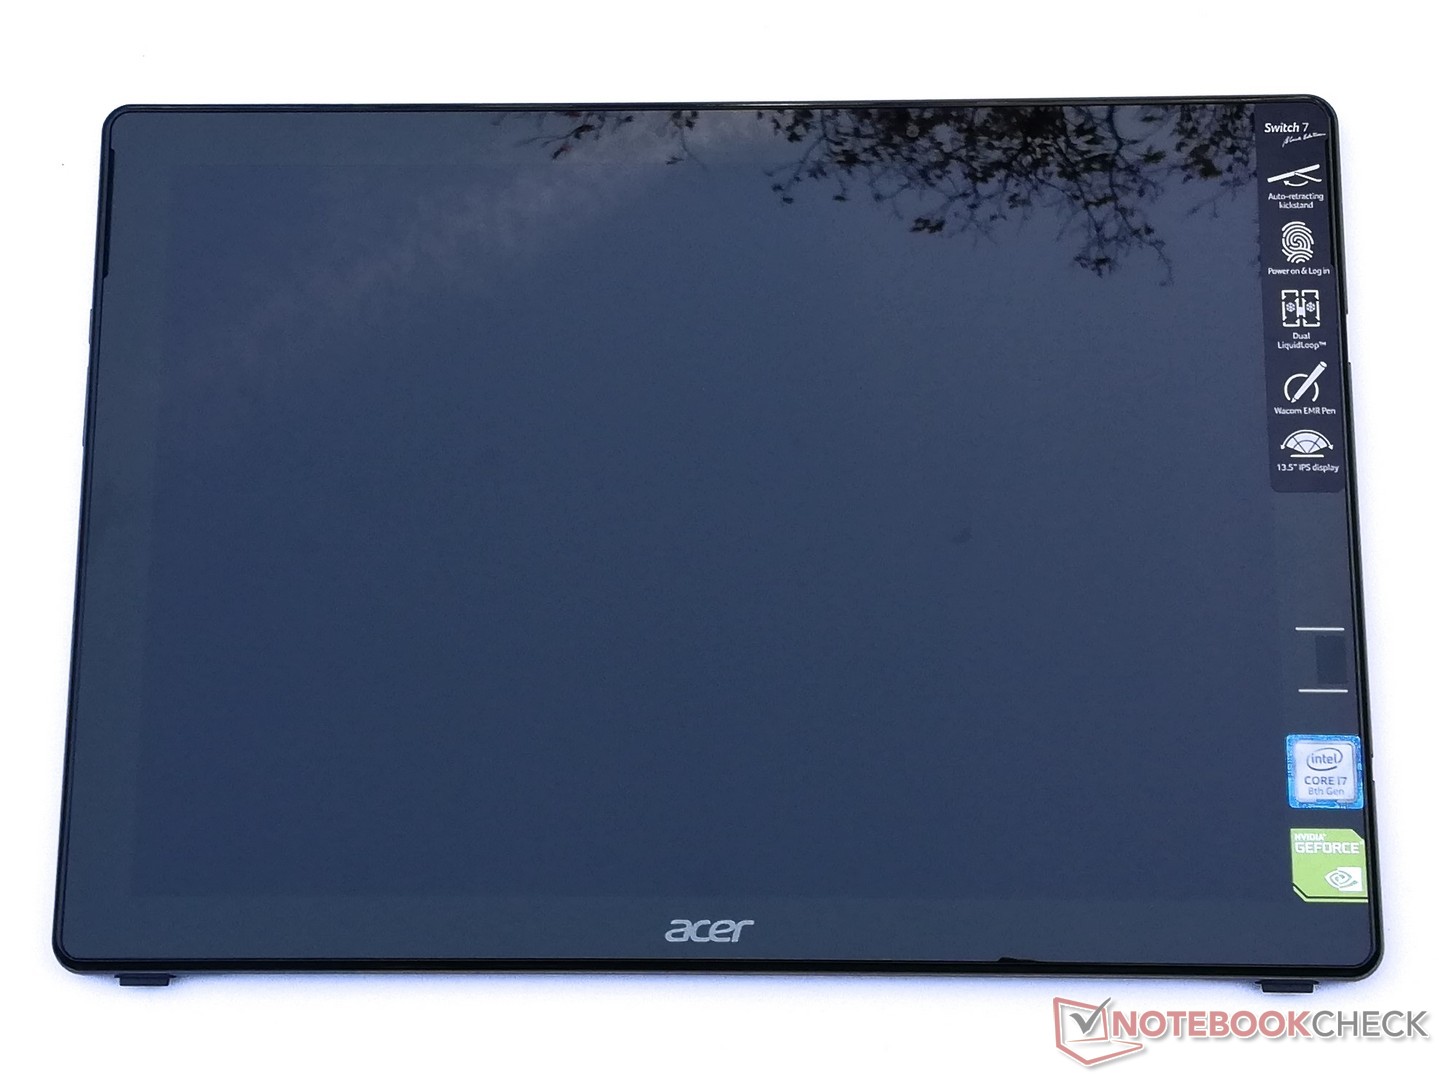
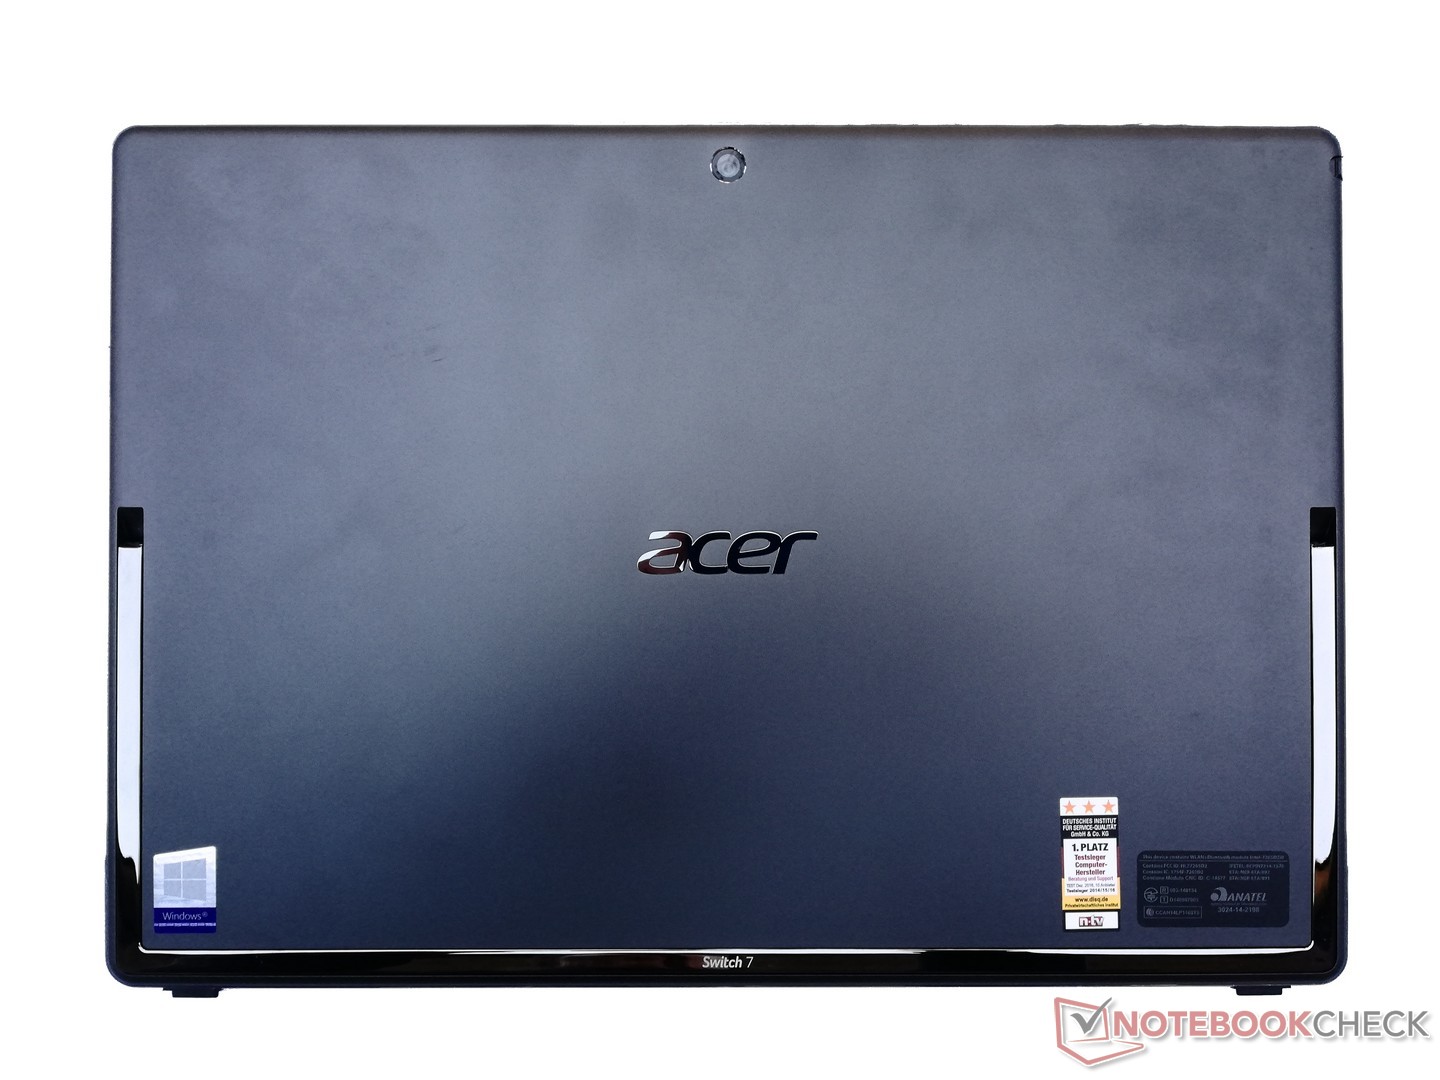
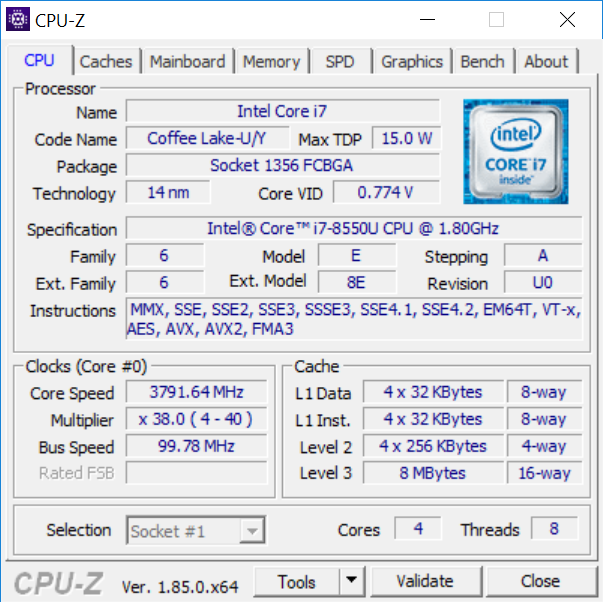
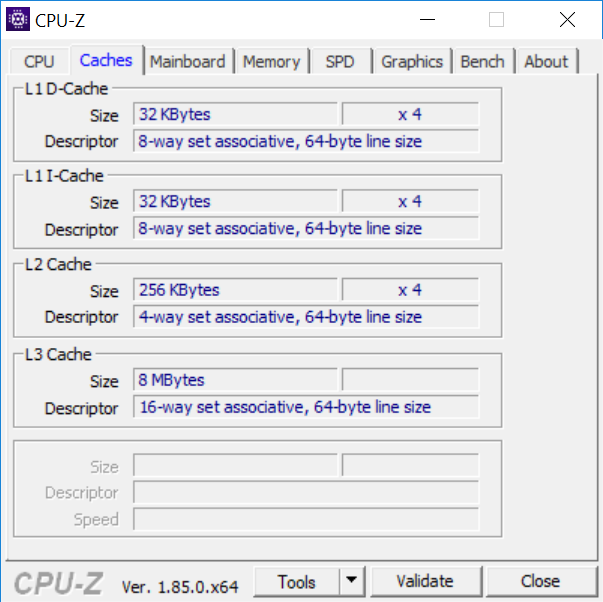
Courte critique du convertible Acer Switch 7 Black Edition (i7-8550U, MX150)


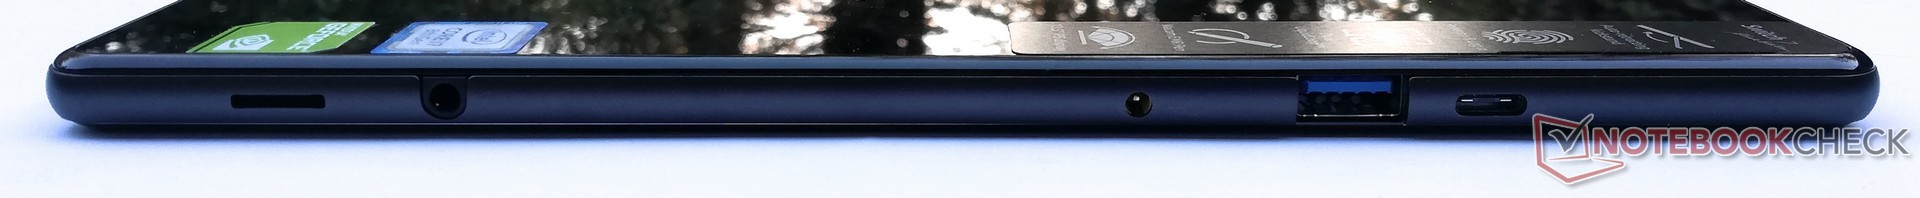
| SD Card Reader | |
| average JPG Copy Test (av. of 3 runs) | |
| Lenovo ThinkPad X1 Yoga 2018-20LES01W00 (Toshiba Exceria Pro M501) | |
| Microsoft Surface Pro 6, Core i7, 512 GB (Toshiba Exceria Pro M501 microSDXC 64GB) | |
| Fujitsu Stylistic Q738 (Toshiba Exceria Pro M501 microSDXC 64GB) | |
| Acer Switch 7 BE SW713-51GNP (Toshiba Exceria Pro M501 microSDXC 64GB) | |
| Moyenne de la classe Convertible (28.1 - 197, n=23, 2 dernières années) | |
| maximum AS SSD Seq Read Test (1GB) | |
| Lenovo ThinkPad X1 Yoga 2018-20LES01W00 (Toshiba Exceria Pro M501) | |
| Moyenne de la classe Convertible (28.9 - 254, n=22, 2 dernières années) | |
| Microsoft Surface Pro 6, Core i7, 512 GB (Toshiba Exceria Pro M501 microSDXC 64GB) | |
| Acer Switch 7 BE SW713-51GNP (Toshiba Exceria Pro M501 microSDXC 64GB) | |
| Fujitsu Stylistic Q738 (Toshiba Exceria Pro M501 microSDXC 64GB) | |
| |||||||||||||||||||||||||
Homogénéité de la luminosité: 82 %
Valeur mesurée au centre, sur batterie: 379 cd/m²
Contraste: 868:1 (Valeurs des noirs: 0.44 cd/m²)
ΔE ColorChecker Calman: 6.23 | ∀{0.5-29.43 Ø4.73}
calibrated: 2.62
ΔE Greyscale Calman: 8.34 | ∀{0.09-98 Ø4.97}
95% sRGB (Argyll 1.6.3 3D)
61% AdobeRGB 1998 (Argyll 1.6.3 3D)
66.1% AdobeRGB 1998 (Argyll 3D)
94.8% sRGB (Argyll 3D)
66.4% Display P3 (Argyll 3D)
Gamma: 2.43
CCT: 7853 K
| Acer Switch 7 BE SW713-51GNP KL.1350W.001, , 2256x1504, 13.5" | Microsoft Surface Pro 6, Core i7, 512 GB LGPhilips LP123WQ112604, , 2736x1824, 12.3" | HP Elite x2 1013 G3-2TT14EA AU Optronics AUO101A, , 3000x2000, 13" | Lenovo ThinkPad X1 Yoga 2018-20LES01W00 Lenovo 40AE / B140QAN02.0, , 2560x1440, 14" | Fujitsu Stylistic Q738 Sharp SHP149B, , 1920x1080, 13.3" | |
|---|---|---|---|---|---|
| Display | 2% | 2% | 28% | 3% | |
| Display P3 Coverage (%) | 66.4 | 67.1 1% | 67.5 2% | 86.5 30% | 67.8 2% |
| sRGB Coverage (%) | 94.8 | 95.5 1% | 96.7 2% | 100 5% | 96.6 2% |
| AdobeRGB 1998 Coverage (%) | 66.1 | 67.9 3% | 68.2 3% | 99.4 50% | 69.4 5% |
| Response Times | 32% | 28% | 22% | 43% | |
| Response Time Grey 50% / Grey 80% * (ms) | 59 ? | 43 ? 27% | 47 ? 20% | 56.8 ? 4% | 35 ? 41% |
| Response Time Black / White * (ms) | 40 ? | 25 ? 37% | 26 ? 35% | 24 ? 40% | 22 ? 45% |
| PWM Frequency (Hz) | 22000 ? | 208 ? | |||
| Screen | 32% | 19% | 46% | 14% | |
| Brightness middle (cd/m²) | 382 | 484 27% | 452 18% | 562 47% | 292 -24% |
| Brightness (cd/m²) | 344 | 473 38% | 412 20% | 522 52% | 277 -19% |
| Brightness Distribution (%) | 82 | 91 11% | 85 4% | 86 5% | 90 10% |
| Black Level * (cd/m²) | 0.44 | 0.33 25% | 0.48 -9% | 0.3 32% | 0.32 27% |
| Contrast (:1) | 868 | 1467 69% | 942 9% | 1873 116% | 913 5% |
| Colorchecker dE 2000 * | 6.23 | 4.29 31% | 4.05 35% | 2.8 55% | 3.69 41% |
| Colorchecker dE 2000 max. * | 12.41 | 6.46 48% | 6.64 46% | 5.8 53% | 6.9 44% |
| Colorchecker dE 2000 calibrated * | 2.62 | 1.34 49% | 1.56 40% | ||
| Greyscale dE 2000 * | 8.34 | 4.3 48% | 4.87 42% | 4.5 46% | 4.11 51% |
| Gamma | 2.43 91% | 2.51 88% | 2.71 81% | 2.16 102% | 2.3 96% |
| CCT | 7853 83% | 7315 89% | 7160 91% | 7205 90% | 7140 91% |
| Color Space (Percent of AdobeRGB 1998) (%) | 61 | 62 2% | 62 2% | 88.9 46% | 63 3% |
| Color Space (Percent of sRGB) (%) | 95 | 95 0% | 97 2% | 100 5% | 97 2% |
| Moyenne finale (programmes/paramètres) | 22% /
26% | 16% /
17% | 32% /
39% | 20% /
16% |
* ... Moindre est la valeur, meilleures sont les performances
Temps de réponse de l'écran
| ↔ Temps de réponse noir à blanc | ||
|---|---|---|
| 40 ms ... hausse ↗ et chute ↘ combinées | ↗ 22 ms hausse | 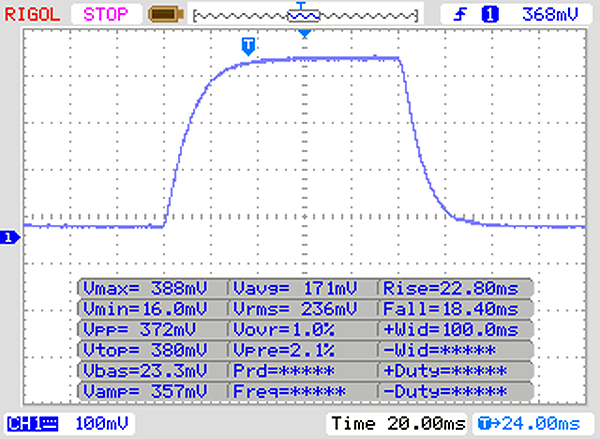 |
| ↘ 18 ms chute | ||
| L'écran souffre de latences très élevées, à éviter pour le jeu. En comparaison, tous les appareils testés affichent entre 0.1 (minimum) et 240 (maximum) ms. » 97 % des appareils testés affichent de meilleures performances. Cela signifie que les latences relevées sont moins bonnes que la moyenne (19.9 ms) de tous les appareils testés. | ||
| ↔ Temps de réponse gris 50% à gris 80% | ||
| 59 ms ... hausse ↗ et chute ↘ combinées | ↗ 29 ms hausse | 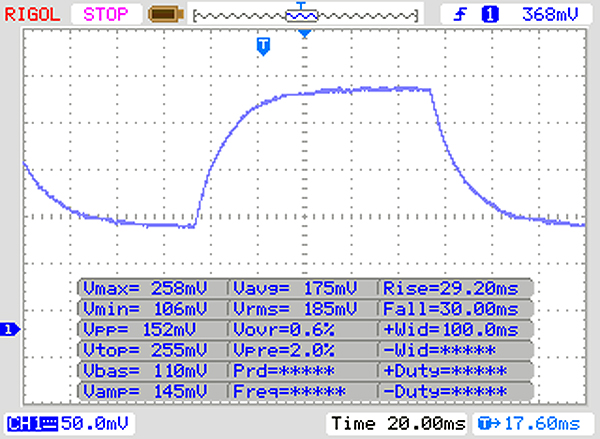 |
| ↘ 30 ms chute | ||
| L'écran souffre de latences très élevées, à éviter pour le jeu. En comparaison, tous les appareils testés affichent entre 0.165 (minimum) et 636 (maximum) ms. » 95 % des appareils testés affichent de meilleures performances. Cela signifie que les latences relevées sont moins bonnes que la moyenne (31.1 ms) de tous les appareils testés. | ||
Scintillement / MLI (Modulation de largeur d'impulsion)
| Scintillement / MLI (Modulation de largeur d'impulsion) non décelé | 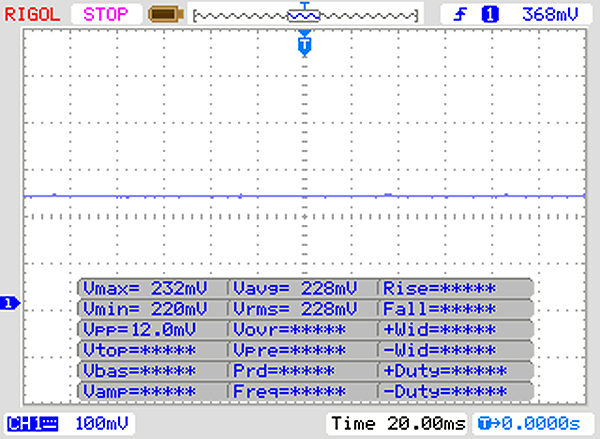 | ||
En comparaison, 52 % des appareils testés n'emploient pas MDI pour assombrir leur écran. Nous avons relevé une moyenne à 7801 (minimum : 5 - maximum : 343500) Hz dans le cas où une MDI était active. | |||
| PCMark 8 Home Score Accelerated v2 | 3306 points | |
| PCMark 8 Work Score Accelerated v2 | 4450 points | |
| PCMark 10 Score | 3056 points | |
Aide | ||
| Acer Switch 7 BE SW713-51GNP Liteonit CV3-SD512 | Microsoft Surface Pro 6, Core i7, 512 GB Toshiba KBG30ZPZ512G | HP Elite x2 1013 G3-2TT14EA Samsung PM961 MZVLW256HEHP | Lenovo ThinkPad X1 Yoga 2018-20LES01W00 Samsung SSD PM981 MZVLB512HAJQ | Fujitsu Stylistic Q738 Samsung SSD PM871b MZNLN256HAJQ | Moyenne Liteonit CV3-SD512 | |
|---|---|---|---|---|---|---|
| CrystalDiskMark 5.2 / 6 | 69% | 173% | 260% | 1% | 0% | |
| Write 4K (MB/s) | 61.4 | 83.2 36% | 91 48% | 138.8 126% | 79.5 29% | 61.4 ? 0% |
| Read 4K (MB/s) | 29.98 | 43.84 46% | 36.84 23% | 45.21 51% | 19.71 -34% | 30 ? 0% |
| Write Seq (MB/s) | 432.8 | 636 47% | 1197 177% | 1896 338% | 385.2 -11% | 433 ? 0% |
| Read Seq (MB/s) | 448 | 900 101% | 1705 281% | 2070 362% | 435.9 -3% | 448 ? 0% |
| Write 4K Q32T1 (MB/s) | 226.7 | 192.9 -15% | 355.8 57% | 483.3 113% | 222.4 -2% | 227 ? 0% |
| Read 4K Q32T1 (MB/s) | 302.2 | 247.4 -18% | 256.9 -15% | 451.8 50% | 212.8 -30% | 302 ? 0% |
| Write Seq Q32T1 (MB/s) | 353 | 861 144% | 1222 246% | 2066 485% | 534 51% | 353 ? 0% |
| Read Seq Q32T1 (MB/s) | 521 | 1615 210% | 3460 564% | 3423 557% | 544 4% | 521 ? 0% |
| AS SSD | 4% | 126% | 13% | 0% | ||
| Seq Read (MB/s) | 509 | 1154 127% | 2062 305% | 432.9 -15% | 509 ? 0% | |
| Seq Write (MB/s) | 456.9 | 393.6 -14% | 832 82% | 253.6 -44% | 457 ? 0% | |
| 4K Read (MB/s) | 22.65 | 34.42 52% | 41.45 83% | 22.47 -1% | 22.7 ? 0% | |
| 4K Write (MB/s) | 43.98 | 68.9 57% | 91.1 107% | 76.7 74% | 44 ? 0% | |
| 4K-64 Read (MB/s) | 325.5 | 494.1 52% | 669 106% | 377.8 16% | 326 ? 0% | |
| 4K-64 Write (MB/s) | 243.7 | 171.3 -30% | 596 145% | 282.1 16% | 244 ? 0% | |
| Access Time Read * (ms) | 0.213 | 0.063 | 0.148 | |||
| Access Time Write * (ms) | 0.08 | 0.3 -275% | 0.041 49% | 0.046 43% | 0.08 ? -0% | |
| Score Read (Points) | 399 | 644 61% | 917 130% | 444 11% | 399 ? 0% | |
| Score Write (Points) | 333 | 280 -16% | 770 131% | 384 15% | 333 ? 0% | |
| Score Total (Points) | 941 | 1225 30% | 2105 124% | 1052 12% | 941 ? 0% | |
| Copy ISO MB/s (MB/s) | 985 | 761 | ||||
| Copy Program MB/s (MB/s) | 143.1 | 237.3 | ||||
| Copy Game MB/s (MB/s) | 676 | 512 | ||||
| Moyenne finale (programmes/paramètres) | 37% /
33% | 150% /
147% | 260% /
260% | 7% /
7% | 0% /
0% |
* ... Moindre est la valeur, meilleures sont les performances

| 3DMark 11 Performance | 3800 points | |
| 3DMark Cloud Gate Standard Score | 12420 points | |
| 3DMark Fire Strike Score | 2575 points | |
Aide | ||
| Thief | |
| 1920x1080 Very High Preset AA:FXAA & High SS AF:8x | |
| Moyenne NVIDIA GeForce MX150 (16 - 23.2, n=6) | |
| Acer Switch 7 BE SW713-51GNP | |
| 1366x768 High Preset AA:FXAA & Low SS AF:4x | |
| Moyenne NVIDIA GeForce MX150 (30.2 - 44.1, n=6) | |
| Acer Switch 7 BE SW713-51GNP | |
| Microsoft Surface Pro 6, Core i7, 512 GB | |
| 1366x768 Normal Preset AA:FX | |
| Acer Switch 7 BE SW713-51GNP | |
| Moyenne NVIDIA GeForce MX150 (32.5 - 51.9, n=6) | |
| Microsoft Surface Pro 6, Core i7, 512 GB | |
| 1024x768 Very Low Preset | |
| Acer Switch 7 BE SW713-51GNP | |
| Moyenne NVIDIA GeForce MX150 (41.5 - 79.2, n=6) | |
| Microsoft Surface Pro 6, Core i7, 512 GB | |
| Rise of the Tomb Raider | |
| 1024x768 Lowest Preset | |
| Moyenne NVIDIA GeForce MX150 (41.6 - 86, n=28) | |
| Acer Switch 7 BE SW713-51GNP | |
| Microsoft Surface Pro 6, Core i7, 512 GB | |
| Lenovo ThinkPad X1 Yoga 2018-20LES01W00 | |
| HP Elite x2 1013 G3-2TT14EA | |
| 1366x768 Medium Preset AF:2x | |
| Moyenne NVIDIA GeForce MX150 (28.2 - 60, n=29) | |
| Acer Switch 7 BE SW713-51GNP | |
| Microsoft Surface Pro 6, Core i7, 512 GB | |
| HP Elite x2 1013 G3-2TT14EA | |
| 1920x1080 High Preset AA:FX AF:4x | |
| Moyenne NVIDIA GeForce MX150 (14.8 - 27, n=28) | |
| Acer Switch 7 BE SW713-51GNP | |
| Microsoft Surface Pro 6, Core i7, 512 GB | |
| HP Elite x2 1013 G3-2TT14EA | |
| 1920x1080 Very High Preset AA:FX AF:16x | |
| Moyenne NVIDIA GeForce MX150 (14.8 - 26, n=23) | |
| Acer Switch 7 BE SW713-51GNP | |
| HP Elite x2 1013 G3-2TT14EA | |
| Bas | Moyen | Élevé | Ultra | |
|---|---|---|---|---|
| BioShock Infinite (2013) | 125 | 93 | 88 | 30 |
| Thief (2014) | 70 | 43 | 32 | 16 |
| The Witcher 3 (2015) | 19 | |||
| Rise of the Tomb Raider (2016) | 59 | 34 | 18 | 15 |
(±) La température maximale du côté supérieur est de 43.4 °C / 110 F, par rapport à la moyenne de 35.4 °C / 96 F, allant de 19.6 à 60 °C pour la classe Convertible.
(-) Le fond chauffe jusqu'à un maximum de 45.3 °C / 114 F, contre une moyenne de 36.9 °C / 98 F
(-) En utilisation inactive, la température moyenne du côté supérieur est de 52 °C / 126 F, par rapport à la moyenne du dispositif de 30.3 °C / 87 F.
(-) Les repose-poignets et le pavé tactile peuvent devenir très chauds au toucher, avec un maximum de 42.2 °C / 108# F.
(-) La température moyenne de la zone de l'appui-paume de dispositifs similaires était de 28 °C / 82.4 F (-14.2 °C / #-25.6 F).
Acer Switch 7 BE SW713-51GNP analyse audio
(-) | haut-parleurs pas très forts (67.5 dB)
Basses 100 - 315 Hz
(±) | basse réduite - en moyenne 6.8% inférieure à la médiane
(±) | la linéarité des basses est moyenne (7.3% delta à la fréquence précédente)
Médiums 400 - 2000 Hz
(±) | médiane supérieure - en moyenne 7.2% supérieure à la médiane
(±) | la linéarité des médiums est moyenne (8.9% delta à la fréquence précédente)
Aiguës 2 - 16 kHz
(+) | des sommets équilibrés - à seulement 4.8% de la médiane
(+) | les aigus sont linéaires (6.6% delta à la fréquence précédente)
Globalement 100 - 16 000 Hz
(±) | la linéarité du son global est moyenne (26.9% de différence avec la médiane)
Par rapport à la même classe
» 83% de tous les appareils testés de cette catégorie étaient meilleurs, 3% similaires, 14% pires
» Le meilleur avait un delta de 6%, la moyenne était de 20%, le pire était de 57%.
Par rapport à tous les appareils testés
» 82% de tous les appareils testés étaient meilleurs, 4% similaires, 14% pires
» Le meilleur avait un delta de 4%, la moyenne était de 24%, le pire était de 134%.
Apple MacBook 12 (Early 2016) 1.1 GHz analyse audio
(+) | les haut-parleurs peuvent jouer relativement fort (83.6# dB)
Basses 100 - 315 Hz
(±) | basse réduite - en moyenne 11.3% inférieure à la médiane
(±) | la linéarité des basses est moyenne (14.2% delta à la fréquence précédente)
Médiums 400 - 2000 Hz
(+) | médiane équilibrée - seulement 2.4% de la médiane
(+) | les médiums sont linéaires (5.5% delta à la fréquence précédente)
Aiguës 2 - 16 kHz
(+) | des sommets équilibrés - à seulement 2% de la médiane
(+) | les aigus sont linéaires (4.5% delta à la fréquence précédente)
Globalement 100 - 16 000 Hz
(+) | le son global est linéaire (10.2% différence à la médiane)
Par rapport à la même classe
» 7% de tous les appareils testés de cette catégorie étaient meilleurs, 2% similaires, 91% pires
» Le meilleur avait un delta de 5%, la moyenne était de 18%, le pire était de 53%.
Par rapport à tous les appareils testés
» 5% de tous les appareils testés étaient meilleurs, 1% similaires, 94% pires
» Le meilleur avait un delta de 4%, la moyenne était de 24%, le pire était de 134%.
| Éteint/en veille | |
| Au repos | |
| Fortement sollicité |
|
Légende:
min: | |
| Acer Switch 7 BE SW713-51GNP i5-8550U, GeForce MX150, Liteonit CV3-SD512, IPS, 2256x1504, 13.5" | Microsoft Surface Pro 6, Core i7, 512 GB i7-8650U, UHD Graphics 620, Toshiba KBG30ZPZ512G, IPS, 2736x1824, 12.3" | HP Elite x2 1013 G3-2TT14EA i5-8350U, UHD Graphics 620, Samsung PM961 MZVLW256HEHP, IPS, 3000x2000, 13" | Lenovo ThinkPad X1 Yoga 2018-20LES01W00 i5-8550U, UHD Graphics 620, Samsung SSD PM981 MZVLB512HAJQ, IPS Dolby Vision HDR, 2560x1440, 14" | Fujitsu Stylistic Q738 i5-8350U, UHD Graphics 620, Samsung SSD PM871b MZNLN256HAJQ, IPS, 1920x1080, 13.3" | Moyenne NVIDIA GeForce MX150 | Moyenne de la classe Convertible | |
|---|---|---|---|---|---|---|---|
| Power Consumption | 14% | 5% | -11% | 31% | -8% | 0% | |
| Idle Minimum * (Watt) | 4.5 | 3.2 29% | 4.9 -9% | 3.4 24% | 4.2 7% | 4.48 ? -0% | 4.29 ? 5% |
| Idle Average * (Watt) | 7.6 | 8.7 -14% | 8.9 -17% | 8.8 -16% | 7 8% | 7.88 ? -4% | 7.08 ? 7% |
| Idle Maximum * (Watt) | 10.2 | 10.4 -2% | 11 -8% | 11.9 -17% | 7.9 23% | 9.76 ? 4% | 8.68 ? 15% |
| Load Average * (Watt) | 48 | 29.2 39% | 32 33% | 50.4 -5% | 19.8 59% | 54.7 ? -14% | 44 ? 8% |
| Load Maximum * (Watt) | 50.3 | 40.8 19% | 36 28% | 71.2 -42% | 22 56% | 63.5 ? -26% | 67.3 ? -34% |
* ... Moindre est la valeur, meilleures sont les performances
| Acer Switch 7 BE SW713-51GNP i5-8550U, GeForce MX150, Wh | Microsoft Surface Pro 6, Core i7, 512 GB i7-8650U, UHD Graphics 620, 45 Wh | HP Elite x2 1013 G3-2TT14EA i5-8350U, UHD Graphics 620, 50 Wh | Lenovo ThinkPad X1 Yoga 2018-20LES01W00 i5-8550U, UHD Graphics 620, 54 Wh | Fujitsu Stylistic Q738 i5-8350U, UHD Graphics 620, Wh | Moyenne de la classe Convertible | |
|---|---|---|---|---|---|---|
| Autonomie de la batterie | 198% | 141% | 207% | 56% | 318% | |
| Reader / Idle (h) | 3.2 | 18.1 466% | 13 306% | 20.1 528% | 27.7 ? 766% | |
| WiFi v1.3 (h) | 4.1 | 8.5 107% | 7.7 88% | 8.6 110% | 6.4 56% | 11.9 ? 190% |
| Load (h) | 1.8 | 2.2 22% | 2.3 28% | 1.5 -17% | 1.779 ? -1% |
Points positifs
Points négatifs
L’Acer Switch 7 Black Edition est un convertible Windows puissant. Les performances globales sont d’un bon niveau, et les composants sont à la hauteur. Cependant, la sélection des ports prouve que des compromis ont dû être faits. Cela dit, il est possible de connecter une station d’accueil via le port Thunderbolt, afin de récupérer tous les ports absents.
Grâce à la GeForce MX150 dédiée de Nvidia, la Switch 7 possède de meilleures performances pour le jeu que ses concurrents avec GPU intégrés. Cependant, la machine peut parfois beaucoup chauffer, ce qui entraîne du thermal throttling, qui augmente en fonction de la hausse des sollicitations. Les créatifs professionnels qui font beaucoup d’édition d’images et qui ont besoin d’un stylet doivent regarder la Switch 7 de plus près. Le poids de la tablette peut un peu compliquer son utilisation dans certaines circonstances.
L’Acer Switch 7 Black Edition est un convertible Windows très puissant et polyvalent.
L’intégralité de cette critique est disponible en anglais en suivant ce lien.
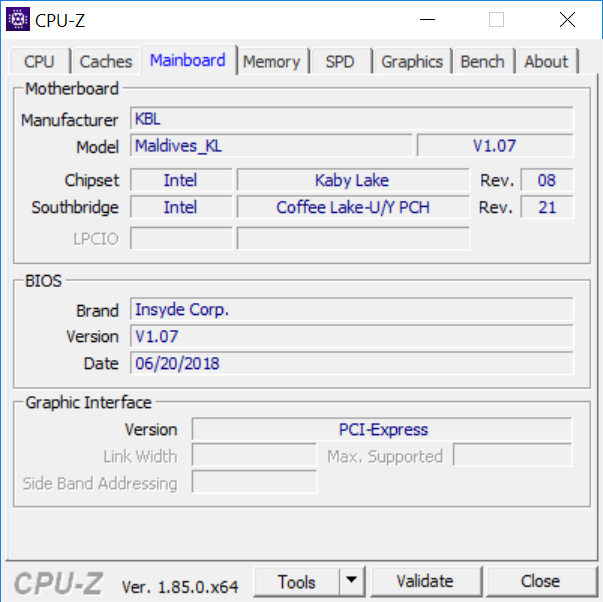
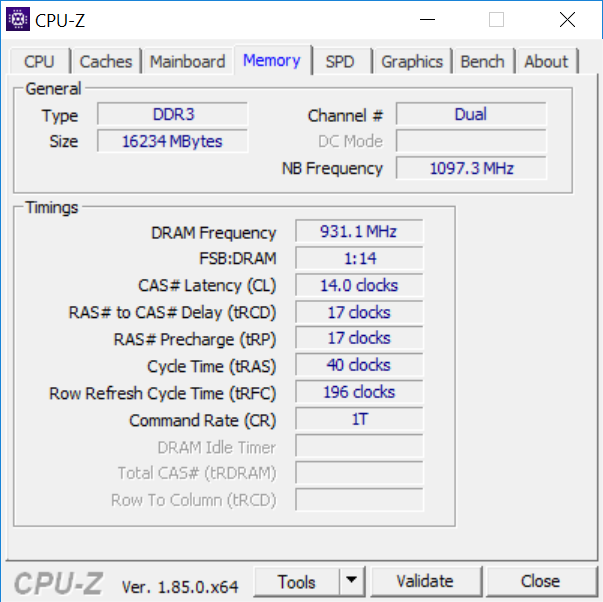
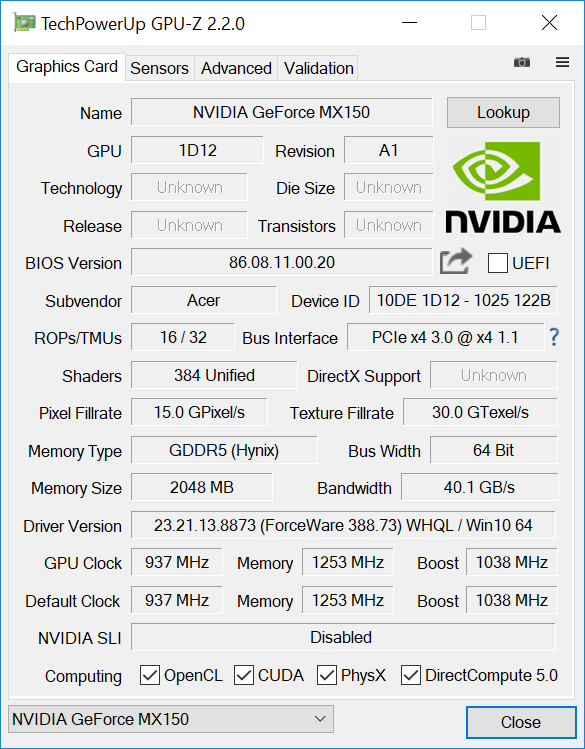
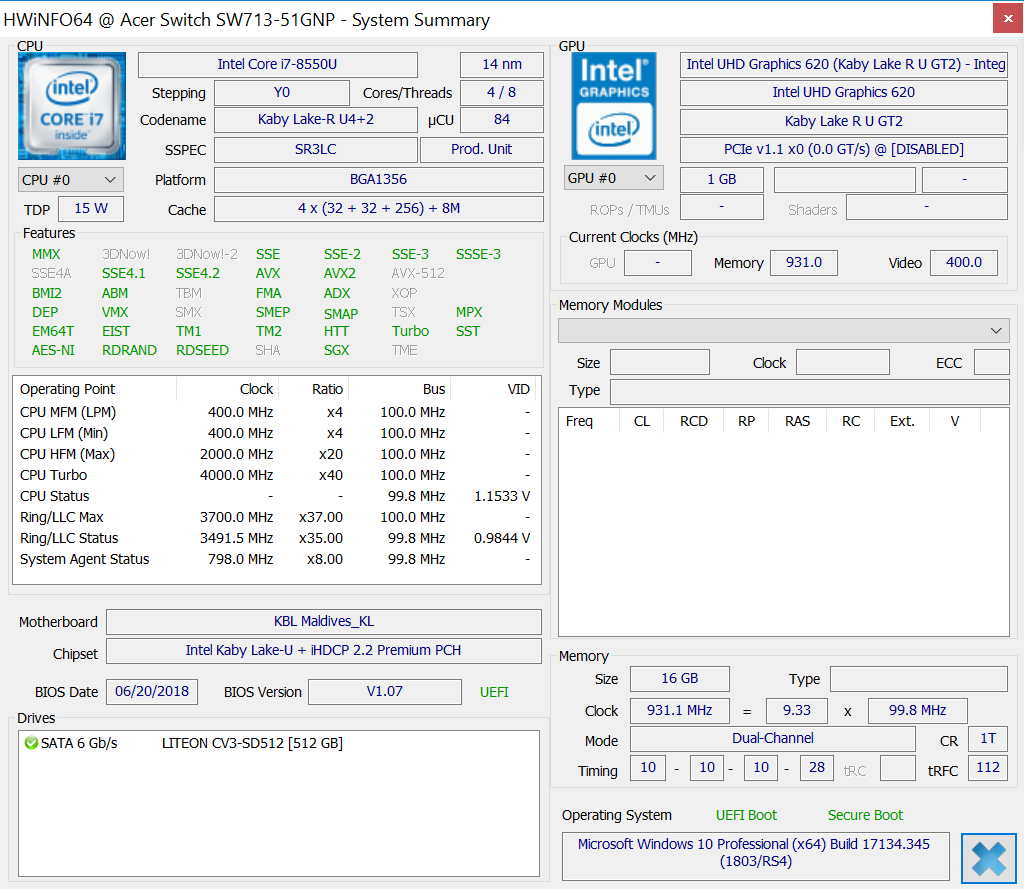
Acer Switch 7 BE SW713-51GNP
- 11/19/2018 v6 (old)
Mike Wobker