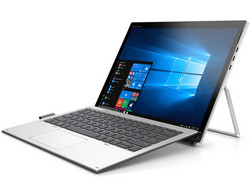
Courte critique du 2-en-1 HP Elite x2 1013 G3 (i5-8350U, UHD 620, 3K)
Top 10
» Le Top 10 des PC portables multimédia
» Le Top 10 des PC portables de jeu
» Le Top 10 des PC portables de jeu légers
» Le Top 10 des ordinateurs portables bureautiques
» Le Top 10 des PC portables bureautiques premium/professionnels
» Le Top 10 des Stations de travail mobiles
» Le Top 10 des Ultraportables
» Le Top 10 des Ultrabooks
» Le Top 10 des Convertibles
» Le Top 10 des Tablettes
» Le Top 10 des Tablettes Windows
» Le Top 10 des Smartphones
» Le Top 10 des PC Portables á moins de 300 euros
» Le Top 10 des PC Portables á moins de 500 euros
» Le Top 25 des meilleurs écrans d'ordinateurs
Comparaison des tailles
| |||||||||||||||||||||||||
Homogénéité de la luminosité: 85 %
Valeur mesurée au centre, sur batterie: 456 cd/m²
Contraste: 942:1 (Valeurs des noirs: 0.48 cd/m²)
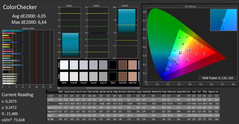
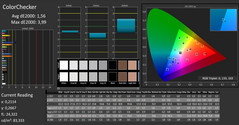
ΔE ColorChecker Calman: 4.05 | ∀{0.5-29.43 Ø4.77}
calibrated: 1.56
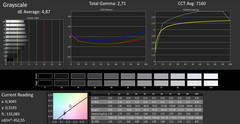
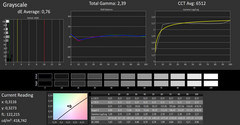
ΔE Greyscale Calman: 4.87 | ∀{0.09-98 Ø5}
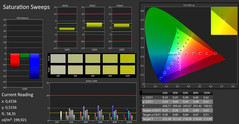
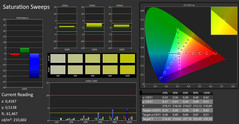
97% sRGB (Argyll 1.6.3 3D)
62% AdobeRGB 1998 (Argyll 1.6.3 3D)
68.2% AdobeRGB 1998 (Argyll 3D)
96.7% sRGB (Argyll 3D)
67.5% Display P3 (Argyll 3D)
Gamma: 2.71
CCT: 7160 K
| HP Elite x2 1013 G3-2TT14EA IPS, 3000x2000, 13" | HP Elite x2 1012 G2-1LV76EA IPS, 2716x1824, 12.3" | Lenovo Miix 520-12IKB 20M3000LGE IPS, 1920x1200, 12.2" | Dell Latitude 12 5285 2-in-1 IPS, 1920x1280, 12.3" | Asus Transformer 4 Pro (i7-7500U, HD620) IPS, 2160x1440, 12.6" | Microsoft Surface Pro (2017) i7 IPS, 2736x1824, 12.3" | Microsoft Surface Pro (2017) i5 IPS, 2736x1824, 12.3" | |
|---|---|---|---|---|---|---|---|
| Display | 0% | -3% | -5% | -2% | -1% | 1% | |
| Display P3 Coverage (%) | 67.5 | 66.7 -1% | 66.1 -2% | 62.8 -7% | 69.6 3% | 66.6 -1% | 67.6 0% |
| sRGB Coverage (%) | 96.7 | 98 1% | 91.6 -5% | 94 -3% | 90 -7% | 96.5 0% | 99 2% |
| AdobeRGB 1998 Coverage (%) | 68.2 | 68.7 1% | 66.7 -2% | 64.7 -5% | 65.9 -3% | 67.8 -1% | 69.1 1% |
| Response Times | 10% | 18% | -4% | 3% | 13% | -1% | |
| Response Time Grey 50% / Grey 80% * (ms) | 47 ? | 45.6 ? 3% | 36 ? 23% | 42.4 ? 10% | 41 ? 13% | 37 ? 21% | 42 ? 11% |
| Response Time Black / White * (ms) | 26 ? | 21.6 ? 17% | 23 ? 12% | 30.8 ? -18% | 28 ? -8% | 25 ? 4% | 29 ? -12% |
| PWM Frequency (Hz) | 2119 ? | 200 ? | 210.1 ? | 22130 ? | 21000 | ||
| Screen | 16% | -19% | 5% | 1% | 5% | 15% | |
| Brightness middle (cd/m²) | 452 | 443 -2% | 384 -15% | 523.2 16% | 262 -42% | 482 7% | 417 -8% |
| Brightness (cd/m²) | 412 | 446 8% | 355 -14% | 522 27% | 254 -38% | 466 13% | 401 -3% |
| Brightness Distribution (%) | 85 | 88 4% | 80 -6% | 88 4% | 89 5% | 92 8% | 88 4% |
| Black Level * (cd/m²) | 0.48 | 0.41 15% | 0.56 -17% | 0.42 12% | 0.26 46% | 0.395 18% | 0.29 40% |
| Contrast (:1) | 942 | 1080 15% | 686 -27% | 1246 32% | 1008 7% | 1220 30% | 1438 53% |
| Colorchecker dE 2000 * | 4.05 | 2.6 36% | 4.58 -13% | 4 1% | 3.34 18% | 4 1% | 3.63 10% |
| Colorchecker dE 2000 max. * | 6.64 | 4 40% | 11.63 -75% | 8.6 -30% | 7.12 -7% | 7.2 -8% | 6.74 -2% |
| Colorchecker dE 2000 calibrated * | 1.56 | ||||||
| Greyscale dE 2000 * | 4.87 | 3 38% | 5.63 -16% | 5.5 -13% | 3.28 33% | 5.7 -17% | 2.18 55% |
| Gamma | 2.71 81% | 2.38 92% | 2.45 90% | 2.16 102% | 2.47 89% | 2.28 96% | 3.09 71% |
| CCT | 7160 91% | 6780 96% | 7571 86% | 7546 86% | 7180 91% | 7950 82% | 6767 96% |
| Color Space (Percent of AdobeRGB 1998) (%) | 62 | 62.6 1% | 60 -3% | 64.86 5% | 59 -5% | 62 0% | 63 2% |
| Color Space (Percent of sRGB) (%) | 97 | 98 1% | 92 -5% | 93.97 -3% | 90 -7% | 96 -1% | 99 2% |
| Moyenne finale (programmes/paramètres) | 9% /
12% | -1% /
-11% | -1% /
2% | 1% /
1% | 6% /
5% | 5% /
10% |
* ... Moindre est la valeur, meilleures sont les performances
Scintillement / MLI (Modulation de largeur d'impulsion)
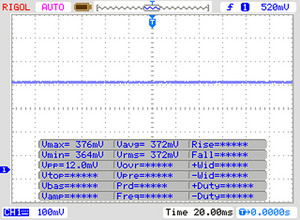
| Scintillement / MLI (Modulation de largeur d'impulsion) non décelé | |||
En comparaison, 53 % des appareils testés n'emploient pas MDI pour assombrir leur écran. Nous avons relevé une moyenne à 8070 (minimum : 5 - maximum : 343500) Hz dans le cas où une MDI était active. | |||
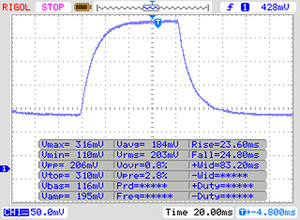
Temps de réponse de l'écran
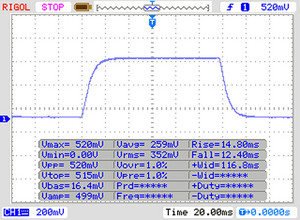
| ↔ Temps de réponse noir à blanc | ||
|---|---|---|
| 26 ms ... hausse ↗ et chute ↘ combinées | ↗ 14 ms hausse | |
| ↘ 12 ms chute | ||
| L'écran souffre de latences relativement élevées, insuffisant pour le jeu. En comparaison, tous les appareils testés affichent entre 0.1 (minimum) et 240 (maximum) ms. » 62 % des appareils testés affichent de meilleures performances. Cela signifie que les latences relevées sont moins bonnes que la moyenne (20.2 ms) de tous les appareils testés. | ||
| ↔ Temps de réponse gris 50% à gris 80% | ||
| 47 ms ... hausse ↗ et chute ↘ combinées | ↗ 23 ms hausse | |
| ↘ 24 ms chute | ||
| L'écran souffre de latences très élevées, à éviter pour le jeu. En comparaison, tous les appareils testés affichent entre 0.165 (minimum) et 636 (maximum) ms. » 80 % des appareils testés affichent de meilleures performances. Cela signifie que les latences relevées sont moins bonnes que la moyenne (31.5 ms) de tous les appareils testés. | ||
| Geekbench 3 | |
| 32 Bit Multi-Core Score | |
| Lenovo Miix 520-12IKB 20M3000LGE | |
| HP Elite x2 1013 G3-2TT14EA | |
| Moyenne Intel Core i5-8350U (n=1) | |
| 32 Bit Single-Core Score | |
| Lenovo Miix 520-12IKB 20M3000LGE | |
| HP Elite x2 1013 G3-2TT14EA | |
| Moyenne Intel Core i5-8350U (n=1) | |
| Geekbench 4.4 | |
| 64 Bit Multi-Core Score | |
| Lenovo Miix 520-12IKB 20M3000LGE | |
| HP Elite x2 1013 G3-2TT14EA | |
| Moyenne Intel Core i5-8350U (11004 - 15464, n=3) | |
| 64 Bit Single-Core Score | |
| Lenovo Miix 520-12IKB 20M3000LGE | |
| HP Elite x2 1013 G3-2TT14EA | |
| Moyenne Intel Core i5-8350U (3646 - 4685, n=3) | |
| Mozilla Kraken 1.1 - Total | |
| HP Elite x2 1013 G3-2TT14EA (Edge 42) | |
| HP Elite x2 1012 G2-1LV76EA (Edge 40.15063.0.0) | |
| Moyenne Intel Core i5-8350U (1017 - 1289, n=5) | |
| Asus Transformer 4 Pro (i7-7500U, HD620) | |
| Microsoft Surface Pro (2017) i7 (Edge 40) | |
| Moyenne de la classe Convertible (407 - 1089, n=60, 2 dernières années) | |
| Octane V2 - Total Score | |
| Moyenne de la classe Convertible (50984 - 123023, n=15, 2 dernières années) | |
| Microsoft Surface Pro (2017) i7 (Edge 40) | |
| Microsoft Surface Pro (2017) i5 | |
| Moyenne Intel Core i5-8350U (28223 - 38722, n=5) | |
| Asus Transformer 4 Pro (i7-7500U, HD620) | |
| HP Elite x2 1013 G3-2TT14EA (Edge 42) | |
| HP Elite x2 1012 G2-1LV76EA (Edge 40.15063.0.0) | |
| JetStream 1.1 - Total Score | |
| Lenovo Miix 520-12IKB 20M3000LGE (Edge 41) | |
| Microsoft Surface Pro (2017) i7 (Edge 40) | |
| HP Elite x2 1013 G3-2TT14EA (Edge 42) | |
| Microsoft Surface Pro (2017) i5 | |
| HP Elite x2 1012 G2-1LV76EA (Edge 40.15063.0.0) | |
| Moyenne Intel Core i5-8350U (173 - 232, n=5) | |
| Asus Transformer 4 Pro (i7-7500U, HD620) | |
| Fujitsu Stylistic Q738 | |
| Huawei Matebook E | |
* ... Moindre est la valeur, meilleures sont les performances
| PCMark 7 Score | 5676 points | |
| PCMark 8 Home Score Accelerated v2 | 3413 points | |
| PCMark 8 Creative Score Accelerated v2 | 4669 points | |
| PCMark 8 Work Score Accelerated v2 | 4200 points | |
| PCMark 10 Score | 3559 points | |
Aide | ||
| HP Elite x2 1013 G3-2TT14EA Samsung PM961 MZVLW256HEHP | HP Elite x2 1012 G2-1LV76EA Samsung PM961 MZVLW256HEHP | Lenovo Miix 520-12IKB 20M3000LGE Samsung SSD PM961 1TB M.2 PCIe 3.0 x4 NVMe (MZVLW1T0) | Dell Latitude 12 5285 2-in-1 Samsung PM961 MZVLW256HEHP | Asus Transformer 4 Pro (i7-7500U, HD620) SK Hynix HFS256G39TND-N210A | Microsoft Surface Pro (2017) i7 Samsung PM971 KUS040202M | Microsoft Surface Pro (2017) i5 Samsung PM971 KUS030202M | Moyenne Samsung PM961 MZVLW256HEHP | |
|---|---|---|---|---|---|---|---|---|
| CrystalDiskMark 3.0 | 30% | 14% | -9% | -45% | 4% | -15% | 14% | |
| Read Seq (MB/s) | 1786 | 1875 5% | 883 -51% | 1294 -28% | 475.3 -73% | 1308 -27% | 723 -60% | 1627 ? -9% |
| Write Seq (MB/s) | 1209 | 1261 4% | 932 -23% | 865 -28% | 260.9 -78% | 961 -21% | 853 -29% | 1136 ? -6% |
| Read 512 (MB/s) | 717 | 1235 72% | 586 -18% | 406 -43% | 289.3 -60% | 227.5 -68% | 225 -69% | 887 ? 24% |
| Write 512 (MB/s) | 798 | 844 6% | 627 -21% | 589 -26% | 260.7 -67% | 792 -1% | 445 -44% | 781 ? -2% |
| Read 4k (MB/s) | 49.66 | 56.9 15% | 54.8 10% | 31.75 -36% | 30.06 -39% | 53.6 8% | 46 -7% | 53 ? 7% |
| Write 4k (MB/s) | 104.2 | 145.4 40% | 139.3 34% | 72.2 -31% | 73.5 -29% | 136.3 31% | 125 20% | 126.7 ? 22% |
| Read 4k QD32 (MB/s) | 286 | 398.3 39% | 607 112% | 493.3 72% | 296.8 4% | 485.6 70% | 423 48% | 419 ? 47% |
| Write 4k QD32 (MB/s) | 298.4 | 472.5 58% | 498.5 67% | 434.5 46% | 239.8 -20% | 421.5 41% | 373 25% | 384 ? 29% |
| 3DMark 06 Standard Score | 10622 points | |
| 3DMark 11 Performance | 1851 points | |
| 3DMark Ice Storm Standard Score | 56649 points | |
| 3DMark Cloud Gate Standard Score | 7437 points | |
| 3DMark Fire Strike Score | 1026 points | |
| 3DMark Time Spy Score | 384 points | |
Aide | ||
| 3DMark 11 - 1280x720 Performance GPU | |
| Moyenne de la classe Convertible (1505 - 40732, n=56, 2 dernières années) | |
| Microsoft Surface Pro (2017) i7 | |
| Moyenne Intel UHD Graphics 620 (1144 - 3432, n=244) | |
| Lenovo Miix 520-12IKB 20M3000LGE (Cool Mode Off) | |
| Lenovo Miix 520-12IKB 20M3000LGE (Cool Mode On) | |
| HP Elite x2 1013 G3-2TT14EA | |
| Dell Latitude 12 5285 2-in-1 | |
| HP Elite x2 1012 G2-1LV76EA | |
| Asus Transformer 4 Pro (i7-7500U, HD620) | |
| Huawei Matebook E | |
| Fujitsu Stylistic Q738 | |
| Bas | Moyen | Élevé | Ultra | |
|---|---|---|---|---|
| Tomb Raider (2013) | 91.5 | 45 | 28.6 | 12.8 |
| BioShock Infinite (2013) | 60.6 | 31.1 | 26.8 | 8.7 |
| Rise of the Tomb Raider (2016) | 17.2 | 11.4 | 6 | 3.1 |
| BioShock Infinite - 1280x720 Very Low Preset | |
| Lenovo Miix 520-12IKB 20M3000LGE | |
| Moyenne Intel UHD Graphics 620 (18.3 - 90.2, n=187) | |
| HP Elite x2 1013 G3-2TT14EA | |
| Dell Latitude 12 5285 2-in-1 | |
| HP Elite x2 1012 G2-1LV76EA | |
| Fujitsu Stylistic Q738 | |
| Microsoft Surface Pro (2017) i5 | |
| Huawei Matebook E | |
| Asus Transformer 4 Pro (i7-7500U, HD620) | |
| Tomb Raider - 1024x768 Low Preset | |
| HP Elite x2 1013 G3-2TT14EA | |
| Dell Latitude 12 5285 2-in-1 | |
| Moyenne Intel UHD Graphics 620 (24.3 - 114.4, n=18) | |
Degré de la nuisance sonore
| Au repos |
| 30.3 / 30.3 / 31.2 dB(A) |
| Fortement sollicité |
| 32.8 / 32.9 dB(A) |
 | ||
30 dB silencieux 40 dB(A) audible 50 dB(A) bruyant |
||
min: | ||
| HP Elite x2 1013 G3-2TT14EA i5-8350U, UHD Graphics 620 | HP Elite x2 1012 G2-1LV76EA i5-7200U, HD Graphics 620 | Lenovo Miix 520-12IKB 20M3000LGE i5-8550U, UHD Graphics 620 | Dell Latitude 12 5285 2-in-1 i7-7600U, HD Graphics 620 | Asus Transformer 4 Pro (i7-7500U, HD620) i7-7500U, HD Graphics 620 | Microsoft Surface Pro (2017) i7 i7-7660U, Iris Plus Graphics 640 | Moyenne Intel UHD Graphics 620 | Moyenne de la classe Convertible | |
|---|---|---|---|---|---|---|---|---|
| Noise | 4% | -1% | 6% | 1% | 1% | 1% | 9% | |
| arrêt / environnement * (dB) | 30.3 | 29.5 3% | 30.2 -0% | 28.2 7% | 30.2 -0% | 29.6 2% | 29 ? 4% | 23.8 ? 21% |
| Idle Minimum * (dB) | 30.3 | 29.5 3% | 30.2 -0% | 28.2 7% | 30.2 -0% | 29.6 2% | 29.1 ? 4% | 24.2 ? 20% |
| Idle Average * (dB) | 30.3 | 29.5 3% | 30.2 -0% | 28.2 7% | 30.2 -0% | 29.6 2% | 29.1 ? 4% | 24.6 ? 19% |
| Idle Maximum * (dB) | 31.2 | 29.5 5% | 30.2 3% | 28.2 10% | 29.6 5% | 29.7 ? 5% | 25.3 ? 19% | |
| Load Average * (dB) | 32.8 | 30.6 7% | 33.4 -2% | 30.4 7% | 30.8 6% | 33.4 -2% | 33.5 ? -2% | 33.6 ? -2% |
| Load Maximum * (dB) | 32.9 | 32.5 1% | 34.2 -4% | 34 -3% | 32.9 -0% | 34.1 -4% | 36.1 ? -10% | 41.3 ? -26% |
| Witcher 3 ultra * (dB) | 33.4 |
* ... Moindre est la valeur, meilleures sont les performances
(-) La température maximale du côté supérieur est de 49.4 °C / 121 F, par rapport à la moyenne de 35.3 °C / 96 F, allant de 19.6 à 60 °C pour la classe Convertible.
(-) Le fond chauffe jusqu'à un maximum de 47.1 °C / 117 F, contre une moyenne de 36.8 °C / 98 F
(±) En utilisation inactive, la température moyenne du côté supérieur est de 32.2 °C / 90 F, par rapport à la moyenne du dispositif de 30.3 °C / 87 F.
(-) Les repose-poignets et le pavé tactile peuvent devenir très chauds au toucher, avec un maximum de 41 °C / 105.8# F.
(-) La température moyenne de la zone de l'appui-paume de dispositifs similaires était de 27.9 °C / 82.2 F (-13.1 °C / #-23.6 F).
| HP Elite x2 1013 G3-2TT14EA i5-8350U, UHD Graphics 620 | HP Elite x2 1012 G2-1LV76EA i5-7200U, HD Graphics 620 | Lenovo Miix 520-12IKB 20M3000LGE i5-8550U, UHD Graphics 620 | Dell Latitude 12 5285 2-in-1 i7-7600U, HD Graphics 620 | Asus Transformer 4 Pro (i7-7500U, HD620) i7-7500U, HD Graphics 620 | Microsoft Surface Pro (2017) i7 i7-7660U, Iris Plus Graphics 640 | Microsoft Surface Pro (2017) i5 i5-7300U, HD Graphics 620 | Moyenne Intel UHD Graphics 620 | Moyenne de la classe Convertible | |
|---|---|---|---|---|---|---|---|---|---|
| Heat | 15% | 5% | 12% | 16% | 13% | 8% | 16% | 15% | |
| Maximum Upper Side * (°C) | 49.4 | 42.3 14% | 43.7 12% | 38.2 23% | 40.5 18% | 42 15% | 39.2 21% | 41.1 ? 17% | 40.7 ? 18% |
| Maximum Bottom * (°C) | 47.1 | 44.5 6% | 44.5 6% | 48.6 -3% | 37 21% | 42 11% | 40.3 14% | 44.3 ? 6% | 43.3 ? 8% |
| Idle Upper Side * (°C) | 38 | 29.5 22% | 38 -0% | 29.6 22% | 31.1 18% | 31 18% | 37 3% | 26.8 ? 29% | 27.9 ? 27% |
| Idle Bottom * (°C) | 30.8 | 25.2 18% | 30.8 -0% | 28.8 6% | 28.2 8% | 28 9% | 32.3 -5% | 27.7 ? 10% | 28.7 ? 7% |
* ... Moindre est la valeur, meilleures sont les performances
HP Elite x2 1013 G3-2TT14EA analyse audio
(±) | le niveau sonore du haut-parleur est moyen mais bon (74.4# dB)
Basses 100 - 315 Hz
(-) | presque aucune basse - en moyenne 15.1% plus bas que la médiane
(±) | la linéarité des basses est moyenne (10.9% delta à la fréquence précédente)
Médiums 400 - 2000 Hz
(±) | médiane supérieure - en moyenne 7.9% supérieure à la médiane
(±) | la linéarité des médiums est moyenne (11.3% delta à la fréquence précédente)
Aiguës 2 - 16 kHz
(±) | sommets plus élevés - en moyenne 5.2% plus élevés que la médiane
(+) | les aigus sont linéaires (6.8% delta à la fréquence précédente)
Globalement 100 - 16 000 Hz
(±) | la linéarité du son global est moyenne (20.8% de différence avec la médiane)
Par rapport à la même classe
» 54% de tous les appareils testés de cette catégorie étaient meilleurs, 11% similaires, 35% pires
» Le meilleur avait un delta de 6%, la moyenne était de 20%, le pire était de 57%.
Par rapport à tous les appareils testés
» 56% de tous les appareils testés étaient meilleurs, 8% similaires, 37% pires
» Le meilleur avait un delta de 4%, la moyenne était de 24%, le pire était de 134%.
Apple MacBook 12 (Early 2016) 1.1 GHz analyse audio
(+) | les haut-parleurs peuvent jouer relativement fort (83.6# dB)
Basses 100 - 315 Hz
(±) | basse réduite - en moyenne 11.3% inférieure à la médiane
(±) | la linéarité des basses est moyenne (14.2% delta à la fréquence précédente)
Médiums 400 - 2000 Hz
(+) | médiane équilibrée - seulement 2.4% de la médiane
(+) | les médiums sont linéaires (5.5% delta à la fréquence précédente)
Aiguës 2 - 16 kHz
(+) | des sommets équilibrés - à seulement 2% de la médiane
(+) | les aigus sont linéaires (4.5% delta à la fréquence précédente)
Globalement 100 - 16 000 Hz
(+) | le son global est linéaire (10.2% différence à la médiane)
Par rapport à la même classe
» 7% de tous les appareils testés de cette catégorie étaient meilleurs, 2% similaires, 91% pires
» Le meilleur avait un delta de 5%, la moyenne était de 18%, le pire était de 53%.
Par rapport à tous les appareils testés
» 4% de tous les appareils testés étaient meilleurs, 1% similaires, 94% pires
» Le meilleur avait un delta de 4%, la moyenne était de 24%, le pire était de 134%.
| Éteint/en veille | |
| Au repos | |
| Fortement sollicité |
|
Légende:
min: | |
| HP Elite x2 1013 G3-2TT14EA i5-8350U, UHD Graphics 620 | HP Elite x2 1012 G2-1LV76EA i5-7200U, HD Graphics 620 | Lenovo Miix 520-12IKB 20M3000LGE i5-8550U, UHD Graphics 620 | Dell Latitude 12 5285 2-in-1 i7-7600U, HD Graphics 620 | Asus Transformer 4 Pro (i7-7500U, HD620) i7-7500U, HD Graphics 620 | Microsoft Surface Pro (2017) i7 i7-7660U, Iris Plus Graphics 640 | Microsoft Surface Pro (2017) i5 i5-7300U, HD Graphics 620 | Moyenne Intel UHD Graphics 620 | Moyenne de la classe Convertible | |
|---|---|---|---|---|---|---|---|---|---|
| Power Consumption | -6% | 14% | 19% | 34% | -7% | 22% | 5% | -18% | |
| Idle Minimum * (Watt) | 4.9 | 4.1 16% | 3.9 20% | 2.85 42% | 3.4 31% | 4.2 14% | 3.6 27% | 3.81 ? 22% | 4.44 ? 9% |
| Idle Average * (Watt) | 8.9 | 9.2 -3% | 8.2 8% | 6.76 24% | 5.7 36% | 10.1 -13% | 8.1 9% | 6.94 ? 22% | 7.42 ? 17% |
| Idle Maximum * (Watt) | 11 | 11.1 -1% | 8.4 24% | 6.91 37% | 7.4 33% | 14 -27% | 8.7 21% | 8.75 ? 20% | 9.78 ? 11% |
| Load Average * (Watt) | 32 | 33.8 -6% | 25.2 21% | 32.88 -3% | 15 53% | 37.4 -17% | 25.5 20% | 35 ? -9% | 45 ? -41% |
| Load Maximum * (Watt) | 36 | 49.2 -37% | 37 -3% | 37.41 -4% | 29.7 17% | 34 6% | 23.5 35% | 47.5 ? -32% | 67.6 ? -88% |
| Witcher 3 ultra * (Watt) | 38.1 |
* ... Moindre est la valeur, meilleures sont les performances
| HP Elite x2 1013 G3-2TT14EA i5-8350U, UHD Graphics 620, 50 Wh | HP Elite x2 1012 G2-1LV76EA i5-7200U, HD Graphics 620, 47 Wh | Lenovo Miix 520-12IKB 20M3000LGE i5-8550U, UHD Graphics 620, 38 Wh | Dell Latitude 12 5285 2-in-1 i7-7600U, HD Graphics 620, 42 Wh | Asus Transformer 4 Pro (i7-7500U, HD620) i7-7500U, HD Graphics 620, 39 Wh | Microsoft Surface Pro (2017) i7 i7-7660U, Iris Plus Graphics 640, 45 Wh | Microsoft Surface Pro (2017) i5 i5-7300U, HD Graphics 620, 45 Wh | Moyenne de la classe Convertible | |
|---|---|---|---|---|---|---|---|---|
| Autonomie de la batterie | -4% | -27% | 7% | -15% | 15% | 39% | 64% | |
| Reader / Idle (h) | 13 | 13.9 7% | 17.9 38% | 14 8% | 17.6 35% | 25.1 ? 93% | ||
| H.264 (h) | 6.5 | 6.3 -3% | 10.2 57% | 15.5 ? 138% | ||||
| WiFi v1.3 (h) | 7.7 | 6.3 -18% | 5.6 -27% | 8.1 5% | 4.7 -39% | 8.2 6% | 12.4 61% | 11.3 ? 47% |
| Load (h) | 2.3 | 2.3 0% | 1.8 -22% | 2 -13% | 1.9 -17% | 2.8 22% | 1.811 ? -21% | |
| Witcher 3 ultra (h) | 1.9 |
Points positifs
Points négatifs
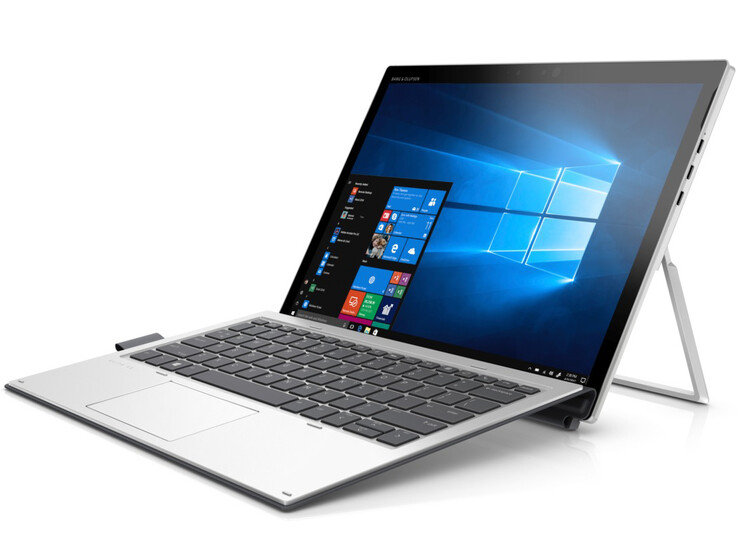
L’Elite x2 1013 G3 de HP est un 2-en-1 de 13 pouces qui cible avant tout les pros. C’est le successeur de l’Elite x2 1012 G2. Vu que le 1013 G3 est une refonte complète, il faut avouer que les deux appareils n’ont pas grand-chose en commun. La nouvelle version et plus fine et plus élégante que son prédécesseur.
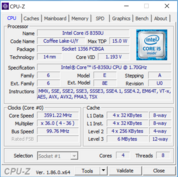
Il est équipé d’un Core i5-8350U qui apporte plus de puissance que nécessaire pour les tâches web et de bureautique du quotidien. Il reste très silencieux quel que soit le niveau de sollicitations, et est resté frais avec un usage classique. Il est très réactif grâce à son SSD NVMe, qui peut être remplacé.
L’Elite x2 1013 G3 de HP est un 2-en-1 robuste. Nous n’avons presque rien à critiquer. Entre autres, nous nous attendions à un modem LTE inclus vu le prix élevé de l’appareil - presque 2 000 $.
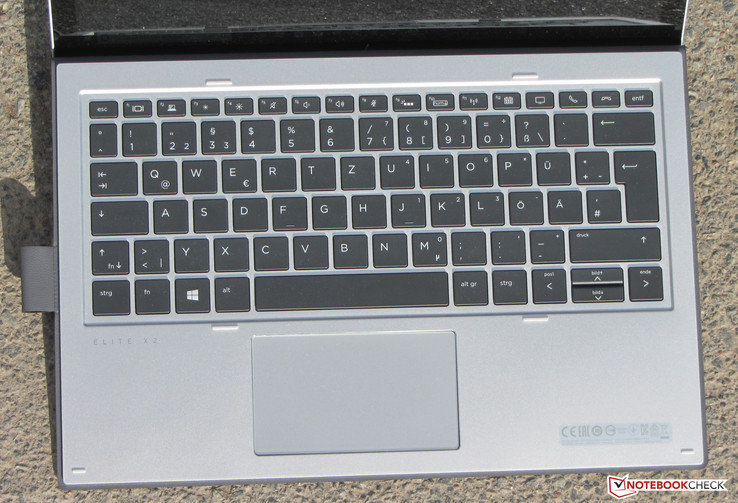
Le dock clavier inclus est très efficace. Il permet une frappe rapide et fluide, et paraît même adapté à des séances de rédaction longues et régulières. Il est rétroéclairé. La batterie est honnête - mais à cet égard la Surface Pro (2017) est bien plus convaincante.
L’écran 3:2 bien contrasté de 13 pouces est très lumineux et possède de larges angles de vision. L’écran tactile est compatible avec les stylets. Notre modèle n’avait pas de modem LTE, mais il était prêt à recevoir un module WWAN : un modem LTE peut être ajouté ultérieurement.
L’intégralité de cette critique est disponible en anglais en suivant ce lien.
HP Elite x2 1013 G3-2TT14EA
- 10/17/2019 v7 (old)
Sascha Mölck


