Notebookcheck Logo
Teaser

Test du XMG Neo 16 A25 : Ryzen 9 9955HX3D et RTX 5090 pour des performances de jeu maximales

Pleine puissance.

XMG propose également cette année son ordinateur portable gaming haut de gamme avec des processeurs AMD. Nous testons le Neo 16 A25, équipé du processeur Ryzen 9 9955HX3D, de la carte graphique GeForce RTX 5090 et d'un mini écran LED 300 Hz. Est-ce suffisant pour prétendre à la couronne du jeu ?
Andreas Osthoff, 👁 Andreas Osthoff (traduit par DeepL / Ninh Duy) Publié 🇺🇸 🇩🇪 ...

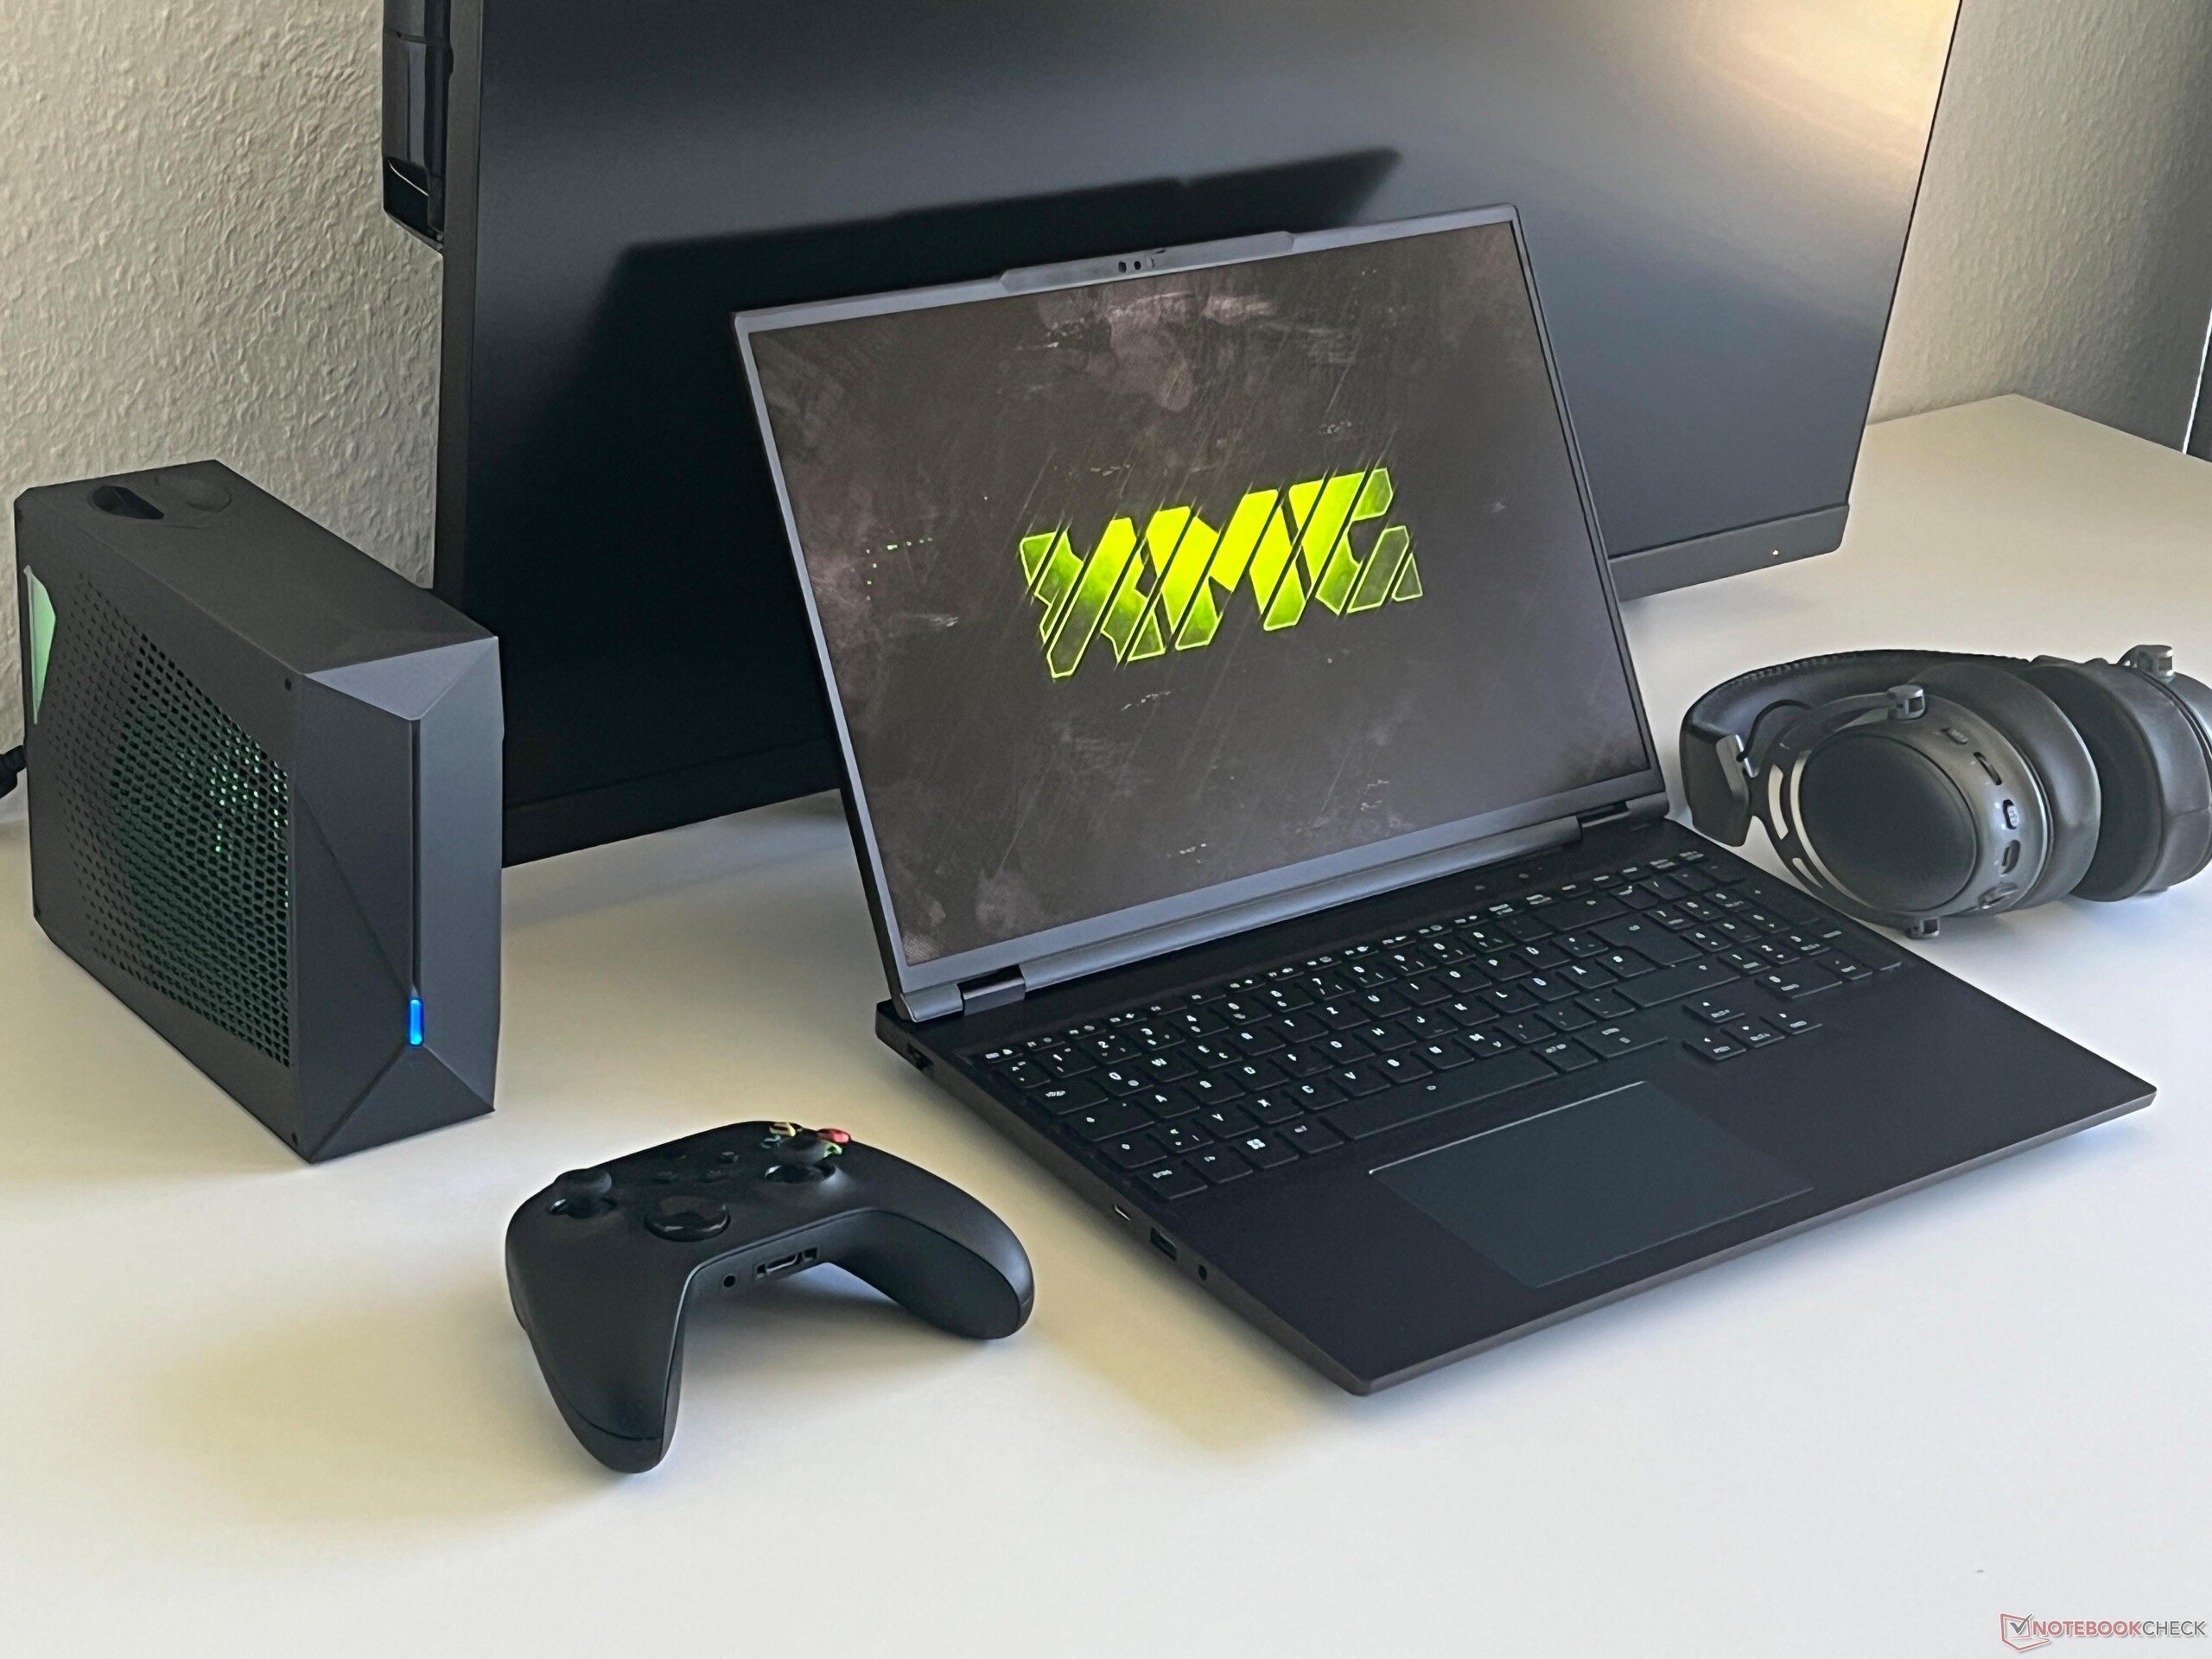
Verdict - Le Neo 16 A25 est l'ordinateur portable de jeu avec Ryzen 9 9955HX3D le plus puissant

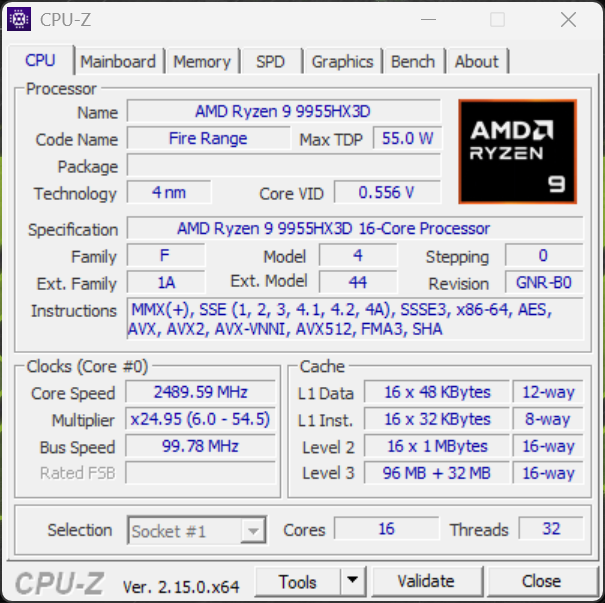
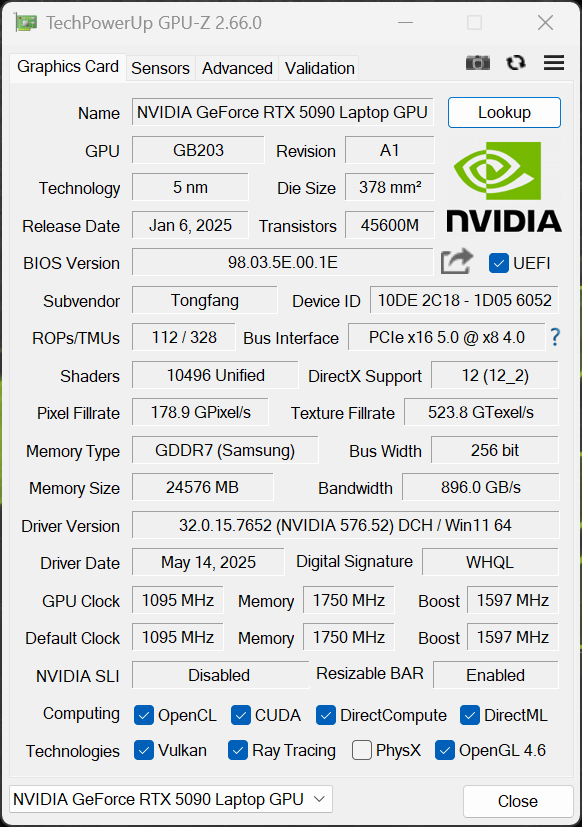
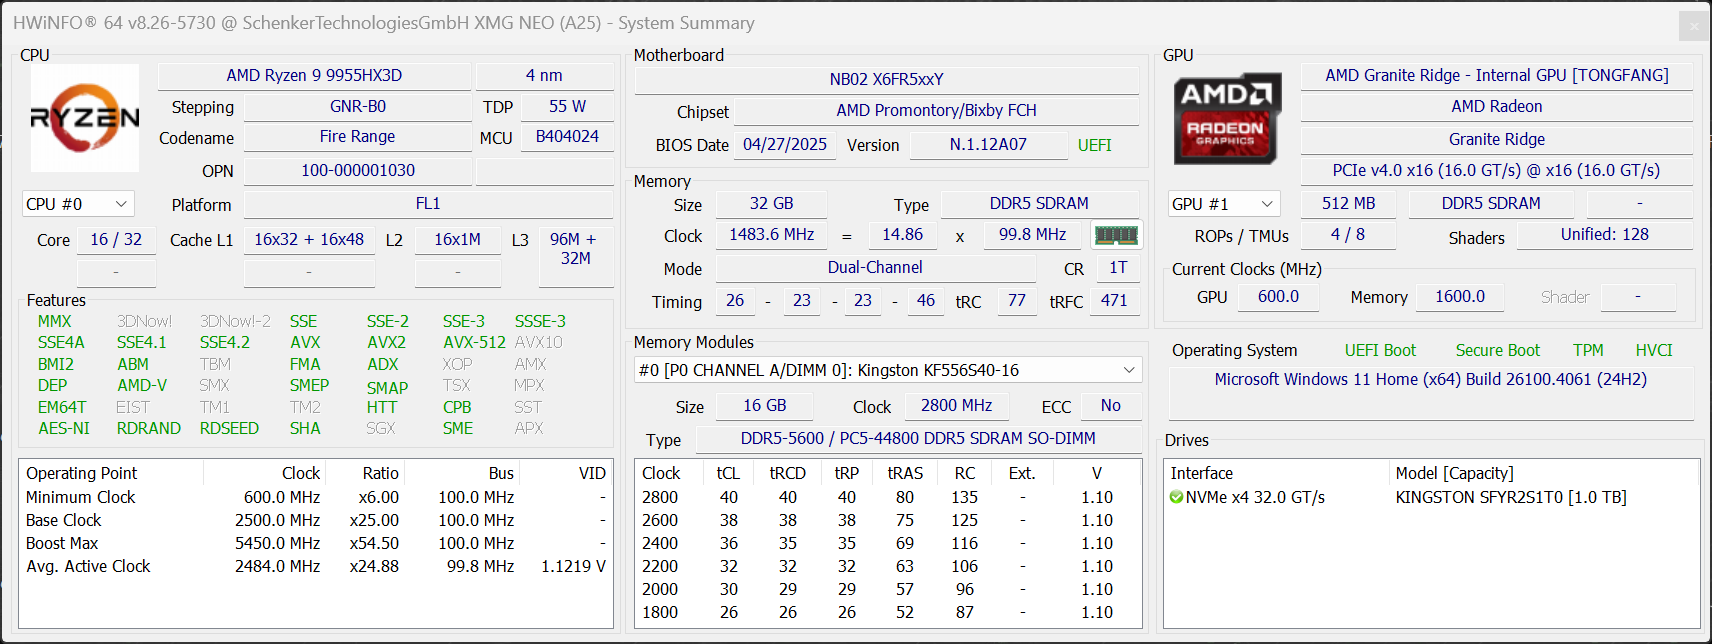
Le nouveau XMG Neo 16 A25 est également disponible avec un processeur AMD pour la première fois cette année, y compris le nouveau Ryzen 9955HX3D avec 3D V-Cache. Comme avec l'ancien Ryzen 9 7945HX3D, les performances de certains jeux bénéficient sensiblement du cache supplémentaire. Comme nous l'avons démontré dans notre analyse du 9955HX3Dl'avantage par rapport à la Ryzen 9 9955HX standard n'est pas particulièrement significatif, surtout en résolution QHD, et le supplément de 215 € n'est utile que dans une certaine mesure. Cependant, si vous souhaitez utiliser le gamer le plus rapide, vous avez frappé à la bonne porte.

Download your licensed rating image as SVG / PNG

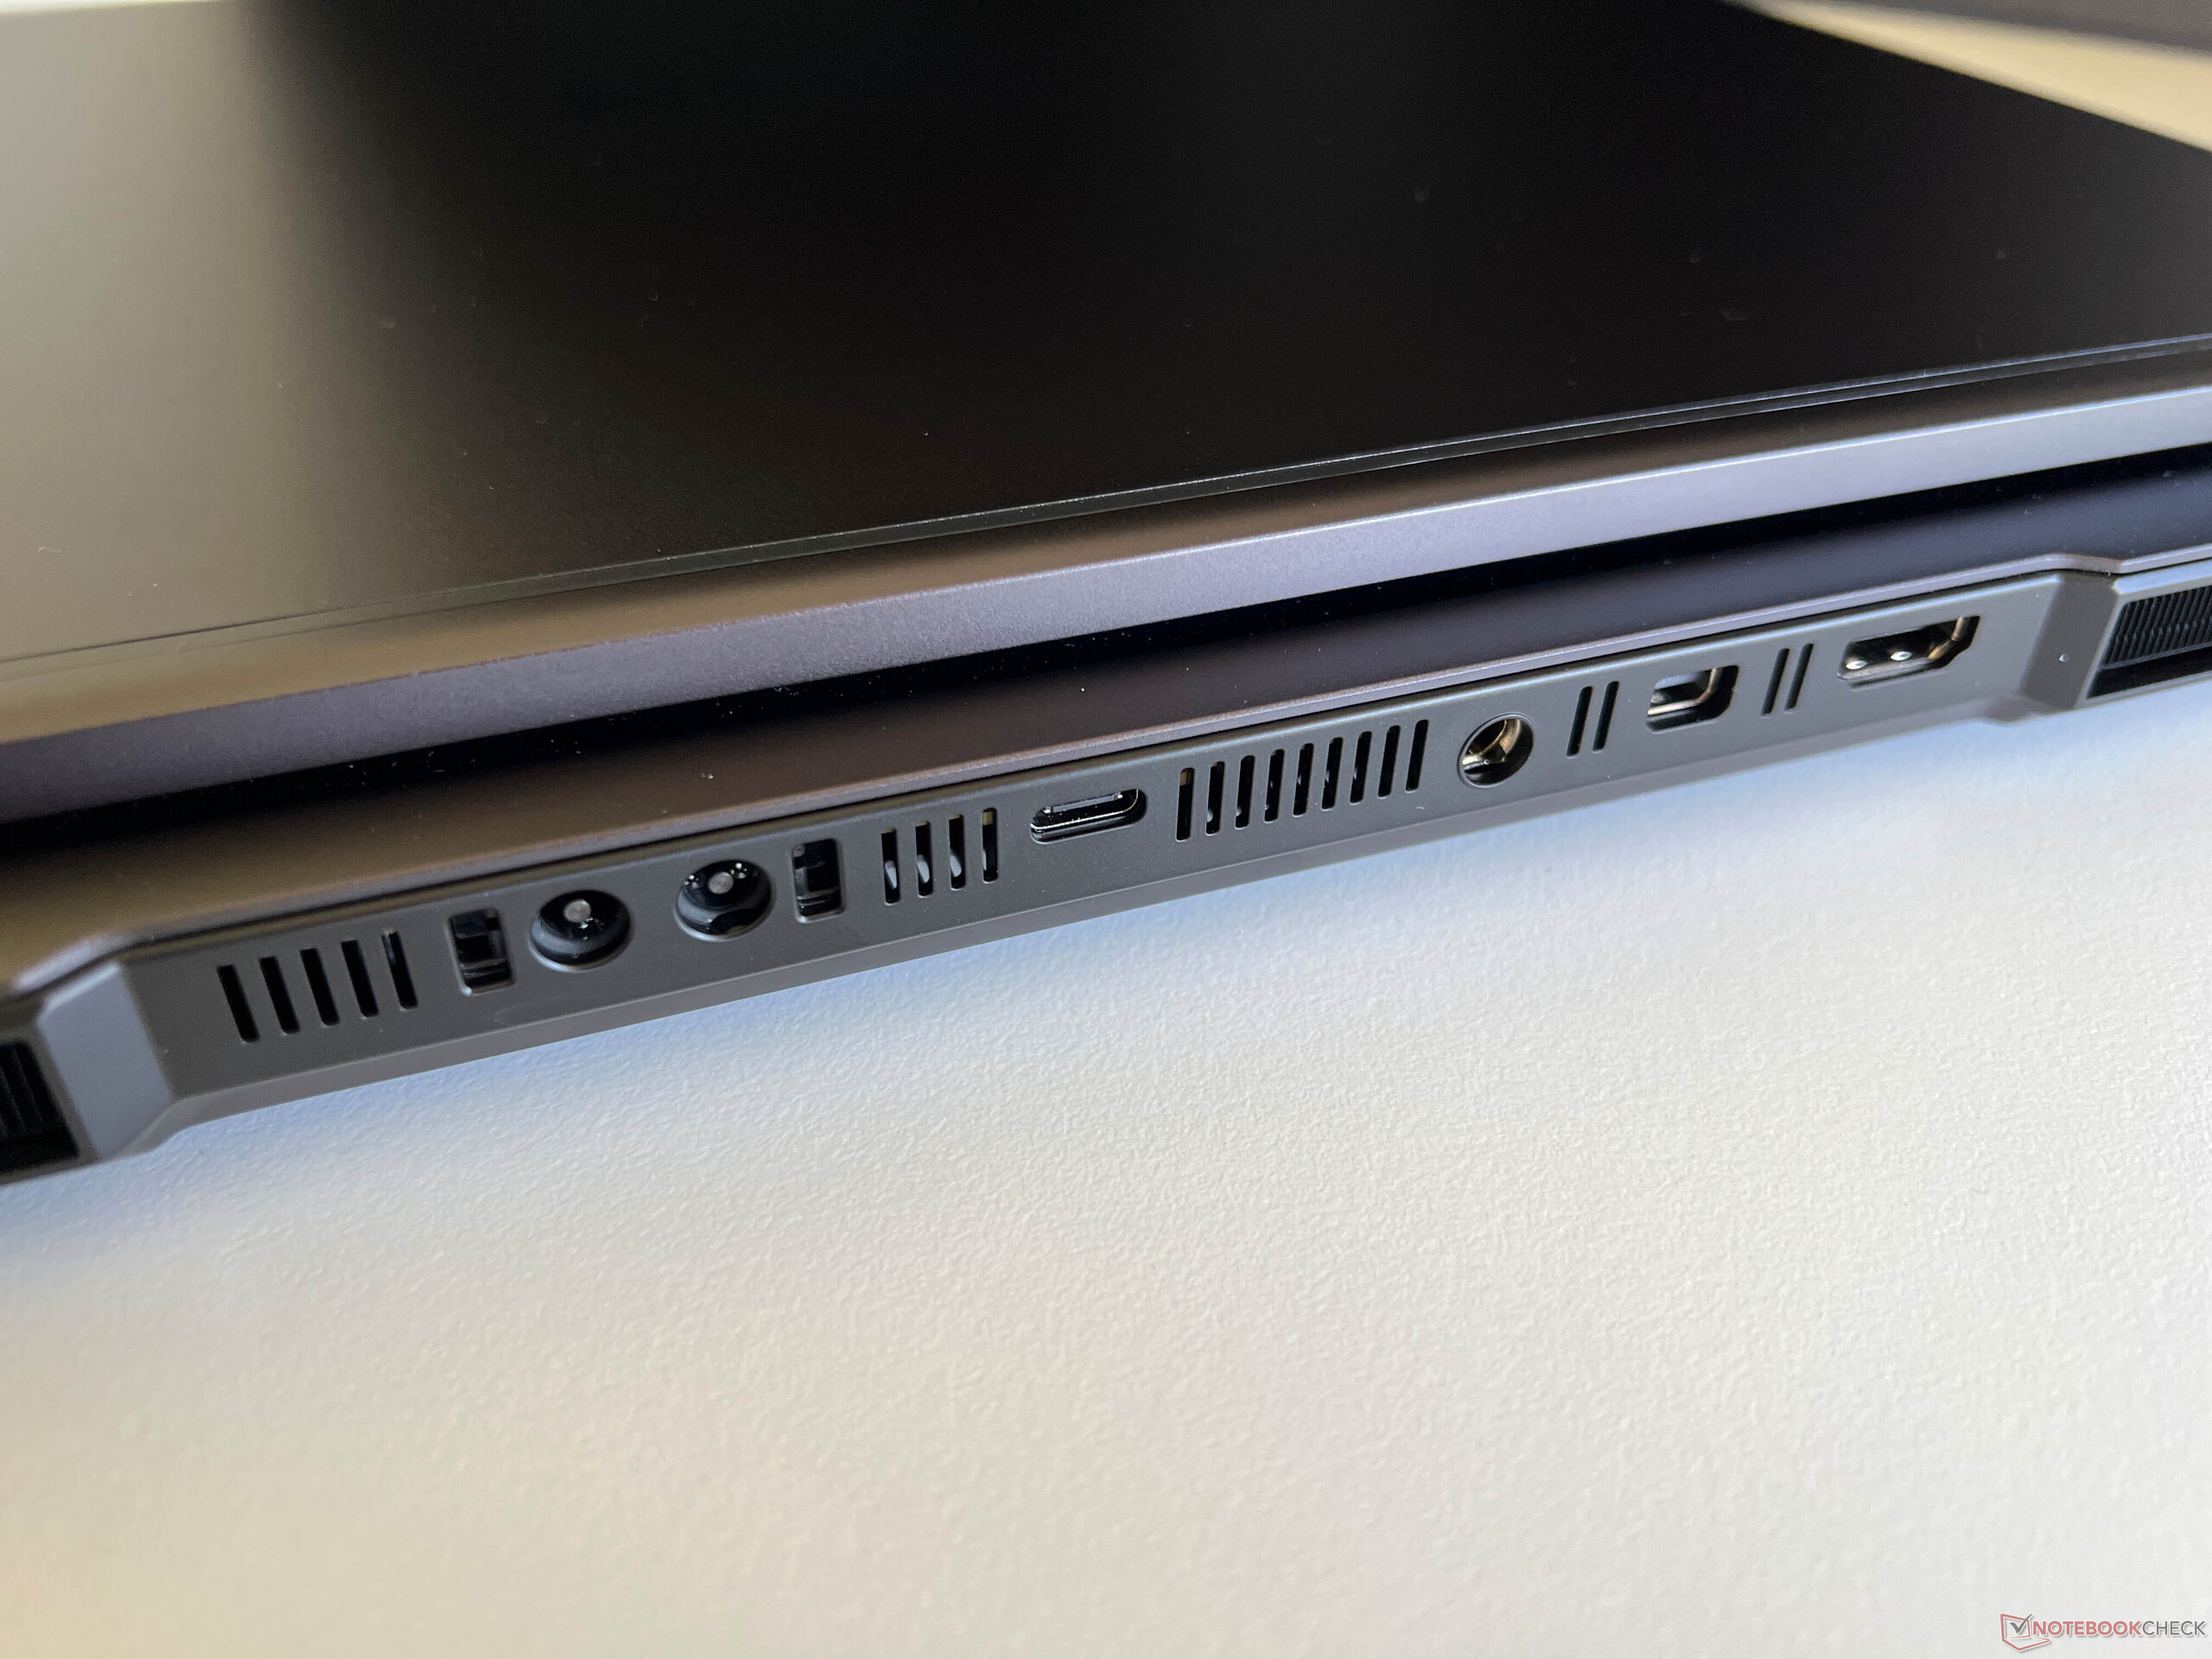
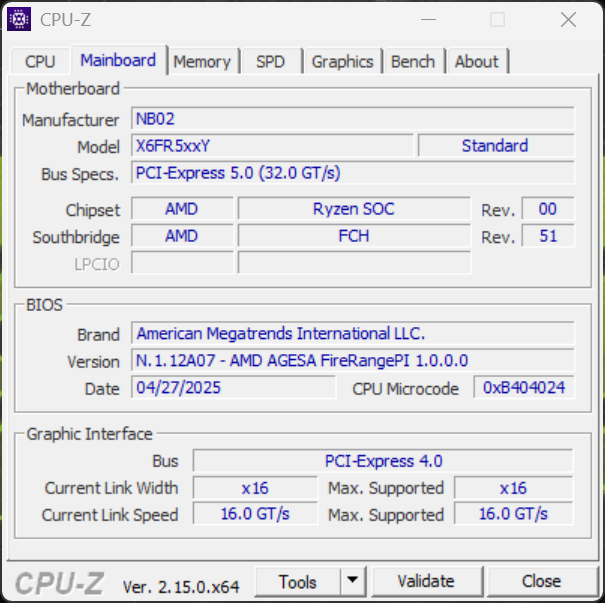
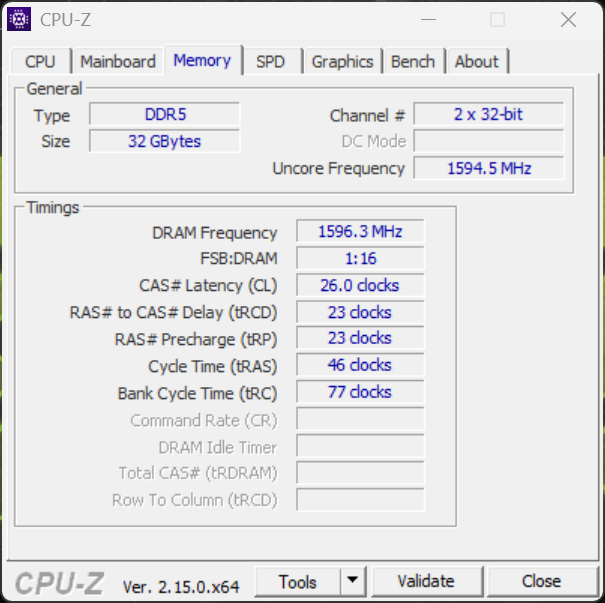
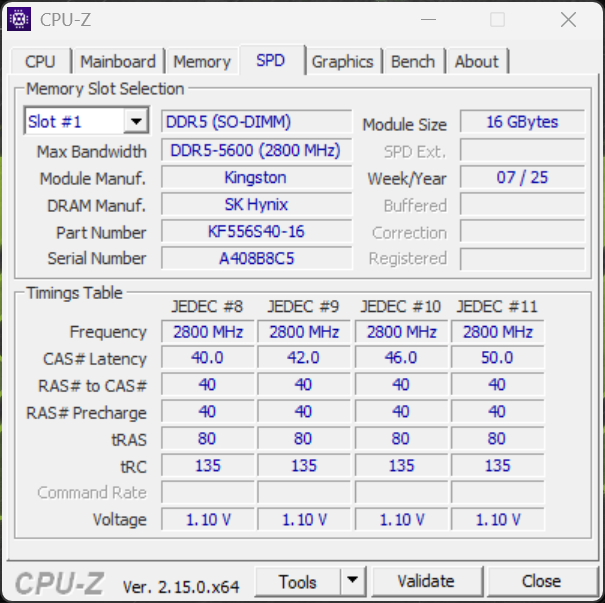
En termes d'équipement, il y a une différence entre le modèle AMD et le modèle Intel du Neo 16. Le modèle AMD n'est actuellement disponible qu'avec 96 Go de mémoire vive et ne prend pas en charge Thunderbolt et USB 4.0. En outre, le modèle Intel peut désormais être commandé avec un module Wi-Fi 7. Le modèle Intel a également un net avantage en termes d'autonomie de la batterie.

Le nouveau mini panneau LED mérite notre recommandation pour l'écran, et le supplément de 175 € est tout à fait justifié. Cependant, le problème de la commutation graphique persiste sur tous les modèles du Neo 16, car Advanced Optimus n'est pas encore pris en charge. XMG informe les clients sur sa page d'accueil officielle https://www.xmg.gg/news-xmg-pro-xmg-neo-2025-status-updates/ et est actuellement en contact avec Nvidia pour résoudre le problème. Cependant, il n'y a actuellement aucune garantie que la fonctionnalité sera mise en œuvre.

Points positifs

+ très haute performance (CPU & GPU)
+ PCIe 5.0 et nombreuses interfaces
+ mini panneau LED extrêmement lumineux
+ très bonne qualité d'image & 300 Hz
+ boîtier robuste et de haute qualité
+ clavier confortable
+ bonnes options de maintenance et jusqu'à 96 Go de RAM
+ lecteur de cartes rapide
+ refroidissement à l'eau en option

Points négatifs

- pas (encore) d'Advanced Optimus & G-Sync pour l'écran interne
- Modèle AMD sans USB 4.0/Wi-Fi 7
- ventilateurs bruyants pendant les jeux
- câble d'alimentation court
- les profils d'usine pour P3 ne sont pas particulièrement précis

Prix et disponibilité

En Allemagne, le XMG Neo 16 A25 peut être commandé chez Bestware à partir de 2 639 €.

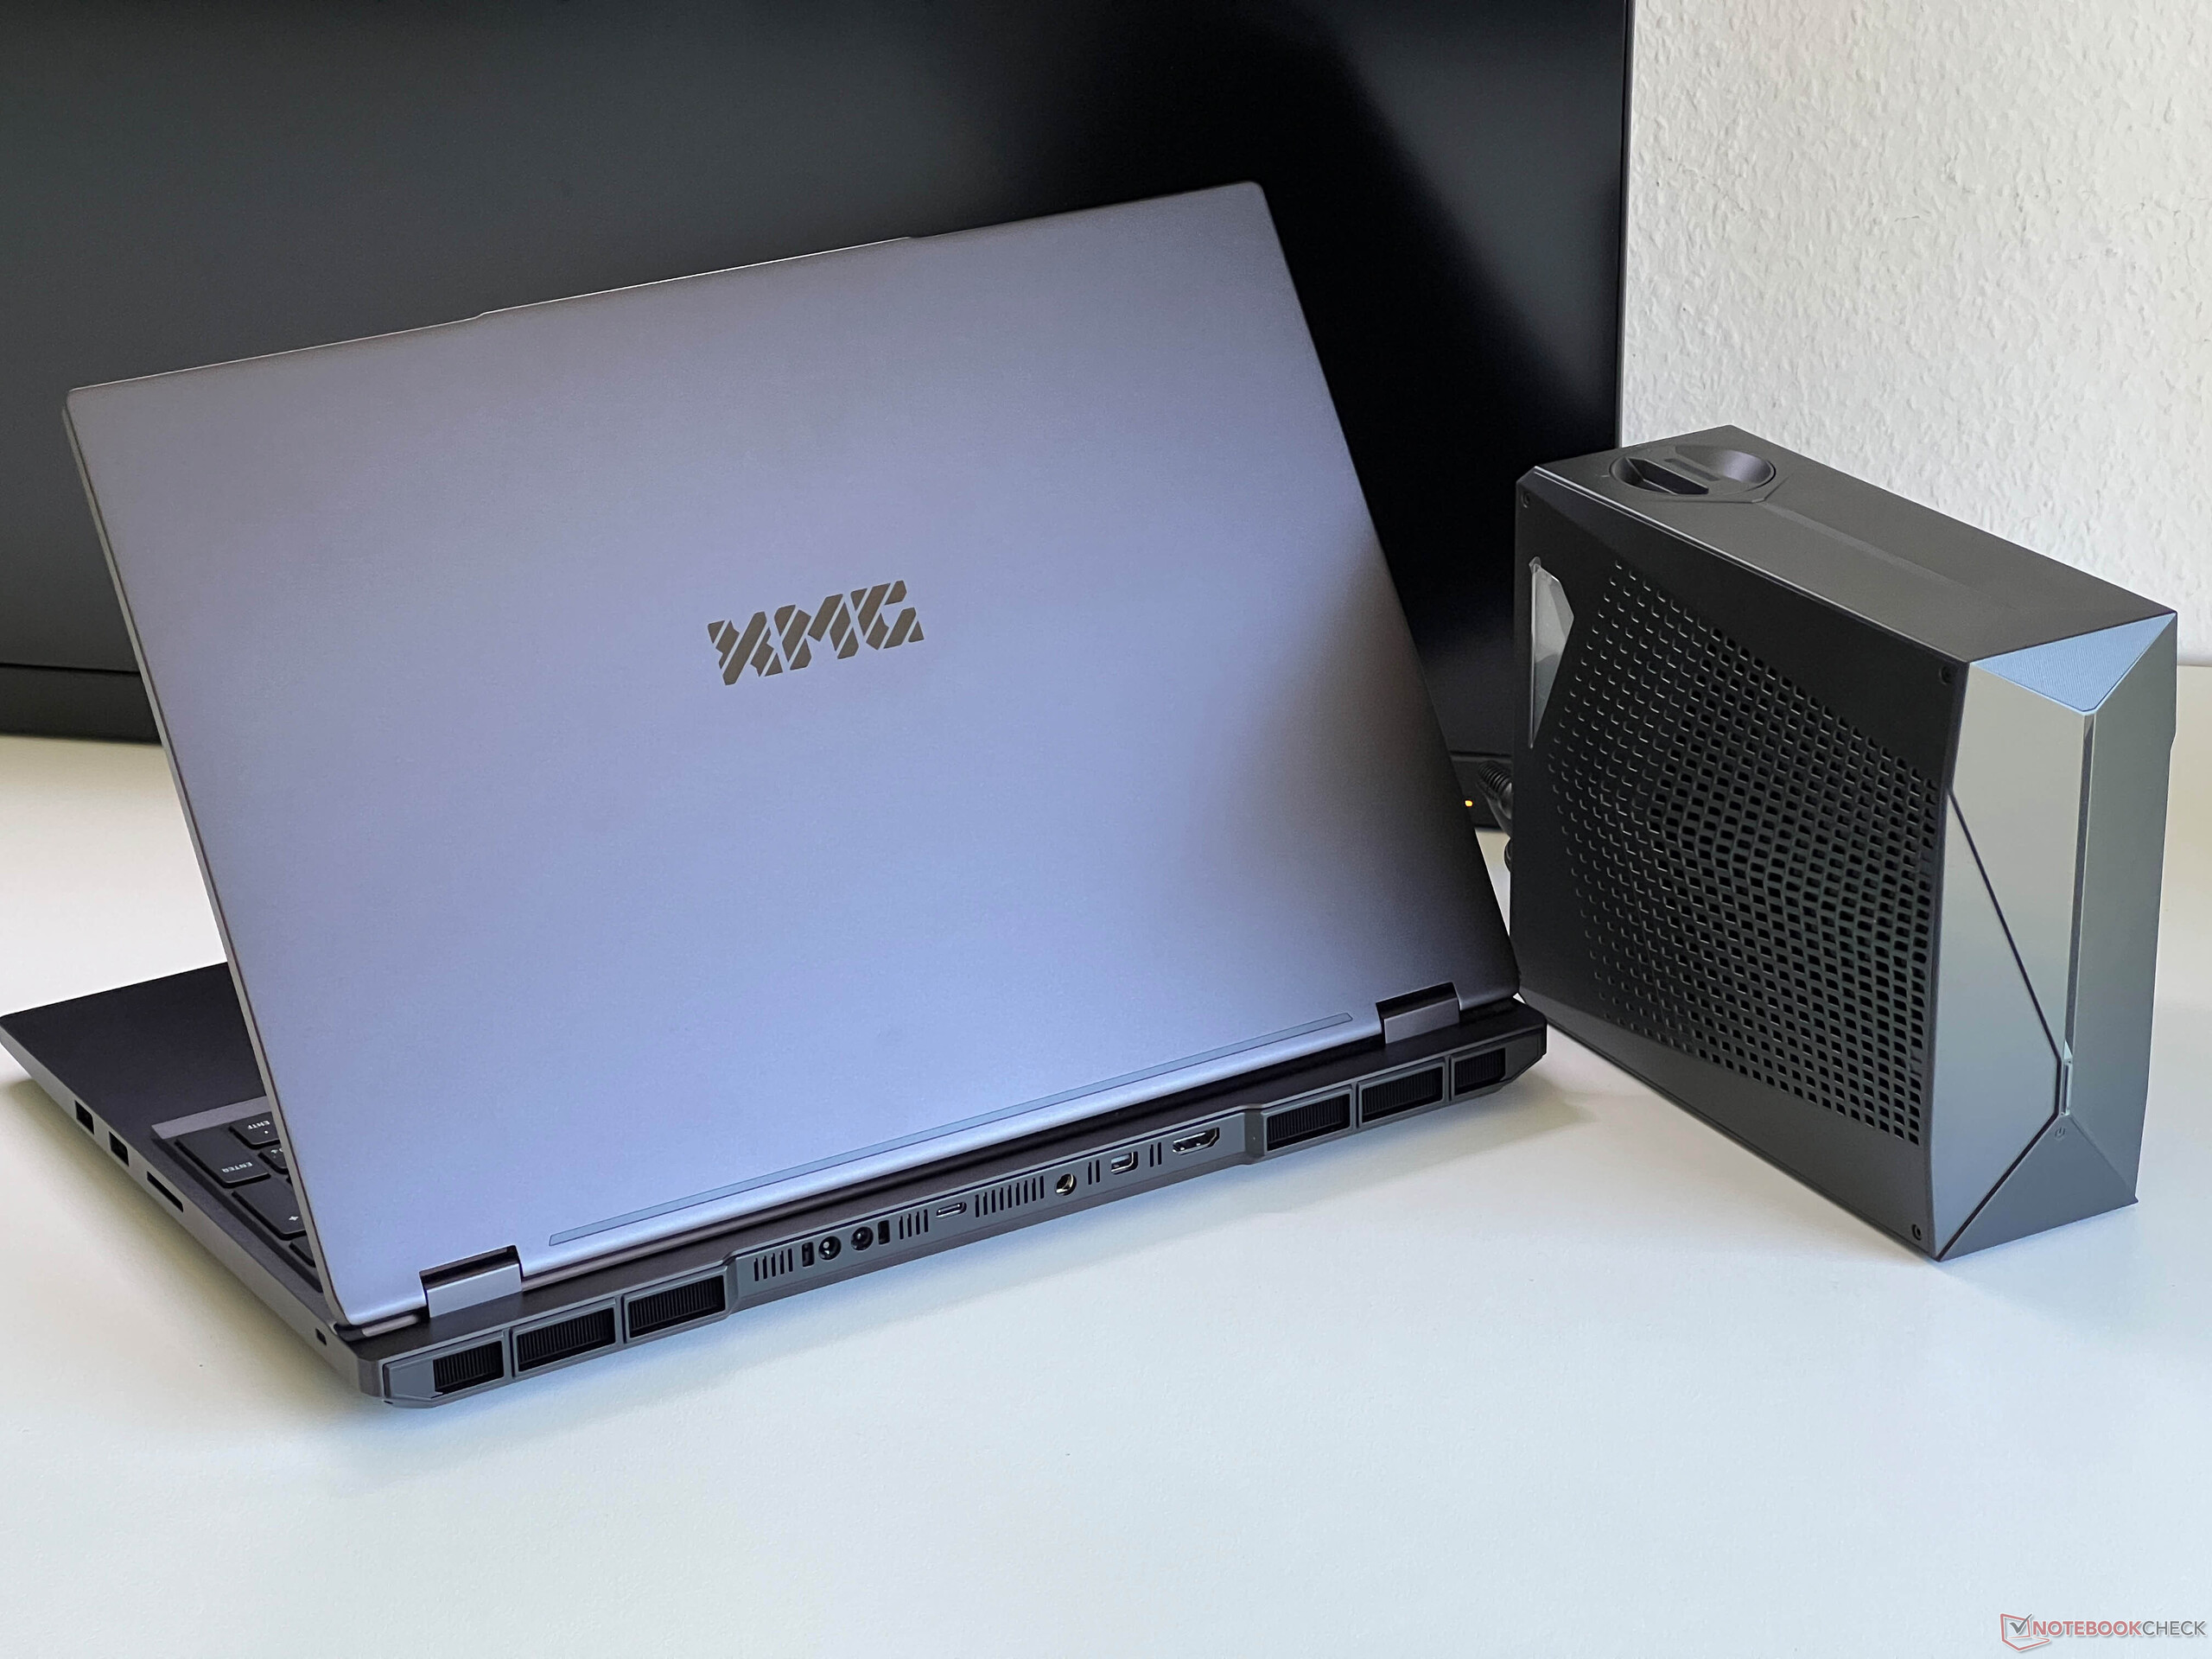
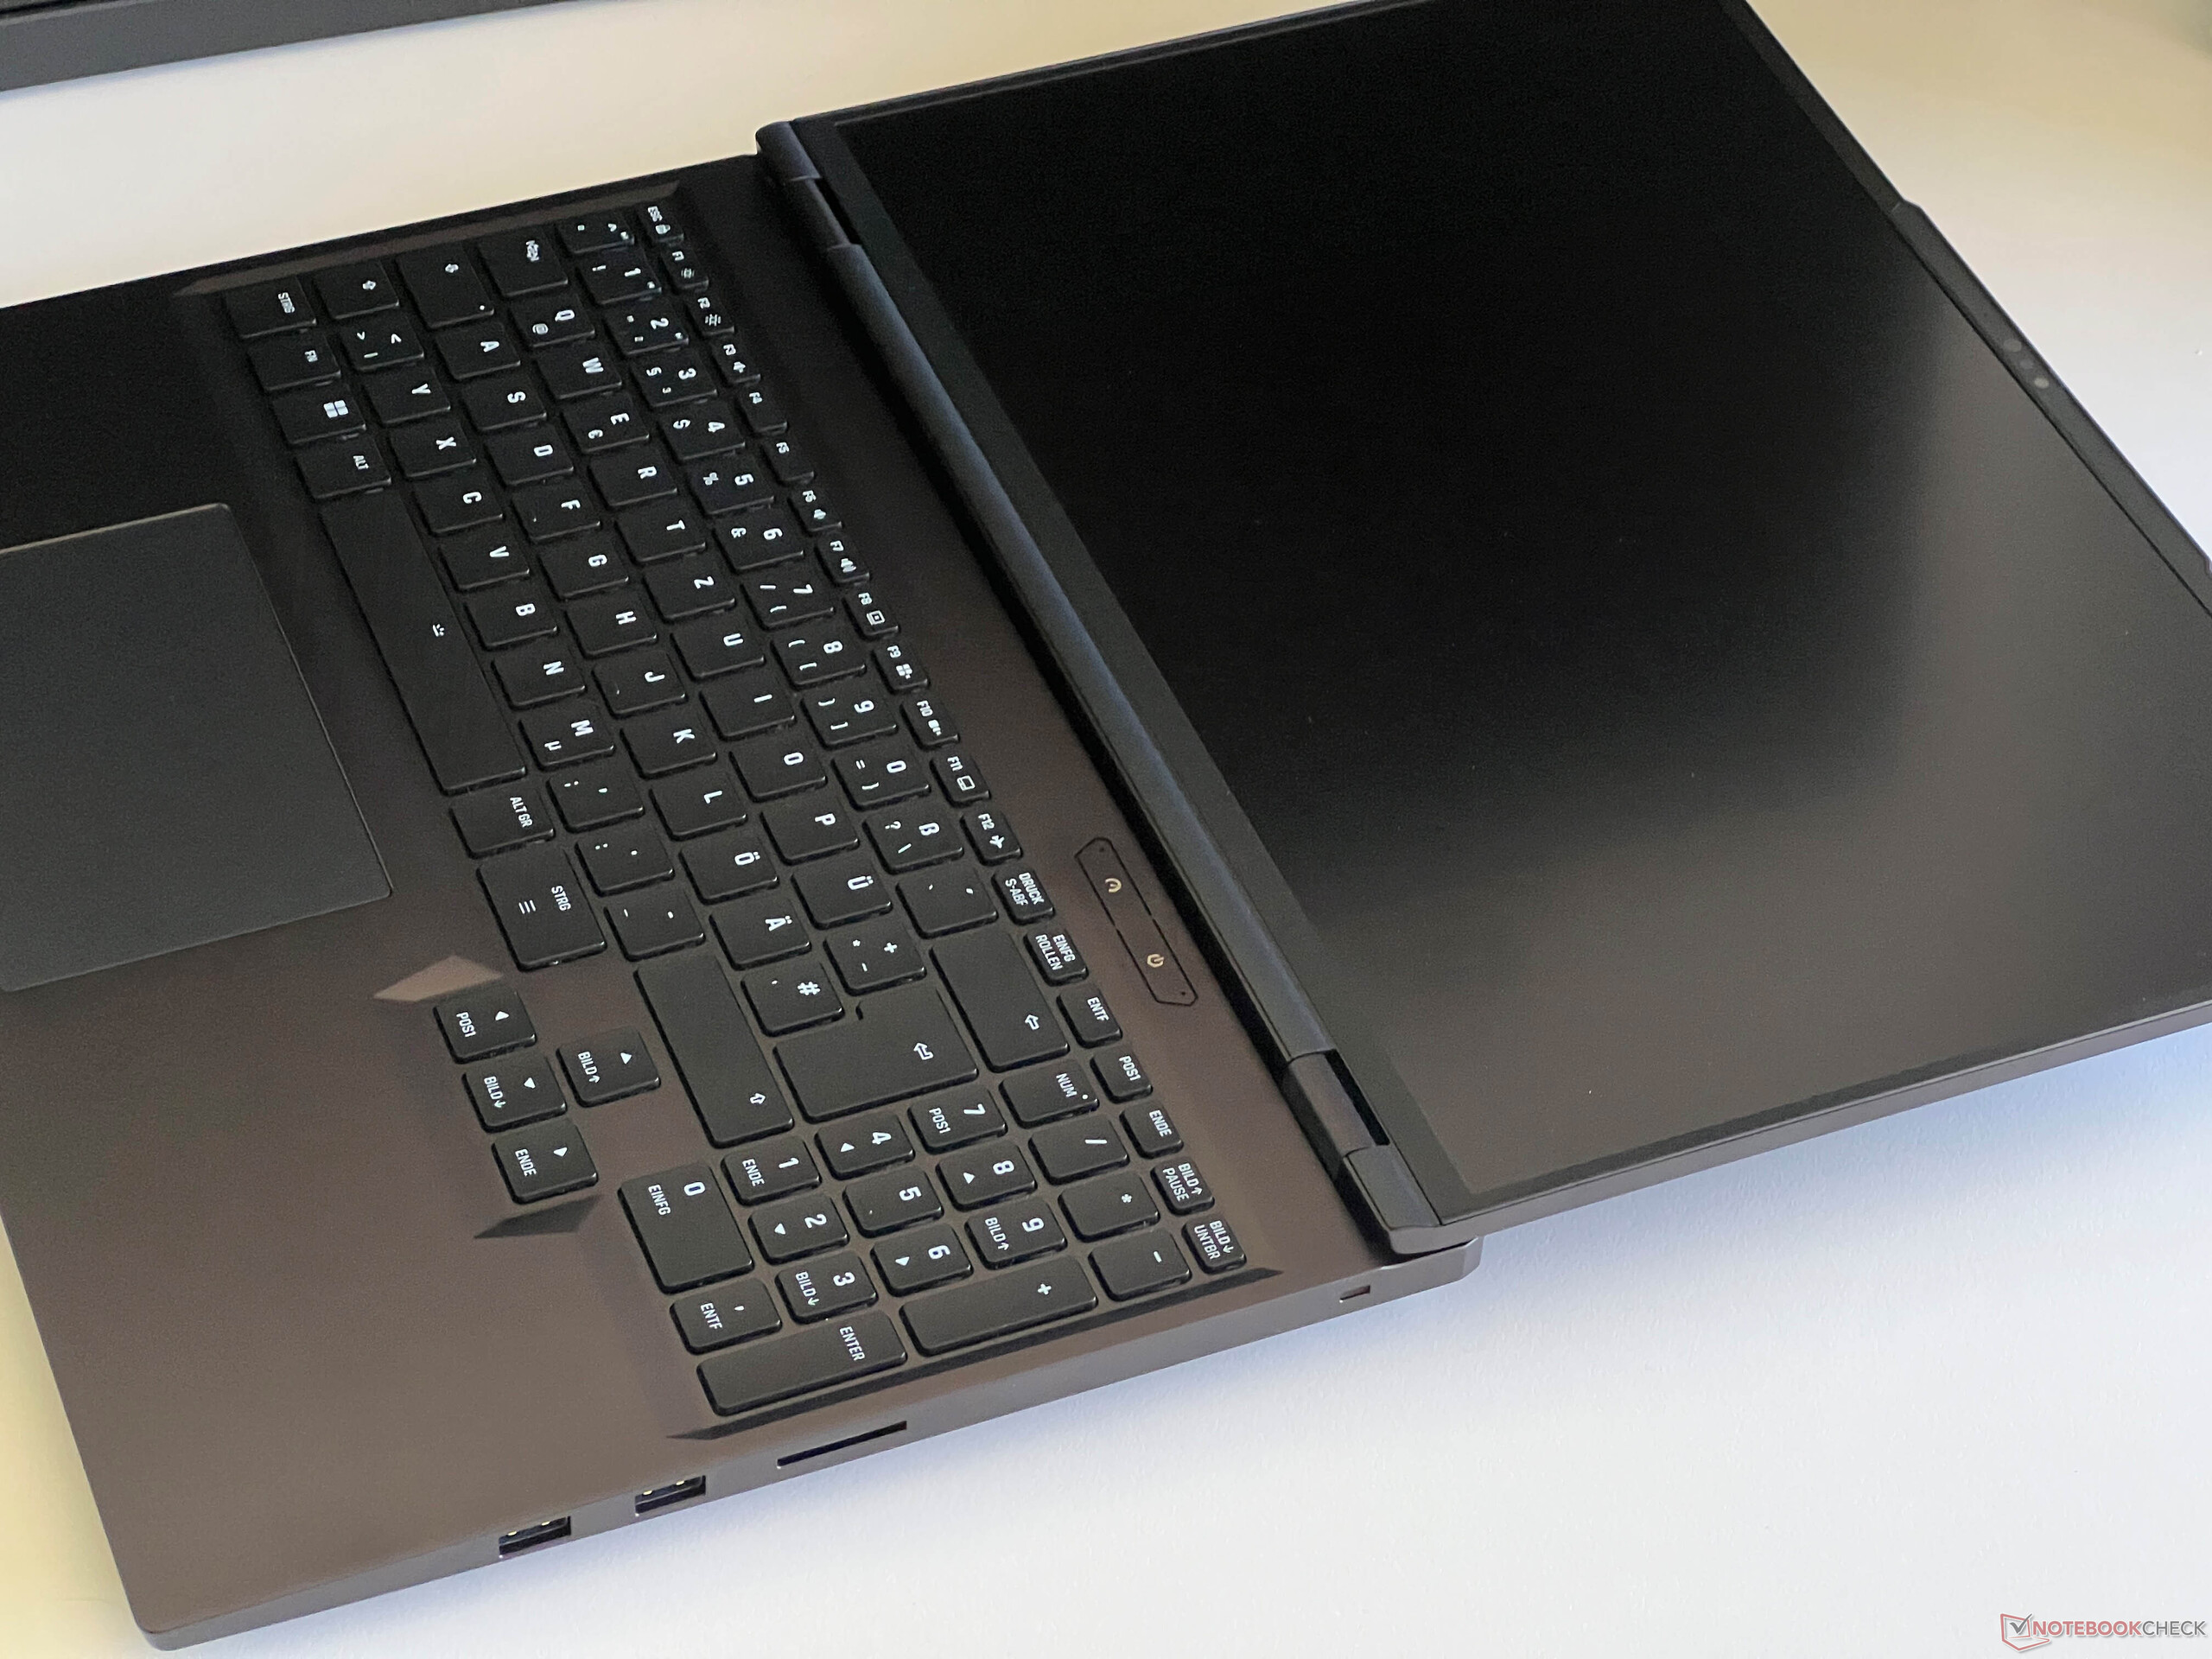
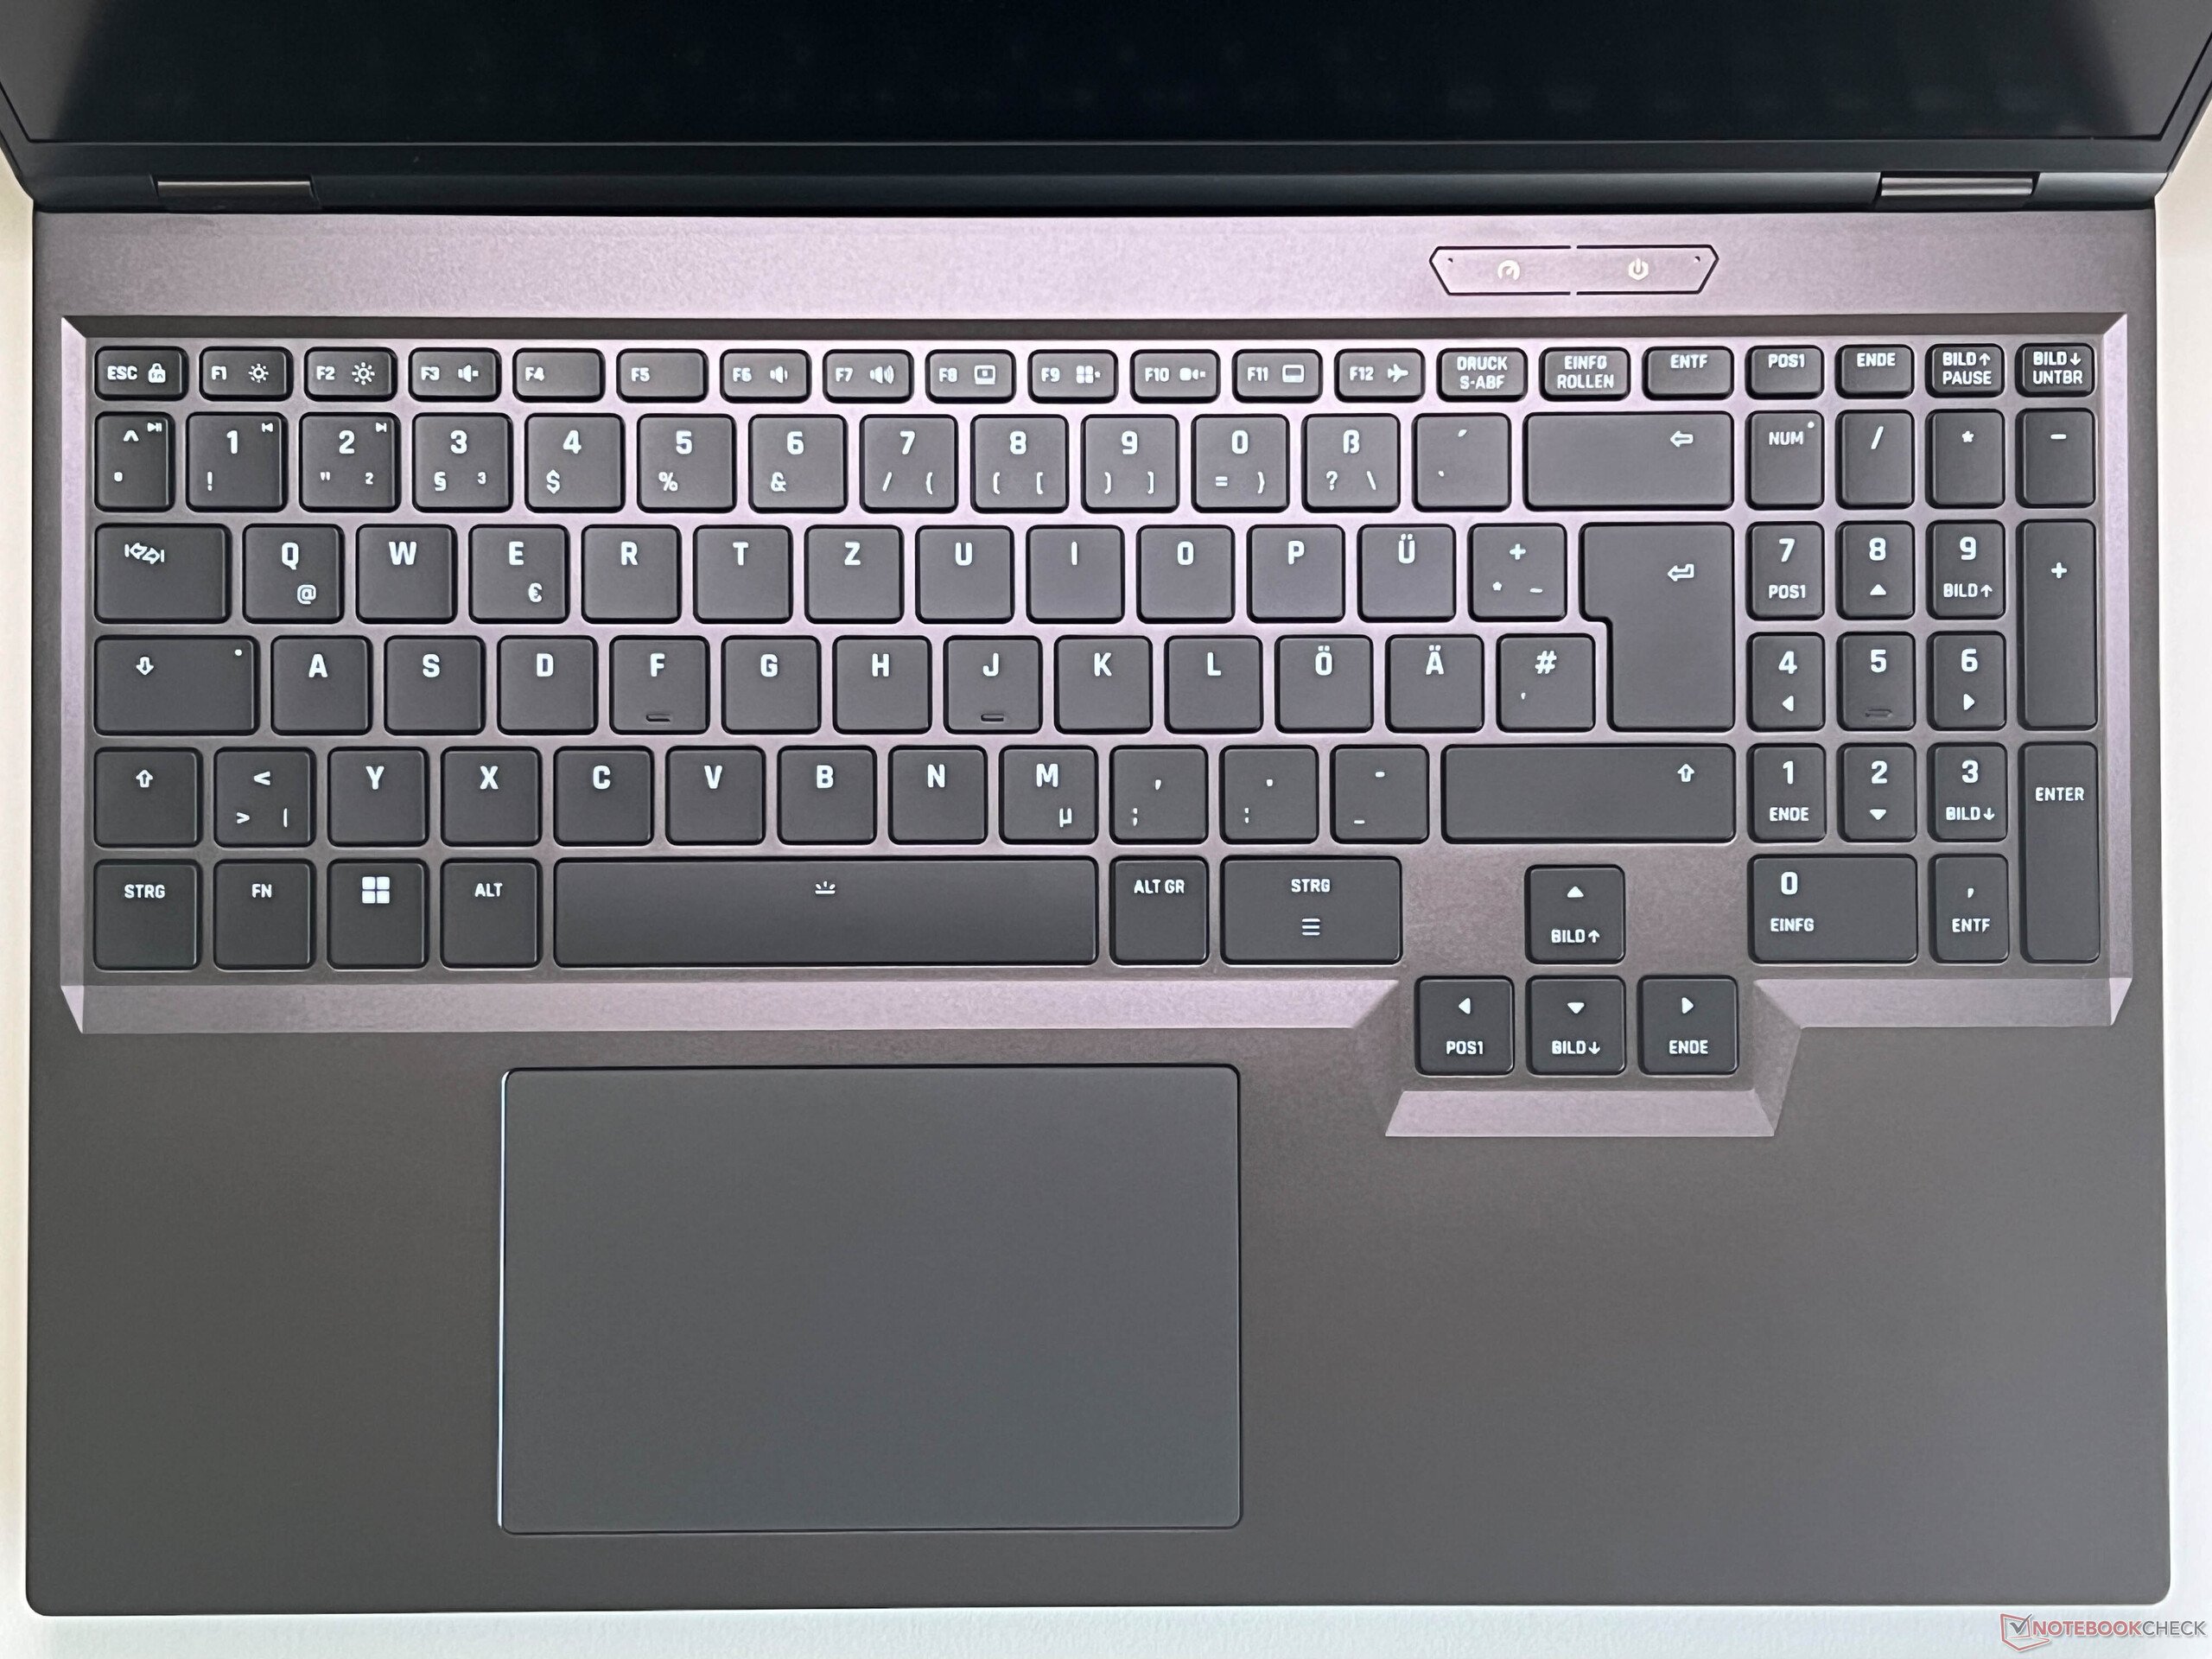
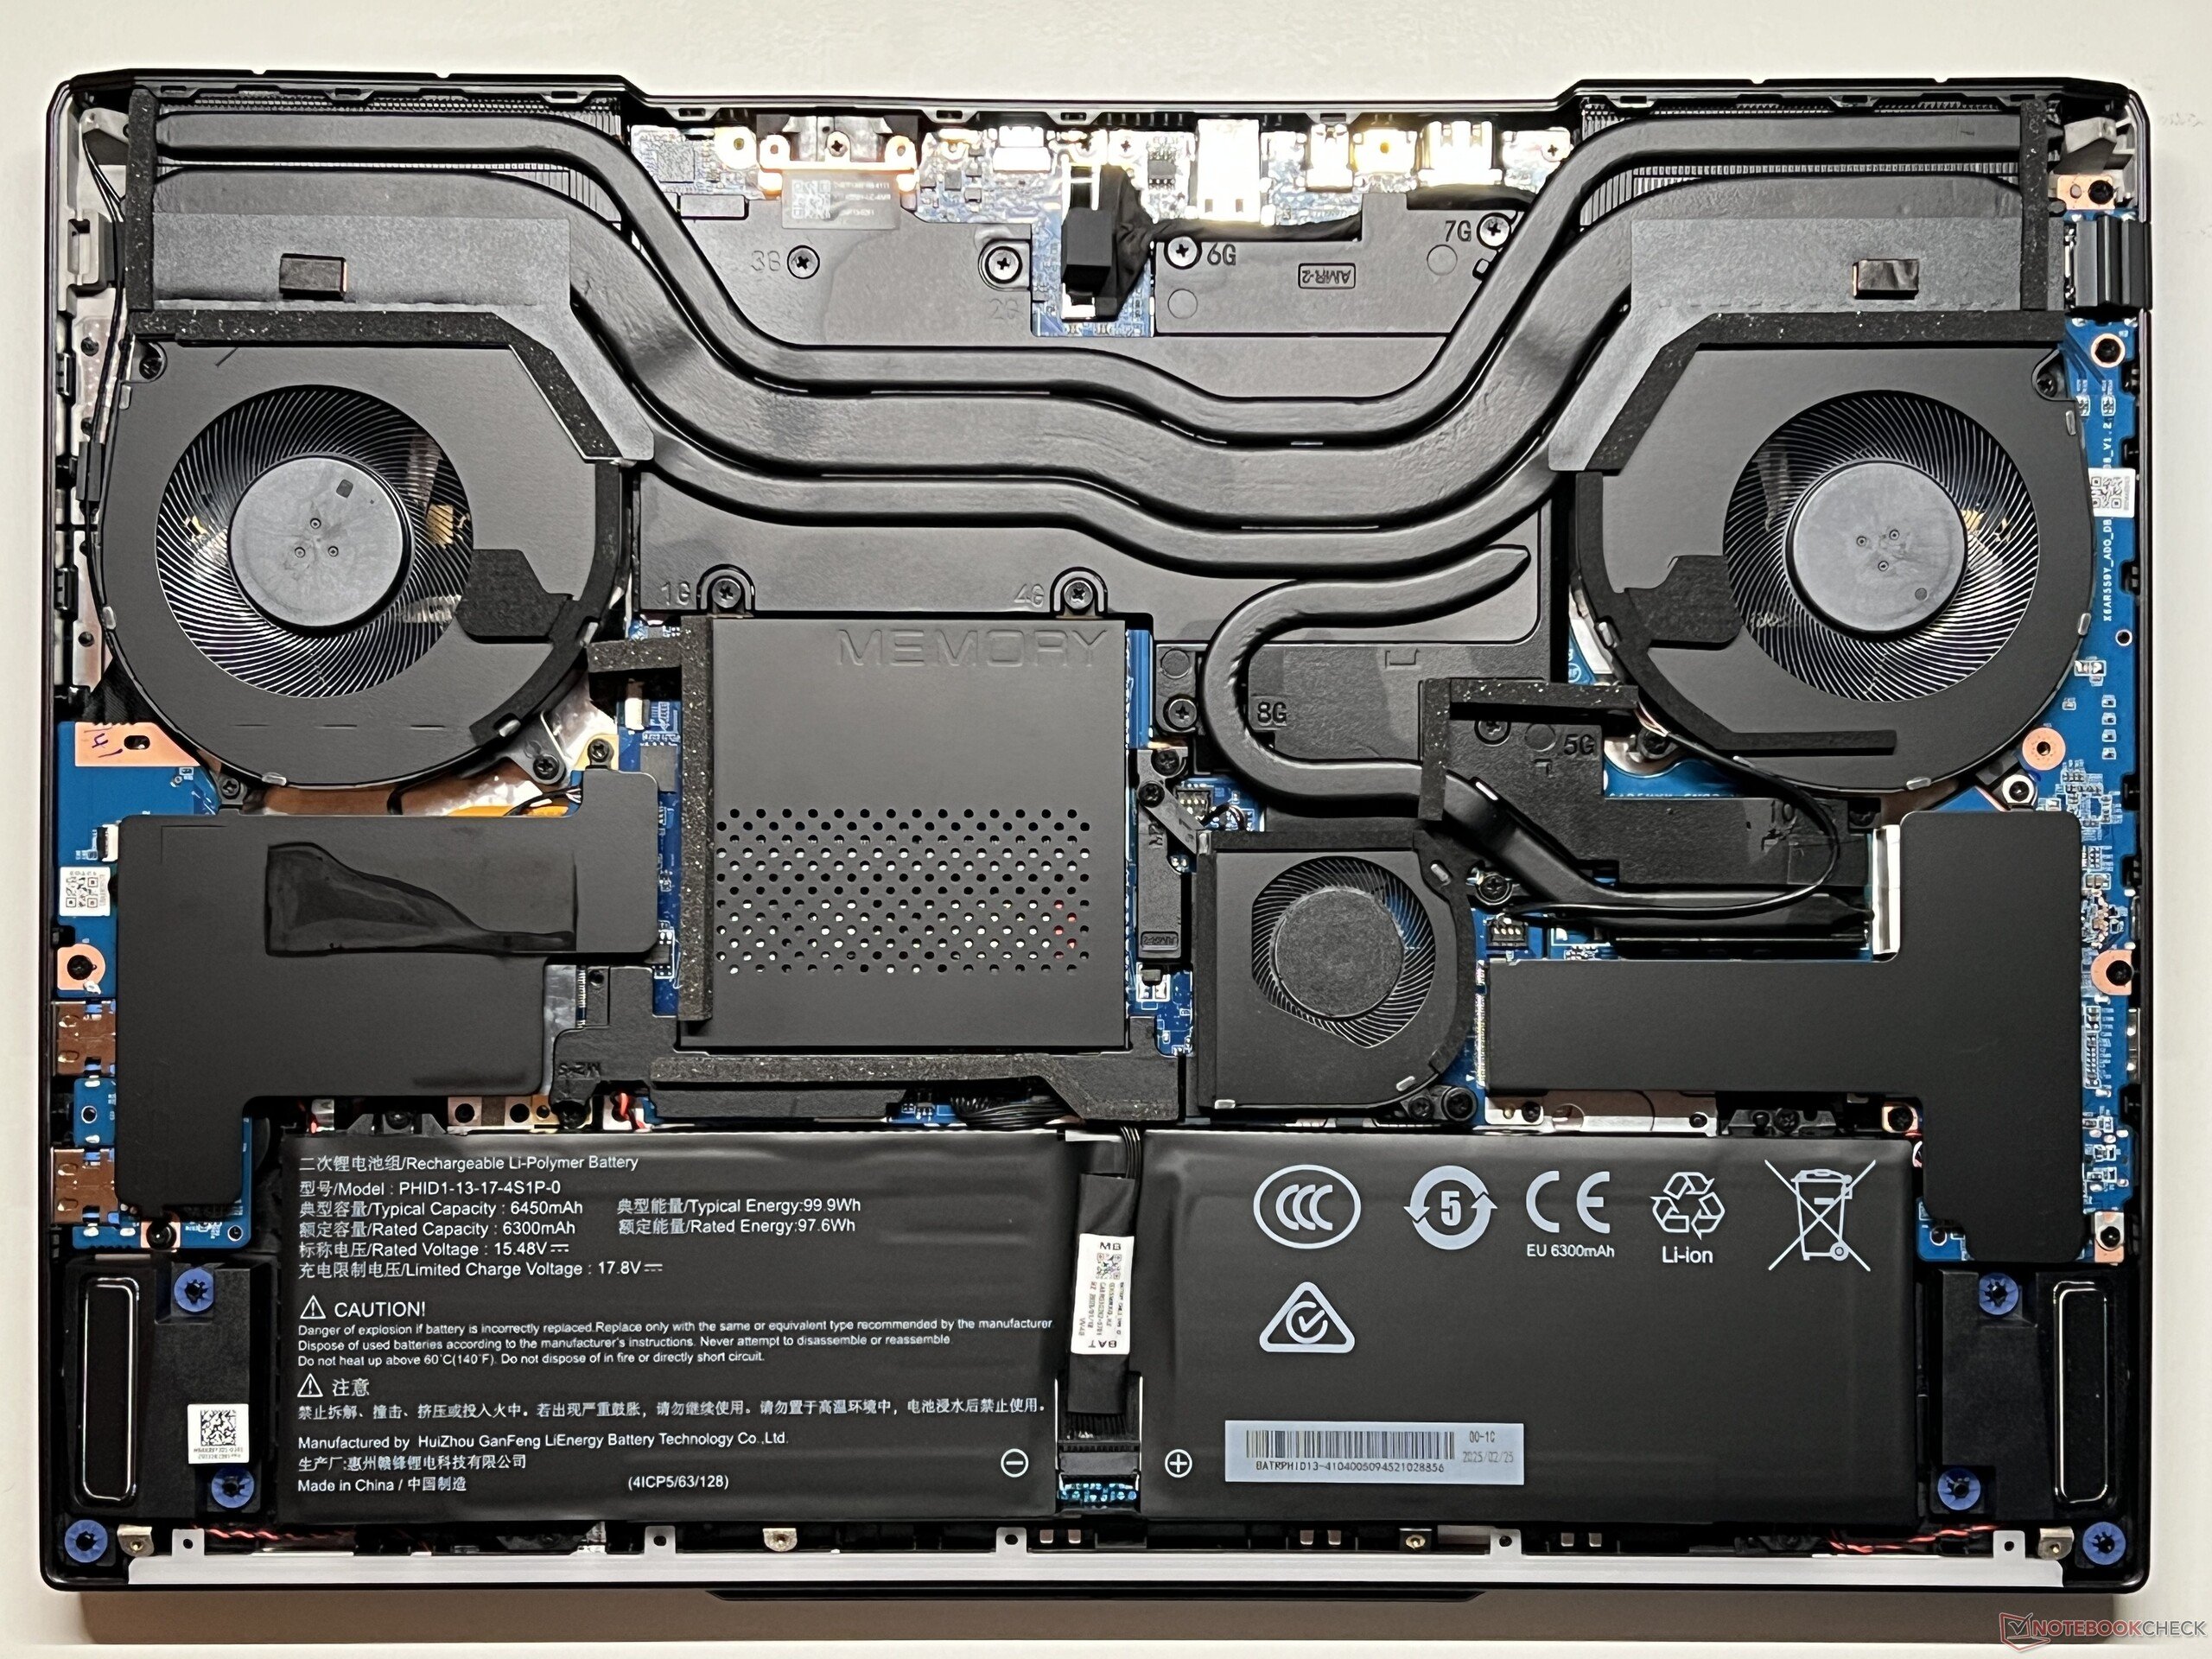
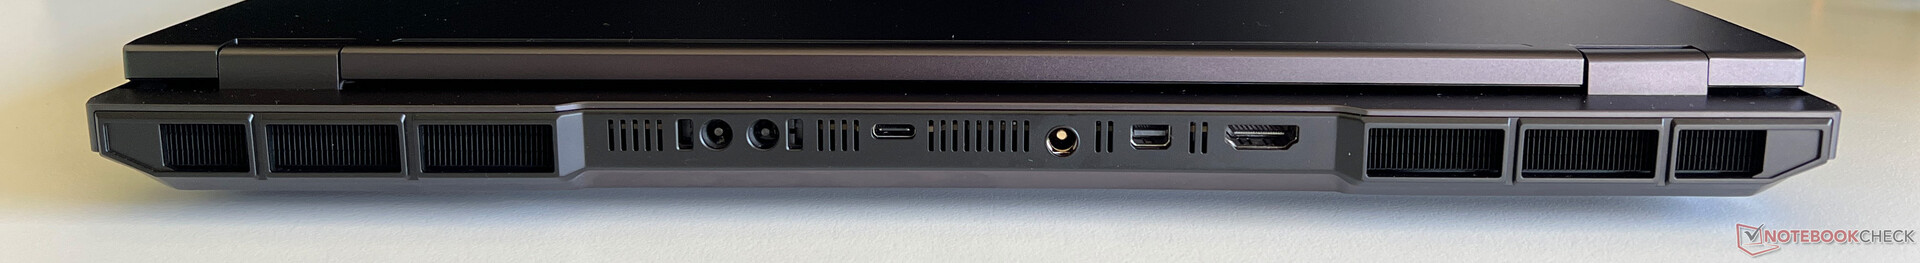
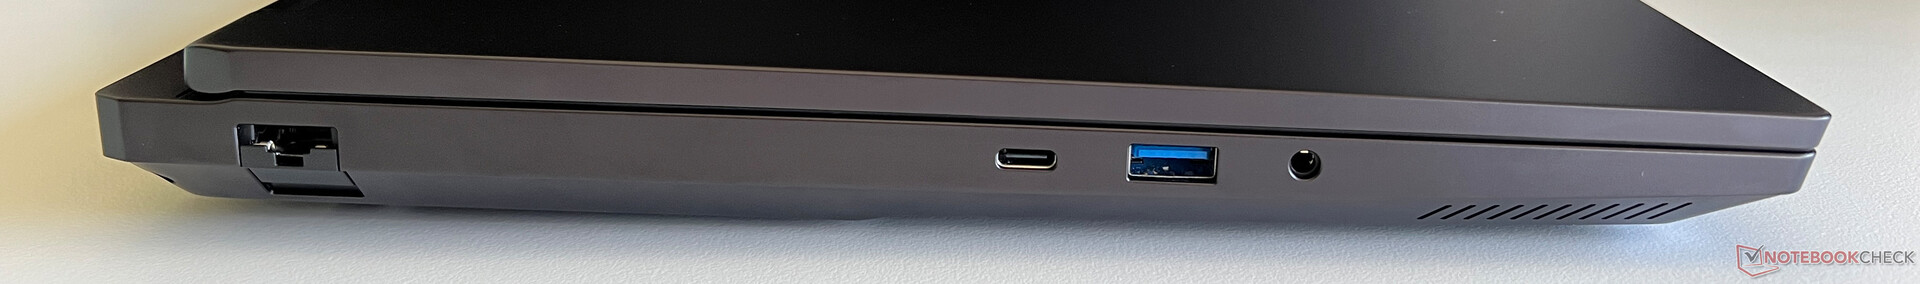
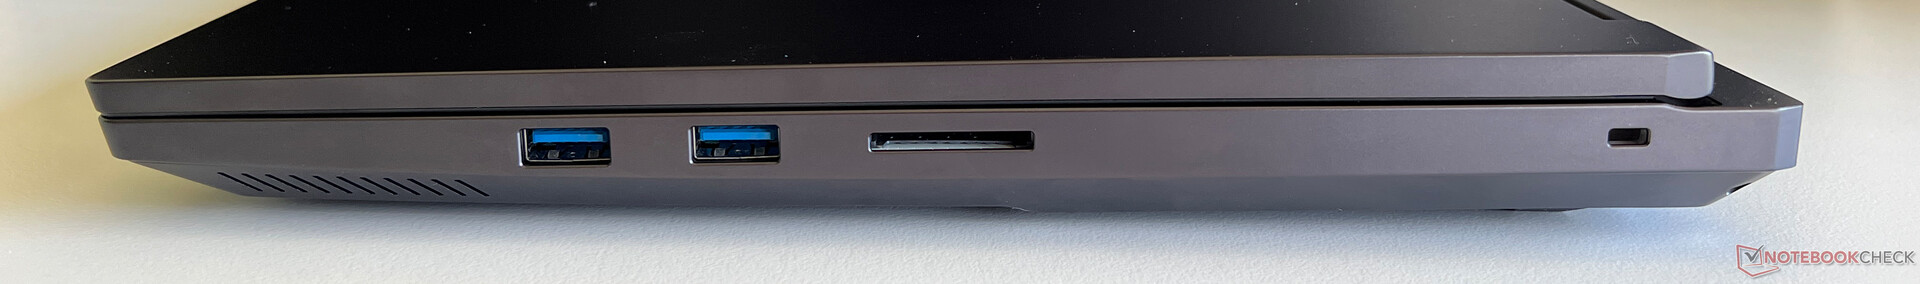
Le Neo 16 avec un processeur AMD partage de nombreuses similitudes avec le Neo 16 E25 (Intel), que nous avons récemment testé. Vous trouverez des informations complètes sur le boîtier, ses caractéristiques, le nouveau mini panneau LED et le refroidissement à l'eau Oasis en option dans notre test du Neo 16 E25.

Spécifications

SCHENKER XMG Neo 16 A25 5090 (XMG Neo 16 Gamme)
Processeur
AMD Ryzen 9 9955HX3D 16 x - 5.4 GHz, 160 W PL2 / Short Burst, 145 W PL1 / Sustained, Fire Range-HX (Zen 5)
Carte graphique
Nvidia GeForce RTX 5090 Laptop - 24 Go VRAM, Processeur: 2604 MHz, RAM: 1750 MHz, 175 W TDP ( y compris 25 W Dynamic Boost), GDDR7, 576.52, Optimus, MUX-Switch
Mémoire
32 Go 
, DDR5-5600, Dual-Channel, 2 Slots, max. 96 GB
Écran
16.00 pouces 16:10, 2560 x 1600 pixel 189 PPP, NE160QDM-NM9, Mini-LED, brillant: non, HDR, 300 Hz, Adaptive Sync
Carte mère
AMD Promontory/Bixby FCH
Disque dur
Kingston Fury Renegade SFYRS1000G, 1024 Go 
, 873 Go libres
Carte son
AMD Zen - Audio Processor - HD Audio Controller
Connexions
3 USB 3.0 / 3.1 Gen1, 2 USB 3.1 Gen2, USB-C Power Delivery (PD), 1 HDMI, 2 DisplayPort, 1 Encoche de Sécurité Kensington, Connectique audio: 3.5 mm Audio, Lecteur de cartes mémoires: SDXC
Réseau
Realtek RTL8125 2.5GBe Family Ethernet Controller (10/100/1000/2500MBit/s), Intel Wi-Fi 6E AX210 (a/b/g/h/n = Wi-Fi 4/ac = Wi-Fi 5/ax = Wi-Fi 6/), Bluetooth 5.3
Taille
Hauteur x Largeur x Profondeur (en mm): 27.9 x 356.7 x 259.9
Batterie
99.8 Wh, 6450 mAh Lithium-Polymère
Système d'exploitation
Microsoft Windows 11 Home
Appareil photo
Webcam: 1080p w/ mechanical shutter + IR
Appareil photo primaire: 2 MPix
Fonctionnalités additionnelles
Haut-parleurs: Stereo, Clavier: Chiclet, Rétroéclairage du clavier: oui, 420W PSU, 24 Mois Garantie
Poids
2.855 kg, Alimentation: 835 g
Prix
4480 euros
Remarque : le fabricant peut utiliser des composants provenant de différents fournisseurs, notamment des panneaux d'affichage, des lecteurs ou des clés USB ayant des spécifications similaires.


Comparaison des tailles

357 mm 245 mm 30 mm 2.8 kg357 mm 254 mm 29.9 mm 2.5 kg354 mm 268 mm 30.8 mm 2.8 kg356.7 mm 259.9 mm 27.9 mm 2.9 kg356.7 mm 259.9 mm 27.9 mm 2.9 kg357 mm 269 mm 24.9 mm 2.8 kg297 mm 210 mm 1 mm 5.7 g
Arrière : connexion pour le refroidissement à eau Oasis, USB-C 3.2 Gen.2 (10 GBit/s, DisplayPort 1.4a, 140 Watt Power Delivery), connexion d'alimentation, Mini-DisplayPort 2.1, HDMI 2.1
À gauche : Ethernet (2,5 GBit/s), USB-C 3.2 Gen.2 (10 GBit/s, DisplayPort 1.4a, 100 Watt Power Delivery), USB-A 3.2 Gen.1 (5 GBit/s), audio 3,5 mm
À droite : 2x USB-A 3.2 Gen.1 (5 GBit/s), lecteur de carte SD, Kensington NanoSaver Lock

Performances - Ryzen 9 9955HX3D avec jusqu'à 96 Go de RAM


Profil énergétique CPU TDP CB 2024 Multi GPU TGP Time Spy Graphics CP 2077 QHD Ultra max. Volume du ventilateur
Équilibré 45 watts 1 296 points 150 watts 22 210 points 103,4 fps 45,9 dB(A)
Enthusiast 85 watts 1 826 points 150 watts 22 239 points 103,6 fps 49,8 dB(A)
Overboost 160/145 watts 2,120 points 175 watts 24,121 points 111.2 fps 55.5 dB(A)
batterie (Enthusiast) 42/35 watts 979 points 40 watts 5,476 points 25.4 fps 33.8 dB(A)

Cinebench R15 Multi loop

03156309451260157518902205252028353150346537804095441047255040535556705985Tooltip
SCHENKER XMG Neo 16 A25 5090 AMD Ryzen 9 9955HX3D: Ø5974 (5932.08-6044.12)
Medion Erazer Beast 16 X1 Ultimate Intel Core Ultra 9 275HX: Ø5347 (4011.63-6161.43)
SCHENKER XMG Neo 16 E25 RTX 5090 Laptop Intel Core Ultra 9 275HX: Ø6151 (6038.65-6270.58)
Asus ROG Strix Scar 16 2025 Intel Core Ultra 9 275HX: Ø5832 (5537.87-5930.32)
HP Omen Max 16 ah000 Intel Core Ultra 9 275HX: Ø5145 (5108.56-5171.97)
Aorus MASTER 16 AM6H Intel Core Ultra 9 275HX: Ø5596 (5505.09-5679.4)
CPU Performance Rating: Percent
Cinebench 2024: CPU Multi Core | CPU Single Core
Cinebench R23: Multi Core | Single Core
Cinebench R20: CPU (Multi Core) | CPU (Single Core)
Cinebench R15: CPU Multi 64Bit | CPU Single 64Bit
Blender: v2.79 BMW27 CPU
7-Zip 18.03: 7z b 4 | 7z b 4 -mmt1
Geekbench 6.4: Multi-Core | Single-Core
Geekbench 5.5: Multi-Core | Single-Core
HWBOT x265 Benchmark v2.2: 4k Preset
LibreOffice : 20 Documents To PDF
R Benchmark 2.5: Overall mean
CPU Performance Rating
SCHENKER XMG Neo 16 E25 RTX 5090 Laptop
Intel Core Ultra 9 275HX
86.8 pt
SCHENKER XMG Neo 16 A25 5090
AMD Ryzen 9 9955HX3D
86 pt
Moyenne AMD Ryzen 9 9955HX3D
 
85.7 pt
Asus ROG Strix Scar 16 2025
Intel Core Ultra 9 275HX
83.4 pt
Medion Erazer Beast 16 X1 Ultimate
Intel Core Ultra 9 275HX
78.9 pt
Aorus MASTER 16 AM6H -2!
Intel Core Ultra 9 275HX
78.7 pt
HP Omen Max 16 ah000
Intel Core Ultra 9 275HX
75.3 pt
Moyenne de la classe Gaming
 
61.1 pt
Cinebench 2024 / CPU Multi Core
SCHENKER XMG Neo 16 E25 RTX 5090 Laptop
Intel Core Ultra 9 275HX
2254 Points +6%
Asus ROG Strix Scar 16 2025
Intel Core Ultra 9 275HX
2196 Points +4%
SCHENKER XMG Neo 16 A25 5090
AMD Ryzen 9 9955HX3D
2120 Points
Moyenne AMD Ryzen 9 9955HX3D
  (2072 - 2160, n=3)
2117 Points 0%
HP Omen Max 16 ah000
Intel Core Ultra 9 275HX
1913 Points -10%
Medion Erazer Beast 16 X1 Ultimate
Intel Core Ultra 9 275HX
1547 Points -27%
Moyenne de la classe Gaming
  (331 - 2298, n=74, 2 dernières années)
1388 Points -35%
Cinebench 2024 / CPU Single Core
SCHENKER XMG Neo 16 E25 RTX 5090 Laptop
Intel Core Ultra 9 275HX
138.2 Points +6%
Medion Erazer Beast 16 X1 Ultimate
Intel Core Ultra 9 275HX
136 Points +5%
HP Omen Max 16 ah000
Intel Core Ultra 9 275HX
130.7 Points +1%
Asus ROG Strix Scar 16 2025
Intel Core Ultra 9 275HX
130.5 Points 0%
SCHENKER XMG Neo 16 A25 5090
AMD Ryzen 9 9955HX3D
130 Points
Moyenne AMD Ryzen 9 9955HX3D
  (129.4 - 130, n=3)
129.7 Points 0%
Moyenne de la classe Gaming
  (68.2 - 138.2, n=75, 2 dernières années)
118.9 Points -9%
Cinebench R23 / Multi Core
SCHENKER XMG Neo 16 E25 RTX 5090 Laptop
Intel Core Ultra 9 275HX
40951 Points +4%
SCHENKER XMG Neo 16 A25 5090
AMD Ryzen 9 9955HX3D
39266 Points
Moyenne AMD Ryzen 9 9955HX3D
  (38864 - 39266, n=2)
39065 Points -1%
Asus ROG Strix Scar 16 2025
Intel Core Ultra 9 275HX
38039 Points -3%
Aorus MASTER 16 AM6H
Intel Core Ultra 9 275HX
36329 Points -7%
HP Omen Max 16 ah000
Intel Core Ultra 9 275HX
33449 (32761.6min - 33449.1max) Points -15%
Medion Erazer Beast 16 X1 Ultimate
Intel Core Ultra 9 275HX
30712 Points -22%
Moyenne de la classe Gaming
  (5668 - 40970, n=147, 2 dernières années)
23219 Points -41%
Cinebench R23 / Single Core
SCHENKER XMG Neo 16 E25 RTX 5090 Laptop
Intel Core Ultra 9 275HX
2260 Points +4%
Medion Erazer Beast 16 X1 Ultimate
Intel Core Ultra 9 275HX
2256 Points +4%
Aorus MASTER 16 AM6H
Intel Core Ultra 9 275HX
2216 Points +2%
SCHENKER XMG Neo 16 A25 5090
AMD Ryzen 9 9955HX3D
2179 Points
Moyenne AMD Ryzen 9 9955HX3D
  (2165 - 2179, n=2)
2172 Points 0%
Asus ROG Strix Scar 16 2025
Intel Core Ultra 9 275HX
2141 Points -2%
HP Omen Max 16 ah000
Intel Core Ultra 9 275HX
2128 Points -2%
Moyenne de la classe Gaming
  (1136 - 2267, n=147, 2 dernières années)
1930 Points -11%
Cinebench R20 / CPU (Multi Core)
SCHENKER XMG Neo 16 E25 RTX 5090 Laptop
Intel Core Ultra 9 275HX
15881 Points +5%
SCHENKER XMG Neo 16 A25 5090
AMD Ryzen 9 9955HX3D
15177 Points
Moyenne AMD Ryzen 9 9955HX3D
  (15146 - 15177, n=2)
15162 Points 0%
Asus ROG Strix Scar 16 2025
Intel Core Ultra 9 275HX
14828 Points -2%
Aorus MASTER 16 AM6H
Intel Core Ultra 9 275HX
14307 Points -6%
HP Omen Max 16 ah000
Intel Core Ultra 9 275HX
13178 Points -13%
Medion Erazer Beast 16 X1 Ultimate
Intel Core Ultra 9 275HX
12257 Points -19%
Moyenne de la classe Gaming
  (2179 - 16108, n=147, 2 dernières années)
8940 Points -41%
Cinebench R20 / CPU (Single Core)
SCHENKER XMG Neo 16 E25 RTX 5090 Laptop
Intel Core Ultra 9 275HX
869 Points +3%
Medion Erazer Beast 16 X1 Ultimate
Intel Core Ultra 9 275HX
869 Points +3%
Aorus MASTER 16 AM6H
Intel Core Ultra 9 275HX
854 Points +1%
Moyenne AMD Ryzen 9 9955HX3D
  (847 - 851, n=2)
849 Points 0%
SCHENKER XMG Neo 16 A25 5090
AMD Ryzen 9 9955HX3D
847 Points
Asus ROG Strix Scar 16 2025
Intel Core Ultra 9 275HX
843 Points 0%
HP Omen Max 16 ah000
Intel Core Ultra 9 275HX
811 Points -4%
Moyenne de la classe Gaming
  (439 - 870, n=147, 2 dernières années)
743 Points -12%
Cinebench R15 / CPU Multi 64Bit
SCHENKER XMG Neo 16 E25 RTX 5090 Laptop
Intel Core Ultra 9 275HX
6271 (6038.65min - 6270.58max) Points +4%
Medion Erazer Beast 16 X1 Ultimate
Intel Core Ultra 9 275HX
6161 (4011.63min - 6161.43max) Points +2%
SCHENKER XMG Neo 16 A25 5090
AMD Ryzen 9 9955HX3D
6044 (5932.08min - 6044.12max) Points
Moyenne AMD Ryzen 9 9955HX3D
  (6041 - 6044, n=2)
6043 Points 0%
Asus ROG Strix Scar 16 2025
Intel Core Ultra 9 275HX
5930 (5537.87min - 5930.32max) Points -2%
Aorus MASTER 16 AM6H
Intel Core Ultra 9 275HX
5679 (5505.09min - 5679.4max) Points -6%
HP Omen Max 16 ah000
Intel Core Ultra 9 275HX
5172 (5108.56min - 5171.97max) Points -14%
Moyenne de la classe Gaming
  (1537 - 6271, n=150, 2 dernières années)
3584 Points -41%
Cinebench R15 / CPU Single 64Bit
Asus ROG Strix Scar 16 2025
Intel Core Ultra 9 275HX
341 Points +2%
SCHENKER XMG Neo 16 E25 RTX 5090 Laptop
Intel Core Ultra 9 275HX
340 Points +2%
Medion Erazer Beast 16 X1 Ultimate
Intel Core Ultra 9 275HX
337 Points +1%
SCHENKER XMG Neo 16 A25 5090
AMD Ryzen 9 9955HX3D
333 Points
Aorus MASTER 16 AM6H
Intel Core Ultra 9 275HX
331 Points -1%
Moyenne AMD Ryzen 9 9955HX3D
  (321 - 333, n=2)
327 Points -2%
HP Omen Max 16 ah000
Intel Core Ultra 9 275HX
317 Points -5%
Moyenne de la classe Gaming
  (191.9 - 343, n=147, 2 dernières années)
285 Points -14%
Blender / v2.79 BMW27 CPU
Moyenne de la classe Gaming
  (80 - 517, n=141, 2 dernières années)
163.9 Seconds * -105%
Medion Erazer Beast 16 X1 Ultimate
Intel Core Ultra 9 275HX
115 Seconds * -44%
HP Omen Max 16 ah000
Intel Core Ultra 9 275HX
102 Seconds * -28%
Aorus MASTER 16 AM6H
Intel Core Ultra 9 275HX
93 Seconds * -16%
Asus ROG Strix Scar 16 2025
Intel Core Ultra 9 275HX
87 Seconds * -9%
SCHENKER XMG Neo 16 E25 RTX 5090 Laptop
Intel Core Ultra 9 275HX
83 Seconds * -4%
SCHENKER XMG Neo 16 A25 5090
AMD Ryzen 9 9955HX3D
80 Seconds *
Moyenne AMD Ryzen 9 9955HX3D
  (80 - 80, n=2)
80 Seconds * -0%
7-Zip 18.03 / 7z b 4
SCHENKER XMG Neo 16 A25 5090
AMD Ryzen 9 9955HX3D
148086 MIPS
Moyenne AMD Ryzen 9 9955HX3D
  (145803 - 148086, n=2)
146945 MIPS -1%
SCHENKER XMG Neo 16 E25 RTX 5090 Laptop
Intel Core Ultra 9 275HX
124155 MIPS -16%
Asus ROG Strix Scar 16 2025
Intel Core Ultra 9 275HX
121092 MIPS -18%
Medion Erazer Beast 16 X1 Ultimate
Intel Core Ultra 9 275HX
120932 MIPS -18%
Aorus MASTER 16 AM6H
Intel Core Ultra 9 275HX
112410 MIPS -24%
HP Omen Max 16 ah000
Intel Core Ultra 9 275HX
104686 MIPS -29%
Moyenne de la classe Gaming
  (23795 - 148086, n=145, 2 dernières années)
87248 MIPS -41%
7-Zip 18.03 / 7z b 4 -mmt1
SCHENKER XMG Neo 16 A25 5090
AMD Ryzen 9 9955HX3D
7300 MIPS
Moyenne AMD Ryzen 9 9955HX3D
  (7151 - 7300, n=2)
7226 MIPS -1%
Medion Erazer Beast 16 X1 Ultimate
Intel Core Ultra 9 275HX
7149 MIPS -2%
SCHENKER XMG Neo 16 E25 RTX 5090 Laptop
Intel Core Ultra 9 275HX
7114 MIPS -3%
Aorus MASTER 16 AM6H
Intel Core Ultra 9 275HX
6669 MIPS -9%
Asus ROG Strix Scar 16 2025
Intel Core Ultra 9 275HX
6654 MIPS -9%
Moyenne de la classe Gaming
  (4199 - 7573, n=145, 2 dernières années)
6343 MIPS -13%
HP Omen Max 16 ah000
Intel Core Ultra 9 275HX
6186 MIPS -15%
Geekbench 6.4 / Multi-Core
Asus ROG Strix Scar 16 2025
Intel Core Ultra 9 275HX
20902 Points +2%
SCHENKER XMG Neo 16 E25 RTX 5090 Laptop
Intel Core Ultra 9 275HX
20890 Points +2%
SCHENKER XMG Neo 16 A25 5090
AMD Ryzen 9 9955HX3D
20540 Points
Medion Erazer Beast 16 X1 Ultimate
Intel Core Ultra 9 275HX
20443 Points 0%
Moyenne AMD Ryzen 9 9955HX3D
  (19788 - 20551, n=4)
20200 Points -2%
Aorus MASTER 16 AM6H
Intel Core Ultra 9 275HX
19299 Points -6%
HP Omen Max 16 ah000
Intel Core Ultra 9 275HX
18322 Points -11%
Moyenne de la classe Gaming
  (5340 - 22104, n=134, 2 dernières années)
15010 Points -27%
Geekbench 6.4 / Single-Core
SCHENKER XMG Neo 16 A25 5090
AMD Ryzen 9 9955HX3D
3214 Points
Moyenne AMD Ryzen 9 9955HX3D
  (3146 - 3237, n=4)
3188 Points -1%
Medion Erazer Beast 16 X1 Ultimate
Intel Core Ultra 9 275HX
3141 Points -2%
SCHENKER XMG Neo 16 E25 RTX 5090 Laptop
Intel Core Ultra 9 275HX
3109 Points -3%
Asus ROG Strix Scar 16 2025
Intel Core Ultra 9 275HX
3072 Points -4%
Aorus MASTER 16 AM6H
Intel Core Ultra 9 275HX
3046 Points -5%
HP Omen Max 16 ah000
Intel Core Ultra 9 275HX
2917 Points -9%
Moyenne de la classe Gaming
  (1490 - 3219, n=134, 2 dernières années)
2725 Points -15%
Geekbench 5.5 / Multi-Core
SCHENKER XMG Neo 16 E25 RTX 5090 Laptop
Intel Core Ultra 9 275HX
25599 Points +8%
Medion Erazer Beast 16 X1 Ultimate
Intel Core Ultra 9 275HX
24829 Points +5%
Asus ROG Strix Scar 16 2025
Intel Core Ultra 9 275HX
24285 Points +3%
SCHENKER XMG Neo 16 A25 5090
AMD Ryzen 9 9955HX3D
23669 Points
Moyenne AMD Ryzen 9 9955HX3D
  (23468 - 23669, n=2)
23569 Points 0%
Aorus MASTER 16 AM6H
Intel Core Ultra 9 275HX
22218 Points -6%
HP Omen Max 16 ah000
Intel Core Ultra 9 275HX
21195 Points -10%
Moyenne de la classe Gaming
  (4557 - 27010, n=144, 2 dernières années)
15723 Points -34%
Geekbench 5.5 / Single-Core
Moyenne AMD Ryzen 9 9955HX3D
  (2381 - 2401, n=2)
2391 Points 0%
SCHENKER XMG Neo 16 A25 5090
AMD Ryzen 9 9955HX3D
2381 Points
SCHENKER XMG Neo 16 E25 RTX 5090 Laptop
Intel Core Ultra 9 275HX
2264 Points -5%
Medion Erazer Beast 16 X1 Ultimate
Intel Core Ultra 9 275HX
2250 Points -6%
Asus ROG Strix Scar 16 2025
Intel Core Ultra 9 275HX
2235 Points -6%
Aorus MASTER 16 AM6H
Intel Core Ultra 9 275HX
2214 Points -7%
HP Omen Max 16 ah000
Intel Core Ultra 9 275HX
2034 Points -15%
Moyenne de la classe Gaming
  (986 - 2423, n=144, 2 dernières années)
1953 Points -18%
HWBOT x265 Benchmark v2.2 / 4k Preset
SCHENKER XMG Neo 16 E25 RTX 5090 Laptop
Intel Core Ultra 9 275HX
43.2 fps +2%
Moyenne AMD Ryzen 9 9955HX3D
  (42.3 - 42.7, n=2)
42.5 fps 0%
SCHENKER XMG Neo 16 A25 5090
AMD Ryzen 9 9955HX3D
42.3 fps
Medion Erazer Beast 16 X1 Ultimate
Intel Core Ultra 9 275HX
41.5 fps -2%
Asus ROG Strix Scar 16 2025
Intel Core Ultra 9 275HX
40.4 fps -4%
Aorus MASTER 16 AM6H
Intel Core Ultra 9 275HX
36 fps -15%
HP Omen Max 16 ah000
Intel Core Ultra 9 275HX
35 fps -17%
Moyenne de la classe Gaming
  (7.7 - 44.3, n=145, 2 dernières années)
25.2 fps -40%
LibreOffice / 20 Documents To PDF
Medion Erazer Beast 16 X1 Ultimate
Intel Core Ultra 9 275HX
57.8 s * -24%
Moyenne de la classe Gaming
  (19 - 96.6, n=143, 2 dernières années)
47.6 s * -2%
SCHENKER XMG Neo 16 A25 5090
AMD Ryzen 9 9955HX3D
46.6 s *
Moyenne AMD Ryzen 9 9955HX3D
  (44.9 - 46.6, n=2)
45.8 s * +2%
HP Omen Max 16 ah000
Intel Core Ultra 9 275HX
41.4 s * +11%
SCHENKER XMG Neo 16 E25 RTX 5090 Laptop
Intel Core Ultra 9 275HX
40.7 s * +13%
Asus ROG Strix Scar 16 2025
Intel Core Ultra 9 275HX
40.5 s * +13%
Aorus MASTER 16 AM6H
Intel Core Ultra 9 275HX
40.46 s * +13%
R Benchmark 2.5 / Overall mean
HP Omen Max 16 ah000
Intel Core Ultra 9 275HX
0.4568 sec * -29%
Moyenne de la classe Gaming
  (0.3551 - 0.759, n=146, 2 dernières années)
0.433 sec * -22%
Aorus MASTER 16 AM6H
Intel Core Ultra 9 275HX
0.43 sec * -21%
Asus ROG Strix Scar 16 2025
Intel Core Ultra 9 275HX
0.4141 sec * -17%
SCHENKER XMG Neo 16 E25 RTX 5090 Laptop
Intel Core Ultra 9 275HX
0.4053 sec * -14%
Medion Erazer Beast 16 X1 Ultimate
Intel Core Ultra 9 275HX
0.4011 sec * -13%
Moyenne AMD Ryzen 9 9955HX3D
  (0.3552 - 0.3677, n=2)
0.3615 sec * -2%
SCHENKER XMG Neo 16 A25 5090
AMD Ryzen 9 9955HX3D
0.3552 sec *

* ... Moindre est la valeur, meilleures sont les performances

Cinebench R10 Rendering Single 32Bit
9264
Cinebench R10 Shading 32Bit
24922
Cinebench R10 Rendering Multiple CPUs 32Bit
81339
Cinebench R11.5 CPU Single 64Bit
3.98 Points
Cinebench R11.5 CPU Multi 64Bit
69.12 Points
Cinebench R11.5 OpenGL 64Bit
232.51 fps
Cinebench R15 CPU Multi 64Bit
6044 Points
Cinebench R15 CPU Single 64Bit
333 Points
Cinebench R15 Ref. Match 64Bit
99.6 %
Cinebench R15 OpenGL 64Bit
321 fps
Cinebench R20 CPU (Single Core)
847 Points
Cinebench R20 CPU (Multi Core)
15177 Points
Cinebench R23 Multi Core
39266 Points
Cinebench R23 Single Core
2179 Points
Cinebench 2024 CPU Single Core
130 Points
Cinebench 2024 CPU Multi Core
2120 Points
Aide
Performance Rating
Moyenne AMD Ryzen 9 9955HX3D
 
97.1 pt
SCHENKER XMG Neo 16 A25 5090
AMD Ryzen 9 9955HX3D, GeForce RTX 5090 Laptop
96.4 pt
SCHENKER XMG Neo 16 E25 RTX 5090 Laptop
Intel Core Ultra 9 275HX, GeForce RTX 5090 Laptop
75.6 pt
Asus ROG Strix Scar 16 2025
Intel Core Ultra 9 275HX, GeForce RTX 5090 Laptop
74.9 pt
Medion Erazer Beast 16 X1 Ultimate
Intel Core Ultra 9 275HX, GeForce RTX 5090 Laptop
73.3 pt
Aorus MASTER 16 AM6H
Intel Core Ultra 9 275HX, GeForce RTX 5090 Laptop
71.2 pt
HP Omen Max 16 ah000
Intel Core Ultra 9 275HX, GeForce RTX 5090 Laptop
66.2 pt
Moyenne de la classe Gaming
 
52.4 pt
AIDA64 / FP32 Ray-Trace
Moyenne AMD Ryzen 9 9955HX3D
  (80619 - 84943, n=2)
82781 KRay/s +3%
SCHENKER XMG Neo 16 A25 5090
AMD Ryzen 9 9955HX3D, GeForce RTX 5090 Laptop
80619 KRay/s
SCHENKER XMG Neo 16 E25 RTX 5090 Laptop
Intel Core Ultra 9 275HX, GeForce RTX 5090 Laptop
39895 KRay/s -51%
Asus ROG Strix Scar 16 2025
Intel Core Ultra 9 275HX, GeForce RTX 5090 Laptop
39551 KRay/s -51%
Medion Erazer Beast 16 X1 Ultimate
Intel Core Ultra 9 275HX, GeForce RTX 5090 Laptop
38481 KRay/s -52%
Aorus MASTER 16 AM6H
Intel Core Ultra 9 275HX, GeForce RTX 5090 Laptop
38066 KRay/s -53%
HP Omen Max 16 ah000
Intel Core Ultra 9 275HX, GeForce RTX 5090 Laptop
34180 KRay/s -58%
Moyenne de la classe Gaming
  (7192 - 85542, n=144, 2 dernières années)
25632 KRay/s -68%
AIDA64 / FPU Julia
Moyenne AMD Ryzen 9 9955HX3D
  (230738 - 238426, n=2)
234582 Points +2%
SCHENKER XMG Neo 16 A25 5090
AMD Ryzen 9 9955HX3D, GeForce RTX 5090 Laptop
230738 Points
SCHENKER XMG Neo 16 E25 RTX 5090 Laptop
Intel Core Ultra 9 275HX, GeForce RTX 5090 Laptop
198802 Points -14%
Asus ROG Strix Scar 16 2025
Intel Core Ultra 9 275HX, GeForce RTX 5090 Laptop
191476 Points -17%
Medion Erazer Beast 16 X1 Ultimate
Intel Core Ultra 9 275HX, GeForce RTX 5090 Laptop
189586 Points -18%
Aorus MASTER 16 AM6H
Intel Core Ultra 9 275HX, GeForce RTX 5090 Laptop
189130 Points -18%
HP Omen Max 16 ah000
Intel Core Ultra 9 275HX, GeForce RTX 5090 Laptop
173656 Points -25%
Moyenne de la classe Gaming
  (35040 - 252486, n=144, 2 dernières années)
118052 Points -49%
AIDA64 / CPU SHA3
SCHENKER XMG Neo 16 E25 RTX 5090 Laptop
Intel Core Ultra 9 275HX, GeForce RTX 5090 Laptop
9734 MB/s +1%
Moyenne AMD Ryzen 9 9955HX3D
  (9656 - 9750, n=2)
9703 MB/s 0%
SCHENKER XMG Neo 16 A25 5090
AMD Ryzen 9 9955HX3D, GeForce RTX 5090 Laptop
9656 MB/s
Asus ROG Strix Scar 16 2025
Intel Core Ultra 9 275HX, GeForce RTX 5090 Laptop
9480 MB/s -2%
Medion Erazer Beast 16 X1 Ultimate
Intel Core Ultra 9 275HX, GeForce RTX 5090 Laptop
9263 MB/s -4%
Aorus MASTER 16 AM6H
Intel Core Ultra 9 275HX, GeForce RTX 5090 Laptop
9025 MB/s -7%
HP Omen Max 16 ah000
Intel Core Ultra 9 275HX, GeForce RTX 5090 Laptop
8315 MB/s -14%
Moyenne de la classe Gaming
  (1728 - 10389, n=144, 2 dernières années)
5374 MB/s -44%
AIDA64 / CPU Queen
SCHENKER XMG Neo 16 A25 5090
AMD Ryzen 9 9955HX3D, GeForce RTX 5090 Laptop
173351 Points
Moyenne AMD Ryzen 9 9955HX3D
  (171718 - 173351, n=2)
172535 Points 0%
SCHENKER XMG Neo 16 E25 RTX 5090 Laptop
Intel Core Ultra 9 275HX, GeForce RTX 5090 Laptop
140695 Points -19%
Medion Erazer Beast 16 X1 Ultimate
Intel Core Ultra 9 275HX, GeForce RTX 5090 Laptop
139554 Points -19%
Asus ROG Strix Scar 16 2025
Intel Core Ultra 9 275HX, GeForce RTX 5090 Laptop
138882 Points -20%
Aorus MASTER 16 AM6H
Intel Core Ultra 9 275HX, GeForce RTX 5090 Laptop
135378 Points -22%
HP Omen Max 16 ah000
Intel Core Ultra 9 275HX, GeForce RTX 5090 Laptop
128670 Points -26%
Moyenne de la classe Gaming
  (50699 - 200651, n=144, 2 dernières années)
117348 Points -32%
AIDA64 / FPU SinJulia
Moyenne AMD Ryzen 9 9955HX3D
  (32989 - 33636, n=2)
33313 Points +1%
SCHENKER XMG Neo 16 A25 5090
AMD Ryzen 9 9955HX3D, GeForce RTX 5090 Laptop
32989 Points
Medion Erazer Beast 16 X1 Ultimate
Intel Core Ultra 9 275HX, GeForce RTX 5090 Laptop
14415 Points -56%
SCHENKER XMG Neo 16 E25 RTX 5090 Laptop
Intel Core Ultra 9 275HX, GeForce RTX 5090 Laptop
14382 Points -56%
Moyenne de la classe Gaming
  (5020 - 33636, n=144, 2 dernières années)
13961 Points -58%
Asus ROG Strix Scar 16 2025
Intel Core Ultra 9 275HX, GeForce RTX 5090 Laptop
13955 Points -58%
Aorus MASTER 16 AM6H
Intel Core Ultra 9 275HX, GeForce RTX 5090 Laptop
13522 Points -59%
HP Omen Max 16 ah000
Intel Core Ultra 9 275HX, GeForce RTX 5090 Laptop
12272 Points -63%
AIDA64 / FPU Mandel
Moyenne AMD Ryzen 9 9955HX3D
  (122088 - 126658, n=2)
124373 Points +2%
SCHENKER XMG Neo 16 A25 5090
AMD Ryzen 9 9955HX3D, GeForce RTX 5090 Laptop
122088 Points
Asus ROG Strix Scar 16 2025
Intel Core Ultra 9 275HX, GeForce RTX 5090 Laptop
102630 Points -16%
SCHENKER XMG Neo 16 E25 RTX 5090 Laptop
Intel Core Ultra 9 275HX, GeForce RTX 5090 Laptop
102544 Points -16%
Aorus MASTER 16 AM6H
Intel Core Ultra 9 275HX, GeForce RTX 5090 Laptop
98724 Points -19%
Medion Erazer Beast 16 X1 Ultimate
Intel Core Ultra 9 275HX, GeForce RTX 5090 Laptop
98647 Points -19%
HP Omen Max 16 ah000
Intel Core Ultra 9 275HX, GeForce RTX 5090 Laptop
90980 Points -25%
Moyenne de la classe Gaming
  (17585 - 134044, n=144, 2 dernières années)
60447 Points -50%
AIDA64 / CPU AES
Moyenne AMD Ryzen 9 9955HX3D
  (161913 - 163423, n=2)
162668 MB/s 0%
SCHENKER XMG Neo 16 A25 5090
AMD Ryzen 9 9955HX3D, GeForce RTX 5090 Laptop
161913 MB/s
SCHENKER XMG Neo 16 E25 RTX 5090 Laptop
Intel Core Ultra 9 275HX, GeForce RTX 5090 Laptop
136847 MB/s -15%
Medion Erazer Beast 16 X1 Ultimate
Intel Core Ultra 9 275HX, GeForce RTX 5090 Laptop
136767 MB/s -16%
Asus ROG Strix Scar 16 2025
Intel Core Ultra 9 275HX, GeForce RTX 5090 Laptop
134008 MB/s -17%
Aorus MASTER 16 AM6H
Intel Core Ultra 9 275HX, GeForce RTX 5090 Laptop
129745 MB/s -20%
HP Omen Max 16 ah000
Intel Core Ultra 9 275HX, GeForce RTX 5090 Laptop
118108 MB/s -27%
Moyenne de la classe Gaming
  (19065 - 328679, n=144, 2 dernières années)
109924 MB/s -32%
AIDA64 / CPU ZLib
Moyenne AMD Ryzen 9 9955HX3D
  (2497 - 2517, n=2)
2507 MB/s 0%
SCHENKER XMG Neo 16 A25 5090
AMD Ryzen 9 9955HX3D, GeForce RTX 5090 Laptop
2497 MB/s
SCHENKER XMG Neo 16 E25 RTX 5090 Laptop
Intel Core Ultra 9 275HX, GeForce RTX 5090 Laptop
2263 MB/s -9%
Medion Erazer Beast 16 X1 Ultimate
Intel Core Ultra 9 275HX, GeForce RTX 5090 Laptop
2238 MB/s -10%
Asus ROG Strix Scar 16 2025
Intel Core Ultra 9 275HX, GeForce RTX 5090 Laptop
2179 MB/s -13%
Aorus MASTER 16 AM6H
Intel Core Ultra 9 275HX, GeForce RTX 5090 Laptop
2076 MB/s -17%
HP Omen Max 16 ah000
Intel Core Ultra 9 275HX, GeForce RTX 5090 Laptop
1896 MB/s -24%
Moyenne de la classe Gaming
  (373 - 2531, n=144, 2 dernières années)
1440 MB/s -42%
AIDA64 / FP64 Ray-Trace
Moyenne AMD Ryzen 9 9955HX3D
  (42676 - 45384, n=2)
44030 KRay/s +3%
SCHENKER XMG Neo 16 A25 5090
AMD Ryzen 9 9955HX3D, GeForce RTX 5090 Laptop
42676 KRay/s
Asus ROG Strix Scar 16 2025
Intel Core Ultra 9 275HX, GeForce RTX 5090 Laptop
21185 KRay/s -50%
SCHENKER XMG Neo 16 E25 RTX 5090 Laptop
Intel Core Ultra 9 275HX, GeForce RTX 5090 Laptop
20910 KRay/s -51%
Medion Erazer Beast 16 X1 Ultimate
Intel Core Ultra 9 275HX, GeForce RTX 5090 Laptop
20672 KRay/s -52%
Aorus MASTER 16 AM6H
Intel Core Ultra 9 275HX, GeForce RTX 5090 Laptop
20602 KRay/s -52%
HP Omen Max 16 ah000
Intel Core Ultra 9 275HX, GeForce RTX 5090 Laptop
18490 KRay/s -57%
Moyenne de la classe Gaming
  (3856 - 45446, n=144, 2 dernières années)
13753 KRay/s -68%
AIDA64 / CPU PhotoWorxx
Asus ROG Strix Scar 16 2025
Intel Core Ultra 9 275HX, GeForce RTX 5090 Laptop
56613 MPixel/s +32%
SCHENKER XMG Neo 16 E25 RTX 5090 Laptop
Intel Core Ultra 9 275HX, GeForce RTX 5090 Laptop
53630 MPixel/s +25%
Medion Erazer Beast 16 X1 Ultimate
Intel Core Ultra 9 275HX, GeForce RTX 5090 Laptop
49190 MPixel/s +14%
HP Omen Max 16 ah000
Intel Core Ultra 9 275HX, GeForce RTX 5090 Laptop
49039 MPixel/s +14%
Aorus MASTER 16 AM6H
Intel Core Ultra 9 275HX, GeForce RTX 5090 Laptop
48187 MPixel/s +12%
SCHENKER XMG Neo 16 A25 5090
AMD Ryzen 9 9955HX3D, GeForce RTX 5090 Laptop
43032 MPixel/s
Moyenne de la classe Gaming
  (10805 - 62274, n=144, 2 dernières années)
41396 MPixel/s -4%
Moyenne AMD Ryzen 9 9955HX3D
  (38765 - 43032, n=2)
40899 MPixel/s -5%
Performance Rating: Percent
PCMark 10: Score | Essentials | Productivity | Digital Content Creation
CrossMark: Overall | Productivity | Creativity | Responsiveness
WebXPRT 3: Overall
WebXPRT 4: Overall
Mozilla Kraken 1.1: Total
Performance Rating
Moyenne AMD Ryzen 9 9955HX3D, Nvidia GeForce RTX 5090 Laptop
 
89.6 pt
SCHENKER XMG Neo 16 A25 5090
GeForce RTX 5090 Laptop, R9 9955HX3D, Kingston Fury Renegade SFYRS1000G
89.1 pt
SCHENKER XMG Neo 16 E25 RTX 5090 Laptop
GeForce RTX 5090 Laptop, Ultra 9 275HX, Samsung 9100 Pro 1 TB
88.1 pt
Aorus MASTER 16 AM6H
GeForce RTX 5090 Laptop, Ultra 9 275HX, Kingston OM8PGP41024Q-A0
85.7 pt
Asus ROG Strix Scar 16 2025
GeForce RTX 5090 Laptop, Ultra 9 275HX, WD PC SN8000S 2TB
85.3 pt
Medion Erazer Beast 16 X1 Ultimate
GeForce RTX 5090 Laptop, Ultra 9 275HX, Phison E31 2 TB
85 pt
HP Omen Max 16 ah000 -1!
GeForce RTX 5090 Laptop, Ultra 9 275HX, WDC PC SN810 2TB
81.7 pt
Moyenne de la classe Gaming
 
75.9 pt
PCMark 10 / Score
SCHENKER XMG Neo 16 A25 5090
GeForce RTX 5090 Laptop, R9 9955HX3D, Kingston Fury Renegade SFYRS1000G
9647 Points
Moyenne AMD Ryzen 9 9955HX3D, Nvidia GeForce RTX 5090 Laptop
  (9639 - 9647, n=2)
9643 Points 0%
SCHENKER XMG Neo 16 E25 RTX 5090 Laptop
GeForce RTX 5090 Laptop, Ultra 9 275HX, Samsung 9100 Pro 1 TB
9032 Points -6%
Asus ROG Strix Scar 16 2025
GeForce RTX 5090 Laptop, Ultra 9 275HX, WD PC SN8000S 2TB
8819 Points -9%
HP Omen Max 16 ah000
GeForce RTX 5090 Laptop, Ultra 9 275HX, WDC PC SN810 2TB
8794 Points -9%
Medion Erazer Beast 16 X1 Ultimate
GeForce RTX 5090 Laptop, Ultra 9 275HX, Phison E31 2 TB
8518 Points -12%
Aorus MASTER 16 AM6H
GeForce RTX 5090 Laptop, Ultra 9 275HX, Kingston OM8PGP41024Q-A0
8241 Points -15%
Moyenne de la classe Gaming
  (5776 - 9852, n=131, 2 dernières années)
8004 Points -17%
PCMark 10 / Essentials
Moyenne AMD Ryzen 9 9955HX3D, Nvidia GeForce RTX 5090 Laptop
  (11728 - 11735, n=2)
11732 Points 0%
SCHENKER XMG Neo 16 A25 5090
GeForce RTX 5090 Laptop, R9 9955HX3D, Kingston Fury Renegade SFYRS1000G
11728 Points
Medion Erazer Beast 16 X1 Ultimate
GeForce RTX 5090 Laptop, Ultra 9 275HX, Phison E31 2 TB
11369 Points -3%
SCHENKER XMG Neo 16 E25 RTX 5090 Laptop
GeForce RTX 5090 Laptop, Ultra 9 275HX, Samsung 9100 Pro 1 TB
11162 Points -5%
Asus ROG Strix Scar 16 2025
GeForce RTX 5090 Laptop, Ultra 9 275HX, WD PC SN8000S 2TB
11103 Points -5%
HP Omen Max 16 ah000
GeForce RTX 5090 Laptop, Ultra 9 275HX, WDC PC SN810 2TB
10969 Points -6%
Moyenne de la classe Gaming
  (9057 - 12600, n=131, 2 dernières années)
10800 Points -8%
Aorus MASTER 16 AM6H
GeForce RTX 5090 Laptop, Ultra 9 275HX, Kingston OM8PGP41024Q-A0
9994 Points -15%
PCMark 10 / Productivity
SCHENKER XMG Neo 16 A25 5090
GeForce RTX 5090 Laptop, R9 9955HX3D, Kingston Fury Renegade SFYRS1000G
11003 Points
Moyenne AMD Ryzen 9 9955HX3D, Nvidia GeForce RTX 5090 Laptop
  (10829 - 11003, n=2)
10916 Points -1%
Moyenne de la classe Gaming
  (6662 - 14612, n=131, 2 dernières années)
9916 Points -10%
Medion Erazer Beast 16 X1 Ultimate
GeForce RTX 5090 Laptop, Ultra 9 275HX, Phison E31 2 TB
9515 Points -14%
SCHENKER XMG Neo 16 E25 RTX 5090 Laptop
GeForce RTX 5090 Laptop, Ultra 9 275HX, Samsung 9100 Pro 1 TB
9317 Points -15%
Aorus MASTER 16 AM6H
GeForce RTX 5090 Laptop, Ultra 9 275HX, Kingston OM8PGP41024Q-A0
9300 Points -15%
Asus ROG Strix Scar 16 2025
GeForce RTX 5090 Laptop, Ultra 9 275HX, WD PC SN8000S 2TB
9164 Points -17%
HP Omen Max 16 ah000
GeForce RTX 5090 Laptop, Ultra 9 275HX, WDC PC SN810 2TB
9122 Points -17%
PCMark 10 / Digital Content Creation
SCHENKER XMG Neo 16 E25 RTX 5090 Laptop
GeForce RTX 5090 Laptop, Ultra 9 275HX, Samsung 9100 Pro 1 TB
19227 Points +2%
Moyenne AMD Ryzen 9 9955HX3D, Nvidia GeForce RTX 5090 Laptop
  (18879 - 19123, n=2)
19001 Points +1%
SCHENKER XMG Neo 16 A25 5090
GeForce RTX 5090 Laptop, R9 9955HX3D, Kingston Fury Renegade SFYRS1000G
18879 Points
HP Omen Max 16 ah000
GeForce RTX 5090 Laptop, Ultra 9 275HX, WDC PC SN810 2TB
18445 Points -2%
Asus ROG Strix Scar 16 2025
GeForce RTX 5090 Laptop, Ultra 9 275HX, WD PC SN8000S 2TB
18293 Points -3%
Aorus MASTER 16 AM6H
GeForce RTX 5090 Laptop, Ultra 9 275HX, Kingston OM8PGP41024Q-A0
16344 Points -13%
Medion Erazer Beast 16 X1 Ultimate
GeForce RTX 5090 Laptop, Ultra 9 275HX, Phison E31 2 TB
15507 Points -18%
Moyenne de la classe Gaming
  (7440 - 19351, n=131, 2 dernières années)
13167 Points -30%
CrossMark / Overall
Aorus MASTER 16 AM6H
GeForce RTX 5090 Laptop, Ultra 9 275HX, Kingston OM8PGP41024Q-A0
2253 Points +2%
SCHENKER XMG Neo 16 E25 RTX 5090 Laptop
GeForce RTX 5090 Laptop, Ultra 9 275HX, Samsung 9100 Pro 1 TB
2249 Points +2%
Moyenne AMD Ryzen 9 9955HX3D, Nvidia GeForce RTX 5090 Laptop
  (2199 - 2264, n=2)
2232 Points +2%
Medion Erazer Beast 16 X1 Ultimate
GeForce RTX 5090 Laptop, Ultra 9 275HX, Phison E31 2 TB
2211 Points +1%
SCHENKER XMG Neo 16 A25 5090
GeForce RTX 5090 Laptop, R9 9955HX3D, Kingston Fury Renegade SFYRS1000G
2199 Points
Asus ROG Strix Scar 16 2025
GeForce RTX 5090 Laptop, Ultra 9 275HX, WD PC SN8000S 2TB
2144 Points -3%
HP Omen Max 16 ah000
GeForce RTX 5090 Laptop, Ultra 9 275HX, WDC PC SN810 2TB
1995 Points -9%
Moyenne de la classe Gaming
  (1247 - 2344, n=113, 2 dernières années)
1941 Points -12%
CrossMark / Productivity
Aorus MASTER 16 AM6H
GeForce RTX 5090 Laptop, Ultra 9 275HX, Kingston OM8PGP41024Q-A0
2106 Points +8%
SCHENKER XMG Neo 16 E25 RTX 5090 Laptop
GeForce RTX 5090 Laptop, Ultra 9 275HX, Samsung 9100 Pro 1 TB
2062 Points +5%
Medion Erazer Beast 16 X1 Ultimate
GeForce RTX 5090 Laptop, Ultra 9 275HX, Phison E31 2 TB
2040 Points +4%
Moyenne AMD Ryzen 9 9955HX3D, Nvidia GeForce RTX 5090 Laptop
  (1958 - 2021, n=2)
1990 Points +2%
SCHENKER XMG Neo 16 A25 5090
GeForce RTX 5090 Laptop, R9 9955HX3D, Kingston Fury Renegade SFYRS1000G
1958 Points
Asus ROG Strix Scar 16 2025
GeForce RTX 5090 Laptop, Ultra 9 275HX, WD PC SN8000S 2TB
1948 Points -1%
HP Omen Max 16 ah000
GeForce RTX 5090 Laptop, Ultra 9 275HX, WDC PC SN810 2TB
1847 Points -6%
Moyenne de la classe Gaming
  (1299 - 2204, n=113, 2 dernières années)
1832 Points -6%
CrossMark / Creativity
Moyenne AMD Ryzen 9 9955HX3D, Nvidia GeForce RTX 5090 Laptop
  (2651 - 2700, n=2)
2676 Points +1%
SCHENKER XMG Neo 16 A25 5090
GeForce RTX 5090 Laptop, R9 9955HX3D, Kingston Fury Renegade SFYRS1000G
2651 Points
SCHENKER XMG Neo 16 E25 RTX 5090 Laptop
GeForce RTX 5090 Laptop, Ultra 9 275HX, Samsung 9100 Pro 1 TB
2612 Points -1%
Medion Erazer Beast 16 X1 Ultimate
GeForce RTX 5090 Laptop, Ultra 9 275HX, Phison E31 2 TB
2570 Points -3%
Asus ROG Strix Scar 16 2025
GeForce RTX 5090 Laptop, Ultra 9 275HX, WD PC SN8000S 2TB
2556 Points -4%
Aorus MASTER 16 AM6H
GeForce RTX 5090 Laptop, Ultra 9 275HX, Kingston OM8PGP41024Q-A0
2452 Points -8%
HP Omen Max 16 ah000
GeForce RTX 5090 Laptop, Ultra 9 275HX, WDC PC SN810 2TB
2285 Points -14%
Moyenne de la classe Gaming
  (1275 - 2729, n=113, 2 dernières années)
2150 Points -19%
CrossMark / Responsiveness
Aorus MASTER 16 AM6H
GeForce RTX 5090 Laptop, Ultra 9 275HX, Kingston OM8PGP41024Q-A0
2139 Points +20%
SCHENKER XMG Neo 16 E25 RTX 5090 Laptop
GeForce RTX 5090 Laptop, Ultra 9 275HX, Samsung 9100 Pro 1 TB
1864 Points +5%
Moyenne AMD Ryzen 9 9955HX3D, Nvidia GeForce RTX 5090 Laptop
  (1776 - 1874, n=2)
1825 Points +3%
Medion Erazer Beast 16 X1 Ultimate
GeForce RTX 5090 Laptop, Ultra 9 275HX, Phison E31 2 TB
1793 Points +1%
SCHENKER XMG Neo 16 A25 5090
GeForce RTX 5090 Laptop, R9 9955HX3D, Kingston Fury Renegade SFYRS1000G
1776 Points
Moyenne de la classe Gaming
  (1030 - 2330, n=113, 2 dernières années)
1714 Points -3%
Asus ROG Strix Scar 16 2025
GeForce RTX 5090 Laptop, Ultra 9 275HX, WD PC SN8000S 2TB
1686 Points -5%
HP Omen Max 16 ah000
GeForce RTX 5090 Laptop, Ultra 9 275HX, WDC PC SN810 2TB
1673 Points -6%
WebXPRT 3 / Overall
HP Omen Max 16 ah000
GeForce RTX 5090 Laptop, Ultra 9 275HX, WDC PC SN810 2TB
359 Points +5%
SCHENKER XMG Neo 16 E25 RTX 5090 Laptop
GeForce RTX 5090 Laptop, Ultra 9 275HX, Samsung 9100 Pro 1 TB
349 Points +2%
Aorus MASTER 16 AM6H
GeForce RTX 5090 Laptop, Ultra 9 275HX, Kingston OM8PGP41024Q-A0
346 Points +1%
Asus ROG Strix Scar 16 2025
GeForce RTX 5090 Laptop, Ultra 9 275HX, WD PC SN8000S 2TB
344 Points +1%
SCHENKER XMG Neo 16 A25 5090
GeForce RTX 5090 Laptop, R9 9955HX3D, Kingston Fury Renegade SFYRS1000G
342 Points
Moyenne AMD Ryzen 9 9955HX3D, Nvidia GeForce RTX 5090 Laptop
  (n=1)
342 Points 0%
Medion Erazer Beast 16 X1 Ultimate
GeForce RTX 5090 Laptop, Ultra 9 275HX, Phison E31 2 TB
331 Points -3%
Moyenne de la classe Gaming
  (215 - 480, n=125, 2 dernières années)
310 Points -9%
WebXPRT 4 / Overall
Asus ROG Strix Scar 16 2025
GeForce RTX 5090 Laptop, Ultra 9 275HX, WD PC SN8000S 2TB
337 Points +5%
Medion Erazer Beast 16 X1 Ultimate
GeForce RTX 5090 Laptop, Ultra 9 275HX, Phison E31 2 TB
335 Points +5%
Aorus MASTER 16 AM6H
GeForce RTX 5090 Laptop, Ultra 9 275HX, Kingston OM8PGP41024Q-A0
333 Points +4%
SCHENKER XMG Neo 16 E25 RTX 5090 Laptop
GeForce RTX 5090 Laptop, Ultra 9 275HX, Samsung 9100 Pro 1 TB
333 Points +4%
SCHENKER XMG Neo 16 A25 5090
GeForce RTX 5090 Laptop, R9 9955HX3D, Kingston Fury Renegade SFYRS1000G
320 Points
Moyenne AMD Ryzen 9 9955HX3D, Nvidia GeForce RTX 5090 Laptop
  (n=1)
320 Points 0%
Moyenne de la classe Gaming
  (176.4 - 341, n=113, 2 dernières années)
274 Points -14%
Mozilla Kraken 1.1 / Total
Moyenne de la classe Gaming
  (397 - 674, n=135, 2 dernières années)
488 ms * -23%
HP Omen Max 16 ah000
GeForce RTX 5090 Laptop, Ultra 9 275HX, WDC PC SN810 2TB
420 ms * -6%
Asus ROG Strix Scar 16 2025
GeForce RTX 5090 Laptop, Ultra 9 275HX, WD PC SN8000S 2TB
412 ms * -4%
Aorus MASTER 16 AM6H
GeForce RTX 5090 Laptop, Ultra 9 275HX, Kingston OM8PGP41024Q-A0
411 ms * -4%
Medion Erazer Beast 16 X1 Ultimate
GeForce RTX 5090 Laptop, Ultra 9 275HX, Phison E31 2 TB
411 ms * -4%
SCHENKER XMG Neo 16 E25 RTX 5090 Laptop
GeForce RTX 5090 Laptop, Ultra 9 275HX, Samsung 9100 Pro 1 TB
404 ms * -2%
SCHENKER XMG Neo 16 A25 5090
GeForce RTX 5090 Laptop, R9 9955HX3D, Kingston Fury Renegade SFYRS1000G
397 ms *
Moyenne AMD Ryzen 9 9955HX3D, Nvidia GeForce RTX 5090 Laptop
  (n=1)
397 ms * -0%

* ... Moindre est la valeur, meilleures sont les performances

PCMark 10 Score
9647 points
Aide
AIDA64 / Memory Copy
SCHENKER XMG Neo 16 E25 RTX 5090 Laptop
Intel Core Ultra 9 275HX, GeForce RTX 5090 Laptop
86978 MB/s +41%
Asus ROG Strix Scar 16 2025
Intel Core Ultra 9 275HX, GeForce RTX 5090 Laptop
84020 MB/s +37%
Medion Erazer Beast 16 X1 Ultimate
Intel Core Ultra 9 275HX, GeForce RTX 5090 Laptop
79577 MB/s +29%
HP Omen Max 16 ah000
Intel Core Ultra 9 275HX, GeForce RTX 5090 Laptop
77500 MB/s +26%
Aorus MASTER 16 AM6H
Intel Core Ultra 9 275HX, GeForce RTX 5090 Laptop
75982 MB/s +23%
Moyenne de la classe Gaming
  (21750 - 97515, n=144, 2 dernières années)
68455 MB/s +11%
SCHENKER XMG Neo 16 A25 5090
AMD Ryzen 9 9955HX3D, GeForce RTX 5090 Laptop
61533 MB/s
Moyenne AMD Ryzen 9 9955HX3D
  (56383 - 61533, n=2)
58958 MB/s -4%
AIDA64 / Memory Read
SCHENKER XMG Neo 16 E25 RTX 5090 Laptop
Intel Core Ultra 9 275HX, GeForce RTX 5090 Laptop
97151 MB/s +49%
Asus ROG Strix Scar 16 2025
Intel Core Ultra 9 275HX, GeForce RTX 5090 Laptop
87760 MB/s +34%
Medion Erazer Beast 16 X1 Ultimate
Intel Core Ultra 9 275HX, GeForce RTX 5090 Laptop
86460 MB/s +32%
HP Omen Max 16 ah000
Intel Core Ultra 9 275HX, GeForce RTX 5090 Laptop
84473 MB/s +29%
Aorus MASTER 16 AM6H
Intel Core Ultra 9 275HX, GeForce RTX 5090 Laptop
82625 MB/s +26%
Moyenne de la classe Gaming
  (22956 - 103347, n=144, 2 dernières années)
71418 MB/s +9%
SCHENKER XMG Neo 16 A25 5090
AMD Ryzen 9 9955HX3D, GeForce RTX 5090 Laptop
65369 MB/s
Moyenne AMD Ryzen 9 9955HX3D
  (59750 - 65369, n=2)
62560 MB/s -4%
AIDA64 / Memory Write
SCHENKER XMG Neo 16 E25 RTX 5090 Laptop
Intel Core Ultra 9 275HX, GeForce RTX 5090 Laptop
85648 MB/s +17%
Asus ROG Strix Scar 16 2025
Intel Core Ultra 9 275HX, GeForce RTX 5090 Laptop
82159 MB/s +13%
HP Omen Max 16 ah000
Intel Core Ultra 9 275HX, GeForce RTX 5090 Laptop
77637 MB/s +7%
Medion Erazer Beast 16 X1 Ultimate
Intel Core Ultra 9 275HX, GeForce RTX 5090 Laptop
77505 MB/s +6%
Aorus MASTER 16 AM6H
Intel Core Ultra 9 275HX, GeForce RTX 5090 Laptop
73095 MB/s 0%
SCHENKER XMG Neo 16 A25 5090
AMD Ryzen 9 9955HX3D, GeForce RTX 5090 Laptop
72898 MB/s
Moyenne de la classe Gaming
  (22297 - 108954, n=144, 2 dernières années)
70682 MB/s -3%
Moyenne AMD Ryzen 9 9955HX3D
  (59506 - 72898, n=2)
66202 MB/s -9%
AIDA64 / Memory Latency
HP Omen Max 16 ah000
Intel Core Ultra 9 275HX, GeForce RTX 5090 Laptop
118.7 ns * -15%
Aorus MASTER 16 AM6H
Intel Core Ultra 9 275HX, GeForce RTX 5090 Laptop
111.9 ns * -8%
Asus ROG Strix Scar 16 2025
Intel Core Ultra 9 275HX, GeForce RTX 5090 Laptop
111.2 ns * -7%
Medion Erazer Beast 16 X1 Ultimate
Intel Core Ultra 9 275HX, GeForce RTX 5090 Laptop
110.2 ns * -6%
SCHENKER XMG Neo 16 E25 RTX 5090 Laptop
Intel Core Ultra 9 275HX, GeForce RTX 5090 Laptop
107.7 ns * -4%
SCHENKER XMG Neo 16 A25 5090
AMD Ryzen 9 9955HX3D, GeForce RTX 5090 Laptop
103.6 ns *
Moyenne AMD Ryzen 9 9955HX3D
  (96.1 - 103.6, n=2)
99.9 ns * +4%
Moyenne de la classe Gaming
  (59.5 - 259, n=144, 2 dernières années)
98.8 ns * +5%

* ... Moindre est la valeur, meilleures sont les performances

LatencyMon - Vue d'ensemble
LatencyMon - Pilote
LatencyMon - Pilote
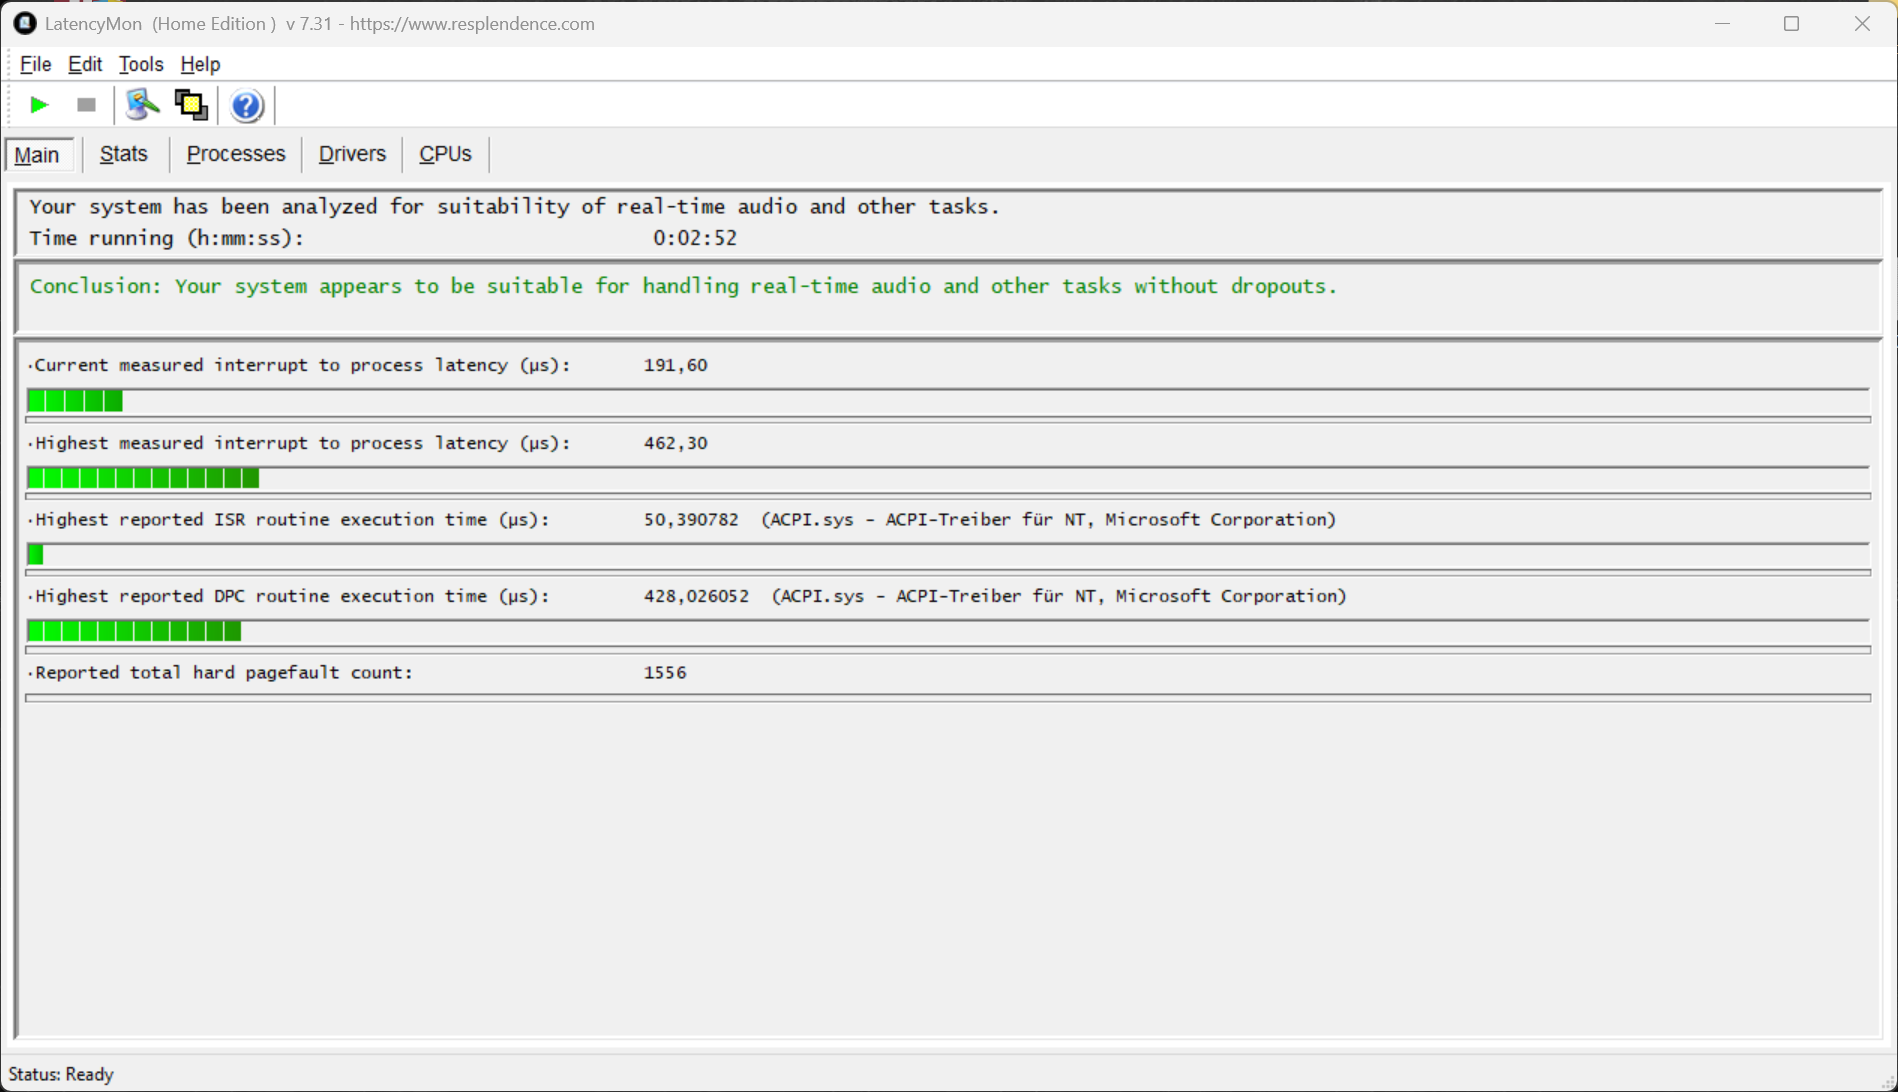
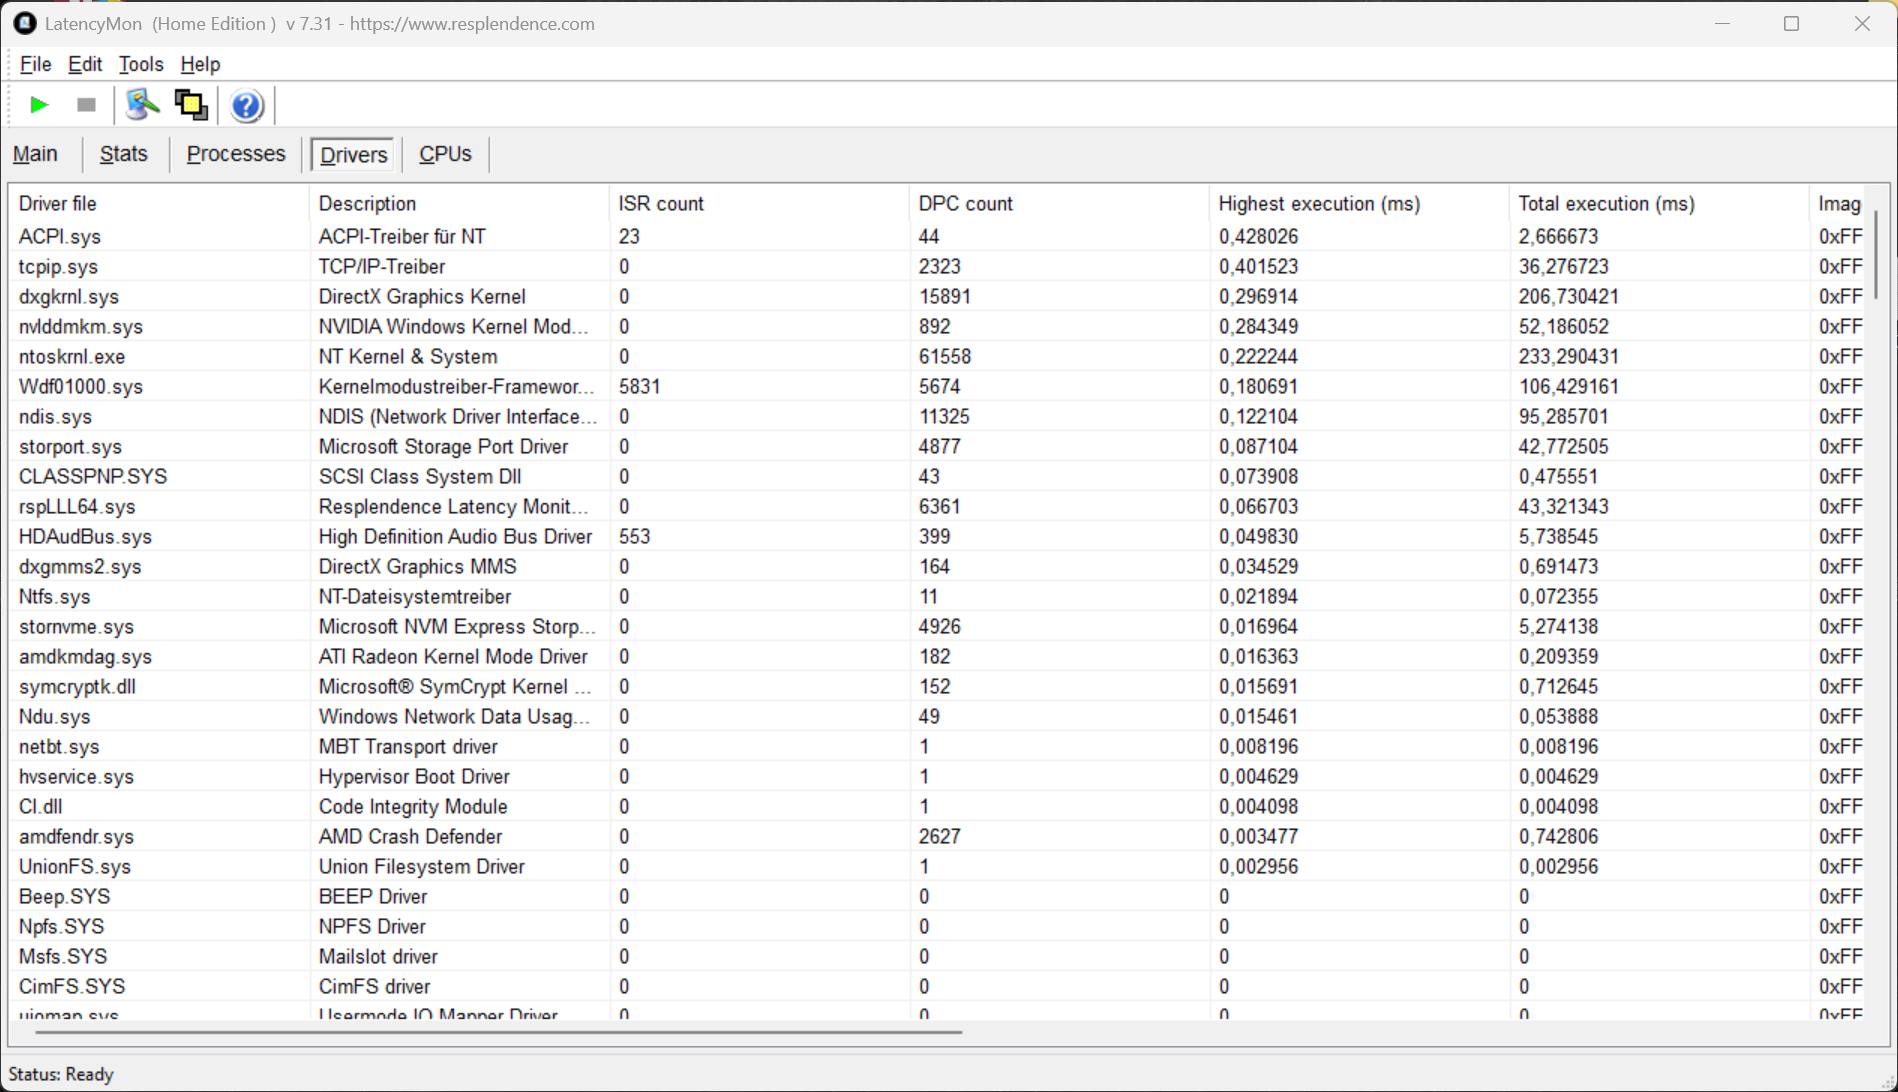
DPC Latencies / LatencyMon - interrupt to process latency (max), Web, Youtube, Prime95
Asus ROG Strix Scar 16 2025
GeForce RTX 5090 Laptop, Ultra 9 275HX, WD PC SN8000S 2TB
2296.5 μs * -397%
Aorus MASTER 16 AM6H
GeForce RTX 5090 Laptop, Ultra 9 275HX, Kingston OM8PGP41024Q-A0
1637.7 μs * -254%
HP Omen Max 16 ah000
GeForce RTX 5090 Laptop, Ultra 9 275HX, WDC PC SN810 2TB
1516.1 μs * -228%
SCHENKER XMG Neo 16 E25 RTX 5090 Laptop
GeForce RTX 5090 Laptop, Ultra 9 275HX, Samsung 9100 Pro 1 TB
1465.8 μs * -217%
Medion Erazer Beast 16 X1 Ultimate
GeForce RTX 5090 Laptop, Ultra 9 275HX, Phison E31 2 TB
911.5 μs * -97%
SCHENKER XMG Neo 16 A25 5090
GeForce RTX 5090 Laptop, R9 9955HX3D, Kingston Fury Renegade SFYRS1000G
462.3 μs *

* ... Moindre est la valeur, meilleures sont les performances

Kingston Fury Renegade SFYRS1000G
CDM 5/6 Read Seq Q32T1: 9502 MB/s
CDM 5/6 Write Seq Q32T1: 6580 MB/s
CDM 5/6 Read 4K Q32T1: 324 MB/s
CDM 5/6 Write 4K Q32T1: 403 MB/s
CDM 5/6 Read 4K: 63.5 MB/s
CDM 5/6 Write 4K: 118.6 MB/s
CDM 6 Write 4K Q8T8: 294 MB/s
CDM 6 Read 4K Q8T8: 862 MB/s
Drive Performance Rating - Percent
SCHENKER XMG Neo 16 A25 5090
Kingston Fury Renegade SFYRS1000G
78.4 pt
SCHENKER XMG Neo 16 E25 RTX 5090 Laptop
Samsung 9100 Pro 1 TB
75.5 pt
Moyenne Kingston Fury Renegade SFYRS1000G
 
72.3 pt
Medion Erazer Beast 16 X1 Ultimate
Phison E31 2 TB
68.1 pt
Aorus MASTER 16 AM6H
Kingston OM8PGP41024Q-A0
67.3 pt
Moyenne de la classe Gaming
 
63.3 pt
Asus ROG Strix Scar 16 2025
WD PC SN8000S 2TB
55.8 pt
HP Omen Max 16 ah000
WDC PC SN810 2TB
48.1 pt
DiskSpd
seq read
SCHENKER XMG Neo 16 A25 5090
Kingston Fury Renegade SFYRS1000G
7029 (6966.86min - 7029.44max) MB/s
SCHENKER XMG Neo 16 E25 RTX 5090 Laptop
Samsung 9100 Pro 1 TB
5861 (5825.98min - 5861.12max) MB/s -17%
Moyenne Kingston Fury Renegade SFYRS1000G
  (3912 - 7029, n=2)
5471 MB/s -22%
Medion Erazer Beast 16 X1 Ultimate
Phison E31 2 TB
3968 (3897.56min - 3968.05max) MB/s -44%
Moyenne de la classe Gaming
  (281 - 7663, n=127, 2 dernières années)
3447 MB/s -51%
HP Omen Max 16 ah000
WDC PC SN810 2TB
3415 (3349.37min - 3415.42max) MB/s -51%
Aorus MASTER 16 AM6H
Kingston OM8PGP41024Q-A0
3268 (3226.52min - 3267.96max) MB/s -54%
Asus ROG Strix Scar 16 2025
WD PC SN8000S 2TB
331 (68.02min - 331.14max) MB/s -95%
seq write
SCHENKER XMG Neo 16 A25 5090
Kingston Fury Renegade SFYRS1000G
5592 (5439.62min - 5591.78max) MB/s
Moyenne Kingston Fury Renegade SFYRS1000G
  (4256 - 5592, n=2)
4924 MB/s -12%
SCHENKER XMG Neo 16 E25 RTX 5090 Laptop
Samsung 9100 Pro 1 TB
4387 (4285.53min - 4387.28max) MB/s -22%
Aorus MASTER 16 AM6H
Kingston OM8PGP41024Q-A0
3906 (3851.27min - 3906.37max) MB/s -30%
Moyenne de la classe Gaming
  (535 - 9307, n=127, 2 dernières années)
3864 MB/s -31%
Medion Erazer Beast 16 X1 Ultimate
Phison E31 2 TB
3272 (3073.73min - 3272.14max) MB/s -41%
Asus ROG Strix Scar 16 2025
WD PC SN8000S 2TB
3016 (2843.5min - 3016.38max) MB/s -46%
HP Omen Max 16 ah000
WDC PC SN810 2TB
2570 (2187.36min - 2569.74max) MB/s -54%
seq q8 t1 read
SCHENKER XMG Neo 16 A25 5090
Kingston Fury Renegade SFYRS1000G
14313 (12003.9min - 14312.6max) MB/s
SCHENKER XMG Neo 16 E25 RTX 5090 Laptop
Samsung 9100 Pro 1 TB
13091 (10532.2min - 13090.8max) MB/s -9%
Moyenne Kingston Fury Renegade SFYRS1000G
  (7116 - 14313, n=2)
10715 MB/s -25%
Medion Erazer Beast 16 X1 Ultimate
Phison E31 2 TB
9744 (8105.91min - 9743.59max) MB/s -32%
Asus ROG Strix Scar 16 2025
WD PC SN8000S 2TB
6880 (6106.07min - 6880.21max) MB/s -52%
HP Omen Max 16 ah000
WDC PC SN810 2TB
6766 (5345.22min - 6765.62max) MB/s -53%
Moyenne de la classe Gaming
  (2594 - 15056, n=127, 2 dernières années)
6535 MB/s -54%
Aorus MASTER 16 AM6H
Kingston OM8PGP41024Q-A0
4799 (4213.14min - 4799.33max) MB/s -66%
seq q8 t1 write
SCHENKER XMG Neo 16 A25 5090
Kingston Fury Renegade SFYRS1000G
10800 (10111.1min - 10799.7max) MB/s
Moyenne Kingston Fury Renegade SFYRS1000G
  (6135 - 10800, n=2)
8468 MB/s -22%
SCHENKER XMG Neo 16 E25 RTX 5090 Laptop
Samsung 9100 Pro 1 TB
7264 (5656.44min - 7264.06max) MB/s -33%
Medion Erazer Beast 16 X1 Ultimate
Phison E31 2 TB
6525 (4526.28min - 6524.61max) MB/s -40%
Asus ROG Strix Scar 16 2025
WD PC SN8000S 2TB
5275 (5153.09min - 5274.69max) MB/s -51%
HP Omen Max 16 ah000
WDC PC SN810 2TB
5187 (5110.55min - 5187.31max) MB/s -52%
Moyenne de la classe Gaming
  (539 - 13519, n=127, 2 dernières années)
5112 MB/s -53%
Aorus MASTER 16 AM6H
Kingston OM8PGP41024Q-A0
3905 (3856.71min - 3905.27max) MB/s -64%
4k q1 t1 read
Moyenne Kingston Fury Renegade SFYRS1000G
  (69.8 - 86.5, n=2)
78.2 MB/s +12%
SCHENKER XMG Neo 16 E25 RTX 5090 Laptop
Samsung 9100 Pro 1 TB
77.4 (77.02min - 77.43max) MB/s +11%
Medion Erazer Beast 16 X1 Ultimate
Phison E31 2 TB
75.2 (73.03min - 75.16max) MB/s +8%
SCHENKER XMG Neo 16 A25 5090
Kingston Fury Renegade SFYRS1000G
69.8 (69.45min - 69.83max) MB/s
Asus ROG Strix Scar 16 2025
WD PC SN8000S 2TB
69.6 (64.94min - 69.55max) MB/s 0%
Aorus MASTER 16 AM6H
Kingston OM8PGP41024Q-A0
68.4 (66.54min - 68.38max) MB/s -2%
Moyenne de la classe Gaming
  (32.9 - 95.9, n=127, 2 dernières années)
67.4 MB/s -3%
HP Omen Max 16 ah000
WDC PC SN810 2TB
57.4 (57.08min - 57.42max) MB/s -18%
4k q1 t1 write
Aorus MASTER 16 AM6H
Kingston OM8PGP41024Q-A0
317 (306.21min - 316.5max) MB/s +86%
Moyenne de la classe Gaming
  (78 - 397, n=127, 2 dernières années)
217 MB/s +27%
Moyenne Kingston Fury Renegade SFYRS1000G
  (170.3 - 192, n=2)
181.2 MB/s +6%
SCHENKER XMG Neo 16 A25 5090
Kingston Fury Renegade SFYRS1000G
170.3 (168.43min - 170.32max) MB/s
Medion Erazer Beast 16 X1 Ultimate
Phison E31 2 TB
160.3 (157.41min - 160.31max) MB/s -6%
Asus ROG Strix Scar 16 2025
WD PC SN8000S 2TB
159.4 (153.59min - 159.38max) MB/s -6%
SCHENKER XMG Neo 16 E25 RTX 5090 Laptop
Samsung 9100 Pro 1 TB
157 (155.82min - 156.95max) MB/s -8%
HP Omen Max 16 ah000
WDC PC SN810 2TB
149.4 (92.02min - 149.43max) MB/s -12%
4k q32 t16 read
Aorus MASTER 16 AM6H
Kingston OM8PGP41024Q-A0
2809 (2804.8min - 2809.03max) MB/s +153%
Moyenne de la classe Gaming
  (417 - 6172, n=127, 2 dernières années)
2506 MB/s +125%
Moyenne Kingston Fury Renegade SFYRS1000G
  (1112 - 1176, n=2)
1144 MB/s +3%
SCHENKER XMG Neo 16 A25 5090
Kingston Fury Renegade SFYRS1000G
1112 (1085.98min - 1112.27max) MB/s
HP Omen Max 16 ah000
WDC PC SN810 2TB
982 (747.27min - 982.13max) MB/s -12%
SCHENKER XMG Neo 16 E25 RTX 5090 Laptop
Samsung 9100 Pro 1 TB
961 (945.93min - 961.25max) MB/s -14%
Medion Erazer Beast 16 X1 Ultimate
Phison E31 2 TB
948 (837.88min - 947.74max) MB/s -15%
Asus ROG Strix Scar 16 2025
WD PC SN8000S 2TB
679 (591.01min - 678.88max) MB/s -39%
4k q32 t16 write
Aorus MASTER 16 AM6H
Kingston OM8PGP41024Q-A0
3711 (3674.85min - 3711.4max) MB/s +500%
Moyenne de la classe Gaming
  (162.3 - 5588, n=127, 2 dernières années)
2053 MB/s +232%
SCHENKER XMG Neo 16 A25 5090
Kingston Fury Renegade SFYRS1000G
618 (609.25min - 617.87max) MB/s
Moyenne Kingston Fury Renegade SFYRS1000G
  (538 - 618, n=2)
578 MB/s -6%
Medion Erazer Beast 16 X1 Ultimate
Phison E31 2 TB
555 (533.82min - 554.71max) MB/s -10%
SCHENKER XMG Neo 16 E25 RTX 5090 Laptop
Samsung 9100 Pro 1 TB
544 (523.14min - 543.91max) MB/s -12%
HP Omen Max 16 ah000
WDC PC SN810 2TB
520 (486.41min - 520.16max) MB/s -16%
Asus ROG Strix Scar 16 2025
WD PC SN8000S 2TB
505 (461.27min - 504.83max) MB/s -18%
AS SSD
Score Total
SCHENKER XMG Neo 16 E25 RTX 5090 Laptop
Samsung 9100 Pro 1 TB
8857 Points +9%
Moyenne Kingston Fury Renegade SFYRS1000G
  (8146 - 8263, n=2)
8205 Points +1%
SCHENKER XMG Neo 16 A25 5090
Kingston Fury Renegade SFYRS1000G
8146 Points
Medion Erazer Beast 16 X1 Ultimate
Phison E31 2 TB
7940 Points -3%
Asus ROG Strix Scar 16 2025
WD PC SN8000S 2TB
7590 Points -7%
Moyenne de la classe Gaming
  (2271 - 13854, n=124, 2 dernières années)
6784 Points -17%
Aorus MASTER 16 AM6H
Kingston OM8PGP41024Q-A0
6720 Points -18%
HP Omen Max 16 ah000
WDC PC SN810 2TB
5355 Points -34%
Score Read
Aorus MASTER 16 AM6H
Kingston OM8PGP41024Q-A0
2761 Points +48%
Moyenne de la classe Gaming
  (776 - 4721, n=124, 2 dernières années)
2380 Points +27%
SCHENKER XMG Neo 16 E25 RTX 5090 Laptop
Samsung 9100 Pro 1 TB
2056 Points +10%
SCHENKER XMG Neo 16 A25 5090
Kingston Fury Renegade SFYRS1000G
1869 Points
Moyenne Kingston Fury Renegade SFYRS1000G
  (1792 - 1869, n=2)
1831 Points -2%
Medion Erazer Beast 16 X1 Ultimate
Phison E31 2 TB
1758 Points -6%
HP Omen Max 16 ah000
WDC PC SN810 2TB
1569 Points -16%
Asus ROG Strix Scar 16 2025
WD PC SN8000S 2TB
1541 Points -18%
Score Write
SCHENKER XMG Neo 16 E25 RTX 5090 Laptop
Samsung 9100 Pro 1 TB
5936 Points +8%
Moyenne Kingston Fury Renegade SFYRS1000G
  (5482 - 5665, n=2)
5574 Points +2%
SCHENKER XMG Neo 16 A25 5090
Kingston Fury Renegade SFYRS1000G
5482 Points
Medion Erazer Beast 16 X1 Ultimate
Phison E31 2 TB
5380 Points -2%
Asus ROG Strix Scar 16 2025
WD PC SN8000S 2TB
5263 Points -4%
Moyenne de la classe Gaming
  (515 - 7208, n=124, 2 dernières années)
3255 Points -41%
HP Omen Max 16 ah000
WDC PC SN810 2TB
3074 Points -44%
Aorus MASTER 16 AM6H
Kingston OM8PGP41024Q-A0
2588 Points -53%
Seq Read
SCHENKER XMG Neo 16 E25 RTX 5090 Laptop
Samsung 9100 Pro 1 TB
9653 MB/s +2%
SCHENKER XMG Neo 16 A25 5090
Kingston Fury Renegade SFYRS1000G
9484 MB/s
Moyenne Kingston Fury Renegade SFYRS1000G
  (5664 - 9484, n=2)
7574 MB/s -20%
Medion Erazer Beast 16 X1 Ultimate
Phison E31 2 TB
6860.6 MB/s -28%
HP Omen Max 16 ah000
WDC PC SN810 2TB
5105.48 MB/s -46%
Moyenne de la classe Gaming
  (2260 - 9890, n=124, 2 dernières années)
5105 MB/s -46%
Asus ROG Strix Scar 16 2025
WD PC SN8000S 2TB
4260 MB/s -55%
Aorus MASTER 16 AM6H
Kingston OM8PGP41024Q-A0
4092 MB/s -57%
Seq Write
SCHENKER XMG Neo 16 A25 5090
Kingston Fury Renegade SFYRS1000G
6039 MB/s
SCHENKER XMG Neo 16 E25 RTX 5090 Laptop
Samsung 9100 Pro 1 TB
5562 MB/s -8%
Moyenne Kingston Fury Renegade SFYRS1000G
  (3081 - 6039, n=2)
4560 MB/s -24%
Medion Erazer Beast 16 X1 Ultimate
Phison E31 2 TB
4523.93 MB/s -25%
Moyenne de la classe Gaming
  (495 - 9486, n=124, 2 dernières années)
3855 MB/s -36%
Asus ROG Strix Scar 16 2025
WD PC SN8000S 2TB
3812 MB/s -37%
HP Omen Max 16 ah000
WDC PC SN810 2TB
3100.36 MB/s -49%
Aorus MASTER 16 AM6H
Kingston OM8PGP41024Q-A0
3060 MB/s -49%
4K Read
Aorus MASTER 16 AM6H
Kingston OM8PGP41024Q-A0
85 MB/s +28%
SCHENKER XMG Neo 16 E25 RTX 5090 Laptop
Samsung 9100 Pro 1 TB
81.6 MB/s +23%
Medion Erazer Beast 16 X1 Ultimate
Phison E31 2 TB
78.94 MB/s +19%
Asus ROG Strix Scar 16 2025
WD PC SN8000S 2TB
75.6 MB/s +14%
Moyenne Kingston Fury Renegade SFYRS1000G
  (66.4 - 77.7, n=2)
72.1 MB/s +9%
SCHENKER XMG Neo 16 A25 5090
Kingston Fury Renegade SFYRS1000G
66.4 MB/s
Moyenne de la classe Gaming
  (27.8 - 112.1, n=124, 2 dernières années)
65.8 MB/s -1%
HP Omen Max 16 ah000
WDC PC SN810 2TB
54.74 MB/s -18%
4K Write
Aorus MASTER 16 AM6H
Kingston OM8PGP41024Q-A0
271 MB/s +20%
Asus ROG Strix Scar 16 2025
WD PC SN8000S 2TB
249 MB/s +11%
Moyenne Kingston Fury Renegade SFYRS1000G
  (225 - 272, n=2)
249 MB/s +11%
Medion Erazer Beast 16 X1 Ultimate
Phison E31 2 TB
245.88 MB/s +9%
SCHENKER XMG Neo 16 E25 RTX 5090 Laptop
Samsung 9100 Pro 1 TB
226 MB/s 0%
SCHENKER XMG Neo 16 A25 5090
Kingston Fury Renegade SFYRS1000G
225 MB/s
Moyenne de la classe Gaming
  (79.4 - 512, n=124, 2 dernières années)
216 MB/s -4%
HP Omen Max 16 ah000
WDC PC SN810 2TB
185.44 MB/s -18%
4K-64 Read
Aorus MASTER 16 AM6H
Kingston OM8PGP41024Q-A0
2266 MB/s +165%
Moyenne de la classe Gaming
  (451 - 3630, n=124, 2 dernières années)
1797 MB/s +110%
Asus ROG Strix Scar 16 2025
WD PC SN8000S 2TB
1039 MB/s +22%
SCHENKER XMG Neo 16 E25 RTX 5090 Laptop
Samsung 9100 Pro 1 TB
1010 MB/s +18%
HP Omen Max 16 ah000
WDC PC SN810 2TB
1004.03 MB/s +18%
Moyenne Kingston Fury Renegade SFYRS1000G
  (854 - 1148, n=2)
1001 MB/s +17%
Medion Erazer Beast 16 X1 Ultimate
Phison E31 2 TB
993.4 MB/s +16%
SCHENKER XMG Neo 16 A25 5090
Kingston Fury Renegade SFYRS1000G
854 MB/s
4K-64 Write
SCHENKER XMG Neo 16 E25 RTX 5090 Laptop
Samsung 9100 Pro 1 TB
5155 MB/s +11%
Moyenne Kingston Fury Renegade SFYRS1000G
  (4653 - 5085, n=2)
4869 MB/s +5%
Medion Erazer Beast 16 X1 Ultimate
Phison E31 2 TB
4681.46 MB/s +1%
SCHENKER XMG Neo 16 A25 5090
Kingston Fury Renegade SFYRS1000G
4653 MB/s
Asus ROG Strix Scar 16 2025
WD PC SN8000S 2TB
4633 MB/s 0%
Moyenne de la classe Gaming
  (277 - 5909, n=124, 2 dernières années)
2657 MB/s -43%
HP Omen Max 16 ah000
WDC PC SN810 2TB
2578.56 MB/s -45%
Aorus MASTER 16 AM6H
Kingston OM8PGP41024Q-A0
2011 MB/s -57%
Access Time Read
Asus ROG Strix Scar 16 2025
WD PC SN8000S 2TB
0.116 ms * -383%
Aorus MASTER 16 AM6H
Kingston OM8PGP41024Q-A0
0.092 ms * -283%
Moyenne Kingston Fury Renegade SFYRS1000G
  (0.024 - 0.104, n=2)
0.064 ms * -167%
Moyenne de la classe Gaming
  (0.016 - 0.379, n=123, 2 dernières années)
0.05645 ms * -135%
HP Omen Max 16 ah000
WDC PC SN810 2TB
0.054 ms * -125%
SCHENKER XMG Neo 16 E25 RTX 5090 Laptop
Samsung 9100 Pro 1 TB
0.052 ms * -117%
Medion Erazer Beast 16 X1 Ultimate
Phison E31 2 TB
0.033 ms * -38%
SCHENKER XMG Neo 16 A25 5090
Kingston Fury Renegade SFYRS1000G
0.024 ms *
Access Time Write
HP Omen Max 16 ah000
WDC PC SN810 2TB
0.06 ms * -253%
Moyenne de la classe Gaming
  (0.011 - 1.028, n=124, 2 dernières années)
0.04906 ms * -189%
Aorus MASTER 16 AM6H
Kingston OM8PGP41024Q-A0
0.04 ms * -135%
SCHENKER XMG Neo 16 E25 RTX 5090 Laptop
Samsung 9100 Pro 1 TB
0.017 ms * -0%
SCHENKER XMG Neo 16 A25 5090
Kingston Fury Renegade SFYRS1000G
0.017 ms *
Asus ROG Strix Scar 16 2025
WD PC SN8000S 2TB
0.016 ms * +6%
Medion Erazer Beast 16 X1 Ultimate
Phison E31 2 TB
0.015 ms * +12%
Moyenne Kingston Fury Renegade SFYRS1000G
  (0.013 - 0.017, n=2)
0.015 ms * +12%

* ... Moindre est la valeur, meilleures sont les performances

Continuous read: DiskSpd Read Loop, Queue Depth 8

0725145021752900362543505075580065257250797587009425101501087511600123251305013775Tooltip
SCHENKER XMG Neo 16 A25 5090; diskspd 2.0.17 f: Ø14274 (12676.44-14430.92)
3DMark Performance Rating - Percent
SCHENKER XMG Neo 16 A25 5090
Nvidia GeForce RTX 5090 Laptop, AMD Ryzen 9 9955HX3D
97.1 pt
SCHENKER XMG Neo 16 E25 RTX 5090 Laptop
Nvidia GeForce RTX 5090 Laptop, Intel Core Ultra 9 275HX
96.7 pt
Medion Erazer Beast 16 X1 Ultimate -1!
Nvidia GeForce RTX 5090 Laptop, Intel Core Ultra 9 275HX
94.8 pt
HP Omen Max 16 ah000 -1!
Nvidia GeForce RTX 5090 Laptop, Intel Core Ultra 9 275HX
93 pt
Moyenne Nvidia GeForce RTX 5090 Laptop
 
92 pt
Asus ROG Strix Scar 16 2025
Nvidia GeForce RTX 5090 Laptop, Intel Core Ultra 9 275HX
90.1 pt
Aorus MASTER 16 AM6H -1!
Nvidia GeForce RTX 5090 Laptop, Intel Core Ultra 9 275HX
90.1 pt
Moyenne de la classe Gaming
 
58.2 pt
3DMark 11 - 1280x720 Performance GPU
Medion Erazer Beast 16 X1 Ultimate
Nvidia GeForce RTX 5090 Laptop, Intel Core Ultra 9 275HX
76300 Points +10%
SCHENKER XMG Neo 16 E25 RTX 5090 Laptop
Nvidia GeForce RTX 5090 Laptop, Intel Core Ultra 9 275HX
73596 Points +7%
HP Omen Max 16 ah000
Nvidia GeForce RTX 5090 Laptop, Intel Core Ultra 9 275HX
72215 Points +5%
Aorus MASTER 16 AM6H
Nvidia GeForce RTX 5090 Laptop, Intel Core Ultra 9 275HX
70815 Points +2%
SCHENKER XMG Neo 16 A25 5090
Nvidia GeForce RTX 5090 Laptop, AMD Ryzen 9 9955HX3D
69089 Points
Moyenne Nvidia GeForce RTX 5090 Laptop
  (54052 - 76300, n=12)
68735 Points -1%
Asus ROG Strix Scar 16 2025
Nvidia GeForce RTX 5090 Laptop, Intel Core Ultra 9 275HX
63549 Points -8%
Moyenne de la classe Gaming
  (10741 - 76300, n=139, 2 dernières années)
46285 Points -33%
3DMark
1920x1080 Fire Strike Graphics
SCHENKER XMG Neo 16 A25 5090
Nvidia GeForce RTX 5090 Laptop, AMD Ryzen 9 9955HX3D
62849 Points
SCHENKER XMG Neo 16 E25 RTX 5090 Laptop
Nvidia GeForce RTX 5090 Laptop, Intel Core Ultra 9 275HX
54791 Points -13%
Medion Erazer Beast 16 X1 Ultimate
Nvidia GeForce RTX 5090 Laptop, Intel Core Ultra 9 275HX
54220 Points -14%
Moyenne Nvidia GeForce RTX 5090 Laptop
  (42516 - 62849, n=13)
52466 Points -17%
Asus ROG Strix Scar 16 2025
Nvidia GeForce RTX 5090 Laptop, Intel Core Ultra 9 275HX
49297 Points -22%
HP Omen Max 16 ah000
Nvidia GeForce RTX 5090 Laptop, Intel Core Ultra 9 275HX
49115 Points -22%
Aorus MASTER 16 AM6H
Nvidia GeForce RTX 5090 Laptop, Intel Core Ultra 9 275HX
47034 Points -25%
Moyenne de la classe Gaming
  (2913 - 62849, n=151, 2 dernières années)
33301 Points -47%
2560x1440 Time Spy Graphics
SCHENKER XMG Neo 16 E25 RTX 5090 Laptop
Nvidia GeForce RTX 5090 Laptop, Intel Core Ultra 9 275HX
25040 Points +2%
HP Omen Max 16 ah000
Nvidia GeForce RTX 5090 Laptop, Intel Core Ultra 9 275HX
24873 Points +2%
Aorus MASTER 16 AM6H
Nvidia GeForce RTX 5090 Laptop, Intel Core Ultra 9 275HX
24563 Points 0%
SCHENKER XMG Neo 16 A25 5090
Nvidia GeForce RTX 5090 Laptop, AMD Ryzen 9 9955HX3D
24483 Points
Medion Erazer Beast 16 X1 Ultimate
Nvidia GeForce RTX 5090 Laptop, Intel Core Ultra 9 275HX
23967 Points -2%
Moyenne Nvidia GeForce RTX 5090 Laptop
  (19216 - 25129, n=13)
23684 Points -3%
Asus ROG Strix Scar 16 2025
Nvidia GeForce RTX 5090 Laptop, Intel Core Ultra 9 275HX
23600 Points -4%
Moyenne de la classe Gaming
  (2295 - 25040, n=147, 2 dernières années)
14078 Points -42%
Steel Nomad Score
SCHENKER XMG Neo 16 E25 RTX 5090 Laptop
Nvidia GeForce RTX 5090 Laptop, Intel Core Ultra 9 275HX
6151 Points +2%
SCHENKER XMG Neo 16 A25 5090
Nvidia GeForce RTX 5090 Laptop, AMD Ryzen 9 9955HX3D
6029 Points
Asus ROG Strix Scar 16 2025
Nvidia GeForce RTX 5090 Laptop, Intel Core Ultra 9 275HX
6008 Points 0%
Moyenne Nvidia GeForce RTX 5090 Laptop
  (4791 - 6163, n=9)
5851 Points -3%
Aorus MASTER 16 AM6H
Nvidia GeForce RTX 5090 Laptop, Intel Core Ultra 9 275HX
5828 Points -3%
Moyenne de la classe Gaming
  (1522 - 6163, n=42, 2 dernières années)
3724 Points -38%
2560x1440 Port Royal Graphics
SCHENKER XMG Neo 16 E25 RTX 5090 Laptop
Nvidia GeForce RTX 5090 Laptop, Intel Core Ultra 9 275HX
16250 Points +1%
HP Omen Max 16 ah000
Nvidia GeForce RTX 5090 Laptop, Intel Core Ultra 9 275HX
16245 Points +1%
SCHENKER XMG Neo 16 A25 5090
Nvidia GeForce RTX 5090 Laptop, AMD Ryzen 9 9955HX3D
16143 Points
Medion Erazer Beast 16 X1 Ultimate
Nvidia GeForce RTX 5090 Laptop, Intel Core Ultra 9 275HX
15788 Points -2%
Moyenne Nvidia GeForce RTX 5090 Laptop
  (12749 - 17063, n=10)
15756 Points -2%
Asus ROG Strix Scar 16 2025
Nvidia GeForce RTX 5090 Laptop, Intel Core Ultra 9 275HX
15721 Points -3%
Moyenne de la classe Gaming
  (984 - 16250, n=83, 2 dernières années)
9823 Points -39%
3DMark 11 Performance
53735 points
3DMark Fire Strike Score
49845 points
3DMark Time Spy Score
21652 points
3DMark Steel Nomad Score
6029 points
Aide
Blender / v3.3 Classroom OPTIX/RTX
Moyenne de la classe Gaming
  (9 - 95, n=139, 2 dernières années)
20.2 Seconds * -124%
Medion Erazer Beast 16 X1 Ultimate
Nvidia GeForce RTX 5090 Laptop, Intel Core Ultra 9 275HX
18 Seconds * -100%
Asus ROG Strix Scar 16 2025
Nvidia GeForce RTX 5090 Laptop, Intel Core Ultra 9 275HX
15.3 Seconds * -70%
Moyenne Nvidia GeForce RTX 5090 Laptop
  (9 - 18, n=12)
12.3 Seconds * -37%
HP Omen Max 16 ah000
Nvidia GeForce RTX 5090 Laptop, Intel Core Ultra 9 275HX
12 Seconds * -33%
SCHENKER XMG Neo 16 E25 RTX 5090 Laptop
Nvidia GeForce RTX 5090 Laptop, Intel Core Ultra 9 275HX
11.47 Seconds * -27%
Aorus MASTER 16 AM6H
Nvidia GeForce RTX 5090 Laptop, Intel Core Ultra 9 275HX
11 Seconds * -22%
SCHENKER XMG Neo 16 A25 5090
Nvidia GeForce RTX 5090 Laptop, AMD Ryzen 9 9955HX3D
9 Seconds *
Blender / v3.3 Classroom CUDA
Medion Erazer Beast 16 X1 Ultimate
Nvidia GeForce RTX 5090 Laptop, Intel Core Ultra 9 275HX
37 Seconds * -147%
Moyenne de la classe Gaming
  (15 - 110, n=140, 2 dernières années)
34.1 Seconds * -127%
Asus ROG Strix Scar 16 2025
Nvidia GeForce RTX 5090 Laptop, Intel Core Ultra 9 275HX
19.4 Seconds * -29%
Moyenne Nvidia GeForce RTX 5090 Laptop
  (15 - 37, n=10)
18.7 Seconds * -25%
SCHENKER XMG Neo 16 E25 RTX 5090 Laptop
Nvidia GeForce RTX 5090 Laptop, Intel Core Ultra 9 275HX
16.04 Seconds * -7%
Aorus MASTER 16 AM6H
Nvidia GeForce RTX 5090 Laptop, Intel Core Ultra 9 275HX
16 Seconds * -7%
HP Omen Max 16 ah000
Nvidia GeForce RTX 5090 Laptop, Intel Core Ultra 9 275HX
15 Seconds * -0%
SCHENKER XMG Neo 16 A25 5090
Nvidia GeForce RTX 5090 Laptop, AMD Ryzen 9 9955HX3D
15 Seconds *
Blender / v3.3 Classroom CPU
Moyenne de la classe Gaming
  (122 - 962, n=145, 2 dernières années)
279 Seconds * -127%
Medion Erazer Beast 16 X1 Ultimate
Nvidia GeForce RTX 5090 Laptop, Intel Core Ultra 9 275HX
190 Seconds * -54%
HP Omen Max 16 ah000
Nvidia GeForce RTX 5090 Laptop, Intel Core Ultra 9 275HX
162 Seconds * -32%
Moyenne Nvidia GeForce RTX 5090 Laptop
  (123 - 259, n=12)
160.1 Seconds * -30%
Aorus MASTER 16 AM6H
Nvidia GeForce RTX 5090 Laptop, Intel Core Ultra 9 275HX
149 Seconds * -21%
Asus ROG Strix Scar 16 2025
Nvidia GeForce RTX 5090 Laptop, Intel Core Ultra 9 275HX
138 Seconds * -12%
SCHENKER XMG Neo 16 E25 RTX 5090 Laptop
Nvidia GeForce RTX 5090 Laptop, Intel Core Ultra 9 275HX
134 Seconds * -9%
SCHENKER XMG Neo 16 A25 5090
Nvidia GeForce RTX 5090 Laptop, AMD Ryzen 9 9955HX3D
123 Seconds *

* ... Moindre est la valeur, meilleures sont les performances

Performance Rating - Percent
SCHENKER XMG Neo 16 A25 5090
AMD Ryzen 9 9955HX3D, Nvidia GeForce RTX 5090 Laptop
100 pt
SCHENKER XMG Neo 16 E25 RTX 5090 Laptop
Intel Core Ultra 9 275HX, Nvidia GeForce RTX 5090 Laptop
90.2 pt
Medion Erazer Beast 16 X1 Ultimate -1!
Intel Core Ultra 9 275HX, Nvidia GeForce RTX 5090 Laptop
86.6 pt
Asus ROG Strix Scar 16 2025
Intel Core Ultra 9 275HX, Nvidia GeForce RTX 5090 Laptop
85.7 pt
HP Omen Max 16 ah000 -2!
Intel Core Ultra 9 275HX, Nvidia GeForce RTX 5090 Laptop
84.7 pt
Aorus MASTER 16 AM6H
Intel Core Ultra 9 275HX, Nvidia GeForce RTX 5090 Laptop
83.8 pt
Moyenne de la classe Gaming
 
62.5 pt
Cyberpunk 2077 2.2 Phantom Liberty - 1920x1080 Ultra Preset (FSR off)
SCHENKER XMG Neo 16 A25 5090
AMD Ryzen 9 9955HX3D, Nvidia GeForce RTX 5090 Laptop
164 (130.9min) fps
Medion Erazer Beast 16 X1 Ultimate
Intel Core Ultra 9 275HX, Nvidia GeForce RTX 5090 Laptop
158.5 (122min) fps -3%
SCHENKER XMG Neo 16 E25 RTX 5090 Laptop
Intel Core Ultra 9 275HX, Nvidia GeForce RTX 5090 Laptop
154.8 (123.7min) fps -6%
Asus ROG Strix Scar 16 2025
Intel Core Ultra 9 275HX, Nvidia GeForce RTX 5090 Laptop
153.6 (124.2min) fps -6%
HP Omen Max 16 ah000
Intel Core Ultra 9 275HX, Nvidia GeForce RTX 5090 Laptop
151.9 (117.7min, 106.2P1) fps -7%
Aorus MASTER 16 AM6H
Intel Core Ultra 9 275HX, Nvidia GeForce RTX 5090 Laptop
137.5 (102min) fps -16%
Moyenne de la classe Gaming
  (6.76 - 164, n=108, 2 dernières années)
97.7 fps -40%
Baldur's Gate 3 - 1920x1080 Ultra Preset AA:T
SCHENKER XMG Neo 16 A25 5090
AMD Ryzen 9 9955HX3D, Nvidia GeForce RTX 5090 Laptop
218.8 fps
SCHENKER XMG Neo 16 E25 RTX 5090 Laptop
Intel Core Ultra 9 275HX, Nvidia GeForce RTX 5090 Laptop
201 fps -8%
Medion Erazer Beast 16 X1 Ultimate
Intel Core Ultra 9 275HX, Nvidia GeForce RTX 5090 Laptop
200 (86min, 110.5P0.1, 152.2P1) fps -9%
Aorus MASTER 16 AM6H
Intel Core Ultra 9 275HX, Nvidia GeForce RTX 5090 Laptop
194 fps -11%
Asus ROG Strix Scar 16 2025
Intel Core Ultra 9 275HX, Nvidia GeForce RTX 5090 Laptop
193.3 fps -12%
Moyenne de la classe Gaming
  (34.5 - 246, n=74, 2 dernières années)
130.4 fps -40%
GTA V - 1920x1080 Highest Settings possible AA:4xMSAA + FX AF:16x
SCHENKER XMG Neo 16 A25 5090
AMD Ryzen 9 9955HX3D, Nvidia GeForce RTX 5090 Laptop
186.9 (2.62min, 166.7P1) fps
SCHENKER XMG Neo 16 E25 RTX 5090 Laptop
Intel Core Ultra 9 275HX, Nvidia GeForce RTX 5090 Laptop
164.1 (3.7min, 100P1) fps -12%
Asus ROG Strix Scar 16 2025
Intel Core Ultra 9 275HX, Nvidia GeForce RTX 5090 Laptop
162.8 (3.33min, 111.1P1) fps -13%
Medion Erazer Beast 16 X1 Ultimate
Intel Core Ultra 9 275HX, Nvidia GeForce RTX 5090 Laptop
142.4 (3.25min, 90.9P1) fps -24%
Aorus MASTER 16 AM6H
Intel Core Ultra 9 275HX, Nvidia GeForce RTX 5090 Laptop
140.9 (3.56min, 90.9P1) fps -25%
Moyenne de la classe Gaming
  (12.1 - 186.9, n=123, 2 dernières années)
118.4 fps -37%
Final Fantasy XV Benchmark - 1920x1080 High Quality
SCHENKER XMG Neo 16 A25 5090
AMD Ryzen 9 9955HX3D, Nvidia GeForce RTX 5090 Laptop
208 fps
Medion Erazer Beast 16 X1 Ultimate
Intel Core Ultra 9 275HX, Nvidia GeForce RTX 5090 Laptop
205 fps -1%
HP Omen Max 16 ah000
Intel Core Ultra 9 275HX, Nvidia GeForce RTX 5090 Laptop
203 fps -2%
SCHENKER XMG Neo 16 E25 RTX 5090 Laptop
Intel Core Ultra 9 275HX, Nvidia GeForce RTX 5090 Laptop
203 fps -2%
Aorus MASTER 16 AM6H
Intel Core Ultra 9 275HX, Nvidia GeForce RTX 5090 Laptop
201 fps -3%
Asus ROG Strix Scar 16 2025
Intel Core Ultra 9 275HX, Nvidia GeForce RTX 5090 Laptop
194.6 fps -6%
Moyenne de la classe Gaming
  (19.2 - 212, n=141, 2 dernières années)
127 fps -39%
Strange Brigade - 1920x1080 ultra AA:ultra AF:16
SCHENKER XMG Neo 16 A25 5090
AMD Ryzen 9 9955HX3D, Nvidia GeForce RTX 5090 Laptop
453.1 fps
SCHENKER XMG Neo 16 E25 RTX 5090 Laptop
Intel Core Ultra 9 275HX, Nvidia GeForce RTX 5090 Laptop
434 (79.1min, 306P1) fps -4%
Aorus MASTER 16 AM6H
Intel Core Ultra 9 275HX, Nvidia GeForce RTX 5090 Laptop
408 (11.4min, 274P1) fps -10%
HP Omen Max 16 ah000
Intel Core Ultra 9 275HX, Nvidia GeForce RTX 5090 Laptop
382 (118.7min, 248P1) fps -16%
Asus ROG Strix Scar 16 2025
Intel Core Ultra 9 275HX, Nvidia GeForce RTX 5090 Laptop
375 (147.7min, 218P1) fps -17%
Moyenne de la classe Gaming
  (38.9 - 453, n=135, 2 dernières années)
244 fps -46%
Dota 2 Reborn - 1920x1080 ultra (3/3) best looking
SCHENKER XMG Neo 16 A25 5090
AMD Ryzen 9 9955HX3D, Nvidia GeForce RTX 5090 Laptop
248 (195.9min) fps
SCHENKER XMG Neo 16 E25 RTX 5090 Laptop
Intel Core Ultra 9 275HX, Nvidia GeForce RTX 5090 Laptop
185.6 (154.7min) fps -25%
Medion Erazer Beast 16 X1 Ultimate
Intel Core Ultra 9 275HX, Nvidia GeForce RTX 5090 Laptop
176.4 (144.9min) fps -29%
Asus ROG Strix Scar 16 2025
Intel Core Ultra 9 275HX, Nvidia GeForce RTX 5090 Laptop
167.2 (136.1min) fps -33%
Aorus MASTER 16 AM6H
Intel Core Ultra 9 275HX, Nvidia GeForce RTX 5090 Laptop
166.4 (141.2min) fps -33%
HP Omen Max 16 ah000
Intel Core Ultra 9 275HX, Nvidia GeForce RTX 5090 Laptop
161 (134.6min) fps -35%
Moyenne de la classe Gaming
  (65.1 - 248, n=144, 2 dernières années)
152.2 fps -39%
X-Plane 11.11 - 1920x1080 high (fps_test=3)
SCHENKER XMG Neo 16 A25 5090
AMD Ryzen 9 9955HX3D, Nvidia GeForce RTX 5090 Laptop
133.6 fps
SCHENKER XMG Neo 16 E25 RTX 5090 Laptop
Intel Core Ultra 9 275HX, Nvidia GeForce RTX 5090 Laptop
119.5 fps -11%
Asus ROG Strix Scar 16 2025
Intel Core Ultra 9 275HX, Nvidia GeForce RTX 5090 Laptop
115.9 fps -13%
Medion Erazer Beast 16 X1 Ultimate
Intel Core Ultra 9 275HX, Nvidia GeForce RTX 5090 Laptop
114.2 fps -15%
Aorus MASTER 16 AM6H
Intel Core Ultra 9 275HX, Nvidia GeForce RTX 5090 Laptop
113.2 fps -15%
HP Omen Max 16 ah000
Intel Core Ultra 9 275HX, Nvidia GeForce RTX 5090 Laptop
112.6 fps -16%
Moyenne de la classe Gaming
  (33.4 - 166.2, n=147, 2 dernières années)
104.8 fps -22%
Cyberpunk 2077 2.2 Phantom Liberty - 2560x1440 Ultra Preset (FSR off)
HP Omen Max 16 ah000
Intel Core Ultra 9 275HX, Nvidia GeForce RTX 5090 Laptop
111.3 (93.2min, 89.7P1) fps 0%
SCHENKER XMG Neo 16 A25 5090
AMD Ryzen 9 9955HX3D, Nvidia GeForce RTX 5090 Laptop
111.2 (91.6min) fps
Medion Erazer Beast 16 X1 Ultimate
Intel Core Ultra 9 275HX, Nvidia GeForce RTX 5090 Laptop
110.8 (93min) fps 0%
Aorus MASTER 16 AM6H
Intel Core Ultra 9 275HX, Nvidia GeForce RTX 5090 Laptop
109.7 (90.9min) fps -1%
SCHENKER XMG Neo 16 E25 RTX 5090 Laptop
Intel Core Ultra 9 275HX, Nvidia GeForce RTX 5090 Laptop
108.3 (91.2min) fps -3%
Asus ROG Strix Scar 16 2025
Intel Core Ultra 9 275HX, Nvidia GeForce RTX 5090 Laptop
107.7 (90.1min) fps -3%
Moyenne Nvidia GeForce RTX 5090 Laptop
  (83.2 - 115.6, n=15)
107.4 fps -3%
Moyenne de la classe Gaming
  (24.8 - 115.6, n=90, 2 dernières années)
72.2 fps -35%
Baldur's Gate 3 - 2560x1440 Ultra Preset AA:T
SCHENKER XMG Neo 16 A25 5090
AMD Ryzen 9 9955HX3D, Nvidia GeForce RTX 5090 Laptop
156.9 fps
Aorus MASTER 16 AM6H
Intel Core Ultra 9 275HX, Nvidia GeForce RTX 5090 Laptop
151 fps -4%
Medion Erazer Beast 16 X1 Ultimate
Intel Core Ultra 9 275HX, Nvidia GeForce RTX 5090 Laptop
151 (50min) fps -4%
SCHENKER XMG Neo 16 E25 RTX 5090 Laptop
Intel Core Ultra 9 275HX, Nvidia GeForce RTX 5090 Laptop
146 fps -7%
Moyenne Nvidia GeForce RTX 5090 Laptop
  (103.1 - 158.4, n=13)
145.3 fps -7%
Asus ROG Strix Scar 16 2025
Intel Core Ultra 9 275HX, Nvidia GeForce RTX 5090 Laptop
141.7 fps -10%
Moyenne de la classe Gaming
  (44 - 175.5, n=62, 2 dernières années)
104.3 fps -34%
F1 24 - 2560x1440 Ultra High Preset AA:T AF:16x
HP Omen Max 16 ah000
Intel Core Ultra 9 275HX, Nvidia GeForce RTX 5090 Laptop
104.3 (74min, 81P1) fps +3%
SCHENKER XMG Neo 16 E25 RTX 5090 Laptop
Intel Core Ultra 9 275HX, Nvidia GeForce RTX 5090 Laptop
103.3 (73min, 80P1) fps +2%
SCHENKER XMG Neo 16 A25 5090
AMD Ryzen 9 9955HX3D, Nvidia GeForce RTX 5090 Laptop
101.2 (76min, 81P1) fps
Moyenne Nvidia GeForce RTX 5090 Laptop
  (72.5 - 105.5, n=13)
98 fps -3%
Asus ROG Strix Scar 16 2025
Intel Core Ultra 9 275HX, Nvidia GeForce RTX 5090 Laptop
97.8 (70min, 75P1) fps -3%
Aorus MASTER 16 AM6H
Intel Core Ultra 9 275HX, Nvidia GeForce RTX 5090 Laptop
90 fps -11%
Moyenne de la classe Gaming
  (36.7 - 105, n=33, 2 dernières années)
76.1 fps -25%
Assassin's Creed Shadows - 2560x1440 Ultra High
SCHENKER XMG Neo 16 A25 5090
AMD Ryzen 9 9955HX3D, Nvidia GeForce RTX 5090 Laptop
59 fps
Aorus MASTER 16 AM6H
Intel Core Ultra 9 275HX, Nvidia GeForce RTX 5090 Laptop
56 fps -5%
HP Omen Max 16 ah000
Intel Core Ultra 9 275HX, Nvidia GeForce RTX 5090 Laptop
55 (45min) fps -7%
SCHENKER XMG Neo 16 E25 RTX 5090 Laptop
Intel Core Ultra 9 275HX, Nvidia GeForce RTX 5090 Laptop
55 fps -7%
Moyenne Nvidia GeForce RTX 5090 Laptop
  (37 - 59, n=11)
53.8 fps -9%
Moyenne de la classe Gaming
  (30 - 59, n=23, 2 dernières années)
48.9 fps -17%
Alan Wake 2 - 2560x1440 High Preset
SCHENKER XMG Neo 16 E25 RTX 5090 Laptop
Intel Core Ultra 9 275HX, Nvidia GeForce RTX 5090 Laptop
88.5 fps 0%
SCHENKER XMG Neo 16 A25 5090
AMD Ryzen 9 9955HX3D, Nvidia GeForce RTX 5090 Laptop
88.5 fps
Asus ROG Strix Scar 16 2025
Intel Core Ultra 9 275HX, Nvidia GeForce RTX 5090 Laptop
83.4 fps -6%
HP Omen Max 16 ah000
Intel Core Ultra 9 275HX, Nvidia GeForce RTX 5090 Laptop
82.9 fps -6%
Moyenne Nvidia GeForce RTX 5090 Laptop
  (57.6 - 88.8, n=12)
82.6 fps -7%
Aorus MASTER 16 AM6H
Intel Core Ultra 9 275HX, Nvidia GeForce RTX 5090 Laptop
81.1 fps -8%
Moyenne de la classe Gaming
  (22.5 - 88.5, n=34, 2 dernières années)
70.1 fps -21%
Call of Duty Black Ops 6 - 2560x1440 Extreme Preset
SCHENKER XMG Neo 16 A25 5090
AMD Ryzen 9 9955HX3D, Nvidia GeForce RTX 5090 Laptop
127 fps
Moyenne Nvidia GeForce RTX 5090 Laptop
  (92 - 136, n=6)
118.5 fps -7%
SCHENKER XMG Neo 16 E25 RTX 5090 Laptop
Intel Core Ultra 9 275HX, Nvidia GeForce RTX 5090 Laptop
116 fps -9%
Moyenne de la classe Gaming
  (60 - 127, n=12, 2 dernières années)
94.8 fps -25%
Asus ROG Strix Scar 16 2025
Intel Core Ultra 9 275HX, Nvidia GeForce RTX 5090 Laptop
92 fps -28%
Indiana Jones and the Great Circle - 2560x1440 Very Ultra Preset
HP Omen Max 16 ah000
Intel Core Ultra 9 275HX, Nvidia GeForce RTX 5090 Laptop
115.9 fps +9%
SCHENKER XMG Neo 16 A25 5090
AMD Ryzen 9 9955HX3D, Nvidia GeForce RTX 5090 Laptop
106 fps
Aorus MASTER 16 AM6H
Intel Core Ultra 9 275HX, Nvidia GeForce RTX 5090 Laptop
102 fps -4%
Moyenne Nvidia GeForce RTX 5090 Laptop
  (66.1 - 115.9, n=13)
101.8 fps -4%
SCHENKER XMG Neo 16 E25 RTX 5090 Laptop
Intel Core Ultra 9 275HX, Nvidia GeForce RTX 5090 Laptop
101.3 fps -4%
Asus ROG Strix Scar 16 2025
Intel Core Ultra 9 275HX, Nvidia GeForce RTX 5090 Laptop
99.1 fps -7%
Moyenne de la classe Gaming
  (66.1 - 115.9, n=21, 2 dernières années)
95.2 fps -10%
Données CPU/GPU Cyberpunk 2077 (1080p Ultra)

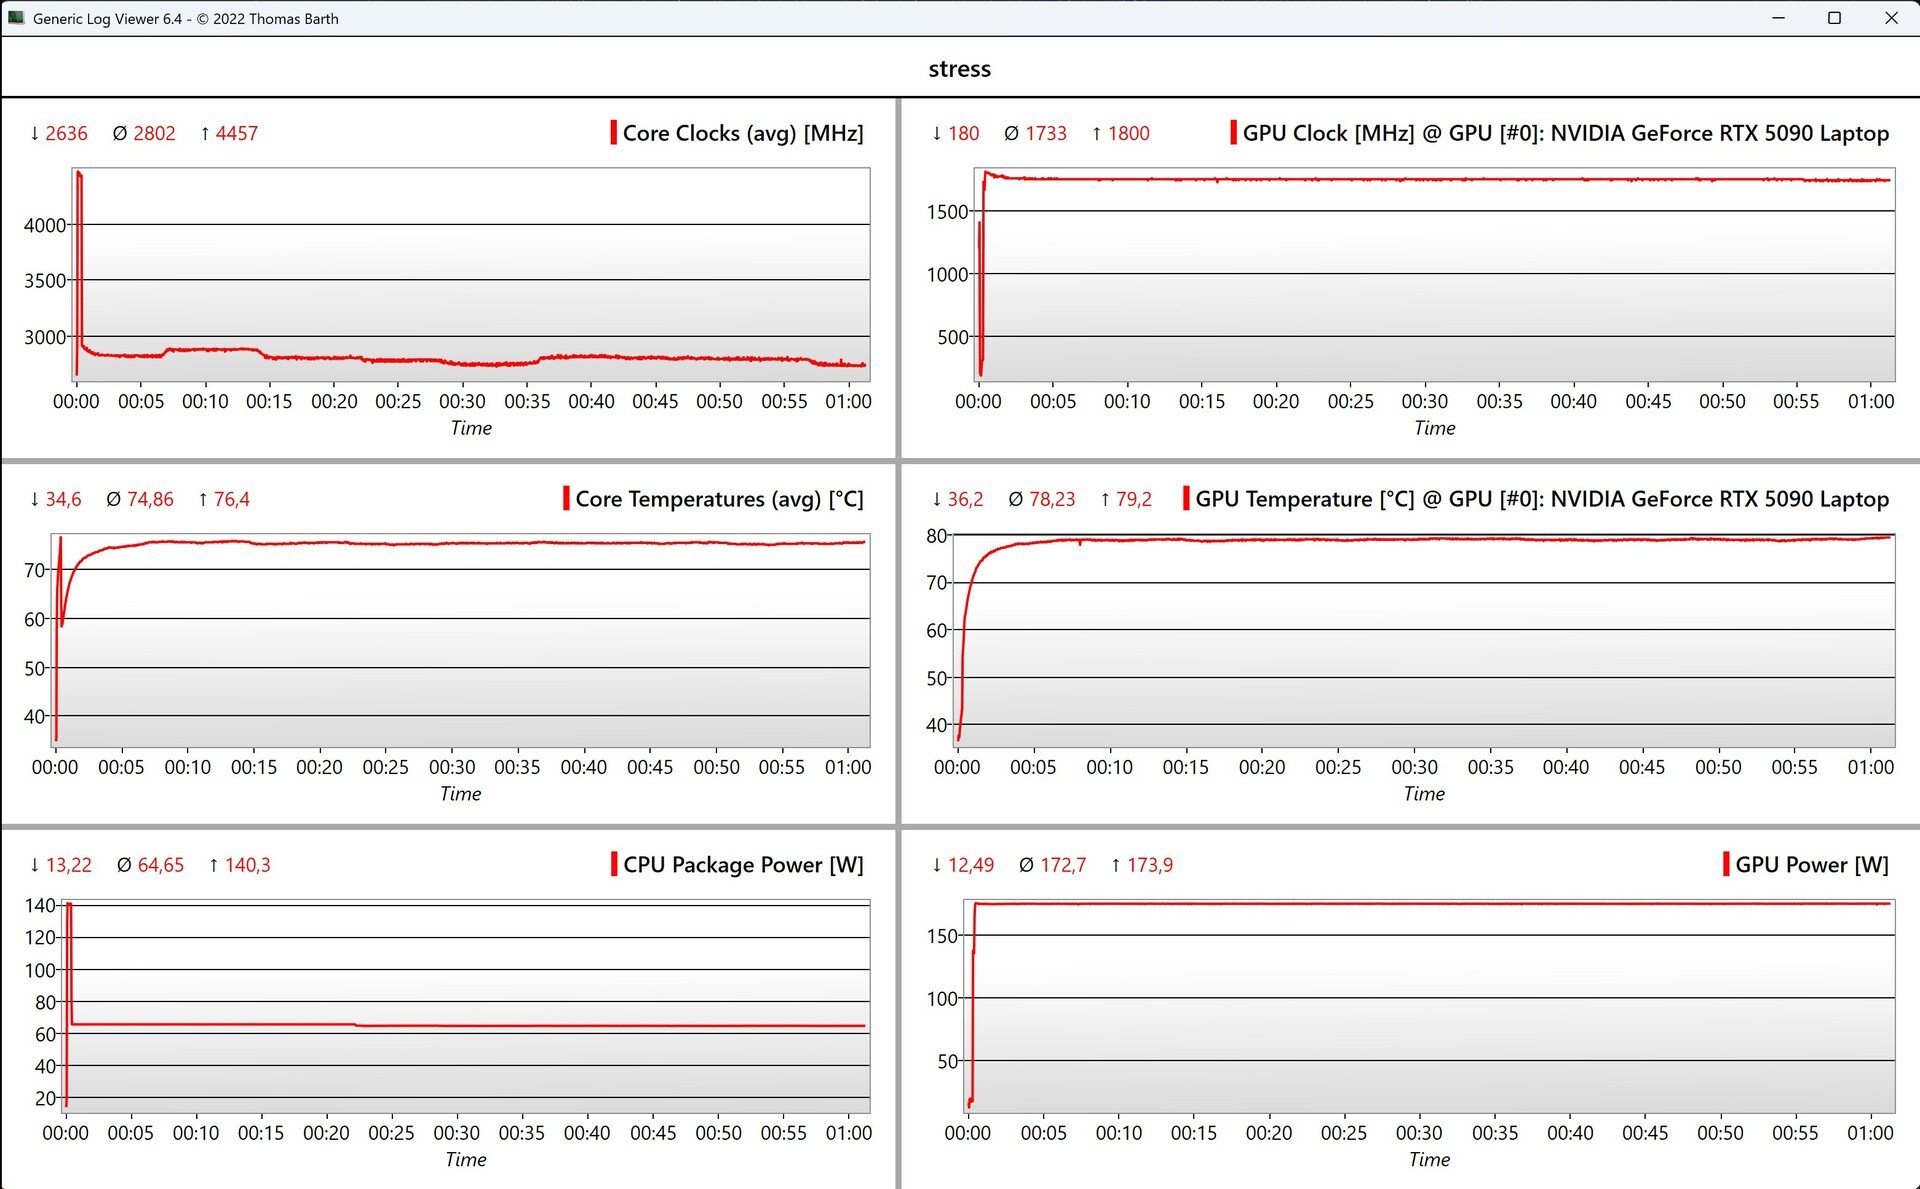
Cyberpunk 2077 Ultra FPS chart

0102030405060708090100110120130140150Tooltip
SCHENKER XMG Neo 16 A25 5090 R9 9955HX3D, GeForce RTX 5090 Laptop: Ø152.6 (146-156)
BasMoyenÉlevéUltraQHD
GTA V (2015) 186.9 183.9
Dota 2 Reborn (2015) 313 288 275 248
Final Fantasy XV Benchmark (2018) 235 233 208 173.5
X-Plane 11.11 (2018) 181.1 152.6 133.6
Strange Brigade (2018) 453.1 342.9
Baldur's Gate 3 (2023) 333.4 260.7 227.4 218.8 156.9
Cyberpunk 2077 2.2 Phantom Liberty (2023) 226 208 180 164 111.2
Alan Wake 2 (2023) 145.4 138.6 127.7 88.5
F1 24 (2024) 421 399 357 154.2 101.2
Call of Duty Black Ops 6 (2024) 229 209 165 161 127
Indiana Jones and the Great Circle (2024) 203 151.9 133.4 106
Assassin's Creed Shadows (2025) 126 115 97 69 59
F1 25 (2025) 317 308 291 59.8 36.8

Émissions et énergie

Degré de la nuisance sonore

Au repos
25.6 / 25.6 / 25.6 dB(A)
Fortement sollicité
47.2 / 55.5 dB(A)
  red to green bar
 
 
30 dB
silencieux
40 dB(A)
audible
50 dB(A)
bruyant
 
min: dark, med: mid, max: light   Earthworks M23R, Arta (à 15 cm de distance)   bruit ambiant: 24.1 dB(A)
dB(A) 0102030405060708090Deep BassMiddle BassHigh BassLower RangeMidsHigher MidsLower HighsMid HighsUpper HighsSuper Highs2037.344.539.138.72530.329.733.632.53126.528.128.827.94028.729.729.232.8503026.928.429.56329.123.725.528.88023.618.822.930.910023.518.419.427.112524.517.920.430.71602416.61929.220026.916.118.53325026.616.818.63331529.215.117.236.740031.111.414.937.2500331114.939.663034.510.514.340.380036.410.41541.8100037.110.314.742.712503710.713.243.8160037.611.21346200035.711.61344.225003611.712.744.9315034.21212.543.6400035.412.612.444.8500034.912.612.643.5630034.412.712.643.4800029.812.812.643.41000025.412.712.739.81250023.112.812.637.3160002012.912.233.4SPL47.224.125.655.5N5.80.50.710.4median 33median 12.6median 13.2median 40.3Delta522.44.8hearing rangehide median Fan NoiseSCHENKER XMG Neo 16 A25 5090
SCHENKER XMG Neo 16 A25 5090
GeForce RTX 5090 Laptop, R9 9955HX3D, Kingston Fury Renegade SFYRS1000G
Medion Erazer Beast 16 X1 Ultimate
GeForce RTX 5090 Laptop, Ultra 9 275HX, Phison E31 2 TB
SCHENKER XMG Neo 16 E25 RTX 5090 Laptop
GeForce RTX 5090 Laptop, Ultra 9 275HX, Samsung 9100 Pro 1 TB
Asus ROG Strix Scar 16 2025
GeForce RTX 5090 Laptop, Ultra 9 275HX, WD PC SN8000S 2TB
HP Omen Max 16 ah000
GeForce RTX 5090 Laptop, Ultra 9 275HX, WDC PC SN810 2TB
Aorus MASTER 16 AM6H
GeForce RTX 5090 Laptop, Ultra 9 275HX, Kingston OM8PGP41024Q-A0
Noise
-3%
-2%
-3%
-6%
5%
arrêt / environnement *
24.1
24
-0%
24
-0%
23.8
1%
22.8
5%
23
5%
Idle Minimum *
25.6
25
2%
26
-2%
29
-13%
29
-13%
23
10%
Idle Average *
25.6
27
-5%
26
-2%
29
-13%
29
-13%
23
10%
Idle Maximum *
25.6
29
-13%
26
-2%
29
-13%
29
-13%
23
10%
Load Average *
47.2
52
-10%
52.4
-11%
40.5
14%
47.7
-1%
40.46
14%
Cyberpunk 2077 ultra *
55.5
55
1%
55.4
-0%
53.6
3%
54.8
1%
59.75
-8%
Load Maximum *
55.5
55
1%
55.4
-0%
53.6
3%
61.1
-10%
59.75
-8%

* ... Moindre est la valeur, meilleures sont les performances

Test de stress des données CPU/GPU
 43.2 °C46.3 °C42.8 °C 
 44.1 °C44.5 °C37 °C 
 30.2 °C31.2 °C30 °C 
Maximum: 46.3 °C
Moyenne: 38.8 °C
42.4 °C44.3 °C43.6 °C
35.8 °C40.9 °C40.4 °C
30.2 °C30.4 °C32.1 °C
Maximum: 44.3 °C
Moyenne: 37.8 °C
Alimentation (valeur maximale)  59.8 °C | Température ambiante de la pièce 20.6 °C | Fluke t3000FC (calibrated), Voltcraft IR-900
(-) La température moyenne de la face supérieure sous charge maximale est de 38.8 °C / 102 F, par rapport à la moyenne de 33.9 °C / 93 F pour les appareils de la classe Gaming.
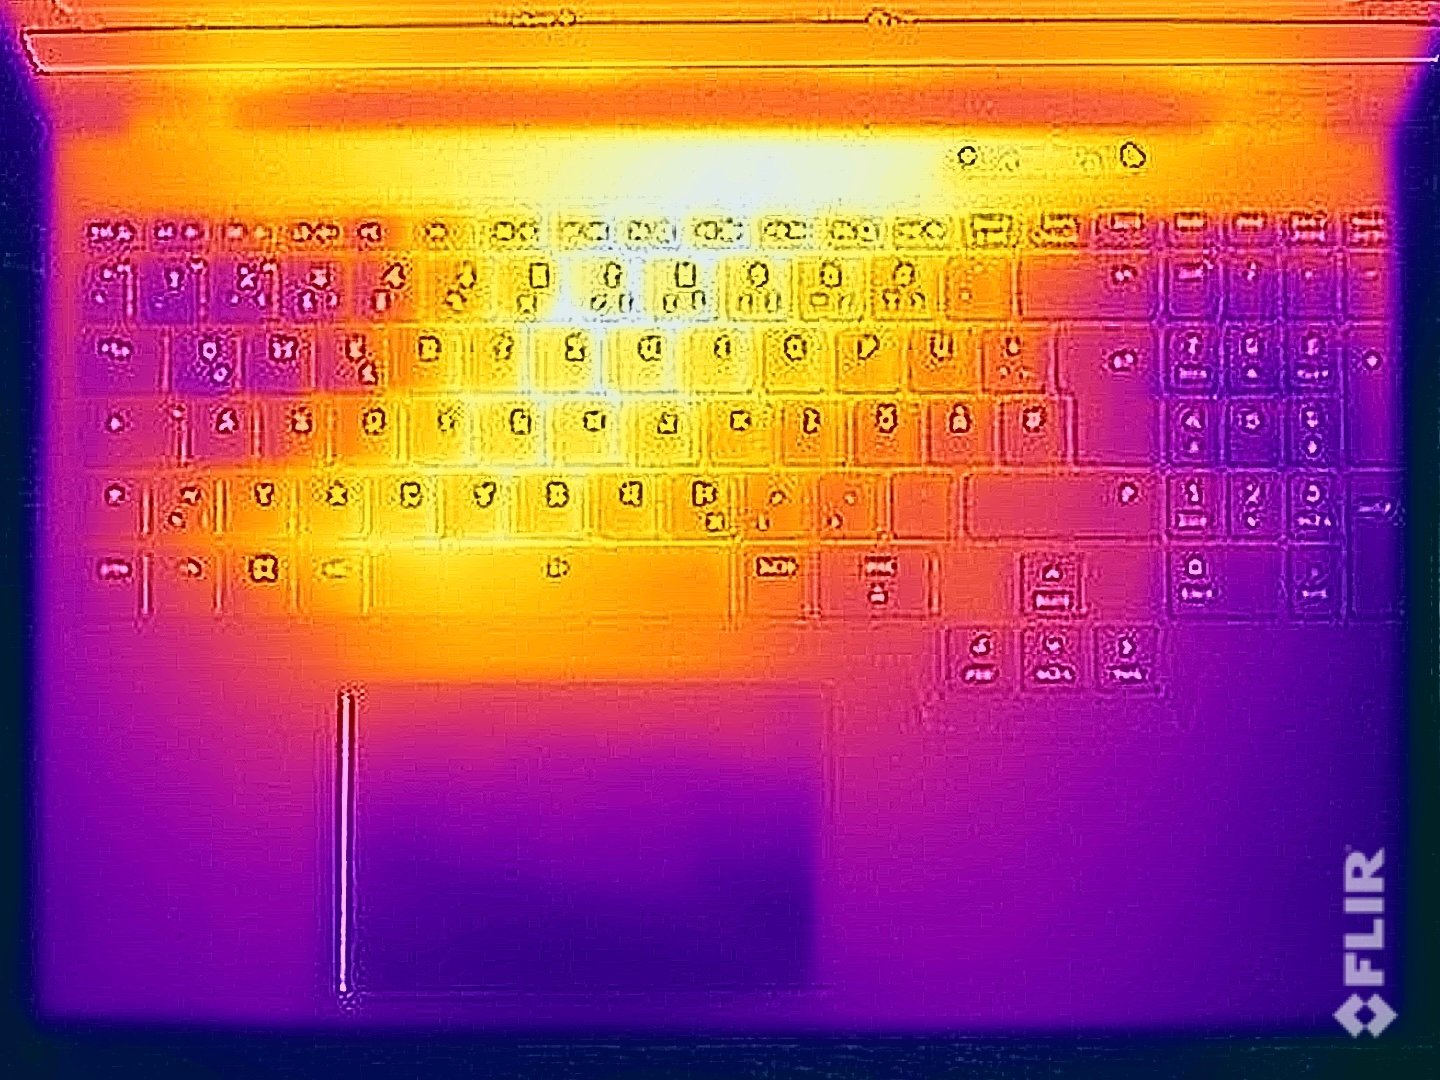
(-) La température maximale du côté supérieur est de 46.3 °C / 115 F, par rapport à la moyenne de 40.4 °C / 105 F, allant de 21.2 à 68.8 °C pour la classe Gaming.
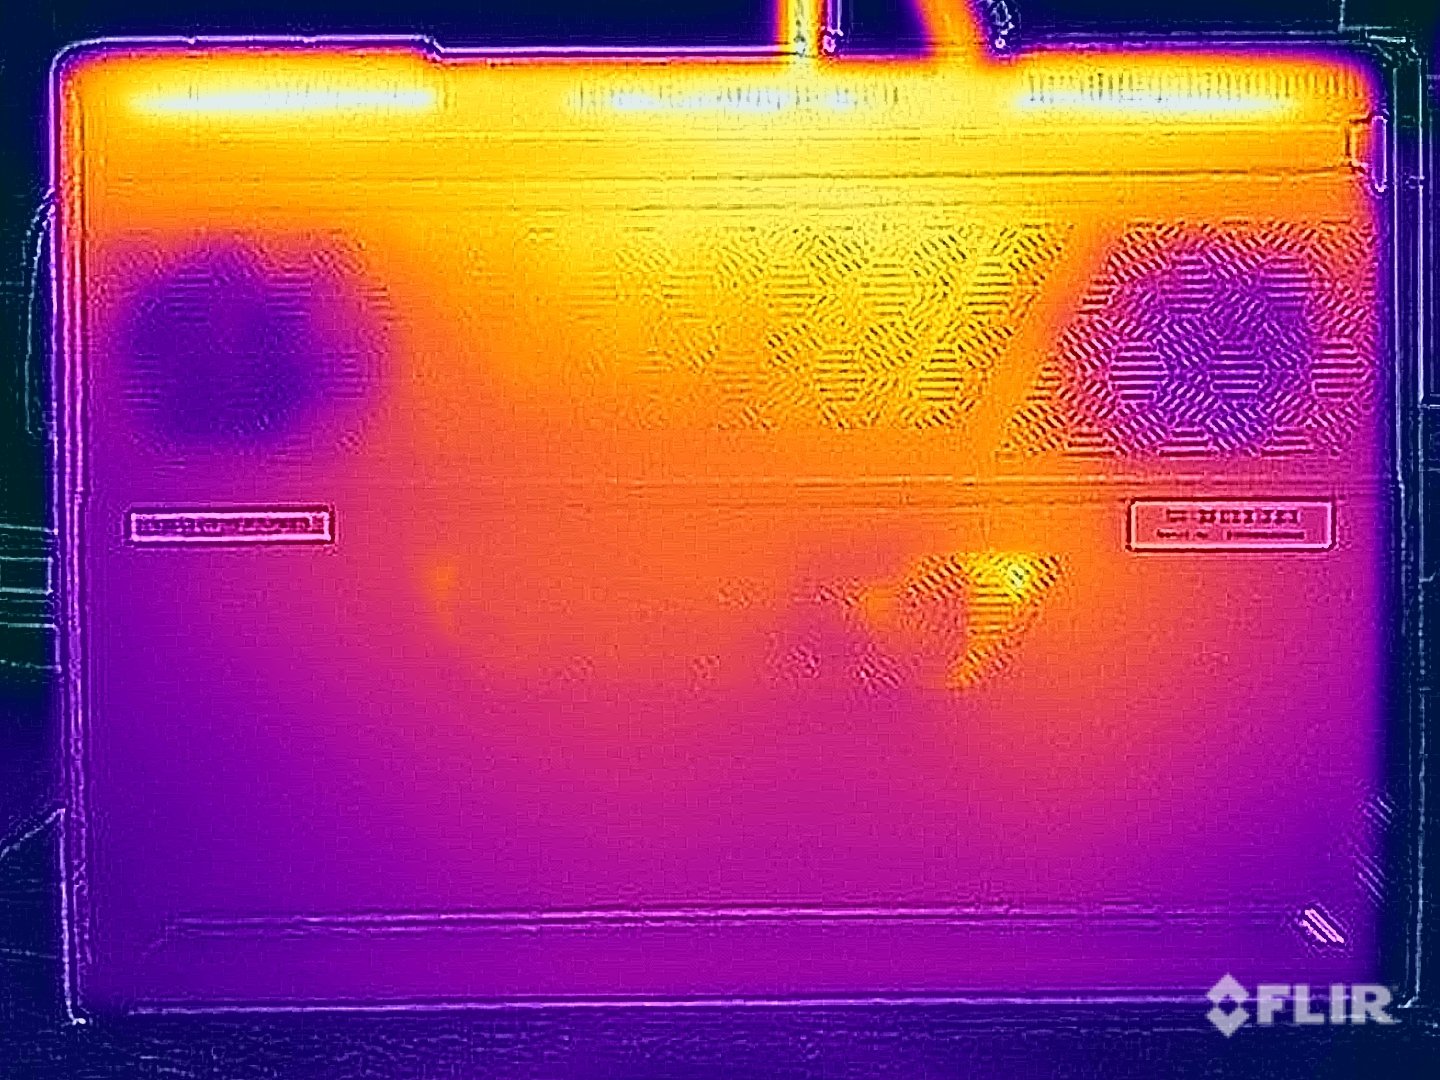
(±) Le fond chauffe jusqu'à un maximum de 44.3 °C / 112 F, contre une moyenne de 43.3 °C / 110 F
(+) En utilisation inactive, la température moyenne du côté supérieur est de 28.8 °C / 84 F, par rapport à la moyenne du dispositif de 33.9 °C / 93 F.
(-) 3: The average temperature for the upper side is 38.2 °C / 101 F, compared to the average of 33.9 °C / 93 F for the class Gaming.
(+) Les repose-poignets et le pavé tactile sont plus froids que la température de la peau avec un maximum de 31.2 °C / 88.2 F et sont donc froids au toucher.
(-) La température moyenne de la zone de l'appui-paume de dispositifs similaires était de 28.9 °C / 84 F (-2.3 °C / #-4.2 F).
Test de résistance aux températures de surface (face supérieure)
Test de résistance aux températures de surface (face inférieure)
SCHENKER XMG Neo 16 A25 5090
AMD Ryzen 9 9955HX3D, Nvidia GeForce RTX 5090 Laptop
Medion Erazer Beast 16 X1 Ultimate
Intel Core Ultra 9 275HX, Nvidia GeForce RTX 5090 Laptop
SCHENKER XMG Neo 16 E25 RTX 5090 Laptop
Intel Core Ultra 9 275HX, Nvidia GeForce RTX 5090 Laptop
Asus ROG Strix Scar 16 2025
Intel Core Ultra 9 275HX, Nvidia GeForce RTX 5090 Laptop
HP Omen Max 16 ah000
Intel Core Ultra 9 275HX, Nvidia GeForce RTX 5090 Laptop
Aorus MASTER 16 AM6H
Intel Core Ultra 9 275HX, Nvidia GeForce RTX 5090 Laptop
Heat
-1%
1%
-8%
5%
-10%
Maximum Upper Side *
46.3
49
-6%
47.8
-3%
44.2
5%
42.8
8%
39
16%
Maximum Bottom *
44.3
45
-2%
46.7
-5%
48.1
-9%
50.2
-13%
51
-15%
Idle Upper Side *
30
30
-0%
28.4
5%
33
-10%
27.6
8%
36
-20%
Idle Bottom *
31.1
30
4%
28.9
7%
36.1
-16%
26.2
16%
38
-22%

* ... Moindre est la valeur, meilleures sont les performances

dB(A) 0102030405060708090Deep BassMiddle BassHigh BassLower RangeMidsHigher MidsLower HighsMid HighsUpper HighsSuper Highs2036.344.52528.735.23127.129.54028.728.75024.431.96323.435.58019.841.810018.452.412517.35716017.955.420018.362.125017.963.731515.96740012.268.350011.172.663010.176.380010.577.8100010.474.5125010.773.8160010.772.7200010.671.8250011.463.1315012.365.4400012.469.8500012.267.8630012.270.6800012.366.31000012.464.91250012.259.31600011.755.8SPL2483.8N0.561.3median 12.2median 67Delta2.35.646.539.234.635.140.846.125.428.93838.820.734.715.141.314.648.91355.615.958.917.760.316.763.313.164.811.969.712.574.412.47911.376.711.675.31175.411.472.71272.51266.712.362.71371.91368.81375.213.372.512.973.512.669.812.161.924.685.30.668.2median 12.6median 69.815.743.841.63130.526.326.831.725.926.82521.626.318.438.119.74617.453.518.352.419.262.718.865.215.567.412.566.711.468.911.273.611.274.110.873.310.371.710.470.91169.710.96511.264.811.365.811.462.211.765.111.76711.767.411.663.31152.623.881.40.553.9median 11.4median 65.823.832.929.332.922.625.522.620.519.320.518.918.618.923.421.423.421.828.421.826.818.426.835.51835.545.218.345.256.52156.56020.26063.818.963.864.118.464.165.21865.265.419.765.463.620.663.667.118.967.16917.86967.118.667.164.817.864.867.816.367.864.417.564.46616.2666815.36863.813.463.864.313.364.361.21361.260.512.660.560.312.360.360.411.560.477.92977.944.71.144.7median 64.1median 17.8median 64.13.21.93.231.530.231.539.731.539.738.932.138.925.532.425.529.53329.531.622.531.634.81434.833.515.833.538.613.838.647.713.447.753.115.853.15918.45959.119.259.160.711.660.763.99.663.966.87.866.86686664.78.464.761.18.361.164.19.264.163.39.663.362.810.662.859.710.859.761.111.461.164.511.664.565.311.965.362.912.362.961.11361.156.612.156.646.612.246.675.423.375.438.50.538.5median 61.1median 11.6median 61.15.92.45.9hearing rangehide median Pink NoiseSCHENKER XMG Neo 16 A25 5090Medion Erazer Beast 16 X1 UltimateAsus ROG Strix Scar 16 2025HP Omen Max 16 ah000Aorus MASTER 16 AM6H
Diagramme de fréquence (les cases peuvent être cochées et décochées pour comparer les appareils)
SCHENKER XMG Neo 16 A25 5090 analyse audio

(+) | les haut-parleurs peuvent jouer relativement fort (83.8# dB)
Basses 100 - 315 Hz
(±) | basse réduite - en moyenne 7.3% inférieure à la médiane
(±) | la linéarité des basses est moyenne (8.6% delta à la fréquence précédente)
Médiums 400 - 2000 Hz
(±) | médiane supérieure - en moyenne 6.5% supérieure à la médiane
(+) | les médiums sont linéaires (3.8% delta à la fréquence précédente)
Aiguës 2 - 16 kHz
(+) | des sommets équilibrés - à seulement 2.2% de la médiane
(+) | les aigus sont linéaires (6.8% delta à la fréquence précédente)
Globalement 100 - 16 000 Hz
(+) | le son global est linéaire (11.2% différence à la médiane)
Par rapport à la même classe
» 8% de tous les appareils testés de cette catégorie étaient meilleurs, 4% similaires, 88% pires
» Le meilleur avait un delta de 6%, la moyenne était de 18%, le pire était de 132%.
Par rapport à tous les appareils testés
» 6% de tous les appareils testés étaient meilleurs, 2% similaires, 92% pires
» Le meilleur avait un delta de 4%, la moyenne était de 24%, le pire était de 134%.

Medion Erazer Beast 16 X1 Ultimate analyse audio

(+) | les haut-parleurs peuvent jouer relativement fort (85# dB)
Basses 100 - 315 Hz
(±) | basse réduite - en moyenne 11.2% inférieure à la médiane
(+) | les basses sont linéaires (6.8% delta à la fréquence précédente)
Médiums 400 - 2000 Hz
(+) | médiane équilibrée - seulement 4.7% de la médiane
(+) | les médiums sont linéaires (4.6% delta à la fréquence précédente)
Aiguës 2 - 16 kHz
(+) | des sommets équilibrés - à seulement 3.6% de la médiane
(±) | la linéarité des aigus est moyenne (8% delta à la fréquence précédente)
Globalement 100 - 16 000 Hz
(+) | le son global est linéaire (10.8% différence à la médiane)
Par rapport à la même classe
» 7% de tous les appareils testés de cette catégorie étaient meilleurs, 3% similaires, 90% pires
» Le meilleur avait un delta de 6%, la moyenne était de 18%, le pire était de 132%.
Par rapport à tous les appareils testés
» 5% de tous les appareils testés étaient meilleurs, 1% similaires, 93% pires
» Le meilleur avait un delta de 4%, la moyenne était de 24%, le pire était de 134%.

Asus ROG Strix Scar 16 2025 analyse audio

(±) | le niveau sonore du haut-parleur est moyen mais bon (81.4# dB)
Basses 100 - 315 Hz
(±) | basse réduite - en moyenne 8.4% inférieure à la médiane
(±) | la linéarité des basses est moyenne (9.7% delta à la fréquence précédente)
Médiums 400 - 2000 Hz
(±) | médiane supérieure - en moyenne 5.4% supérieure à la médiane
(+) | les médiums sont linéaires (2.9% delta à la fréquence précédente)
Aiguës 2 - 16 kHz
(+) | des sommets équilibrés - à seulement 1.3% de la médiane
(+) | les aigus sont linéaires (3.8% delta à la fréquence précédente)
Globalement 100 - 16 000 Hz
(+) | le son global est linéaire (10.7% différence à la médiane)
Par rapport à la même classe
» 7% de tous les appareils testés de cette catégorie étaient meilleurs, 2% similaires, 91% pires
» Le meilleur avait un delta de 6%, la moyenne était de 18%, le pire était de 132%.
Par rapport à tous les appareils testés
» 5% de tous les appareils testés étaient meilleurs, 2% similaires, 94% pires
» Le meilleur avait un delta de 4%, la moyenne était de 24%, le pire était de 134%.

HP Omen Max 16 ah000 analyse audio

(±) | le niveau sonore du haut-parleur est moyen mais bon (77.9# dB)
Basses 100 - 315 Hz
(±) | basse réduite - en moyenne 9.9% inférieure à la médiane
(±) | la linéarité des basses est moyenne (13.4% delta à la fréquence précédente)
Médiums 400 - 2000 Hz
(+) | médiane équilibrée - seulement 2.3% de la médiane
(+) | les médiums sont linéaires (4.3% delta à la fréquence précédente)
Aiguës 2 - 16 kHz
(+) | des sommets équilibrés - à seulement 1.9% de la médiane
(+) | les aigus sont linéaires (4.8% delta à la fréquence précédente)
Globalement 100 - 16 000 Hz
(+) | le son global est linéaire (11.4% différence à la médiane)
Par rapport à la même classe
» 9% de tous les appareils testés de cette catégorie étaient meilleurs, 3% similaires, 88% pires
» Le meilleur avait un delta de 6%, la moyenne était de 18%, le pire était de 132%.
Par rapport à tous les appareils testés
» 6% de tous les appareils testés étaient meilleurs, 2% similaires, 92% pires
» Le meilleur avait un delta de 4%, la moyenne était de 24%, le pire était de 134%.

Aorus MASTER 16 AM6H analyse audio

(±) | le niveau sonore du haut-parleur est moyen mais bon (75.36# dB)
Basses 100 - 315 Hz
(±) | basse réduite - en moyenne 12.6% inférieure à la médiane
(±) | la linéarité des basses est moyenne (9% delta à la fréquence précédente)
Médiums 400 - 2000 Hz
(+) | médiane équilibrée - seulement 2.8% de la médiane
(+) | les médiums sont linéaires (4.4% delta à la fréquence précédente)
Aiguës 2 - 16 kHz
(+) | des sommets équilibrés - à seulement 1.8% de la médiane
(+) | les aigus sont linéaires (3.8% delta à la fréquence précédente)
Globalement 100 - 16 000 Hz
(+) | le son global est linéaire (13.5% différence à la médiane)
Par rapport à la même classe
» 19% de tous les appareils testés de cette catégorie étaient meilleurs, 7% similaires, 73% pires
» Le meilleur avait un delta de 6%, la moyenne était de 18%, le pire était de 132%.
Par rapport à tous les appareils testés
» 13% de tous les appareils testés étaient meilleurs, 4% similaires, 83% pires
» Le meilleur avait un delta de 4%, la moyenne était de 24%, le pire était de 134%.

Consommation énergétique
Éteint/en veilledarklight 0.42 / 1.9 Watts
Au reposdarkmidlight 13.2 / 16.8 / 17.1 Watts
Fortement sollicité midlight 164.2 / 392.8 Watts
 color bar
Légende: min: dark, med: mid, max: light        Metrahit Energy
SCHENKER XMG Neo 16 A25 5090
GeForce RTX 5090 Laptop, R9 9955HX3D, Kingston Fury Renegade SFYRS1000G
Medion Erazer Beast 16 X1 Ultimate
GeForce RTX 5090 Laptop, Ultra 9 275HX, Phison E31 2 TB
SCHENKER XMG Neo 16 E25 RTX 5090 Laptop
GeForce RTX 5090 Laptop, Ultra 9 275HX, Samsung 9100 Pro 1 TB
Asus ROG Strix Scar 16 2025
GeForce RTX 5090 Laptop, Ultra 9 275HX, WD PC SN8000S 2TB
HP Omen Max 16 ah000
GeForce RTX 5090 Laptop, Ultra 9 275HX, WDC PC SN810 2TB
Aorus MASTER 16 AM6H
GeForce RTX 5090 Laptop, Ultra 9 275HX, Kingston OM8PGP41024Q-A0
Power Consumption
-2%
2%
-38%
-19%
-29%
Idle Minimum *
13.2
13.1
1%
11.8
11%
22.5
-70%
9.9
25%
25
-89%
Idle Average *
16.8
17.5
-4%
15.1
10%
32.2
-92%
28.6
-70%
29.4
-75%
Idle Maximum *
17.1
23
-35%
15.8
8%
34.3
-101%
47.1
-175%
31
-81%
Load Average *
164.2
88
46%
165.3
-1%
169.3
-3%
141.8
14%
109
34%
Cyberpunk 2077 ultra *
284
299
-5%
296
-4%
294
-4%
253
11%
290
-2%
Cyberpunk 2077 ultra external monitor *
282
297
-5%
289
-2%
288
-2%
230
18%
292
-4%
Load Maximum *
392.8
428
-9%
415.5
-6%
371.5
5%
233
41%
325
17%

* ... Moindre est la valeur, meilleures sont les performances

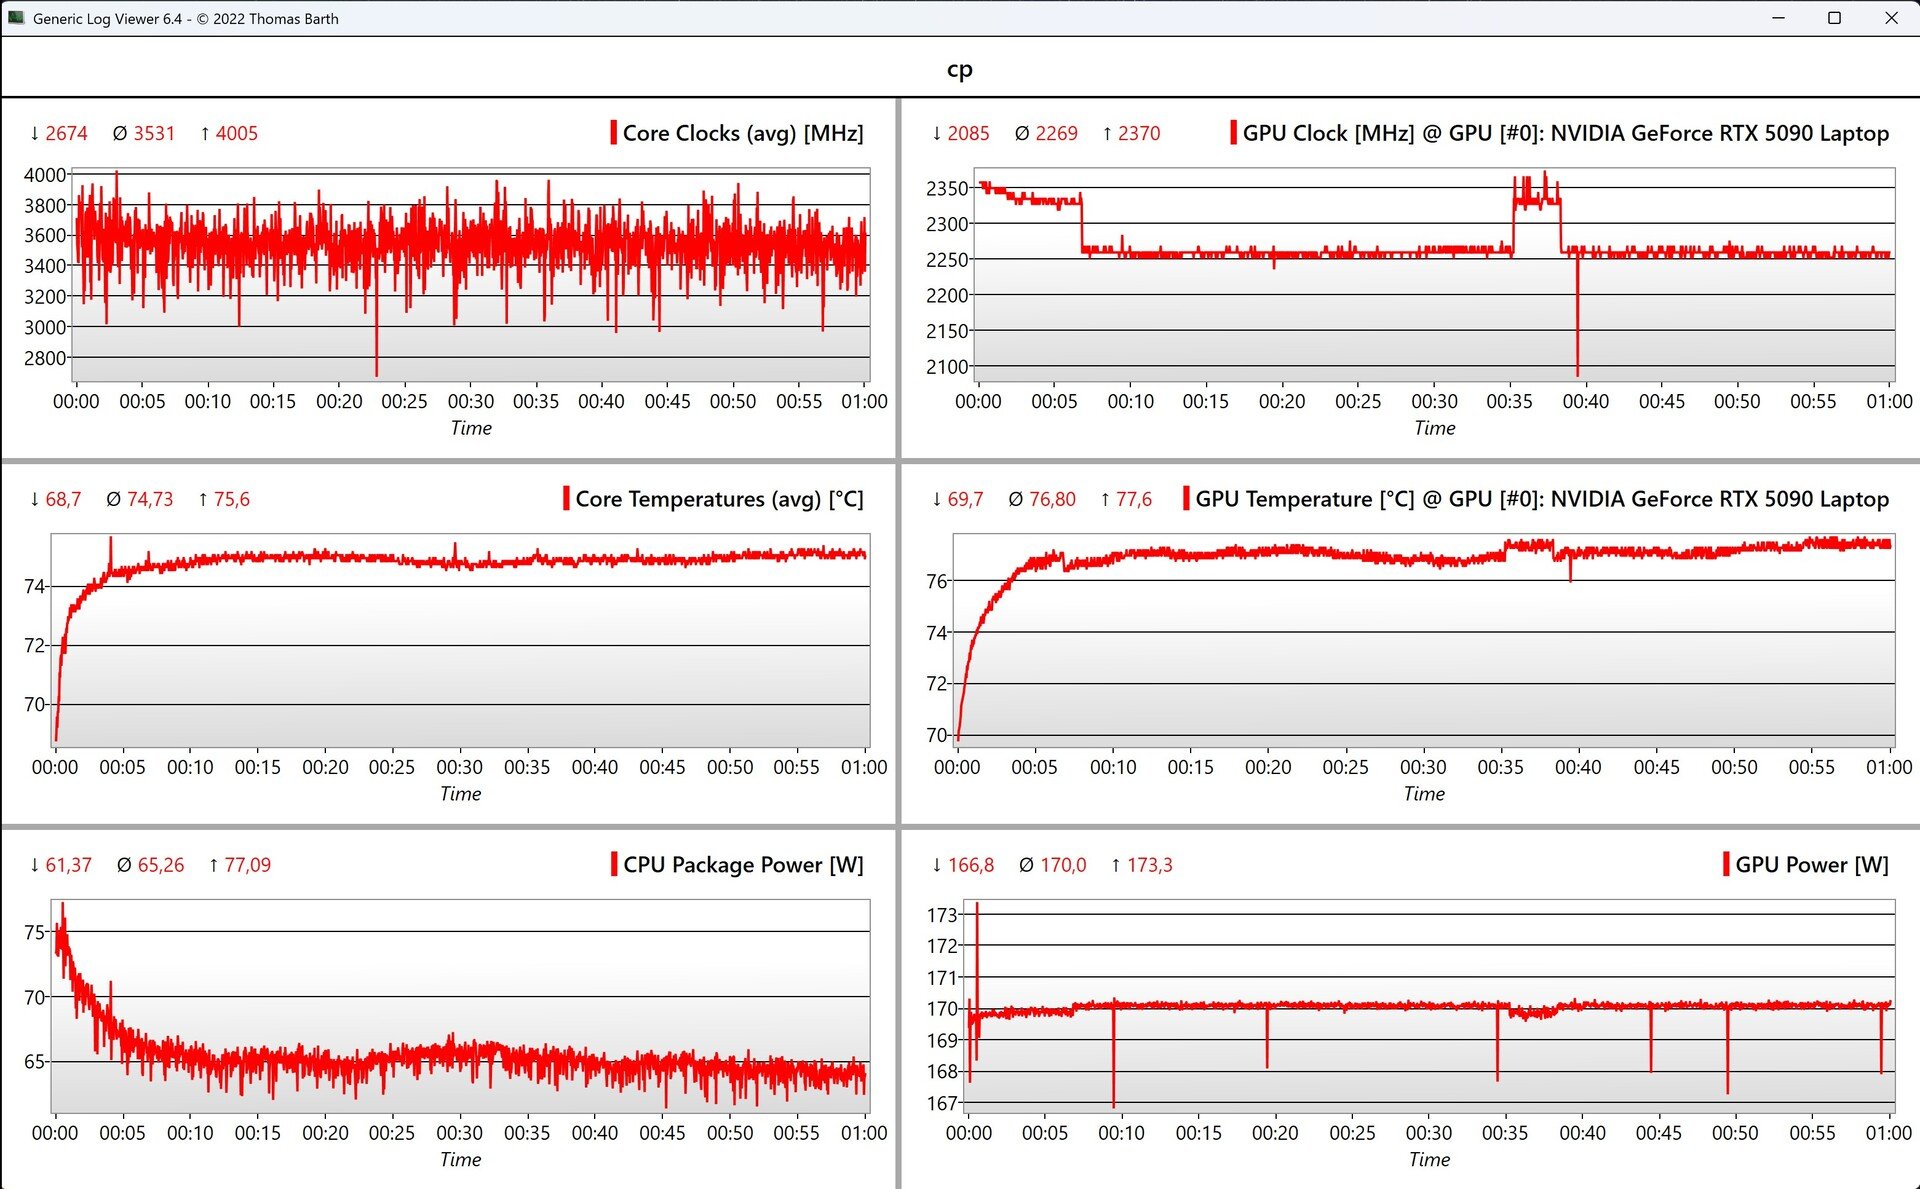
Power consumption Cyberpunk / Stress test

020406080100120140160180200220240260280300320340360Tooltip
SCHENKER XMG Neo 16 A25 5090; 1280x720 Prime95 28.10 and Furmark 1.25: Ø315 (238-375)
SCHENKER XMG Neo 16 A25 5090; Idle 150cd/m2: Ø14.2 (10.7-19)
SCHENKER XMG Neo 16 A25 5090; Cyberpunk 2077 FHD ultra no FSR 150cd: Ø284 (278-289)

Power consumption with external monitor

0153045607590105120135150165180195210225240255270285Tooltip
SCHENKER XMG Neo 16 A25 5090; Prime95 V2810 Stress (external Monitor): Ø228 (209-235)
SCHENKER XMG Neo 16 A25 5090; Cinebench R15 Multi (external Monitor): Ø221 (202-226)
SCHENKER XMG Neo 16 A25 5090; Cinebench R23 Single (external Monitor): Ø43.7 (37.3-77.9)
SCHENKER XMG Neo 16 A25 5090; Cinebench R23 Multi (external Monitor): Ø210 (204-225)
SCHENKER XMG Neo 16 A25 5090; 1280x720 FurMark 1.19 GPU Stress Test (external Monitor): Ø224 (215-231)
SCHENKER XMG Neo 16 A25 5090; Idle 1min (external Monitor): Ø12.3 (7.13-18.8)
SCHENKER XMG Neo 16 A25 5090; Cyberpunk 2077 FHD ultra no FSR (external Monitor): Ø282 (275-294)

Durée de vie de la batterie

Autonomie
WiFi Websurfing
5h 52min
WiFi Websurfing max. Brightness
3h 16min
Battery Runtime
WiFi Websurfing
SCHENKER XMG Neo 16 E25 RTX 5090 Laptop
Ultra 9 275HX, GeForce RTX 5090 Laptop, 99.8 Wh
572 min +63%
Medion Erazer Beast 16 X1 Ultimate
Ultra 9 275HX, GeForce RTX 5090 Laptop, 99 Wh
474 min +35%
Aorus MASTER 16 AM6H
Ultra 9 275HX, GeForce RTX 5090 Laptop, 99 Wh
404 min +15%
Asus ROG Strix Scar 16 2025
Ultra 9 275HX, GeForce RTX 5090 Laptop, 90 Wh
388 min +10%
Moyenne de la classe Gaming
  (85 - 889, n=124, 2 dernières années)
385 min +9%
SCHENKER XMG Neo 16 A25 5090
R9 9955HX3D, GeForce RTX 5090 Laptop, 99.8 Wh
352 min
HP Omen Max 16 ah000
Ultra 9 275HX, GeForce RTX 5090 Laptop, 83 Wh
350 min -1%
WiFi Websurfing max. Brightness
Moyenne de la classe Gaming
  (164 - 534, n=36, 2 dernières années)
308 min +57%
SCHENKER XMG Neo 16 E25 RTX 5090 Laptop
Ultra 9 275HX, GeForce RTX 5090 Laptop, 99.8 Wh
233 min +19%
SCHENKER XMG Neo 16 A25 5090
R9 9955HX3D, GeForce RTX 5090 Laptop, 99.8 Wh
196 min
Asus ROG Strix Scar 16 2025
Ultra 9 275HX, GeForce RTX 5090 Laptop, 90 Wh
164 min -16%

Notebookcheck note globale

SCHENKER XMG Neo 16 A25 5090 - 05/30/2025 v8
Andreas Osthoff

Châssis
88 / 98 → 89%
Clavier
89%
Dispositif de pointage
86%
Connectivité
73 / 80 → 91%
Poids
57 / 10-68 → 82%
Autonomie
65 / 95 → 68%
Écran
93%
Performances en jeu
96%
Performances dans les applications
96%
Chauffe
87 / 95 → 91%
Nuisance sonore
69 / 90 → 76%
Audio
84%
Appareil photo
38 / 75 → 51%
Moyenne
62%
89%
Gaming - Moyenne compensée
CO2 Emissions
No Data
Materials
0%
Packaging
50%
Power Use
70.9%
Repairability
40%
Software Updates
22.3%
Recycle Logo Total Sustainability Score: 30.5%

Comparaison des alternatives possibles

Benchmark Comparison Plugin: ERROR, Layout "57" not supported!

Transparency

La sélection des appareils à examiner est effectuée par notre équipe éditoriale. L'échantillon de test a été prêté à l'auteur par le fabricant ou le détaillant pour les besoins de cet examen. Le prêteur n'a pas eu d'influence sur cette évaluation et le fabricant n'a pas reçu de copie de cette évaluation avant sa publication. Il n'y avait aucune obligation de publier cet article. Nous n'acceptons jamais de compensation ou de paiement en échange de nos commentaires. En tant que média indépendant, Notebookcheck n'est pas soumis à l'autorité des fabricants, des détaillants ou des éditeurs.

Voici comment Notebookcheck teste

Chaque année, Notebookcheck examine de manière indépendante des centaines d'ordinateurs portables et de smartphones en utilisant des procédures standardisées afin de garantir que tous les résultats sont comparables. Nous avons continuellement développé nos méthodes de test depuis environ 20 ans et avons établi des normes industrielles dans le processus. Dans nos laboratoires de test, des équipements de mesure de haute qualité sont utilisés par des techniciens et des rédacteurs expérimentés. Ces tests impliquent un processus de validation en plusieurs étapes. Notre système d'évaluation complexe repose sur des centaines de mesures et de points de référence bien fondés, ce qui garantit l'objectivité.
Please share our article, every link counts!
Mail Logo
> Revues et rapports de ordinateurs portatifs et smartphones, ordiphones > Critiques > Test du XMG Neo 16 A25 : Ryzen 9 9955HX3D et RTX 5090 pour des performances de jeu maximales
Andreas Osthoff, 2025-06- 3 (Update: 2025-06- 4)