Test du HP Omen Max 16 : ultra rapide mais un peu trop chaud
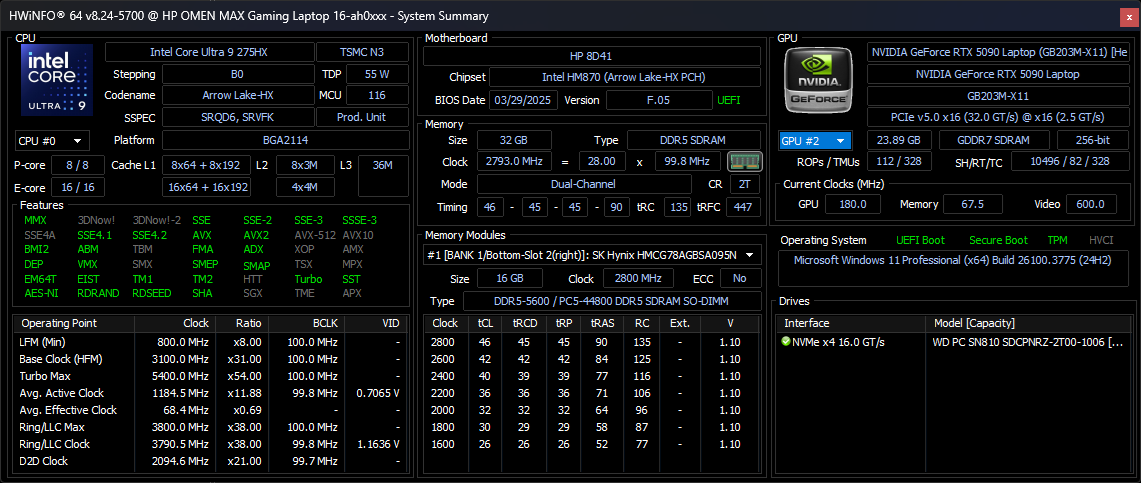
Stats maximales.
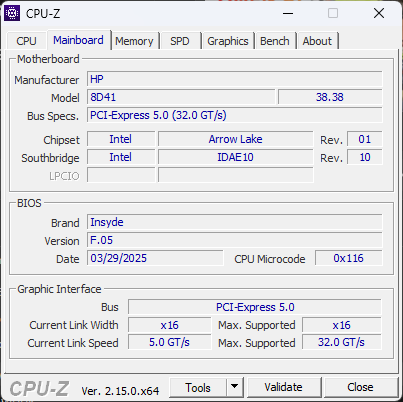
L'Omen Max 16 est livré avec les derniers processeurs Intel Arrow Lake et les cartes graphiques Nvidia Maxwell disponibles jusqu'au Core Ultra 9 275HX et GeForce RTX 5090. Cependant, le processeur en particulier aurait probablement pu bénéficier d'une solution de refroidissement plus solide.Allen Ngo, 👁 Allen Ngo (traduit par DeepL / Ninh Duy) Publié 🇺🇸 🇪🇸 ...
Verdict - L'une des options de processeur les plus rapides disponibles
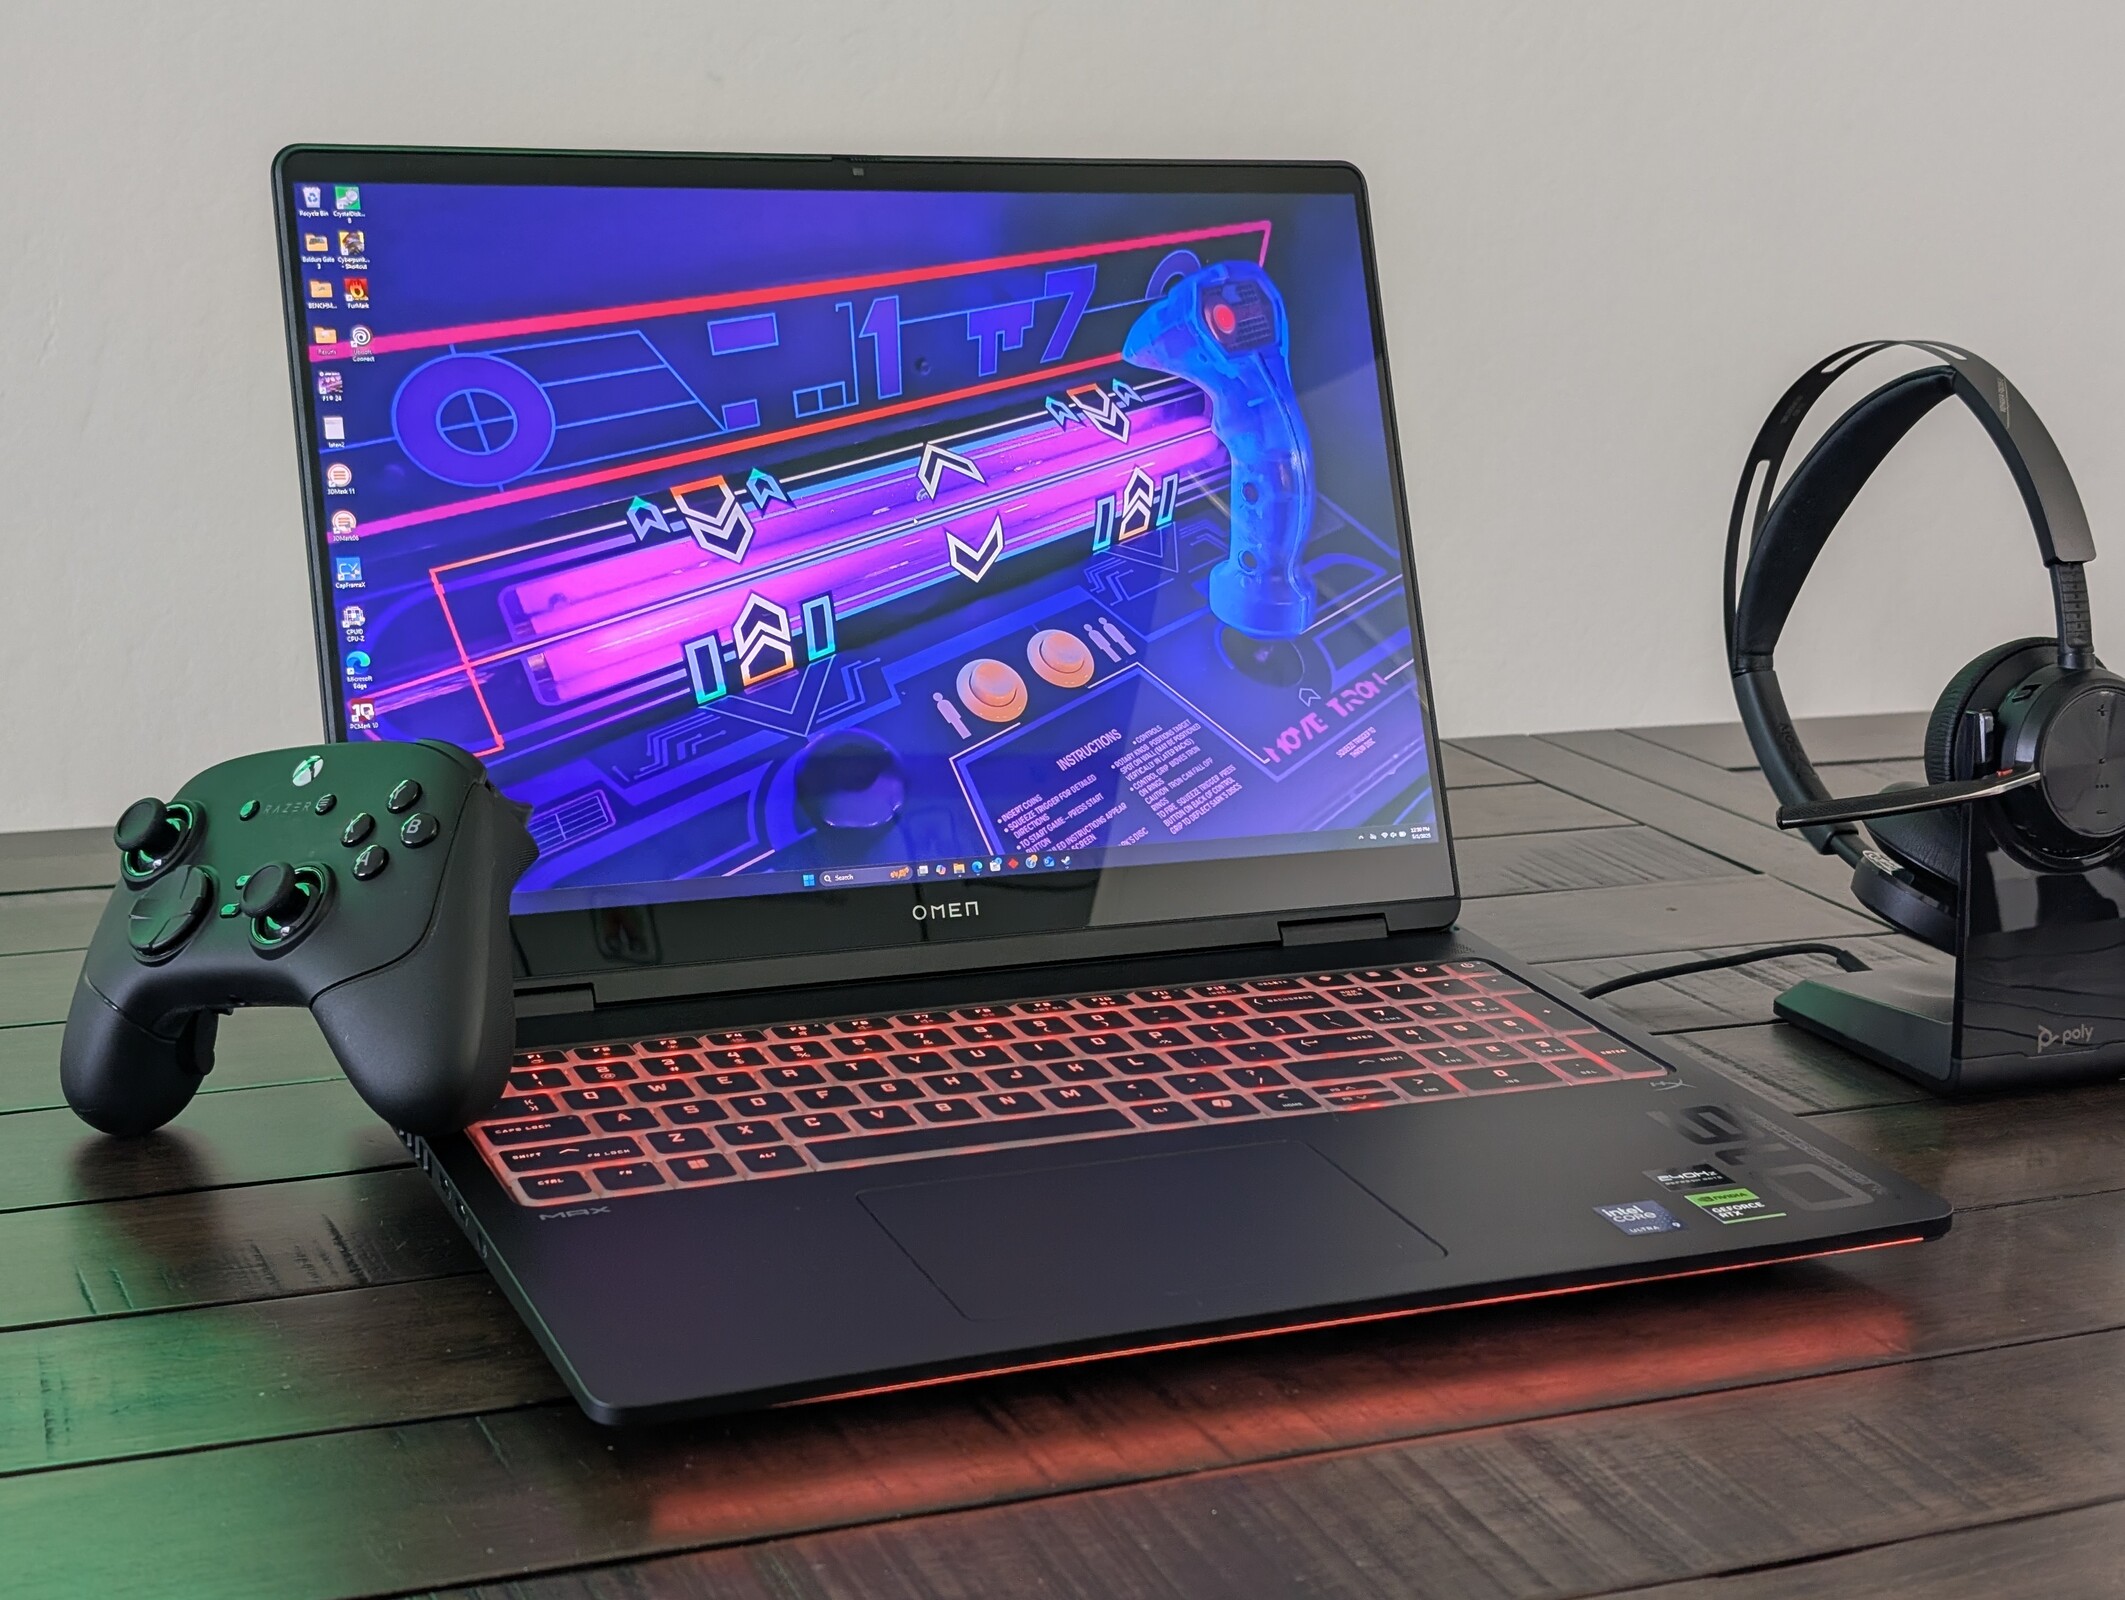
L'Omen Max 16 offre des performances impressionnantes compte tenu de sa taille. Il est équipé du même processeur Core Ultra 9 275HX et du même GPU RTX 5090 de 175 W GeForce que le modèle concurrent Lenovo Legion Pro 7i 16 Gen 10, tout en étant à la fois plus lourd et plus petit. Le processeur en particulier permet au HP de surpasser les ordinateurs portables de jeu de 16 pouces populaires comme le Razer Blade 16 2025 ou l'Asus ROG Zephyrus G16 qui sont limités au Ryzen AI 9 HX 370 et au Core Ultra 9 285H, respectivement. Les utilisateurs qui peuvent exploiter le processeur Core HX super rapide pour leurs charges de travail peuvent trouver l'Omen Max 16 intéressant, d'autant plus qu'il est livré avec des panneaux OLED similaires à ceux de la concurrence et un clavier sans doute plus confortable.
Aussi rapide que soit le processeur Arrow Lake HX, il est peut-être trop rapide pour l'Omen Max 16. La température du cœur sous charge ou pendant les jeux dépasse largement les 90°C, tandis que les fréquences d'horloge sont systématiquement inférieures à celles du même processeur fonctionnant sur le Legion Pro 7i 16 mentionné plus haut. Le déficit est peut-être minime, mais les passionnés qui recherchent la moindre performance préféreront peut-être le Lenovo ou un autre modèle avec des options de CPU plus froides mais plus lentes.
Points positifs
Points négatifs
Prix et disponibilité
HP livre maintenant l' Omen Max 16 à partir de $2500 pour la configuration RTX 5070 Ti de base jusqu'à $4000 pour notre configuration RTX 5090 telle que nous l'avons testée.
Table des matières
- Verdict - L'une des options de processeur les plus rapides disponibles
- Spécifications
- Caisse - Emballage dense
- Connectivité
- Périphériques d'entrée - Familiers et plus lumineux
- Affichage - OLED 240 Hz avec G-Sync
- Performance - Processeur très chaud sous charge
- Émissions
- Gestion de l'énergie - Un processeur très exigeant
- Notebookcheck Rating
- Potential Competitors in Comparison
L'Omen Max 16 est conçu pour être la version plus grande, plus lourde et plus rapide de l'Omen 16 "normal" omen 16 "normal". Il embarque donc certains des processeurs les plus rapides du marché, notamment le CPU Arrow Lake Core Ultra 9 275HX et le GPU Blackwell 175 W GeForce RTX 5090, alors que de nombreux concurrents plus fins n'offrent que des processeurs de la série H et des GPU TGP inférieurs. L'Omen Max 16 vise à faire le moins de concessions possible en matière de performances - du moins en théorie.
Les SKUs inférieures de ce modèle commencent avec le CPU Core Ultra 7 255HX et le GPU RTX 5070 Ti avec un écran IPS 2K pour $2500 USD jusqu'à notre unité de test entièrement configurée avec un écran OLED 1600p pour plus de $4000 USD.
Les alternatives dans l'espace de jeu de 16 pouces incluent le MSI Vector 16 HX, Lenovo Legion 9 16ou le Razer Blade 16.
Plus de commentaires sur HP :
Spécifications
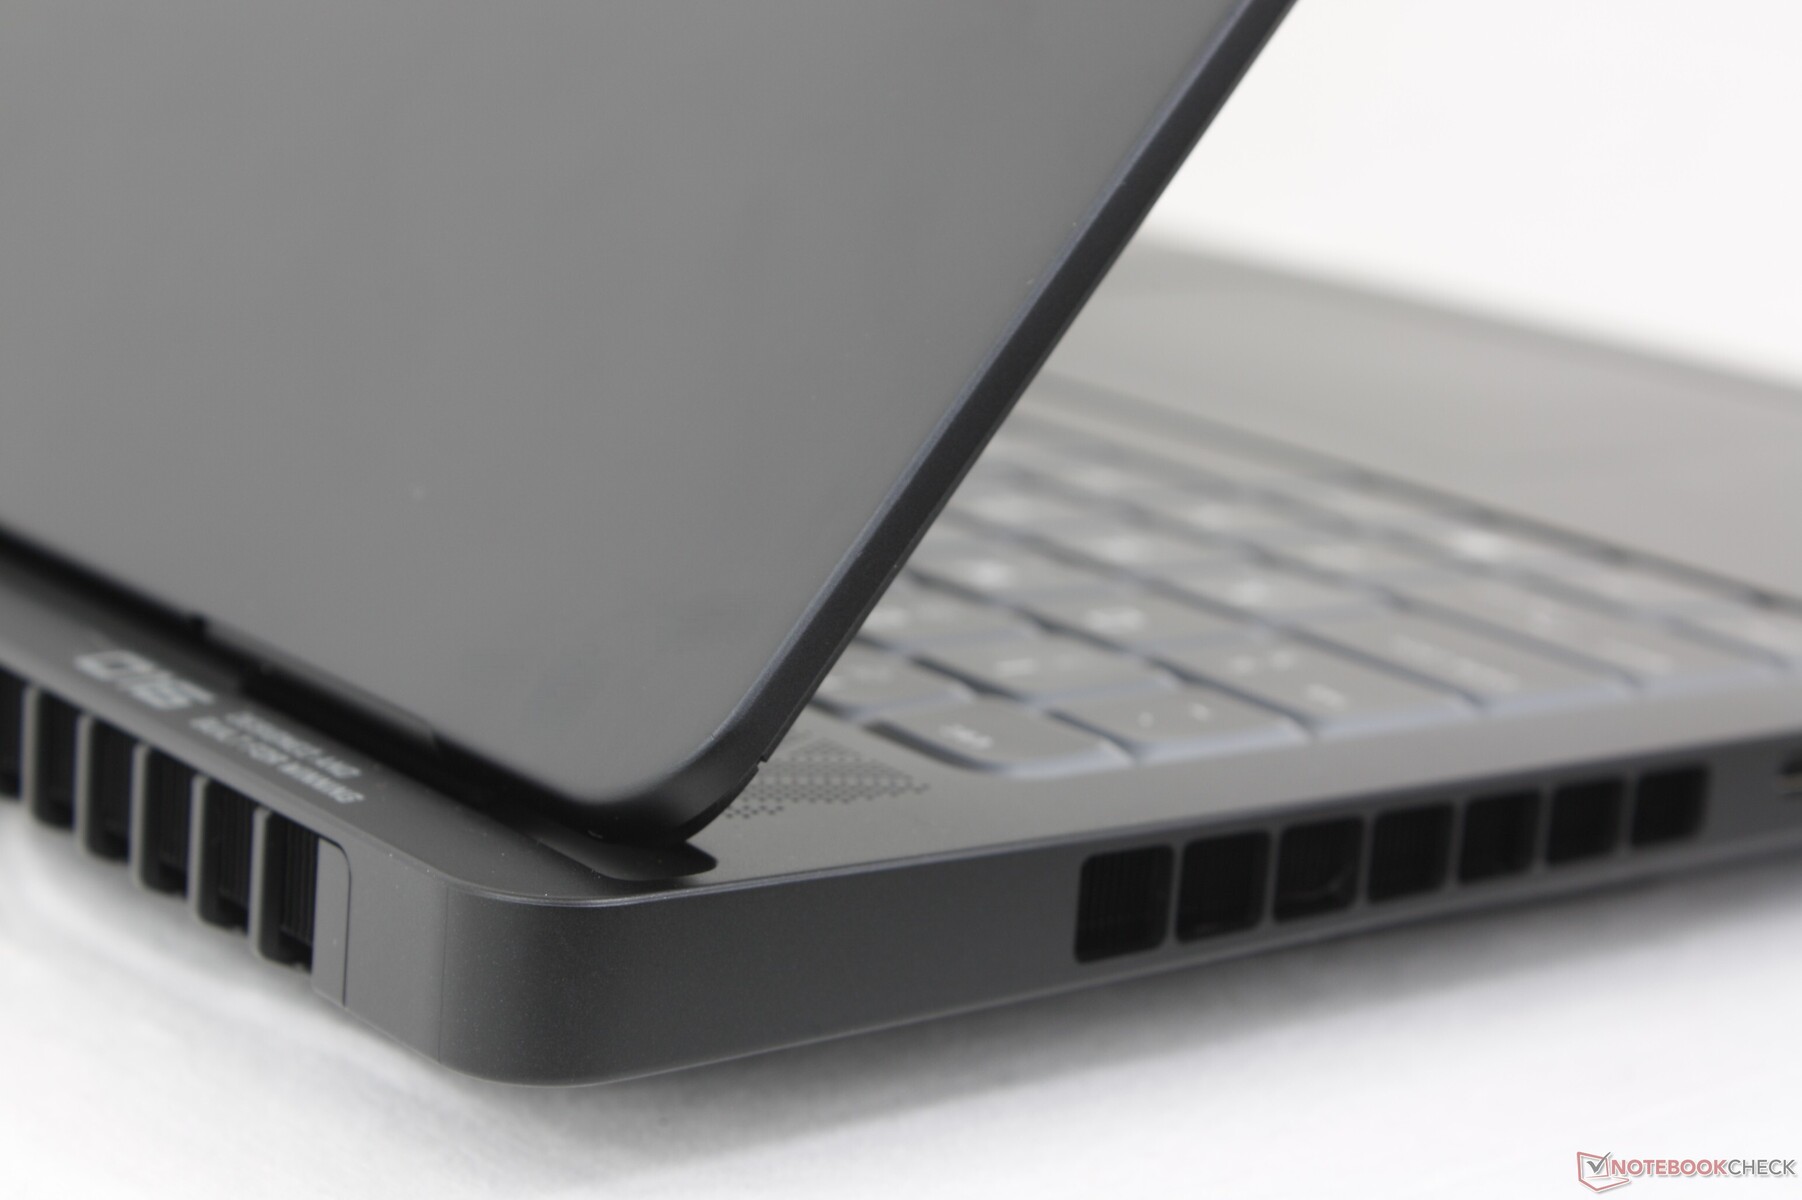
Caisse - Emballage dense
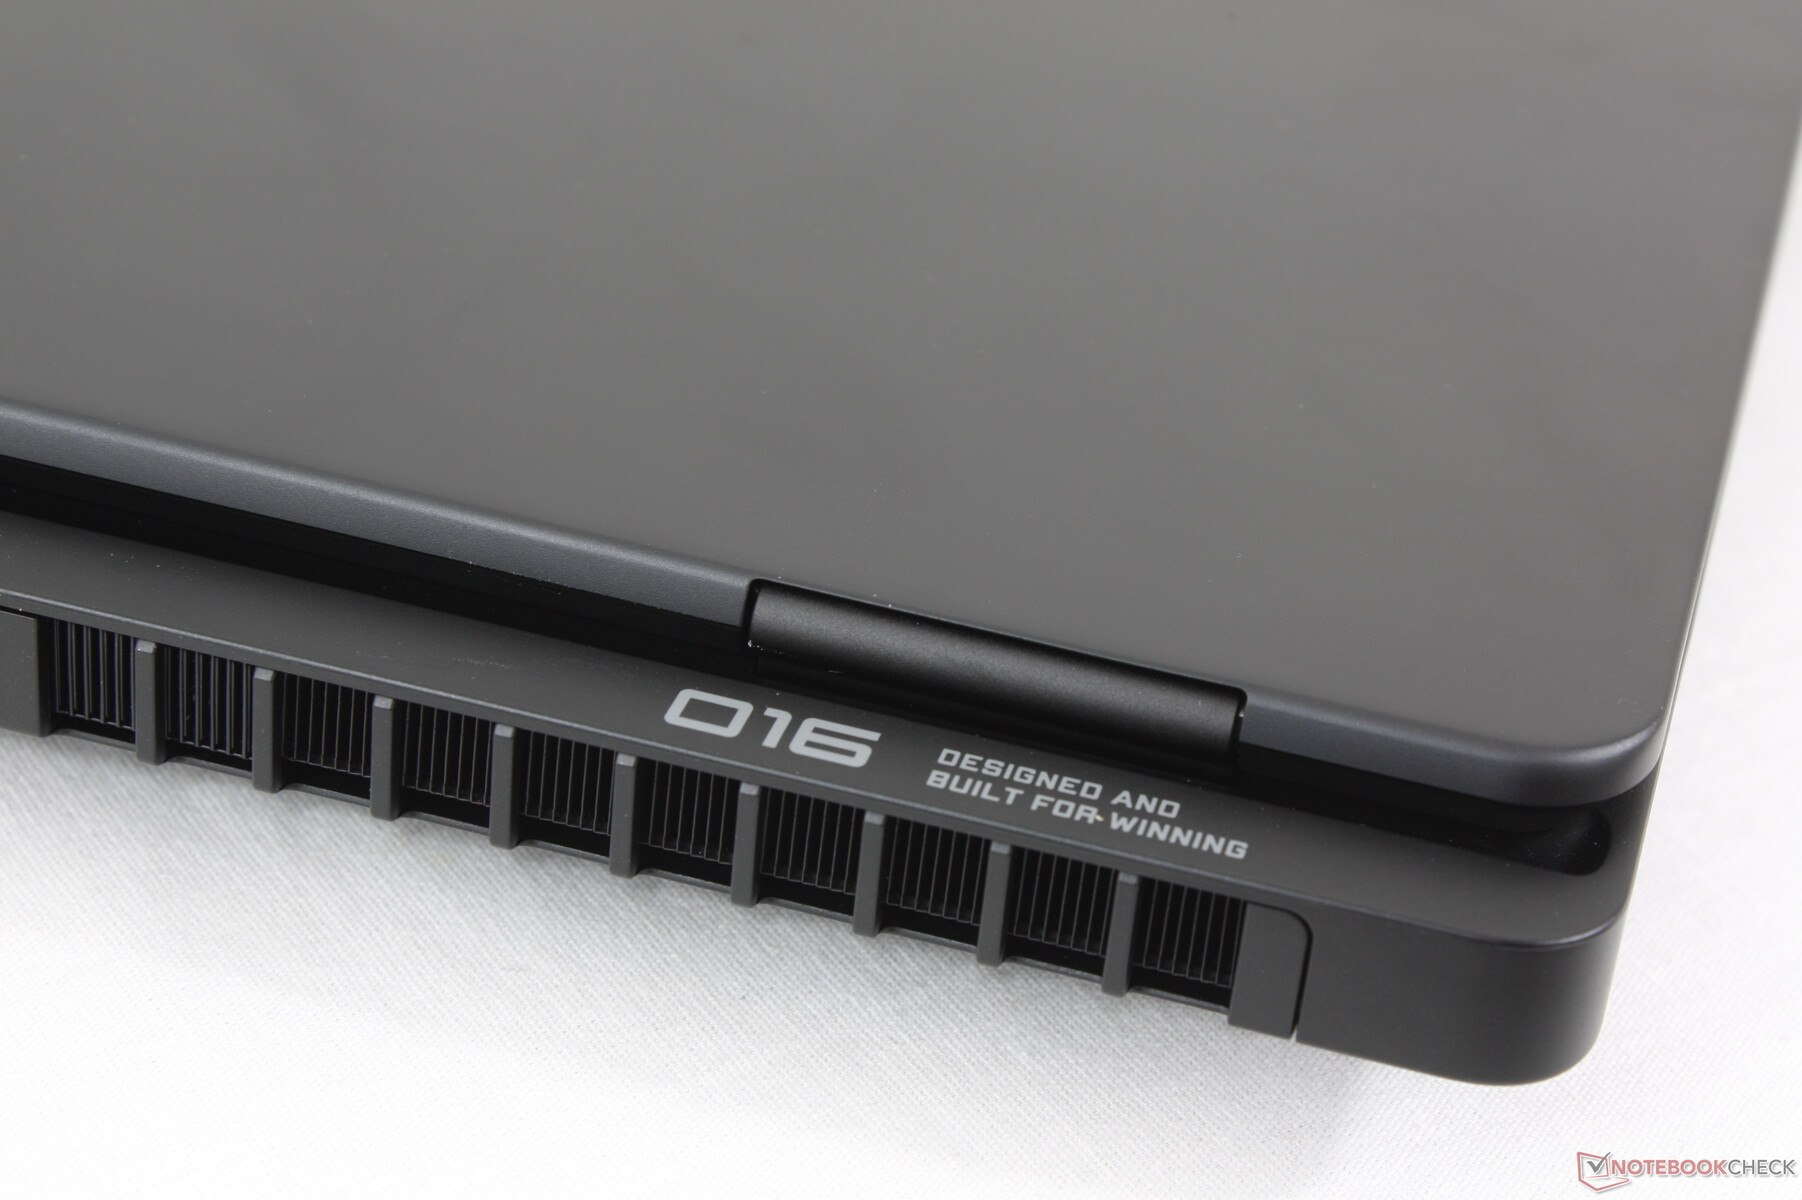
Bien que leurs dimensions soient différentes, l'Omen Max 16 est visuellement très similaire à l'Omen 16 2024 sortant, jusqu'à la couleur noire mate, le design arrière et les charnières, et les surfaces lisses en aluminium. Les principales différences sont le clavier révisé et la nouvelle barre LED le long du bord avant, comme sur le dernier modèle de la gamme Legion Pro 7i 16 G10.
La qualité de construction reste excellente autour de la base, tandis que le couvercle et les charnières auraient pu être plus rigides pour une meilleure sensation de longévité. Par exemple, le couvercle a tendance à vaciller lors de l'ajustement des angles et la pression sur le centre derrière l'écran fait fléchir la surface plus que sur le Blade 16 ou le Lenovo susmentionné.
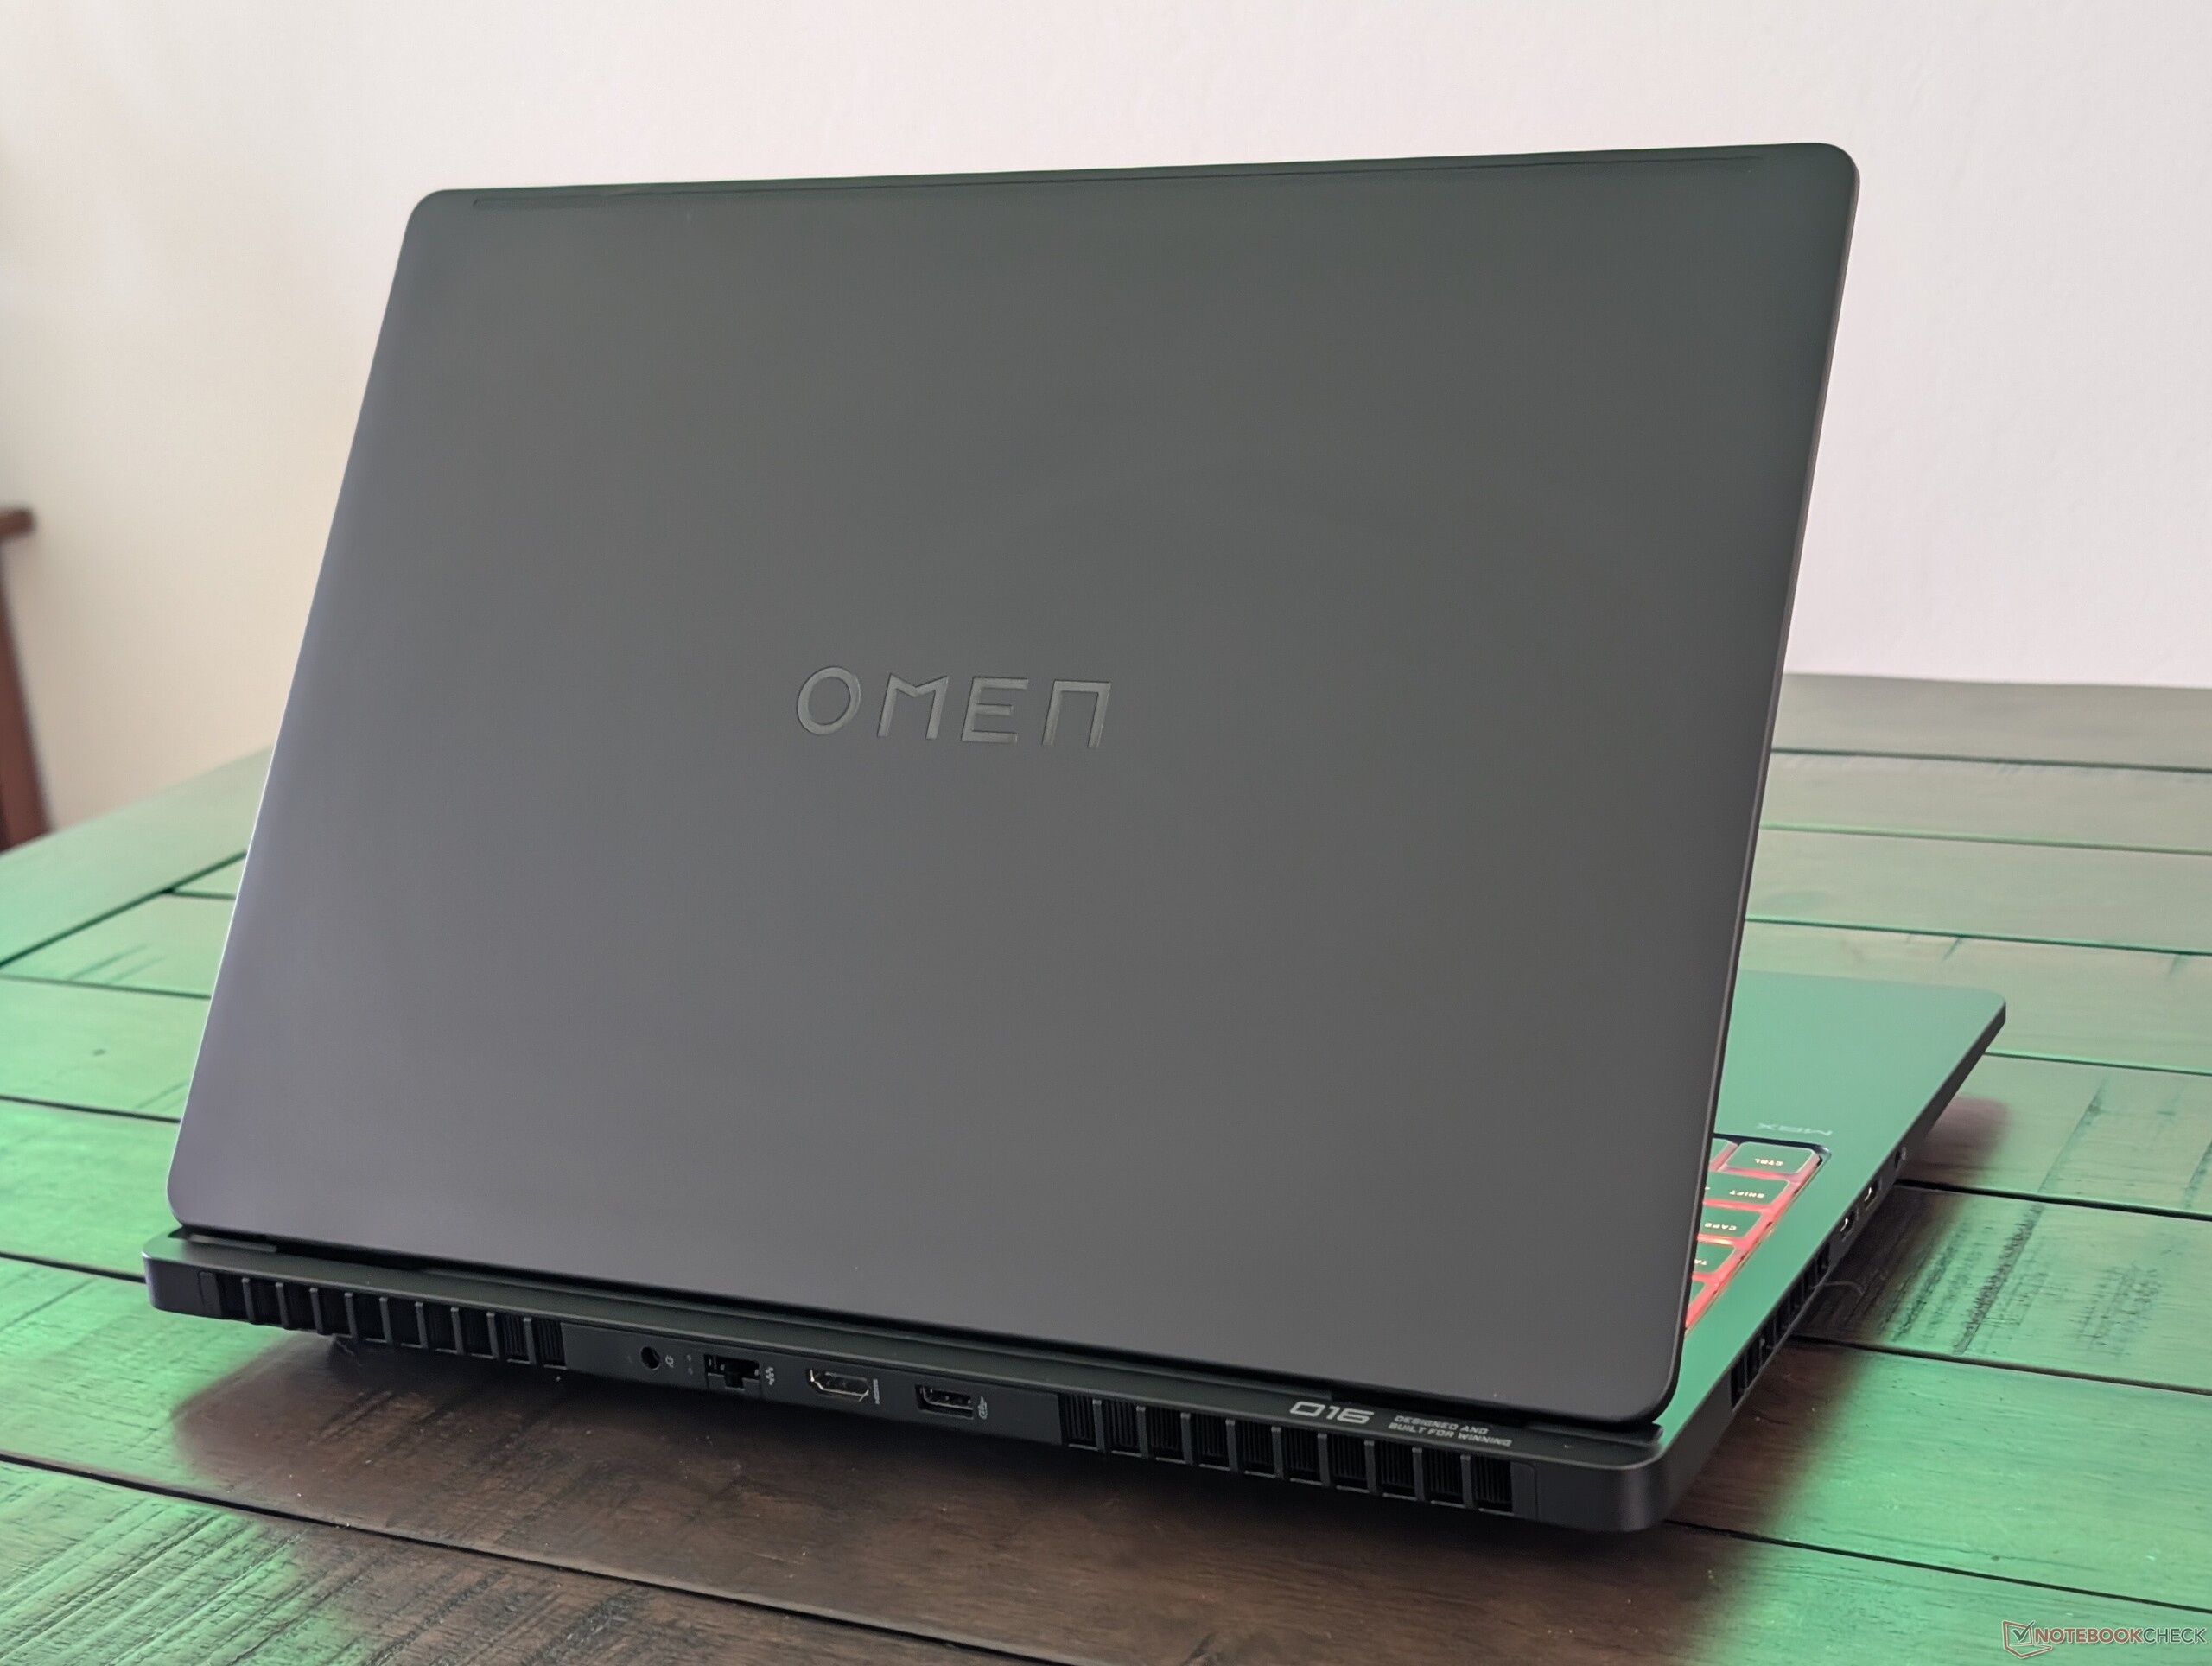
HP a vraiment mis le "Max" dans "Omen Max 16" car le modèle est à la fois plus épais et plus lourd que l'Omen 16 sortant. L'augmentation du poids en particulier est notable car le système est plus lourd de plusieurs centaines de grammes que des concurrents comme le ROG Zephyrus G16 ou le Legion 9 16IRX9 de l'année dernière. Il s'agit d'un design assez dense, même pour un ordinateur portable de jeu de 16 pouces.
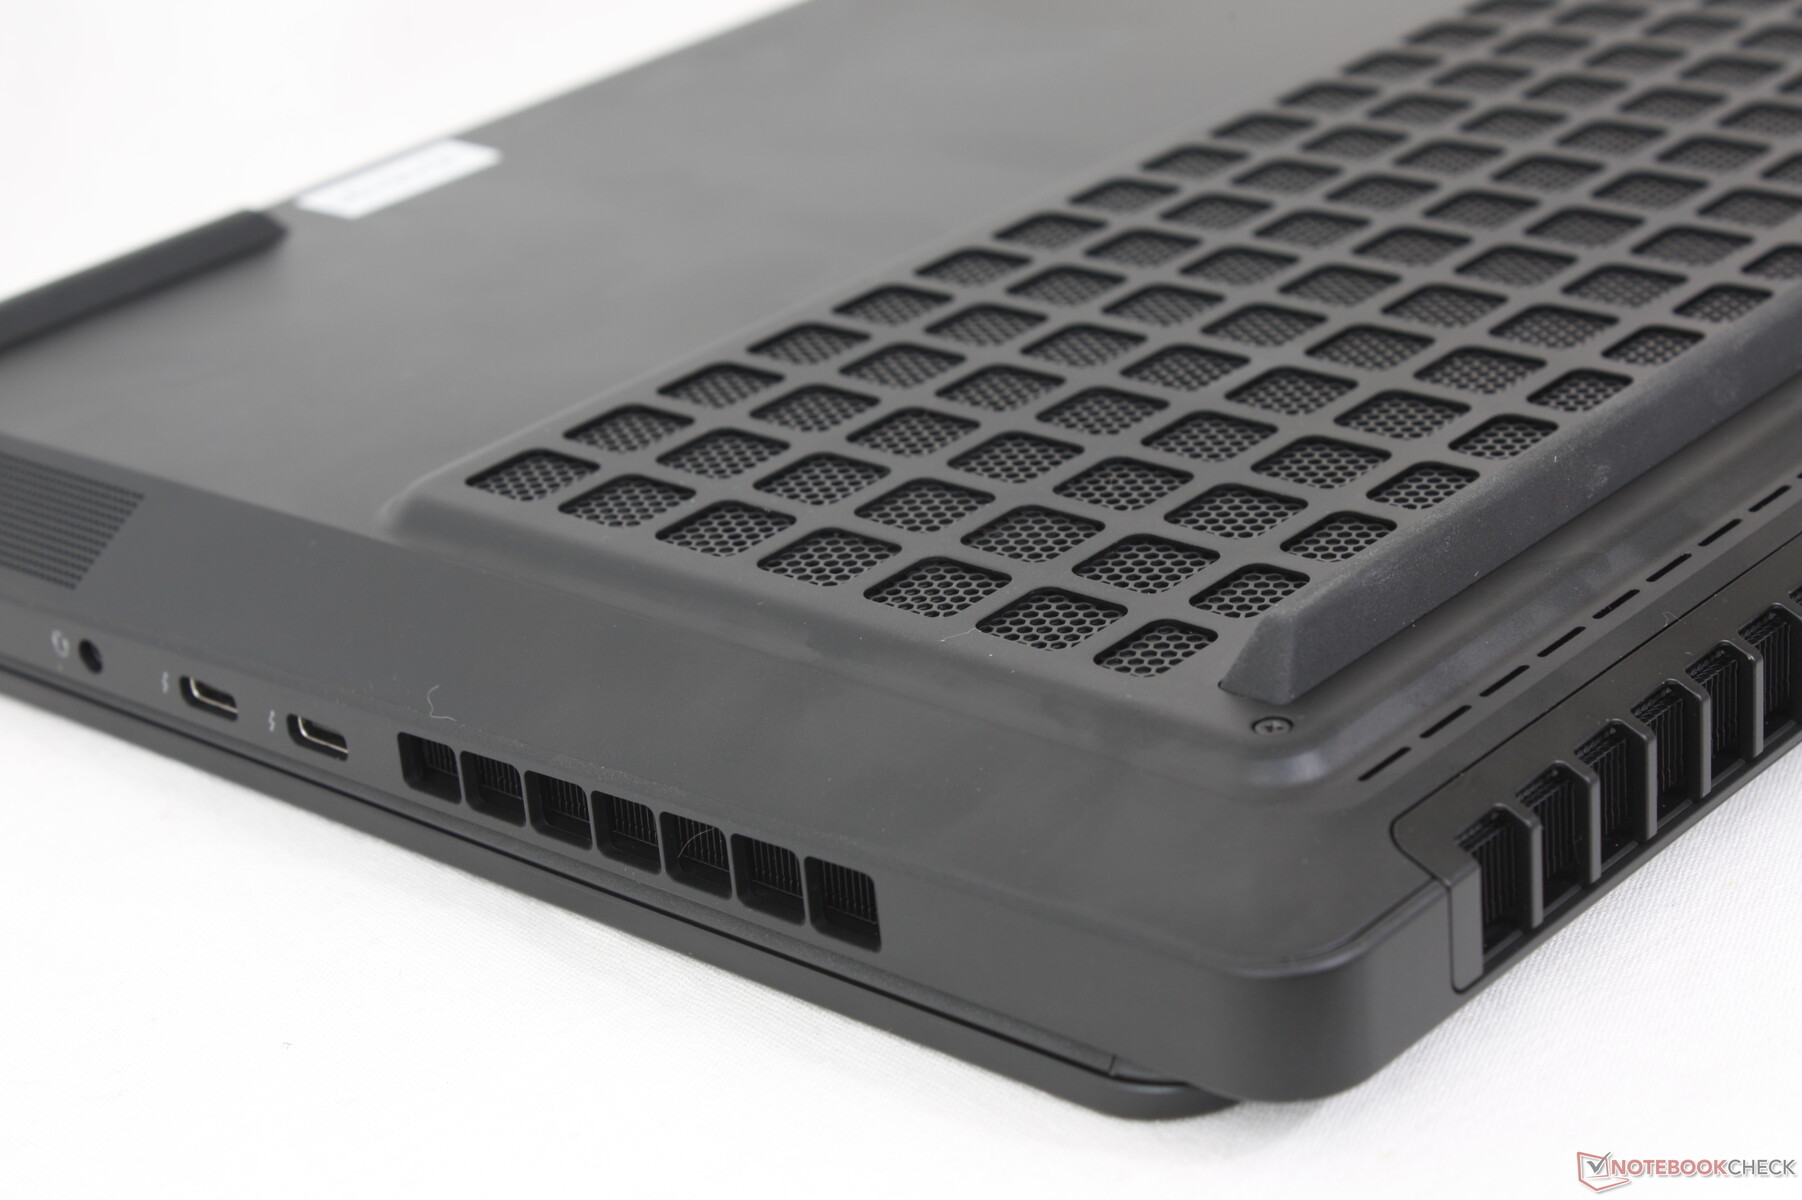
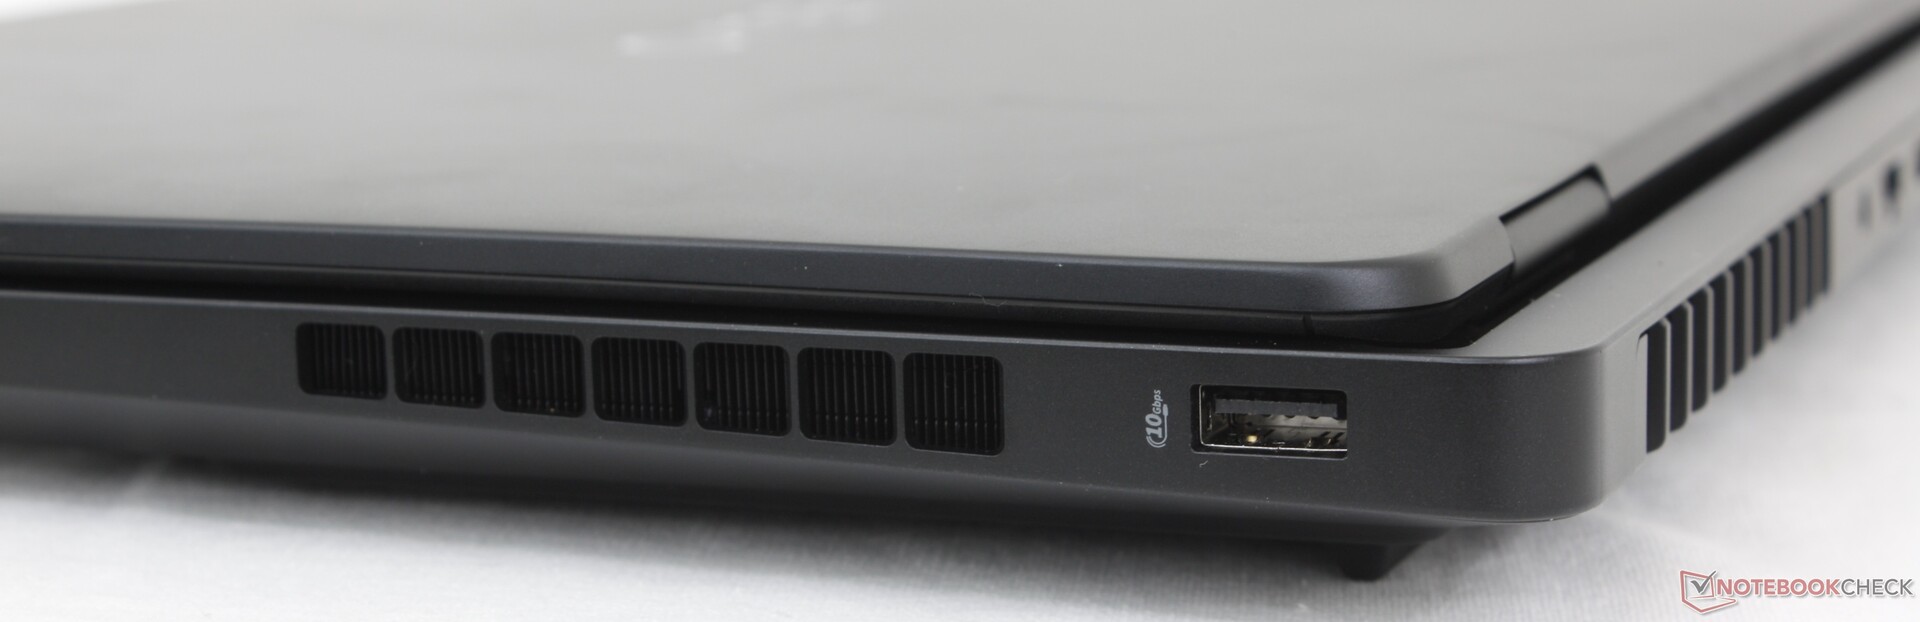
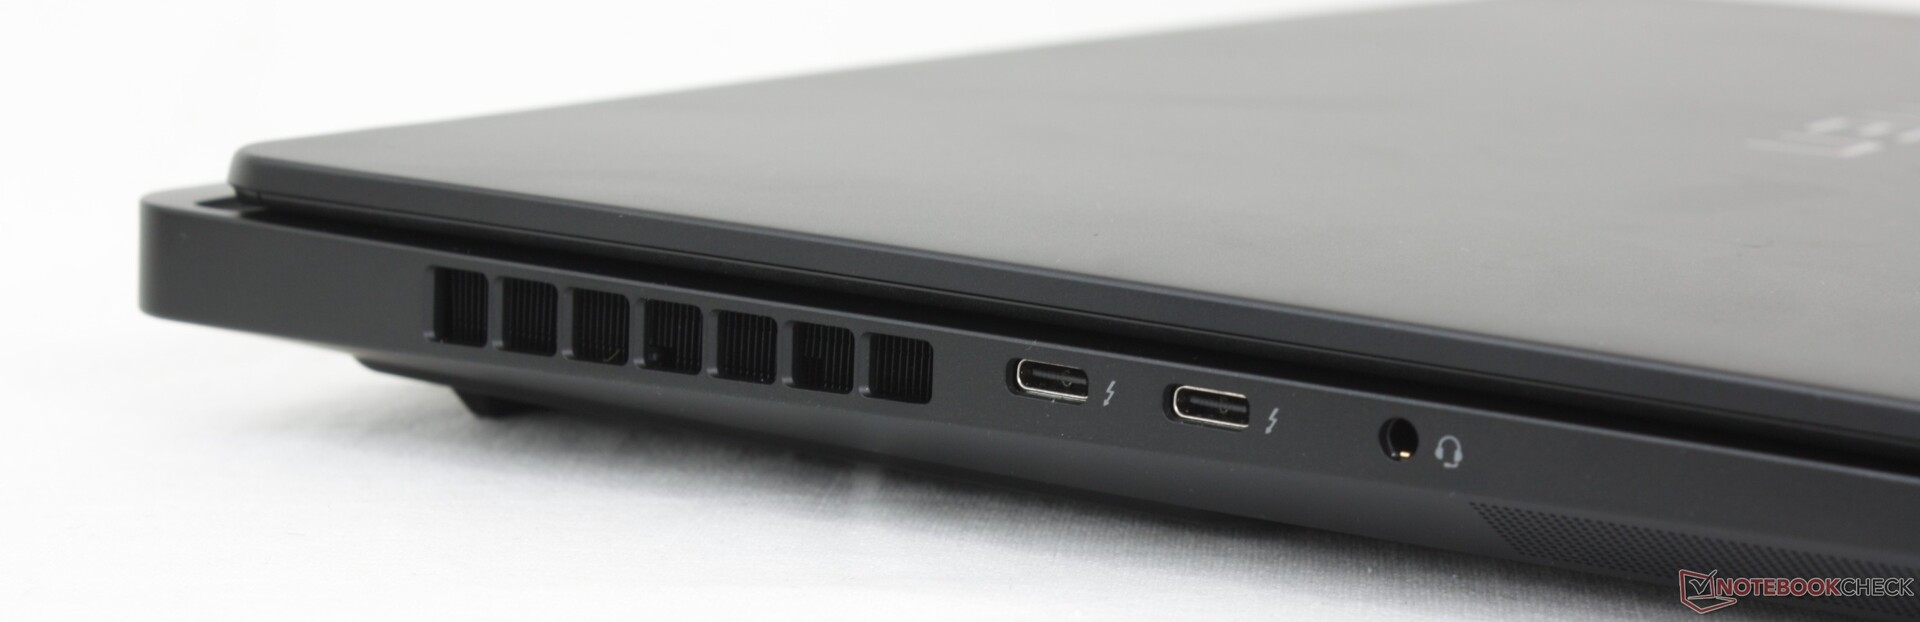
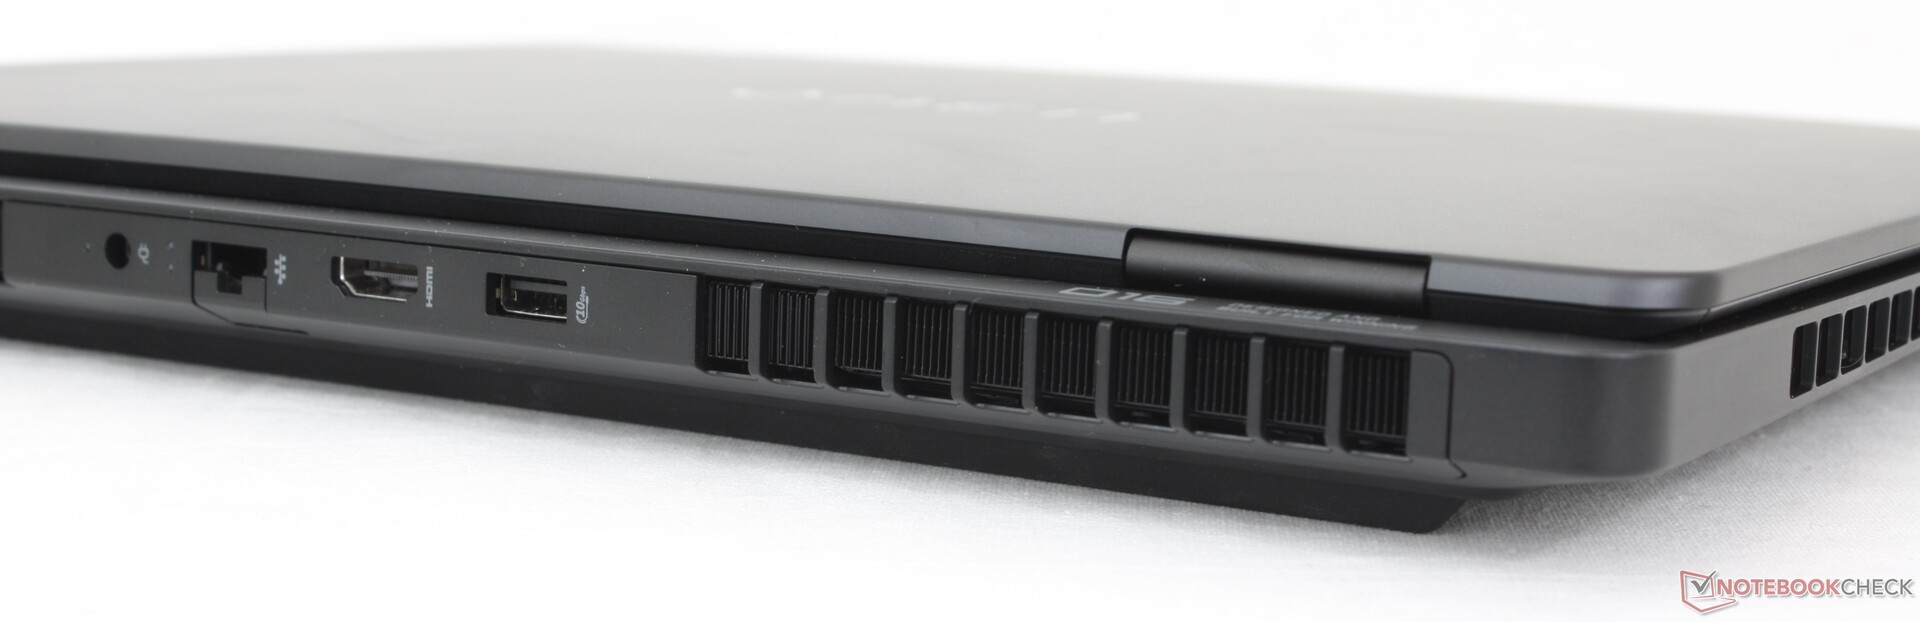
Connectivité
Les options de port restent les mêmes que sur l'Omen 16 malgré les changements externes et internes. Ce n'est pas nécessairement une mauvaise chose car le modèle intègre une sélection saine pour être compétitif par rapport aux alternatives, mais les créateurs de contenu peuvent déplorer l'absence d'un lecteur de carte SD intégré.

Communication
L'Intel BE200 est livré en standard avec une connectivité Wi-Fi 7 et Bluetooth 5.4.
| Networking | |
| iperf3 transmit AXE11000 | |
| Razer Blade 16 2025 RTX 5090 | |
| Asus ROG Zephyrus G16 GU605CX | |
| HP Omen 16 (2024) | |
| Lenovo Legion 9 16IRX9, RTX 4090 | |
| HP Omen Max 16 ah000 | |
| MSI Vector 16 HX A14V | |
| iperf3 receive AXE11000 | |
| Razer Blade 16 2025 RTX 5090 | |
| HP Omen 16 (2024) | |
| Asus ROG Zephyrus G16 GU605CX | |
| Lenovo Legion 9 16IRX9, RTX 4090 | |
| HP Omen Max 16 ah000 | |
| MSI Vector 16 HX A14V | |
| iperf3 transmit AXE11000 6GHz | |
| Lenovo Legion 9 16IRX9, RTX 4090 | |
| MSI Vector 16 HX A14V | |
| HP Omen Max 16 ah000 | |
| iperf3 receive AXE11000 6GHz | |
| Lenovo Legion 9 16IRX9, RTX 4090 | |
| HP Omen Max 16 ah000 | |
| MSI Vector 16 HX A14V | |
Webcam
Une webcam de 2 mégapixels est fournie en standard avec un système infrarouge et un obturateur physique.


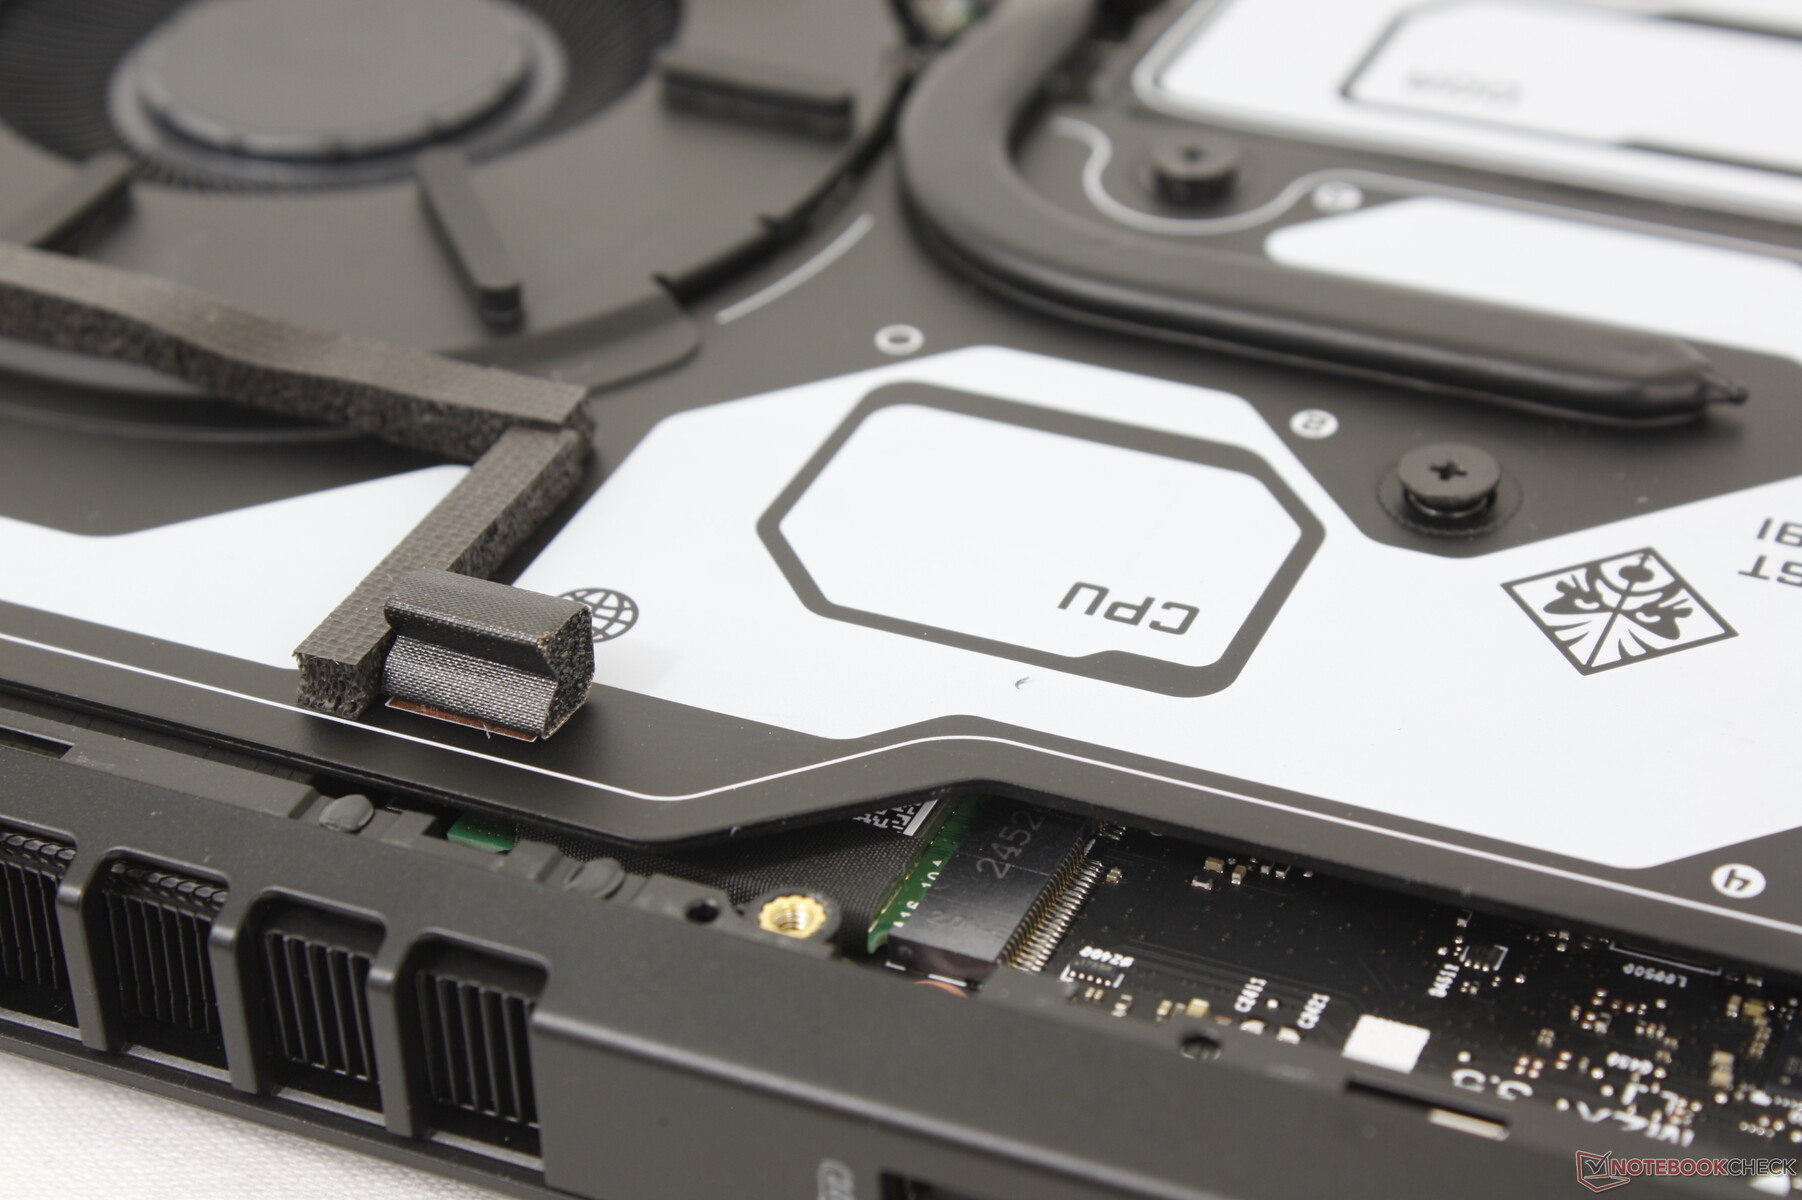
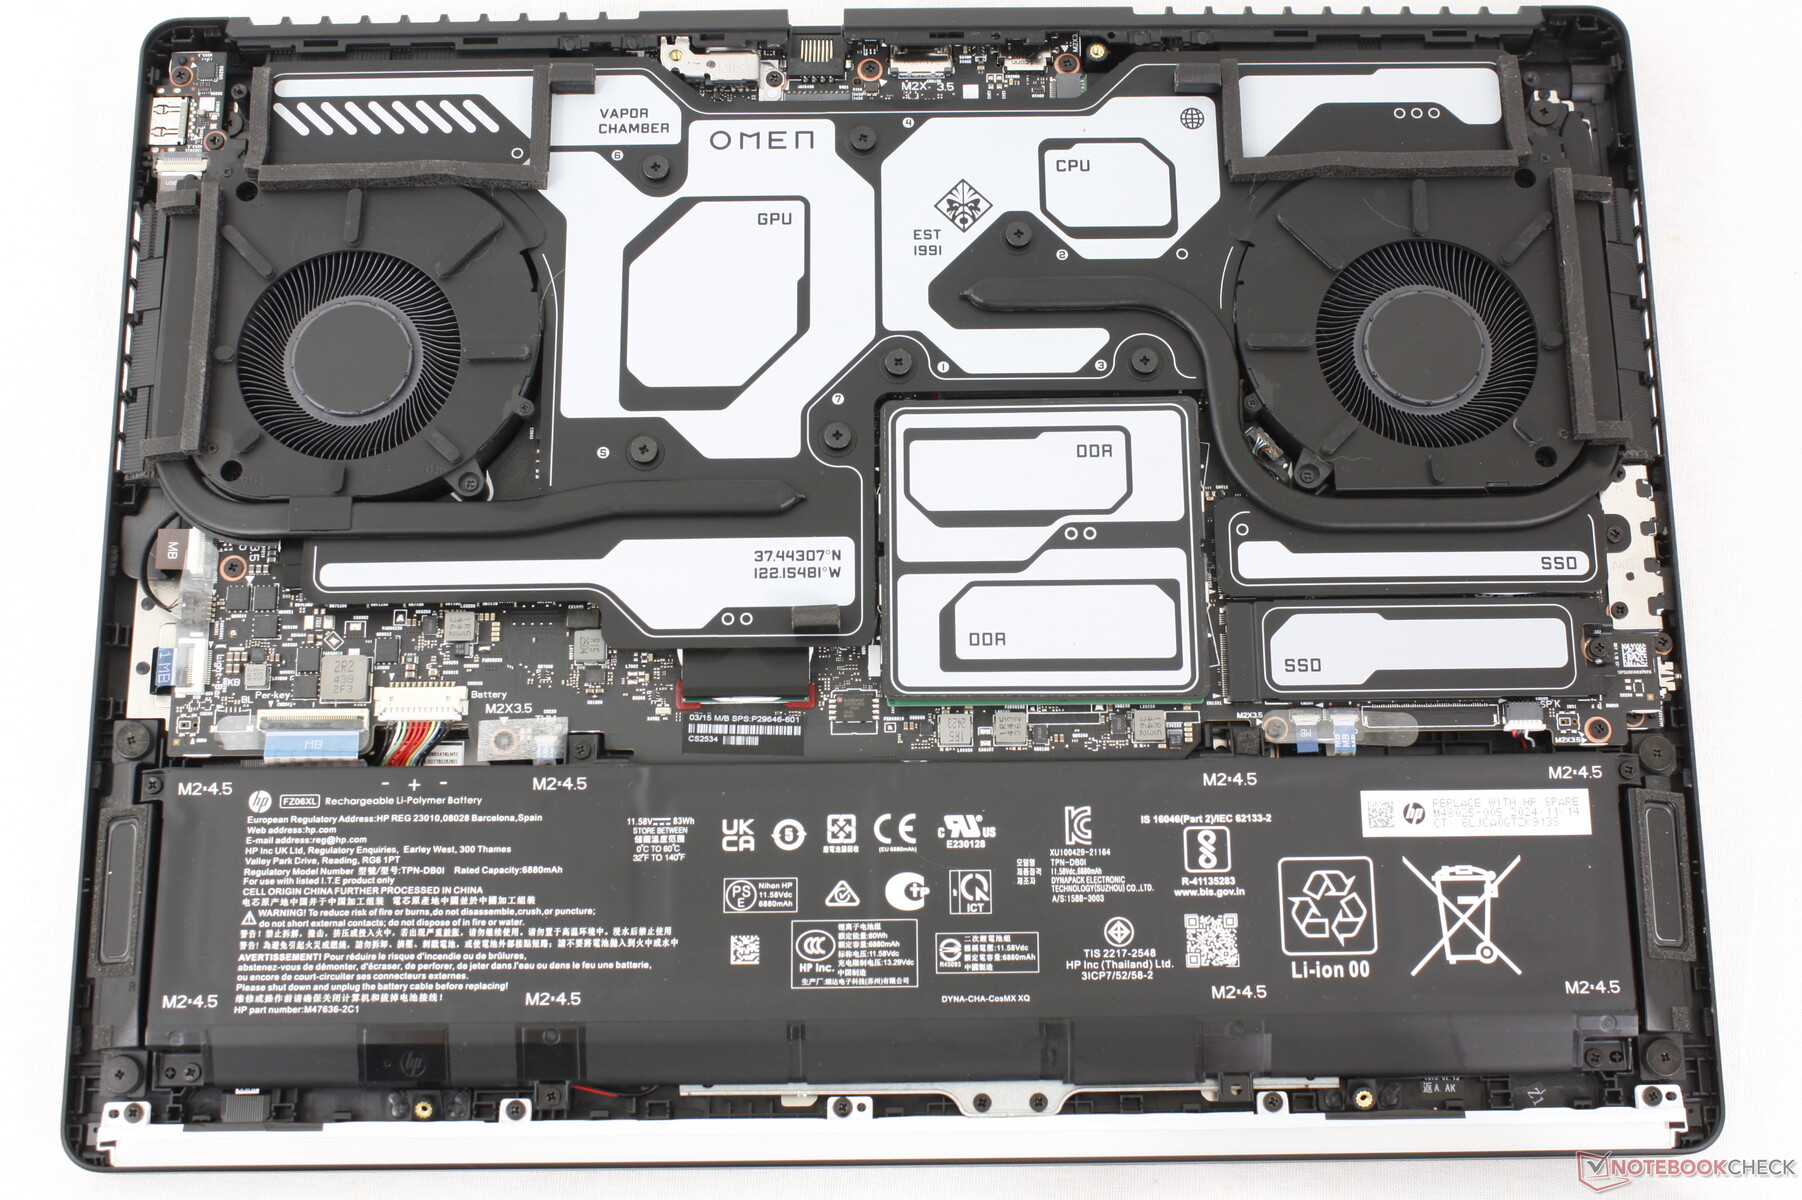
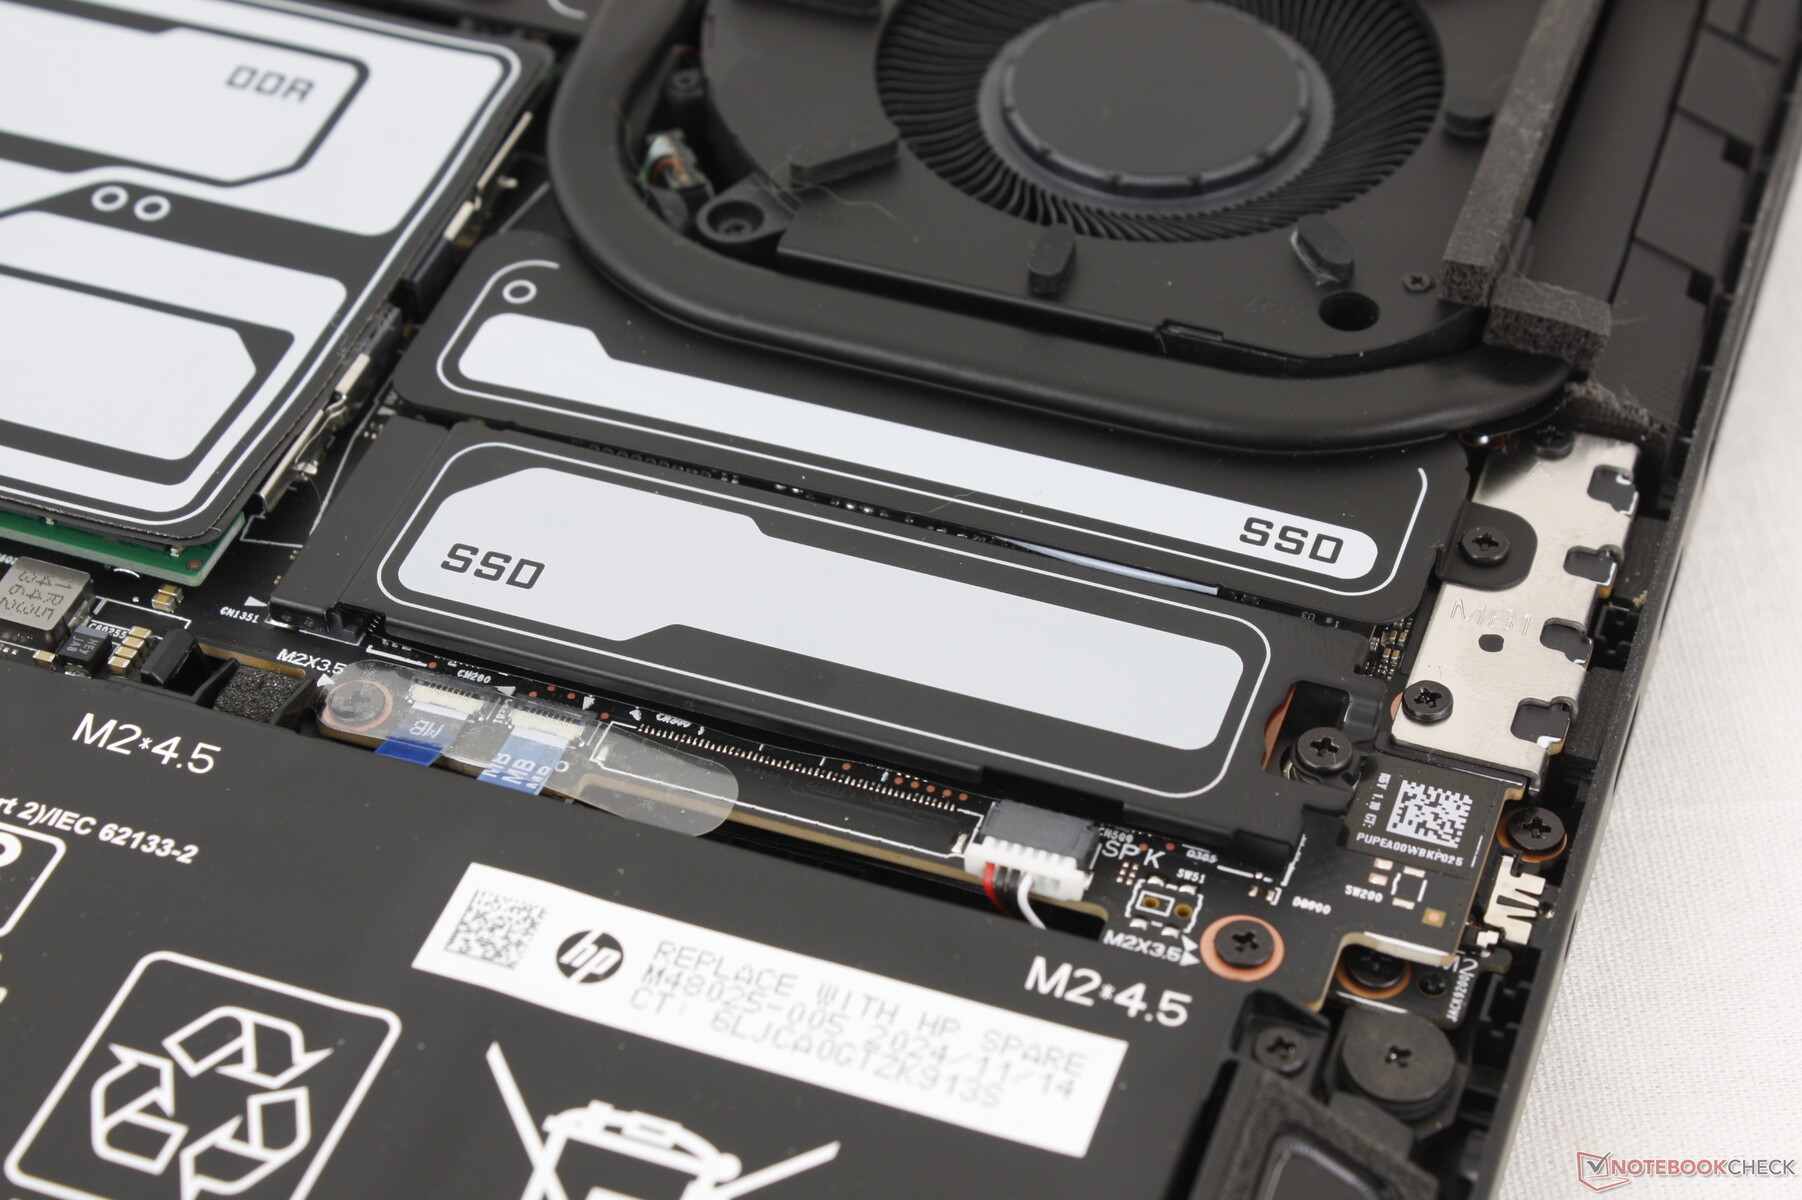
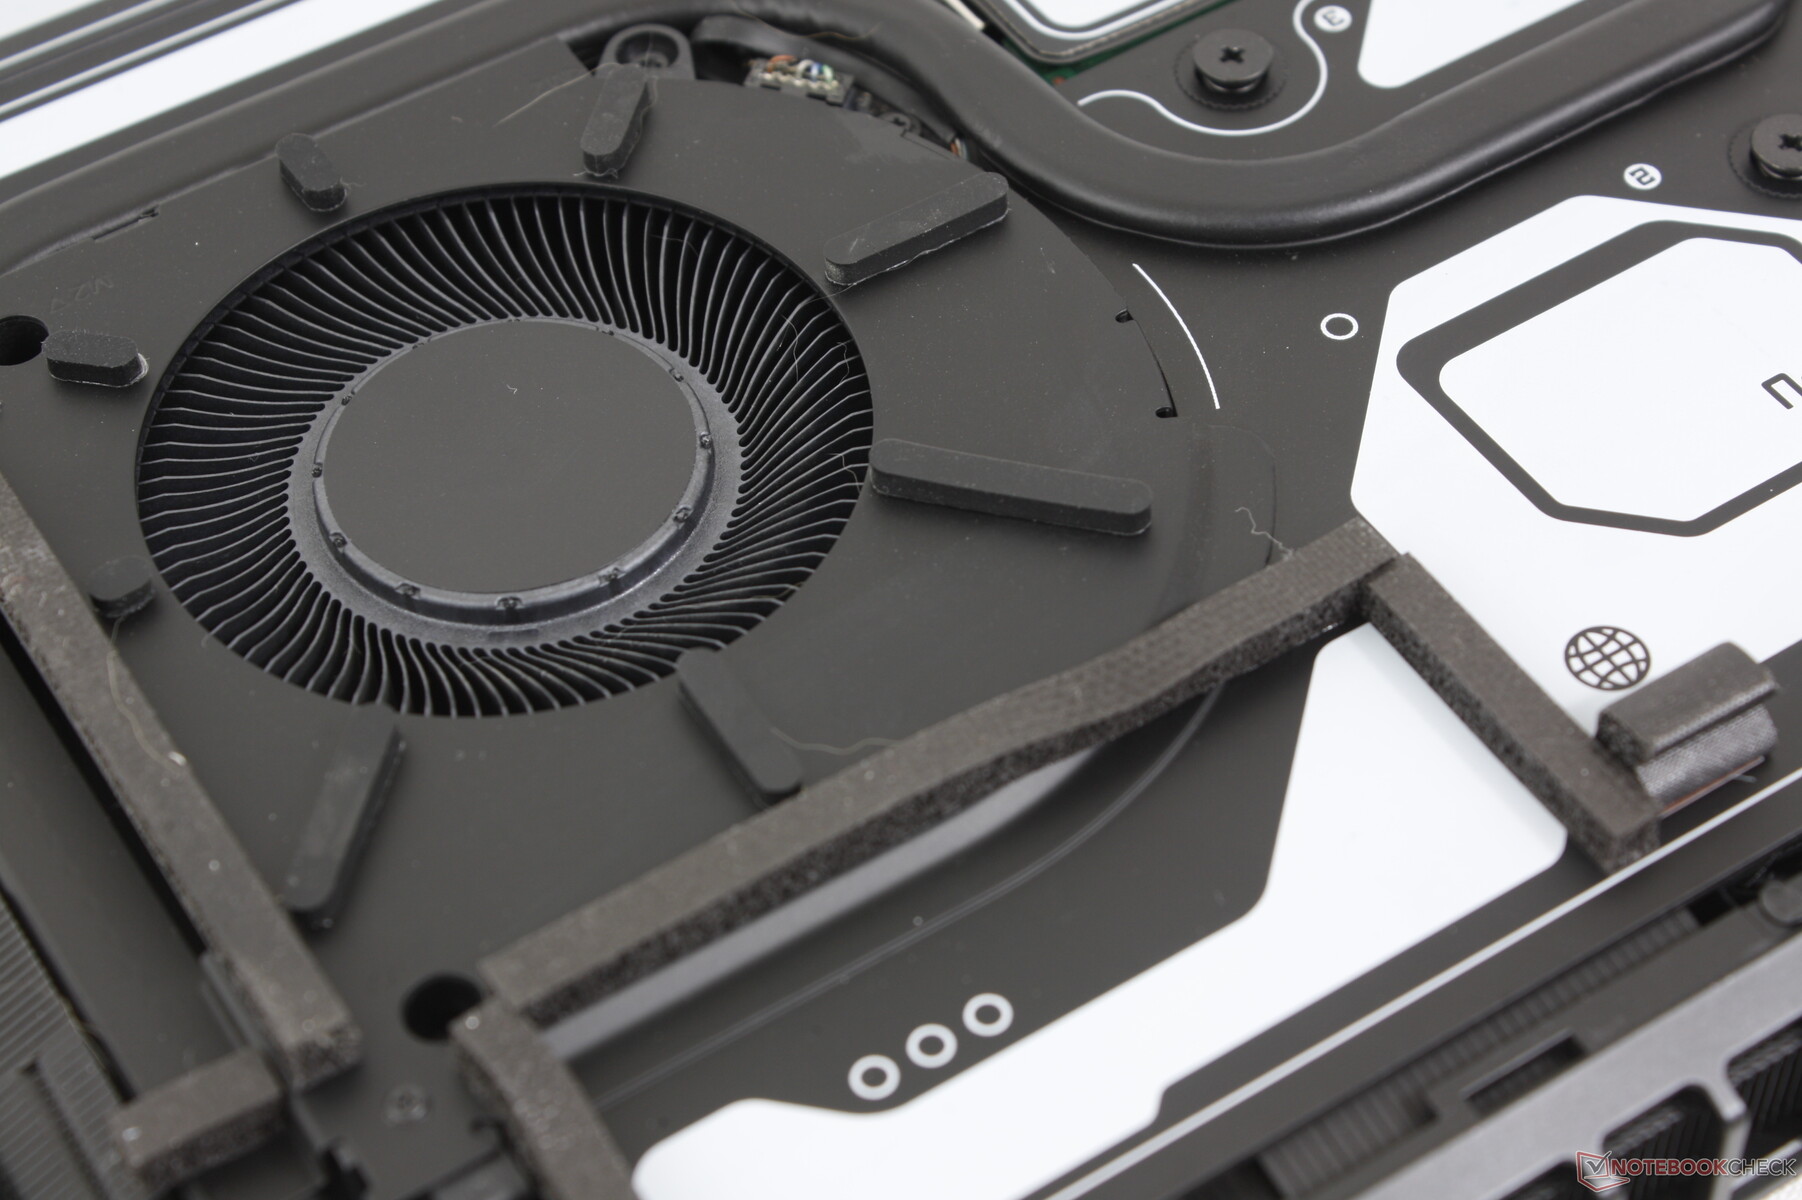
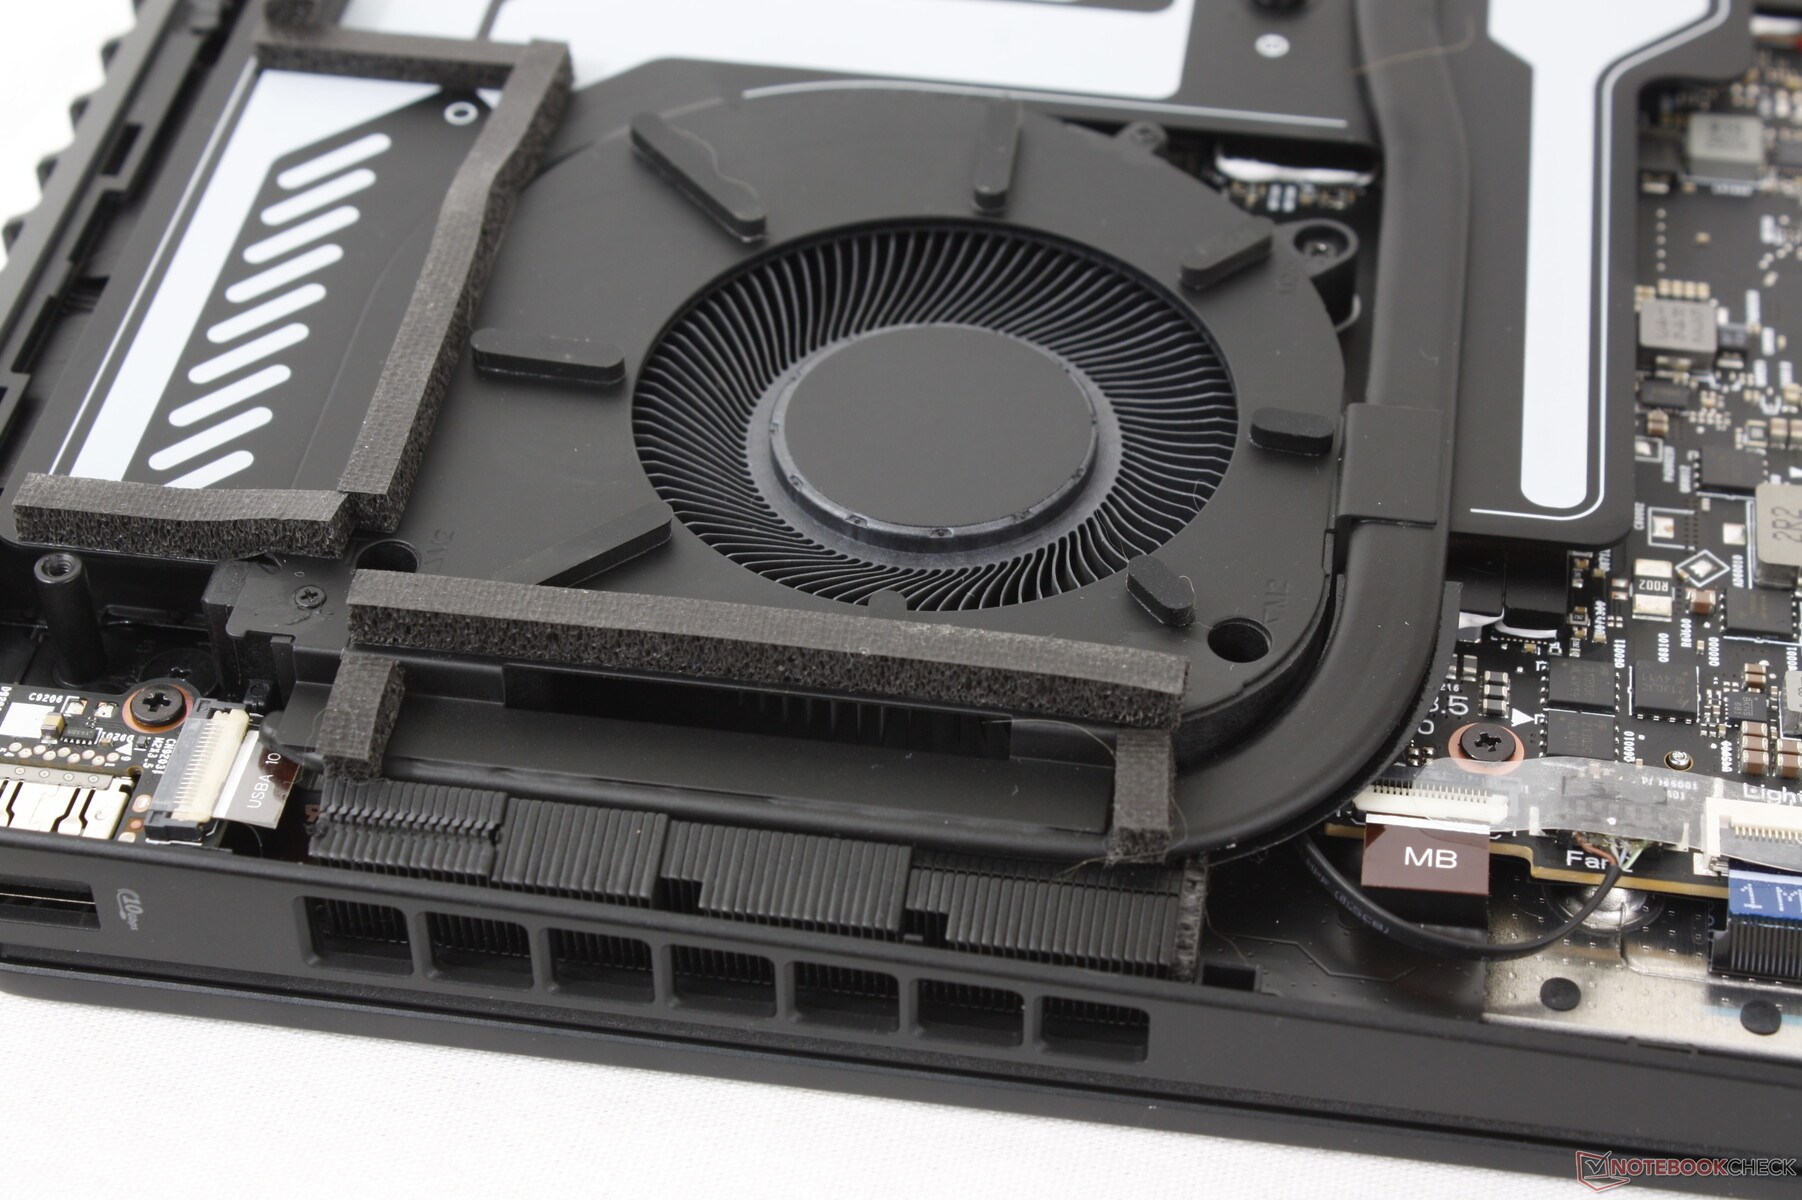
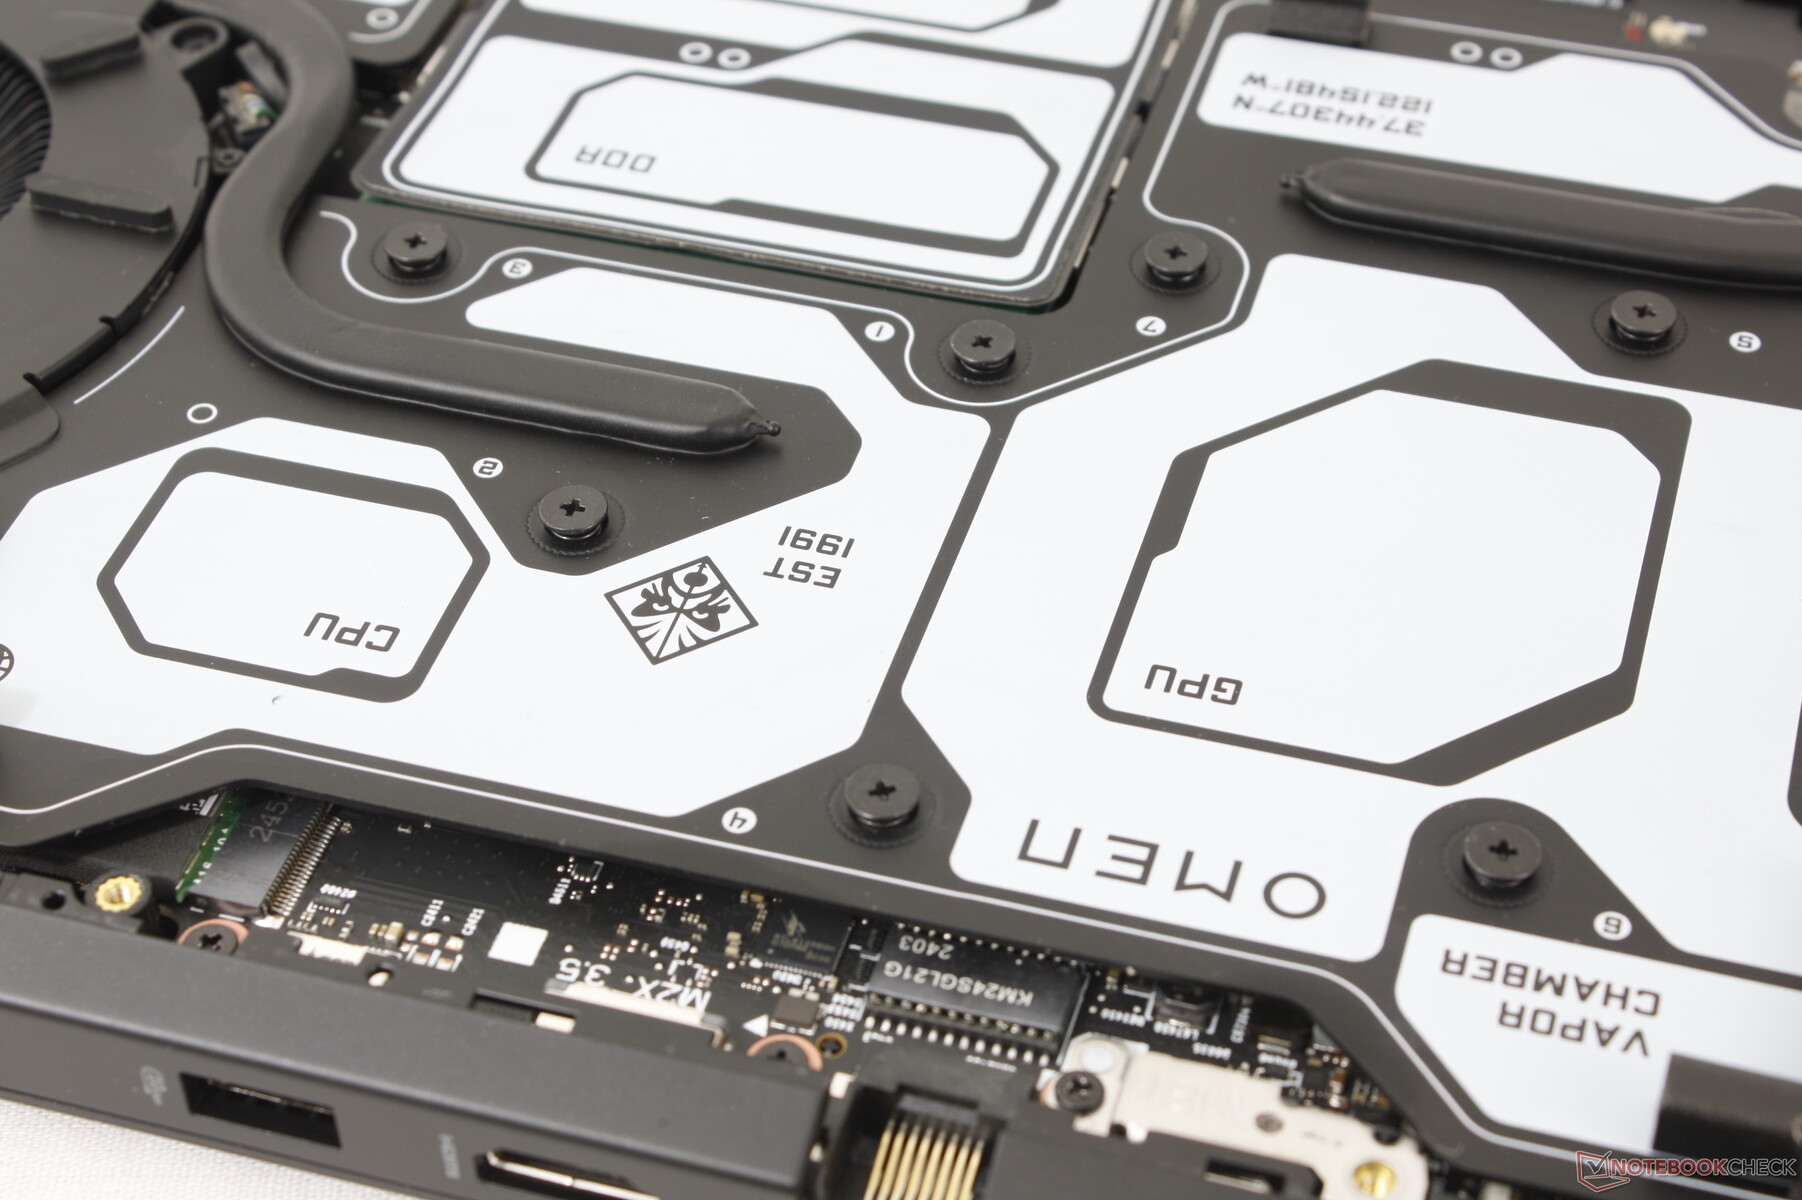
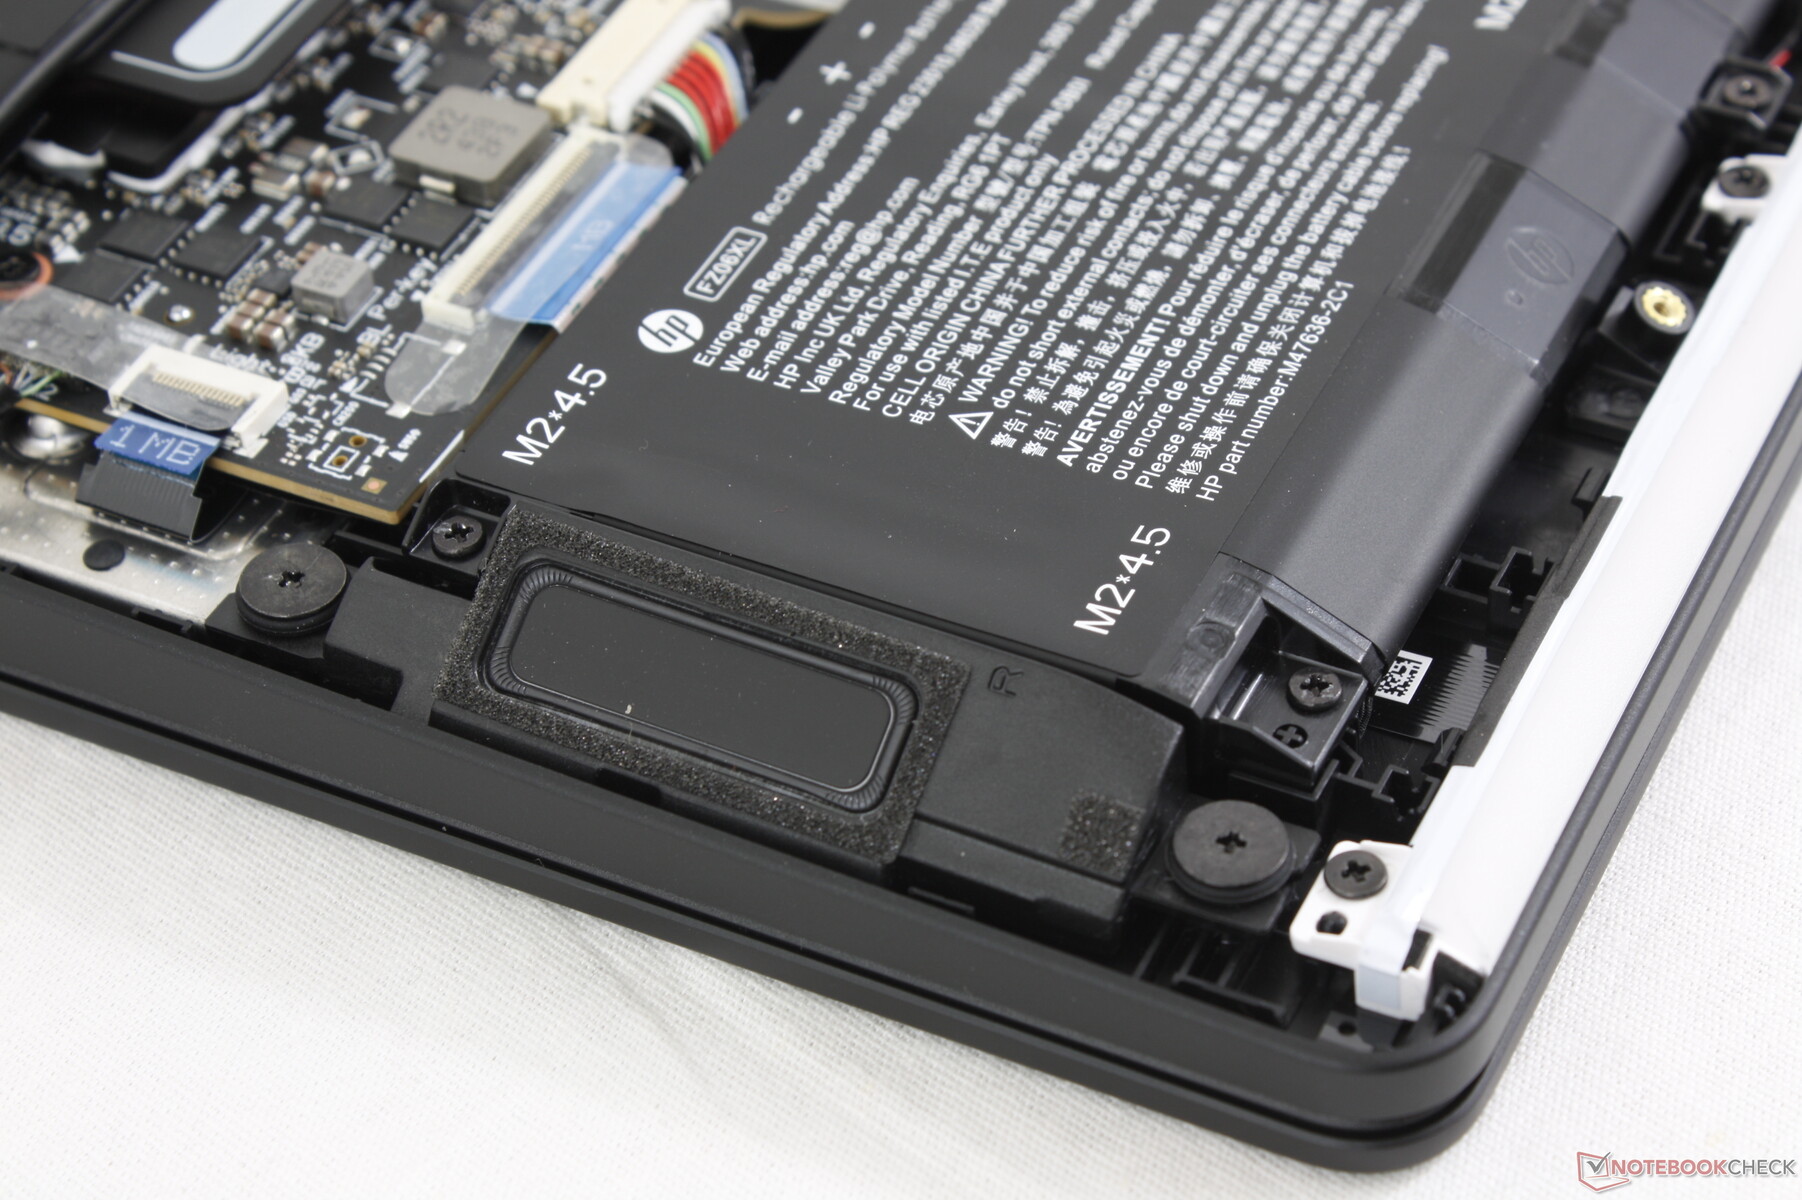
Maintenance
Le panneau inférieur se détache facilement à l'aide d'un simple tournevis Phillips. Les deux emplacements M.2 2280 SSD et les deux emplacements SODIMM sont clairement étiquetés pour permettre à l'utilisateur final d'effectuer des mises à niveau. Le module WLAN est également techniquement amovible, mais il est caché sous la solution de refroidissement et donc plus difficile à retirer.
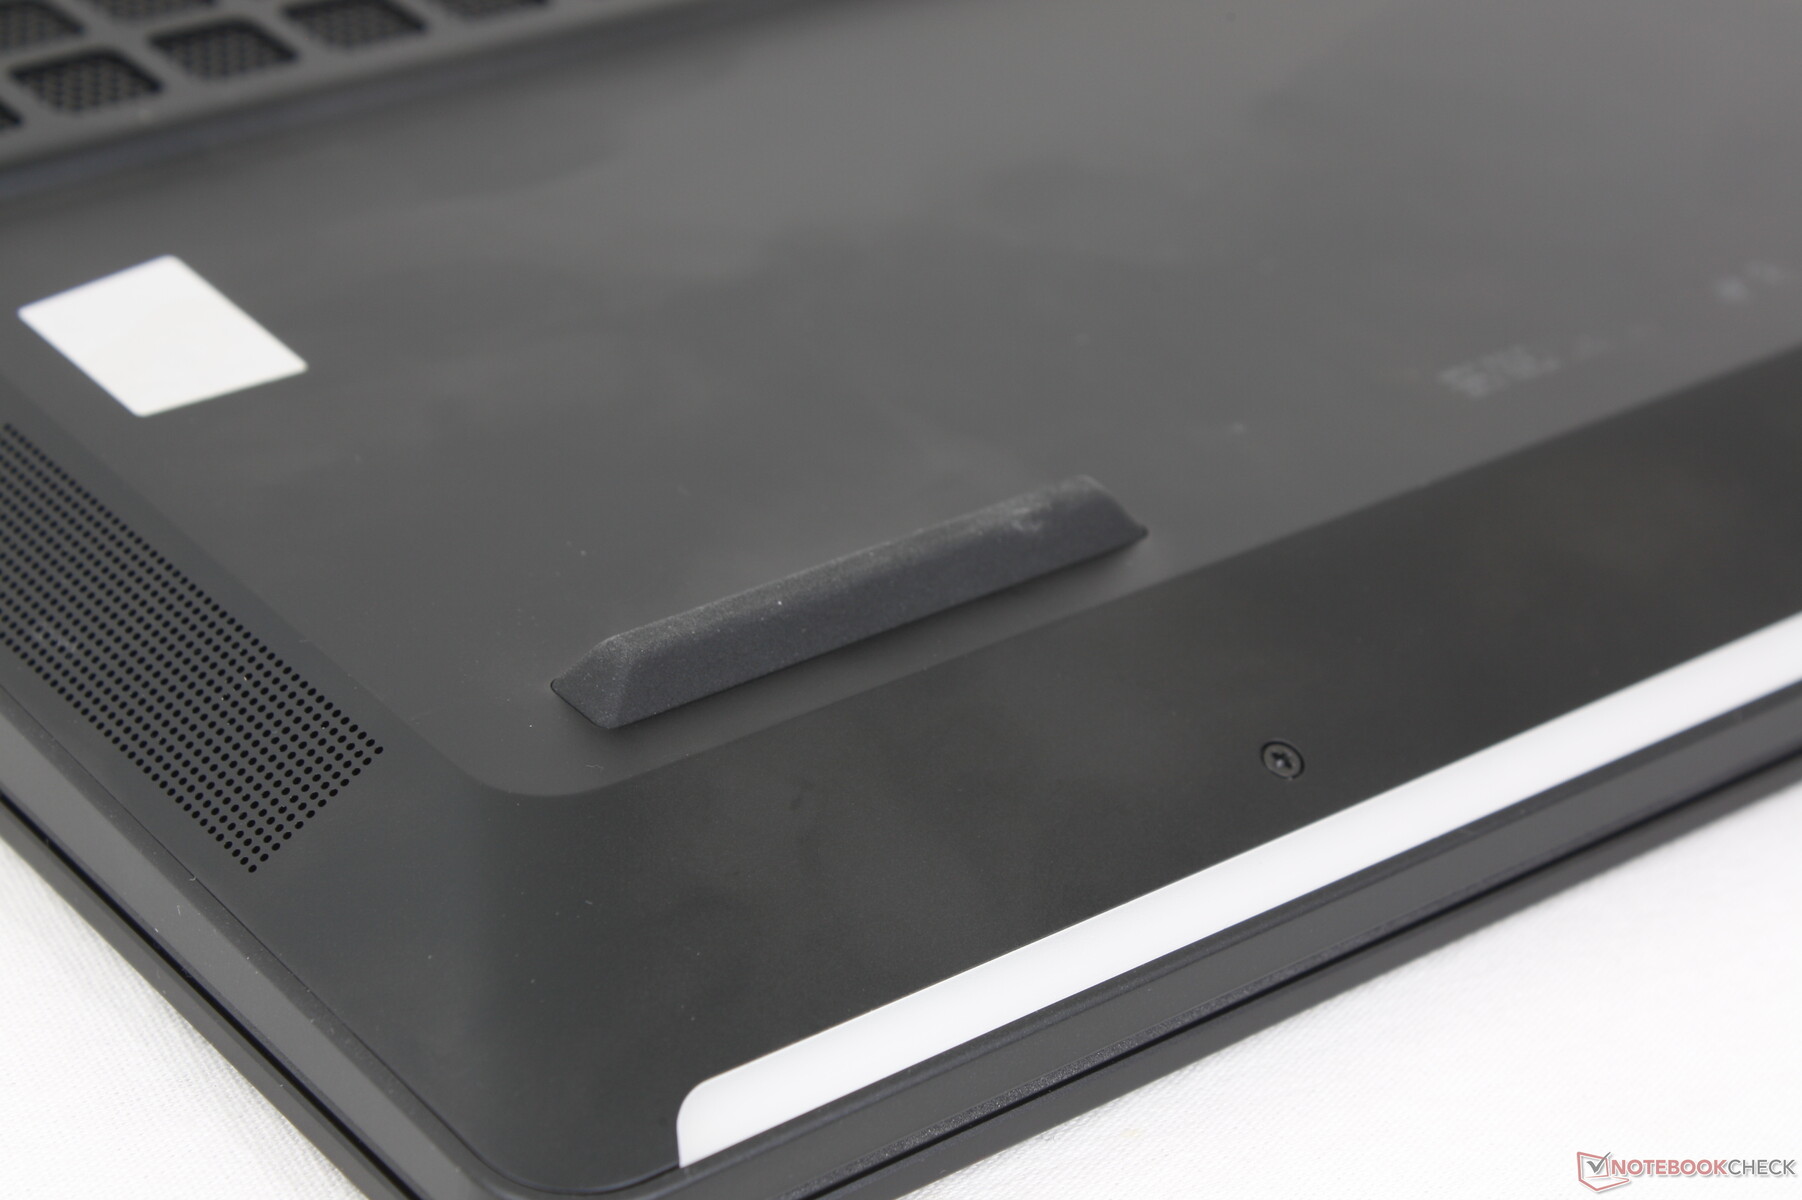
Durabilité
Les couvercles extérieur et inférieur sont constitués à 100 % d'aluminium recyclé, tandis que les repose-poignets et le cadre autour de l'écran sont constitués de 30 à 45 % de plastiques recyclés après consommation.
Accessoires et garantie
La boîte ne contient rien d'autre que l'adaptateur secteur et les documents. La garantie limitée habituelle d'un an du fabricant s'applique si vous l'achetez aux États-Unis.
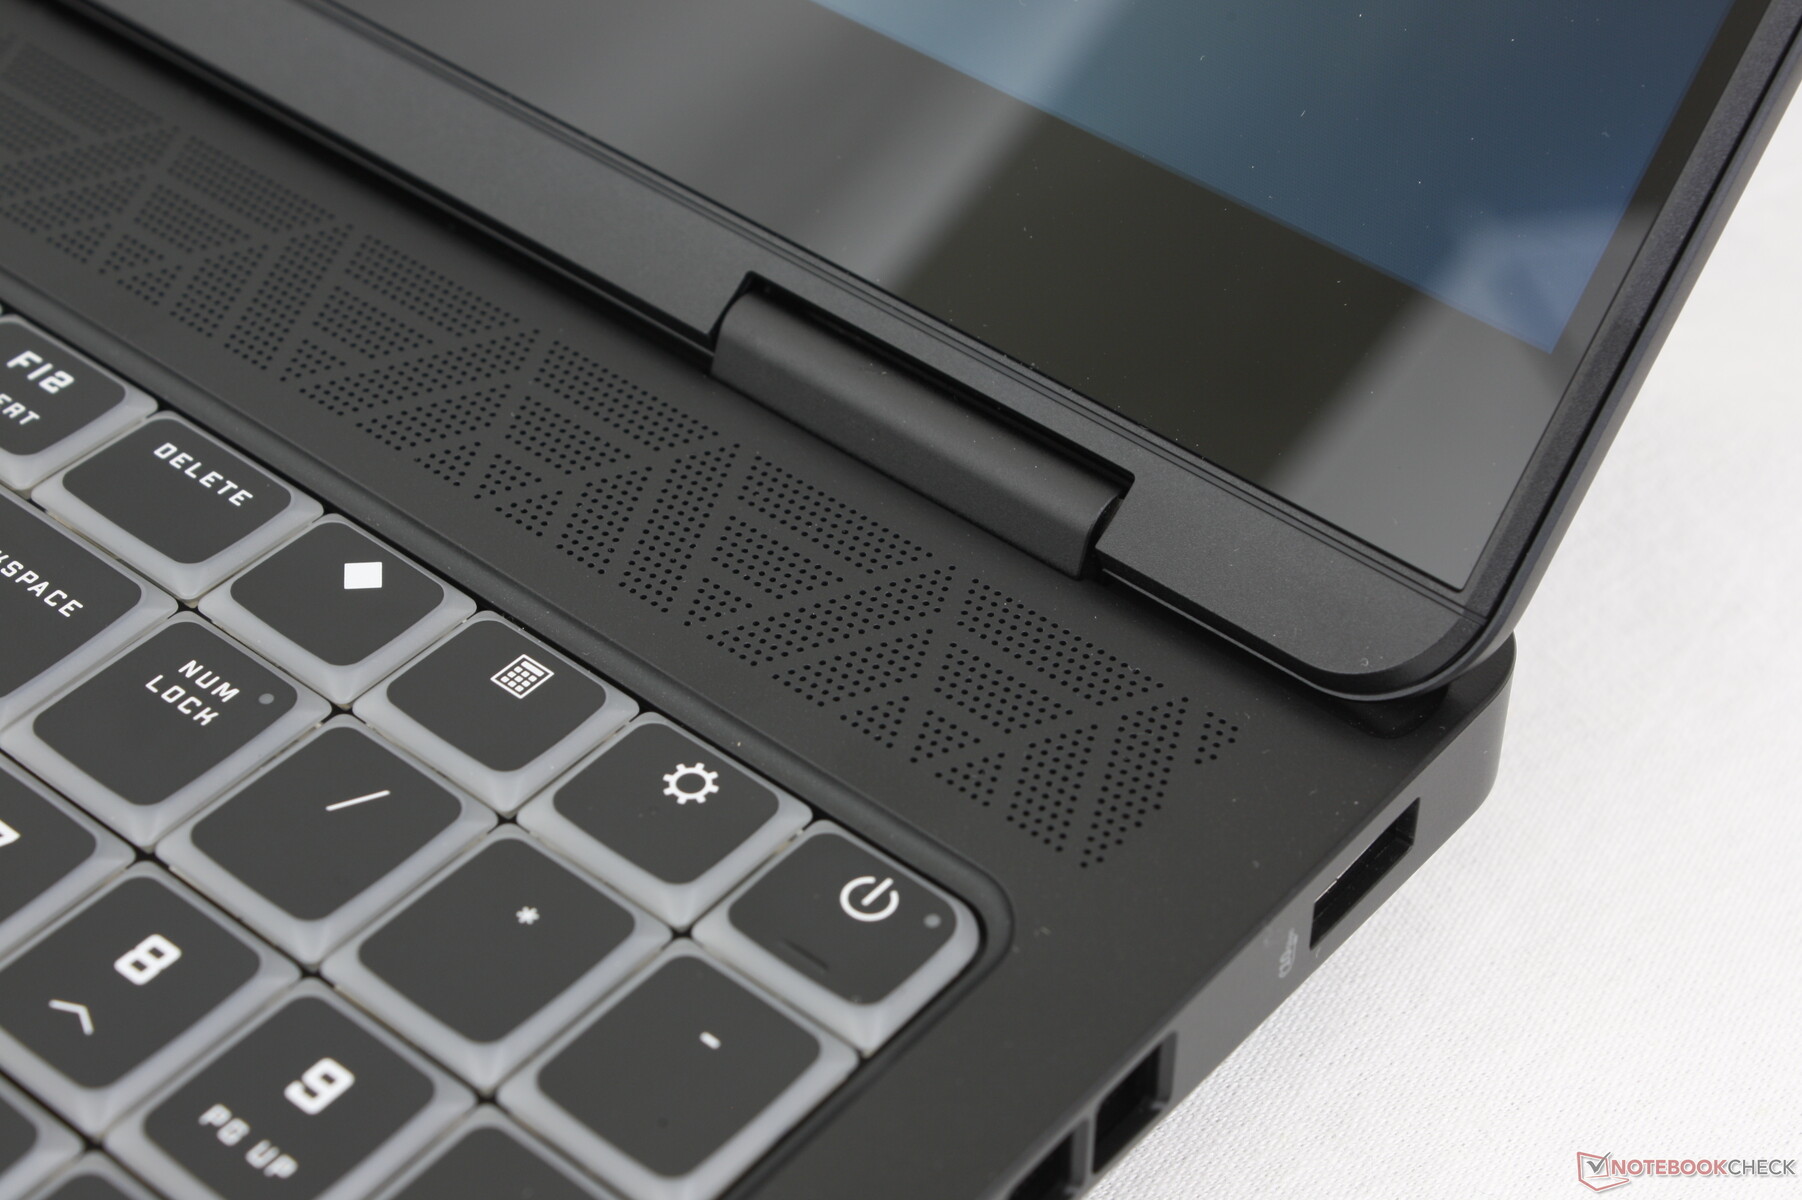
Périphériques d'entrée - Familiers et plus lumineux
Clavier
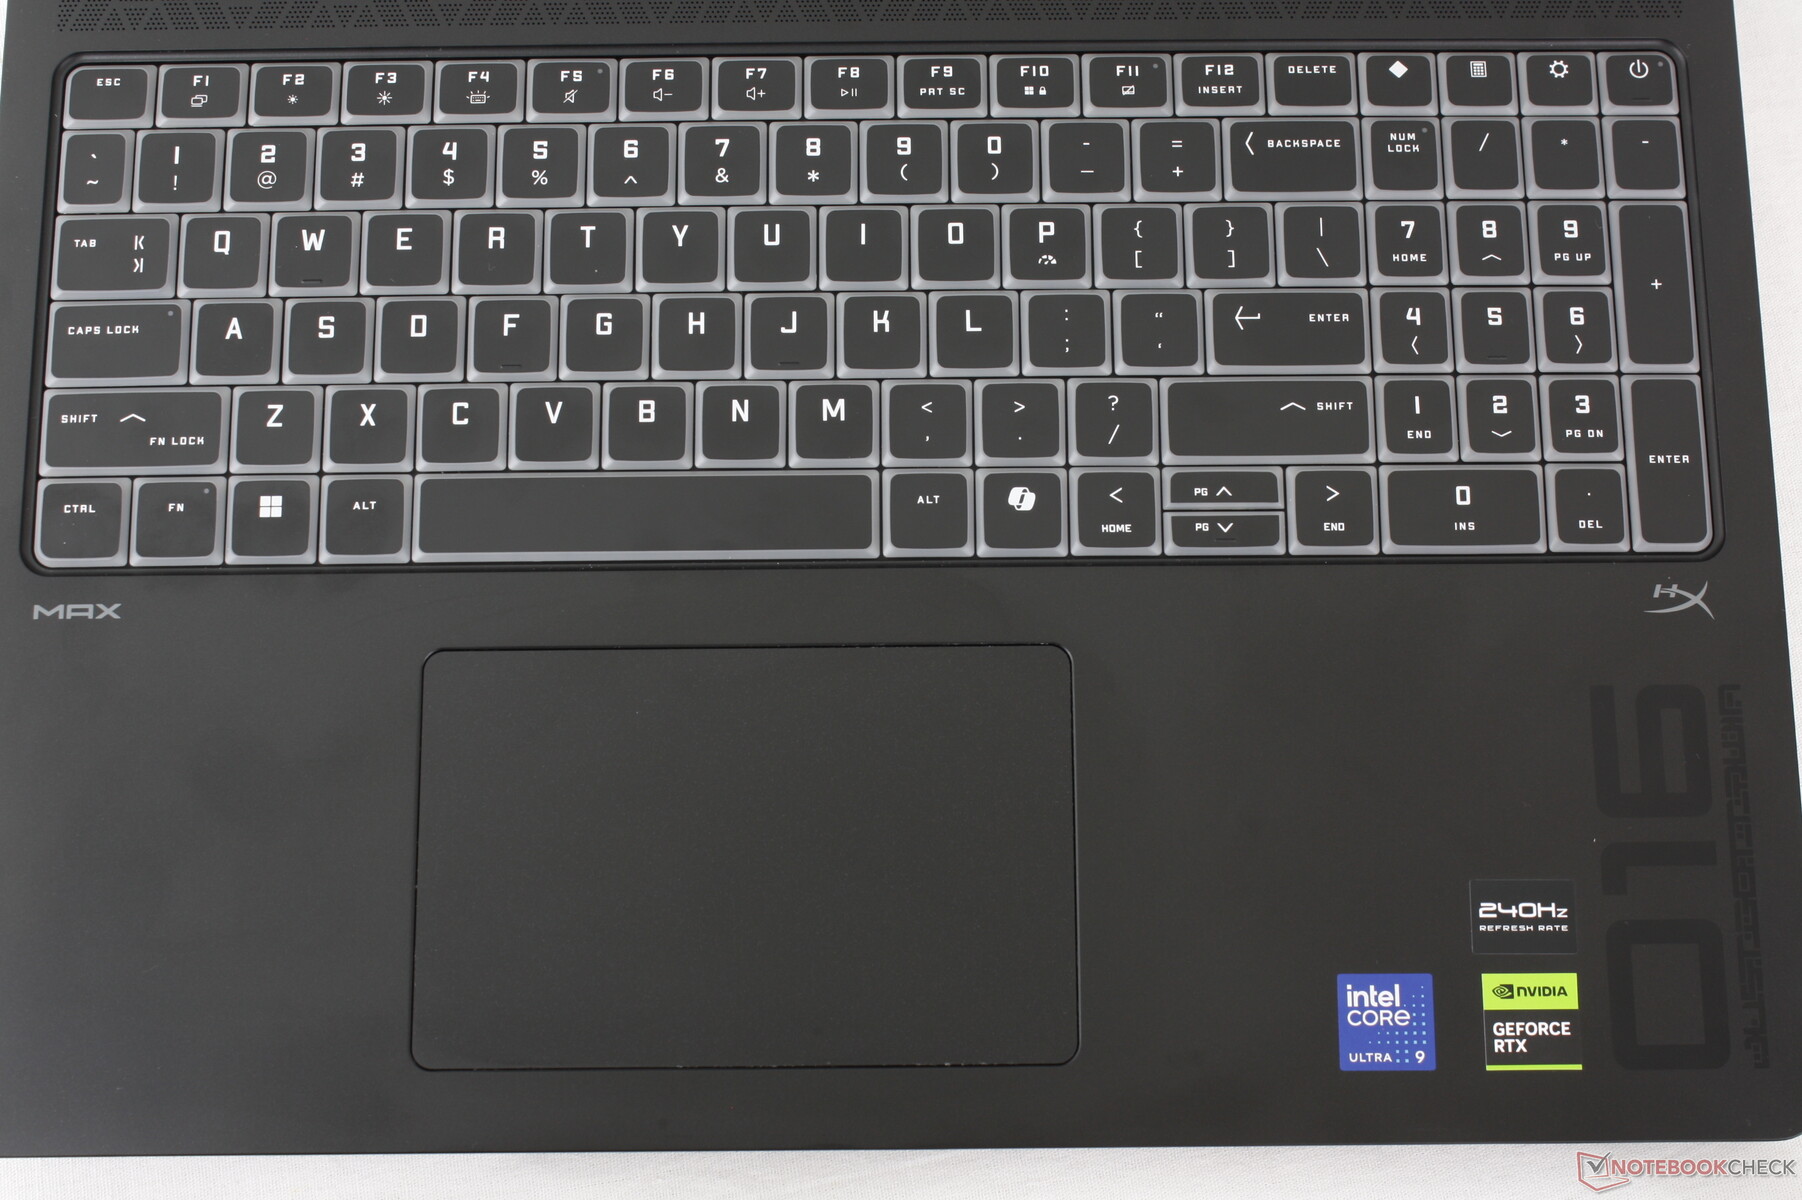
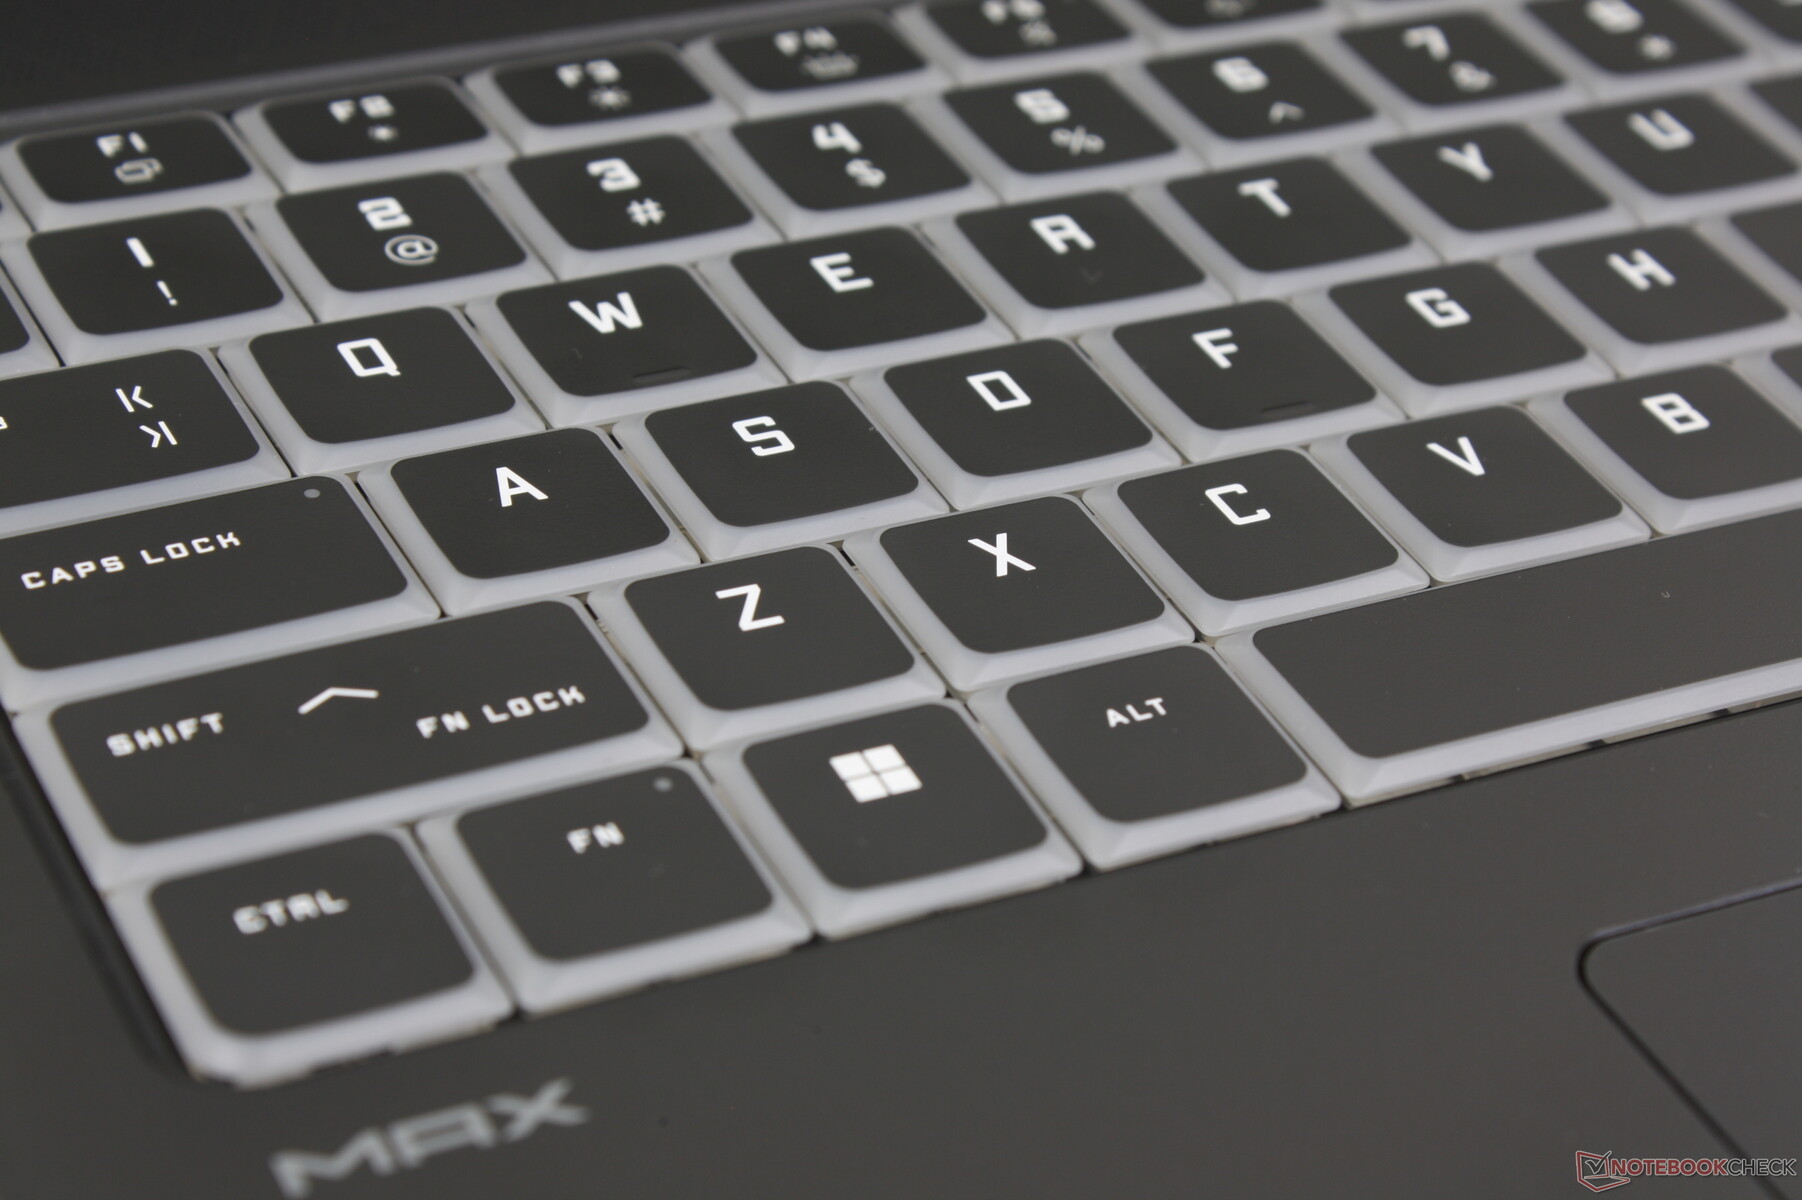
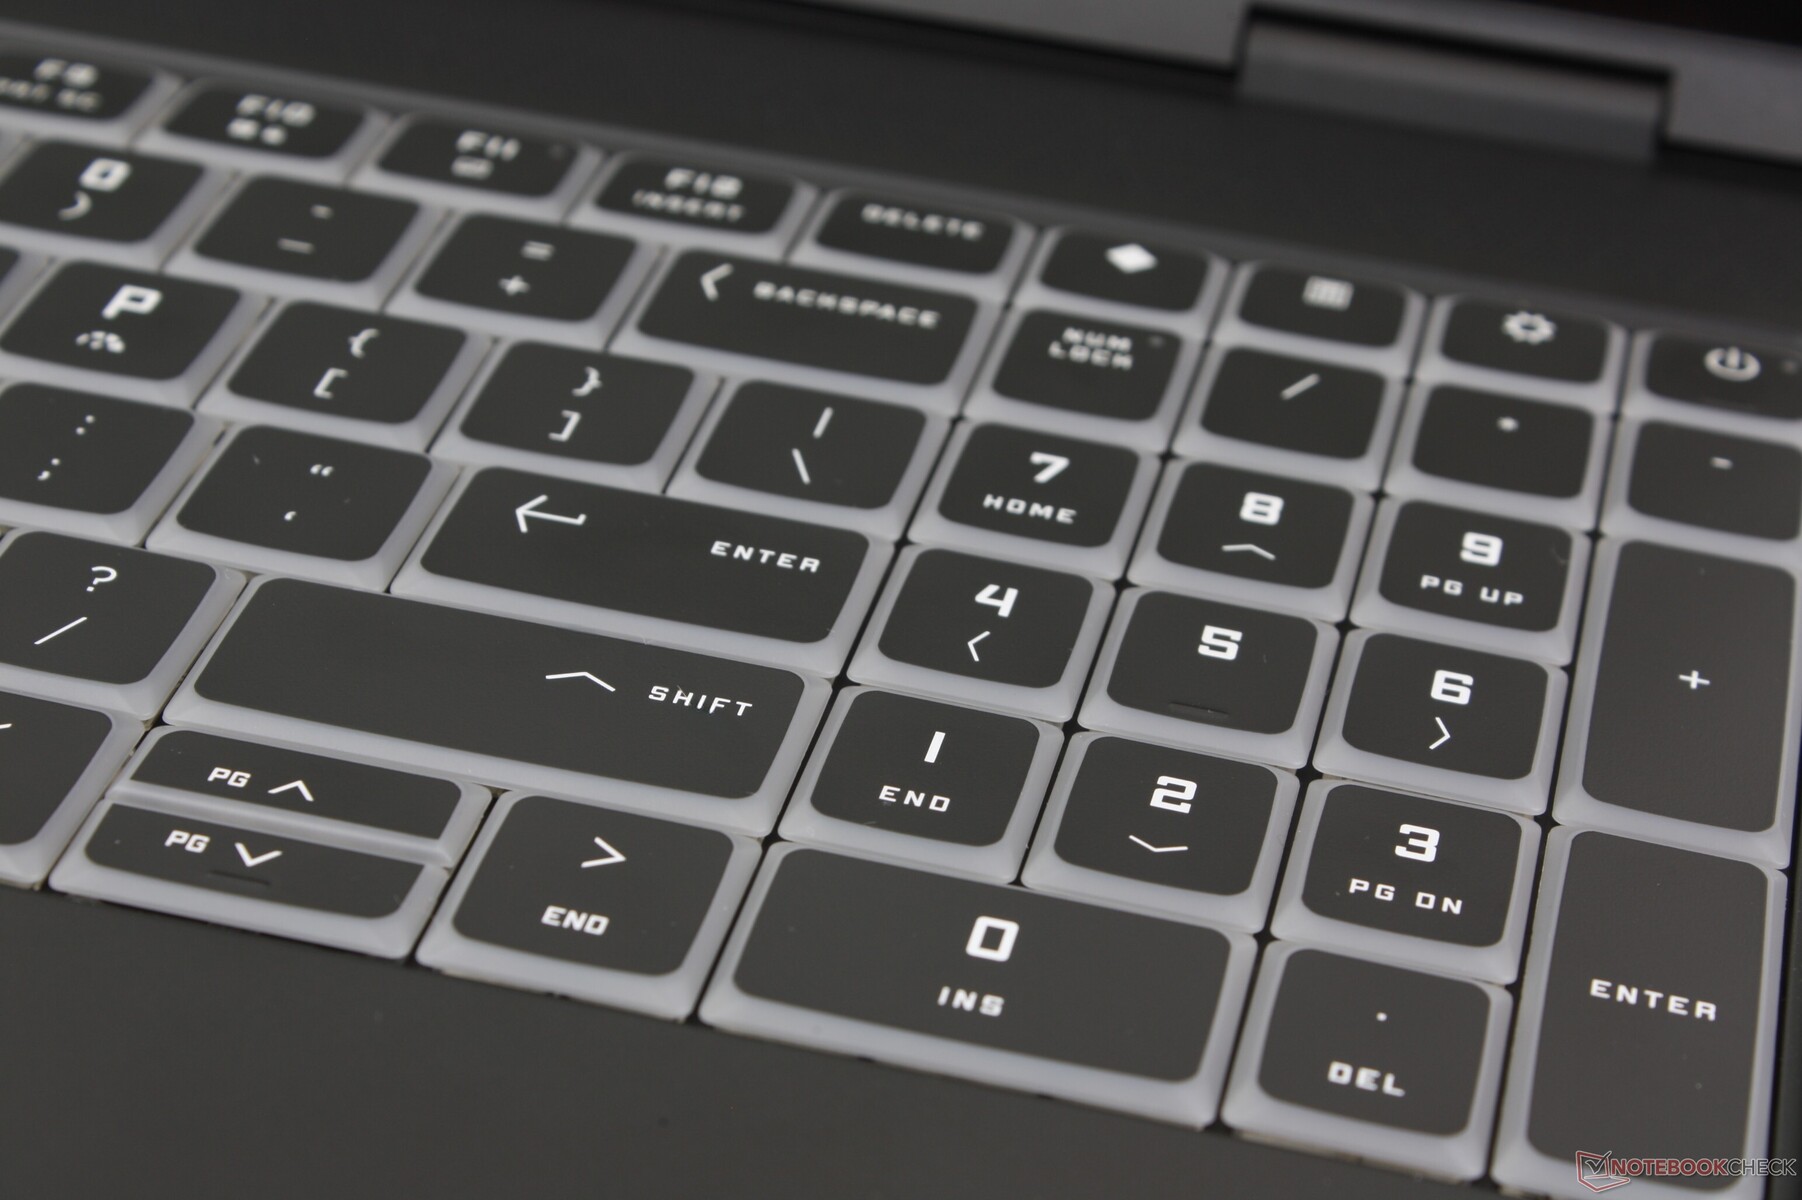
HP a modifié le clavier pour qu'il ressemble davantage au clavier "zero lattice" du récent Omen Transcend 14. Le rétroéclairage RGB est plus vivant, tandis que l'expérience de frappe reste décente, bien que moins profonde et avec un feedback plus léger que sur le Legion Pro 7i 16 G10. Les touches fléchées sont malheureusement plus petites cette fois-ci, tandis qu'un véritable pavé numérique remplace les touches PgUp, PgDn, Home et End du modèle 2024.
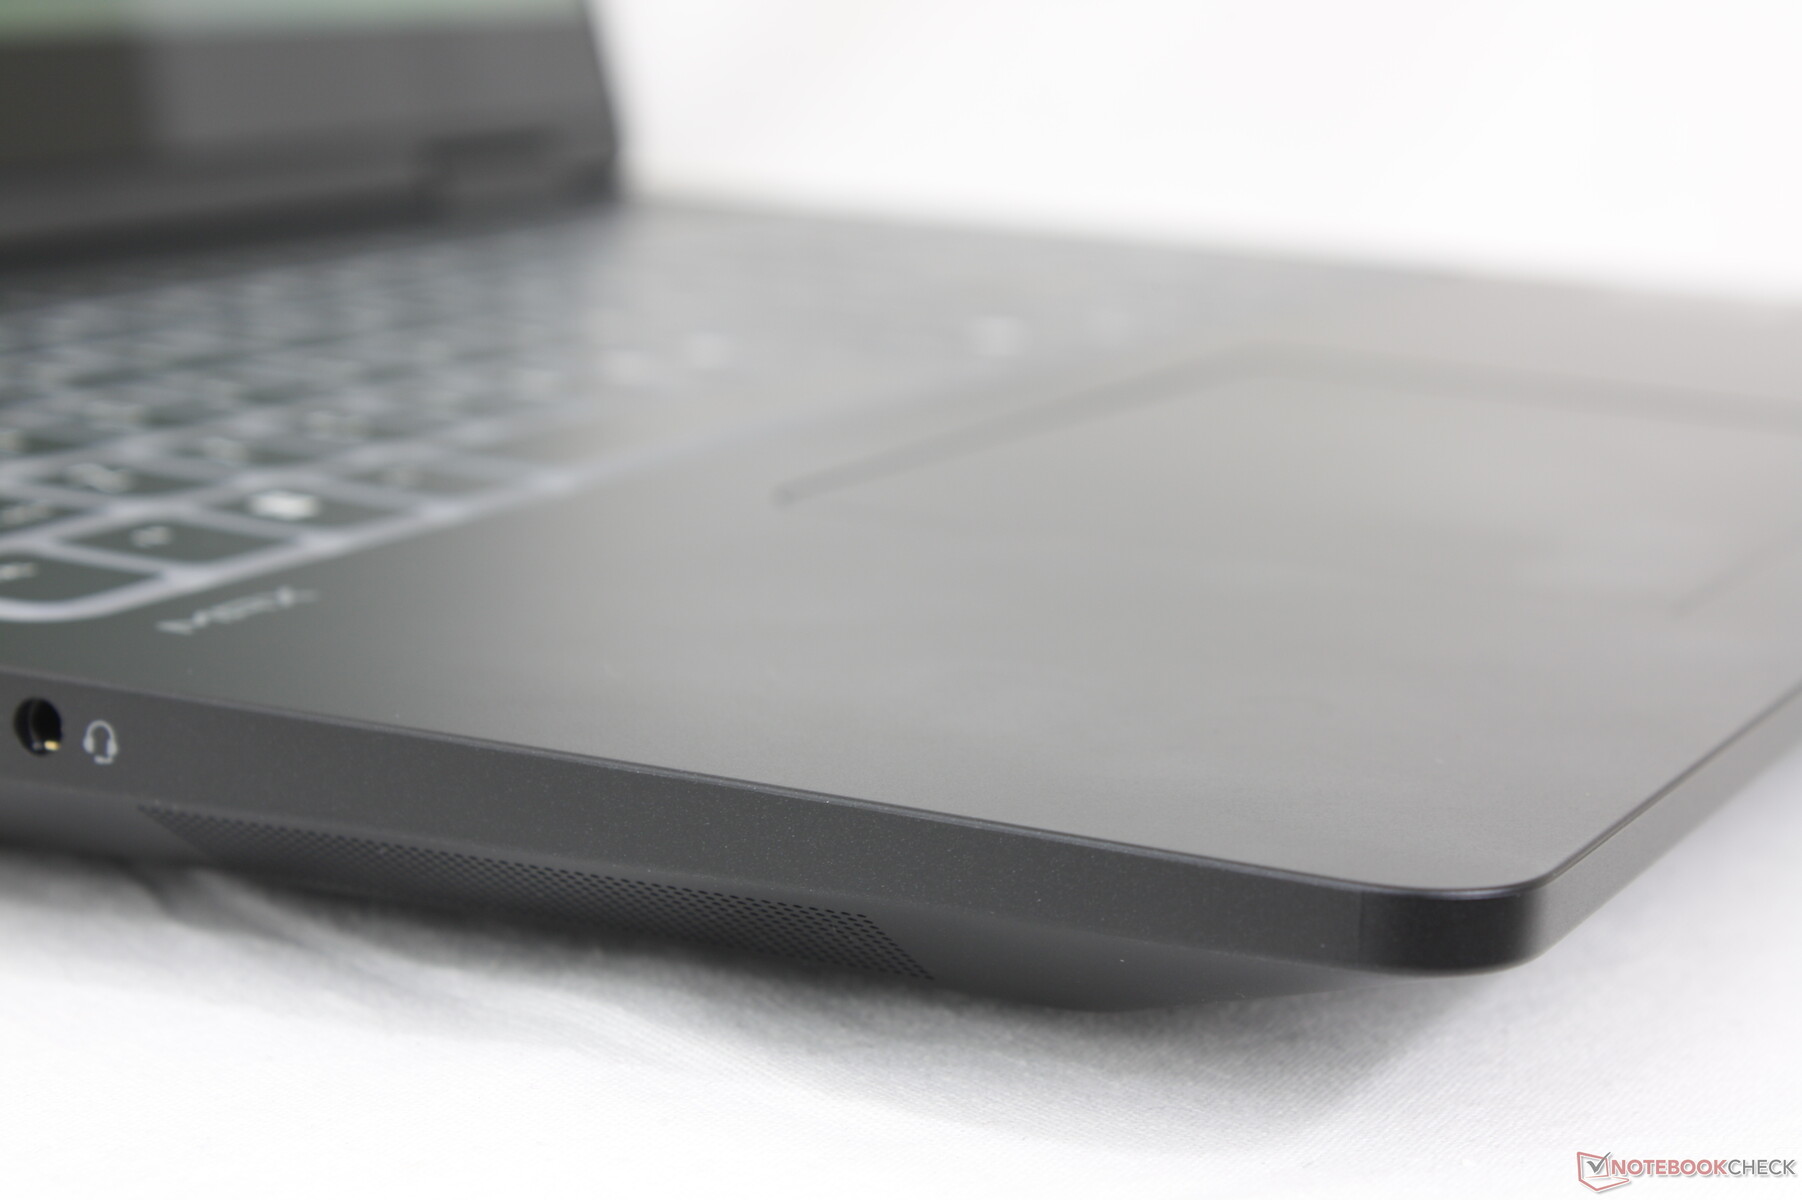
Pavé tactile
La taille du clavier reste la même que sur l'Omen 16 2024, à savoir 12,5 x 8 cm. Les modèles concurrents comme le Blade 16 ou le Zephyrus G16 ont des pavés numériques plus spacieux, mais les clics sur l'Omen Max 16 ne sont pas aussi spongieux, ce qui constitue un compromis équitable.

Affichage - OLED 240 Hz avec G-Sync
Le panneau OLED ATNA60DL02-0 de Samsung est très similaire à celui du récent Zephyrus G14, jusqu'au taux de rafraîchissement de 240 Hz, à la prise en charge des couleurs P3, aux niveaux de luminosité et même au comportement de la modulation de la largeur d'impulsion. Il remplit toutes les conditions pour être adapté à la plupart des jeux et à l'édition de contenu.
G-Sync et HDR500 sont pris en charge alors que Windows VRR ne l'est pas. Nous avons pu mesurer une luminosité maximale de 594 nits avec le HDR activé ou de 391 nits en mode SDR.


| |||||||||||||||||||||||||
Homogénéité de la luminosité: 96 %
Valeur mesurée au centre, sur batterie: 376.5 cd/m²
Contraste: ∞:1 (Valeurs des noirs: 0 cd/m²)
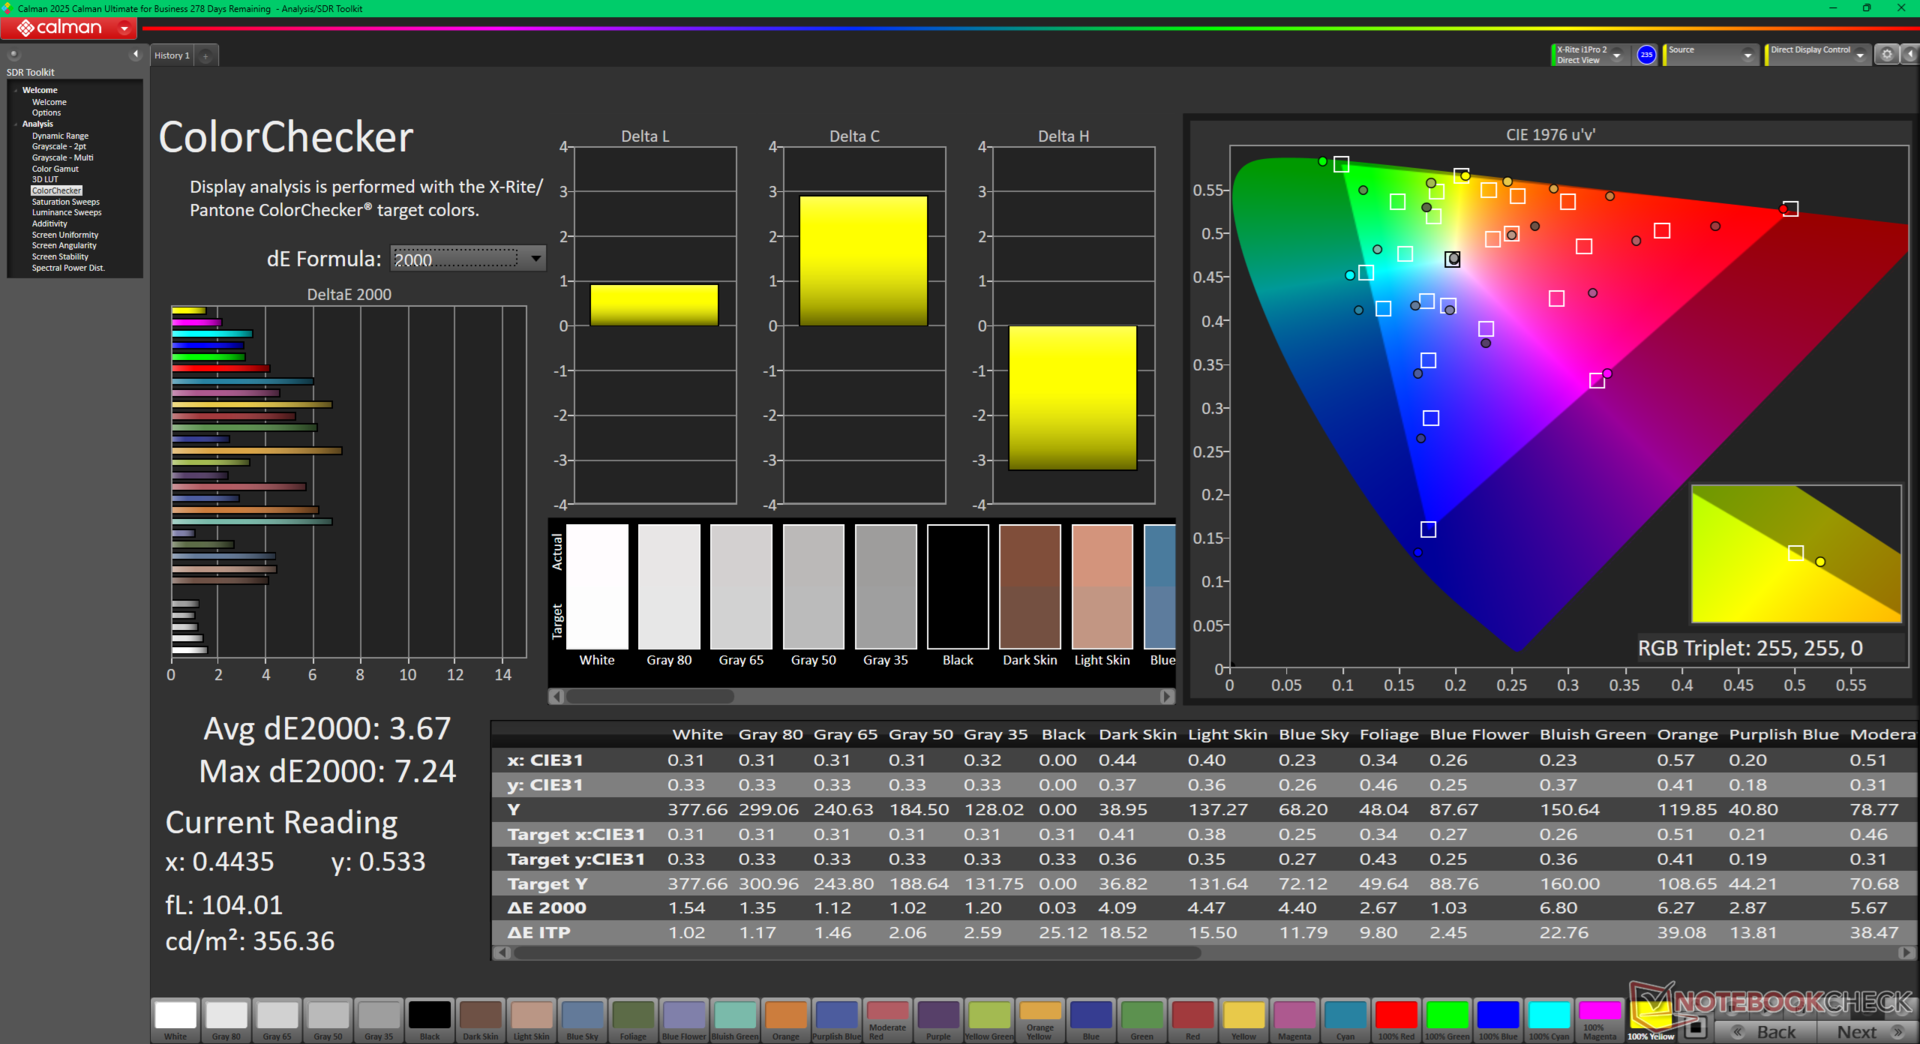
ΔE ColorChecker Calman: 3.67 | ∀{0.5-29.43 Ø4.71}
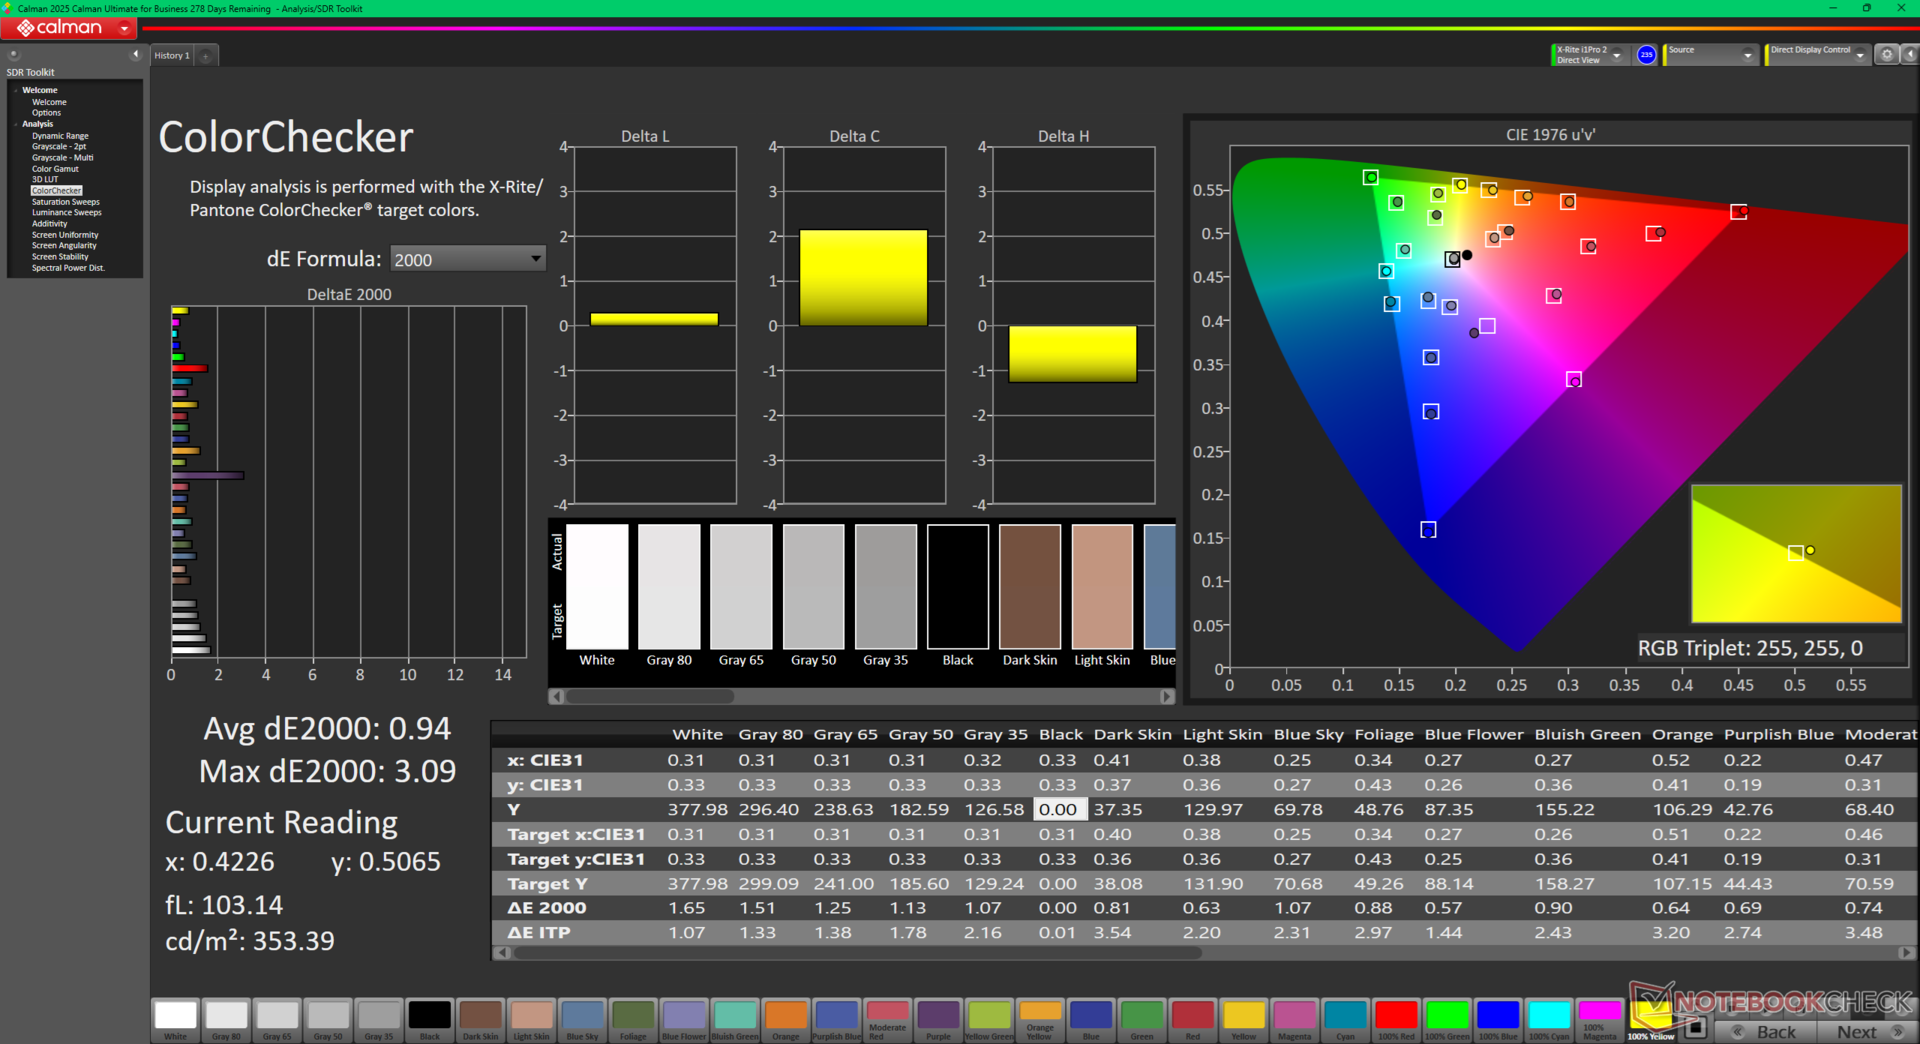
calibrated: 0.94
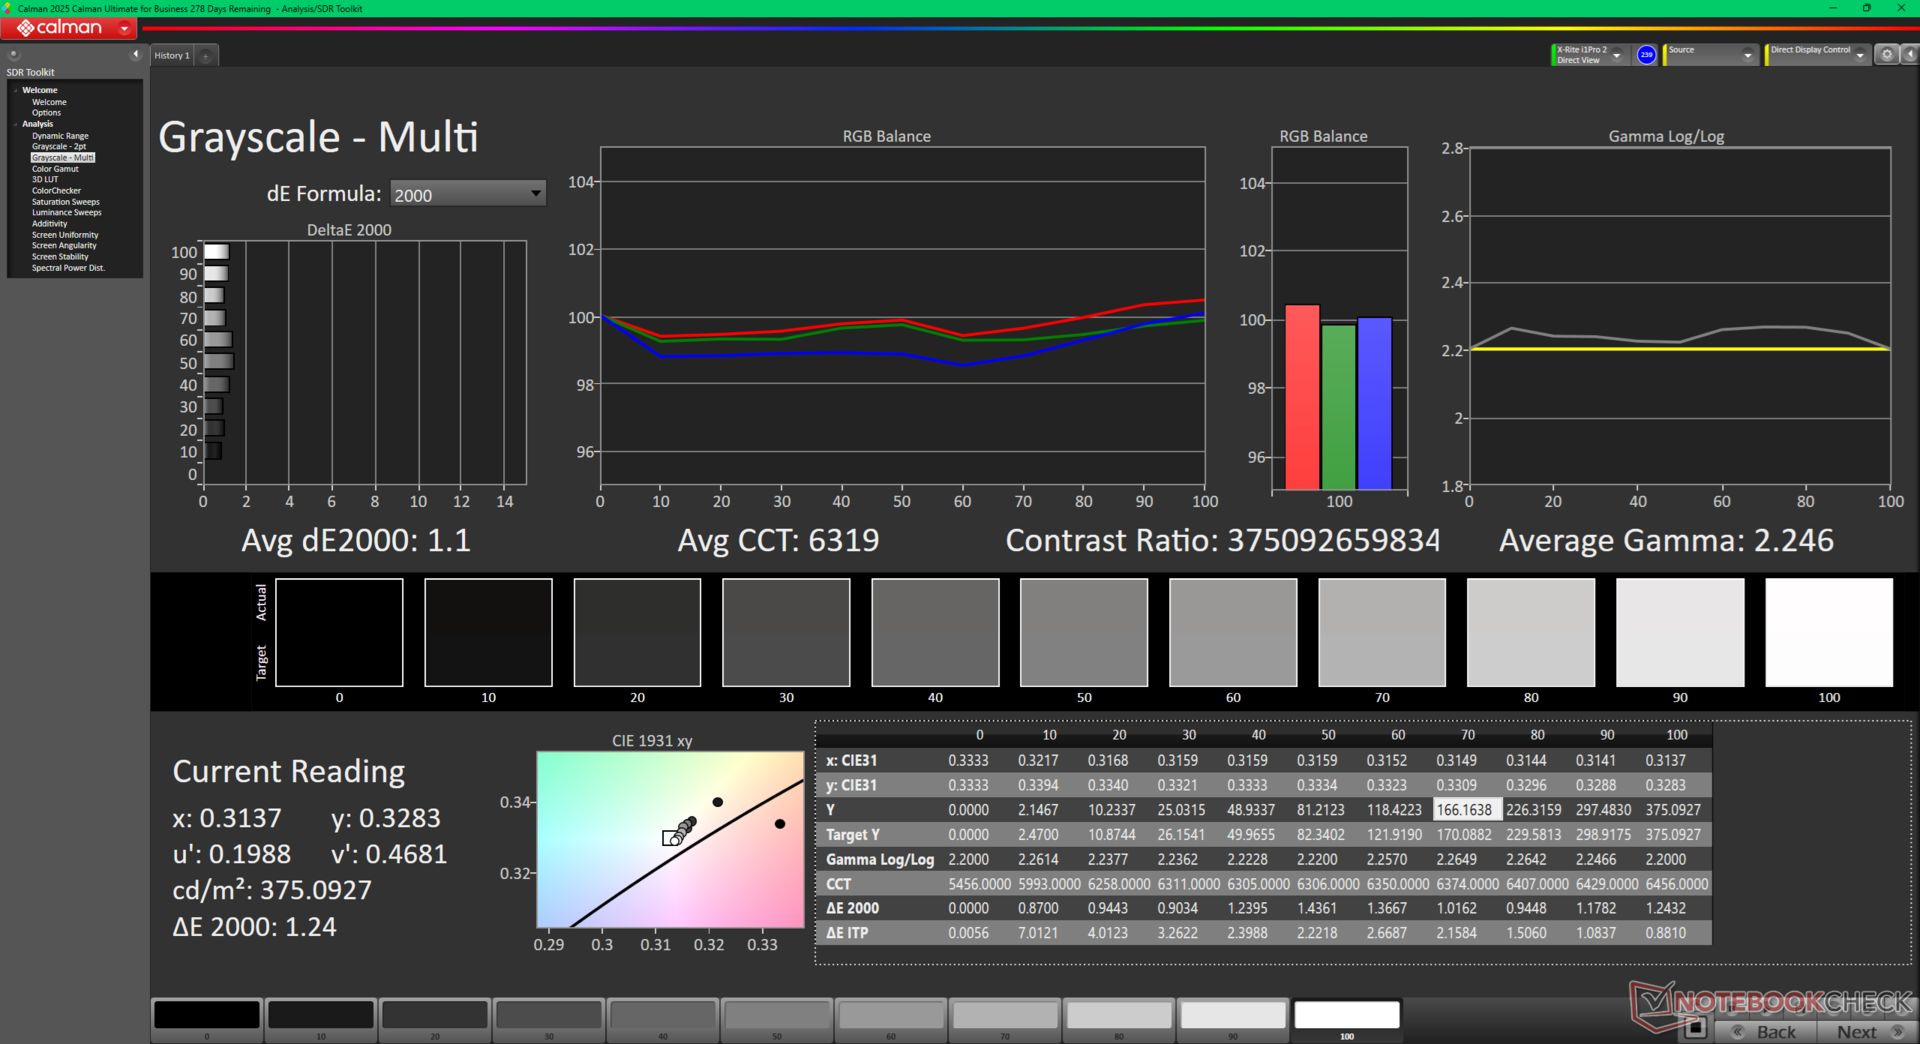
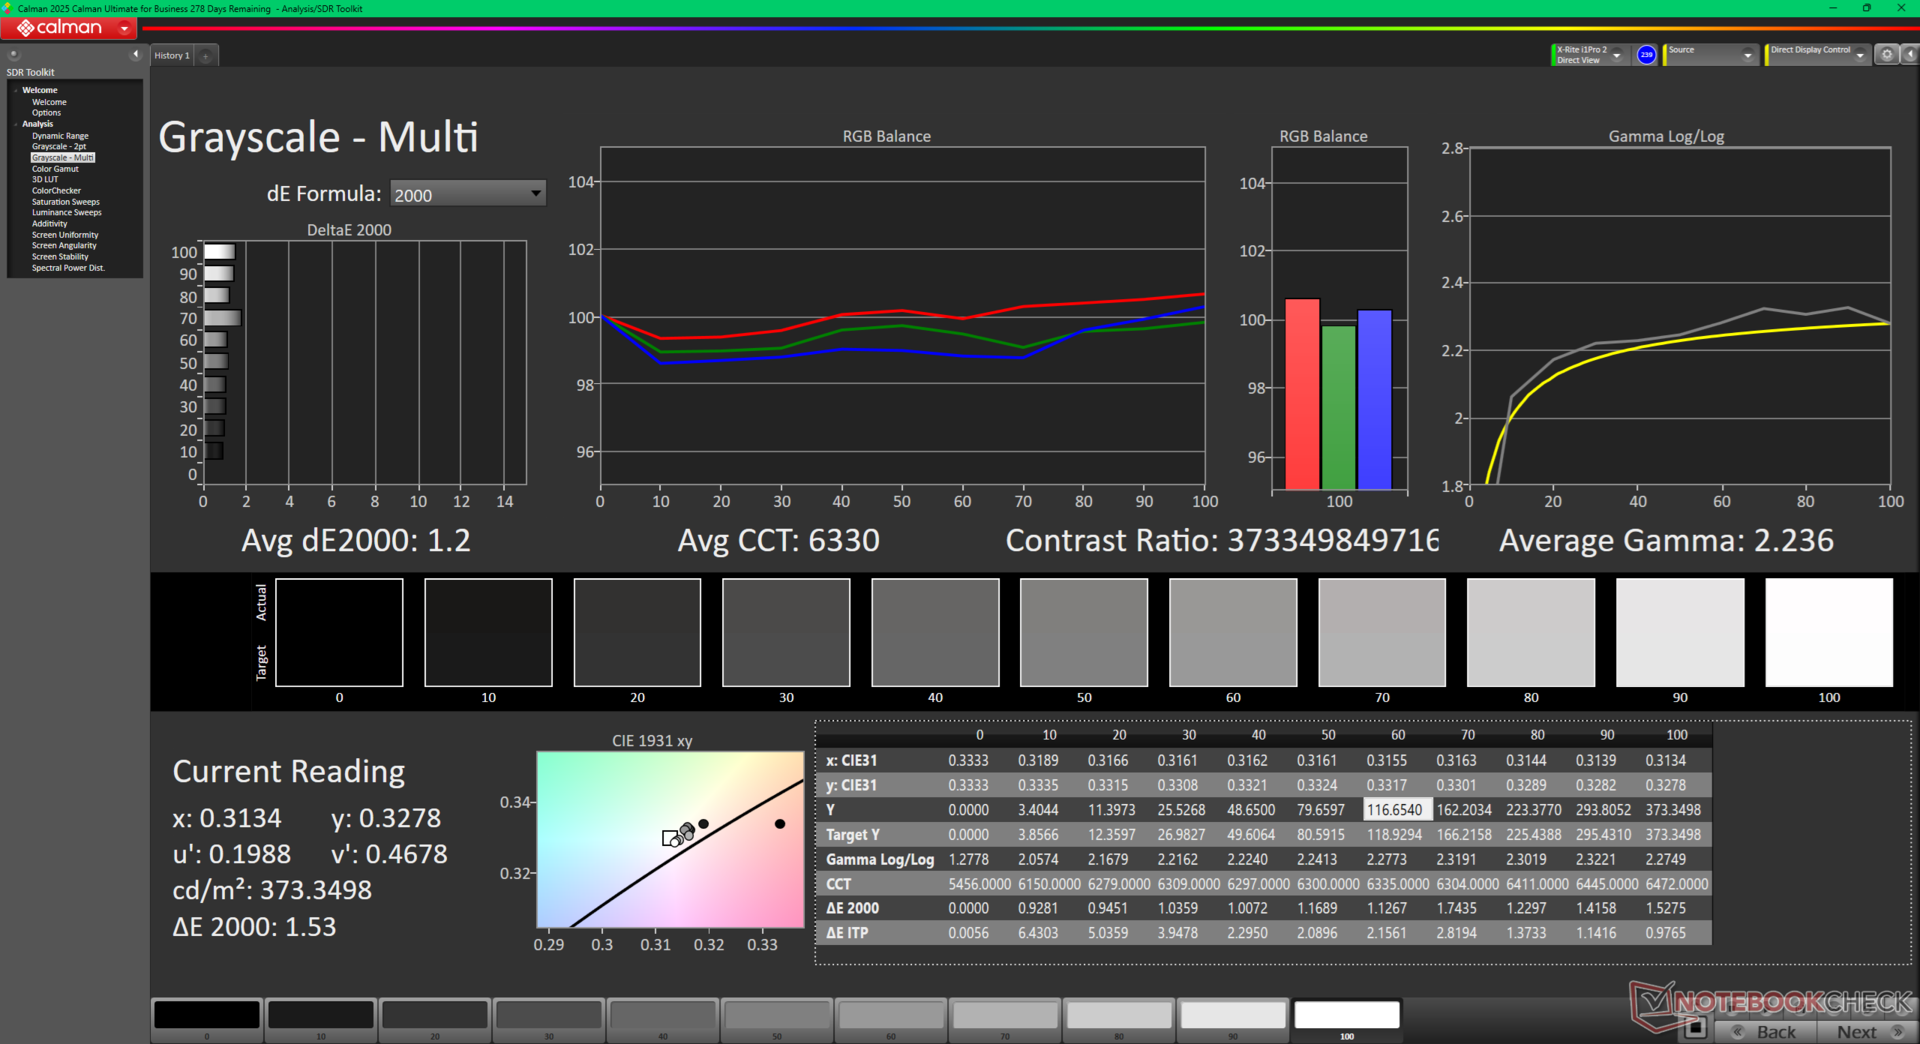
ΔE Greyscale Calman: 1.1 | ∀{0.09-98 Ø4.96}
98.2% AdobeRGB 1998 (Argyll 3D)
100% sRGB (Argyll 3D)
99.7% Display P3 (Argyll 3D)
Gamma: 2.25
CCT: 6319 K
| HP Omen Max 16 ah000 Samsung ATNA60DL02-0, OLED, 2560x1600, 16", 240 Hz | HP Omen 16 (2024) BOE BOE0B7D, IPS, 2560x1440, 16.1", 240 Hz | Asus ROG Zephyrus G16 GA605WV ATNA60DL04-0, OLED, 2560x1600, 16", 240 Hz | Razer Blade 16 2025 RTX 5090 ATNA60DL04-0, OLED, 2560x1600, 16", 240 Hz | MSI Vector 16 HX A14V Chi Mei N160GME-GTB, IPS, 2560x1600, 16", 240 Hz | Lenovo Legion 9 16IRX9, RTX 4090 CSOT T3 MNG007ZA2-2, MiniLED, 3200x2000, 16", 165 Hz | |
|---|---|---|---|---|---|---|
| Display | -20% | -0% | -6% | -6% | -5% | |
| Display P3 Coverage (%) | 99.7 | 68.6 -31% | 99.9 0% | 96.1 -4% | 95.4 -4% | 95.3 -4% |
| sRGB Coverage (%) | 100 | 98.6 -1% | 100 0% | 99.9 0% | 99.7 0% | 99.9 0% |
| AdobeRGB 1998 Coverage (%) | 98.2 | 70.6 -28% | 96.9 -1% | 85 -13% | 85.4 -13% | 86.6 -12% |
| Response Times | -3321% | -2% | 12% | -2096% | -2066% | |
| Response Time Grey 50% / Grey 80% * (ms) | 0.29 ? | 14.1 ? -4762% | 0.22 ? 24% | 0.2 ? 31% | 5.7 ? -1866% | 12.6 ? -4245% |
| Response Time Black / White * (ms) | 0.47 ? | 9.3 ? -1879% | 0.25 ? 47% | 0.25 ? 47% | 11.4 ? -2326% | 10 ? -2028% |
| PWM Frequency (Hz) | 960 ? | 960 | 960 ? | 5430 | ||
| PWM Amplitude * (%) | 31 | 55 -77% | 44 -42% | 8 74% | ||
| Screen | -21% | 0% | 11% | -30% | -22% | |
| Brightness middle (cd/m²) | 376.5 | 292 -22% | 416 10% | 391 4% | 557.2 48% | 631 68% |
| Brightness (cd/m²) | 382 | 291 -24% | 418 9% | 393 3% | 506 32% | 664 74% |
| Brightness Distribution (%) | 96 | 85 -11% | 96 0% | 98 2% | 83 -14% | 91 -5% |
| Black Level * (cd/m²) | 0.24 | 0.41 | 0.03 | |||
| Colorchecker dE 2000 * | 3.67 | 2.36 36% | 1.6 56% | 1.2 67% | 2.91 21% | 2.68 27% |
| Colorchecker dE 2000 max. * | 7.24 | 4.08 44% | 2.1 71% | 3.2 56% | 5.94 18% | 6.41 11% |
| Colorchecker dE 2000 calibrated * | 0.94 | 0.93 1% | 1.63 -73% | 2.68 -185% | ||
| Greyscale dE 2000 * | 1.1 | 3 -173% | 2.7 -145% | 1.8 -64% | 3.8 -245% | 2.71 -146% |
| Gamma | 2.25 98% | 2.101 105% | 2.16 102% | 2.2 100% | 2.23 99% | 2.27 97% |
| CCT | 6319 103% | 5976 109% | 6331 103% | 6493 100% | 6408 101% | 6135 106% |
| Contrast (:1) | 1217 | 1359 | 21033 | |||
| Moyenne finale (programmes/paramètres) | -1121% /
-571% | -1% /
-1% | 6% /
7% | -711% /
-369% | -698% /
-490% |
* ... Moindre est la valeur, meilleures sont les performances
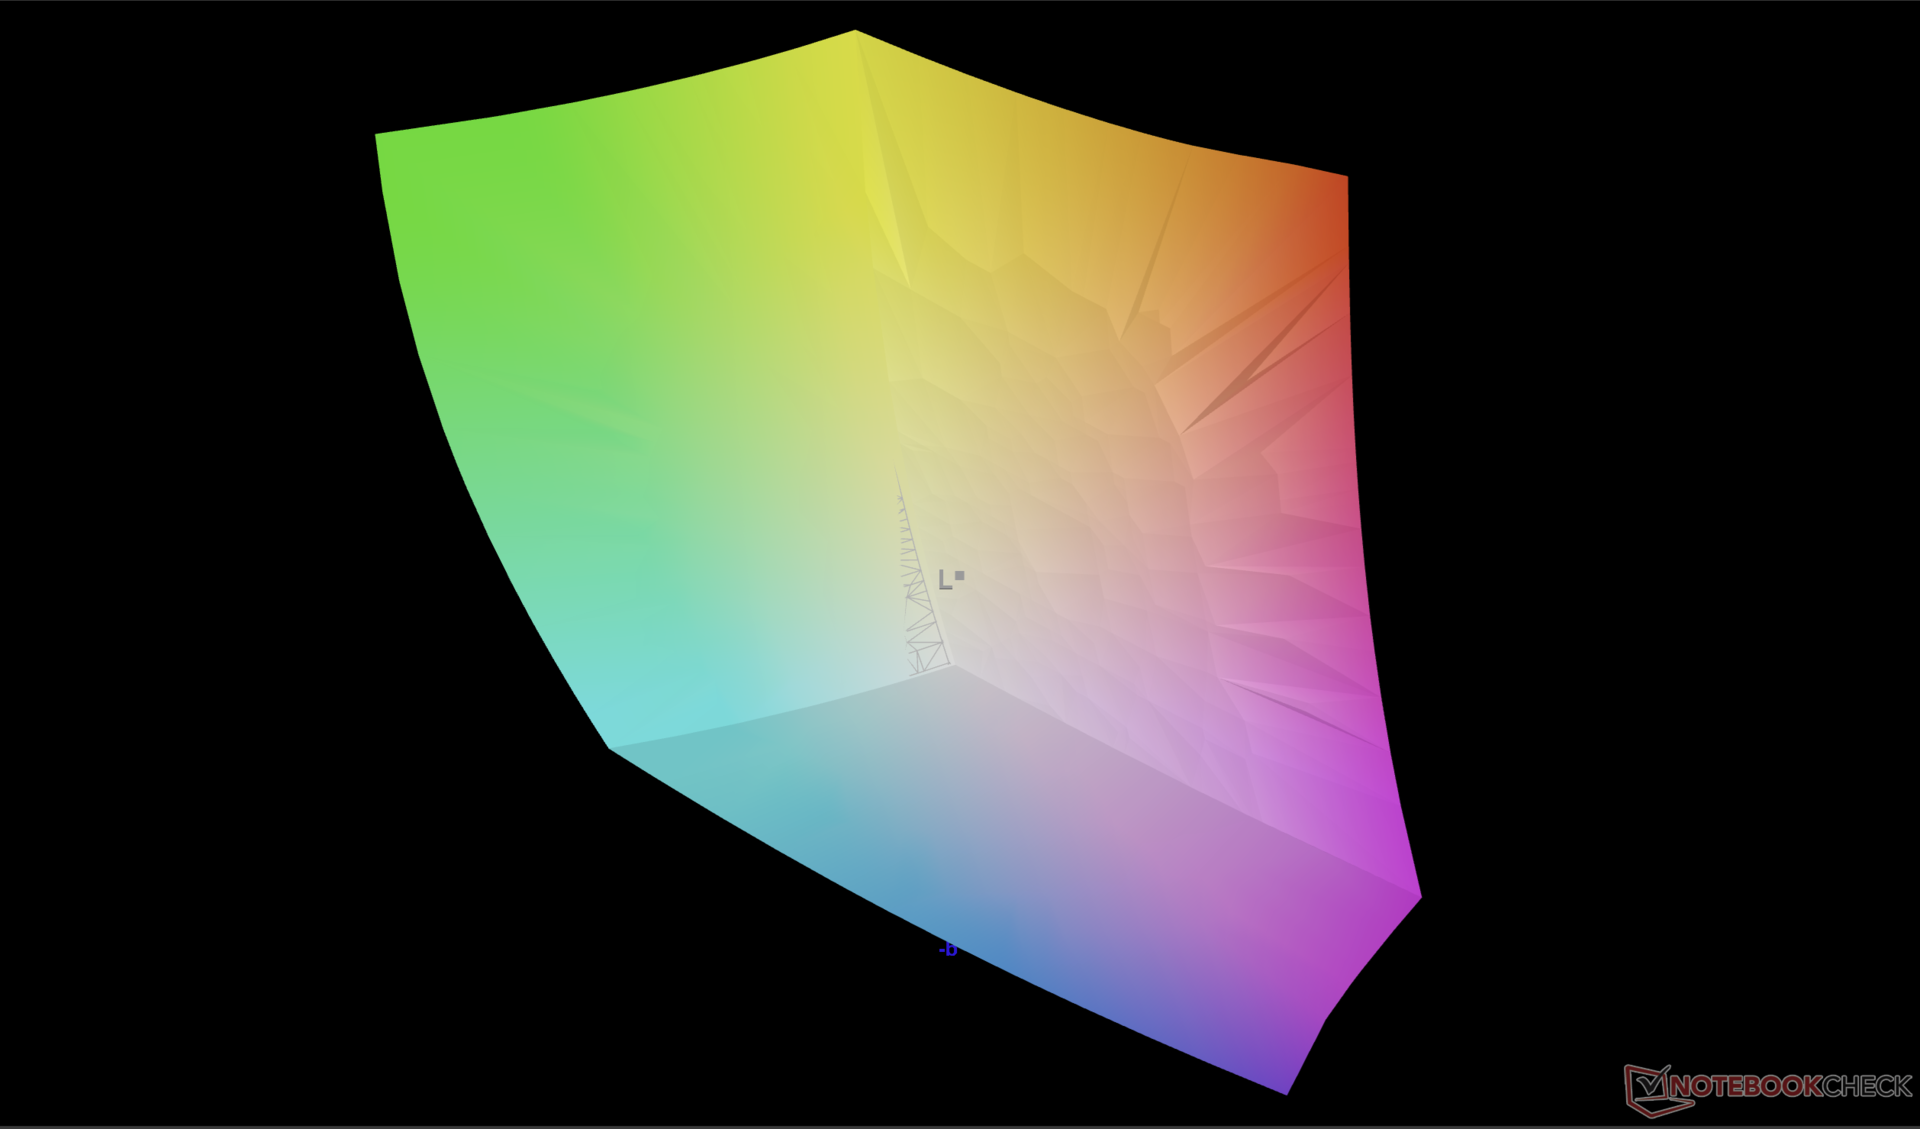
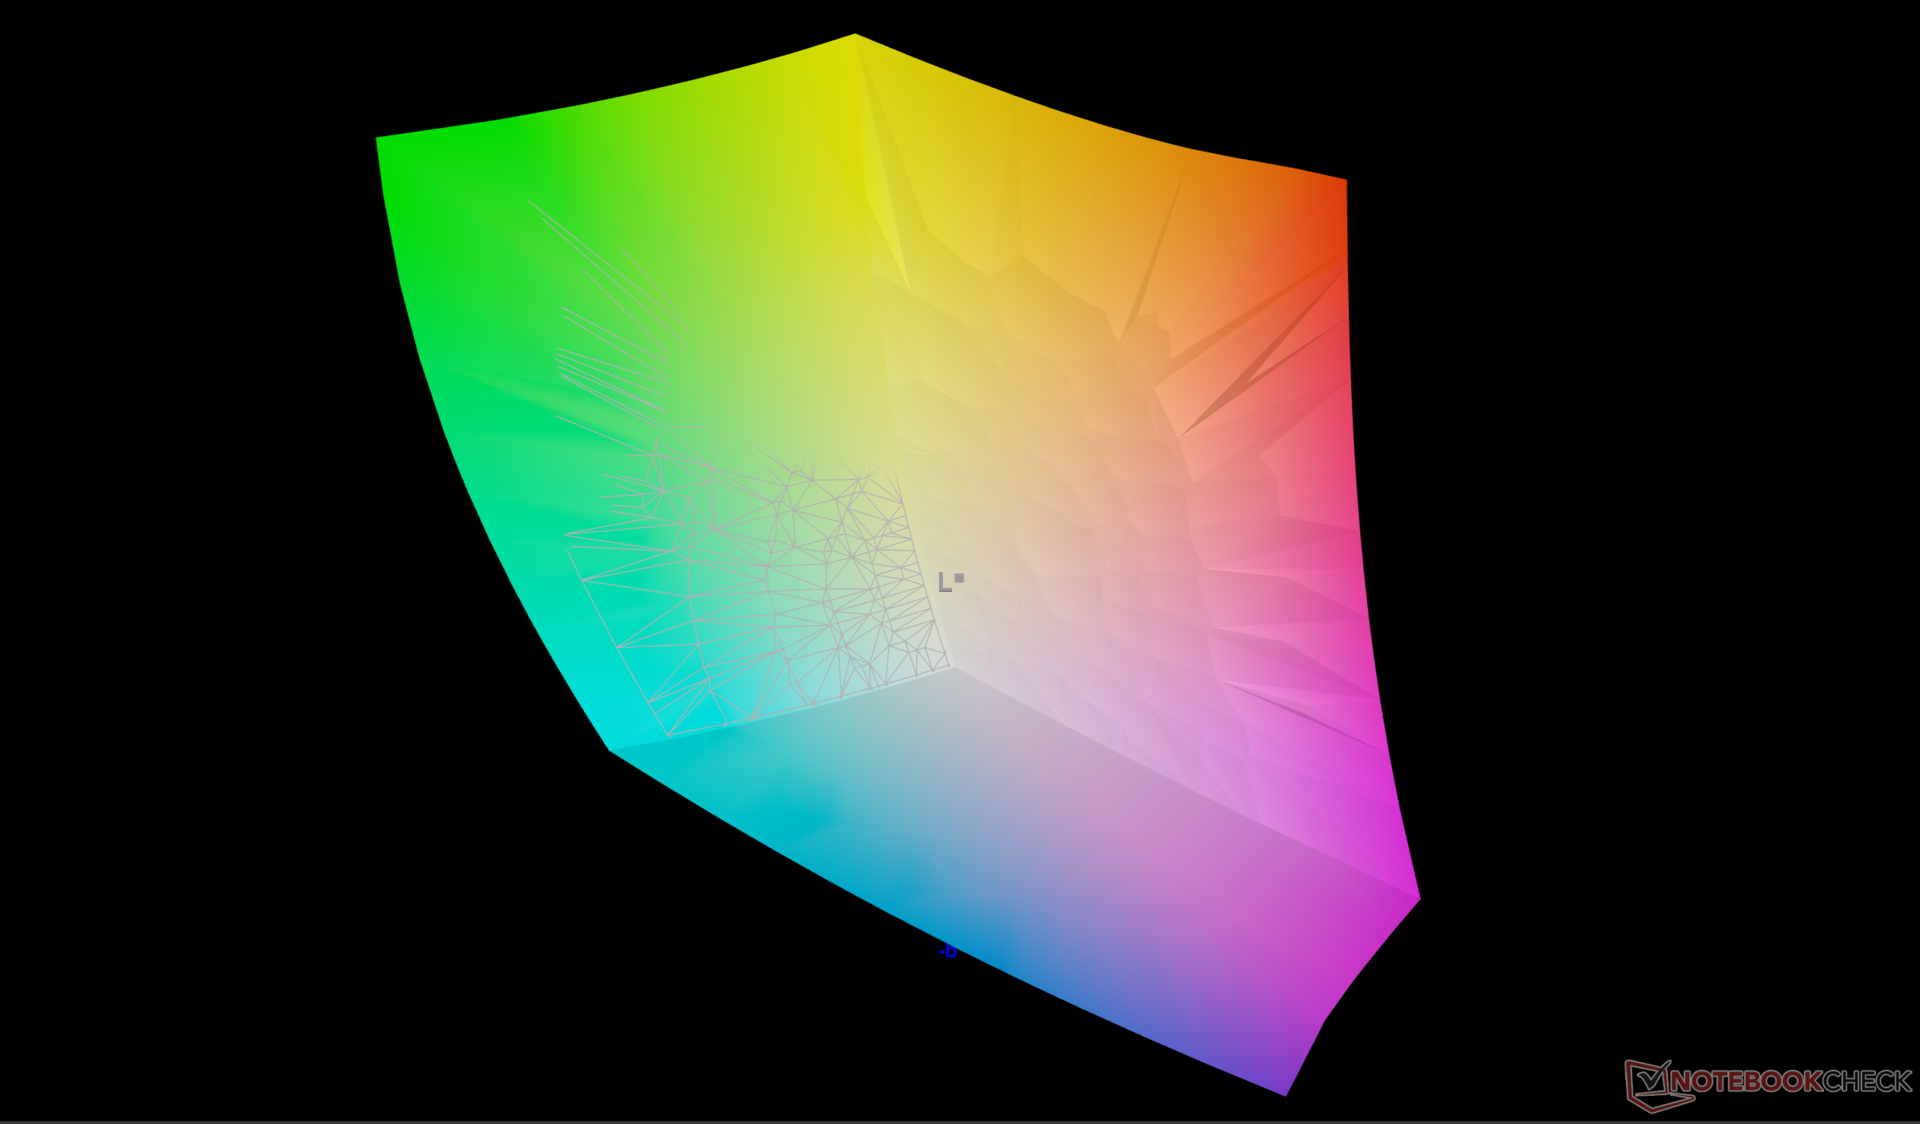
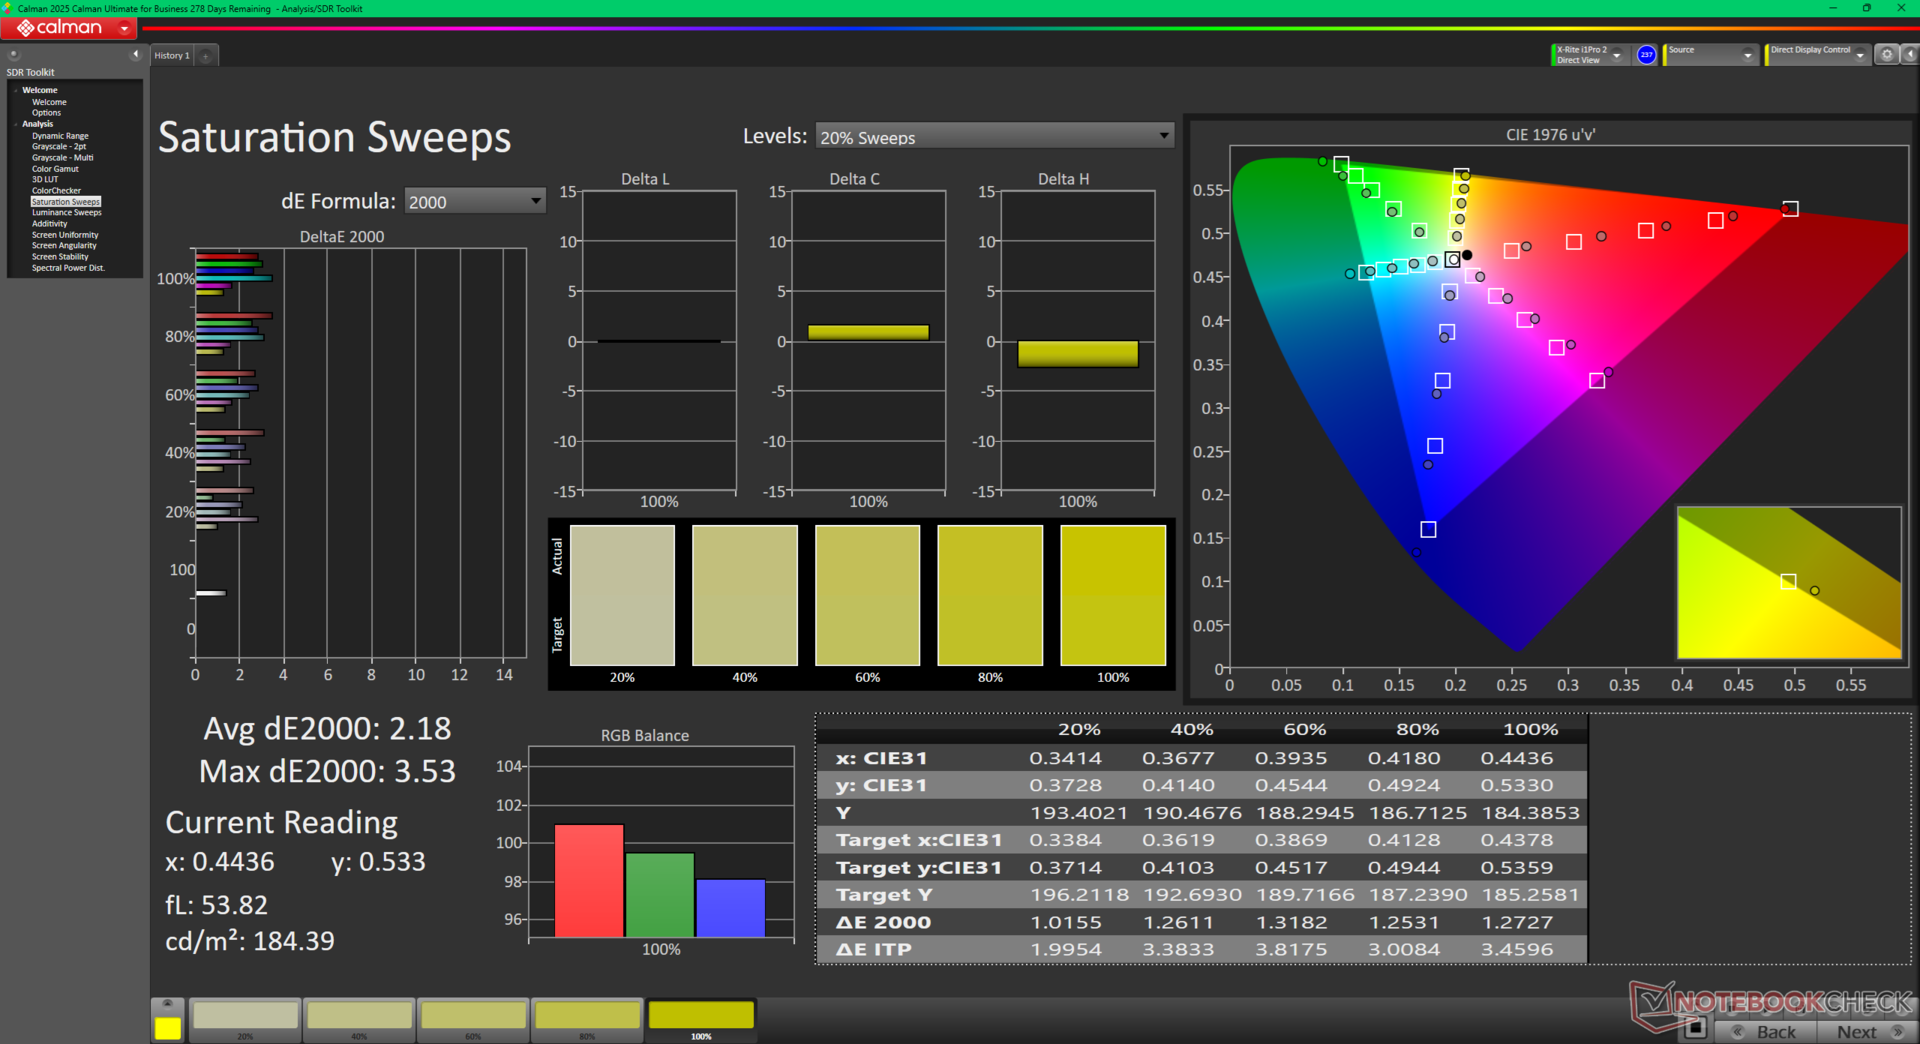
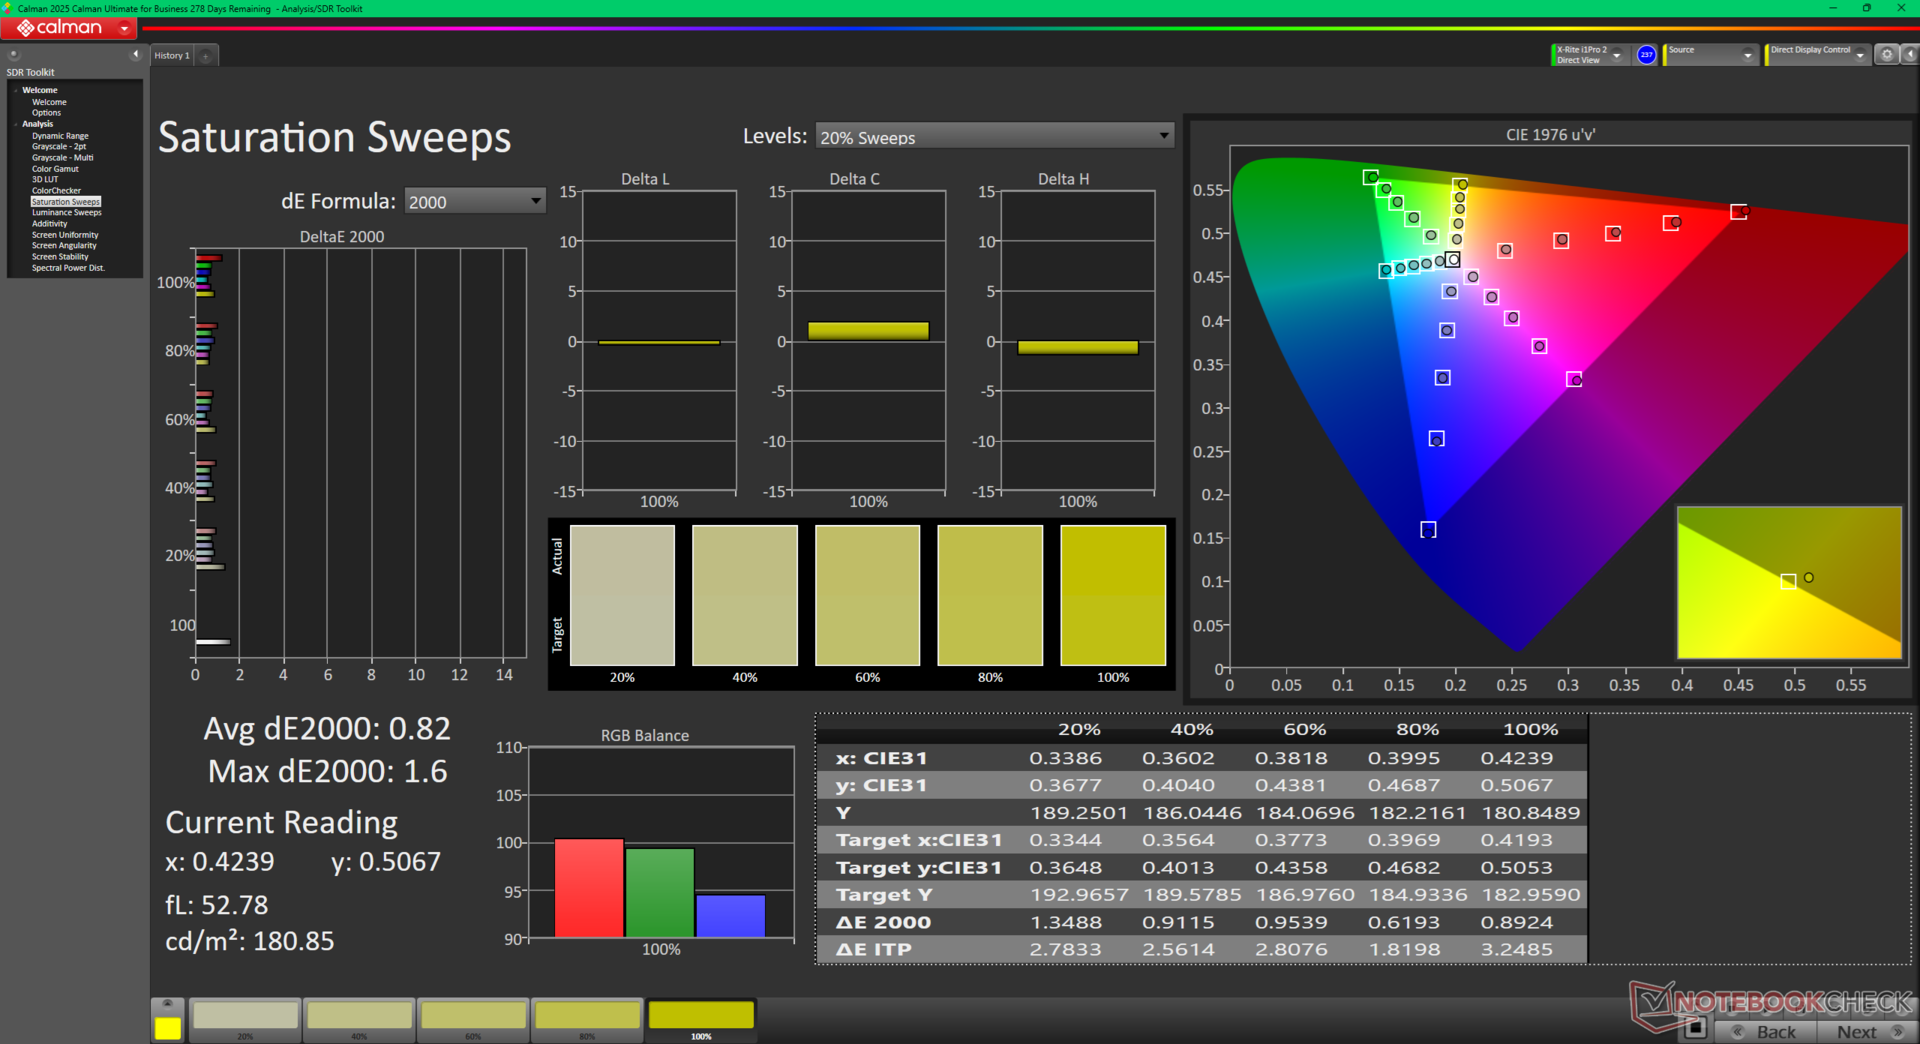
L'écran est assez bien calibré par rapport à la norme P3, comme c'est le cas pour la plupart des écrans OLED.
Temps de réponse de l'écran
| ↔ Temps de réponse noir à blanc | ||
|---|---|---|
| 0.47 ms ... hausse ↗ et chute ↘ combinées | ↗ 0.25 ms hausse | 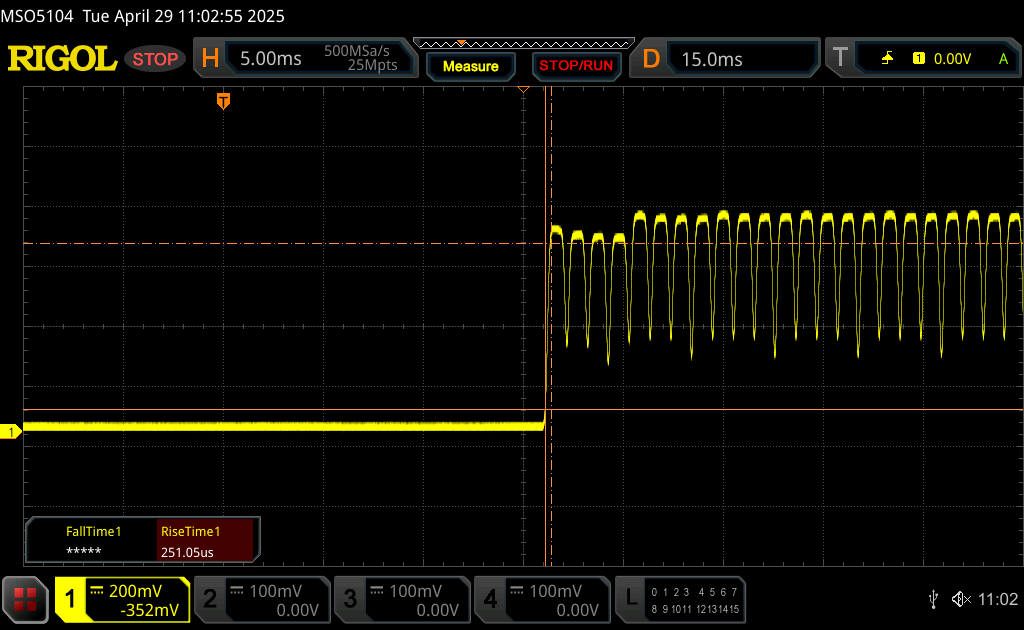 |
| ↘ 0.22 ms chute | ||
| L'écran montre de très faibles temps de réponse, parfait pour le jeu. En comparaison, tous les appareils testés affichent entre 0.1 (minimum) et 240 (maximum) ms. » 1 % des appareils testés affichent de meilleures performances. Cela signifie que les latences relevées sont meilleures que la moyenne (19.8 ms) de tous les appareils testés. | ||
| ↔ Temps de réponse gris 50% à gris 80% | ||
| 0.29 ms ... hausse ↗ et chute ↘ combinées | ↗ 0.15 ms hausse | 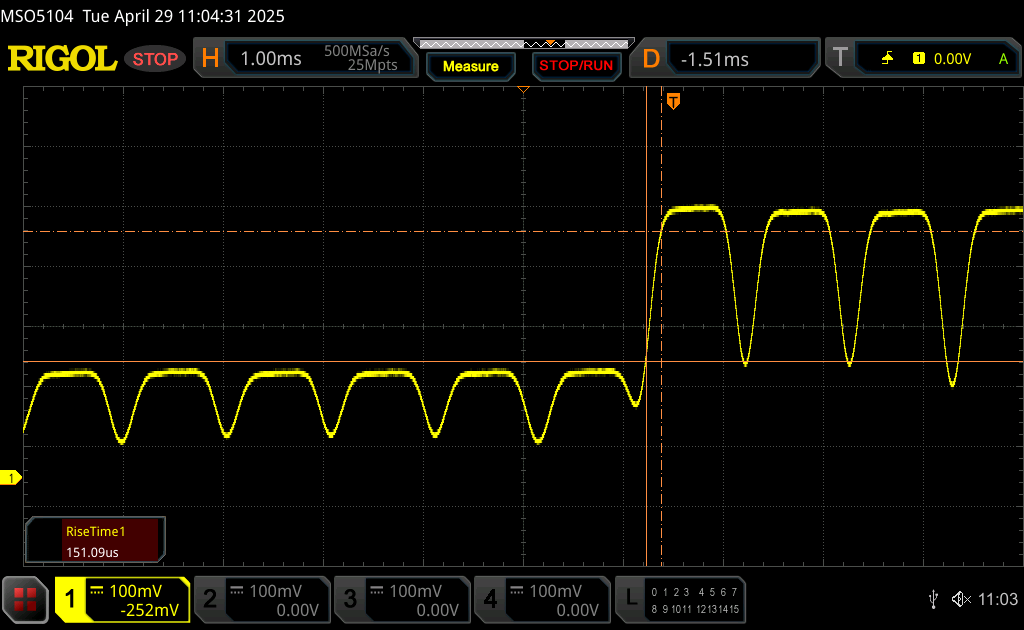 |
| ↘ 0.14 ms chute | ||
| L'écran montre de très faibles temps de réponse, parfait pour le jeu. En comparaison, tous les appareils testés affichent entre 0.165 (minimum) et 636 (maximum) ms. » 0 % des appareils testés affichent de meilleures performances. Cela signifie que les latences relevées sont meilleures que la moyenne (31 ms) de tous les appareils testés. | ||
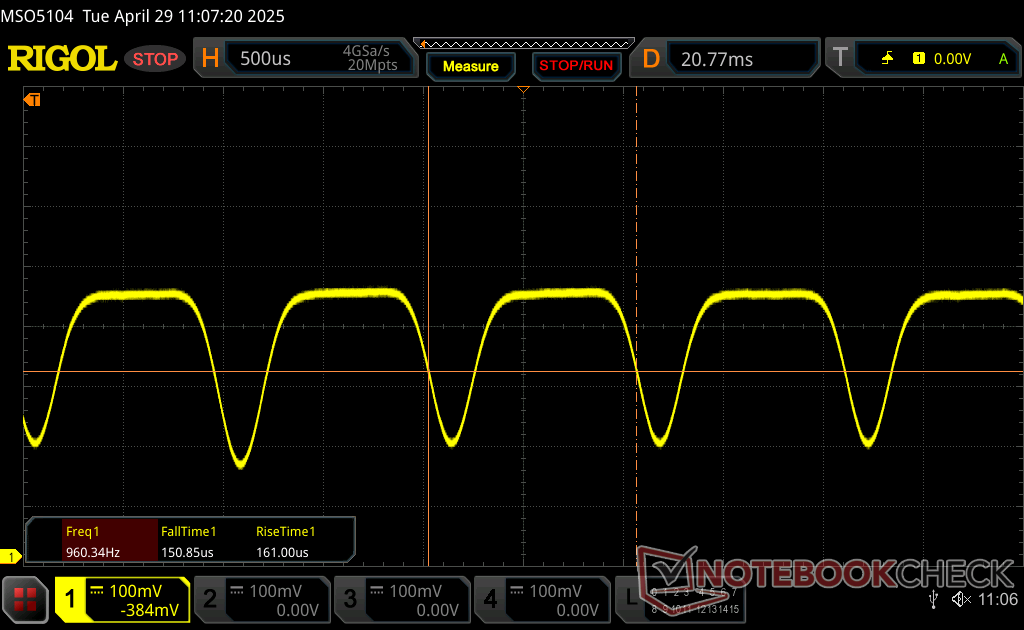
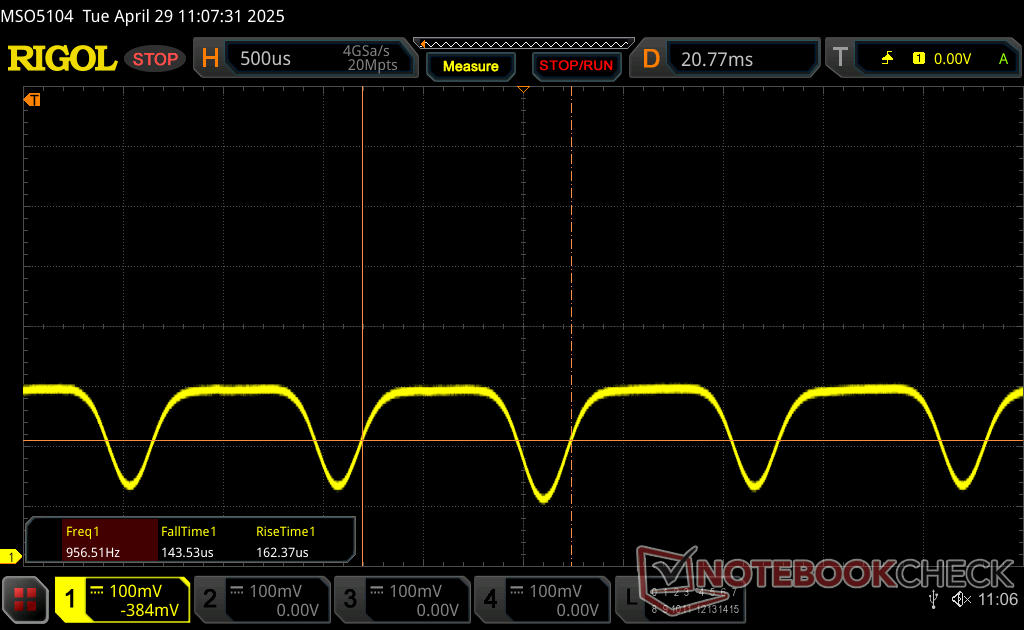
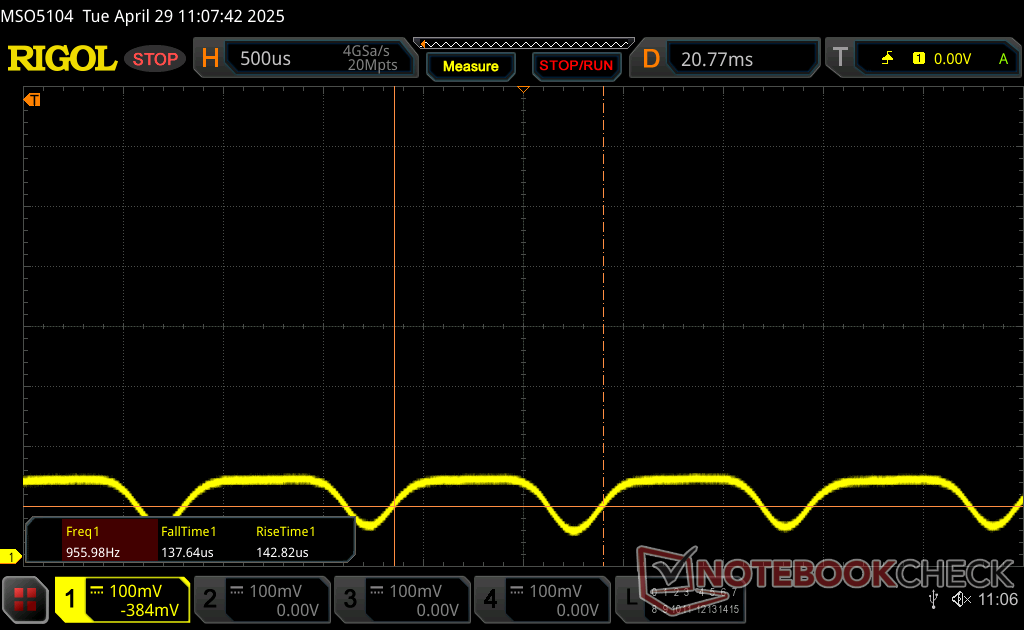
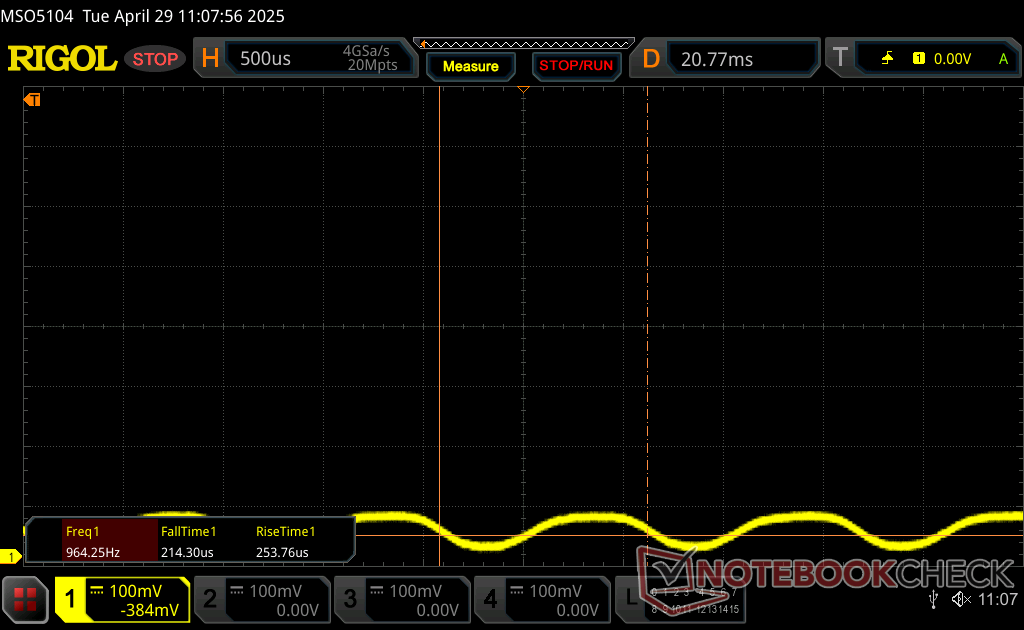
Scintillement / MLI (Modulation de largeur d'impulsion)
| Scintillement / MLI (Modulation de largeur d'impulsion) décelé | 960 Hz Amplitude: 31 % | ≤ 100 Niveau de luminosité | 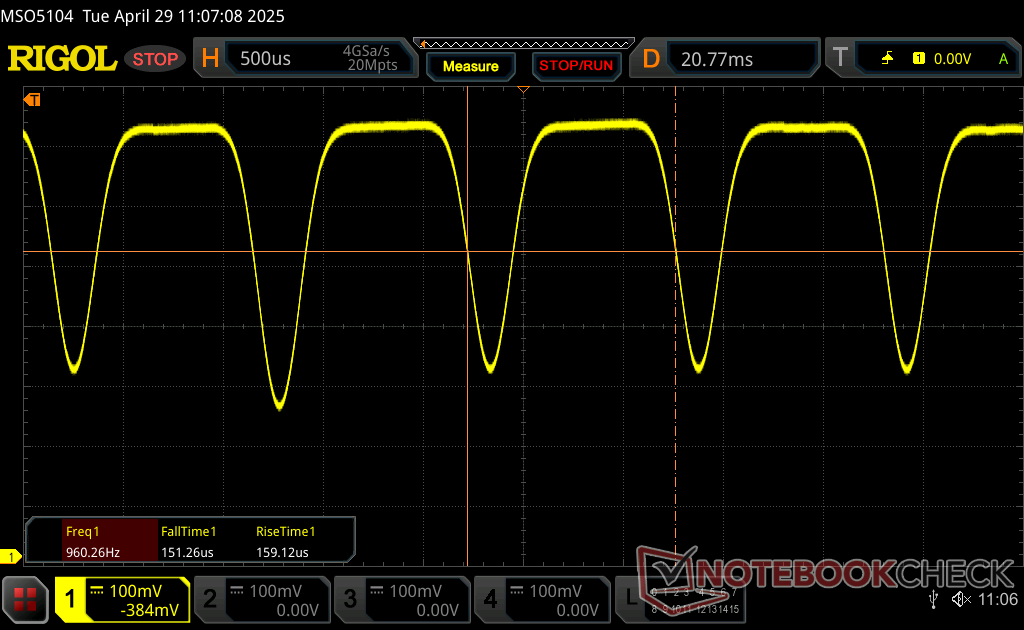 |
Le rétroéclairage de l'écran scintille à la fréquence de 960 Hz (certainement du fait de l'utilisation d'une MDI - Modulation de largeur d'impulsion) à un niveau de luminosité inférieur ou égal à 100 % . Aucun scintillement ne devrait être perceptible au-dessus de cette valeur. La fréquence de rafraîchissement de 960 Hz est élevée, la grande majorité des utilisateurs ne devrait pas percevoir de scintillements et être sujette à une fatigue oculaire accrue. En comparaison, 52 % des appareils testés n'emploient pas MDI pour assombrir leur écran. Nous avons relevé une moyenne à 7754 (minimum : 5 - maximum : 343500) Hz dans le cas où une MDI était active. | |||
Les reflets sont presque toujours inévitables à l'extérieur en raison de la brillance du panneau.


Performance - Processeur très chaud sous charge
Conditions d'essai
Nous avons réglé Windows et Omen Gaming Hub sur le mode Performance avant d'effectuer les tests ci-dessous. Nous encourageons les utilisateurs à se familiariser avec Omen Gaming Hub pour ajuster les profils et les paramètres du système. Le logiciel est néanmoins loin d'être parfait car il cache des paramètres importants derrière plusieurs sous-menus et même une vitrine.
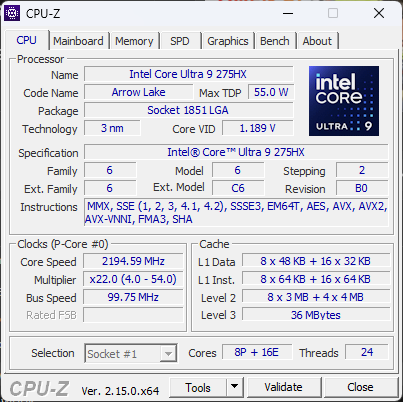
Processeur
Le Core Ultra 9 275HX dans l'Omen Max 16 est un mélange des deux. D'un côté, il est beaucoup plus rapide que le moins performant des Core i9-14900HX Core i9-14900HX du 2024 Omen 16. D'autre part, le processeur est plus lent que la plupart des autres ordinateurs portables équipés du même processeur, y compris le récent Legion Pro 7i 16 Gen 10 jusqu'à 10 %. Cela peut être dû aux limitations thermiques plus strictes du design HP, comme le suggère notre section Stress Test ci-dessous.
Cinebench R15 Multi Loop
Cinebench R23: Multi Core | Single Core
Cinebench R20: CPU (Multi Core) | CPU (Single Core)
Cinebench R15: CPU Multi 64Bit | CPU Single 64Bit
Blender: v2.79 BMW27 CPU
7-Zip 18.03: 7z b 4 | 7z b 4 -mmt1
Geekbench 6.7: Multi-Core | Single-Core
Geekbench 5.5: Multi-Core | Single-Core
HWBOT x265 Benchmark v2.2: 4k Preset
LibreOffice : 20 Documents To PDF
R Benchmark 2.5: Overall mean
| CPU Performance rating | |
| Lenovo Legion Pro 7i 16 Gen 10 | |
| Moyenne Intel Core Ultra 9 275HX | |
| MSI Vector 16 HX A14V | |
| HP Omen Max 16 ah000 | |
| Lenovo Legion Pro 7 RTX4090 -2! | |
| HP Omen 16 (2024) | |
| Alienware m16 R1 AMD | |
| Razer Blade 16 2025 RTX 5090 | |
| Asus ROG Zephyrus G16 GU605CX | |
| Dell G16 7620 -2! | |
| Asus ROG Zephyrus Duo 16 GX650RX -2! | |
| Cinebench R20 / CPU (Multi Core) | |
| Lenovo Legion Pro 7i 16 Gen 10 | |
| Moyenne Intel Core Ultra 9 275HX (12026 - 16108, n=30) | |
| HP Omen Max 16 ah000 | |
| MSI Vector 16 HX A14V | |
| Lenovo Legion Pro 7 RTX4090 | |
| Alienware m16 R1 AMD | |
| HP Omen 16 (2024) | |
| Razer Blade 16 2025 RTX 5090 | |
| Asus ROG Zephyrus G16 GU605CX | |
| Dell G16 7620 | |
| Asus ROG Zephyrus Duo 16 GX650RX | |
| Cinebench R20 / CPU (Single Core) | |
| HP Omen 16 (2024) | |
| Moyenne Intel Core Ultra 9 275HX (774 - 870, n=30) | |
| MSI Vector 16 HX A14V | |
| Lenovo Legion Pro 7i 16 Gen 10 | |
| Asus ROG Zephyrus G16 GU605CX | |
| HP Omen Max 16 ah000 | |
| Razer Blade 16 2025 RTX 5090 | |
| Lenovo Legion Pro 7 RTX4090 | |
| Alienware m16 R1 AMD | |
| Dell G16 7620 | |
| Asus ROG Zephyrus Duo 16 GX650RX | |
| Cinebench R15 / CPU Multi 64Bit | |
| Lenovo Legion Pro 7i 16 Gen 10 | |
| Moyenne Intel Core Ultra 9 275HX (4737 - 6271, n=30) | |
| HP Omen Max 16 ah000 | |
| Lenovo Legion Pro 7 RTX4090 | |
| MSI Vector 16 HX A14V | |
| Alienware m16 R1 AMD | |
| HP Omen 16 (2024) | |
| Razer Blade 16 2025 RTX 5090 | |
| Asus ROG Zephyrus G16 GU605CX | |
| Dell G16 7620 | |
| Asus ROG Zephyrus Duo 16 GX650RX | |
| Cinebench R15 / CPU Single 64Bit | |
| Lenovo Legion Pro 7i 16 Gen 10 | |
| Moyenne Intel Core Ultra 9 275HX (306 - 343, n=31) | |
| Asus ROG Zephyrus G16 GU605CX | |
| HP Omen Max 16 ah000 | |
| HP Omen 16 (2024) | |
| Razer Blade 16 2025 RTX 5090 | |
| MSI Vector 16 HX A14V | |
| Alienware m16 R1 AMD | |
| Lenovo Legion Pro 7 RTX4090 | |
| Asus ROG Zephyrus Duo 16 GX650RX | |
| Dell G16 7620 | |
| Geekbench 6.7 / Multi-Core | |
| Moyenne Intel Core Ultra 9 275HX (16033 - 21668, n=33) | |
| Lenovo Legion Pro 7i 16 Gen 10 | |
| HP Omen Max 16 ah000 | |
| MSI Vector 16 HX A14V | |
| Asus ROG Zephyrus G16 GU605CX | |
| HP Omen 16 (2024) | |
| Razer Blade 16 2025 RTX 5090 | |
| Alienware m16 R1 AMD | |
| Geekbench 6.7 / Single-Core | |
| HP Omen 16 (2024) | |
| Lenovo Legion Pro 7i 16 Gen 10 | |
| Moyenne Intel Core Ultra 9 275HX (2843 - 3160, n=33) | |
| MSI Vector 16 HX A14V | |
| Razer Blade 16 2025 RTX 5090 | |
| Asus ROG Zephyrus G16 GU605CX | |
| HP Omen Max 16 ah000 | |
| Alienware m16 R1 AMD | |
| HWBOT x265 Benchmark v2.2 / 4k Preset | |
| Lenovo Legion Pro 7i 16 Gen 10 | |
| Moyenne Intel Core Ultra 9 275HX (30.7 - 43.8, n=30) | |
| HP Omen Max 16 ah000 | |
| Lenovo Legion Pro 7 RTX4090 | |
| MSI Vector 16 HX A14V | |
| Alienware m16 R1 AMD | |
| Razer Blade 16 2025 RTX 5090 | |
| Asus ROG Zephyrus G16 GU605CX | |
| HP Omen 16 (2024) | |
| Dell G16 7620 | |
| Asus ROG Zephyrus Duo 16 GX650RX | |
| LibreOffice / 20 Documents To PDF | |
| Dell G16 7620 | |
| Razer Blade 16 2025 RTX 5090 | |
| MSI Vector 16 HX A14V | |
| Asus ROG Zephyrus Duo 16 GX650RX | |
| HP Omen 16 (2024) | |
| Asus ROG Zephyrus G16 GU605CX | |
| Moyenne Intel Core Ultra 9 275HX (33.2 - 62.1, n=30) | |
| HP Omen Max 16 ah000 | |
| Lenovo Legion Pro 7 RTX4090 | |
| Alienware m16 R1 AMD | |
| Lenovo Legion Pro 7i 16 Gen 10 | |
| R Benchmark 2.5 / Overall mean | |
| Dell G16 7620 | |
| Asus ROG Zephyrus Duo 16 GX650RX | |
| HP Omen Max 16 ah000 | |
| Asus ROG Zephyrus G16 GU605CX | |
| Alienware m16 R1 AMD | |
| Moyenne Intel Core Ultra 9 275HX (0.3943 - 0.4568, n=30) | |
| Lenovo Legion Pro 7i 16 Gen 10 | |
| Lenovo Legion Pro 7 RTX4090 | |
| Razer Blade 16 2025 RTX 5090 | |
| MSI Vector 16 HX A14V | |
| HP Omen 16 (2024) | |
* ... Moindre est la valeur, meilleures sont les performances
AIDA64: FP32 Ray-Trace | FPU Julia | CPU SHA3 | CPU Queen | FPU SinJulia | FPU Mandel | CPU AES | CPU ZLib | FP64 Ray-Trace | CPU PhotoWorxx
| Performance rating | |
| Moyenne Intel Core Ultra 9 275HX | |
| HP Omen Max 16 ah000 | |
| MSI Vector 16 HX A14V | |
| Lenovo Legion 9 16IRX9, RTX 4090 | |
| Razer Blade 16 2025 RTX 5090 | |
| Asus ROG Zephyrus G16 GU605CX | |
| HP Omen 16 (2024) | |
| AIDA64 / FP32 Ray-Trace | |
| Razer Blade 16 2025 RTX 5090 | |
| Moyenne Intel Core Ultra 9 275HX (28039 - 39895, n=30) | |
| HP Omen Max 16 ah000 | |
| MSI Vector 16 HX A14V | |
| Lenovo Legion 9 16IRX9, RTX 4090 | |
| Asus ROG Zephyrus G16 GU605CX | |
| HP Omen 16 (2024) | |
| AIDA64 / FPU Julia | |
| Moyenne Intel Core Ultra 9 275HX (140254 - 200744, n=30) | |
| HP Omen Max 16 ah000 | |
| MSI Vector 16 HX A14V | |
| Razer Blade 16 2025 RTX 5090 | |
| Lenovo Legion 9 16IRX9, RTX 4090 | |
| Asus ROG Zephyrus G16 GU605CX | |
| HP Omen 16 (2024) | |
| AIDA64 / CPU SHA3 | |
| Moyenne Intel Core Ultra 9 275HX (6710 - 9817, n=30) | |
| HP Omen Max 16 ah000 | |
| MSI Vector 16 HX A14V | |
| Lenovo Legion 9 16IRX9, RTX 4090 | |
| Razer Blade 16 2025 RTX 5090 | |
| Asus ROG Zephyrus G16 GU605CX | |
| HP Omen 16 (2024) | |
| AIDA64 / CPU Queen | |
| MSI Vector 16 HX A14V | |
| Moyenne Intel Core Ultra 9 275HX (113887 - 140937, n=30) | |
| Lenovo Legion 9 16IRX9, RTX 4090 | |
| HP Omen 16 (2024) | |
| HP Omen Max 16 ah000 | |
| Razer Blade 16 2025 RTX 5090 | |
| Asus ROG Zephyrus G16 GU605CX | |
| AIDA64 / FPU SinJulia | |
| Razer Blade 16 2025 RTX 5090 | |
| MSI Vector 16 HX A14V | |
| Lenovo Legion 9 16IRX9, RTX 4090 | |
| Moyenne Intel Core Ultra 9 275HX (11172 - 14425, n=30) | |
| HP Omen Max 16 ah000 | |
| HP Omen 16 (2024) | |
| Asus ROG Zephyrus G16 GU605CX | |
| AIDA64 / FPU Mandel | |
| Moyenne Intel Core Ultra 9 275HX (72596 - 104508, n=30) | |
| HP Omen Max 16 ah000 | |
| Razer Blade 16 2025 RTX 5090 | |
| MSI Vector 16 HX A14V | |
| Lenovo Legion 9 16IRX9, RTX 4090 | |
| Asus ROG Zephyrus G16 GU605CX | |
| HP Omen 16 (2024) | |
| AIDA64 / CPU AES | |
| MSI Vector 16 HX A14V | |
| Lenovo Legion 9 16IRX9, RTX 4090 | |
| Moyenne Intel Core Ultra 9 275HX (105608 - 247074, n=30) | |
| HP Omen Max 16 ah000 | |
| HP Omen 16 (2024) | |
| Razer Blade 16 2025 RTX 5090 | |
| Asus ROG Zephyrus G16 GU605CX | |
| AIDA64 / CPU ZLib | |
| MSI Vector 16 HX A14V | |
| Lenovo Legion 9 16IRX9, RTX 4090 | |
| Moyenne Intel Core Ultra 9 275HX (1582 - 2263, n=30) | |
| HP Omen Max 16 ah000 | |
| Razer Blade 16 2025 RTX 5090 | |
| HP Omen 16 (2024) | |
| Asus ROG Zephyrus G16 GU605CX | |
| AIDA64 / FP64 Ray-Trace | |
| Razer Blade 16 2025 RTX 5090 | |
| Moyenne Intel Core Ultra 9 275HX (14847 - 21854, n=30) | |
| HP Omen Max 16 ah000 | |
| MSI Vector 16 HX A14V | |
| Lenovo Legion 9 16IRX9, RTX 4090 | |
| Asus ROG Zephyrus G16 GU605CX | |
| HP Omen 16 (2024) | |
| AIDA64 / CPU PhotoWorxx | |
| Asus ROG Zephyrus G16 GU605CX | |
| Lenovo Legion 9 16IRX9, RTX 4090 | |
| Razer Blade 16 2025 RTX 5090 | |
| Moyenne Intel Core Ultra 9 275HX (37482 - 62916, n=30) | |
| HP Omen 16 (2024) | |
| MSI Vector 16 HX A14V | |
| HP Omen Max 16 ah000 | |
Test de stress
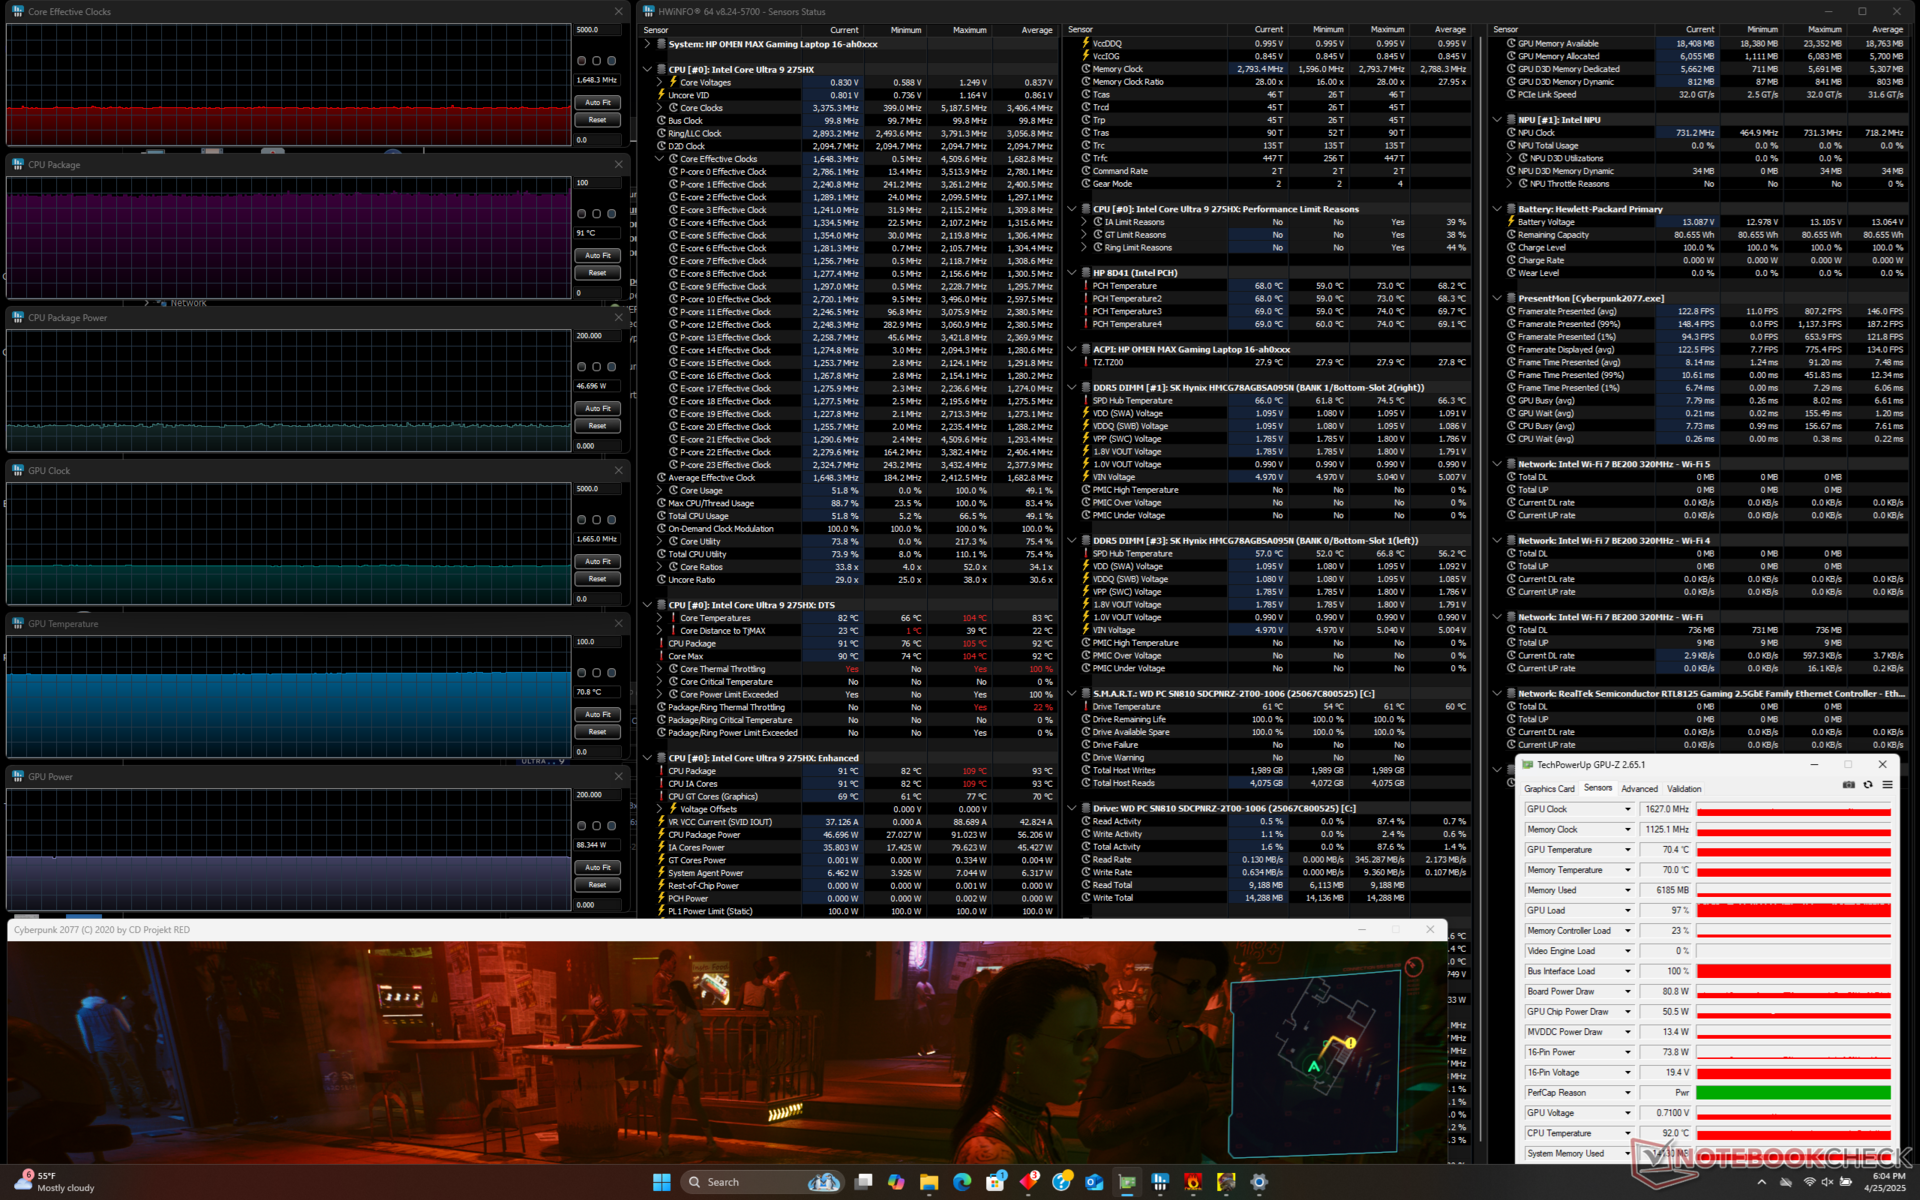
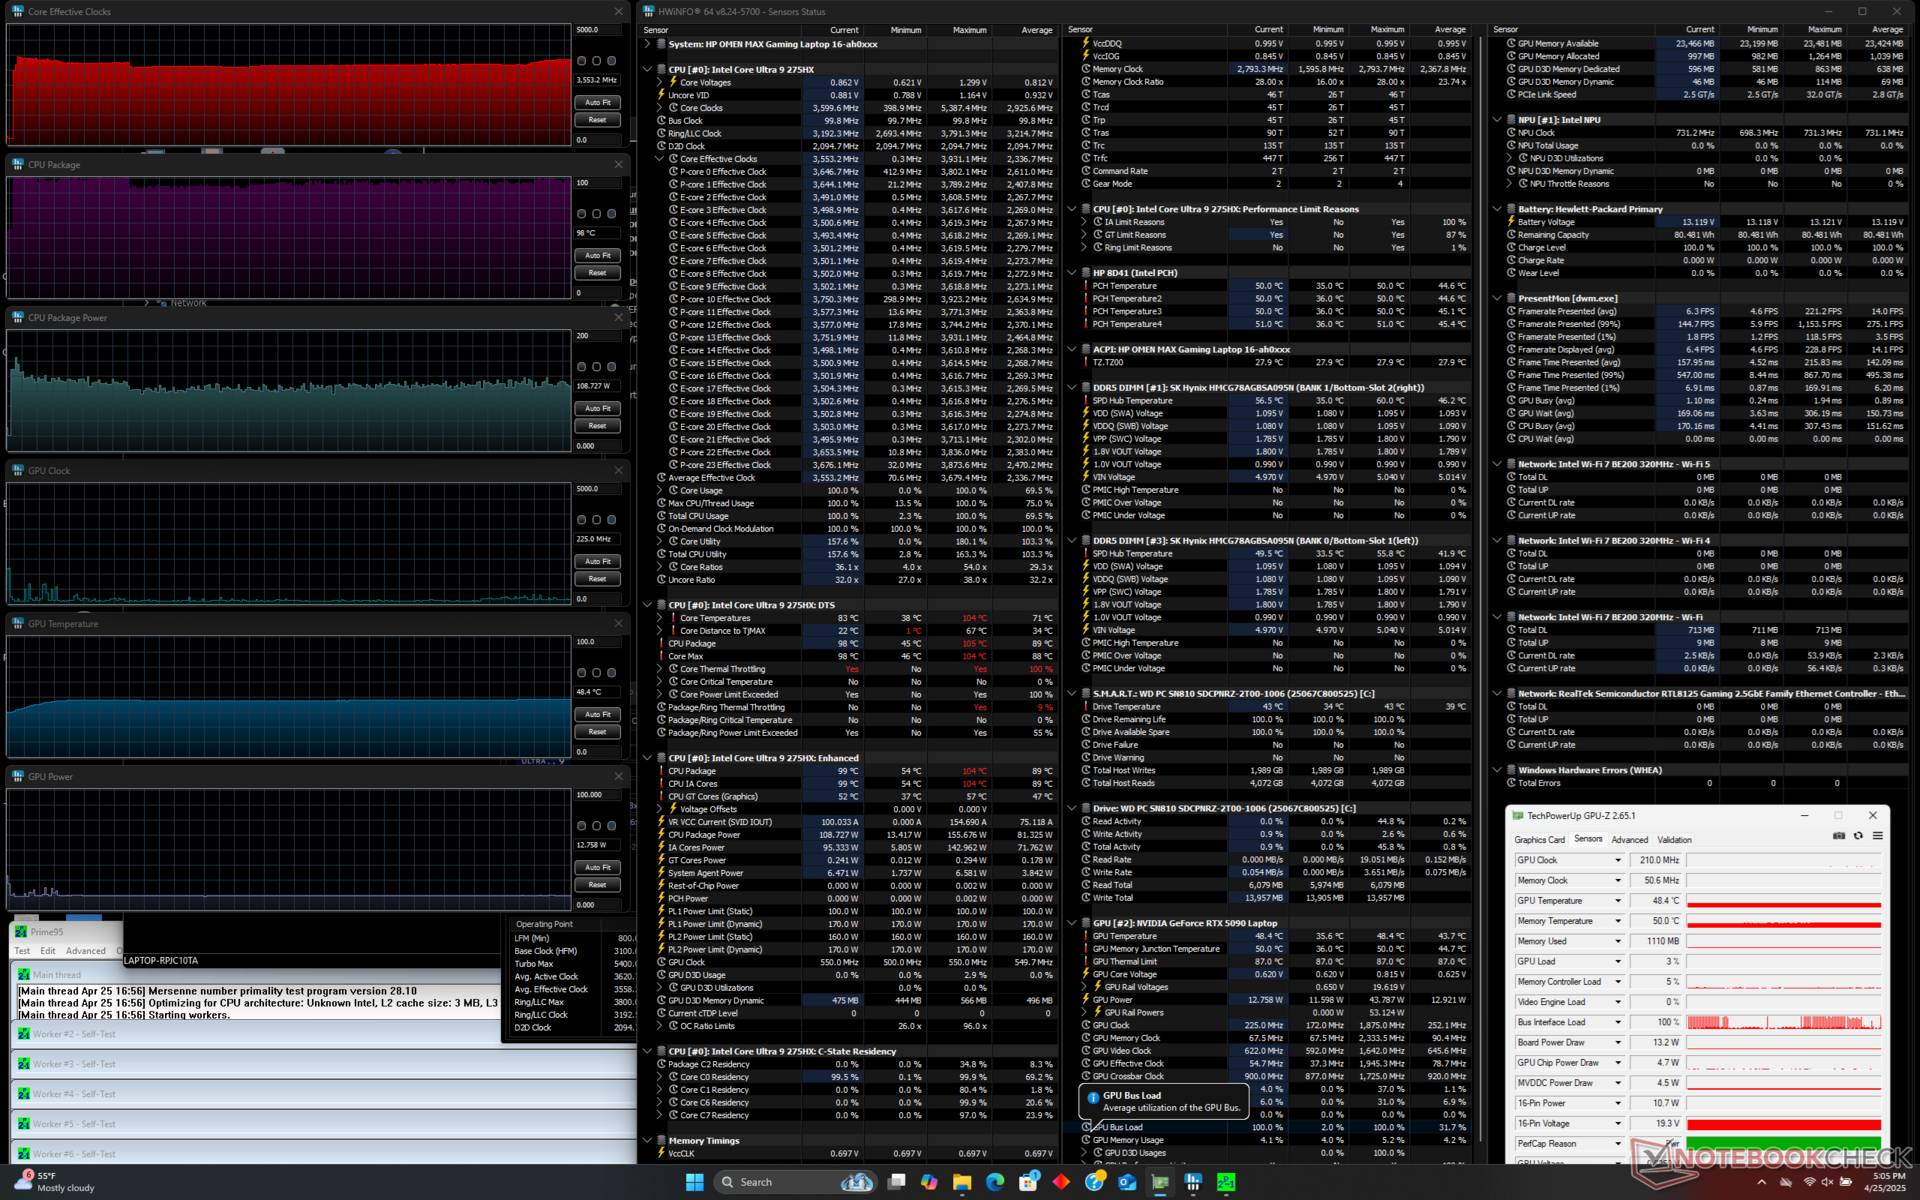
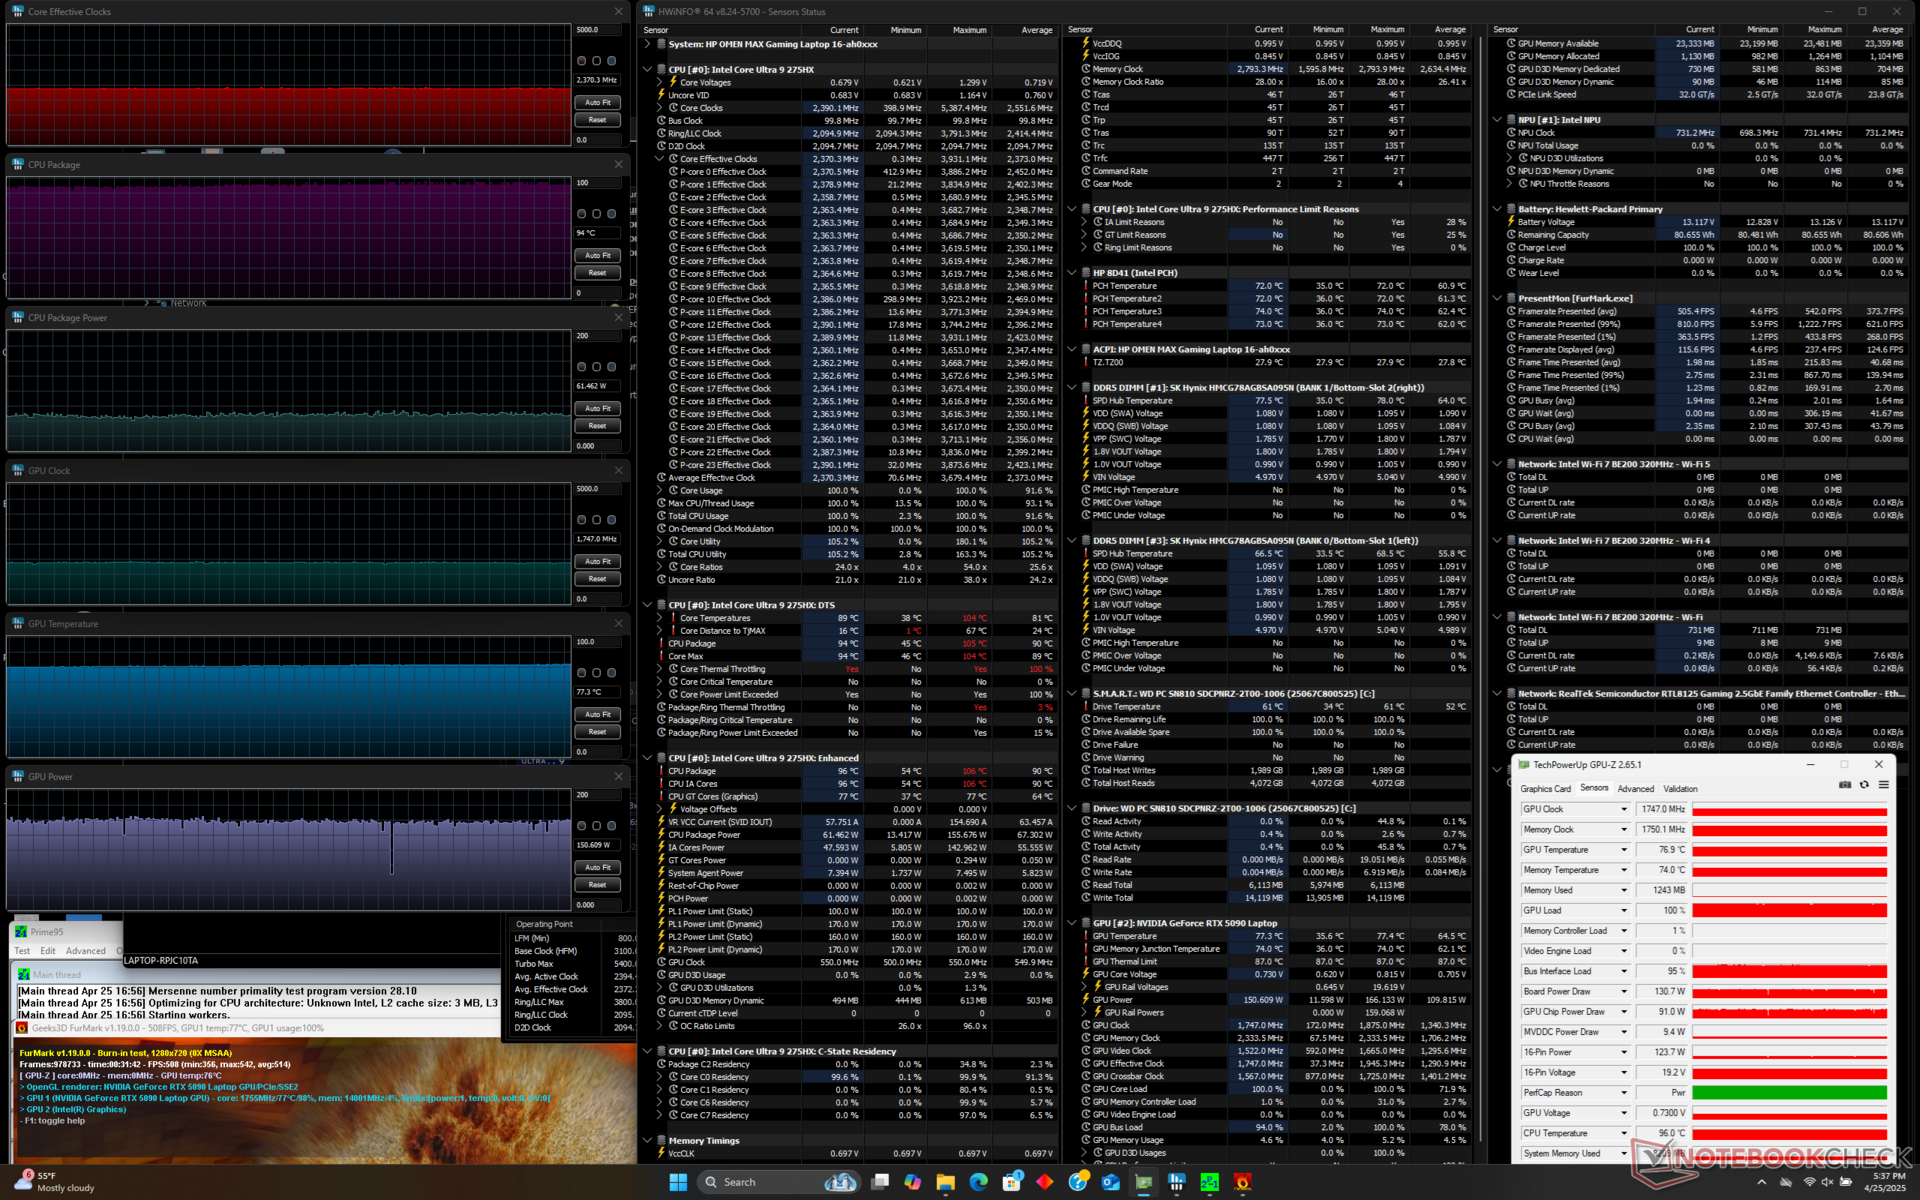
L'exécution de Prime95 montre pourquoi l'Omen Max 16 est toujours derrière le Legion Pro 7i 16 G10, même s'ils sont tous deux équipés du même processeur Core Ultra 9 275HX. Le CPU de notre HP se stabilise à 2.5 GHz, 98 C, et 108 W en mode Unleashed comparé à 3.8 GHz, 95 C, et 156 W sur le Lenovo. Ce dernier est capable de tirer des performances Turbo Boost plus régulières du CPU que sur l'Omen Max 16.
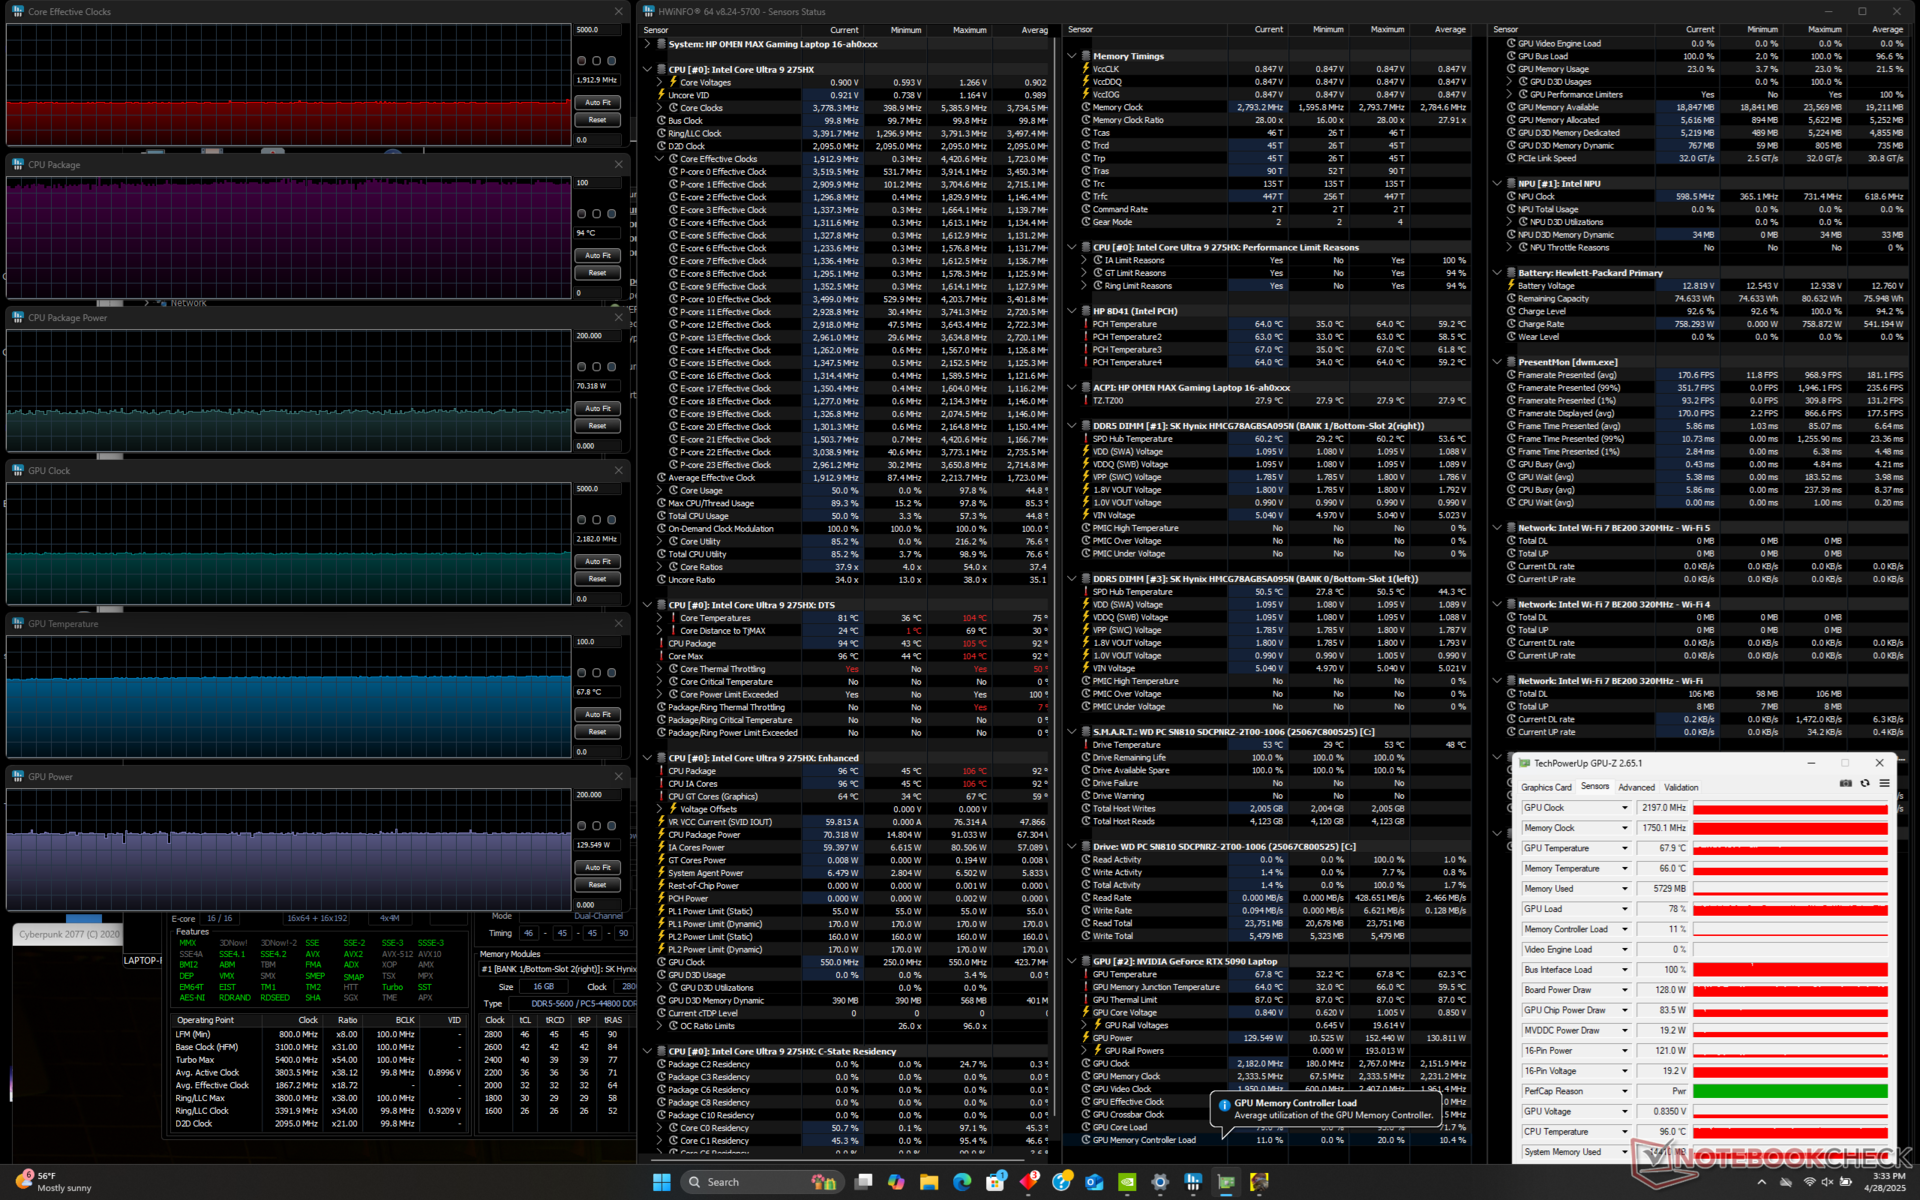
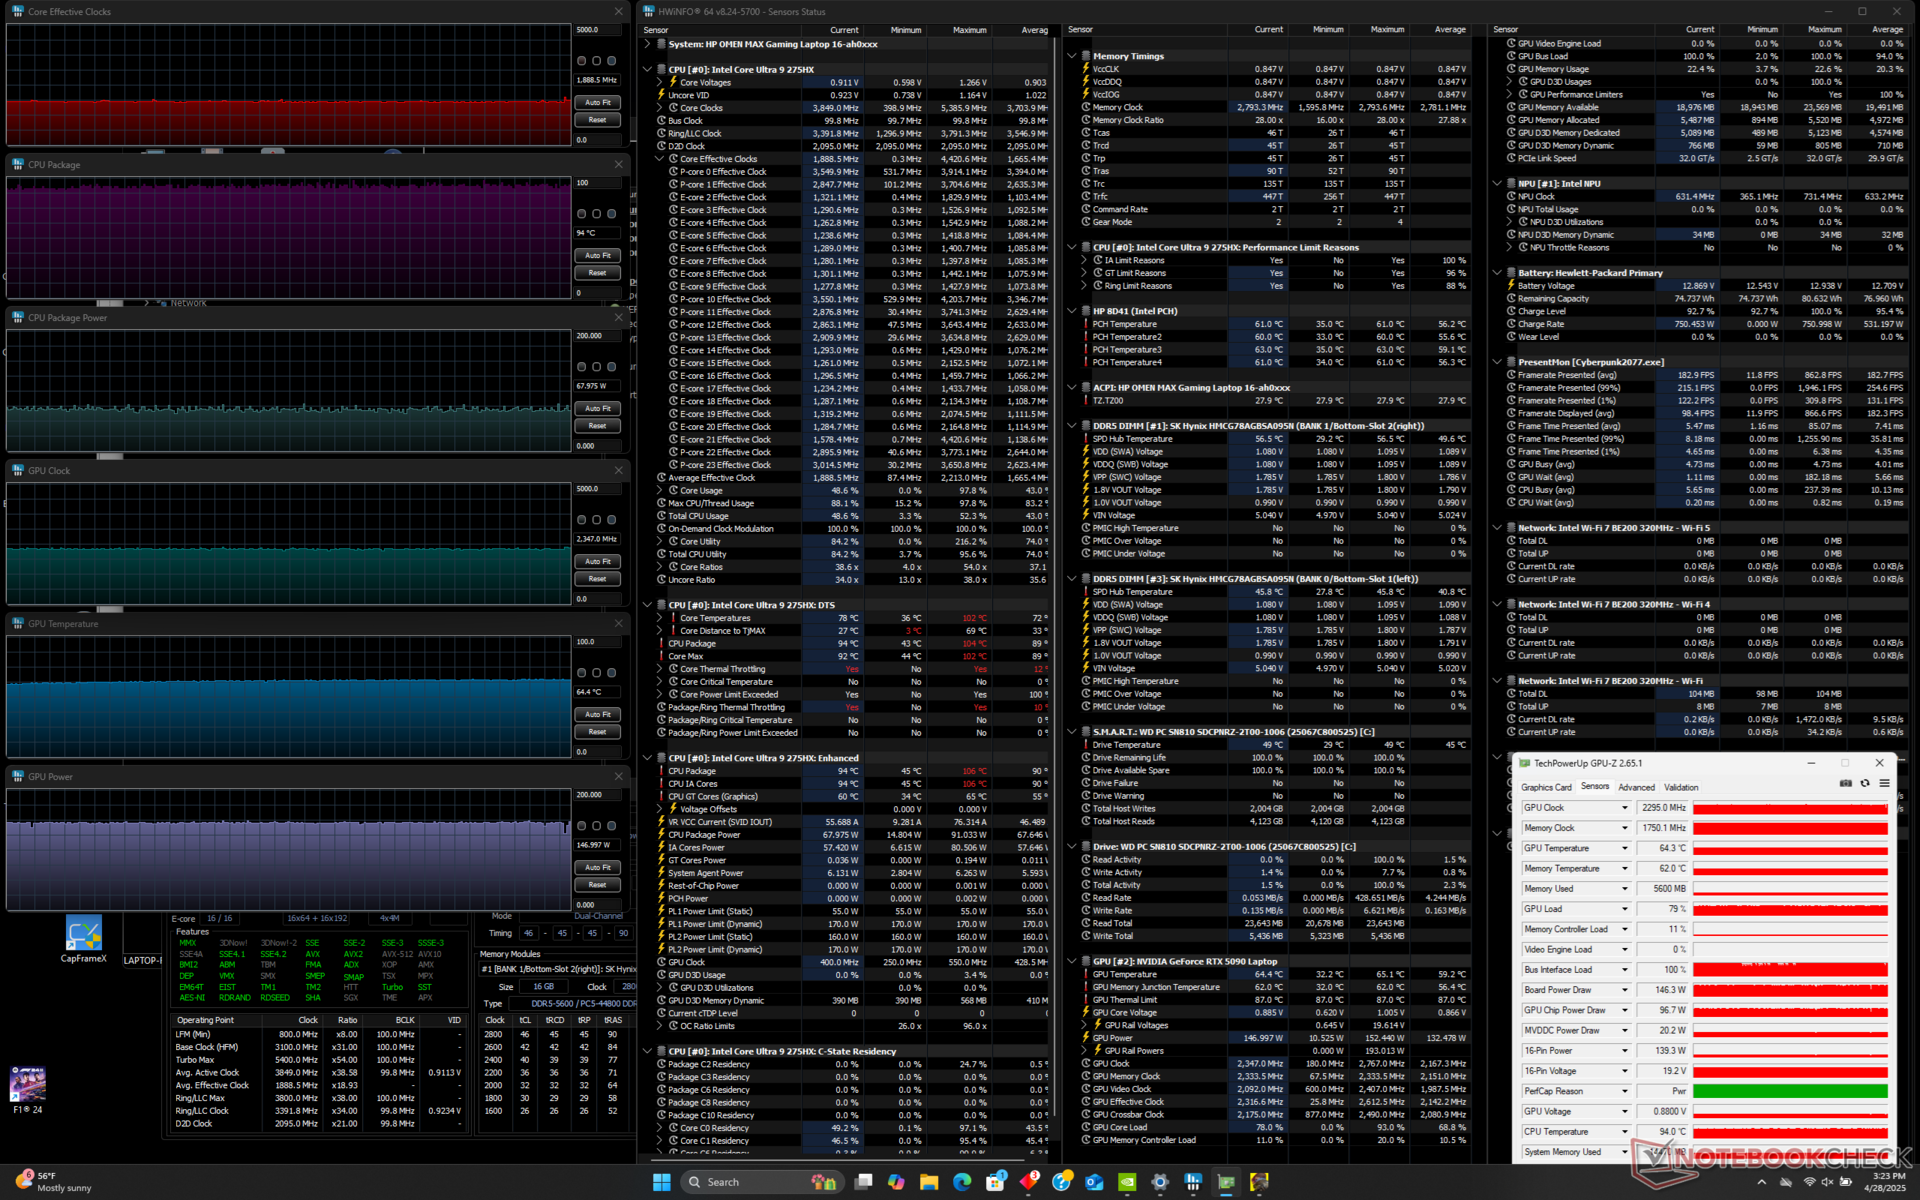
Les utilisateurs doivent noter qu'il existe des différences de performances entre les trois profils d'alimentation : Équilibré, Performance et Déchaîné, comme le montrent les captures d'écran de Cyberpunk 2077 ci-dessous. Le plafond de puissance du GPU atteint 145 W en mode Unleashed, 128 W en mode Performance et 81 W en mode Balanced. En d'autres termes, les joueurs doivent supporter le mode de ventilation maximal de HP (c'est-à-dire le mode Unleashed) pour bénéficier de toute la puissance du GPU.
Les températures du processeur sont plus élevées que nous le souhaiterions, à près de 95°C, tandis que le GPU fonctionne beaucoup plus froidement, à 70°C ou moins.
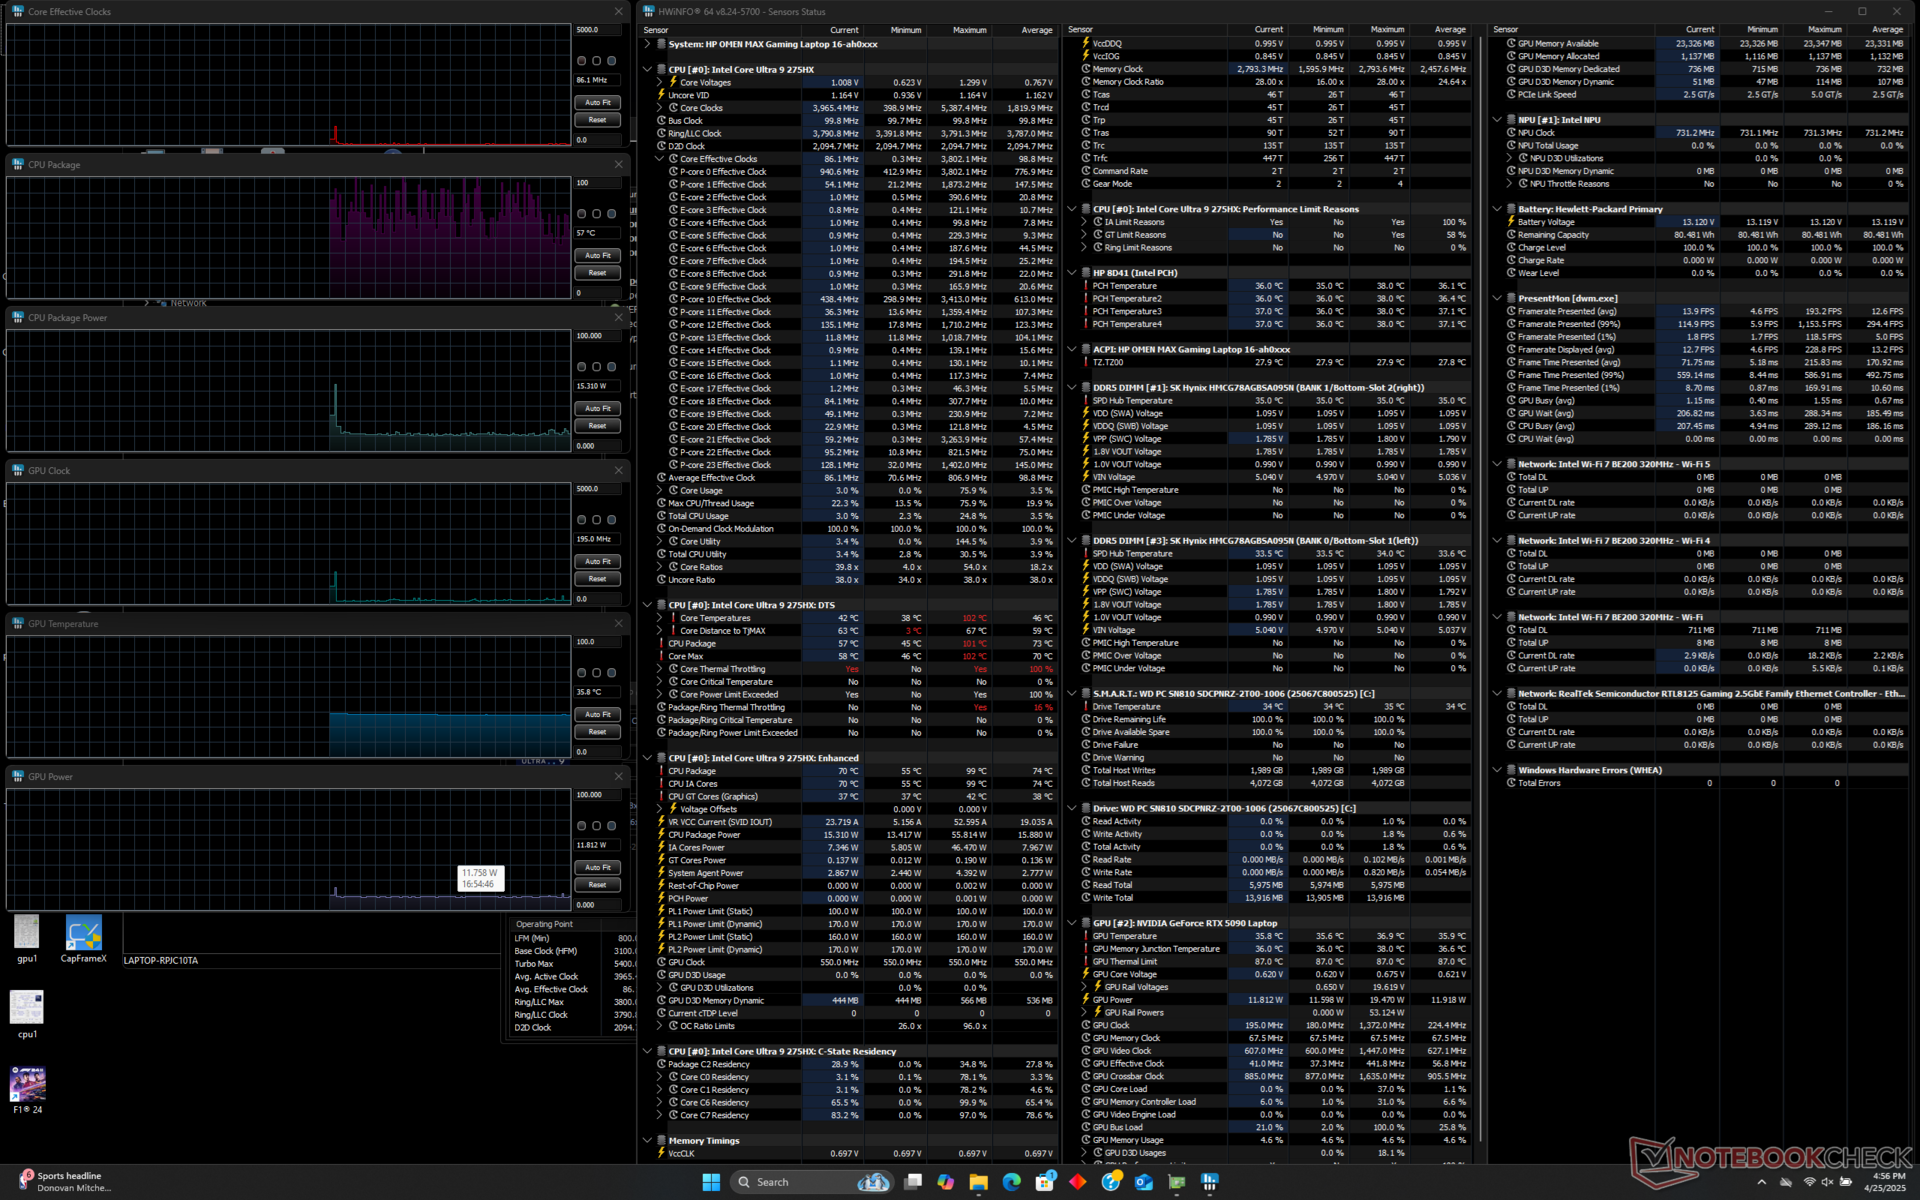
| Horloge moyenne du CPU (GHz) | Horloge du GPU (MHz) | Température moyenne du CPU (°C) | Température moyenne du GPU (°C) | |
| Système au repos | -- | -- | 57 | 36 |
| Prime95 Stress | 3.5 | -- | 98 | 48 |
| Prime95 + FurMark Stress | 2.4 | 1747 | 94 | 77 |
| Cyberpunk 2077 Stress (mode Unleashed) | 1.9 | 2347 | 94 | 64 |
| Cyberpunk 2077 Stress (mode Performance) | 1.9 | 2182 | 94 | 68 |
| Cyberpunk 2077 Stress (mode équilibré) | 1.6 | 1665 | 91 | 71 |
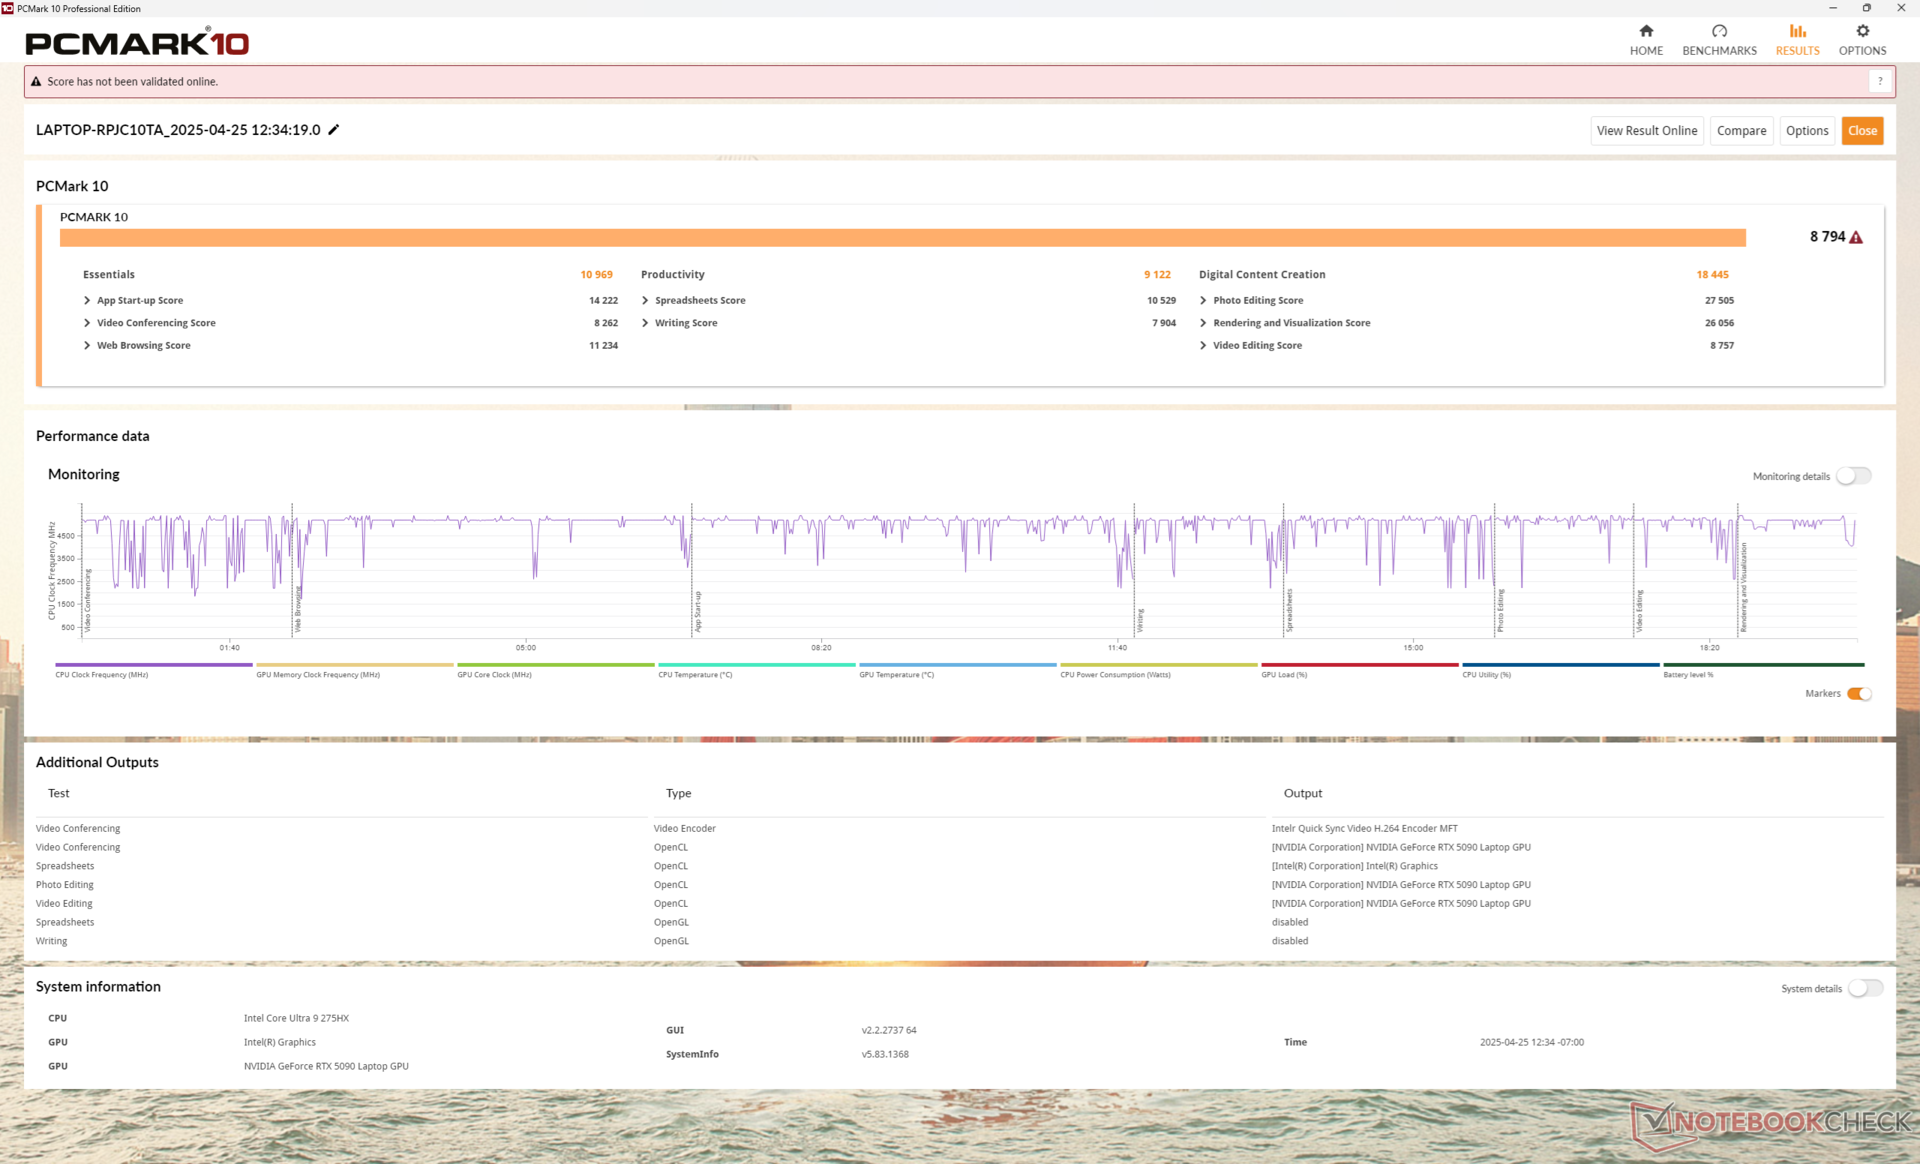
Performance du système
Les résultats de PCMark 10 sont légèrement inférieurs aux attentes, en particulier dans le sous-test Productivité, où les performances du processeur sont les plus importantes. Cela pourrait être dû aux performances quelque peu décevantes du processeur mentionnées ci-dessus.
CrossMark: Overall | Productivity | Creativity | Responsiveness
WebXPRT 3: Overall
WebXPRT 4: Overall
Mozilla Kraken 1.1: Total
| PCMark 10 / Score | |
| HP Omen 16 (2024) | |
| Asus ROG Zephyrus G16 GU605CX | |
| HP Omen Max 16 ah000 | |
| MSI Vector 16 HX A14V | |
| Moyenne Intel Core Ultra 9 275HX, NVIDIA GeForce RTX 5090 Laptop (7474 - 9497, n=11) | |
| Razer Blade 16 2025 RTX 5090 | |
| Lenovo Legion 9 16IRX9, RTX 4090 | |
| PCMark 10 / Essentials | |
| MSI Vector 16 HX A14V | |
| HP Omen 16 (2024) | |
| Lenovo Legion 9 16IRX9, RTX 4090 | |
| HP Omen Max 16 ah000 | |
| Moyenne Intel Core Ultra 9 275HX, NVIDIA GeForce RTX 5090 Laptop (9994 - 11369, n=12) | |
| Asus ROG Zephyrus G16 GU605CX | |
| Razer Blade 16 2025 RTX 5090 | |
| PCMark 10 / Productivity | |
| HP Omen 16 (2024) | |
| Asus ROG Zephyrus G16 GU605CX | |
| Razer Blade 16 2025 RTX 5090 | |
| Lenovo Legion 9 16IRX9, RTX 4090 | |
| MSI Vector 16 HX A14V | |
| Moyenne Intel Core Ultra 9 275HX, NVIDIA GeForce RTX 5090 Laptop (9122 - 10925, n=11) | |
| HP Omen Max 16 ah000 | |
| PCMark 10 / Digital Content Creation | |
| HP Omen Max 16 ah000 | |
| Moyenne Intel Core Ultra 9 275HX, NVIDIA GeForce RTX 5090 Laptop (9952 - 19234, n=11) | |
| MSI Vector 16 HX A14V | |
| Asus ROG Zephyrus G16 GU605CX | |
| HP Omen 16 (2024) | |
| Razer Blade 16 2025 RTX 5090 | |
| Lenovo Legion 9 16IRX9, RTX 4090 | |
| CrossMark / Overall | |
| HP Omen 16 (2024) | |
| Moyenne Intel Core Ultra 9 275HX, NVIDIA GeForce RTX 5090 Laptop (1995 - 2339, n=12) | |
| MSI Vector 16 HX A14V | |
| Asus ROG Zephyrus G16 GU605CX | |
| HP Omen Max 16 ah000 | |
| Lenovo Legion 9 16IRX9, RTX 4090 | |
| CrossMark / Productivity | |
| HP Omen 16 (2024) | |
| Moyenne Intel Core Ultra 9 275HX, NVIDIA GeForce RTX 5090 Laptop (1847 - 2211, n=12) | |
| MSI Vector 16 HX A14V | |
| Asus ROG Zephyrus G16 GU605CX | |
| HP Omen Max 16 ah000 | |
| Lenovo Legion 9 16IRX9, RTX 4090 | |
| CrossMark / Creativity | |
| Moyenne Intel Core Ultra 9 275HX, NVIDIA GeForce RTX 5090 Laptop (2170 - 2642, n=12) | |
| MSI Vector 16 HX A14V | |
| Asus ROG Zephyrus G16 GU605CX | |
| HP Omen 16 (2024) | |
| HP Omen Max 16 ah000 | |
| Lenovo Legion 9 16IRX9, RTX 4090 | |
| CrossMark / Responsiveness | |
| HP Omen 16 (2024) | |
| MSI Vector 16 HX A14V | |
| Moyenne Intel Core Ultra 9 275HX, NVIDIA GeForce RTX 5090 Laptop (1673 - 2217, n=12) | |
| Lenovo Legion 9 16IRX9, RTX 4090 | |
| HP Omen Max 16 ah000 | |
| Asus ROG Zephyrus G16 GU605CX | |
| WebXPRT 3 / Overall | |
| HP Omen Max 16 ah000 | |
| Moyenne Intel Core Ultra 9 275HX, NVIDIA GeForce RTX 5090 Laptop (315 - 372, n=12) | |
| Asus ROG Zephyrus G16 GU605CX | |
| HP Omen 16 (2024) | |
| MSI Vector 16 HX A14V | |
| Razer Blade 16 2025 RTX 5090 | |
| Lenovo Legion 9 16IRX9, RTX 4090 | |
| WebXPRT 4 / Overall | |
| Moyenne Intel Core Ultra 9 275HX, NVIDIA GeForce RTX 5090 Laptop (301 - 341, n=11) | |
| Asus ROG Zephyrus G16 GU605CX | |
| HP Omen 16 (2024) | |
| MSI Vector 16 HX A14V | |
| Razer Blade 16 2025 RTX 5090 | |
| Lenovo Legion 9 16IRX9, RTX 4090 | |
| Mozilla Kraken 1.1 / Total | |
| Lenovo Legion 9 16IRX9, RTX 4090 | |
| Asus ROG Zephyrus G16 GU605CX | |
| MSI Vector 16 HX A14V | |
| HP Omen 16 (2024) | |
| Razer Blade 16 2025 RTX 5090 | |
| HP Omen Max 16 ah000 | |
| Moyenne Intel Core Ultra 9 275HX, NVIDIA GeForce RTX 5090 Laptop (402 - 424, n=12) | |
* ... Moindre est la valeur, meilleures sont les performances
| PCMark 10 Score | 8794 points | |
Aide | ||
| AIDA64 / Memory Copy | |
| Asus ROG Zephyrus G16 GU605CX | |
| Razer Blade 16 2025 RTX 5090 | |
| Lenovo Legion 9 16IRX9, RTX 4090 | |
| Moyenne Intel Core Ultra 9 275HX (56003 - 94460, n=30) | |
| HP Omen 16 (2024) | |
| MSI Vector 16 HX A14V | |
| HP Omen Max 16 ah000 | |
| AIDA64 / Memory Read | |
| Razer Blade 16 2025 RTX 5090 | |
| HP Omen 16 (2024) | |
| MSI Vector 16 HX A14V | |
| Moyenne Intel Core Ultra 9 275HX (55795 - 97151, n=30) | |
| HP Omen Max 16 ah000 | |
| Lenovo Legion 9 16IRX9, RTX 4090 | |
| Asus ROG Zephyrus G16 GU605CX | |
| AIDA64 / Memory Write | |
| Razer Blade 16 2025 RTX 5090 | |
| Lenovo Legion 9 16IRX9, RTX 4090 | |
| Moyenne Intel Core Ultra 9 275HX (55663 - 116129, n=30) | |
| HP Omen 16 (2024) | |
| HP Omen Max 16 ah000 | |
| MSI Vector 16 HX A14V | |
| Asus ROG Zephyrus G16 GU605CX | |
| AIDA64 / Memory Latency | |
| Asus ROG Zephyrus G16 GU605CX | |
| HP Omen Max 16 ah000 | |
| Moyenne Intel Core Ultra 9 275HX (105.8 - 161.6, n=30) | |
| Razer Blade 16 2025 RTX 5090 | |
| Lenovo Legion 9 16IRX9, RTX 4090 | |
| HP Omen 16 (2024) | |
| MSI Vector 16 HX A14V | |
* ... Moindre est la valeur, meilleures sont les performances
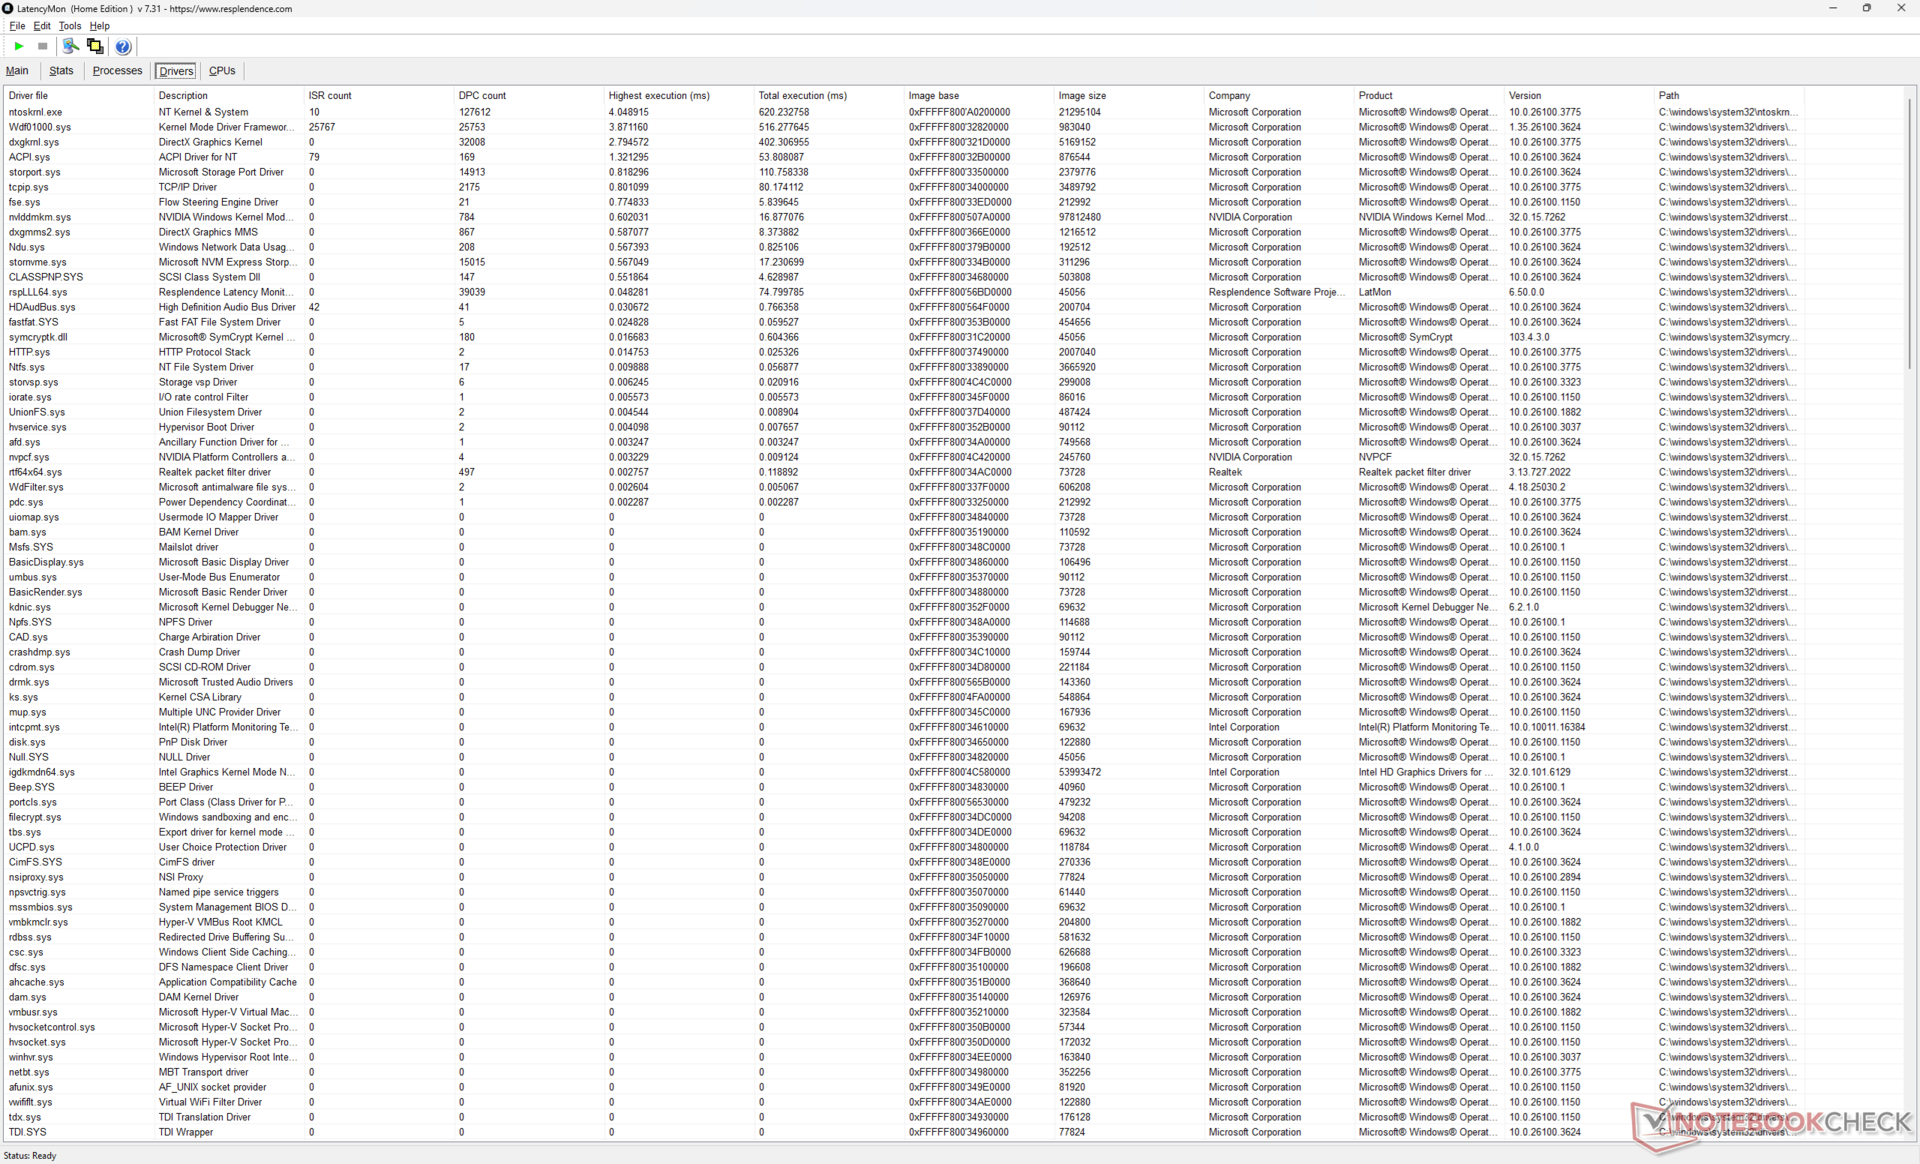
Latence DPC
LatencyMon montre des problèmes mineurs de DPC lors de l'ouverture de plusieurs onglets de notre page d'accueil, mais sans aucune perte d'images enregistrée lors de la lecture de contenus vidéo 4K60.

| DPC Latencies / LatencyMon - interrupt to process latency (max), Web, Youtube, Prime95 | |
| Asus ROG Zephyrus G16 GU605CX | |
| Lenovo Legion 9 16IRX9, RTX 4090 | |
| MSI Vector 16 HX A14V | |
| HP Omen Max 16 ah000 | |
| HP Omen 16 (2024) | |
| Razer Blade 16 2025 RTX 5090 | |
* ... Moindre est la valeur, meilleures sont les performances
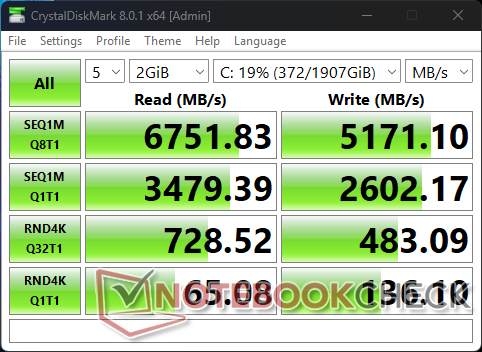
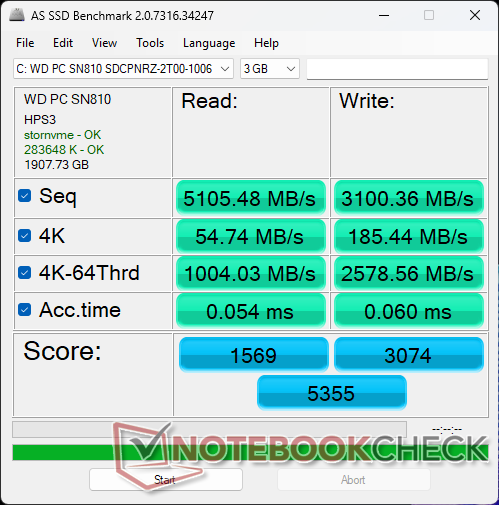
Dispositifs de stockage
Le WDC PC SN810 SSD de notre unité de test n'a pas montré de comportement d'étranglement lorsqu'il a été sollicité pour un maximum stable d'environ 6800 Mo/s.

| Drive Performance rating - Percent | |
| HP Omen 16 (2024) | |
| Razer Blade 16 2025 RTX 5090 | |
| Lenovo Legion 9 16IRX9, RTX 4090 | |
| Asus ROG Zephyrus G16 GU605CX | |
| MSI Vector 16 HX A14V | |
| HP Omen Max 16 ah000 | |
* ... Moindre est la valeur, meilleures sont les performances
Disk Throttling: DiskSpd Read Loop, Queue Depth 8
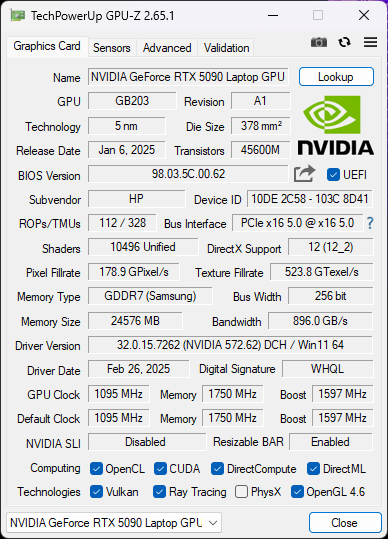
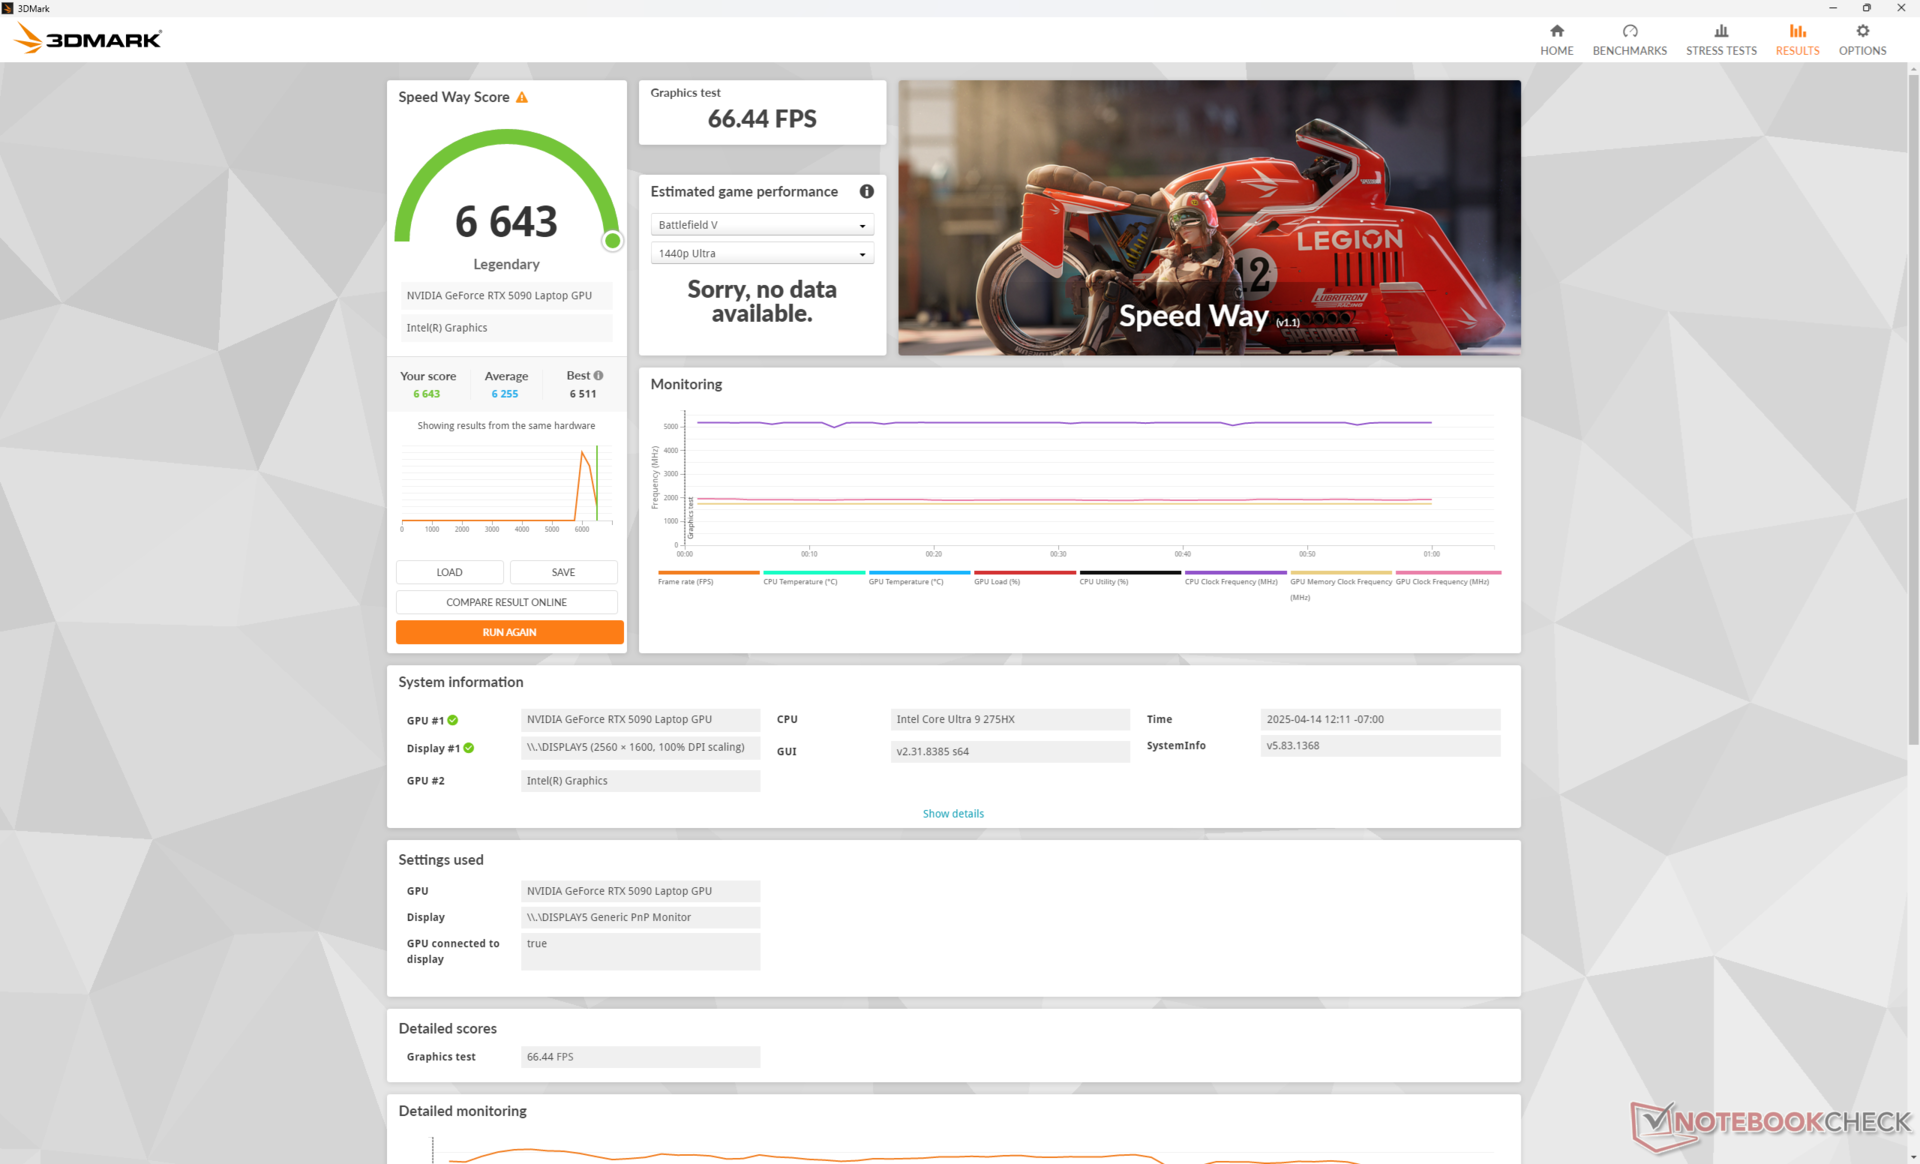
Performances du GPU - 175 W TGP Target
Le mobile GeForce RTX 5090 n'est que 10 à 20 % plus rapide que la rTX 4090 lorsqu'il s'agit de tramage brut. Elle est littéralement deux fois moins rapide que la rTX 5090 de bureau en raison des limitations de puissance inhérentes aux facteurs de forme des ordinateurs portables, mais elle comporte toujours des cœurs tenseurs de 5e génération mis à niveau et la prise en charge de l'encodage/décodage 4:2:2, qui sont absents de l'ancienne série GeForce 40.
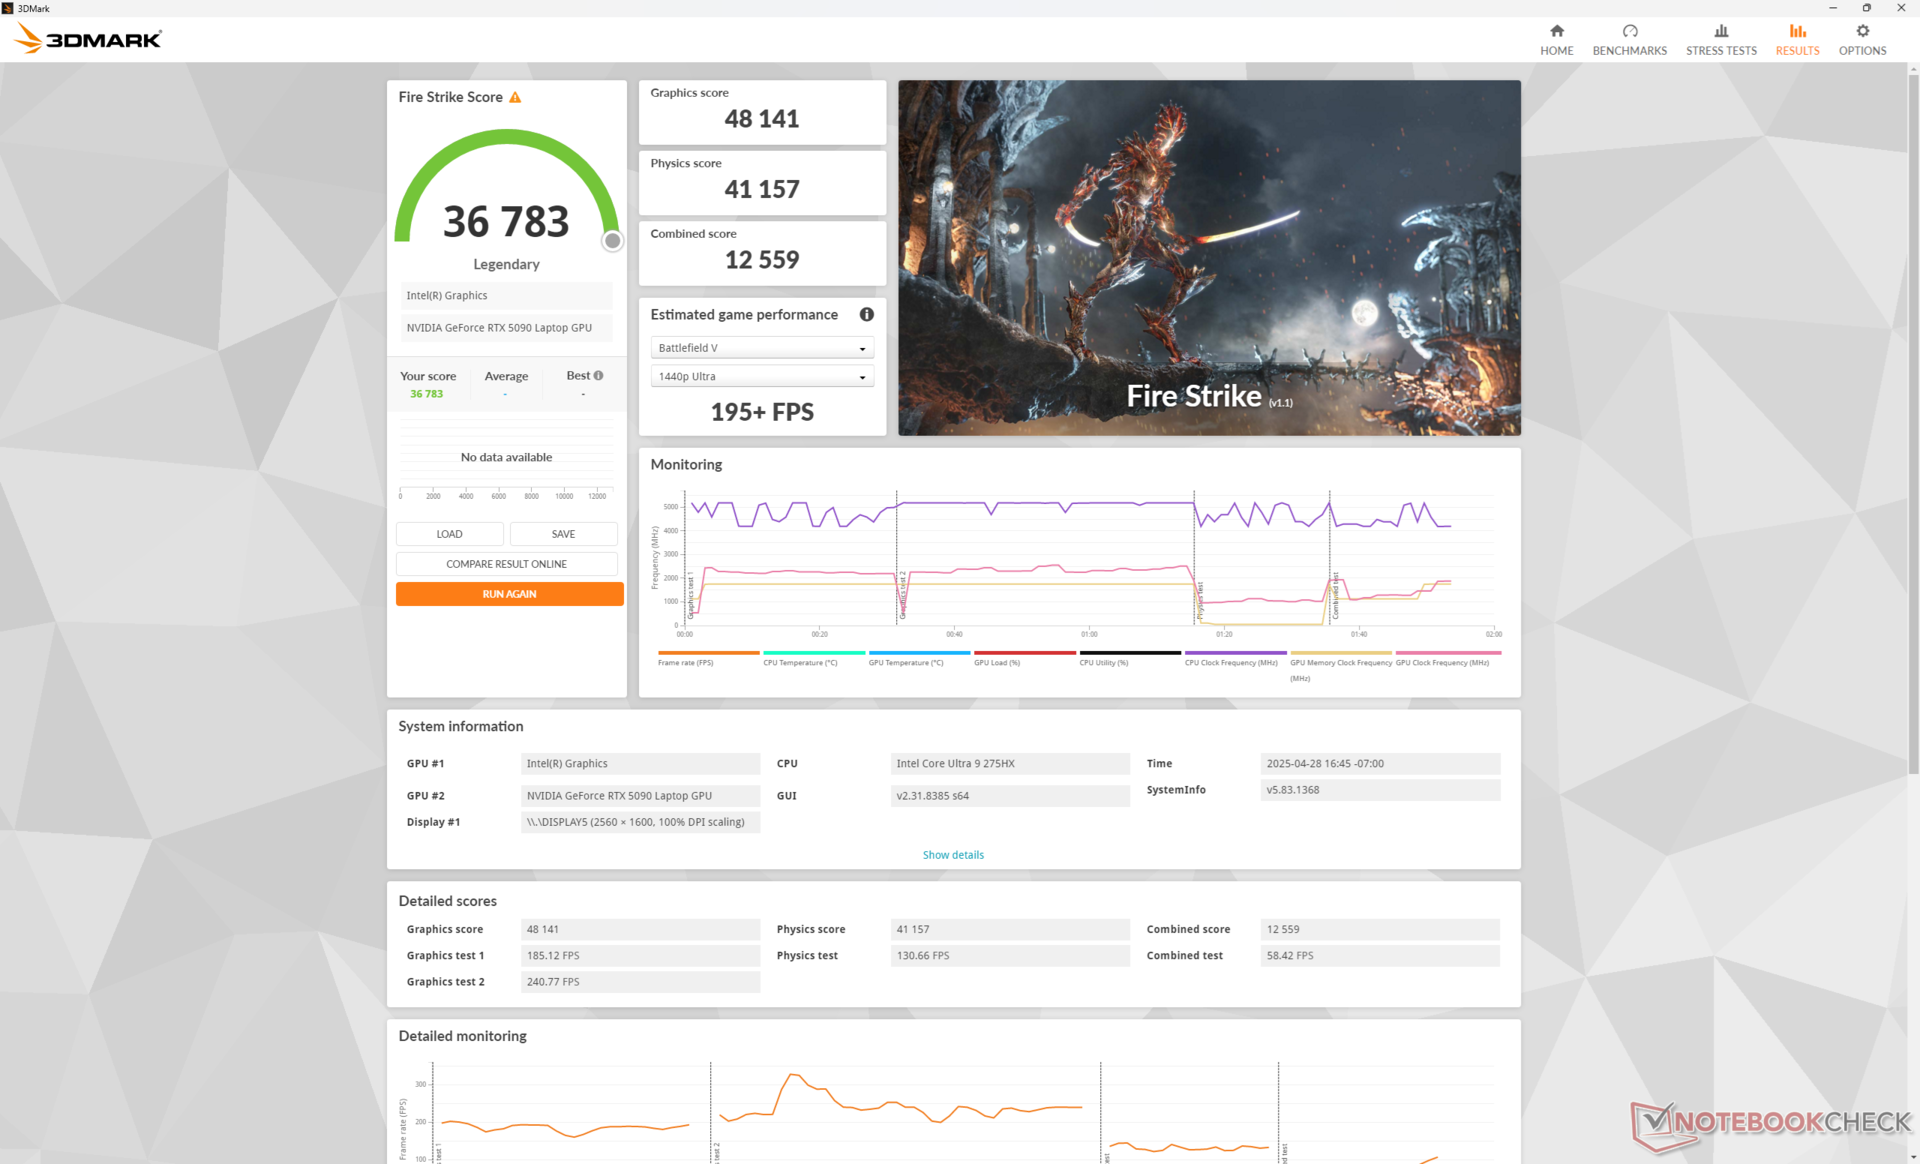
Notez que le passage du mode Unleashed au mode Performance ne réduit les performances du GPU que de quelques points de pourcentage, comme le montre notre tableau de résultats Fire Strike ci-dessous.
| Profil de puissance | Score graphique | Score physique | Score combiné |
| Mode déchaîné | 49342 | 44020 | 11675 |
| Mode Performance | 48146 (-2%) | 43466 (-1%) | 11522 (-1%) |
| Mode équilibré | 45941 (-7%) | 43842 (-0%) | 11319 (-3%) |
| Alimentation par batterie | 15428 (-69%) | 23175 (-47%) | 2926 (-75%) |
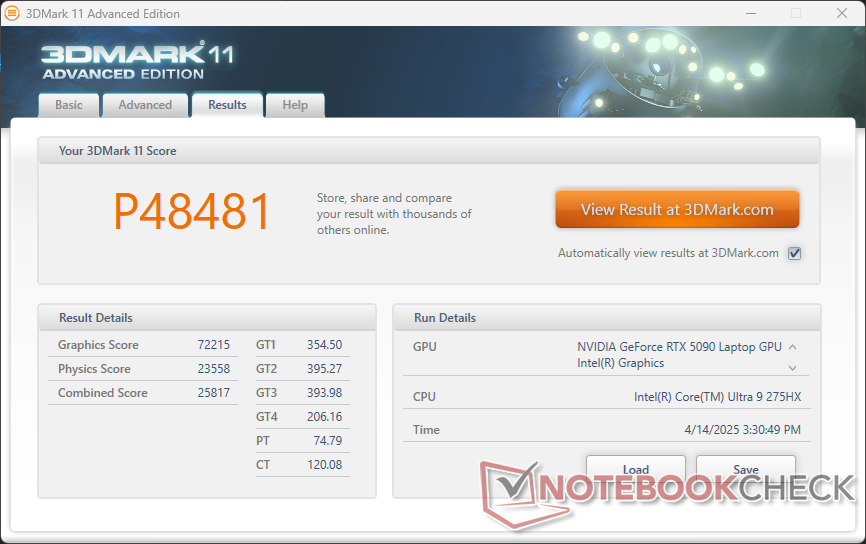
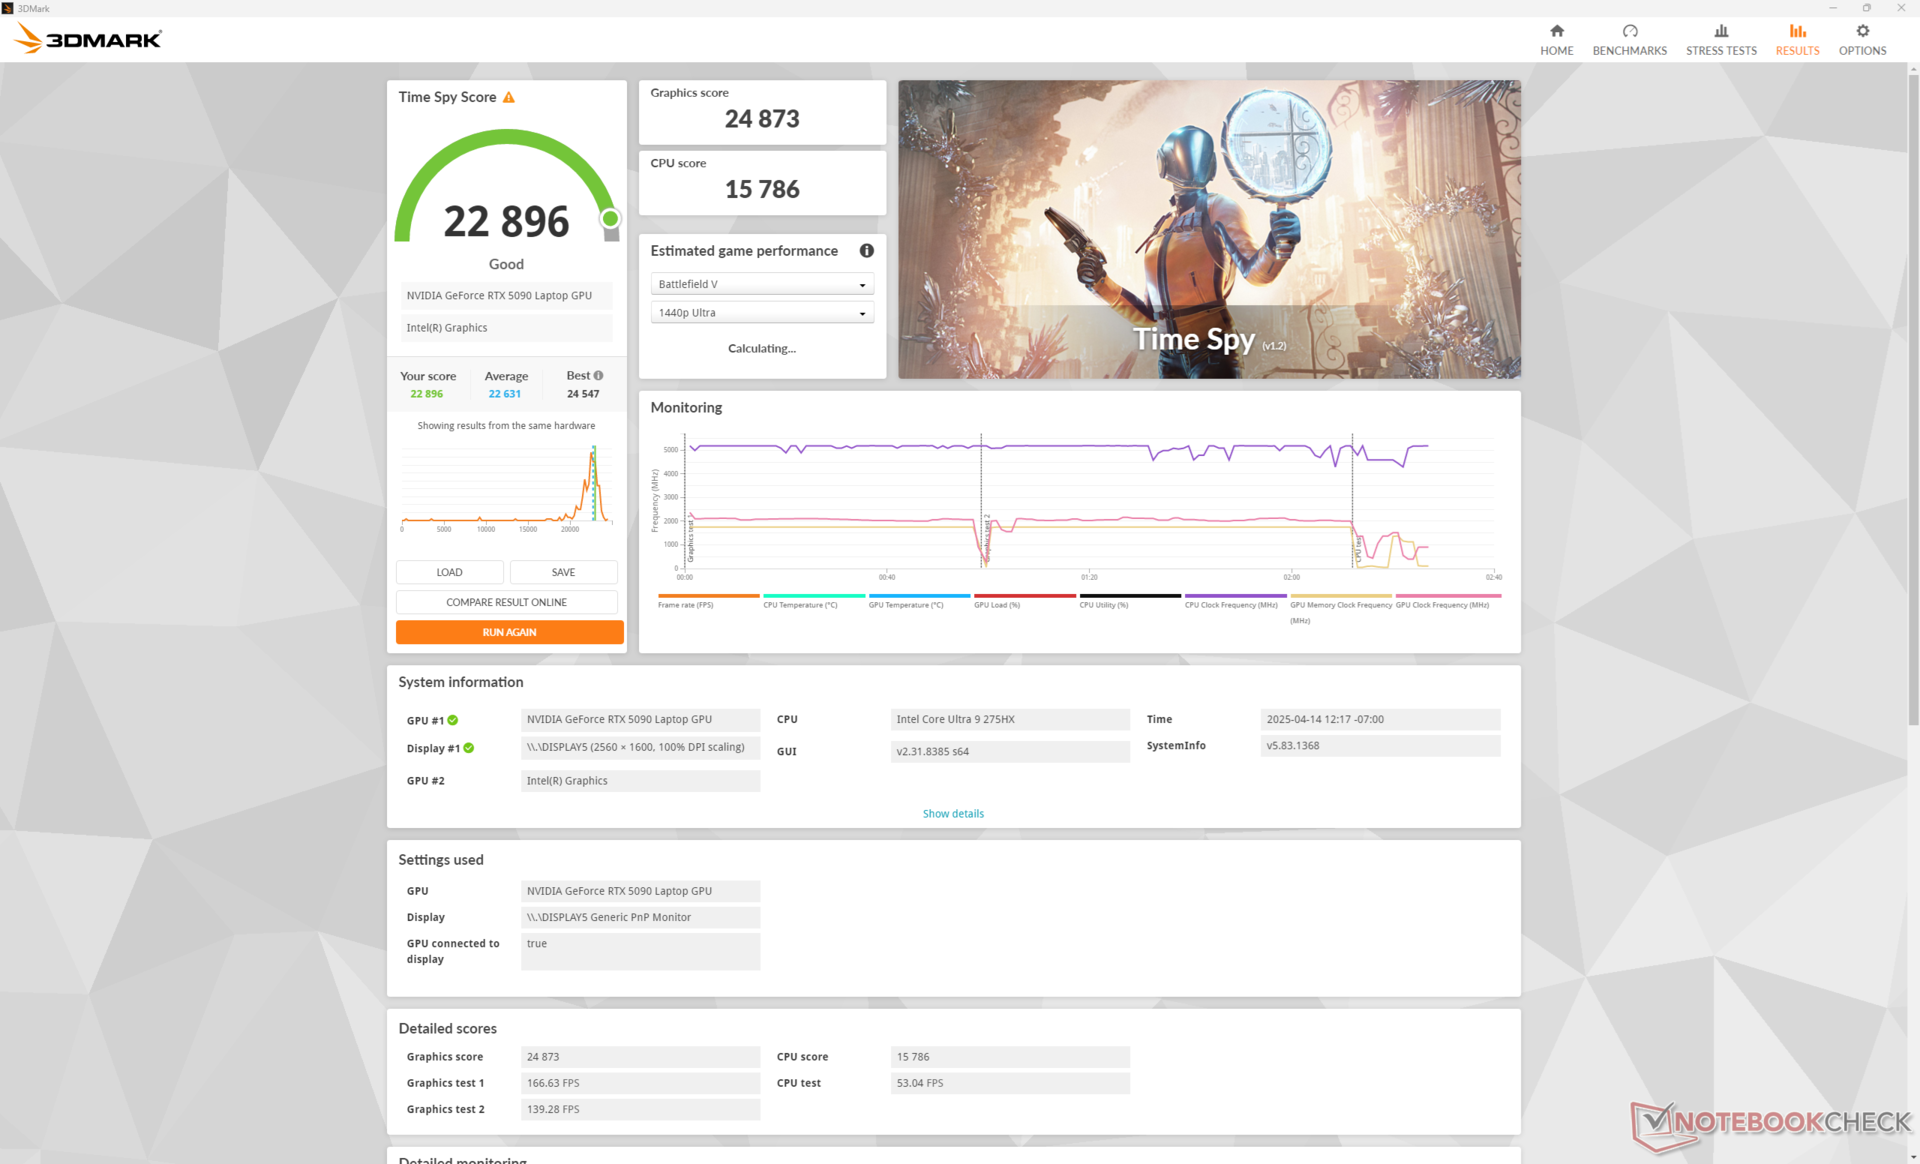
| 3DMark 11 Performance | 48481 points | |
| 3DMark Fire Strike Score | 36501 points | |
| 3DMark Time Spy Score | 22896 points | |
Aide | ||
* ... Moindre est la valeur, meilleures sont les performances
Performances des jeux
Alors que la RTX 5090 de bureau s'associe bien avec un écran 4K, la RTX 5090 mobile s'associe bien avec un écran 2K ou 3K. Des titres exigeants comme Monster Hunter Wilds ou Alan Wake 2 peuvent déjà tourner avec les paramètres maximums à plus de 60 FPS sur un écran 2K avant d'appliquer les fonctions DLSS ou FG. La DLSS et/ou des paramètres légèrement inférieurs sont recommandés si vous jouez sur un écran 4K externe afin de maintenir des taux d'images par seconde supérieurs à 60.
La génération d'images multiples n'est pas recommandée si le taux d'images par seconde est de 60 ou moins, car le délai d'entrée devient très perceptible, comme nous l'avons constaté avec Alan Wake 2 ou Indiana Jones. Des paramètres plus bas, des résolutions plus faibles et/ou le mode Performance DLSS sont plutôt recommandés pour augmenter les taux d'images de base avant d'appliquer la MFG.
Cyberpunk 2077 ultra FPS Chart
| Bas | Moyen | Élevé | Ultra | QHD DLSS | QHD | 4K DLSS | 4K FSR | 4K | |
|---|---|---|---|---|---|---|---|---|---|
| Dota 2 Reborn (2015) | 215 | 186.6 | 178.9 | 161 | 151.6 | ||||
| Final Fantasy XV Benchmark (2018) | 226 | 203 | 177.2 | 104.7 | |||||
| X-Plane 11.11 (2018) | 140.4 | 141.5 | 112.6 | 89.9 | |||||
| Strange Brigade (2018) | 382 | 319 | 179.6 | ||||||
| Cyberpunk 2077 (2023) | 173.7 | 171.6 | 161.5 | 151.9 | 126.2 | 111.3 | 46.4 | 52.8 | |
| Alan Wake 2 (2023) | 82.9 | 69.7 | 46.2 | ||||||
| F1 24 (2024) | 152.2 | 151 | 104.3 | 87.9 | 52 | ||||
| Indiana Jones and the Great Circle (2024) | 142.3 | 120.6 | 115.9 | 68.6 | |||||
| Monster Hunter Wilds (2025) | 88.2 | 85 | 74.7 | 64 | 47.5 | ||||
| Assassin's Creed Shadows (2025) | 70 | 64 | 55 | 53 | 40 |
Émissions
Bruit du système
Les ventilateurs font un excellent travail en restant silencieux lors de l'exécution de charges peu exigeantes comme les navigateurs ou les vidéos avec un comportement de pulsation minimal. En revanche, ils peuvent devenir très bruyants très rapidement même en mode équilibré où nous avons pu mesurer 48 dB(A) pendant les 90 premières secondes de 3DMark 06. Ce comportement est malheureusement courant sur les ordinateurs portables de jeu.
Le bruit du ventilateur lors de l'utilisation de Cyberpunk 2077 en mode Balanced, Performance et Unleashed se stabilise à 45 dB(A), 55 dB(A) et 61 dB(A), respectivement. Il est recommandé d'utiliser un casque à 60 dB(A) ou plus, car même les haut-parleurs internes ne sont pas assez puissants pour vaincre les ventilateurs à ce stade. Le mode Unleashed permet de tirer le maximum de performances du GPU, comme indiqué dans la section GPU ci-dessus, mais les gains sont très faibles par rapport à l'augmentation très forte du bruit. Les joueurs peuvent donc préférer le mode Performance ou le mode Équilibré.

Degré de la nuisance sonore
| Au repos |
| 29 / 29 / 29 dB(A) |
| Fortement sollicité |
| 47.7 / 61.1 dB(A) |
 | ||
30 dB silencieux 40 dB(A) audible 50 dB(A) bruyant |
||
min: | ||
| HP Omen Max 16 ah000 GeForce RTX 5090 Laptop, Ultra 9 275HX, WDC PC SN810 2TB | HP Omen 16 (2024) GeForce RTX 4080 Laptop GPU, i9-14900HX, SK hynix PC801 HFS001TEJ9X101N | Asus ROG Zephyrus G16 GU605CX GeForce RTX 5090 Laptop, Ultra 9 285H, Western Digital PC SN5000S SDEPNSJ-2T00-1006 | Razer Blade 16 2025 RTX 5090 GeForce RTX 5090 Laptop, Ryzen AI 9 HX 370, SSSTC CA6-8D2048 | MSI Vector 16 HX A14V GeForce RTX 4080 Laptop GPU, i9-14900HX, WD PC SN560 SDDPNQE-1T00 | Lenovo Legion 9 16IRX9, RTX 4090 GeForce RTX 4090 Laptop GPU, i9-14900HX, Micron 3400 2TB MTFDKBA2T0TFH | |
|---|---|---|---|---|---|---|
| Noise | 1% | 4% | 4% | -10% | 15% | |
| arrêt / environnement * (dB) | 22.8 | 25 -10% | 23.8 -4% | 24.1 -6% | 23.2 -2% | 23 -1% |
| Idle Minimum * (dB) | 29 | 29 -0% | 23.8 18% | 24.1 17% | 33.5 -16% | 23 21% |
| Idle Average * (dB) | 29 | 30 -3% | 27.2 6% | 30.6 -6% | 33.5 -16% | 23 21% |
| Idle Maximum * (dB) | 29 | 31 -7% | 31.3 -8% | 30.6 -6% | 33.5 -16% | 23 21% |
| Load Average * (dB) | 47.7 | 46 4% | 47.6 -0% | 45.5 5% | 52.1 -9% | 39 18% |
| Cyberpunk 2077 ultra * (dB) | 54.8 | 51.3 6% | 48.2 12% | |||
| Load Maximum * (dB) | 61.1 | 47 23% | 53.3 13% | 53.4 13% | 62 -1% | 55.56 9% |
| Witcher 3 ultra * (dB) | 47 | 62 | 55.32 |
* ... Moindre est la valeur, meilleures sont les performances
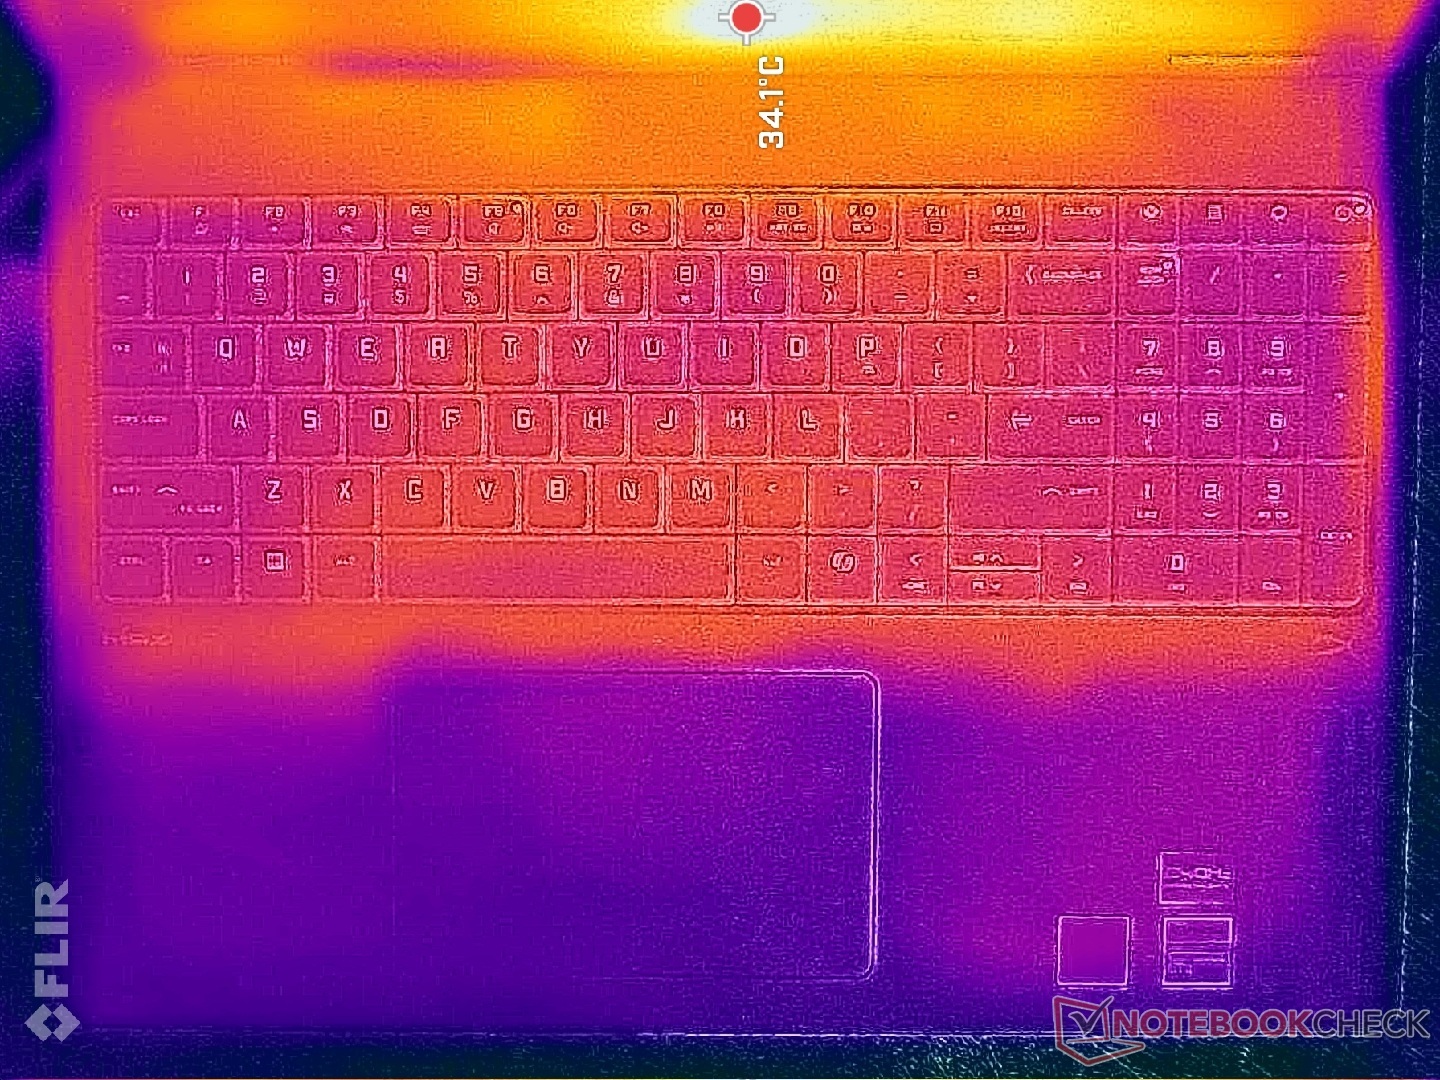
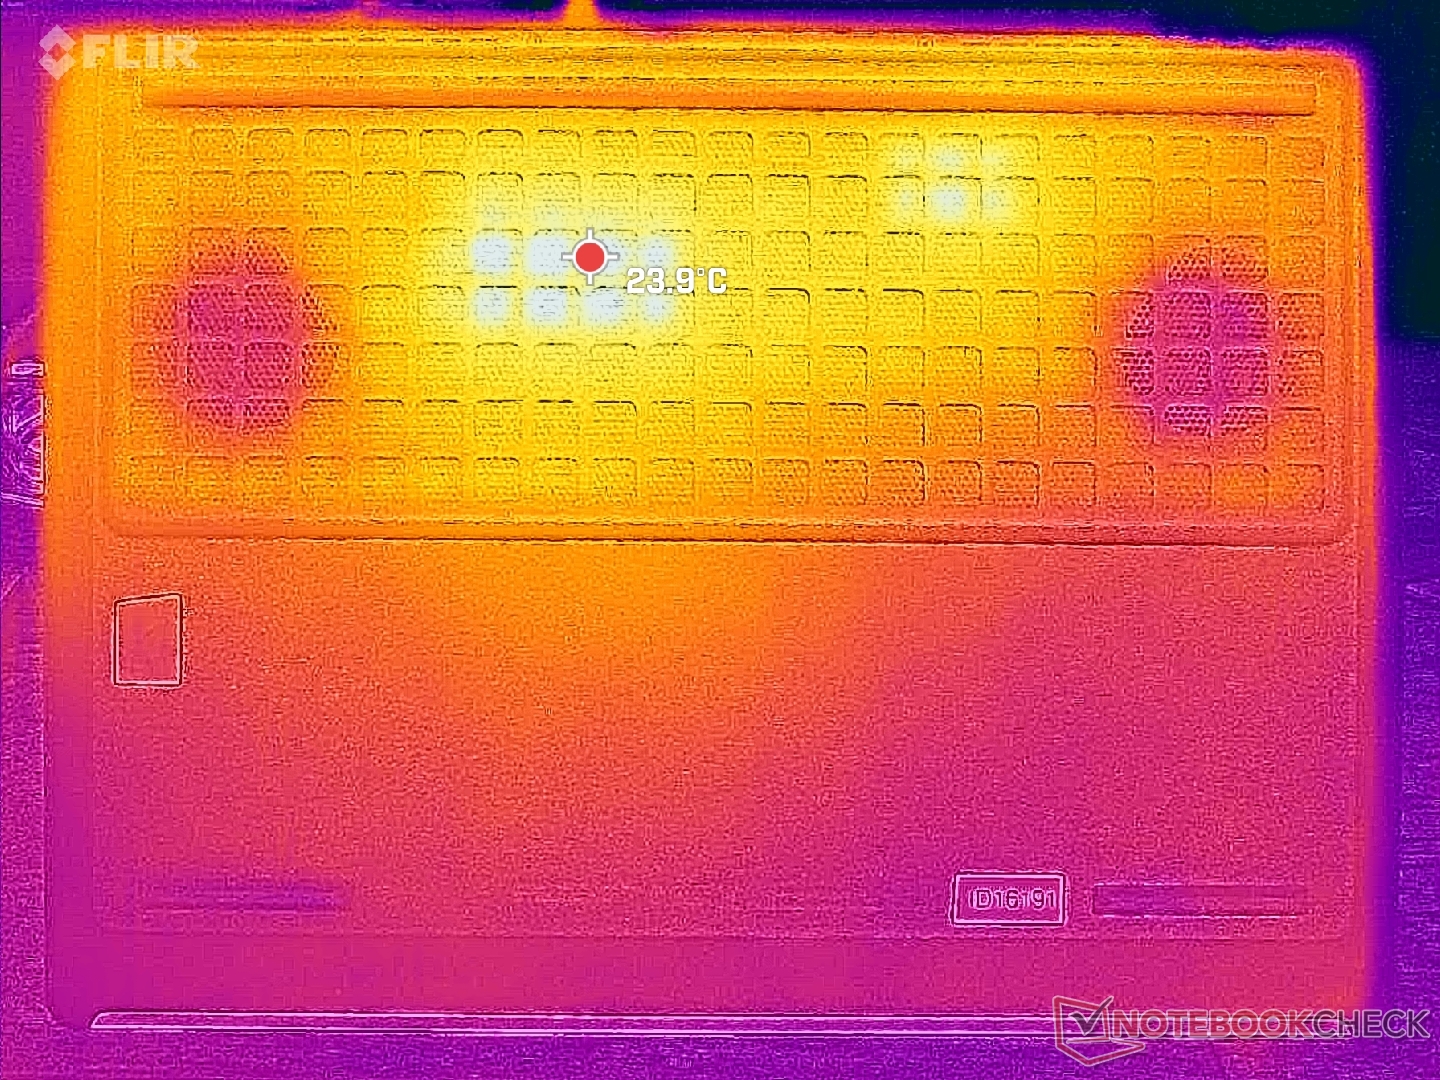
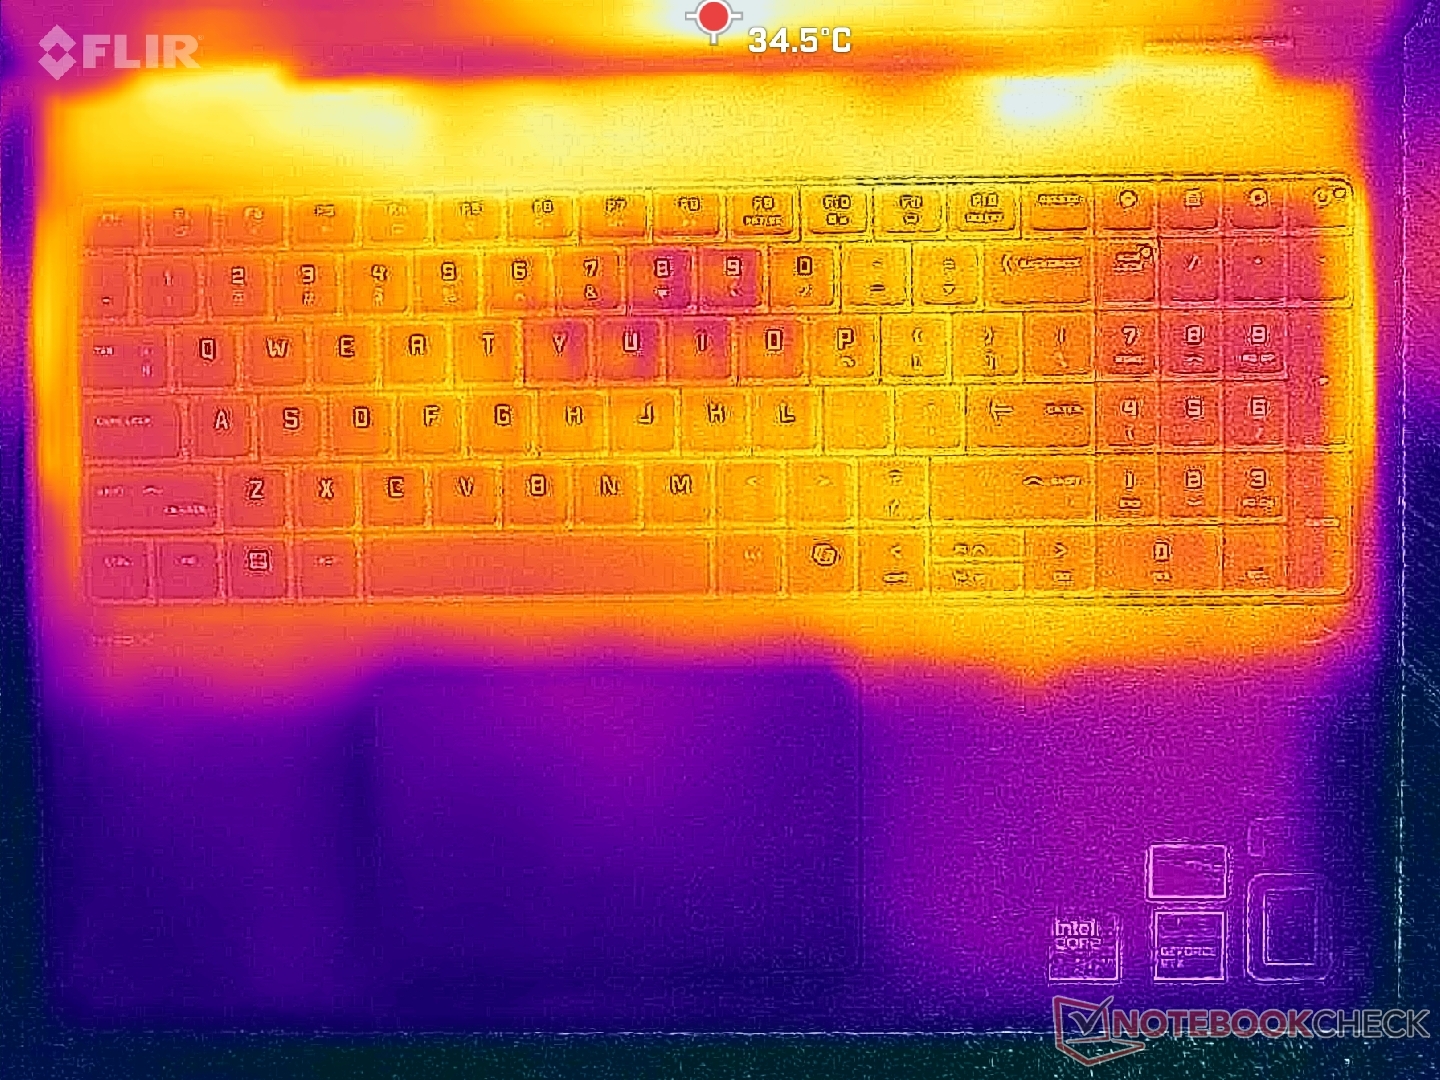
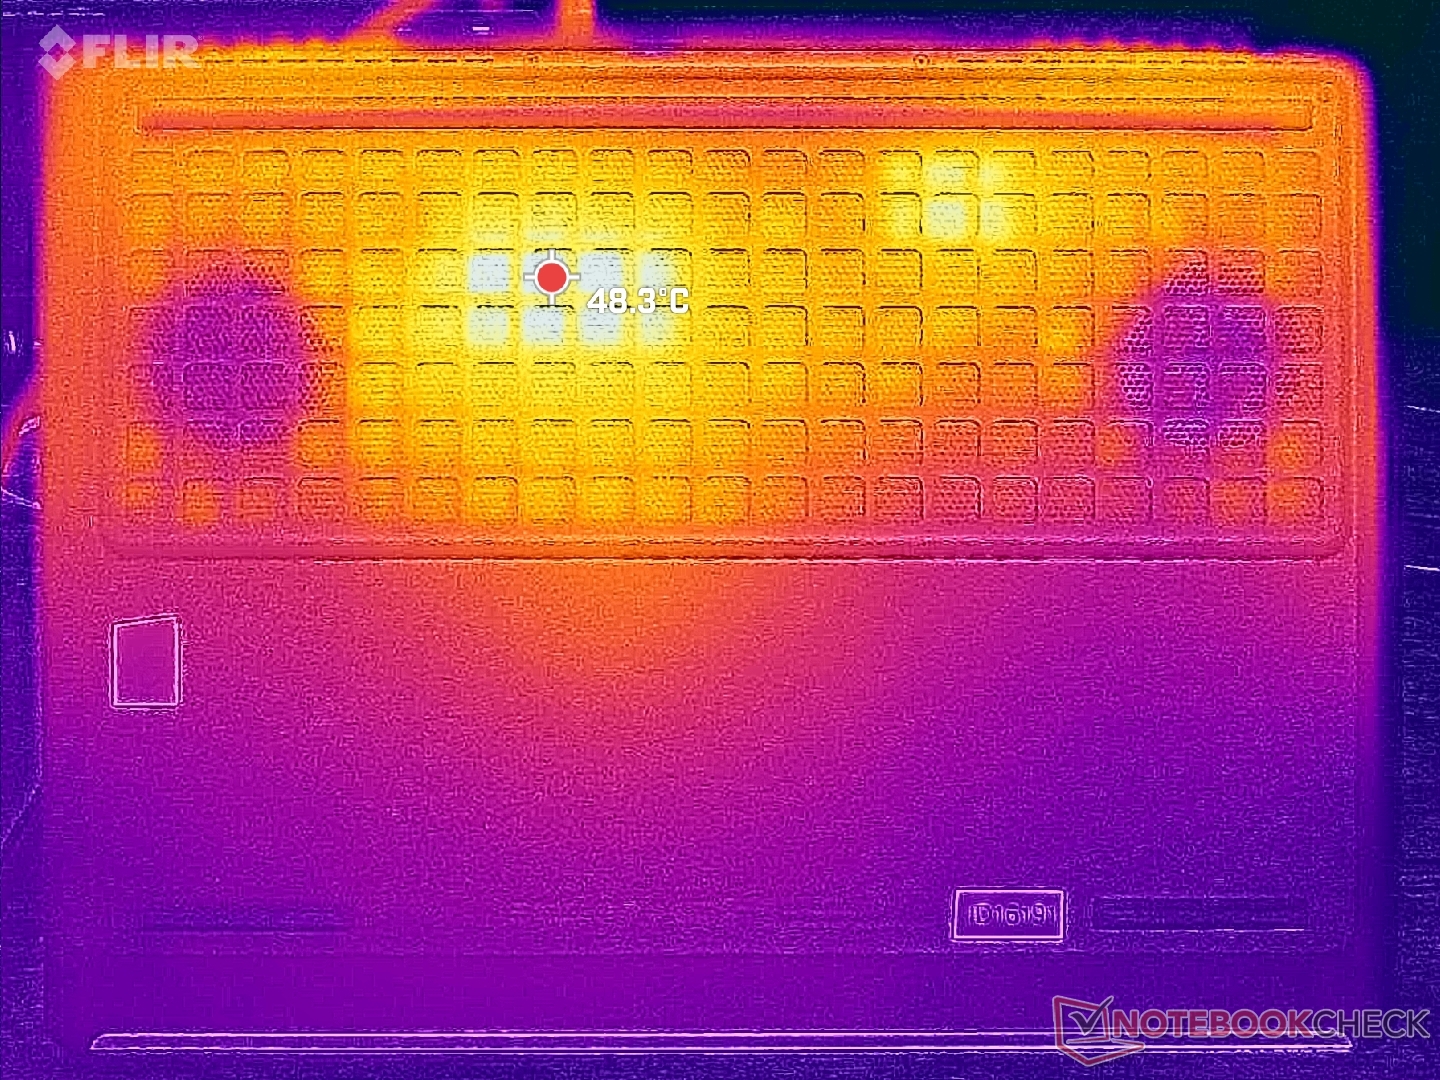
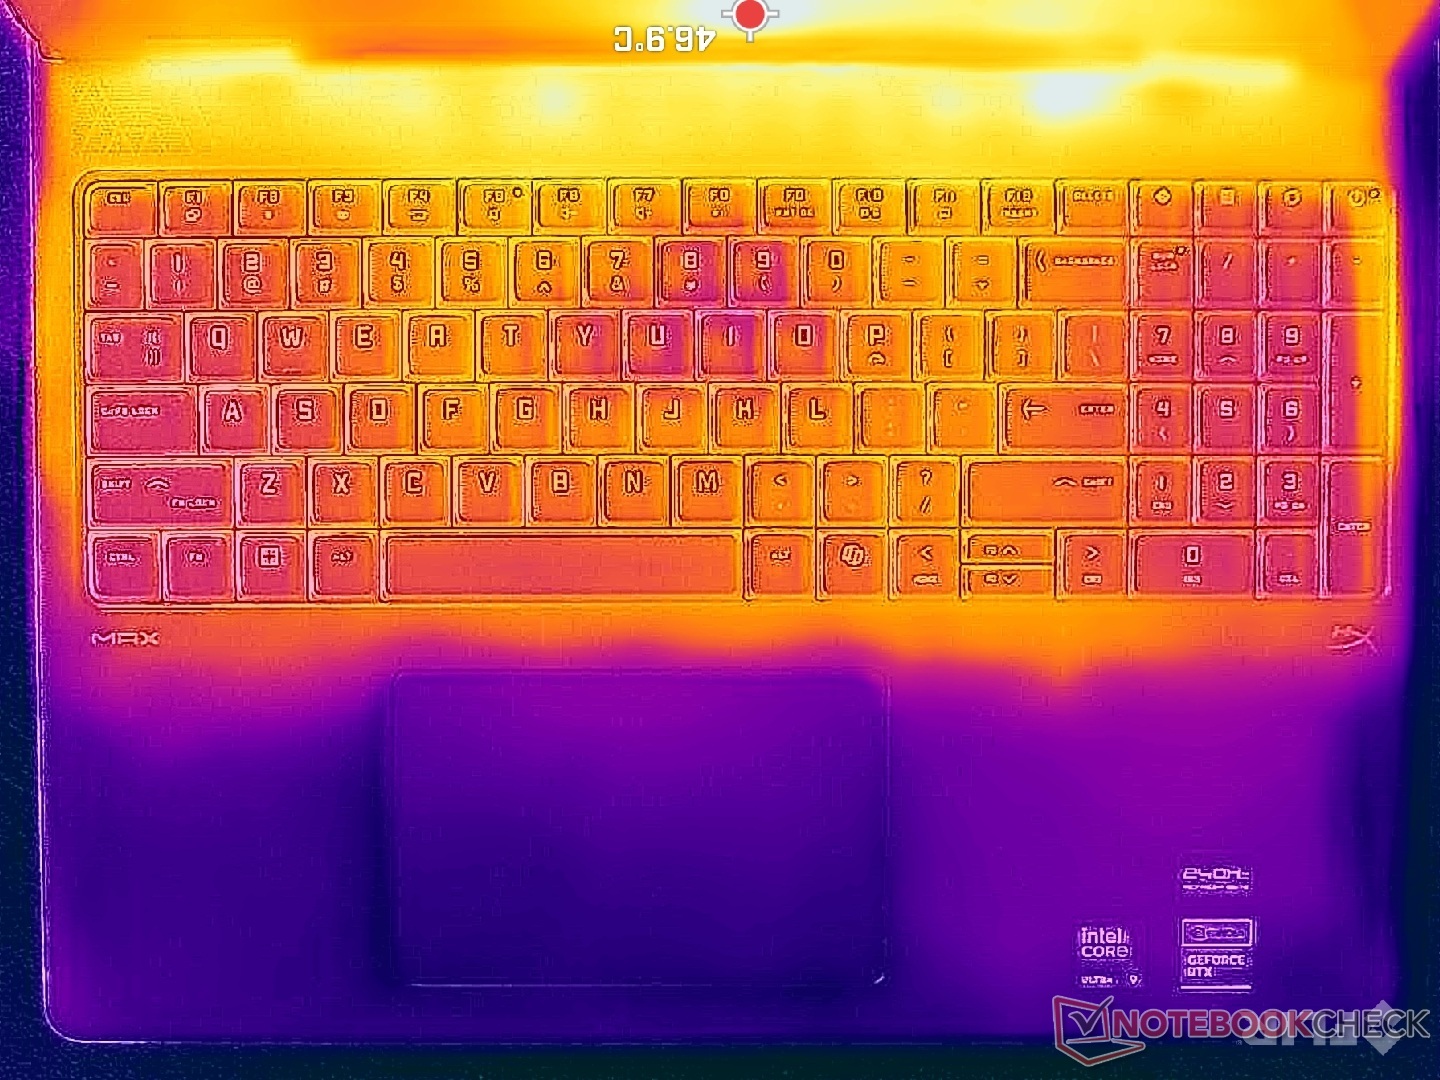
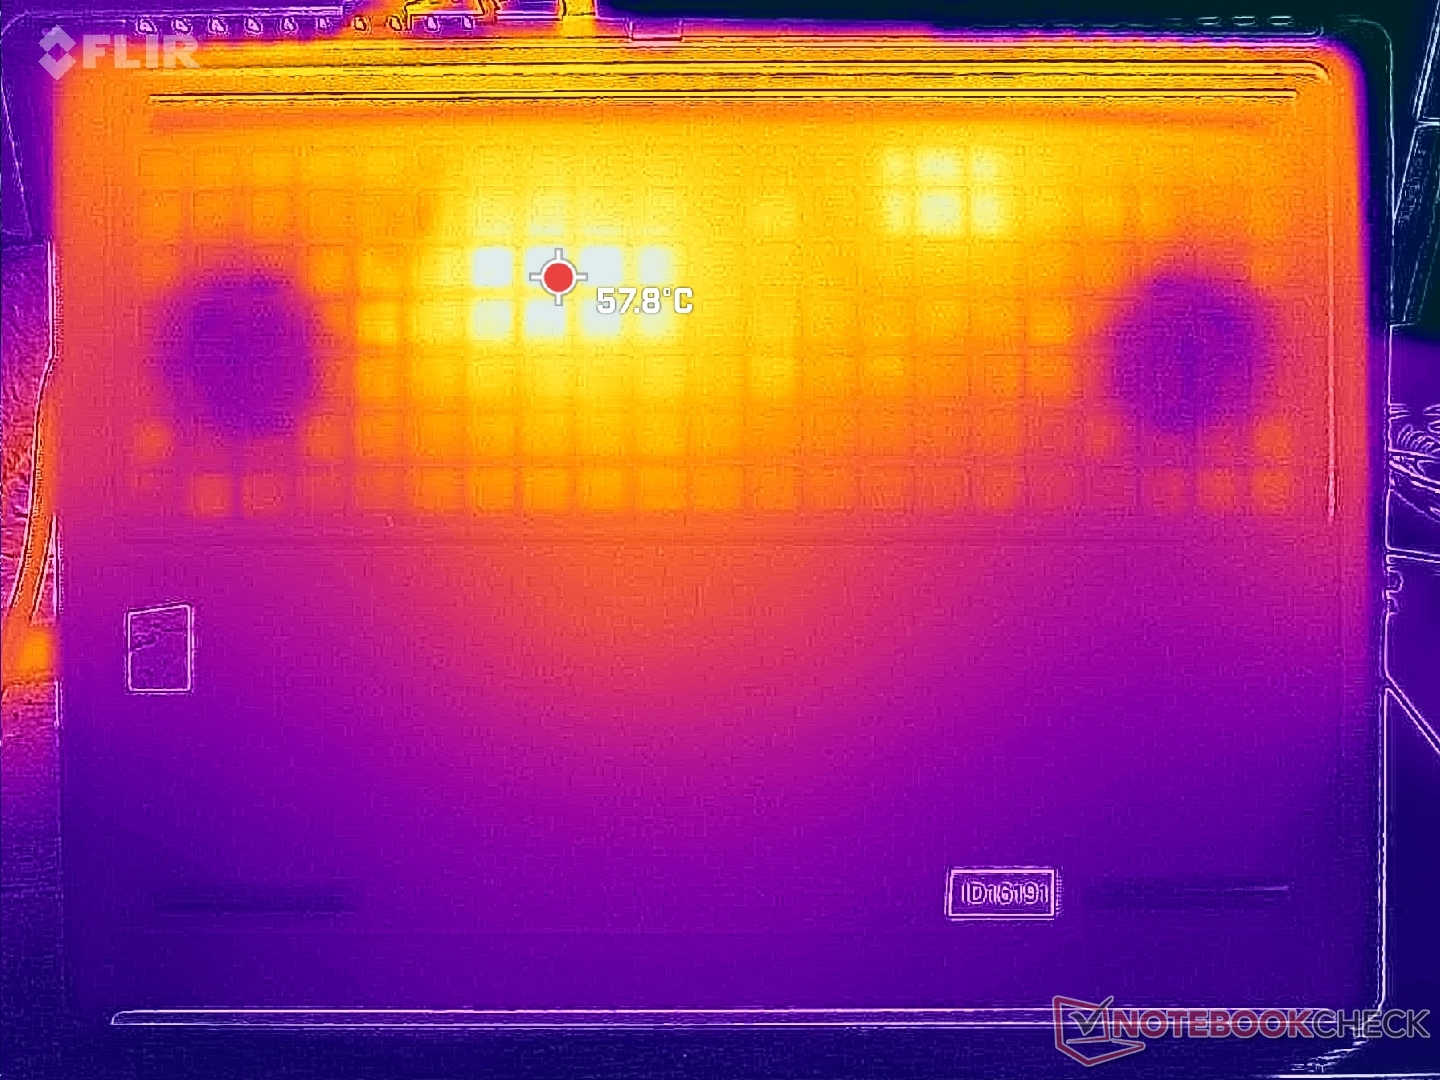
Température
Les points chauds pendant le jeu peuvent atteindre plus de 35 C et 46 C sur le clavier et le capot inférieur, respectivement. Ces zones se trouvent à l'arrière de l'appareil, loin des zones fréquemment touchées comme les appuis palmaires, les touches WASD ou le pavé numérique. Les températures moyennes sont nettement inférieures à celles que nous avons observées sur les modèles 2024 Omen 16 et 2024 Omen 16 2024 Omen 16 de plusieurs degrés C, probablement en raison de toutes les mises à jour internes.
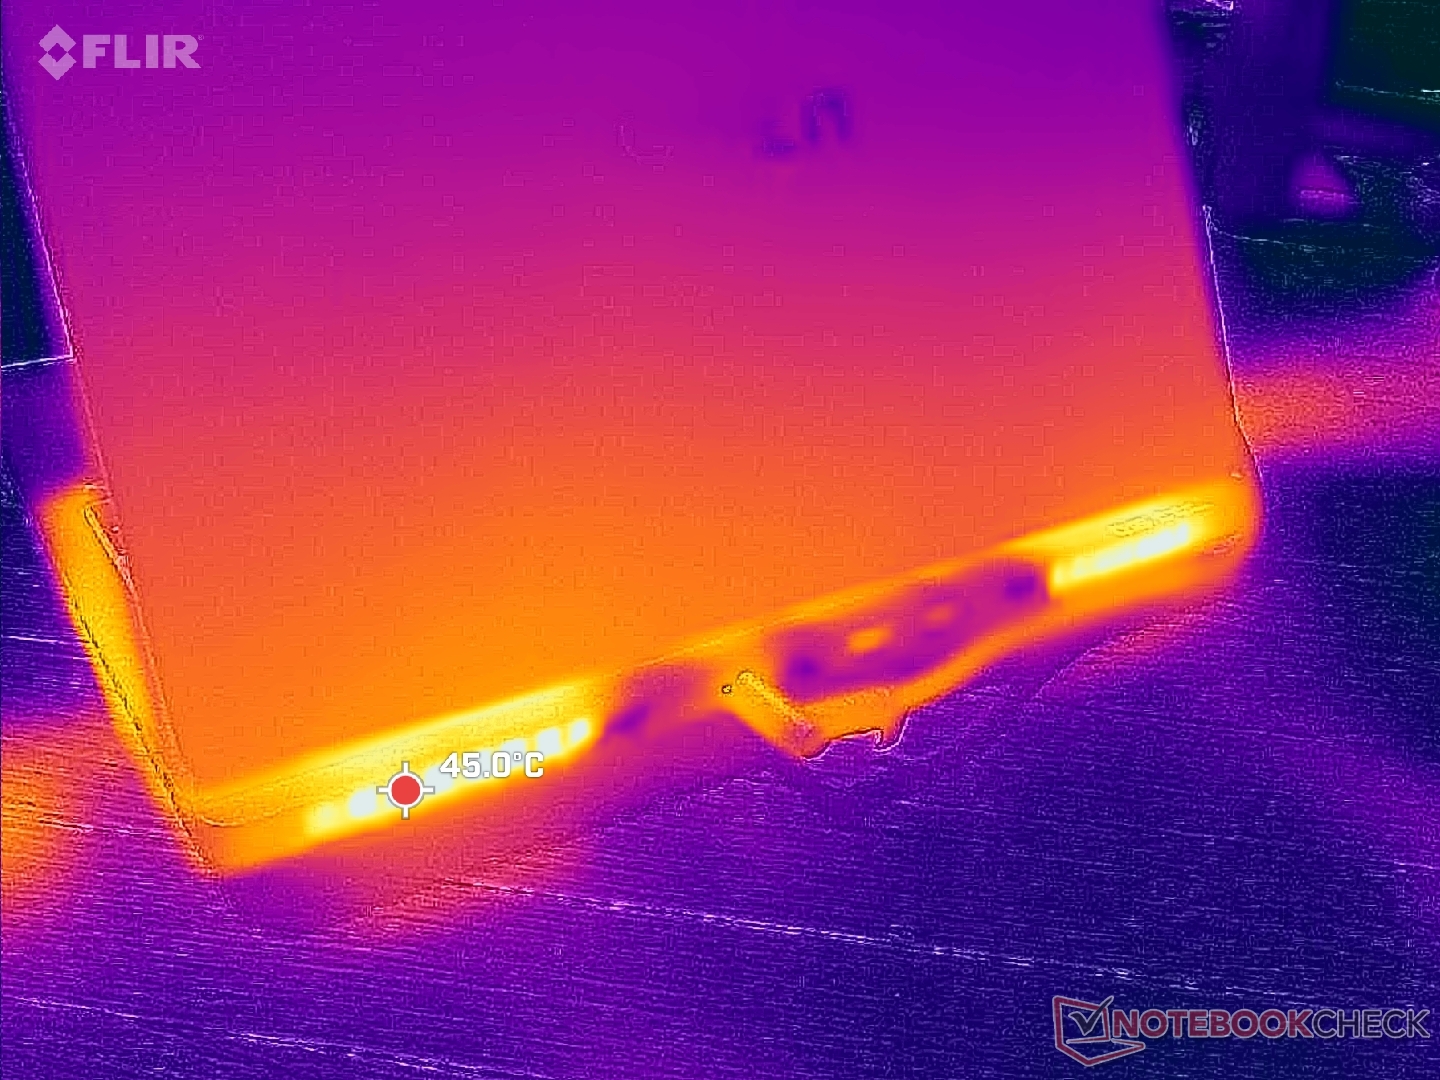
(±) La température maximale du côté supérieur est de 42.8 °C / 109 F, par rapport à la moyenne de 40.4 °C / 105 F, allant de 21.2 à 68.8 °C pour la classe Gaming.
(-) Le fond chauffe jusqu'à un maximum de 50.2 °C / 122 F, contre une moyenne de 43.2 °C / 110 F
(+) En utilisation inactive, la température moyenne du côté supérieur est de 24.3 °C / 76 F, par rapport à la moyenne du dispositif de 33.9 °C / 93 F.
(+) 3: The average temperature for the upper side is 29.6 °C / 85 F, compared to the average of 33.9 °C / 93 F for the class Gaming.
(+) Les repose-poignets et le pavé tactile sont plus froids que la température de la peau avec un maximum de 26 °C / 78.8 F et sont donc froids au toucher.
(+) La température moyenne de la zone de l'appui-paume de dispositifs similaires était de 28.8 °C / 83.8 F (+2.8 °C / #5 F).
| HP Omen Max 16 ah000 Intel Core Ultra 9 275HX, NVIDIA GeForce RTX 5090 Laptop | HP Omen 16 (2024) Intel Core i9-14900HX, NVIDIA GeForce RTX 4080 Laptop GPU | Asus ROG Zephyrus G16 GU605CX Intel Core Ultra 9 285H, NVIDIA GeForce RTX 5090 Laptop | Razer Blade 16 2025 RTX 5090 AMD Ryzen AI 9 HX 370, NVIDIA GeForce RTX 5090 Laptop | MSI Vector 16 HX A14V Intel Core i9-14900HX, NVIDIA GeForce RTX 4080 Laptop GPU | Lenovo Legion 9 16IRX9, RTX 4090 Intel Core i9-14900HX, NVIDIA GeForce RTX 4090 Laptop GPU | |
|---|---|---|---|---|---|---|
| Heat | -4% | 4% | -10% | 11% | -31% | |
| Maximum Upper Side * (°C) | 42.8 | 47 -10% | 44 -3% | 48.3 -13% | 36.4 15% | 56 -31% |
| Maximum Bottom * (°C) | 50.2 | 57 -14% | 44.1 12% | 53.3 -6% | 35.6 29% | 53 -6% |
| Idle Upper Side * (°C) | 27.6 | 25 9% | 26.1 5% | 28.3 -3% | 26.6 4% | 38 -38% |
| Idle Bottom * (°C) | 26.2 | 26 1% | 25.5 3% | 30.3 -16% | 27 -3% | 39 -49% |
* ... Moindre est la valeur, meilleures sont les performances
Intervenants
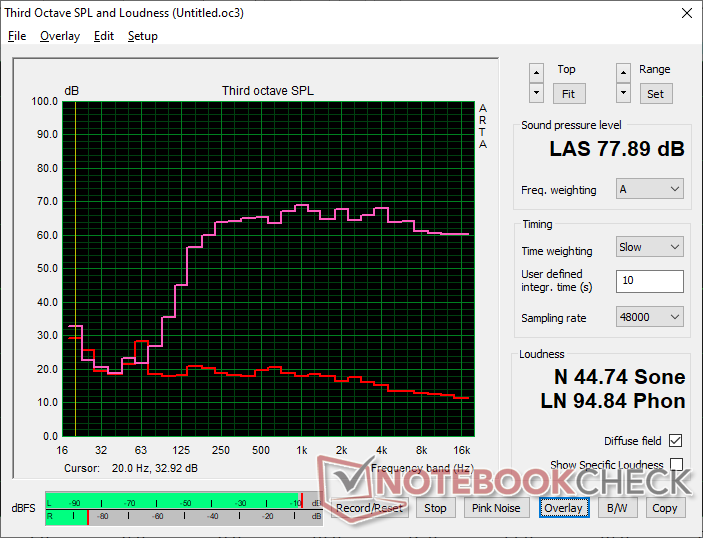
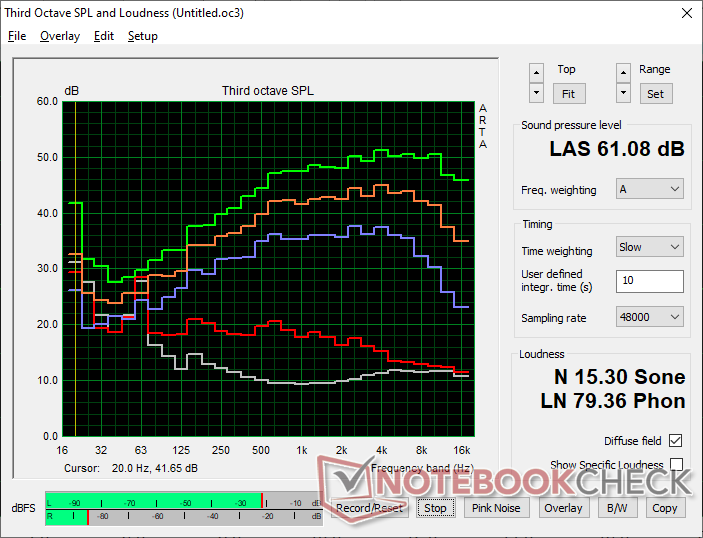
HP Omen Max 16 ah000 analyse audio
(±) | le niveau sonore du haut-parleur est moyen mais bon (77.9# dB)
Basses 100 - 315 Hz
(±) | basse réduite - en moyenne 9.9% inférieure à la médiane
(±) | la linéarité des basses est moyenne (13.4% delta à la fréquence précédente)
Médiums 400 - 2000 Hz
(+) | médiane équilibrée - seulement 2.3% de la médiane
(+) | les médiums sont linéaires (4.3% delta à la fréquence précédente)
Aiguës 2 - 16 kHz
(+) | des sommets équilibrés - à seulement 1.9% de la médiane
(+) | les aigus sont linéaires (4.8% delta à la fréquence précédente)
Globalement 100 - 16 000 Hz
(+) | le son global est linéaire (11.4% différence à la médiane)
Par rapport à la même classe
» 9% de tous les appareils testés de cette catégorie étaient meilleurs, 3% similaires, 88% pires
» Le meilleur avait un delta de 6%, la moyenne était de 18%, le pire était de 132%.
Par rapport à tous les appareils testés
» 7% de tous les appareils testés étaient meilleurs, 2% similaires, 90% pires
» Le meilleur avait un delta de 4%, la moyenne était de 23%, le pire était de 134%.
Apple MacBook Pro 16 2021 M1 Pro analyse audio
(+) | les haut-parleurs peuvent jouer relativement fort (84.7# dB)
Basses 100 - 315 Hz
(+) | bonne basse - seulement 3.8% loin de la médiane
(+) | les basses sont linéaires (5.2% delta à la fréquence précédente)
Médiums 400 - 2000 Hz
(+) | médiane équilibrée - seulement 1.3% de la médiane
(+) | les médiums sont linéaires (2.1% delta à la fréquence précédente)
Aiguës 2 - 16 kHz
(+) | des sommets équilibrés - à seulement 1.9% de la médiane
(+) | les aigus sont linéaires (2.7% delta à la fréquence précédente)
Globalement 100 - 16 000 Hz
(+) | le son global est linéaire (4.6% différence à la médiane)
Par rapport à la même classe
» 0% de tous les appareils testés de cette catégorie étaient meilleurs, 0% similaires, 100% pires
» Le meilleur avait un delta de 5%, la moyenne était de 17%, le pire était de 45%.
Par rapport à tous les appareils testés
» 0% de tous les appareils testés étaient meilleurs, 0% similaires, 100% pires
» Le meilleur avait un delta de 4%, la moyenne était de 23%, le pire était de 134%.
Gestion de l'énergie - Un processeur très exigeant
Consommation électrique
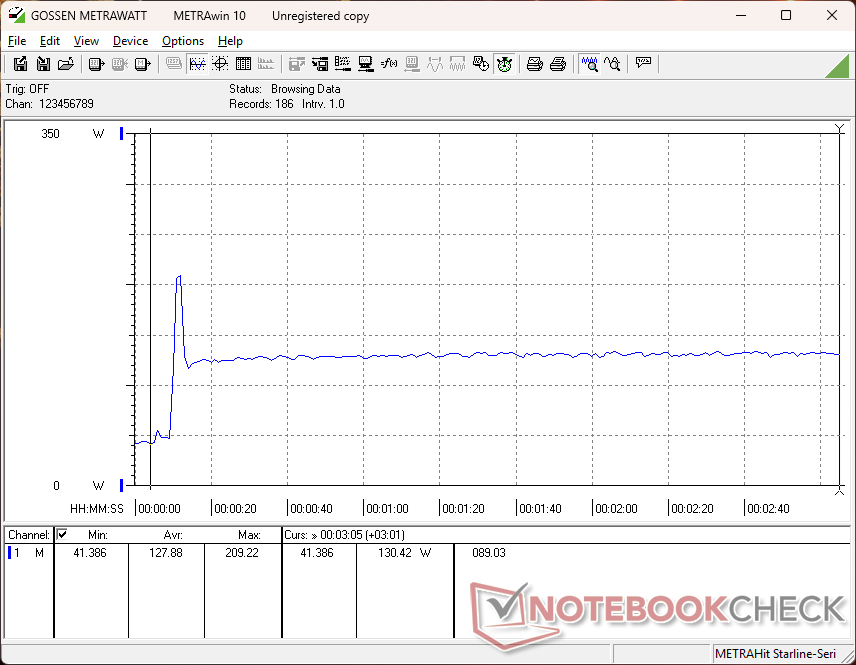
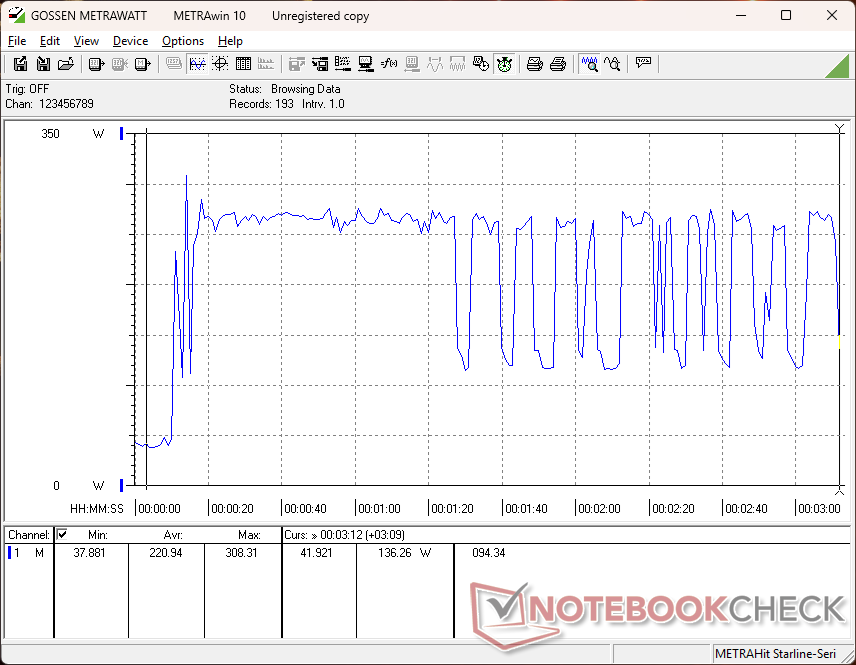
La consommation varie considérablement lorsque l'ordinateur tourne au ralenti sur le bureau, en raison du panneau OLED et des paramètres du GPU. En mode Power Saver iGPU avec la luminosité au minimum, par exemple, la consommation peut être aussi basse que 10 W contre 47 W en mode Performance dGPU avec la luminosité maximale et un écran tout blanc.
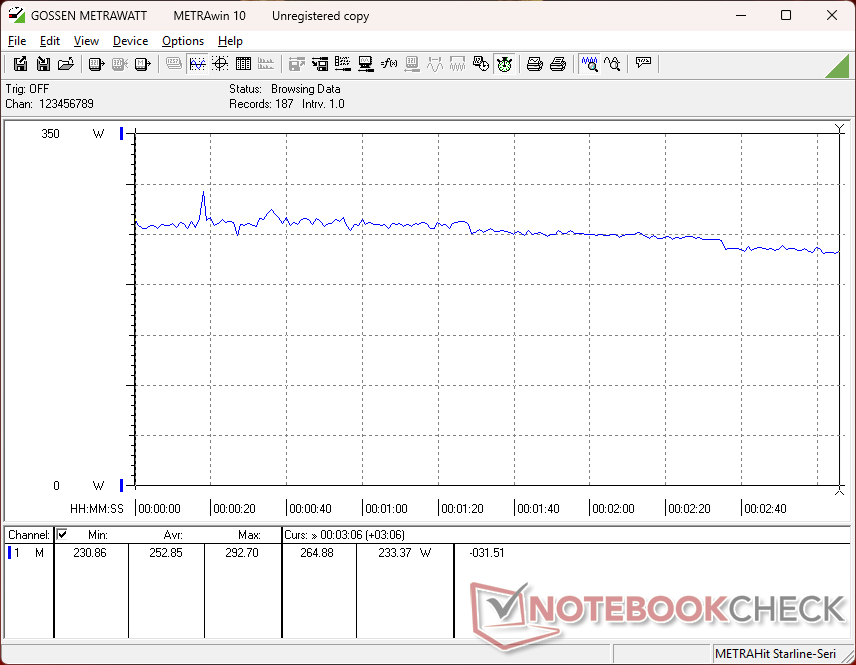
La consommation oscille entre 130 W et 270 W lors de l'exécution simultanée de Prime95 et FurMark, même en mode Unleashed, ce qui suggère des problèmes pour maintenir des performances constantes en cas de sollicitation maximale. Bien que des charges aussi extrêmes ne soient pas courantes, ce même test sur la plupart des autres ordinateurs portables de jeu donnerait des résultats plus stables et plus cohérents en comparaison.
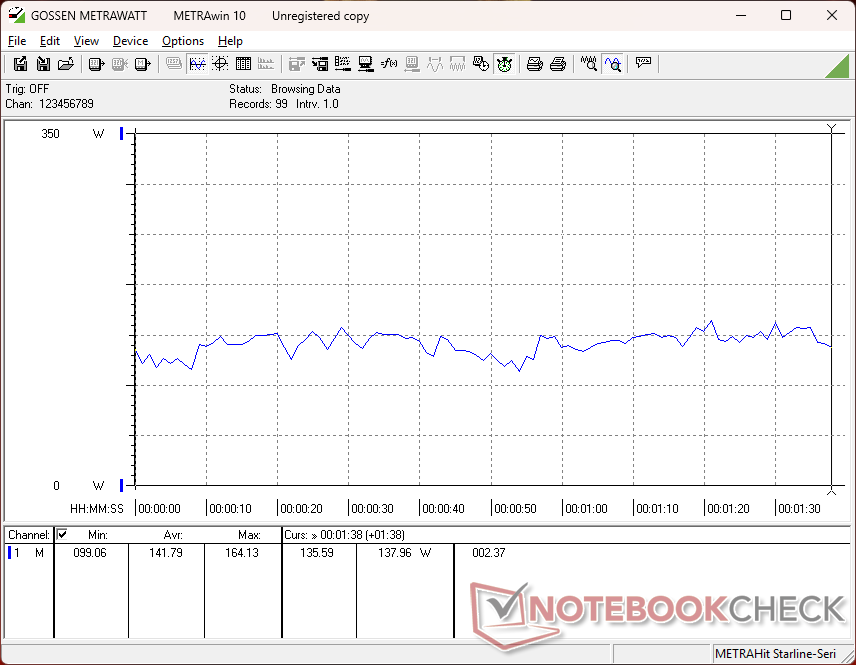
L'exécution de Cyberpunk 2077 demande beaucoup plus de puissance que sur le ROG Zephyrus G16 ou le Blade 16 avec le même GPU RTX 5090, probablement en raison du CPU de la série HX et de l'objectif TGP plus élevé de notre HP.
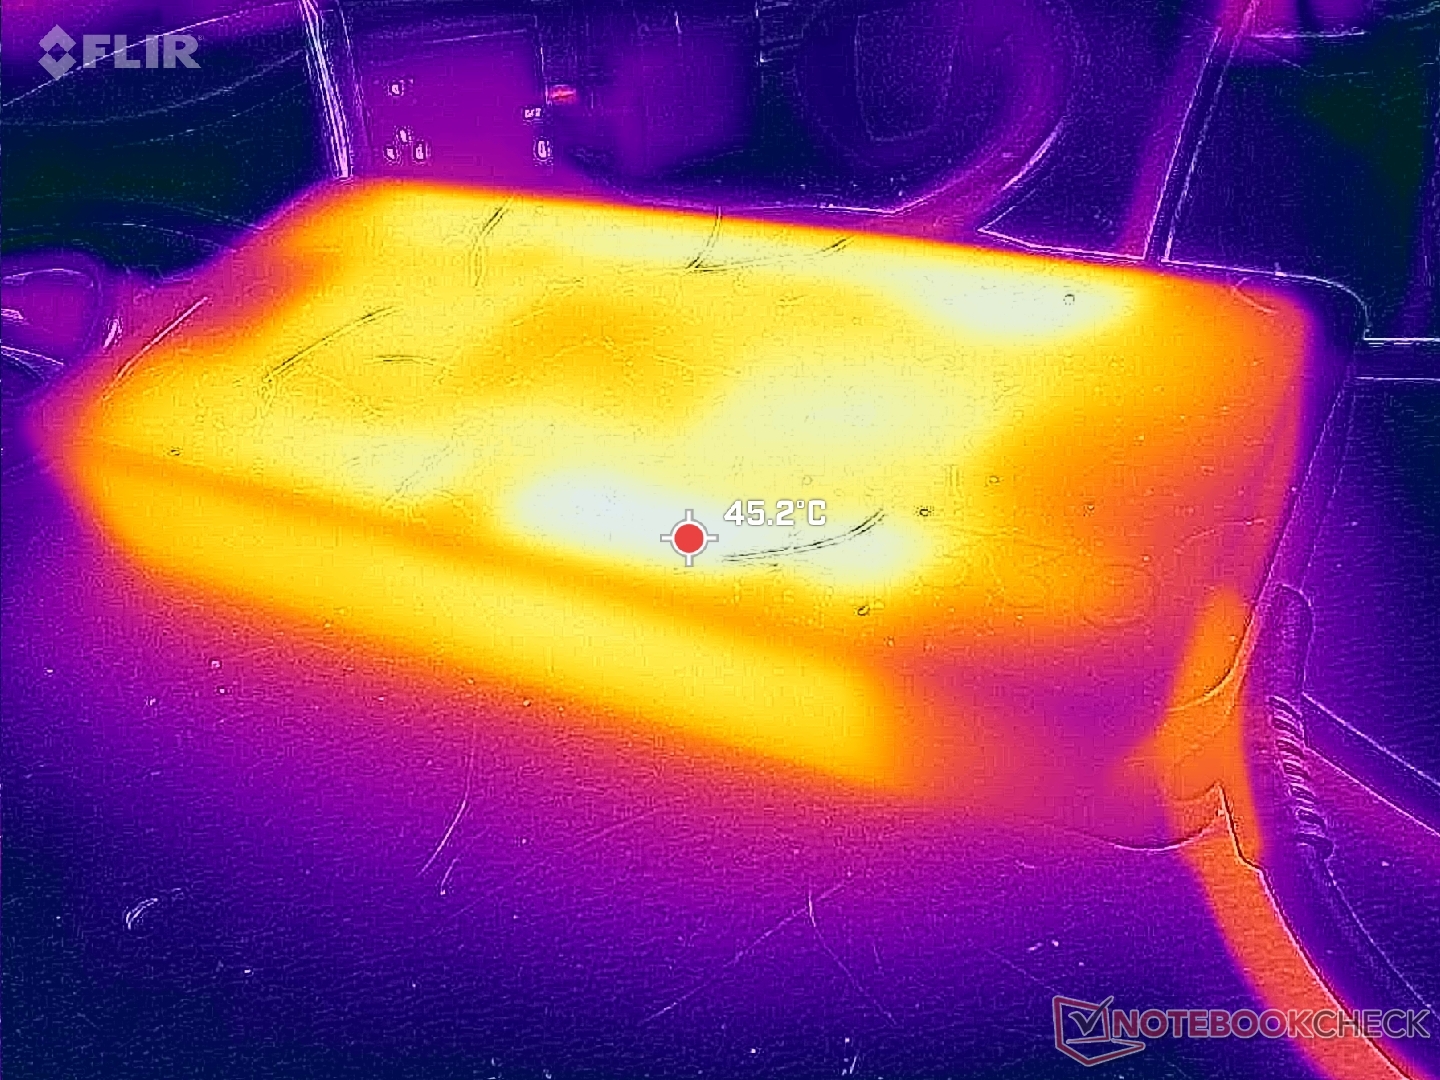
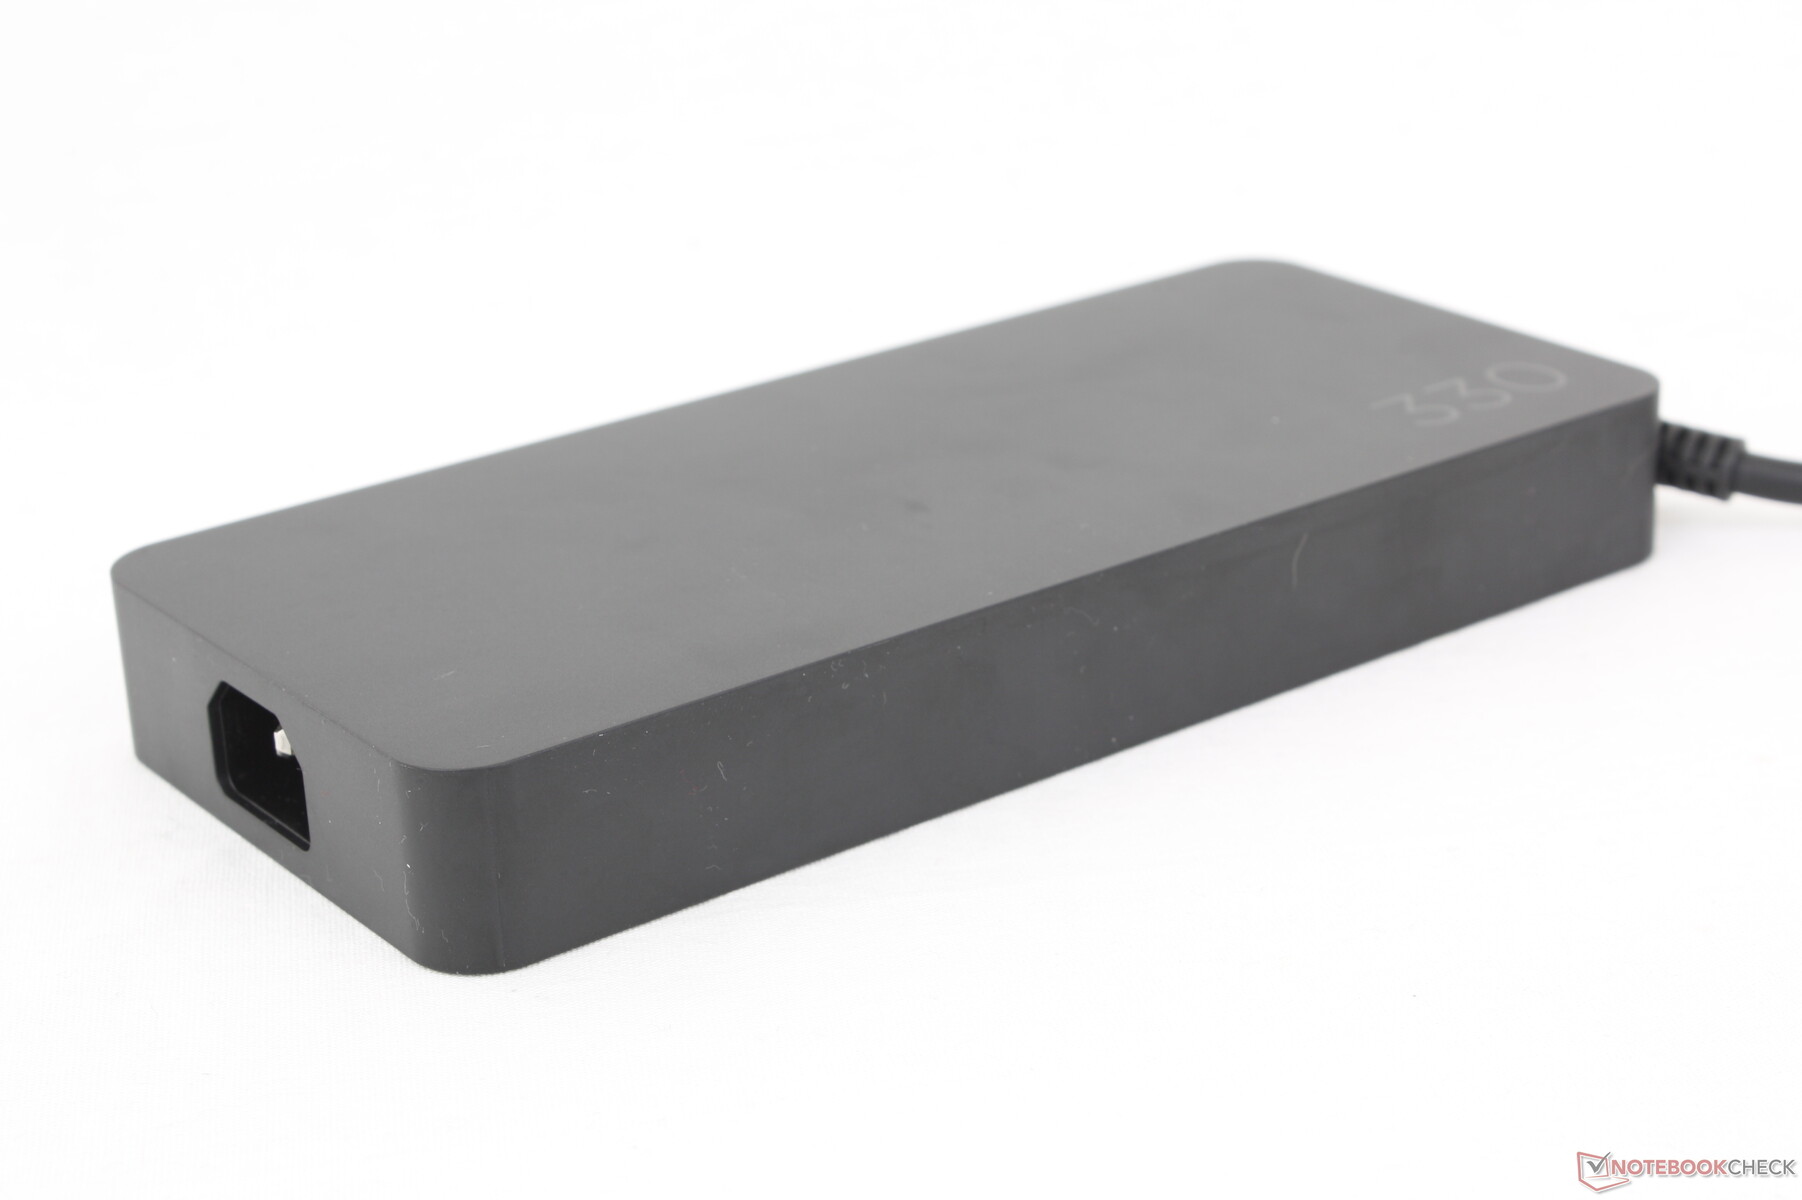
Nous avons pu enregistrer une consommation maximale de 309 W sur le grand adaptateur secteur (~20 x 9 x 2,5 cm) de 330 W lorsque le CPU et le GPU sont pleinement sollicités.
| Éteint/en veille | |
| Au repos | |
| Fortement sollicité |
|
Légende:
min: | |
| HP Omen Max 16 ah000 Ultra 9 275HX, GeForce RTX 5090 Laptop, WDC PC SN810 2TB, OLED, 2560x1600, 16" | HP Omen 16 (2024) i9-14900HX, GeForce RTX 4080 Laptop GPU, SK hynix PC801 HFS001TEJ9X101N, IPS, 2560x1440, 16.1" | Asus ROG Zephyrus G16 GU605CX Ultra 9 285H, GeForce RTX 5090 Laptop, Western Digital PC SN5000S SDEPNSJ-2T00-1006, OLED, 2560x1600, 16" | Razer Blade 16 2025 RTX 5090 Ryzen AI 9 HX 370, GeForce RTX 5090 Laptop, SSSTC CA6-8D2048, OLED, 2560x1600, 16" | MSI Vector 16 HX A14V i9-14900HX, GeForce RTX 4080 Laptop GPU, WD PC SN560 SDDPNQE-1T00, IPS, 2560x1600, 16" | Lenovo Legion 9 16IRX9, RTX 4090 i9-14900HX, GeForce RTX 4090 Laptop GPU, Micron 3400 2TB MTFDKBA2T0TFH, MiniLED, 3200x2000, 16" | |
|---|---|---|---|---|---|---|
| Power Consumption | 13% | 31% | 25% | -5% | -17% | |
| Idle Minimum * (Watt) | 9.9 | 9 9% | 9.4 5% | 10.9 -10% | 15.8 -60% | 20.5 -107% |
| Idle Average * (Watt) | 28.6 | 16 44% | 13.6 52% | 13.5 53% | 23.3 19% | 27.7 3% |
| Idle Maximum * (Watt) | 47.1 | 35 26% | 15.8 66% | 13.7 71% | 30 36% | 32.1 32% |
| Load Average * (Watt) | 141.8 | 129 9% | 115.4 19% | 120.2 15% | 123.9 13% | 105 26% |
| Cyberpunk 2077 ultra external monitor * (Watt) | 230 | 160.4 30% | 177.6 23% | |||
| Cyberpunk 2077 ultra * (Watt) | 253 | 164.5 35% | 178.2 30% | |||
| Load Maximum * (Watt) | 233 | 285 -22% | 216.7 7% | 246.1 -6% | 306 -31% | 323 -39% |
| Witcher 3 ultra * (Watt) | 150.8 | 285 | 246 |
* ... Moindre est la valeur, meilleures sont les performances
Power Consumption Cyberpunk / Stress Test
Power Consumption external Monitor
Autonomie de la batterie
Le temps d'exécution du WLAN est presque exactement le même que celui que nous avons enregistré sur l'Omen 16 2024 avec des profils d'alimentation équilibrés et des paramètres iGPU similaires. Bien que cela puisse sembler terne à première vue, gardez à l'esprit que notre modèle 2025 utilise un panneau OLED à plus haute résolution que le panneau IPS de l'ancien modèle.
| HP Omen Max 16 ah000 Ultra 9 275HX, GeForce RTX 5090 Laptop, 83 Wh | HP Omen 16 (2024) i9-14900HX, GeForce RTX 4080 Laptop GPU, 83 Wh | Asus ROG Zephyrus G16 GU605CX Ultra 9 285H, GeForce RTX 5090 Laptop, 90 Wh | Razer Blade 16 2025 RTX 5090 Ryzen AI 9 HX 370, GeForce RTX 5090 Laptop, 90 Wh | MSI Vector 16 HX A14V i9-14900HX, GeForce RTX 4080 Laptop GPU, 90 Wh | Lenovo Legion 9 16IRX9, RTX 4090 i9-14900HX, GeForce RTX 4090 Laptop GPU, 99.99 Wh | |
|---|---|---|---|---|---|---|
| Autonomie de la batterie | 2% | 55% | 36% | 12% | 33% | |
| Reader / Idle (h) | 8.7 | 10.7 23% | ||||
| WiFi v1.3 (h) | 5.8 | 5.9 2% | 9 55% | 7.9 36% | 5.5 -5% | 4.8 -17% |
| Load (h) | 1.2 | 1.4 17% | 2.2 83% | |||
| H.264 (h) | 9.9 | 4.9 | ||||
| Cyberpunk 2077 ultra 150cd (h) | 1.2 |
Notebookcheck Rating
HP Omen Max 16 ah000
- 05/03/2025 v8
Allen Ngo
 Total Sustainability Score:
 Potential Competitors in Comparison
Image | Modèle | Prix | Poids | Épaisseur | Écran |
|---|---|---|---|---|---|
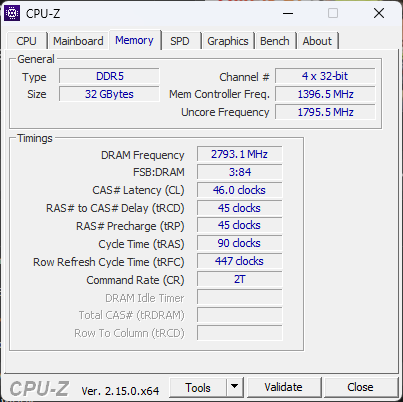
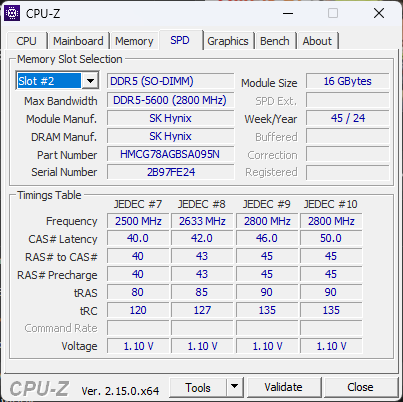
1. 81.9%  | HP Omen Max 16 ah000 Intel Core Ultra 9 275HX ⎘ NVIDIA GeForce RTX 5090 Laptop ⎘ 32 Go Mémoire, 2048 Go SSD | Amazon: Prix de liste: 3800 USD | 2.8 kg | 24.9 mm | 16.00" 2560x1600 189 PPI OLED |
2. 86.7% v7 (old)  | HP Omen 16 (2024) Intel Core i9-14900HX ⎘ NVIDIA GeForce RTX 4080 Laptop GPU ⎘ 32 Go Mémoire, 1024 Go SSD | Amazon: 1. $1,399.00 HP OMEN 16 inch Laptop, FHD ... 2. $1,789.00 HP Omen 16 2024 Gaming Lapto... 3. $1,599.99 HP Omen 16 Slim Gaming Lapto... Prix de liste: 3200 Euro | 2.4 kg | 23.5 mm | 16.10" 2560x1440 182 PPI IPS |
3. 90%  | Asus ROG Zephyrus G16 GU605CX Intel Core Ultra 9 285H ⎘ NVIDIA GeForce RTX 5090 Laptop ⎘ 64 Go Mémoire, 2048 Go SSD | Amazon: Prix de liste: 4799€ | 1.9 kg | 17.4 mm | 16.00" 2560x1600 189 PPI OLED |
4. 87%  | Razer Blade 16 2025 RTX 5090 AMD Ryzen AI 9 HX 370 ⎘ NVIDIA GeForce RTX 5090 Laptop ⎘ 32 Go Mémoire, 2048 Go SSD | Amazon: Prix de liste: 4399€ | 2.1 kg | 17.4 mm | 16.00" 2560x1600 189 PPI OLED |
5. 88% v7 (old)  | MSI Vector 16 HX A14V Intel Core i9-14900HX ⎘ NVIDIA GeForce RTX 4080 Laptop GPU ⎘ 32 Go Mémoire, 1024 Go SSD | Amazon: 1. $2,108.74 msi Vector 16 HX AI Gaming L... 2. $1,649.00 MSI Vector 16 HX AI A2XWHG-2... 3. $2,699.99 msi Vector A18 HX 18” 240H... Prix de liste: 2700 USD | 2.7 kg | 28.55 mm | 16.00" 2560x1600 189 PPI IPS |
6. 83.9%  | Lenovo Legion 9 16IRX9, RTX 4090 Intel Core i9-14900HX ⎘ NVIDIA GeForce RTX 4090 Laptop GPU ⎘ 64 Go Mémoire, 2048 Go SSD | Amazon: Prix de liste: 4899 Euro | 2.5 kg | 22.7 mm | 16.00" 3200x2000 236 PPI MiniLED |
Transparency
La sélection des appareils à examiner est effectuée par notre équipe éditoriale. L'échantillon de test a été prêté à l'auteur par le fabricant ou le détaillant pour les besoins de cet examen. Le prêteur n'a pas eu d'influence sur cette évaluation et le fabricant n'a pas reçu de copie de cette évaluation avant sa publication. Il n'y avait aucune obligation de publier cet article. En tant que média indépendant, Notebookcheck n'est pas soumis à l'autorité des fabricants, des détaillants ou des éditeurs.
Voici comment Notebookcheck teste
Chaque année, Notebookcheck examine de manière indépendante des centaines d'ordinateurs portables et de smartphones en utilisant des procédures standardisées afin de garantir que tous les résultats sont comparables. Nous avons continuellement développé nos méthodes de test depuis environ 20 ans et avons établi des normes industrielles dans le processus. Dans nos laboratoires de test, des équipements de mesure de haute qualité sont utilisés par des techniciens et des rédacteurs expérimentés. Ces tests impliquent un processus de validation en plusieurs étapes. Notre système d'évaluation complexe repose sur des centaines de mesures et de points de référence bien fondés, ce qui garantit l'objectivité.
