Notebookcheck Logo

Test de la Nvidia Ada RTX 40 : la RTX 4090 de 175 W surpasse la RTX 3090 de 350 W pour les performances comme pour l'efficacité énergétique

Plus d'images que jamais. Les ordinateurs portables équipés des GPU Ada RTX 40 de Nvidia ont commencé à être disponibles, actuellement avec des GPU phares comme les RTX 4080 et RTX 4090 pour ordinateur portable. Nous disposons des données de trois appareils de ce type - le MSI Titan GT77 HX 13V et le Schenker XMG Neo 16, tous deux équipés du RTX 4090, et le Razer Blade 16 équipé du RTX 4080 - et nous évaluons les performances des dernières offres mobiles de Nvidia par rapport à celles d'autres appareils de bureau et mobiles.

Les GPU pour ordinateurs portables sont traditionnellement freinés par des limitations de puissance et de fréquence par rapport à leurs homologues de bureau.

Si nous n'en sommes pas encore au stade où la physique peut être écartée, les GPU d'aujourd'hui ont évolué pour offrir plus de performances par watt que jamais auparavant.

L'année dernière, Nvidia a annoncé l'architecture Ada Lovelace pour les ordinateurs de bureau grand public, marquée par l'arrivée de GeForce RTX 40 Series. Dans nos tests, la RTX 4090, RTX 4080et laRTX 4070 Ti ont offert des gains de performance et d'efficacité significatifs par rapport à leurs homologues Turing.

Aujourd'hui, c'est au tour des variantes mobiles d'Ada de répéter l'exploit.

Les ordinateurs portables équipés des GPU mobiles phares d'Ada, comme les cartes RTX 4090 et RTX 4080 Laptop GPUs sont maintenant disponibles dans le monde entier. Les appareils équipés de cartes Ada de milieu de gamme seront lancés plus tard dans le mois.

Architecture mobile Ada : RTX 40 mobile en comparaison avec d'autres GPU Nvidia

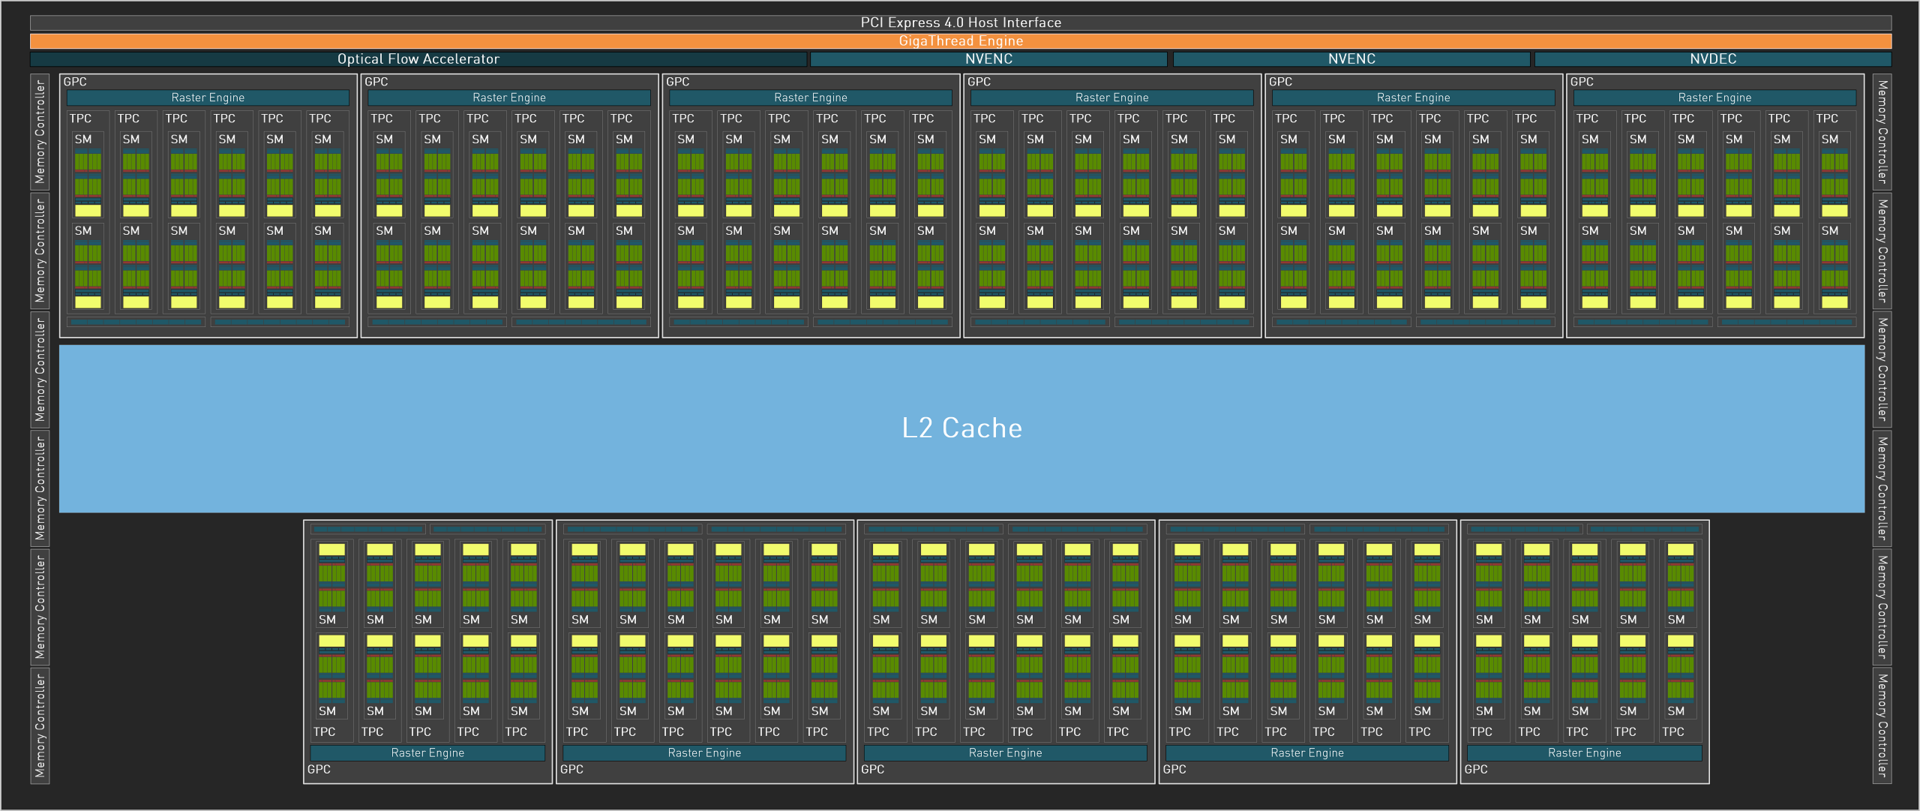
Il n'est pas possible d'insérer un processeur AD102 complet dans un châssis d'ordinateur portable sans faire de sérieux compromis sur l'autonomie de la batterie et la gestion thermique. Par conséquent, la gamme mobile RTX 40 commence par le GPU AD103, qui est fabriqué de novo pour les GPU grand public tels que les RTX 4080 et inférieurs et qui n'est donc pas un composant AD102 réduit.

Par conséquent, le GPU RTX 4090 pour ordinateur portable est essentiellement le même que le RTX 4080 de bureau avec une nomenclature trompeuse. Cependant, c'est là que s'arrêtent les similitudes entre ces cartes.

Vue d'ensemble d'un seul multiprocesseur Ada Streaming. (Source : Nvidia)
Matrice AD102 avec 16 384 cœurs CUDA. (Image Source : Nvidia)
Matrice AD103 avec 9 728 cœurs CUDA. (Image Source : Nvidia)
 

Le GPU RTX 4090 Laptop peut être configuré dans une plage de TDP comprise entre 80 W et 150 W, ce qui se traduit par des horloges de boost allant de 1 455 MHz à 2 040 MHz.

Tirant les leçons du Fiasco d'Ampèreles équipementiers indiquent désormais de manière proactive la puissance du GPU dans les spécifications, ce qui devrait donner aux acheteurs une meilleure idée des performances par rapport à la configuration et au châssis de l'ordinateur portable.

Cependant, notez que tous les OEM ne publient pas les valeurs de Dynamic Boost.

Le GPU RTX 4090 pour ordinateur portable utilise le même bus mémoire 256 bits que le RTX 4080 de bureau mais souffre d'une réduction de ~20% de la bande passante mémoire bien qu'il soit légèrement plus rapide que le RTX 3080 Ti pour ordinateur portable RTX 3080 Ti pour ordinateur portable.

La nature énergivore de la GDDR6X signifie qu'elle ne peut pas être utilisée dans un ordinateur portable. Nvidia a déclaré que la GDDR6 VRAM de l'Ada mobile est conçue pour être très efficace avec une horloge améliorée, une faible tension et des états de mémoire à faible consommation.

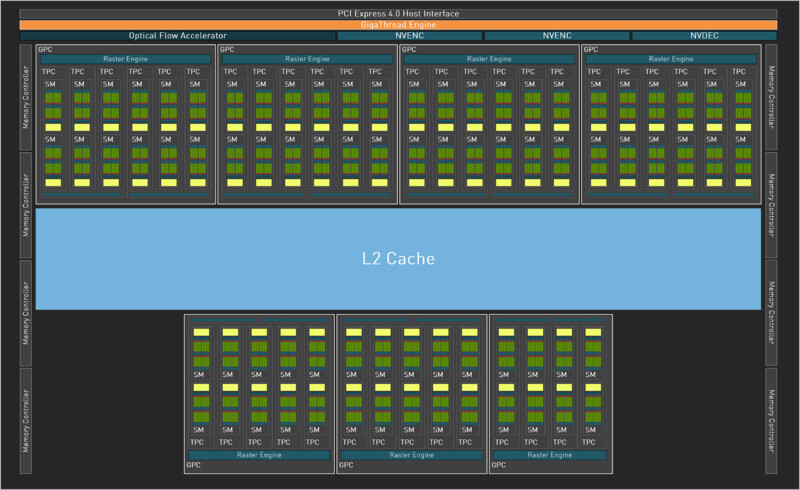
Le GPU RTX 4080 Laptop utilise le die AD104 du RTX 4070 Ti de bureau avec une légère réduction du nombre de cœurs CUDA qui correspond à ce que nous avions vu auparavant dans le GPU RTX 3080 Ti Laptop.

Bien que le GPU RTX 3080 Ti Laptop semble meilleur sur le papier, du moins en termes de caractéristiques VRAM, le RTX 4080 mobile compense cette déficience par des améliorations architecturales dans Ada.

Spécifications RTX 4090 FE RTX 4080 FE RTX 4070 Ti RTX 4090 Laptop GPU RTX 4080 Laptop GPU RTX 3090 Ti FE RTX 3090 FE RTX 3080 Ti FE RTX 3080 FE RTX 3080 Ti Laptop GPU
Puce AD102 AD103 AD104 AD103 AD104 GA102 GA102 GA102 GA102 GA103
Processus FinFET Custom 4N Custom 4N Custom 4N Custom 4N Custom 4N 8 nm 8 nm 8 nm 8 nm 8 nm
Cœurs CUDA 16 384 9 728 7 680 9728 7424 10 752 10 496 10 240 8 704 7 424
Unités de texture 512 304 240 304 232 336 328 320 272 232
Tensor Cores 512 4th Gen. 304 4th Gen. 240 4th Gen. 304 4th Gen. 232 4th Gen. 336 3rd Gen. 328 3rd Gen. 320 3rd Gen. 272 3rd Gen. 232 3rd Gen.
RT Cores 128 3e Gén. 76 3e Gén. 60 3e Gén. 76 3e Gén. 58 3e Gén. 84 2e Gén. 82 2e Gén. 80 2e Gén. 68 2e Gén. 58 2e Gén.
Horloge de base du GPU 2,235 MHz 2,205 MHz 2,310 MHz 1,590 MHz 1,530 MHz 1,560 MHz 1,395 MHz 1,365 MHz 1,440 MHz 1,230 MHz
Horloge Boost GPU 2 520 MHz 2 505 MHz 2 760 MHz 2040 MHz 1995 MHz 1 860 MHz 1 695 MHz 1 665 MHz 1 710 MHz 1 590 MHz
Bus mémoire 384 bits 256 bits 192 bits 256 bits 192 bits 384 bits 384 bits 384 bits 320 bits 256 bits
Bande passante mémoire 1 008 Go/s 716,8 Go/s 504 Go/s 576 Go/s 432Go/s 1 008 Go/s 936 Go/s 912 Go/s 760 Go/s 512 Go/s
Mémoire vidéo 24 GB GDDR6X 16 GB GDDR6X 12 GB GDDR6X 16 GB GDDR6 12 GB GDDR6 24 GB GDDR6X 24 GB GDDR6X 12 GB GDDR6X 10 GB GDDR6X 16 GB GDDR6
Consommation électrique 450 W 320 W 285 W 150 W (+25 W DB) 150 W (+25 W DB) 450 W 350 W 350 W 320 W 150 W (+25 W DB)

La génération Ada apporte également quelques changements notables à l'implémentation Max-Q de Nvidia. Lorsque Max-Q a fait ses débuts avec Turing, l'accent était mis sur le seul indice TDP. Les cartes elles-mêmes étaient clairement étiquetées Max-Q, ce qui facilitait la sélection.

Cependant, à partir d'Ampere, Nvidia a choisi de mettre la presse et les utilisateurs finaux dans un dilemme en supprimant la marque Max-Q et en l'utilisant comme un terme générique pour des technologies telles que Whisper Mode, Resizeable BAR, Dynamic Boost, Advanced Optimus, etc.

Les OEM ont maintenant le choix d'utiliser n'importe quel sous-ensemble de technologies Max-Q qu'ils jugent approprié, et aussi d'intégrer un GPU de grande taille dans un châssis mince pour se vanter tout en configurant son TDP près des valeurs de base.

Avec Ada, Nvidia introduit ce qu'il appelle le Max-Q de 5ème génération dans lequel DLSS 3 et la mémoire GDDR6 basse consommation jouent un rôle essentiel.

Nouveaux pipelines DLSS 3 et ray tracing

Nous avons abordé brièvement le DLSS 3 et les nouvelles fonctions de ray tracing dans Ada dans notre revue de la RTX 4090 Founders Edition RTX 4090 Founders Edition. Essentiellement, DLSS 3 utilise le nouvel accélérateur de flux optique (OFA) autonome d'Ada pour insérer des images à la volée. La génération des images se fait sur le GPU et non dans le jeu.

Plus précisément, DLSS 3 est une combinaison de la super résolution et de la génération de trames DLSS 2 existante. Selon Nvidia, DLSS 3 reconstruit 7/8e de l'image - 3/4 de la première image est reconstruite avec DLSS 2 Super Resolution tandis que la deuxième image complète est créée avec la génération de trames.

Étant donné que la génération d'images se fait au niveau du GPU, DLSS 3 peut aider à augmenter le nombre d'images dans les titres nécessitant l'utilisation du CPU ou de la physique, comme Microsoft Flight Simulator 2020.

Notez que DLSS 3 nécessite un GPU RTX 40, un titre pris en charge et l'activation de la planification accélérée du GPU au niveau matériel et de Nvidia Reflex.

Noyau Ampère RT de 2ème génération. (Source : Nvidia)
Noyau Ada RT de 3ème génération. (Source : Nvidia)

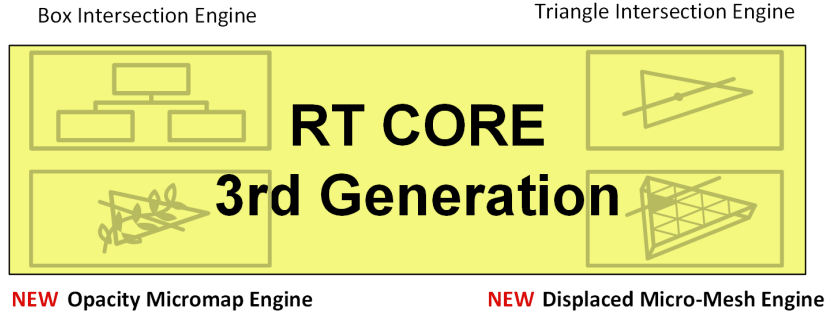
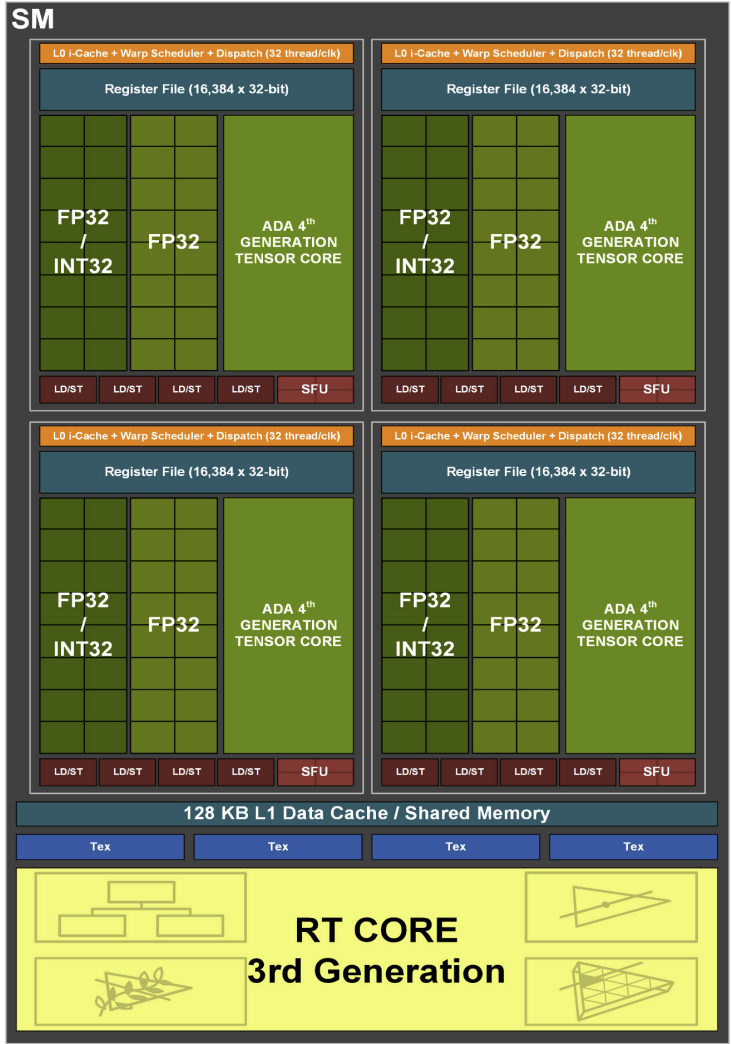
Ada dispose de cœurs de ray tracing (RT) de troisième génération avec deux nouvelles fonctions : le moteur de micromap d'opacité et le moteur de micro-maille déplacée. Ces fonctions s'ajoutent au moteur d'intersection de boîtes et au moteur d'intersection de triangles déjà présents dans Ampere.

Il existe également un nouveau pipeline SER (Shader Execution Reordering) sur https://developer.nvidia.com/blog/improve-shader-performance-and-in-game-frame-rates-with-shader-execution-reordering/ (SER), qui fonctionne comme un ordonnanceur efficace pour les threads de rayons secondaires. Bien que SER puisse potentiellement accélérer les calculs RT intensifs comme le traçage de chemin, il nécessite le soutien du développeur du jeu.

Selon Nvidia, la mise en œuvre de SER devrait être assez simple. Les développeurs pourront obtenir des informations sur les performances de SER via Nvidia NSight. La société a déclaré qu'elle travaillait avec Microsoft et d'autres pour ajouter la prise en charge de SER aux API graphiques telles que DirectX.

Appareils de test : La crème de la crème

Nous disposons des appareils de test suivants dans nos laboratoires :

Tous les appareils testés ont été exécutés dans leurs modes de performances maximales avec une commutation MUX vers le dGPU. Cela a permis aux RTX 4090 et RTX 4090 d'utiliser la totalité du TGP de 175 W, y compris Dynamic Boost.

MSI Titan GT77 HX 13V
Razer Blade 16
Razer Blade 16
Schenker XMG Neo 16
Schenker XMG Neo 16

Remarque: Nous sommes les premiers à avoir reçu une variante précoce du Schenker XMG Neo 16. Comme il s'agit d'un modèle de pré-production, les scores peuvent ne pas refléter les performances réelles de l'appareil lors de notre examen officiel avec un échantillon de détail.

Performances synthétiques : RTX 4090 mobile juste derrière une RTX 4070 Ti de bureau

Les performances cumulées de 3DMark montrent que le GPU RTX 4090 Laptop de la Titan GT77 HX et du XMG Neo 16 ont des performances similaires, ce qui indique qu'il n'y a pas de goulot d'étranglement potentiel ailleurs dans le pipeline.

Le GPU RTX 4080 Laptop du Razer Blade 16 est en retard de 19% par rapport au RTX 4090 Laptop, ce qui est similaire au pourcentage d'écart entre les variantes de bureau de ces GPU.

Ceci étant dit, le GPU RTX 4090 Laptop est jusqu'à 35% plus lent que la carte RTX 4090 Founders Edition de bureau, et jusqu'à 26% plus lent que la Radeon RX 7900 XTX. Toutefois, ses performances sont comparables à celles de la RTX 4070 Ti de bureau.

Malgré un nombre similaire de cœurs CUDA, les limitations du TDP signifient que la RTX 4080 Founders Edition 320 W est 20% plus rapide par rapport à un GPU RTX 4090 Laptop 175 W dans la performance 3DMark globale.

Par rapport aux GPU mobiles de la génération précédente, la génération Ada semble offrir des gains de performance significatifs. Le GPU RTX 4090 pour ordinateur portable est 76 % plus rapide dans tous les tests 3DMark confondus que le GPU RTX 3080 Ti moyen pour ordinateur portable.

De bons gains de 43% sont également constatés avec le GPU RTX 4080 Laptop par rapport à la variante mobile RTX 3080 Ti moyenne.

Performance Rating - Percent
NVIDIA GeForce RTX 4090 Founders Edition
NVIDIA GeForce RTX 4090, i9-13900K
99.6 pt
AMD Radeon RX 7900 XTX
Radeon RX 7900 XTX, R9 7950X
87.2 pt
NVIDIA GeForce RTX 4080 Founders Edition
NVIDIA GeForce RTX 4080, i9-13900K
80.8 pt
AMD Radeon RX 7900 XT
Radeon RX 7900 XT, R9 7950X
78.8 pt
Asus TUF Gaming GeForce RTX 4070 Ti
NVIDIA GeForce RTX 4070 Ti, i9-13900K
68.7 pt
MSI Titan GT77 HX 13VI
NVIDIA GeForce RTX 4090 Laptop GPU, i9-13950HX, Samsung PM9A1 MZVL22T0HBLB
65.3 pt
SCHENKER XMG Neo 16 Raptor Lake
NVIDIA GeForce RTX 4090 Laptop GPU, i9-13900HX
64.8 pt
Moyenne NVIDIA GeForce RTX 3090
 
58.7 pt
Razer Blade 16 Early 2023
NVIDIA GeForce RTX 4080 Laptop GPU, i9-13950HX, SSSTC CA6-8D1024
53.2 pt
Moyenne AMD Radeon RX 6800M
 
38.4 pt
Moyenne NVIDIA GeForce RTX 3080 Ti Laptop GPU
 
37.2 pt
Moyenne NVIDIA GeForce RTX 3080 Laptop GPU
 
34.6 pt
Moyenne NVIDIA GeForce RTX 3070 Ti Laptop GPU
 
33.9 pt
Moyenne AMD Radeon RX 6700M -1!
 
33.4 pt
Moyenne AMD Radeon RX 6600M
 
27.5 pt
Moyenne NVIDIA GeForce RTX 3060 Laptop GPU
 
25 pt
3DMark 11 - 1280x720 Performance GPU
NVIDIA GeForce RTX 4090 Founders Edition
NVIDIA GeForce RTX 4090, i9-13900K
99834 Points +76%
NVIDIA GeForce RTX 4080 Founders Edition
NVIDIA GeForce RTX 4080, i9-13900K
86838 Points +54%
AMD Radeon RX 7900 XTX
Radeon RX 7900 XTX, R9 7950X
83322 Points +47%
AMD Radeon RX 7900 XT
Radeon RX 7900 XT, R9 7950X
77784 Points +38%
Asus TUF Gaming GeForce RTX 4070 Ti
NVIDIA GeForce RTX 4070 Ti, i9-13900K
75990 Points +34%
Asus TUF Gaming GeForce RTX 4070 Ti
NVIDIA GeForce RTX 4070 Ti, i9-13900K
75612 Points +34%
SCHENKER XMG Neo 16 Raptor Lake
NVIDIA GeForce RTX 4090 Laptop GPU, i9-13900HX
71432 Points +26%
MSI Titan GT77 HX 13VI
NVIDIA GeForce RTX 4090 Laptop GPU, i9-13950HX, Samsung PM9A1 MZVL22T0HBLB
69211 Points +22%
Moyenne NVIDIA GeForce RTX 3090
  (55144 - 66934, n=16)
60854 Points +8%
Razer Blade 16 Early 2023
NVIDIA GeForce RTX 4080 Laptop GPU, i9-13950HX, SSSTC CA6-8D1024
56565 Points
Moyenne AMD Radeon RX 6800M
  (39075 - 41706, n=2)
40391 Points -29%
Moyenne NVIDIA GeForce RTX 3080 Ti Laptop GPU
  (13920 - 45841, n=45)
39402 Points -30%
Moyenne NVIDIA GeForce RTX 3080 Laptop GPU
  (31288 - 43744, n=39)
38345 Points -32%
Moyenne NVIDIA GeForce RTX 3070 Ti Laptop GPU
  (13799 - 42569, n=36)
35944 Points -36%
Moyenne AMD Radeon RX 6700M
  ()
33497 Points -41%
Moyenne AMD Radeon RX 6600M
  (27030 - 32340, n=6)
31142 Points -45%
Moyenne NVIDIA GeForce RTX 3060 Laptop GPU
  (13799 - 30772, n=43)
26816 Points -53%
3DMark
2560x1440 Time Spy Graphics
NVIDIA GeForce RTX 4090 Founders Edition
NVIDIA GeForce RTX 4090, i9-13900K
36101 Points +96%
AMD Radeon RX 7900 XTX
Radeon RX 7900 XTX, R9 7950X
29699 Points +61%
NVIDIA GeForce RTX 4080 Founders Edition
NVIDIA GeForce RTX 4080, i9-13900K
28133 Points +53%
AMD Radeon RX 7900 XT
Radeon RX 7900 XT, R9 7950X
25874 Points +40%
Asus TUF Gaming GeForce RTX 4070 Ti
NVIDIA GeForce RTX 4070 Ti, i9-13900K
22982 Points +25%
Asus TUF Gaming GeForce RTX 4070 Ti
NVIDIA GeForce RTX 4070 Ti, i9-13900K
22949 Points +24%
MSI Titan GT77 HX 13VI
NVIDIA GeForce RTX 4090 Laptop GPU, i9-13950HX, Samsung PM9A1 MZVL22T0HBLB
22254 Points +21%
SCHENKER XMG Neo 16 Raptor Lake
NVIDIA GeForce RTX 4090 Laptop GPU, i9-13900HX
21786 Points +18%
Moyenne NVIDIA GeForce RTX 3090
  (18685 - 20433, n=16)
19254 Points +4%
Razer Blade 16 Early 2023
NVIDIA GeForce RTX 4080 Laptop GPU, i9-13950HX, SSSTC CA6-8D1024
18441 Points
Moyenne NVIDIA GeForce RTX 3080 Ti Laptop GPU
  (4921 - 13835, n=43)
11850 Points -36%
Moyenne AMD Radeon RX 6800M
  (10439 - 11316, n=4)
11067 Points -40%
Moyenne NVIDIA GeForce RTX 3080 Laptop GPU
  (6407 - 13210, n=44)
10695 Points -42%
Moyenne NVIDIA GeForce RTX 3070 Ti Laptop GPU
  (8142 - 12324, n=37)
10478 Points -43%
Moyenne AMD Radeon RX 6700M
  (8654 - 9323, n=2)
8989 Points -51%
Moyenne NVIDIA GeForce RTX 3060 Laptop GPU
  (6285 - 9235, n=49)
8057 Points -56%
Moyenne AMD Radeon RX 6600M
  (7200 - 8234, n=7)
7864 Points -57%
1920x1080 Fire Strike Graphics
AMD Radeon RX 7900 XTX
Radeon RX 7900 XTX, R9 7950X
66967 Points +65%
NVIDIA GeForce RTX 4090 Founders Edition
NVIDIA GeForce RTX 4090, i9-13900K
65879 Points +62%
AMD Radeon RX 7900 XT
Radeon RX 7900 XT, R9 7950X
63712 Points +57%
NVIDIA GeForce RTX 4080 Founders Edition
NVIDIA GeForce RTX 4080, i9-13900K
58893 Points +45%
Asus TUF Gaming GeForce RTX 4070 Ti
NVIDIA GeForce RTX 4070 Ti, i9-13900K
53729 Points +32%
Asus TUF Gaming GeForce RTX 4070 Ti
NVIDIA GeForce RTX 4070 Ti, i9-13900K
52903 Points +30%
MSI Titan GT77 HX 13VI
NVIDIA GeForce RTX 4090 Laptop GPU, i9-13950HX, Samsung PM9A1 MZVL22T0HBLB
49247 Points +21%
Moyenne NVIDIA GeForce RTX 3090
  (41298 - 49282, n=16)
46854 Points +15%
SCHENKER XMG Neo 16 Raptor Lake
NVIDIA GeForce RTX 4090 Laptop GPU, i9-13900HX
46240 Points +14%
Razer Blade 16 Early 2023
NVIDIA GeForce RTX 4080 Laptop GPU, i9-13950HX, SSSTC CA6-8D1024
40570 Points
Moyenne AMD Radeon RX 6800M
  (30507 - 34993, n=3)
33233 Points -18%
Moyenne NVIDIA GeForce RTX 3080 Ti Laptop GPU
  (6928 - 34439, n=43)
29496 Points -27%
Moyenne AMD Radeon RX 6700M
  (27449 - 28399, n=2)
27924 Points -31%
Moyenne NVIDIA GeForce RTX 3070 Ti Laptop GPU
  (22612 - 32550, n=37)
27554 Points -32%
Moyenne NVIDIA GeForce RTX 3080 Laptop GPU
  (16455 - 32366, n=45)
27464 Points -32%
Moyenne AMD Radeon RX 6600M
  (21876 - 24788, n=7)
23563 Points -42%
Moyenne NVIDIA GeForce RTX 3060 Laptop GPU
  (16354 - 23109, n=49)
20436 Points -50%
3840x2160 Fire Strike Ultra Graphics
NVIDIA GeForce RTX 4090 Founders Edition
NVIDIA GeForce RTX 4090, i9-13900K
24276 Points +124%
AMD Radeon RX 7900 XTX
Radeon RX 7900 XTX, R9 7950X
20214 Points +87%
NVIDIA GeForce RTX 4080 Founders Edition
NVIDIA GeForce RTX 4080, i9-13900K
17122 Points +58%
AMD Radeon RX 7900 XT
Radeon RX 7900 XT, R9 7950X
17078 Points +58%
SCHENKER XMG Neo 16 Raptor Lake
NVIDIA GeForce RTX 4090 Laptop GPU, i9-13900HX
14184 Points +31%
MSI Titan GT77 HX 13VI
NVIDIA GeForce RTX 4090 Laptop GPU, i9-13950HX, Samsung PM9A1 MZVL22T0HBLB
13756 Points +27%
Asus TUF Gaming GeForce RTX 4070 Ti
NVIDIA GeForce RTX 4070 Ti, i9-13900K
13546 Points +25%
Asus TUF Gaming GeForce RTX 4070 Ti
NVIDIA GeForce RTX 4070 Ti, i9-13900K
13487 Points +25%
Moyenne NVIDIA GeForce RTX 3090
  (11613 - 12587, n=13)
12305 Points +14%
Razer Blade 16 Early 2023
NVIDIA GeForce RTX 4080 Laptop GPU, i9-13950HX, SSSTC CA6-8D1024
10815 Points
Moyenne AMD Radeon RX 6800M
  (7109 - 8434, n=3)
7939 Points -27%
Moyenne NVIDIA GeForce RTX 3080 Ti Laptop GPU
  (6613 - 8613, n=17)
7891 Points -27%
Moyenne NVIDIA GeForce RTX 3080 Laptop GPU
  (5859 - 8293, n=24)
7142 Points -34%
Moyenne NVIDIA GeForce RTX 3070 Ti Laptop GPU
  (6267 - 7778, n=12)
7111 Points -34%
Moyenne AMD Radeon RX 6600M
  (4952 - 5590, n=6)
5311 Points -51%
Moyenne NVIDIA GeForce RTX 3060 Laptop GPU
  (3844 - 5480, n=23)
4898 Points -55%

Performances de jeu : Le GPU RTX 4090 pour ordinateur portable est à égalité avec le RTX 4070 Ti en 4K

Une tendance similaire est observée dans le jeu également, où le GPU RTX 4090 Laptop dans le XMG Neo 16 est à une distance frappante de l'ordinateur RTX 4070 Ti dans les performances de jeu cumulées.

Nous voyons que le GPU RTX 4080 pour ordinateur portable est à la traîne de la variante mobile RTX 4090 jusqu'à 17%, ce qui est similaire aux écarts que nous voyons entre les versions de bureau de la RTX 4090 et de la RTX 4080.

Les améliorations de l'architecture semblent conférer à la RTX 4080 Laptop un avantage de 33% sur la RTX 3080 Ti Laptop GPU en termes de performances de jeu globales, mais la RTX 4090 offre un gain énorme de 61% par rapport au vaisseau amiral mobile d'Ampere.

Tout comme leurs homologues de bureau, les GPU mobiles RTX 40 semblent également être facilement engorgés par le CPU à des résolutions inférieures. Dans Metro Exodus (non amélioré), par exemple, le GPU RTX 4090 pour portable est à la traîne par rapport au RTX 4070 Ti de bureau jusqu'à 19% à 1080p Ultra. Cependant, à 4K Ultra, le GPU mobile phare d'Ada est aussi performant que le RTX 4070 Ti.

Nous constatons également des écarts croissants entre le GPU RTX 4090 pour ordinateur portable et la carte RTX 4090 pour ordinateur de bureau en 4K Ultra par rapport au 1080p ou au QHD Ultra pour cette raison - Ada aime tout simplement être taxé en 4K.

Il est intéressant de noter que l'écart entre le GPU RTX 4080 pour ordinateur portable et le GPU RTX 4090 pour ordinateur portable augmente également en 4K.

Les jeux qui sollicitent excessivement le CPU comme Mafia : Definitive Edition montrent des différences perceptibles entre la RTX 4070 Ti et la RTX 4090 Laptop GPU uniquement à 1080p. Lorsque la résolution augmente, la RTX 4090 Laptop GPU est capable de combler l'écart ou même de battre la RTX 4070 Ti d'un cheveu dans ce jeu.

Performance Rating - Percent
NVIDIA GeForce RTX 4090 Founders Edition
NVIDIA GeForce RTX 4090, i9-13900K
99.8 pt
NVIDIA GeForce RTX 4080 Founders Edition
NVIDIA GeForce RTX 4080, i9-13900K
85.9 pt
AMD Radeon RX 7900 XTX -3!
Radeon RX 7900 XTX, R9 7950X
85.5 pt
AMD Radeon RX 7900 XT -3!
Radeon RX 7900 XT, R9 7950X
75.8 pt
Asus TUF Gaming GeForce RTX 4070 Ti
NVIDIA GeForce RTX 4070 Ti, i9-13900K
72.3 pt
SCHENKER XMG Neo 16 Raptor Lake
NVIDIA GeForce RTX 4090 Laptop GPU, i9-13900HX
66.1 pt
MSI Titan GT77 HX 13VI
NVIDIA GeForce RTX 4090 Laptop GPU, i9-13950HX, Samsung PM9A1 MZVL22T0HBLB
65 pt
Moyenne NVIDIA GeForce RTX 3090
 
61.6 pt
Razer Blade 16 Early 2023
NVIDIA GeForce RTX 4080 Laptop GPU, i9-13950HX, SSSTC CA6-8D1024
54.6 pt
Moyenne NVIDIA GeForce RTX 3080 Ti Laptop GPU -1!
 
41.1 pt
Moyenne AMD Radeon RX 6700M -12!
 
34.5 pt
Moyenne NVIDIA GeForce RTX 3070 Ti Laptop GPU -6!
 
33.1 pt
Moyenne AMD Radeon RX 6800M -3!
 
32.9 pt
Moyenne NVIDIA GeForce RTX 3080 Laptop GPU
 
32.4 pt
Moyenne NVIDIA GeForce RTX 3060 Laptop GPU
 
27.1 pt
Moyenne AMD Radeon RX 6600M
 
24.8 pt
The Witcher 3
1920x1080 Ultra Graphics & Postprocessing (HBAO+)
NVIDIA GeForce RTX 4090 Founders Edition
NVIDIA GeForce RTX 4090, i9-13900K
297 (271min, 271P1 - 345max) fps +68%
AMD Radeon RX 7900 XTX
Radeon RX 7900 XTX, R9 7950X
297 (41.3min, 167.7P0.1, 245P1 - 507max) fps +68%
AMD Radeon RX 7900 XT
Radeon RX 7900 XT, R9 7950X
265 (104.1min, 151.5P0.1, 214P1 - 491max) fps +50%
NVIDIA GeForce RTX 4080 Founders Edition
NVIDIA GeForce RTX 4080, i9-13900K
254 (227min, 227P1 - 291max) fps +44%
Asus TUF Gaming GeForce RTX 4070 Ti
NVIDIA GeForce RTX 4070 Ti, i9-13900K
230 (207min, 208.68P1 - 258max) fps +30%
SCHENKER XMG Neo 16 Raptor Lake
NVIDIA GeForce RTX 4090 Laptop GPU, i9-13900HX
216.4 (5.6P0.1, 144.3P1) fps +22%
MSI Titan GT77 HX 13VI
NVIDIA GeForce RTX 4090 Laptop GPU, i9-13950HX, Samsung PM9A1 MZVL22T0HBLB
198.9 (190min, 191P1 - 214max) fps +13%
Moyenne NVIDIA GeForce RTX 3090
  (160 - 192.6, n=16)
179.9 fps +2%
Razer Blade 16 Early 2023
NVIDIA GeForce RTX 4080 Laptop GPU, i9-13950HX, SSSTC CA6-8D1024
176.8 (159min - 192max) fps
Moyenne NVIDIA GeForce RTX 3080 Ti Laptop GPU
  (30 - 130.6, n=43)
112.1 fps -37%
Moyenne AMD Radeon RX 6800M
  (108 - 110, n=2)
109 fps -38%
Moyenne NVIDIA GeForce RTX 3080 Laptop GPU
  (85.1 - 123, n=39)
105.2 fps -40%
Moyenne NVIDIA GeForce RTX 3070 Ti Laptop GPU
  (76.8 - 124.1, n=39)
102.4 fps -42%
Moyenne AMD Radeon RX 6700M
  ()
95.4 fps -46%
Moyenne AMD Radeon RX 6600M
  (75.4 - 88.2, n=6)
84 fps -52%
Moyenne NVIDIA GeForce RTX 3060 Laptop GPU
  (58.2 - 91.5, n=48)
76.9 fps -57%
3840x2160 Ultra Graphics & Postprocessing (HBAO+)
NVIDIA GeForce RTX 4090 Founders Edition
NVIDIA GeForce RTX 4090, i9-13900K
170.7 (154min, 154.59P1 - 187max) fps +111%
NVIDIA GeForce RTX 4080 Founders Edition
NVIDIA GeForce RTX 4080, i9-13900K
128 (113min, 114.12P1 - 141max) fps +58%
AMD Radeon RX 7900 XTX
Radeon RX 7900 XTX, R9 7950X
125.8 (9.5min, 66.1P0.1, 94.8P1 - 400max) fps +56%
AMD Radeon RX 7900 XT
Radeon RX 7900 XT, R9 7950X
109.4 (57.5min, 60.1P0.1, 86.2P1 - 358max) fps +35%
SCHENKER XMG Neo 16 Raptor Lake
NVIDIA GeForce RTX 4090 Laptop GPU, i9-13900HX
107.6 fps +33%
MSI Titan GT77 HX 13VI
NVIDIA GeForce RTX 4090 Laptop GPU, i9-13950HX, Samsung PM9A1 MZVL22T0HBLB
100 fps +24%
Asus TUF Gaming GeForce RTX 4070 Ti
NVIDIA GeForce RTX 4070 Ti, i9-13900K
98.3 (88min, 88.56P1 - 108max) fps +22%
Moyenne NVIDIA GeForce RTX 3090
  (85.4 - 98.5, n=8)
93.4 fps +16%
Razer Blade 16 Early 2023
NVIDIA GeForce RTX 4080 Laptop GPU, i9-13950HX, SSSTC CA6-8D1024
80.8 (76min - 87max) fps
Moyenne NVIDIA GeForce RTX 3080 Ti Laptop GPU
  (44.8 - 62.7, n=5)
56.4 fps -30%
Moyenne NVIDIA GeForce RTX 3070 Ti Laptop GPU
  (48.4 - 52.3, n=2)
50.4 fps -38%
Moyenne NVIDIA GeForce RTX 3080 Laptop GPU
  (47 - 51.6, n=4)
49.2 fps -39%
Moyenne AMD Radeon RX 6800M
  ()
44.5 fps -45%
Moyenne NVIDIA GeForce RTX 3060 Laptop GPU
  ()
37.4 fps -54%
Moyenne AMD Radeon RX 6600M
  (33 - 33.8, n=3)
33.3 fps -59%
Metro Exodus
1920x1080 Ultra Quality AF:16x
NVIDIA GeForce RTX 4090 Founders Edition
NVIDIA GeForce RTX 4090, i9-13900K
191.2 (84.99min - 313.09max) fps +57%
AMD Radeon RX 7900 XTX
Radeon RX 7900 XTX, R9 7950X
183.5 (102.51min - 295.07max) fps +51%
NVIDIA GeForce RTX 4080 Founders Edition
NVIDIA GeForce RTX 4080, i9-13900K
180 (82.56min - 319.08max) fps +48%
AMD Radeon RX 7900 XT
Radeon RX 7900 XT, R9 7950X
164.6 (92.11min - 256.61max) fps +35%
Asus TUF Gaming GeForce RTX 4070 Ti
NVIDIA GeForce RTX 4070 Ti, i9-13900K
161.4 (78.05min - 296.03max) fps +33%
Moyenne NVIDIA GeForce RTX 3090
  (108 - 145, n=12)
135.3 fps +11%
MSI Titan GT77 HX 13VI
NVIDIA GeForce RTX 4090 Laptop GPU, i9-13950HX, Samsung PM9A1 MZVL22T0HBLB
132 fps +8%
SCHENKER XMG Neo 16 Raptor Lake
NVIDIA GeForce RTX 4090 Laptop GPU, i9-13900HX
131.51 (63.87min - 211.51max) fps +8%
Razer Blade 16 Early 2023
NVIDIA GeForce RTX 4080 Laptop GPU, i9-13950HX, SSSTC CA6-8D1024
121.7 (54.5min - 212.1max) fps
Moyenne NVIDIA GeForce RTX 3080 Ti Laptop GPU
  ()
88.1 fps -28%
Moyenne AMD Radeon RX 6800M
  (78.7 - 79.3, n=3)
79 fps -35%
Moyenne NVIDIA GeForce RTX 3080 Laptop GPU
  (68.7 - 87.9, n=5)
78.5 fps -35%
Moyenne NVIDIA GeForce RTX 3070 Ti Laptop GPU
  (71 - 77.2, n=2)
74.1 fps -39%
Moyenne NVIDIA GeForce RTX 3060 Laptop GPU
  (59.4 - 63.2, n=3)
61.6 fps -49%
Moyenne AMD Radeon RX 6600M
  (55.6 - 62.3, n=4)
59.8 fps -51%
2560x1440 Ultra Quality AF:16x
NVIDIA GeForce RTX 4090 Founders Edition
NVIDIA GeForce RTX 4090, i9-13900K
176 (81.25min - 295.51max) fps +73%
NVIDIA GeForce RTX 4080 Founders Edition
NVIDIA GeForce RTX 4080, i9-13900K
155.1 (77.58min - 279.33max) fps +52%
AMD Radeon RX 7900 XTX
Radeon RX 7900 XTX, R9 7950X
154.5 (90.83min - 228.57max) fps +51%
AMD Radeon RX 7900 XT
Radeon RX 7900 XT, R9 7950X
135 (79.57min - 198.77max) fps +32%
Asus TUF Gaming GeForce RTX 4070 Ti
NVIDIA GeForce RTX 4070 Ti, i9-13900K
132.1 (72.92min - 245.28max) fps +30%
SCHENKER XMG Neo 16 Raptor Lake
NVIDIA GeForce RTX 4090 Laptop GPU, i9-13900HX
117.44 (57.38min - 200.04max) fps +15%
MSI Titan GT77 HX 13VI
NVIDIA GeForce RTX 4090 Laptop GPU, i9-13950HX, Samsung PM9A1 MZVL22T0HBLB
116 fps +14%
Moyenne NVIDIA GeForce RTX 3090
  (102 - 118.2, n=12)
113.2 fps +11%
Razer Blade 16 Early 2023
NVIDIA GeForce RTX 4080 Laptop GPU, i9-13950HX, SSSTC CA6-8D1024
102 (50.6min - 175.9max) fps
Moyenne NVIDIA GeForce RTX 3080 Ti Laptop GPU
  ()
73.2 fps -28%
Moyenne AMD Radeon RX 6800M
  (55.9 - 61.4, n=2)
58.7 fps -42%
Moyenne NVIDIA GeForce RTX 3080 Laptop GPU
  (45.1 - 59.4, n=4)
54.1 fps -47%
Moyenne NVIDIA GeForce RTX 3070 Ti Laptop GPU
  ()
52.7 fps -48%
Moyenne NVIDIA GeForce RTX 3060 Laptop GPU
  ()
49.6 fps -51%
Moyenne AMD Radeon RX 6600M
  (45.1 - 47.6, n=3)
46.5 fps -54%
3840x2160 Ultra Quality AF:16x
NVIDIA GeForce RTX 4090 Founders Edition
NVIDIA GeForce RTX 4090, i9-13900K
135 (72.48min - 235.85max) fps +101%
NVIDIA GeForce RTX 4080 Founders Edition
NVIDIA GeForce RTX 4080, i9-13900K
105.7 (67.17min - 159.57max) fps +58%
AMD Radeon RX 7900 XTX
Radeon RX 7900 XTX, R9 7950X
103.5 (66.43min - 144.4max) fps +54%
AMD Radeon RX 7900 XT
Radeon RX 7900 XT, R9 7950X
86.9 (56.86min - 117.84max) fps +30%
Asus TUF Gaming GeForce RTX 4070 Ti
NVIDIA GeForce RTX 4070 Ti, i9-13900K
84.5 (55.02min - 124.04max) fps +26%
SCHENKER XMG Neo 16 Raptor Lake
NVIDIA GeForce RTX 4090 Laptop GPU, i9-13900HX
83.98 (50.46min - 137.42max) fps +25%
MSI Titan GT77 HX 13VI
NVIDIA GeForce RTX 4090 Laptop GPU, i9-13950HX, Samsung PM9A1 MZVL22T0HBLB
81 fps +21%
Moyenne NVIDIA GeForce RTX 3090
  (70.6 - 77.3, n=12)
75 fps +12%
Razer Blade 16 Early 2023
NVIDIA GeForce RTX 4080 Laptop GPU, i9-13950HX, SSSTC CA6-8D1024
67 (34min - 118.9max) fps
Moyenne NVIDIA GeForce RTX 3080 Ti Laptop GPU
  ()
47.6 fps -29%
Moyenne NVIDIA GeForce RTX 3080 Laptop GPU
  (35.4 - 45.1, n=4)
38.9 fps -42%
Moyenne AMD Radeon RX 6800M
  (37.1 - 39.6, n=2)
38.4 fps -43%
Moyenne NVIDIA GeForce RTX 3060 Laptop GPU
  ()
31.4 fps -53%
Moyenne AMD Radeon RX 6600M
  (27.3 - 28.7, n=3)
28.1 fps -58%
Control
1920x1080 High Quality Preset (DX11)
AMD Radeon RX 7900 XTX
Radeon RX 7900 XTX, R9 7950X
240 (18.1min, 136.2P0.1, 151.8P1 - 606max) fps +53%
NVIDIA GeForce RTX 4090 Founders Edition
NVIDIA GeForce RTX 4090, i9-13900K
238 (14.4min, 62.9P0.1, 153.8P1 - 672max) fps +52%
NVIDIA GeForce RTX 4080 Founders Edition
NVIDIA GeForce RTX 4080, i9-13900K
233 (7.49min, 27.2P0.1, 156.1P1 - 694max) fps +48%
AMD Radeon RX 7900 XT
Radeon RX 7900 XT, R9 7950X
233 (67.8min, 133.8P0.1, 152.6P1 - 638max) fps +48%
Asus TUF Gaming GeForce RTX 4070 Ti
NVIDIA GeForce RTX 4070 Ti, i9-13900K
202 (88min, 151.4P0.1, 165P1 - 504max) fps +29%
MSI Titan GT77 HX 13VI
NVIDIA GeForce RTX 4090 Laptop GPU, i9-13950HX, Samsung PM9A1 MZVL22T0HBLB
187 fps +19%
SCHENKER XMG Neo 16 Raptor Lake
NVIDIA GeForce RTX 4090 Laptop GPU, i9-13900HX
183.7 (38.8P0.1, 119.5P1) fps +17%
Moyenne NVIDIA GeForce RTX 3090
  (172.2 - 189.2, n=5)
179.9 fps +15%
Razer Blade 16 Early 2023
NVIDIA GeForce RTX 4080 Laptop GPU, i9-13950HX, SSSTC CA6-8D1024
157 fps
Moyenne AMD Radeon RX 6800M
  ()
108 fps -31%
Moyenne NVIDIA GeForce RTX 3080 Laptop GPU
  (82.3 - 94.8, n=3)
89.5 fps -43%
Moyenne AMD Radeon RX 6700M
  ()
82.2 fps -48%
Moyenne NVIDIA GeForce RTX 3060 Laptop GPU
  ()
78.1 fps -50%
Moyenne AMD Radeon RX 6600M
  (69.7 - 72, n=4)
70.5 fps -55%
2560x1440 High Quality Preset (DX11)
NVIDIA GeForce RTX 4090 Founders Edition
NVIDIA GeForce RTX 4090, i9-13900K
201 (84.1min, 146.6P0.1, 159P1 - 509max) fps +97%
AMD Radeon RX 7900 XTX
Radeon RX 7900 XTX, R9 7950X
184.9 (66.6min, 105.1P0.1, 121.7P1 - 629max) fps +81%
NVIDIA GeForce RTX 4080 Founders Edition
NVIDIA GeForce RTX 4080, i9-13900K
164.2 (59.2min, 121.2P0.1, 135.5P1 - 753max) fps +61%
AMD Radeon RX 7900 XT
Radeon RX 7900 XT, R9 7950X
156.4 (53.3min, 89.4P0.1, 95.9P1 - 575max) fps +53%
Asus TUF Gaming GeForce RTX 4070 Ti
NVIDIA GeForce RTX 4070 Ti, i9-13900K
130.6 (59min, 74P0.1, 107.3P1 - 355max) fps +28%
MSI Titan GT77 HX 13VI
NVIDIA GeForce RTX 4090 Laptop GPU, i9-13950HX, Samsung PM9A1 MZVL22T0HBLB
122 fps +20%
SCHENKER XMG Neo 16 Raptor Lake
NVIDIA GeForce RTX 4090 Laptop GPU, i9-13900HX
121.9 (31P0.1, 85.8P1) fps +20%
Moyenne NVIDIA GeForce RTX 3090
  (115.8 - 123.7, n=5)
120.4 fps +18%
Razer Blade 16 Early 2023
NVIDIA GeForce RTX 4080 Laptop GPU, i9-13950HX, SSSTC CA6-8D1024
102 fps
Moyenne NVIDIA GeForce RTX 3080 Ti Laptop GPU
  ()
72.9 fps -29%
Moyenne AMD Radeon RX 6800M
  ()
69 fps -32%
Moyenne NVIDIA GeForce RTX 3080 Laptop GPU
  (55.7 - 62.3, n=3)
58.7 fps -42%
Moyenne NVIDIA GeForce RTX 3060 Laptop GPU
  ()
51.1 fps -50%
Moyenne AMD Radeon RX 6600M
  (44.9 - 45.6, n=2)
45.3 fps -56%
3840x2160 High Quality Preset (DX11)
NVIDIA GeForce RTX 4090 Founders Edition
NVIDIA GeForce RTX 4090, i9-13900K
107.7 (83.4min, 85.3P0.1, 91.1P1 - 134.9max) fps +115%
AMD Radeon RX 7900 XTX
Radeon RX 7900 XTX, R9 7950X
89.4 (46.8min, 48.3P0.1, 52.1P1 - 369max) fps +78%
NVIDIA GeForce RTX 4080 Founders Edition
NVIDIA GeForce RTX 4080, i9-13900K
82.6 (15.4min, 68.7P0.1, 71.9P1 - 374max) fps +65%
AMD Radeon RX 7900 XT
Radeon RX 7900 XT, R9 7950X
75.8 (40.1min, 41.7P0.1, 43.6P1 - 277max) fps +51%
Asus TUF Gaming GeForce RTX 4070 Ti
NVIDIA GeForce RTX 4070 Ti, i9-13900K
64.9 (50min, 51.9P0.1, 56.5P1 - 105max) fps +30%
SCHENKER XMG Neo 16 Raptor Lake
NVIDIA GeForce RTX 4090 Laptop GPU, i9-13900HX
63.5 (21.7P0.1, 30.5P1) fps +27%
MSI Titan GT77 HX 13VI
NVIDIA GeForce RTX 4090 Laptop GPU, i9-13950HX, Samsung PM9A1 MZVL22T0HBLB
63 fps +26%
Moyenne NVIDIA GeForce RTX 3090
  (61.3 - 66, n=5)
62.9 fps +26%
Razer Blade 16 Early 2023
NVIDIA GeForce RTX 4080 Laptop GPU, i9-13950HX, SSSTC CA6-8D1024
50.1 fps
Moyenne NVIDIA GeForce RTX 3080 Ti Laptop GPU
  ()
34.5 fps -31%
Moyenne AMD Radeon RX 6800M
  ()
34 fps -32%
Moyenne NVIDIA GeForce RTX 3080 Laptop GPU
  (29 - 30.9, n=3)
29.7 fps -41%
Moyenne NVIDIA GeForce RTX 3060 Laptop GPU
  ()
26 fps -48%
Moyenne AMD Radeon RX 6600M
  (21.7 - 22.2, n=2)
22 fps -56%
Borderlands 3
1920x1080 Badass Overall Quality (DX11)
NVIDIA GeForce RTX 4090 Founders Edition
NVIDIA GeForce RTX 4090, i9-13900K
201 fps +51%
NVIDIA GeForce RTX 4080 Founders Edition
NVIDIA GeForce RTX 4080, i9-13900K
199.4 fps +49%
Asus TUF Gaming GeForce RTX 4070 Ti
NVIDIA GeForce RTX 4070 Ti, i9-13900K
186.9 fps +40%
AMD Radeon RX 7900 XTX
Radeon RX 7900 XTX, R9 7950X
180.2 fps +35%
SCHENKER XMG Neo 16 Raptor Lake
NVIDIA GeForce RTX 4090 Laptop GPU, i9-13900HX
176 fps +32%
AMD Radeon RX 7900 XT
Radeon RX 7900 XT, R9 7950X
169.4 fps +27%
MSI Titan GT77 HX 13VI
NVIDIA GeForce RTX 4090 Laptop GPU, i9-13950HX, Samsung PM9A1 MZVL22T0HBLB
151 fps +13%
Moyenne NVIDIA GeForce RTX 3090
  (117 - 165, n=12)
149.1 fps +12%
Razer Blade 16 Early 2023
NVIDIA GeForce RTX 4080 Laptop GPU, i9-13950HX, SSSTC CA6-8D1024
133.5 fps
Moyenne NVIDIA GeForce RTX 3080 Ti Laptop GPU
  ()
90.7 fps -32%
Moyenne NVIDIA GeForce RTX 3080 Laptop GPU
  (76.5 - 90, n=3)
84 fps -37%
Moyenne NVIDIA GeForce RTX 3070 Ti Laptop GPU
  ()
80.9 fps -39%
Moyenne AMD Radeon RX 6800M
  (77.6 - 83.9, n=3)
80.2 fps -40%
Moyenne NVIDIA GeForce RTX 3060 Laptop GPU
  (69.3 - 74.3, n=4)
72.2 fps -46%
Moyenne AMD Radeon RX 6700M
  ()
71.2 fps -47%
Moyenne AMD Radeon RX 6600M
  (59.9 - 67.3, n=5)
64.8 fps -51%
2560x1440 Badass Overall Quality (DX11)
NVIDIA GeForce RTX 4090 Founders Edition
NVIDIA GeForce RTX 4090, i9-13900K
190 fps +75%
NVIDIA GeForce RTX 4080 Founders Edition
NVIDIA GeForce RTX 4080, i9-13900K
170.5 fps +57%
AMD Radeon RX 7900 XTX
Radeon RX 7900 XTX, R9 7950X
152.2 fps +40%
Asus TUF Gaming GeForce RTX 4070 Ti
NVIDIA GeForce RTX 4070 Ti, i9-13900K
140.6 fps +29%
AMD Radeon RX 7900 XT
Radeon RX 7900 XT, R9 7950X
135.2 fps +24%
SCHENKER XMG Neo 16 Raptor Lake
NVIDIA GeForce RTX 4090 Laptop GPU, i9-13900HX
132.34 fps +22%
MSI Titan GT77 HX 13VI
NVIDIA GeForce RTX 4090 Laptop GPU, i9-13950HX, Samsung PM9A1 MZVL22T0HBLB
130 fps +20%
Moyenne NVIDIA GeForce RTX 3090
  (105 - 131.6, n=12)
123.2 fps +13%
Razer Blade 16 Early 2023
NVIDIA GeForce RTX 4080 Laptop GPU, i9-13950HX, SSSTC CA6-8D1024
108.7 fps
Moyenne NVIDIA GeForce RTX 3080 Ti Laptop GPU
  ()
78.2 fps -28%
Moyenne AMD Radeon RX 6800M
  (57 - 67.2, n=2)
62.1 fps -43%
Moyenne NVIDIA GeForce RTX 3080 Laptop GPU
  (55.7 - 64.4, n=3)
60.9 fps -44%
Moyenne NVIDIA GeForce RTX 3070 Ti Laptop GPU
  ()
58.7 fps -46%
Moyenne NVIDIA GeForce RTX 3060 Laptop GPU
  (51.3 - 52.4, n=2)
51.9 fps -52%
Moyenne AMD Radeon RX 6600M
  (44.9 - 45.7, n=3)
45.2 fps -58%
3840x2160 Badass Overall Quality (DX11)
NVIDIA GeForce RTX 4090 Founders Edition
NVIDIA GeForce RTX 4090, i9-13900K
133.4 fps +123%
NVIDIA GeForce RTX 4080 Founders Edition
NVIDIA GeForce RTX 4080, i9-13900K
95.7 fps +60%
AMD Radeon RX 7900 XTX
Radeon RX 7900 XTX, R9 7950X
88.4 fps +48%
MSI Titan GT77 HX 13VI
NVIDIA GeForce RTX 4090 Laptop GPU, i9-13950HX, Samsung PM9A1 MZVL22T0HBLB
76 fps +27%
AMD Radeon RX 7900 XT
Radeon RX 7900 XT, R9 7950X
74.6 fps +25%
Asus TUF Gaming GeForce RTX 4070 Ti
NVIDIA GeForce RTX 4070 Ti, i9-13900K
74.1 fps +24%
Moyenne NVIDIA GeForce RTX 3090
  (68 - 75.3, n=12)
72.8 fps +22%
SCHENKER XMG Neo 16 Raptor Lake
NVIDIA GeForce RTX 4090 Laptop GPU, i9-13900HX
70.5 fps +18%
Razer Blade 16 Early 2023
NVIDIA GeForce RTX 4080 Laptop GPU, i9-13950HX, SSSTC CA6-8D1024
59.8 fps
Moyenne NVIDIA GeForce RTX 3080 Ti Laptop GPU
  ()
46.1 fps -23%
Moyenne NVIDIA GeForce RTX 3080 Laptop GPU
  (32.3 - 36, n=3)
34.4 fps -42%
Moyenne AMD Radeon RX 6800M
  (30.3 - 35.8, n=2)
33.1 fps -45%
Moyenne NVIDIA GeForce RTX 3060 Laptop GPU
  ()
28.5 fps -52%
Moyenne AMD Radeon RX 6600M
  (23.7 - 24.1, n=3)
23.9 fps -60%
Shadow of the Tomb Raider
1920x1080 Highest Preset AA:T
NVIDIA GeForce RTX 4090 Founders Edition
NVIDIA GeForce RTX 4090, i9-13900K
306 fps +74%
NVIDIA GeForce RTX 4080 Founders Edition
NVIDIA GeForce RTX 4080, i9-13900K
303 fps +72%
AMD Radeon RX 7900 XTX
Radeon RX 7900 XTX, R9 7950X
301 fps +71%
AMD Radeon RX 7900 XT
Radeon RX 7900 XT, R9 7950X
282 fps +60%
Asus TUF Gaming GeForce RTX 4070 Ti
NVIDIA GeForce RTX 4070 Ti, i9-13900K
280 fps +59%
MSI Titan GT77 HX 13VI
NVIDIA GeForce RTX 4090 Laptop GPU, i9-13950HX, Samsung PM9A1 MZVL22T0HBLB
214 fps +22%
SCHENKER XMG Neo 16 Raptor Lake
NVIDIA GeForce RTX 4090 Laptop GPU, i9-13900HX
207 (140min - 309max) fps +18%
Moyenne NVIDIA GeForce RTX 3090
  (145 - 240, n=14)
204 fps +16%
Razer Blade 16 Early 2023
NVIDIA GeForce RTX 4080 Laptop GPU, i9-13950HX, SSSTC CA6-8D1024
176 (117min - 277max) fps
Moyenne NVIDIA GeForce RTX 3080 Ti Laptop GPU
  ()
156.5 fps -11%
Moyenne NVIDIA GeForce RTX 3070 Ti Laptop GPU
  (119 - 129, n=2)
124 fps -30%
Moyenne NVIDIA GeForce RTX 3080 Laptop GPU
  (76.6 - 151, n=12)
116.4 fps -34%
Moyenne AMD Radeon RX 6700M
  ()
116 fps -34%
Moyenne AMD Radeon RX 6800M
  (104 - 106.1, n=2)
105.1 fps -40%
Moyenne AMD Radeon RX 6600M
  (103.2 - 106.2, n=5)
105.1 fps -40%
Moyenne NVIDIA GeForce RTX 3060 Laptop GPU
  (84 - 95, n=4)
88.8 fps -50%
2560x1440 Highest Preset AA:T
NVIDIA GeForce RTX 4090 Founders Edition
NVIDIA GeForce RTX 4090, i9-13900K
282 fps +83%
NVIDIA GeForce RTX 4080 Founders Edition
NVIDIA GeForce RTX 4080, i9-13900K
248 fps +61%
AMD Radeon RX 7900 XTX
Radeon RX 7900 XTX, R9 7950X
230 fps +49%
AMD Radeon RX 7900 XT
Radeon RX 7900 XT, R9 7950X
203 fps +32%
Asus TUF Gaming GeForce RTX 4070 Ti
NVIDIA GeForce RTX 4070 Ti, i9-13900K
202 fps +31%
MSI Titan GT77 HX 13VI
NVIDIA GeForce RTX 4090 Laptop GPU, i9-13950HX, Samsung PM9A1 MZVL22T0HBLB
187 fps +21%
SCHENKER XMG Neo 16 Raptor Lake
NVIDIA GeForce RTX 4090 Laptop GPU, i9-13900HX
168 (162min - 327max) fps +9%
Moyenne NVIDIA GeForce RTX 3090
  (137 - 172.3, n=12)
165.6 fps +8%
Razer Blade 16 Early 2023
NVIDIA GeForce RTX 4080 Laptop GPU, i9-13950HX, SSSTC CA6-8D1024
154 (121min - 248max) fps
Moyenne NVIDIA GeForce RTX 3080 Ti Laptop GPU
  ()
123.9 fps -20%
Moyenne NVIDIA GeForce RTX 3080 Laptop GPU
  (79 - 113, n=6)
95.7 fps -38%
Moyenne NVIDIA GeForce RTX 3070 Ti Laptop GPU
  ()
83 fps -46%
Moyenne AMD Radeon RX 6800M
  ()
80.5 fps -48%
Moyenne NVIDIA GeForce RTX 3060 Laptop GPU
  (66 - 71, n=3)
68.3 fps -56%
Moyenne AMD Radeon RX 6600M
  (66 - 69.5, n=3)
67.6 fps -56%
3840x2160 Highest Preset AA:T
NVIDIA GeForce RTX 4090 Founders Edition
NVIDIA GeForce RTX 4090, i9-13900K
182 fps +117%
NVIDIA GeForce RTX 4080 Founders Edition
NVIDIA GeForce RTX 4080, i9-13900K
134 fps +60%
AMD Radeon RX 7900 XTX
Radeon RX 7900 XTX, R9 7950X
130.1 fps +55%
AMD Radeon RX 7900 XT
Radeon RX 7900 XT, R9 7950X
109.6 fps +30%
Asus TUF Gaming GeForce RTX 4070 Ti
NVIDIA GeForce RTX 4070 Ti, i9-13900K
104.4 fps +24%
MSI Titan GT77 HX 13VI
NVIDIA GeForce RTX 4090 Laptop GPU, i9-13950HX, Samsung PM9A1 MZVL22T0HBLB
103 fps +23%
SCHENKER XMG Neo 16 Raptor Lake
NVIDIA GeForce RTX 4090 Laptop GPU, i9-13900HX
103 (88min - 150max) fps +23%
Moyenne NVIDIA GeForce RTX 3090
  (89.3 - 99.7, n=12)
96.4 fps +15%
Razer Blade 16 Early 2023
NVIDIA GeForce RTX 4080 Laptop GPU, i9-13950HX, SSSTC CA6-8D1024
84 (77min - 219max) fps
Moyenne NVIDIA GeForce RTX 3080 Ti Laptop GPU
  ()
72.4 fps -14%
Moyenne NVIDIA GeForce RTX 3080 Laptop GPU
  (43 - 56.3, n=4)
50.6 fps -40%
Moyenne AMD Radeon RX 6800M
  ()
43.2 fps -49%
Moyenne NVIDIA GeForce RTX 3060 Laptop GPU
  ()
42 fps -50%
Moyenne AMD Radeon RX 6600M
  (31 - 33.6, n=3)
31.9 fps -62%
Mafia Definitive Edition
1920x1080 High Preset
NVIDIA GeForce RTX 4080 Founders Edition
NVIDIA GeForce RTX 4080, i9-13900K
260 (58.1min, 133.7P0.1, 187.5P1 - 469max) fps +52%
NVIDIA GeForce RTX 4090 Founders Edition
NVIDIA GeForce RTX 4090, i9-13900K
255 (80.7min, 89.2P0.1, 169.4P1 - 479max) fps +49%
Asus TUF Gaming GeForce RTX 4070 Ti
NVIDIA GeForce RTX 4070 Ti, i9-13900K
241 (107.5min, 136.3P0.1, 183.2P1 - 470max) fps +41%
SCHENKER XMG Neo 16 Raptor Lake
NVIDIA GeForce RTX 4090 Laptop GPU, i9-13900HX
187.9 (68.8P0.1, 118.8P1) fps +10%
MSI Titan GT77 HX 13VI
NVIDIA GeForce RTX 4090 Laptop GPU, i9-13950HX, Samsung PM9A1 MZVL22T0HBLB
179 fps +4%
Razer Blade 16 Early 2023
NVIDIA GeForce RTX 4080 Laptop GPU, i9-13950HX, SSSTC CA6-8D1024
171.3 (150min - 193max) fps
Moyenne NVIDIA GeForce RTX 3090
  (157 - 158.8, n=2)
157.9 fps -8%
Moyenne NVIDIA GeForce RTX 3080 Ti Laptop GPU
  ()
151 fps -12%
Moyenne NVIDIA GeForce RTX 3070 Ti Laptop GPU
  (95.1 - 111.5, n=2)
103.3 fps -40%
Moyenne NVIDIA GeForce RTX 3080 Laptop GPU
  (98.7 - 104, n=3)
101.6 fps -41%
Moyenne NVIDIA GeForce RTX 3060 Laptop GPU
  (86.1 - 98.5, n=2)
92.3 fps -46%
Moyenne AMD Radeon RX 6700M
  ()
85.5 fps -50%
Moyenne AMD Radeon RX 6600M
  (79.2 - 85.6, n=4)
80.8 fps -53%
2560x1440 High Preset
NVIDIA GeForce RTX 4090 Founders Edition
NVIDIA GeForce RTX 4090, i9-13900K
238 (71.6min, 84.3P0.1, 162.7P1 - 422max) fps +96%
NVIDIA GeForce RTX 4080 Founders Edition
NVIDIA GeForce RTX 4080, i9-13900K
214 (100.6min, 149.1P0.1, 172.3P1 - 322max) fps +76%
Asus TUF Gaming GeForce RTX 4070 Ti
NVIDIA GeForce RTX 4070 Ti, i9-13900K
171.9 (100min, 119.6P0.1, 144.6P1 - 300max) fps +41%
SCHENKER XMG Neo 16 Raptor Lake
NVIDIA GeForce RTX 4090 Laptop GPU, i9-13900HX
168.1 (52.7P0.1, 117P1) fps +38%
MSI Titan GT77 HX 13VI
NVIDIA GeForce RTX 4090 Laptop GPU, i9-13950HX, Samsung PM9A1 MZVL22T0HBLB
161 fps +32%
Moyenne NVIDIA GeForce RTX 3090
  (142.3 - 149, n=2)
145.7 fps +20%
Razer Blade 16 Early 2023
NVIDIA GeForce RTX 4080 Laptop GPU, i9-13950HX, SSSTC CA6-8D1024
121.6 (104min - 135max) fps
Moyenne NVIDIA GeForce RTX 3080 Ti Laptop GPU
  ()
108 fps -11%
Moyenne NVIDIA GeForce RTX 3080 Laptop GPU
  (69.3 - 70.7, n=2)
70 fps -42%
Moyenne NVIDIA GeForce RTX 3060 Laptop GPU
  ()
67.4 fps -45%
Moyenne NVIDIA GeForce RTX 3070 Ti Laptop GPU
  ()
66.1 fps -46%
Moyenne AMD Radeon RX 6600M
  ()
57.7 fps -53%
3840x2160 High Preset
NVIDIA GeForce RTX 4090 Founders Edition
NVIDIA GeForce RTX 4090, i9-13900K
160.2 (42.5min, 66.5P0.1, 122.8P1 - 370max) fps +128%
NVIDIA GeForce RTX 4080 Founders Edition
NVIDIA GeForce RTX 4080, i9-13900K
115.6 (34.7min, 70.3P0.1, 99.3P1 - 305max) fps +64%
MSI Titan GT77 HX 13VI
NVIDIA GeForce RTX 4090 Laptop GPU, i9-13950HX, Samsung PM9A1 MZVL22T0HBLB
93 fps +32%
SCHENKER XMG Neo 16 Raptor Lake
NVIDIA GeForce RTX 4090 Laptop GPU, i9-13900HX
91.8 (40.5P0.1, 70.4P1) fps +30%
Asus TUF Gaming GeForce RTX 4070 Ti
NVIDIA GeForce RTX 4070 Ti, i9-13900K
88.9 (34.4min, 62P0.1, 77.4P1 - 370max) fps +26%
Moyenne NVIDIA GeForce RTX 3090
  (84.5 - 89.1, n=2)
86.8 fps +23%
Razer Blade 16 Early 2023
NVIDIA GeForce RTX 4080 Laptop GPU, i9-13950HX, SSSTC CA6-8D1024
70.4 (61min - 81max) fps
Moyenne NVIDIA GeForce RTX 3080 Ti Laptop GPU
  ()
58.6 fps -17%
Moyenne NVIDIA GeForce RTX 3080 Laptop GPU
  (37.2 - 37.4, n=2)
37.3 fps -47%
Moyenne NVIDIA GeForce RTX 3060 Laptop GPU
  ()
36.2 fps -49%
Moyenne NVIDIA GeForce RTX 3070 Ti Laptop GPU
  ()
35.7 fps -49%
Moyenne AMD Radeon RX 6600M
  ()
27.3 fps -61%

Performances du ray tracing

Bien qu'il possède le même nombre de cœurs RT que la RTX 4080 de bureau, le GPU RTX 4090 pour ordinateur portable peut être jusqu'à 25% plus lent en termes de performances globales de ray tracing. Cependant, nous voyons d'excellents gains jusqu'à 58% par rapport au GPU RTX 3080 Ti pour ordinateur portable.

Bien que nous obtenions de très bons chiffres d'images par seconde en 1080p natif, le ray tracing natif 4K à des fréquences d'images jouables n'est toujours pas dans le domaine du possible, comme le montrent les résultats de Cyberpunk 2077Cyberpunk 2077 1.5 : tests pour PC portables et de bureau. Nvidia pousse DLSS 3 comme le seul moyen viable de jouer à des résolutions plus élevées avec le RT activé.

Performance Rating - Percent
NVIDIA GeForce RTX 4090 Founders Edition
NVIDIA GeForce RTX 4090, i9-13900K
98.7 pt
NVIDIA GeForce RTX 4080 Founders Edition
NVIDIA GeForce RTX 4080, i9-13900K
87.4 pt
Asus TUF Gaming GeForce RTX 4070 Ti
NVIDIA GeForce RTX 4070 Ti, i9-13900K
75.9 pt
AMD Radeon RX 7900 XTX -2!
Radeon RX 7900 XTX, R9 7950X
74.5 pt
AMD Radeon RX 7900 XT -2!
Radeon RX 7900 XT, R9 7950X
66.2 pt
MSI Titan GT77 HX 13VI
NVIDIA GeForce RTX 4090 Laptop GPU, i9-13950HX, Samsung PM9A1 MZVL22T0HBLB
65.8 pt
SCHENKER XMG Neo 16 Raptor Lake
NVIDIA GeForce RTX 4090 Laptop GPU, i9-13900HX
65.2 pt
Moyenne NVIDIA GeForce RTX 3090
 
63.9 pt
Razer Blade 16 Early 2023
NVIDIA GeForce RTX 4080 Laptop GPU, i9-13950HX, SSSTC CA6-8D1024
62.2 pt
Moyenne NVIDIA GeForce RTX 3080 Ti Laptop GPU
 
41.7 pt
Moyenne NVIDIA GeForce RTX 3080 Laptop GPU
 
35.7 pt
Moyenne NVIDIA GeForce RTX 3070 Ti Laptop GPU
 
31.8 pt
Moyenne NVIDIA GeForce RTX 3060 Laptop GPU -1!
 
25.4 pt
Moyenne AMD Radeon RX 6700M -5!
 
25.3 pt
Moyenne AMD Radeon RX 6600M -2!
 
23.5 pt
Moyenne AMD Radeon RX 6800M -1!
 
23 pt
Metro Exodus - 1920x1080 Ultra Quality DXR AF:16x
AMD Radeon RX 7900 XTX
Radeon RX 7900 XTX, R9 7950X
141.2 (89.03min - 194.63max) fps +35%
NVIDIA GeForce RTX 4080 Founders Edition
NVIDIA GeForce RTX 4080, i9-13900K
137.2 (68.42min - 213.17max) fps +31%
NVIDIA GeForce RTX 4090 Founders Edition
NVIDIA GeForce RTX 4090, i9-13900K
135 (73.53min - 215.75max) fps +29%
Asus TUF Gaming GeForce RTX 4070 Ti
NVIDIA GeForce RTX 4070 Ti, i9-13900K
128.8 (62.96min - 211.1max) fps +23%
AMD Radeon RX 7900 XT
Radeon RX 7900 XT, R9 7950X
124.3 (78.88min - 166max) fps +19%
Moyenne NVIDIA GeForce RTX 3090
  (68.6 - 122.2, n=12)
111.4 fps +7%
MSI Titan GT77 HX 13VI
NVIDIA GeForce RTX 4090 Laptop GPU, i9-13950HX, Samsung PM9A1 MZVL22T0HBLB
108 fps +3%
Razer Blade 16 Early 2023
NVIDIA GeForce RTX 4080 Laptop GPU, i9-13950HX, SSSTC CA6-8D1024
104.4 (50.2min - 162.5max) fps
SCHENKER XMG Neo 16 Raptor Lake
NVIDIA GeForce RTX 4090 Laptop GPU, i9-13900HX
101.25 (55.8min - 158.6max) fps -3%
Moyenne NVIDIA GeForce RTX 3080 Ti Laptop GPU
  ()
77.9 fps -25%
Moyenne NVIDIA GeForce RTX 3080 Laptop GPU
  (59.1 - 74.5, n=5)
69 fps -34%
Moyenne NVIDIA GeForce RTX 3070 Ti Laptop GPU
  (61.3 - 65.1, n=2)
63.2 fps -39%
Moyenne AMD Radeon RX 6800M
  (54.9 - 57.4, n=3)
56.1 fps -46%
Moyenne NVIDIA GeForce RTX 3060 Laptop GPU
  (50.9 - 54.4, n=3)
52.9 fps -49%
Moyenne AMD Radeon RX 6600M
  (43.8 - 54.4, n=3)
47.5 fps -55%
Watch Dogs Legion - 1920x1080 Ultra Preset + Ultra Ray Tracing (DX12)
NVIDIA GeForce RTX 4090 Founders Edition
NVIDIA GeForce RTX 4090, i9-13900K
115.7 (18.56min, 92.59P1 - 160.3max) fps +45%
NVIDIA GeForce RTX 4080 Founders Edition
NVIDIA GeForce RTX 4080, i9-13900K
111.6 (76.88min, 90.46P1 - 161.11max) fps +40%
Asus TUF Gaming GeForce RTX 4070 Ti
NVIDIA GeForce RTX 4070 Ti, i9-13900K
98.9 (72.06min, 82.17P1 - 137.41max) fps +24%
SCHENKER XMG Neo 16 Raptor Lake
NVIDIA GeForce RTX 4090 Laptop GPU, i9-13900HX
90 (26min - 128max) fps +13%
Moyenne NVIDIA GeForce RTX 3090
  (75.7 - 110, n=3)
88 fps +10%
MSI Titan GT77 HX 13VI
NVIDIA GeForce RTX 4090 Laptop GPU, i9-13950HX, Samsung PM9A1 MZVL22T0HBLB
84 fps +5%
Razer Blade 16 Early 2023
NVIDIA GeForce RTX 4080 Laptop GPU, i9-13950HX, SSSTC CA6-8D1024
80 (58min - 115max) fps
Moyenne NVIDIA GeForce RTX 3080 Ti Laptop GPU
  (50 - 70, n=3)
58.6 fps -27%
Moyenne NVIDIA GeForce RTX 3080 Laptop GPU
  (41 - 59.5, n=5)
46.2 fps -42%
Moyenne NVIDIA GeForce RTX 3070 Ti Laptop GPU
  (36 - 41.2, n=2)
38.6 fps -52%
Moyenne AMD Radeon RX 6800M
  ()
29 fps -64%
Moyenne NVIDIA GeForce RTX 3060 Laptop GPU
  (15.4 - 27, n=2)
21.2 fps -73%
Moyenne AMD Radeon RX 6700M
  ()
18 fps -77%
Moyenne AMD Radeon RX 6600M
  ()
17.5 fps -78%
Far Cry 6 - 1920x1080 Ultra Graphics Quality + HD Textures + DXR AA:T
NVIDIA GeForce RTX 4080 Founders Edition
NVIDIA GeForce RTX 4080, i9-13900K
154 (125min - 209max) fps +29%
AMD Radeon RX 7900 XTX
Radeon RX 7900 XTX, R9 7950X
152.1 (75min - 229max) fps +28%
NVIDIA GeForce RTX 4090 Founders Edition
NVIDIA GeForce RTX 4090, i9-13900K
147 (125min - 209max) fps +24%
Asus TUF Gaming GeForce RTX 4070 Ti
NVIDIA GeForce RTX 4070 Ti, i9-13900K
146 (122min - 194max) fps +23%
AMD Radeon RX 7900 XT
Radeon RX 7900 XT, R9 7950X
143.6 (46min - 227max) fps +21%
Razer Blade 16 Early 2023
NVIDIA GeForce RTX 4080 Laptop GPU, i9-13950HX, SSSTC CA6-8D1024
119 (88min - 165max) fps
MSI Titan GT77 HX 13VI
NVIDIA GeForce RTX 4090 Laptop GPU, i9-13950HX, Samsung PM9A1 MZVL22T0HBLB
116 fps -3%
Moyenne NVIDIA GeForce RTX 3090
  (76 - 138.2, n=8)
112.6 fps -5%
SCHENKER XMG Neo 16 Raptor Lake
NVIDIA GeForce RTX 4090 Laptop GPU, i9-13900HX
108 (90min - 160max) fps -9%
Moyenne NVIDIA GeForce RTX 3080 Ti Laptop GPU
  (91 - 92, n=3)
91.3 fps -23%
Moyenne NVIDIA GeForce RTX 3070 Ti Laptop GPU
  (59 - 77.7, n=2)
68.4 fps -43%
Moyenne NVIDIA GeForce RTX 3080 Laptop GPU
  (59 - 84, n=3)
68 fps -43%
Moyenne AMD Radeon RX 6700M
  ()
54 fps -55%
Moyenne AMD Radeon RX 6600M
  (45.6 - 66.8, n=4)
53.8 fps -55%
Moyenne NVIDIA GeForce RTX 3060 Laptop GPU
  (34 - 66, n=2)
50 fps -58%
Dying Light 2 - 1920x1080 High Quality Raytracing
NVIDIA GeForce RTX 4090 Founders Edition
NVIDIA GeForce RTX 4090, i9-13900K
130 (49min, 97.7P0.1, 106.7P1 - 261max) fps +55%
NVIDIA GeForce RTX 4080 Founders Edition
NVIDIA GeForce RTX 4080, i9-13900K
98.7 (37.6min, 46.5P0.1, 74.3P1 - 245max) fps +18%
Razer Blade 16 Early 2023
NVIDIA GeForce RTX 4080 Laptop GPU, i9-13950HX, SSSTC CA6-8D1024
83.9 (66.4min - 121.8max) fps
Asus TUF Gaming GeForce RTX 4070 Ti
NVIDIA GeForce RTX 4070 Ti, i9-13900K
82.9 (36.6min, 45.4P0.1, 69.2P1 - 247max) fps -1%
Moyenne NVIDIA GeForce RTX 3090
  (67.9 - 80.2, n=2)
74.1 fps -12%
SCHENKER XMG Neo 16 Raptor Lake
NVIDIA GeForce RTX 4090 Laptop GPU, i9-13900HX
74 (27.6P0.1, 52P1) fps -12%
MSI Titan GT77 HX 13VI
NVIDIA GeForce RTX 4090 Laptop GPU, i9-13950HX, Samsung PM9A1 MZVL22T0HBLB
73 fps -13%
Moyenne NVIDIA GeForce RTX 3080 Ti Laptop GPU
  (33.4 - 42.3, n=5)
38.5 fps -54%
Moyenne NVIDIA GeForce RTX 3070 Ti Laptop GPU
  (28.7 - 54.9, n=6)
36.6 fps -56%
Moyenne NVIDIA GeForce RTX 3080 Laptop GPU
  ()
36 fps -57%
Moyenne NVIDIA GeForce RTX 3060 Laptop GPU
  ()
26.1 fps -69%
Moyenne AMD Radeon RX 6800M
  ()
17.8 fps -79%
Cyberpunk 2077 1.6
1920x1080 Ray Tracing Ultra Preset (DLSS off)
NVIDIA GeForce RTX 4090 Founders Edition
NVIDIA GeForce RTX 4090, i9-13900K
118.4 (92min - 154.9max) fps +81%
NVIDIA GeForce RTX 4080 Founders Edition
NVIDIA GeForce RTX 4080, i9-13900K
100.1 (77.6min - 133.3max) fps +53%
Asus TUF Gaming GeForce RTX 4070 Ti
NVIDIA GeForce RTX 4070 Ti, i9-13900K
81 (62.6min - 103.6max) fps +24%
MSI Titan GT77 HX 13VI
NVIDIA GeForce RTX 4090 Laptop GPU, i9-13950HX, Samsung PM9A1 MZVL22T0HBLB
74 fps +13%
SCHENKER XMG Neo 16 Raptor Lake
NVIDIA GeForce RTX 4090 Laptop GPU, i9-13900HX
73.86 (23.84min - 119.71max) fps +13%
Moyenne NVIDIA GeForce RTX 3090
  (61.3 - 68, n=5)
65.5 fps 0%
Razer Blade 16 Early 2023
NVIDIA GeForce RTX 4080 Laptop GPU, i9-13950HX, SSSTC CA6-8D1024
65.3 (31.7min - 96.9max) fps
AMD Radeon RX 7900 XTX
Radeon RX 7900 XTX, R9 7950X
64.6 (49.1min - 85.9max) fps -1%
AMD Radeon RX 7900 XT
Radeon RX 7900 XT, R9 7950X
57.1 (41.7min - 77.1max) fps -13%
Moyenne NVIDIA GeForce RTX 3080 Ti Laptop GPU
  (39.2 - 49.9, n=7)
43.3 fps -34%
Moyenne NVIDIA GeForce RTX 3070 Ti Laptop GPU
  (27.9 - 63, n=7)
36.8 fps -44%
Moyenne NVIDIA GeForce RTX 3080 Laptop GPU
  (34.6 - 37.8, n=2)
36.2 fps -45%
Moyenne NVIDIA GeForce RTX 3060 Laptop GPU
  (12.6 - 28.9, n=7)
23.9 fps -63%
Moyenne AMD Radeon RX 6800M
  ()
23.5 fps -64%
Moyenne AMD Radeon RX 6600M
  (15.6 - 26.6, n=2)
21.1 fps -68%
3840x2160 Ray Tracing Ultra Preset (DLSS off)
NVIDIA GeForce RTX 4090 Founders Edition
NVIDIA GeForce RTX 4090, i9-13900K
42.6 (32min - 55.4max) fps +121%
NVIDIA GeForce RTX 4080 Founders Edition
NVIDIA GeForce RTX 4080, i9-13900K
30.7 (23.5min - 40.6max) fps +59%
Asus TUF Gaming GeForce RTX 4070 Ti
NVIDIA GeForce RTX 4070 Ti, i9-13900K
23.7 (18.1min - 31.3max) fps +23%
SCHENKER XMG Neo 16 Raptor Lake
NVIDIA GeForce RTX 4090 Laptop GPU, i9-13900HX
22.43 (17.52min - 31.11max) fps +16%
MSI Titan GT77 HX 13VI
NVIDIA GeForce RTX 4090 Laptop GPU, i9-13950HX, Samsung PM9A1 MZVL22T0HBLB
22 fps +14%
Moyenne NVIDIA GeForce RTX 3090
  (19.8 - 22.1, n=5)
21 fps +9%
AMD Radeon RX 7900 XTX
Radeon RX 7900 XTX, R9 7950X
20.7 (14.4min - 28.9max) fps +7%
Razer Blade 16 Early 2023
NVIDIA GeForce RTX 4080 Laptop GPU, i9-13950HX, SSSTC CA6-8D1024
19.3 (13.3min - 26.5max) fps
AMD Radeon RX 7900 XT
Radeon RX 7900 XT, R9 7950X
17.6 (12min - 25max) fps -9%
Moyenne NVIDIA GeForce RTX 3080 Ti Laptop GPU
  (9.22 - 12.3, n=3)
10.9 fps -44%
Moyenne NVIDIA GeForce RTX 3080 Laptop GPU
  (10.2 - 10.7, n=2)
10.5 fps -46%
Moyenne AMD Radeon RX 6600M
  ()
6.77 fps -65%
Moyenne AMD Radeon RX 6800M
  ()
6.6 fps -66%
Moyenne NVIDIA GeForce RTX 3070 Ti Laptop GPU
  ()
5.29 fps -73%
Ghostwire Tokyo - 1920x1080 Highest Settings + Maximum Ray Tracing
NVIDIA GeForce RTX 4090 Founders Edition
NVIDIA GeForce RTX 4090, i9-13900K
193.7 (38.5min, 66.5P0.1, 142.5P1 - 275max) fps +100%
NVIDIA GeForce RTX 4080 Founders Edition
NVIDIA GeForce RTX 4080, i9-13900K
166.2 (30.4min, 60P0.1, 115.2P1 - 248max) fps +71%
Asus TUF Gaming GeForce RTX 4070 Ti
NVIDIA GeForce RTX 4070 Ti, i9-13900K
139.3 (31.3min, 53.2P0.1, 89.7P1 - 236max) fps +44%
AMD Radeon RX 7900 XTX
Radeon RX 7900 XTX, R9 7950X
136.3 (39.1min, 76.4P0.1, 95.8P1 - 243max) fps +41%
MSI Titan GT77 HX 13VI
NVIDIA GeForce RTX 4090 Laptop GPU, i9-13950HX, Samsung PM9A1 MZVL22T0HBLB
127 fps +31%
SCHENKER XMG Neo 16 Raptor Lake
NVIDIA GeForce RTX 4090 Laptop GPU, i9-13900HX
125.9 (35.6P0.1, 87.3P1) fps +30%
AMD Radeon RX 7900 XT
Radeon RX 7900 XT, R9 7950X
116.5 (30.3min, 71.6P0.1, 78.1P1 - 246max) fps +20%
Moyenne NVIDIA GeForce RTX 3090
  (106 - 122, n=3)
111.6 fps +15%
Razer Blade 16 Early 2023
NVIDIA GeForce RTX 4080 Laptop GPU, i9-13950HX, SSSTC CA6-8D1024
97 fps
Moyenne NVIDIA GeForce RTX 3080 Ti Laptop GPU
  (66.1 - 68.3, n=2)
67.2 fps -31%
Moyenne NVIDIA GeForce RTX 3080 Laptop GPU
  (64.7 - 65.9, n=2)
65.3 fps -33%
Moyenne NVIDIA GeForce RTX 3070 Ti Laptop GPU
  (48.9 - 59.9, n=3)
55.3 fps -43%
Moyenne NVIDIA GeForce RTX 3060 Laptop GPU
  ()
46.6 fps -52%
Moyenne AMD Radeon RX 6800M
  ()
46.6 fps -52%

Performance DLSS 3

Le tableau suivant illustre les avantages de DLSS 3 dans les titres pris en charge avec le GPU RTX 4090 de l'ordinateur portable MSI Titan GT77 HX 13V.

Par rapport à la 4K native, DLSS 3 en mode équilibré présente des avantages phénoménaux en termes de performances avec des paramètres 4K Ultra. Cyberpunk 2077 a été l'enfant-vedette de Nvidia pour le ray tracing et les performances DLSS depuis un certain temps maintenant, et en conséquence, nous constatons un gain stupéfiant de 331% en fps moyen après avoir activé DLSS 3 par rapport à la 4K native en réglages Ultra.

Jeu Réglage DLSS désactivé DLSS activé (équilibré) Différence
Spider-Man Miles Morales 4K Ultra 83 FPS 132 FPS +59 %
The Witcher 3 4.00 4K RT Ultra 27 FPS 50 FPS +85 %
Cyberpunk 2077 1.5 4K RT Ultra 22 FPS 95 FPS +331 %
God of War 4K Ultra 80 FPS 111 FPS +38 %
Horizon Zero Dawn Ultra 4K 95 FPS 143 FPS +51 %

MSI Titan GT77 HX 13VI

Bas Moyen Élevé UltraQHD4K DLSS4K
GTA V (2015) 184.1 182.6 140.9 138.5 175.7
The Witcher 3 (2015) 619 546 422 198.9 160
Dota 2 Reborn (2015) 225 206 194.1 185.9 178.9
Final Fantasy XV Benchmark (2018) 230 221 187.4 162.9 94.7
X-Plane 11.11 (2018) 203 177.5 134.1 114.3
Far Cry 5 (2018) 186 173 160 159 113
Strange Brigade (2018) 490 396 391 373 309 159.3
Shadow of the Tomb Raider (2018) 245 227 219 214 187 103
Metro Exodus (2019) 204 183 153 132 116 81
Control (2019) 240 232 187 122 63
Borderlands 3 (2019) 201 176 162 151 130 76
Horizon Zero Dawn (2020) 209 189 174 163 154 131 95
Mafia Definitive Edition (2020) 219 189 179 161 93
Watch Dogs Legion (2020) 152 144 131 120 109 69
F1 2021 (2021) 501 449 417 209 192.4 114.4
Far Cry 6 (2021) 167 147 144 135 89
Forza Horizon 5 (2021) 220 181 174 124 113 95
God of War (2022) 201 200 180 133 115 80
Rainbow Six Extraction (2022) 378 347 346 314 219 112
Dying Light 2 (2022) 240 206 174 121 62
GRID Legends (2022) 254 230 210 199 190 132
Cyberpunk 2077 1.6 (2022) 156 144 138 135 98 56
Ghostwire Tokyo (2022) 237 236 234 231 206 100
Tiny Tina's Wonderlands (2022) 339 289 224 182 131 70
F1 22 (2022) 316 294 283 138.2 90.1 44.9
Call of Duty Modern Warfare 2 2022 (2022) 230 215 183 176 135 126 85
Spider-Man Miles Morales (2022) 134 131 118 116 113 83
The Callisto Protocol (2022) 195 181 145 144 114 68
The Witcher 3 v4.00 (2023) 240 189 173 150 104 50
Dead Space Remake (2023) 147 141 130 129 100 53

Razer Blade 16 Early 2023

Bas Moyen Élevé UltraQHD4K DLSS4K FSR4K
GTA V (2015) 186.6 185.2 183.4 140.7 125.2 143.7
The Witcher 3 (2015) 609.6 462.7 353.5 176.8 120.6
Dota 2 Reborn (2015) 218 204 196 194.7 176.7
Final Fantasy XV Benchmark (2018) 195.8 184.1 157.8 120.1 74.1
X-Plane 11.11 (2018) 201 177.7 137 117.5
Strange Brigade (2018) 438 365 351 323 237 122.3
Shadow of the Tomb Raider (2018) 228 201 196 176 154 84
Metro Exodus (2019) 197 170.4 145 121.7 102 67
Control (2019) 239.1 204.7 157 102 50.1
Borderlands 3 (2019) 207.7 176.6 158.1 133.5 108.7 59.8
Mafia Definitive Edition (2020) 280.3 184 171.3 121.6 70.4
Watch Dogs Legion (2020) 140 129 121 110 93 56
Far Cry 6 (2021) 181 149 134 125 115 71
Dying Light 2 (2022) 184.1 160.4 140.9 97.8 48.6
Cyberpunk 2077 1.6 (2022) 121.1 118.1 113.8 106.2 81.2 40
Ghostwire Tokyo (2022) 198.7 159.6 154 145 135.9 73.1
The Callisto Protocol (2022) 177.8 159.8 119.9 120.4 93.1 55.3
Skull & Bones (2024) 50
Horizon Forbidden West (2024) 56.1 54.8 39.5

Schenker XMG Neo 16

Bas Moyen Élevé UltraQHD4K
GTA V (2015) 137.5 137.7 88.9
The Witcher 3 (2015) 216.4 137.1
Dota 2 Reborn (2015) 227 202 191.2 177.3 179.4
Final Fantasy XV Benchmark (2018) 180.7 158 91.5
X-Plane 11.11 (2018) 204 179.7 135.5 124.2
Strange Brigade (2018) 482 396 372 350 311 160.3
Shadow of the Tomb Raider (2018) 207 168 103
Metro Exodus (2019) 131.51 117.44 83.98
Control (2019) 183.7 121.9 63.5
Borderlands 3 (2019) 176 132.34 70.5
Mafia Definitive Edition (2020) 187.9 168.1 91.8
Watch Dogs Legion (2020) 127 113 71
Assassin´s Creed Valhalla (2020) 161 130 78
Far Cry 6 (2021) 139 134 92
Dying Light 2 (2022) 171.8 118.4 61.7
Cyberpunk 2077 1.6 (2022) 122.8 94.26 49.15
Ghostwire Tokyo (2022) 230.1 196.8 97.7
Tiny Tina's Wonderlands (2022) 189.4 135.8 73.7
F1 22 (2022) 137.4 90.5 45.3
Call of Duty Modern Warfare 2 2022 (2022) 181 137 86
Spider-Man Miles Morales (2022) 121.4 115.7 84.2
The Callisto Protocol (2022) 143.5 116.5 69.8
The Witcher 3 v4.00 (2023) 141.8 102.9 52.8

Test de stress

Les modèles d'ordinateurs portables testés n'ont pas présenté d'incohérences significatives dues à un étranglement thermique lorsqu'ils ont été sollicités par le siteThe Witcher 3 à 1080p Ultra.

La RTX 4090 du Titan GT77 HX 13V semble avoir quelques difficultés à maintenir le framerate initial mais parvient à se rétablir après un certain temps. La mise en œuvre de la RTX 4090 du XMG Neo 16 s'en sort légèrement mieux à cet égard.

Le RTX 4080 du Razer Blade 16, quant à lui, s'en sort bien dans ce test de stress.

0153045607590105120135150165180195210Tooltip
Razer Blade 16 Early 2023 NVIDIA GeForce RTX 4080 Laptop GPU, i9-13950HX, SSSTC CA6-8D1024; The Witcher 3: Ø166.9 (141-179)
SCHENKER XMG Neo 16 Raptor Lake NVIDIA GeForce RTX 4090 Laptop GPU, i9-13900HX; The Witcher 3: Ø204 (195-219)
MSI Titan GT77 HX 13VI NVIDIA GeForce RTX 4090 Laptop GPU, i9-13950HX, Samsung PM9A1 MZVL22T0HBLB; The Witcher 3: Ø198.9 (190-214)

Consommation d'énergie : RTX 4090 mobile 53% plus économe en énergie que le GPU RTX 3080 Ti pour ordinateur portable

La consommation électrique du mur dans le cas des GPU d'ordinateurs portables n'est pas vraiment comparable à ce que nous observons avec les pièces de bureau. En fait, la carte RTX 4090 Founders Edition peut à elle seule tirer plus de 700 W en charge lorsqu'elle est configurée pour utiliser une cible de puissance plus élevée.

Ce qui est intéressant ici, c'est que vous obtenez maintenant beaucoup plus de performances par watt par rapport à n'importe quel autre GPU mobile Nvidia à ce jour.

Par exemple, le MSI Titan GT77 12UHS équipée de la RTX 3080 Ti a une consommation totale similaire à celle de la Titan GT77 HX 13V, soit environ 248 W dans The Witcher 3 à 1080p ultra et environ 11% de plus dans FurMark (1280 x 720, sans AA). Cependant, la Titan GT77 HX 13V a une efficacité énergétique supérieure de 53% dans The Witcher 3 par rapport à son prédécesseur de 12ème génération.

Le Razer Blade 16 avec son GPU RTX 4080 consomme 7% de plus (236 W) que le Blade 17 avec un GPU RTX 3080 Ti (220 W) dans The Witcher 3. Malgré une consommation globale légèrement supérieure, le nouveau Blade 16 avec le GPU RTX 4080 est 32% plus économe en énergie dans le jeu que le Blade 17, bien que le RTX 3080 Ti de ce dernier soit configuré à 165 W.

Cela correspond également à la façon dont Nvidia a conçu Ada pour être beaucoup plus économe en énergie qu'Ampere. Les avantages du processus personnalisé 4N mis à part, le GPU Ada essaie d'abord d'atteindre les limites maximales d'horloge et de tension avant d'augmenter la puissance, ce qui se traduit par des performances plus élevées et une efficacité accrue à la même valeur de puissance par rapport à Ampere.

Power consumption: External monitor

04080120160200240280320360400440480520560600640680Tooltip
Razer Blade 16 Early 2023 NVIDIA GeForce RTX 4080 Laptop GPU, i9-13950HX, SSSTC CA6-8D1024; Power Consumption; 1920x1080 The Witcher 3 ultra (external Monitor): Ø236 (225-245)
MSI Titan GT77 HX 13VI NVIDIA GeForce RTX 4090 Laptop GPU, i9-13950HX, Samsung PM9A1 MZVL22T0HBLB; Power Consumption; 1920x1080 The Witcher 3 ultra (external Monitor): Ø250 (245-260)
NVIDIA GeForce RTX 4090 Founders Edition NVIDIA GeForce RTX 4090, i9-13900K; Power Consumption; 1920x1080 The Witcher 3 ultra (external Monitor); 133% PT OC: Ø552 (541-569)
NVIDIA GeForce RTX 4090 Founders Edition NVIDIA GeForce RTX 4090, i9-13900K; Power Consumption; 1920x1080 The Witcher 3 ultra (external Monitor); 100% PT: Ø499 (493-519)
NVIDIA GeForce RTX 4080 Founders Edition NVIDIA GeForce RTX 4080, i9-13900K; Power Consumption; 1920x1080 The Witcher 3 ultra (external Monitor); 110% PT: Ø463 (451-481)
NVIDIA GeForce RTX 4080 Founders Edition NVIDIA GeForce RTX 4080, i9-13900K; Power Consumption; 1920x1080 The Witcher 3 ultra (external Monitor); 100% PT: Ø420 (410-448)
Razer Blade 16 Early 2023 NVIDIA GeForce RTX 4080 Laptop GPU, i9-13950HX, SSSTC CA6-8D1024; Power Consumption; 1280x720 FurMark 1.19 GPU Stress Test (external Monitor): Ø242 (232-253)
MSI Titan GT77 HX 13VI NVIDIA GeForce RTX 4090 Laptop GPU, i9-13950HX, Samsung PM9A1 MZVL22T0HBLB; Power Consumption; 1280x720 FurMark 1.19 GPU Stress Test (external Monitor): Ø218 (183.4-250)
NVIDIA GeForce RTX 4090 Founders Edition NVIDIA GeForce RTX 4090, i9-13900K; Power Consumption; 1280x720 FurMark 1.19 GPU Stress Test (external Monitor); 133% PT OC: Ø704 (666-717)
NVIDIA GeForce RTX 4090 Founders Edition NVIDIA GeForce RTX 4090, i9-13900K; Power Consumption; 1280x720 FurMark 1.19 GPU Stress Test (external Monitor); 100% PT: Ø558 (551-566)
NVIDIA GeForce RTX 4080 Founders Edition NVIDIA GeForce RTX 4080, i9-13900K; Power Consumption; 1280x720 FurMark 1.19 GPU Stress Test (external Monitor); 110% PT: Ø466 (461-488)
NVIDIA GeForce RTX 4080 Founders Edition NVIDIA GeForce RTX 4080, i9-13900K; Power Consumption; 1280x720 FurMark 1.19 GPU Stress Test (external Monitor); 100% PT: Ø429 (423-436)
Power Consumption / The Witcher 3 ultra (external Monitor)
NVIDIA GeForce RTX 4090 Founders Edition
NVIDIA GeForce RTX 4090, i9-13900K (133% PT OC, Idle: 81.25 W)
552 (541min, 545P1 - 569max) Watt * -134%
NVIDIA GeForce RTX 4090 Founders Edition
NVIDIA GeForce RTX 4090, i9-13900K (100% PT, Idle: 81.25 W)
499 (493min, 494P1 - 519max) Watt * -111%
AMD Radeon RX 7900 XTX
Radeon RX 7900 XTX, R9 7950X (Idle: 86.5 W)
540 (527min, 530P1 - 564max) Watt * -129%
Moyenne NVIDIA GeForce RTX 3090
  (Idle: 464 - 597, n=17 W)
524 Watt * -122%
NVIDIA GeForce RTX 4080 Founders Edition
NVIDIA GeForce RTX 4080, i9-13900K (110% PT, Idle: 78.45 W)
463 (451min, 453P1 - 481max) Watt * -96%
NVIDIA GeForce RTX 4080 Founders Edition
NVIDIA GeForce RTX 4080, i9-13900K (100% PT, Idle: 78.45 W)
420 (410min, 411P1 - 448max) Watt * -78%
AMD Radeon RX 7900 XT
Radeon RX 7900 XT, R9 7950X (Idle: 84.6 W)
459 (451min, 453P1 - 488max) Watt * -94%
Asus TUF Gaming GeForce RTX 4070 Ti
NVIDIA GeForce RTX 4070 Ti, i9-13900K (Perf BIOS / 110% PT, Idle: 75.4 W)
422 (412min, 413P1 - 452max) Watt * -79%
Asus TUF Gaming GeForce RTX 4070 Ti
NVIDIA GeForce RTX 4070 Ti, i9-13900K (Perf BIOS / 100% PT, Idle: 75.4 W)
419 (414min, 415P1 - 438max) Watt * -78%
Asus TUF Gaming GeForce RTX 4070 Ti
NVIDIA GeForce RTX 4070 Ti, i9-13900K (Quiet BIOS / 100% PT, Idle: 75.4 W)
418 (411min, 412P1 - 433max) Watt * -77%
MSI Titan GT77 HX 13VI
NVIDIA GeForce RTX 4090 Laptop GPU, i9-13950HX, Samsung PM9A1 MZVL22T0HBLB
250 (245min, 246P1 - 260max) Watt * -6%
MSI Titan GT77 12UHS
GeForce RTX 3080 Ti Laptop GPU, i9-12900HX, Samsung PM9A1 MZVL21T0HCLR
248 (242min, 244P1 - 259max) Watt * -5%
Razer Blade 16 Early 2023
NVIDIA GeForce RTX 4080 Laptop GPU, i9-13950HX, SSSTC CA6-8D1024
236 (225min, 225P1 - 245max) Watt *
Razer Blade 17 Early 2022
GeForce RTX 3080 Ti Laptop GPU, i9-12900H, Samsung PM9A1 MZVL21T0HCLR
220 (215min, 215P1 - 227max) Watt * +7%
Moyenne NVIDIA GeForce RTX 3080 Ti Laptop GPU
  (Idle: 144 - 287, n=27 W)
213 Watt * +10%
Moyenne AMD Radeon RX 6800M
  (Idle:  W)
211 Watt * +11%
Moyenne NVIDIA GeForce RTX 3080 Laptop GPU
  (Idle: 124 - 244, n=25 W)
183.8 Watt * +22%
Moyenne AMD Radeon RX 6700M
  (Idle:  W)
182 Watt * +23%
Moyenne NVIDIA GeForce RTX 3070 Ti Laptop GPU
  (Idle: 115 - 234, n=25 W)
181 Watt * +23%
Moyenne AMD Radeon RX 6600M
  (Idle: 124 - 191, n=6 W)
164.5 Watt * +30%
Moyenne NVIDIA GeForce RTX 3060 Laptop GPU
  (Idle: 107.5 - 191, n=38 W)
148.9 Watt * +37%
Power Consumption / FurMark 1.19 GPU Stress Test (external Monitor)
NVIDIA GeForce RTX 4090 Founders Edition
NVIDIA GeForce RTX 4090, i9-13900K (133% PT OC, Idle: 81.25 W)
704 (666min, 670P1 - 717max) Watt * -191%
NVIDIA GeForce RTX 4090 Founders Edition
NVIDIA GeForce RTX 4090, i9-13900K (100% PT, Idle: 81.25 W)
558 (551min, 553P1 - 566max) Watt * -131%
AMD Radeon RX 7900 XTX
Radeon RX 7900 XTX, R9 7950X (Idle: 86.5 W)
518 (501min, 502P1 - 525max) Watt * -114%
AMD Radeon RX 7900 XT
Radeon RX 7900 XT, R9 7950X (Idle: 84.6 W)
513 (500min, 506P1 - 527max) Watt * -112%
Moyenne NVIDIA GeForce RTX 3090
  (Idle: 281 - 551, n=8 W)
469 Watt * -94%
NVIDIA GeForce RTX 4080 Founders Edition
NVIDIA GeForce RTX 4080, i9-13900K (110% PT, Idle: 78.45 W)
466 (461min, 462P1 - 488max) Watt * -93%
NVIDIA GeForce RTX 4080 Founders Edition
NVIDIA GeForce RTX 4080, i9-13900K (100% PT, Idle: 78.45 W)
429 (423min, 424P1 - 436max) Watt * -77%
Asus TUF Gaming GeForce RTX 4070 Ti
NVIDIA GeForce RTX 4070 Ti, i9-13900K (Perf BIOS / 110% PT, Idle: 75.4 W)
443 (440min, 440P1 - 465max) Watt * -83%
Asus TUF Gaming GeForce RTX 4070 Ti
NVIDIA GeForce RTX 4070 Ti, i9-13900K (Quiet BIOS / 100% PT, Idle: 75.4 W)
410 (408min, 409P1 - 415max) Watt * -69%
Asus TUF Gaming GeForce RTX 4070 Ti
NVIDIA GeForce RTX 4070 Ti, i9-13900K (Perf BIOS / 100% PT, Idle: 75.4 W)
406 (401min, 402P1 - 430max) Watt * -68%
Razer Blade 16 Early 2023
NVIDIA GeForce RTX 4080 Laptop GPU, i9-13950HX, SSSTC CA6-8D1024
242 (232min, 234P1 - 253max) Watt *
MSI Titan GT77 12UHS
GeForce RTX 3080 Ti Laptop GPU, i9-12900HX, Samsung PM9A1 MZVL21T0HCLR
241 (230min, 231P1 - 249max) Watt * -0%
Razer Blade 17 Early 2022
GeForce RTX 3080 Ti Laptop GPU, i9-12900H, Samsung PM9A1 MZVL21T0HCLR
221 (213min, 216P1 - 227max) Watt * +9%
MSI Titan GT77 HX 13VI
NVIDIA GeForce RTX 4090 Laptop GPU, i9-13950HX, Samsung PM9A1 MZVL22T0HBLB
218 (183.4min, 211P1 - 250max) Watt * +10%
Moyenne NVIDIA GeForce RTX 3080 Ti Laptop GPU
  (Idle: 139.2 - 288, n=28 W)
203 Watt * +16%
Moyenne AMD Radeon RX 6800M
  (Idle:  W)
198.4 Watt * +18%
Moyenne NVIDIA GeForce RTX 3080 Laptop GPU
  (Idle: 122 - 254, n=26 W)
175.4 Watt * +28%
Moyenne NVIDIA GeForce RTX 3070 Ti Laptop GPU
  (Idle: 123.6 - 211, n=27 W)
175.1 Watt * +28%
Moyenne AMD Radeon RX 6600M
  (Idle: 113 - 187, n=6 W)
166 Watt * +31%
Moyenne AMD Radeon RX 6700M
  (Idle:  W)
155 Watt * +36%
Moyenne NVIDIA GeForce RTX 3060 Laptop GPU
  (Idle: 94.1 - 202, n=38 W)
145.4 Watt * +40%
Power Consumption / Witcher 3 ultra Efficiency (external Monitor)
MSI Titan GT77 HX 13VI
NVIDIA GeForce RTX 4090 Laptop GPU, i9-13950HX, Samsung PM9A1 MZVL22T0HBLB
0.796 fps per Watt +12%
Razer Blade 16 Early 2023
NVIDIA GeForce RTX 4080 Laptop GPU, i9-13950HX, SSSTC CA6-8D1024
0.71 fps per Watt
Moyenne NVIDIA GeForce RTX 3080 Laptop GPU
  (0.4696 - 0.736, n=23)
0.583 fps per Watt -18%
Moyenne NVIDIA GeForce RTX 3070 Ti Laptop GPU
  (0.4399 - 0.97, n=24)
0.579 fps per Watt -18%
AMD Radeon RX 7900 XT
Radeon RX 7900 XT, R9 7950X
0.577 fps per Watt -19%
Moyenne NVIDIA GeForce RTX 3080 Ti Laptop GPU
  (0.4432 - 0.69, n=26)
0.555 fps per Watt -22%
AMD Radeon RX 7900 XTX
Radeon RX 7900 XTX, R9 7950X
0.55 fps per Watt -23%
NVIDIA GeForce RTX 4080 Founders Edition
NVIDIA GeForce RTX 4080, i9-13900K
0.549 fps per Watt -23%
Asus TUF Gaming GeForce RTX 4070 Ti
NVIDIA GeForce RTX 4070 Ti, i9-13900K
0.545 fps per Watt -23%
Razer Blade 17 Early 2022
GeForce RTX 3080 Ti Laptop GPU, i9-12900H, Samsung PM9A1 MZVL21T0HCLR
0.544 fps per Watt -23%
NVIDIA GeForce RTX 4090 Founders Edition
NVIDIA GeForce RTX 4090, i9-13900K
0.538 fps per Watt -24%
Moyenne NVIDIA GeForce RTX 3060 Laptop GPU
  (0.4181 - 0.651, n=33)
0.538 fps per Watt -24%
Moyenne AMD Radeon RX 6700M
  ()
0.524 fps per Watt -26%
MSI Titan GT77 12UHS
GeForce RTX 3080 Ti Laptop GPU, i9-12900HX, Samsung PM9A1 MZVL21T0HCLR
0.521 fps per Watt -27%
Moyenne AMD Radeon RX 6600M
  (0.4398 - 0.608, n=6)
0.519 fps per Watt -27%
Moyenne NVIDIA GeForce RTX 3090
  (0.268 - 0.3954, n=14)
0.3429 fps per Watt -52%

* ... Moindre est la valeur, meilleures sont les performances

Verdict : Des performances dignes d'une RTX 3090 de bureau à 175 W

Les GPU Ada RTX 40 de Nvidia pour ordinateurs portables offrent d'excellentes performances et une grande efficacité énergétique. (Image Source : Nvidia)

La génération Ampère de Nvidia avait beaucoup d'atouts en termes de performances par rapport à Turing, mais son lancement a eu lieu à un moment où l'ordre mondial se détraquait.

En conséquence, les cartes ont été sous-stockées et hors de prix, ce qui a donné lieu à toutes sortes de combines de scalp. Dans le contexte d'un boom des crypto-monnaies capricieux et éphémère, de nombreux joueurs ont estimé qu'il était économiquement judicieux d'opter pour des ordinateurs portables alimentés par des ampères plutôt que pour des cartes de bureau.

Avance rapide jusqu'en 2023, et la plupart de ces expériences pénibles sont désormais derrière nous. Les derniers GPU Ada de Nvidia se sont imposés des critères très élevés en termes de performances et d'efficacité énergétique, au point qu'ils semblent constituer un véritable saut de génération.

Nous avons été très impressionnés par les performances d'Ada sur les ordinateurs de bureau et nous sommes heureux de constater que la plupart de ces avantages se traduisent également sur les ordinateurs portables.

Les GPU pour ordinateurs portables Nvidia RTX 4080 et RTX 4090 illustrent parfaitement les performances et l'efficacité d'Ada, le premier ayant des performances plus ou moins similaires à celles d'un RTX 3090 de bureau de 350 watts. Toutefois, ces avantages ne sont visibles qu'avec le modèle le plus haut de gamme qui consomme 175 W.

Tout n'est pas rose avec Ada mobile, cependant. Les appareils que nous avons testés ont permis aux RTX 4080 et RTX 4090 de déployer pleinement leurs muscles à 150 W avec 25 W supplémentaires de Dynamic Boost. Tous les ordinateurs portables dans la nature ne permettront pas à ces GPU de fonctionner à ces TDP.

Et ceux qui le font ne sont pas vraiment portables non plus - l'alimentation de la Titan GT77 pèse à elle seule 1,4 kg et ses niveaux de bruit en charge maximale peuvent donner l'impression d'être assis dans le cockpit d'un F16.

L'autre problème est l'image de marque trompeuse de Nvidia. Le client moyen s'attache généralement plus à la marque numérique qu'aux spécifications réelles du GPU, de sorte que quelqu'un à Santa Clara a pensé qu'il était parfaitement logique, d'un point de vue marketing, de baptiser le meilleur GPU pour ordinateur portable RTX 4090, simplement parce qu'il est plus performant qu'un RTX 3090 de bureau !

Mais ceux qui recherchent les ordinateurs portables équipés de RTX 4090 ne sont pas des consommateurs moyens typiques. Et ne parlons même pas de toutes les sortes de problèmes de performance auxquels on peut s'attendre dans la gamme des 80 à 150 W de TDP.

Le prix est un autre facteur important à prendre en compte. Les ordinateurs portables que nous avons utilisés dans cette comparaison ont le potentiel de faire un gros trou dans vos poches. À tel point que l'achat d'une voiture d'occasion peut sembler un meilleur investissement. Mais bon, c'est la nature des appareils phares en général.

Tout bien considéré, Ada mobile est un pas dans la bonne direction. Les avantages que nous constatons avec les configurations haut de gamme vont certainement se répercuter sur les offres de milieu et d'entrée de gamme, et des fonctionnalités telles que DLSS 3 vont certainement contribuer à accélérer l'adoption d'Ada parmi les joueurs mobiles.

Nous aurons une image plus globale des améliorations de l'efficacité d'Ada mobile lorsque nous testerons d'autres ordinateurs portables RTX 40 configurés avec différents TDP dans les mois à venir.

Espérons que les appareils équipés d'AMD RDNA 3 seront également disponibles en nombre significatif à terme et qu'ils seront compétitifs pour le bénéfice de tous.

Pricecompare

Please share our article, every link counts!
> Revues et rapports de ordinateurs portatifs et smartphones, ordiphones > Critiques > Test de la Nvidia Ada RTX 40 : la RTX 4090 de 175 W surpasse la RTX 3090 de 350 W pour les performances comme pour l'efficacité énergétique
Vaidyanathan Subramaniam, 2023-02-10 (Update: 2023-02-13)