

Verdict - L'un des ordinateurs portables RTX 5090 les plus rapides
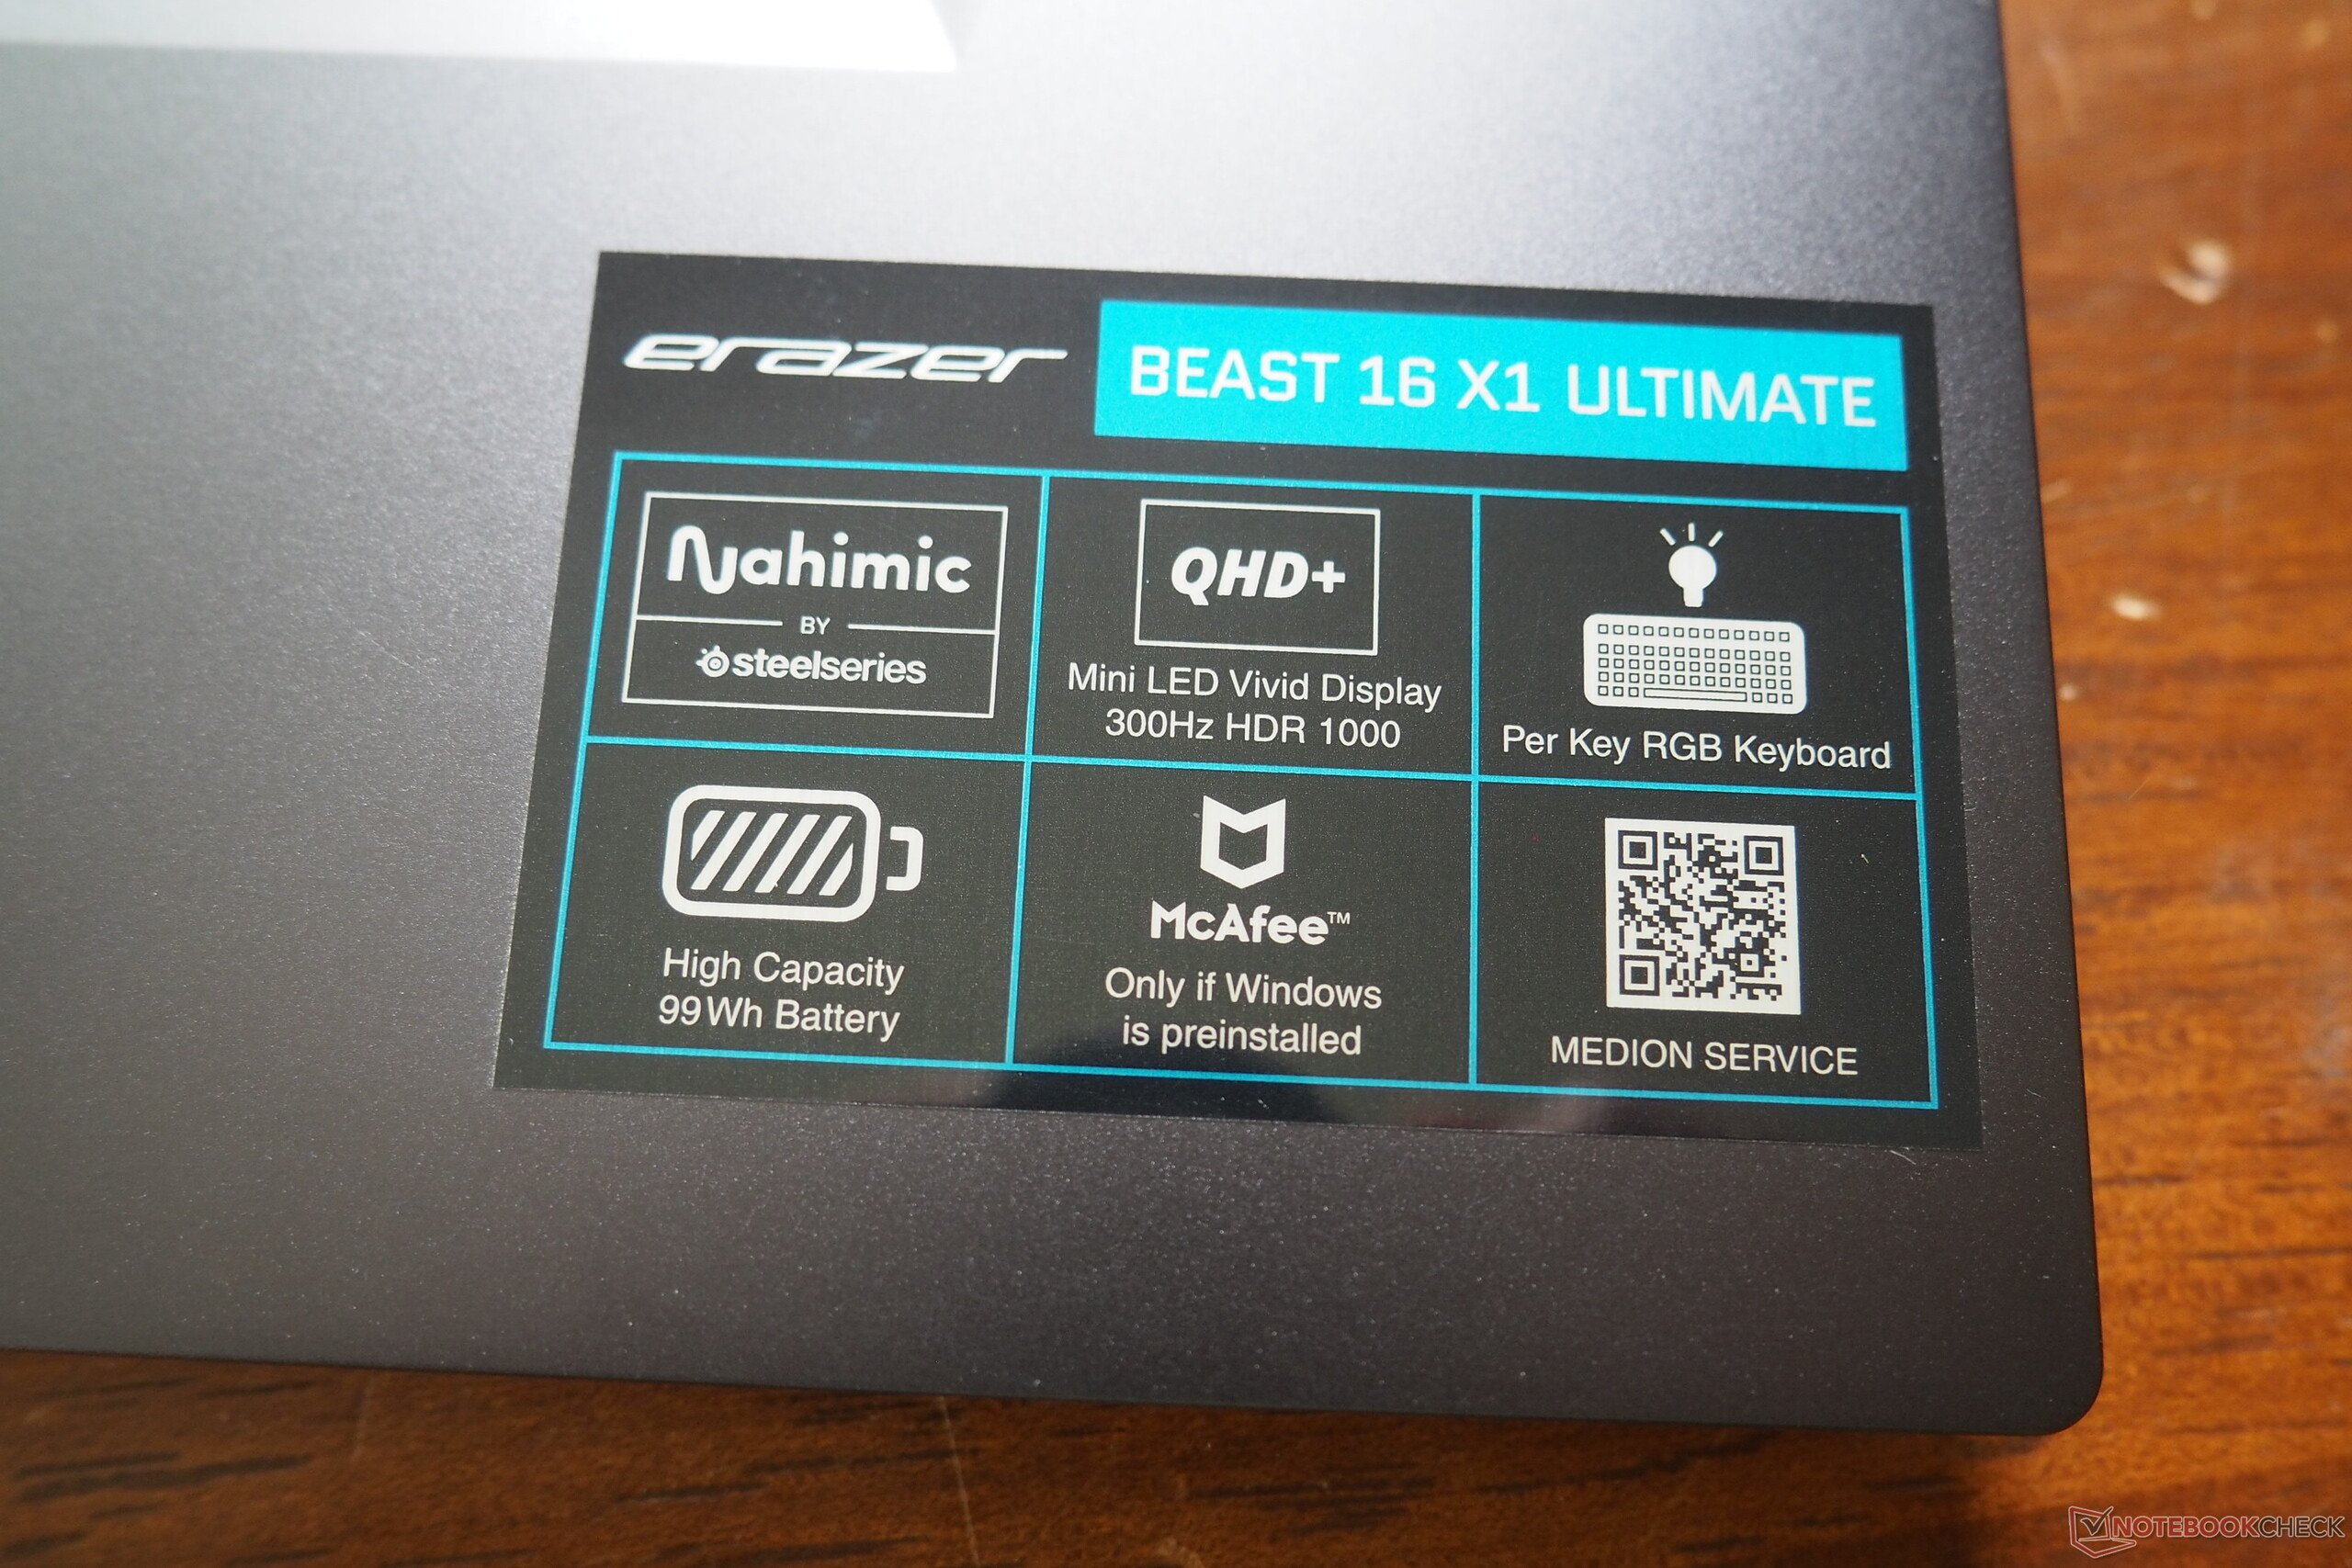
Le Medion Erazer Beast 16 X1 n'est certainement pas une bonne affaire : Pour la version supérieure MD62732 avec Core Ultra 9 275HX, GeForce RTX 5090, 32 Go de RAM et 2 TB SSD, vous devez mettre plus de 4000 euros (~$4539) sur la table au moment du test. Nous verrons dans la suite de cet article si le surcoût par rapport à la RTX 5080 en vaut la peine. Dans l'ensemble, l'ordinateur portable de 16 pouces a reçu la note "très bien", grâce à ses performances, son écran et son boîtier. Le mini écran LED au format 16:10 (2 560 x 1 600 pixels, 300 Hz) marque des points notamment grâce à sa luminosité élevée, son contraste riche et sa large gamme de couleurs, qui devraient plaire non seulement aux joueurs, mais aussi aux utilisateurs professionnels.
Le châssis est de grande qualité grâce à l'insert métallique et impressionne par sa bonne stabilité. Les périphériques d'entrée et les connexions ne sont pas mal non plus. L'Erazer Beast 16 X1 dispose notamment d'un port Thunderbolt 4. Il y a peu de points à critiquer, mais ce qui nous a le plus dérangés lors du test, c'est le développement important du bruit sous charge. Malheureusement, ce défaut concerne presque tous les ordinateurs portables de jeu.
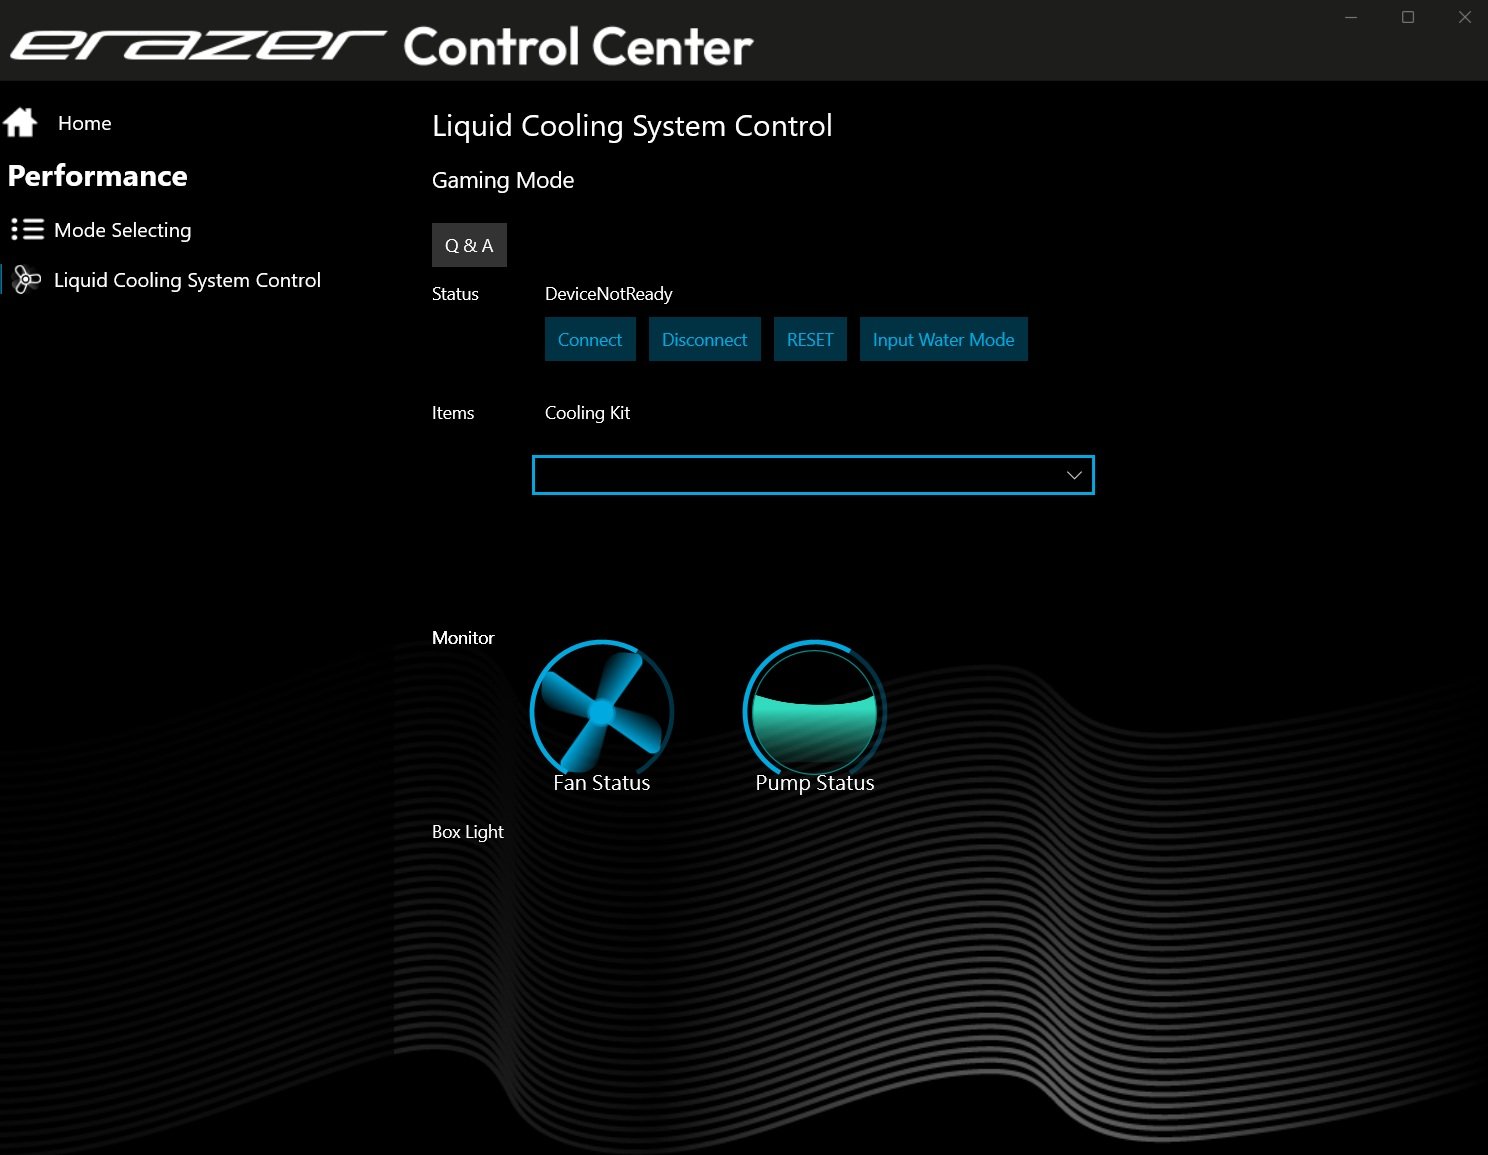
Si vous souhaitez tirer encore plus de profit de votre ordinateur portable, vous pouvez acheter le kit de refroidissement optionnel Erazer Cooling Kit V2 pour environ 250 euros (~$284). Nous publierons bientôt un article séparé avec quelques mesures appropriées.
Points positifs
Points négatifs
Prix et disponibilité
L'Erazer Beast 16 X1 Ultimate MD62732 est disponible pour environ 4,300 Euros (~$4879) sur la page d'accueil de Medion https://www.medion.com/de/shop/p/high-end-gaming-notebooks-medion-erazer-beast-16-x1-ultimate-high-end-gaming-laptop-intel-core-ultra-9-prozessor-275hx-windows-11-home-40-6-cm-16--mini-led-vivid-display-mit-300hz-rtx-5090-2-tb-pcie-ssd-32-gb-ram-30039605A1 (actuellement réduit à 4,090 Euros/~4641).
les homologues de 16 pouces qui contiennent également un GPU RTX 5000 sont, par exemple, le HP Omen Max 16le Asus ROG Strix Scar 16l'Asus ROG Strix Scar 16 Lenovo Legion Pro 7i 16 et le Asus ROG Strix G16qui apparaissent tous dans les tableaux en tant qu'appareils de comparaison. Toutefois, le principal concurrent est le modèle plus ou moins identique XMG Neo 16 E25.
Spécifications
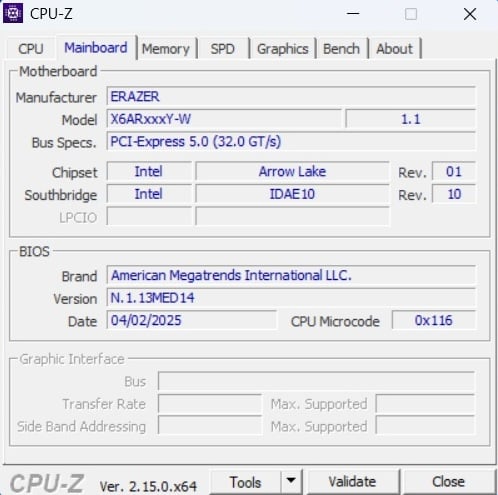
Logement
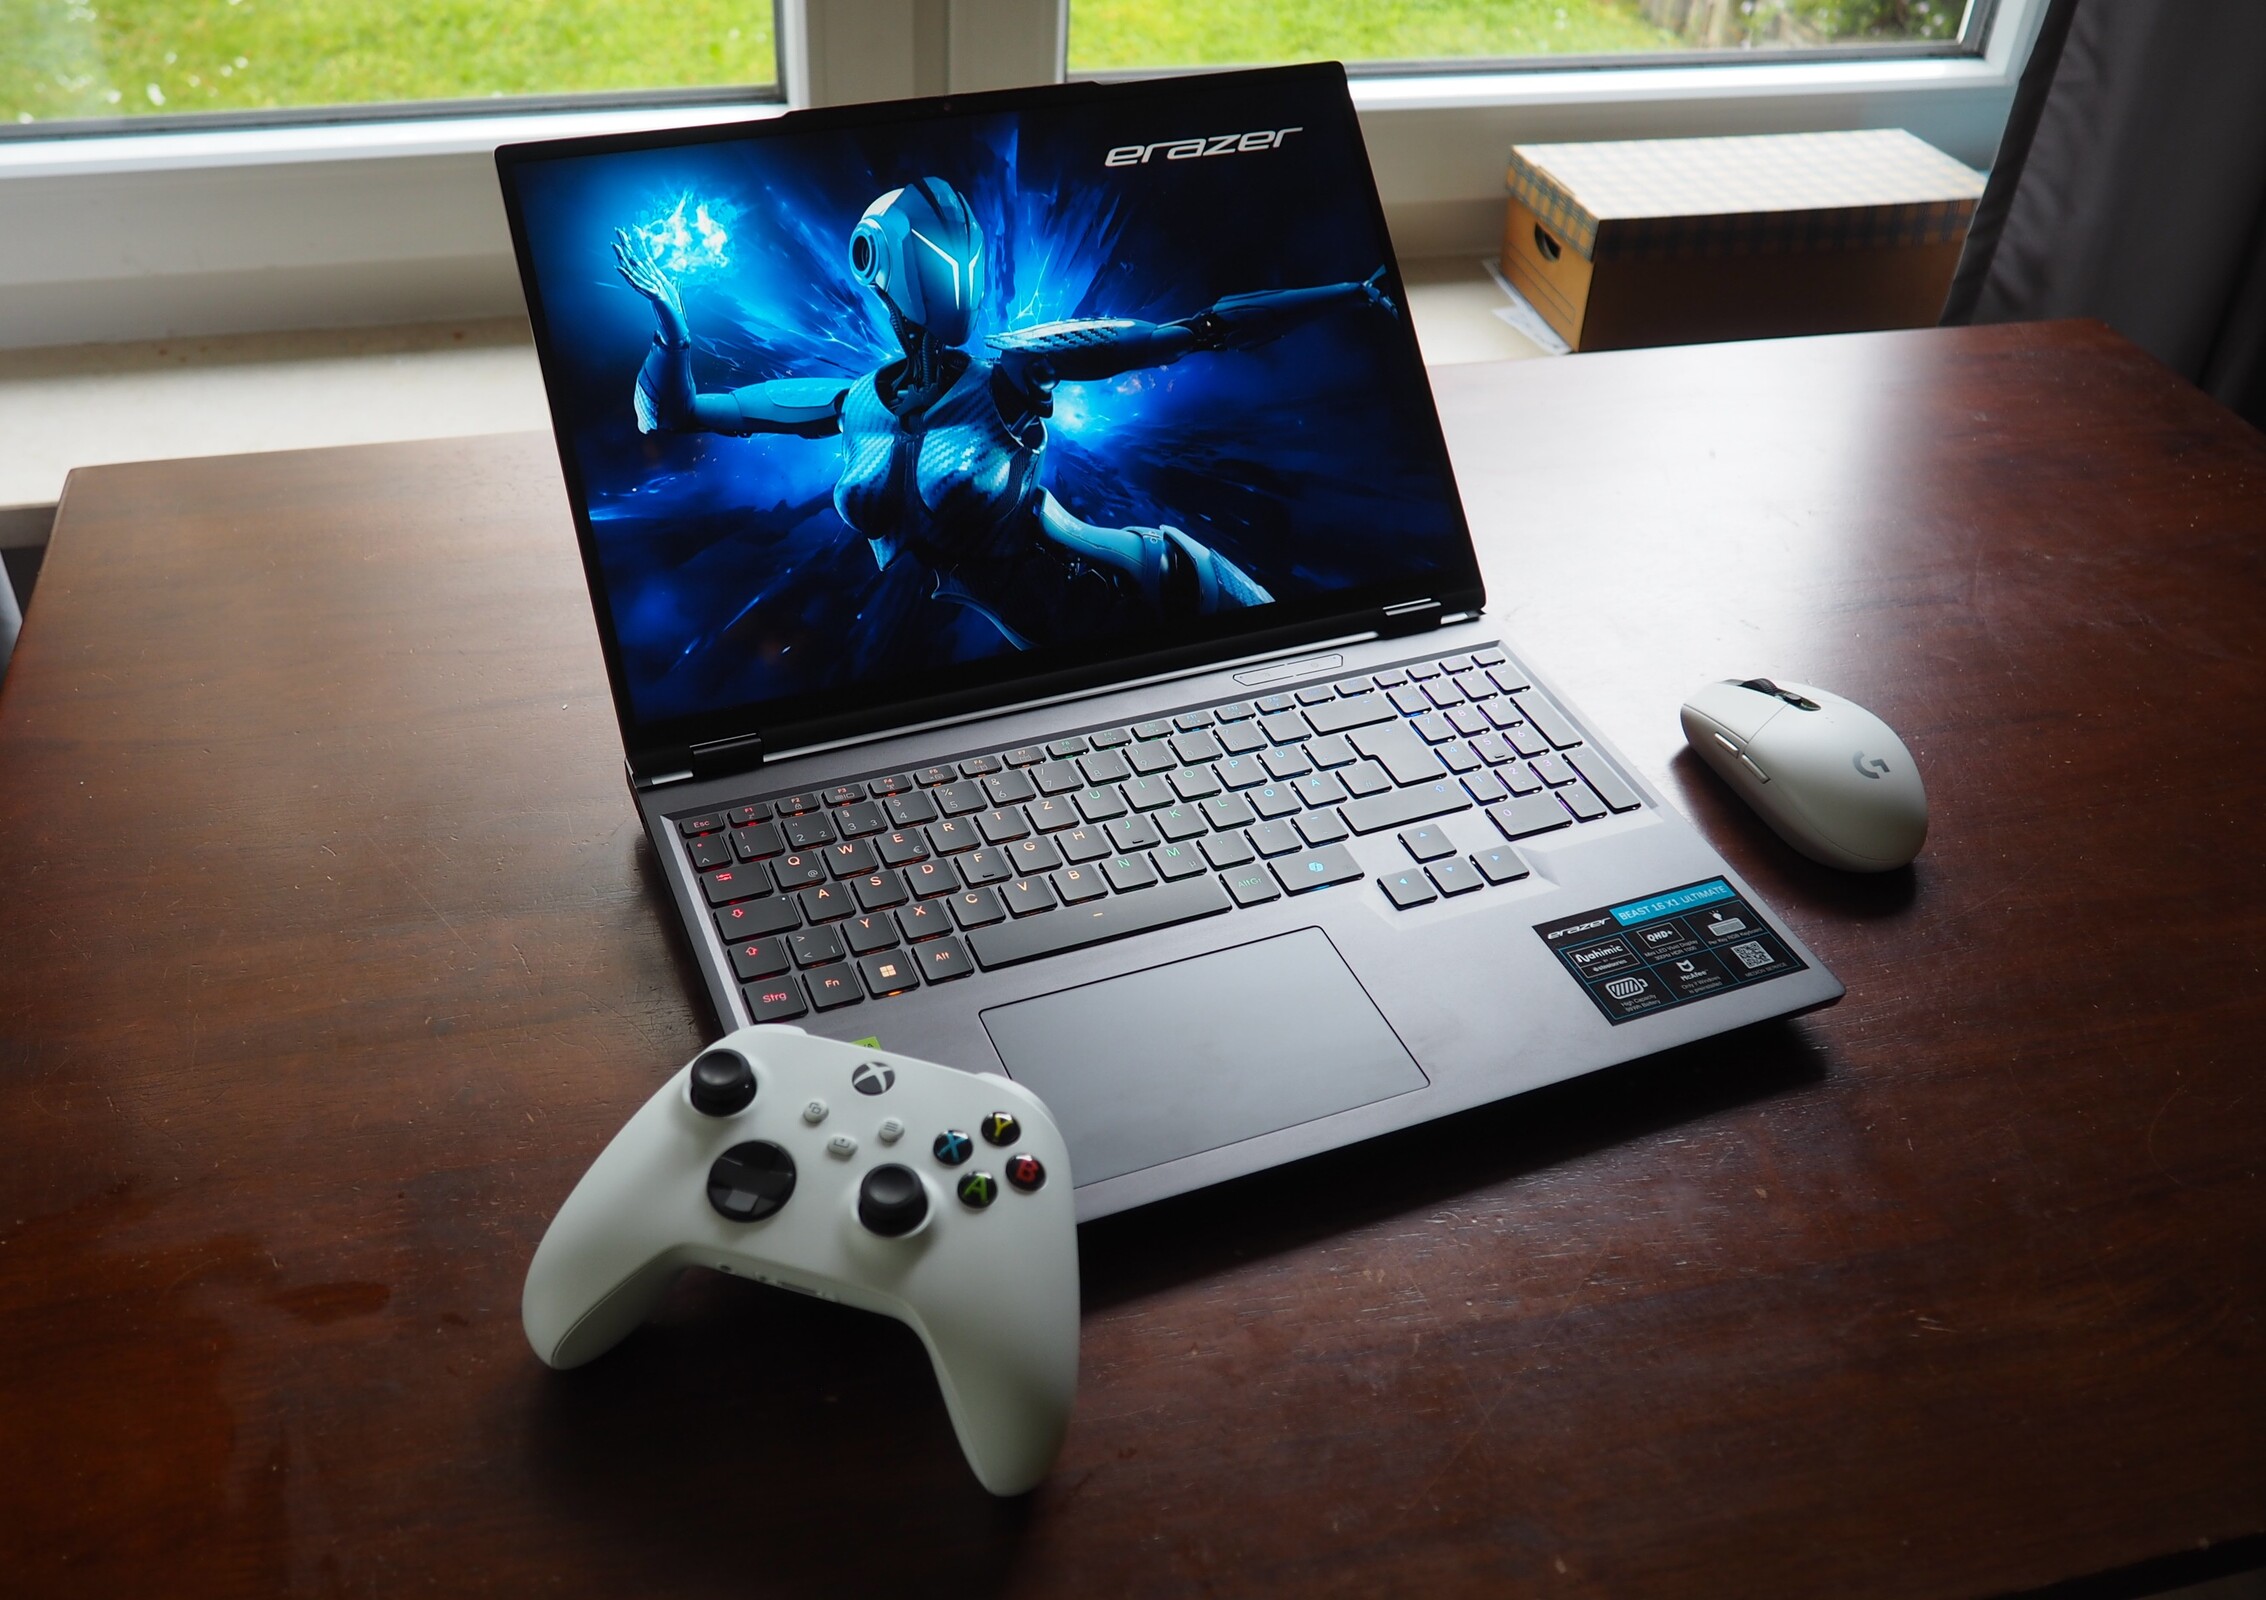
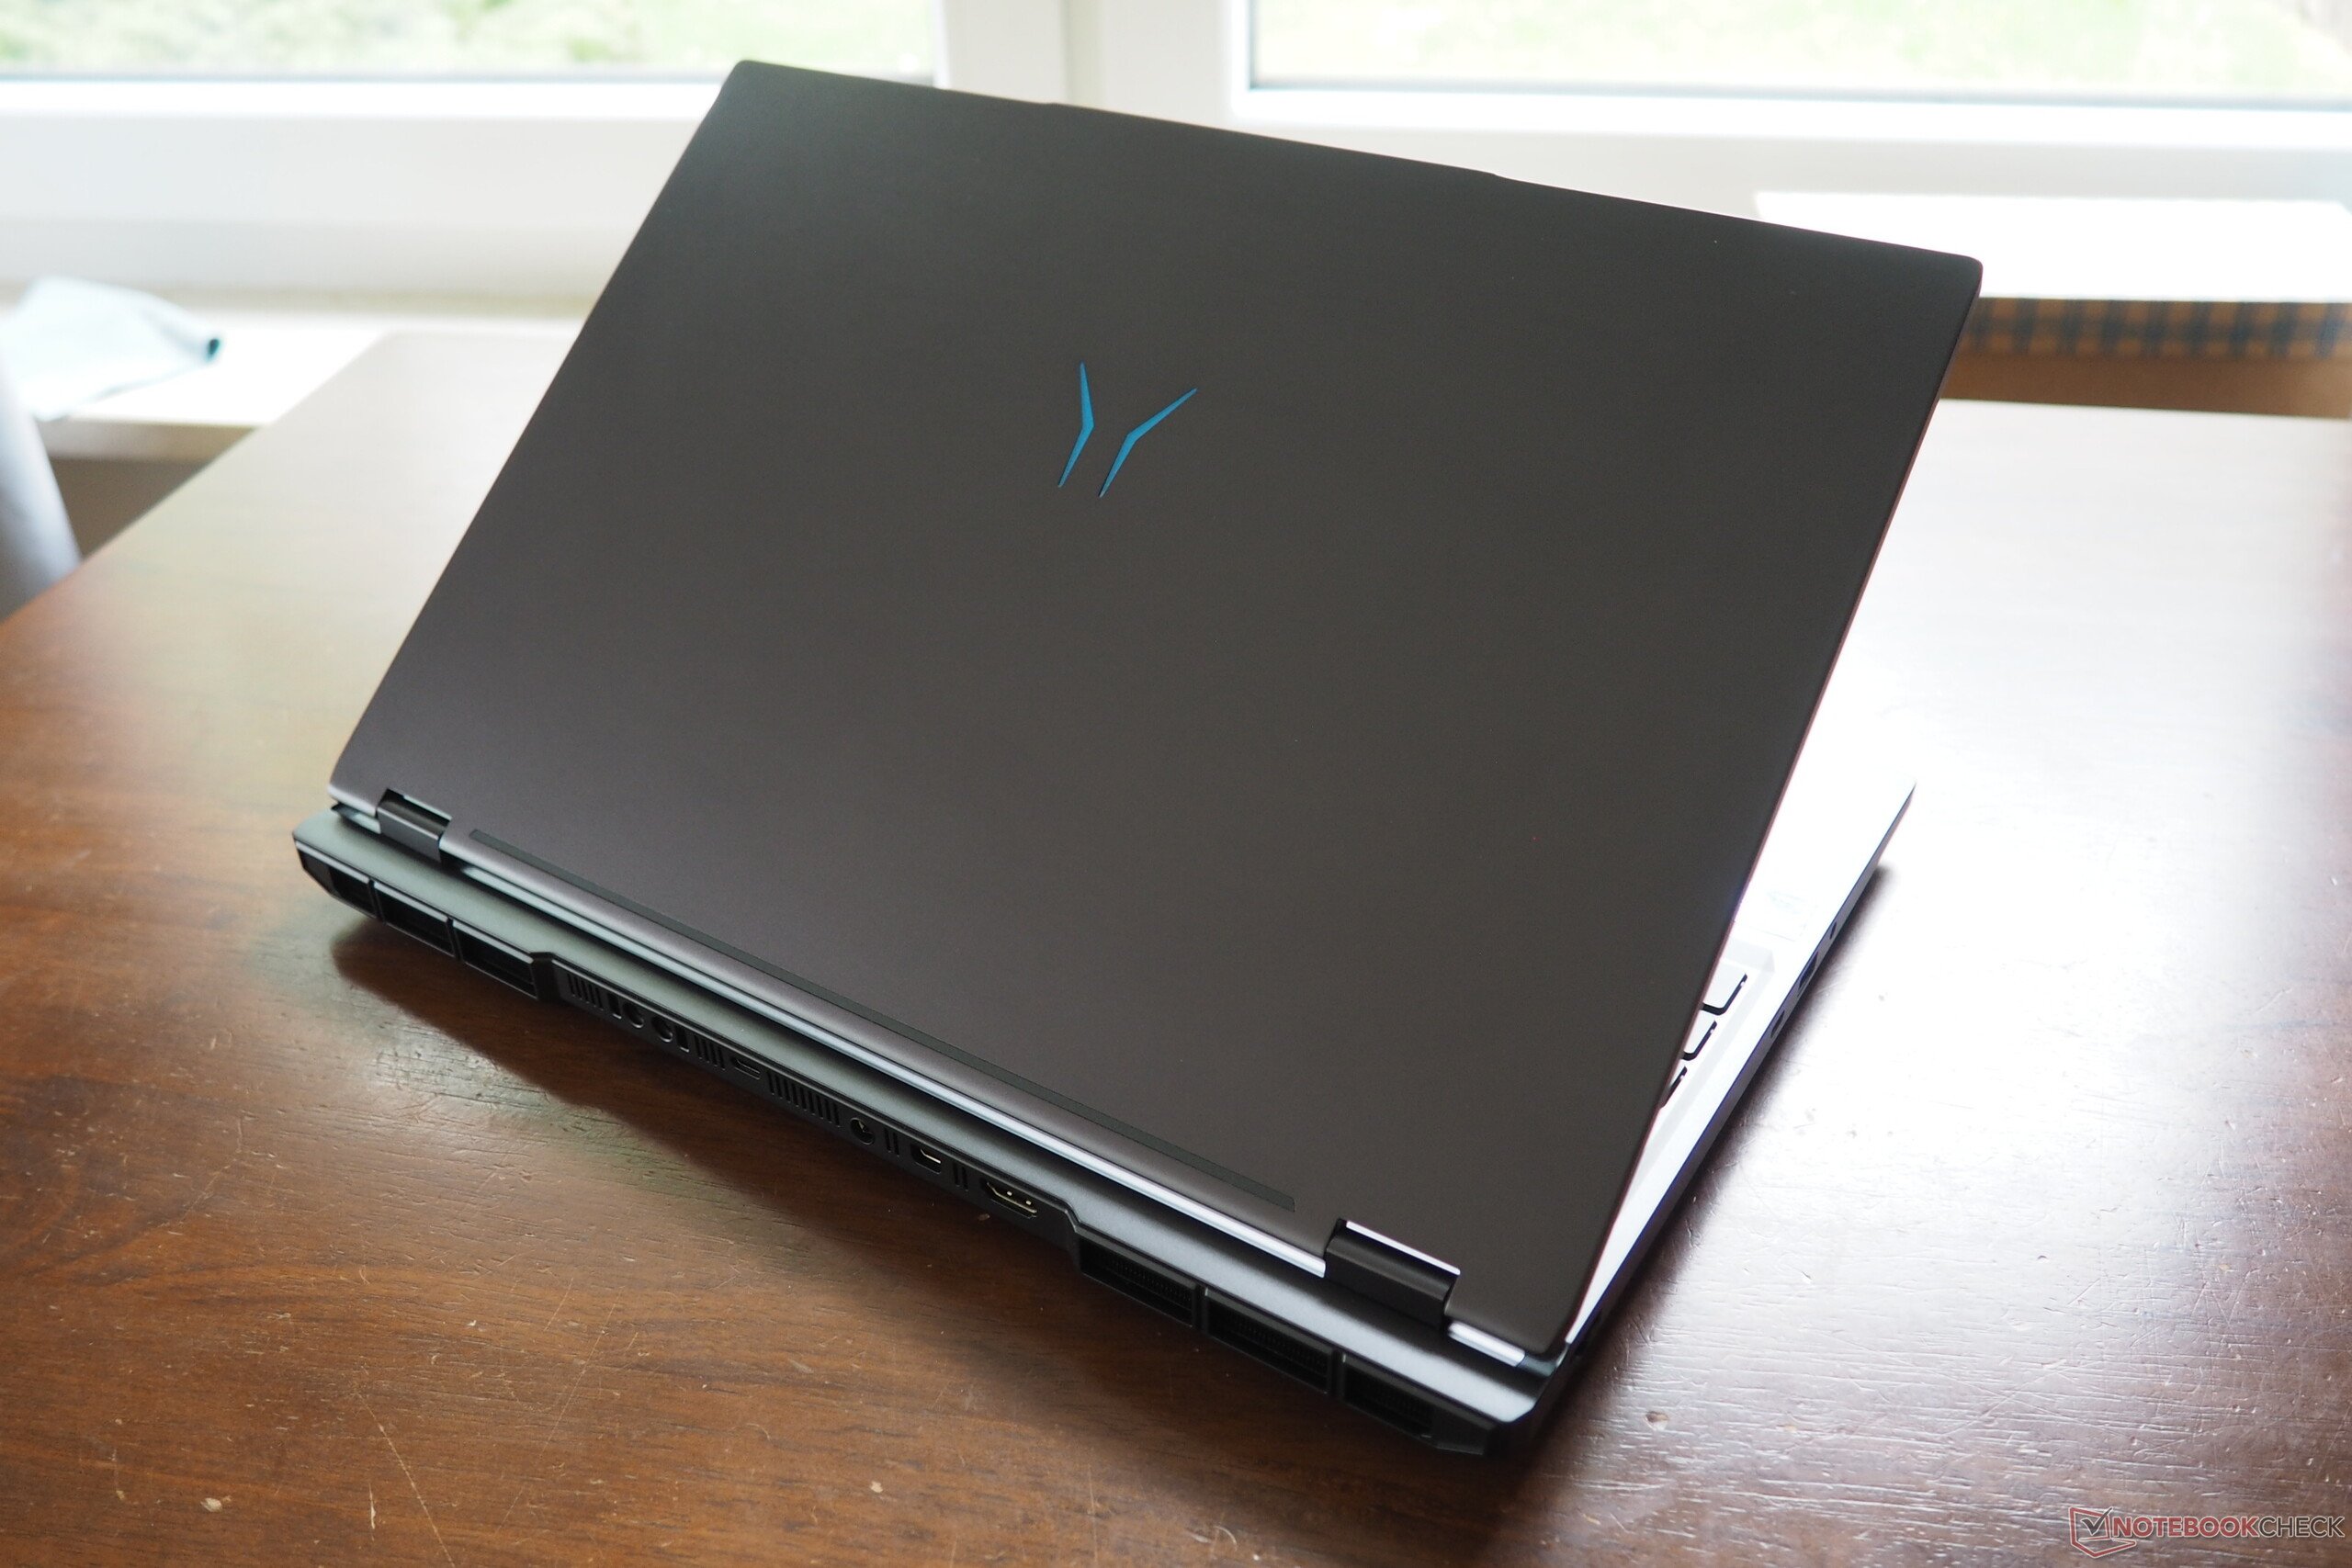
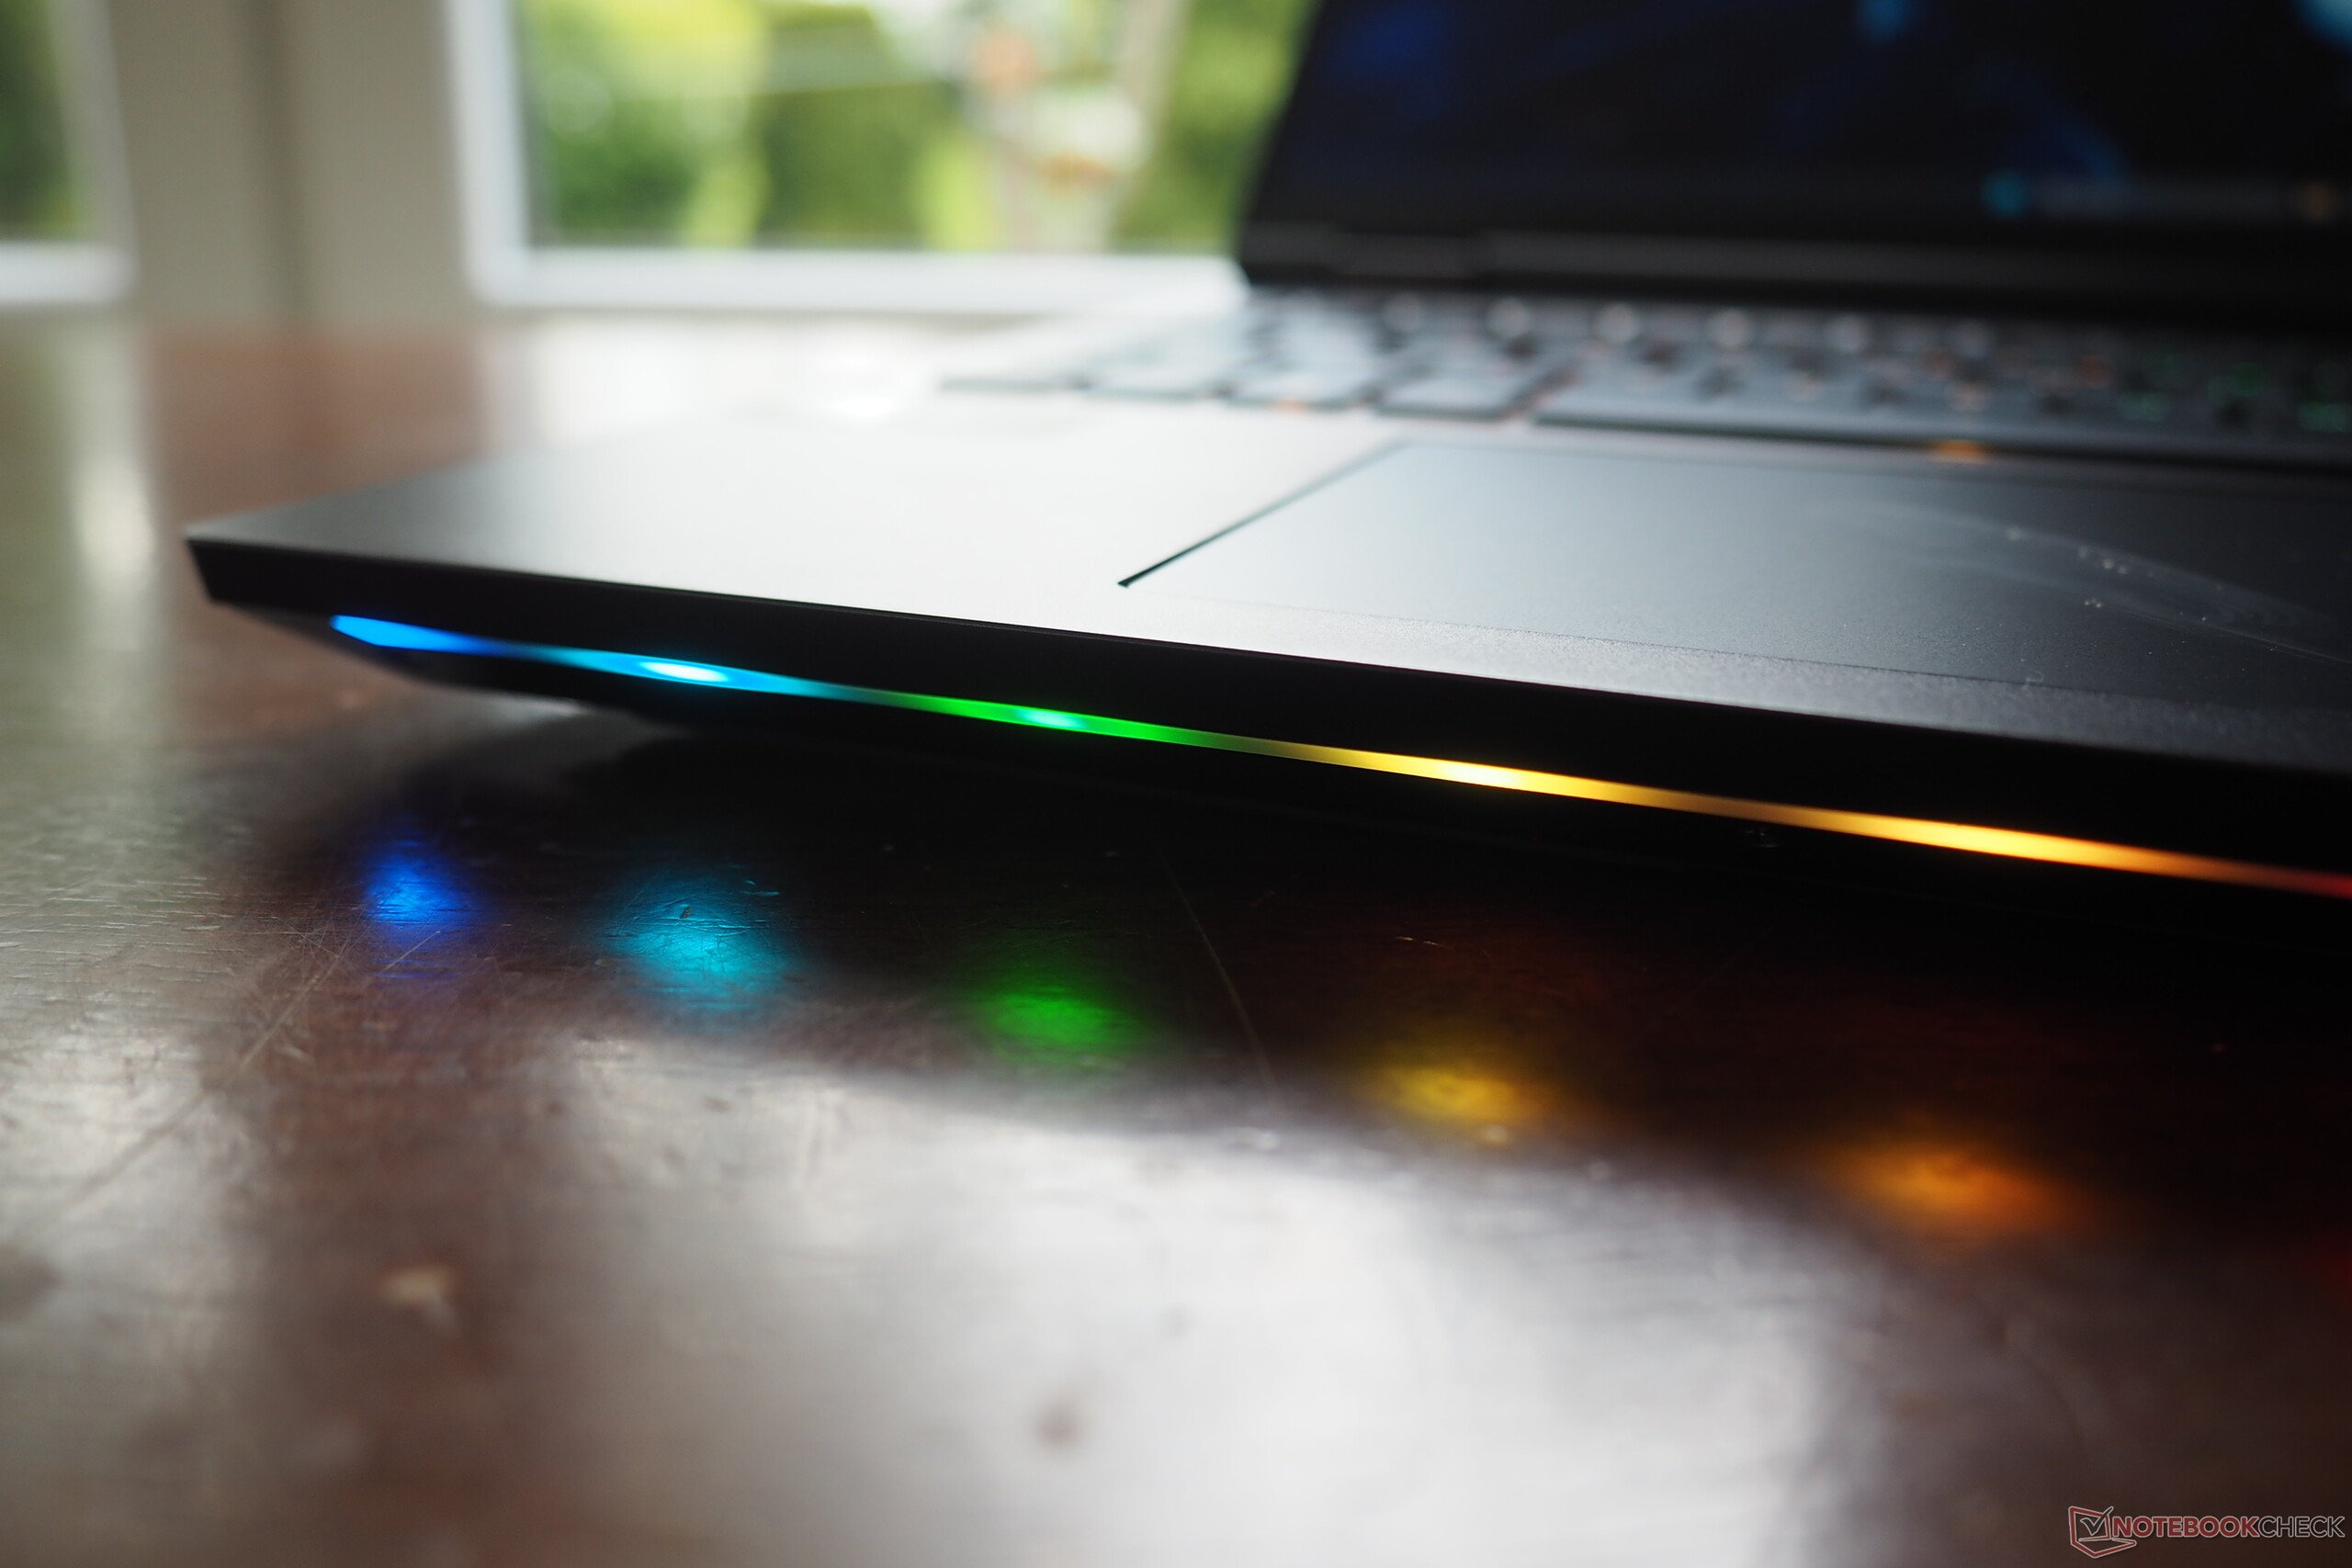
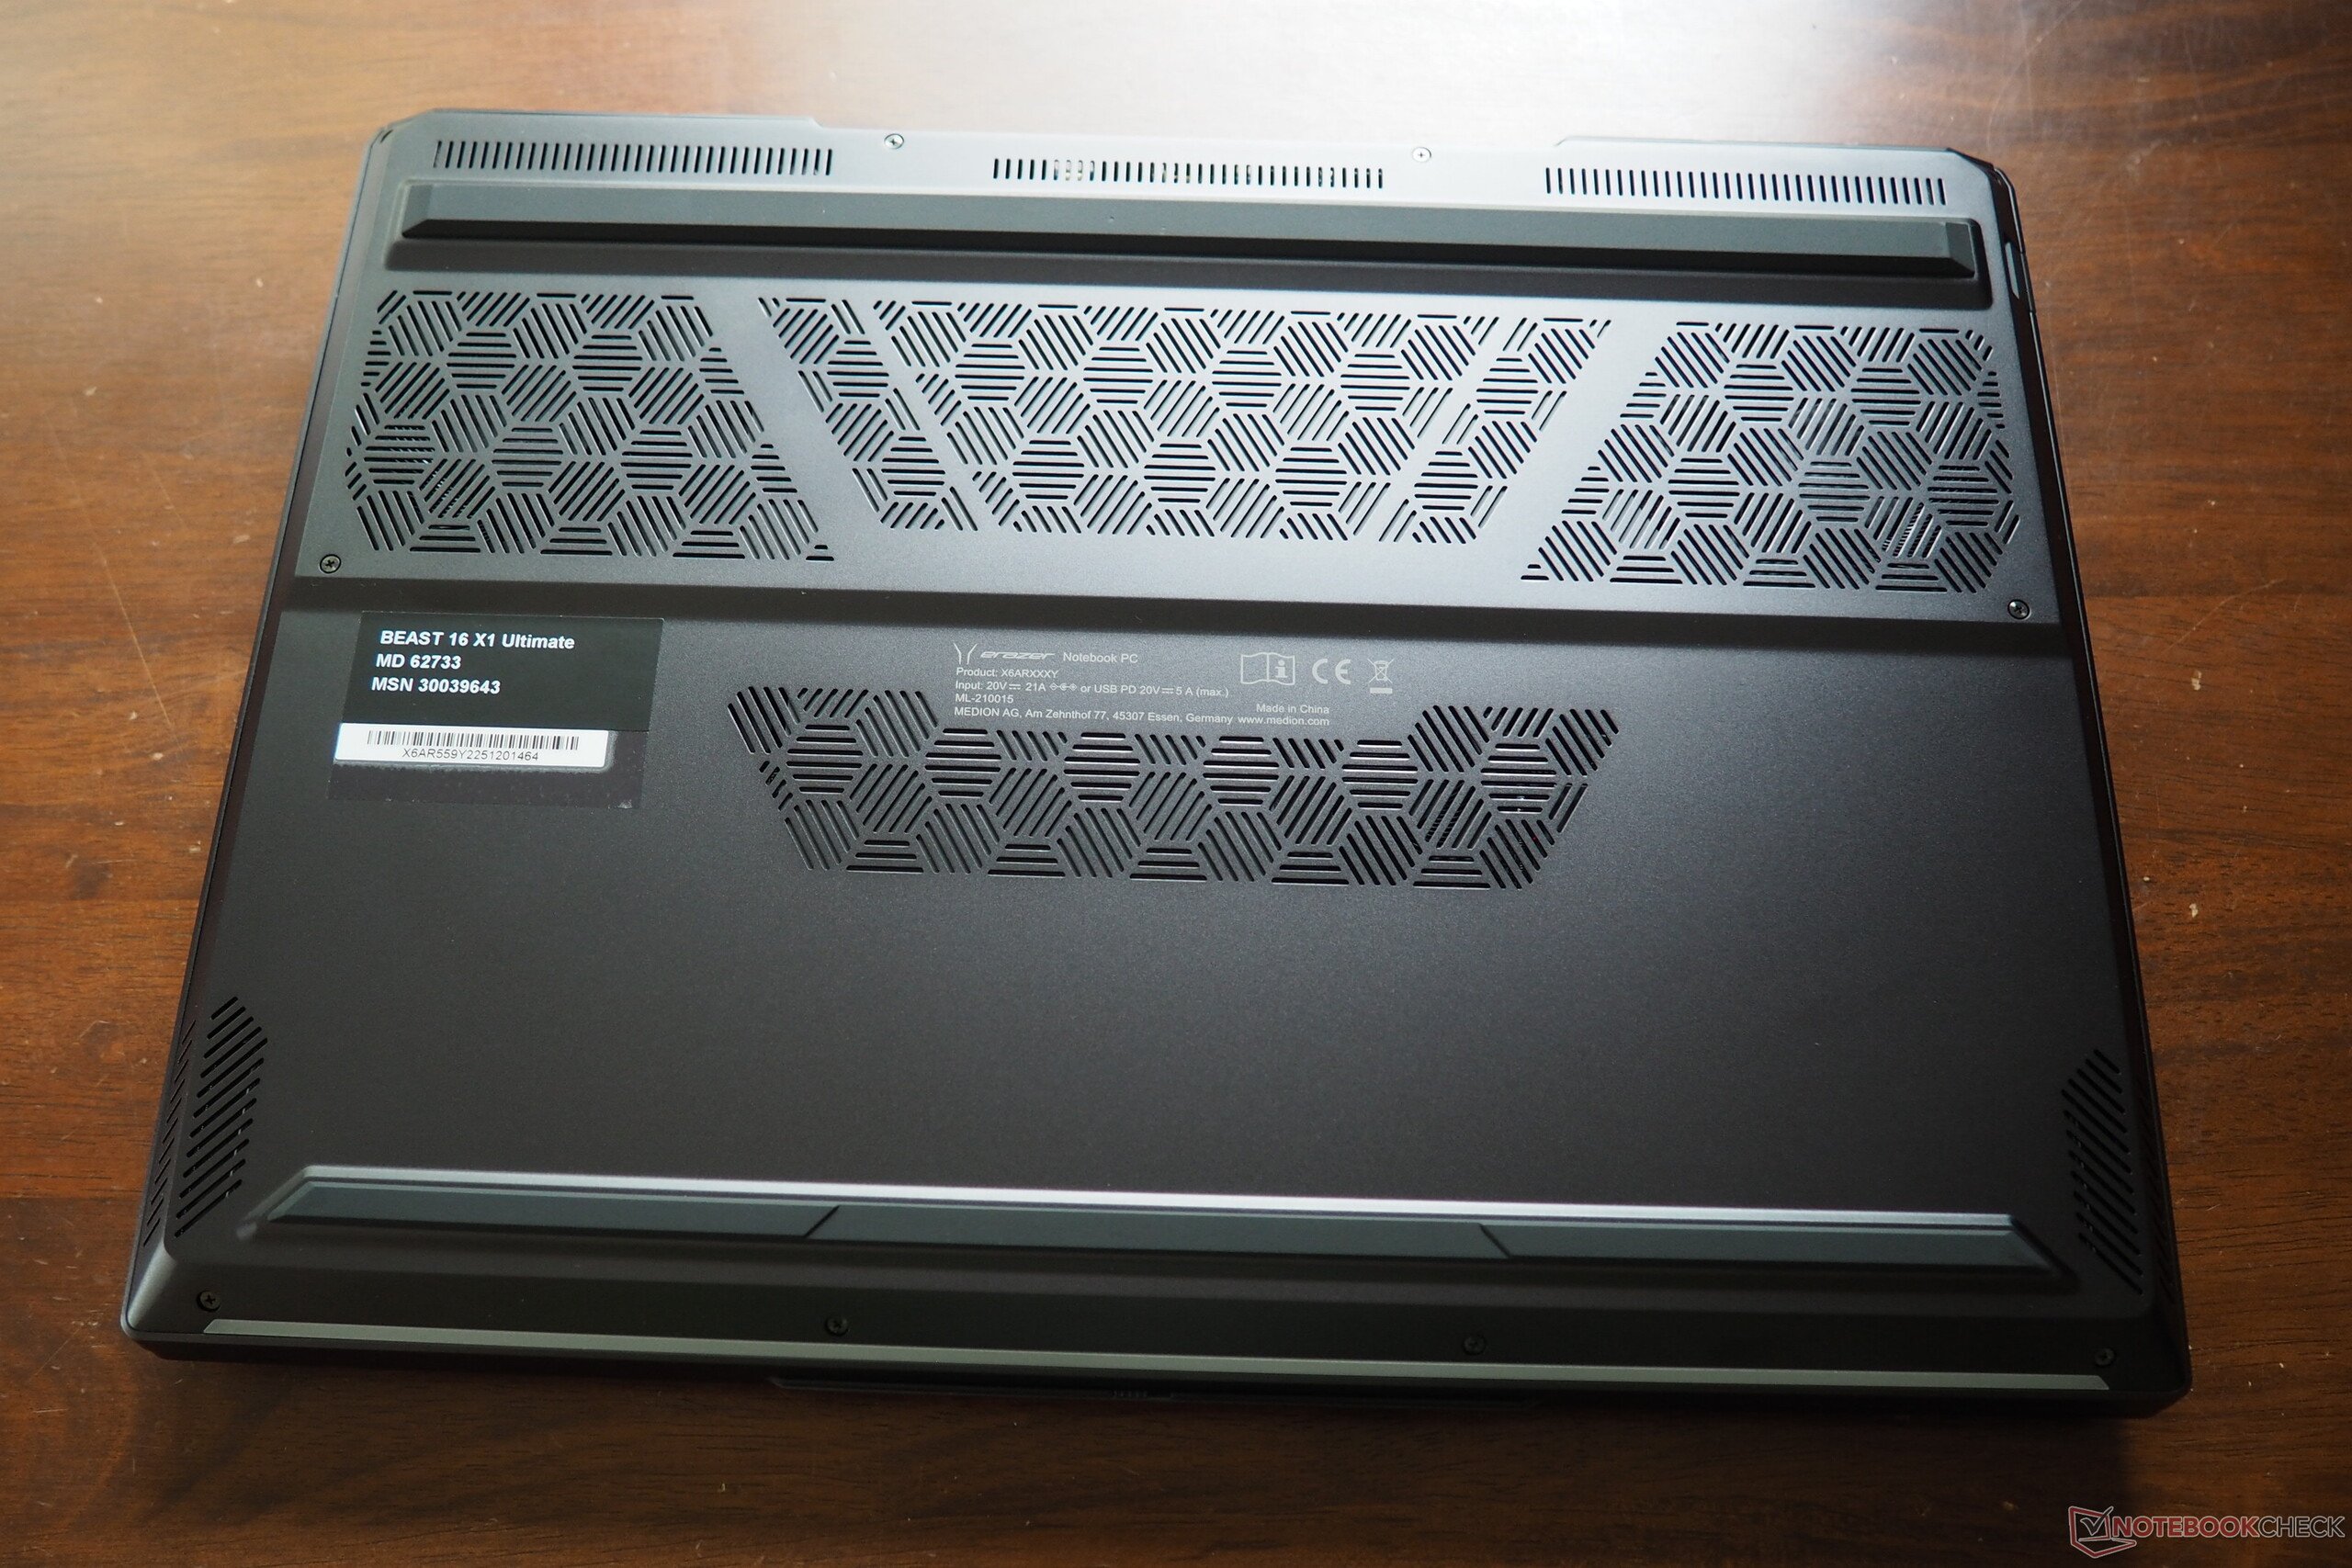
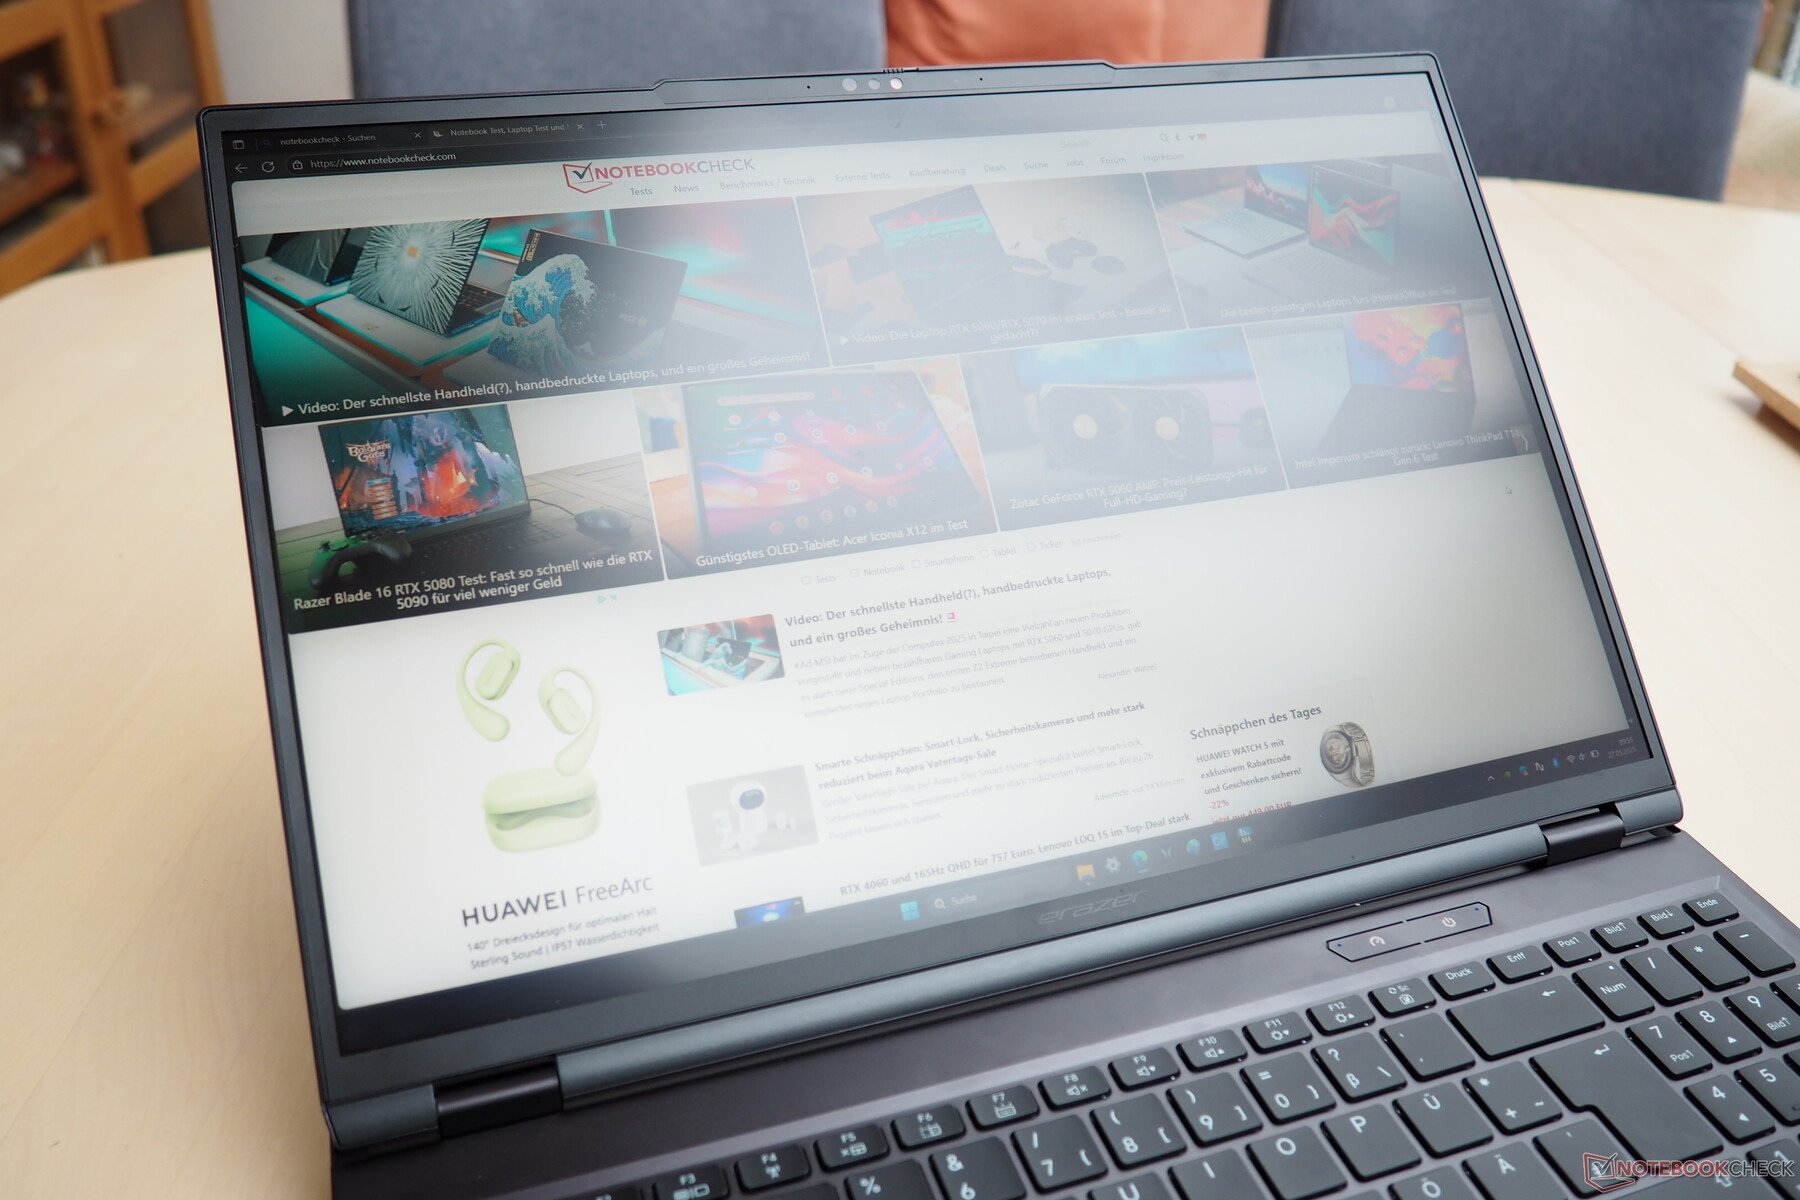
Comme mentionné au début, le boîtier laisse une très bonne impression. Medion a opté pour un châssis Tonfang, qui reste agréablement stable même sous une forte pression et qui est généralement très élégant. Le design, avec ses formes et ses bords, offre un beau mélange d'élégance et d'espièglerie, et les fans d'éclairage peuvent se réjouir de la présence d'une élégante bande LED à l'avant (voir les photos). Avec 2,8 kg, le poids n'est ni faible ni particulièrement élevé, comparable à celui de la Strix Scar 16 et de l'Omen Max 16. La hauteur de 3 cm n'est pas excessive. L'angle d'ouverture généreux de 180° mérite un respect particulier, ce qui n'est pas le cas de tous les concurrents.

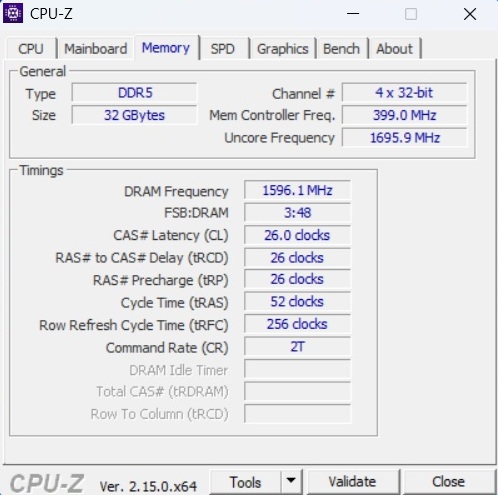
Equipement
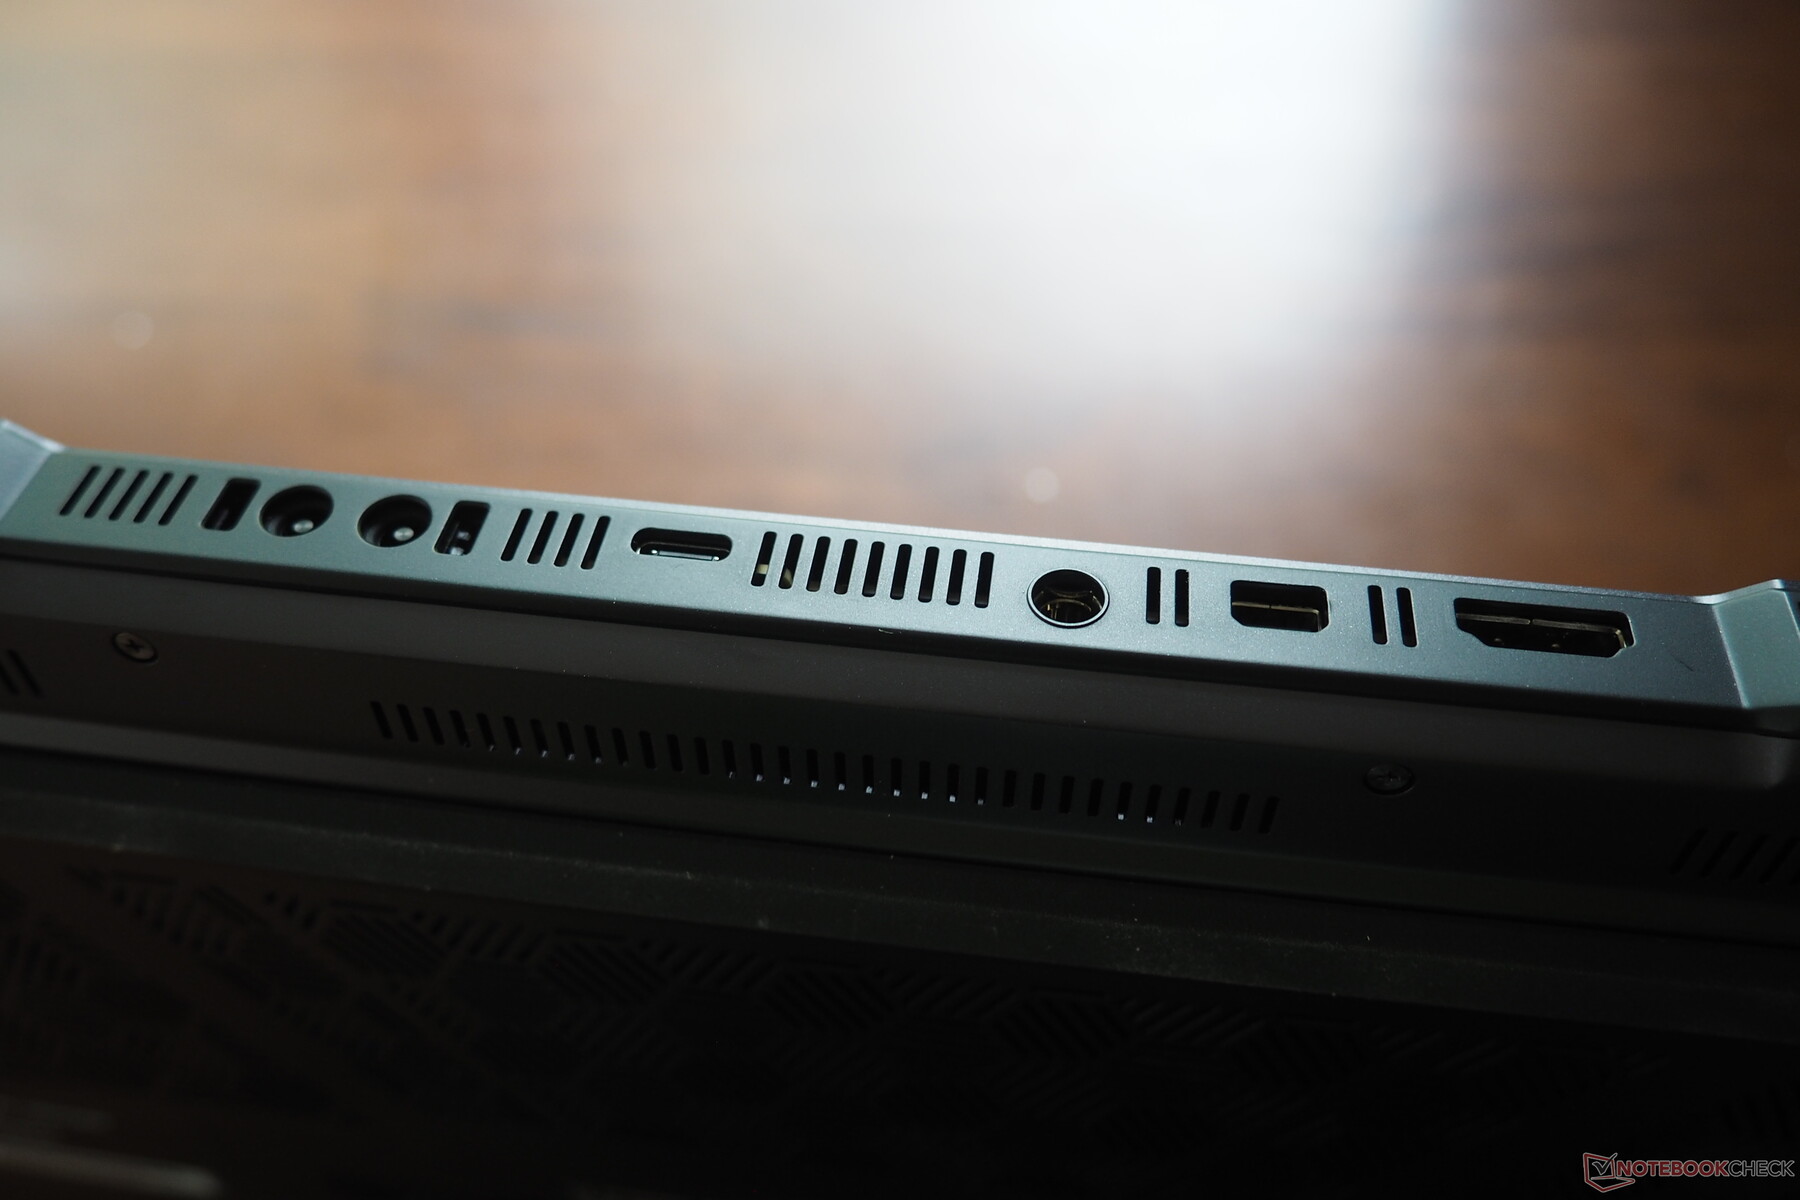
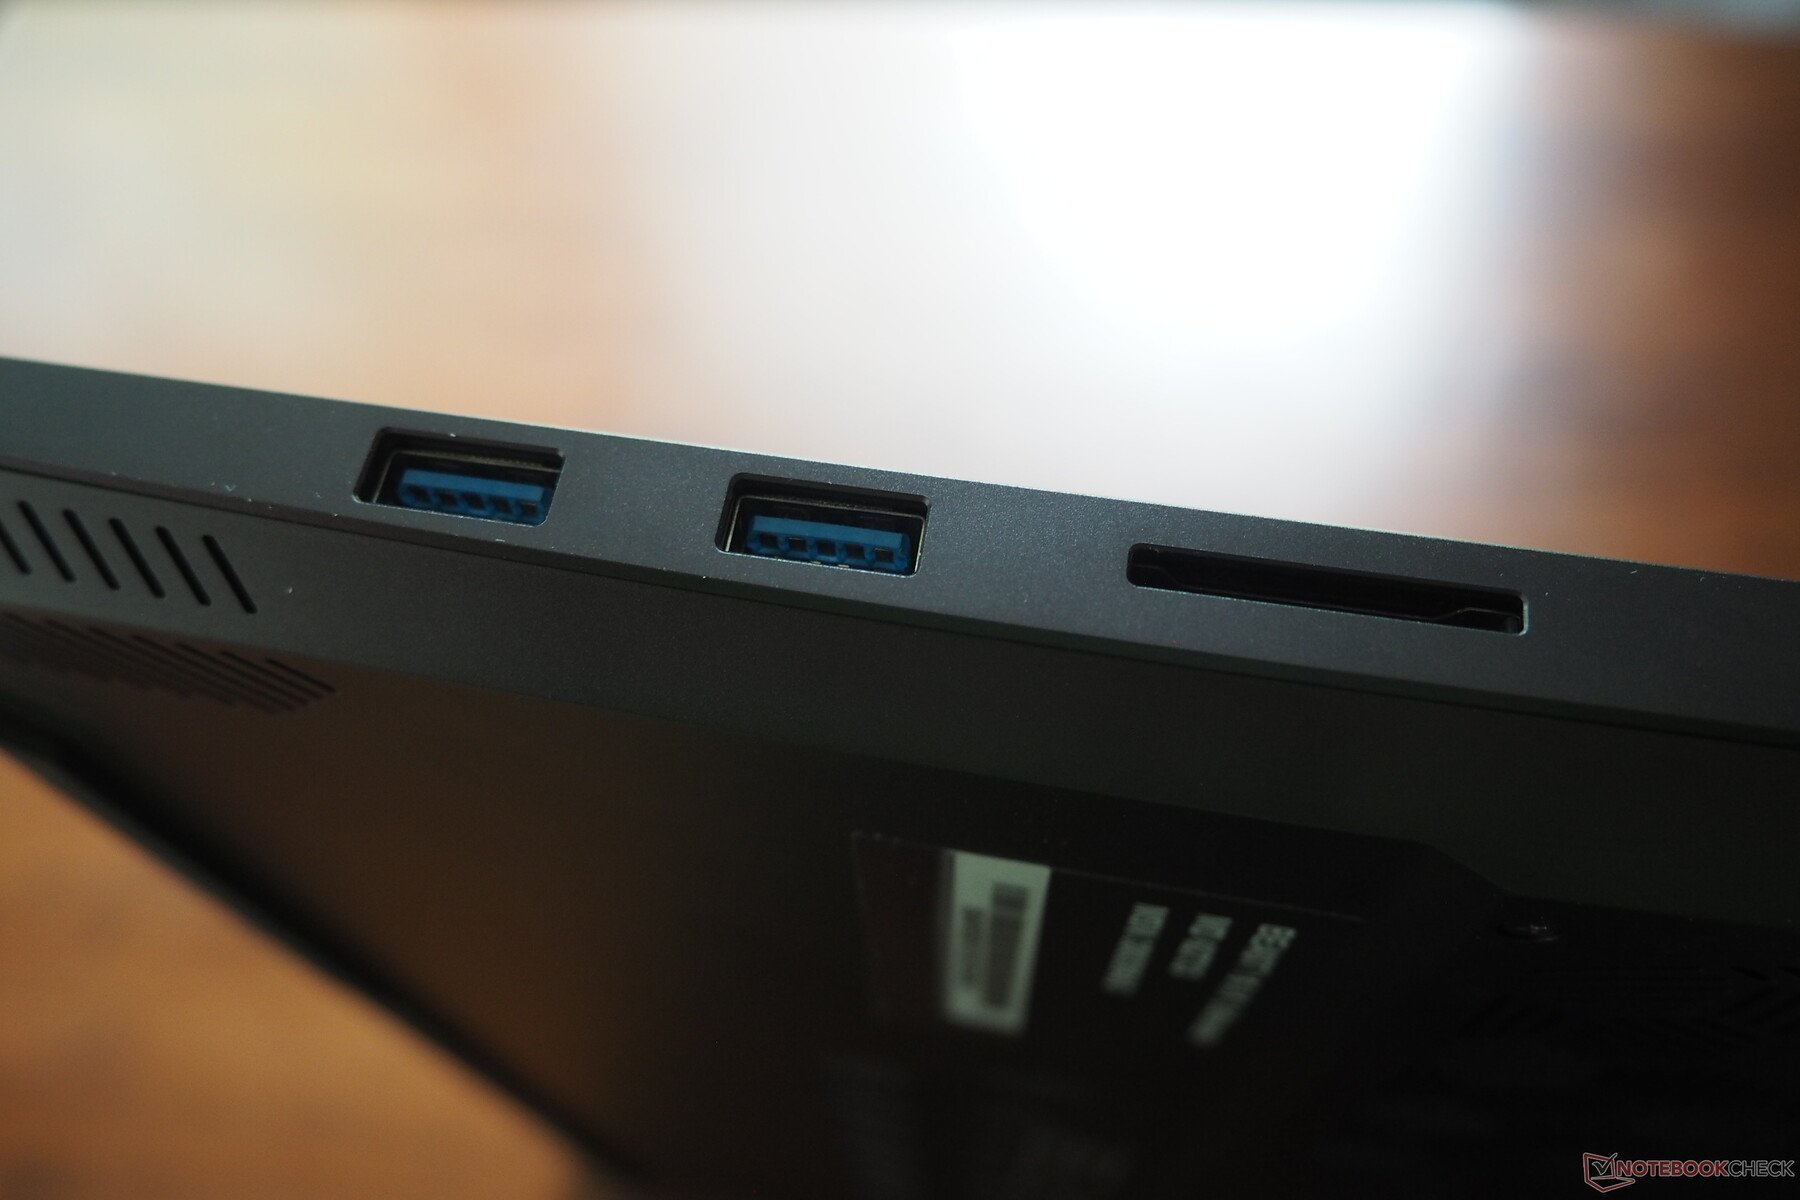
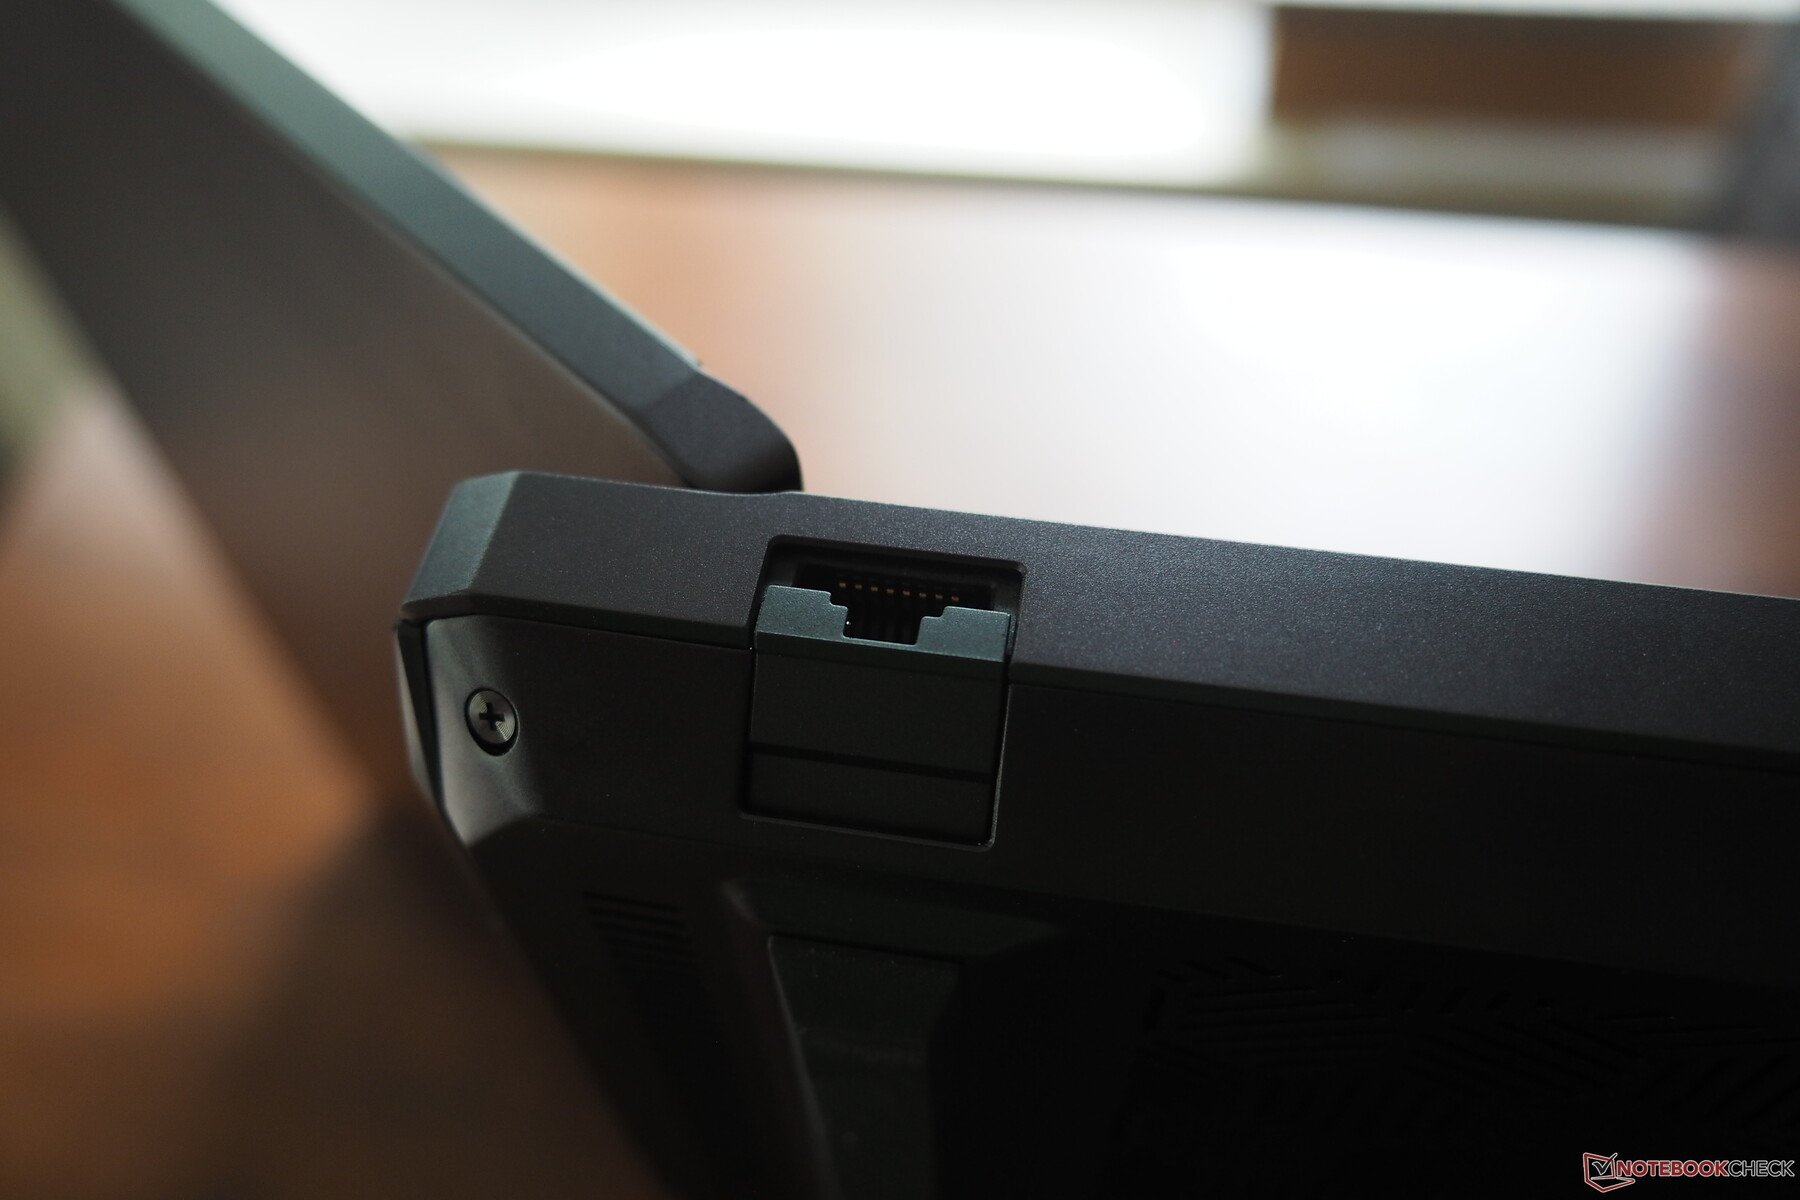
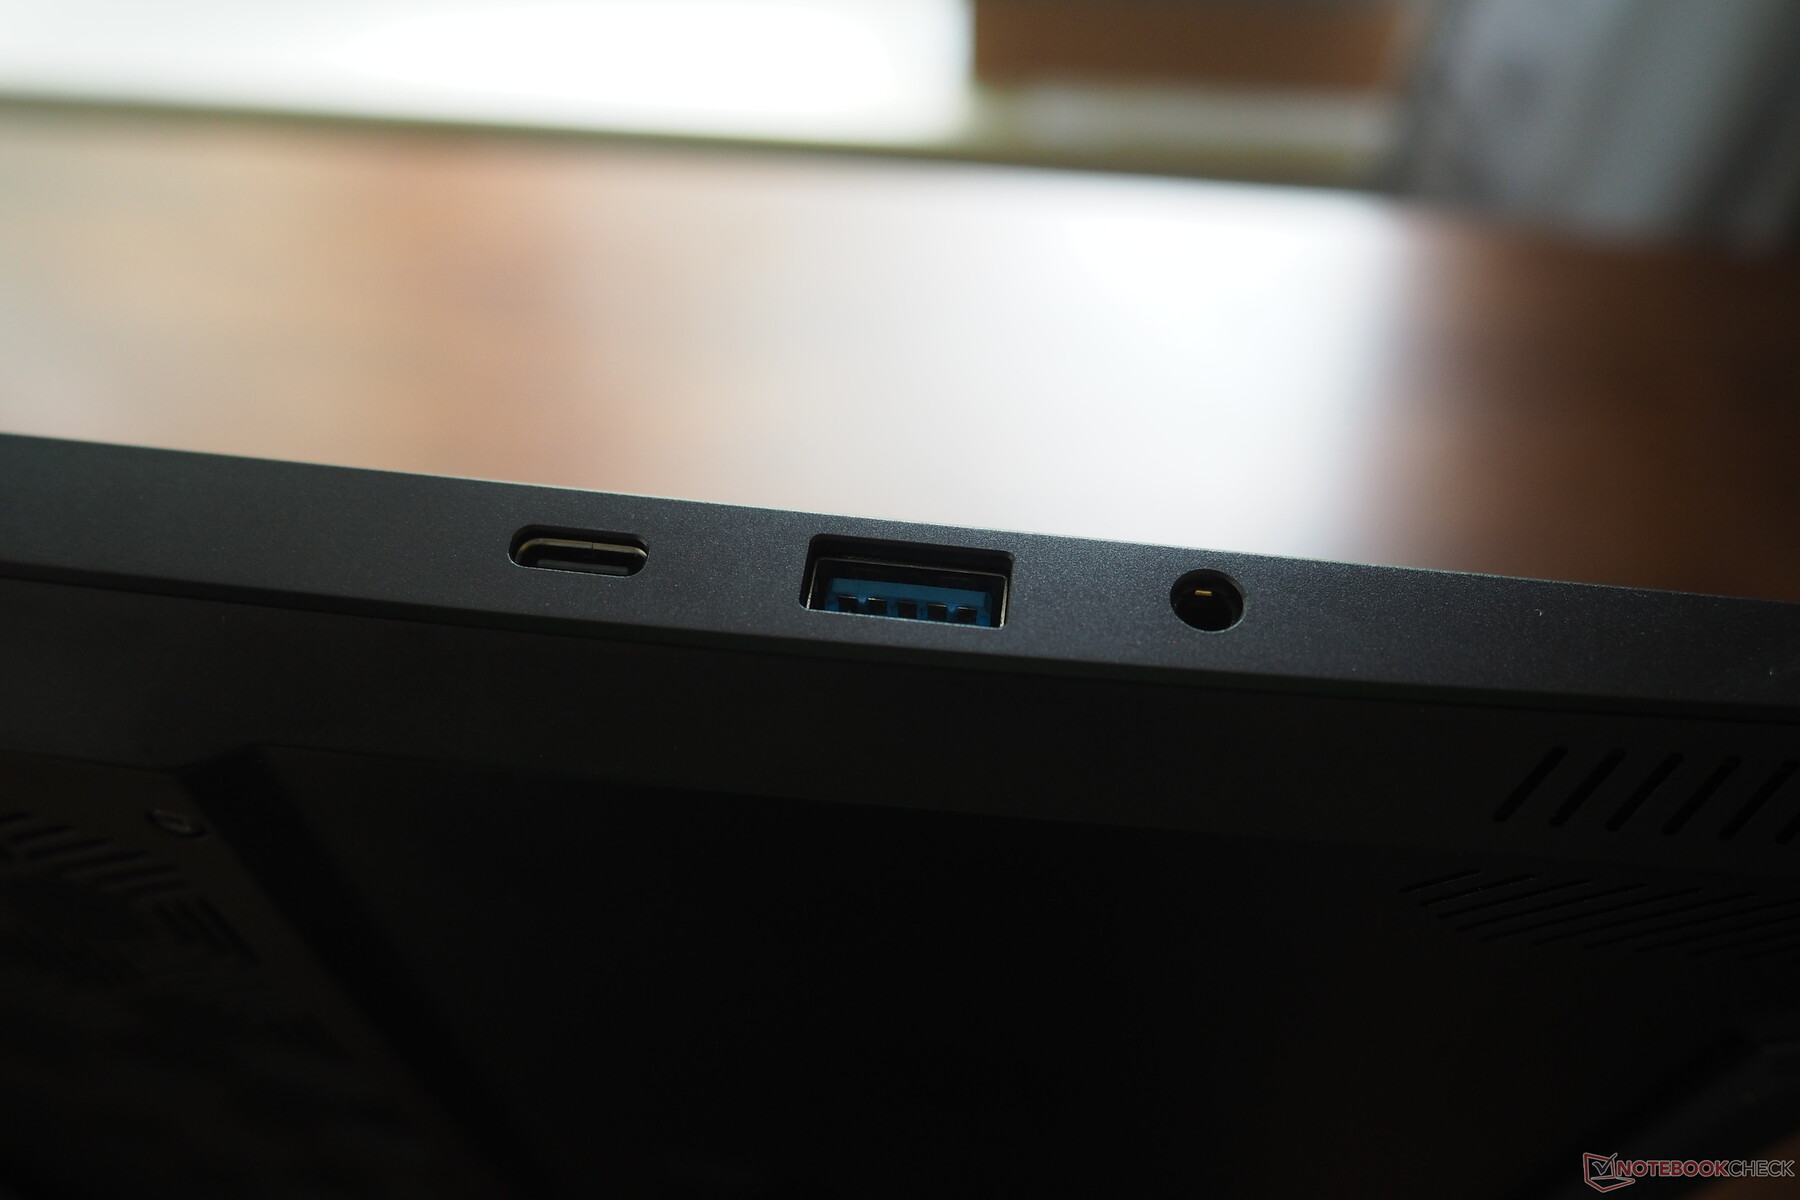
Le Beast 16 X1 peut se targuer de disposer de toutes sortes d'interfaces modernes. 2.le LAN 5 Gbit est tout aussi actuel que le HDMI 2.1, le (mini) DisplayPort 2.1a et Thunderbolt 4, ainsi qu'un port USB-C 3.2 Gen2, deux ports USB-A 3.2 Gen1, une prise audio et un lecteur de cartes très rapide. L'entrée pour le système de refroidissement à eau externe est également située à l'arrière. Il n'y a rien à redire non plus sur les performances du module sans fil ; bien que la puce AX211 d'Intel ne prenne pas en charge le Wi-Fi 7, elle atteint tout de même des vitesses élevées, voire très élevées.
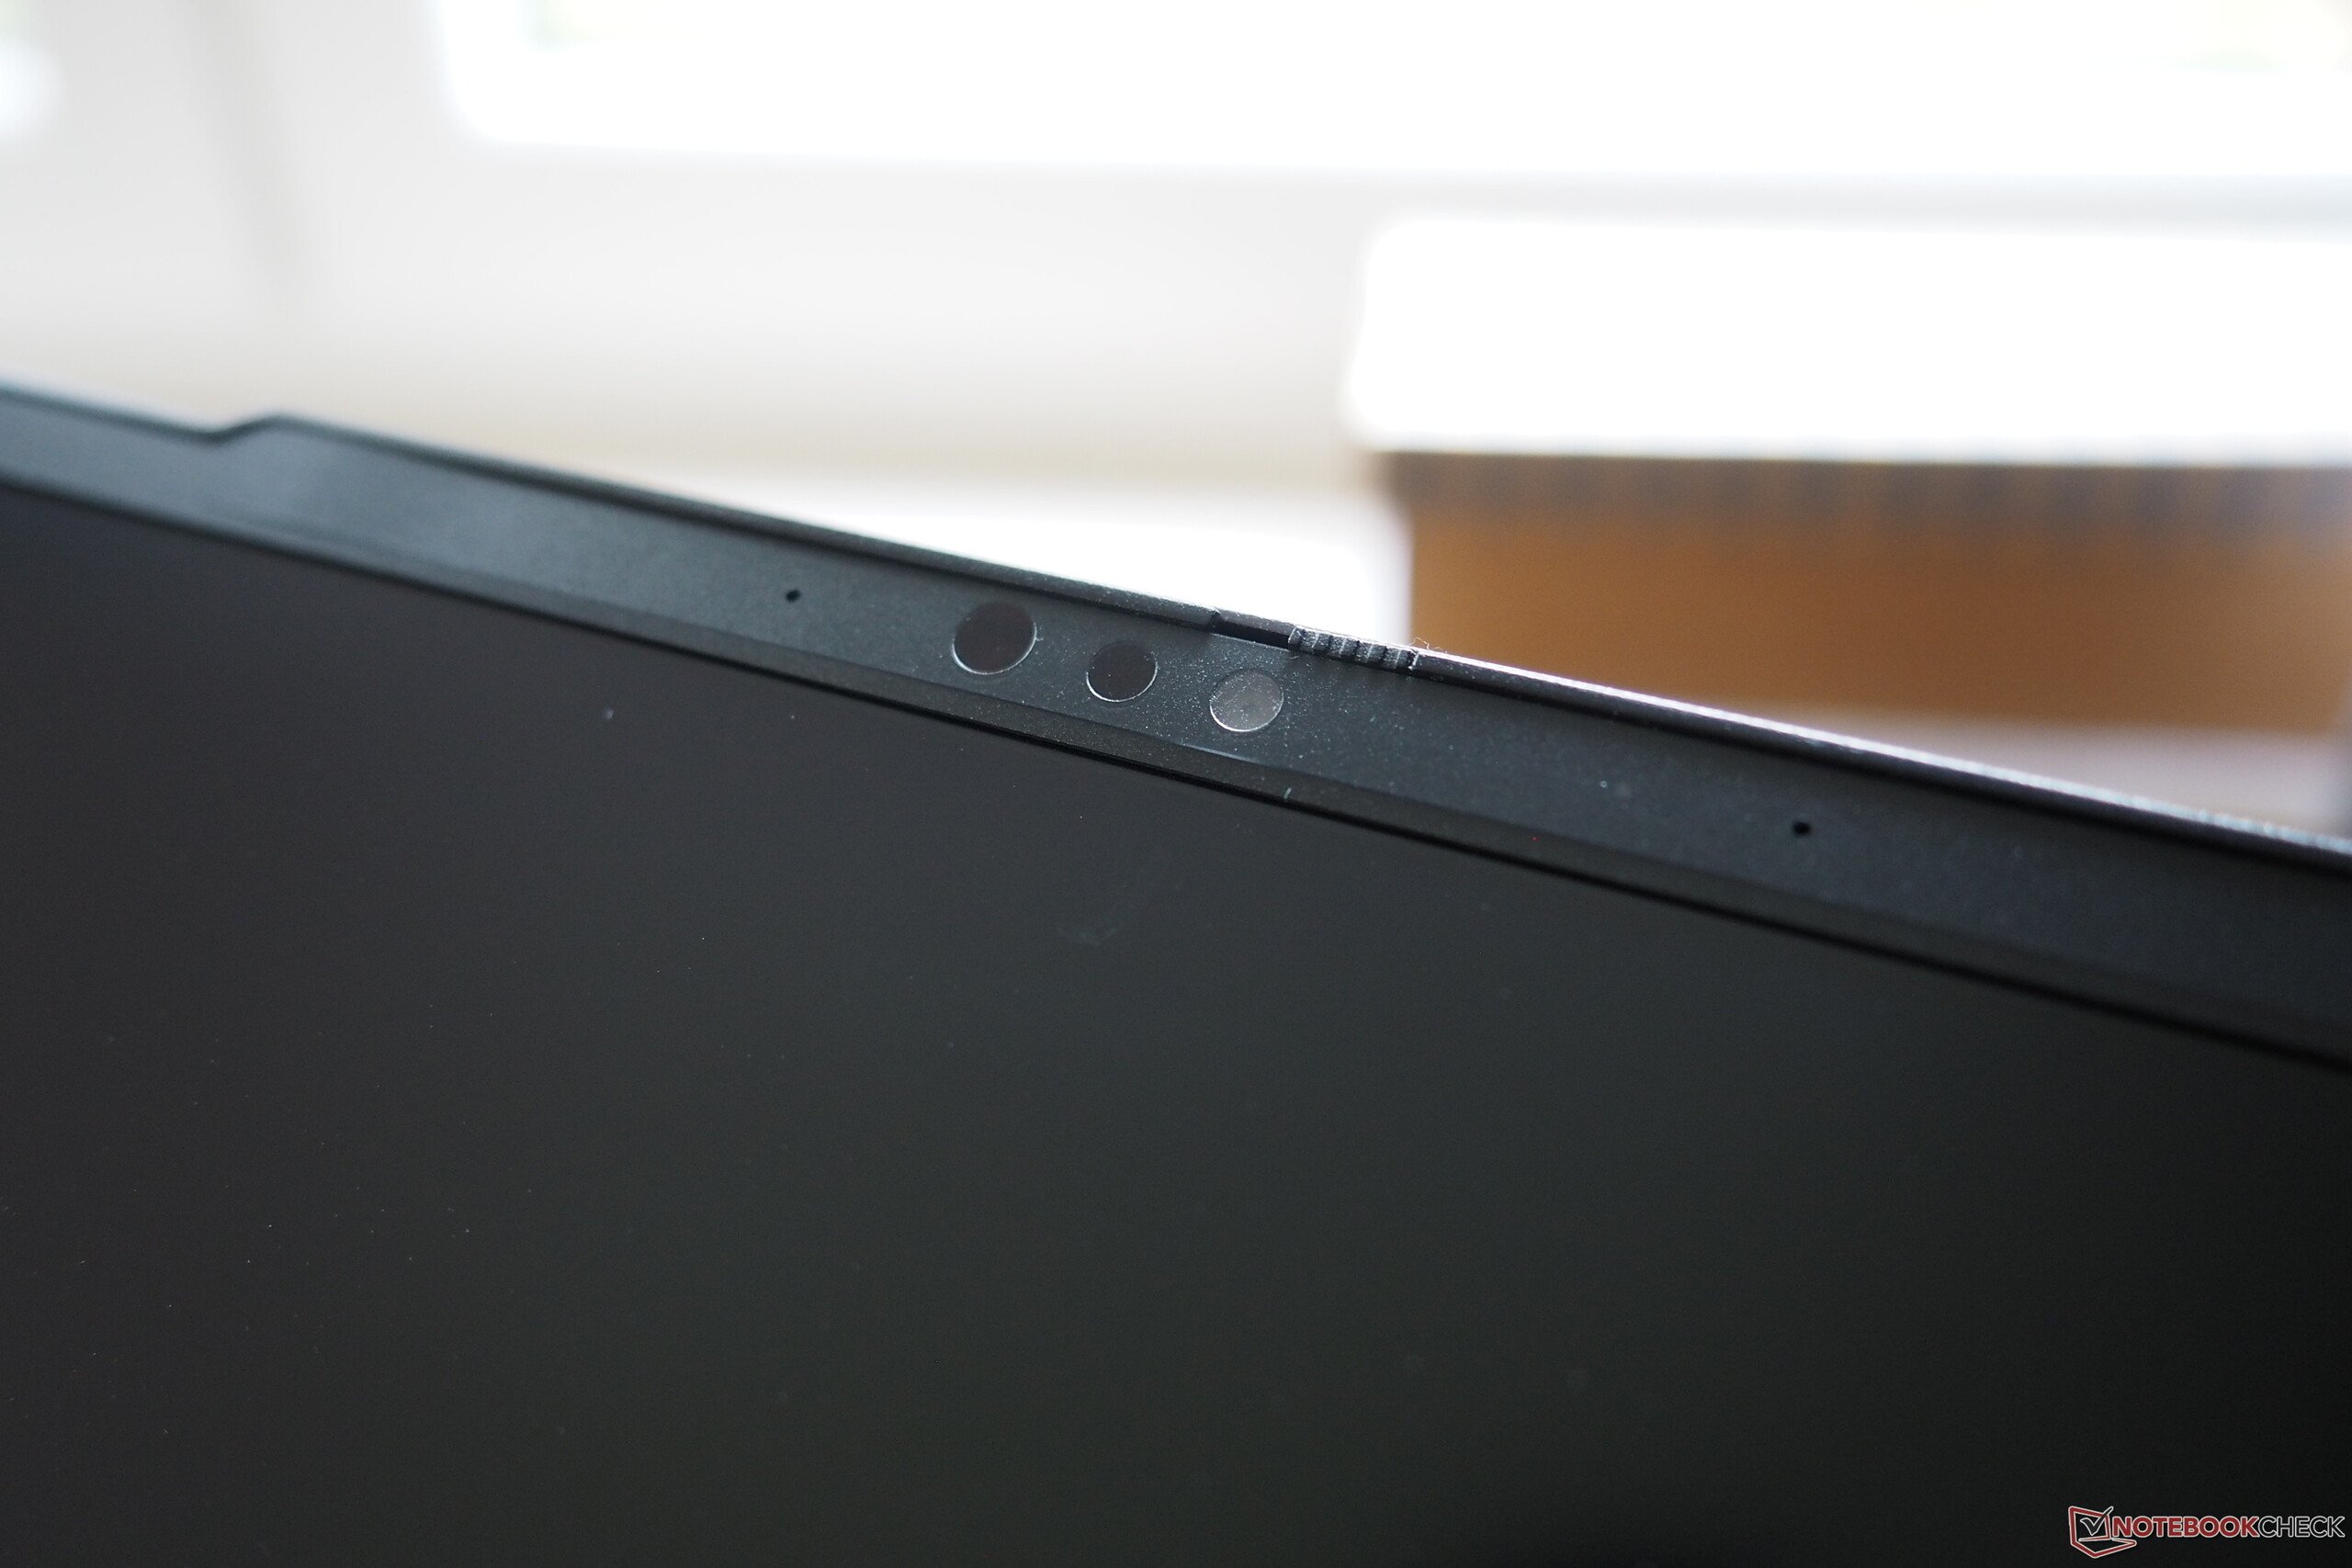
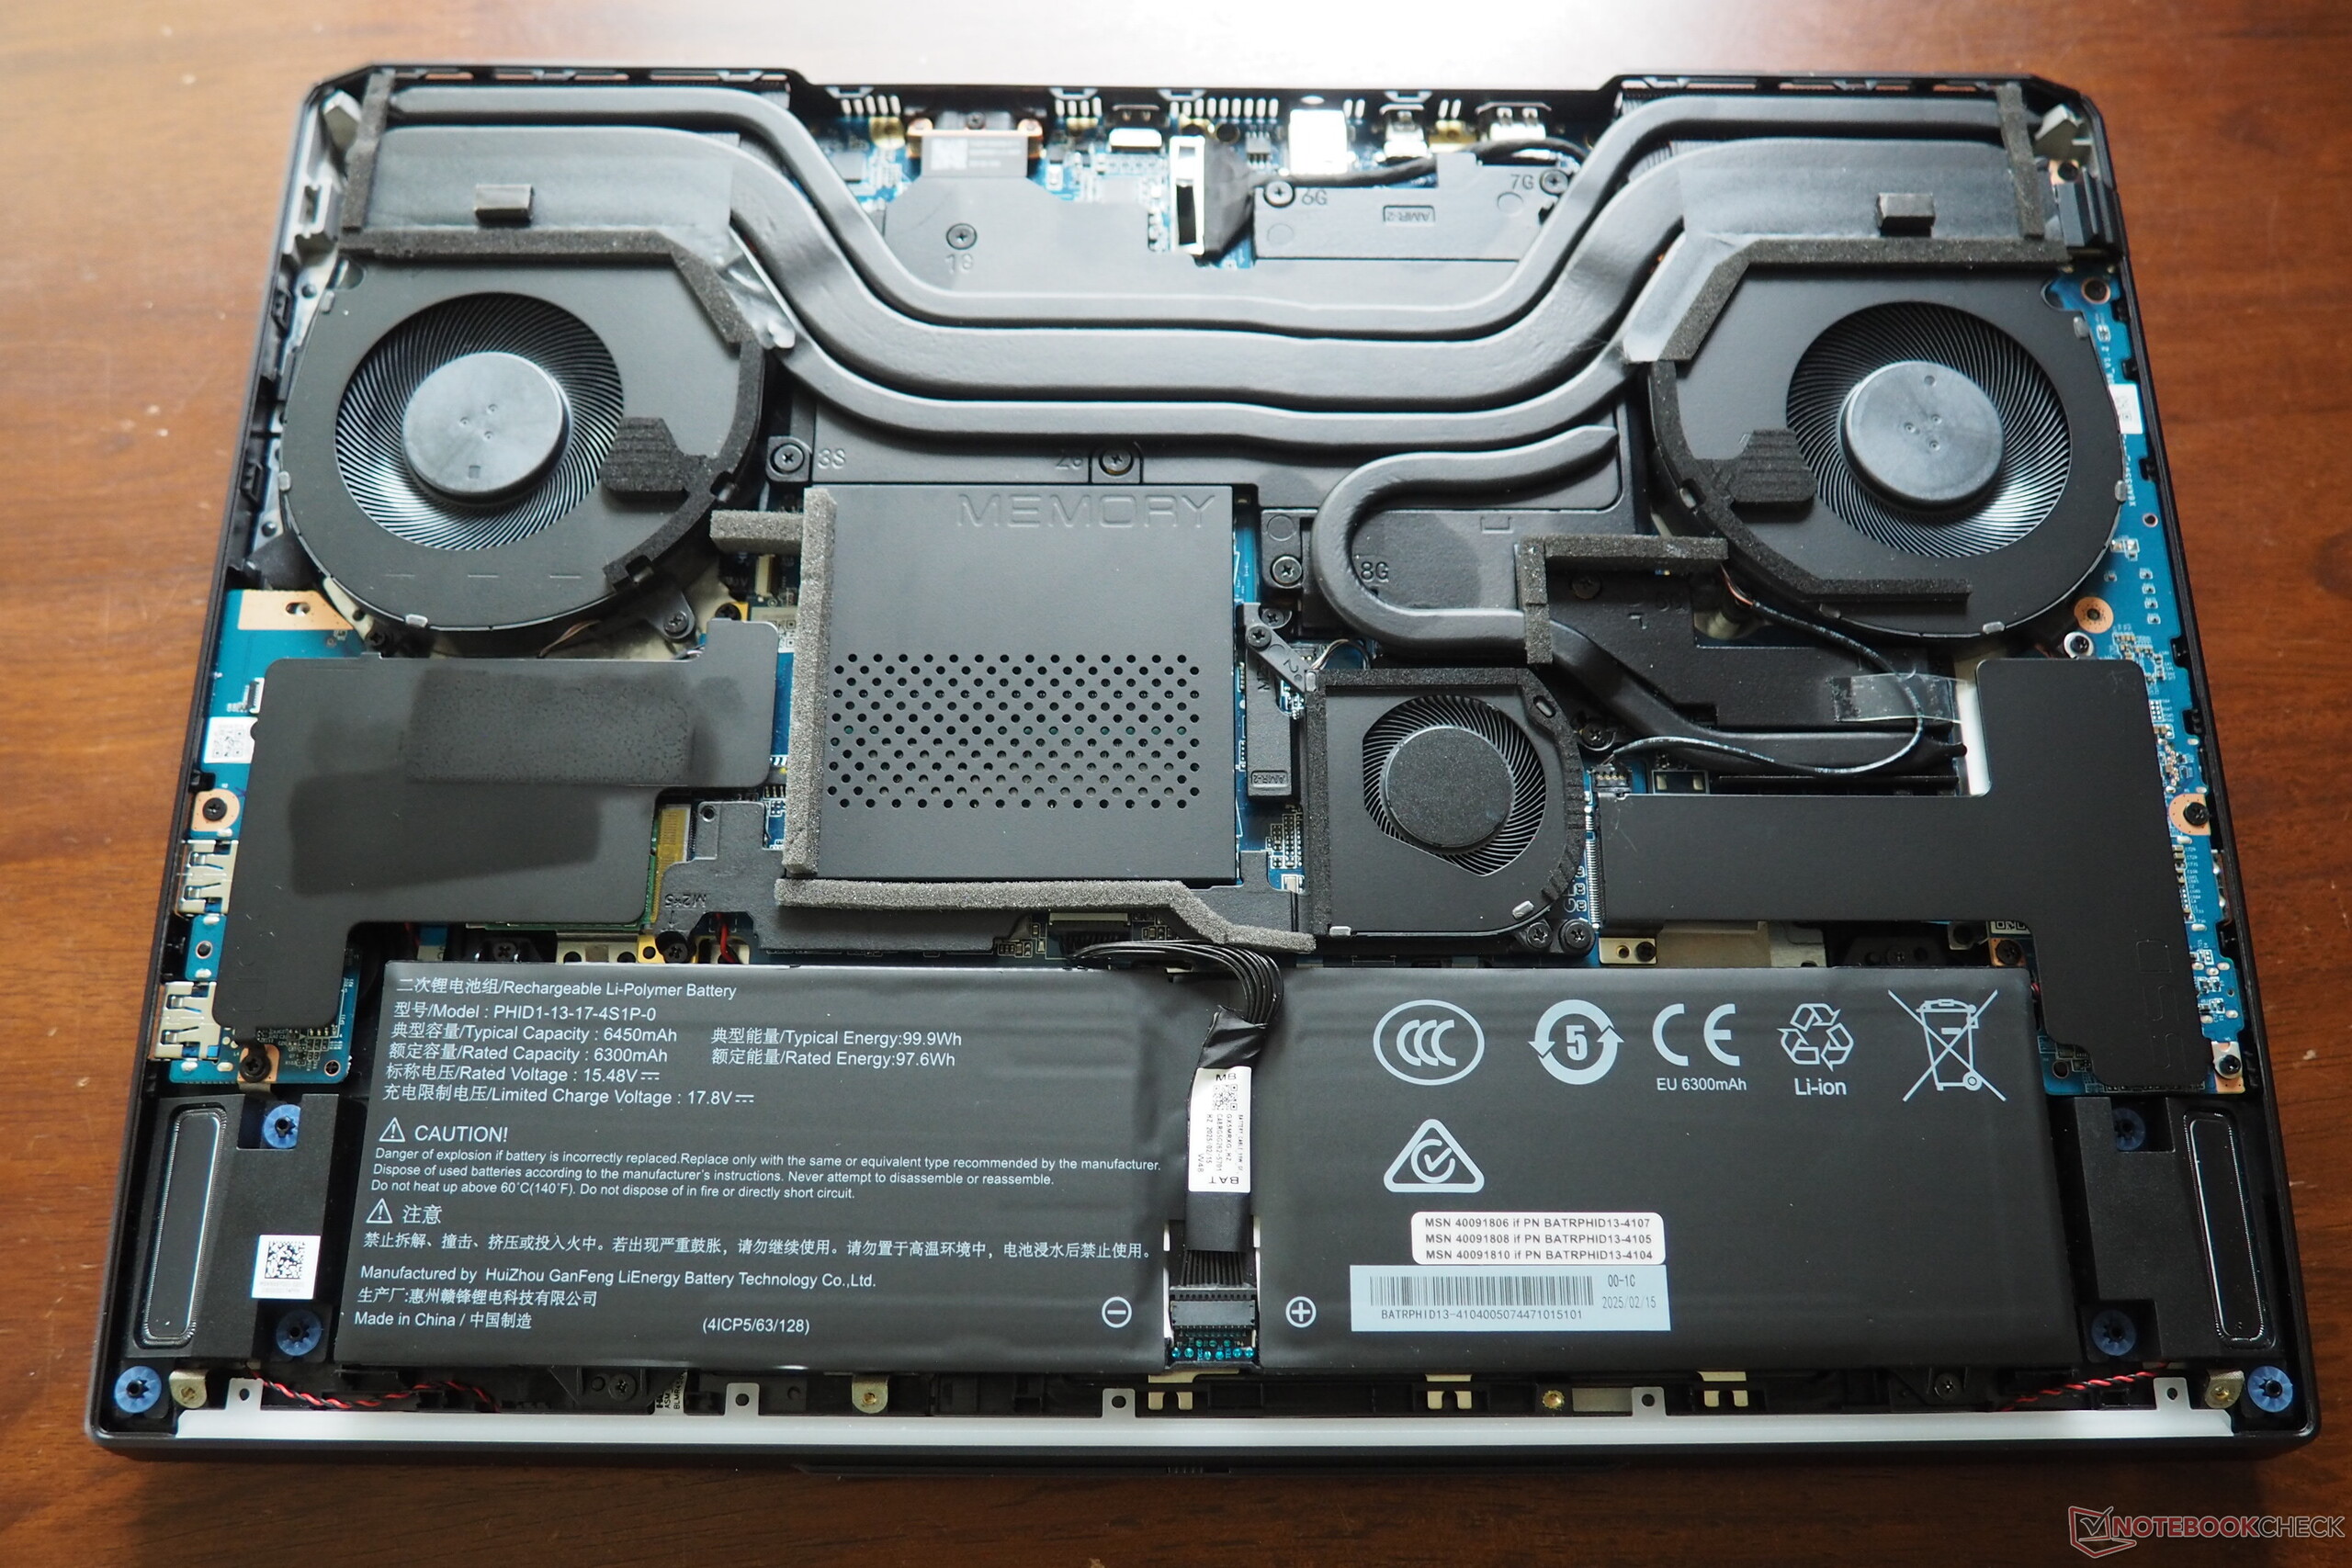
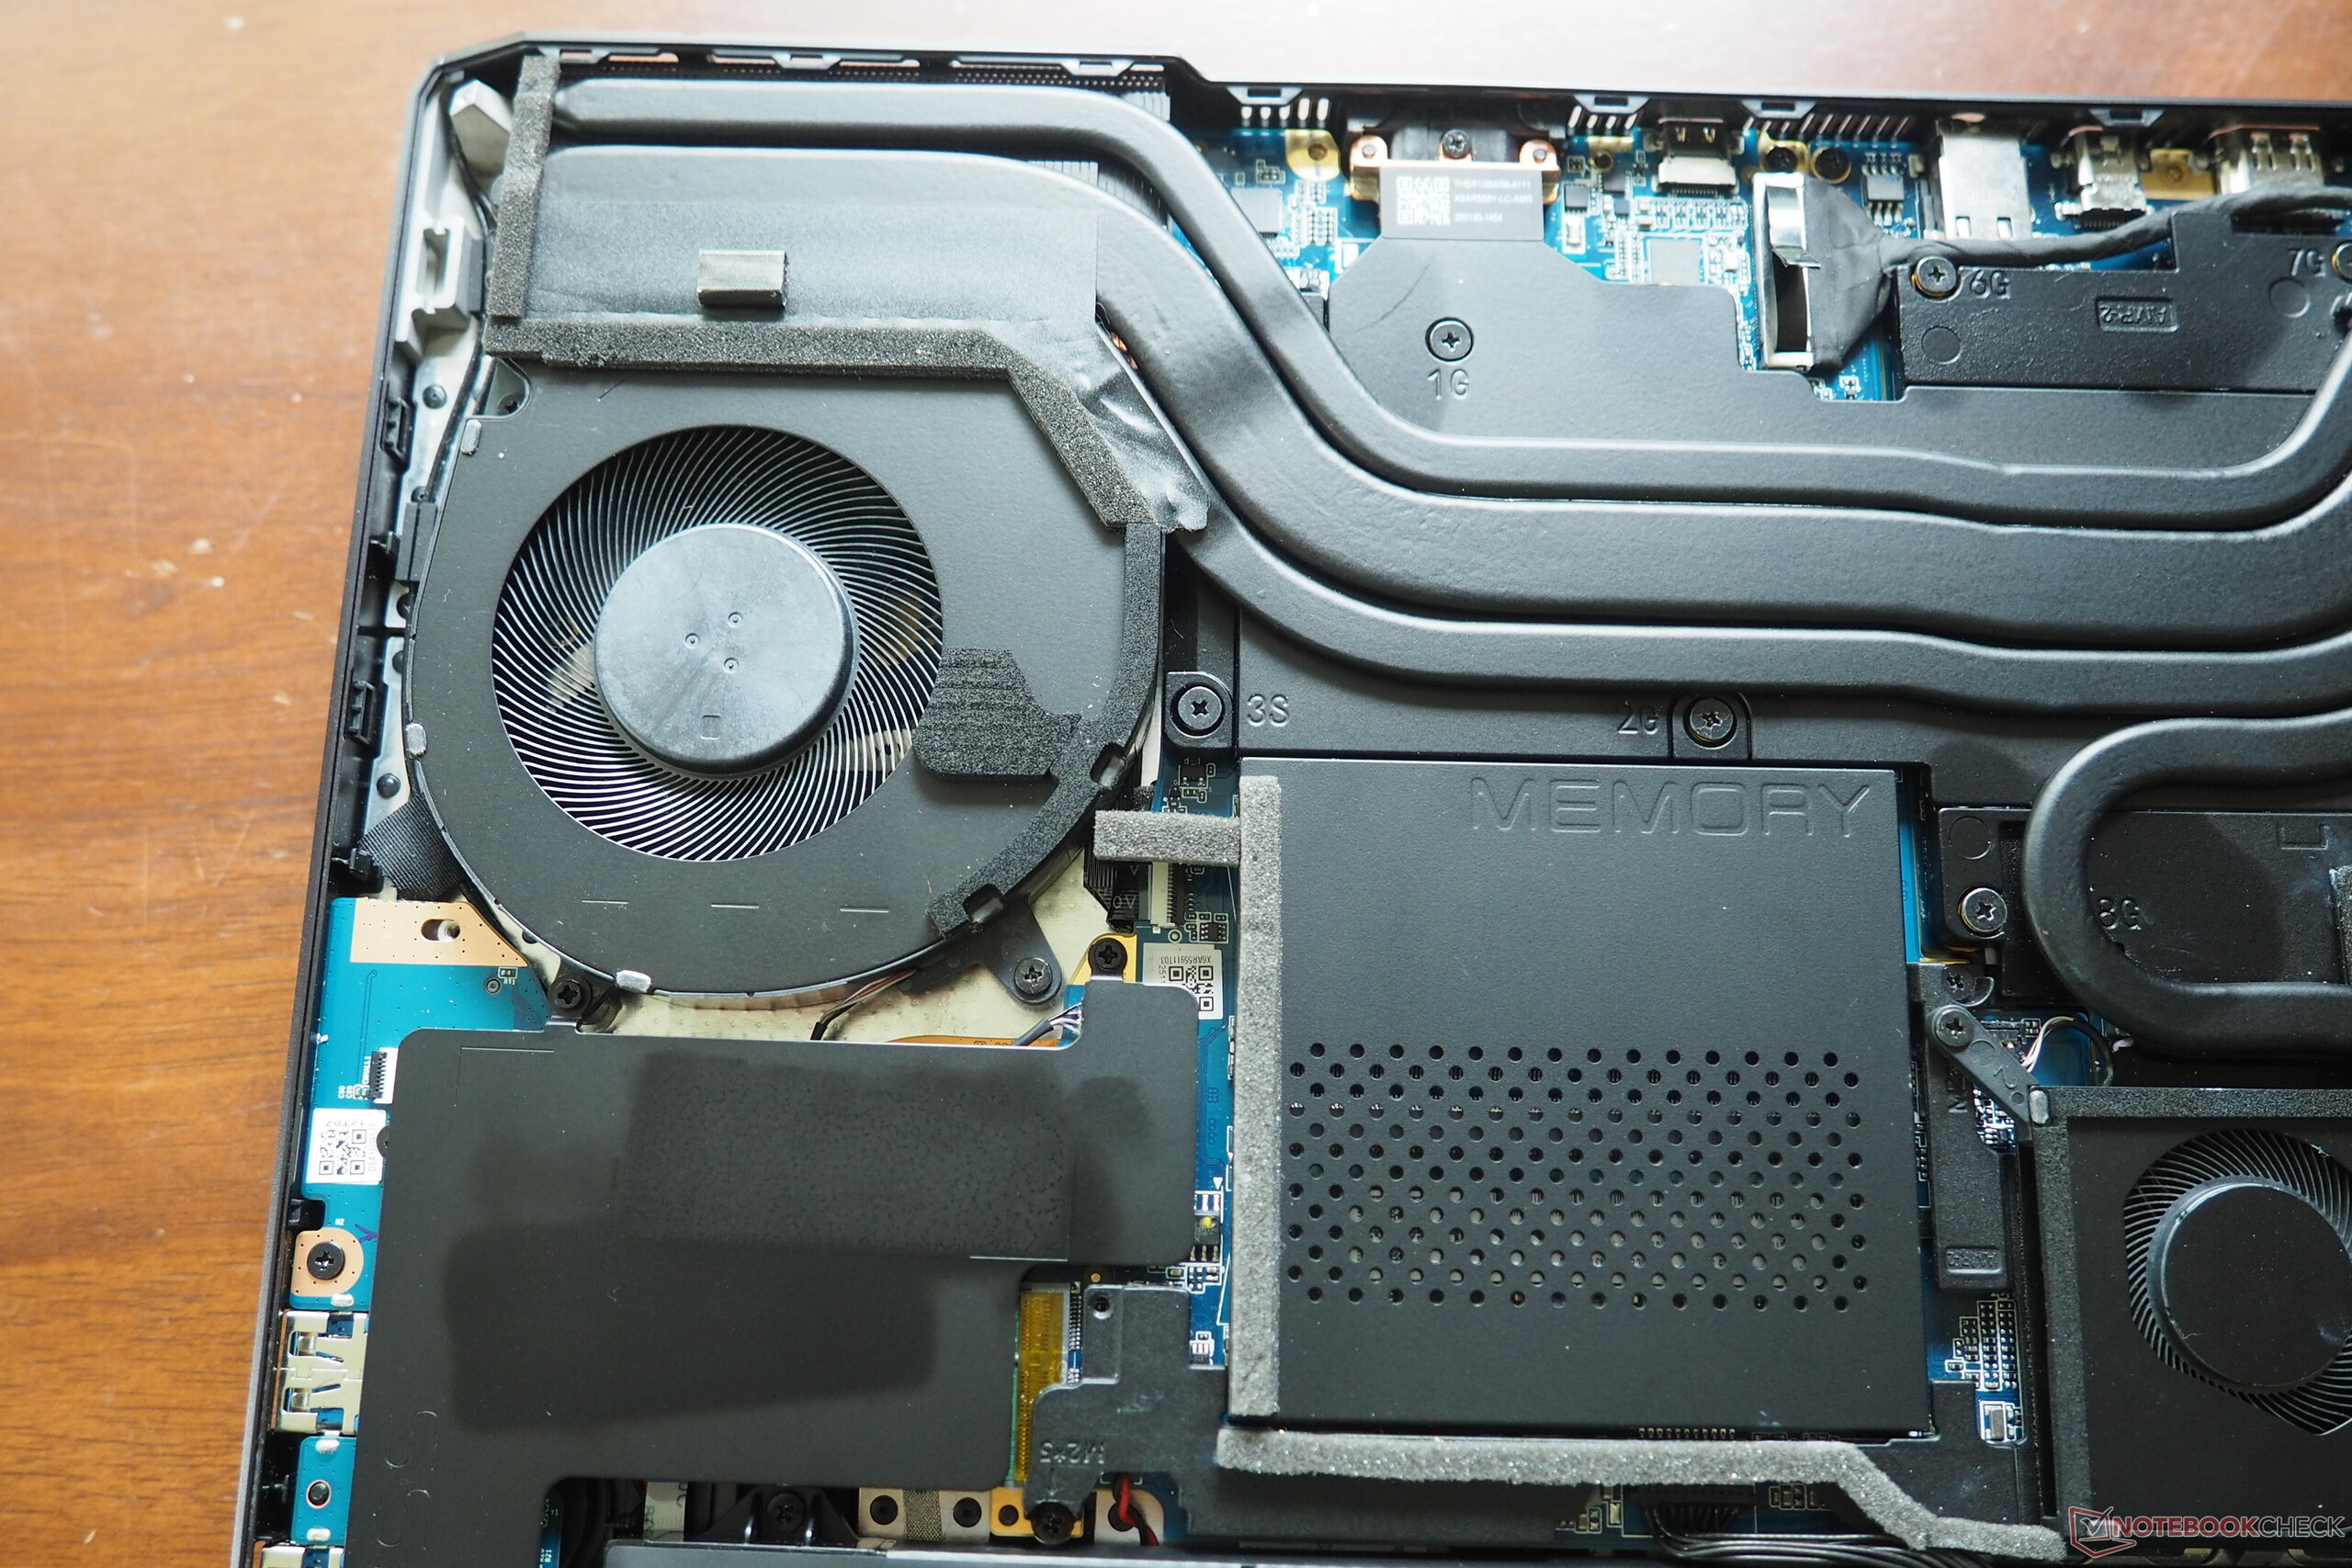
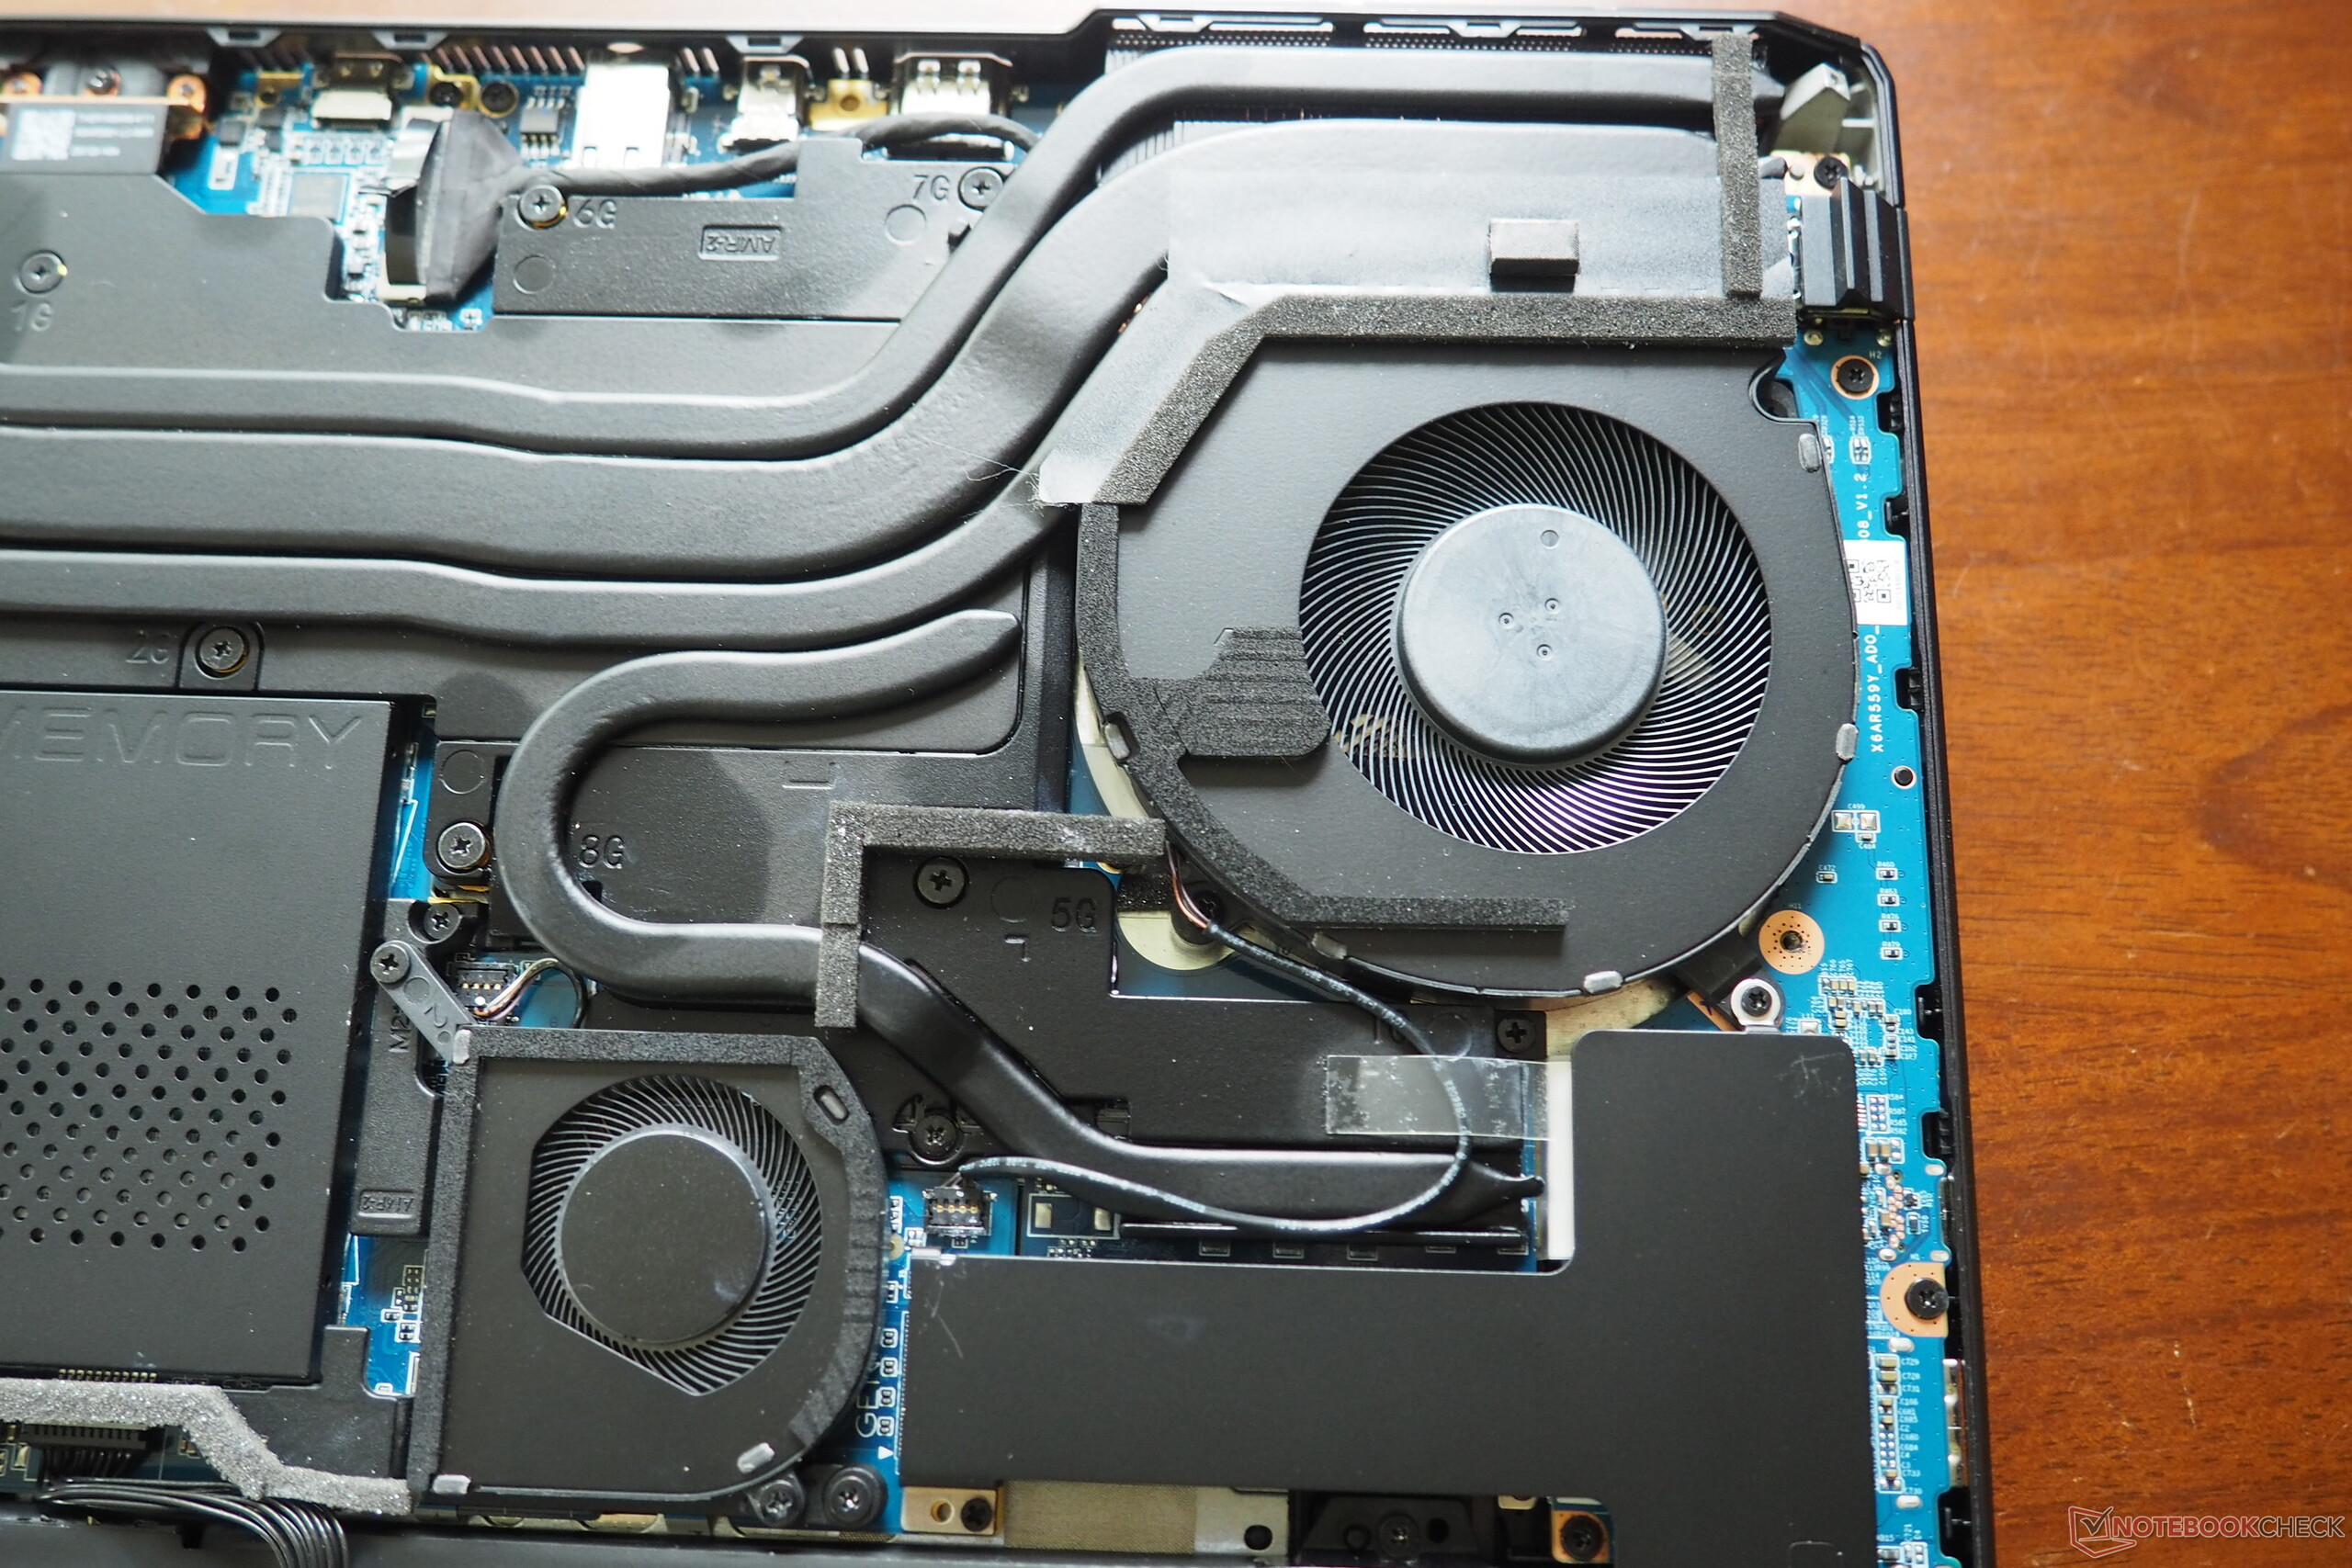
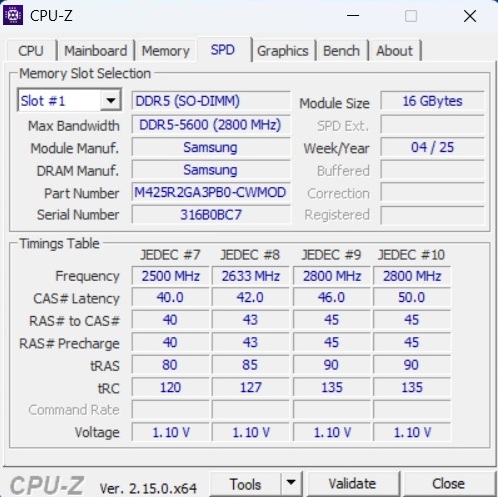
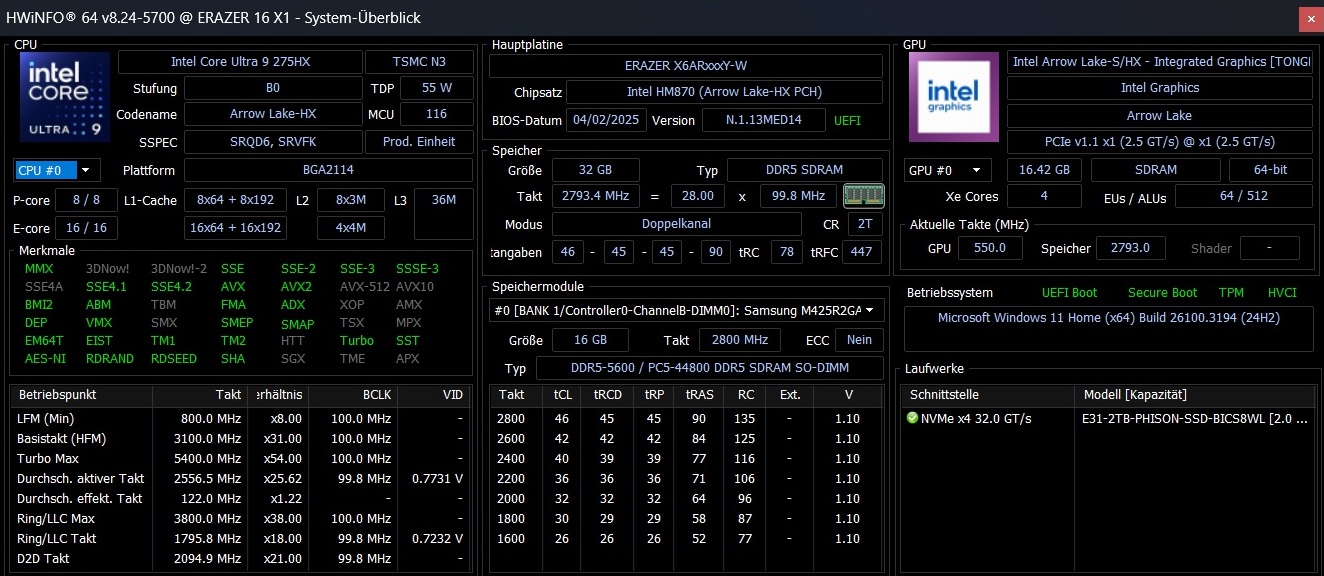
La qualité d'image de la webcam est moyenne : Grâce à sa résolution Full HD, elle est un peu plus nette que les caméras HD de certains concurrents, mais il ne faut pas s'attendre à des miracles. Medion mérite des points supplémentaires pour la couverture physique. Le Beast 16 X1 peut être entretenu après avoir retiré 10 vis Phillips et la base du boîtier. Le modèle 16 pouces dispose de deux banques SO-DIMM et de deux slots M.2-2280 (1x PCIe 5, 1x PCIe 4), qui sont tous deux cachés sous des dissipateurs thermiques. En ce qui concerne le système de refroidissement, la machine de jeu est équipée de trois ventilateurs.
Lecteur de carte SD
| SD Card Reader | |
| average JPG Copy Test (av. of 3 runs) | |
| Medion Erazer Beast 16 X1 Ultimate (AV PRO microSD 128 GB V60) | |
| SCHENKER XMG Neo 16 E25 RTX 5090 Laptop (Angelbird AV Pro V60) | |
| Moyenne de la classe Gaming (19 - 204, n=74, 2 dernières années) | |
| maximum AS SSD Seq Read Test (1GB) | |
| SCHENKER XMG Neo 16 E25 RTX 5090 Laptop (Angelbird AV Pro V60) | |
| Medion Erazer Beast 16 X1 Ultimate (AV PRO microSD 128 GB V60) | |
| Moyenne de la classe Gaming (25.8 - 261, n=73, 2 dernières années) | |
Communication
Webcam


Maintenance
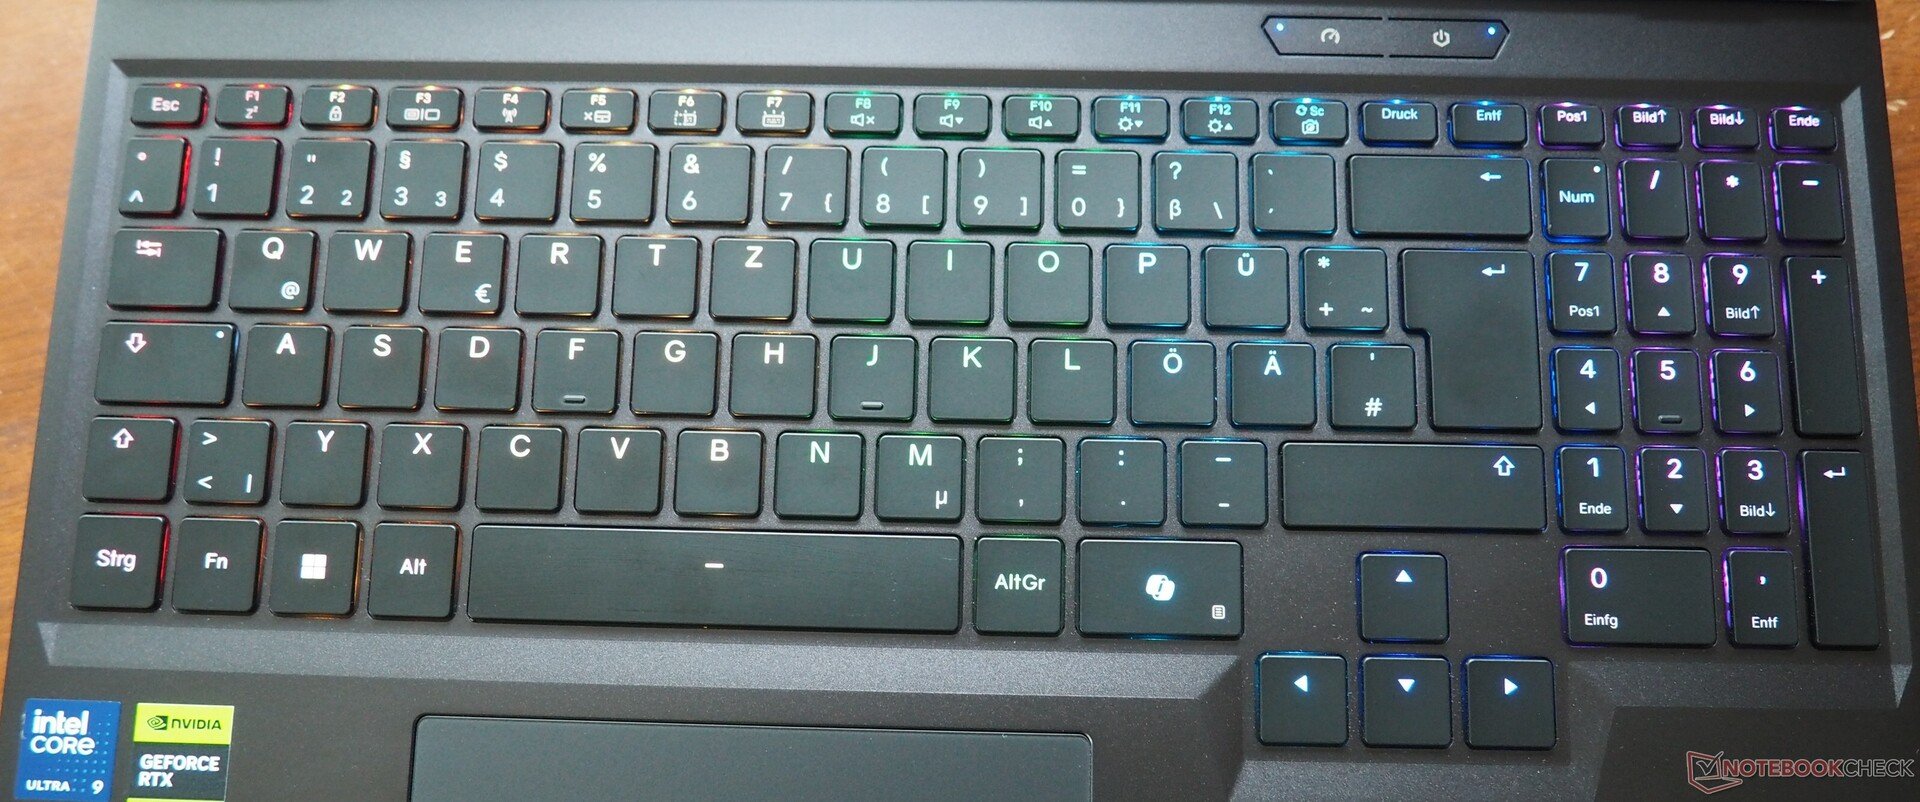
Dispositifs d'entrée
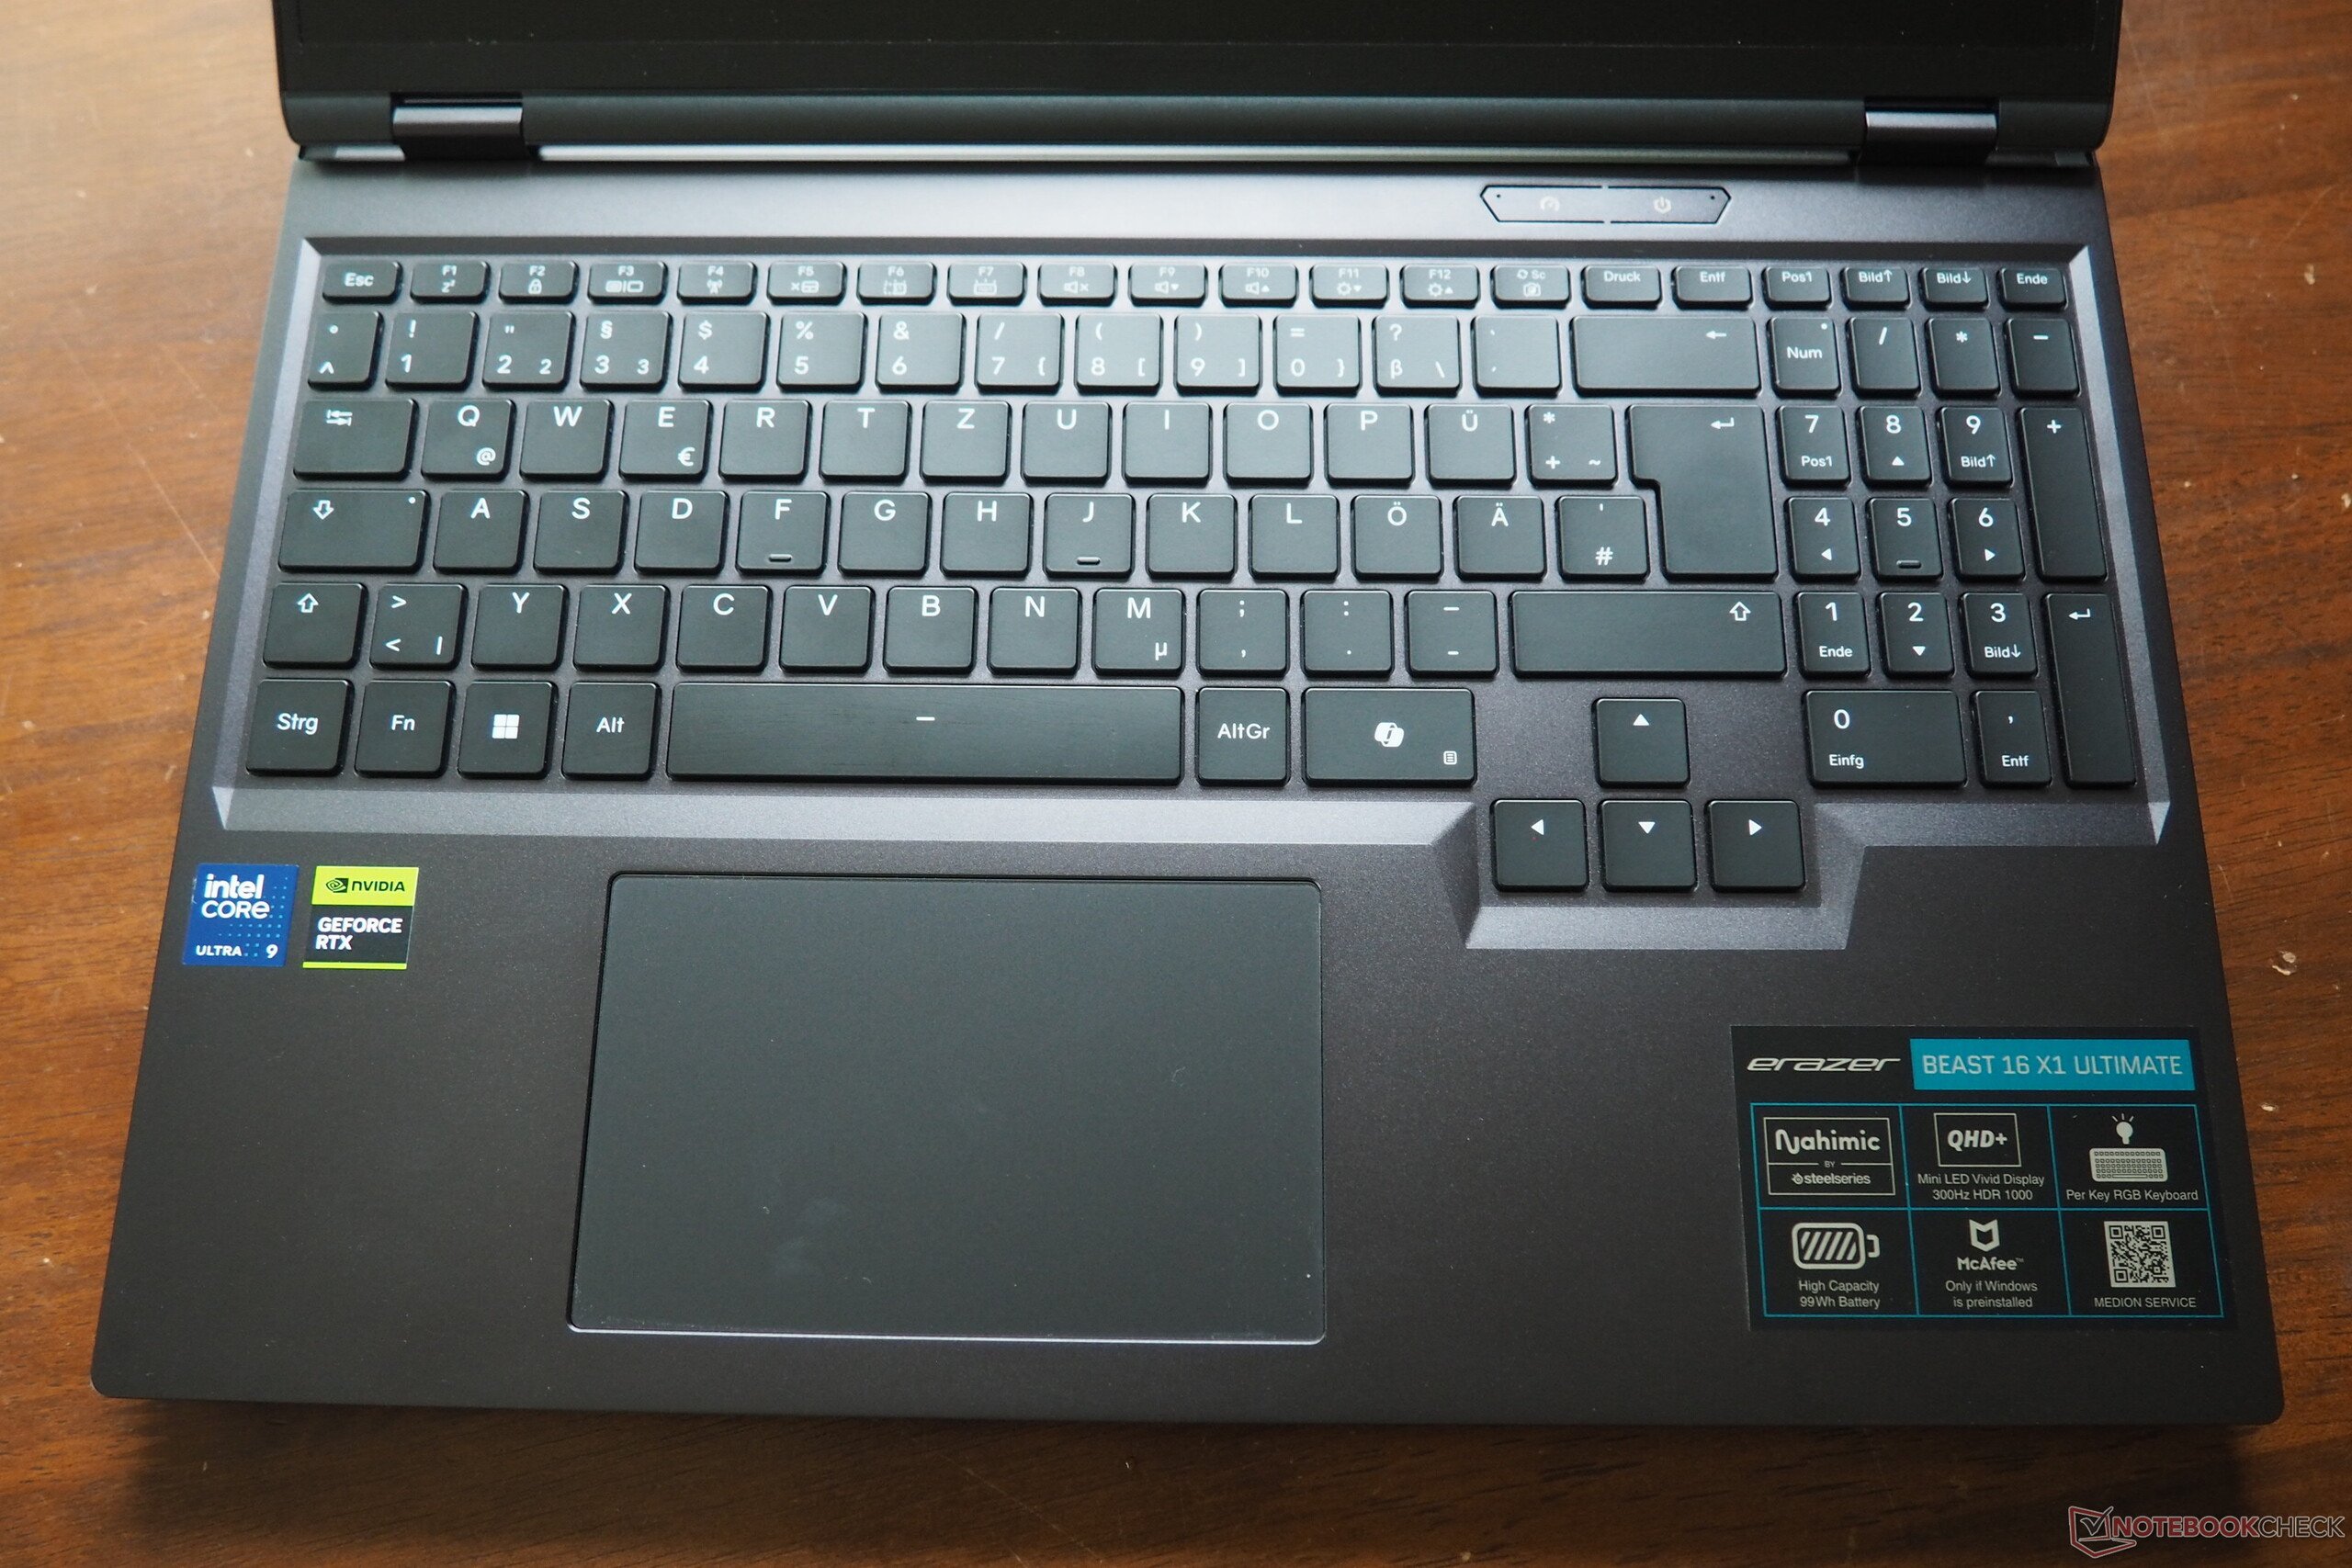
Le clavier du Beast 16 X1 impressionne par son très bon retour d'information, qui est presque équivalent à celui des modèles mécaniques. Le côté droit comporte un pavé numérique dédié, dont les touches sont légèrement plus étroites que les autres. Les amateurs de flèches directionnelles se réjouiront des dimensions normales de ces touches. L'éclairage intégré (RVB par touche) peut être réglé sur plusieurs niveaux.
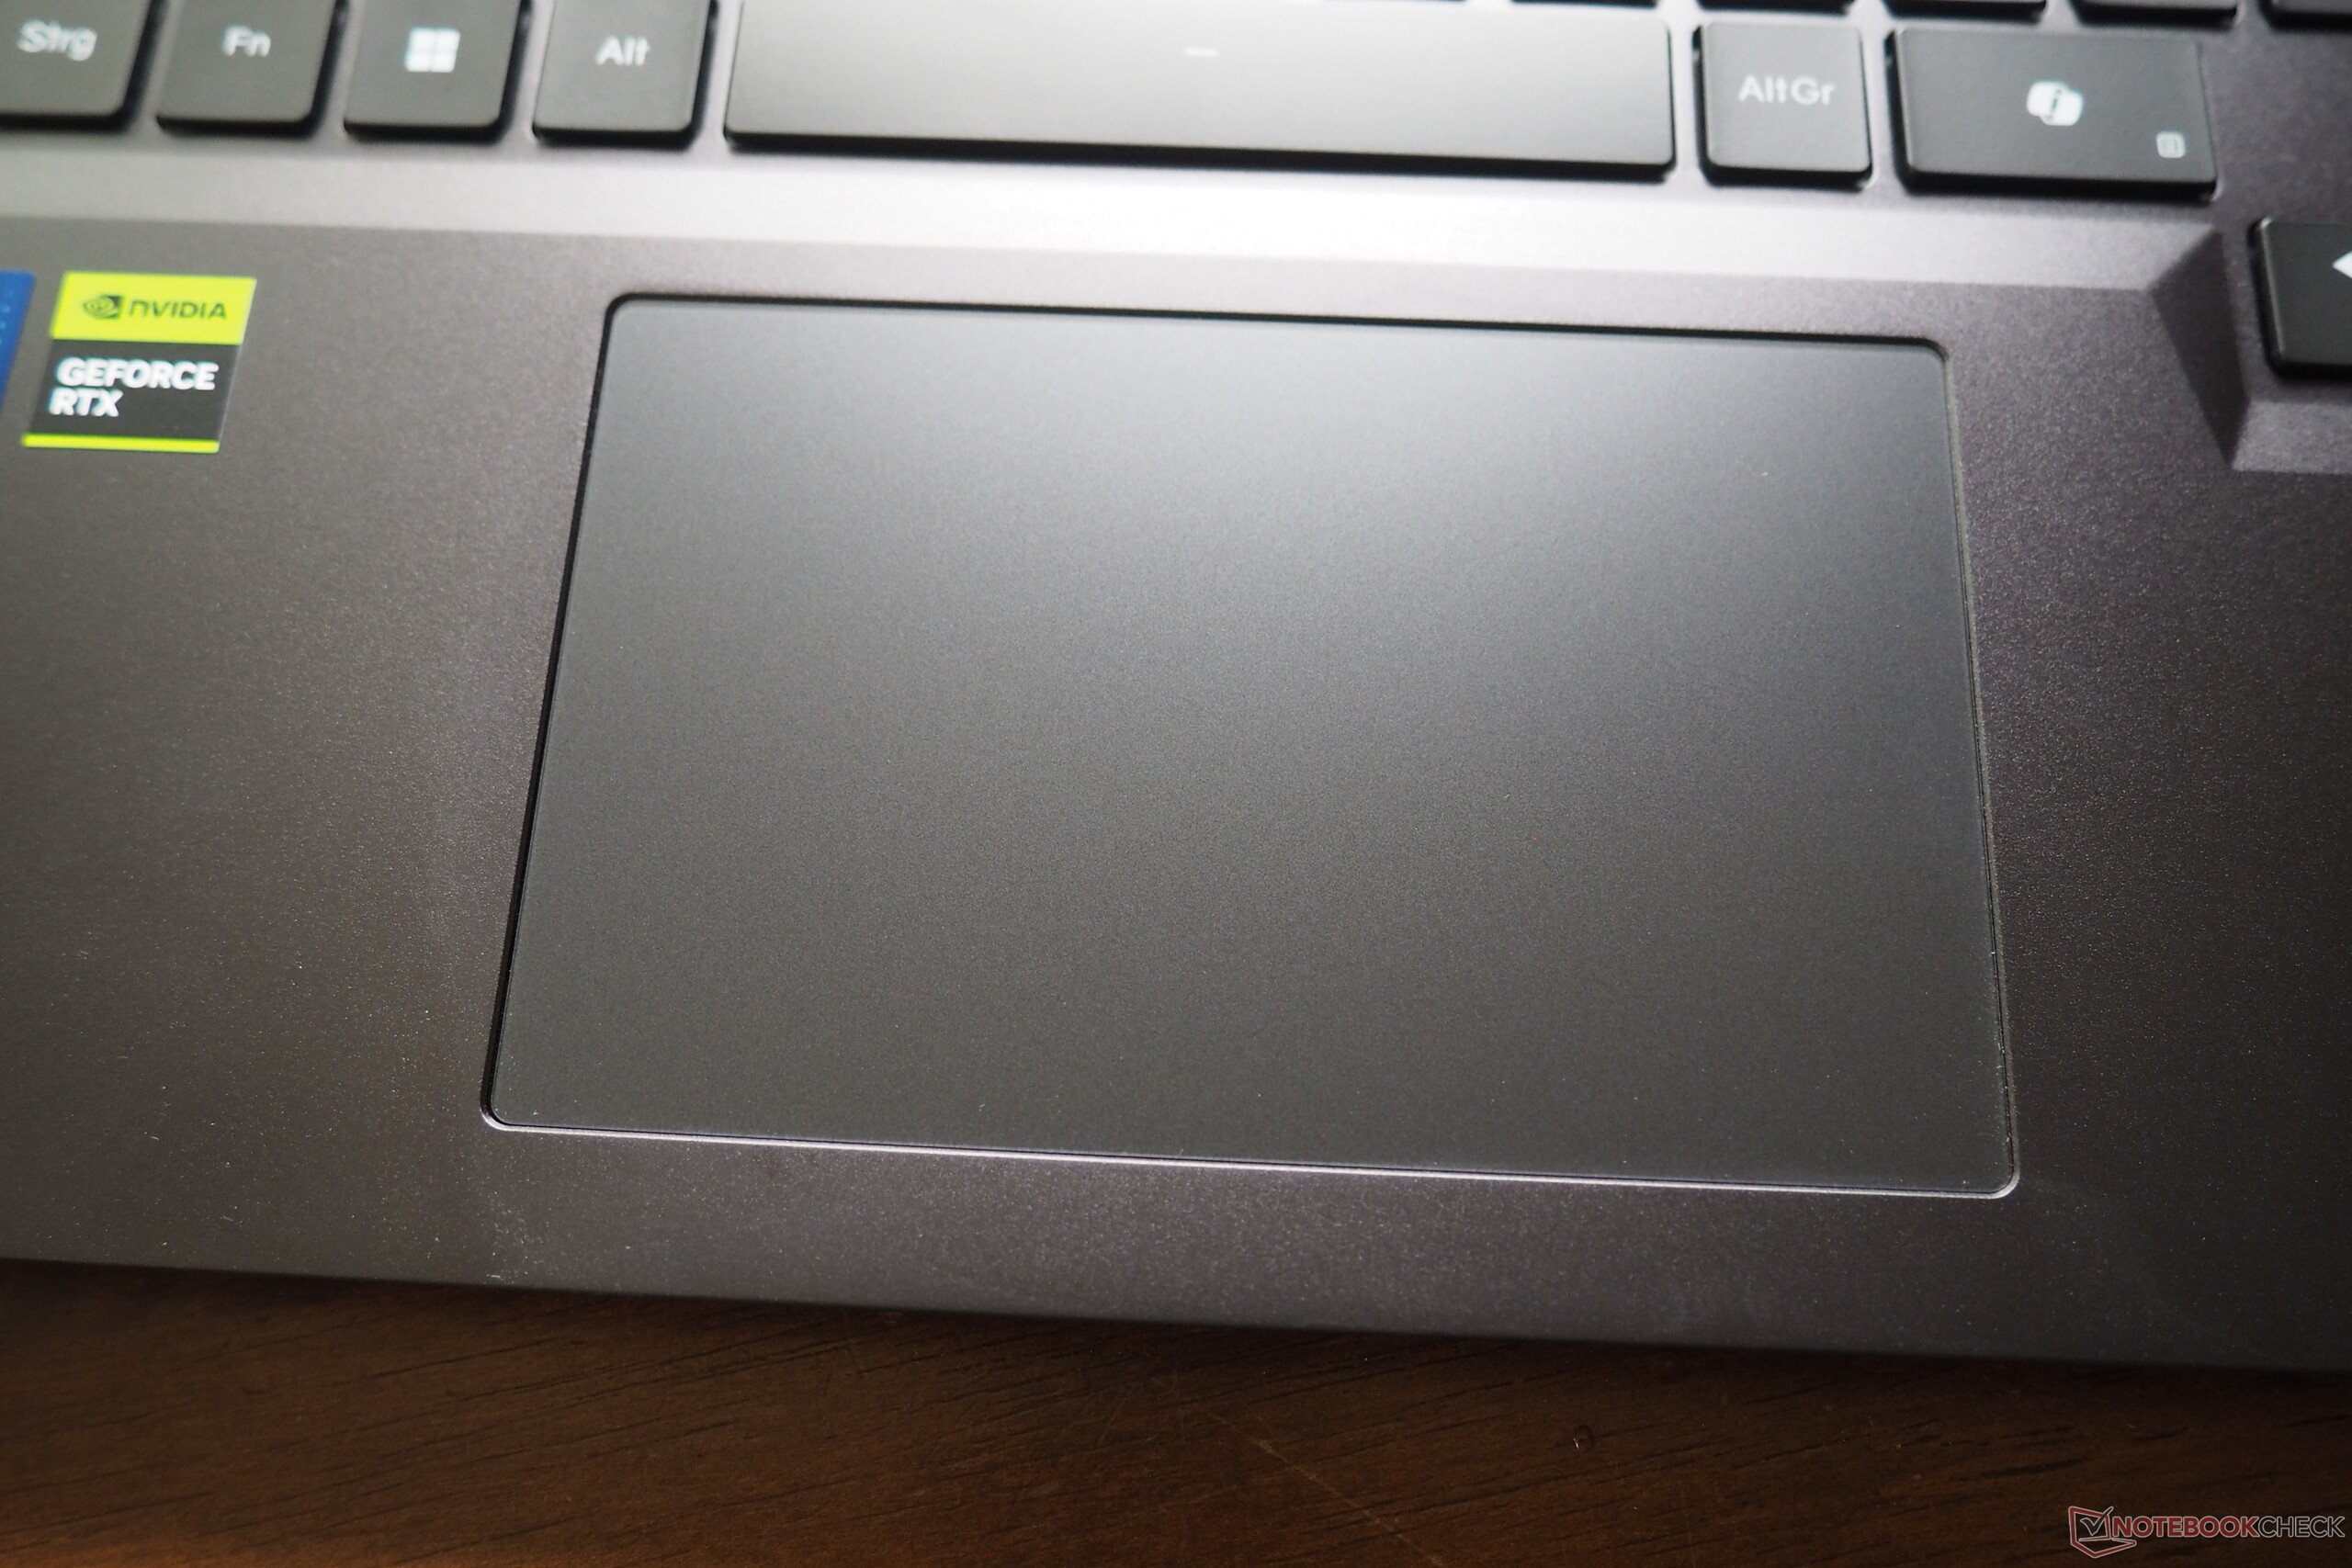
Le pavé tactile est largement discret, ce qui est positif en termes de précision, de propriétés de glissement et de prise en charge des gestes. Avec une taille de 12,4 x 7,6 cm (~4,9 x 3,0 in), il a été dimensionné de manière adéquate. Les zones de clic situées sur le bord inférieur se déclenchent un peu bruyamment, mais offrent un retour d'information solide (haptique) similaire à celui du clavier.
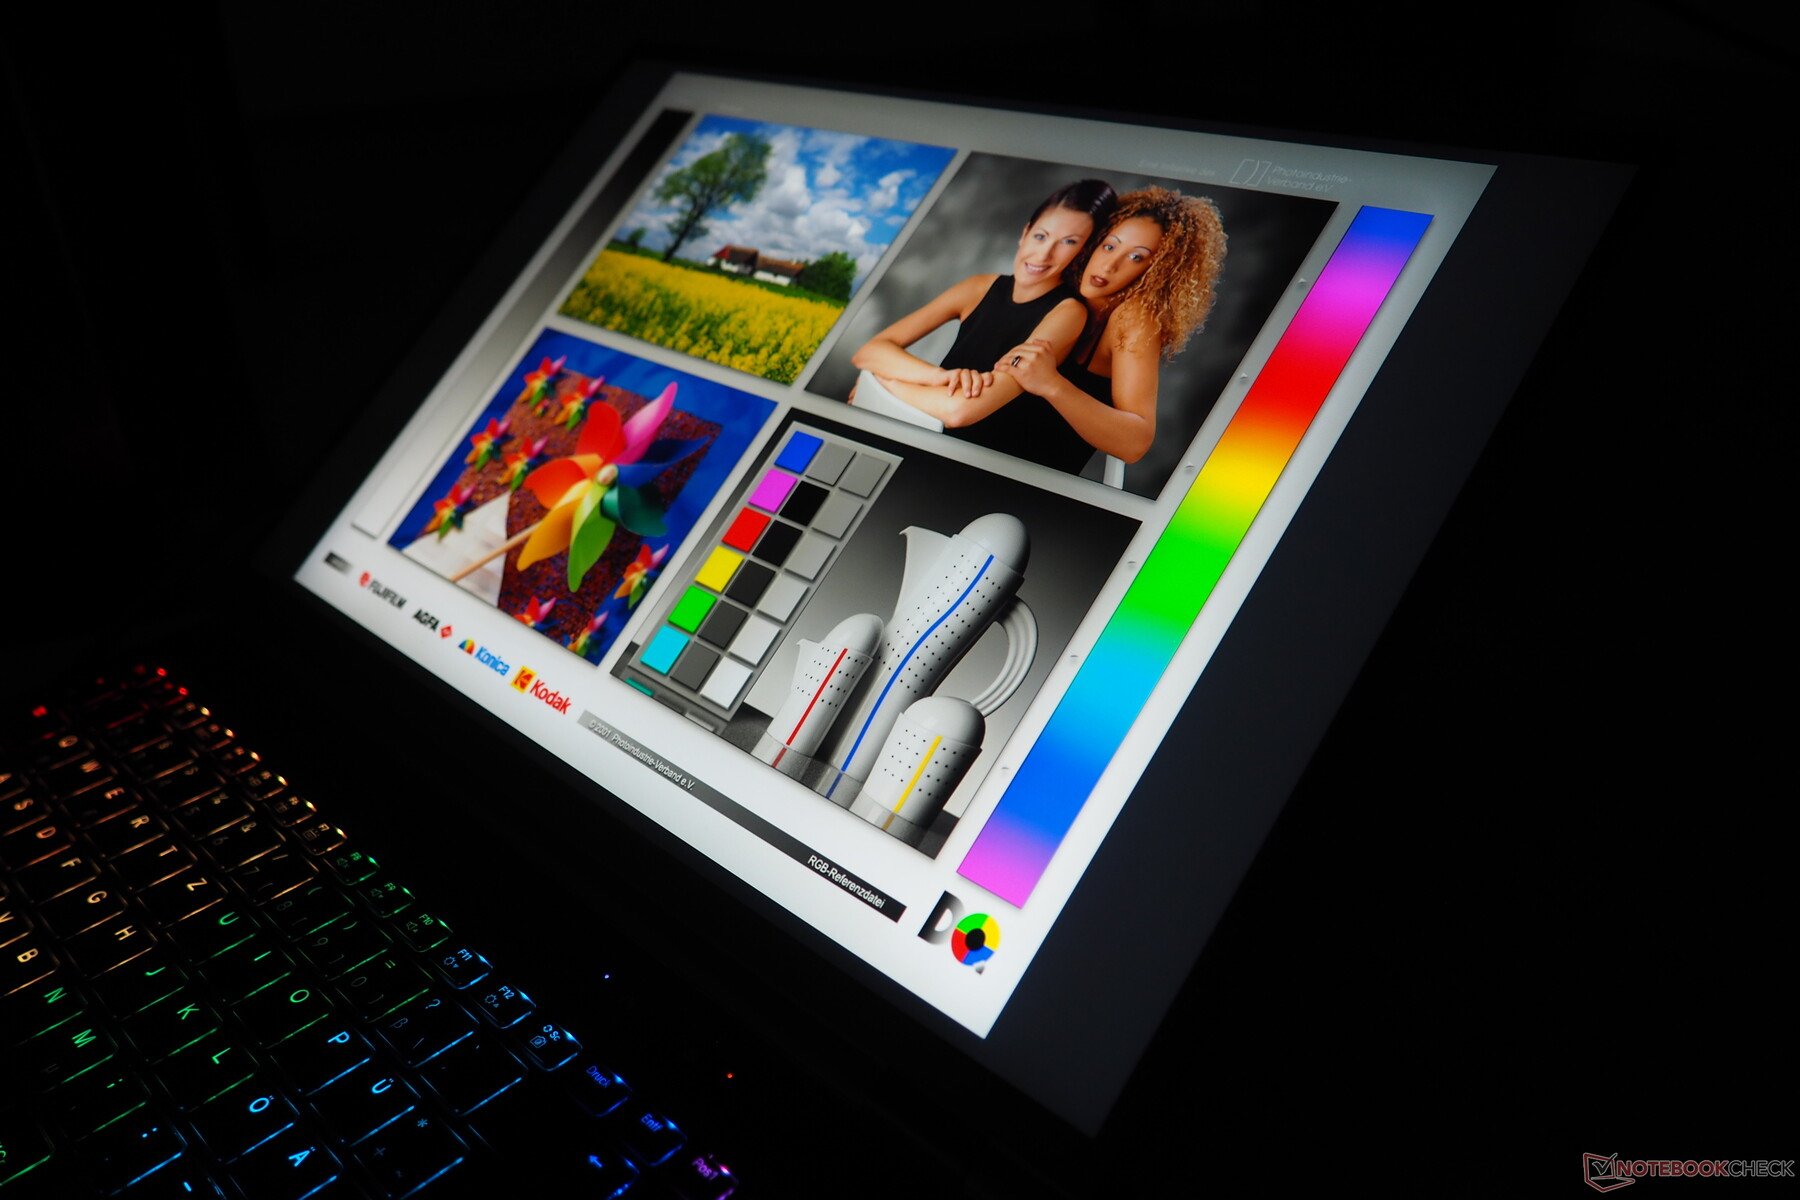
Affichage
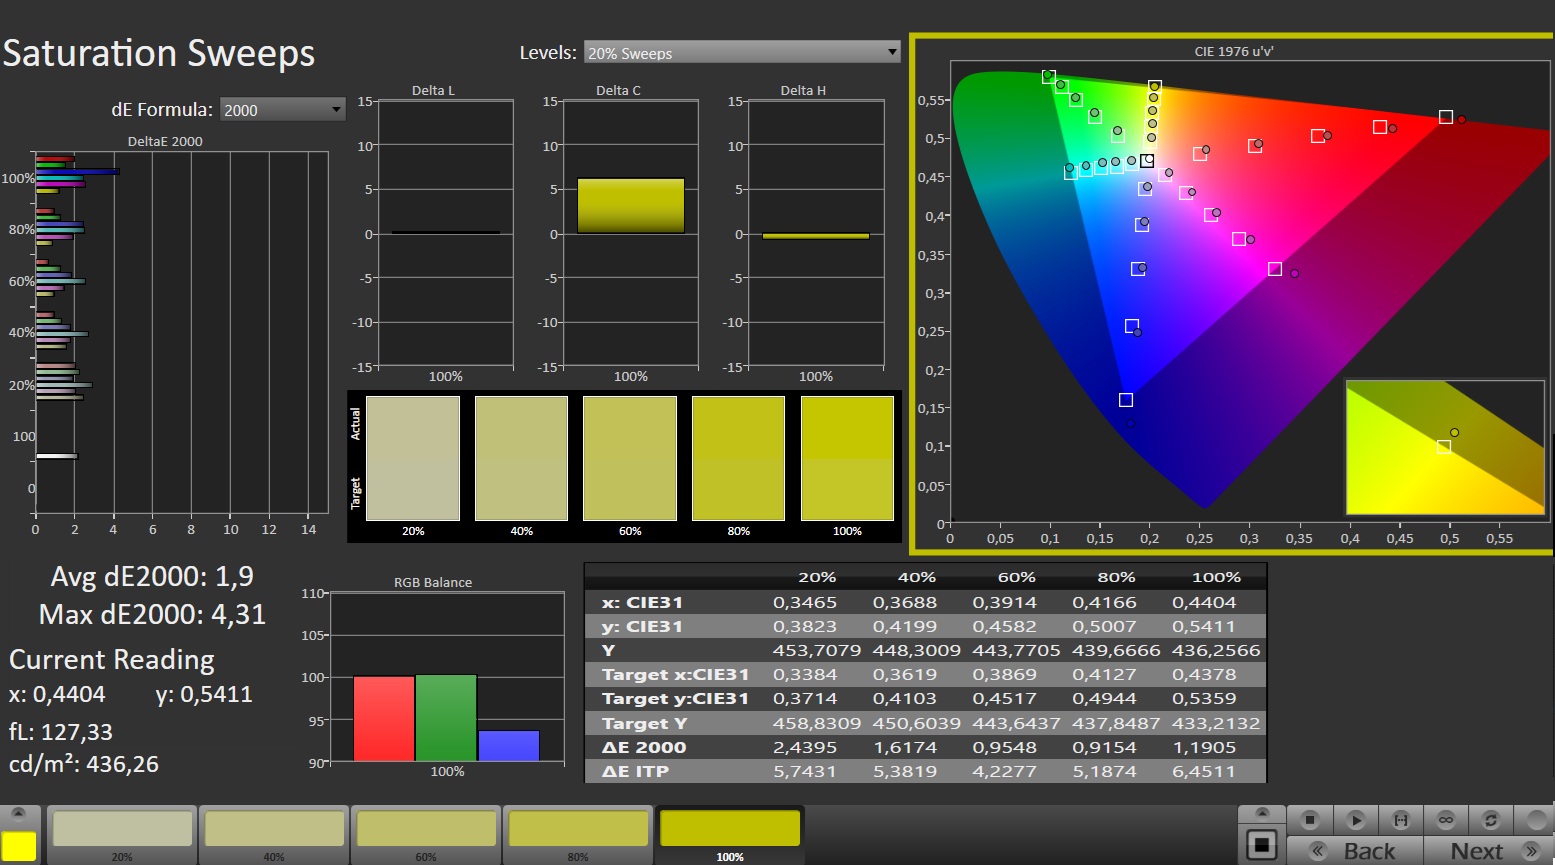
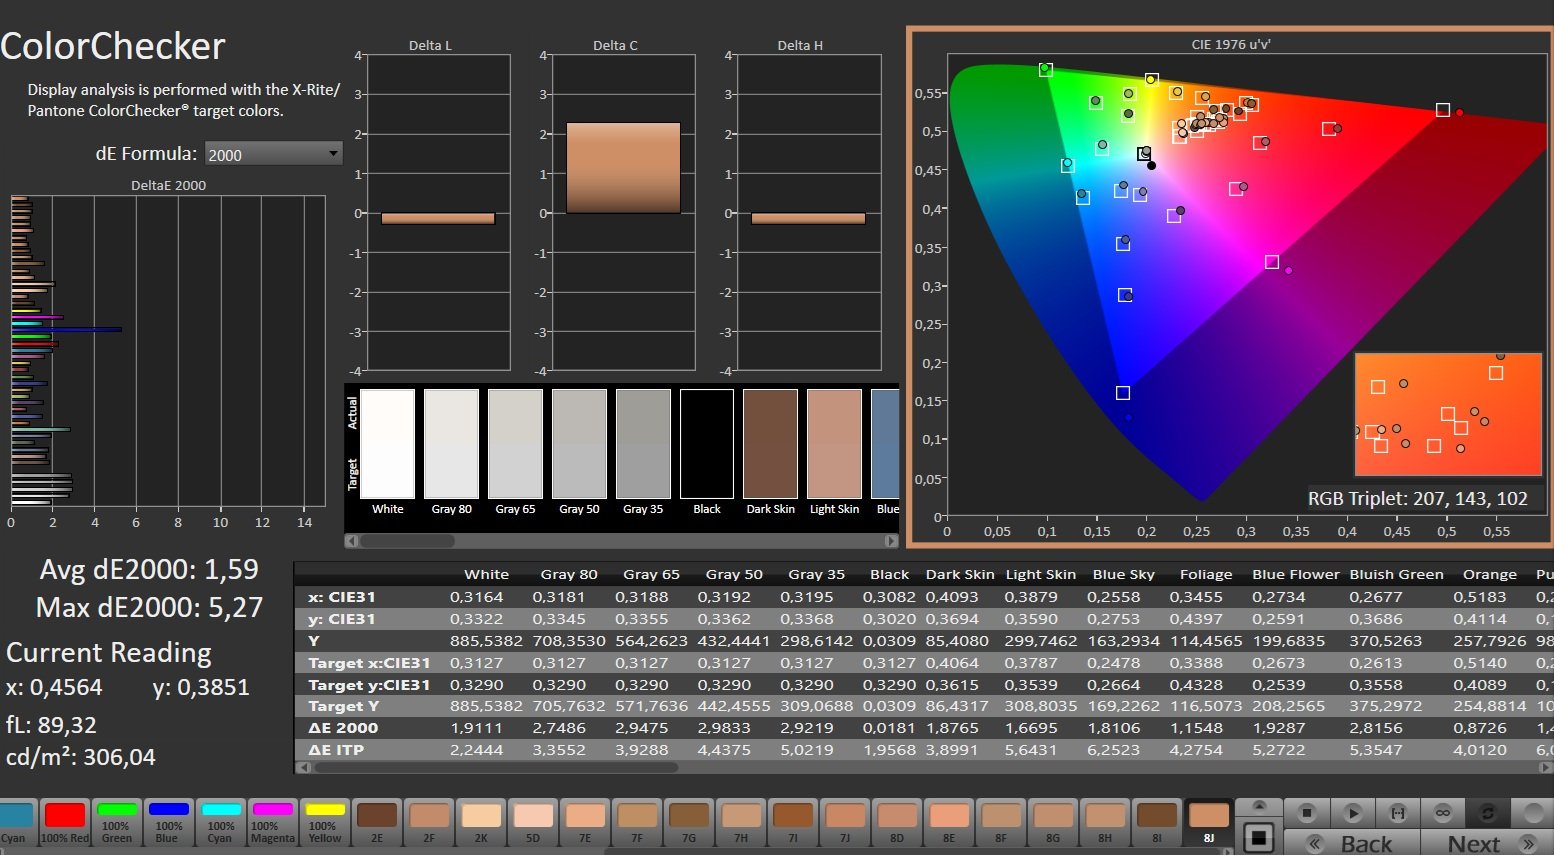
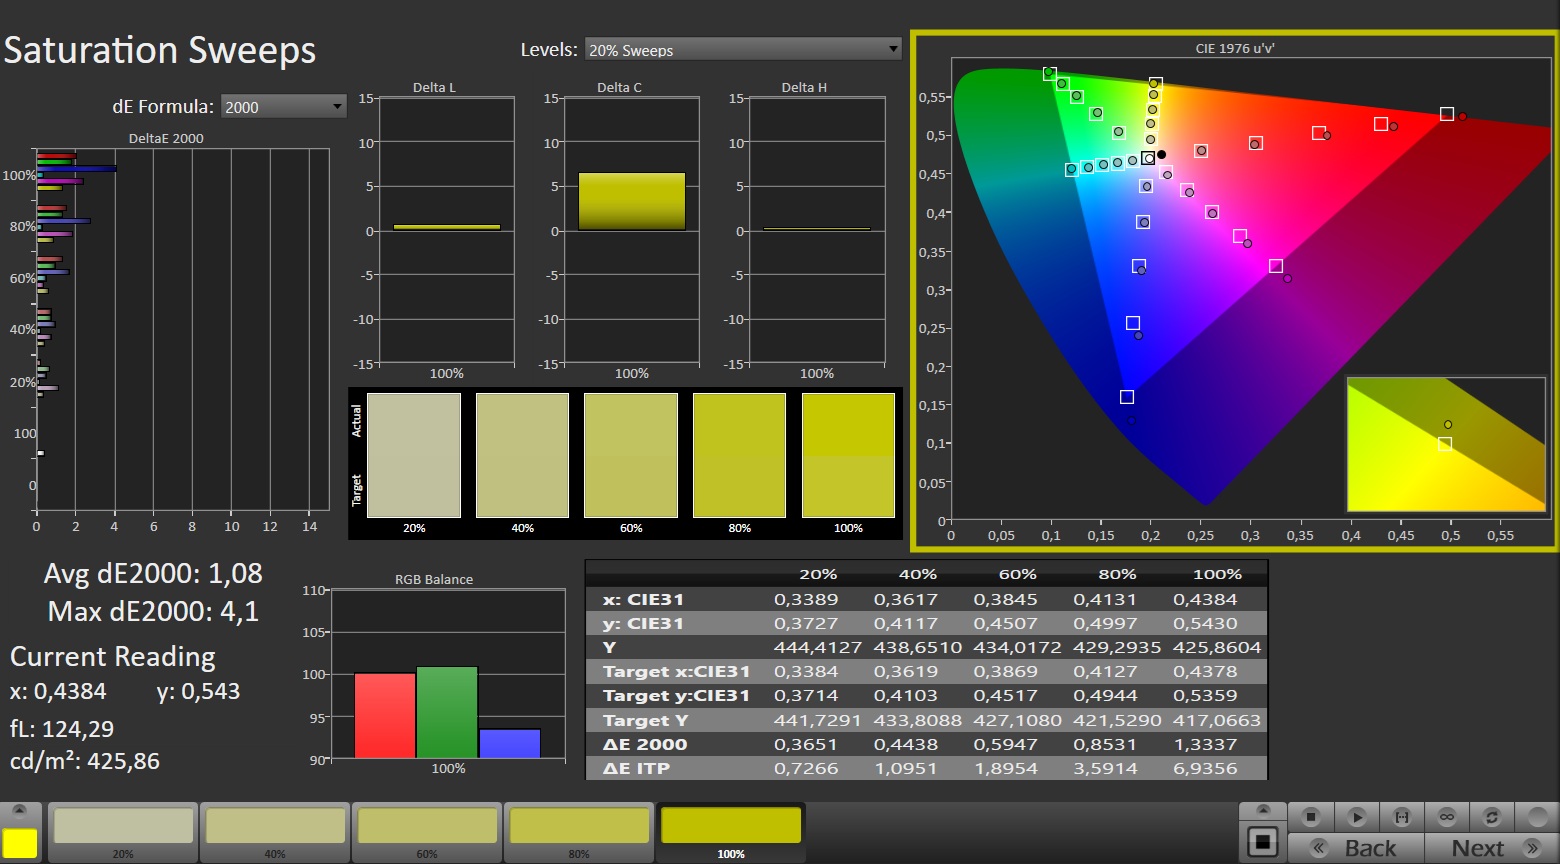
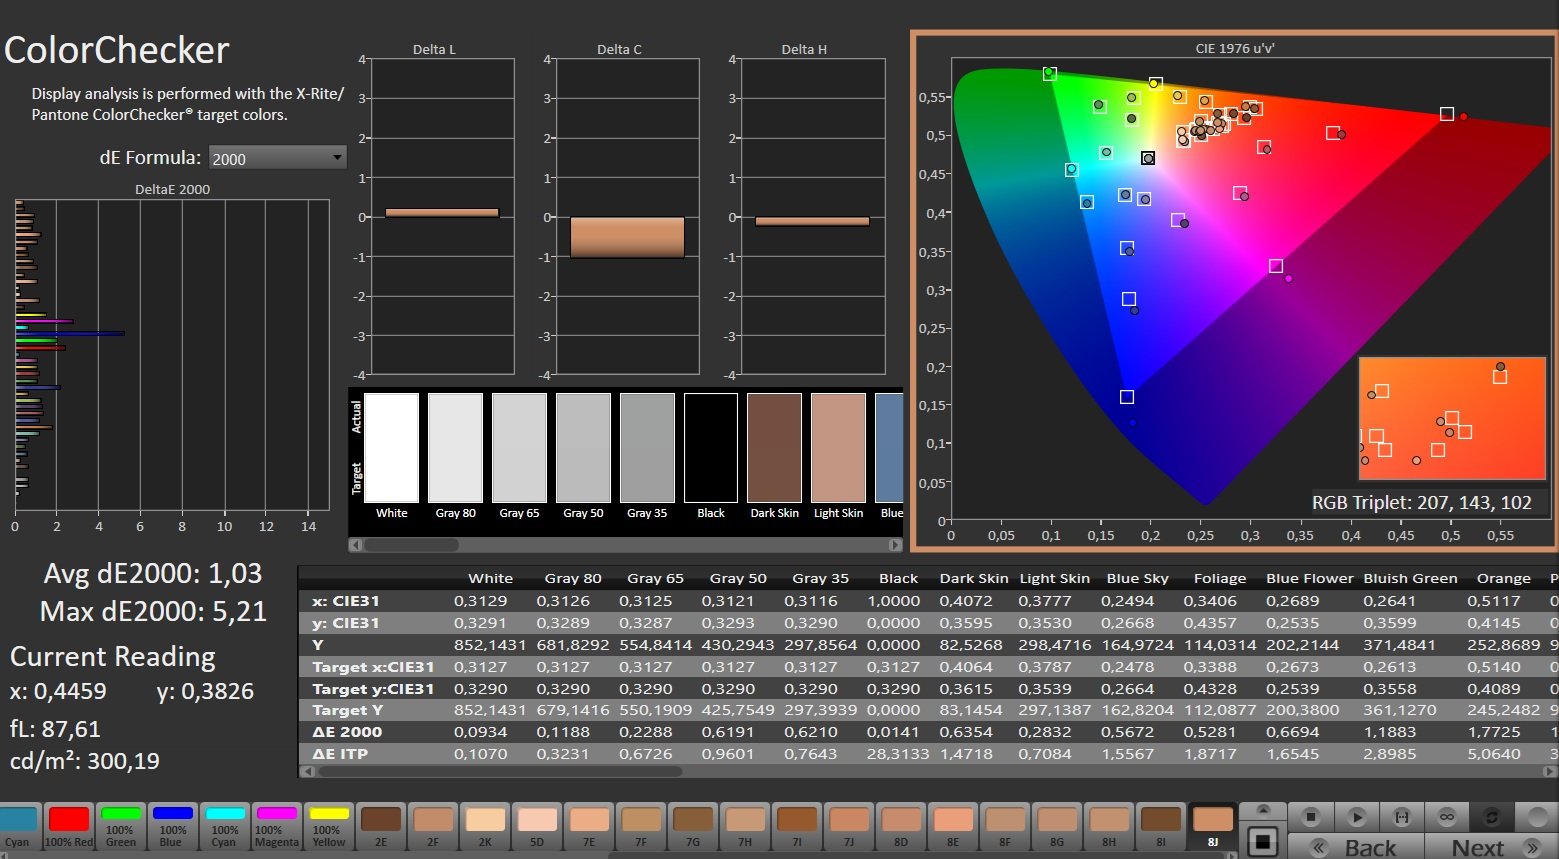
L'un des principaux atouts de la Beast 16 X1 est son mini-écran LED de première classe. Dès sa sortie de l'emballage, l'écran de 16 pouces offre un niveau de précision des couleurs assez élevé.
| |||||||||||||||||||||||||
Homogénéité de la luminosité: 94 %
Valeur mesurée au centre, sur batterie: 837 cd/m²
Contraste: ∞:1 (Valeurs des noirs: 0 cd/m²)
ΔE Color 1.59 | 0.5-29.43 Ø4.85, calibrated: 1.03
ΔE Greyscale 2.4 | 0.09-98 Ø5.1
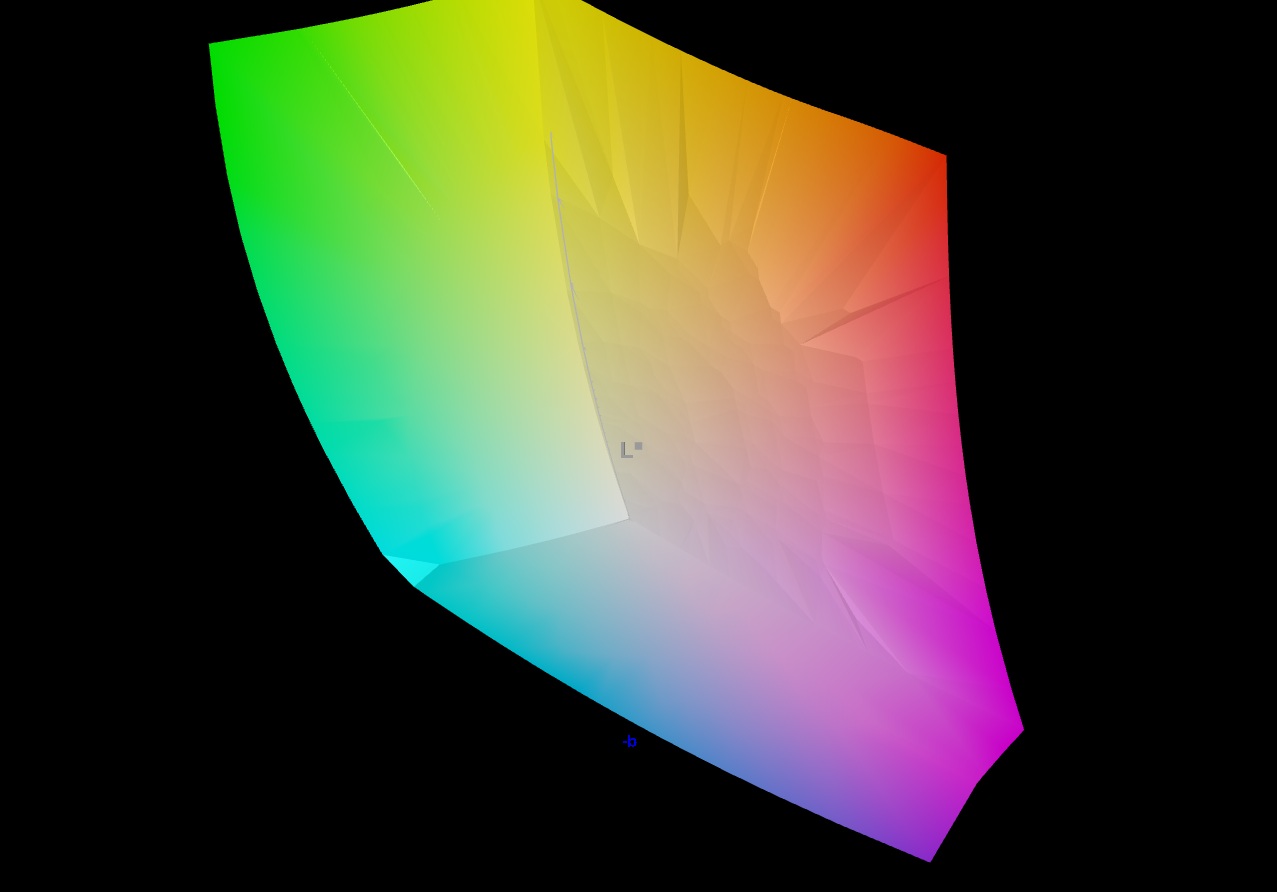
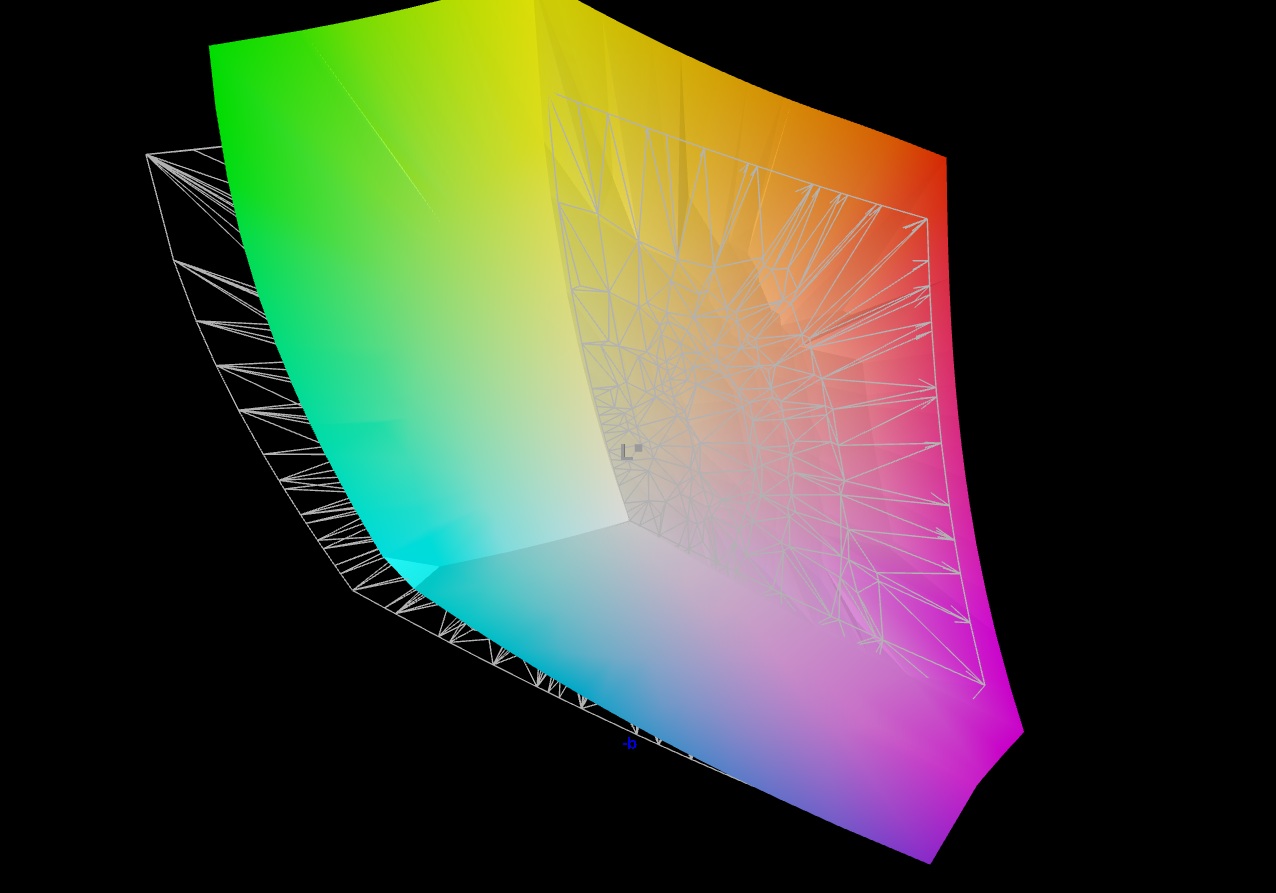
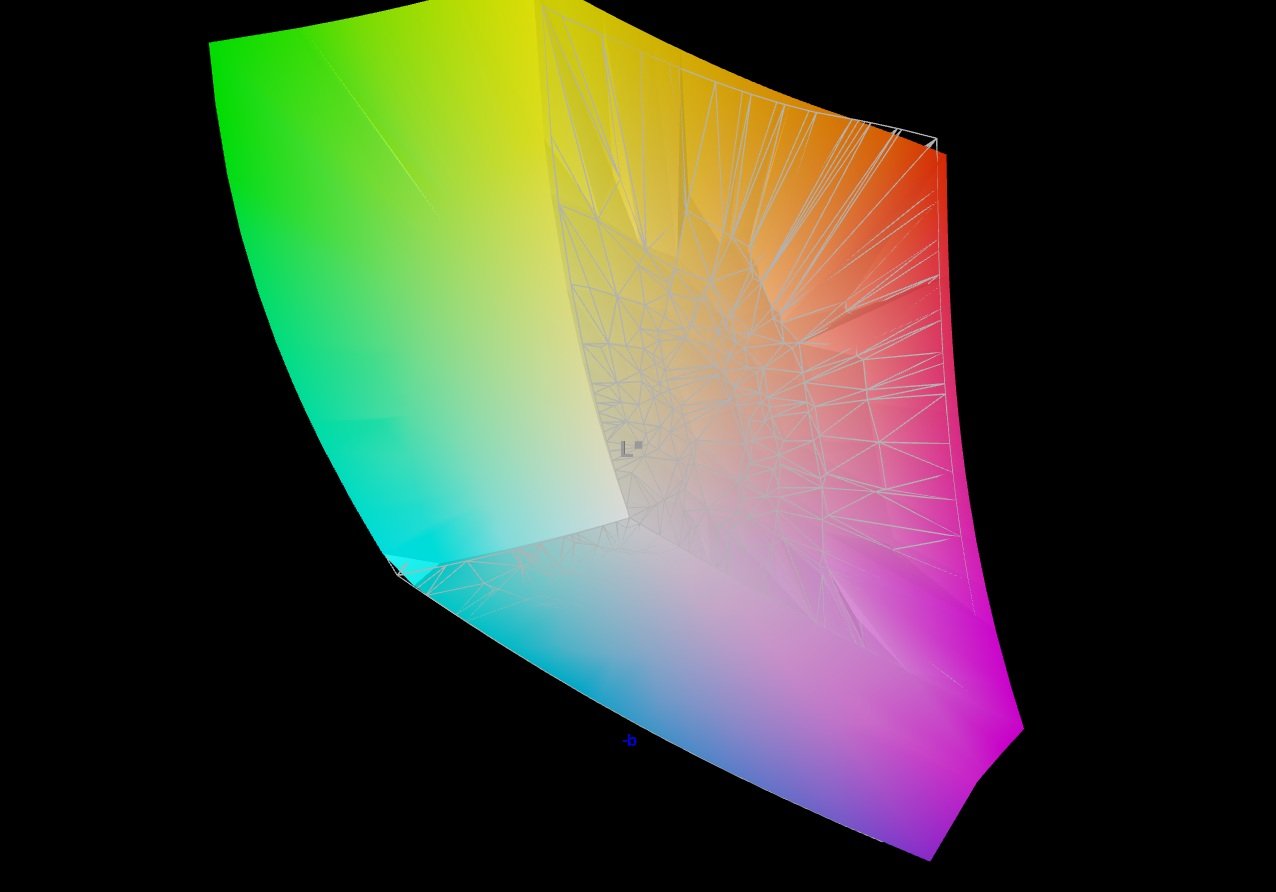
86.9% AdobeRGB 1998 (Argyll 2.2.0 3D)
100% sRGB (Argyll 2.2.0 3D)
99.7% Display P3 (Argyll 2.2.0 3D)
Gamma: 2.214
| Medion Erazer Beast 16 X1 Ultimate NE160QDM-NM9 (BOE0D5A), Mini-LED, 2560x1600, 16", 300 Hz | SCHENKER XMG Neo 16 E25 RTX 5090 Laptop NE160QDM-NM9, Mini-LED, 2560x1600, 16", 300 Hz | HP Omen Max 16 ah000 Samsung ATNA60DL02-0, OLED, 2560x1600, 16", 240 Hz | Asus ROG Strix Scar 16 2025 NE160QDM-NM8, Mini-LED, 2560x1600, 16", 240 Hz | Lenovo Legion Pro 7i 16 Gen 10 Samsung ATNA60HU01-0, OLED, 2560x1600, 16", 240 Hz | Asus ROG Strix G16 G615 NE160QDM-NZC, IPS, 2560x1600, 16", 240 Hz | |
|---|---|---|---|---|---|---|
| Display | 1% | 4% | 1% | 3% | 1% | |
| Display P3 Coverage | 99.7 | 99.9 0% | 99.7 0% | 99.9 0% | 99.5 0% | 99.1 -1% |
| sRGB Coverage | 100 | 100 0% | 100 0% | 100 0% | 100 0% | 99.9 0% |
| AdobeRGB 1998 Coverage | 86.9 | 88.5 2% | 98.2 13% | 88.4 2% | 94.4 9% | 89.1 3% |
| Response Times | -33% | 87% | 16% | 88% | 42% | |
| Response Time Grey 50% / Grey 80% * | 10 ? | 17.4 ? -74% | 0.29 ? 97% | 7 ? 30% | 0.28 ? 97% | 4.6 ? 54% |
| Response Time Black / White * | 8.6 ? | 13 ? -51% | 0.47 ? 95% | 8.4 ? 2% | 0.43 ? 95% | 6.1 ? 29% |
| PWM Frequency | 20457 ? | 20253 | 960 ? | 20555 ? | 1438 ? | |
| PWM Amplitude * | 100 | 75 25% | 31 69% | 29 71% | ||
| Screen | -29% | -30% | 23% | -17% | -4% | |
| Brightness middle | 837 | 888 6% | 376.5 -55% | 754 -10% | 490.4 -41% | 545 -35% |
| Brightness | 821 | 859 5% | 382 -53% | 773 -6% | 498 -39% | 536 -35% |
| Brightness Distribution | 94 | 94 0% | 96 2% | 91 -3% | 97 3% | 89 -5% |
| Black Level * | 0.07 | 0.41 | ||||
| Colorchecker dE 2000 * | 1.59 | 3.3 -108% | 3.67 -131% | 1 37% | 3.2 -101% | 1.6 -1% |
| Colorchecker dE 2000 max. * | 5.27 | 5.5 -4% | 7.24 -37% | 2 62% | 6.04 -15% | 4 24% |
| Colorchecker dE 2000 calibrated * | 1.03 | 1.5 -46% | 0.94 9% | 0.84 18% | 0.8 22% | |
| Greyscale dE 2000 * | 2.4 | 3.8 -58% | 1.1 54% | 1 58% | 1 58% | 2.4 -0% |
| Gamma | 2.214 99% | 2.46 89% | 2.25 98% | 2.14 103% | 2.24 98% | 2.25 98% |
| CCT | 6186 105% | 6267 104% | 6319 103% | 6493 100% | 6373 102% | 6737 96% |
| Contrast | 10771 | 1329 | ||||
| Moyenne finale (programmes/paramètres) | -20% /
-23% | 20% /
5% | 13% /
16% | 25% /
12% | 13% /
5% |
* ... Moindre est la valeur, meilleures sont les performances
En général, la couverture de l'espace colorimétrique de 100% sRGB ou DCI-P3 et 87% AdobeRGB est impressionnante, bien que cela s'applique également aux panneaux OLED ou IPS de la concurrence. En termes de luminosité (nous avons testé en mode SDR ; le HDR peut également être activé si vous le souhaitez), le Beast 16 X1 et le Neo 16 prennent la tête avec une moyenne de 821 cd/m², ce qui est un excellent résultat.
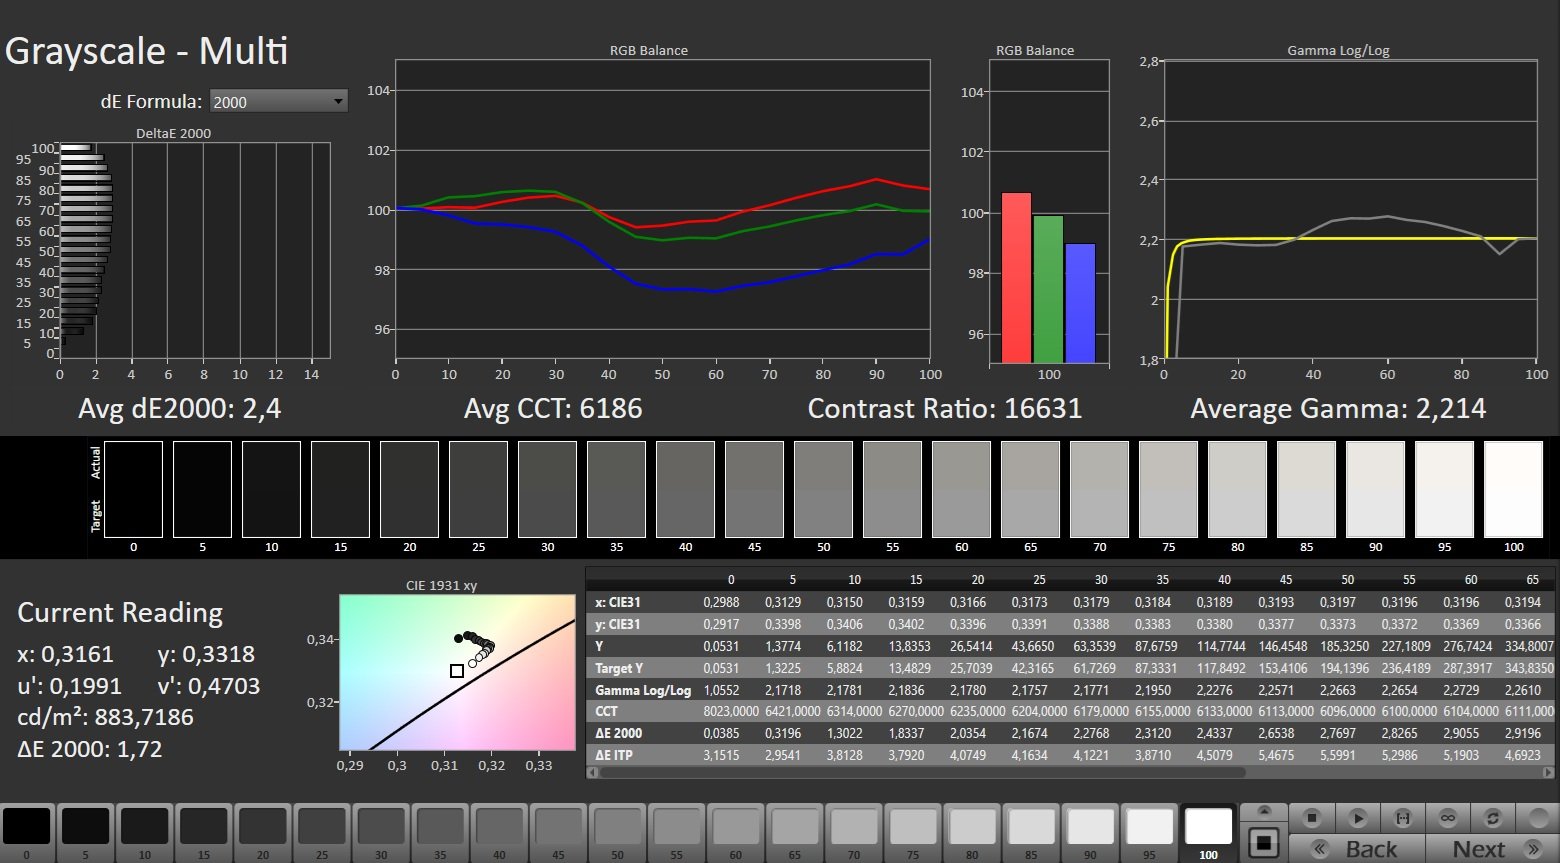
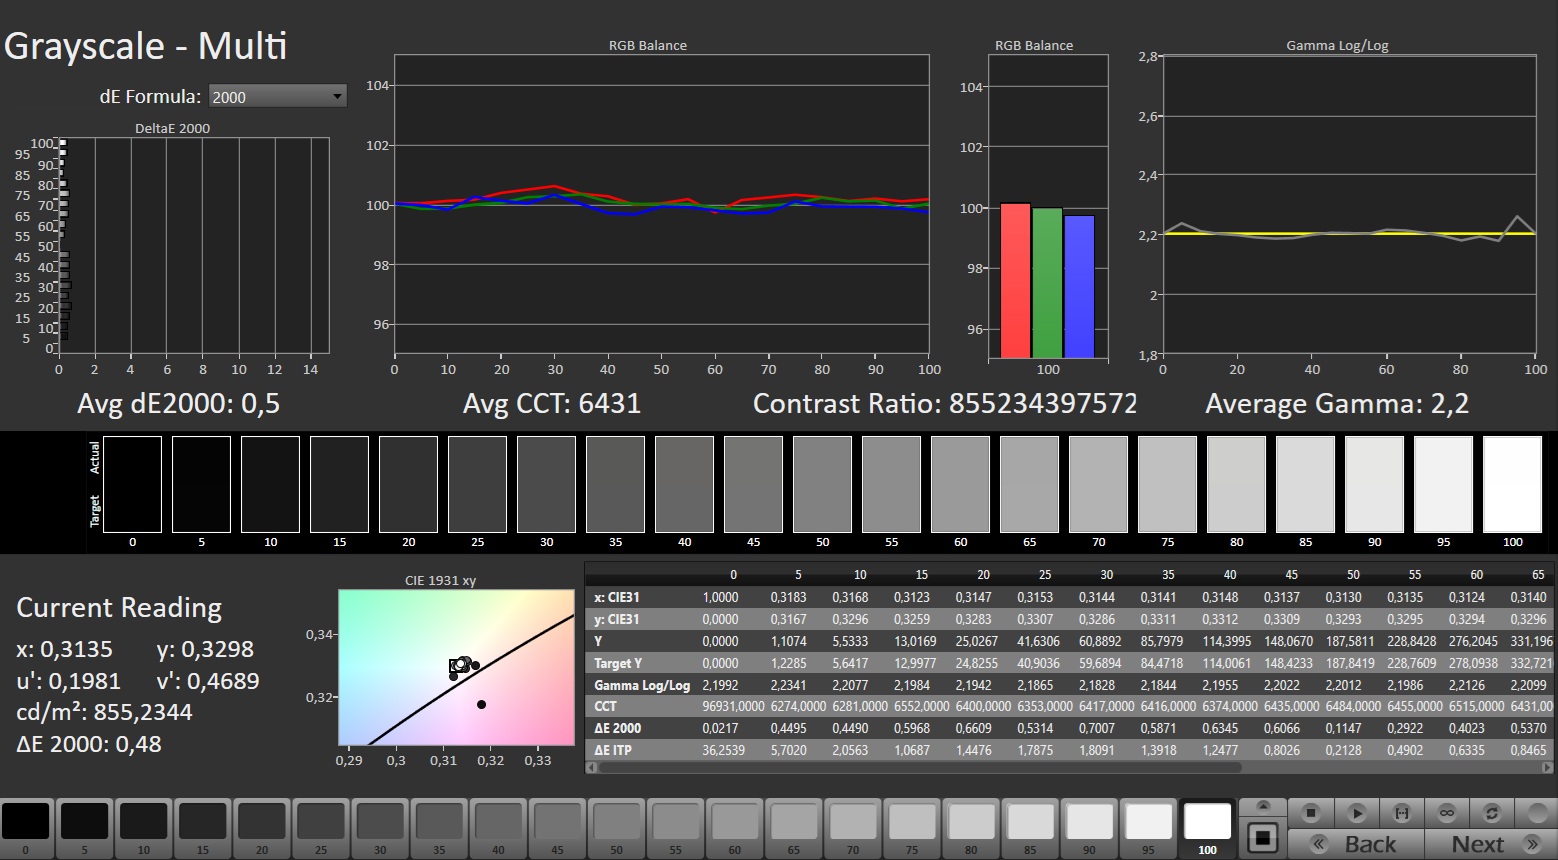
En combinaison avec le faible niveau de noir, il en résulte un excellent contraste. Les temps de réponse sont plus proches de ceux d'un écran IPS classique.
Malheureusement, l'écran a du mal à scintiller jusqu'à un niveau de luminosité de 92 %. Cependant, la fréquence est si élevée que même les personnes sensibles ne devraient pas avoir de problèmes.
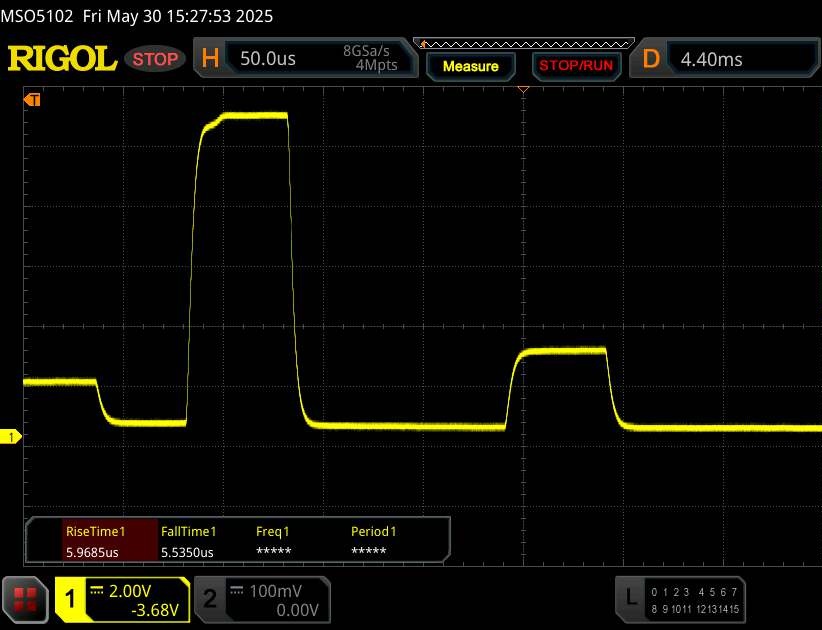
Temps de réponse de l'écran
| ↔ Temps de réponse noir à blanc | ||
|---|---|---|
| 8.6 ms ... hausse ↗ et chute ↘ combinées | ↗ 4.2 ms hausse | 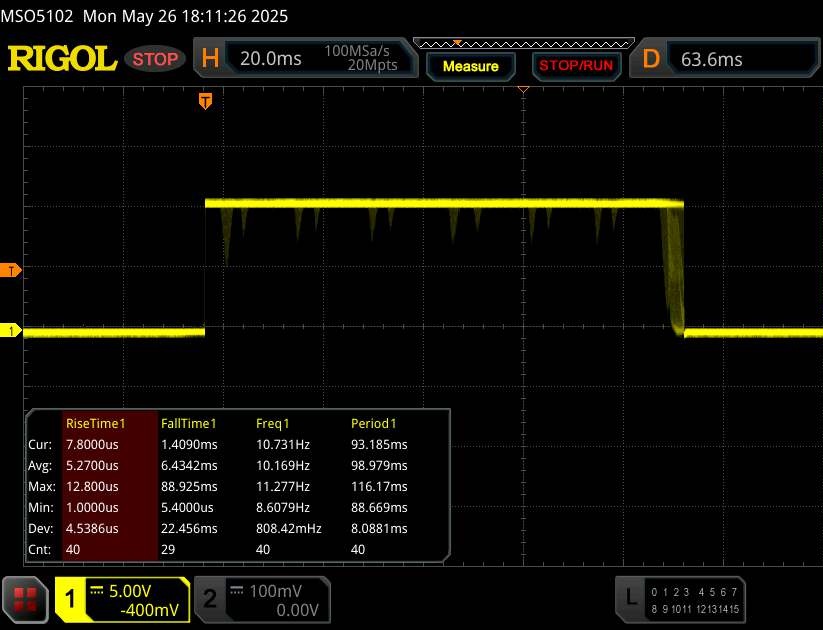 |
| ↘ 6.4 ms chute | ||
| L'écran montre de faibles temps de réponse, un bon écran pour jouer. En comparaison, tous les appareils testés affichent entre 0.1 (minimum) et 240 (maximum) ms. » 22 % des appareils testés affichent de meilleures performances. Cela signifie que les latences relevées sont meilleures que la moyenne (20.6 ms) de tous les appareils testés. | ||
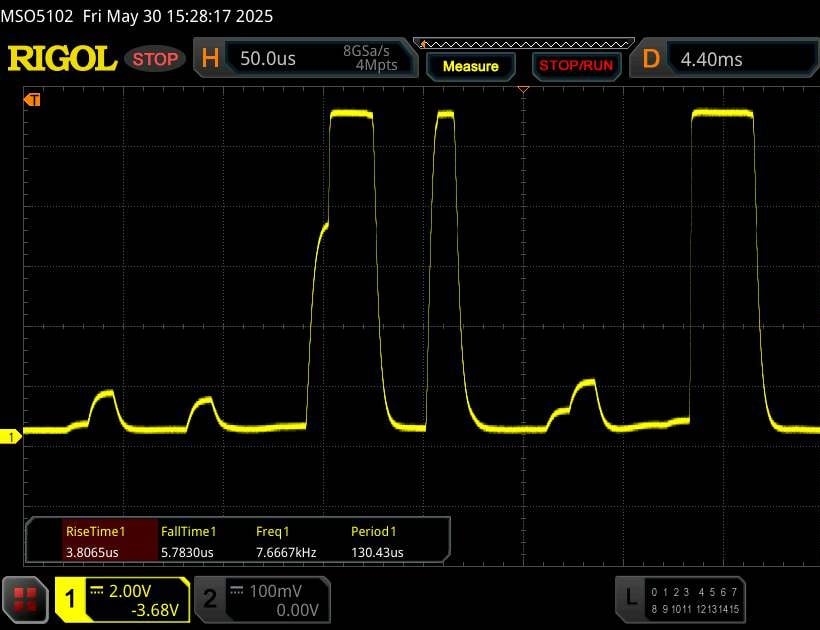
| ↔ Temps de réponse gris 50% à gris 80% | ||
| 10 ms ... hausse ↗ et chute ↘ combinées | ↗ 4.7 ms hausse | 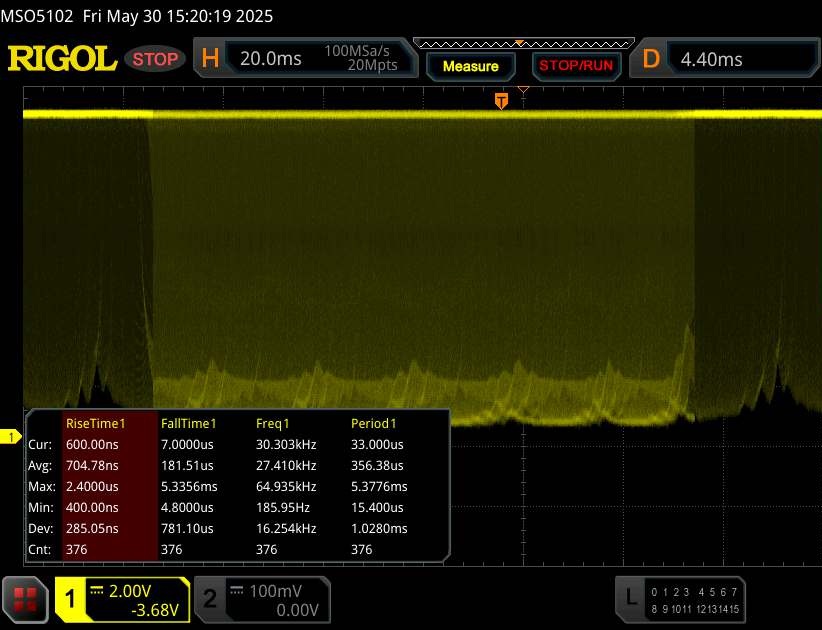 |
| ↘ 5.3 ms chute | ||
| L'écran montre de bons temps de réponse, mais insuffisant pour du jeu compétitif. En comparaison, tous les appareils testés affichent entre 0.165 (minimum) et 636 (maximum) ms. » 21 % des appareils testés affichent de meilleures performances. Cela signifie que les latences relevées sont meilleures que la moyenne (32.3 ms) de tous les appareils testés. | ||
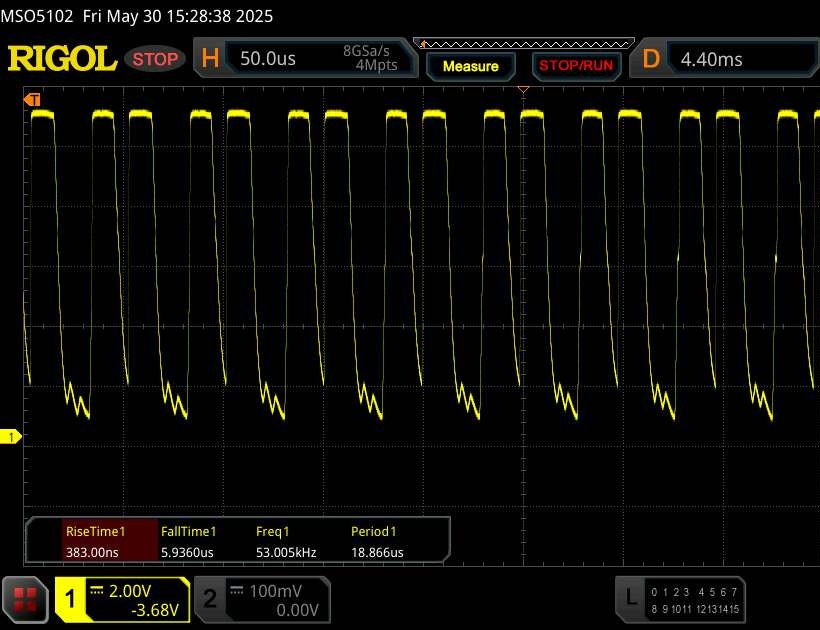
Scintillement / MLI (Modulation de largeur d'impulsion)
| Scintillement / MLI (Modulation de largeur d'impulsion) décelé | 20457 Hz Amplitude: 100 % | ≤ 92 Niveau de luminosité | 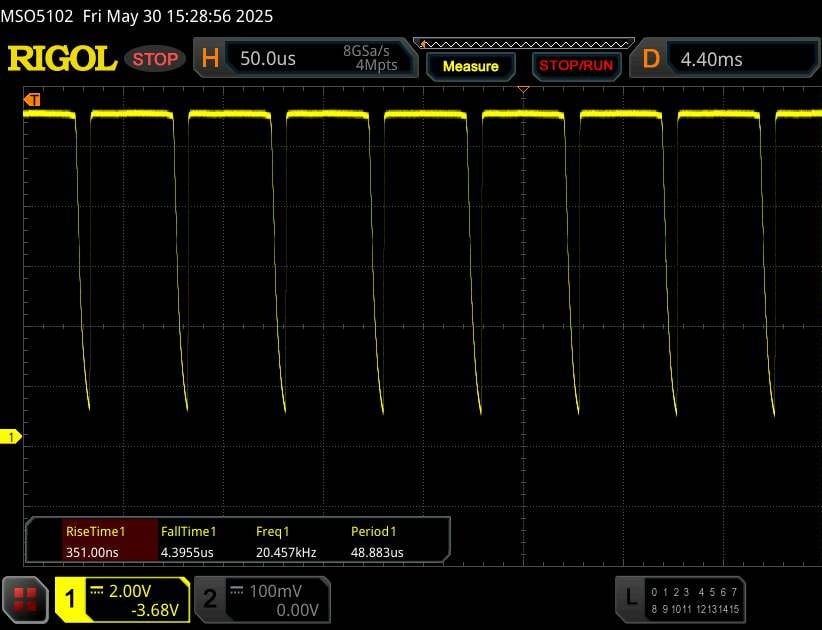 |
Le rétroéclairage de l'écran scintille à la fréquence de 20457 Hz (certainement du fait de l'utilisation d'une MDI - Modulation de largeur d'impulsion) à un niveau de luminosité inférieur ou égal à 92 % . Aucun scintillement ne devrait être perceptible au-dessus de cette valeur. La fréquence de rafraîchissement de 20457 Hz est élevée, la grande majorité des utilisateurs ne devrait pas percevoir de scintillements et être sujette à une fatigue oculaire accrue. En comparaison, 53 % des appareils testés n'emploient pas MDI pour assombrir leur écran. Nous avons relevé une moyenne à 8429 (minimum : 5 - maximum : 343500) Hz dans le cas où une MDI était active. | |||
Performance
La Beast 16 X1 est disponible avec la RTX 5090 Laptop soit avec la RTX 5080 et appartient donc au segment haut de gamme dans les deux cas. Avec ce dernier GPU, l'appareil coûte environ 1 000 euros (~1135 $) de moins, le supplément pour la version RTX 5090 étant proportionnellement élevé.
Conditions d'essai
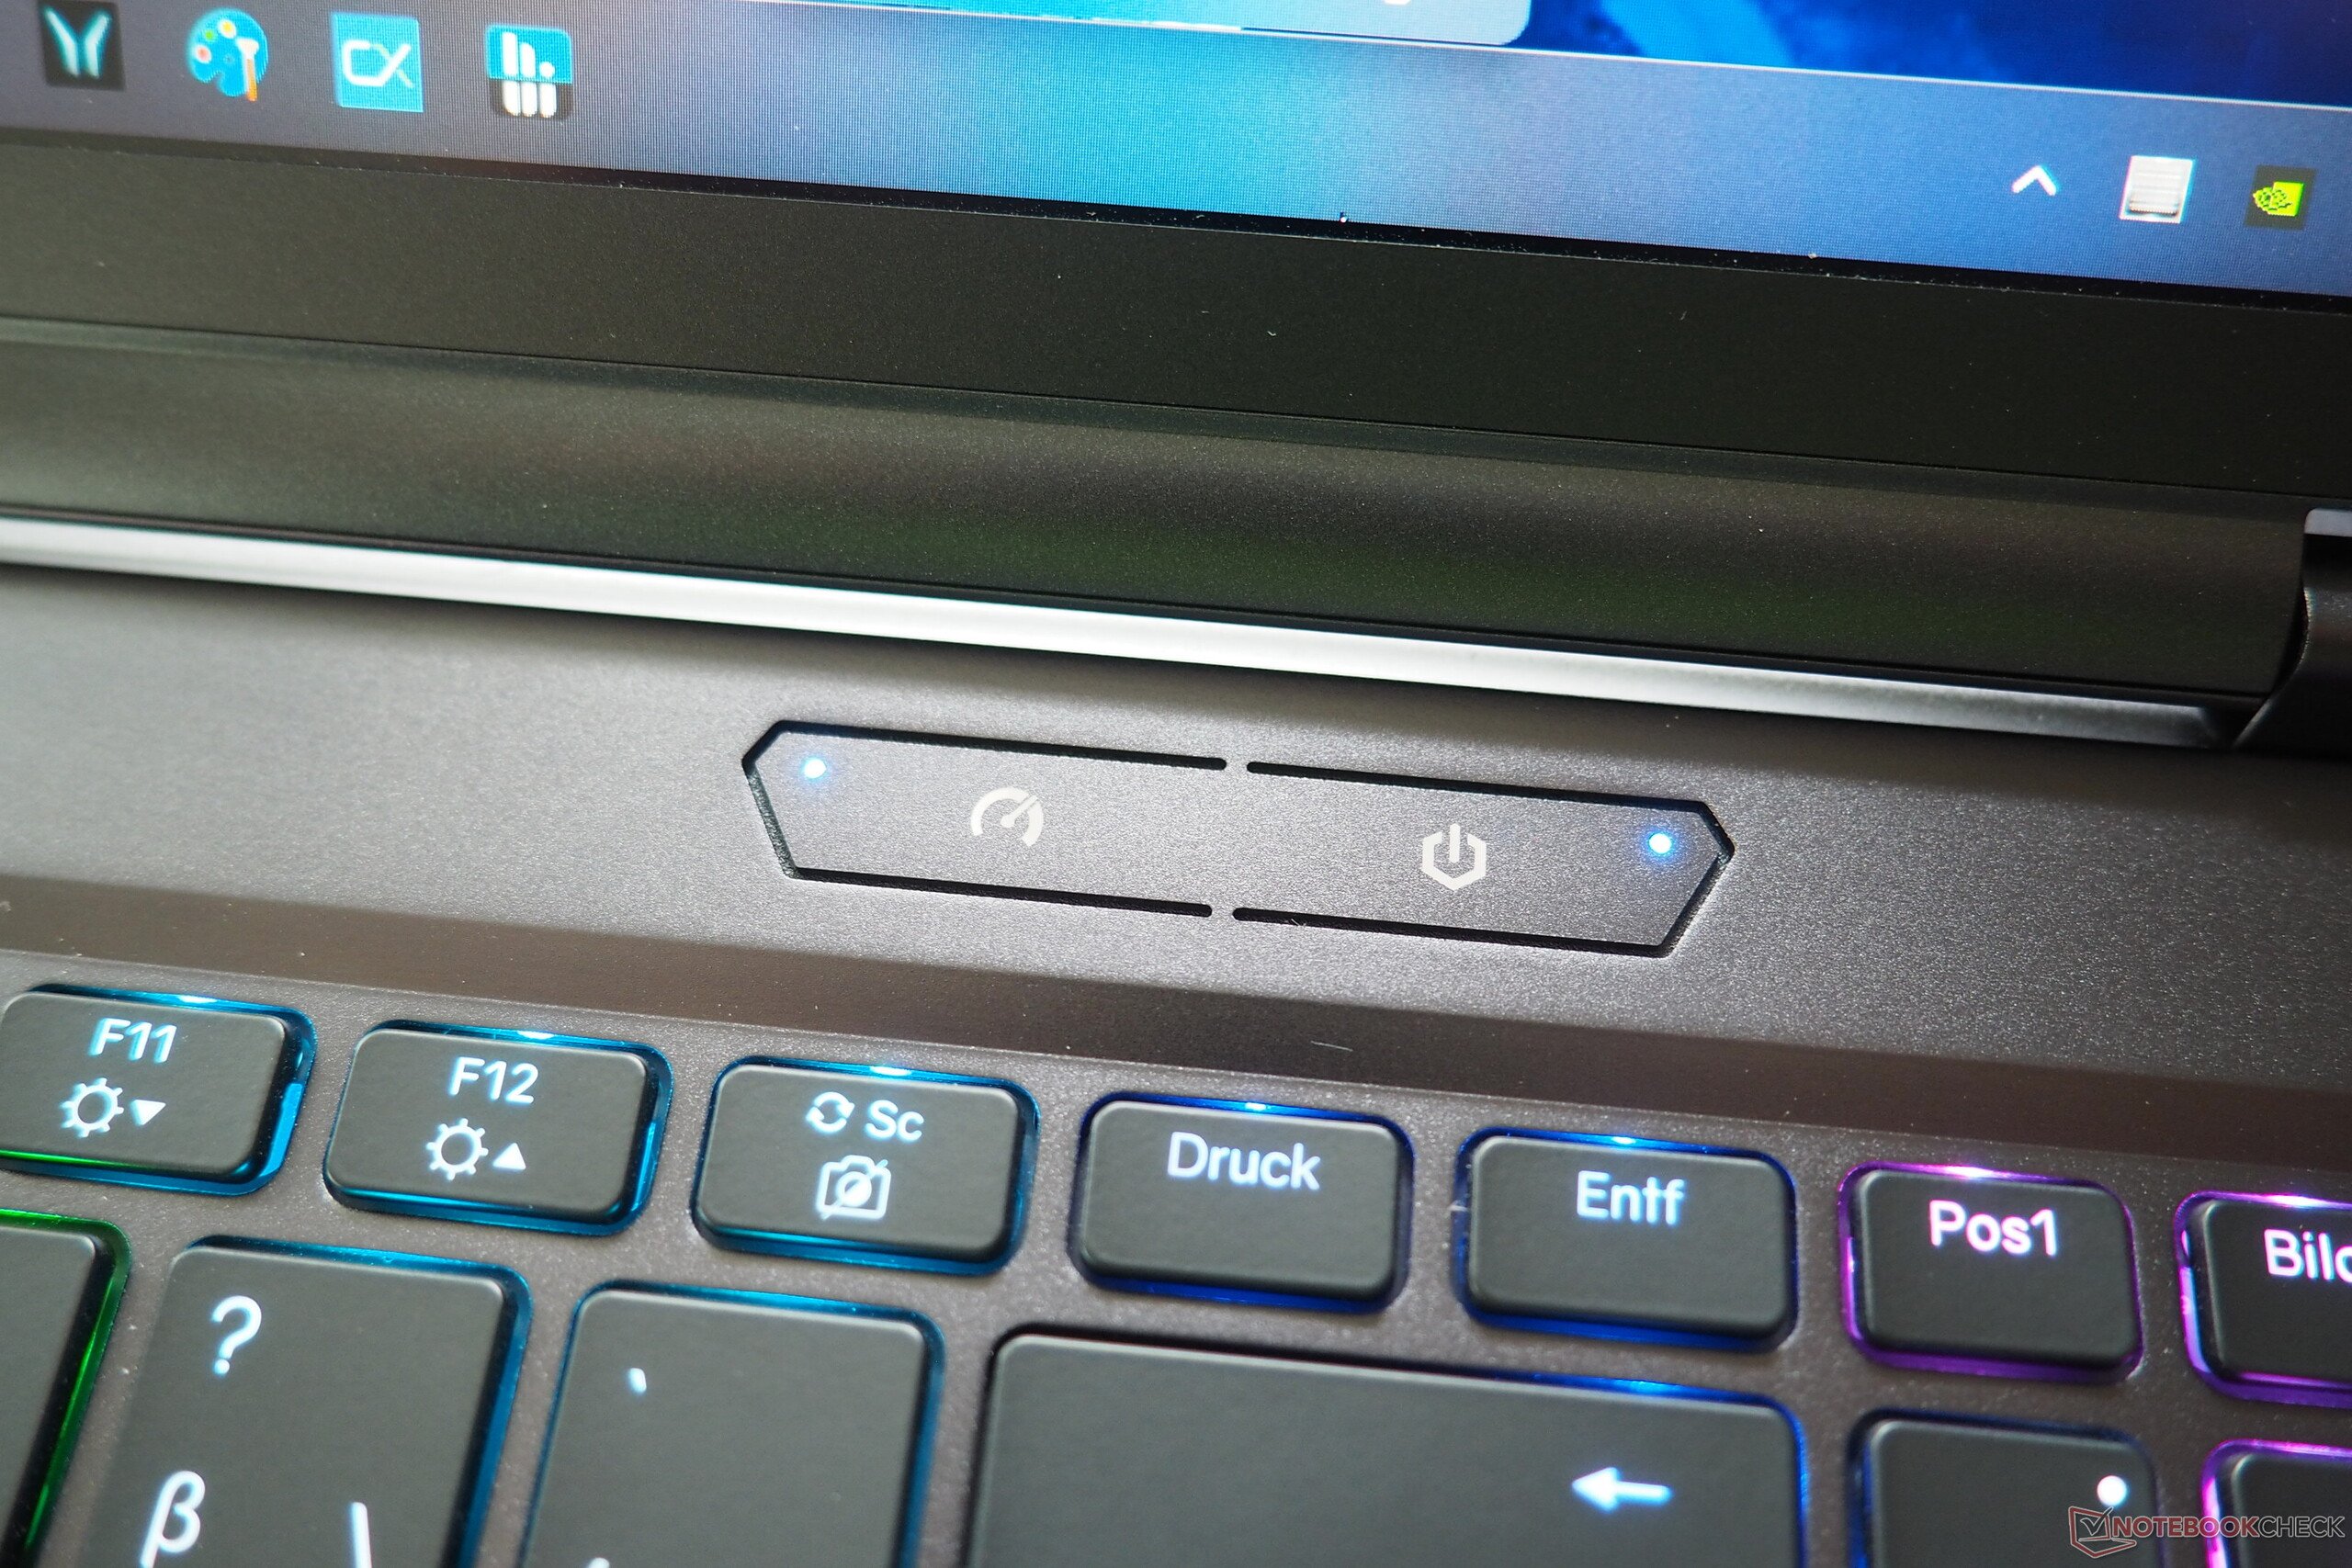
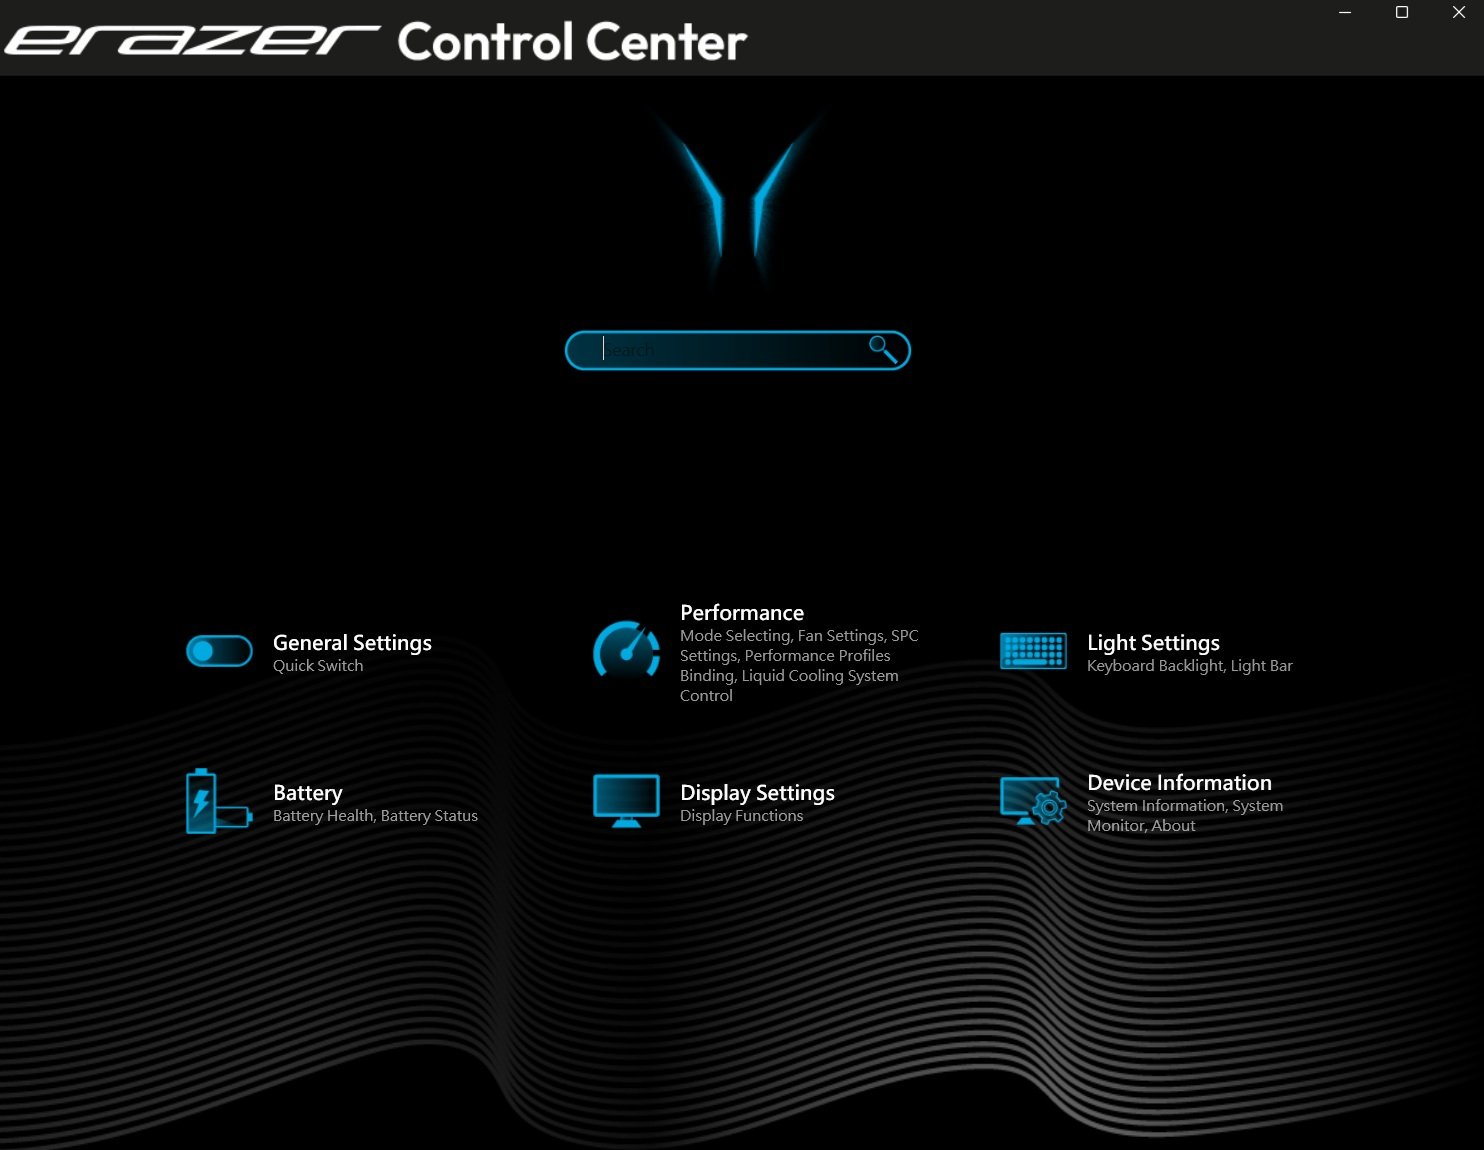
Pratique : Un bouton spécial (à côté du bouton d'alimentation) permet de passer rapidement d'un mode de fonctionnement à l'autre. le mode "Silence" s'allume en vert, le mode "Balance" en bleu et le mode "Gaming" en violet. Les effets sur le niveau sonore et les performances sont indiqués dans le tableau ci-dessous. À l'exception du test de la batterie, nos mesures ont été effectuées avec le profil Gaming. Il semble qu'il y ait encore un bug dans le centre de contrôle Erazer, qui peut également être utilisé pour changer de mode : Après le (re)démarrage de l'ordinateur portable, seul le profil Silent est sélectionné - du moins en ce qui concerne l'affichage.
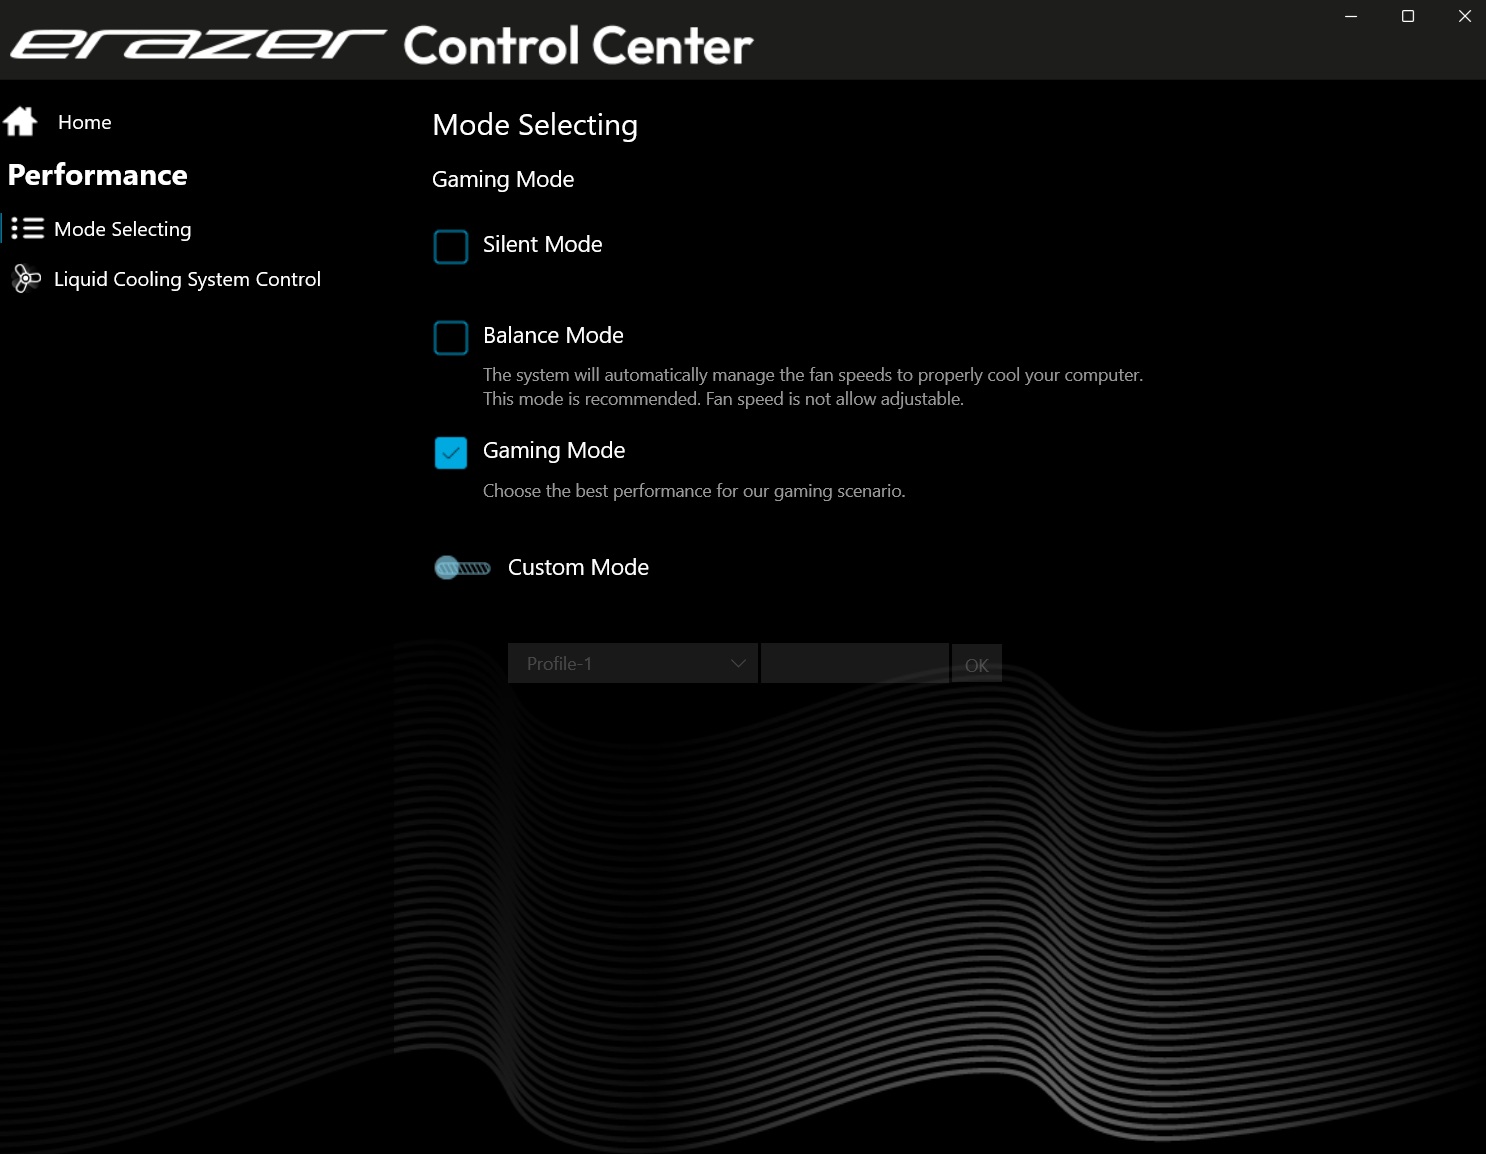
| Erazer Control Center Mode | Silence | Balance | Gaming |
| Cyberpunk 2077 Bruit | 42 dB(A) | 48 dB(A) | 55 dB(A) |
| Performances de Cyberpunk 2077 (FHD/Ultra) | 83,8 fps | 148,6 fps | 158,5 fps |
| Cinebench R15 Multi Score | 3318 Points | 4494 Points | 6067 Points |
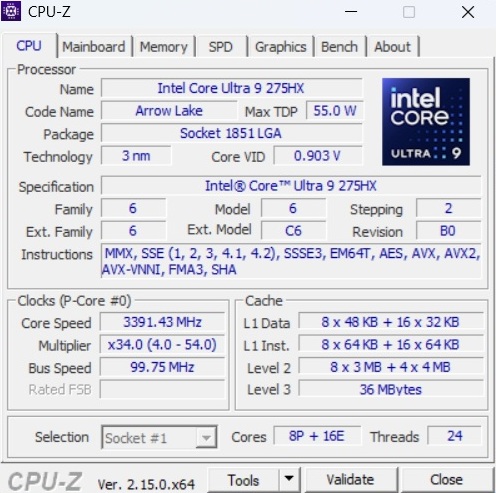
Processeur
L'Intel Core Ultra 9 275HX de la génération Arrow Lake laisse des sentiments mitigés dans la Beast 16 X1. À première vue, les résultats sont au niveau attendu, voire plus dans certains cas. Cependant, comme l'a montré notre boucle Cinebench, les performances baissent entre-temps en cas de charge prolongée, ce qui n'est pas le cas de la concurrence.
Cinebench R15 Multi Endurance test
* ... Moindre est la valeur, meilleures sont les performances
AIDA64: FP32 Ray-Trace | FPU Julia | CPU SHA3 | CPU Queen | FPU SinJulia | FPU Mandel | CPU AES | CPU ZLib | FP64 Ray-Trace | CPU PhotoWorxx
| Performance Rating | |
| SCHENKER XMG Neo 16 E25 RTX 5090 Laptop | |
| Asus ROG Strix Scar 16 2025 | |
| Asus ROG Strix G16 G615 | |
| Medion Erazer Beast 16 X1 Ultimate | |
| Lenovo Legion Pro 7i 16 Gen 10 | |
| Moyenne Intel Core Ultra 9 275HX | |
| HP Omen Max 16 ah000 | |
| Moyenne de la classe Gaming | |
| AIDA64 / FP32 Ray-Trace | |
| SCHENKER XMG Neo 16 E25 RTX 5090 Laptop | |
| Asus ROG Strix Scar 16 2025 | |
| Asus ROG Strix G16 G615 | |
| Medion Erazer Beast 16 X1 Ultimate | |
| Moyenne Intel Core Ultra 9 275HX (29330 - 39895, n=12) | |
| Lenovo Legion Pro 7i 16 Gen 10 | |
| HP Omen Max 16 ah000 | |
| Moyenne de la classe Gaming (7192 - 85542, n=144, 2 dernières années) | |
| AIDA64 / FPU Julia | |
| SCHENKER XMG Neo 16 E25 RTX 5090 Laptop | |
| Asus ROG Strix G16 G615 | |
| Asus ROG Strix Scar 16 2025 | |
| Medion Erazer Beast 16 X1 Ultimate | |
| Lenovo Legion Pro 7i 16 Gen 10 | |
| Moyenne Intel Core Ultra 9 275HX (140254 - 198802, n=12) | |
| HP Omen Max 16 ah000 | |
| Moyenne de la classe Gaming (35040 - 252486, n=144, 2 dernières années) | |
| AIDA64 / CPU SHA3 | |
| SCHENKER XMG Neo 16 E25 RTX 5090 Laptop | |
| Asus ROG Strix Scar 16 2025 | |
| Asus ROG Strix G16 G615 | |
| Medion Erazer Beast 16 X1 Ultimate | |
| Lenovo Legion Pro 7i 16 Gen 10 | |
| Moyenne Intel Core Ultra 9 275HX (6998 - 9734, n=12) | |
| HP Omen Max 16 ah000 | |
| Moyenne de la classe Gaming (1728 - 10389, n=144, 2 dernières années) | |
| AIDA64 / CPU Queen | |
| SCHENKER XMG Neo 16 E25 RTX 5090 Laptop | |
| Medion Erazer Beast 16 X1 Ultimate | |
| Asus ROG Strix Scar 16 2025 | |
| Asus ROG Strix G16 G615 | |
| Lenovo Legion Pro 7i 16 Gen 10 | |
| Moyenne Intel Core Ultra 9 275HX (113887 - 140695, n=12) | |
| HP Omen Max 16 ah000 | |
| Moyenne de la classe Gaming (50699 - 200651, n=144, 2 dernières années) | |
| AIDA64 / FPU SinJulia | |
| Medion Erazer Beast 16 X1 Ultimate | |
| SCHENKER XMG Neo 16 E25 RTX 5090 Laptop | |
| Lenovo Legion Pro 7i 16 Gen 10 | |
| Moyenne de la classe Gaming (5020 - 33636, n=144, 2 dernières années) | |
| Asus ROG Strix Scar 16 2025 | |
| Asus ROG Strix G16 G615 | |
| Moyenne Intel Core Ultra 9 275HX (11172 - 14415, n=12) | |
| HP Omen Max 16 ah000 | |
| AIDA64 / FPU Mandel | |
| Asus ROG Strix G16 G615 | |
| Asus ROG Strix Scar 16 2025 | |
| SCHENKER XMG Neo 16 E25 RTX 5090 Laptop | |
| Medion Erazer Beast 16 X1 Ultimate | |
| Lenovo Legion Pro 7i 16 Gen 10 | |
| Moyenne Intel Core Ultra 9 275HX (72596 - 104057, n=12) | |
| HP Omen Max 16 ah000 | |
| Moyenne de la classe Gaming (17585 - 134044, n=144, 2 dernières années) | |
| AIDA64 / CPU AES | |
| SCHENKER XMG Neo 16 E25 RTX 5090 Laptop | |
| Medion Erazer Beast 16 X1 Ultimate | |
| Asus ROG Strix G16 G615 | |
| Lenovo Legion Pro 7i 16 Gen 10 | |
| Asus ROG Strix Scar 16 2025 | |
| Moyenne Intel Core Ultra 9 275HX (107858 - 136847, n=12) | |
| HP Omen Max 16 ah000 | |
| Moyenne de la classe Gaming (19065 - 328679, n=144, 2 dernières années) | |
| AIDA64 / CPU ZLib | |
| SCHENKER XMG Neo 16 E25 RTX 5090 Laptop | |
| Medion Erazer Beast 16 X1 Ultimate | |
| Asus ROG Strix G16 G615 | |
| Asus ROG Strix Scar 16 2025 | |
| Lenovo Legion Pro 7i 16 Gen 10 | |
| Moyenne Intel Core Ultra 9 275HX (1757 - 2263, n=12) | |
| HP Omen Max 16 ah000 | |
| Moyenne de la classe Gaming (373 - 2531, n=144, 2 dernières années) | |
| AIDA64 / FP64 Ray-Trace | |
| Asus ROG Strix Scar 16 2025 | |
| Asus ROG Strix G16 G615 | |
| SCHENKER XMG Neo 16 E25 RTX 5090 Laptop | |
| Medion Erazer Beast 16 X1 Ultimate | |
| Lenovo Legion Pro 7i 16 Gen 10 | |
| Moyenne Intel Core Ultra 9 275HX (14847 - 21372, n=12) | |
| HP Omen Max 16 ah000 | |
| Moyenne de la classe Gaming (3856 - 45446, n=144, 2 dernières années) | |
| AIDA64 / CPU PhotoWorxx | |
| Asus ROG Strix Scar 16 2025 | |
| SCHENKER XMG Neo 16 E25 RTX 5090 Laptop | |
| Lenovo Legion Pro 7i 16 Gen 10 | |
| Moyenne Intel Core Ultra 9 275HX (47726 - 56613, n=12) | |
| Medion Erazer Beast 16 X1 Ultimate | |
| HP Omen Max 16 ah000 | |
| Asus ROG Strix G16 G615 | |
| Moyenne de la classe Gaming (10805 - 62274, n=144, 2 dernières années) | |
Performance du système
En ce qui concerne les performances du système, l'ordinateur portable Medion occupe la première place du classement général.
PCMark 10: Score | Essentials | Productivity | Digital Content Creation
CrossMark: Overall | Productivity | Creativity | Responsiveness
WebXPRT 3: Overall
WebXPRT 4: Overall
Mozilla Kraken 1.1: Total
| Performance Rating | |
| SCHENKER XMG Neo 16 E25 RTX 5090 Laptop | |
| Asus ROG Strix G16 G615 | |
| Moyenne Intel Core Ultra 9 275HX, Nvidia GeForce RTX 5090 Laptop | |
| Asus ROG Strix Scar 16 2025 | |
| Medion Erazer Beast 16 X1 Ultimate | |
| Lenovo Legion Pro 7i 16 Gen 10 | |
| HP Omen Max 16 ah000 -1! | |
| Moyenne de la classe Gaming | |
| PCMark 10 / Score | |
| Lenovo Legion Pro 7i 16 Gen 10 | |
| SCHENKER XMG Neo 16 E25 RTX 5090 Laptop | |
| Asus ROG Strix G16 G615 | |
| Asus ROG Strix Scar 16 2025 | |
| HP Omen Max 16 ah000 | |
| Moyenne Intel Core Ultra 9 275HX, Nvidia GeForce RTX 5090 Laptop (8241 - 9032, n=7) | |
| Medion Erazer Beast 16 X1 Ultimate | |
| Moyenne de la classe Gaming (5776 - 9852, n=131, 2 dernières années) | |
| PCMark 10 / Essentials | |
| Medion Erazer Beast 16 X1 Ultimate | |
| Lenovo Legion Pro 7i 16 Gen 10 | |
| Asus ROG Strix G16 G615 | |
| SCHENKER XMG Neo 16 E25 RTX 5090 Laptop | |
| Asus ROG Strix Scar 16 2025 | |
| HP Omen Max 16 ah000 | |
| Moyenne Intel Core Ultra 9 275HX, Nvidia GeForce RTX 5090 Laptop (9994 - 11369, n=7) | |
| Moyenne de la classe Gaming (9057 - 12600, n=131, 2 dernières années) | |
| PCMark 10 / Productivity | |
| Moyenne de la classe Gaming (6662 - 14612, n=131, 2 dernières années) | |
| Lenovo Legion Pro 7i 16 Gen 10 | |
| Medion Erazer Beast 16 X1 Ultimate | |
| SCHENKER XMG Neo 16 E25 RTX 5090 Laptop | |
| Moyenne Intel Core Ultra 9 275HX, Nvidia GeForce RTX 5090 Laptop (9122 - 9515, n=7) | |
| Asus ROG Strix G16 G615 | |
| Asus ROG Strix Scar 16 2025 | |
| HP Omen Max 16 ah000 | |
| PCMark 10 / Digital Content Creation | |
| Lenovo Legion Pro 7i 16 Gen 10 | |
| SCHENKER XMG Neo 16 E25 RTX 5090 Laptop | |
| HP Omen Max 16 ah000 | |
| Asus ROG Strix G16 G615 | |
| Asus ROG Strix Scar 16 2025 | |
| Moyenne Intel Core Ultra 9 275HX, Nvidia GeForce RTX 5090 Laptop (15507 - 19227, n=7) | |
| Medion Erazer Beast 16 X1 Ultimate | |
| Moyenne de la classe Gaming (7440 - 19351, n=131, 2 dernières années) | |
| CrossMark / Overall | |
| SCHENKER XMG Neo 16 E25 RTX 5090 Laptop | |
| Medion Erazer Beast 16 X1 Ultimate | |
| Moyenne Intel Core Ultra 9 275HX, Nvidia GeForce RTX 5090 Laptop (1995 - 2282, n=7) | |
| Asus ROG Strix G16 G615 | |
| Asus ROG Strix Scar 16 2025 | |
| Lenovo Legion Pro 7i 16 Gen 10 | |
| HP Omen Max 16 ah000 | |
| Moyenne de la classe Gaming (1247 - 2344, n=113, 2 dernières années) | |
| CrossMark / Productivity | |
| SCHENKER XMG Neo 16 E25 RTX 5090 Laptop | |
| Medion Erazer Beast 16 X1 Ultimate | |
| Moyenne Intel Core Ultra 9 275HX, Nvidia GeForce RTX 5090 Laptop (1847 - 2119, n=7) | |
| Asus ROG Strix G16 G615 | |
| Asus ROG Strix Scar 16 2025 | |
| Lenovo Legion Pro 7i 16 Gen 10 | |
| HP Omen Max 16 ah000 | |
| Moyenne de la classe Gaming (1299 - 2204, n=113, 2 dernières années) | |
| CrossMark / Creativity | |
| SCHENKER XMG Neo 16 E25 RTX 5090 Laptop | |
| Medion Erazer Beast 16 X1 Ultimate | |
| Asus ROG Strix Scar 16 2025 | |
| Moyenne Intel Core Ultra 9 275HX, Nvidia GeForce RTX 5090 Laptop (2285 - 2612, n=7) | |
| Asus ROG Strix G16 G615 | |
| Lenovo Legion Pro 7i 16 Gen 10 | |
| HP Omen Max 16 ah000 | |
| Moyenne de la classe Gaming (1275 - 2729, n=113, 2 dernières années) | |
| CrossMark / Responsiveness | |
| Moyenne Intel Core Ultra 9 275HX, Nvidia GeForce RTX 5090 Laptop (1673 - 2181, n=7) | |
| SCHENKER XMG Neo 16 E25 RTX 5090 Laptop | |
| Asus ROG Strix G16 G615 | |
| Medion Erazer Beast 16 X1 Ultimate | |
| Moyenne de la classe Gaming (1030 - 2330, n=113, 2 dernières années) | |
| Asus ROG Strix Scar 16 2025 | |
| HP Omen Max 16 ah000 | |
| Lenovo Legion Pro 7i 16 Gen 10 | |
| WebXPRT 3 / Overall | |
| HP Omen Max 16 ah000 | |
| Lenovo Legion Pro 7i 16 Gen 10 | |
| SCHENKER XMG Neo 16 E25 RTX 5090 Laptop | |
| Asus ROG Strix G16 G615 | |
| Asus ROG Strix Scar 16 2025 | |
| Moyenne Intel Core Ultra 9 275HX, Nvidia GeForce RTX 5090 Laptop (315 - 359, n=7) | |
| Medion Erazer Beast 16 X1 Ultimate | |
| Moyenne de la classe Gaming (215 - 480, n=125, 2 dernières années) | |
| WebXPRT 4 / Overall | |
| Asus ROG Strix Scar 16 2025 | |
| Asus ROG Strix G16 G615 | |
| Medion Erazer Beast 16 X1 Ultimate | |
| Lenovo Legion Pro 7i 16 Gen 10 | |
| SCHENKER XMG Neo 16 E25 RTX 5090 Laptop | |
| Moyenne Intel Core Ultra 9 275HX, Nvidia GeForce RTX 5090 Laptop (317 - 337, n=6) | |
| Moyenne de la classe Gaming (176.4 - 341, n=113, 2 dernières années) | |
| Mozilla Kraken 1.1 / Total | |
| Moyenne de la classe Gaming (397 - 674, n=135, 2 dernières années) | |
| HP Omen Max 16 ah000 | |
| Asus ROG Strix Scar 16 2025 | |
| Moyenne Intel Core Ultra 9 275HX, Nvidia GeForce RTX 5090 Laptop (404 - 420, n=7) | |
| Medion Erazer Beast 16 X1 Ultimate | |
| Lenovo Legion Pro 7i 16 Gen 10 | |
| Asus ROG Strix G16 G615 | |
| SCHENKER XMG Neo 16 E25 RTX 5090 Laptop | |
* ... Moindre est la valeur, meilleures sont les performances
| PCMark 10 Score | 8518 points | |
Aide | ||
| AIDA64 / Memory Copy | |
| SCHENKER XMG Neo 16 E25 RTX 5090 Laptop | |
| Asus ROG Strix G16 G615 | |
| Lenovo Legion Pro 7i 16 Gen 10 | |
| Asus ROG Strix Scar 16 2025 | |
| Moyenne Intel Core Ultra 9 275HX (74558 - 86978, n=12) | |
| Medion Erazer Beast 16 X1 Ultimate | |
| HP Omen Max 16 ah000 | |
| Moyenne de la classe Gaming (21750 - 97515, n=144, 2 dernières années) | |
| AIDA64 / Memory Read | |
| SCHENKER XMG Neo 16 E25 RTX 5090 Laptop | |
| Lenovo Legion Pro 7i 16 Gen 10 | |
| Moyenne Intel Core Ultra 9 275HX (74094 - 97151, n=12) | |
| Asus ROG Strix Scar 16 2025 | |
| Medion Erazer Beast 16 X1 Ultimate | |
| HP Omen Max 16 ah000 | |
| Asus ROG Strix G16 G615 | |
| Moyenne de la classe Gaming (22956 - 103347, n=144, 2 dernières années) | |
| AIDA64 / Memory Write | |
| SCHENKER XMG Neo 16 E25 RTX 5090 Laptop | |
| Lenovo Legion Pro 7i 16 Gen 10 | |
| Asus ROG Strix Scar 16 2025 | |
| Moyenne Intel Core Ultra 9 275HX (72929 - 85648, n=12) | |
| HP Omen Max 16 ah000 | |
| Medion Erazer Beast 16 X1 Ultimate | |
| Asus ROG Strix G16 G615 | |
| Moyenne de la classe Gaming (22297 - 108954, n=144, 2 dernières années) | |
| AIDA64 / Memory Latency | |
| HP Omen Max 16 ah000 | |
| Moyenne Intel Core Ultra 9 275HX (105.8 - 131.1, n=12) | |
| Asus ROG Strix G16 G615 | |
| Asus ROG Strix Scar 16 2025 | |
| Medion Erazer Beast 16 X1 Ultimate | |
| Lenovo Legion Pro 7i 16 Gen 10 | |
| SCHENKER XMG Neo 16 E25 RTX 5090 Laptop | |
| Moyenne de la classe Gaming (59.5 - 259, n=144, 2 dernières années) | |
* ... Moindre est la valeur, meilleures sont les performances
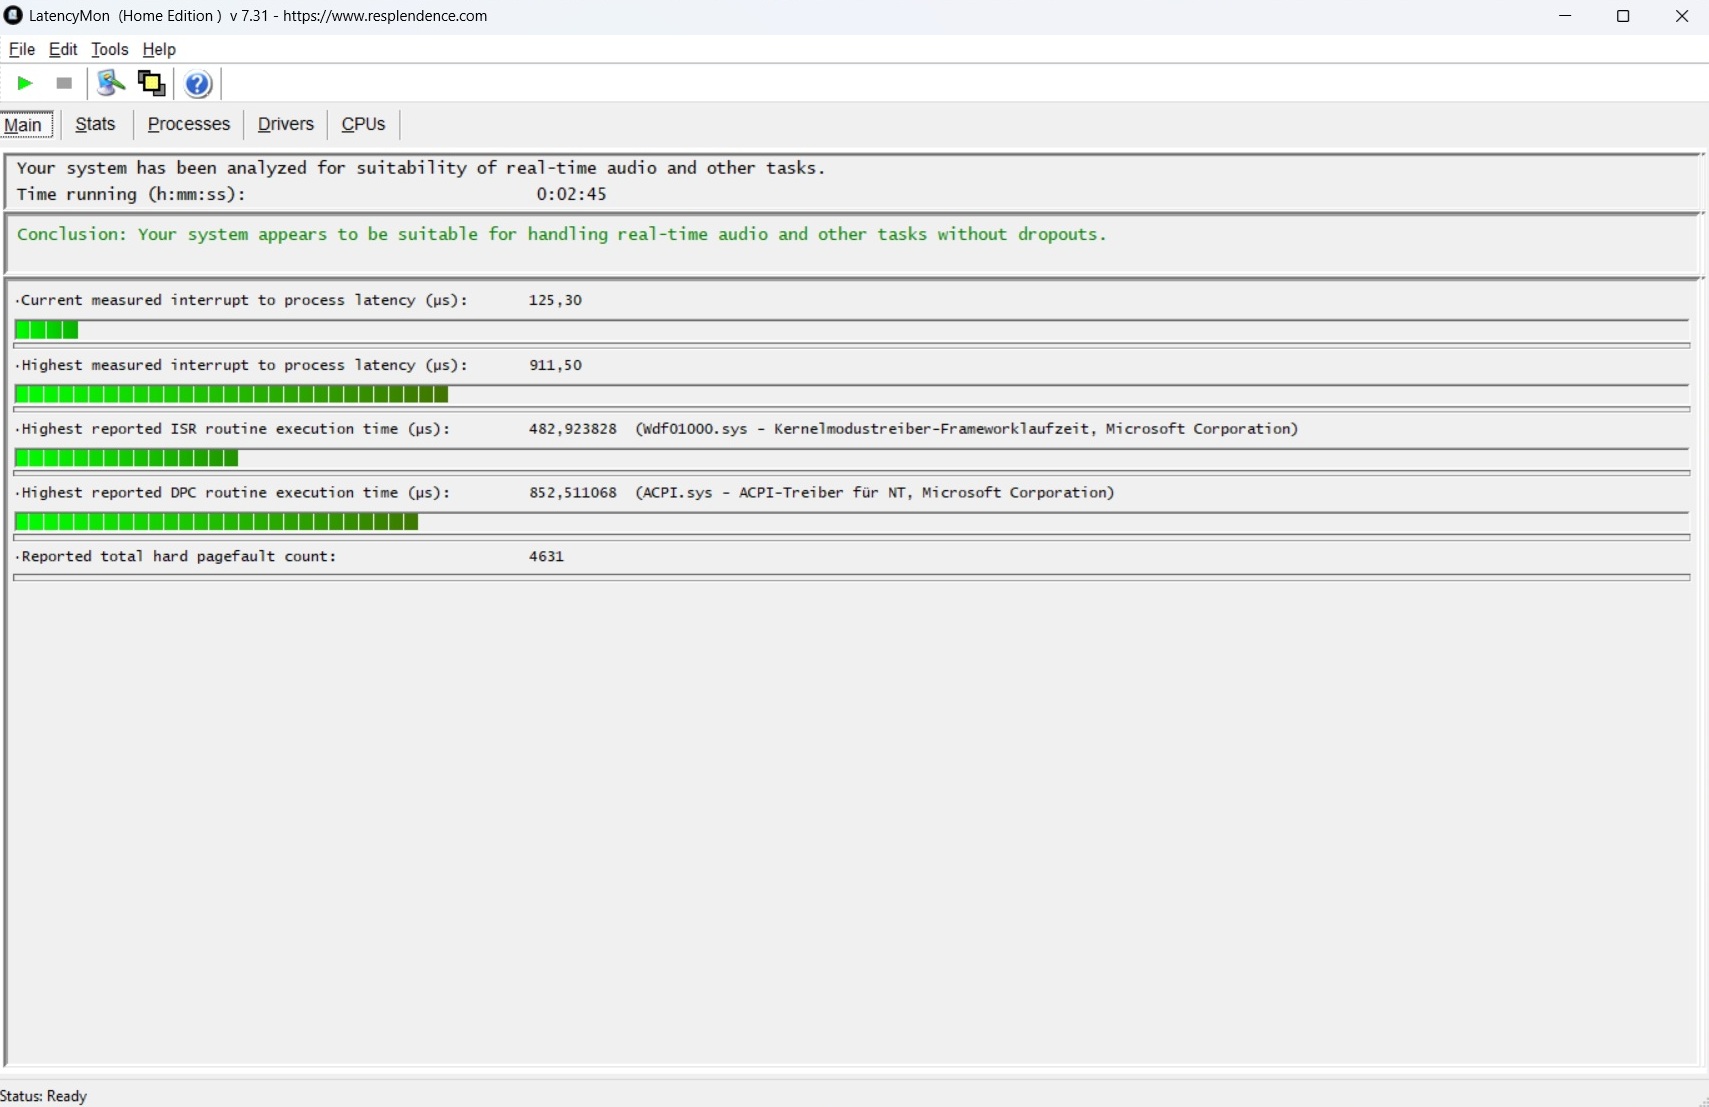
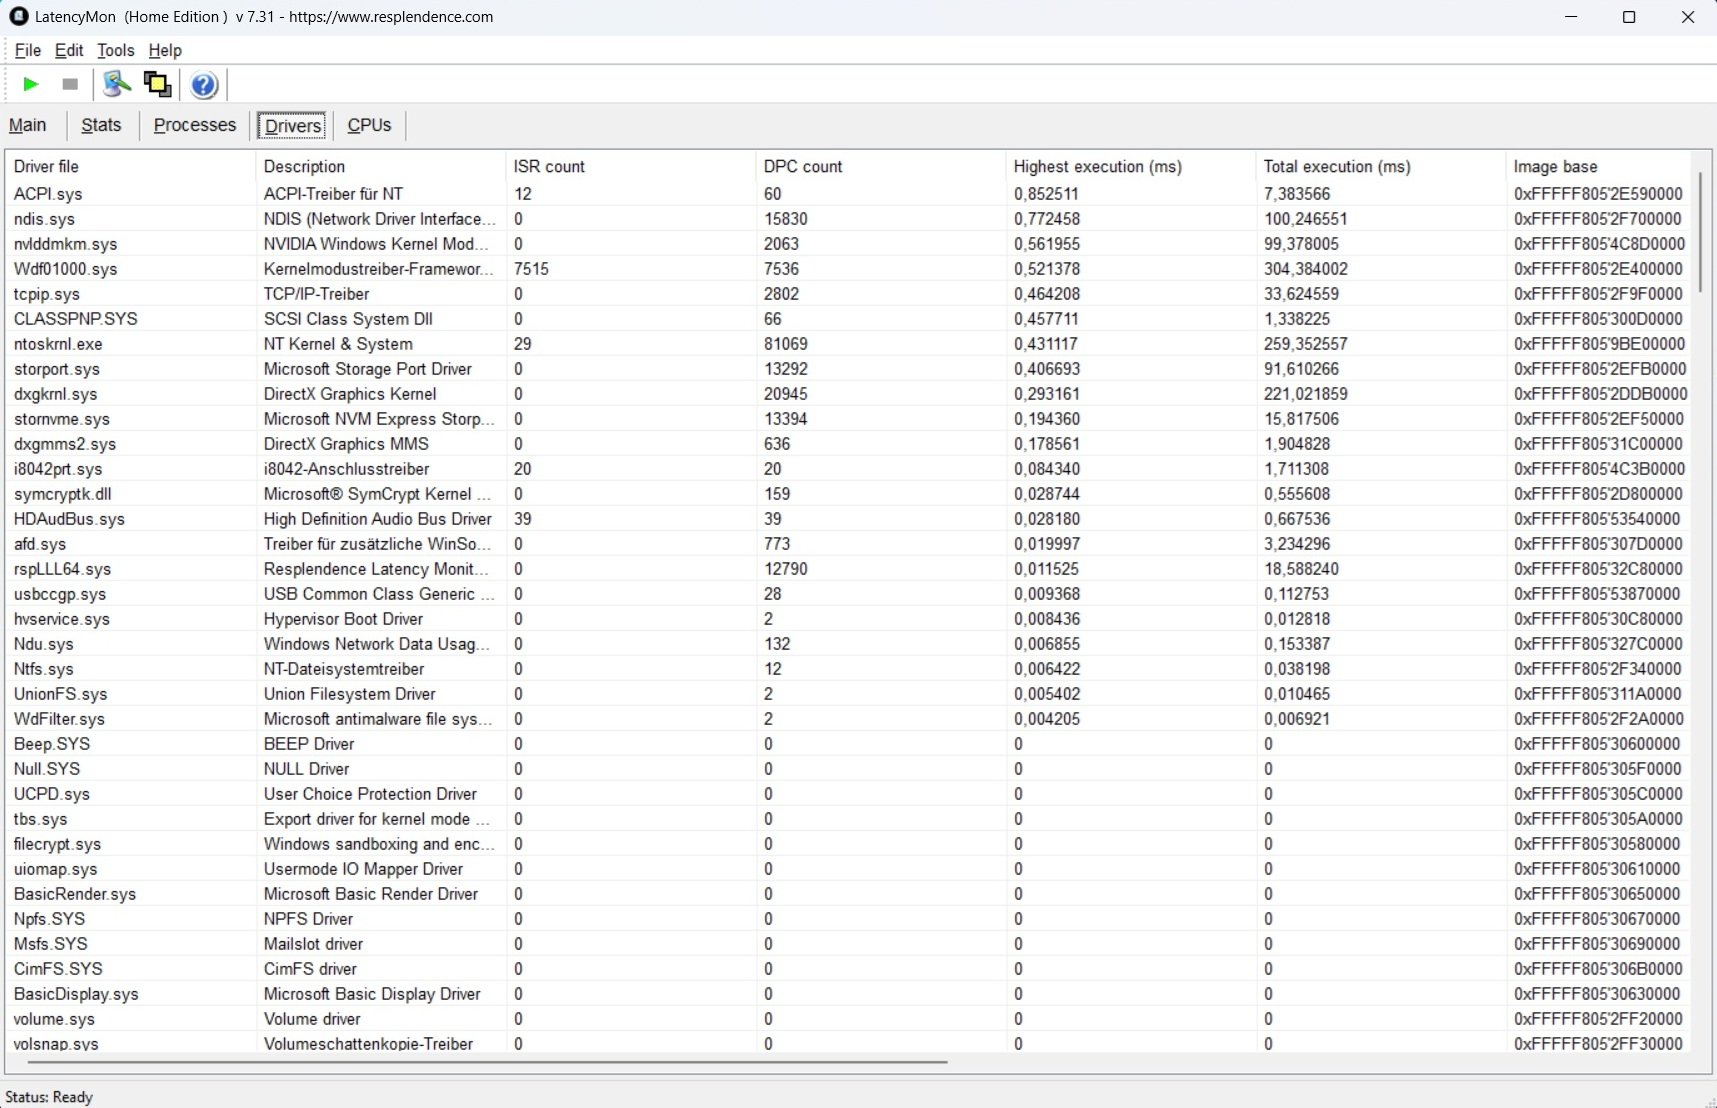
Latences DPC
Les latences ne donnent pas non plus lieu à réclamation. Selon l'outil LatencyMon, le traitement audio et vidéo en temps réel ne devrait poser aucun problème.
| DPC Latencies / LatencyMon - interrupt to process latency (max), Web, Youtube, Prime95 | |
| Asus ROG Strix Scar 16 2025 | |
| HP Omen Max 16 ah000 | |
| Asus ROG Strix G16 G615 | |
| SCHENKER XMG Neo 16 E25 RTX 5090 Laptop | |
| Medion Erazer Beast 16 X1 Ultimate | |
| Lenovo Legion Pro 7i 16 Gen 10 | |
* ... Moindre est la valeur, meilleures sont les performances
Mémoire de masse
Le stockage de masse est également impressionnant. Séquentiellement, le disque PCIe 5 intégré de Phison atteint au mieux environ 10 000 Mo/s, bien que l'on puisse s'attendre à un modèle de 4 To au lieu de 2 To pour le prix. Top : Contrairement aux performances du CPU, celles du SSD restent stables.

* ... Moindre est la valeur, meilleures sont les performances
Continuous Power: DiskSpd Read Loop, Queue Depth 8
Performance du GPU
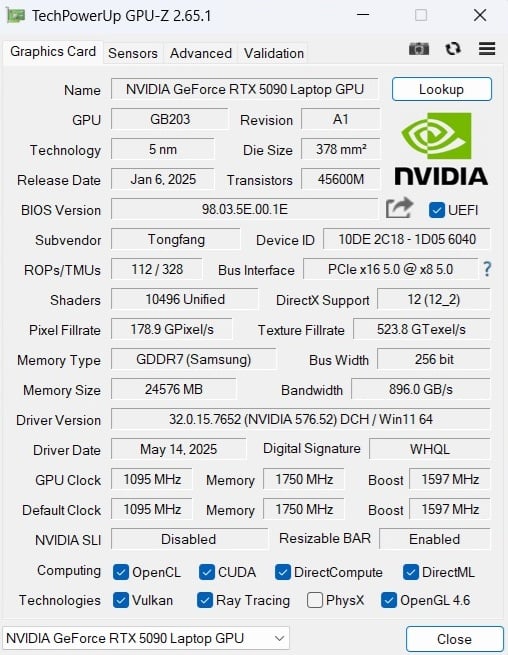
Par rapport à la RTX 5080, la RTX 5090 offre 24 Go de VRAM GDDR7 au lieu de 16 Go. Dans les tests GPU, la Beast 16 X1 fournit une très bonne performance et est souvent en avance de quelques pourcents sur la concurrence ou sur la moyenne déterminée précédemment pour la RTX 5090. Cependant, la RTX 5080 n'est que partiellement distancée par ses adversaires.
| 3DMark 11 Performance | 54178 points | |
| 3DMark Cloud Gate Standard Score | 75355 points | |
| 3DMark Fire Strike Score | 42189 points | |
| 3DMark Time Spy Score | 22368 points | |
Aide | ||
Performances des jeux
La situation est similaire dans les tests de jeu. Ici aussi, la RTX 5090 est parfois à peine plus rapide que la RTX 5080, surtout à des résolutions modérées (Full HD).
| Cyberpunk 2077 2.2 Phantom Liberty - 1920x1080 Ultra Preset (FSR off) | |
| Medion Erazer Beast 16 X1 Ultimate | |
| Lenovo Legion Pro 7i 16 Gen 10 | |
| SCHENKER XMG Neo 16 E25 RTX 5090 Laptop | |
| Asus ROG Strix Scar 16 2025 | |
| HP Omen Max 16 ah000 | |
| Moyenne Nvidia GeForce RTX 5090 Laptop (105.3 - 167.3, n=13) | |
| Asus ROG Strix G16 G615 | |
| Moyenne de la classe Gaming (6.76 - 164, n=108, 2 dernières années) | |
| GTA V - 1920x1080 Highest Settings possible AA:4xMSAA + FX AF:16x | |
| Asus ROG Strix G16 G615 | |
| SCHENKER XMG Neo 16 E25 RTX 5090 Laptop | |
| Asus ROG Strix Scar 16 2025 | |
| Moyenne Nvidia GeForce RTX 5090 Laptop (121.6 - 186.9, n=10) | |
| Medion Erazer Beast 16 X1 Ultimate | |
| Moyenne de la classe Gaming (12.1 - 186.9, n=123, 2 dernières années) | |
Lorsque vous utilisez des résolutions QHD, les distances augmentent et il reste généralement assez de réserves pour les paramètres maximums. Parmi les jeux testés, seuls F1 25 (avec traçage des chemins) et le jeu modérément optimisé Oblivion Remastered n'ont pas dépassé la barre des 60 FPS. Si les choses se gâtent à l'avenir, l'upscaling et la génération (multi) d'images peuvent aider. Les augmentations de performances qui peuvent en résulter sont indiquées dans le tableau ci-dessous ; en incluant DLSS Quality et FG, le taux d'images par seconde double dans Stalker 2 par exemple.
| Doom: The Dark Ages | |
| 2560x1440 Ultra Nightmare AA:T | |
| Medion Erazer Beast 16 X1 Ultimate | |
| Moyenne Nvidia GeForce RTX 5090 Laptop (77 - 82.1, n=2) | |
| Moyenne de la classe Gaming (41 - 82.1, n=5, 2 dernières années) | |
| Asus ROG Strix G16 G615 | |
| 2560x1440 Ultra Nightmare - DLSS Quality | |
| Medion Erazer Beast 16 X1 Ultimate | |
| Moyenne Nvidia GeForce RTX 5090 Laptop (102.3 - 107.3, n=2) | |
| Moyenne de la classe Gaming (89.1 - 107.3, n=4, 2 dernières années) | |
| Asus ROG Strix G16 G615 | |
| F1 25 | |
| 2560x1440 Ultra Max Preset AA:T AF:16x | |
| Moyenne Nvidia GeForce RTX 5090 Laptop (34 - 36.8, n=4) | |
| Medion Erazer Beast 16 X1 Ultimate | |
| Moyenne de la classe Gaming (21.3 - 36.8, n=4, 2 dernières années) | |
| 2560x1440 Ultra Max Preset + DLSS Quality AA:DLSS AF:16x | |
| Moyenne Nvidia GeForce RTX 5090 Laptop (61 - 64, n=2) | |
| Medion Erazer Beast 16 X1 Ultimate | |
| Moyenne de la classe Gaming (39.3 - 64, n=3, 2 dernières années) | |
| The Elder Scrolls IV Oblivion Remastered | |
| 2560x1440 Ultra Preset AA:T | |
| Medion Erazer Beast 16 X1 Ultimate | |
| Moyenne Nvidia GeForce RTX 5090 Laptop (n=1) | |
| Moyenne de la classe Gaming (36.6 - 41.7, n=2, 2 dernières années) | |
| 2560x1440 Ultra Preset + Quality DLSS | |
| Medion Erazer Beast 16 X1 Ultimate | |
| Moyenne Nvidia GeForce RTX 5090 Laptop (n=1) | |
| Moyenne de la classe Gaming (53.2 - 59.7, n=2, 2 dernières années) | |
| Kingdom Come Deliverance 2 | |
| 2560x1440 Ultra Preset | |
| Medion Erazer Beast 16 X1 Ultimate | |
| Moyenne Nvidia GeForce RTX 5090 Laptop (82.6 - 86, n=2) | |
| Aorus Master 18 AM8H | |
| Moyenne de la classe Gaming (74.5 - 86, n=3, 2 dernières années) | |
| 2560x1440 Ultra Preset + Quality DLSS | |
| Medion Erazer Beast 16 X1 Ultimate | |
| Moyenne Nvidia GeForce RTX 5090 Laptop (98.7 - 114.5, n=2) | |
| Moyenne de la classe Gaming (98.7 - 114.5, n=3, 2 dernières années) | |
| Aorus Master 18 AM8H | |
| Until Dawn | |
| 2560x1440 Ultra Preset | |
| Medion Erazer Beast 16 X1 Ultimate | |
| Moyenne Nvidia GeForce RTX 5090 Laptop (65.6 - 69.5, n=2) | |
| Aorus Master 18 AM8H | |
| Moyenne de la classe Gaming (32.9 - 69.5, n=4, 2 dernières années) | |
| 2560x1440 Ultra Preset + Quality DLSS + Ray Tracing | |
| Medion Erazer Beast 16 X1 Ultimate | |
| Moyenne Nvidia GeForce RTX 5090 Laptop (79.7 - 86.3, n=2) | |
| Aorus Master 18 AM8H | |
| Moyenne de la classe Gaming (41.5 - 86.3, n=4, 2 dernières années) | |
| Space Marine 2 | |
| 2560x1440 Ultra Preset AA:T | |
| Aorus Master 18 AM8H | |
| Moyenne Nvidia GeForce RTX 5090 Laptop (97.2 - 98.6, n=2) | |
| Medion Erazer Beast 16 X1 Ultimate | |
| Moyenne de la classe Gaming (48.2 - 98.6, n=4, 2 dernières années) | |
| 2560x1440 Ultra Preset + Quality DLSS | |
| Aorus Master 18 AM8H | |
| Moyenne Nvidia GeForce RTX 5090 Laptop (97.5 - 100.8, n=2) | |
| Medion Erazer Beast 16 X1 Ultimate | |
| Moyenne de la classe Gaming (65.1 - 100.8, n=4, 2 dernières années) | |
| Bas | Moyen | Élevé | Ultra | QHD DLSS | QHD | |
|---|---|---|---|---|---|---|
| GTA V (2015) | 187.5 | 185.3 | 142.4 | 133.4 | ||
| Dota 2 Reborn (2015) | 234 | 204 | 193 | 176.4 | ||
| Final Fantasy XV Benchmark (2018) | 234 | 205 | 172.2 | |||
| X-Plane 11.11 (2018) | 161.6 | 139.2 | 114.2 | |||
| Baldur's Gate 3 (2023) | 217 | 202 | 200 | 151 | ||
| Cyberpunk 2077 2.2 Phantom Liberty (2023) | 188.1 | 171.9 | 158.5 | 110.8 | ||
| Star Wars Outlaws (2024) | 79.3 | 72.7 | 70 | 70.8 | 61 | |
| Space Marine 2 (2024) | 102.8 | 102.1 | 101.4 | 97.5 | 97.2 | |
| Until Dawn (2024) | 109.9 | 102.4 | 93.9 | 86.3 | 69.5 | |
| Stalker 2 (2024) | 106.1 | 92.6 | 81.8 | 134.6 | 65.4 | |
| Kingdom Come Deliverance 2 (2025) | 195.8 | 165.7 | 118.5 | 114.5 | 86 | |
| Civilization 7 (2025) | 231 | 225 | 184.9 | |||
| The Elder Scrolls IV Oblivion Remastered (2025) | 118.4 | 104.2 | 57.5 | 59.7 | 41.7 | |
| Doom: The Dark Ages (2025) | 124.3 | 113.9 | 111.3 | 107.3 | 82.1 | |
| F1 25 (2025) | 256 | 241 | 57 | 61 | 34 |
Une charge prolongée du GPU entraîne une légère baisse des performances sur la Beast 16 X1. Cependant, la perte de FPS est limitée. Notre Cyberpunk-Illustre le phénomène (ligne rouge).
Cyberpunk 2077 ultra FPS-Diagram
Émissions
Émissions sonores
Le 16 pouces est tout aussi bruyant que la concurrence en charge. Un peu moins de 55 dB(A) en mode jeu typique est clairement audible et nécessite un casque. L'ordinateur portable de Medion est beaucoup plus silencieux en mode veille, où les ventilateurs atteignent généralement entre 25 et 29 dB(A).
Degré de la nuisance sonore
| Au repos |
| 25 / 27 / 29 dB(A) |
| Fortement sollicité |
| 52 / 55 dB(A) |
 | ||
30 dB silencieux 40 dB(A) audible 50 dB(A) bruyant |
||
min: | ||
| Medion Erazer Beast 16 X1 Ultimate GeForce RTX 5090 Laptop, Ultra 9 275HX | SCHENKER XMG Neo 16 E25 RTX 5090 Laptop GeForce RTX 5090 Laptop, Ultra 9 275HX | HP Omen Max 16 ah000 GeForce RTX 5090 Laptop, Ultra 9 275HX | Asus ROG Strix Scar 16 2025 GeForce RTX 5090 Laptop, Ultra 9 275HX | Lenovo Legion Pro 7i 16 Gen 10 GeForce RTX 5080 Laptop, Ultra 9 275HX | Asus ROG Strix G16 G615 GeForce RTX 5080 Laptop, Ultra 9 275HX | |
|---|---|---|---|---|---|---|
| Noise | 1% | -3% | 1% | 12% | 2% | |
| arrêt / environnement * | 24 | 24 -0% | 22.8 5% | 23.8 1% | 22.9 5% | 24 -0% |
| Idle Minimum * | 25 | 26 -4% | 29 -16% | 29 -16% | 22.9 8% | 24 4% |
| Idle Average * | 27 | 26 4% | 29 -7% | 29 -7% | 22.9 15% | 30.1 -11% |
| Idle Maximum * | 29 | 26 10% | 29 -0% | 29 -0% | 26.3 9% | 30.1 -4% |
| Load Average * | 52 | 52.4 -1% | 47.7 8% | 40.5 22% | 27.8 47% | 41.1 21% |
| Cyberpunk 2077 ultra * | 55 | 55.4 -1% | 54.8 -0% | 53.6 3% | 54.2 1% | 54.2 1% |
| Load Maximum * | 55 | 55.4 -1% | 61.1 -11% | 53.6 3% | 53.9 2% | 54.2 1% |
* ... Moindre est la valeur, meilleures sont les performances
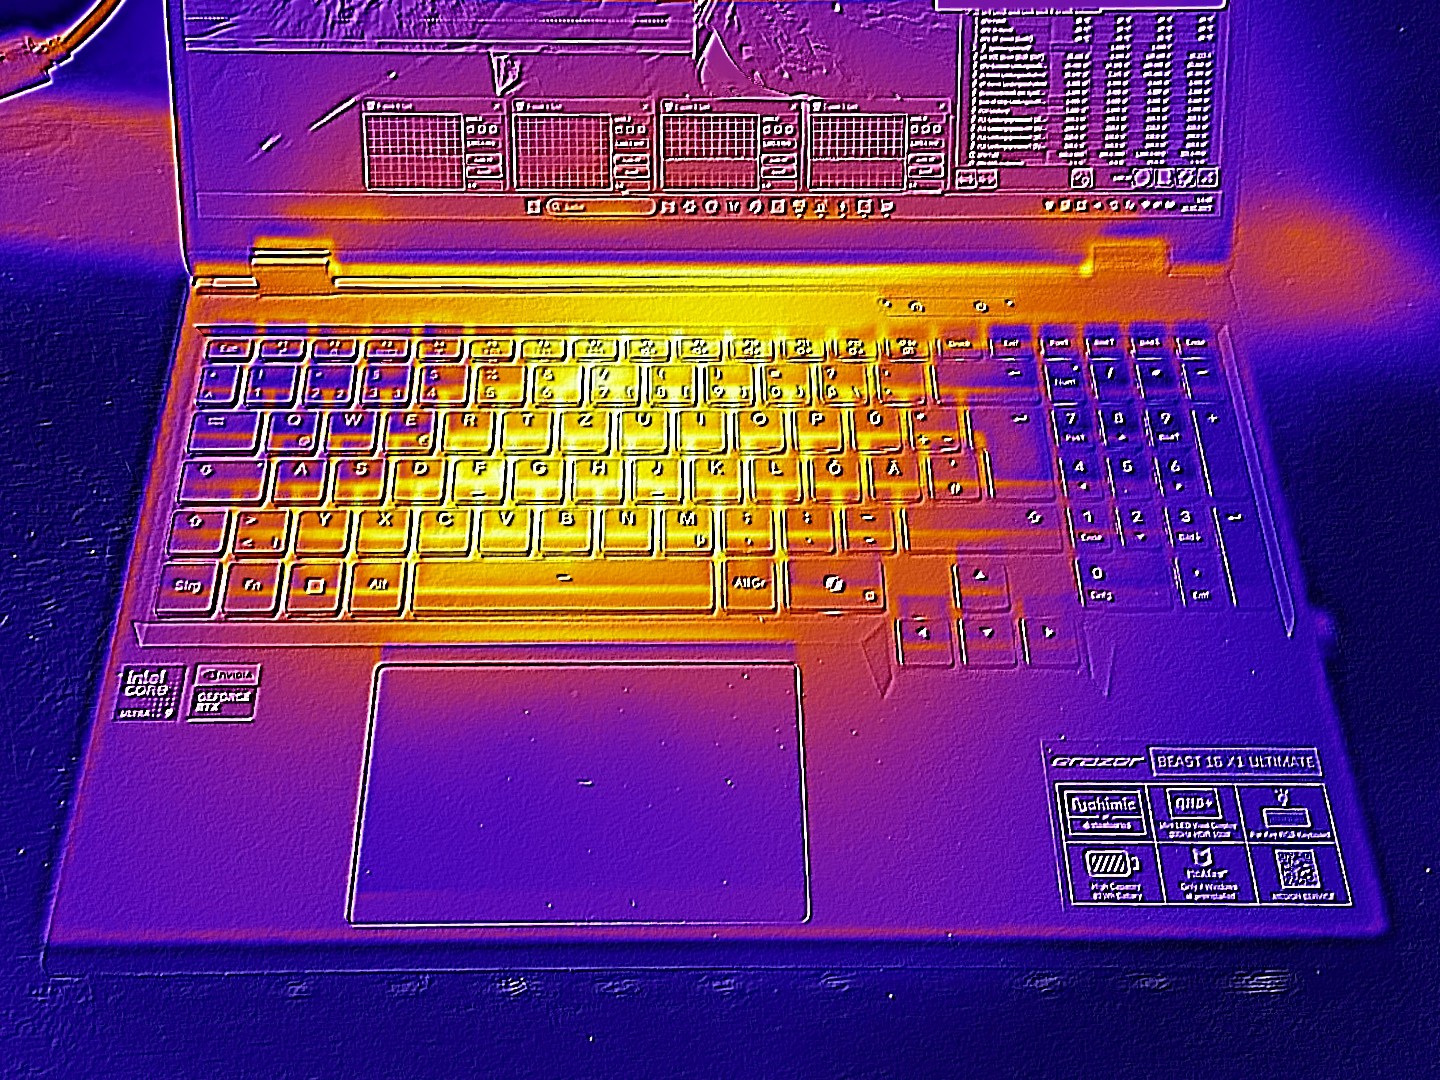
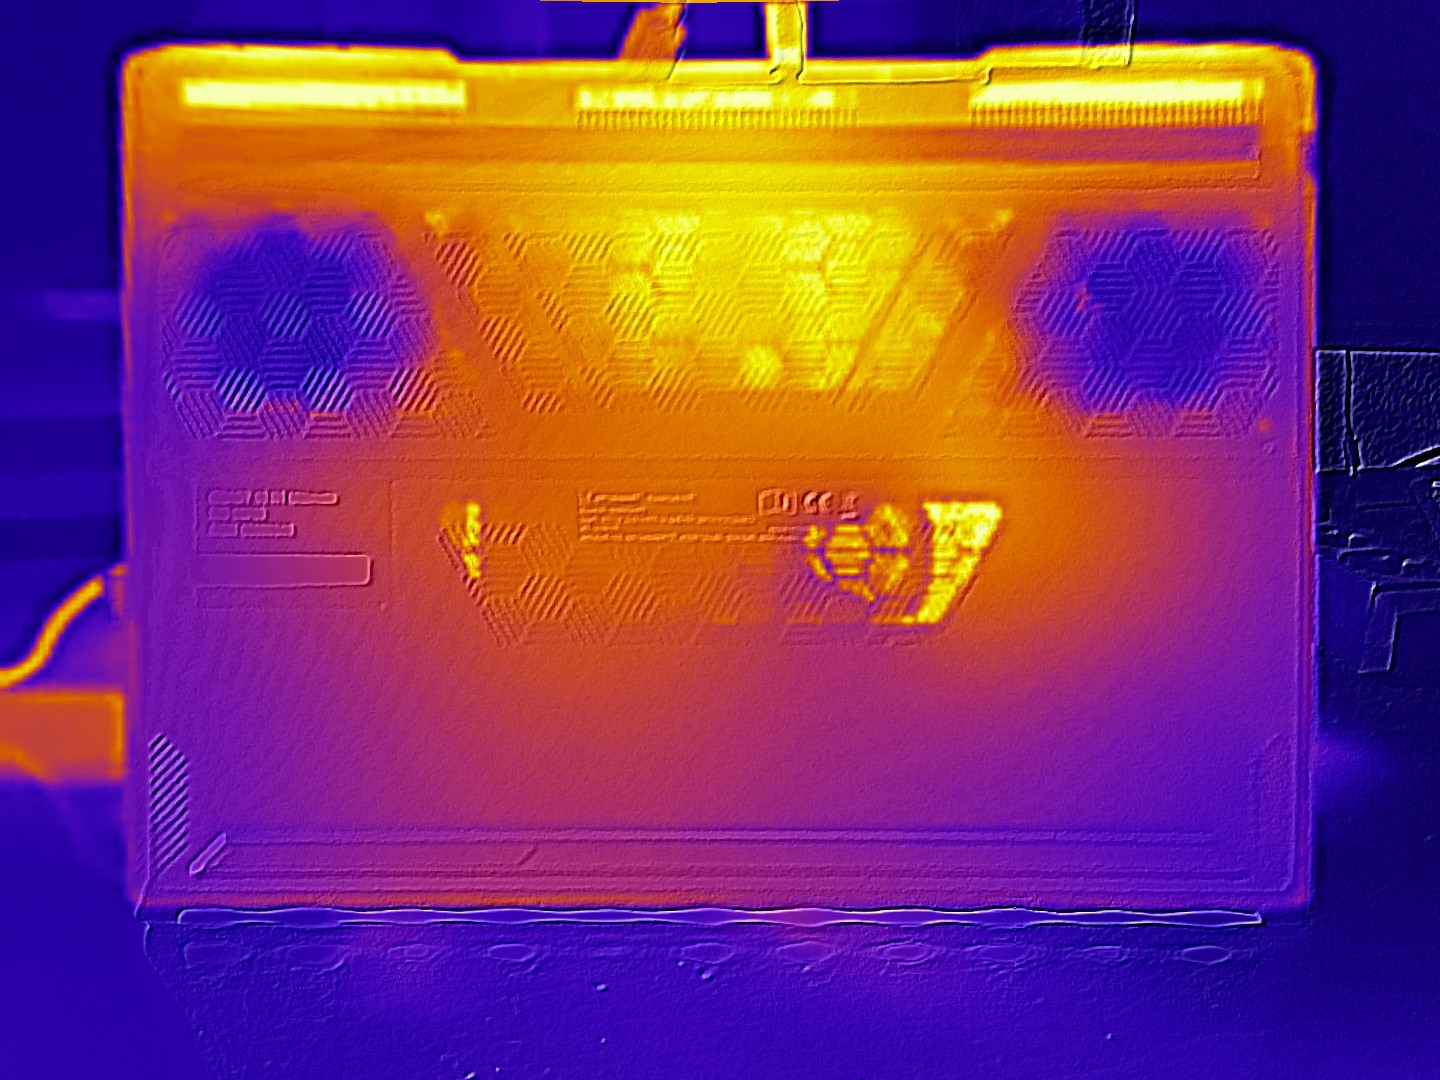
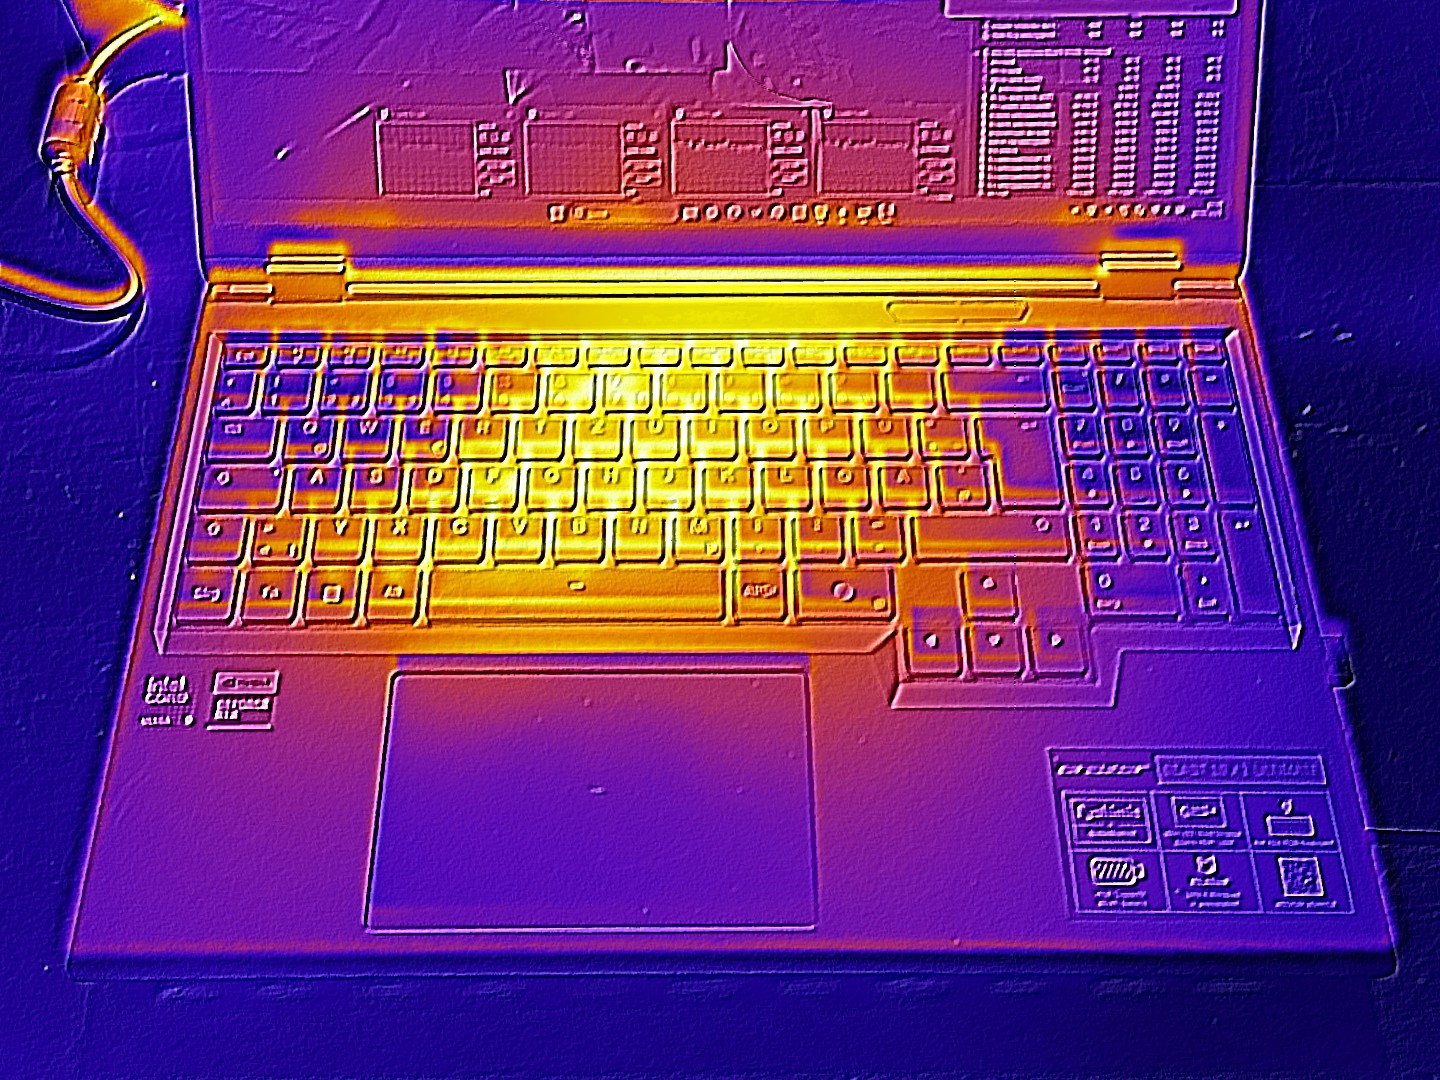
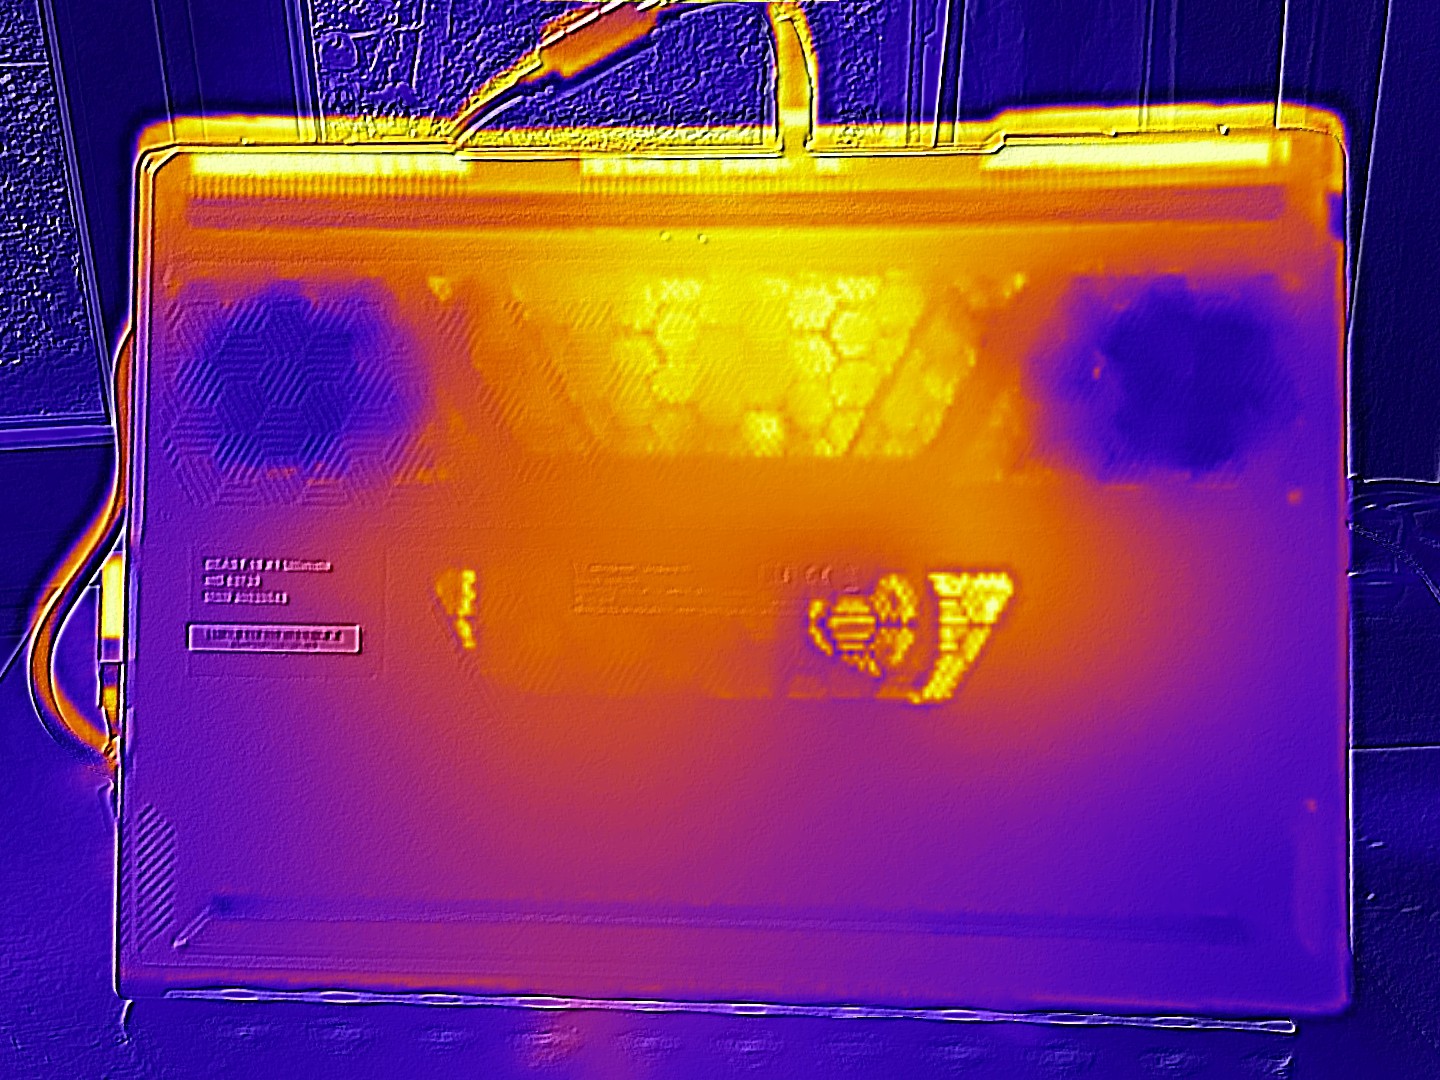
Température
Alors que la Beast 16 X1 reste agréablement froide en mode veille (maximum 30 °C/86 °F), les surfaces du boîtier peuvent atteindre jusqu'à 49 °C (120,2 °F/top) et 45 °C (113 °F/bottom) sous une charge plus importante, ce qui ne constitue pas des valeurs particulièrement élevées ou basses par rapport à la concurrence.
(-) La température maximale du côté supérieur est de 49 °C / 120 F, par rapport à la moyenne de 40.4 °C / 105 F, allant de 21.2 à 68.8 °C pour la classe Gaming.
(±) Le fond chauffe jusqu'à un maximum de 45 °C / 113 F, contre une moyenne de 43.3 °C / 110 F
(+) En utilisation inactive, la température moyenne du côté supérieur est de 29.1 °C / 84 F, par rapport à la moyenne du dispositif de 33.9 °C / 93 F.
(-) 3: The average temperature for the upper side is 40.2 °C / 104 F, compared to the average of 33.9 °C / 93 F for the class Gaming.
(±) Les repose-poignets et le pavé tactile peuvent devenir très chauds au toucher, avec un maximum de 37 °C / 98.6# F.
(-) La température moyenne de la zone de l'appui-paume de dispositifs similaires était de 28.9 °C / 84 F (-8.1 °C / #-14.6 F).
| Medion Erazer Beast 16 X1 Ultimate GeForce RTX 5090 Laptop, Ultra 9 275HX | SCHENKER XMG Neo 16 E25 RTX 5090 Laptop GeForce RTX 5090 Laptop, Ultra 9 275HX | HP Omen Max 16 ah000 GeForce RTX 5090 Laptop, Ultra 9 275HX | Asus ROG Strix Scar 16 2025 GeForce RTX 5090 Laptop, Ultra 9 275HX | Lenovo Legion Pro 7i 16 Gen 10 GeForce RTX 5080 Laptop, Ultra 9 275HX | Asus ROG Strix G16 G615 GeForce RTX 5080 Laptop, Ultra 9 275HX | |
|---|---|---|---|---|---|---|
| Heat | 2% | 6% | -7% | 1% | 8% | |
| Maximum Upper Side * | 49 | 47.8 2% | 42.8 13% | 44.2 10% | 42.6 13% | 39.6 19% |
| Maximum Bottom * | 45 | 46.7 -4% | 50.2 -12% | 48.1 -7% | 41.2 8% | 49.7 -10% |
| Idle Upper Side * | 30 | 28.4 5% | 27.6 8% | 33 -10% | 32.6 -9% | 26.3 12% |
| Idle Bottom * | 30 | 28.9 4% | 26.2 13% | 36.1 -20% | 32.4 -8% | 27.3 9% |
* ... Moindre est la valeur, meilleures sont les performances
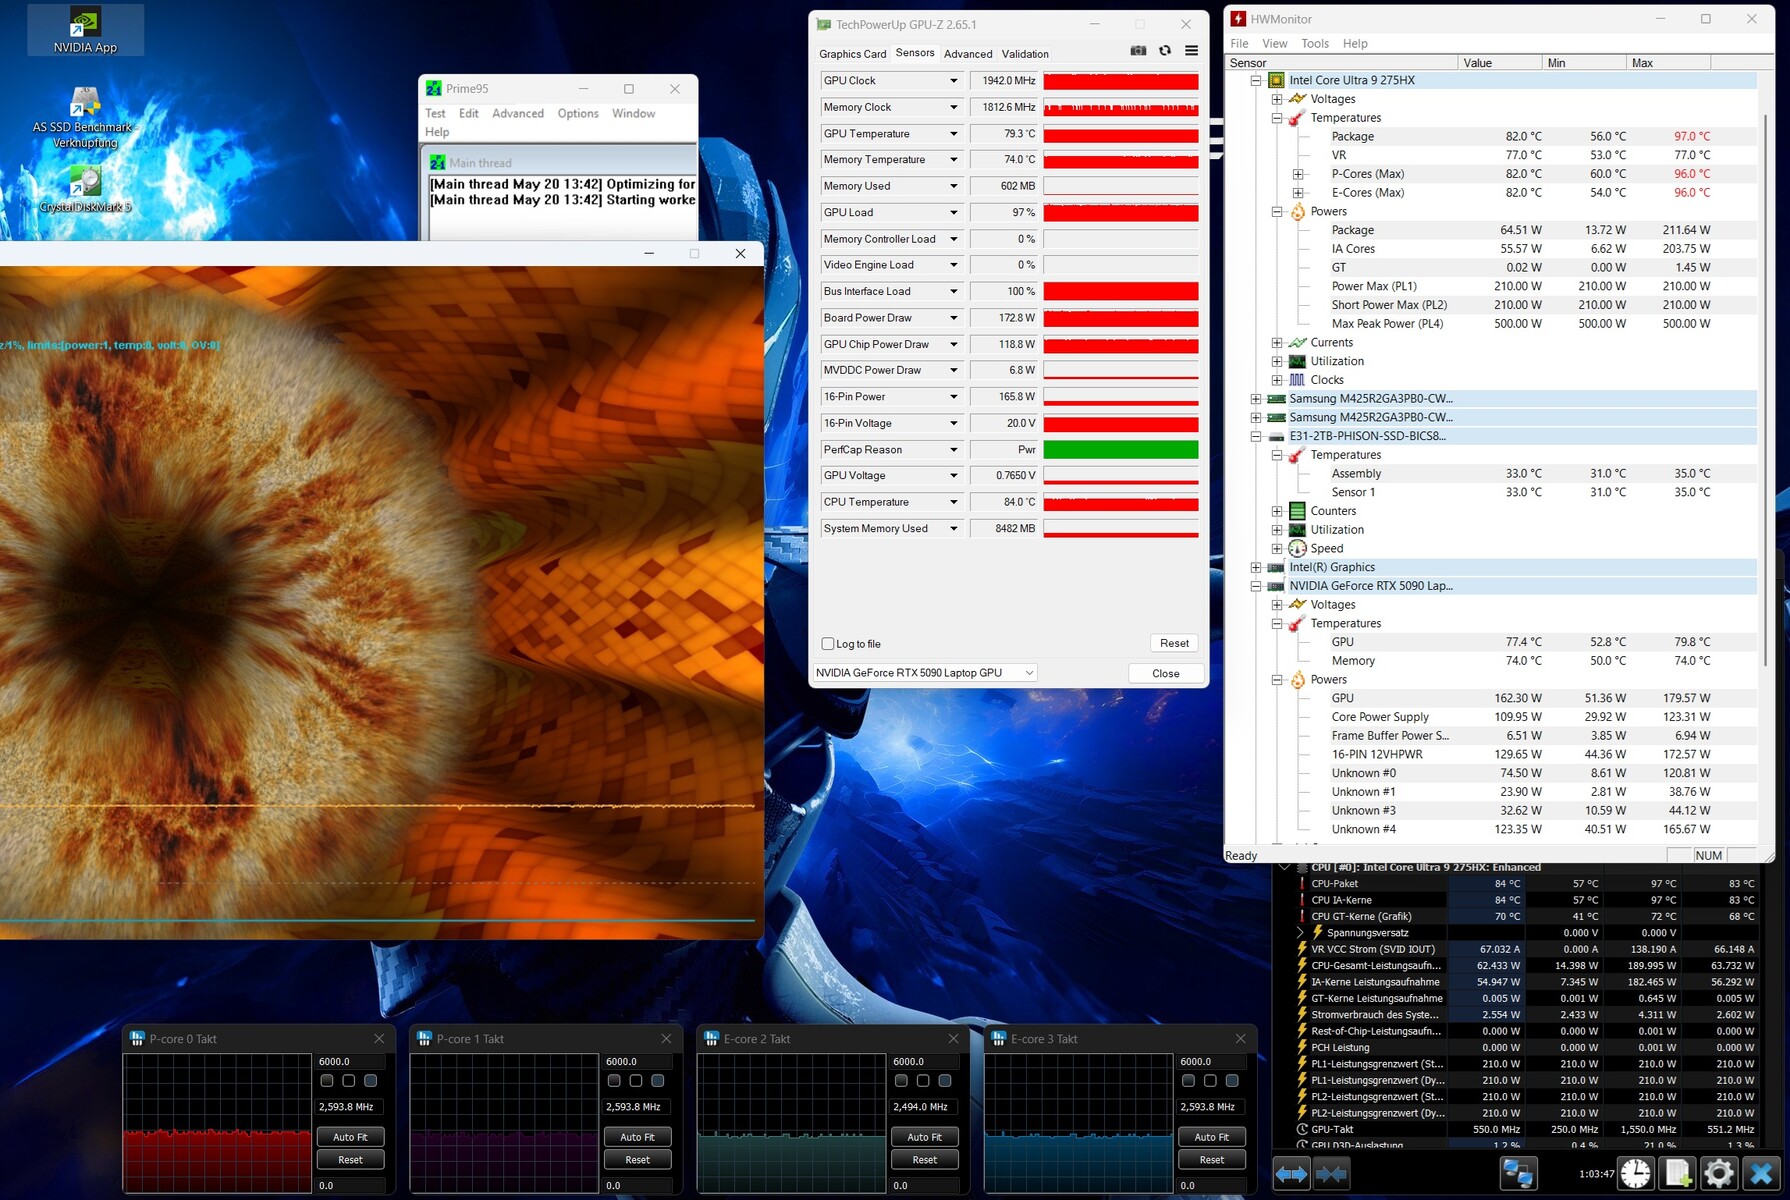
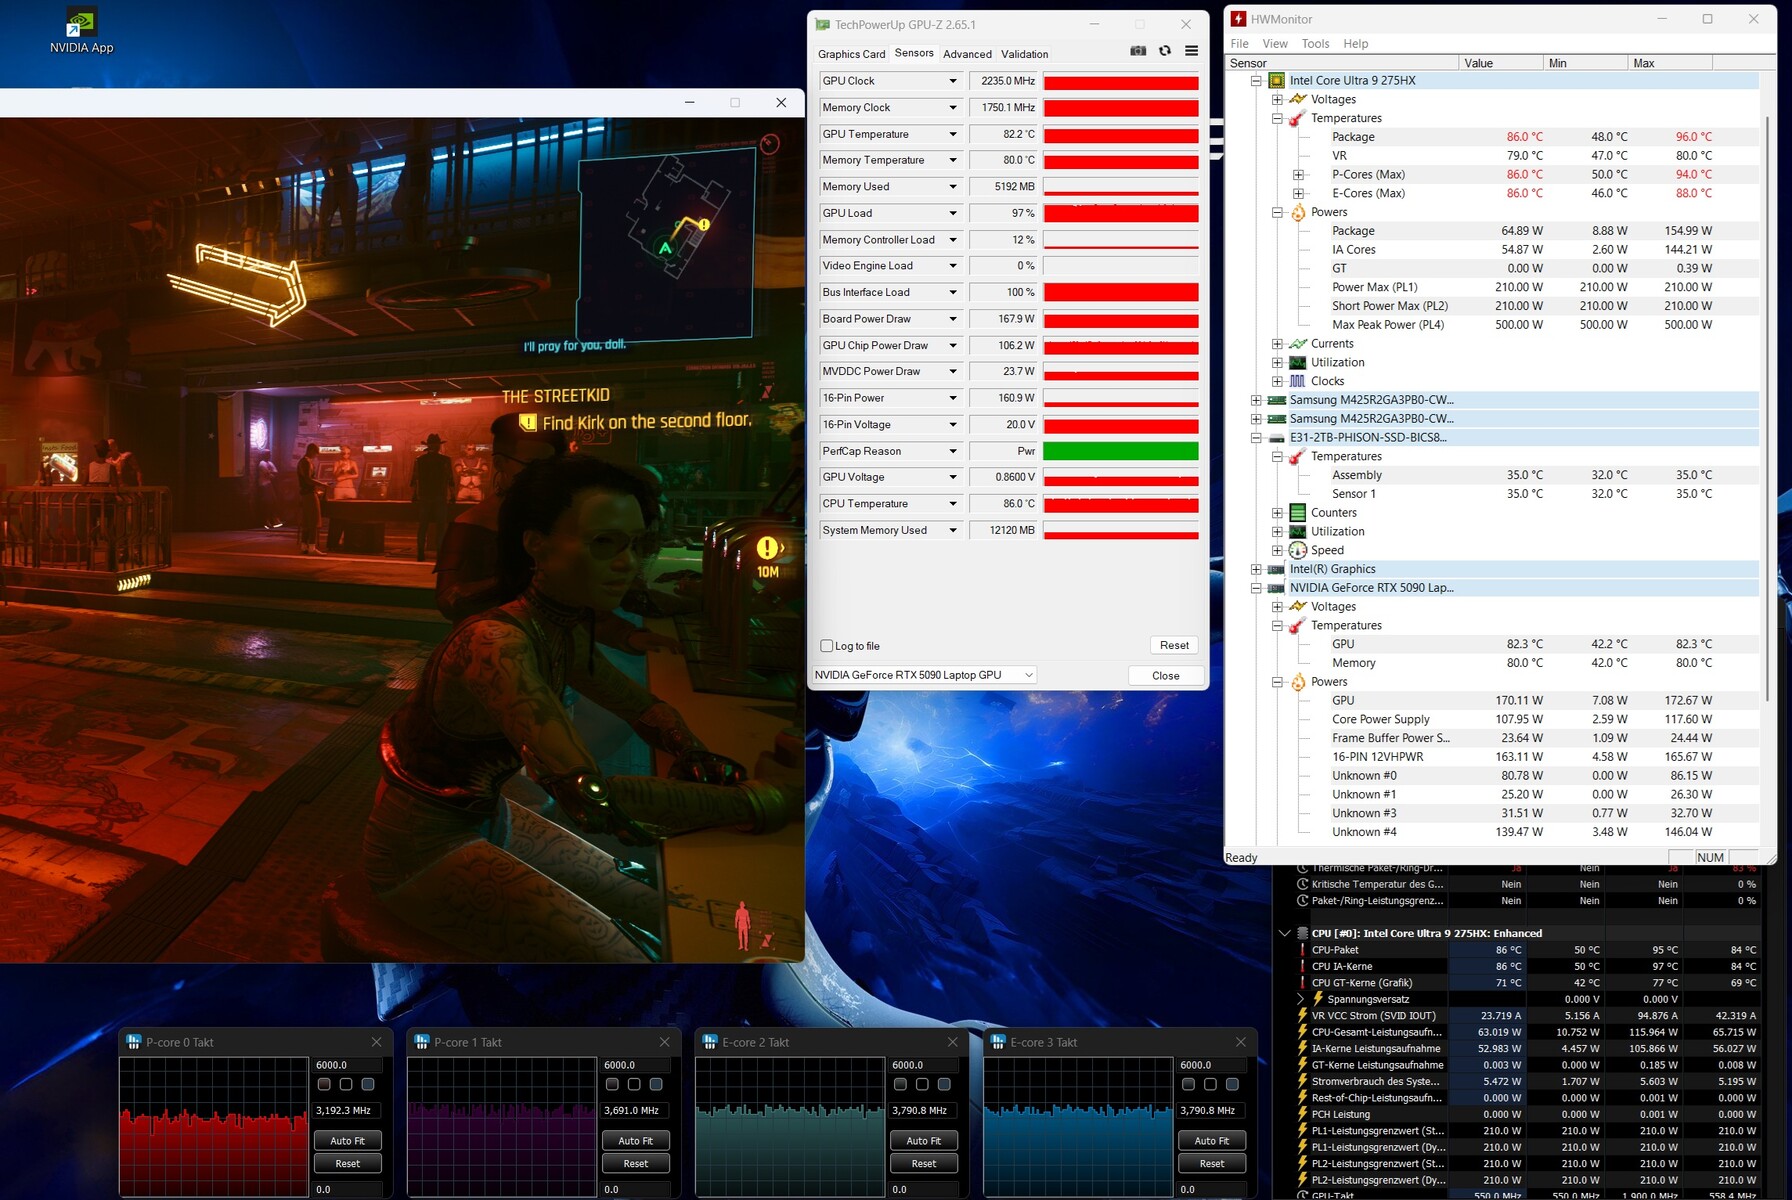
Épreuve d'effort
Notre test de stress avec les outils FurMark et Prime95 a été géré de manière acceptable par le CPU et le GPU à environ 80 °C (176 °F). Les températures étaient légèrement plus élevées dans Cyberpunk 2077 en raison des fréquences d'horloge plus élevées.
Intervenants
Le système audio du Beast 16 X1 est étonnamment bon pour un ordinateur portable et n'a pas à se cacher derrière ses concurrents. Par rapport au HP Omen Max 16, le volume maximum est également plus élevé.
Medion Erazer Beast 16 X1 Ultimate analyse audio
(+) | les haut-parleurs peuvent jouer relativement fort (85# dB)
Basses 100 - 315 Hz
(±) | basse réduite - en moyenne 11.2% inférieure à la médiane
(+) | les basses sont linéaires (6.8% delta à la fréquence précédente)
Médiums 400 - 2000 Hz
(+) | médiane équilibrée - seulement 4.7% de la médiane
(+) | les médiums sont linéaires (4.6% delta à la fréquence précédente)
Aiguës 2 - 16 kHz
(+) | des sommets équilibrés - à seulement 3.6% de la médiane
(±) | la linéarité des aigus est moyenne (8% delta à la fréquence précédente)
Globalement 100 - 16 000 Hz
(+) | le son global est linéaire (10.8% différence à la médiane)
Par rapport à la même classe
» 7% de tous les appareils testés de cette catégorie étaient meilleurs, 3% similaires, 90% pires
» Le meilleur avait un delta de 6%, la moyenne était de 18%, le pire était de 132%.
Par rapport à tous les appareils testés
» 5% de tous les appareils testés étaient meilleurs, 1% similaires, 93% pires
» Le meilleur avait un delta de 4%, la moyenne était de 24%, le pire était de 134%.
HP Omen Max 16 ah000 analyse audio
(±) | le niveau sonore du haut-parleur est moyen mais bon (77.9# dB)
Basses 100 - 315 Hz
(±) | basse réduite - en moyenne 9.9% inférieure à la médiane
(±) | la linéarité des basses est moyenne (13.4% delta à la fréquence précédente)
Médiums 400 - 2000 Hz
(+) | médiane équilibrée - seulement 2.3% de la médiane
(+) | les médiums sont linéaires (4.3% delta à la fréquence précédente)
Aiguës 2 - 16 kHz
(+) | des sommets équilibrés - à seulement 1.9% de la médiane
(+) | les aigus sont linéaires (4.8% delta à la fréquence précédente)
Globalement 100 - 16 000 Hz
(+) | le son global est linéaire (11.4% différence à la médiane)
Par rapport à la même classe
» 9% de tous les appareils testés de cette catégorie étaient meilleurs, 3% similaires, 88% pires
» Le meilleur avait un delta de 6%, la moyenne était de 18%, le pire était de 132%.
Par rapport à tous les appareils testés
» 6% de tous les appareils testés étaient meilleurs, 2% similaires, 92% pires
» Le meilleur avait un delta de 4%, la moyenne était de 24%, le pire était de 134%.
Gestion de l'énergie
Consommation d'énergie
La conclusion concernant la consommation d'énergie est ambivalente. Alors que la Beast 16 X1 tend à être plus économe que la concurrence en mode veille, la consommation en mode 3D est légèrement supérieure à la moyenne. Note : Le dGPU est automatiquement activé lorsqu'un moniteur externe est connecté.
| Éteint/en veille | |
| Au repos | |
| Fortement sollicité |
|
Légende:
min: | |
| Medion Erazer Beast 16 X1 Ultimate GeForce RTX 5090 Laptop, Ultra 9 275HX | SCHENKER XMG Neo 16 E25 RTX 5090 Laptop GeForce RTX 5090 Laptop, Ultra 9 275HX | HP Omen Max 16 ah000 GeForce RTX 5090 Laptop, Ultra 9 275HX | Asus ROG Strix Scar 16 2025 GeForce RTX 5090 Laptop, Ultra 9 275HX | Lenovo Legion Pro 7i 16 Gen 10 GeForce RTX 5080 Laptop, Ultra 9 275HX | Asus ROG Strix G16 G615 GeForce RTX 5080 Laptop, Ultra 9 275HX | Moyenne de la classe Gaming | |
|---|---|---|---|---|---|---|---|
| Power Consumption | -4% | -17% | -40% | -56% | -1% | -4% | |
| Idle Minimum * | 13.1 | 11.8 10% | 9.9 24% | 22.5 -72% | 28.5 -118% | 10.8 18% | 14.2 ? -8% |
| Idle Average * | 17.5 | 15.1 14% | 28.6 -63% | 32.2 -84% | 38.8 -122% | 17.7 -1% | 20.1 ? -15% |
| Idle Maximum * | 23 | 15.8 31% | 47.1 -105% | 34.3 -49% | 45.6 -98% | 18.8 18% | 27.2 ? -18% |
| Load Average * | 88 | 165.3 -88% | 141.8 -61% | 169.3 -92% | 132.2 -50% | 139.4 -58% | 105.5 ? -20% |
| Cyberpunk 2077 ultra * | 299 | 296 1% | 253 15% | 294 2% | 318 -6% | 295 1% | |
| Cyberpunk 2077 ultra external monitor * | 297 | 289 3% | 230 23% | 288 3% | 319 -7% | 291 2% | |
| Load Maximum * | 428 | 415.5 3% | 233 46% | 371.5 13% | 384 10% | 359.3 16% | 256 ? 40% |
* ... Moindre est la valeur, meilleures sont les performances
Power consumption Cyberpunk / Stress test
Power consumption with external Monitor
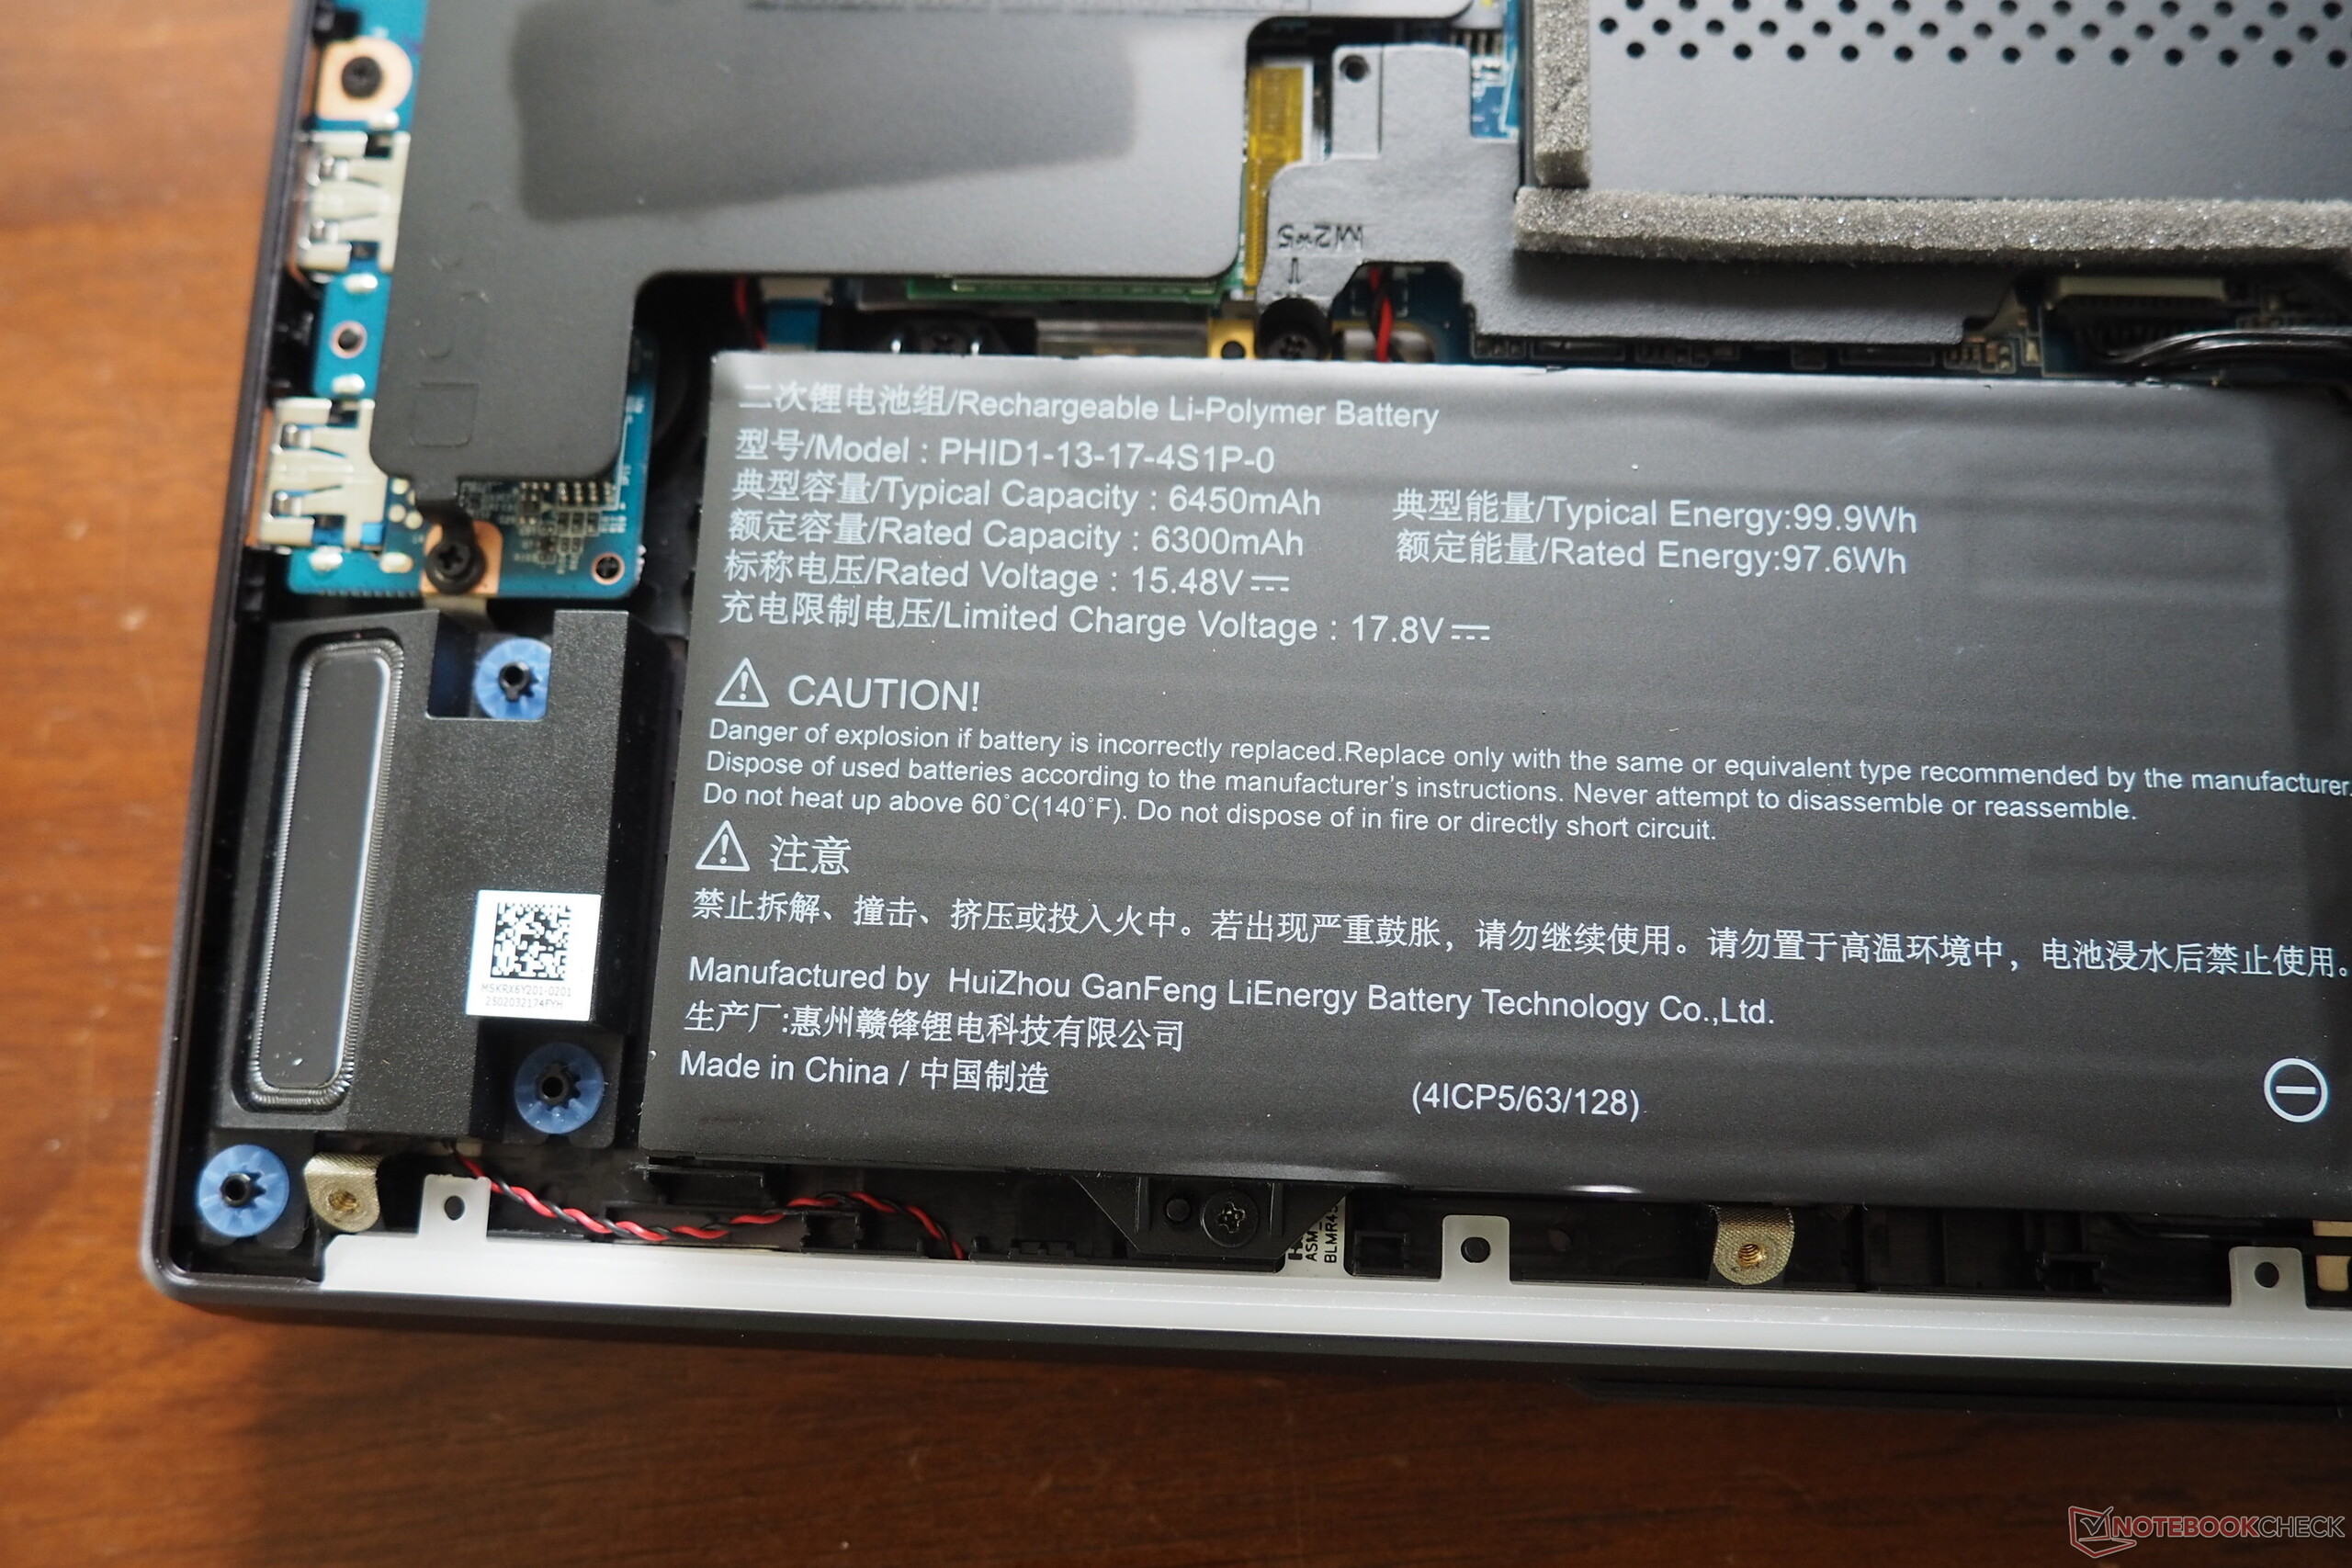
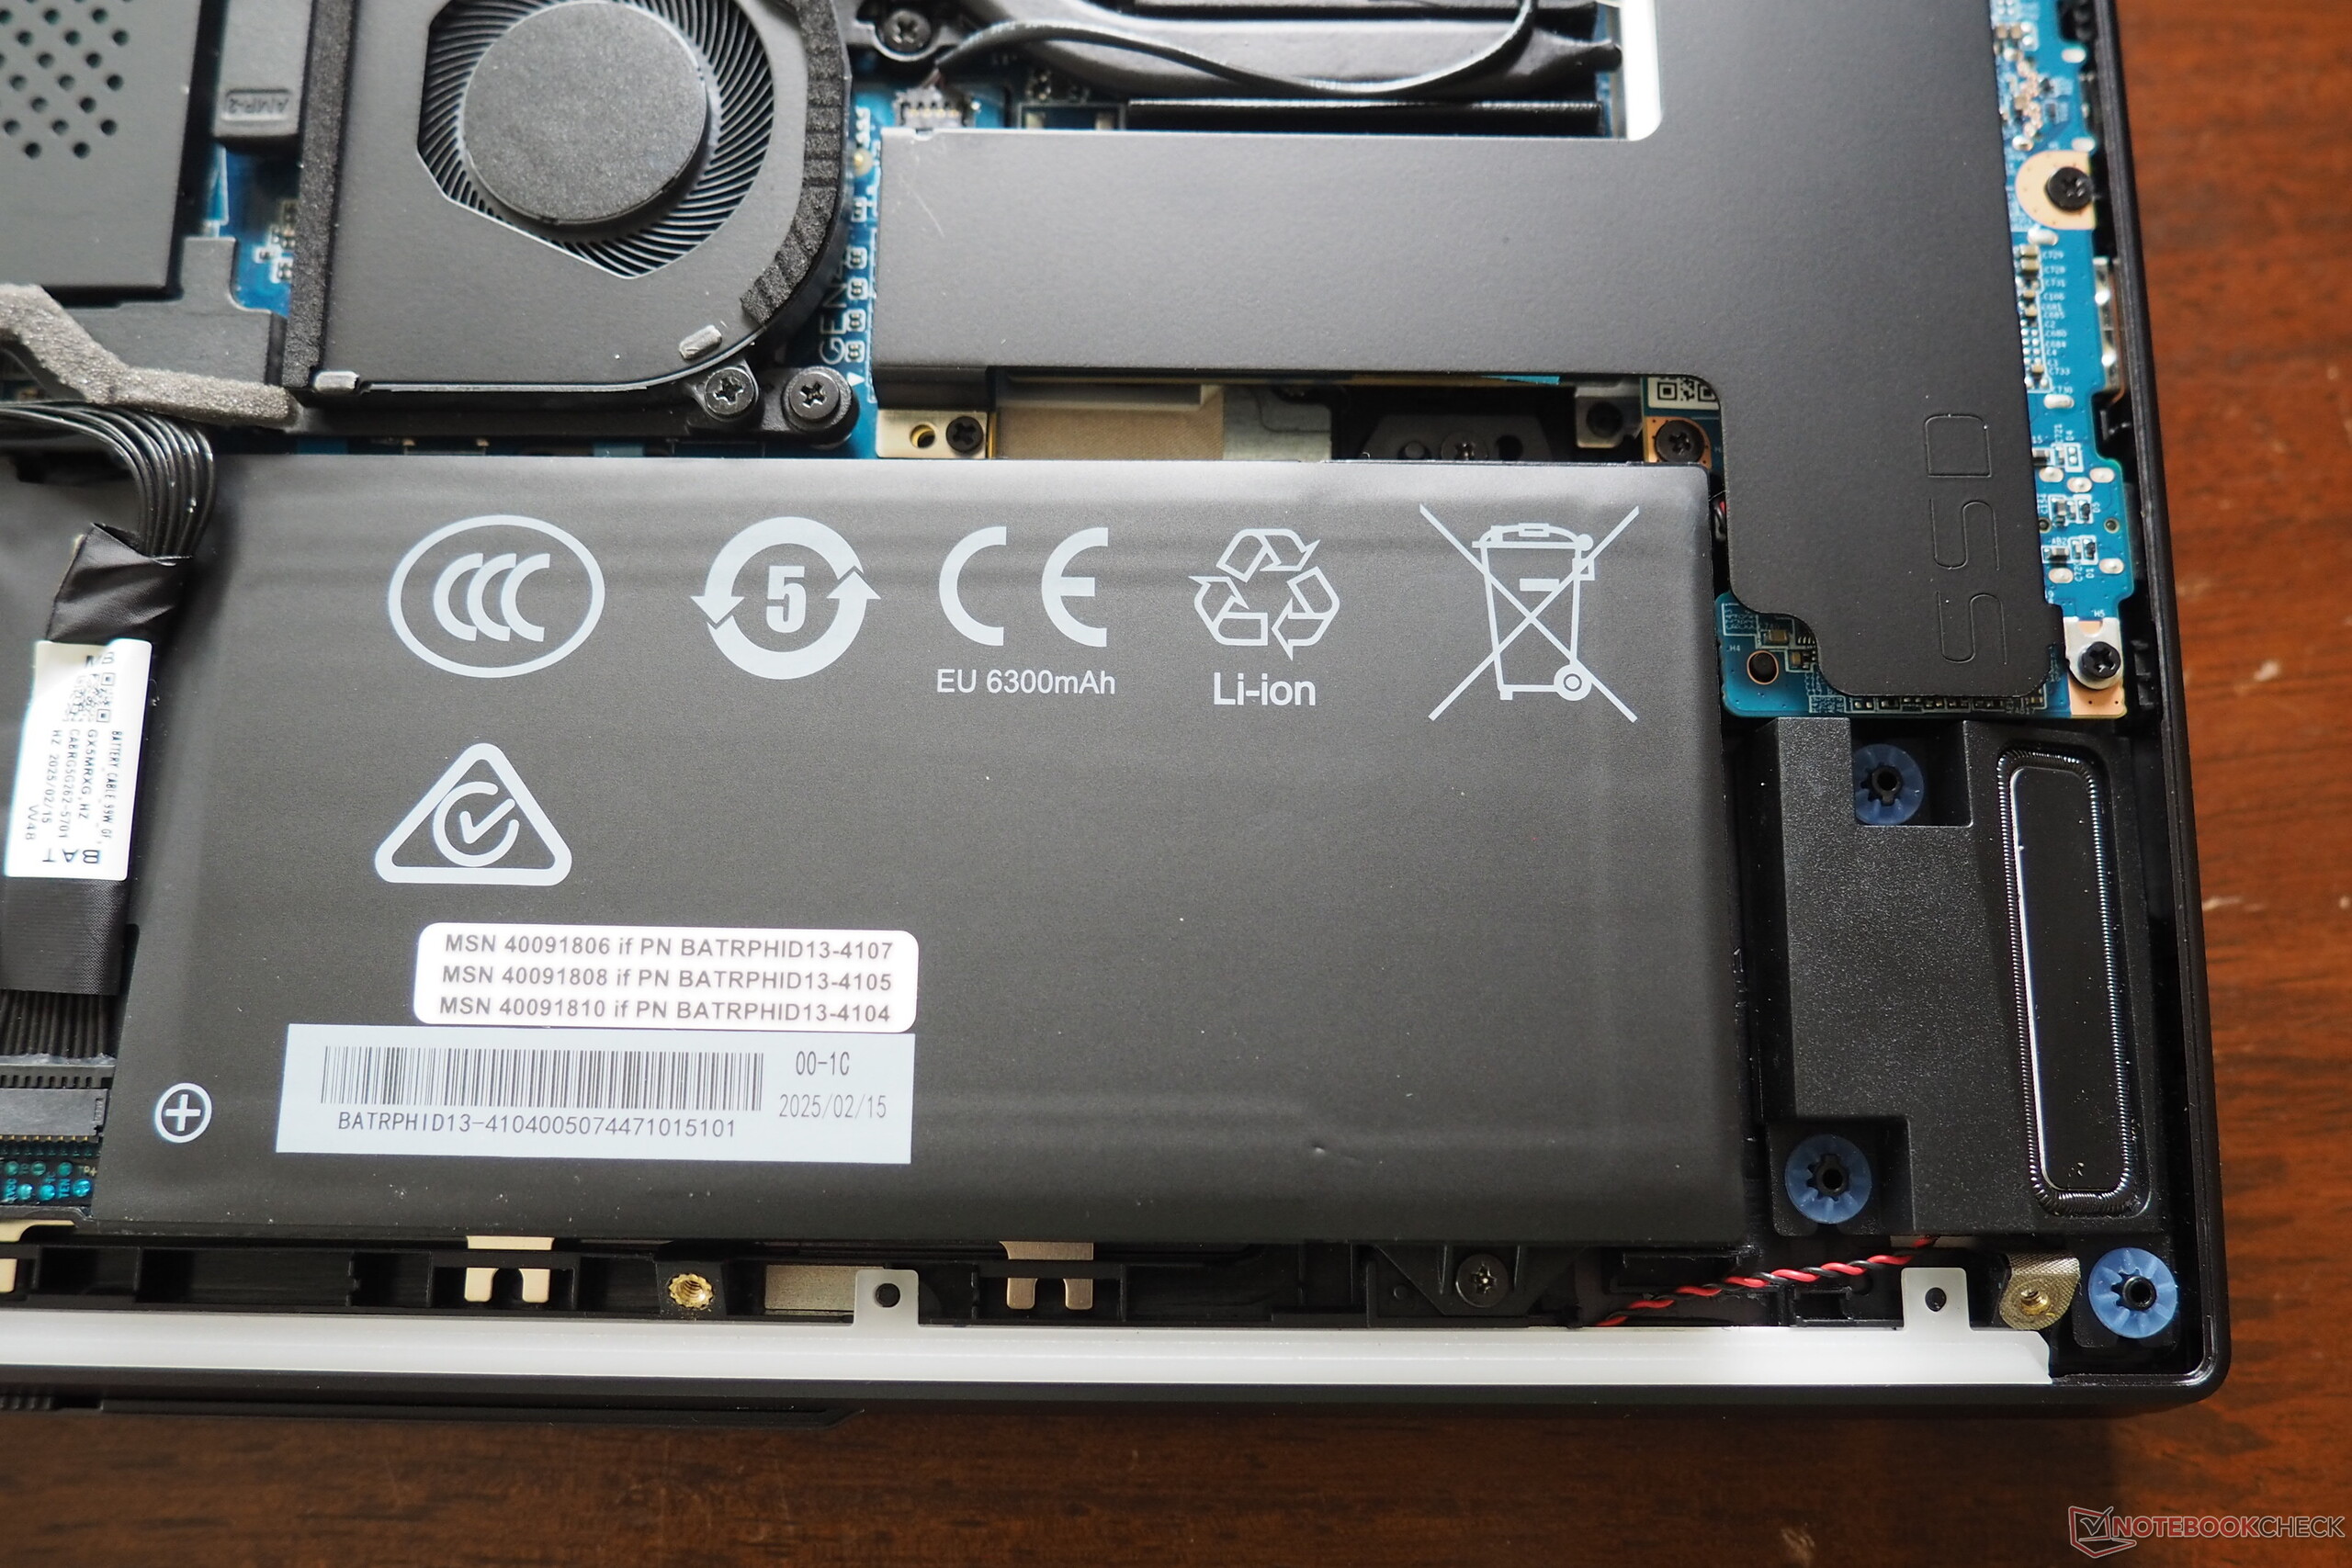
Durée de vie de la batterie
Medion dote cet appareil de 16 pouces d'une batterie puissante de 99 Wh, ce qui nous a permis d'obtenir une autonomie d'un peu moins de 8 heures lors de notre test WLAN (luminosité réduite à 150 cd/m²) - un résultat relativement bon qui est presque à égalité avec le ROG Strix G16 (90 Wh).
| Medion Erazer Beast 16 X1 Ultimate Ultra 9 275HX, GeForce RTX 5090 Laptop, 99 Wh | SCHENKER XMG Neo 16 E25 RTX 5090 Laptop Ultra 9 275HX, GeForce RTX 5090 Laptop, 99.8 Wh | HP Omen Max 16 ah000 Ultra 9 275HX, GeForce RTX 5090 Laptop, 83 Wh | Asus ROG Strix Scar 16 2025 Ultra 9 275HX, GeForce RTX 5090 Laptop, 90 Wh | Lenovo Legion Pro 7i 16 Gen 10 Ultra 9 275HX, GeForce RTX 5080 Laptop, 99 Wh | Asus ROG Strix G16 G615 Ultra 9 275HX, GeForce RTX 5080 Laptop, 90 Wh | Moyenne de la classe Gaming | |
|---|---|---|---|---|---|---|---|
| Autonomie de la batterie | 21% | -26% | -18% | -32% | -1% | -19% | |
| WiFi v1.3 | 474 | 572 21% | 350 -26% | 388 -18% | 323 -32% | 469 -1% | 385 ? -19% |
| H.264 | 460 | 658 | 453 ? | ||||
| Load | 121 | 71 | 48 | 88 | 84.8 ? | ||
| Reader / Idle | 522 | 570 ? | |||||
| Cyberpunk 2077 ultra 150cd | 48 |
Notebookcheck note globale
Le Medion Erazer Beast 16 X1 est un ordinateur portable de haute qualité destiné aux joueurs et aux créateurs, doté d'un écran brillant et de solides performances, mais aussi d'un niveau sonore élevé.
Medion Erazer Beast 16 X1 Ultimate
- 05/30/2025 v8
Florian Glaser
 Total Sustainability Score:
 Comparaison des alternatives possibles
Transparency
La sélection des appareils à examiner est effectuée par notre équipe éditoriale. L'échantillon de test a été prêté à l'auteur par le fabricant ou le détaillant pour les besoins de cet examen. Le prêteur n'a pas eu d'influence sur cette évaluation et le fabricant n'a pas reçu de copie de cette évaluation avant sa publication. Il n'y avait aucune obligation de publier cet article. Nous n'acceptons jamais de compensation ou de paiement en échange de nos commentaires. En tant que média indépendant, Notebookcheck n'est pas soumis à l'autorité des fabricants, des détaillants ou des éditeurs.
Voici comment Notebookcheck teste
Chaque année, Notebookcheck examine de manière indépendante des centaines d'ordinateurs portables et de smartphones en utilisant des procédures standardisées afin de garantir que tous les résultats sont comparables. Nous avons continuellement développé nos méthodes de test depuis environ 20 ans et avons établi des normes industrielles dans le processus. Dans nos laboratoires de test, des équipements de mesure de haute qualité sont utilisés par des techniciens et des rédacteurs expérimentés. Ces tests impliquent un processus de validation en plusieurs étapes. Notre système d'évaluation complexe repose sur des centaines de mesures et de points de référence bien fondés, ce qui garantit l'objectivité.