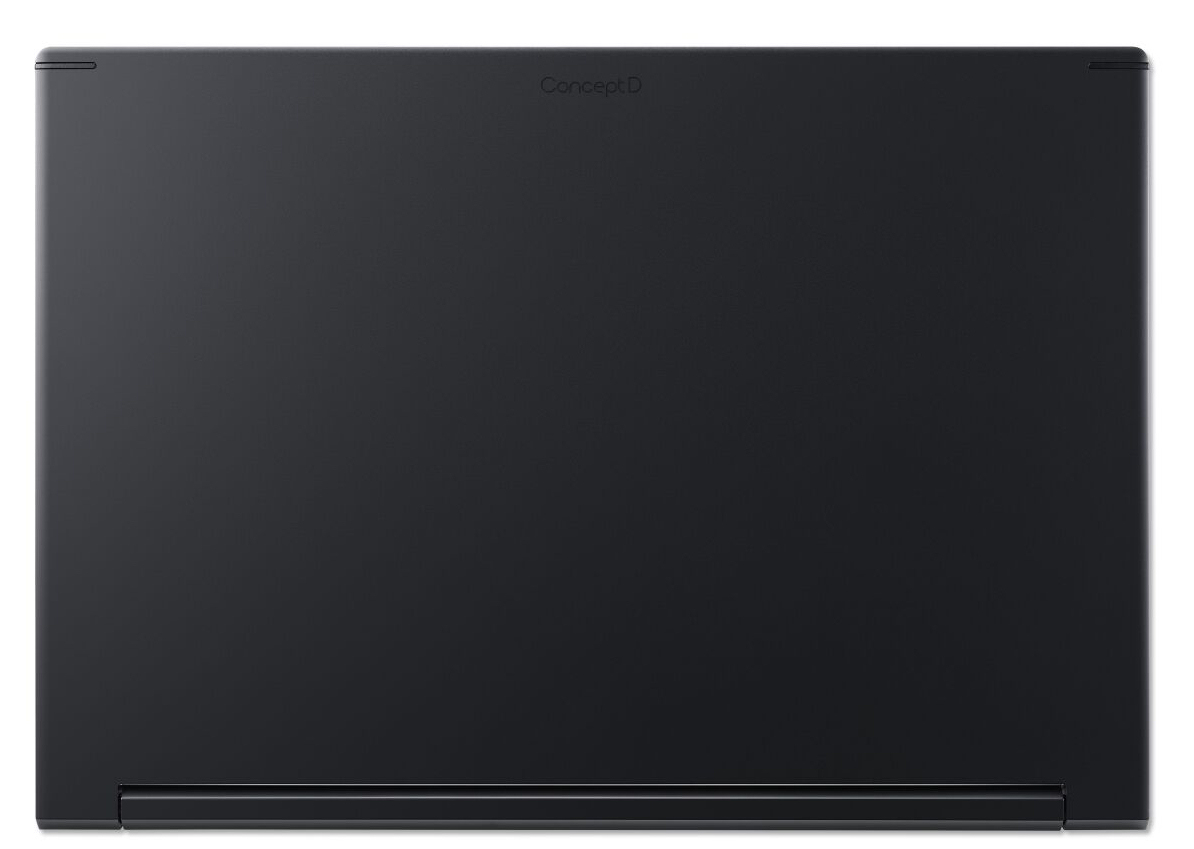
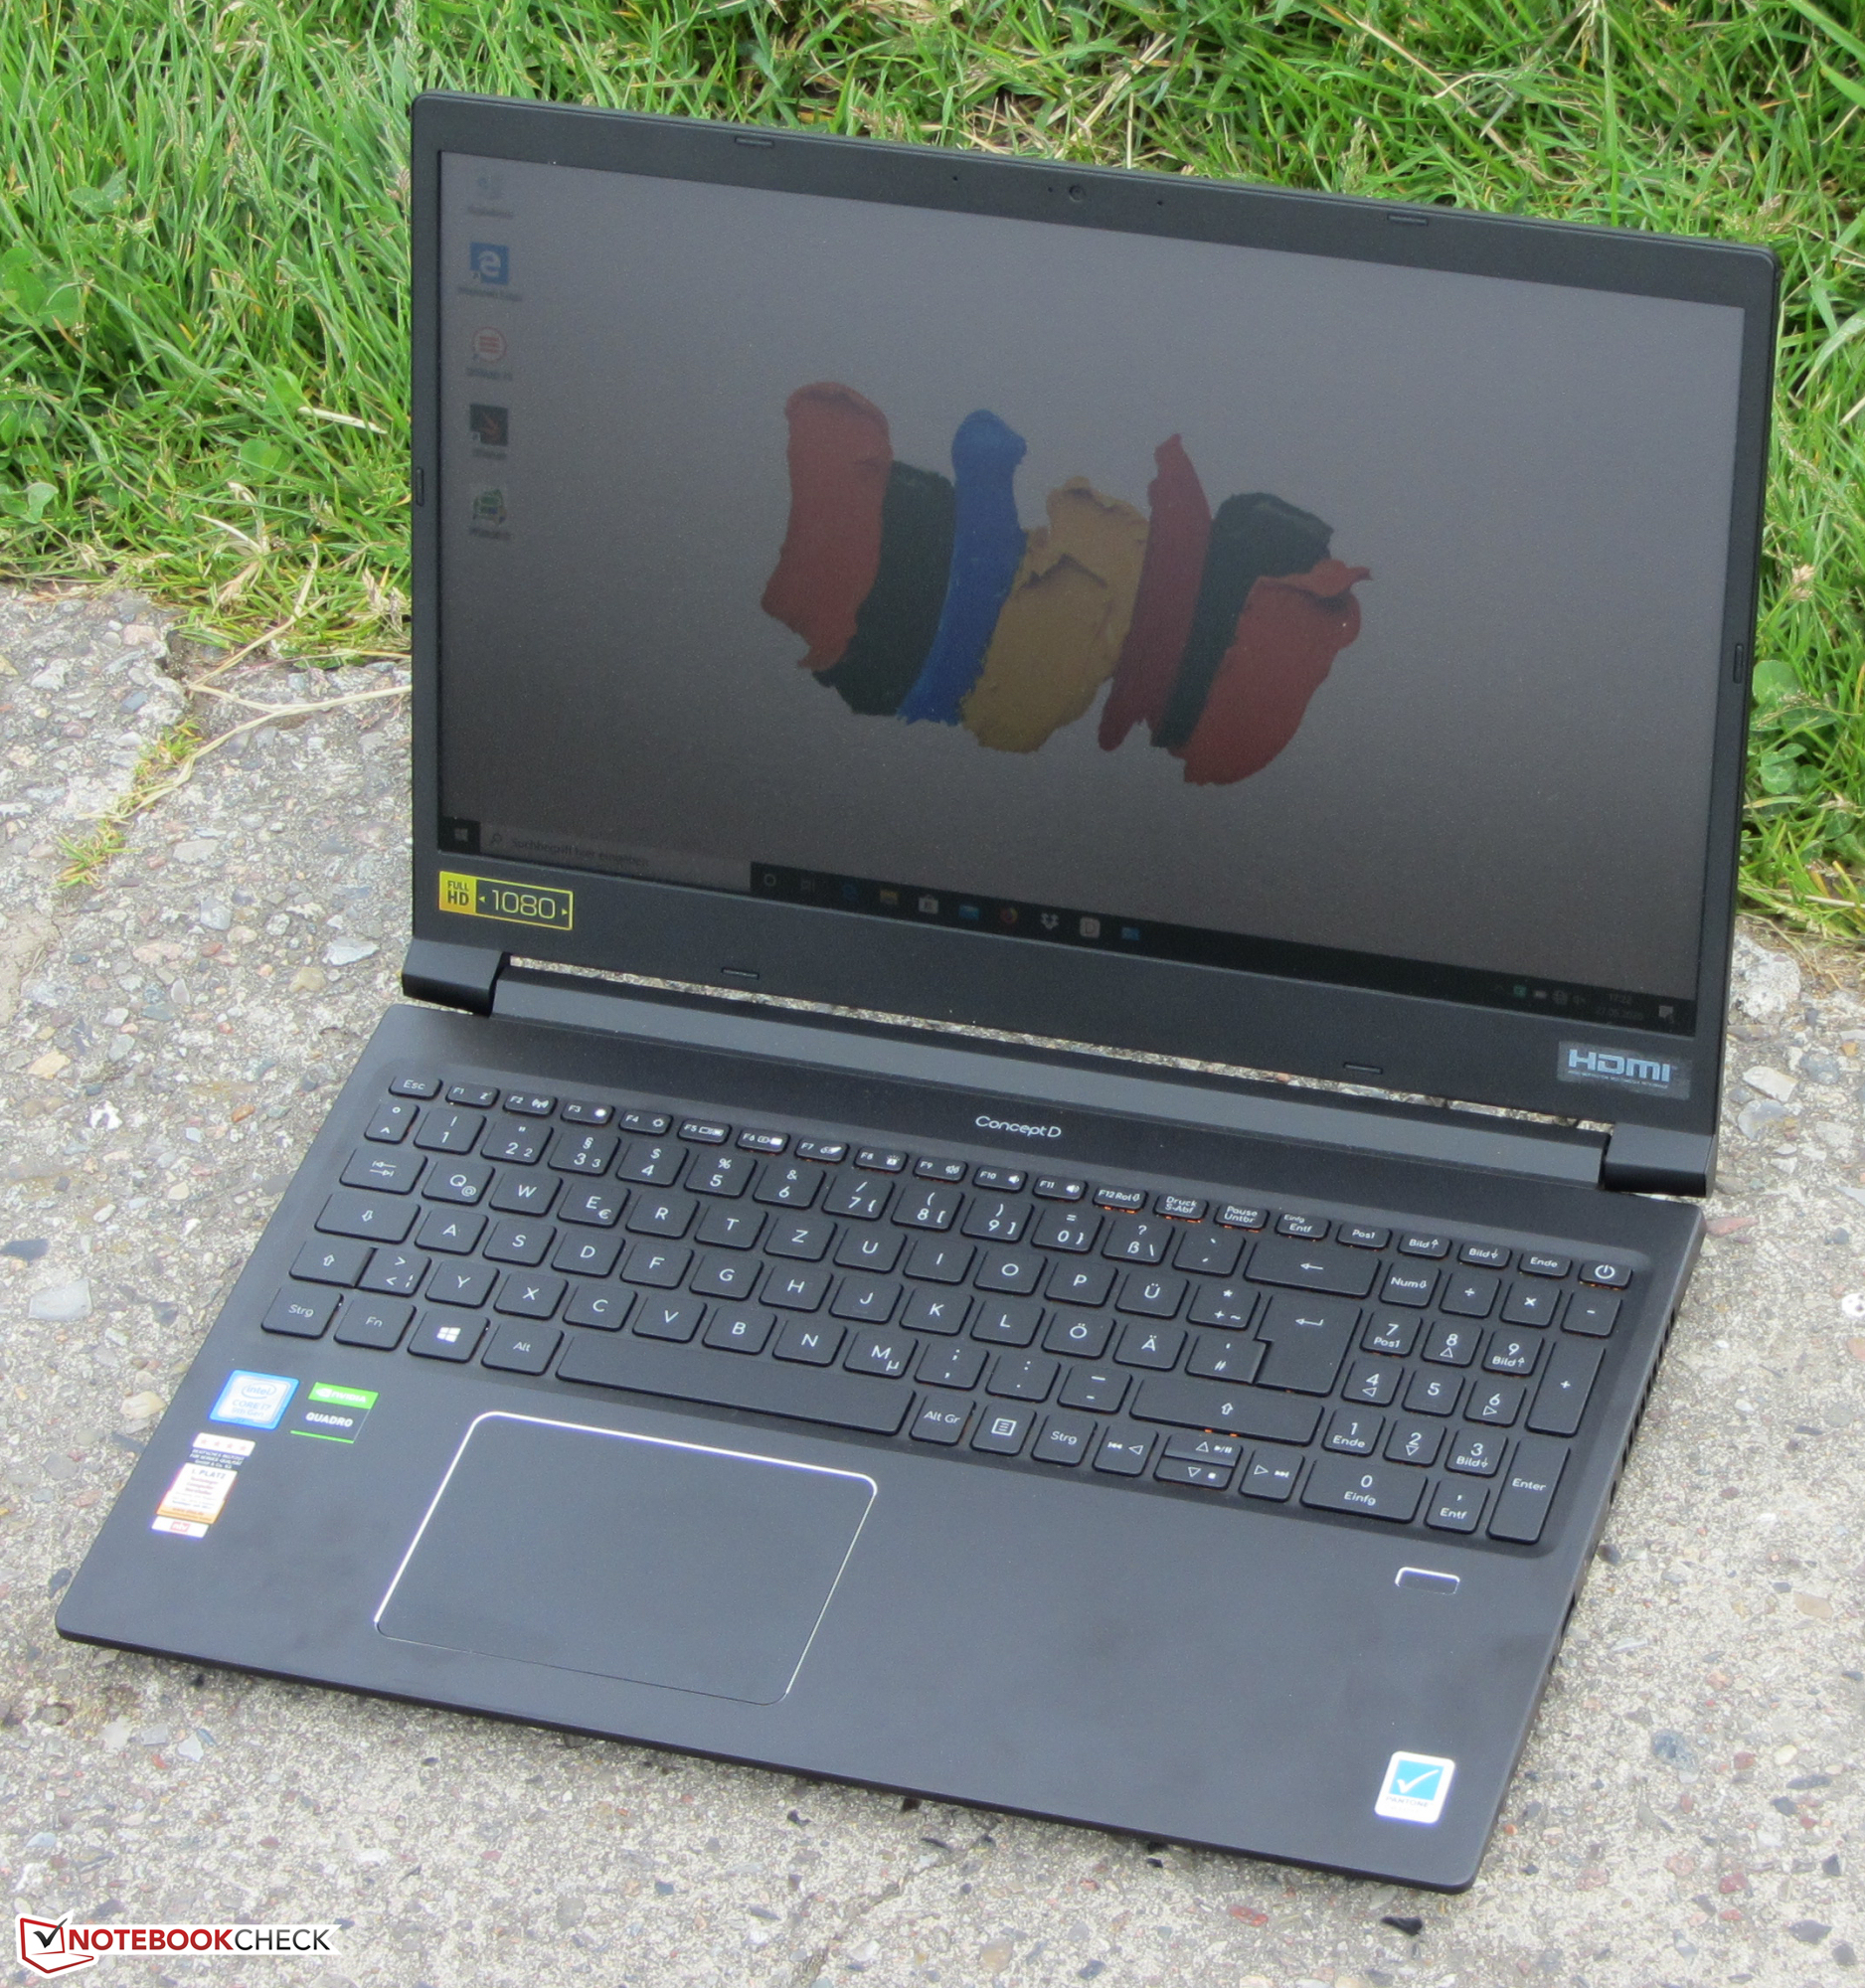
Test de l'Acer ConceptD 3 Pro CN315-71P (i7-9750H, Quadro T1000, FHD) : station de travail mobile avec trois disques
Note | Date | Modèle | Poids | Épaisseur | Taille | Résolution | Prix |
|---|---|---|---|---|---|---|---|
| 82.1 % v7 (old) | 07/20 | Acer ConceptD 3 Pro CN315-71P-73W1 i7-9750H, Quadro T1000 (Laptop) | 2.4 kg | 23.4 mm | 15.60" | 1920x1080 | |
| 81.2 % v7 (old) | 11/19 | Lenovo ThinkPad P53s-20N6001NGE i7-8565U, Quadro P520 | 1.9 kg | 19.95 mm | 15.60" | 1920x1080 | |
| 80.8 % v7 (old) | 10/19 | HP ZBook 15u G6 6TP54EA i7-8565U, Radeon Pro WX 3200 | 1.6 kg | 19 mm | 15.60" | 3840x2160 | |
| 85.6 % v6 (old) | 04/19 | Fujitsu Celsius H780 i7-8850H, Quadro P2000 | 2.8 kg | 31.9 mm | 15.60" | 1920x1080 | |
| 87.8 % v7 (old) | 08/19 | Lenovo ThinkPad P1 2019-20QT000RGE i7-9850H, Quadro T1000 (Laptop) | 1.7 kg | 18.4 mm | 15.60" | 1920x1080 |
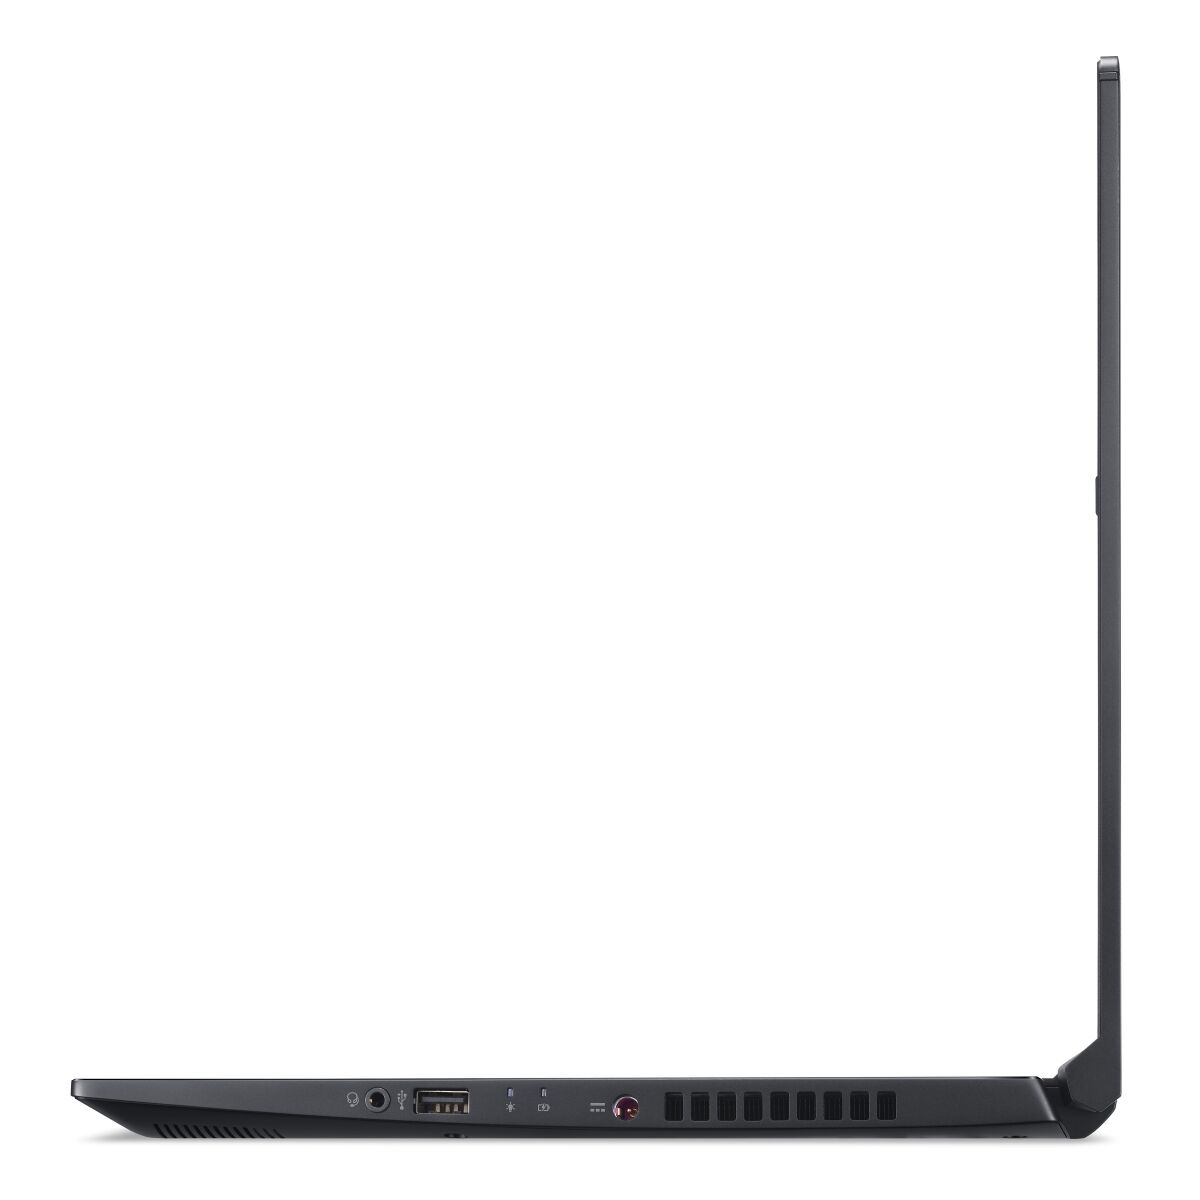
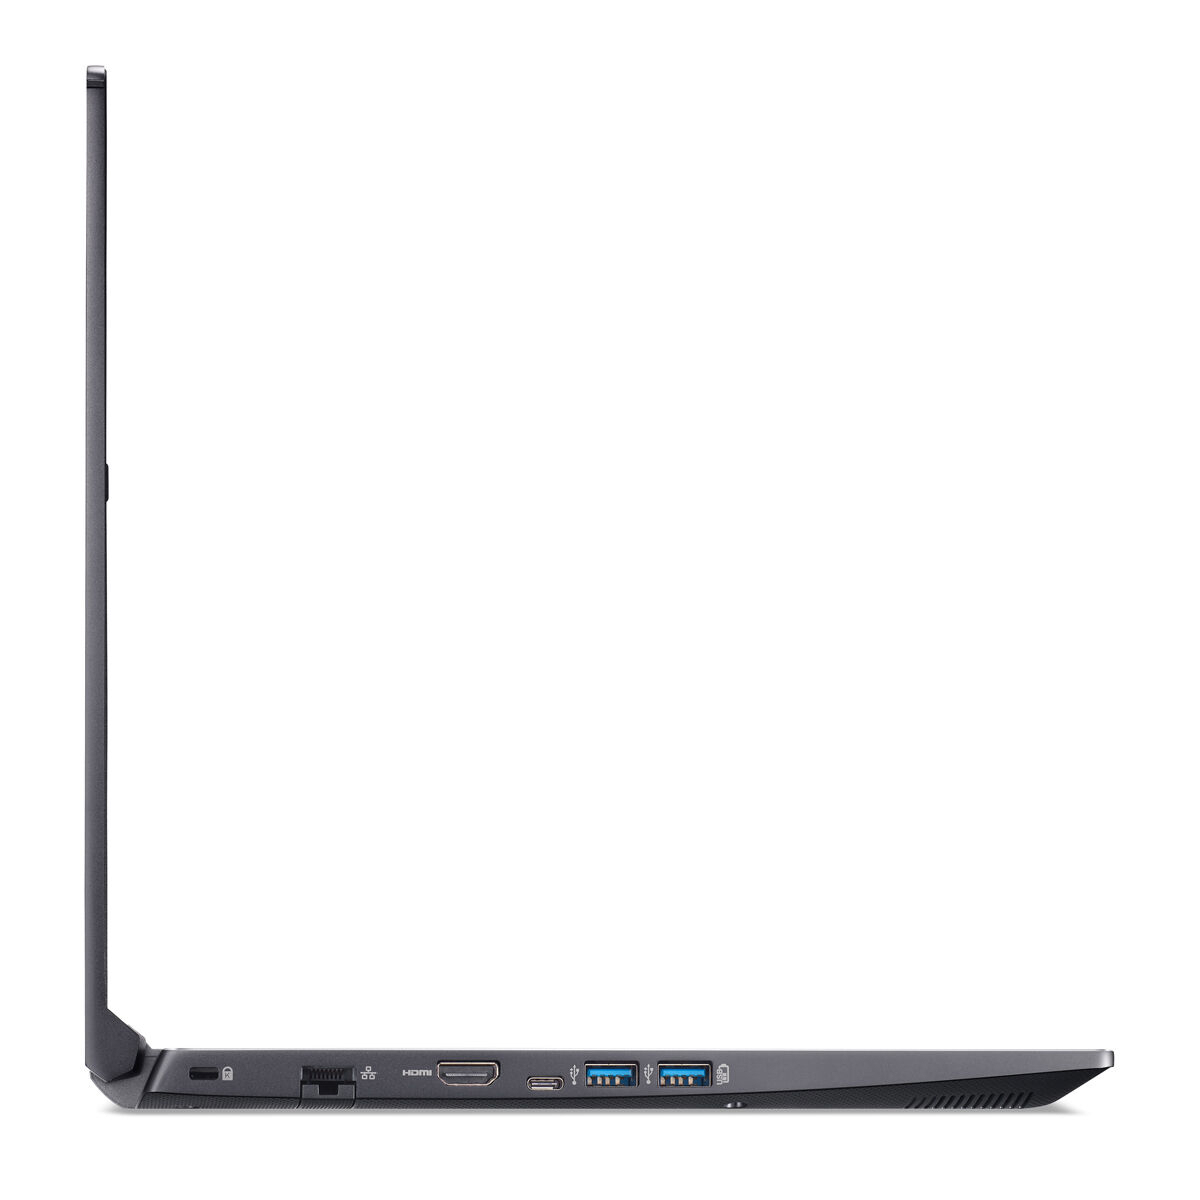
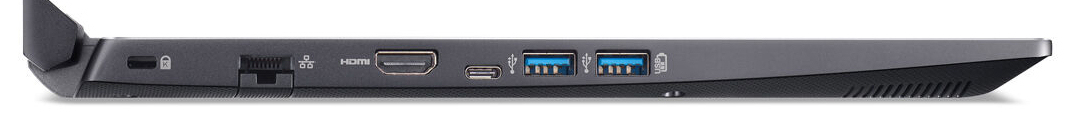
Port configuration

, i7-9750H, WDC PC SN720 SDAPNTW-512G")
, i7-9750H, WDC PC SN720 SDAPNTW-512G")
| |||||||||||||||||||||||||
Homogénéité de la luminosité: 85 %
Valeur mesurée au centre, sur batterie: 343 cd/m²
Contraste: 1559:1 (Valeurs des noirs: 0.22 cd/m²)
ΔE ColorChecker Calman: 3.73 | ∀{0.5-29.43 Ø4.72}
calibrated: 1.43
ΔE Greyscale Calman: 4.24 | ∀{0.09-98 Ø4.97}
100% sRGB (Argyll 1.6.3 3D)
78% AdobeRGB 1998 (Argyll 1.6.3 3D)
87.2% AdobeRGB 1998 (Argyll 3D)
99.9% sRGB (Argyll 3D)
97.9% Display P3 (Argyll 3D)
Gamma: 2.2
CCT: 6329 K
| Acer ConceptD 3 Pro CN315-71P-73W1 IPS, 1920x1080, 15.6" | Lenovo ThinkPad P53s-20N6001NGE IPS, 1920x1080, 15.6" | HP ZBook 15u G6 6TP54EA IPS, 3840x2160, 15.6" | Fujitsu Celsius H780 IPS LED, 1920x1080, 15.6" | Lenovo ThinkPad P1 2019-20QT000RGE IPS LED, 1920x1080, 15.6" | Acer Aspire 7 A715-74G-50U5 IPS, 1920x1080, 15.6" | |
|---|---|---|---|---|---|---|
| Display | -52% | -17% | -25% | -24% | -53% | |
| Display P3 Coverage (%) | 97.9 | 39.58 -60% | 69.2 -29% | 66.3 -32% | 62.4 -36% | 38.3 -61% |
| sRGB Coverage (%) | 99.9 | 57.6 -42% | 97.1 -3% | 85.9 -14% | 91.5 -8% | 57.5 -42% |
| AdobeRGB 1998 Coverage (%) | 87.2 | 40.89 -53% | 69.7 -20% | 62.8 -28% | 63.4 -27% | 39.57 -55% |
| Response Times | -54% | -72% | -19% | 16% | -26% | |
| Response Time Grey 50% / Grey 80% * (ms) | 33 ? | 51.2 ? -55% | 68.8 ? -108% | 38 ? -15% | 34.4 ? -4% | 41 ? -24% |
| Response Time Black / White * (ms) | 22 ? | 33.6 ? -53% | 29.6 -35% | 26.8 ? -22% | 14 ? 36% | 28 ? -27% |
| PWM Frequency (Hz) | 20830 ? | 26040 ? | ||||
| Screen | -53% | -1% | -25% | -2% | -33% | |
| Brightness middle (cd/m²) | 343 | 260 -24% | 451 31% | 271 -21% | 542 58% | 271 -21% |
| Brightness (cd/m²) | 309 | 243 -21% | 434 40% | 260 -16% | 528 71% | 256 -17% |
| Brightness Distribution (%) | 85 | 88 4% | 89 5% | 86 1% | 84 -1% | 91 7% |
| Black Level * (cd/m²) | 0.22 | 0.18 18% | 0.25 -14% | 0.29 -32% | 0.41 -86% | 0.26 -18% |
| Contrast (:1) | 1559 | 1444 -7% | 1804 16% | 934 -40% | 1322 -15% | 1042 -33% |
| Colorchecker dE 2000 * | 3.73 | 6 -61% | 4.4 -18% | 3.9 -5% | 3.5 6% | 3.63 3% |
| Colorchecker dE 2000 max. * | 6.51 | 19.2 -195% | 6.7 -3% | 10.2 -57% | 7.8 -20% | 7.13 -10% |
| Colorchecker dE 2000 calibrated * | 1.43 | 4.3 -201% | 1.8 -26% | 2.9 -103% | 1.3 9% | 4.62 -223% |
| Greyscale dE 2000 * | 4.24 | 4.2 1% | 5 -18% | 2.6 39% | 4.8 -13% | 2.21 48% |
| Gamma | 2.2 100% | 2.49 88% | 2.31 95% | 2.29 96% | 2.33 94% | 2.5 88% |
| CCT | 6329 103% | 6865 95% | 7717 84% | 6517 100% | 7690 85% | 6383 102% |
| Color Space (Percent of AdobeRGB 1998) (%) | 78 | 37.6 -52% | 63 -19% | 56.1 -28% | 58.8 -25% | 36 -54% |
| Color Space (Percent of sRGB) (%) | 100 | 59.2 -41% | 97 -3% | 85.8 -14% | 91.1 -9% | 57 -43% |
| Moyenne finale (programmes/paramètres) | -53% /
-53% | -30% /
-13% | -23% /
-24% | -3% /
-4% | -37% /
-36% |
* ... Moindre est la valeur, meilleures sont les performances
Temps de réponse de l'écran
| ↔ Temps de réponse noir à blanc | ||
|---|---|---|
| 22 ms ... hausse ↗ et chute ↘ combinées | ↗ 14 ms hausse | 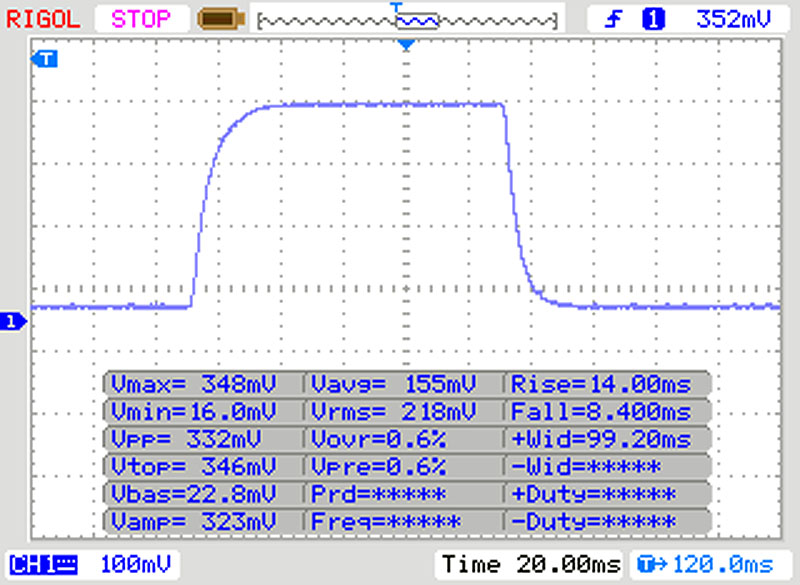 |
| ↘ 8 ms chute | ||
| L'écran montre de bons temps de réponse, mais insuffisant pour du jeu compétitif. En comparaison, tous les appareils testés affichent entre 0.1 (minimum) et 240 (maximum) ms. » 48 % des appareils testés affichent de meilleures performances. Cela signifie que les latences relevées sont moins bonnes que la moyenne (19.9 ms) de tous les appareils testés. | ||
| ↔ Temps de réponse gris 50% à gris 80% | ||
| 33 ms ... hausse ↗ et chute ↘ combinées | ↗ 17 ms hausse | 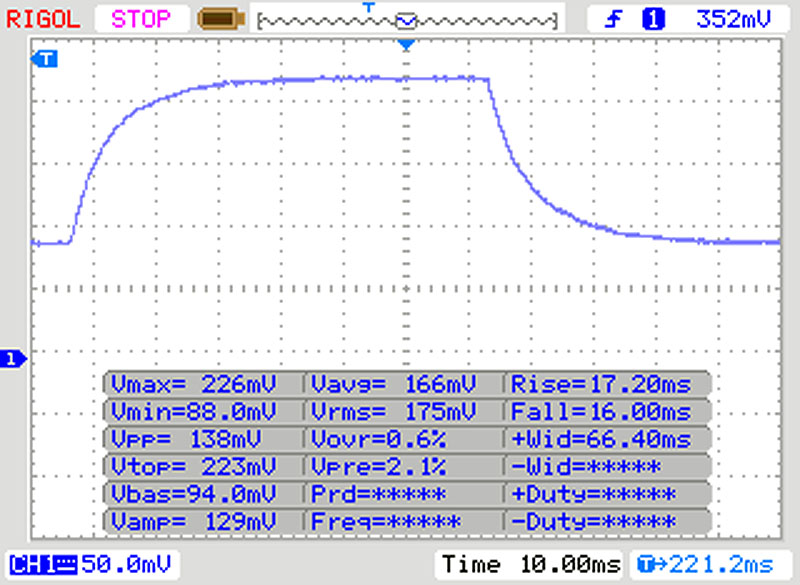 |
| ↘ 16 ms chute | ||
| L'écran souffre de latences très élevées, à éviter pour le jeu. En comparaison, tous les appareils testés affichent entre 0.165 (minimum) et 636 (maximum) ms. » 45 % des appareils testés affichent de meilleures performances. Cela signifie que les latences relevées sont similaires à la moyenne (31.1 ms) de tous les appareils testés. | ||
Scintillement / MLI (Modulation de largeur d'impulsion)
| Scintillement / MLI (Modulation de largeur d'impulsion) non décelé | 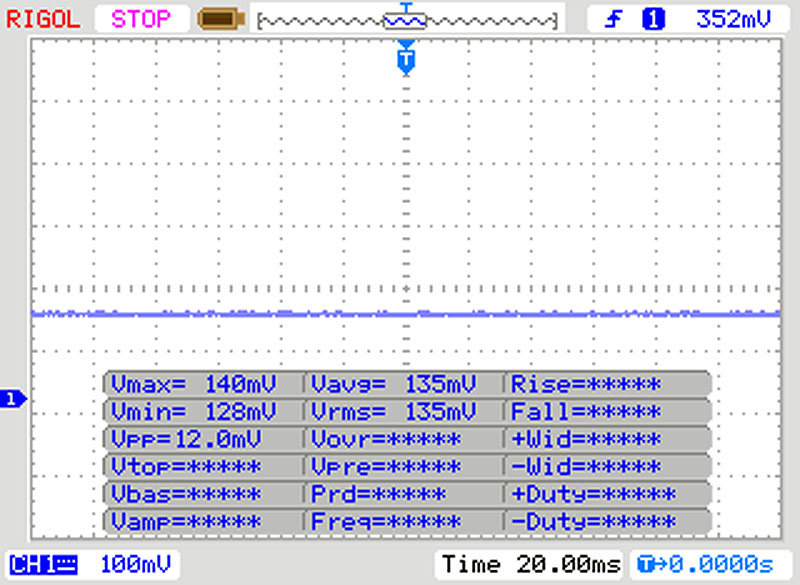 | ||
En comparaison, 52 % des appareils testés n'emploient pas MDI pour assombrir leur écran. Nous avons relevé une moyenne à 7784 (minimum : 5 - maximum : 343500) Hz dans le cas où une MDI était active. | |||
| LibreOffice - 20 Documents To PDF | |
| Moyenne Intel Core i7-9750H (54.5 - 64.7, n=9) | |
| Acer ConceptD 3 Pro CN315-71P-73W1 | |
| Moyenne de la classe Workstation (37.1 - 74.7, n=25, 2 dernières années) | |
| R Benchmark 2.5 - Overall mean | |
| Acer ConceptD 3 Pro CN315-71P-73W1 | |
| Moyenne Intel Core i7-9750H (0.608 - 0.695, n=14) | |
| Moyenne de la classe Workstation (0.3825 - 0.603, n=25, 2 dernières années) | |
| Mozilla Kraken 1.1 - Total | |
| HP ZBook 15u G6 6TP54EA | |
| Acer Aspire 7 A715-74G-50U5 (Edge 44) | |
| Acer ConceptD 3 Pro CN315-71P-73W1 (Edge 44) | |
| Acer ConceptD 3 Pro CN315-71P-73W1 (Chrome 82) | |
| Moyenne Intel Core i7-9750H (845 - 1713, n=54) | |
| Lenovo ThinkPad P1 2019-20QT000RGE (Edge) | |
| Moyenne de la classe Workstation (411 - 538, n=25, 2 dernières années) | |
| JetStream 1.1 - 1.1 Total | |
| Fujitsu Celsius H780 (Edge) | |
| Acer ConceptD 3 Pro CN315-71P-73W1 (Edge 44) | |
| Moyenne Intel Core i7-9750H (212 - 280, n=47) | |
| Acer Aspire 7 A715-74G-50U5 (Edge 44) | |
| HP ZBook 15u G6 6TP54EA | |
* ... Moindre est la valeur, meilleures sont les performances
| PCMark 8 Home Score Accelerated v2 | 4024 points | |
| PCMark 8 Creative Score Accelerated v2 | 3753 points | |
| PCMark 8 Work Score Accelerated v2 | 5341 points | |
| PCMark 10 Score | 4558 points | |
Aide | ||
| DPC Latencies / LatencyMon - interrupt to process latency (max), Web, Youtube, Prime95 | |
| Acer ConceptD 3 Pro CN315-71P-73W1 | |
* ... Moindre est la valeur, meilleures sont les performances

| Acer ConceptD 3 Pro CN315-71P-73W1 WDC PC SN720 SDAPNTW-512G | Lenovo ThinkPad P53s-20N6001NGE Intel SSD 760p SSDPEKKW256G8 | HP ZBook 15u G6 6TP54EA Samsung SSD PM981 MZVLB512HAJQ | Fujitsu Celsius H780 Samsung SSD PM981 MZVLB512HAJQ | Lenovo ThinkPad P1 2019-20QT000RGE WDC PC SN720 SDAQNTW-512G | Acer Aspire 7 A715-74G-50U5 WDC PC SN520 SDAPNUW-512G | Moyenne WDC PC SN720 SDAPNTW-512G | Moyenne de la classe Workstation | |
|---|---|---|---|---|---|---|---|---|
| CrystalDiskMark 5.2 / 6 | 30% | 3% | -13% | 16% | -15% | -4% | 94% | |
| Write 4K (MB/s) | 113.2 | 195.9 73% | 156 38% | 98.3 -13% | 162.2 43% | 113.3 0% | 110 ? -3% | 168.1 ? 48% |
| Read 4K (MB/s) | 31.1 | 74.9 141% | 45.73 47% | 40.18 29% | 43.71 41% | 42.7 37% | 36.9 ? 19% | 69.6 ? 124% |
| Write Seq (MB/s) | 2540 | 1194 -53% | 1158 -54% | 1777 -30% | 2441 -4% | 1457 -43% | 1976 ? -22% | 3868 ? 52% |
| Read Seq (MB/s) | 2005 | 2309 15% | 1132 -44% | 1247 -38% | 1753 -13% | 1432 -29% | 1710 ? -15% | 4279 ? 113% |
| Write 4K Q32T1 (MB/s) | 331.4 | 507 53% | 369.2 11% | 344.7 4% | 397.6 20% | 347.5 5% | 339 ? 2% | 495 ? 49% |
| Read 4K Q32T1 (MB/s) | 368.3 | 624 69% | 573 56% | 383.1 4% | 520 41% | 382.6 4% | 417 ? 13% | 604 ? 64% |
| Write Seq Q32T1 (MB/s) | 2535 | 1206 -52% | 1969 -22% | 2019 -20% | 2519 -1% | 1454 -43% | 2218 ? -13% | 6486 ? 156% |
| Read Seq Q32T1 (MB/s) | 3427 | 3091 -10% | 3138 -8% | 2076 -39% | 3448 1% | 1726 -50% | 2940 ? -14% | 8420 ? 146% |
Continuous load read: DiskSpd Read Loop, Queue Depth 8
| 3DMark 06 Standard Score | 36258 points | |
| 3DMark 11 Performance | 11919 points | |
| 3DMark Ice Storm Standard Score | 103033 points | |
| 3DMark Cloud Gate Standard Score | 26945 points | |
| 3DMark Fire Strike Score | 7783 points | |
| 3DMark Time Spy Score | 3474 points | |
Aide | ||
| BioShock Infinite - 1920x1080 Ultra Preset, DX11 (DDOF) | |
| Acer Aspire 7 A715-74G-50U5 | |
| Acer ConceptD 3 Pro CN315-71P-73W1 | |
| Moyenne NVIDIA Quadro T1000 (Laptop) (72.9 - 86.6, n=2) | |
| Lenovo ThinkPad P1 2019-20QT000RGE | |
| Lenovo ThinkPad P53s-20N6001NGE | |
| HP ZBook 15u G6 6TP54EA | |
| Gears Tactics - 1920x1080 High Preset | |
| Acer ConceptD 3 Pro CN315-71P-73W1 | |
| Moyenne NVIDIA Quadro T1000 (Laptop) (n=1) | |
| Doom Eternal - 1920x1080 High Preset | |
| Acer ConceptD 3 Pro CN315-71P-73W1 | |
| Moyenne NVIDIA Quadro T1000 (Laptop) (n=1) | |
| Red Dead Redemption 2 - 1920x1080 Medium Settings | |
| Acer ConceptD 3 Pro CN315-71P-73W1 | |
| Moyenne NVIDIA Quadro T1000 (Laptop) (n=1) | |
| Star Wars Jedi Fallen Order - 1920x1080 Epic Preset | |
| Acer ConceptD 3 Pro CN315-71P-73W1 | |
| Moyenne NVIDIA Quadro T1000 (Laptop) (n=1) | |
| Bas | Moyen | Élevé | Ultra | |
|---|---|---|---|---|
| BioShock Infinite (2013) | 316.4 | 241 | 216.3 | 86.6 |
| GTA V (2015) | 170.1 | 153.9 | 93.8 | 41.7 |
| The Witcher 3 (2015) | 190.7 | 115.9 | 62.8 | 37.9 |
| Dota 2 Reborn (2015) | 141.4 | 124.8 | 113.6 | 106.7 |
| Rainbow Six Siege (2015) | 244.3 | 197.9 | 139.3 | 117.9 |
| For Honor (2017) | 199.8 | 77.5 | 74.3 | 56.7 |
| Final Fantasy XV Benchmark (2018) | 56.1 | 49.2 | 34 | |
| X-Plane 11.11 (2018) | 79.7 | 66.2 | 57.1 | |
| World of Tanks enCore (2018) | 491.9 | 199.3 | 77.1 | |
| Far Cry 5 (2018) | 107 | 62 | 57 | 53 |
| Shadow of the Tomb Raider (2018) | 101 | 58 | 50 | 45 |
| Assassin´s Creed Odyssey (2018) | 82 | 55 | 50 | 29 |
| Battlefield V (2018) | 138.1 | 76.5 | 66.6 | 59.4 |
| Apex Legends (2019) | 144 | 92.7 | 69 | 68.7 |
| Metro Exodus (2019) | 93.3 | 43.4 | 31.9 | 25.5 |
| Dirt Rally 2.0 (2019) | 232.8 | 100.5 | 79.4 | 42.5 |
| The Division 2 (2019) | 111 | 61 | 48 | 35 |
| Anno 1800 (2019) | 94.5 | 73.4 | 45.2 | 23.1 |
| Rage 2 (2019) | 123.7 | 55.2 | 45.7 | 45.1 |
| Total War: Three Kingdoms (2019) | 182.3 | 62.5 | 37.5 | 25.6 |
| F1 2019 (2019) | 178 | 105 | 92 | 79 |
| Control (2019) | 136.8 | 42.4 | 31.2 | |
| Borderlands 3 (2019) | 117.9 | 58.7 | 38 | 28.5 |
| FIFA 20 (2019) | 208 | 171.3 | 160.3 | 148.9 |
| Ghost Recon Breakpoint (2019) | 93 | 53 | 47 | 32 |
| GRID 2019 (2019) | 125.4 | 76.8 | 65.2 | 42.8 |
| Call of Duty Modern Warfare 2019 (2019) | 96.7 | 61.2 | 50.8 | 44 |
| Need for Speed Heat (2019) | 86 | 60.5 | 51.9 | 46.9 |
| Star Wars Jedi Fallen Order (2019) | 67.3 | 57.6 | 50.4 | |
| Red Dead Redemption 2 (2019) | 87.9 | 46.7 | 29.9 | 19.4 |
| Escape from Tarkov (2020) | 121.4 | 87.9 | 67.8 | 56 |
| Hunt Showdown (2020) | 134.1 | 51 | 44.4 | |
| Doom Eternal (2020) | 150 | 78 | 64.3 | |
| Gears Tactics (2020) | 190.9 | 91.8 | 58.4 | 43.5 |
Degré de la nuisance sonore
| Au repos |
| 31.2 / 31.2 / 31.5 dB(A) |
| Fortement sollicité |
| 38.4 / 41.2 dB(A) |
 | ||
30 dB silencieux 40 dB(A) audible 50 dB(A) bruyant |
||
min: | ||
(±) La température maximale du côté supérieur est de 42 °C / 108 F, par rapport à la moyenne de 38.2 °C / 101 F, allant de 22.2 à 69.8 °C pour la classe Workstation.
(-) Le fond chauffe jusqu'à un maximum de 50.6 °C / 123 F, contre une moyenne de 41.1 °C / 106 F
(+) En utilisation inactive, la température moyenne du côté supérieur est de 24.4 °C / 76 F, par rapport à la moyenne du dispositif de 32 °C / 90 F.
(±) En jouant à The Witcher 3, la température moyenne du côté supérieur est de 36.8 °C / 98 F, alors que la moyenne de l'appareil est de 32 °C / 90 F.
(+) Les repose-poignets et le pavé tactile sont plus froids que la température de la peau avec un maximum de 29.6 °C / 85.3 F et sont donc froids au toucher.
(±) La température moyenne de la zone de l'appui-paume de dispositifs similaires était de 27.8 °C / 82 F (-1.8 °C / #-3.3 F).
Acer ConceptD 3 Pro CN315-71P-73W1 analyse audio
(-) | haut-parleurs pas très forts (63 dB)
Basses 100 - 315 Hz
(-) | presque aucune basse - en moyenne 22.7% plus bas que la médiane
(±) | la linéarité des basses est moyenne (11.6% delta à la fréquence précédente)
Médiums 400 - 2000 Hz
(+) | médiane équilibrée - seulement 1.7% de la médiane
(+) | les médiums sont linéaires (4.7% delta à la fréquence précédente)
Aiguës 2 - 16 kHz
(+) | des sommets équilibrés - à seulement 1.8% de la médiane
(+) | les aigus sont linéaires (5% delta à la fréquence précédente)
Globalement 100 - 16 000 Hz
(±) | la linéarité du son global est moyenne (21.2% de différence avec la médiane)
Par rapport à la même classe
» 76% de tous les appareils testés de cette catégorie étaient meilleurs, 6% similaires, 18% pires
» Le meilleur avait un delta de 7%, la moyenne était de 17%, le pire était de 35%.
Par rapport à tous les appareils testés
» 59% de tous les appareils testés étaient meilleurs, 7% similaires, 34% pires
» Le meilleur avait un delta de 4%, la moyenne était de 24%, le pire était de 134%.
Lenovo ThinkPad P1 2019-20QT000RGE analyse audio
(±) | le niveau sonore du haut-parleur est moyen mais bon (74# dB)
Basses 100 - 315 Hz
(±) | basse réduite - en moyenne 10.6% inférieure à la médiane
(±) | la linéarité des basses est moyenne (13% delta à la fréquence précédente)
Médiums 400 - 2000 Hz
(+) | médiane équilibrée - seulement 4.4% de la médiane
(+) | les médiums sont linéaires (5.9% delta à la fréquence précédente)
Aiguës 2 - 16 kHz
(+) | des sommets équilibrés - à seulement 2.4% de la médiane
(±) | la linéarité des aigus est moyenne (8.2% delta à la fréquence précédente)
Globalement 100 - 16 000 Hz
(±) | la linéarité du son global est moyenne (16.7% de différence avec la médiane)
Par rapport à la même classe
» 46% de tous les appareils testés de cette catégorie étaient meilleurs, 9% similaires, 45% pires
» Le meilleur avait un delta de 7%, la moyenne était de 17%, le pire était de 35%.
Par rapport à tous les appareils testés
» 29% de tous les appareils testés étaient meilleurs, 7% similaires, 64% pires
» Le meilleur avait un delta de 4%, la moyenne était de 24%, le pire était de 134%.
| Éteint/en veille | |
| Au repos | |
| Fortement sollicité |
|
Légende:
min: | |
Points positifs
Points négatifs
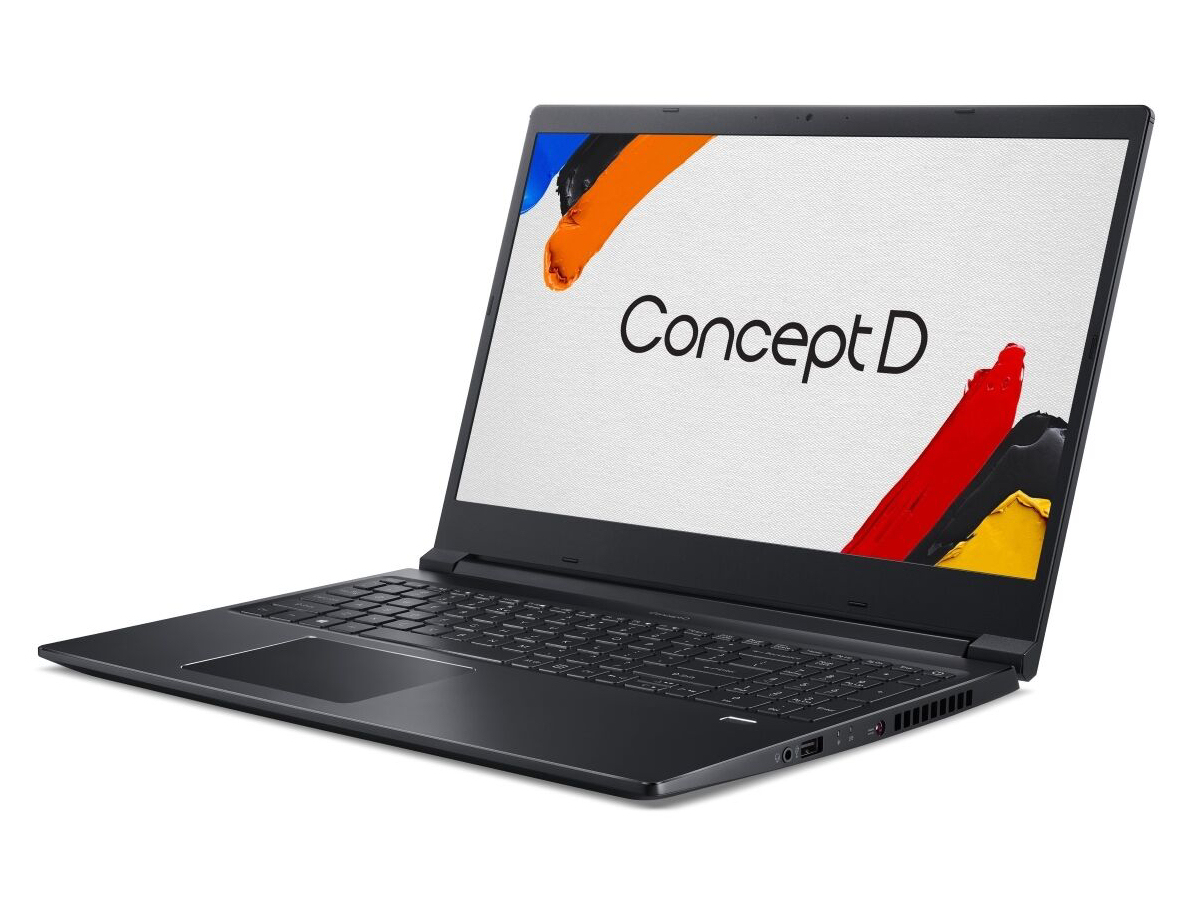
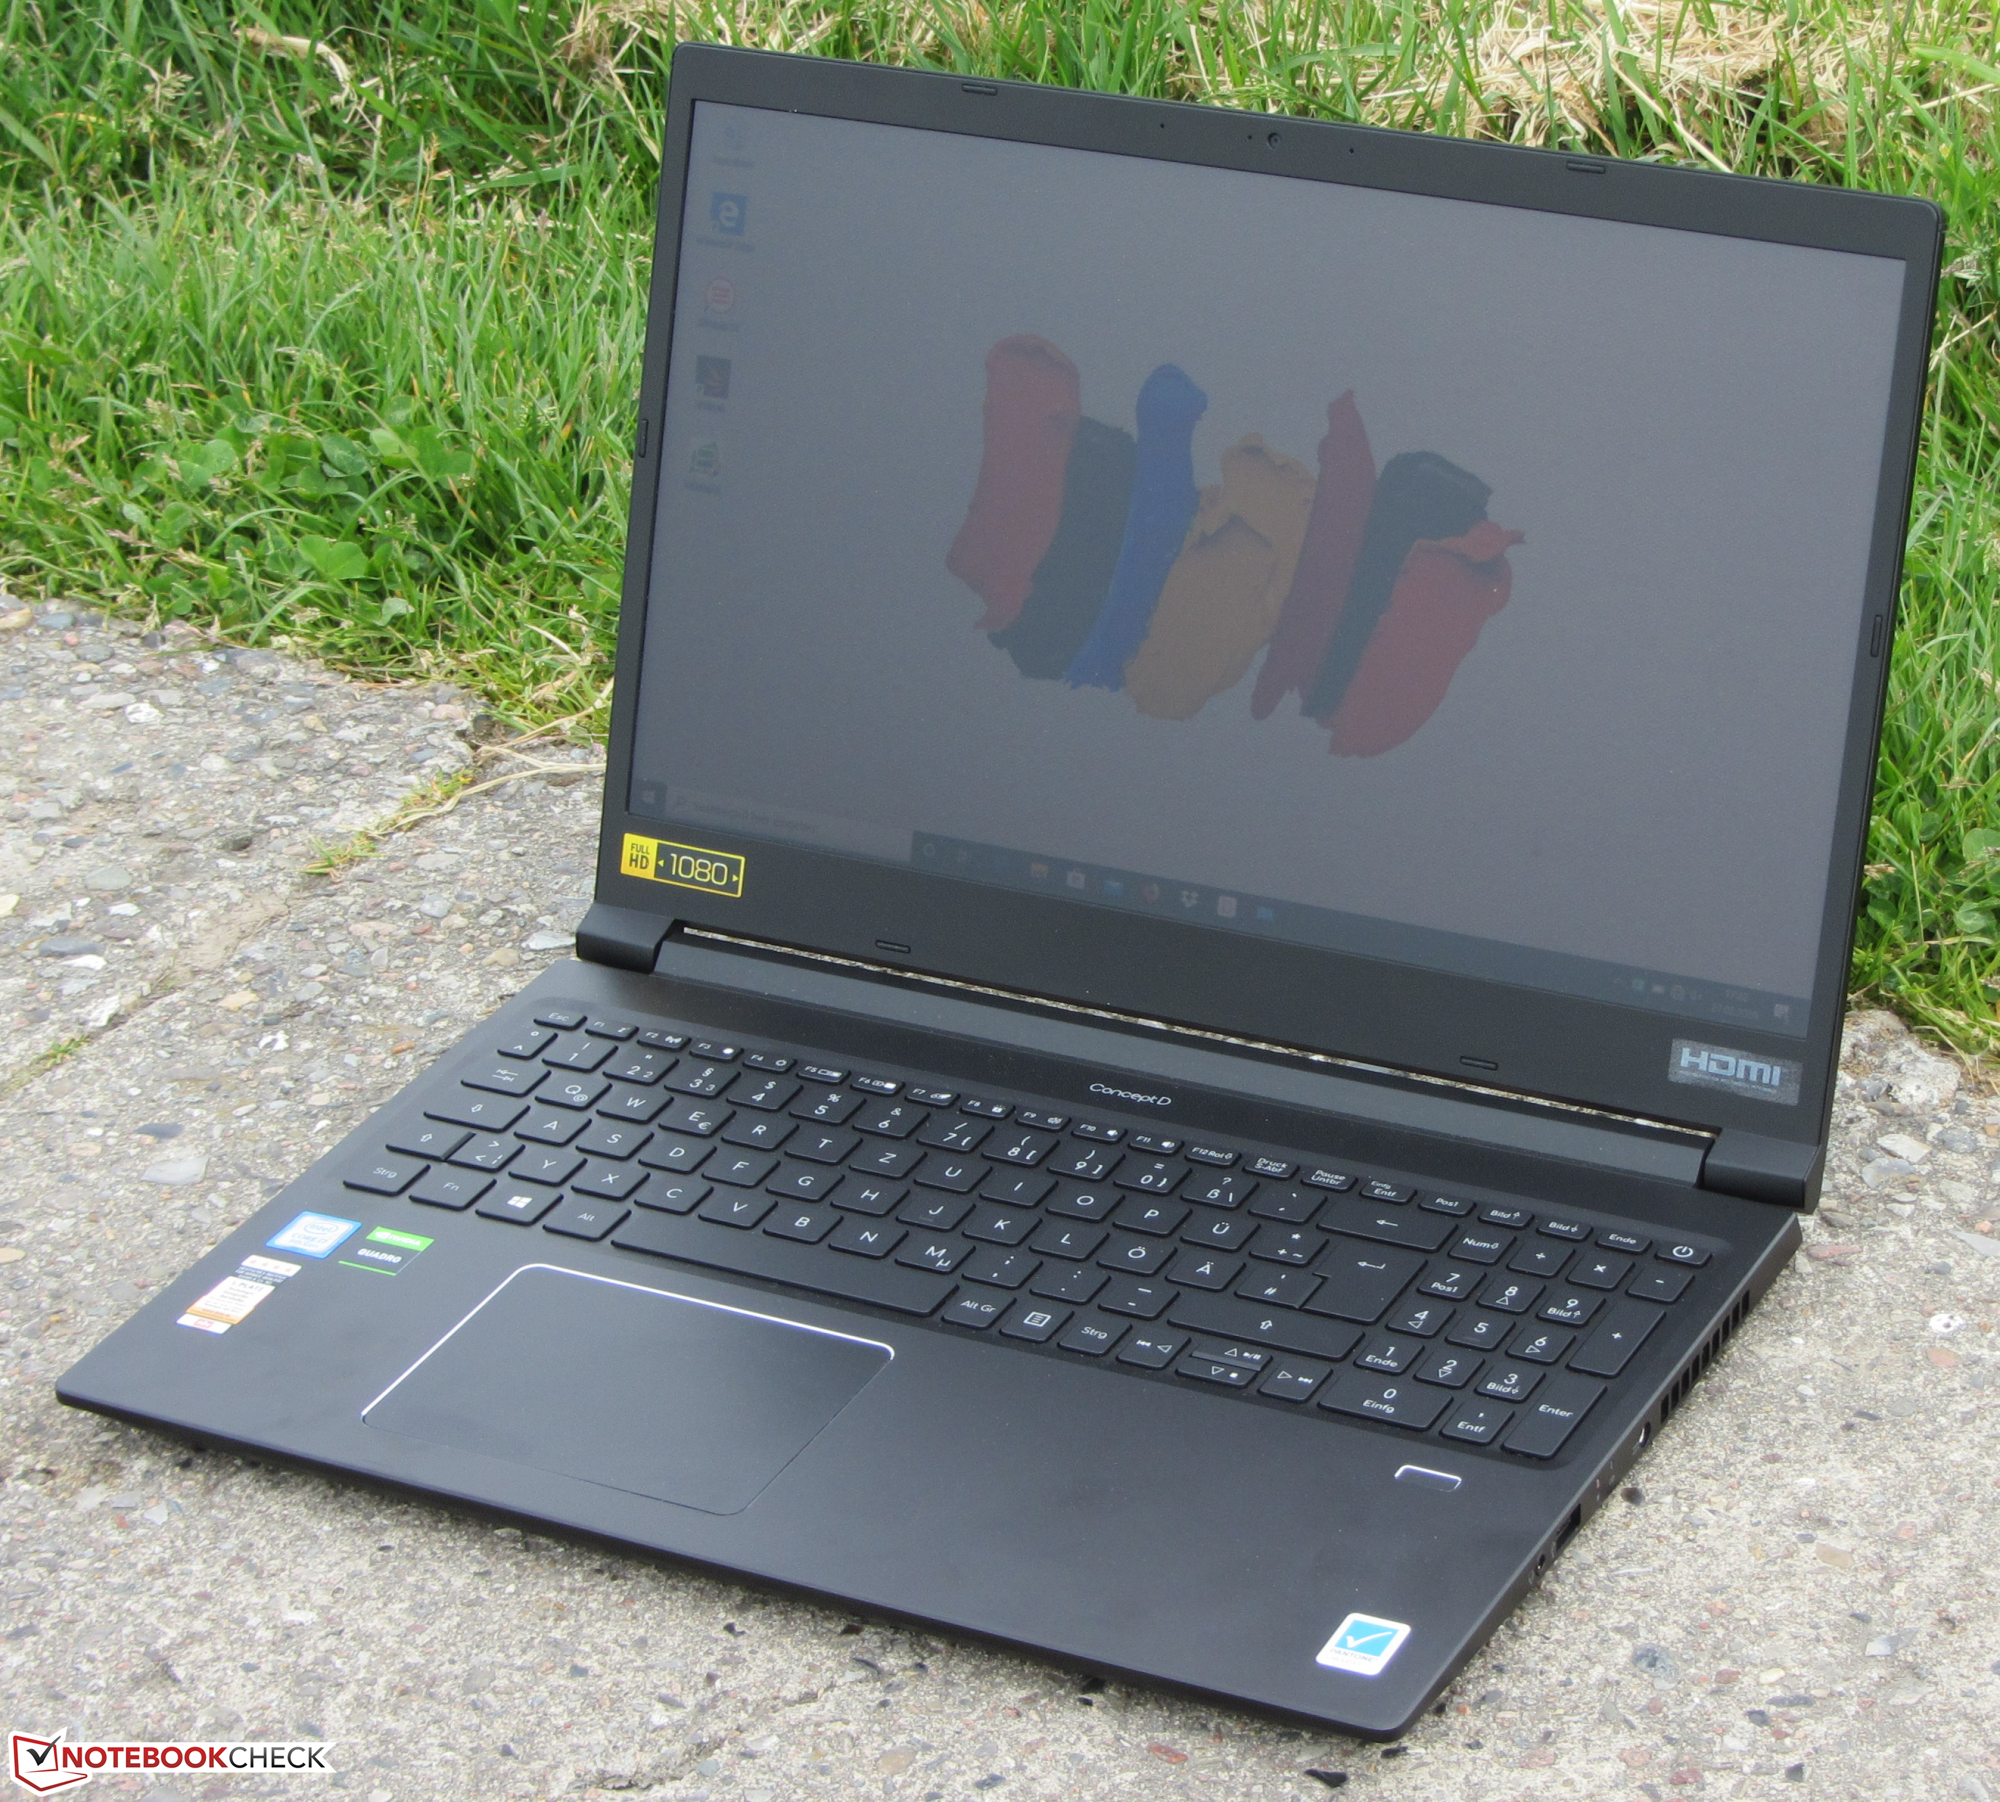
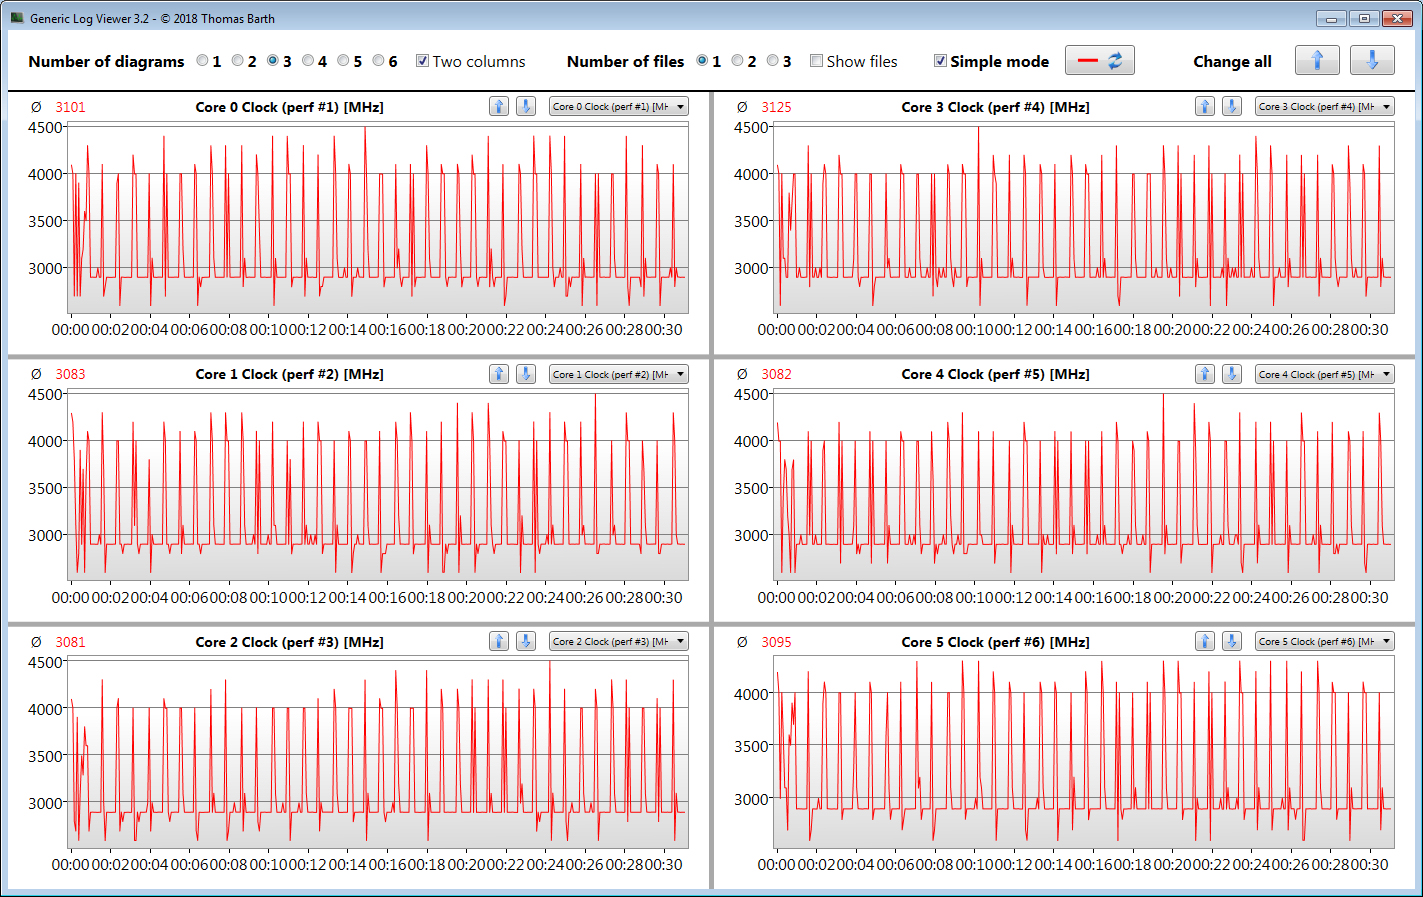
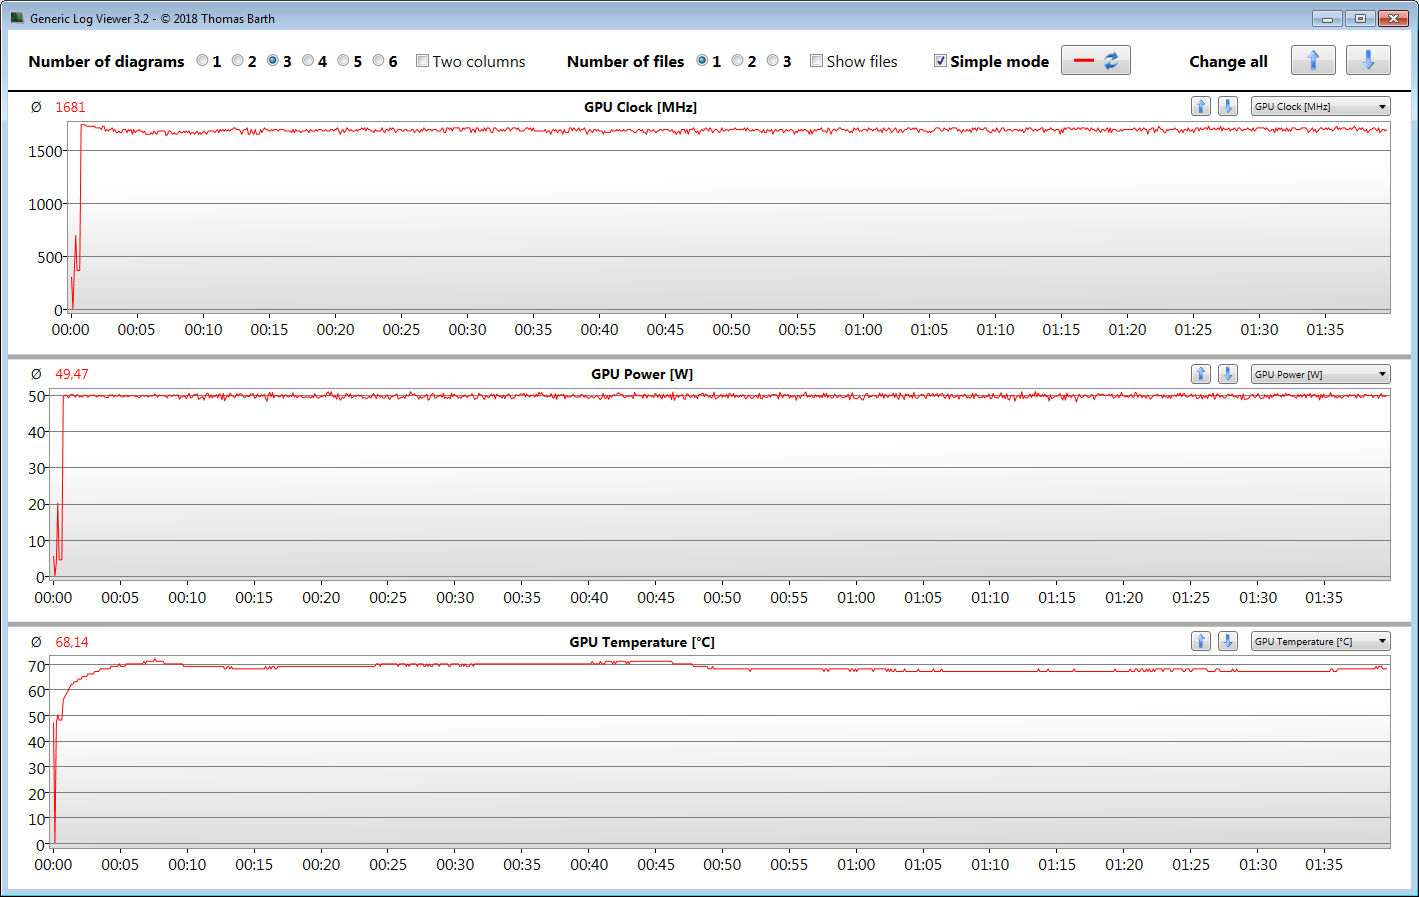
Avec un processeur Core i7-9750H et une carte graphique Quadro T1000, cette station de travail intègre des composants récents. Et même si ce n'est pas un portable de jeu, les composants intégrés permettent de jouer fluidement à tous les jeux récents.
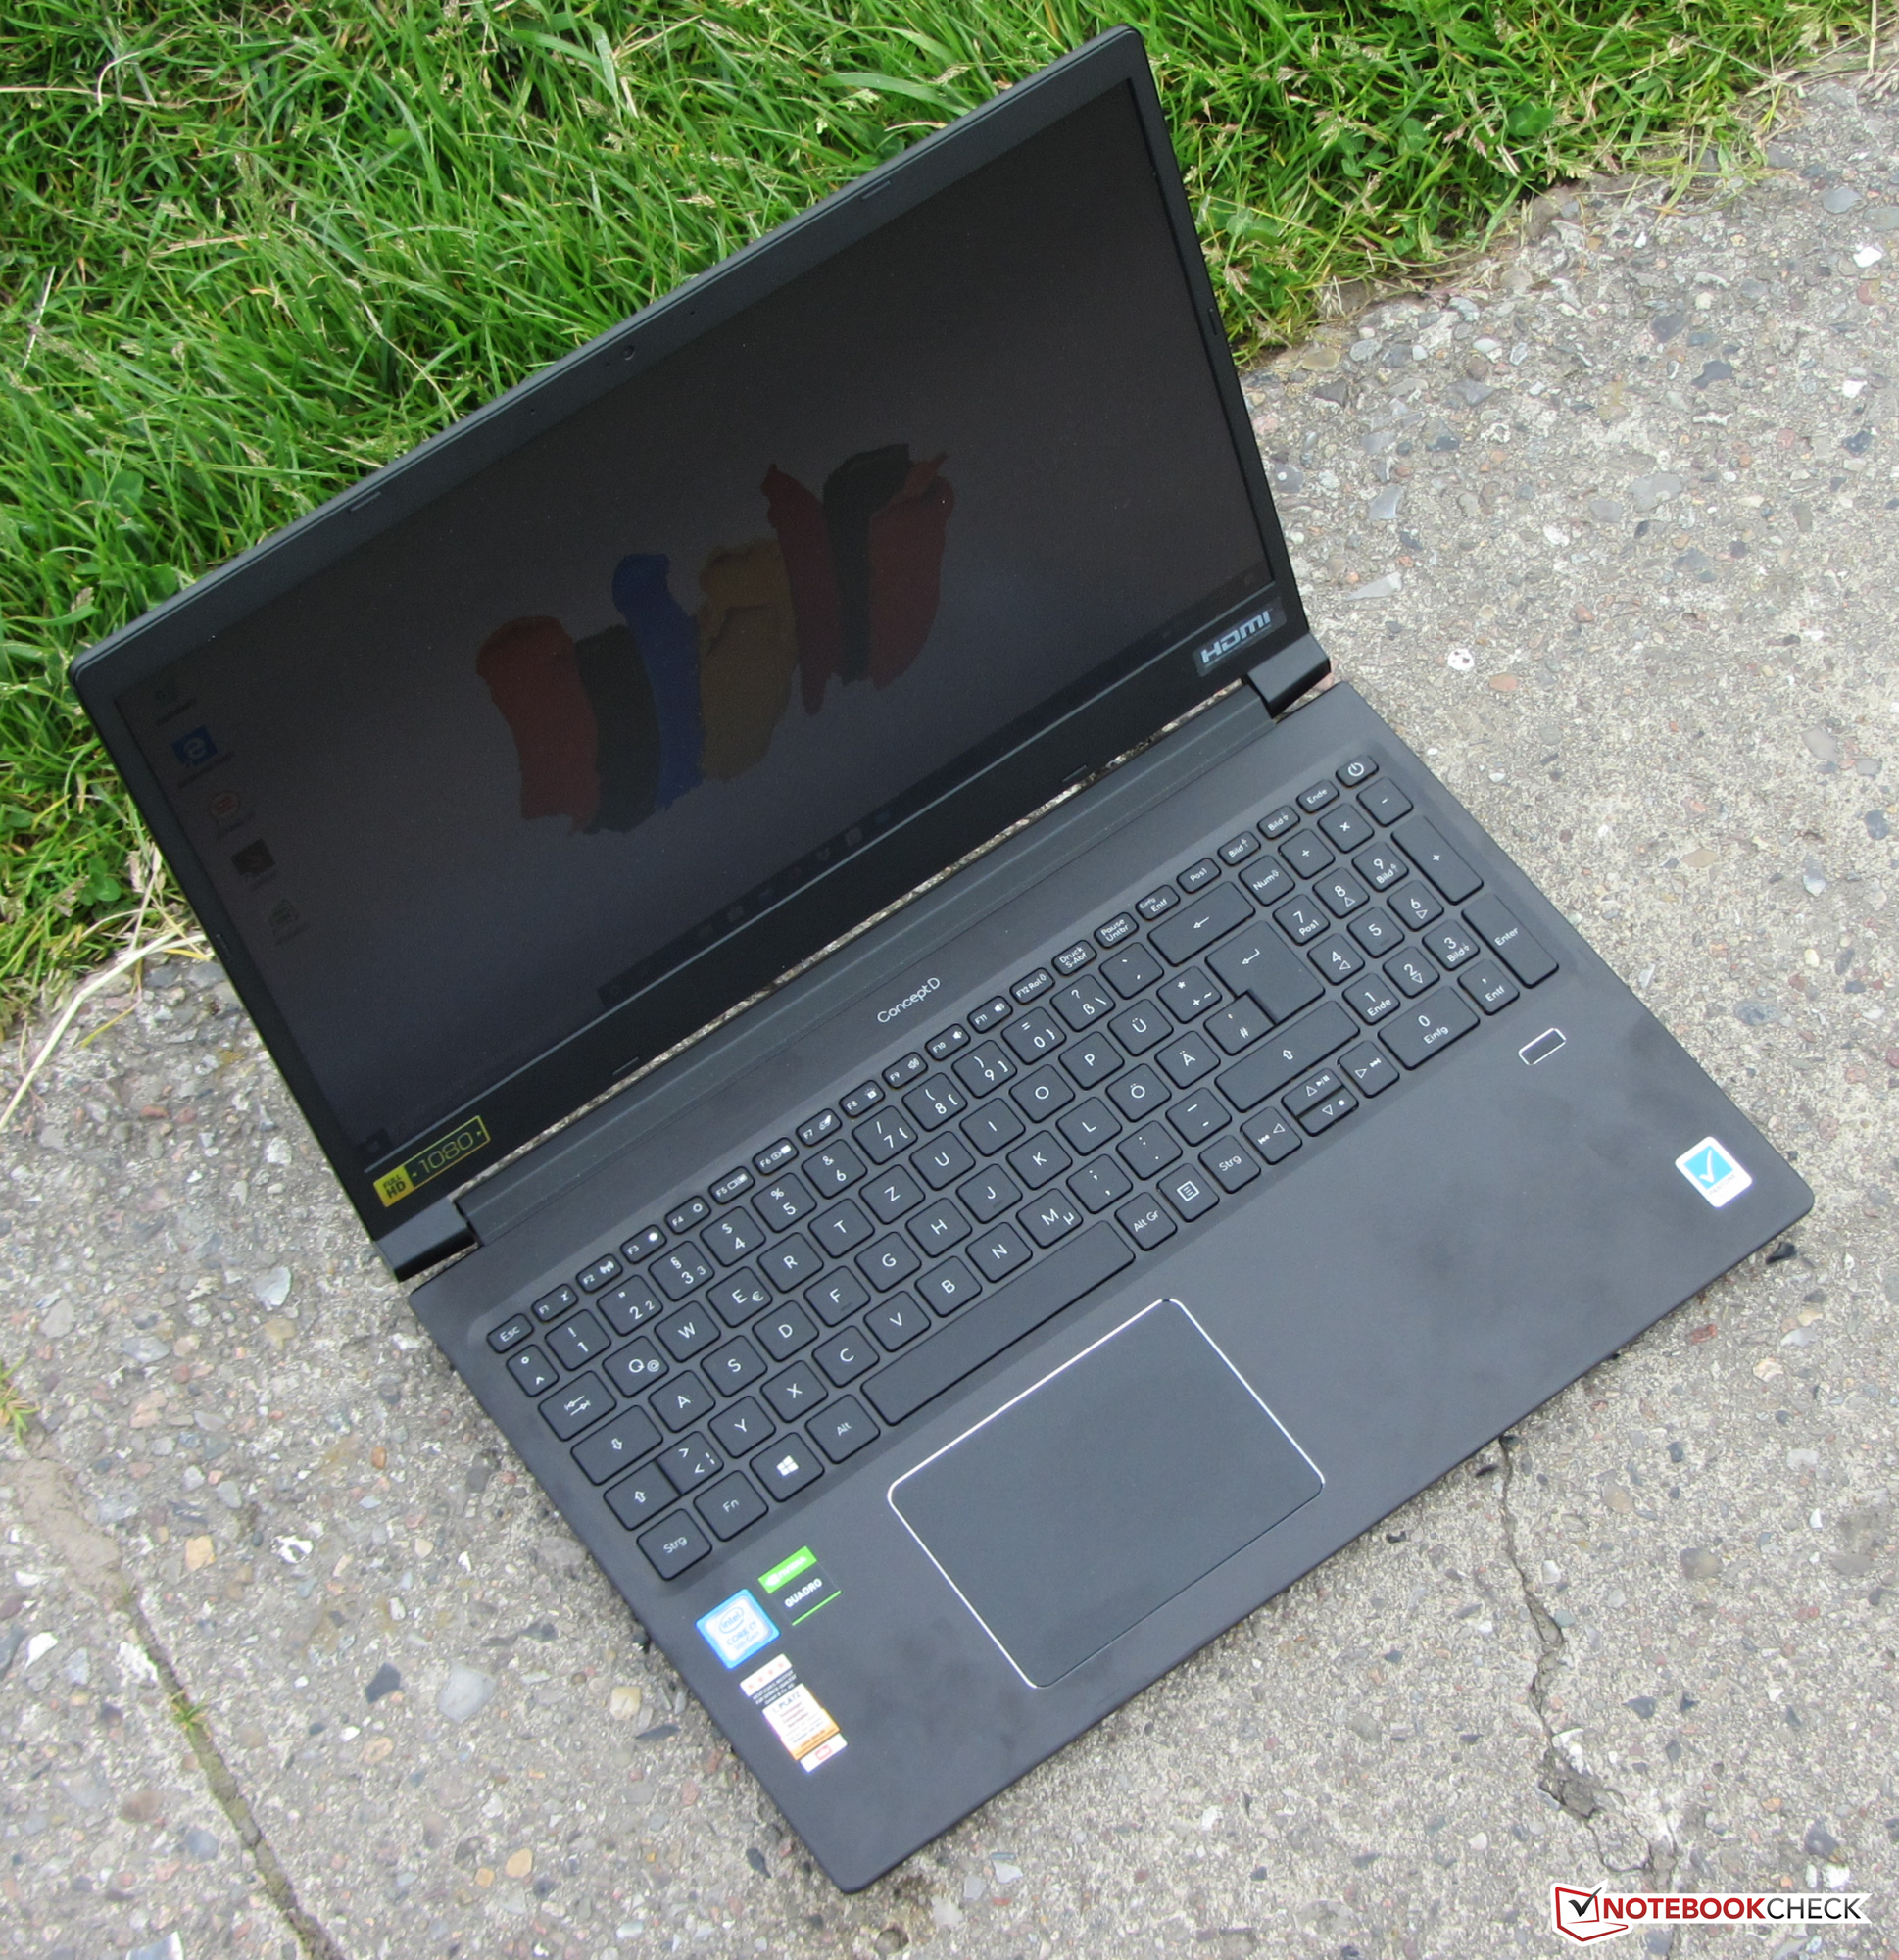
Avec le ConceptD 3 Pro CN315-71P, Acer propose une station de 15,6 pouces équilibrée, qui possède également une bonne autonomie.
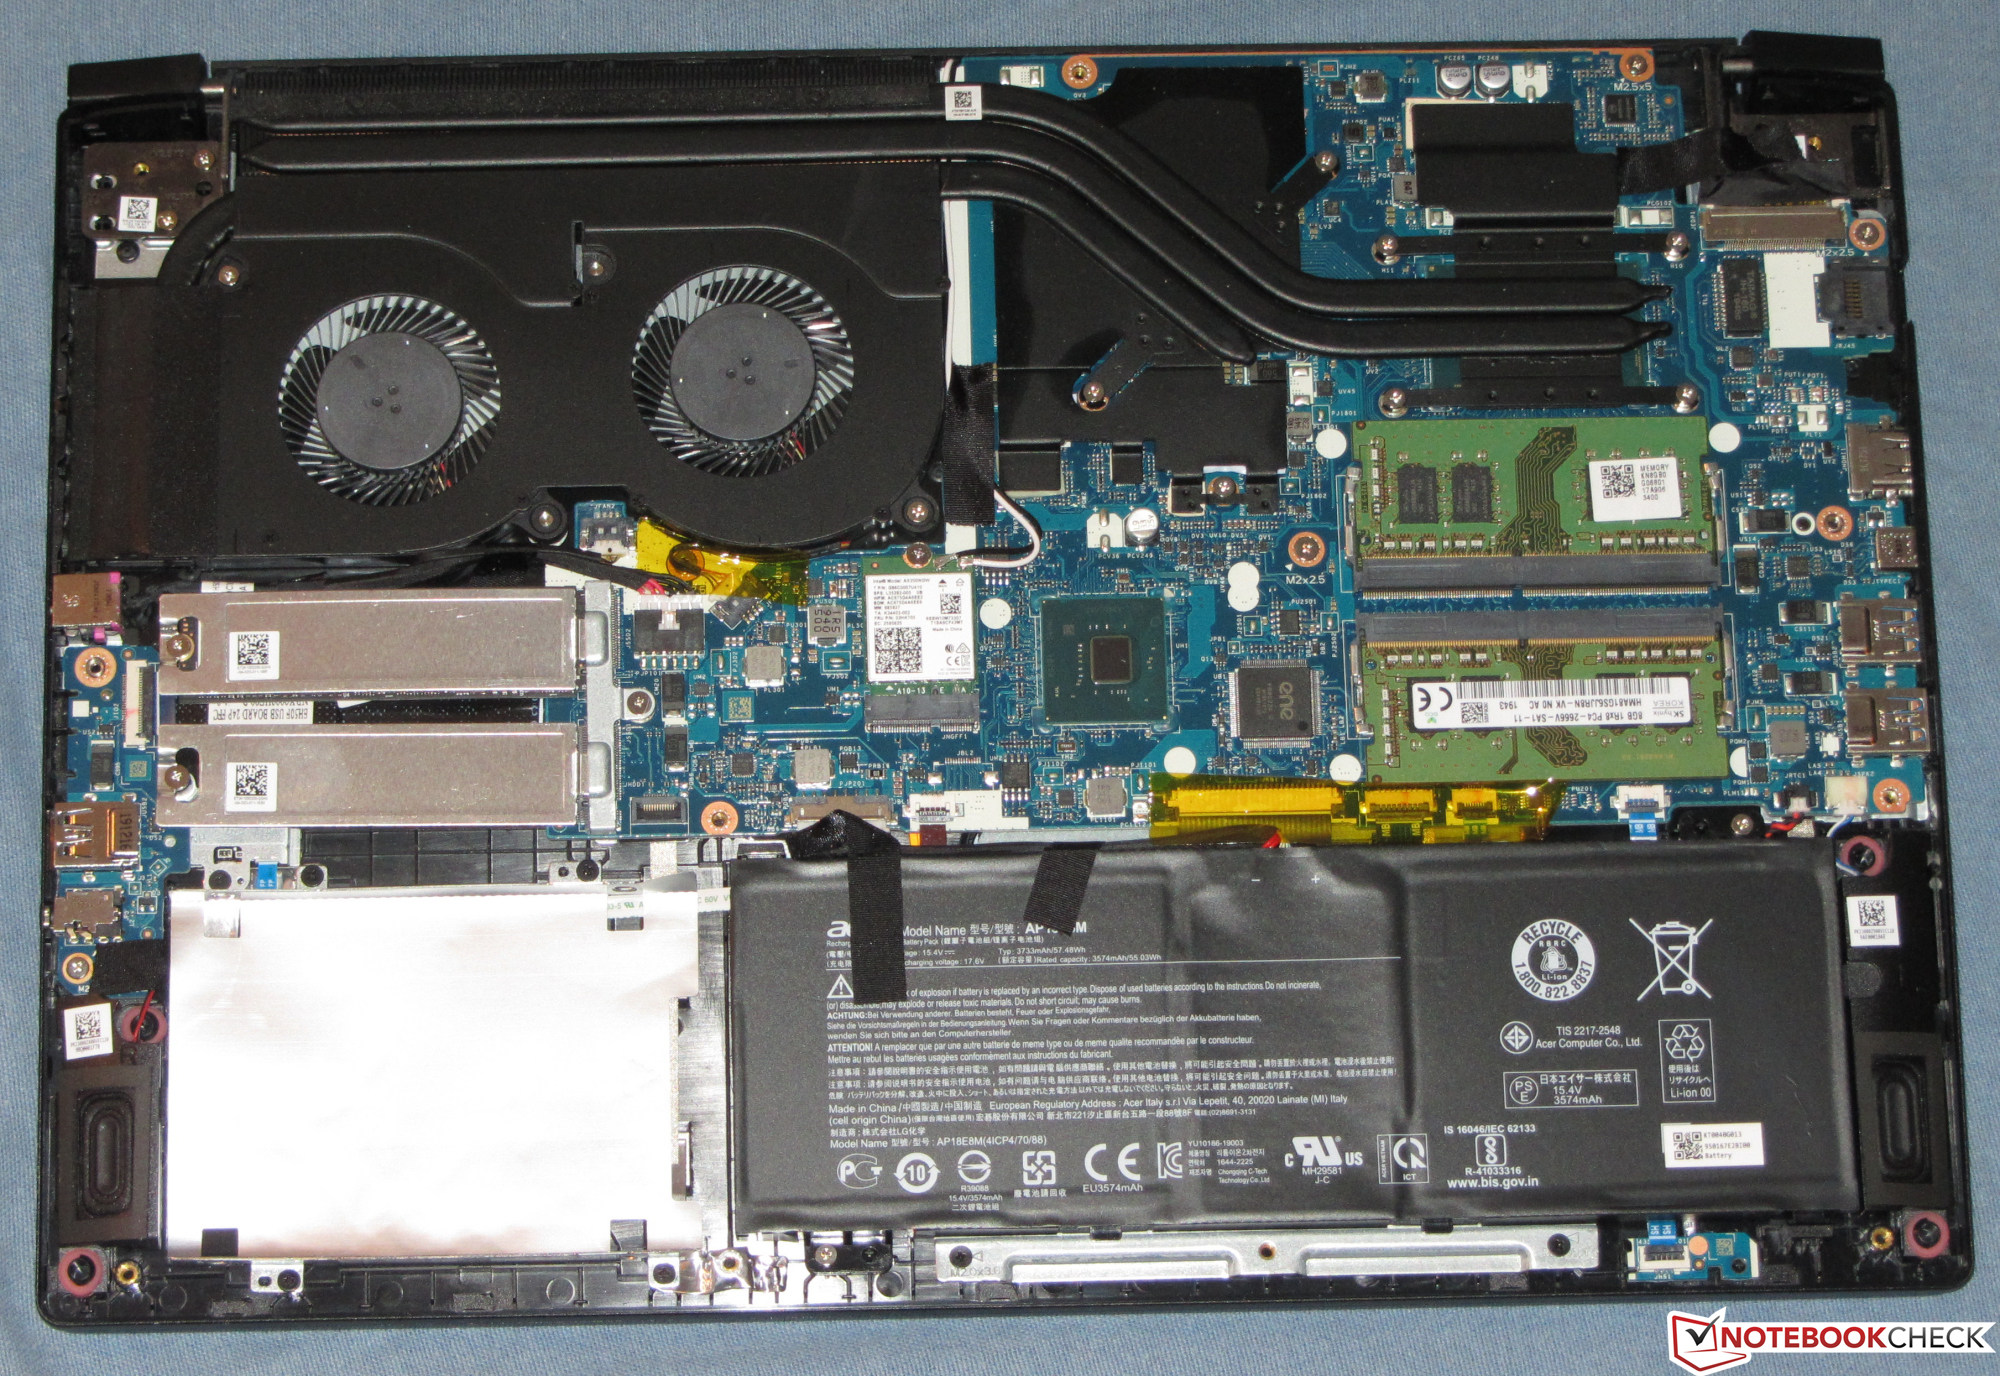
Le SSD NVMe de 512 Go permet au système d'être réactif. Il peut être changé sans problème. Et l'appareil intègre un deuxième emplacement SSD M.2 2280 (NVMe / SATA) ainsi qu'un implacement pour disque de 2,5 pouces.
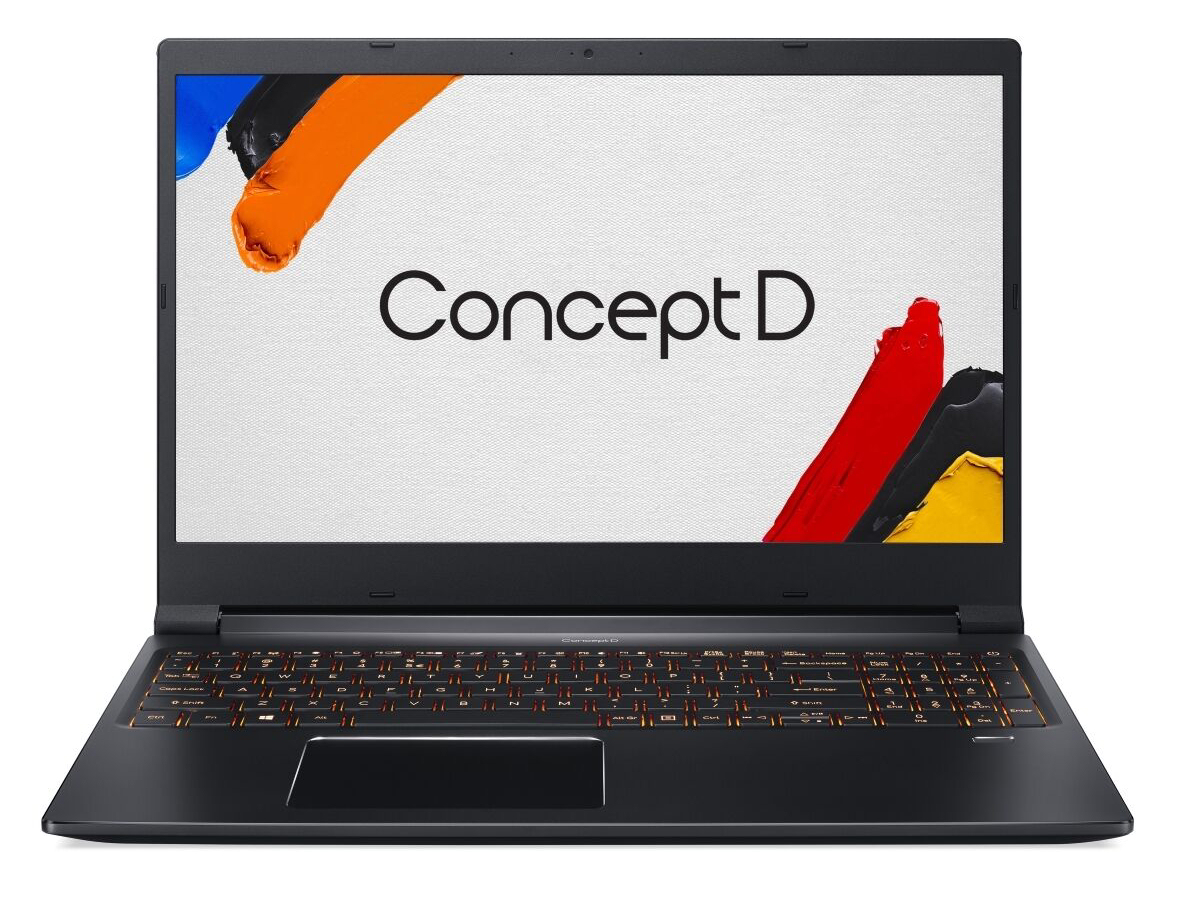
L'écran IPS FHD mat possède un bon contraste, des angles de vision stables, une bonne luminosité, et une bonne fidélité des couleurs - soulignée par la certification Pantone. L'espace colorimétrique sRVB est couvert à 100 %. Le PC portable Acer ne manque pas d'autonomie, tenant 8h04 dans notre test WLAN réaliste. Le clavier est rétroéclairé, et assez bon pour le quotidien.
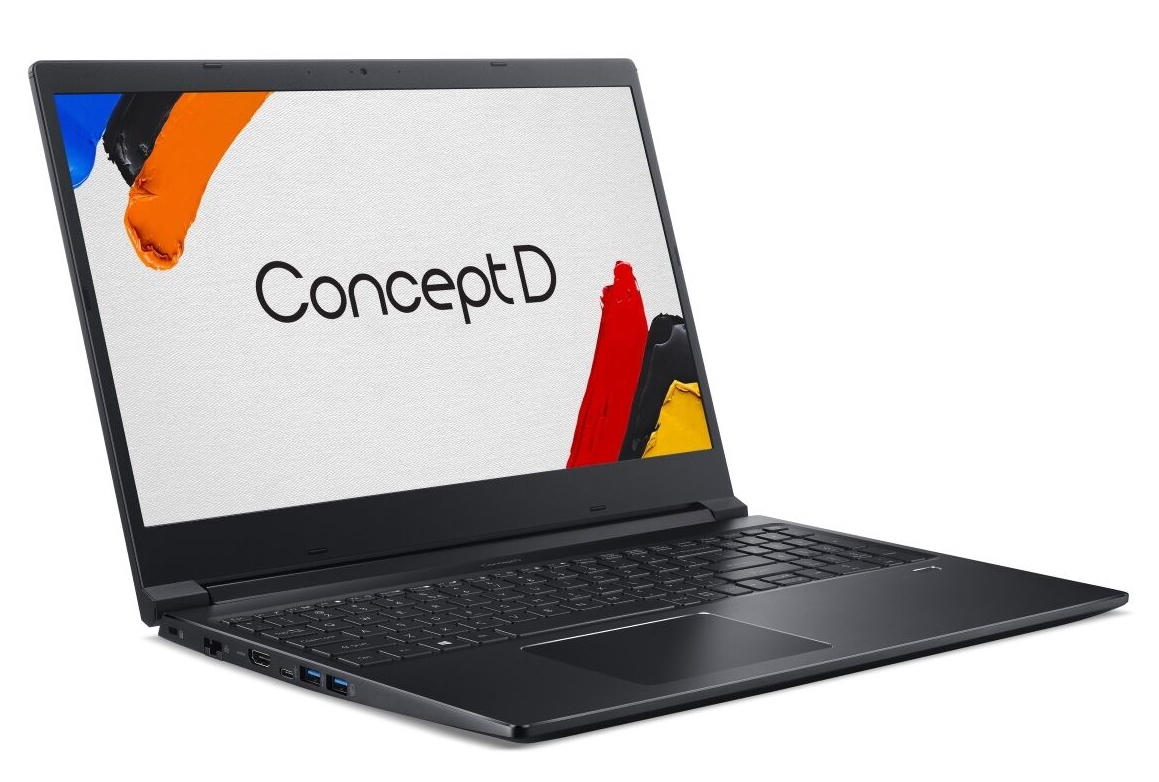
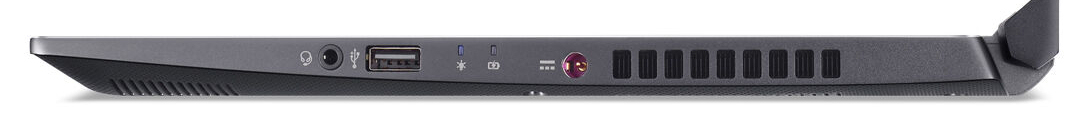
Il manque cependant un port Thunderbolt 3. Cela aurait permis la connexion d'un GPU externe plus puissant, ou une station d'accueil complète. Malheureusement, Acer ne propose sa station de travail qu'avec un simple port USB C (USB 3.2 Gen 1), qui n'intègre pas même le DisplayPort via USB C.
L’intégralité de cette critique est disponible en anglais en suivant ce lien.
Acer ConceptD 3 Pro CN315-71P-73W1
- 06/10/2020 v7 (old)
Sascha Mölck
Price comparison
