Test du Lenovo ThinkPad P53s (i7-8565U, Quadro P520, FHD) : processeur d'ultrabook et carte graphique Quadro
Note | Date | Modèle | Poids | Épaisseur | Taille | Résolution | Prix |
|---|---|---|---|---|---|---|---|
| 81.2 % v7 (old) | 11/19 | Lenovo ThinkPad P53s-20N6001NGE i7-8565U, Quadro P520 | 1.9 kg | 19.95 mm | 15.60" | 1920x1080 | |
| 80.8 % v7 (old) | 10/19 | HP ZBook 15u G6 6TP54EA i7-8565U, Radeon Pro WX 3200 | 1.6 kg | 19 mm | 15.60" | 3840x2160 | |
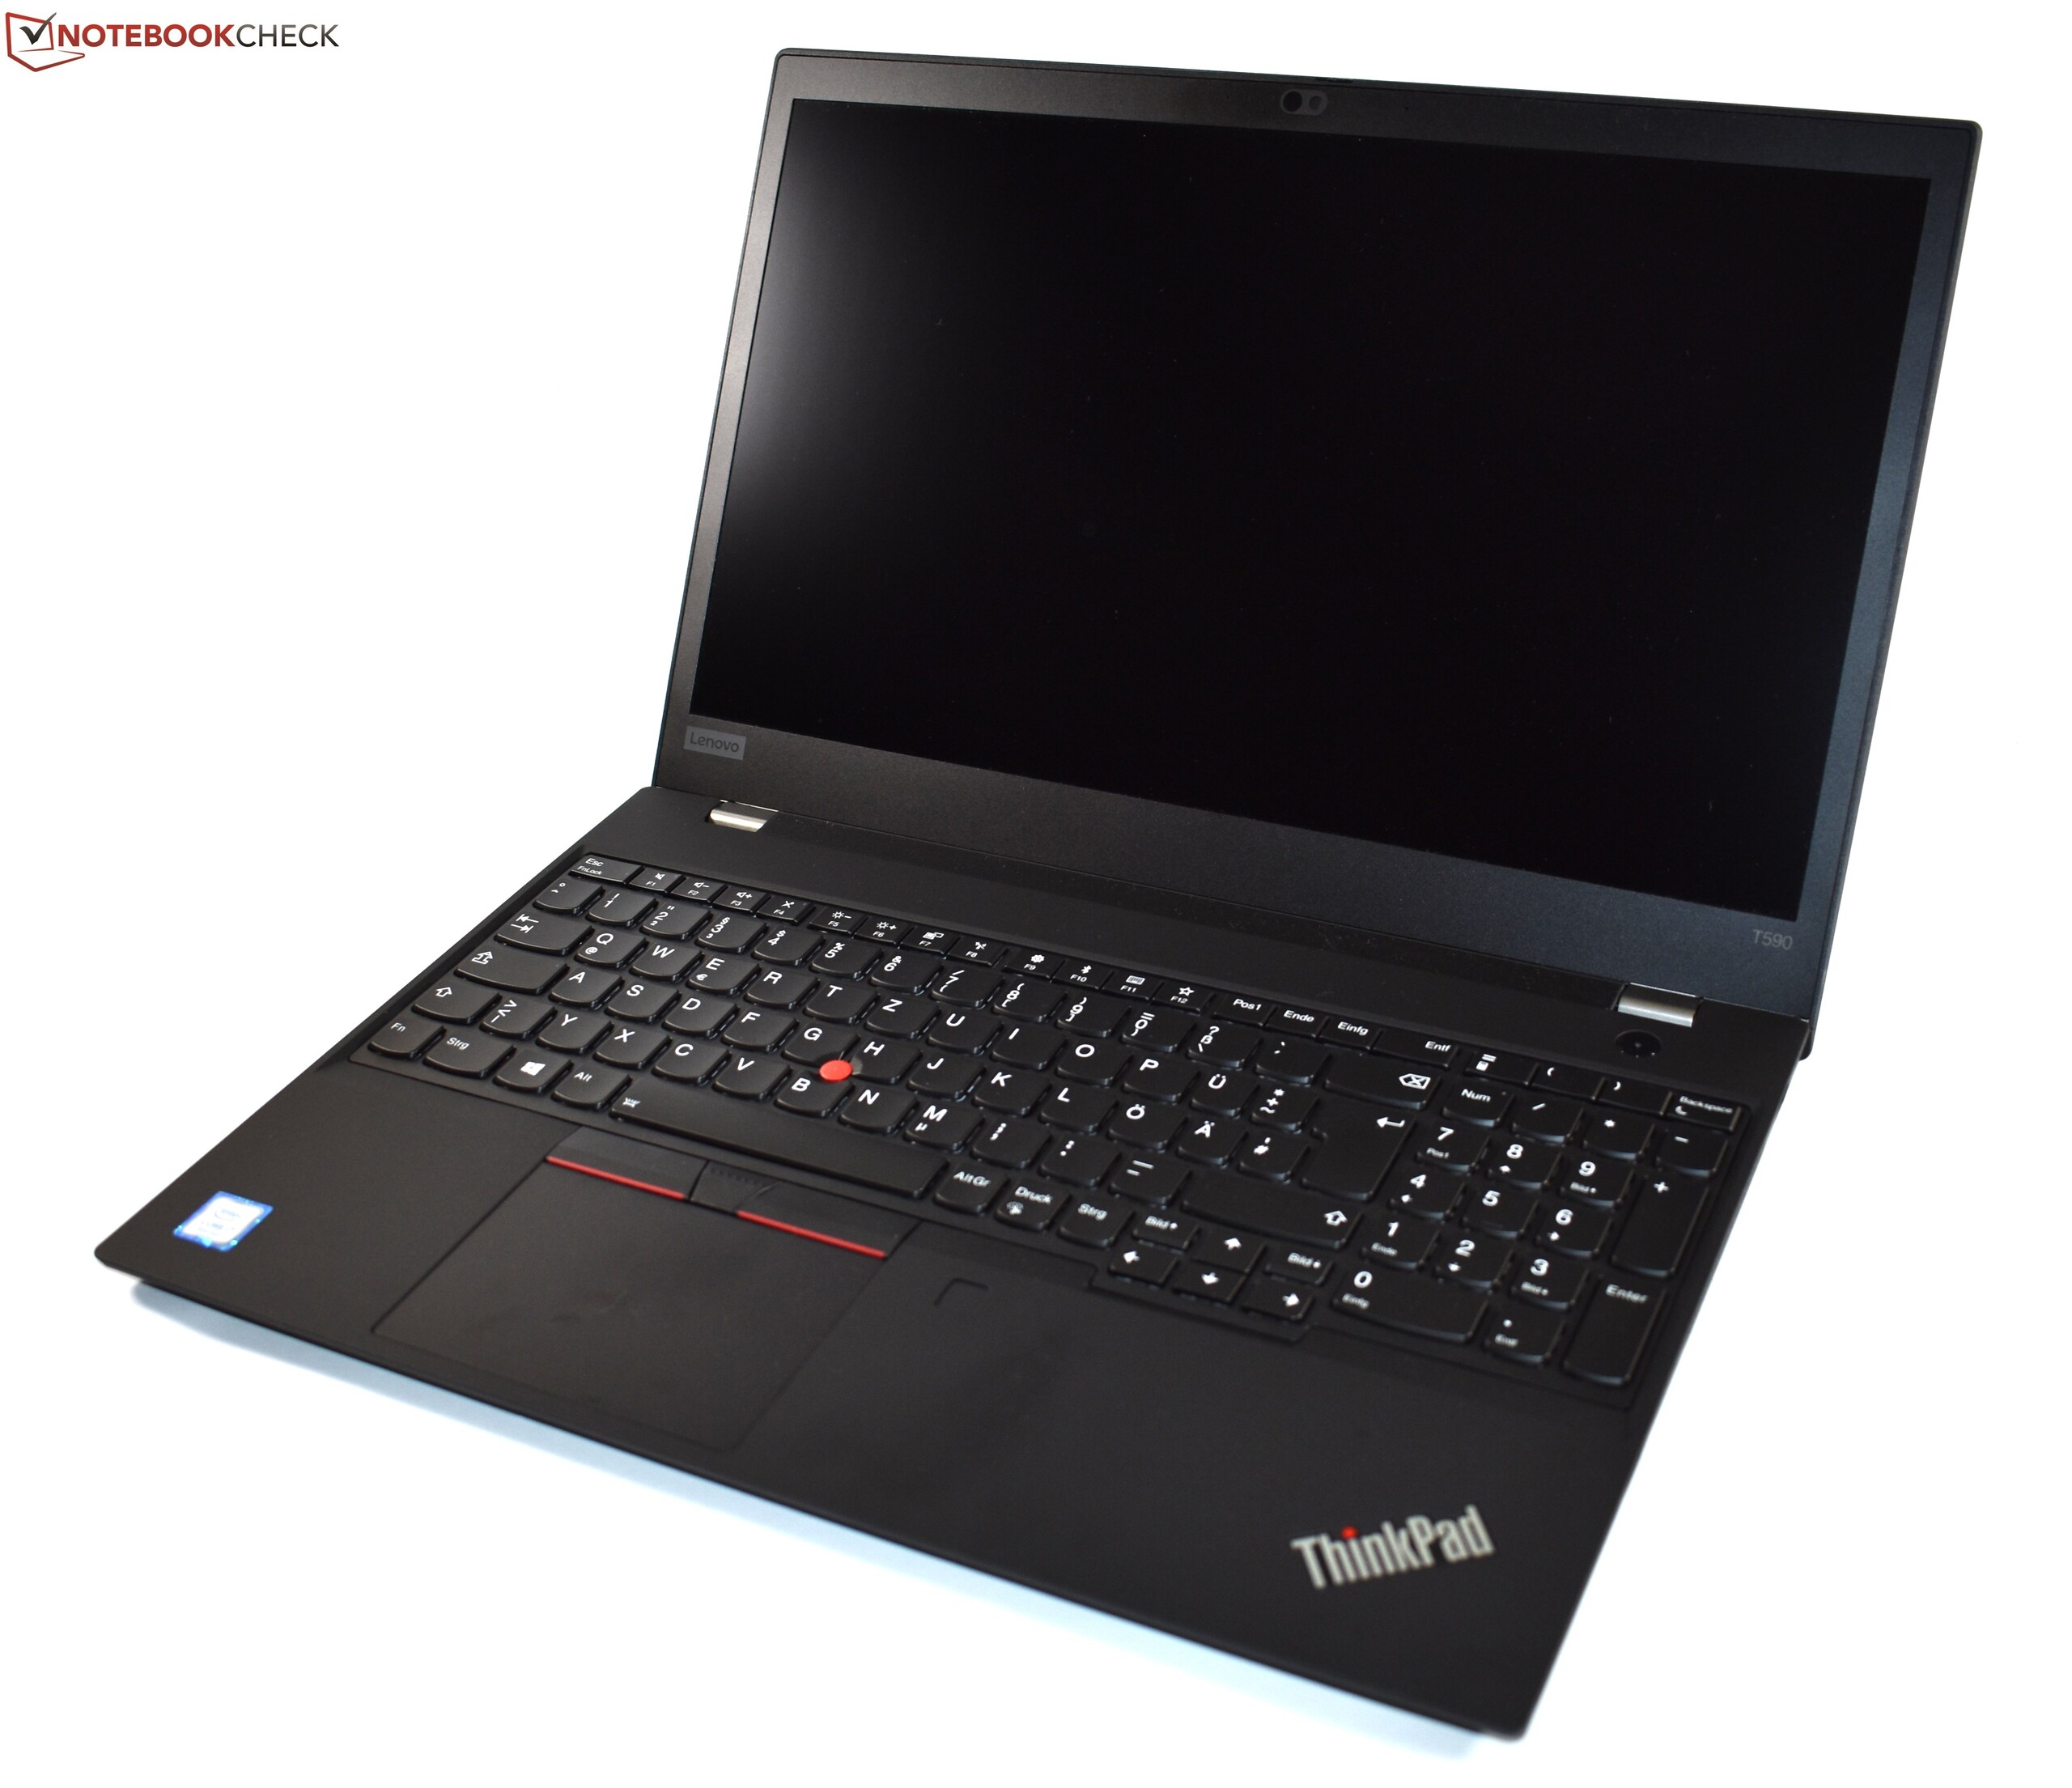
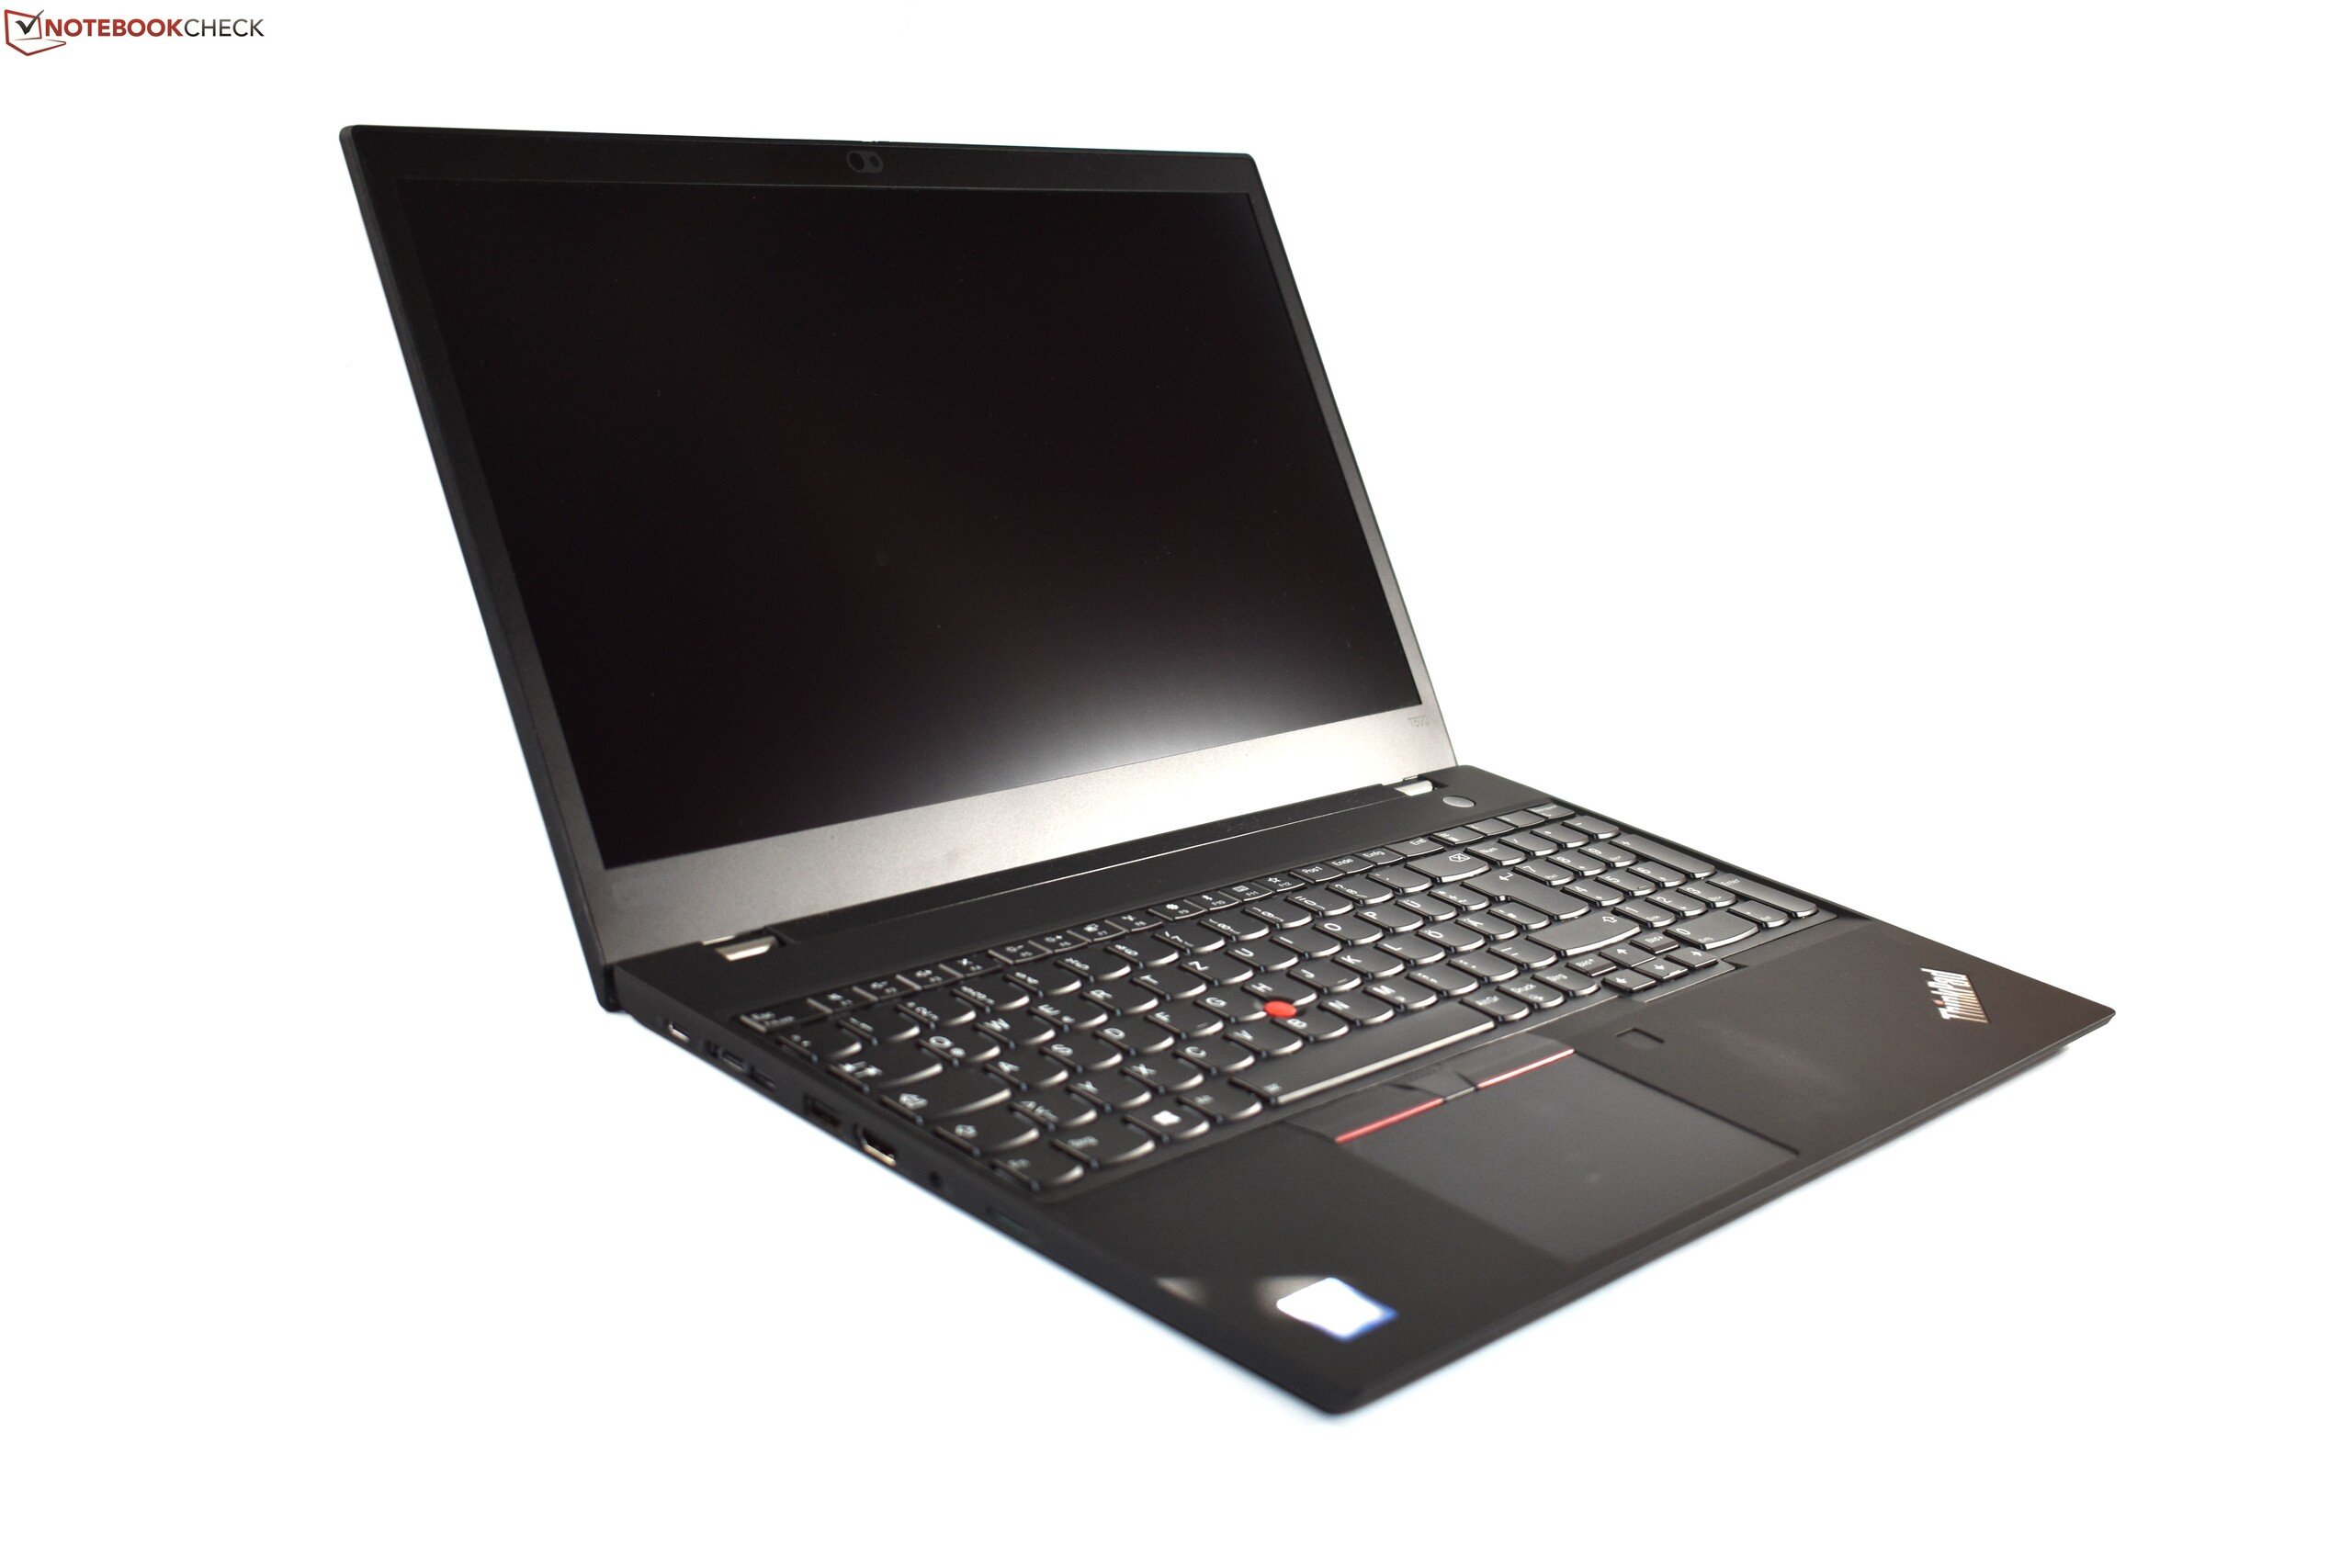
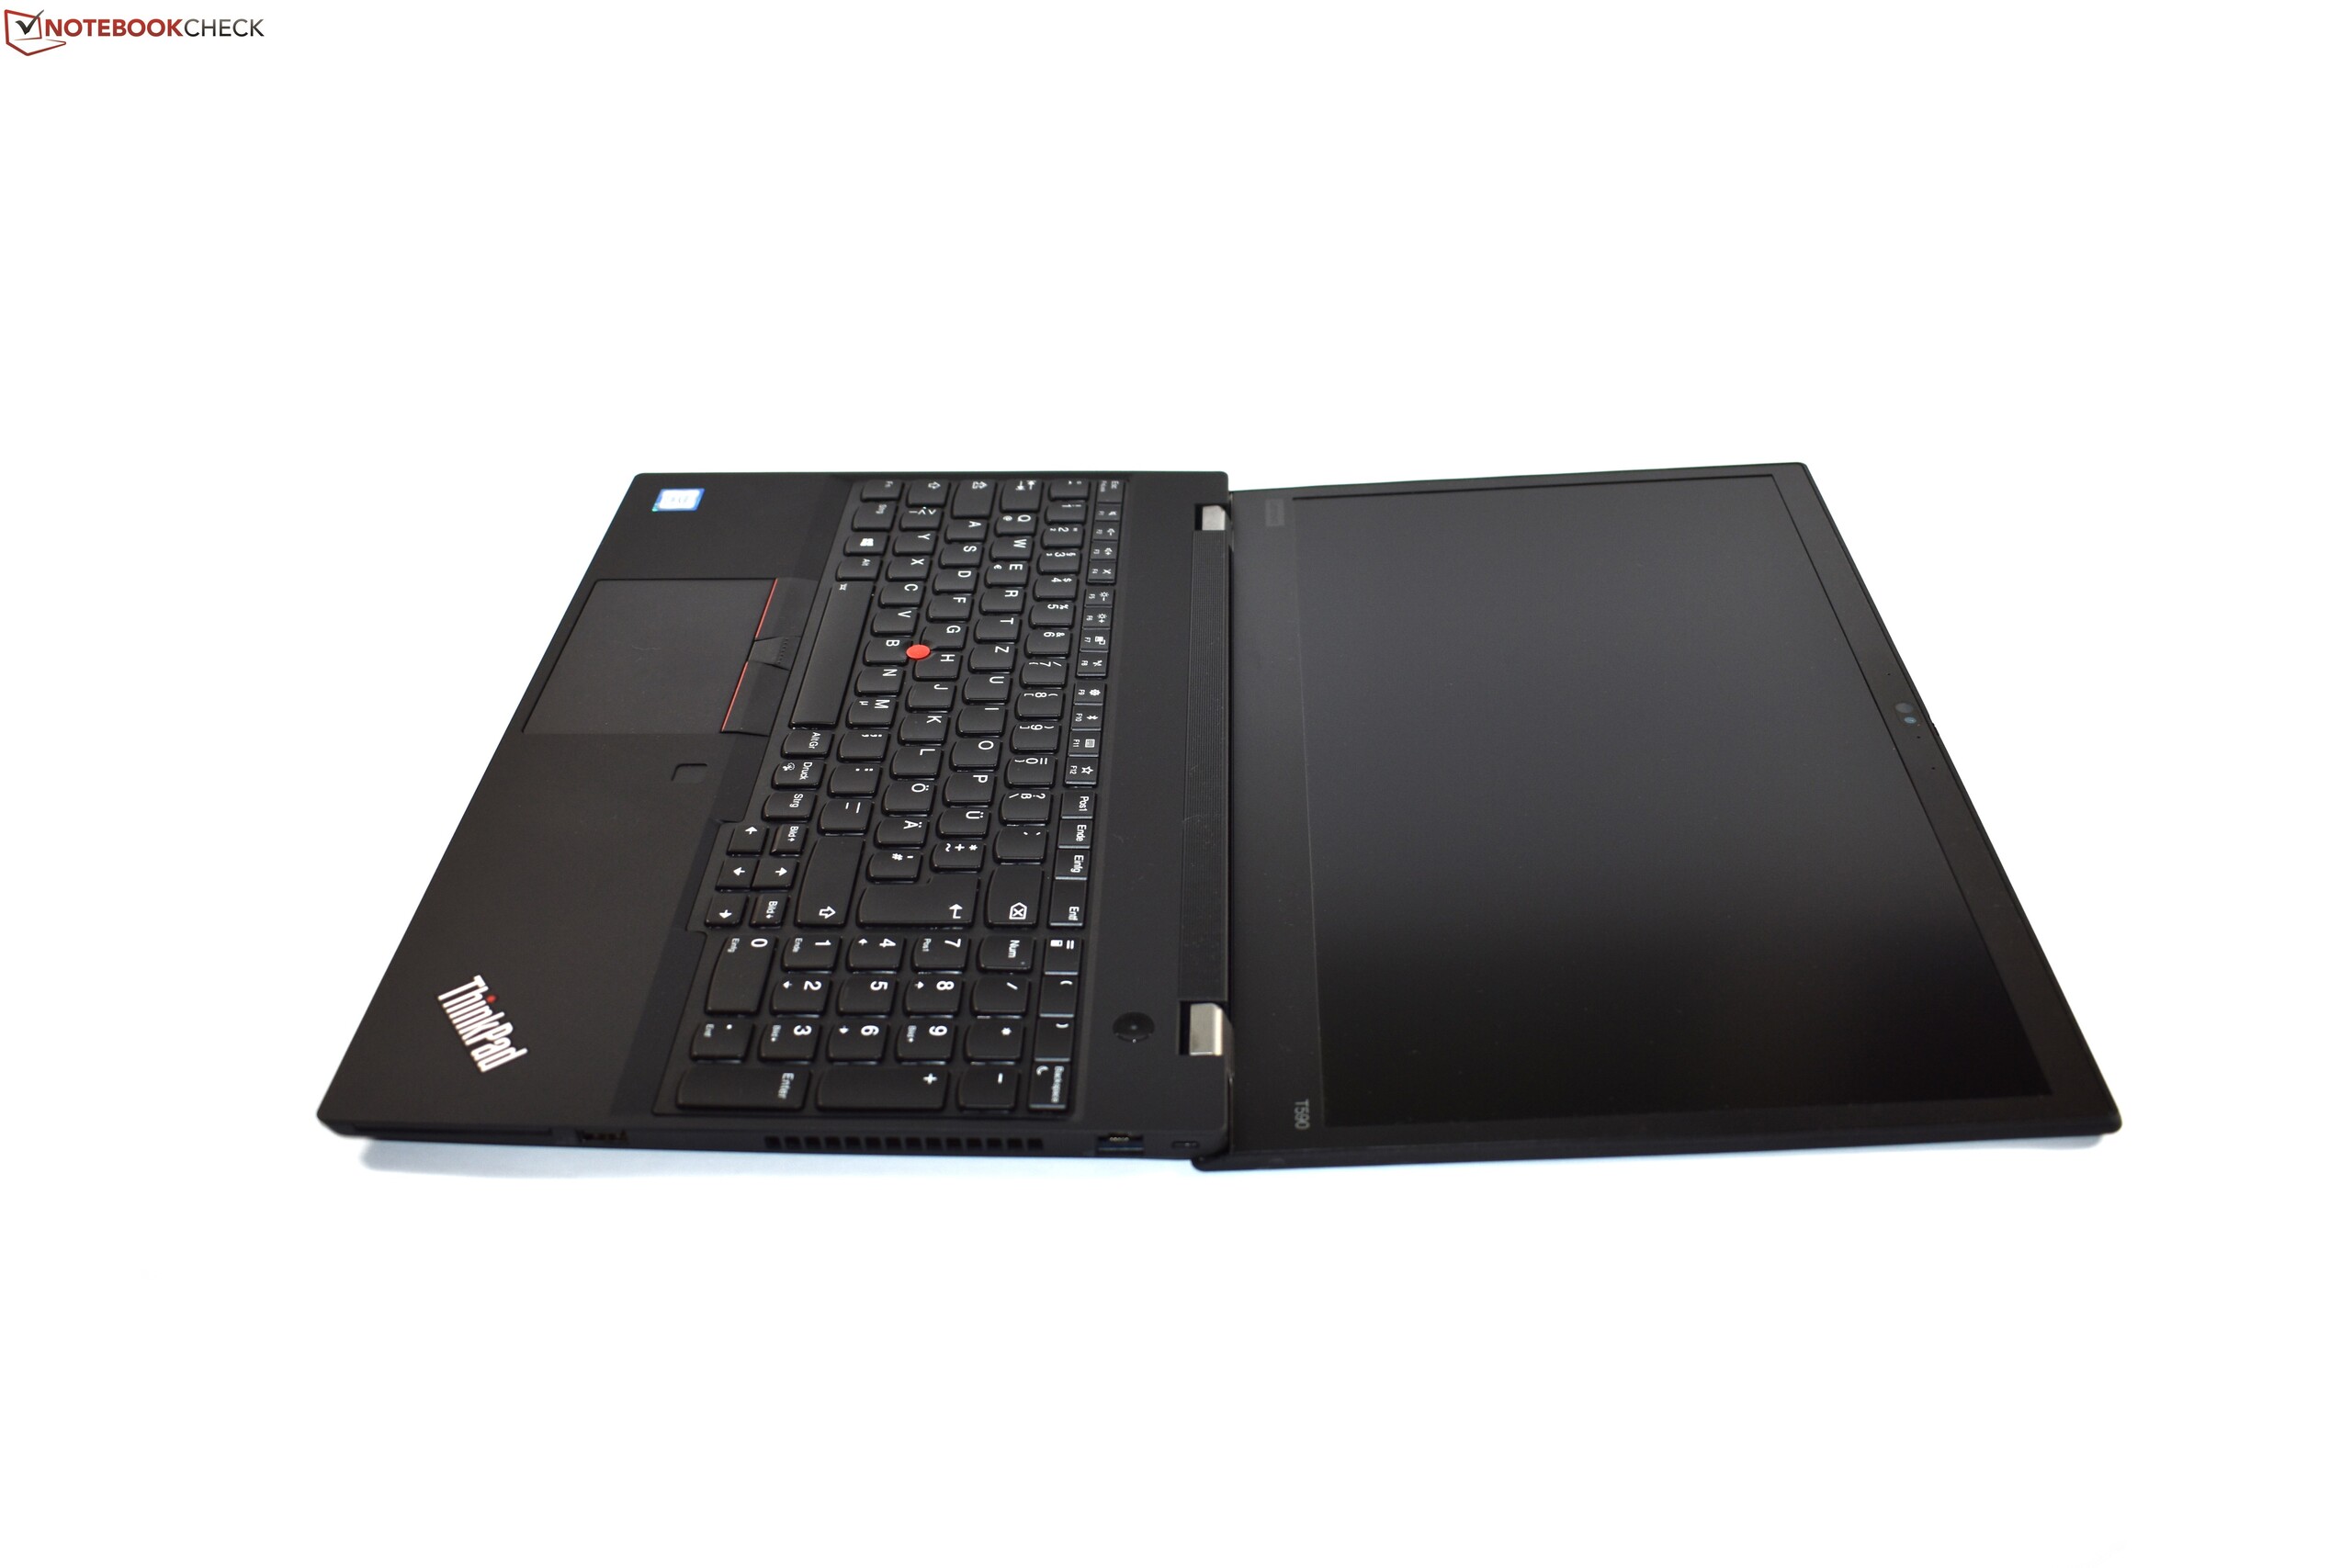
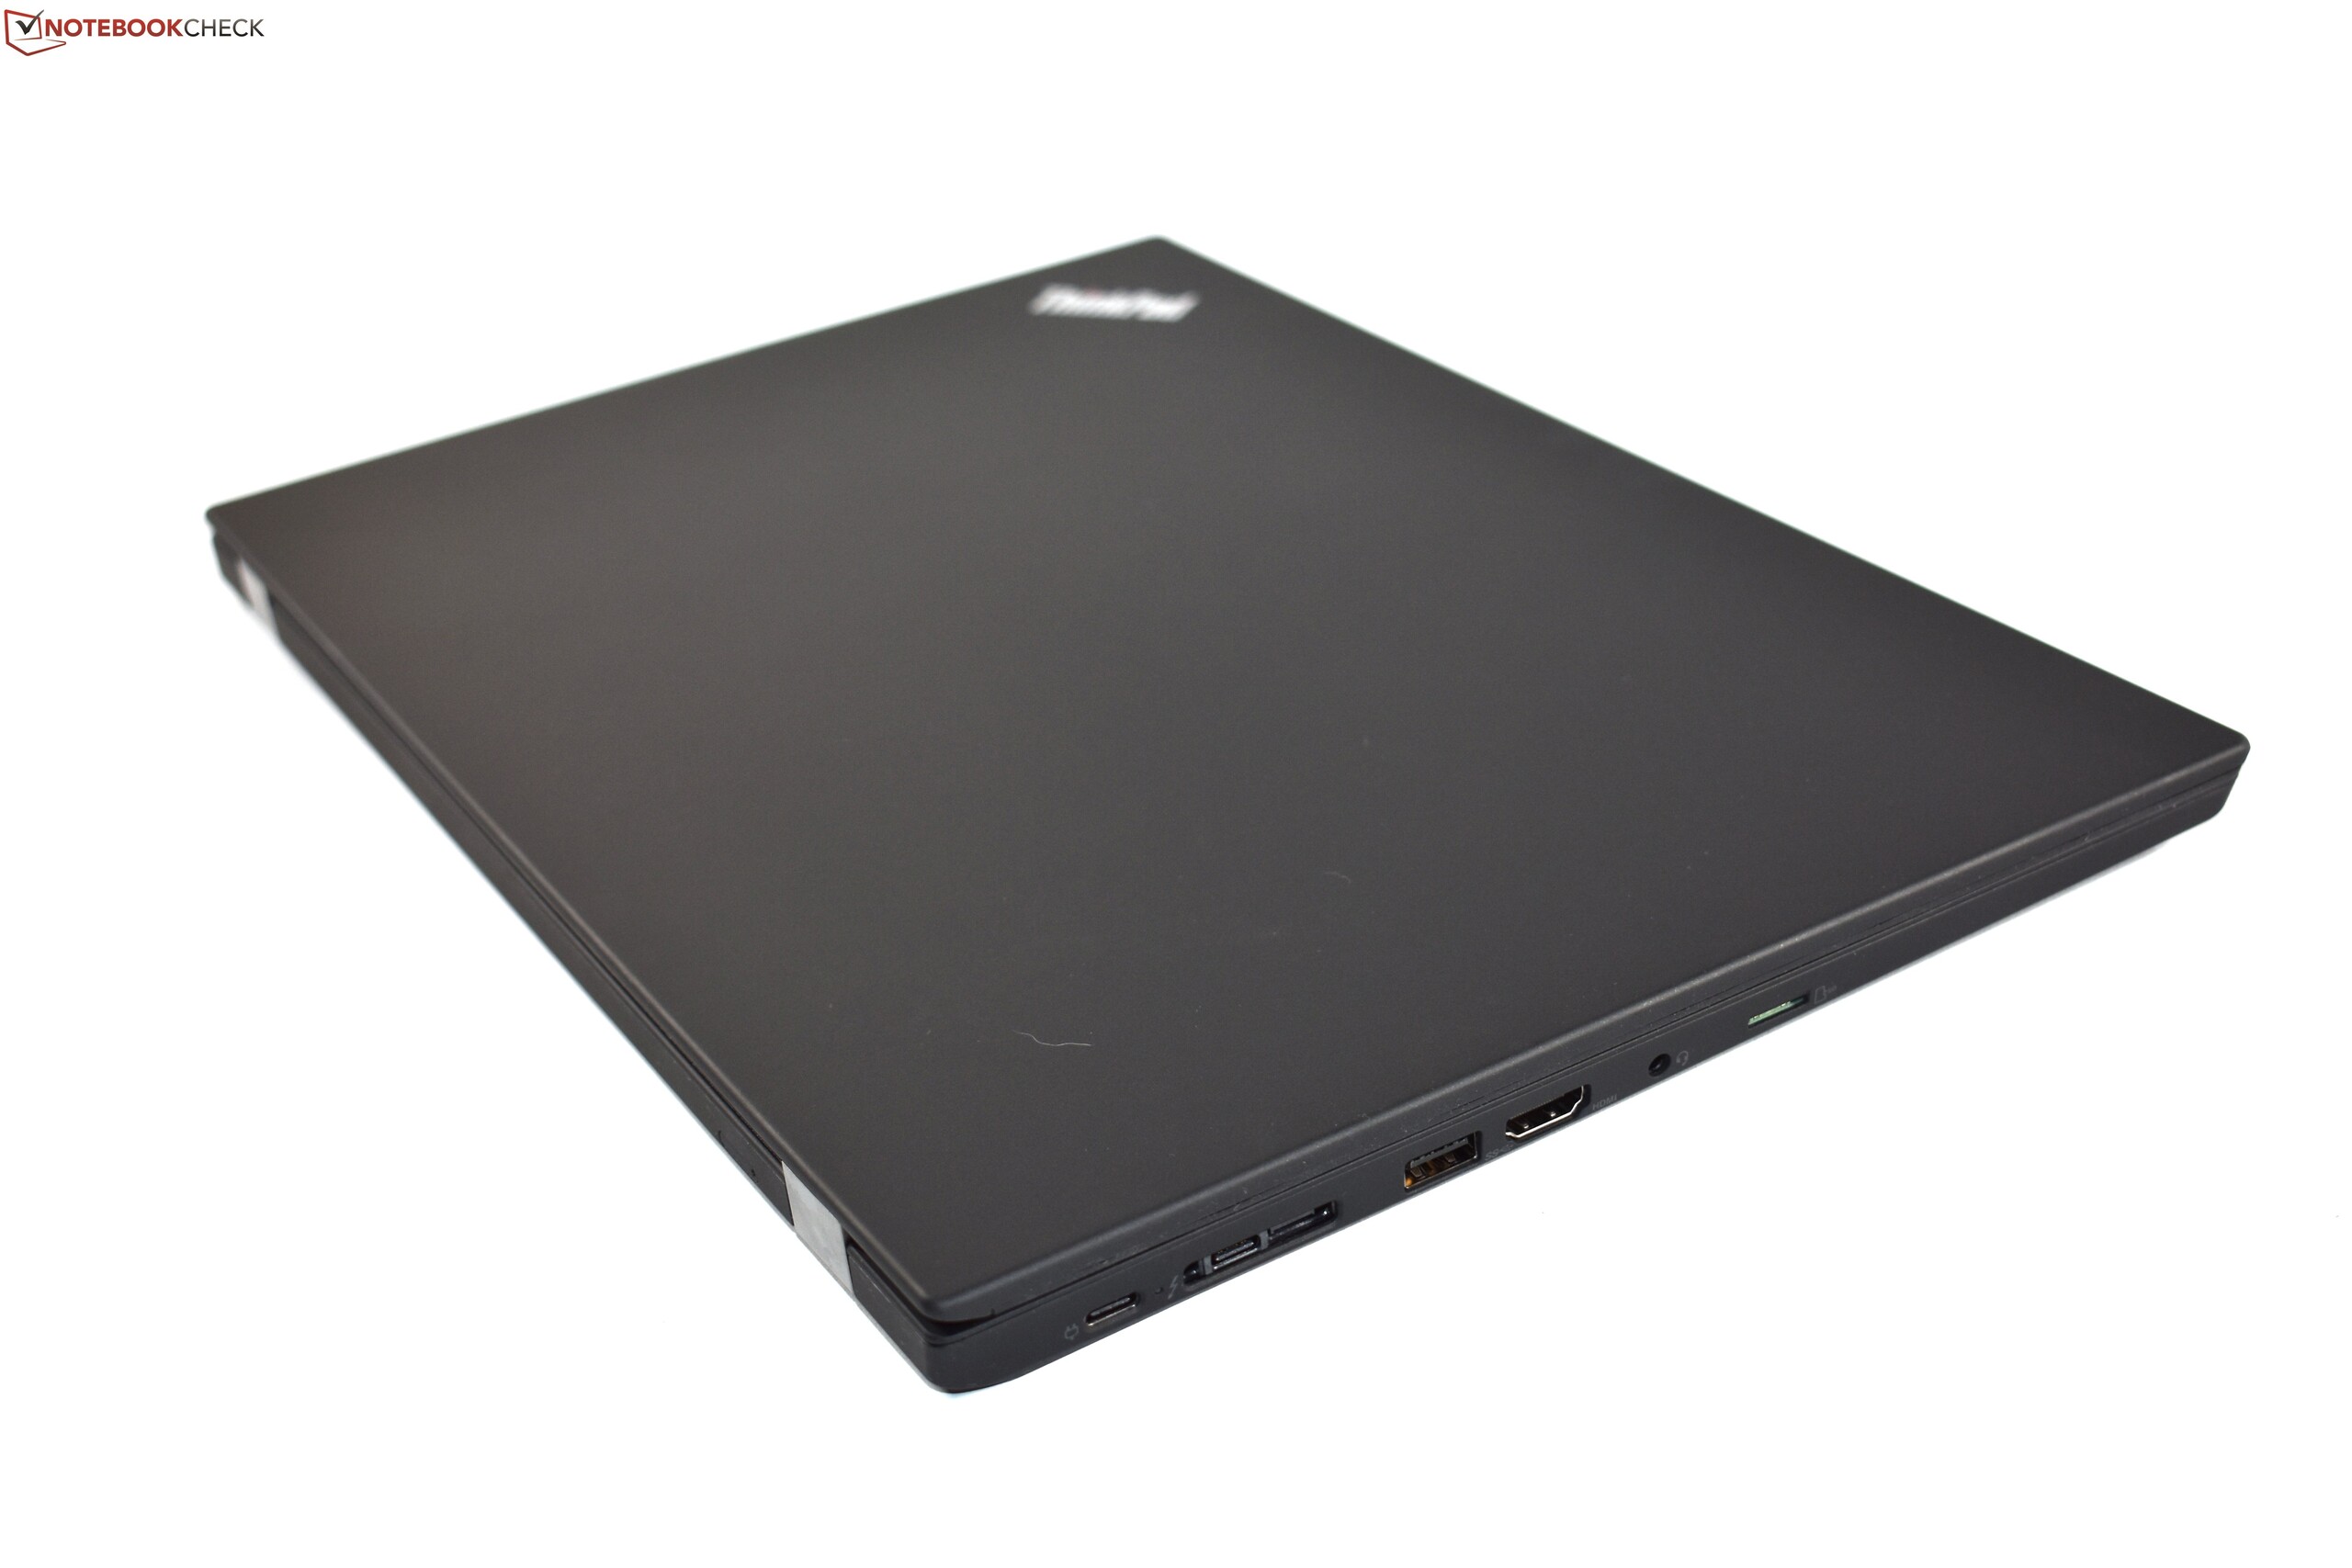
| 86.6 % v7 (old) | 08/19 | Lenovo ThinkPad T590-20N4002VGE i7-8565U, GeForce MX250 | 1.9 kg | 19.95 mm | 15.60" | 1920x1080 | |
| 80.9 % v6 (old) | 07/18 | Lenovo ThinkPad P52S-20LB001FUS i7-8650U, Quadro P500 | 2 kg | 20.2 mm | 15.60" | 3840x2160 | |
| 88.5 % v6 (old) | 09/18 | Dell Precision 5530 Xeon E-2176M E-2176M, Quadro P2000 | 2 kg | 16.82 mm | 15.60" | 3840x2160 | |
| 85.6 % v6 (old) | 04/19 | Fujitsu Celsius H780 i7-8850H, Quadro P2000 | 2.8 kg | 31.9 mm | 15.60" | 1920x1080 |
| SD Card Reader | |
| average JPG Copy Test (av. of 3 runs) | |
| Dell Precision 5530 Xeon E-2176M (Toshiba Exceria Pro SDXC 64 GB UHS-II) | |
| Fujitsu Celsius H780 (Toshiba Exceria Pro SDXC 64 GB UHS-II) | |
| Moyenne de la classe Workstation (49.6 - 681, n=14, 2 dernières années) | |
| Lenovo ThinkPad P52S-20LB001FUS (Toshiba Exceria Pro SDXC 64 GB UHS-II) | |
| Lenovo ThinkPad P53s-20N6001NGE (Toshiba Exceria Pro M501 64 GB UHS-II) | |
| Lenovo ThinkPad T590-20N4002VGE (Toshiba Exceria Pro M501 UHS-II) | |
| maximum AS SSD Seq Read Test (1GB) | |
| Moyenne de la classe Workstation (87.6 - 1455, n=14, 2 dernières années) | |
| Dell Precision 5530 Xeon E-2176M (Toshiba Exceria Pro SDXC 64 GB UHS-II) | |
| Fujitsu Celsius H780 (Toshiba Exceria Pro SDXC 64 GB UHS-II) | |
| Lenovo ThinkPad P52S-20LB001FUS (Toshiba Exceria Pro SDXC 64 GB UHS-II) | |
| Lenovo ThinkPad P53s-20N6001NGE (Toshiba Exceria Pro M501 64 GB UHS-II) | |
| Lenovo ThinkPad T590-20N4002VGE (Toshiba Exceria Pro M501 UHS-II) | |
| |||||||||||||||||||||||||
Homogénéité de la luminosité: 88 %
Valeur mesurée au centre, sur batterie: 258 cd/m²
Contraste: 1444:1 (Valeurs des noirs: 0.18 cd/m²)
ΔE ColorChecker Calman: 6 | ∀{0.5-29.43 Ø4.72}
calibrated: 4.3
ΔE Greyscale Calman: 4.2 | ∀{0.09-98 Ø4.97}
59.2% sRGB (Argyll 1.6.3 3D)
37.6% AdobeRGB 1998 (Argyll 1.6.3 3D)
40.89% AdobeRGB 1998 (Argyll 3D)
57.6% sRGB (Argyll 3D)
39.58% Display P3 (Argyll 3D)
Gamma: 2.49
CCT: 6865 K
| Lenovo ThinkPad P53s-20N6001NGE Lenovo LEN40BA, IPS, 1920x1080, 15.6" | HP ZBook 15u G6 6TP54EA AU Optronics AUO30EB, IPS, 3840x2160, 15.6" | Lenovo ThinkPad T590-20N4002VGE LP156WFC-SPD1, aSi IPS LED, 1920x1080, 15.6" | Lenovo ThinkPad P52S-20LB001FUS Lenovo LEN40BD, IPS, 3840x2160, 15.6" | Dell Precision 5530 Xeon E-2176M Sharp SHP148D / LQ156D1, IGZO, 3840x2160, 15.6" | Fujitsu Celsius H780 LP156WF6-SPP1, IPS LED, 1920x1080, 15.6" | Lenovo ThinkPad T590-20N40009GE NE156QUM-N66, IPS, 3840x2160, 15.6" | |
|---|---|---|---|---|---|---|---|
| Display | 71% | -1% | 62% | 84% | 57% | 102% | |
| Display P3 Coverage (%) | 39.58 | 69.2 75% | 38.79 -2% | 67.3 70% | 76.5 93% | 66.3 68% | 80.2 103% |
| sRGB Coverage (%) | 57.6 | 97.1 69% | 58.3 1% | 89.4 55% | 98.4 71% | 85.9 49% | 97.8 70% |
| AdobeRGB 1998 Coverage (%) | 40.89 | 69.7 70% | 40.11 -2% | 65.4 60% | 76.4 87% | 62.8 54% | 95 132% |
| Response Times | -11% | 23% | 31% | 3% | 23% | 12% | |
| Response Time Grey 50% / Grey 80% * (ms) | 51.2 ? | 68.8 ? -34% | 37.2 ? 27% | 43.2 ? 16% | 48 ? 6% | 38 ? 26% | 48.4 ? 5% |
| Response Time Black / White * (ms) | 33.6 ? | 29.6 12% | 27.2 ? 19% | 18 ? 46% | 33.6 ? -0% | 26.8 ? 20% | 27.2 ? 19% |
| PWM Frequency (Hz) | 980 | 1000 | 20830 ? | ||||
| Screen | 37% | 1% | 20% | 28% | 15% | 49% | |
| Brightness middle (cd/m²) | 260 | 451 73% | 276 6% | 305.5 18% | 451.7 74% | 271 4% | 531 104% |
| Brightness (cd/m²) | 243 | 434 79% | 262 8% | 282 16% | 440 81% | 260 7% | 523 115% |
| Brightness Distribution (%) | 88 | 89 1% | 88 0% | 78 -11% | 90 2% | 86 -2% | 96 9% |
| Black Level * (cd/m²) | 0.18 | 0.25 -39% | 0.23 -28% | 0.24 -33% | 0.4 -122% | 0.29 -61% | 0.37 -106% |
| Contrast (:1) | 1444 | 1804 25% | 1200 -17% | 1273 -12% | 1129 -22% | 934 -35% | 1435 -1% |
| Colorchecker dE 2000 * | 6 | 4.4 27% | 5.6 7% | 3.51 41% | 3.11 48% | 3.9 35% | 2.5 58% |
| Colorchecker dE 2000 max. * | 19.2 | 6.7 65% | 16.4 15% | 7.28 62% | 8.62 55% | 10.2 47% | 4.4 77% |
| Colorchecker dE 2000 calibrated * | 4.3 | 1.8 58% | 4.7 -9% | 3.15 27% | 3.07 29% | 2.9 33% | 1 77% |
| Greyscale dE 2000 * | 4.2 | 5 -19% | 3 29% | 4 5% | 3.7 12% | 2.6 38% | 3.5 17% |
| Gamma | 2.49 88% | 2.31 95% | 2.18 101% | 2.18 101% | 2.11 104% | 2.29 96% | 2.31 95% |
| CCT | 6865 95% | 7717 84% | 7075 92% | 7291 89% | 6492 100% | 6517 100% | 7189 90% |
| Color Space (Percent of AdobeRGB 1998) (%) | 37.6 | 63 68% | 36.9 -2% | 58 54% | 69 84% | 56.1 49% | 84.3 124% |
| Color Space (Percent of sRGB) (%) | 59.2 | 97 64% | 58.1 -2% | 89 50% | 98 66% | 85.8 45% | 97.7 65% |
| Moyenne finale (programmes/paramètres) | 32% /
37% | 8% /
3% | 38% /
29% | 38% /
35% | 32% /
24% | 54% /
54% |
* ... Moindre est la valeur, meilleures sont les performances
Temps de réponse de l'écran
| ↔ Temps de réponse noir à blanc | ||
|---|---|---|
| 33.6 ms ... hausse ↗ et chute ↘ combinées | ↗ 18 ms hausse | 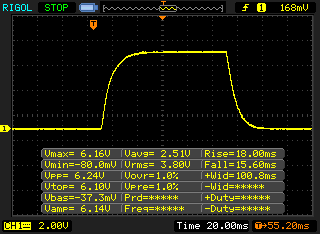 |
| ↘ 15.6 ms chute | ||
| L'écran souffre de latences très élevées, à éviter pour le jeu. En comparaison, tous les appareils testés affichent entre 0.1 (minimum) et 240 (maximum) ms. » 90 % des appareils testés affichent de meilleures performances. Cela signifie que les latences relevées sont moins bonnes que la moyenne (19.8 ms) de tous les appareils testés. | ||
| ↔ Temps de réponse gris 50% à gris 80% | ||
| 51.2 ms ... hausse ↗ et chute ↘ combinées | ↗ 24.4 ms hausse | 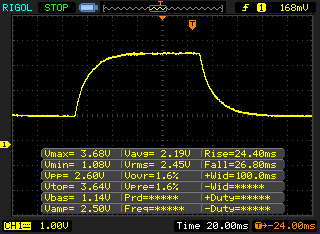 |
| ↘ 26.8 ms chute | ||
| L'écran souffre de latences très élevées, à éviter pour le jeu. En comparaison, tous les appareils testés affichent entre 0.165 (minimum) et 636 (maximum) ms. » 88 % des appareils testés affichent de meilleures performances. Cela signifie que les latences relevées sont moins bonnes que la moyenne (31 ms) de tous les appareils testés. | ||
Scintillement / MLI (Modulation de largeur d'impulsion)
| Scintillement / MLI (Modulation de largeur d'impulsion) non décelé | 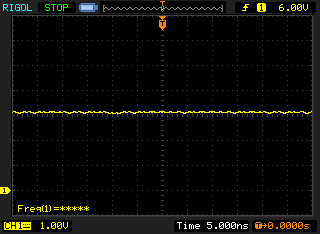 | ||
En comparaison, 52 % des appareils testés n'emploient pas MDI pour assombrir leur écran. Nous avons relevé une moyenne à 7769 (minimum : 5 - maximum : 343500) Hz dans le cas où une MDI était active. | |||
| PCMark 8 Home Score Accelerated v2 | 3840 points | |
| PCMark 8 Work Score Accelerated v2 | 5140 points | |
| PCMark 10 Score | 4374 points | |
Aide | ||
| Lenovo ThinkPad P53s-20N6001NGE Intel SSD 760p SSDPEKKW256G8 | HP ZBook 15u G6 6TP54EA Samsung SSD PM981 MZVLB512HAJQ | Lenovo ThinkPad T590-20N4002VGE Toshiba XG6 KXG60ZNV512G | Lenovo ThinkPad P52S-20LB001FUS Samsung SSD PM981 MZVLB1T0HALR | Dell Precision 5530 Xeon E-2176M SK hynix PC400 512 GB | Fujitsu Celsius H780 Samsung SSD PM981 MZVLB512HAJQ | Moyenne Intel SSD 760p SSDPEKKW256G8 | |
|---|---|---|---|---|---|---|---|
| CrystalDiskMark 5.2 / 6 | -10% | -0% | -20% | -16% | -17% | ||
| Write 4K (MB/s) | 195.9 | 156 -20% | 126.2 -36% | 97.8 -50% | 98.3 -50% | 148.8 ? -24% | |
| Read 4K (MB/s) | 74.9 | 45.73 -39% | 48.93 -35% | 41.21 -45% | 40.18 -46% | 64.8 ? -13% | |
| Write Seq (MB/s) | 1194 | 1158 -3% | 1345 13% | 1312 10% | 1777 49% | 956 ? -20% | |
| Read Seq (MB/s) | 2309 | 1132 -51% | 1373 -41% | 1667 -28% | 1247 -46% | 2325 ? 1% | |
| Write 4K Q32T1 (MB/s) | 507 | 369.2 -27% | 383.8 -24% | 449.5 -11% | 344.7 -32% | 381 ? -25% | |
| Read 4K Q32T1 (MB/s) | 624 | 573 -8% | 434.8 -30% | 327.4 -48% | 383.1 -39% | 462 ? -26% | |
| Write Seq Q32T1 (MB/s) | 1206 | 1969 63% | 2966 146% | 1385 15% | 2019 67% | 954 ? -21% | |
| Read Seq Q32T1 (MB/s) | 3091 | 3138 2% | 3230 4% | 2948 -5% | 2076 -33% | 2848 ? -8% | |
| AS SSD | 30% | 39% | 14% | -17% | 25% | -18% | |
| Seq Read (MB/s) | 2283 | 2083 -9% | 2551 12% | 1351 -41% | 2169 -5% | 1049 -54% | 2472 ? 8% |
| Seq Write (MB/s) | 1042 | 1715 65% | 2376 128% | 1220 17% | 1022 -2% | 1882 81% | 1176 ? 13% |
| 4K Read (MB/s) | 46.62 | 55.3 19% | 52.7 13% | 44.33 -5% | 38.43 -18% | 48.35 4% | 46.1 ? -1% |
| 4K Write (MB/s) | 172.6 | 137.6 -20% | 153 -11% | 100.5 -42% | 92.8 -46% | 102.5 -41% | 135.3 ? -22% |
| 4K-64 Read (MB/s) | 759 | 1211 60% | 1406 85% | 1524 101% | 970 28% | 1395 84% | 677 ? -11% |
| 4K-64 Write (MB/s) | 916 | 1446 58% | 1439 57% | 1245 36% | 926 1% | 1789 95% | 750 ? -18% |
| Access Time Read * (ms) | 0.06 | 0.039 35% | 0.067 -12% | 0.04 33% | 0.073 -22% | 0.066 -10% | 0.06567 ? -9% |
| Access Time Write * (ms) | 0.022 | 0.026 -18% | 0.027 -23% | 0.04 -82% | 0.053 -141% | 0.037 -68% | 0.05067 ? -130% |
| Score Read (Points) | 1034 | 1474 43% | 1714 66% | 1703 65% | 1226 19% | 1549 50% | 970 ? -6% |
| Score Write (Points) | 1192 | 1755 47% | 1829 53% | 1468 23% | 1121 -6% | 2080 74% | 1003 ? -16% |
| Score Total (Points) | 2705 | 3976 47% | 4418 63% | 4038 49% | 2922 8% | 4469 65% | 2416 ? -11% |
| Moyenne finale (programmes/paramètres) | 10% /
13% | 20% /
23% | 14% /
14% | -19% /
-18% | 5% /
8% | -18% /
-18% |
* ... Moindre est la valeur, meilleures sont les performances

| 3DMark 06 Standard Score | 22756 points | |
| 3DMark Vantage P Result | 15720 points | |
| 3DMark 11 Performance | 4604 points | |
| 3DMark Cloud Gate Standard Score | 14006 points | |
| 3DMark Fire Strike Score | 3113 points | |
| 3DMark Time Spy Score | 1171 points | |
Aide | ||
| The Witcher 3 | |
| 1920x1080 High Graphics & Postprocessing (Nvidia HairWorks Off) | |
| Fujitsu Celsius H780 | |
| Lenovo ThinkPad P53s-20N6001NGE | |
| Dell Precision 5530 Xeon E-2176M | |
| Moyenne NVIDIA Quadro P520 (18.7 - 33.5, n=5) | |
| Lenovo ThinkPad T590-20N4002VGE | |
| Lenovo ThinkPad P52S-20LB001FUS | |
| HP ZBook 15u G6 6TP54EA | |
| 1920x1080 Ultra Graphics & Postprocessing (HBAO+) | |
| Dell Precision 5530 Xeon E-2176M | |
| Fujitsu Celsius H780 | |
| Lenovo ThinkPad T590-20N4002VGE | |
| Lenovo ThinkPad P53s-20N6001NGE | |
| Moyenne NVIDIA Quadro P520 (8.4 - 11.1, n=4) | |
| HP ZBook 15u G6 6TP54EA | |
| Lenovo ThinkPad P52S-20LB001FUS | |
| Thief | |
| 1366x768 High Preset AA:FXAA & Low SS AF:4x | |
| Dell Precision 5530 Xeon E-2176M | |
| Lenovo ThinkPad P53s-20N6001NGE | |
| Moyenne NVIDIA Quadro P520 (n=1) | |
| HP ZBook 15u G6 6TP54EA | |
| 1920x1080 Very High Preset AA:FXAA & High SS AF:8x | |
| Dell Precision 5530 Xeon E-2176M | |
| Lenovo ThinkPad P53s-20N6001NGE | |
| Moyenne NVIDIA Quadro P520 (n=1) | |
| HP ZBook 15u G6 6TP54EA | |
| Rise of the Tomb Raider | |
| 1920x1080 High Preset AA:FX AF:4x | |
| Dell Precision 5530 Xeon E-2176M | |
| Lenovo ThinkPad P53s-20N6001NGE | |
| Moyenne NVIDIA Quadro P520 (20.2 - 21.1, n=2) | |
| HP ZBook 15u G6 6TP54EA | |
| Lenovo ThinkPad P52S-20LB001FUS | |
| 1920x1080 Very High Preset AA:FX AF:16x | |
| Dell Precision 5530 Xeon E-2176M | |
| Lenovo ThinkPad P53s-20N6001NGE | |
| Moyenne NVIDIA Quadro P520 (17.2 - 18.3, n=2) | |
| Lenovo ThinkPad P52S-20LB001FUS | |
| BioShock Infinite | |
| 1366x768 High Preset | |
| Dell Precision 5530 Xeon E-2176M | |
| Lenovo ThinkPad T590-20N4002VGE | |
| Lenovo ThinkPad P53s-20N6001NGE | |
| Moyenne NVIDIA Quadro P520 (78.4 - 89.7, n=2) | |
| HP ZBook 15u G6 6TP54EA | |
| 1920x1080 Ultra Preset, DX11 (DDOF) | |
| Dell Precision 5530 Xeon E-2176M | |
| Lenovo ThinkPad T590-20N4002VGE | |
| Lenovo ThinkPad P53s-20N6001NGE | |
| Moyenne NVIDIA Quadro P520 (31.2 - 34, n=2) | |
| HP ZBook 15u G6 6TP54EA | |
| Bas | Moyen | Élevé | Ultra | 4K | |
|---|---|---|---|---|---|
| BioShock Infinite (2013) | 194.7 | 107.1 | 89.7 | 34.01 | |
| Thief (2014) | 80.4 | 49.4 | 39.3 | 22.1 | |
| The Witcher 3 (2015) | 59.4 | 51.8 | 33.53 | 11.08 | |
| Dota 2 Reborn (2015) | 125 | 115 | 70 | 61 | 22.7 |
| Rise of the Tomb Raider (2016) | 64.5 | 41.58 | 21.07 | 18.28 | |
| X-Plane 11.11 (2018) | 70 | 52 | 37.6 | ||
| Far Cry 5 (2018) | 42 | 20 | 18 | 16 | |
| Anno 1800 (2019) | 62.8 | 24.57 | 14.79 | 7.39 |
Degré de la nuisance sonore
| Au repos |
| 29.2 / 29.2 / 30.8 dB(A) |
| Fortement sollicité |
| 32.6 / 33.8 dB(A) |
 | ||
30 dB silencieux 40 dB(A) audible 50 dB(A) bruyant |
||
min: | ||
(±) La température maximale du côté supérieur est de 42.6 °C / 109 F, par rapport à la moyenne de 38.2 °C / 101 F, allant de 22.2 à 69.8 °C pour la classe Workstation.
(-) Le fond chauffe jusqu'à un maximum de 55.6 °C / 132 F, contre une moyenne de 41.1 °C / 106 F
(+) En utilisation inactive, la température moyenne du côté supérieur est de 22.8 °C / 73 F, par rapport à la moyenne du dispositif de 32 °C / 90 F.
(+) Les repose-poignets et le pavé tactile sont plus froids que la température de la peau avec un maximum de 30.3 °C / 86.5 F et sont donc froids au toucher.
(-) La température moyenne de la zone de l'appui-paume de dispositifs similaires était de 27.8 °C / 82 F (-2.5 °C / #-4.5 F).
Lenovo ThinkPad P53s-20N6001NGE analyse audio
(-) | haut-parleurs pas très forts (70.2 dB)
Basses 100 - 315 Hz
(±) | basse réduite - en moyenne 11.8% inférieure à la médiane
(±) | la linéarité des basses est moyenne (12.1% delta à la fréquence précédente)
Médiums 400 - 2000 Hz
(±) | médiane supérieure - en moyenne 6% supérieure à la médiane
(+) | les médiums sont linéaires (5.4% delta à la fréquence précédente)
Aiguës 2 - 16 kHz
(+) | des sommets équilibrés - à seulement 4.8% de la médiane
(±) | la linéarité des aigus est moyenne (8.8% delta à la fréquence précédente)
Globalement 100 - 16 000 Hz
(±) | la linéarité du son global est moyenne (25.3% de différence avec la médiane)
Par rapport à la même classe
» 87% de tous les appareils testés de cette catégorie étaient meilleurs, 5% similaires, 9% pires
» Le meilleur avait un delta de 7%, la moyenne était de 17%, le pire était de 35%.
Par rapport à tous les appareils testés
» 78% de tous les appareils testés étaient meilleurs, 5% similaires, 18% pires
» Le meilleur avait un delta de 4%, la moyenne était de 24%, le pire était de 134%.
HP ZBook 15u G6 6TP54EA analyse audio
(±) | le niveau sonore du haut-parleur est moyen mais bon (76.9# dB)
Basses 100 - 315 Hz
(-) | presque aucune basse - en moyenne 17.7% plus bas que la médiane
(±) | la linéarité des basses est moyenne (12.6% delta à la fréquence précédente)
Médiums 400 - 2000 Hz
(+) | médiane équilibrée - seulement 3.2% de la médiane
(+) | les médiums sont linéaires (5.9% delta à la fréquence précédente)
Aiguës 2 - 16 kHz
(+) | des sommets équilibrés - à seulement 2.6% de la médiane
(+) | les aigus sont linéaires (6.3% delta à la fréquence précédente)
Globalement 100 - 16 000 Hz
(±) | la linéarité du son global est moyenne (18.7% de différence avec la médiane)
Par rapport à la même classe
» 63% de tous les appareils testés de cette catégorie étaient meilleurs, 8% similaires, 29% pires
» Le meilleur avait un delta de 7%, la moyenne était de 17%, le pire était de 35%.
Par rapport à tous les appareils testés
» 43% de tous les appareils testés étaient meilleurs, 8% similaires, 50% pires
» Le meilleur avait un delta de 4%, la moyenne était de 24%, le pire était de 134%.
| Éteint/en veille | |
| Au repos | |
| Fortement sollicité |
|
Légende:
min: | |
| Lenovo ThinkPad P53s-20N6001NGE i7-8565U, Quadro P520, Intel SSD 760p SSDPEKKW256G8, IPS, 1920x1080, 15.6" | HP ZBook 15u G6 6TP54EA i7-8565U, Radeon Pro WX 3200, Samsung SSD PM981 MZVLB512HAJQ, IPS, 3840x2160, 15.6" | Lenovo ThinkPad T590-20N4002VGE i7-8565U, GeForce MX250, Toshiba XG6 KXG60ZNV512G, aSi IPS LED, 1920x1080, 15.6" | Lenovo ThinkPad P52S-20LB001FUS i7-8650U, Quadro P500, Samsung SSD PM981 MZVLB1T0HALR, IPS, 3840x2160, 15.6" | Dell Precision 5530 Xeon E-2176M E-2176M, Quadro P2000, SK hynix PC400 512 GB, IGZO, 3840x2160, 15.6" | Fujitsu Celsius H780 i7-8850H, Quadro P2000, Samsung SSD PM981 MZVLB512HAJQ, IPS LED, 1920x1080, 15.6" | Moyenne NVIDIA Quadro P520 | Moyenne de la classe Workstation | |
|---|---|---|---|---|---|---|---|---|
| Power Consumption | -37% | -23% | -53% | -129% | -115% | -9% | -132% | |
| Idle Minimum * (Watt) | 2.74 | 5.5 -101% | 4.1 -50% | 5.9 -115% | 9.8 -258% | 9.1 -232% | 3.14 ? -15% | 9.04 ? -230% |
| Idle Average * (Watt) | 6.4 | 9.8 -53% | 8.3 -30% | 11.7 -83% | 16.8 -163% | 13.2 -106% | 7.3 ? -14% | 13.8 ? -116% |
| Idle Maximum * (Watt) | 9.7 | 12 -24% | 11.8 -22% | 15.6 -61% | 16.9 -74% | 14.04 -45% | 10.4 ? -7% | 17.7 ? -82% |
| Load Average * (Watt) | 55.2 | 59 -7% | 61.6 -12% | 63 -14% | 102.3 -85% | 78.8 -43% | 60.7 ? -10% | 96.2 ? -74% |
| Load Maximum * (Watt) | 69.4 | 70 -1% | 69.4 -0% | 63.1 9% | 114.5 -65% | 172.5 -149% | 68.9 ? 1% | 178.5 ? -157% |
| Witcher 3 ultra * (Watt) | 51 | 54.4 | 48.4 | 76.5 |
* ... Moindre est la valeur, meilleures sont les performances
| Lenovo ThinkPad P53s-20N6001NGE i7-8565U, Quadro P520, 57 Wh | HP ZBook 15u G6 6TP54EA i7-8565U, Radeon Pro WX 3200, 56 Wh | Lenovo ThinkPad T590-20N4002VGE i7-8565U, GeForce MX250, 57 Wh | Lenovo ThinkPad P52S-20LB001FUS i7-8650U, Quadro P500, 80 Wh | Dell Precision 5530 Xeon E-2176M E-2176M, Quadro P2000, 97 Wh | Fujitsu Celsius H780 i7-8850H, Quadro P2000, 96 Wh | Lenovo ThinkPad T590-20N40009GE i7-8565U, GeForce MX250, 57 Wh | Moyenne de la classe Workstation | |
|---|---|---|---|---|---|---|---|---|
| Autonomie de la batterie | -26% | 31% | -2% | -22% | -13% | -31% | -13% | |
| Reader / Idle (h) | 25.2 | 12.4 -51% | 17.2 -32% | 16.5 -35% | 26.1 ? 4% | |||
| WiFi v1.3 (h) | 8.6 | 6.9 -20% | 10.5 22% | 11.1 29% | 8.4 -2% | 7.5 -13% | 6.1 -29% | 8.52 ? -1% |
| Load (h) | 2.5 | 2.3 -8% | 3.5 40% | 2.4 -4% | 1.8 -28% | 1.7 -32% | 1.429 ? -43% |
Points positifs
Points négatifs
Verdict

Dans nos tests, le ThinkPad P53s est exactement ce qu’il paraît : une station de travail à prix réduit. La base est robuste et de bonne qualité, mais les composants, mis à part la Nvidia Quadro P520, sont identiques à ceux de portables classiques. L’appareil possède des possibilités de maintenance correctes, et de bonnes performances globales.
Le ThinkPad P53s est une alternative à petit prix pour ceux qui cherchent un GPU spécifique mais qui n’ont pas besoin d’une configuration haut de gamme.
Lenovo aurait cependant dû choisir un meilleur écran. Celui-ci possède une couverture des espaces colorimétriques réduite, et sa luminosité maximale est trop faible - ce qui était déjà le cas du portable pro ThinkPad T590. En option, Lenovo propose aussi une très bonne dalle 4K pour le P53s, dont le seul vrai défaut est de consommer plus.
L’intégralité de cette critique est disponible en anglais en suivant ce lien.
Lenovo ThinkPad P53s-20N6001NGE
- 10/28/2019 v7 (old)
Mike Wobker