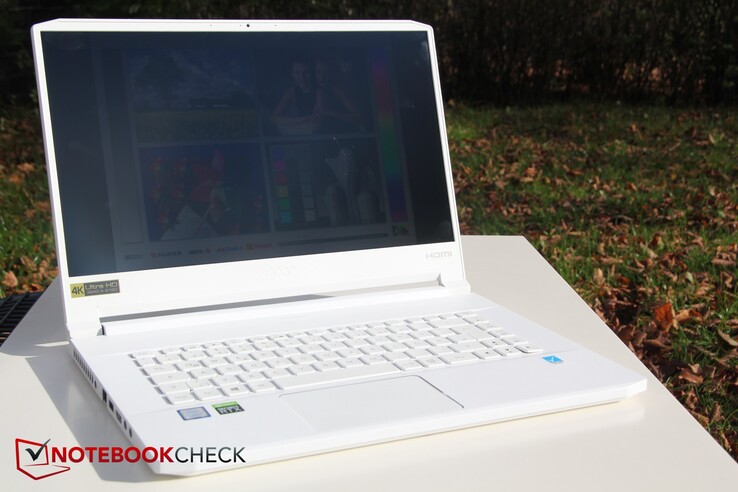
Test de l'Acer ConceptD 7 (i7-9750H, UHD 630, 4K UHD) : bon processeur, mais avec throttling
Note | Date | Modèle | Poids | Épaisseur | Taille | Résolution | Prix |
|---|---|---|---|---|---|---|---|
| 87.3 % v7 (old) | 11/19 | Acer ConceptD 7 CN715-71-743N i7-9750H, GeForce RTX 2060 Mobile | 2.2 kg | 17.9 mm | 15.60" | 3840x2160 | |
| 85.7 % v6 (old) | 08/19 | Lenovo Legion Y540-15IRH i7-9750H, GeForce RTX 2060 Mobile | 2.3 kg | 26 mm | 15.60" | 1920x1080 | |
| 80.8 % v7 (old) | 10/19 | MSI GL65 9SEK i7-9750H, GeForce RTX 2060 Mobile | 2.3 kg | 27.5 mm | 15.60" | 1920x1080 | |
| 84.4 % v7 (old) | 08/19 | Asus Strix GL531GV-PB74 i7-9750H, GeForce RTX 2060 Mobile | 2.4 kg | 25.9 mm | 15.60" | 1920x1080 | |
| 89.4 % v6 (old) | 08/19 | Razer Blade Pro 17 RTX 2060 i7-9750H, GeForce RTX 2060 Mobile | 2.8 kg | 19.9 mm | 17.30" | 1920x1080 | |
| 84.2 % v7 (old) | 09/19 | Razer Blade 15 GTX 1660 Ti i7-9750H, GeForce GTX 1660 Ti Mobile | 2.1 kg | 19.9 mm | 15.60" | 1920x1080 |
Top 10
» Le Top 10 des PC portables multimédia
» Le Top 10 des PC portables de jeu
» Le Top 10 des PC portables de jeu légers
» Le Top 10 des ordinateurs portables bureautiques
» Le Top 10 des PC portables bureautiques premium/professionnels
» Le Top 10 des Stations de travail mobiles
» Le Top 10 des Ultraportables
» Le Top 10 des Ultrabooks
» Le Top 10 des Convertibles
» Le Top 10 des Tablettes
» Le Top 10 des Tablettes Windows
» Le Top 10 des Smartphones
» Le Top 10 des PC Portables á moins de 300 euros
» Le Top 10 des PC Portables á moins de 500 euros
» Le Top 25 des meilleurs écrans d'ordinateurs
Comparaison des tailles
| Networking | |
| iperf3 transmit AX12 | |
| Lenovo Legion Y540-15IRH | |
| Razer Blade 15 GTX 1660 Ti | |
| Acer ConceptD 7 CN715-71-743N | |
| MSI GL65 9SEK | |
| iperf3 receive AX12 | |
| Lenovo Legion Y540-15IRH | |
| Razer Blade 15 GTX 1660 Ti | |
| MSI GL65 9SEK | |
| Acer ConceptD 7 CN715-71-743N | |
| |||||||||||||||||||||||||
Homogénéité de la luminosité: 84 %
Valeur mesurée au centre, sur batterie: 370 cd/m²
Contraste: 1327:1 (Valeurs des noirs: 0.275 cd/m²)
ΔE ColorChecker Calman: 0.99 | ∀{0.5-29.43 Ø4.76}
calibrated: 1.01
ΔE Greyscale Calman: 1.29 | ∀{0.09-98 Ø5}
100% sRGB (Argyll 1.6.3 3D)
88% AdobeRGB 1998 (Argyll 1.6.3 3D)
99% AdobeRGB 1998 (Argyll 3D)
100% sRGB (Argyll 3D)
85.7% Display P3 (Argyll 3D)
Gamma: 2.2
CCT: 6548 K
| Acer ConceptD 7 CN715-71-743N AU Optronics AUO31EB, IPS, 3840x2160, 15.6" | Lenovo Legion Y540-15IRH BOE NV156FHM-N4G (BOE084D), IPS, 1920x1080, 15.6" | MSI GL65 9SEK AU Optronics B156HAN13.0, IPS, 1920x1080, 15.6" | Asus Strix GL531GV-PB74 Panda LM156LF-GL02, IPS, 1920x1080, 15.6" | Razer Blade Pro 17 RTX 2060 AU Optronics B173HAN04.0, IPS, 1920x1080, 17.3" | Razer Blade 15 GTX 1660 Ti BOE NV156FHM-N4K, IPS, 1920x1080, 15.6" | |
|---|---|---|---|---|---|---|
| Display | -22% | -55% | -50% | -26% | -22% | |
| Display P3 Coverage (%) | 85.7 | 64.5 -25% | 36.63 -57% | 40.13 -53% | 61.1 -29% | 65.3 -24% |
| sRGB Coverage (%) | 100 | 91.6 -8% | 55 -45% | 60.3 -40% | 89.4 -11% | 91.8 -8% |
| AdobeRGB 1998 Coverage (%) | 99 | 65.9 -33% | 37.85 -62% | 41.48 -58% | 62.5 -37% | 66.5 -33% |
| Response Times | 75% | 23% | 31% | 79% | 70% | |
| Response Time Grey 50% / Grey 80% * (ms) | 49 ? | 8.8 ? 82% | 26.4 ? 46% | 26 ? 47% | 6.8 ? 86% | 13.6 ? 72% |
| Response Time Black / White * (ms) | 30 ? | 10 ? 67% | 30 ? -0% | 25.6 ? 15% | 8.8 ? 71% | 10 ? 67% |
| PWM Frequency (Hz) | 200 ? | |||||
| Screen | -78% | -181% | -195% | -51% | -102% | |
| Brightness middle (cd/m²) | 365 | 284 -22% | 277.3 -24% | 290.1 -21% | 300.4 -18% | 312.7 -14% |
| Brightness (cd/m²) | 357 | 277 -22% | 256 -28% | 274 -23% | 289 -19% | 305 -15% |
| Brightness Distribution (%) | 84 | 87 4% | 86 2% | 86 2% | 93 11% | 90 7% |
| Black Level * (cd/m²) | 0.275 | 0.3 -9% | 0.2 27% | 0.54 -96% | 0.32 -16% | 0.27 2% |
| Contrast (:1) | 1327 | 947 -29% | 1387 5% | 537 -60% | 939 -29% | 1158 -13% |
| Colorchecker dE 2000 * | 0.99 | 3.53 -257% | 5.25 -430% | 5.16 -421% | 2.32 -134% | 4.57 -362% |
| Colorchecker dE 2000 max. * | 1.89 | 6.11 -223% | 19.43 -928% | 18.09 -857% | 3.81 -102% | 6.81 -260% |
| Colorchecker dE 2000 calibrated * | 1.01 | 1.81 -79% | 4.39 -335% | 4.35 -331% | 2.95 -192% | 2.91 -188% |
| Greyscale dE 2000 * | 1.29 | 3.56 -176% | 3.5 -171% | 4.4 -241% | 1.5 -16% | 4.3 -233% |
| Gamma | 2.2 100% | 2.47 89% | 2.1 105% | 2.1 105% | 2.3 96% | 2.29 96% |
| CCT | 6548 99% | 7257 90% | 6895 94% | 7362 88% | 6764 96% | 7098 92% |
| Color Space (Percent of AdobeRGB 1998) (%) | 88 | 59 -33% | 35 -60% | 38.1 -57% | 57.4 -35% | 59.4 -32% |
| Color Space (Percent of sRGB) (%) | 100 | 91 -9% | 55 -45% | 60 -40% | 89 -11% | 91.3 -9% |
| Moyenne finale (programmes/paramètres) | -8% /
-48% | -71% /
-132% | -71% /
-140% | 1% /
-30% | -18% /
-65% |
* ... Moindre est la valeur, meilleures sont les performances
Temps de réponse de l'écran
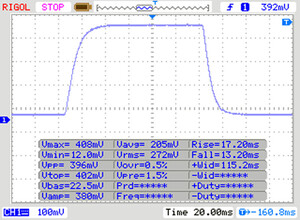
| ↔ Temps de réponse noir à blanc | ||
|---|---|---|
| 30 ms ... hausse ↗ et chute ↘ combinées | ↗ 17 ms hausse | |
| ↘ 13 ms chute | ||
| L'écran souffre de latences très élevées, à éviter pour le jeu. En comparaison, tous les appareils testés affichent entre 0.1 (minimum) et 240 (maximum) ms. » 79 % des appareils testés affichent de meilleures performances. Cela signifie que les latences relevées sont moins bonnes que la moyenne (20.1 ms) de tous les appareils testés. | ||
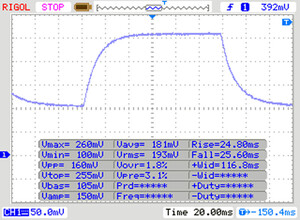
| ↔ Temps de réponse gris 50% à gris 80% | ||
| 49 ms ... hausse ↗ et chute ↘ combinées | ↗ 24 ms hausse | |
| ↘ 25 ms chute | ||
| L'écran souffre de latences très élevées, à éviter pour le jeu. En comparaison, tous les appareils testés affichent entre 0.165 (minimum) et 636 (maximum) ms. » 84 % des appareils testés affichent de meilleures performances. Cela signifie que les latences relevées sont moins bonnes que la moyenne (31.5 ms) de tous les appareils testés. | ||
Scintillement / MLI (Modulation de largeur d'impulsion)
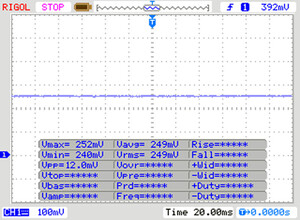
| Scintillement / MLI (Modulation de largeur d'impulsion) non décelé | |||
En comparaison, 53 % des appareils testés n'emploient pas MDI pour assombrir leur écran. Nous avons relevé une moyenne à 8023 (minimum : 5 - maximum : 343500) Hz dans le cas où une MDI était active. | |||
| Cinebench R10 | |
| Rendering Single CPUs 64Bit | |
| Moyenne Intel Core i7-9750H (9069 - 9346, n=3) | |
| Acer ConceptD 7 CN715-71-743N | |
| Rendering Multiple CPUs 64Bit | |
| Moyenne Intel Core i7-9750H (37188 - 44238, n=3) | |
| Acer ConceptD 7 CN715-71-743N | |
| PCMark 8 Home Score Accelerated v2 | 3533 points | |
| PCMark 8 Work Score Accelerated v2 | 4450 points | |
| PCMark 10 Score | 5449 points | |
Aide | ||
| Acer ConceptD 7 CN715-71-743N WDC PC SN720 SDAPNTW-512G | Lenovo Legion Y540-15IRH Samsung PM981a MZVLB1T0HBLR | MSI GL65 9SEK WDC PC SN520 SDAPNUW-512G | Asus Strix GL531GV-PB74 Intel SSD 660p SSDPEKNW512G8 | Razer Blade Pro 17 RTX 2060 Samsung SSD PM981 MZVLB512HAJQ | Razer Blade 15 GTX 1660 Ti Samsung SSD PM981 MZVLB256HAHQ | Moyenne WDC PC SN720 SDAPNTW-512G | |
|---|---|---|---|---|---|---|---|
| CrystalDiskMark 5.2 / 6 | 3% | -12% | -21% | -6% | -6% | -12% | |
| Write 4K (MB/s) | 109 | 131.7 21% | 150.2 38% | 121.9 12% | 124.1 14% | 135 24% | 110 ? 1% |
| Read 4K (MB/s) | 41.33 | 48.06 16% | 43.46 5% | 53.6 30% | 44.75 8% | 41.1 -1% | 36.9 ? -11% |
| Write Seq (MB/s) | 2535 | 1234 -51% | 1412 -44% | 967 -62% | 1292 -49% | 1427 -44% | 1976 ? -22% |
| Read Seq (MB/s) | 1538 | 973 -37% | 1340 -13% | 1461 -5% | 1272 -17% | 1494 -3% | 1710 ? 11% |
| Write 4K Q32T1 (MB/s) | 396.6 | 576 45% | 482.2 22% | 431.4 9% | 514 30% | 494.9 25% | 339 ? -15% |
| Read 4K Q32T1 (MB/s) | 603 | 655 9% | 535 -11% | 337.3 -44% | 596 -1% | 578 -4% | 417 ? -31% |
| Write Seq Q32T1 (MB/s) | 2542 | 3012 18% | 1454 -43% | 972 -62% | 1892 -26% | 1417 -44% | 2218 ? -13% |
| Read Seq Q32T1 (MB/s) | 3324 | 3481 5% | 1744 -48% | 1727 -48% | 3209 -3% | 3251 -2% | 2940 ? -12% |
| AS SSD | 19% | -31% | -24% | 2% | -23% | -12% | |
| Seq Read (MB/s) | 2785 | 1954 -30% | 1315 -53% | 1280 -54% | 1810 -35% | 1829 -34% | 2544 ? -9% |
| Seq Write (MB/s) | 2364 | 2484 5% | 1378 -42% | 905 -62% | 1797 -24% | 1315 -44% | 2034 ? -14% |
| 4K Read (MB/s) | 43.39 | 56.7 31% | 25.31 -42% | 48.73 12% | 48.43 12% | 51.3 18% | 36.5 ? -16% |
| 4K Write (MB/s) | 101.8 | 124.3 22% | 118.2 16% | 107 5% | 106 4% | 106 4% | 110.8 ? 9% |
| 4K-64 Read (MB/s) | 1257 | 1599 27% | 839 -33% | 321.1 -74% | 1156 -8% | 917 -27% | 1112 ? -12% |
| 4K-64 Write (MB/s) | 1473 | 1883 28% | 720 -51% | 761 -48% | 1748 19% | 1212 -18% | 1222 ? -17% |
| Access Time Read * (ms) | 0.073 | 0.039 47% | 0.116 -59% | 0.058 21% | 0.057 22% | 0.063 14% | 0.0965 ? -32% |
| Access Time Write * (ms) | 0.036 | 0.03 17% | 0.091 -153% | 0.046 -28% | 0.035 3% | 0.104 -189% | 0.04212 ? -17% |
| Score Read (Points) | 1579 | 1851 17% | 996 -37% | 498 -68% | 1385 -12% | 1152 -27% | 1403 ? -11% |
| Score Write (Points) | 1811 | 2256 25% | 976 -46% | 958 -47% | 2033 12% | 1450 -20% | 1536 ? -15% |
| Score Total (Points) | 4181 | 5087 22% | 2485 -41% | 1711 -59% | 4135 -1% | 3177 -24% | 3633 ? -13% |
| Copy ISO MB/s (MB/s) | 1592 | 1279 -20% | 1519 -5% | 1984 25% | 1539 -3% | 1506 ? -5% | |
| Copy Program MB/s (MB/s) | 433.7 | 889 105% | 749 73% | 588 36% | 513 18% | 410 ? -5% | |
| Copy Game MB/s (MB/s) | 1026 | 1218 19% | 943 -8% | 835 -19% | 1150 12% | 894 ? -13% | |
| Moyenne finale (programmes/paramètres) | 11% /
12% | -22% /
-24% | -23% /
-23% | -2% /
-0% | -15% /
-17% | -12% /
-12% |
* ... Moindre est la valeur, meilleures sont les performances
| 3DMark 11 Performance | 16394 points | |
| 3DMark Cloud Gate Standard Score | 25480 points | |
| 3DMark Fire Strike Score | 13724 points | |
Aide | ||
| The Witcher 3 | |
| 1920x1080 High Graphics & Postprocessing (Nvidia HairWorks Off) | |
| Razer Blade Pro 17 RTX 2060 | |
| MSI GL65 9SEK | |
| Asus Strix GL531GV-PB74 | |
| Moyenne NVIDIA GeForce RTX 2060 Mobile (74.4 - 131, n=33) | |
| Acer ConceptD 7 CN715-71-743N | |
| Razer Blade 15 GTX 1660 Ti | |
| Moyenne de la classe Multimedia (22 - 242, n=23, 2 dernières années) | |
| 1920x1080 Ultra Graphics & Postprocessing (HBAO+) | |
| Razer Blade Pro 17 RTX 2060 | |
| Asus Strix GL531GV-PB74 | |
| Moyenne NVIDIA GeForce RTX 2060 Mobile (50.6 - 74, n=40) | |
| MSI GL65 9SEK | |
| Acer ConceptD 7 CN715-71-743N | |
| Lenovo Legion Y540-15IRH | |
| Razer Blade 15 GTX 1660 Ti | |
| Moyenne de la classe Multimedia (11 - 121, n=24, 2 dernières années) | |
| 3840x2160 High Graphics & Postprocessing (Nvidia HairWorks Off) | |
| Moyenne de la classe Multimedia (61 - 71, n=2, 2 dernières années) | |
| Acer ConceptD 7 CN715-71-743N | |
| Moyenne NVIDIA GeForce RTX 2060 Mobile (30.4 - 41.3, n=4) | |
| 3840x2160 Ultra Graphics & Postprocessing (HBAO+) | |
| Acer ConceptD 7 CN715-71-743N | |
| Moyenne NVIDIA GeForce RTX 2060 Mobile (n=1) | |
| Rise of the Tomb Raider | |
| 1366x768 Medium Preset AF:2x | |
| Acer ConceptD 7 CN715-71-743N | |
| Moyenne NVIDIA GeForce RTX 2060 Mobile (124 - 160, n=2) | |
| 1920x1080 High Preset AA:FX AF:4x | |
| Acer ConceptD 7 CN715-71-743N | |
| Moyenne NVIDIA GeForce RTX 2060 Mobile (n=1) | |
| 1920x1080 Very High Preset AA:FX AF:16x | |
| Acer ConceptD 7 CN715-71-743N | |
| Moyenne NVIDIA GeForce RTX 2060 Mobile (83.9 - 88, n=3) | |
| Lenovo Legion Y540-15IRH | |
| 3840x2160 High Preset AA:FX AF:4x | |
| Acer ConceptD 7 CN715-71-743N | |
| Moyenne NVIDIA GeForce RTX 2060 Mobile (n=1) | |
| Doom | |
| 1920x1080 Medium Preset | |
| Acer ConceptD 7 CN715-71-743N | |
| Moyenne NVIDIA GeForce RTX 2060 Mobile (n=1) | |
| 1920x1080 High Preset AA:FX | |
| Moyenne NVIDIA GeForce RTX 2060 Mobile (125 - 159, n=2) | |
| Acer ConceptD 7 CN715-71-743N | |
| 1920x1080 Ultra Preset AA:SM | |
| Moyenne NVIDIA GeForce RTX 2060 Mobile (117 - 151, n=2) | |
| Acer ConceptD 7 CN715-71-743N | |
| 3840x2160 High Preset AA:FX | |
| Moyenne NVIDIA GeForce RTX 2060 Mobile (50 - 55.7, n=2) | |
| Acer ConceptD 7 CN715-71-743N | |
| Bas | Moyen | Élevé | Ultra | 4K | |
|---|---|---|---|---|---|
| The Witcher 3 (2015) | 251 | 182 | 107 | 57 | 38 |
| Dota 2 Reborn (2015) | 144 | 131 | 123 | 117 | |
| Rise of the Tomb Raider (2016) | 202 | 160 | 107 | 88 | 39 |
| Doom (2016) | 138 | 134 | 125 | 117 | 50 |
| X-Plane 11.11 (2018) | 89.4 | 83.4 | 67.2 |
| Acer ConceptD 7 CN715-71-743N GeForce RTX 2060 Mobile, i7-9750H, WDC PC SN720 SDAPNTW-512G | Lenovo Legion Y540-15IRH GeForce RTX 2060 Mobile, i7-9750H, Samsung PM981a MZVLB1T0HBLR | MSI GL65 9SEK GeForce RTX 2060 Mobile, i7-9750H, WDC PC SN520 SDAPNUW-512G | Asus Strix GL531GV-PB74 GeForce RTX 2060 Mobile, i7-9750H, Intel SSD 660p SSDPEKNW512G8 | Razer Blade Pro 17 RTX 2060 GeForce RTX 2060 Mobile, i7-9750H, Samsung SSD PM981 MZVLB512HAJQ | Razer Blade 15 GTX 1660 Ti GeForce GTX 1660 Ti Mobile, i7-9750H, Samsung SSD PM981 MZVLB256HAHQ | |
|---|---|---|---|---|---|---|
| Noise | -6% | -10% | -5% | 0% | -2% | |
| arrêt / environnement * (dB) | 30.4 | 30 1% | 28.1 8% | 28.2 7% | 28.2 7% | 28.5 6% |
| Idle Minimum * (dB) | 30.6 | 30 2% | 31.4 -3% | 28.8 6% | 28.2 8% | 30.3 1% |
| Idle Average * (dB) | 30.6 | 32 -5% | 31.5 -3% | 31.4 -3% | 28.2 8% | 30.5 -0% |
| Idle Maximum * (dB) | 30.6 | 34 -11% | 33.5 -9% | 33.3 -9% | 28.2 8% | 30.5 -0% |
| Load Average * (dB) | 44 | 44 -0% | 49.3 -12% | 46.2 -5% | 43 2% | 41 7% |
| Witcher 3 ultra * (dB) | 43.9 | 48 -9% | 51.3 -17% | 50.5 -15% | 48.4 -10% | 48 -9% |
| Load Maximum * (dB) | 44.2 | 52 -18% | 58 -31% | 51.3 -16% | 53.4 -21% | 51.9 -17% |
* ... Moindre est la valeur, meilleures sont les performances
Degré de la nuisance sonore
| Au repos |
| 30.6 / 30.6 / 30.6 dB(A) |
| Fortement sollicité |
| 44 / 44.2 dB(A) |
 | ||
30 dB silencieux 40 dB(A) audible 50 dB(A) bruyant |
||
min: | ||
(±) La température maximale du côté supérieur est de 44.6 °C / 112 F, par rapport à la moyenne de 36.9 °C / 98 F, allant de 21.1 à 71 °C pour la classe Multimedia.
(-) Le fond chauffe jusqu'à un maximum de 57.2 °C / 135 F, contre une moyenne de 39.1 °C / 102 F
(+) En utilisation inactive, la température moyenne du côté supérieur est de 25.5 °C / 78 F, par rapport à la moyenne du dispositif de 31.3 °C / 88 F.
(-) En jouant à The Witcher 3, la température moyenne du côté supérieur est de 38.5 °C / 101 F, alors que la moyenne de l'appareil est de 31.3 °C / 88 F.
(-) Les repose-poignets et le pavé tactile peuvent devenir très chauds au toucher, avec un maximum de 41 °C / 105.8# F.
(-) La température moyenne de la zone de l'appui-paume de dispositifs similaires était de 28.7 °C / 83.7 F (-12.3 °C / #-22.1 F).
| Acer ConceptD 7 CN715-71-743N GeForce RTX 2060 Mobile, i7-9750H, WDC PC SN720 SDAPNTW-512G | Lenovo Legion Y540-15IRH GeForce RTX 2060 Mobile, i7-9750H, Samsung PM981a MZVLB1T0HBLR | MSI GL65 9SEK GeForce RTX 2060 Mobile, i7-9750H, WDC PC SN520 SDAPNUW-512G | Asus Strix GL531GV-PB74 GeForce RTX 2060 Mobile, i7-9750H, Intel SSD 660p SSDPEKNW512G8 | Razer Blade Pro 17 RTX 2060 GeForce RTX 2060 Mobile, i7-9750H, Samsung SSD PM981 MZVLB512HAJQ | Razer Blade 15 GTX 1660 Ti GeForce GTX 1660 Ti Mobile, i7-9750H, Samsung SSD PM981 MZVLB256HAHQ | |
|---|---|---|---|---|---|---|
| Heat | -24% | -24% | -5% | 2% | -23% | |
| Maximum Upper Side * (°C) | 44.6 | 47 -5% | 49 -10% | 43.4 3% | 40.6 9% | 52 -17% |
| Maximum Bottom * (°C) | 57.2 | 60 -5% | 54.2 5% | 49.2 14% | 45.4 21% | 52.2 9% |
| Idle Upper Side * (°C) | 27.4 | 37 -35% | 40.4 -47% | 30.8 -12% | 30 -9% | 38 -39% |
| Idle Bottom * (°C) | 27.6 | 41 -49% | 40 -45% | 34 -23% | 31 -12% | 40.4 -46% |
* ... Moindre est la valeur, meilleures sont les performances
Acer ConceptD 7 CN715-71-743N analyse audio
(-) | haut-parleurs pas très forts (68.5 dB)
Basses 100 - 315 Hz
(±) | basse réduite - en moyenne 13.3% inférieure à la médiane
(-) | les basses ne sont pas linéaires (17% delta à la fréquence précédente)
Médiums 400 - 2000 Hz
(+) | médiane équilibrée - seulement 3.9% de la médiane
(+) | les médiums sont linéaires (6.9% delta à la fréquence précédente)
Aiguës 2 - 16 kHz
(+) | des sommets équilibrés - à seulement 3.2% de la médiane
(±) | la linéarité des aigus est moyenne (7.2% delta à la fréquence précédente)
Globalement 100 - 16 000 Hz
(±) | la linéarité du son global est moyenne (17.3% de différence avec la médiane)
Par rapport à la même classe
» 48% de tous les appareils testés de cette catégorie étaient meilleurs, 8% similaires, 45% pires
» Le meilleur avait un delta de 5%, la moyenne était de 17%, le pire était de 45%.
Par rapport à tous les appareils testés
» 32% de tous les appareils testés étaient meilleurs, 8% similaires, 60% pires
» Le meilleur avait un delta de 4%, la moyenne était de 24%, le pire était de 134%.
Apple MacBook 12 (Early 2016) 1.1 GHz analyse audio
(+) | les haut-parleurs peuvent jouer relativement fort (83.6# dB)
Basses 100 - 315 Hz
(±) | basse réduite - en moyenne 11.3% inférieure à la médiane
(±) | la linéarité des basses est moyenne (14.2% delta à la fréquence précédente)
Médiums 400 - 2000 Hz
(+) | médiane équilibrée - seulement 2.4% de la médiane
(+) | les médiums sont linéaires (5.5% delta à la fréquence précédente)
Aiguës 2 - 16 kHz
(+) | des sommets équilibrés - à seulement 2% de la médiane
(+) | les aigus sont linéaires (4.5% delta à la fréquence précédente)
Globalement 100 - 16 000 Hz
(+) | le son global est linéaire (10.2% différence à la médiane)
Par rapport à la même classe
» 7% de tous les appareils testés de cette catégorie étaient meilleurs, 2% similaires, 91% pires
» Le meilleur avait un delta de 5%, la moyenne était de 18%, le pire était de 53%.
Par rapport à tous les appareils testés
» 4% de tous les appareils testés étaient meilleurs, 1% similaires, 94% pires
» Le meilleur avait un delta de 4%, la moyenne était de 24%, le pire était de 134%.
| Éteint/en veille | |
| Au repos | |
| Fortement sollicité |
|
Légende:
min: | |
| Acer ConceptD 7 CN715-71-743N i7-9750H, GeForce RTX 2060 Mobile, WDC PC SN720 SDAPNTW-512G, IPS, 3840x2160, 15.6" | MSI GL65 9SEK i7-9750H, GeForce RTX 2060 Mobile, WDC PC SN520 SDAPNUW-512G, IPS, 1920x1080, 15.6" | Asus Strix GL531GV-PB74 i7-9750H, GeForce RTX 2060 Mobile, Intel SSD 660p SSDPEKNW512G8, IPS, 1920x1080, 15.6" | Razer Blade Pro 17 RTX 2060 i7-9750H, GeForce RTX 2060 Mobile, Samsung SSD PM981 MZVLB512HAJQ, IPS, 1920x1080, 17.3" | Razer Blade 15 GTX 1660 Ti i7-9750H, GeForce GTX 1660 Ti Mobile, Samsung SSD PM981 MZVLB256HAHQ, IPS, 1920x1080, 15.6" | Lenovo Legion Y540-15IRH i7-9750H, GeForce RTX 2060 Mobile, Samsung PM981a MZVLB1T0HBLR, IPS, 1920x1080, 15.6" | Moyenne NVIDIA GeForce RTX 2060 Mobile | Moyenne de la classe Multimedia | |
|---|---|---|---|---|---|---|---|---|
| Power Consumption | -141% | -27% | -42% | -61% | -36% | -23% | 30% | |
| Idle Minimum * (Watt) | 7.6 | 41 -439% | 10.9 -43% | 16 -111% | 18.7 -146% | 15 -97% | 11.5 ? -51% | 5.96 ? 22% |
| Idle Average * (Watt) | 13.6 | 45.3 -233% | 14.7 -8% | 21.7 -60% | 30.7 -126% | 20 -47% | 16.5 ? -21% | 10.3 ? 24% |
| Idle Maximum * (Watt) | 18.2 | 47.1 -159% | 32.4 -78% | 26.1 -43% | 33.9 -86% | 33 -81% | 23.7 ? -30% | 12.3 ? 32% |
| Load Average * (Watt) | 102 | 94.9 7% | 121.9 -20% | 105.6 -4% | 93.4 8% | 88 14% | 107.5 ? -5% | 67.4 ? 34% |
| Witcher 3 ultra * (Watt) | 144 | 149.4 -4% | 143.5 -0% | 161.8 -12% | 158.9 -10% | 128 11% | ||
| Load Maximum * (Watt) | 183 | 214.2 -17% | 209.6 -15% | 225.3 -23% | 195.3 -7% | 213 -16% | 199.7 ? -9% | 113.2 ? 38% |
* ... Moindre est la valeur, meilleures sont les performances
| Acer ConceptD 7 CN715-71-743N i7-9750H, GeForce RTX 2060 Mobile, 84 Wh | MSI GL65 9SEK i7-9750H, GeForce RTX 2060 Mobile, 51 Wh | Lenovo Legion Y540-15IRH i7-9750H, GeForce RTX 2060 Mobile, 57 Wh | Asus Strix GL531GV-PB74 i7-9750H, GeForce RTX 2060 Mobile, 66 Wh | Razer Blade Pro 17 RTX 2060 i7-9750H, GeForce RTX 2060 Mobile, 70 Wh | Razer Blade 15 GTX 1660 Ti i7-9750H, GeForce GTX 1660 Ti Mobile, 65 Wh | Moyenne de la classe Multimedia | |
|---|---|---|---|---|---|---|---|
| Autonomie de la batterie | -54% | -55% | -78% | -48% | -36% | 68% | |
| Reader / Idle (h) | 13.7 | 4.4 -68% | 3.9 -72% | 25.2 ? 84% | |||
| H.264 (h) | 6.5 | 16.1 ? 148% | |||||
| WiFi v1.3 (h) | 8.6 | 3.8 -56% | 3.2 -63% | 1.9 -78% | 4.5 -48% | 5.5 -36% | 11.4 ? 33% |
| Load (h) | 1.6 | 1 -37% | 1.1 -31% | 1.692 ? 6% |
Points positifs
Points négatifs
Verdict
Le ConceptD d’Acer est vendu comme un système multimédia performant, pour les créatifs. Les résultats de notre test ne reflètent qu’imparfaitement cette ambition, Acer ayant dû réduire les prix. Pour plus de 2 000 €, les clients les moins sensibles au prix auront un portable multimédia élégant avec une allure premium qui, au vu de ses fonctionnalités, s’avère plutôt compact et léger. De plus, il reste frais, silencieux, et sa consommation est plus que raisonnable.
Cependant, le revers de la médaille est que les composants sont peu performants. Le processeur en particulier subit un throttling conséquent, et la chauffe réduit encore plus les performances à cause du châssis compact. Et sur batterie, les performances sont encore plus bridées.
Ceux qui choisissent leur système multimédia uniquement en fonction de la puissance seront mieux servis pas des concurrents moins chers. Avec son grand écran 4K, qui possède un bon contraste et une très bonne couverture des espaces colorimétriques, le ConceptD possède néanmoins quelques arguments, la plupart des autres portables multimédias ne pouvant le suivre sur ce terrain.
Le ConceptD 7 est élégant, silencieux, frais, et consomme peu, tout en ayant un look premium. L’écran 4K, qui couvre bien les espaces colorimétriques, pourrait être décisif dans le choix des créatifs. Cependant les performances de l’appareil Acer sont décevantes, avec un gros throttling du processeur débouchant sur un système lent par rapport à ses concurrents.
L’intégralité de cette critique est disponible en anglais en suivant ce lien.
Acer ConceptD 7 CN715-71-743N
- 05/21/2020 v7 (old)
Christian Hintze


