Courte critique du Razer Blade Pro 17 (i7-9750H, RTX 2060, FHD) : quel résultat par rapport à la version RTX 2080 Max-Q?
| SD Card Reader | |
| average JPG Copy Test (av. of 3 runs) | |
| Razer Blade Pro 17 RTX 2060 (Toshiba Exceria Pro SDXC 64 GB UHS-II) | |
| Razer Blade Pro 2017 (Toshiba Exceria Pro SDXC 64 GB UHS-II) | |
| maximum AS SSD Seq Read Test (1GB) | |
| Razer Blade Pro 17 RTX 2060 (Toshiba Exceria Pro SDXC 64 GB UHS-II) | |
| Razer Blade Pro 2017 (Toshiba Exceria Pro SDXC 64 GB UHS-II) | |
| |||||||||||||||||||||||||
Homogénéité de la luminosité: 93 %
Valeur mesurée au centre, sur batterie: 300.4 cd/m²
Contraste: 939:1 (Valeurs des noirs: 0.32 cd/m²)
ΔE ColorChecker Calman: 2.32 | ∀{0.5-29.43 Ø4.73}
calibrated: 2.95
ΔE Greyscale Calman: 1.5 | ∀{0.09-98 Ø4.97}
89% sRGB (Argyll 1.6.3 3D)
57.4% AdobeRGB 1998 (Argyll 1.6.3 3D)
62.5% AdobeRGB 1998 (Argyll 3D)
89.4% sRGB (Argyll 3D)
61.1% Display P3 (Argyll 3D)
Gamma: 2.3
CCT: 6764 K
| Razer Blade Pro 17 RTX 2060 AU Optronics B173HAN04.0, IPS, 17.3", 1920x1080 | Asus Zephyrus S GX701GX B173HAN04.0 (AUO409D), IPS, 17.3", 1920x1080 | MSI GS75 Stealth 9SG Chi Mei N173HCE-G33 (CMN175C), IPS, 17.3", 1920x1080 | Asus ASUS ROG Strix SCAR III G731GW-XB74 AU Optronics AUO409D, IPS, 17.3", 1920x1080 | Razer Blade Pro 2017 Sharp LQ173D1JW33 (SHP145A), IGZO, 17.3", 3840x2160 | Acer Predator Helios 500 PH517-51-93LS B173ZAN01.0, IPS LED, 17.3", 3840x2160 | |
|---|---|---|---|---|---|---|
| Display | 1% | 4% | -0% | 39% | 38% | |
| Display P3 Coverage (%) | 61.1 | 62.9 3% | 62.6 2% | 61.9 1% | 88.9 45% | 86.7 42% |
| sRGB Coverage (%) | 89.4 | 87.8 -2% | 93.5 5% | 86.3 -3% | 100 12% | 100 12% |
| AdobeRGB 1998 Coverage (%) | 62.5 | 63.9 2% | 64.7 4% | 62.9 1% | 99.7 60% | 99.4 59% |
| Response Times | -8% | -10% | -19% | -565% | -303% | |
| Response Time Grey 50% / Grey 80% * (ms) | 6.8 ? | 7.2 ? -6% | 7.2 ? -6% | 7.2 ? -6% | 60.8 ? -794% | 36 ? -429% |
| Response Time Black / White * (ms) | 8.8 ? | 9.6 ? -9% | 10 ? -14% | 11.6 ? -32% | 38.4 ? -336% | 24.4 ? -177% |
| PWM Frequency (Hz) | 25510 ? | 204.9 ? | ||||
| Screen | 7% | 17% | -34% | -45% | -15% | |
| Brightness middle (cd/m²) | 300.4 | 288 -4% | 366 22% | 297.4 -1% | 230 -23% | 366 22% |
| Brightness (cd/m²) | 289 | 287 -1% | 343 19% | 306 6% | 207 -28% | 349 21% |
| Brightness Distribution (%) | 93 | 91 -2% | 91 -2% | 80 -14% | 83 -11% | 86 -8% |
| Black Level * (cd/m²) | 0.32 | 0.2 37% | 0.29 9% | 0.31 3% | 0.2 37% | 0.46 -44% |
| Contrast (:1) | 939 | 1440 53% | 1262 34% | 959 2% | 1150 22% | 796 -15% |
| Colorchecker dE 2000 * | 2.32 | 2.33 -0% | 1.51 35% | 4.08 -76% | 5.62 -142% | 2.9 -25% |
| Colorchecker dE 2000 max. * | 3.81 | 5.34 -40% | 3.22 15% | 6.88 -81% | 10.24 -169% | 5.4 -42% |
| Colorchecker dE 2000 calibrated * | 2.95 | 2.47 16% | 0.71 76% | 4 -36% | 3.1 -5% | |
| Greyscale dE 2000 * | 1.5 | 1.19 21% | 1.93 -29% | 4 -167% | 4.54 -203% | 3.5 -133% |
| Gamma | 2.3 96% | 2.41 91% | 2.38 92% | 2.259 97% | 2.36 93% | 2.37 93% |
| CCT | 6764 96% | 6710 97% | 6881 94% | 7205 90% | 6625 98% | 6616 98% |
| Color Space (Percent of AdobeRGB 1998) (%) | 57.4 | 57 -1% | 60 5% | 56 -2% | 88 53% | 88.1 53% |
| Color Space (Percent of sRGB) (%) | 89 | 88 -1% | 94 6% | 86 -3% | 100 12% | 100 12% |
| Moyenne finale (programmes/paramètres) | 0% /
4% | 4% /
11% | -18% /
-26% | -190% /
-98% | -93% /
-41% |
* ... Moindre est la valeur, meilleures sont les performances
Temps de réponse de l'écran
| ↔ Temps de réponse noir à blanc | ||
|---|---|---|
| 8.8 ms ... hausse ↗ et chute ↘ combinées | ↗ 4.4 ms hausse | 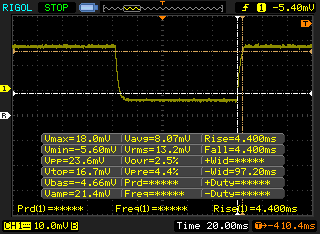 |
| ↘ 4.4 ms chute | ||
| L'écran montre de faibles temps de réponse, un bon écran pour jouer. En comparaison, tous les appareils testés affichent entre 0.1 (minimum) et 240 (maximum) ms. » 24 % des appareils testés affichent de meilleures performances. Cela signifie que les latences relevées sont meilleures que la moyenne (19.9 ms) de tous les appareils testés. | ||
| ↔ Temps de réponse gris 50% à gris 80% | ||
| 6.8 ms ... hausse ↗ et chute ↘ combinées | ↗ 3.6 ms hausse | 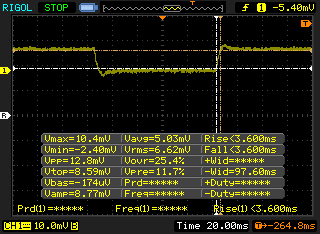 |
| ↘ 3.2 ms chute | ||
| L'écran montre de très faibles temps de réponse, parfait pour le jeu. En comparaison, tous les appareils testés affichent entre 0.165 (minimum) et 636 (maximum) ms. » 19 % des appareils testés affichent de meilleures performances. Cela signifie que les latences relevées sont meilleures que la moyenne (31.1 ms) de tous les appareils testés. | ||
Scintillement / MLI (Modulation de largeur d'impulsion)
| Scintillement / MLI (Modulation de largeur d'impulsion) non décelé |  | ||
En comparaison, 52 % des appareils testés n'emploient pas MDI pour assombrir leur écran. Nous avons relevé une moyenne à 7784 (minimum : 5 - maximum : 343500) Hz dans le cas où une MDI était active. | |||
| Cinebench R10 | |
| Rendering Multiple CPUs 32Bit | |
| Schenker XMG Ultra 15 Turing | |
| MSI GE75 9SG | |
| Moyenne Intel Core i7-9750H (28251 - 36304, n=13) | |
| Lenovo Legion Y540-17IRH | |
| Asus Strix GL703VM-DB74 | |
| Rendering Single 32Bit | |
| Schenker XMG Ultra 15 Turing | |
| MSI GE75 9SG | |
| Moyenne Intel Core i7-9750H (6659 - 7214, n=13) | |
| Lenovo Legion Y540-17IRH | |
| Asus Strix GL703VM-DB74 | |
| wPrime 2.10 - 1024m | |
| Asus Strix GL703VM-DB74 | |
| Moyenne Intel Core i7-9750H (n=1) | |
| MSI GE75 9SG | |
* ... Moindre est la valeur, meilleures sont les performances
| PCMark 8 Home Score Accelerated v2 | 4401 points | |
| PCMark 8 Work Score Accelerated v2 | 5676 points | |
| PCMark 10 Score | 5641 points | |
Aide | ||
| Razer Blade Pro 17 RTX 2060 Samsung SSD PM981 MZVLB512HAJQ | Asus Zephyrus S GX701GX Samsung SSD PM981 MZVLB1T0HALR | MSI GS75 Stealth 9SG 2x Samsung SSD PM981 MZVLB1T0HALR (RAID 0) | Asus ASUS ROG Strix SCAR III G731GW-XB74 Intel SSD 660p 1TB SSDPEKNW010T8 | Razer Blade Pro 2017 2x Samsung SSD PM951 MZVLV256HCHP (RAID 0) | |
|---|---|---|---|---|---|
| AS SSD | 5% | 6% | -34% | -19% | |
| Seq Read (MB/s) | 1810 | 911 -50% | 2855 58% | 1427 -21% | 2599 44% |
| Seq Write (MB/s) | 1797 | 2347 31% | 2687 50% | 1610 -10% | 588 -67% |
| 4K Read (MB/s) | 48.43 | 53 9% | 30.31 -37% | 25.63 -47% | 37.57 -22% |
| 4K Write (MB/s) | 106 | 122.5 16% | 96.3 -9% | 84.2 -21% | 104.4 -2% |
| 4K-64 Read (MB/s) | 1156 | 1577 36% | 1460 26% | 588 -49% | 1116 -3% |
| 4K-64 Write (MB/s) | 1748 | 1734 -1% | 1224 -30% | 732 -58% | 513 -71% |
| Access Time Read * (ms) | 0.057 | 0.08 -40% | 0.054 5% | 0.054 5% | 0.051 11% |
| Access Time Write * (ms) | 0.035 | 0.031 11% | 0.038 -9% | 0.071 -103% | 0.036 -3% |
| Score Read (Points) | 1385 | 1721 24% | 1776 28% | 756 -45% | 1414 2% |
| Score Write (Points) | 2033 | 2091 3% | 1589 -22% | 978 -52% | 676 -67% |
| Score Total (Points) | 4135 | 4771 15% | 4259 3% | 2134 -48% | 2715 -34% |
| Copy ISO MB/s (MB/s) | 1984 | 2226 12% | 1489 -25% | ||
| Copy Program MB/s (MB/s) | 588 | 426.4 -27% | 514 -13% | ||
| Copy Game MB/s (MB/s) | 835 | 1152 38% | 893 7% |
* ... Moindre est la valeur, meilleures sont les performances

| 3DMark 11 Performance | 18741 points | |
| 3DMark Cloud Gate Standard Score | 37458 points | |
| 3DMark Fire Strike Score | 15132 points | |
| 3DMark Time Spy Score | 6608 points | |
Aide | ||
| Shadow of the Tomb Raider - 1920x1080 Highest Preset AA:T | |
| MSI GE75 9SG | |
| MSI RTX 2060 Gaming Z 6G | |
| Asus ASUS ROG Strix SCAR III G731GW-XB74 | |
| Alienware m15 P79F | |
| Razer Blade Pro 17 RTX 2060 | |
| Asus Zephyrus S GX701GX | |
| Moyenne NVIDIA GeForce RTX 2060 Mobile (54 - 86, n=22) | |
| Asus ROG Strix G GL731GU-RB74 | |
| MSI GF75 Thin 9SC | |
| Bas | Moyen | Élevé | Ultra | |
|---|---|---|---|---|
| BioShock Infinite (2013) | 320.8 | 278 | 246.3 | 153.4 |
| The Witcher 3 (2015) | 279.4 | 196.4 | 118.5 | 65 |
| Shadow of the Tomb Raider (2018) | 130 | 97 | 92 | 81 |
| Razer Blade Pro 17 RTX 2060 GeForce RTX 2060 Mobile, i7-9750H, Samsung SSD PM981 MZVLB512HAJQ | Asus Zephyrus S GX701GX GeForce RTX 2080 Max-Q, i7-8750H, Samsung SSD PM981 MZVLB1T0HALR | MSI GS75 Stealth 9SG GeForce RTX 2080 Max-Q, i7-9750H, 2x Samsung SSD PM981 MZVLB1T0HALR (RAID 0) | Asus ASUS ROG Strix SCAR III G731GW-XB74 GeForce RTX 2070 Mobile, i7-9750H, Intel SSD 660p 1TB SSDPEKNW010T8 | Razer Blade Pro 2017 GeForce GTX 1080 Mobile, i7-7820HK, 2x Samsung SSD PM951 MZVLV256HCHP (RAID 0) | Razer Blade Pro 17 RTX 2080 Max-Q GeForce RTX 2080 Max-Q, i7-9750H, Samsung SSD PM981 MZVLB512HAJQ | Acer Predator Helios 500 PH517-51-93LS GeForce GTX 1070 Mobile, i9-8950HK, Liteon CA1-8D512 | |
|---|---|---|---|---|---|---|---|
| Noise | -6% | -9% | -6% | -9% | -2% | 6% | |
| arrêt / environnement * (dB) | 28.2 | 29 -3% | 30 -6% | 28.2 -0% | 30 -6% | 28.2 -0% | 29.4 -4% |
| Idle Minimum * (dB) | 28.2 | 29 -3% | 31 -10% | 28.2 -0% | 30 -6% | 28.2 -0% | 29.4 -4% |
| Idle Average * (dB) | 28.2 | 32 -13% | 32 -13% | 28.5 -1% | 31 -10% | 28.2 -0% | 29.4 -4% |
| Idle Maximum * (dB) | 28.2 | 33 -17% | 38 -35% | 30 -6% | 33 -17% | 30.8 -9% | 30.1 -7% |
| Load Average * (dB) | 43 | 47 -9% | 47 -9% | 51.5 -20% | 43 -0% | 42 2% | 36 16% |
| Witcher 3 ultra * (dB) | 48.4 | 49 -1% | 48 1% | 55.3 -14% | 55 -14% | 51 -5% | 37.6 22% |
| Load Maximum * (dB) | 53.4 | 51 4% | 49 8% | 55.3 -4% | 58 -9% | 53 1% | 42.2 21% |
* ... Moindre est la valeur, meilleures sont les performances
Degré de la nuisance sonore
| Au repos |
| 28.2 / 28.2 / 28.2 dB(A) |
| Fortement sollicité |
| 43 / 53.4 dB(A) |
 | ||
30 dB silencieux 40 dB(A) audible 50 dB(A) bruyant |
||
min: | ||
(±) La température maximale du côté supérieur est de 40.6 °C / 105 F, par rapport à la moyenne de 40.4 °C / 105 F, allant de 21.2 à 68.8 °C pour la classe Gaming.
(-) Le fond chauffe jusqu'à un maximum de 45.4 °C / 114 F, contre une moyenne de 43.2 °C / 110 F
(+) En utilisation inactive, la température moyenne du côté supérieur est de 28.6 °C / 83 F, par rapport à la moyenne du dispositif de 33.9 °C / 93 F.
(±) En jouant à The Witcher 3, la température moyenne du côté supérieur est de 32.8 °C / 91 F, alors que la moyenne de l'appareil est de 33.9 °C / 93 F.
(+) Les repose-poignets et le pavé tactile sont plus froids que la température de la peau avec un maximum de 30 °C / 86 F et sont donc froids au toucher.
(±) La température moyenne de la zone de l'appui-paume de dispositifs similaires était de 28.8 °C / 83.8 F (-1.2 °C / #-2.2 F).
Razer Blade Pro 17 RTX 2060 analyse audio
(+) | les haut-parleurs peuvent jouer relativement fort (84.9# dB)
Basses 100 - 315 Hz
(±) | basse réduite - en moyenne 9.6% inférieure à la médiane
(±) | la linéarité des basses est moyenne (14.4% delta à la fréquence précédente)
Médiums 400 - 2000 Hz
(±) | médiane supérieure - en moyenne 6.7% supérieure à la médiane
(+) | les médiums sont linéaires (5.1% delta à la fréquence précédente)
Aiguës 2 - 16 kHz
(+) | des sommets équilibrés - à seulement 2.4% de la médiane
(+) | les aigus sont linéaires (4.4% delta à la fréquence précédente)
Globalement 100 - 16 000 Hz
(±) | la linéarité du son global est moyenne (18.1% de différence avec la médiane)
Par rapport à la même classe
» 57% de tous les appareils testés de cette catégorie étaient meilleurs, 8% similaires, 35% pires
» Le meilleur avait un delta de 6%, la moyenne était de 18%, le pire était de 132%.
Par rapport à tous les appareils testés
» 38% de tous les appareils testés étaient meilleurs, 8% similaires, 54% pires
» Le meilleur avait un delta de 4%, la moyenne était de 24%, le pire était de 134%.
Apple MacBook 12 (Early 2016) 1.1 GHz analyse audio
(+) | les haut-parleurs peuvent jouer relativement fort (83.6# dB)
Basses 100 - 315 Hz
(±) | basse réduite - en moyenne 11.3% inférieure à la médiane
(±) | la linéarité des basses est moyenne (14.2% delta à la fréquence précédente)
Médiums 400 - 2000 Hz
(+) | médiane équilibrée - seulement 2.4% de la médiane
(+) | les médiums sont linéaires (5.5% delta à la fréquence précédente)
Aiguës 2 - 16 kHz
(+) | des sommets équilibrés - à seulement 2% de la médiane
(+) | les aigus sont linéaires (4.5% delta à la fréquence précédente)
Globalement 100 - 16 000 Hz
(+) | le son global est linéaire (10.2% différence à la médiane)
Par rapport à la même classe
» 7% de tous les appareils testés de cette catégorie étaient meilleurs, 2% similaires, 91% pires
» Le meilleur avait un delta de 5%, la moyenne était de 18%, le pire était de 53%.
Par rapport à tous les appareils testés
» 5% de tous les appareils testés étaient meilleurs, 1% similaires, 94% pires
» Le meilleur avait un delta de 4%, la moyenne était de 24%, le pire était de 134%.
| Éteint/en veille | |
| Au repos | |
| Fortement sollicité |
|
Légende:
min: | |
| Razer Blade Pro 17 RTX 2060 i7-9750H, GeForce RTX 2060 Mobile, Samsung SSD PM981 MZVLB512HAJQ, IPS, 1920x1080, 17.3" | Razer Blade Pro 17 RTX 2080 Max-Q i7-9750H, GeForce RTX 2080 Max-Q, Samsung SSD PM981 MZVLB512HAJQ, IPS, 1920x1080, 17.3" | Asus ASUS ROG Strix SCAR III G731GW-XB74 i7-9750H, GeForce RTX 2070 Mobile, Intel SSD 660p 1TB SSDPEKNW010T8, IPS, 1920x1080, 17.3" | Razer Blade Pro 2017 i7-7820HK, GeForce GTX 1080 Mobile, 2x Samsung SSD PM951 MZVLV256HCHP (RAID 0), IGZO, 3840x2160, 17.3" | Acer Predator Helios 500 PH517-51-93LS i9-8950HK, GeForce GTX 1070 Mobile, Liteon CA1-8D512, IPS LED, 3840x2160, 17.3" | Asus GL704GM-DH74 i7-8750H, GeForce GTX 1060 Mobile, WDC PC SN520 SDAPNUW-256G, IPS, 1920x1080, 17.3" | |
|---|---|---|---|---|---|---|
| Power Consumption | 1% | -16% | -46% | -31% | 8% | |
| Idle Minimum * (Watt) | 16 | 16.2 -1% | 18.2 -14% | 31 -94% | 24.6 -54% | 15.2 5% |
| Idle Average * (Watt) | 21.7 | 20.4 6% | 23 -6% | 36 -66% | 33.1 -53% | 20.4 6% |
| Idle Maximum * (Watt) | 26.1 | 26.1 -0% | 33.1 -27% | 44 -69% | 37.2 -43% | 27.3 -5% |
| Load Average * (Watt) | 105.6 | 96.5 9% | 124.8 -18% | 107 -1% | 124 -17% | 92.9 12% |
| Witcher 3 ultra * (Watt) | 161.8 | 182.9 -13% | 180.8 -12% | 212 -31% | 180 -11% | 143 12% |
| Load Maximum * (Watt) | 225.3 | 214.3 5% | 263 -17% | 258 -15% | 236.5 -5% | 190.6 15% |
* ... Moindre est la valeur, meilleures sont les performances
| Razer Blade Pro 17 RTX 2060 i7-9750H, GeForce RTX 2060 Mobile, 70 Wh | Asus Zephyrus S GX701GX i7-8750H, GeForce RTX 2080 Max-Q, 76 Wh | MSI GS75 Stealth 9SG i7-9750H, GeForce RTX 2080 Max-Q, 80.25 Wh | Asus ASUS ROG Strix SCAR III G731GW-XB74 i7-9750H, GeForce RTX 2070 Mobile, 66 Wh | Razer Blade Pro 2017 i7-7820HK, GeForce GTX 1080 Mobile, 99 Wh | Acer Predator Helios 500 PH517-51-93LS i9-8950HK, GeForce GTX 1070 Mobile, 74 Wh | Razer Blade Pro 17 RTX 2080 Max-Q i7-9750H, GeForce RTX 2080 Max-Q, 70 Wh | |
|---|---|---|---|---|---|---|---|
| Autonomie de la batterie | -16% | 33% | -13% | -27% | -36% | 4% | |
| WiFi v1.3 (h) | 4.5 | 3.8 -16% | 6 33% | 3.9 -13% | 3.3 -27% | 2.9 -36% | 4.7 4% |
| Reader / Idle (h) | 5 | 7.7 | 4.2 | 4.2 | 4.9 | ||
| Load (h) | 0.9 | 1.2 | 1.4 | 1.4 | 1.4 |
Points positifs
Points négatifs
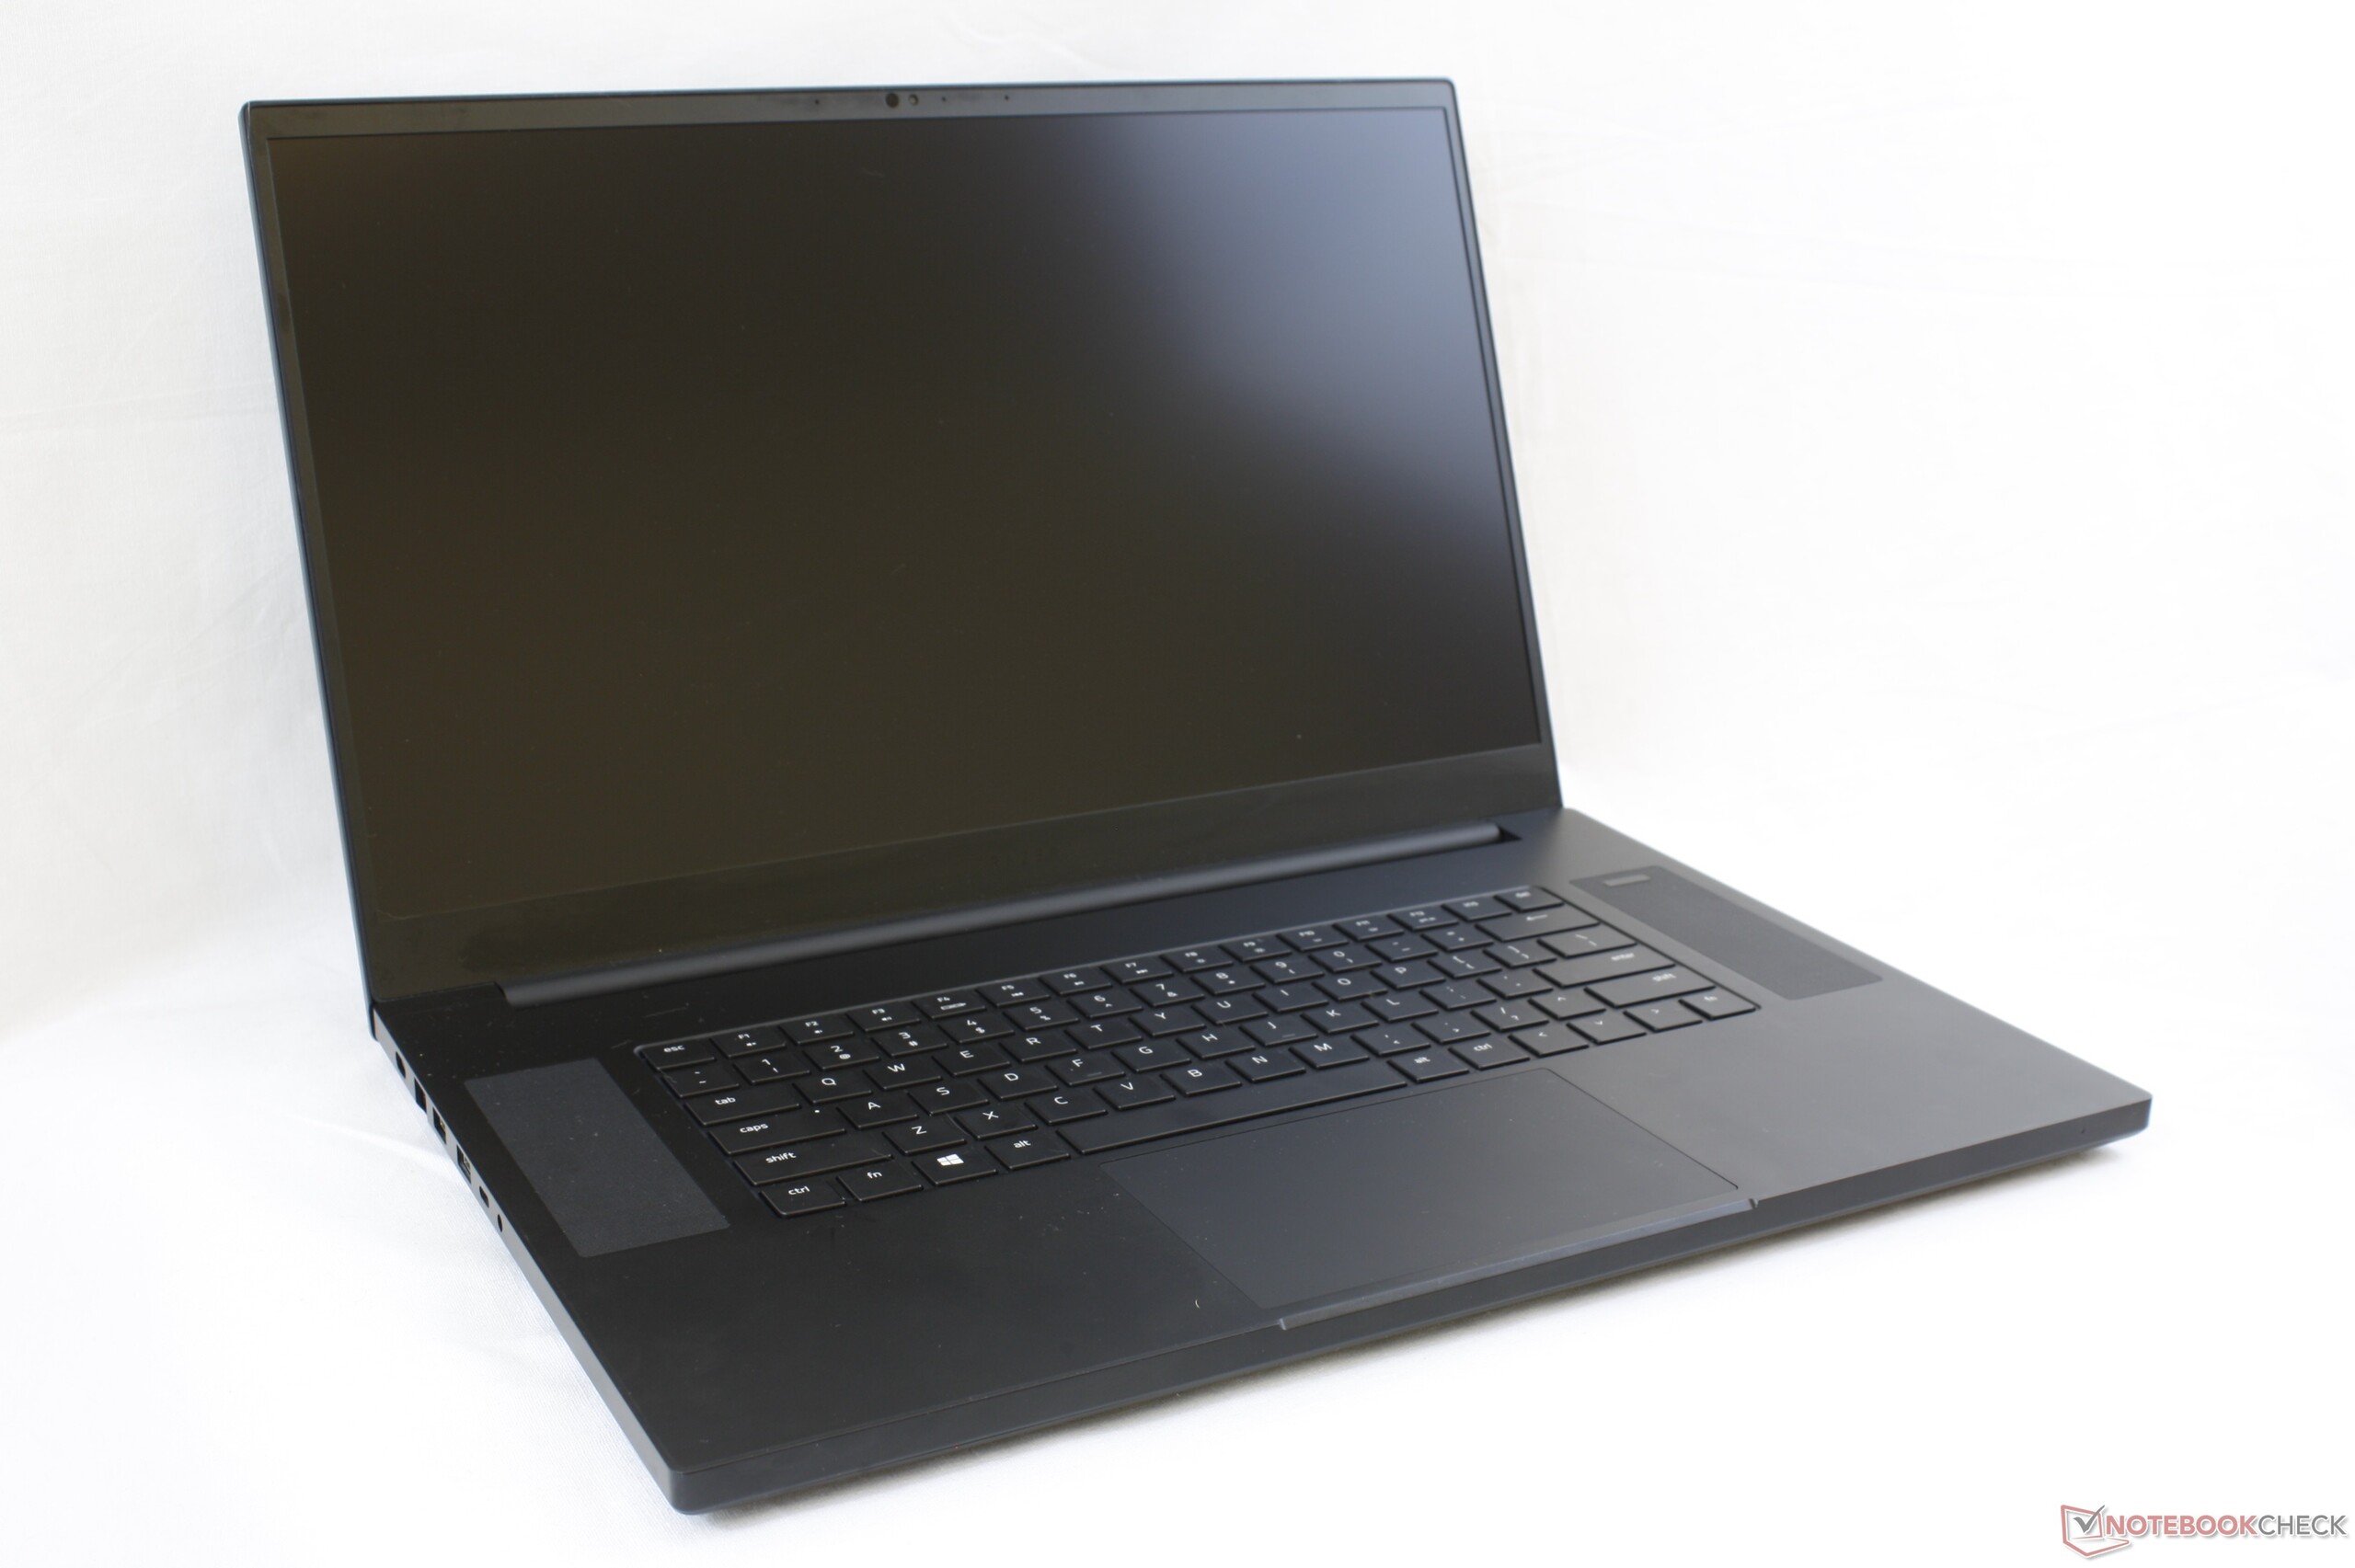
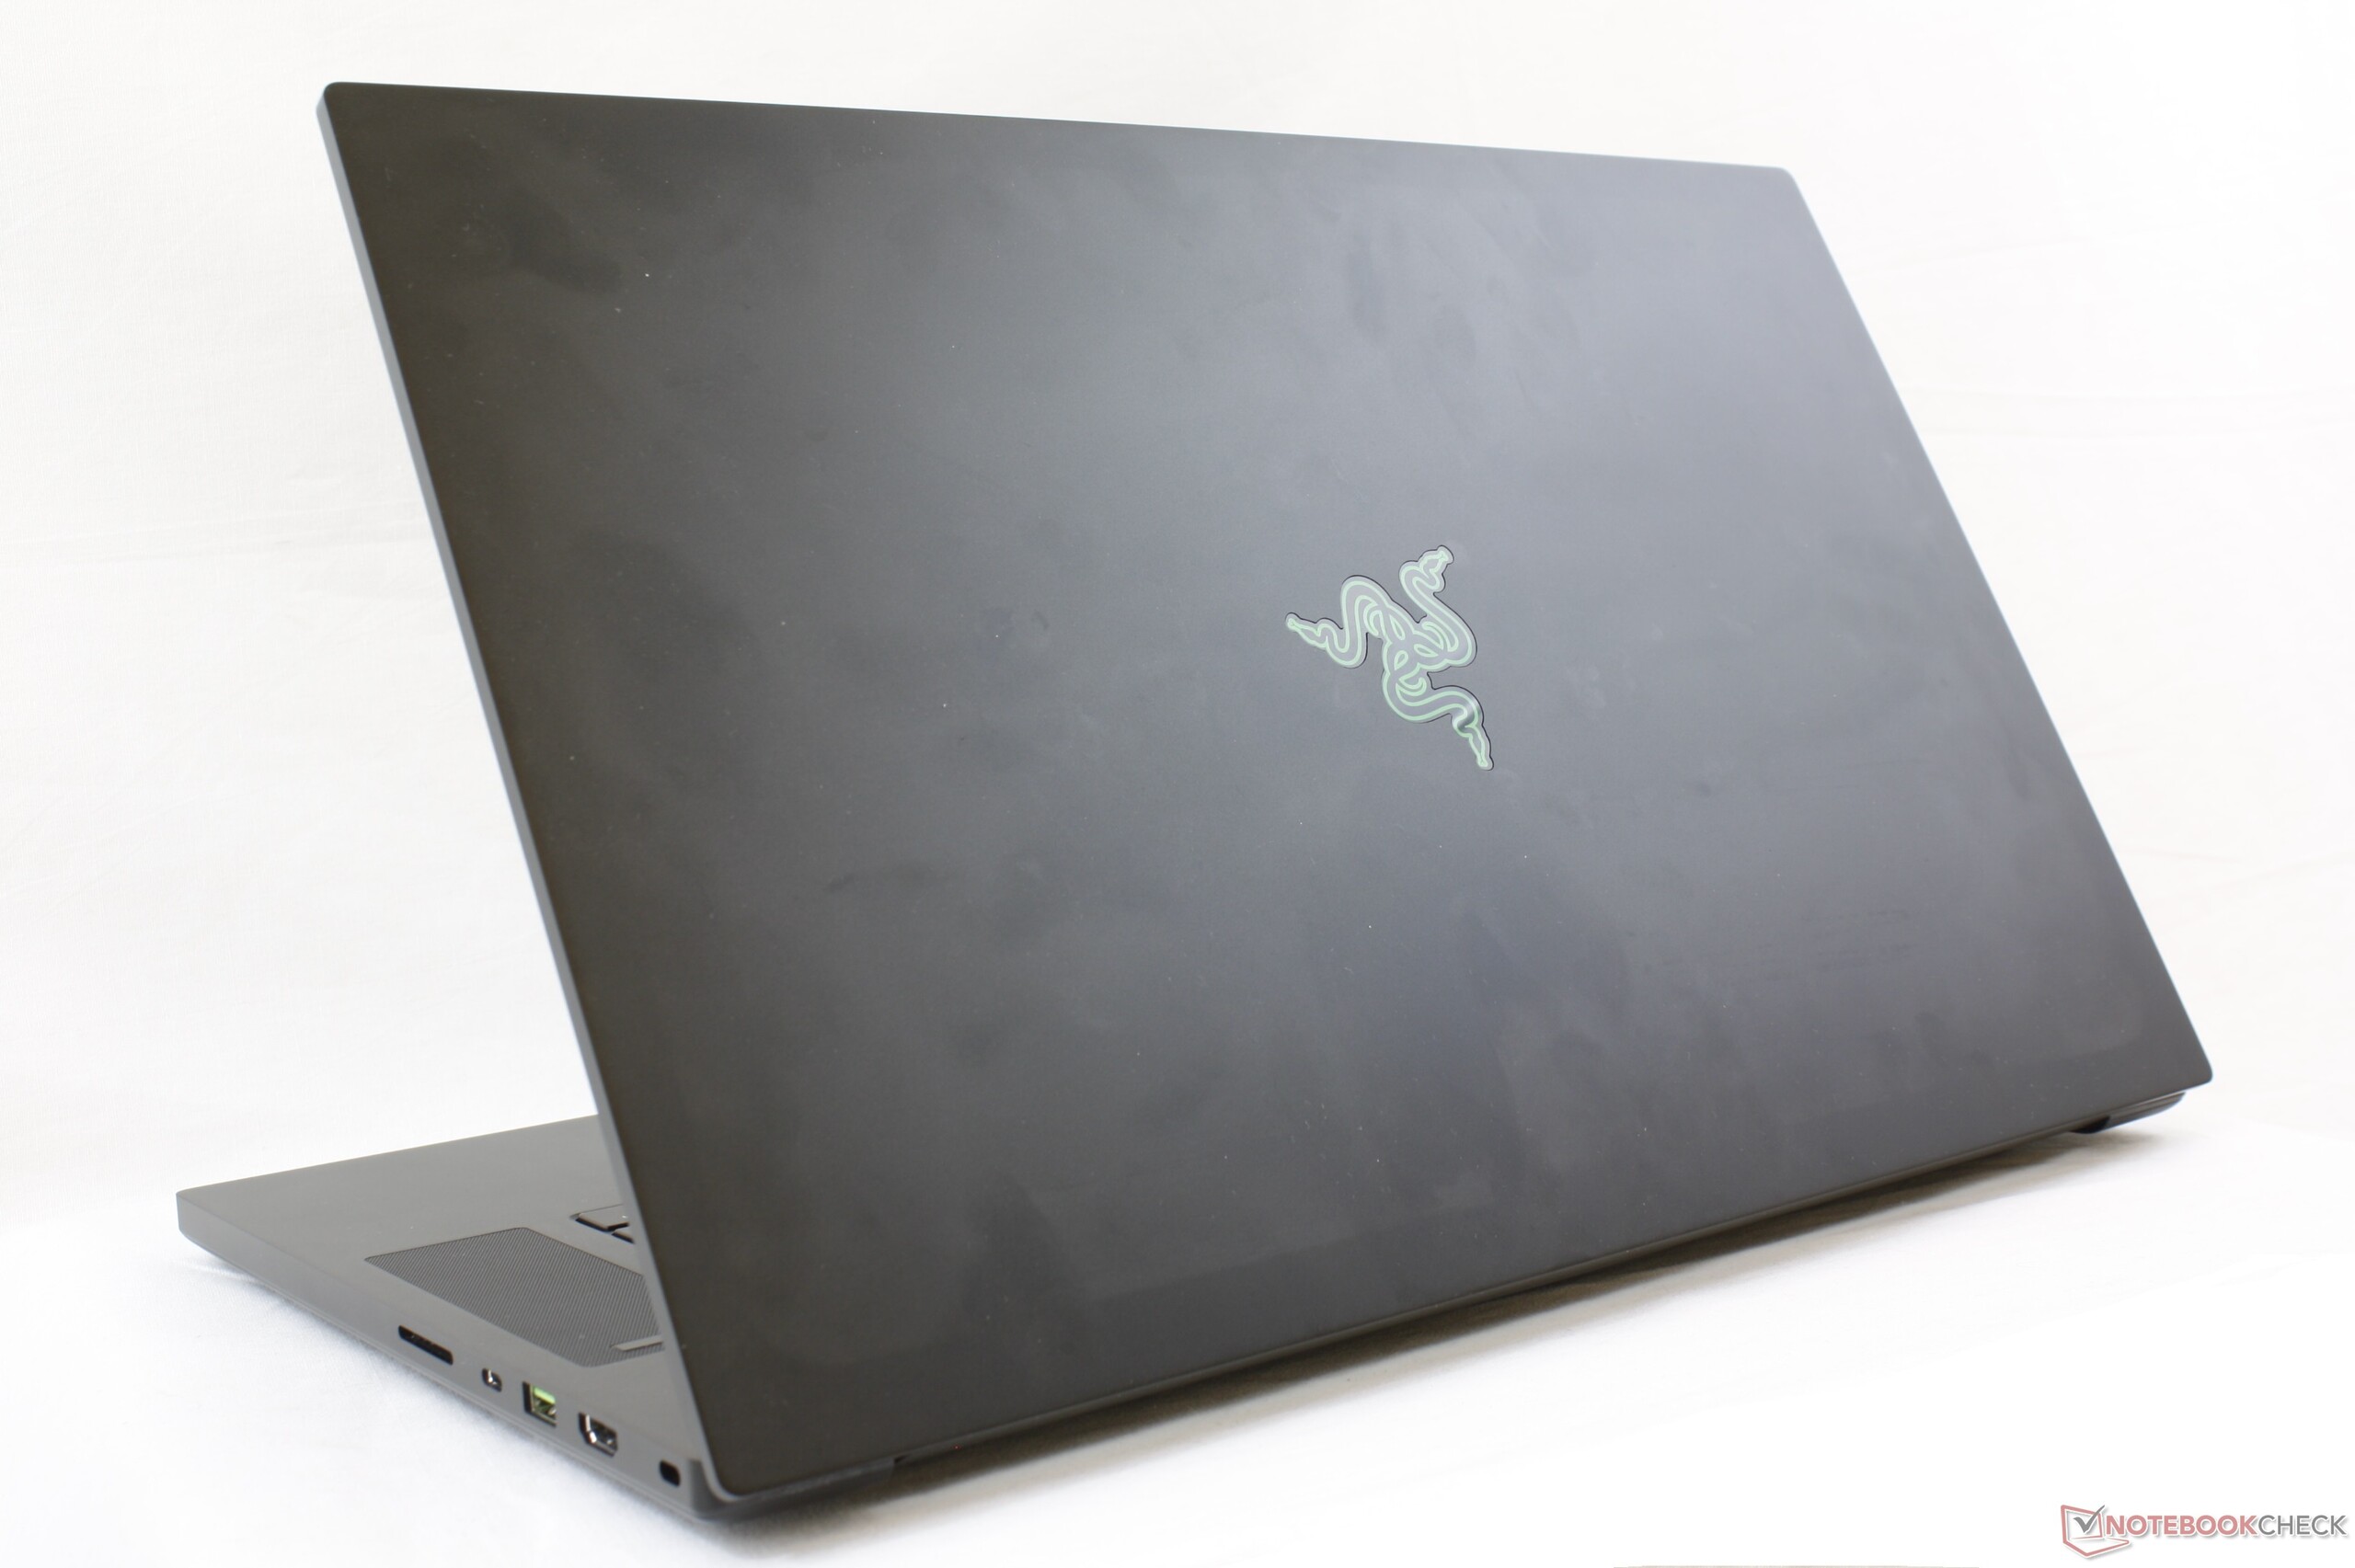
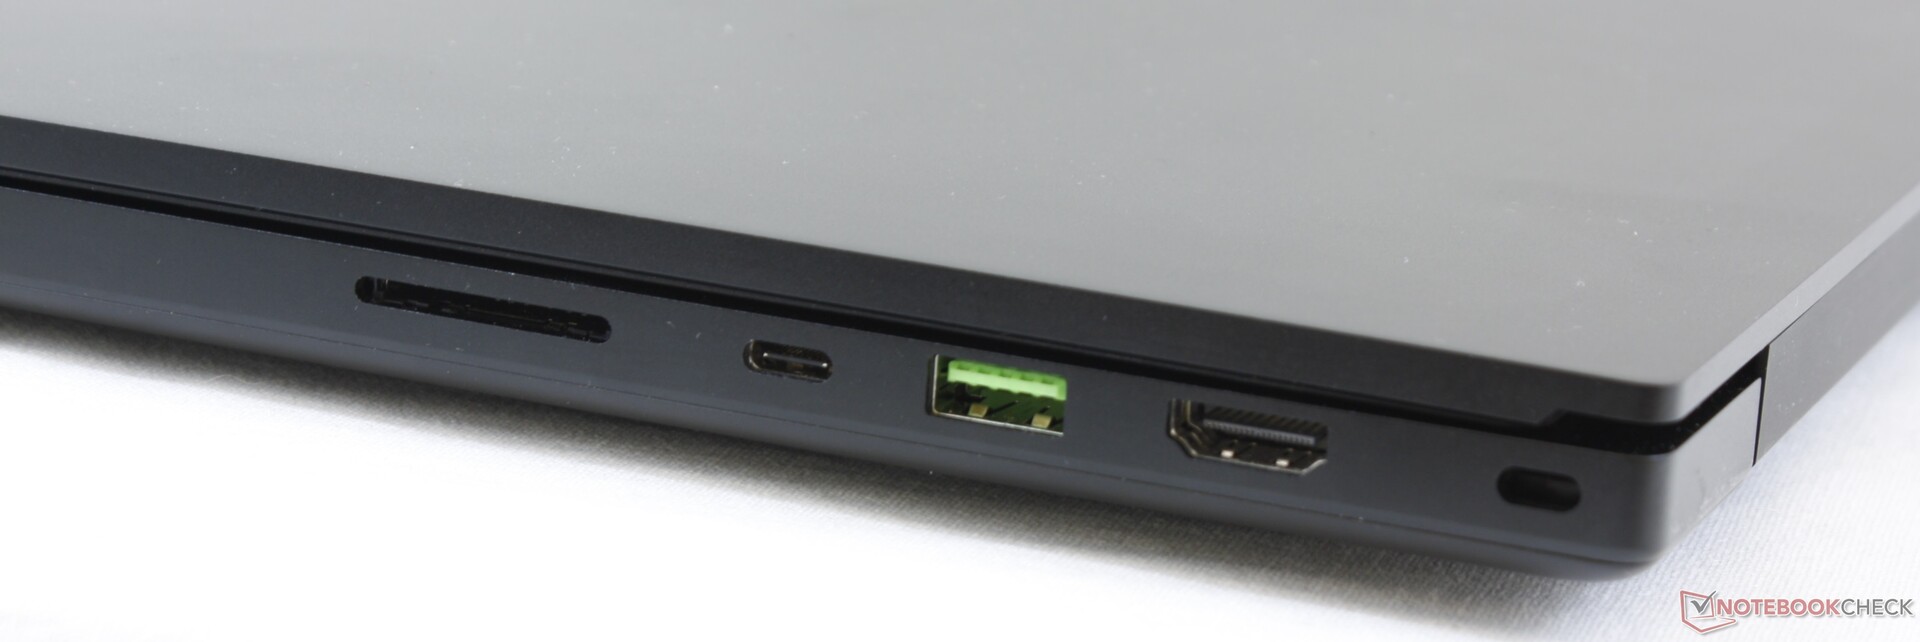
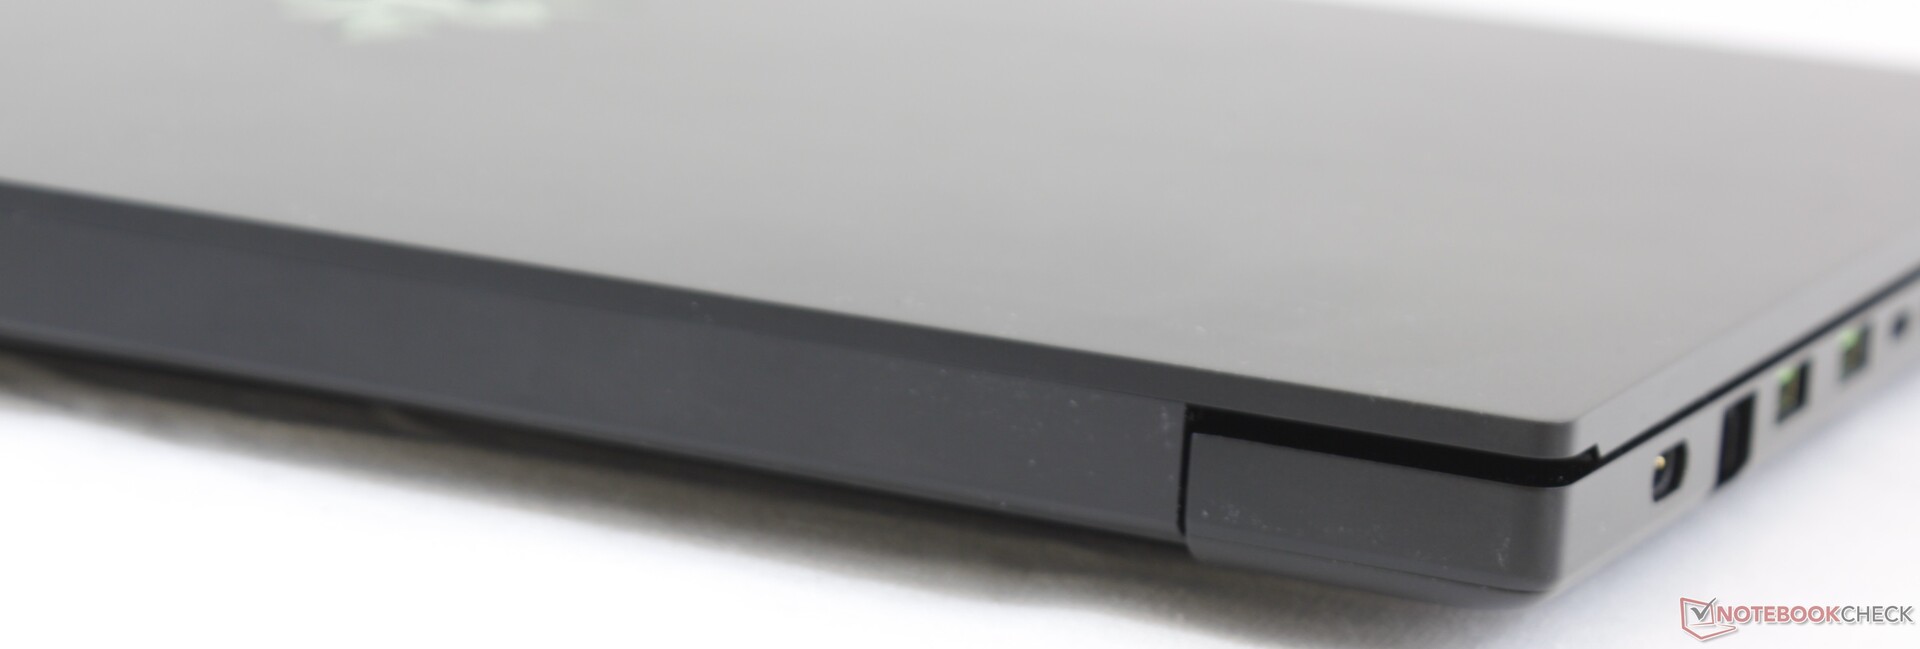
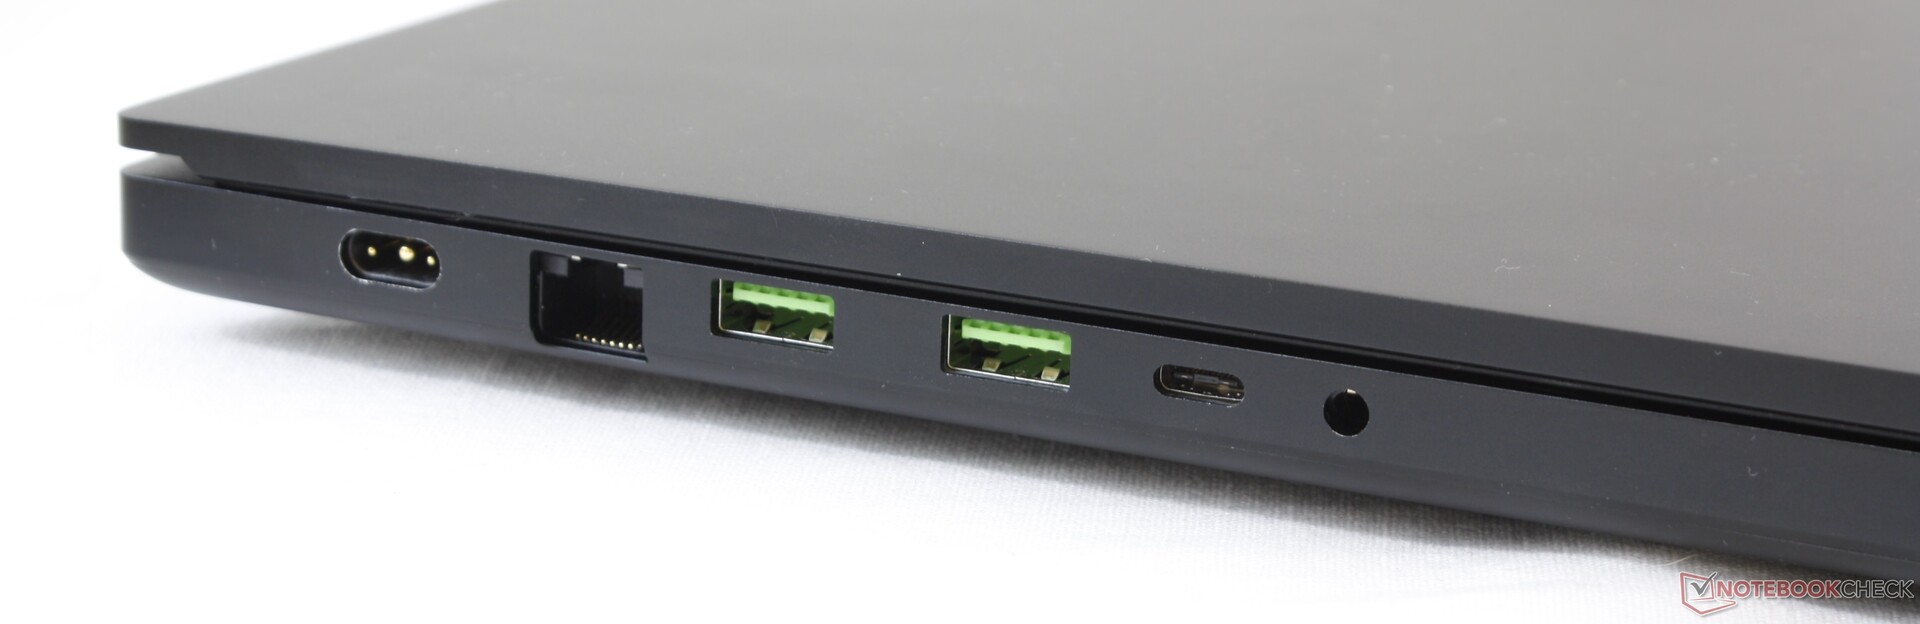
dÀ 2 500 $, le Razer Blade Pro 17 RTX 2060 est plus cher que la plupart de ses concurrents, tels les Asus ROG Scar II GL704GW et Zephyrus S GX701GX, ou le MSI GS75 équipés du même GPU. Cette hausse de prix est due non seulement au châssis minimaliste et plus costaud du Razer, mais également au refroidissement par chambre de vapeur, au lecteur de carte UHS III, au RJ45 2,5 Gbit, et au Wifi 6, rare sur les portables RTX 2060 concurrents. Repeignez le Blade en gris, et les passants le prendront pour un MacBook Pro.
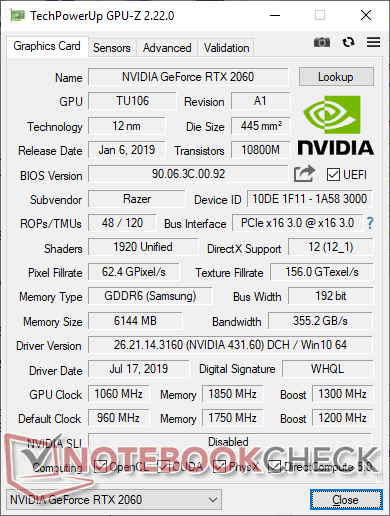
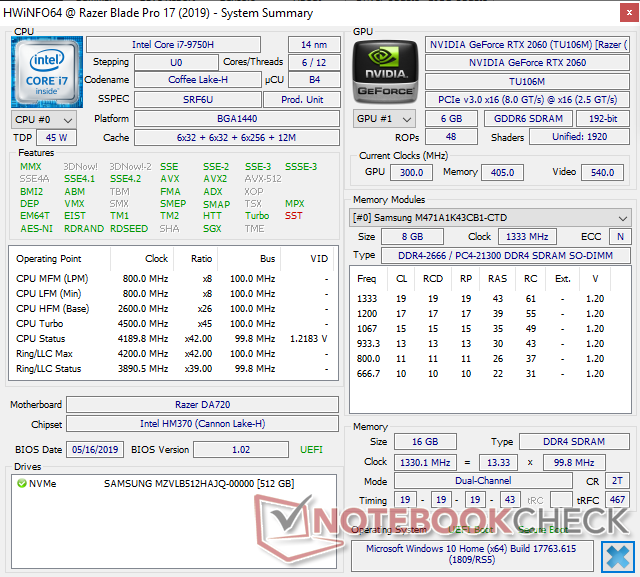
Un avantage mineur mais notable du Blade Pro 17 est que sa carte graphique RTX 2060 tourne à une fréquence supérieure que les autres portables avec la même carte graphique, permettant un léger gain de performances dans les jeux. La différence est suffisante pour que les performances de jeu se rapprochent de celles d’une RTX 2070 Max-Q, ce qui rend le Blade Pro 17 RTX 2070 Max-Q moins intéressant. Par rapport à la version RTX 2080 Max-Q, celle-ci offre 35 % de performances supplémentaires, pour une hausse de la consommation de 13 %. D’autres éléments, comme l’autonomie, le niveau sonore et les températures, sont presque identiques entre les différentes versions du Blade Pro 17, malgré leur différence de performances graphiques.
Le Blade Pro 17 montre la GeForce RTX 2060 à son meilleur. Des fonctionnalités annexes, comme les quatre ventilateurs, le refroidissement par chambre de vapeur, le lecteur de carte UHS III, le port RJ45 2,5 Gbit et le Wifi 6 ne peuvent être trouvés sur d’autres portables de jeu équipés de la même RTX 2060.
L’intégralité de cette critique est disponible en anglais en suivant ce lien.
Razer Blade Pro 17 RTX 2060
- 08/05/2019 v6 (old)
Allen Ngo
Price comparison
