Test du MSI GL65 9SEK (i7-9750H, RTX 2060, FHD) : bien plus nomade que le GL63
| SD Card Reader | |
| average JPG Copy Test (av. of 3 runs) | |
| Gigabyte Aero 15 Classic-XA (Toshiba Exceria Pro SDXC 64 GB UHS-II) | |
| Dell XPS 15 7590 9980HK GTX 1650 (Toshiba Exceria Pro SDXC 64 GB UHS-II) | |
| MSI GL65 9SEK (Toshiba Exceria Pro SDXC 64 GB UHS-II) | |
| MSI GL63 8RC-069US (Toshiba Exceria Pro SDXC 64 GB UHS-II) | |
| maximum AS SSD Seq Read Test (1GB) | |
| Gigabyte Aero 15 Classic-XA (Toshiba Exceria Pro SDXC 64 GB UHS-II) | |
| Dell XPS 15 7590 9980HK GTX 1650 (Toshiba Exceria Pro SDXC 64 GB UHS-II) | |
| MSI GL65 9SEK (Toshiba Exceria Pro SDXC 64 GB UHS-II) | |
| MSI GL63 8RC-069US (Toshiba Exceria Pro SDXC 64 GB UHS-II) | |
| Networking | |
| iperf3 transmit AX12 | |
| Gigabyte Aero 15 Classic-XA | |
| MSI GS65 Stealth 9SG | |
| MSI GL65 9SEK | |
| MSI GL63 8RC-069US | |
| iperf3 receive AX12 | |
| Gigabyte Aero 15 Classic-XA | |
| MSI GS65 Stealth 9SG | |
| MSI GL65 9SEK | |
| MSI GL63 8RC-069US | |
| |||||||||||||||||||||||||
Homogénéité de la luminosité: 86 %
Valeur mesurée au centre, sur batterie: 277.3 cd/m²
Contraste: 1387:1 (Valeurs des noirs: 0.2 cd/m²)
ΔE ColorChecker Calman: 5.25 | ∀{0.5-29.43 Ø4.73}
calibrated: 4.39
ΔE Greyscale Calman: 3.5 | ∀{0.09-98 Ø4.97}
55% sRGB (Argyll 1.6.3 3D)
35% AdobeRGB 1998 (Argyll 1.6.3 3D)
37.85% AdobeRGB 1998 (Argyll 3D)
55% sRGB (Argyll 3D)
36.63% Display P3 (Argyll 3D)
Gamma: 2.1
CCT: 6895 K
| MSI GL65 9SEK AU Optronics B156HAN13.0, IPS, 15.6", 1920x1080 | MSI GL63 8RC-069US LG Philips LP156WF6-SPK6, IPS, 15.6", 1920x1080 | MSI GS65 Stealth 9SG Sharp LQ156M1JW03 (SHP14C5), IPS, 15.6", 1920x1080 | Gigabyte Aero 15 Classic-XA Sharp LQ156M1JW03 (SHP14C5), IGZO, 15.6", 1920x1080 | Asus Zephyrus S GX531GX AU Optronics B156HAN08.2, IPS, 15.6", 1920x1080 | Alienware m15 R2 P87F Sharp LQ156M1, IPS, 15.6", 1920x1080 | |
|---|---|---|---|---|---|---|
| Display | 8% | 81% | 76% | 75% | 75% | |
| Display P3 Coverage (%) | 36.63 | 39.4 8% | 67.6 85% | 65.3 78% | 65.6 79% | 65.3 78% |
| sRGB Coverage (%) | 55 | 59.2 8% | 97.5 77% | 95.5 74% | 92.2 68% | 95.1 73% |
| AdobeRGB 1998 Coverage (%) | 37.85 | 40.72 8% | 68.9 82% | 66.5 76% | 66.9 77% | 65.9 74% |
| Response Times | -4% | 54% | 53% | 71% | 55% | |
| Response Time Grey 50% / Grey 80% * (ms) | 26.4 ? | 33.6 ? -27% | 13.6 ? 48% | 15.2 ? 42% | 7 ? 73% | 16.4 ? 38% |
| Response Time Black / White * (ms) | 30 ? | 24 ? 20% | 12 ? 60% | 11.2 ? 63% | 9.6 ? 68% | 8.8 ? 71% |
| PWM Frequency (Hz) | 23260 ? | 23580 ? | 23810 ? | |||
| Screen | -10% | 34% | 23% | 26% | 3% | |
| Brightness middle (cd/m²) | 277.3 | 286.5 3% | 282.3 2% | 266 -4% | 323.6 17% | 324.2 17% |
| Brightness (cd/m²) | 256 | 258 1% | 269 5% | 248 -3% | 315 23% | 304 19% |
| Brightness Distribution (%) | 86 | 82 -5% | 90 5% | 89 3% | 91 6% | 90 5% |
| Black Level * (cd/m²) | 0.2 | 0.34 -70% | 0.32 -60% | 0.31 -55% | 0.29 -45% | 0.38 -90% |
| Contrast (:1) | 1387 | 843 -39% | 882 -36% | 858 -38% | 1116 -20% | 853 -39% |
| Colorchecker dE 2000 * | 5.25 | 5.57 -6% | 1.17 78% | 2.78 47% | 3.31 37% | 5.01 5% |
| Colorchecker dE 2000 max. * | 19.43 | 16.8 14% | 3.29 83% | 5.96 69% | 5.74 70% | 12.7 35% |
| Colorchecker dE 2000 calibrated * | 4.39 | 4.16 5% | 1.06 76% | 0.91 79% | 2.73 38% | 1.64 63% |
| Greyscale dE 2000 * | 3.5 | 4.6 -31% | 1.3 63% | 3.58 -2% | 2.9 17% | 7.9 -126% |
| Gamma | 2.1 105% | 2.15 102% | 2.2 100% | 2.46 89% | 2.29 96% | 2.35 94% |
| CCT | 6895 94% | 7564 86% | 6643 98% | 7186 90% | 6765 96% | 8455 77% |
| Color Space (Percent of AdobeRGB 1998) (%) | 35 | 37.4 7% | 63.8 82% | 62 77% | 59.7 71% | 60.8 74% |
| Color Space (Percent of sRGB) (%) | 55 | 58.9 7% | 97.5 77% | 96 75% | 91.8 67% | 95.5 74% |
| Moyenne finale (programmes/paramètres) | -2% /
-6% | 56% /
45% | 51% /
36% | 57% /
40% | 44% /
23% |
* ... Moindre est la valeur, meilleures sont les performances
Temps de réponse de l'écran
| ↔ Temps de réponse noir à blanc | ||
|---|---|---|
| 30 ms ... hausse ↗ et chute ↘ combinées | ↗ 17.6 ms hausse | 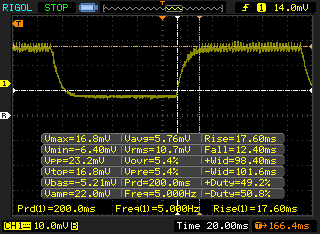 |
| ↘ 12.4 ms chute | ||
| L'écran souffre de latences très élevées, à éviter pour le jeu. En comparaison, tous les appareils testés affichent entre 0.1 (minimum) et 240 (maximum) ms. » 80 % des appareils testés affichent de meilleures performances. Cela signifie que les latences relevées sont moins bonnes que la moyenne (19.9 ms) de tous les appareils testés. | ||
| ↔ Temps de réponse gris 50% à gris 80% | ||
| 26.4 ms ... hausse ↗ et chute ↘ combinées | ↗ 13.2 ms hausse | 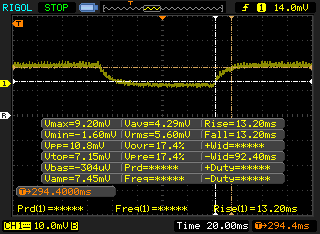 |
| ↘ 13.2 ms chute | ||
| L'écran souffre de latences relativement élevées, insuffisant pour le jeu. En comparaison, tous les appareils testés affichent entre 0.165 (minimum) et 636 (maximum) ms. » 36 % des appareils testés affichent de meilleures performances. Cela signifie que les latences relevées sont meilleures que la moyenne (31.1 ms) de tous les appareils testés. | ||
Scintillement / MLI (Modulation de largeur d'impulsion)
| Scintillement / MLI (Modulation de largeur d'impulsion) non décelé | 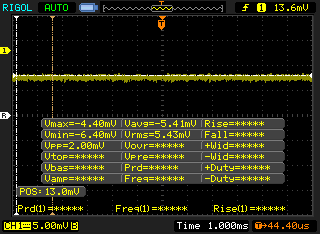 | ||
En comparaison, 52 % des appareils testés n'emploient pas MDI pour assombrir leur écran. Nous avons relevé une moyenne à 7798 (minimum : 5 - maximum : 343500) Hz dans le cas où une MDI était active. | |||
| PCMark 8 Home Score Accelerated v2 | 4136 points | |
| PCMark 8 Work Score Accelerated v2 | 5287 points | |
| PCMark 10 Score | 5761 points | |
Aide | ||
| MSI GL65 9SEK WDC PC SN520 SDAPNUW-512G | MSI GL63 8RC-069US Toshiba HG6 THNSNJ256G8NY | MSI GS65 Stealth 9SG Samsung SSD PM981 MZVLB512HAJQ | Gigabyte Aero 15 Classic-XA Intel SSD 760p SSDPEKKW512G8 | Asus Zephyrus S GX531GX Intel SSD 660p SSDPEKNW512G8 | Alienware m15 R2 P87F 2x Toshiba XG6 KXG60ZNV512G (RAID 0) | |
|---|---|---|---|---|---|---|
| AS SSD | -60% | 59% | 27% | -7% | 33% | |
| Seq Read (MB/s) | 1315 | 512 -61% | 2005 52% | 2517 91% | 1239 -6% | 1925 46% |
| Seq Write (MB/s) | 1378 | 456.4 -67% | 1580 15% | 924 -33% | 920 -33% | 2371 72% |
| 4K Read (MB/s) | 25.31 | 16.18 -36% | 49.33 95% | 59.1 134% | 45.74 81% | 37.2 47% |
| 4K Write (MB/s) | 118.2 | 57.1 -52% | 103.8 -12% | 126.5 7% | 95.7 -19% | 108.9 -8% |
| 4K-64 Read (MB/s) | 839 | 342.3 -59% | 1241 48% | 876 4% | 322 -62% | 1177 40% |
| 4K-64 Write (MB/s) | 720 | 127.3 -82% | 1730 140% | 922 28% | 722 0% | 1135 58% |
| Access Time Read * (ms) | 0.116 | 0.197 -70% | 0.054 53% | 0.042 64% | 0.073 37% | 0.065 44% |
| Access Time Write * (ms) | 0.091 | 0.061 33% | 0.036 60% | 0.065 29% | 0.047 48% | 0.108 -19% |
| Score Read (Points) | 996 | 410 -59% | 1490 50% | 1186 19% | 492 -51% | 1407 41% |
| Score Write (Points) | 976 | 230 -76% | 1991 104% | 1141 17% | 910 -7% | 1481 52% |
| Score Total (Points) | 2485 | 850 -66% | 4230 70% | 2870 15% | 1654 -33% | 3633 46% |
| Copy ISO MB/s (MB/s) | 1279 | 325.6 -75% | 3025 137% | 2086 63% | 1236 -3% | 2073 62% |
| Copy Program MB/s (MB/s) | 889 | 84.8 -90% | 713 -20% | 454.2 -49% | 703 -21% | 576 -35% |
| Copy Game MB/s (MB/s) | 1218 | 202.6 -83% | 1554 28% | 1141 -6% | 812 -33% | 1426 17% |
* ... Moindre est la valeur, meilleures sont les performances

| 3DMark 11 Performance | 18334 points | |
| 3DMark Cloud Gate Standard Score | 34921 points | |
| 3DMark Fire Strike Score | 14827 points | |
| 3DMark Time Spy Score | 6197 points | |
Aide | ||
| Shadow of the Tomb Raider - 1920x1080 Highest Preset AA:T | |
| MSI GE75 9SG | |
| Eurocom Nightsky RX15 | |
| MSI RTX 2060 Gaming Z 6G | |
| MSI GS65 Stealth 9SG | |
| MSI GL65 9SEK | |
| Eurocom Nightsky Ti15 | |
| Asus ROG Zephyrus G15 GA502DU | |
| Dell XPS 15 7590 9980HK GTX 1650 | |
| Asus TUF FX705GE-EW096T | |
| Bas | Moyen | Élevé | Ultra | |
|---|---|---|---|---|
| BioShock Infinite (2013) | 345.1 | 285.1 | 277.4 | 150.3 |
| The Witcher 3 (2015) | 286 | 204 | 117.5 | 58.7 |
| Rocket League (2017) | 244 | 249.3 | 246.9 | |
| Shadow of the Tomb Raider (2018) | 130 | 96 | 88 | 76 |
| MSI GL65 9SEK GeForce RTX 2060 Mobile, i7-9750H, WDC PC SN520 SDAPNUW-512G | MSI GL63 8RC-069US GeForce GTX 1050 Mobile, i5-8300H, Toshiba HG6 THNSNJ256G8NY | MSI GS65 Stealth 9SG GeForce RTX 2080 Max-Q, i7-9750H, Samsung SSD PM981 MZVLB512HAJQ | Gigabyte Aero 15 Classic-XA GeForce RTX 2070 Max-Q, i7-9750H, Intel SSD 760p SSDPEKKW512G8 | Asus Zephyrus S GX531GX GeForce RTX 2080 Max-Q, i7-8750H, Intel SSD 660p SSDPEKNW512G8 | Alienware m15 R2 P87F GeForce RTX 2080 Max-Q, i7-9750H, 2x Toshiba XG6 KXG60ZNV512G (RAID 0) | |
|---|---|---|---|---|---|---|
| Noise | 8% | 8% | -3% | 0% | -3% | |
| arrêt / environnement * (dB) | 28.1 | 28.6 -2% | 28.3 -1% | 30 -7% | 28.7 -2% | 28.3 -1% |
| Idle Minimum * (dB) | 31.4 | 28.6 9% | 30.4 3% | 31 1% | 29.8 5% | 28.5 9% |
| Idle Average * (dB) | 31.5 | 31.6 -0% | 30.5 3% | 34 -8% | 32.4 -3% | 28.5 10% |
| Idle Maximum * (dB) | 33.5 | 31.6 6% | 30.6 9% | 39 -16% | 38 -13% | 49 -46% |
| Load Average * (dB) | 49.3 | 38.6 22% | 37.6 24% | 46 7% | 38.2 23% | 49 1% |
| Witcher 3 ultra * (dB) | 51.3 | 40.6 21% | 46 10% | 53 -3% | 56.6 -10% | 49 4% |
| Load Maximum * (dB) | 58 | 56.8 2% | 55.1 5% | 55 5% | 56.6 2% | 55 5% |
* ... Moindre est la valeur, meilleures sont les performances
Degré de la nuisance sonore
| Au repos |
| 31.4 / 31.5 / 33.5 dB(A) |
| Fortement sollicité |
| 49.3 / 58 dB(A) |
 | ||
30 dB silencieux 40 dB(A) audible 50 dB(A) bruyant |
||
min: | ||
(-) La température maximale du côté supérieur est de 49 °C / 120 F, par rapport à la moyenne de 40.4 °C / 105 F, allant de 21.2 à 68.8 °C pour la classe Gaming.
(-) Le fond chauffe jusqu'à un maximum de 54.2 °C / 130 F, contre une moyenne de 43.2 °C / 110 F
(±) En utilisation inactive, la température moyenne du côté supérieur est de 35.9 °C / 97 F, par rapport à la moyenne du dispositif de 33.9 °C / 93 F.
(-) En jouant à The Witcher 3, la température moyenne du côté supérieur est de 38.4 °C / 101 F, alors que la moyenne de l'appareil est de 33.9 °C / 93 F.
(±) Les repose-poignets et le pavé tactile peuvent devenir très chauds au toucher, avec un maximum de 36 °C / 96.8# F.
(-) La température moyenne de la zone de l'appui-paume de dispositifs similaires était de 28.8 °C / 83.8 F (-7.2 °C / #-13 F).
MSI GL65 9SEK analyse audio
(+) | les haut-parleurs peuvent jouer relativement fort (85.3# dB)
Basses 100 - 315 Hz
(-) | presque aucune basse - en moyenne 25.1% plus bas que la médiane
(±) | la linéarité des basses est moyenne (9.9% delta à la fréquence précédente)
Médiums 400 - 2000 Hz
(±) | médiane supérieure - en moyenne 5.8% supérieure à la médiane
(±) | la linéarité des médiums est moyenne (9.8% delta à la fréquence précédente)
Aiguës 2 - 16 kHz
(+) | des sommets équilibrés - à seulement 4.1% de la médiane
(±) | la linéarité des aigus est moyenne (11.7% delta à la fréquence précédente)
Globalement 100 - 16 000 Hz
(±) | la linéarité du son global est moyenne (25.4% de différence avec la médiane)
Par rapport à la même classe
» 91% de tous les appareils testés de cette catégorie étaient meilleurs, 2% similaires, 7% pires
» Le meilleur avait un delta de 6%, la moyenne était de 18%, le pire était de 132%.
Par rapport à tous les appareils testés
» 78% de tous les appareils testés étaient meilleurs, 5% similaires, 17% pires
» Le meilleur avait un delta de 4%, la moyenne était de 24%, le pire était de 134%.
Apple MacBook 12 (Early 2016) 1.1 GHz analyse audio
(+) | les haut-parleurs peuvent jouer relativement fort (83.6# dB)
Basses 100 - 315 Hz
(±) | basse réduite - en moyenne 11.3% inférieure à la médiane
(±) | la linéarité des basses est moyenne (14.2% delta à la fréquence précédente)
Médiums 400 - 2000 Hz
(+) | médiane équilibrée - seulement 2.4% de la médiane
(+) | les médiums sont linéaires (5.5% delta à la fréquence précédente)
Aiguës 2 - 16 kHz
(+) | des sommets équilibrés - à seulement 2% de la médiane
(+) | les aigus sont linéaires (4.5% delta à la fréquence précédente)
Globalement 100 - 16 000 Hz
(+) | le son global est linéaire (10.2% différence à la médiane)
Par rapport à la même classe
» 7% de tous les appareils testés de cette catégorie étaient meilleurs, 2% similaires, 91% pires
» Le meilleur avait un delta de 5%, la moyenne était de 18%, le pire était de 53%.
Par rapport à tous les appareils testés
» 5% de tous les appareils testés étaient meilleurs, 1% similaires, 94% pires
» Le meilleur avait un delta de 4%, la moyenne était de 24%, le pire était de 134%.
| Éteint/en veille | |
| Au repos | |
| Fortement sollicité |
|
Légende:
min: | |
| MSI GL65 9SEK i7-9750H, GeForce RTX 2060 Mobile, WDC PC SN520 SDAPNUW-512G, IPS, 1920x1080, 15.6" | MSI GL63 8RC-069US i5-8300H, GeForce GTX 1050 Mobile, Toshiba HG6 THNSNJ256G8NY, IPS, 1920x1080, 15.6" | MSI GS65 Stealth 9SG i7-9750H, GeForce RTX 2080 Max-Q, Samsung SSD PM981 MZVLB512HAJQ, IPS, 1920x1080, 15.6" | Gigabyte Aero 15 Classic-XA i7-9750H, GeForce RTX 2070 Max-Q, Intel SSD 760p SSDPEKKW512G8, IGZO, 1920x1080, 15.6" | MSI GP65 Leopard 9SE-225US i7-9750H, GeForce RTX 2060 Mobile, Toshiba KBG30ZMT512G, IPS, 1920x1080, 15.6" | MSI GS65 Stealth Thin 8RE-051US i7-8750H, GeForce GTX 1060 Mobile, Samsung SSD PM981 MZVLB256HAHQ, IPS, 1920x1080, 15.6" | |
|---|---|---|---|---|---|---|
| Power Consumption | 54% | 25% | 22% | 30% | 42% | |
| Idle Minimum * (Watt) | 41 | 7.1 83% | 18.3 55% | 21 49% | 13.6 67% | 8.7 79% |
| Idle Average * (Watt) | 45.3 | 9.8 78% | 22 51% | 23 49% | 17.9 60% | 13 71% |
| Idle Maximum * (Watt) | 47.1 | 10.4 78% | 28.8 39% | 32 32% | 20.6 56% | 14.3 70% |
| Load Average * (Watt) | 94.9 | 88.8 6% | 93 2% | 97 -2% | 96 -1% | 107.4 -13% |
| Witcher 3 ultra * (Watt) | 149.4 | 93.3 38% | 142.6 5% | 148 1% | 154.6 -3% | 129 14% |
| Load Maximum * (Watt) | 214.2 | 132.5 38% | 215.9 -1% | 213 1% | 218.6 -2% | 151.5 29% |
* ... Moindre est la valeur, meilleures sont les performances
| MSI GL65 9SEK i7-9750H, GeForce RTX 2060 Mobile, 51 Wh | MSI GL63 8RC-069US i5-8300H, GeForce GTX 1050 Mobile, 41 Wh | MSI GS65 Stealth 9SG i7-9750H, GeForce RTX 2080 Max-Q, 82 Wh | Gigabyte Aero 15 Classic-XA i7-9750H, GeForce RTX 2070 Max-Q, 94.24 Wh | Asus Zephyrus S GX531GX i7-8750H, GeForce RTX 2080 Max-Q, 50 Wh | Alienware m15 R2 P87F i7-9750H, GeForce RTX 2080 Max-Q, 76 Wh | |
|---|---|---|---|---|---|---|
| Autonomie de la batterie | 16% | 58% | 130% | -21% | 41% | |
| Reader / Idle (h) | 4.4 | 7.3 66% | 9.1 107% | 9.2 109% | ||
| WiFi v1.3 (h) | 3.8 | 4.3 13% | 6 58% | 7 84% | 3 -21% | 5.5 45% |
| Load (h) | 1 | 0.7 -30% | 3 200% | 0.7 -30% |
Points positifs
Points négatifs
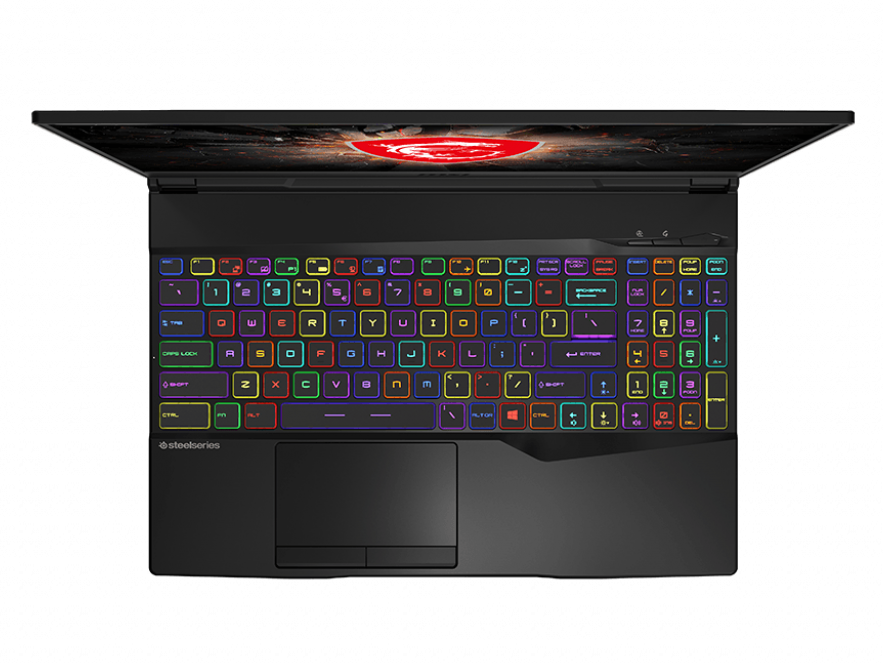

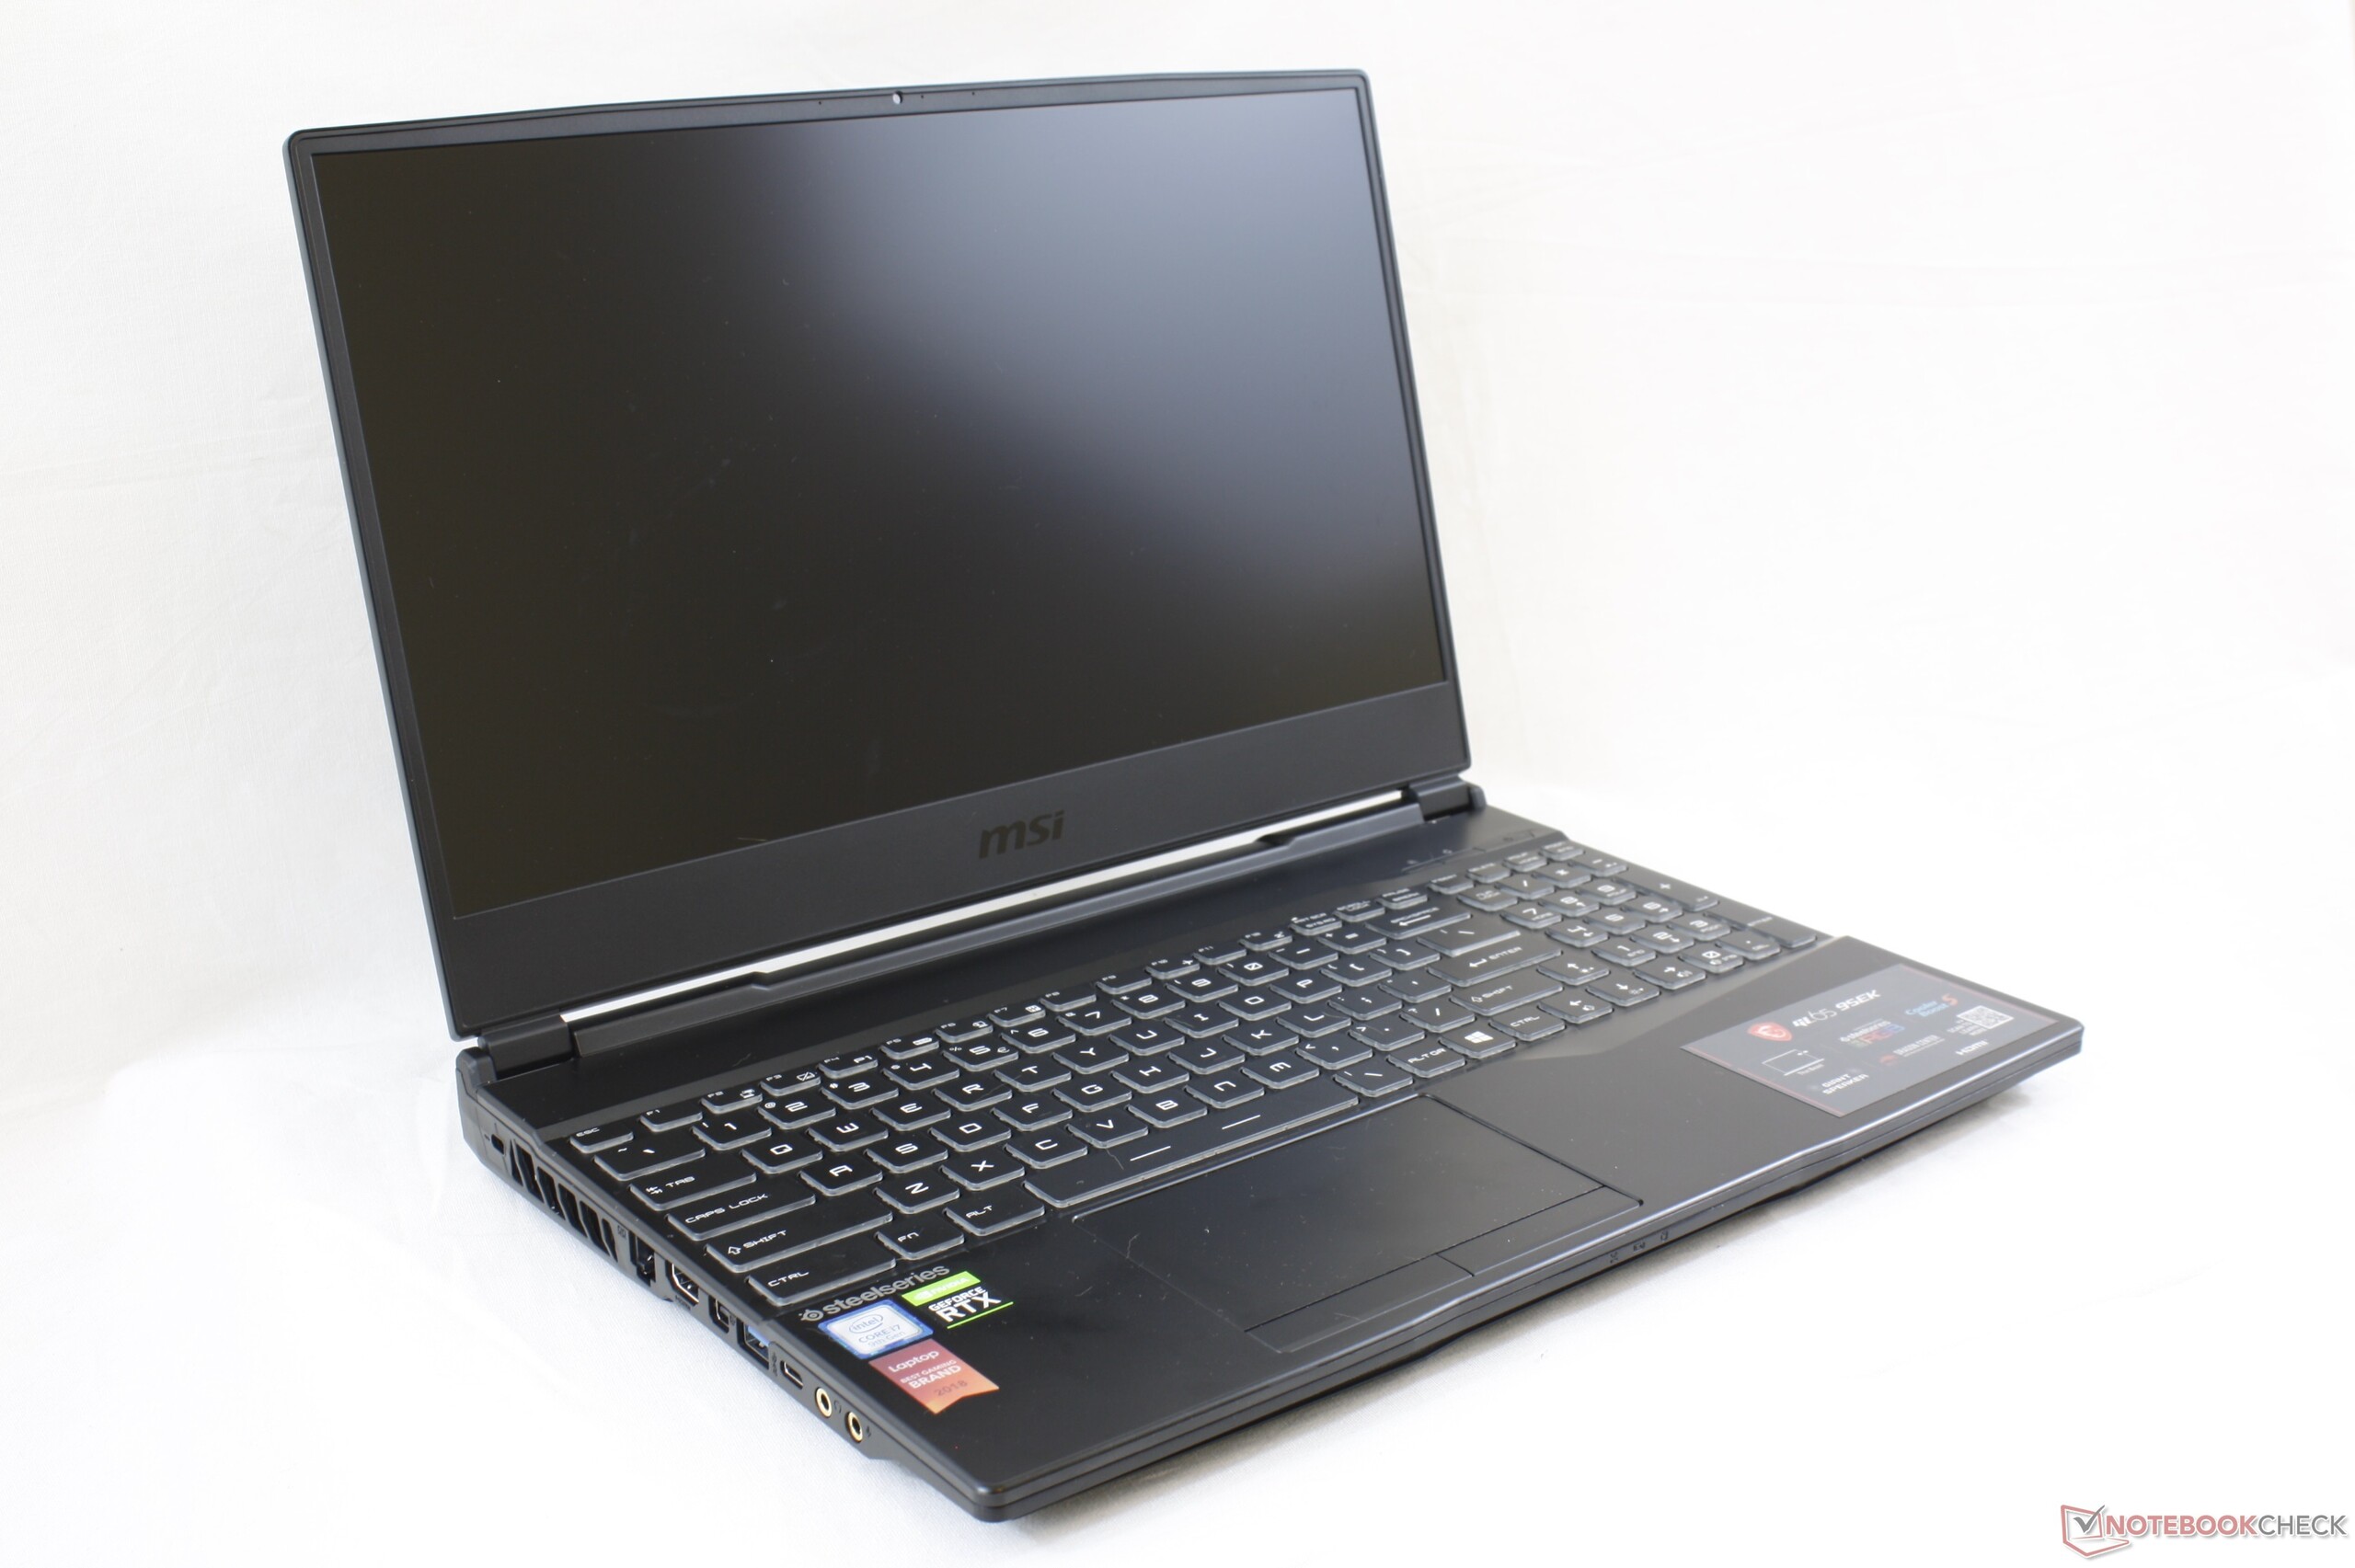
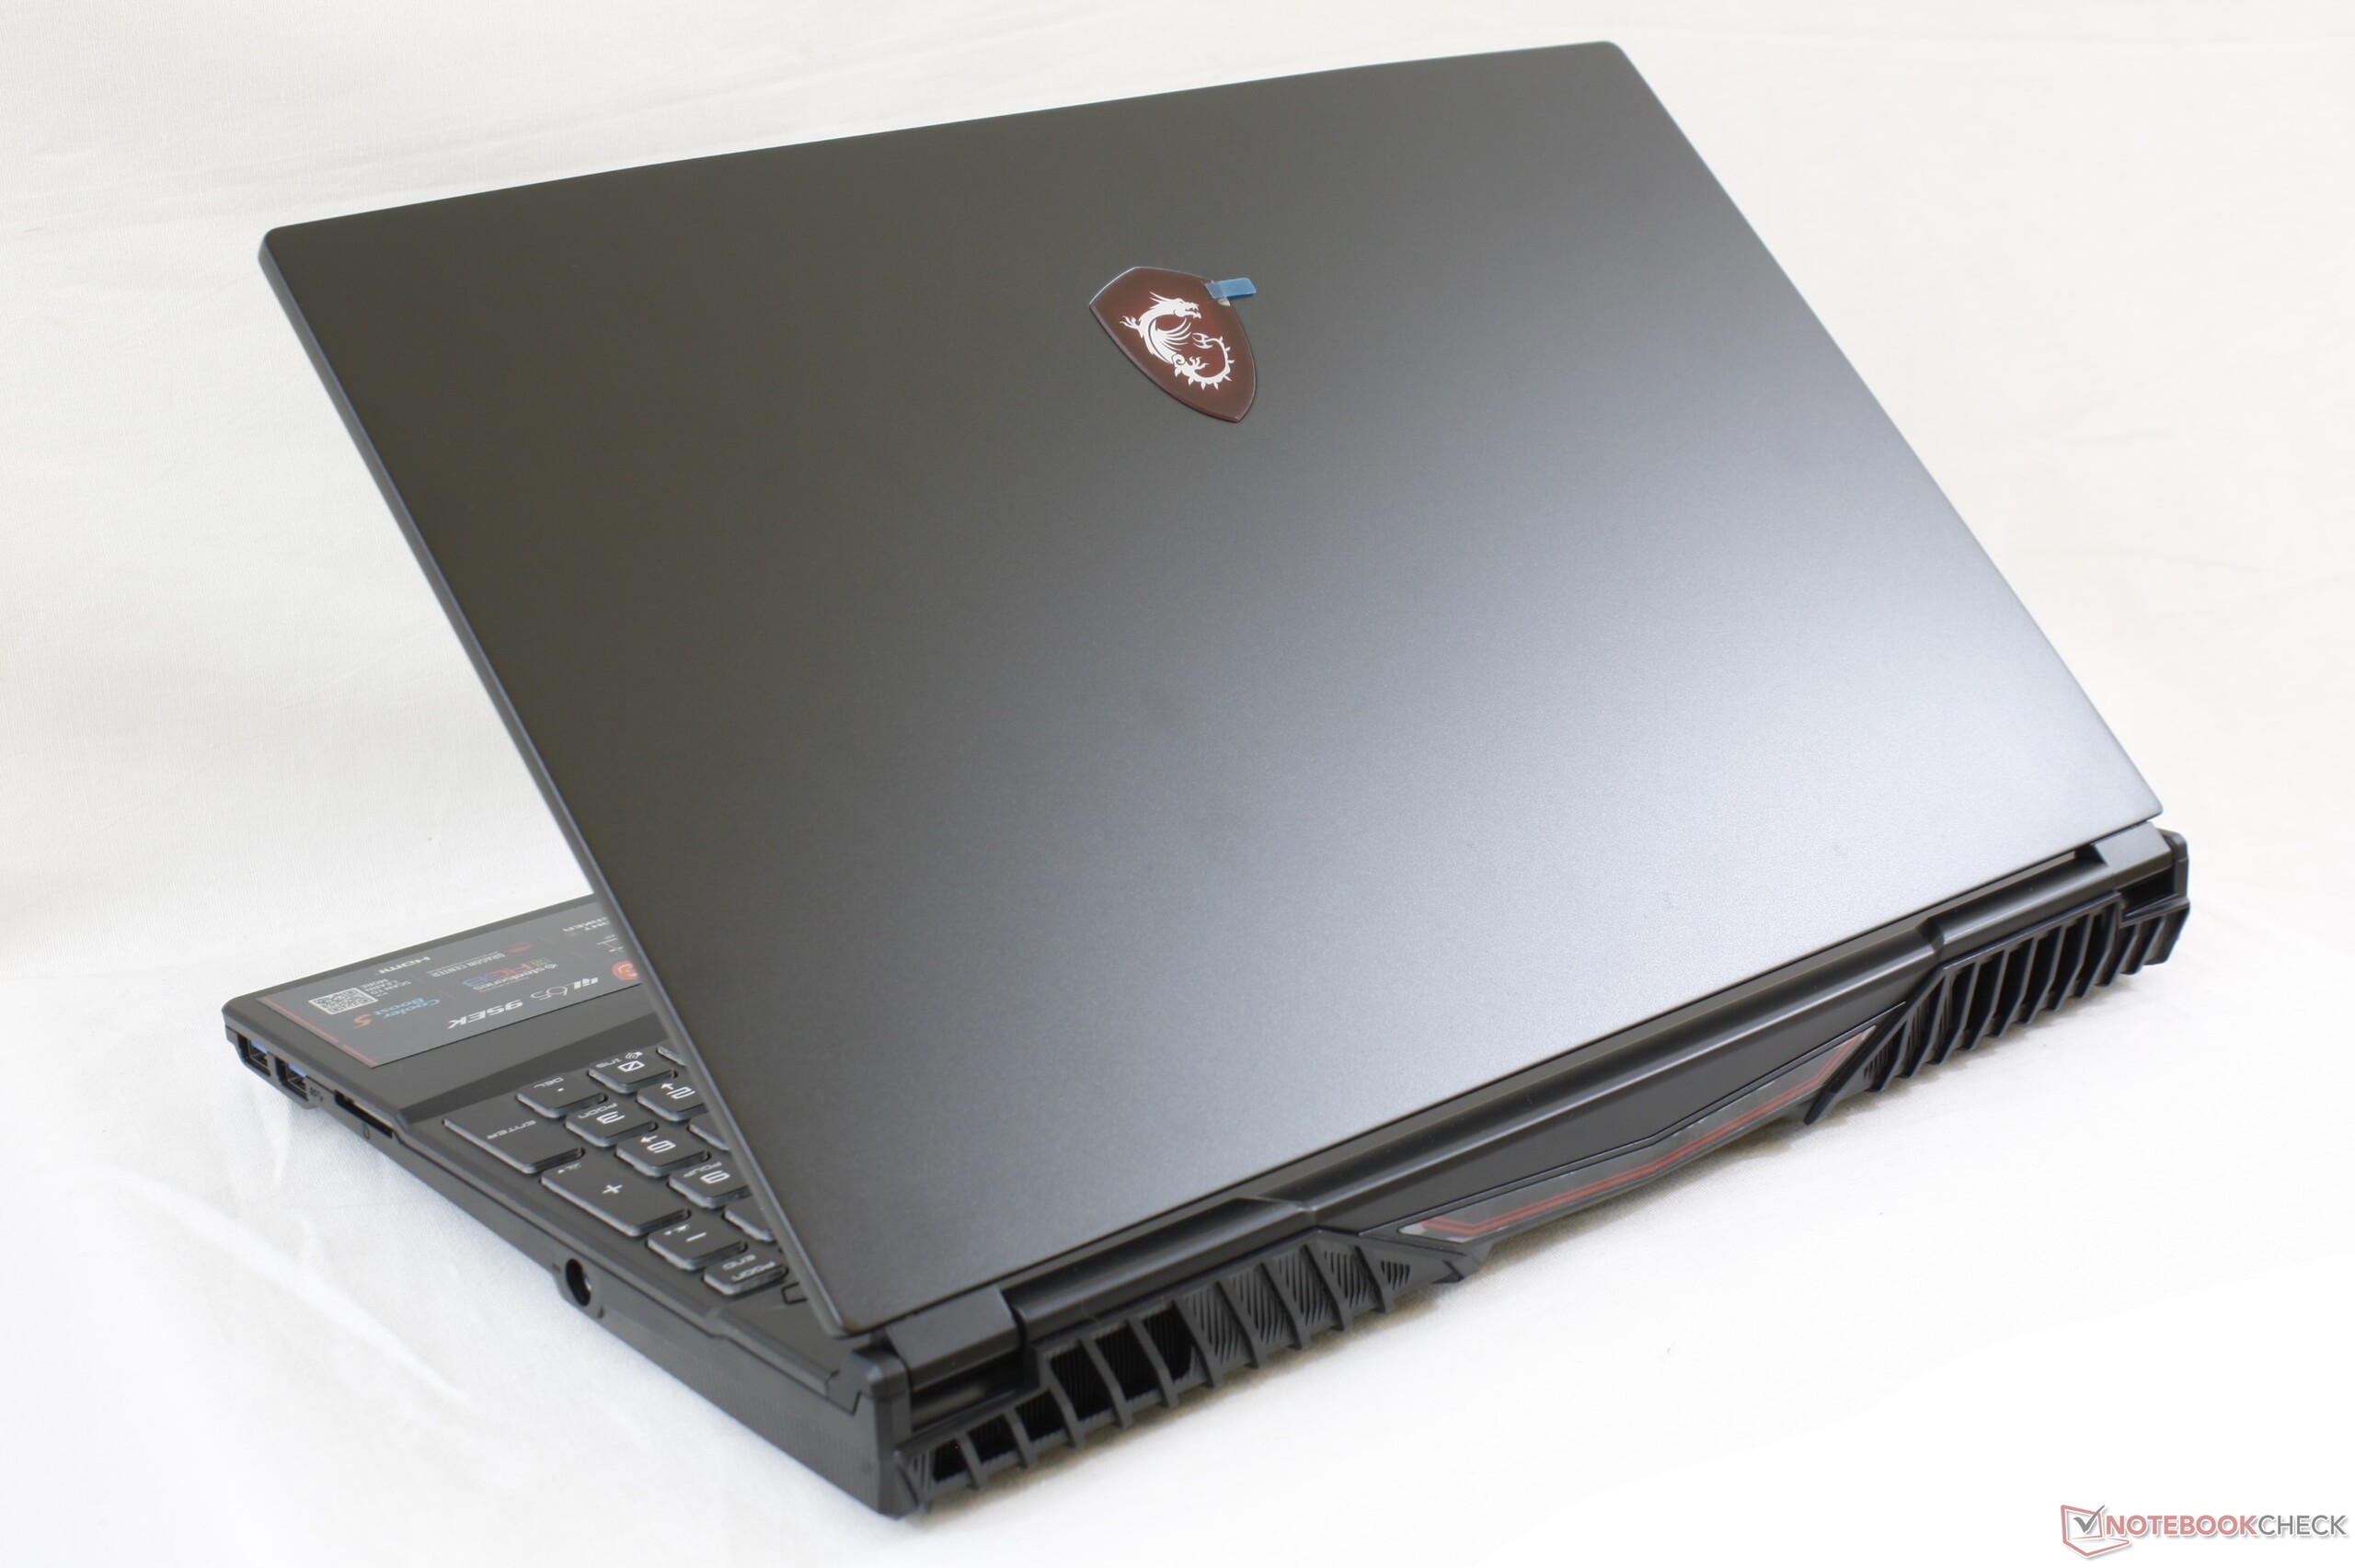
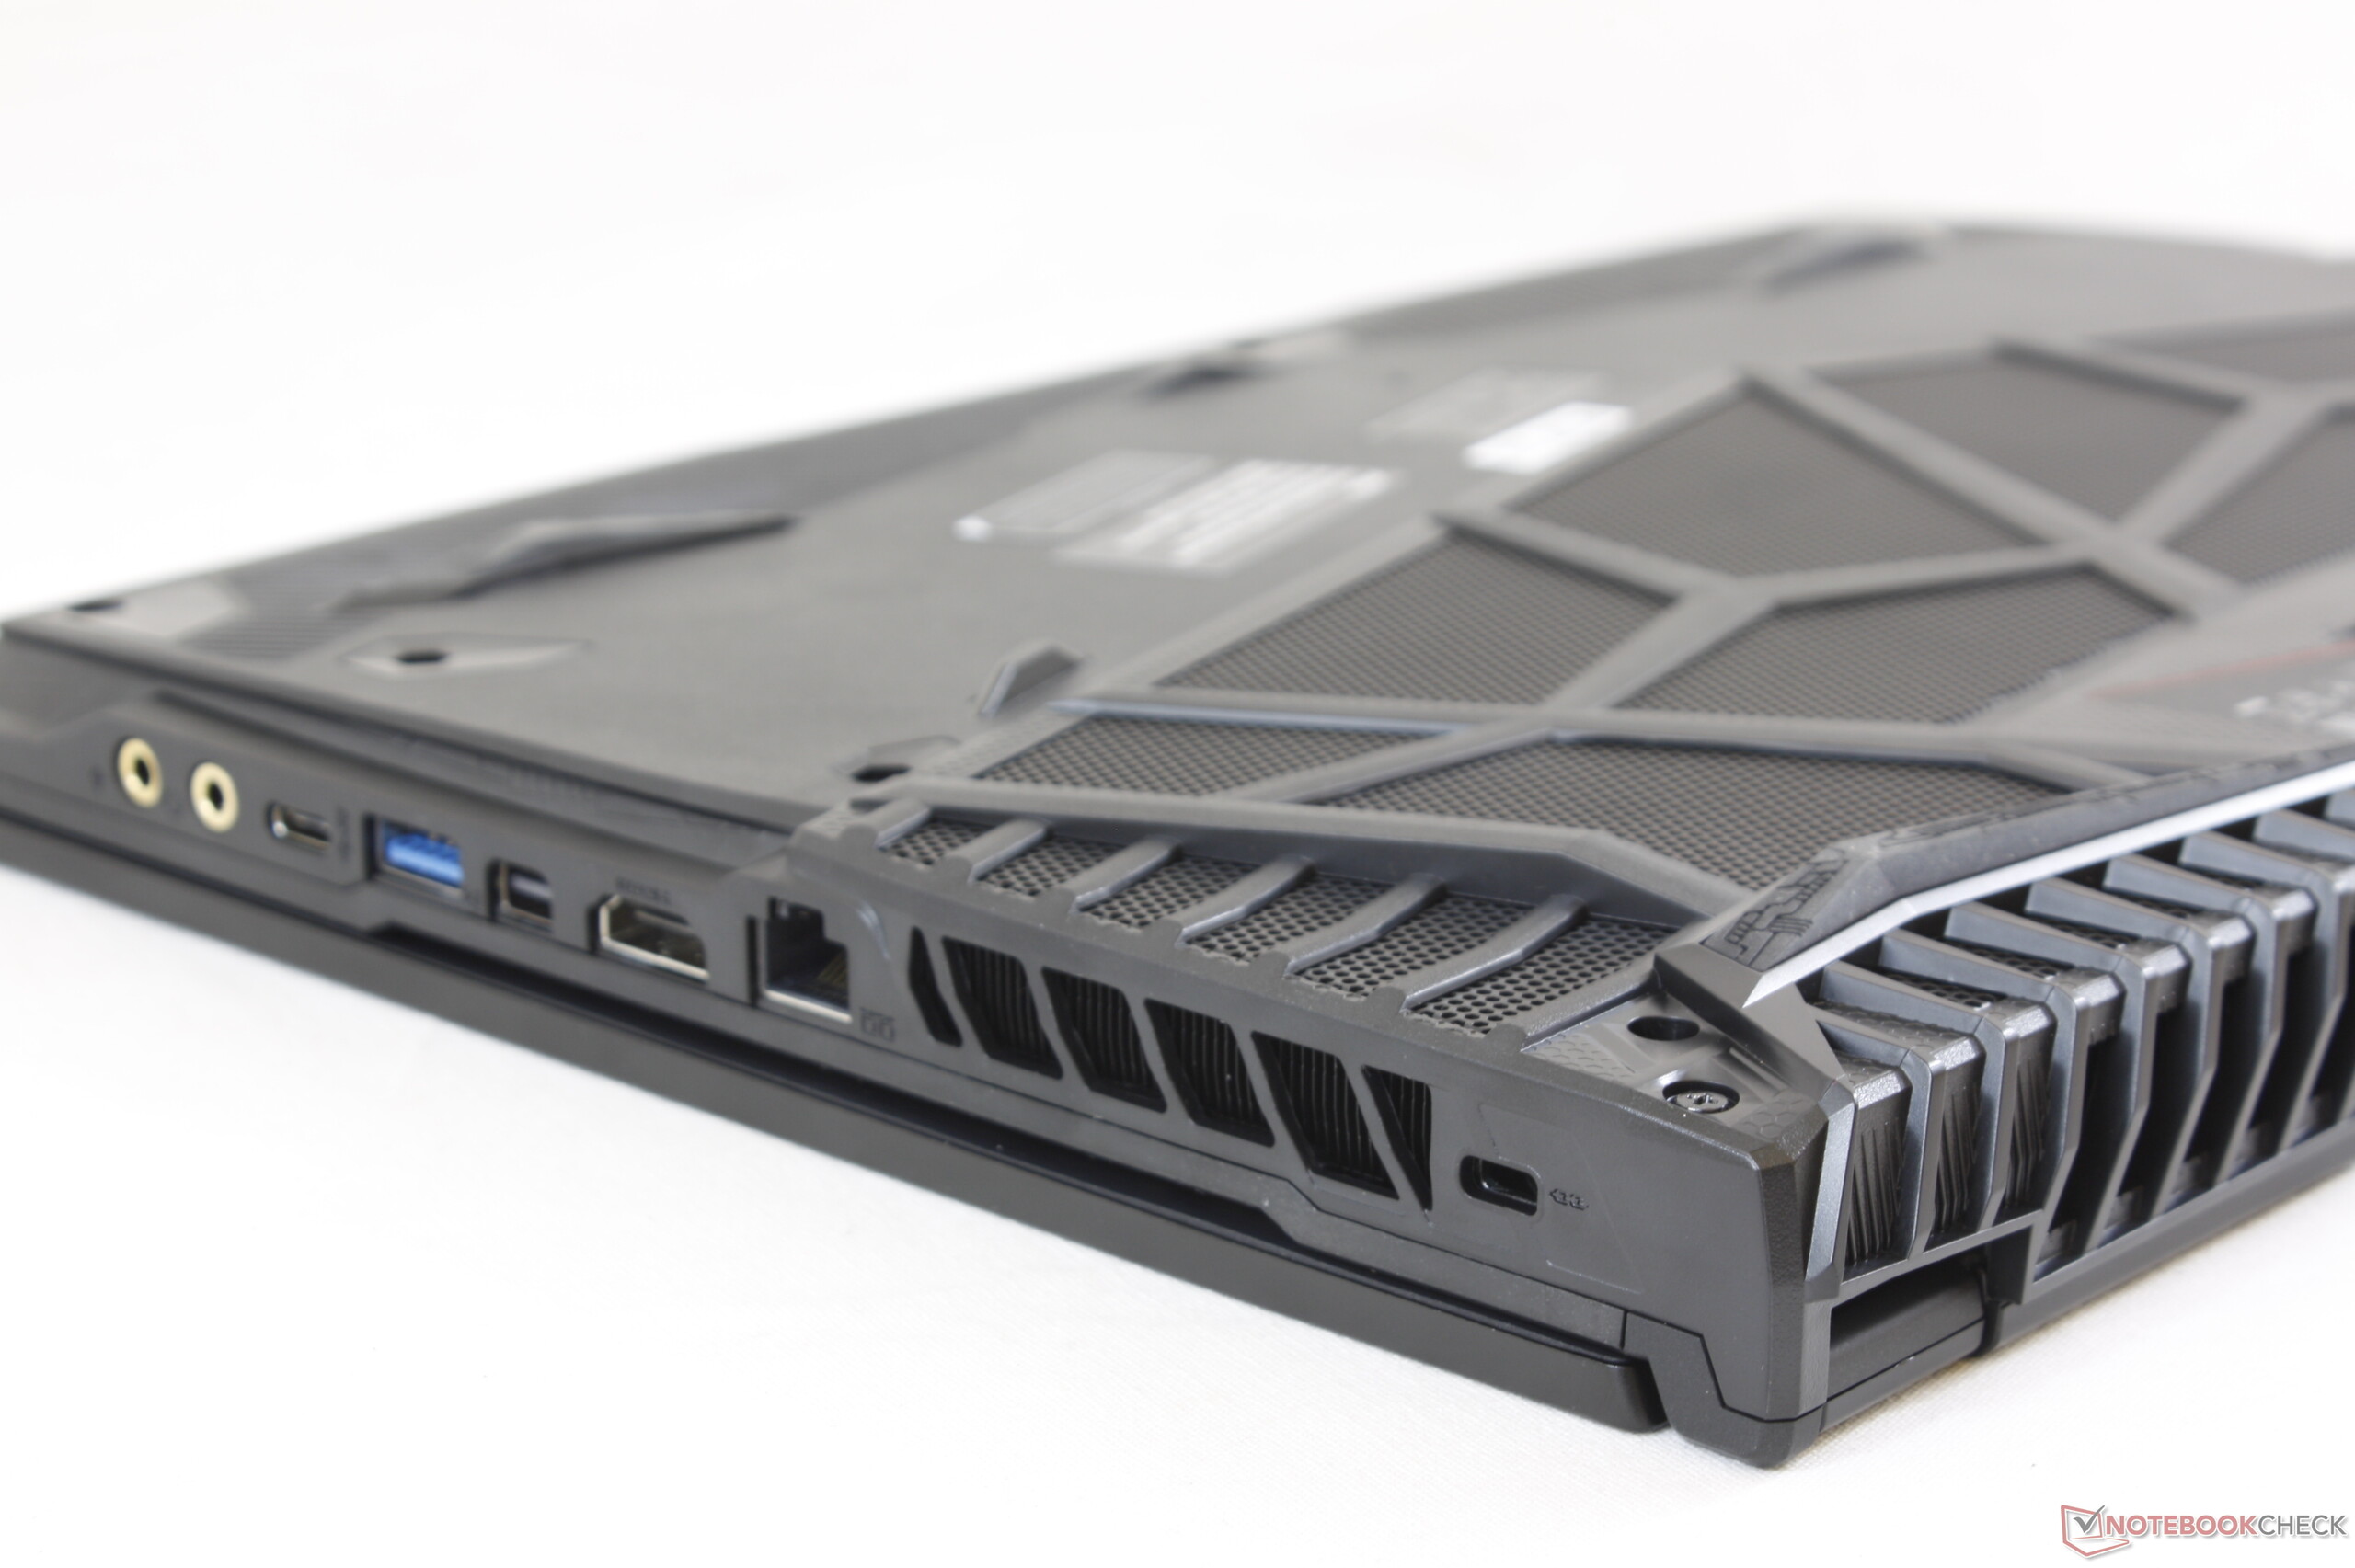
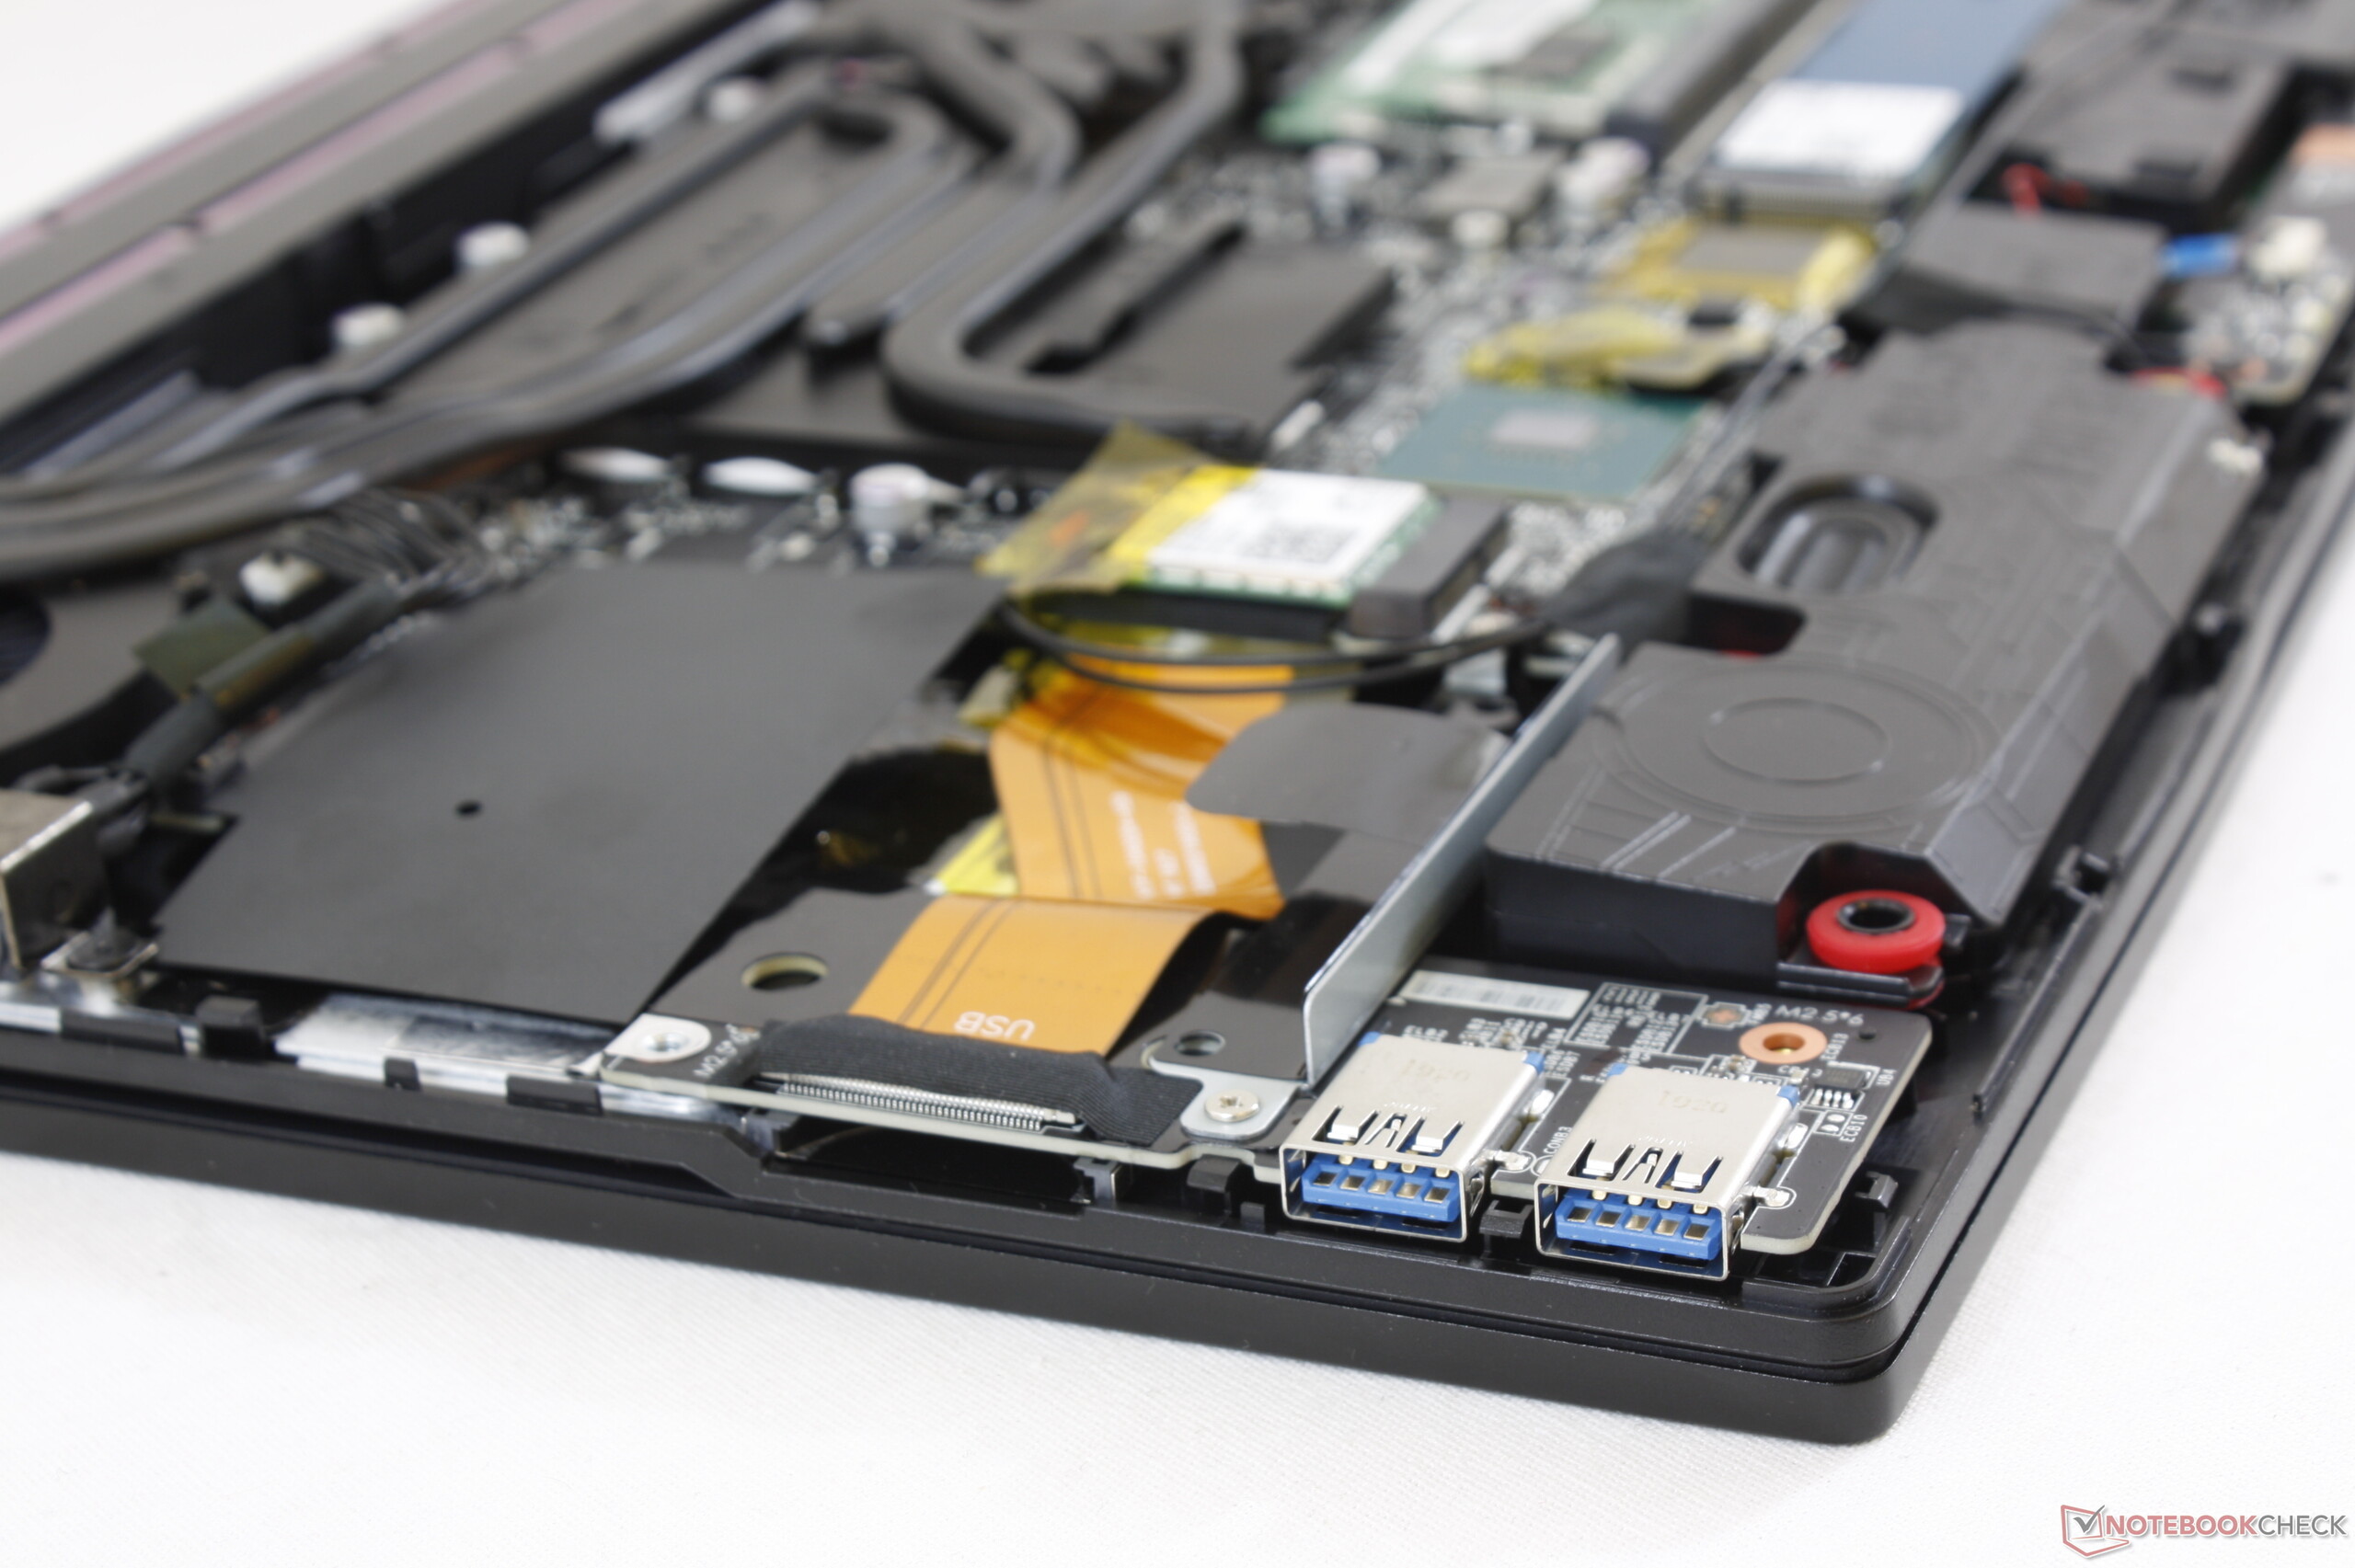
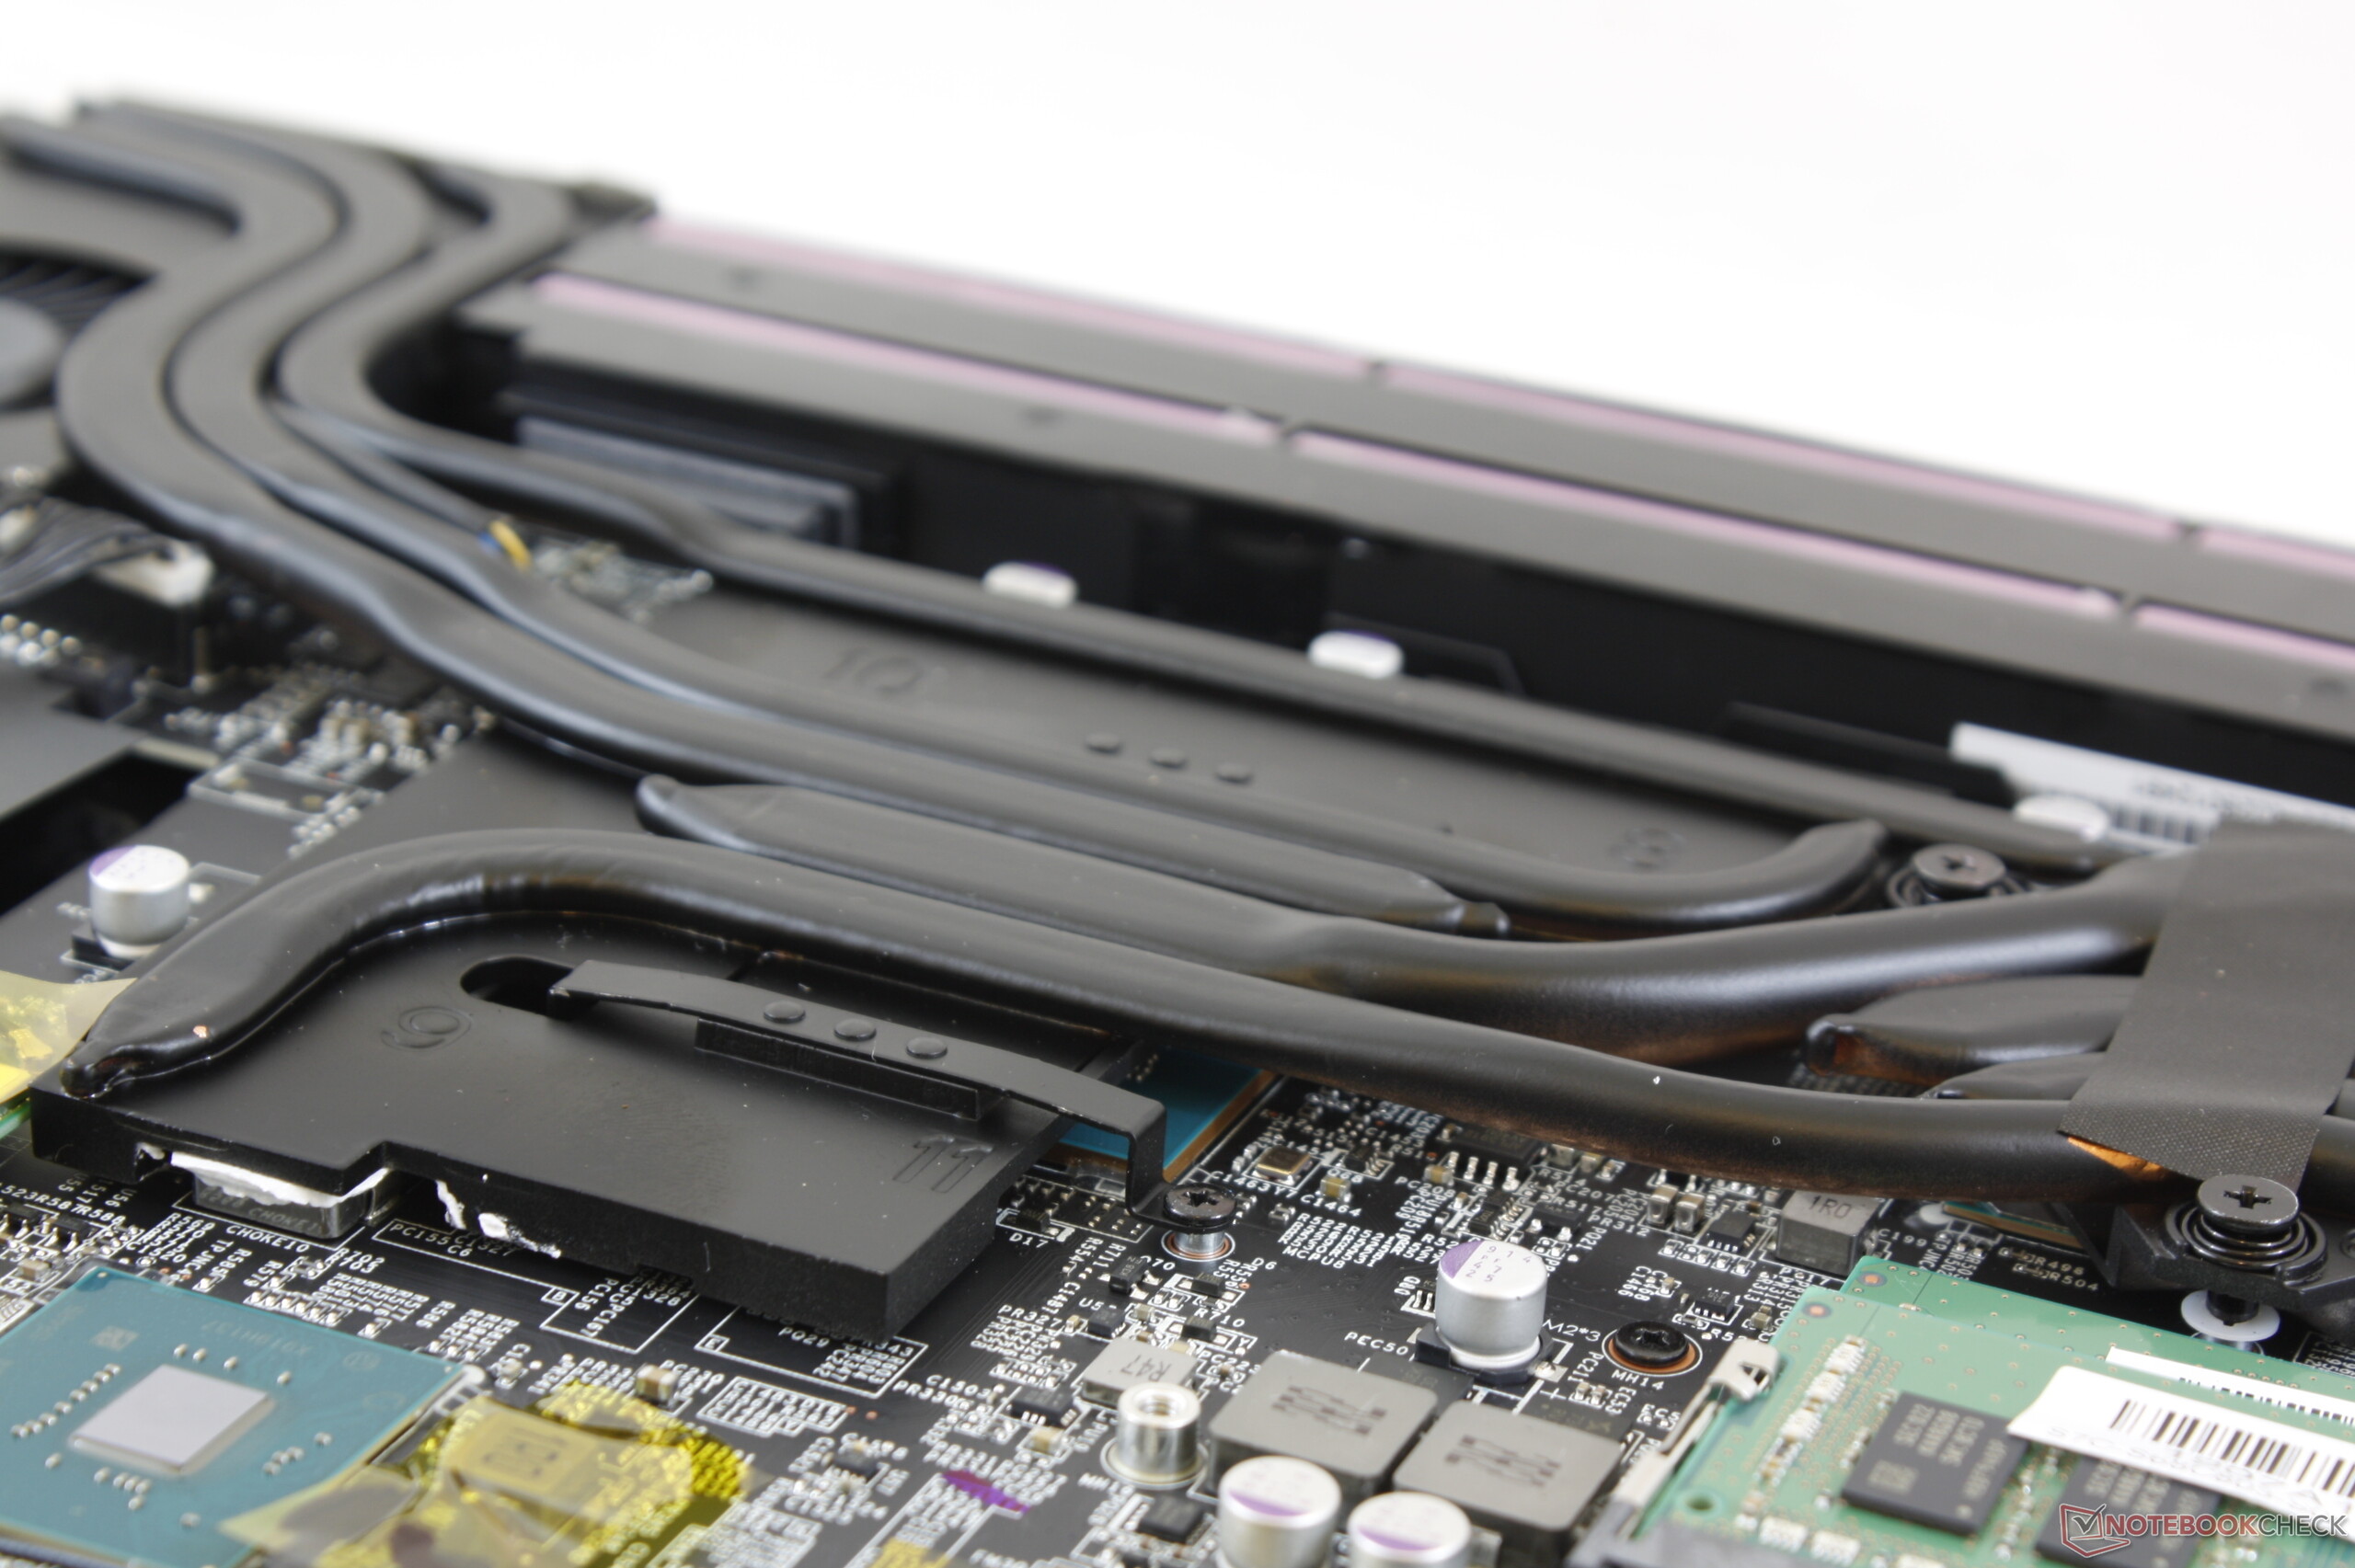
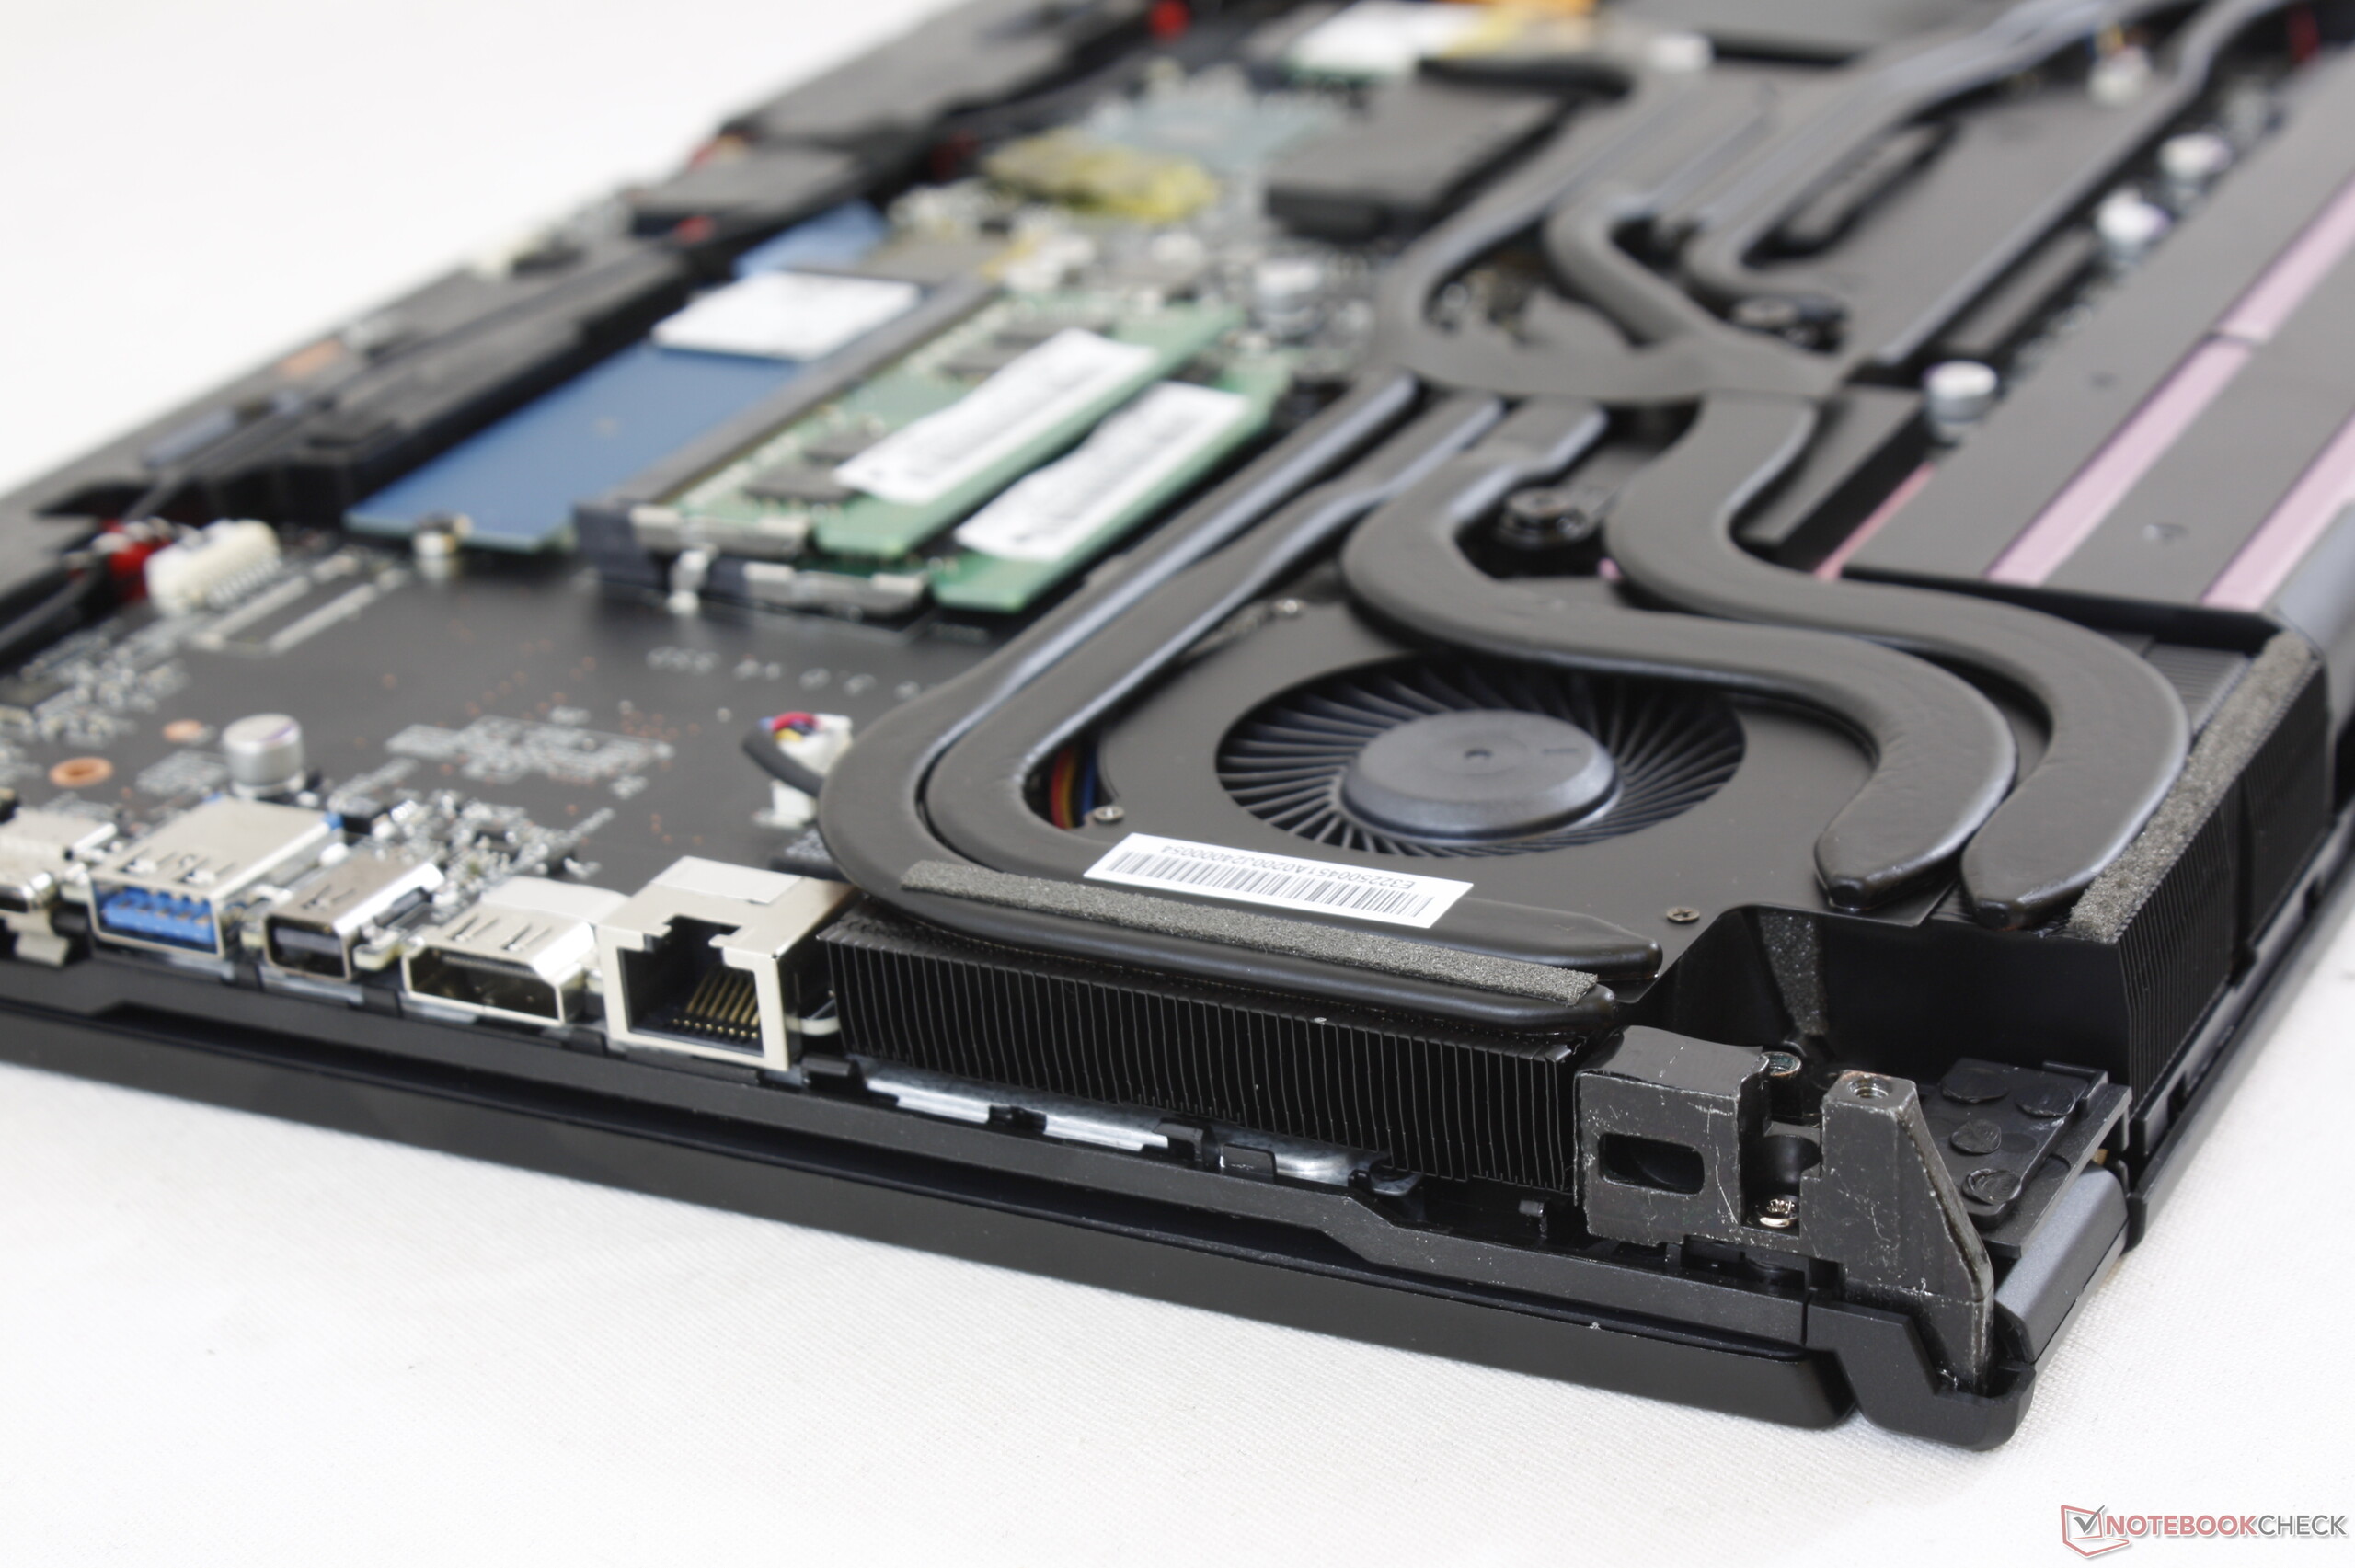
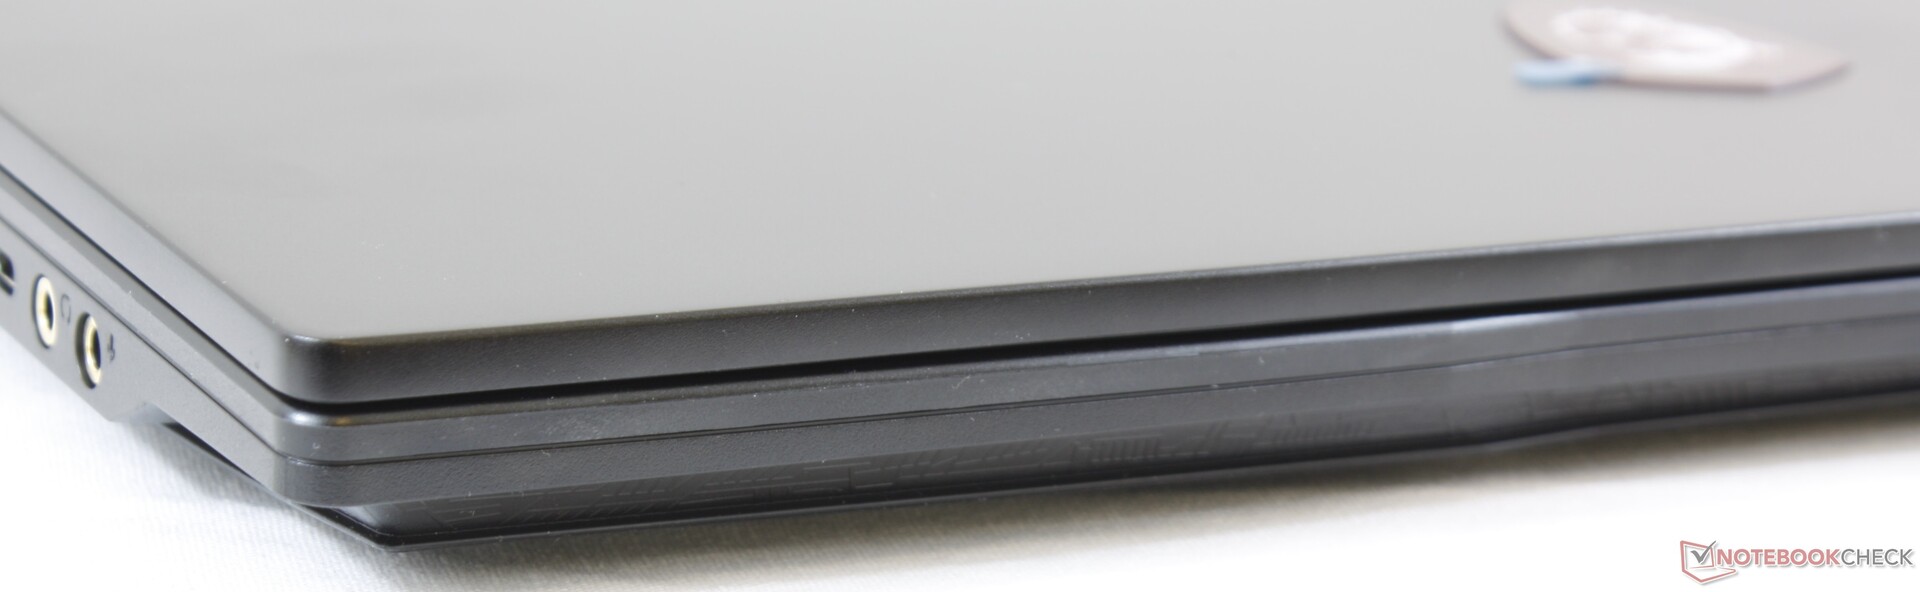
Le plus gros et le plus notable progrès du GL65 sur le GL63 est son châssis plus compact et plus portable. Il est d’environ 16 % plus compact que celui de son prédécesseur, tout en offrant de nouveaux processeurs qui permettent des gains de performances notables.
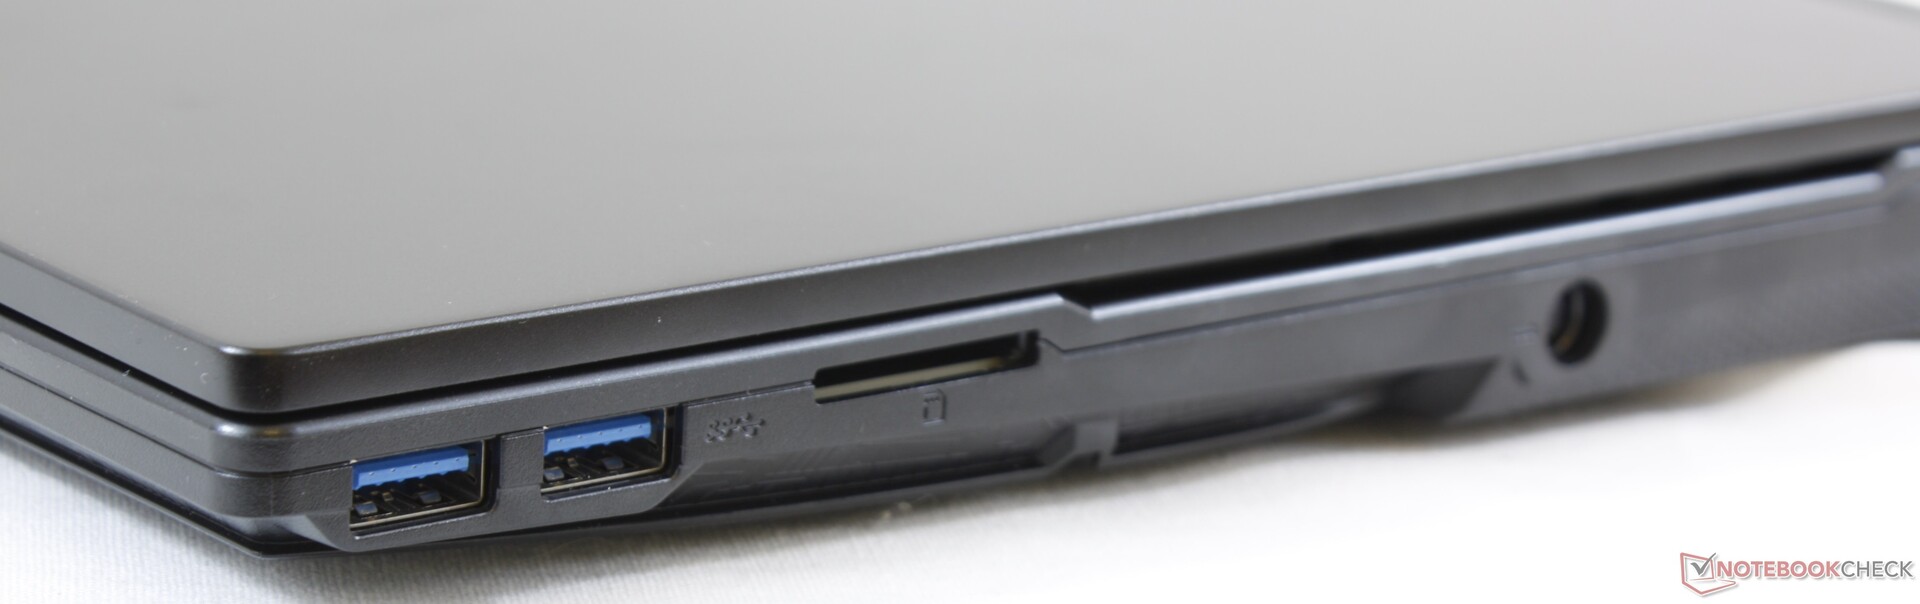
Tout le reste est similaire au GL63. MSI avait pourtant l’occasion d’améliorer l’écran et l’autonomie, d’intégrer des ventilateurs plus silencieux, ou de proposer un lecteur de carte SD plus rapide, mais ces éléments n’ont pas changé d’une génération à l’autre. Il faudra choisir la série GS65 plus haut de gamme s’ils sont importants pour vous.
Le portable de jeu du milieu de gamme avec des performances et une allure réussies taille dans les coûts avec son autonomie et son écran : avec le MSI GL65, il faut être prêt à sacrifier l’autonomie et les couleurs.
L’intégralité de cette critique est disponible en anglais en suivant ce lien.
MSI GL65 9SEK
- 10/02/2019 v7 (old)
Allen Ngo
Price comparison
