Test de l'Acer Nitro 5 AN515-46 : des jeux FHD puissants avec USB 4
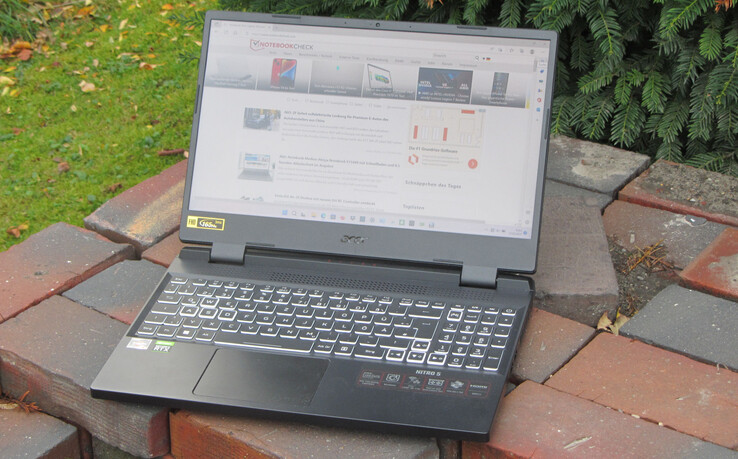
La série Nitro 5 d'Acer se compose d'appareils de jeu d'entrée et de milieu de gamme. Les ordinateurs portables sont positionnés en dessous de la série Predator, avec des prix atteignant jusqu'à 2 500 euros. L'unité de test d'aujourd'hui est disponible à partir de 1 750 euros. Acer a combiné un APU Ryzen 7-6800H économe en énergie avec un GPU RTX 3070-Ti GeForce (TGP de 150 watts) pour ce modèle. En théorie, cela pourrait donner un ordinateur portable puissant qui a de faibles émissions et une longue autonomie. Les concurrents de l'appareil sont les suivantsSchenker XMG Fusion 15 (Mid 22)leMSI Katana GF66 12UGSet leAsus TUF Dash F15 FX517ZR.
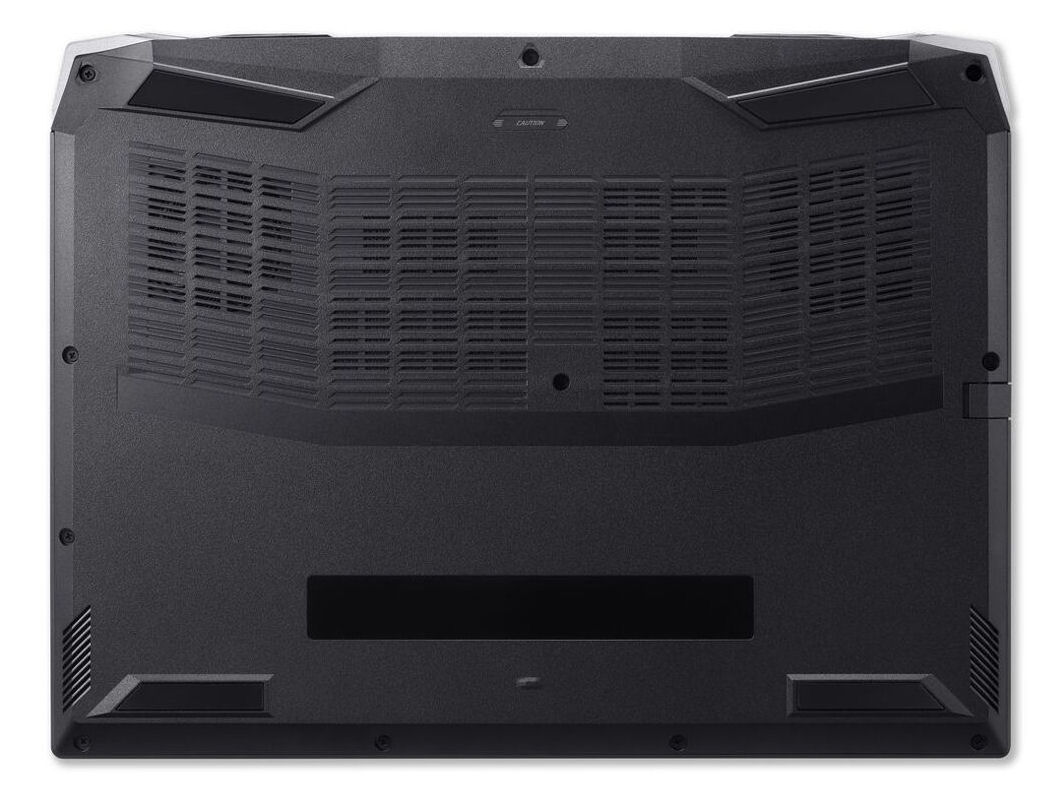
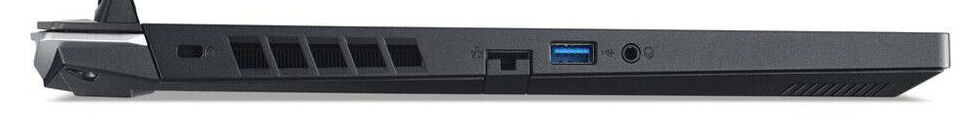
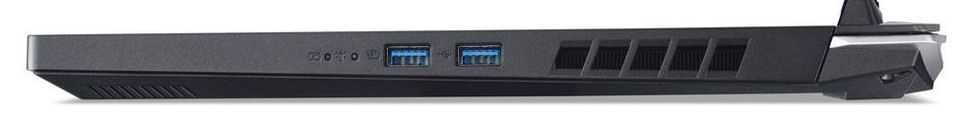
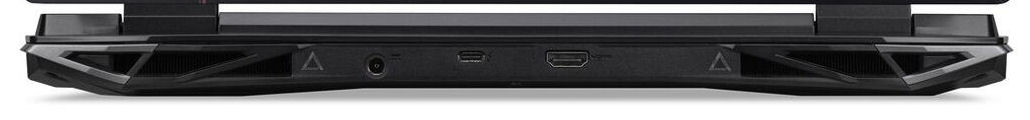
Le AN515-58 a été installé dans le même boîtier que son homologue basé sur Intel, que nous avons déjà testé. Pour en savoir plus sur le boîtier, la connectivité et les périphériques d'entrée, veuillez consulter notre test duNitro 5 AN515-58(Core i7, QHD).
Comparaison avec les concurrents potentiels
Note | Date | Modèle | Poids | Épaisseur | Taille | Résolution | Prix |
|---|---|---|---|---|---|---|---|
| 83.9 % v7 (old) | 11/22 | Acer Nitro 5 AN515-46-R1A1 R7 6800H, GeForce RTX 3070 Ti Laptop GPU | 2.5 kg | 26.8 mm | 15.60" | 1920x1080 | |
| 80.3 % v7 (old) | 06/22 | MSI Katana GF66 12UGS i7-12700H, GeForce RTX 3070 Ti Laptop GPU | 2.3 kg | 27.5 mm | 15.60" | 1920x1080 | |
| 87.4 % v7 (old) | 08/22 | Schenker XMG Fusion 15 (Mid 22) i7-11800H, GeForce RTX 3070 Laptop GPU | 1.9 kg | 21.65 mm | 15.60" | 2560x1440 | |
| 85.8 % v7 (old) | 07/22 | Asus TUF Dash F15 FX517ZR i7-12650H, GeForce RTX 3070 Laptop GPU | 2 kg | 20.7 mm | 15.60" | 2560x1440 |
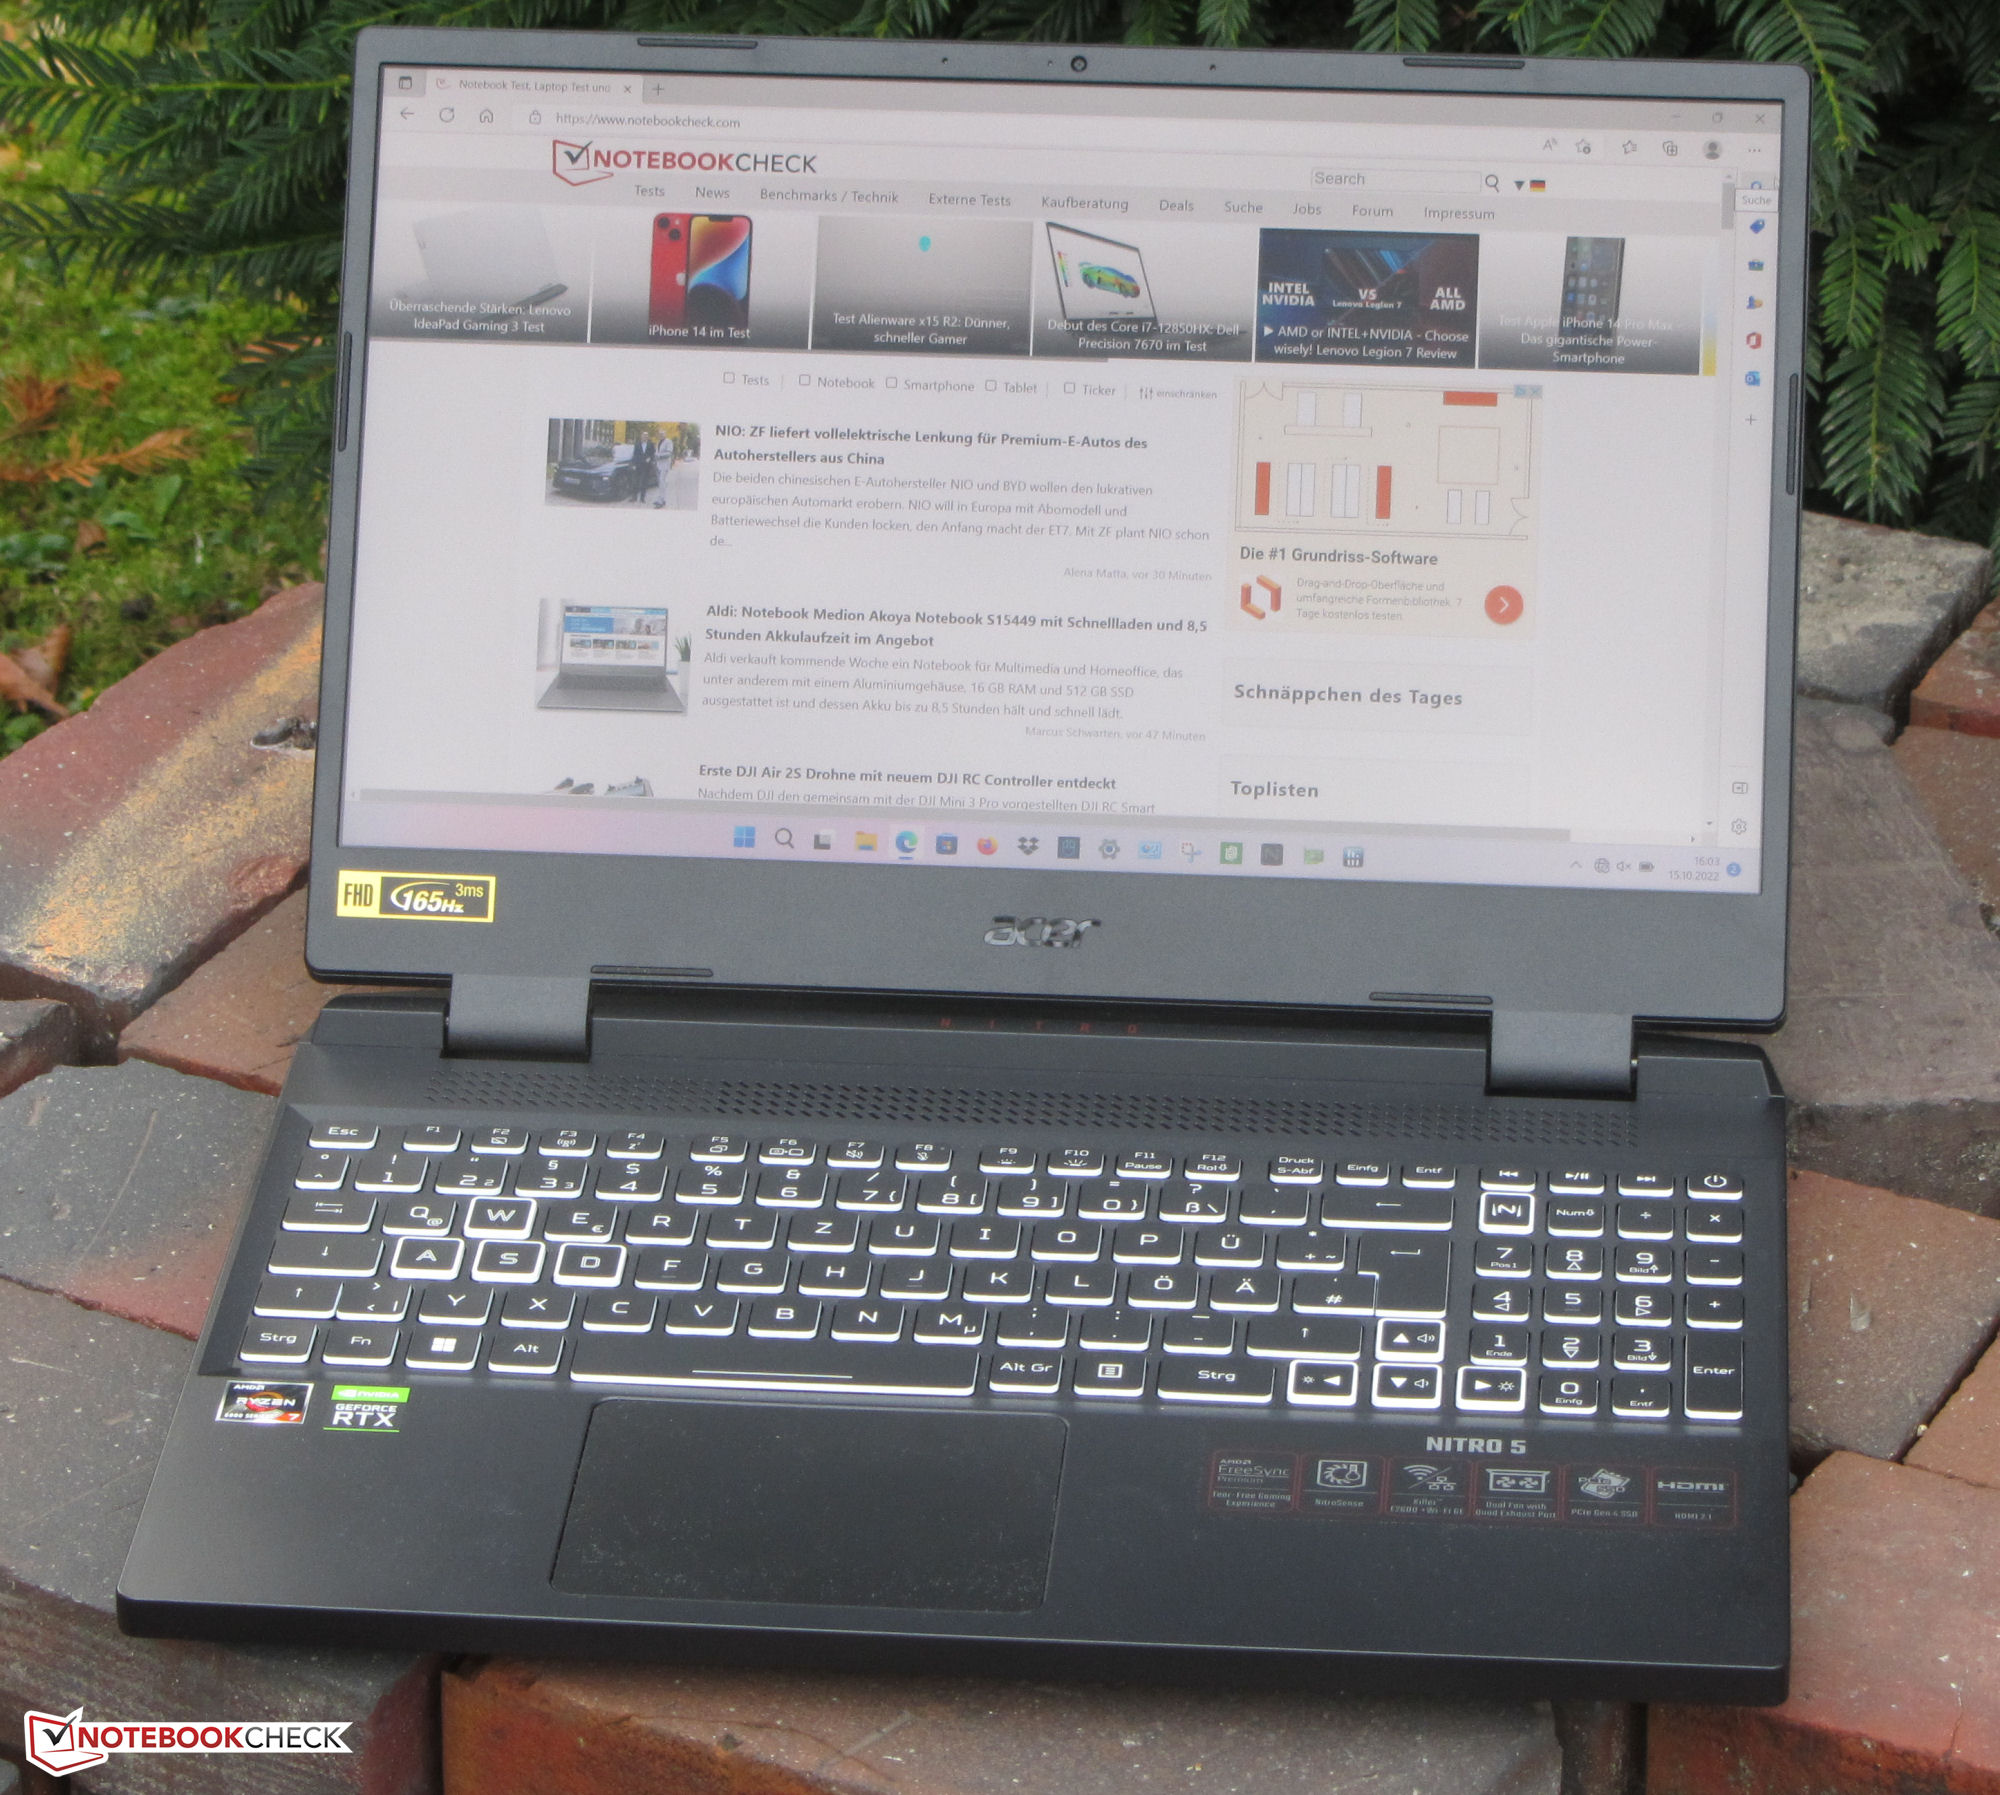
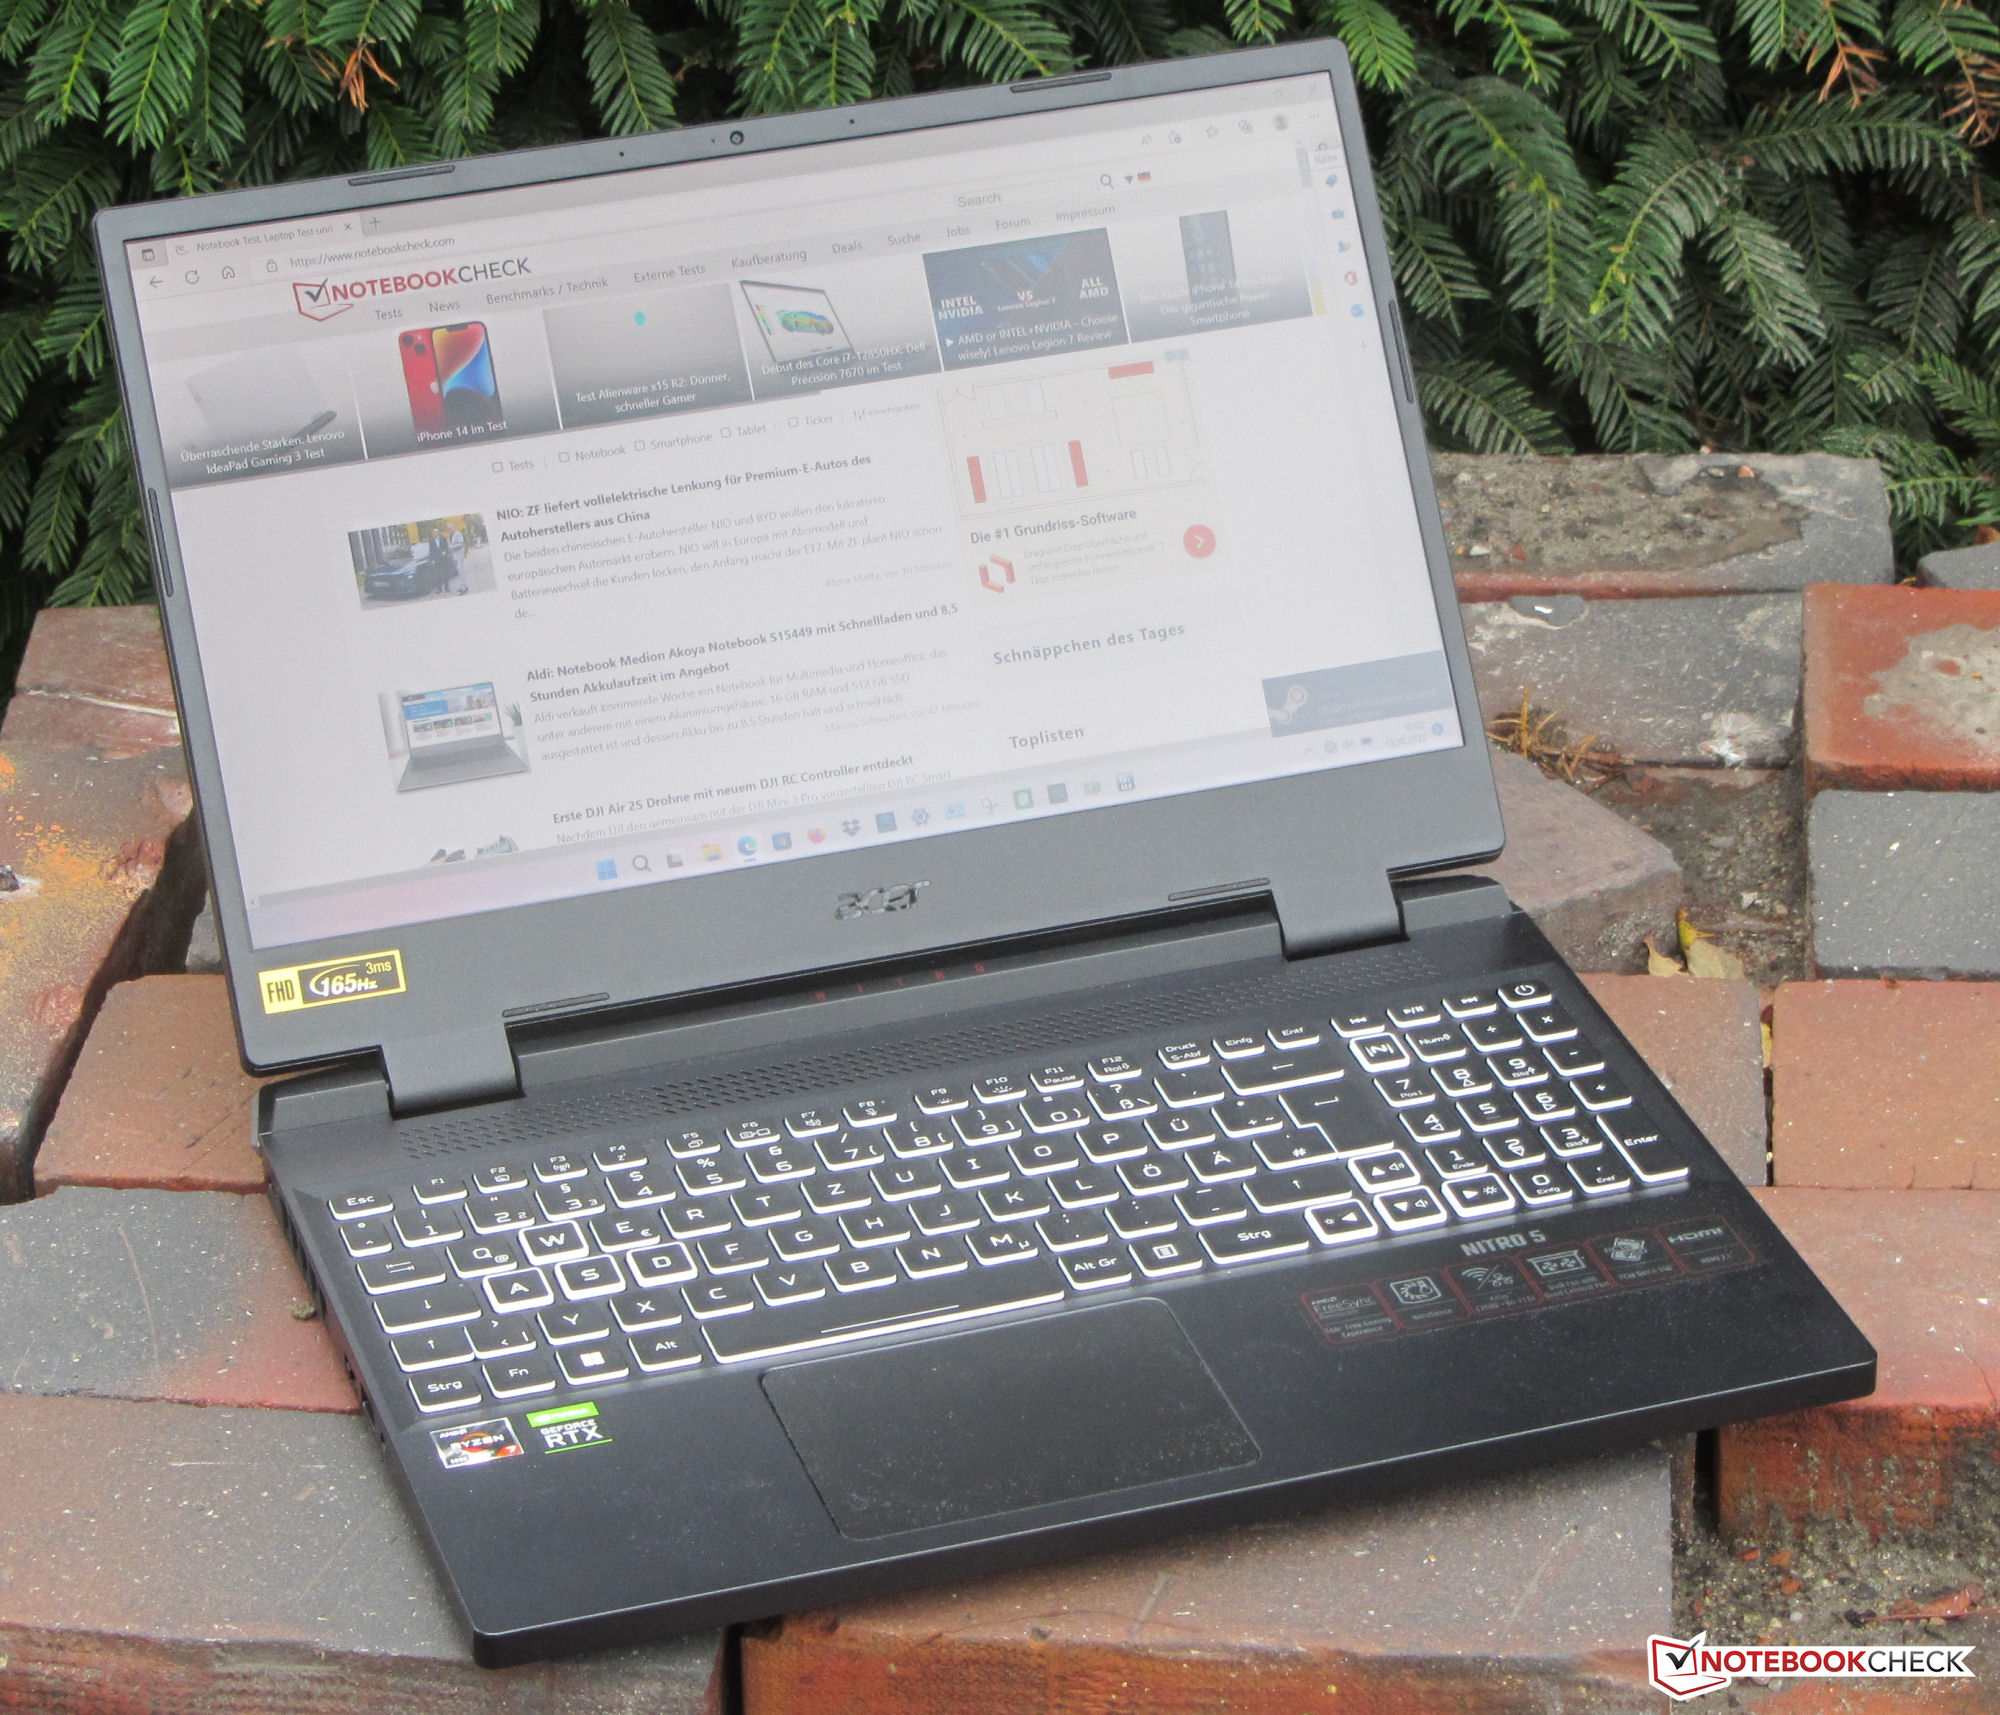
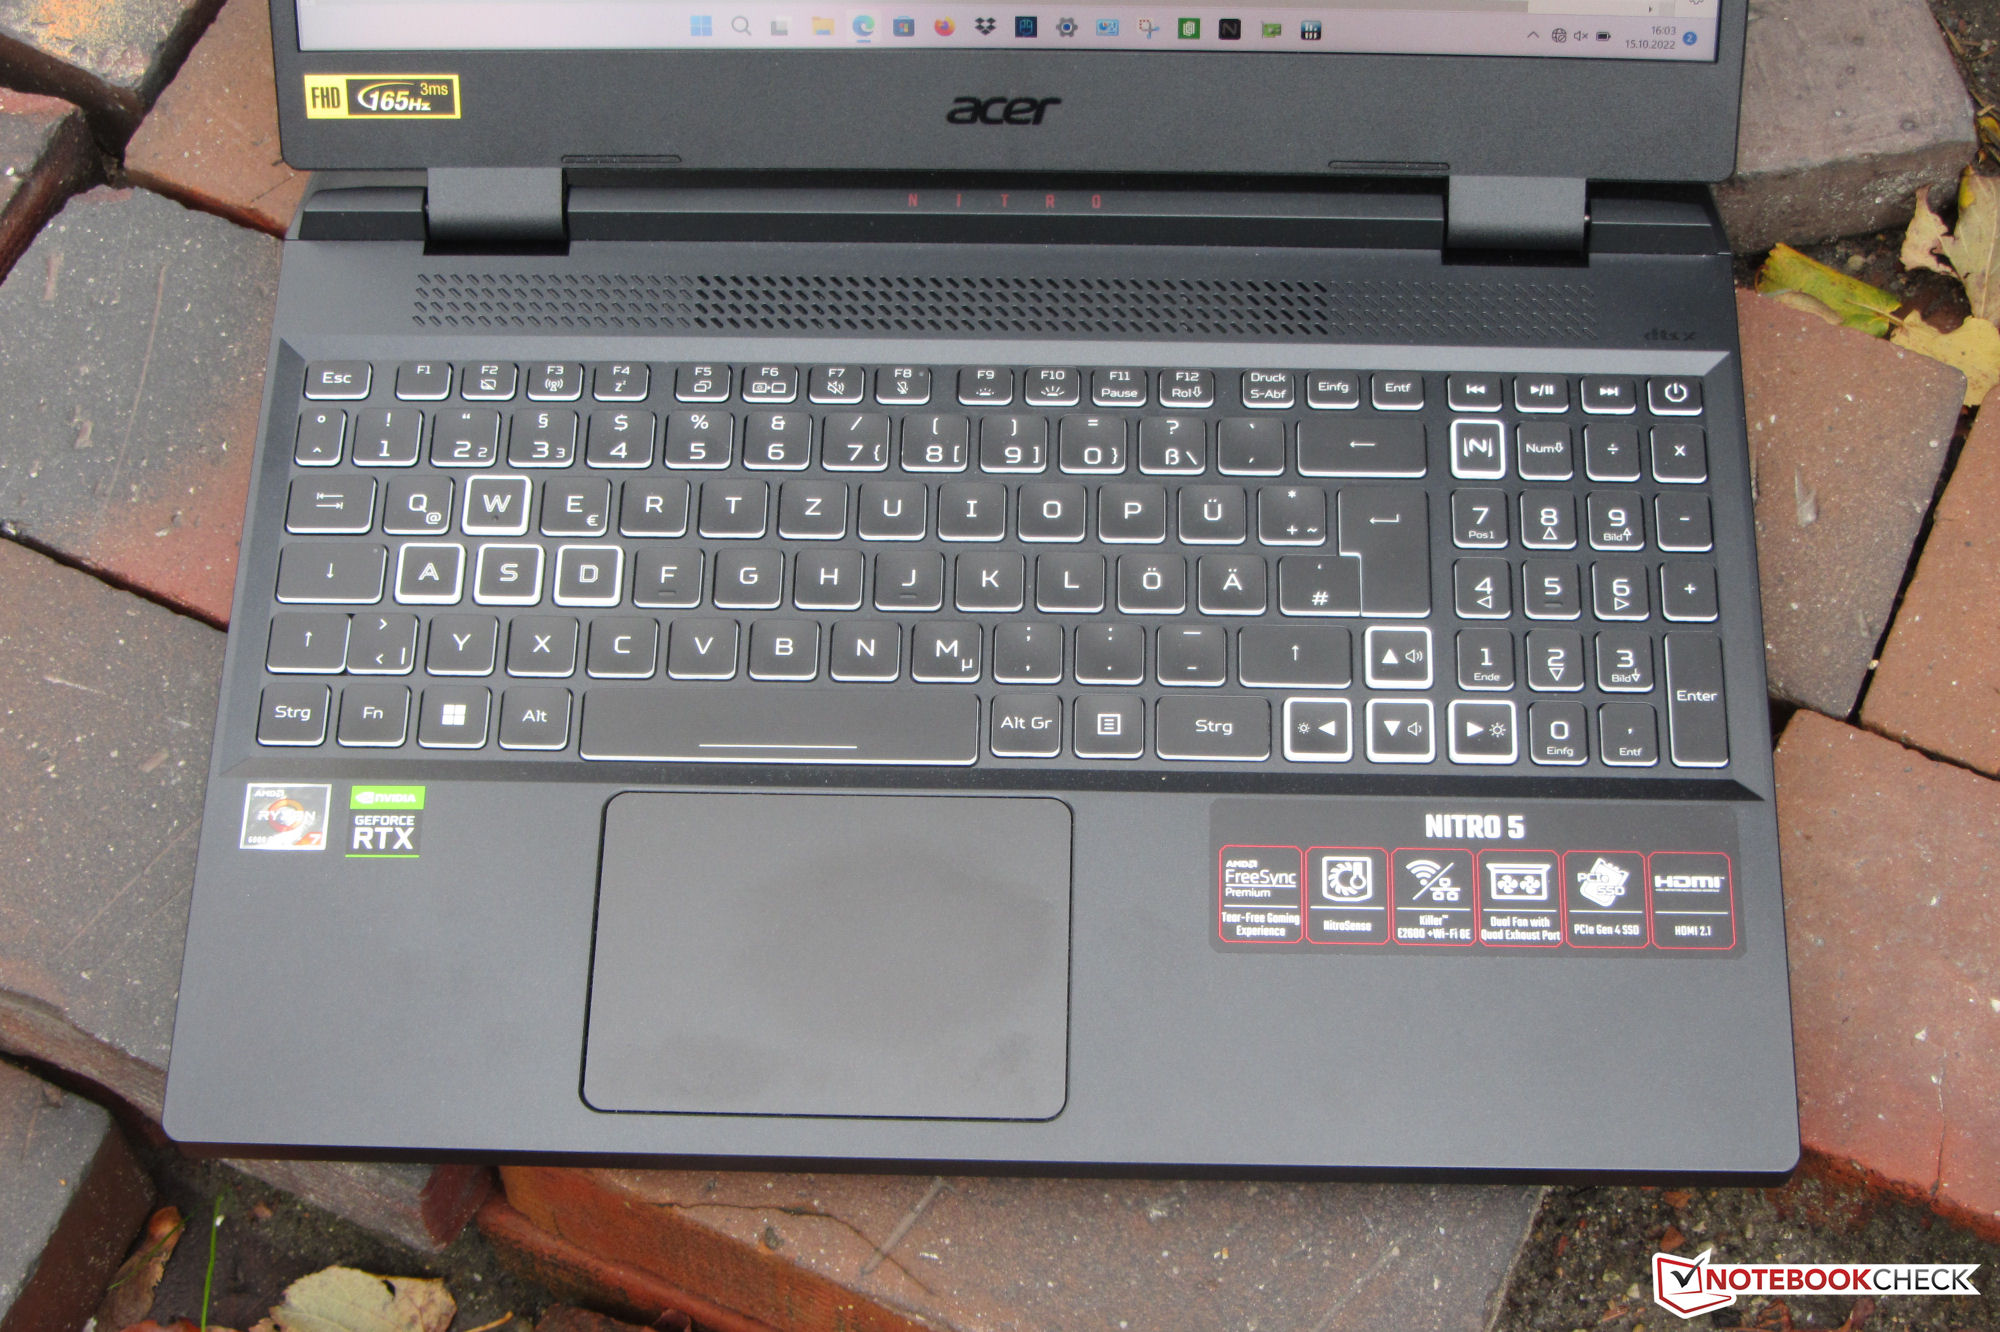


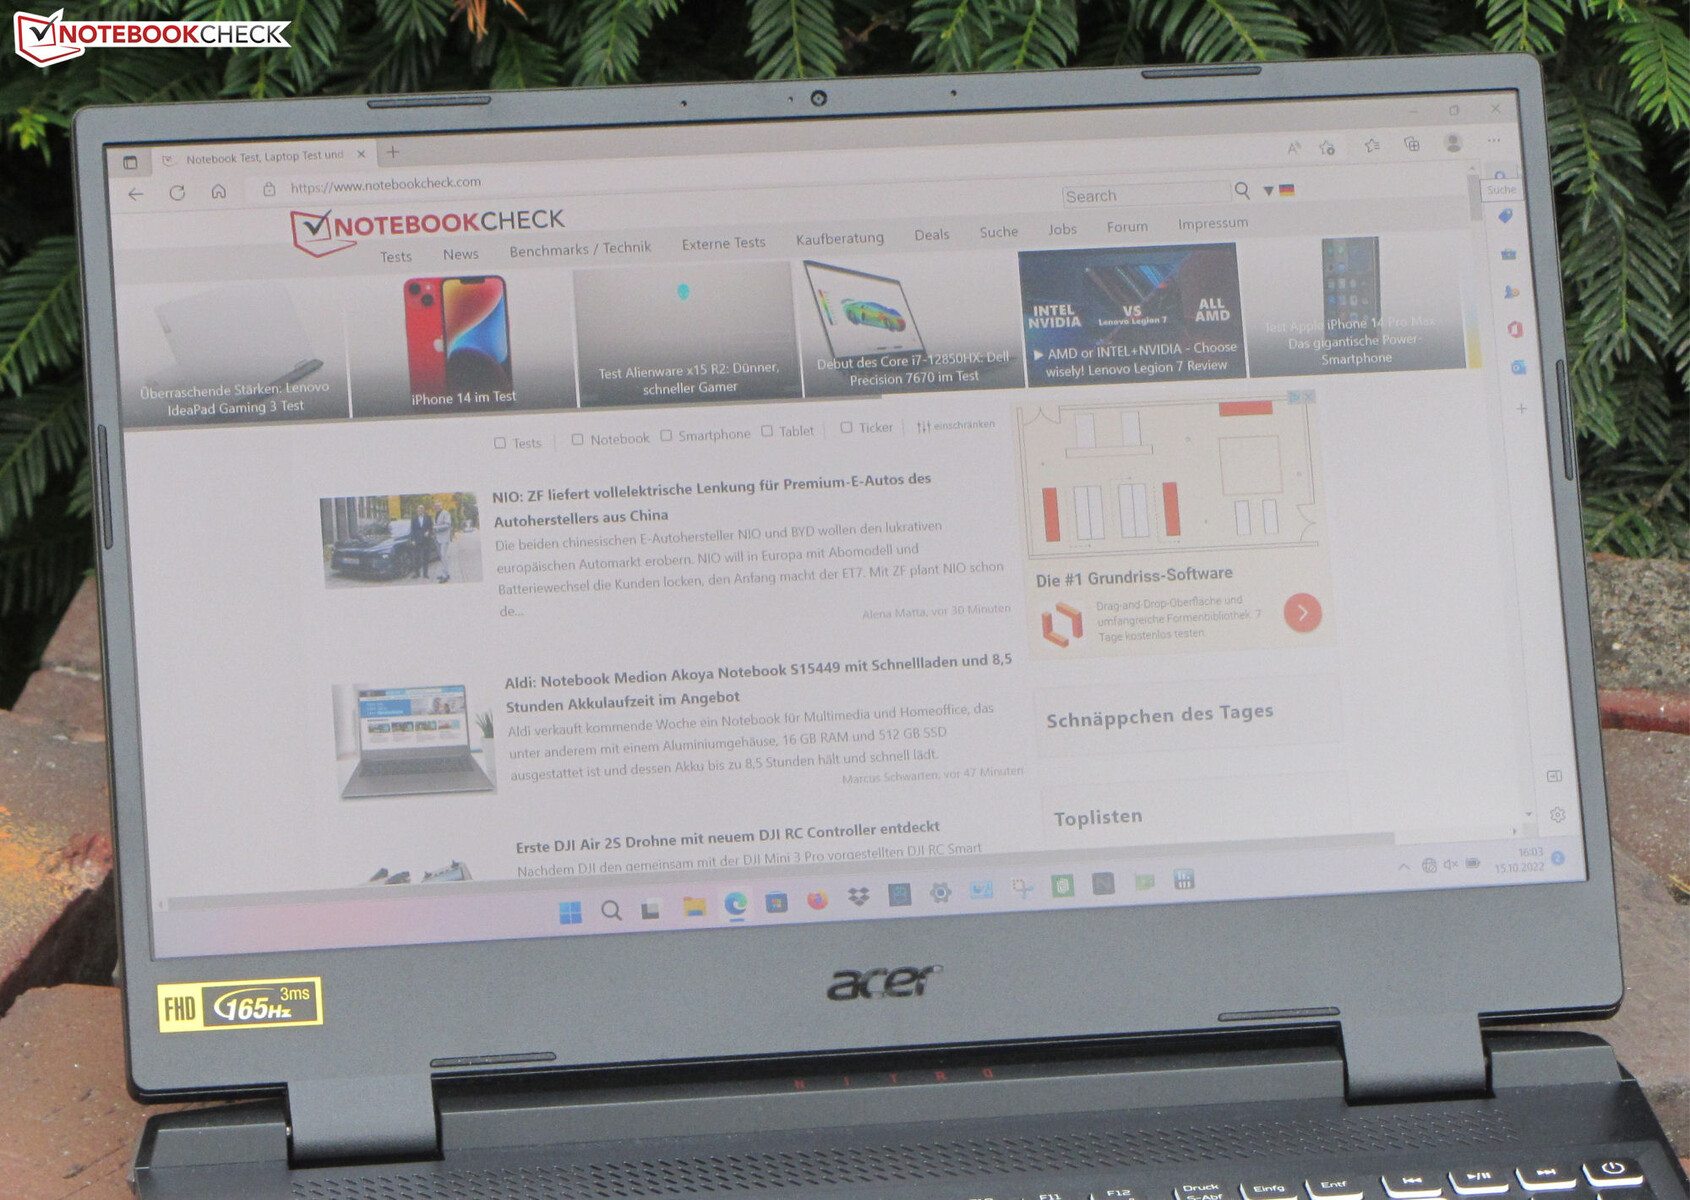
Affichage - ordinateur portable Acer avec une dalle de 165 Hz
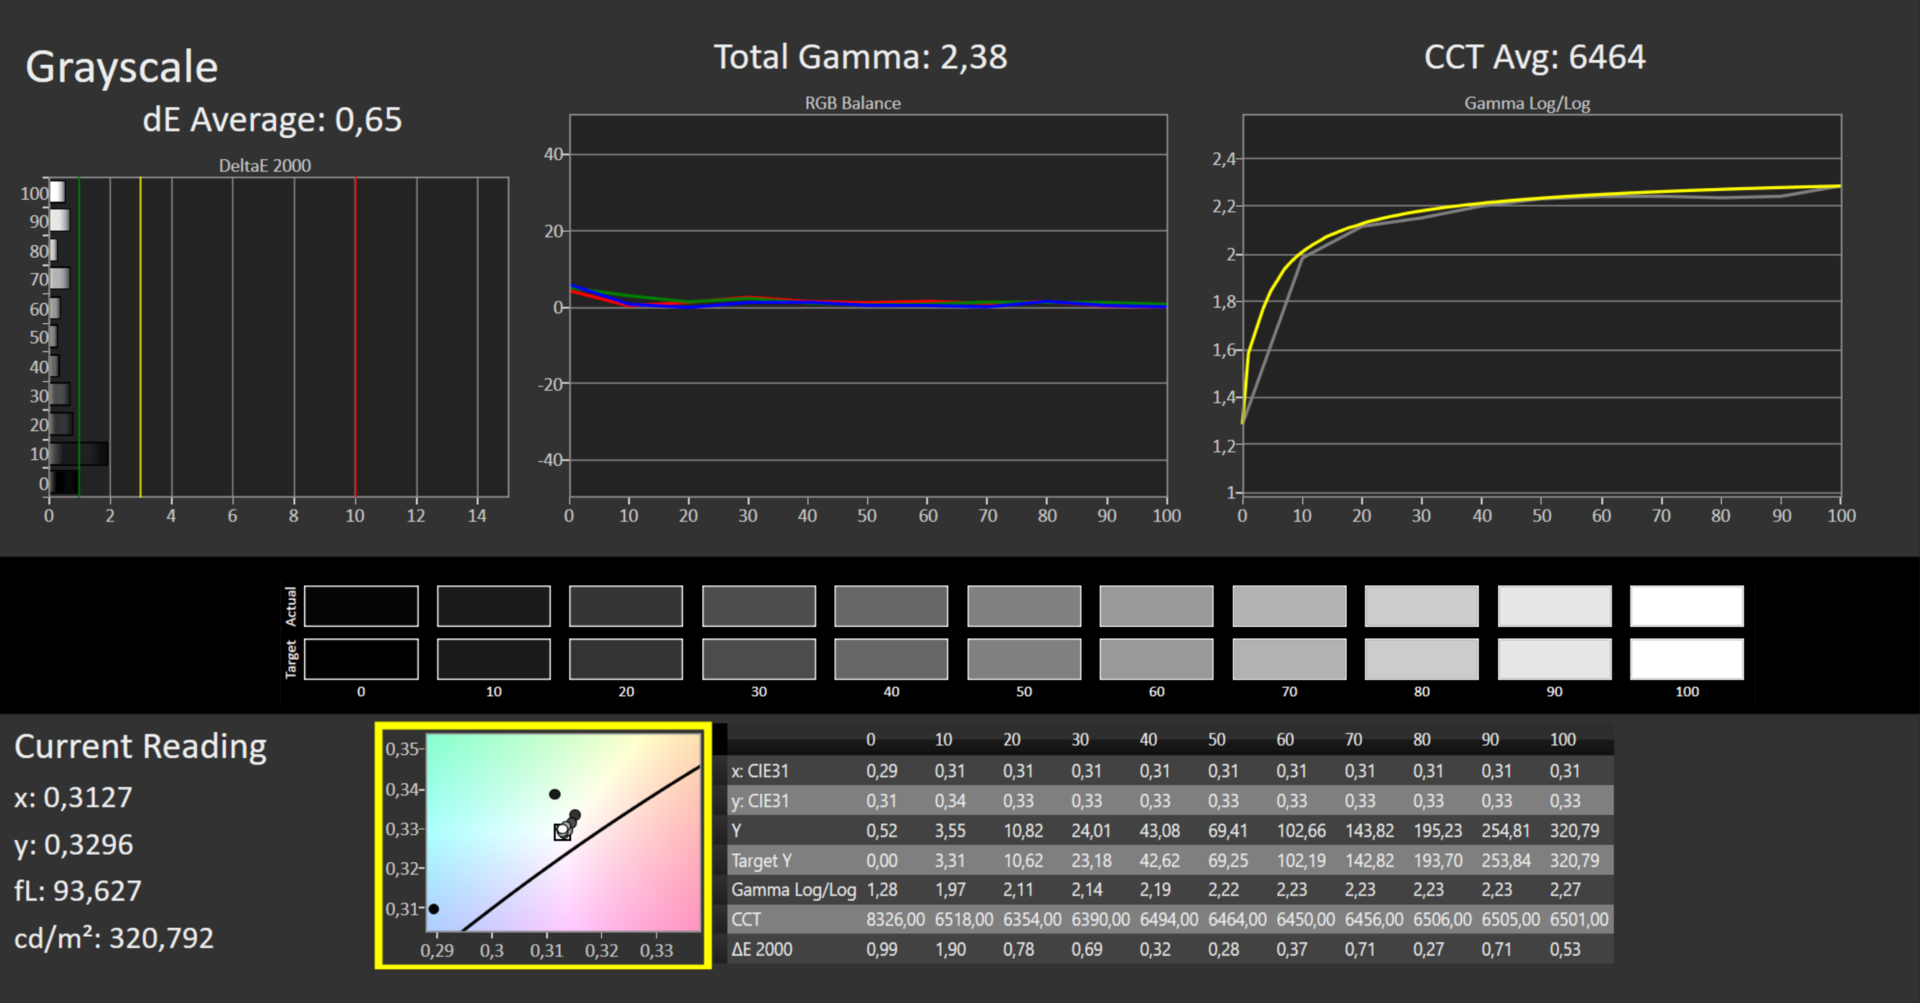
La luminosité de 320,2 cd/m² de l'écran mat de 15,6 pouces (1 920 x 1 080 pixels) répond à nos exigences minimales (> 300 cd/m²). Son taux de contraste de 1 363:1 est plus qu'adéquat et surpasse facilement celui de ses concurrents. La dalle de 165 Hz a des temps de réponse courts et n'utilise pas de PWM, quel que soit le niveau de luminosité.
L'écran prend en charge la technologie FreeSync d'AMD. Celle-ci permet d'adapter dynamiquement les taux de rafraîchissement de l'écran au GPU, afin de créer une image aussi fluide que possible, notamment dans les jeux vidéo.
| |||||||||||||||||||||||||
Homogénéité de la luminosité: 93 %
Valeur mesurée au centre, sur batterie: 334 cd/m²
Contraste: 1363:1 (Valeurs des noirs: 0.24 cd/m²)
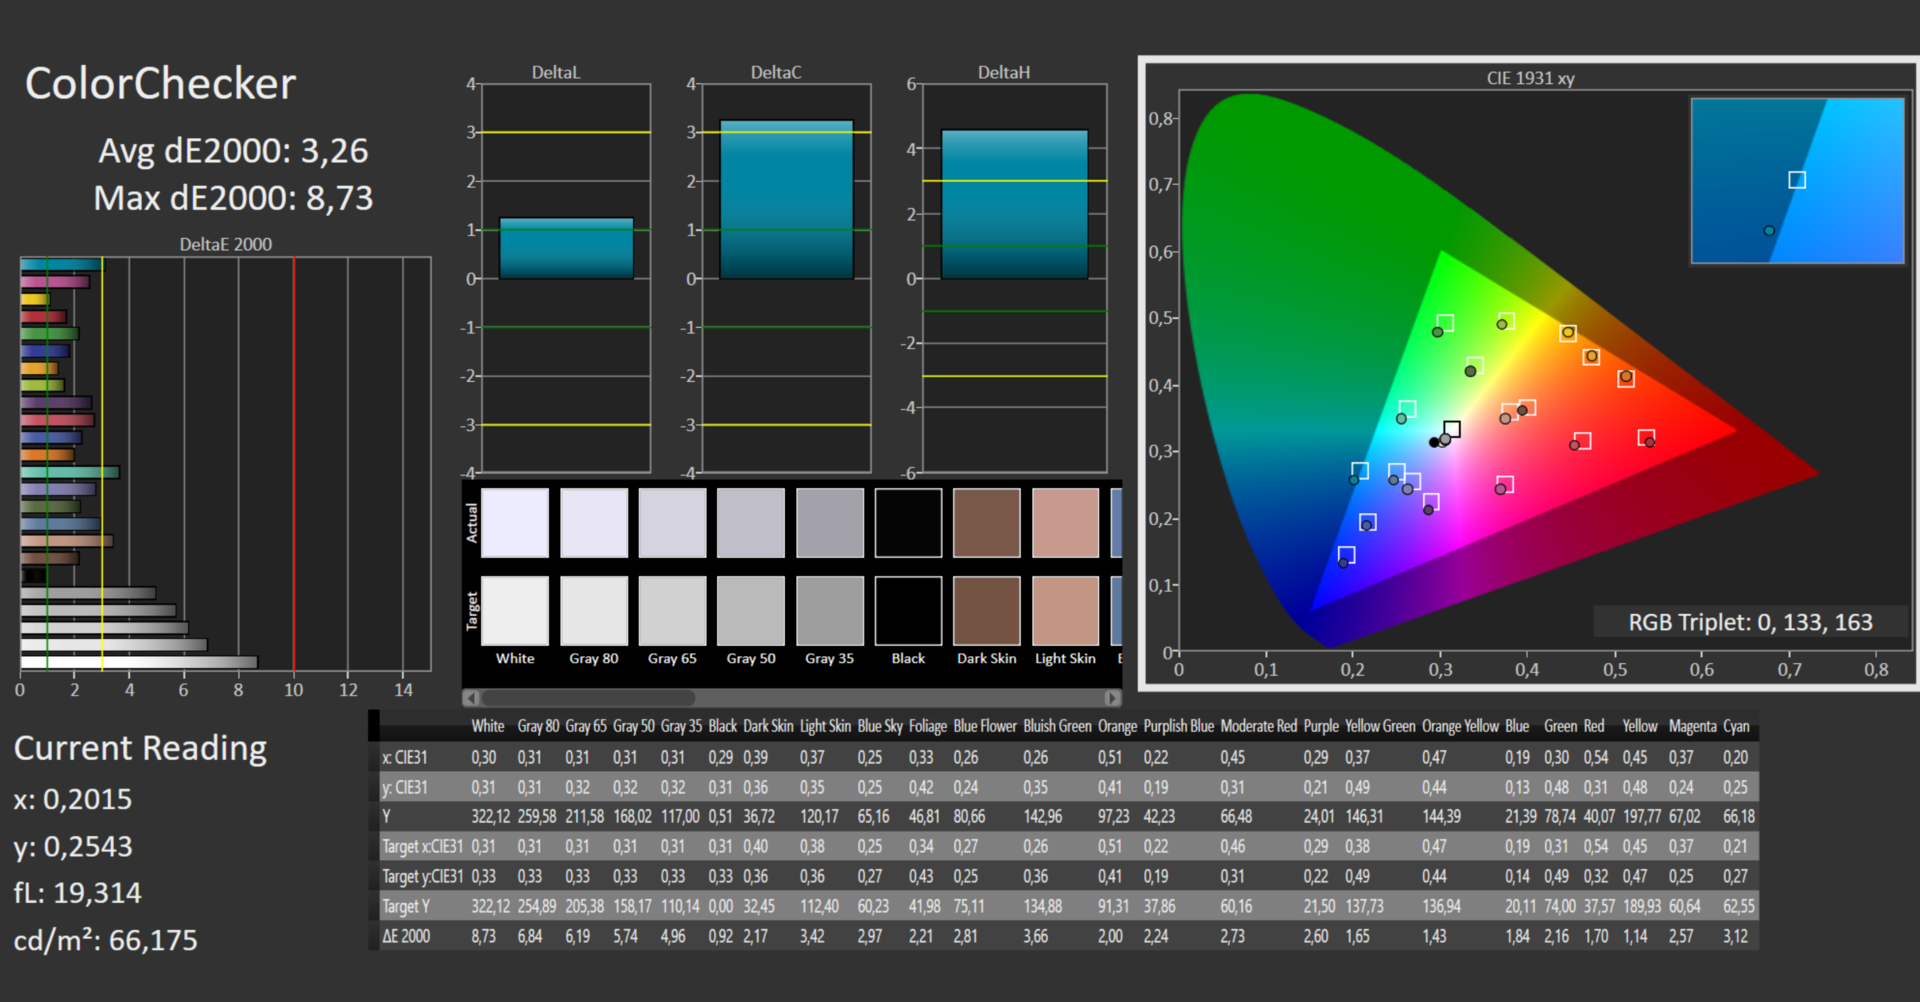
ΔE ColorChecker Calman: 3.26 | ∀{0.5-29.43 Ø4.71}
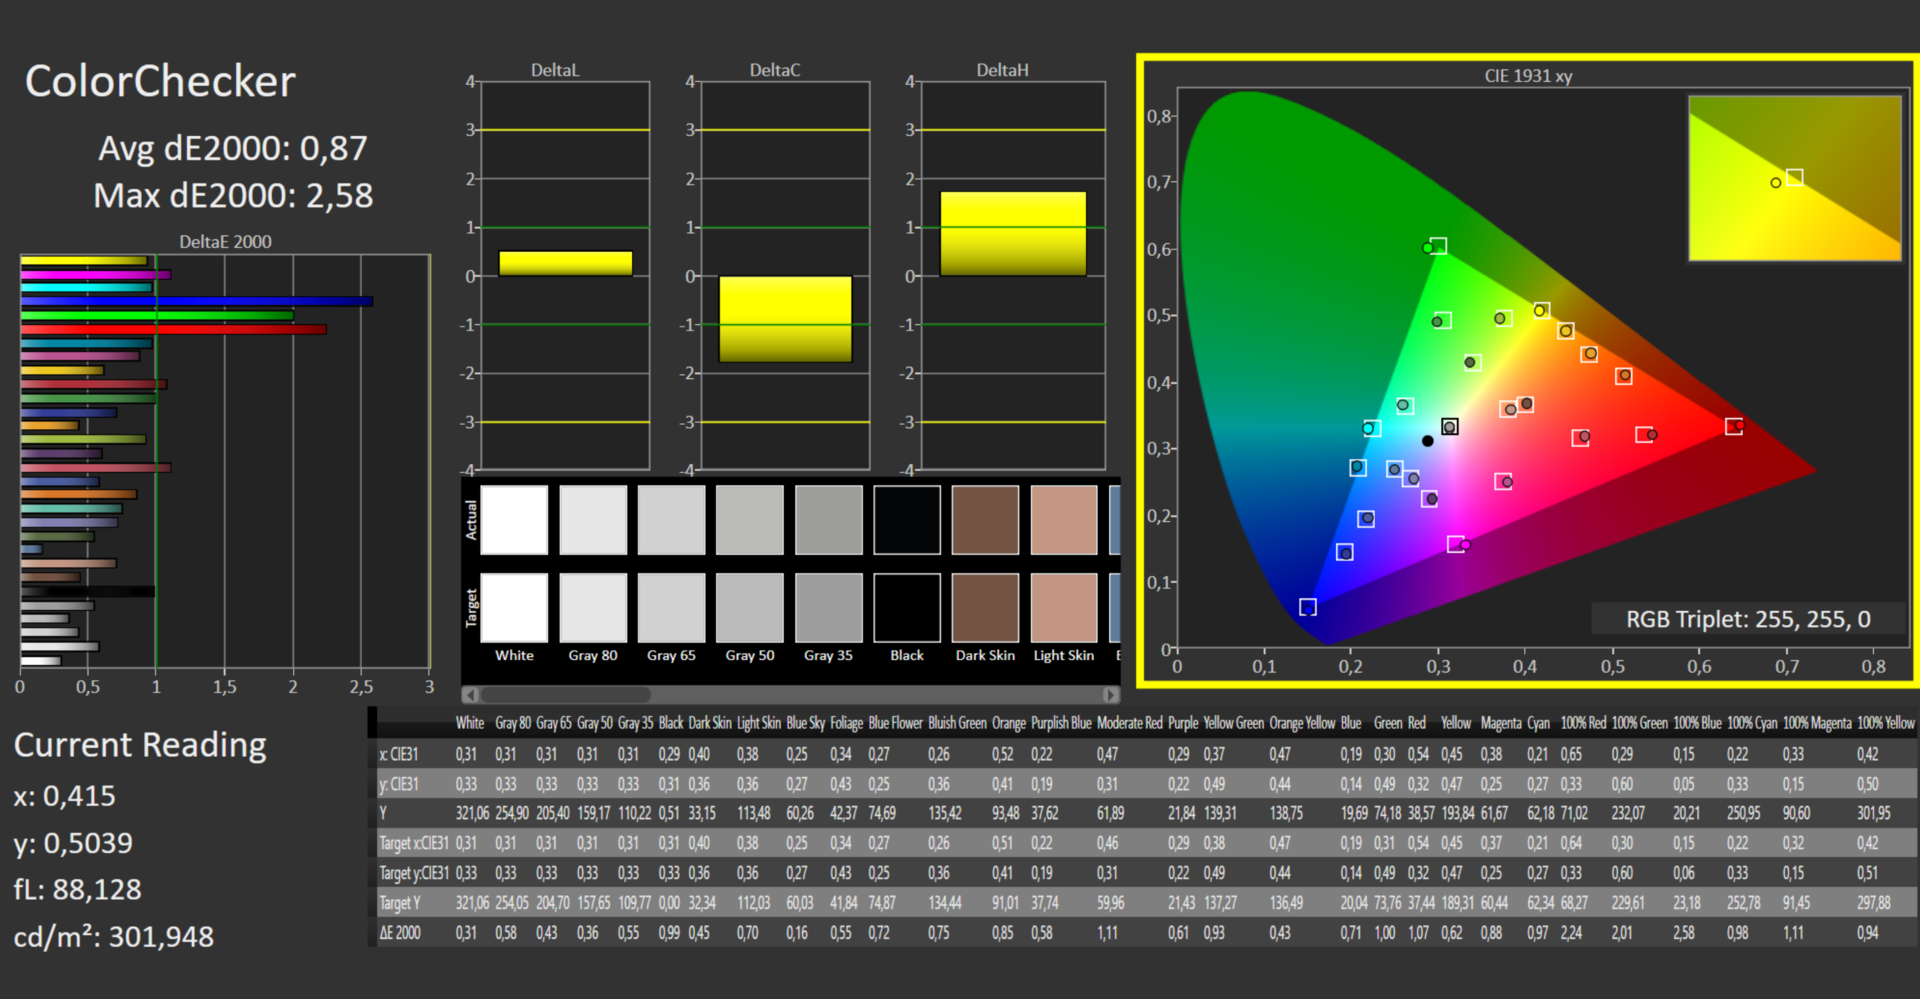
calibrated: 0.87
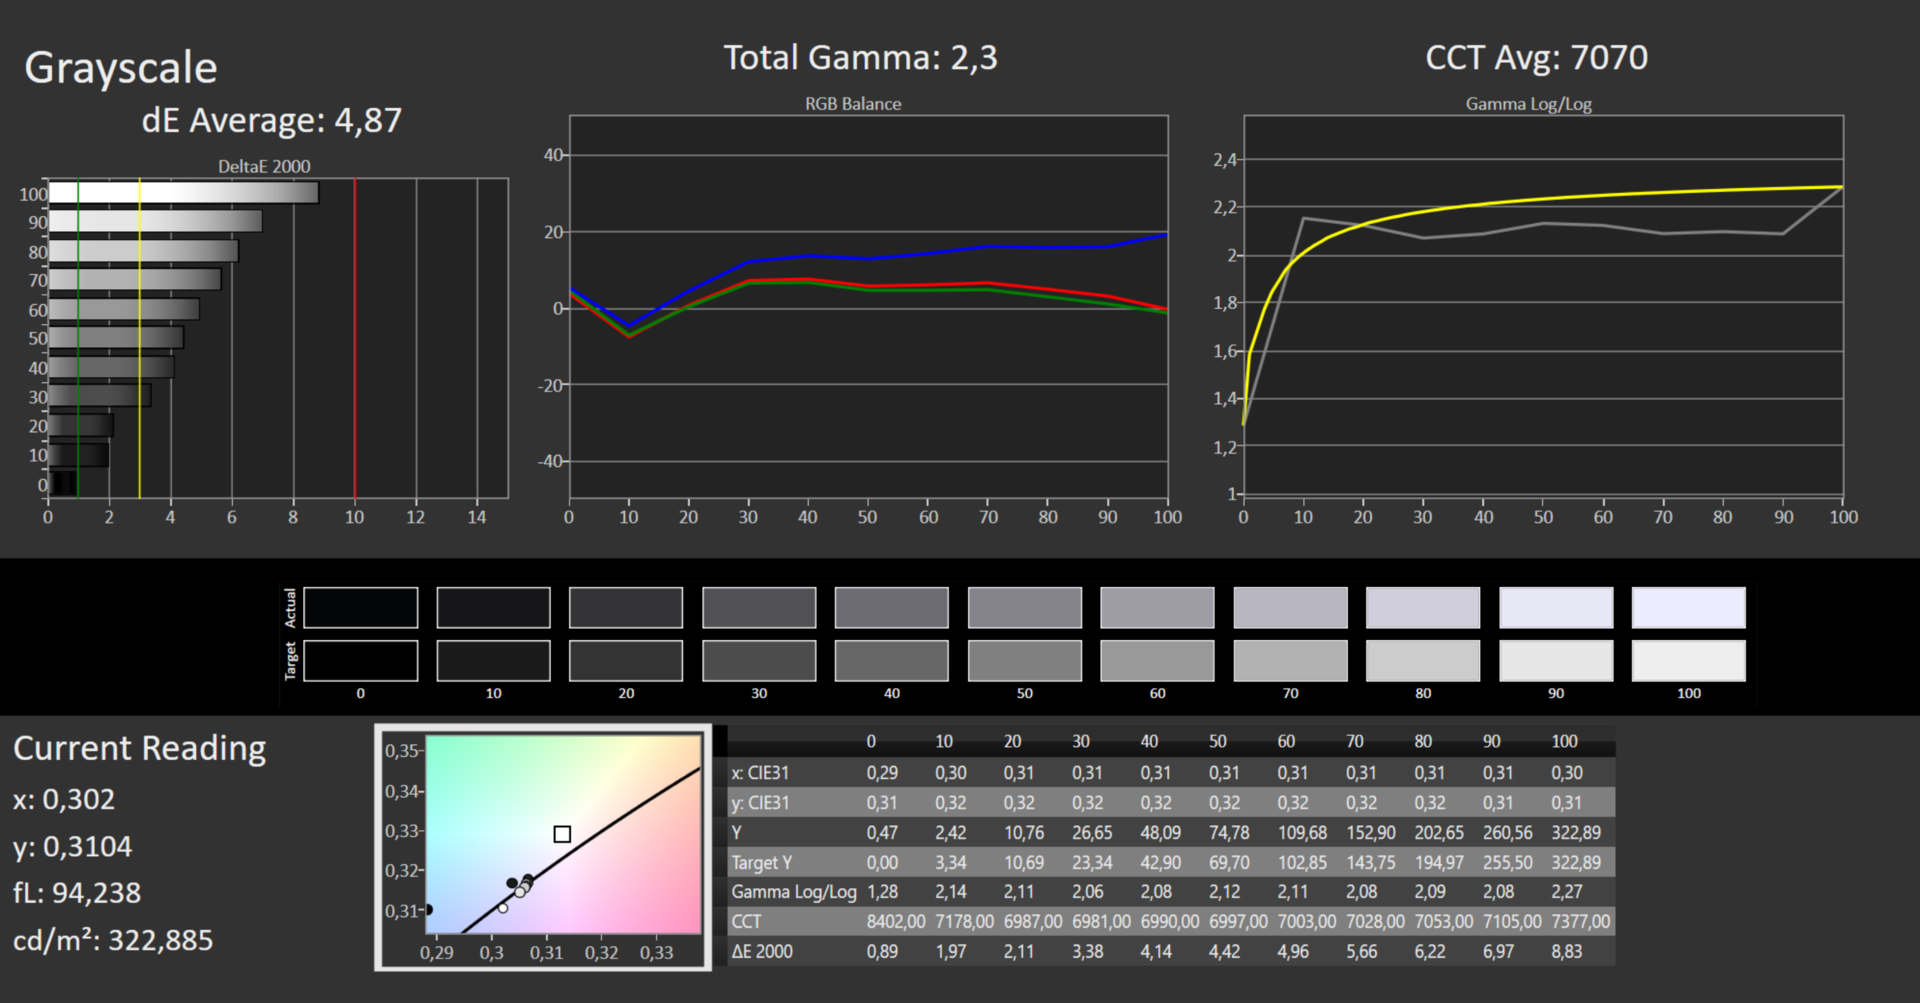
ΔE Greyscale Calman: 4.87 | ∀{0.09-98 Ø4.96}
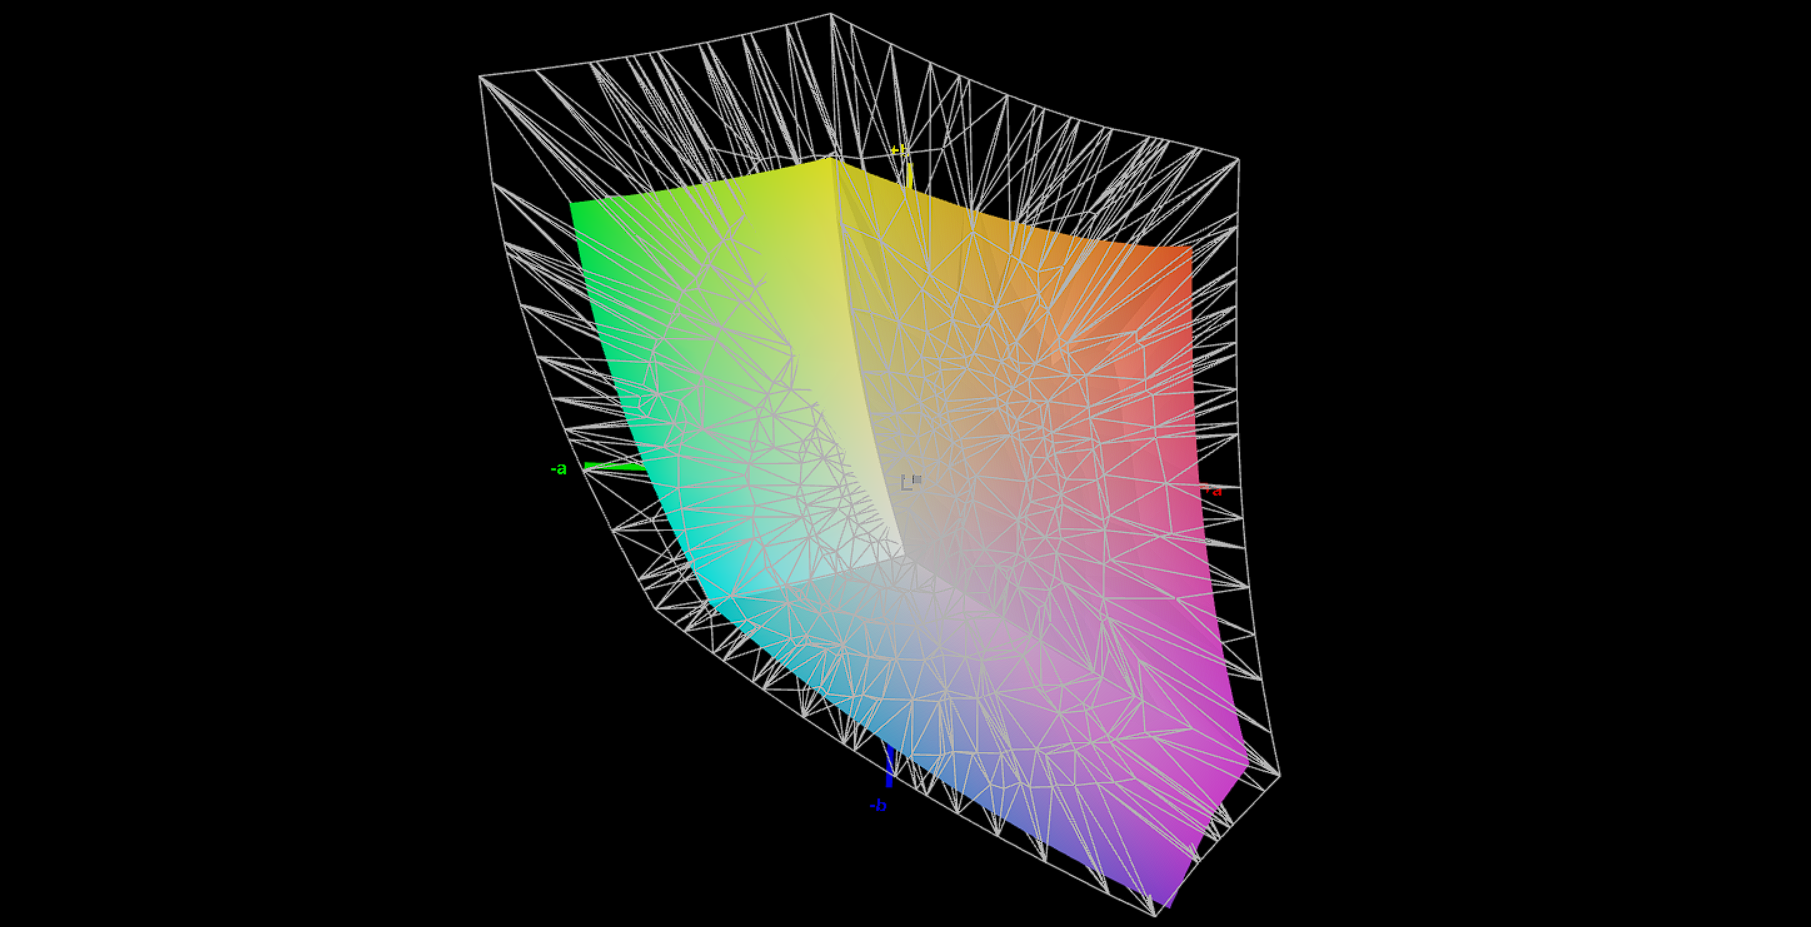
69.7% AdobeRGB 1998 (Argyll 3D)
98.1% sRGB (Argyll 3D)
68.8% Display P3 (Argyll 3D)
Gamma: 2.3
CCT: 7070 K
| Acer Nitro 5 AN515-46-R1A1 AU Optronics B156HAN12.H, IPS, 1920x1080, 15.6" | MSI Katana GF66 12UGS AU Optronics AUOAF90, IPS, 1920x1080, 15.6" | Schenker XMG Fusion 15 (Mid 22) BOE CQ NE156QHM-NY2, IPS, 2560x1440, 15.6" | Asus TUF Dash F15 FX517ZR BOE CQ NE156QHM-NY1, IPS, 2560x1440, 15.6" | Acer Nitro 5 AN515-58-72QR Chi Mei N156KME-GNA, IPS, 2560x1440, 15.6" | |
|---|---|---|---|---|---|
| Display | -42% | -2% | 23% | 21% | |
| Display P3 Coverage (%) | 68.8 | 39.1 -43% | 67.3 -2% | 98.4 43% | 95.6 39% |
| sRGB Coverage (%) | 98.1 | 58.3 -41% | 96.7 -1% | 99.9 2% | 99.8 2% |
| AdobeRGB 1998 Coverage (%) | 69.7 | 40.4 -42% | 68.2 -2% | 85.9 23% | 85.2 22% |
| Response Times | -232% | 12% | 20% | -24% | |
| Response Time Grey 50% / Grey 80% * (ms) | 13 ? | 40 ? -208% | 11.6 ? 11% | 5.6 ? 57% | 15.7 ? -21% |
| Response Time Black / White * (ms) | 8 ? | 28.4 ? -255% | 7 ? 12% | 9.4 ? -18% | 10.2 ? -27% |
| PWM Frequency (Hz) | |||||
| Screen | -55% | -15% | 9% | -2% | |
| Brightness middle (cd/m²) | 327 | 227 -31% | 326 0% | 286 -13% | 332 2% |
| Brightness (cd/m²) | 320 | 225 -30% | 303 -5% | 266 -17% | 303 -5% |
| Brightness Distribution (%) | 93 | 90 -3% | 89 -4% | 87 -6% | 86 -8% |
| Black Level * (cd/m²) | 0.24 | 0.21 12% | 0.33 -38% | 0.25 -4% | 0.29 -21% |
| Contrast (:1) | 1363 | 1081 -21% | 988 -28% | 1144 -16% | 1145 -16% |
| Colorchecker dE 2000 * | 3.26 | 4.19 -29% | 2.73 16% | 2.14 34% | 3.61 -11% |
| Colorchecker dE 2000 max. * | 8.73 | 17.45 -100% | 9.54 -9% | 5.22 40% | 7.71 12% |
| Colorchecker dE 2000 calibrated * | 0.87 | 3.81 -338% | 1.36 -56% | 0.67 23% | 0.59 32% |
| Greyscale dE 2000 * | 4.87 | 2.7 45% | 5.2 -7% | 2.8 43% | 5.2 -7% |
| Gamma | 2.3 96% | 2.208 100% | 2.074 106% | 2.23 99% | 2.155 102% |
| CCT | 7070 92% | 6176 105% | 6911 94% | 7092 92% | 6724 97% |
| Moyenne finale (programmes/paramètres) | -110% /
-77% | -2% /
-8% | 17% /
14% | -2% /
-1% |
* ... Moindre est la valeur, meilleures sont les performances
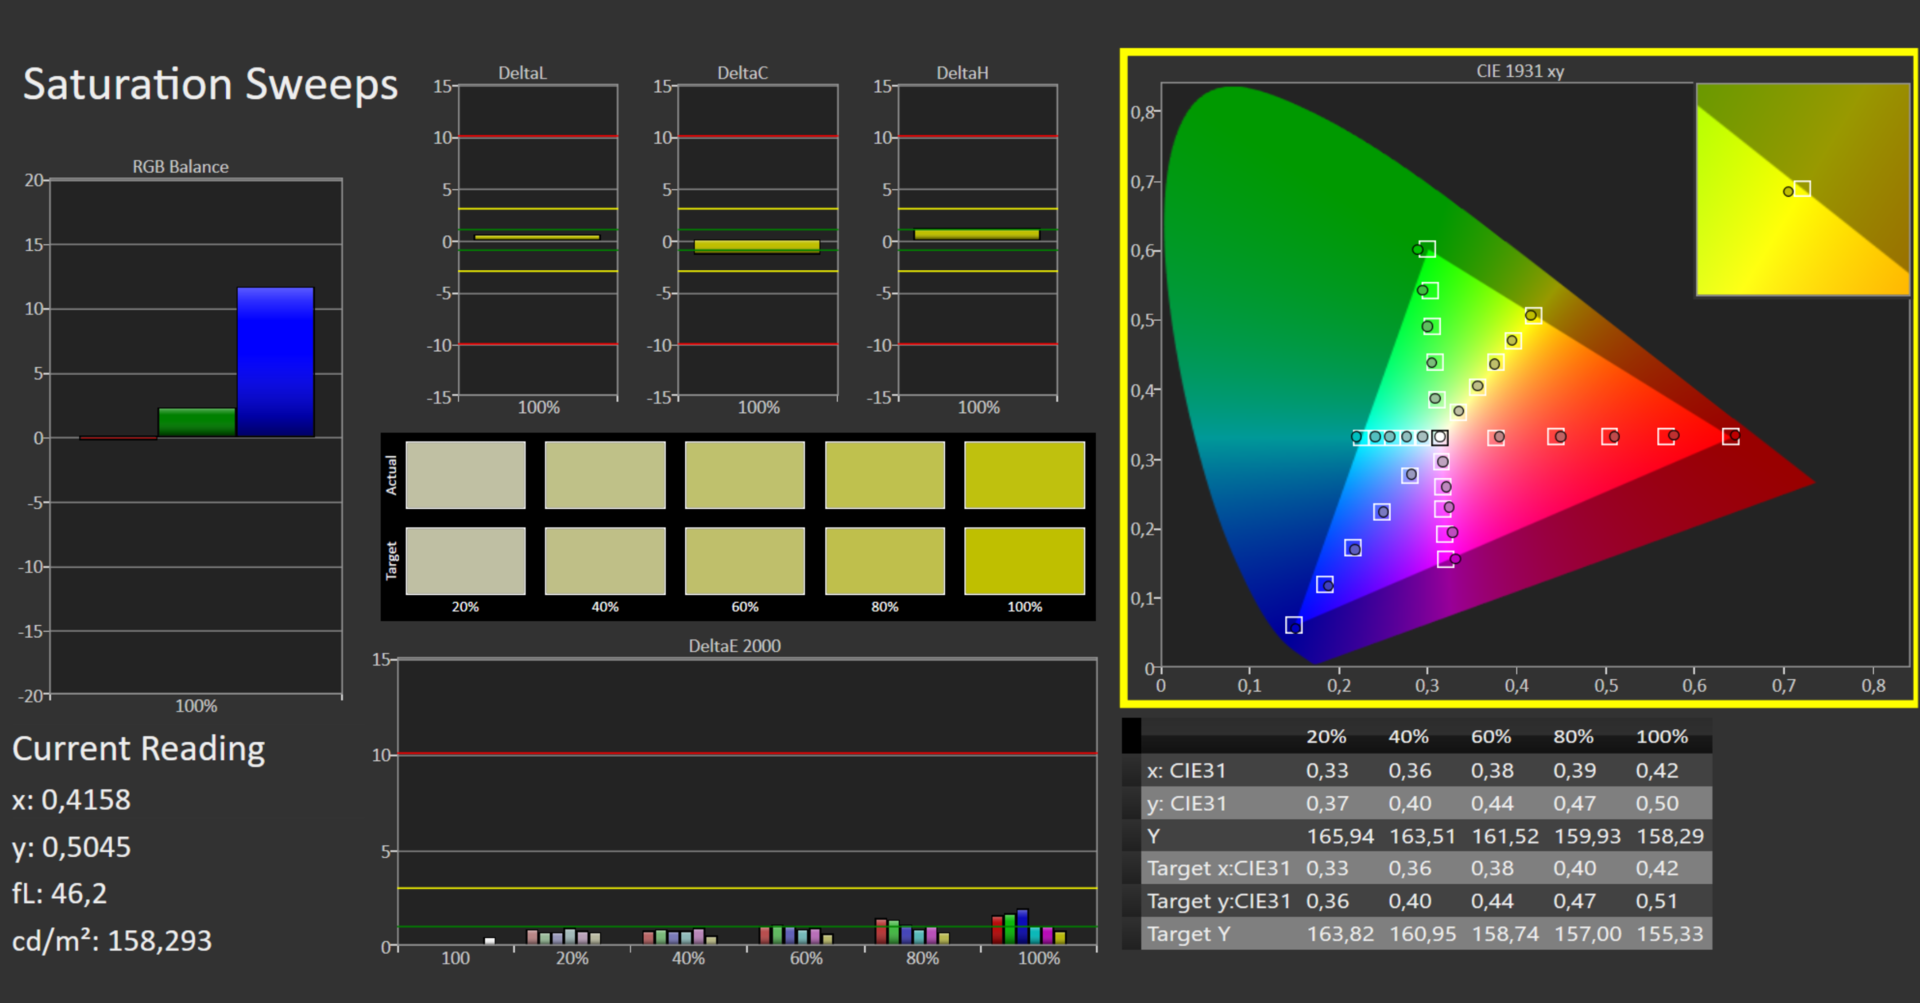
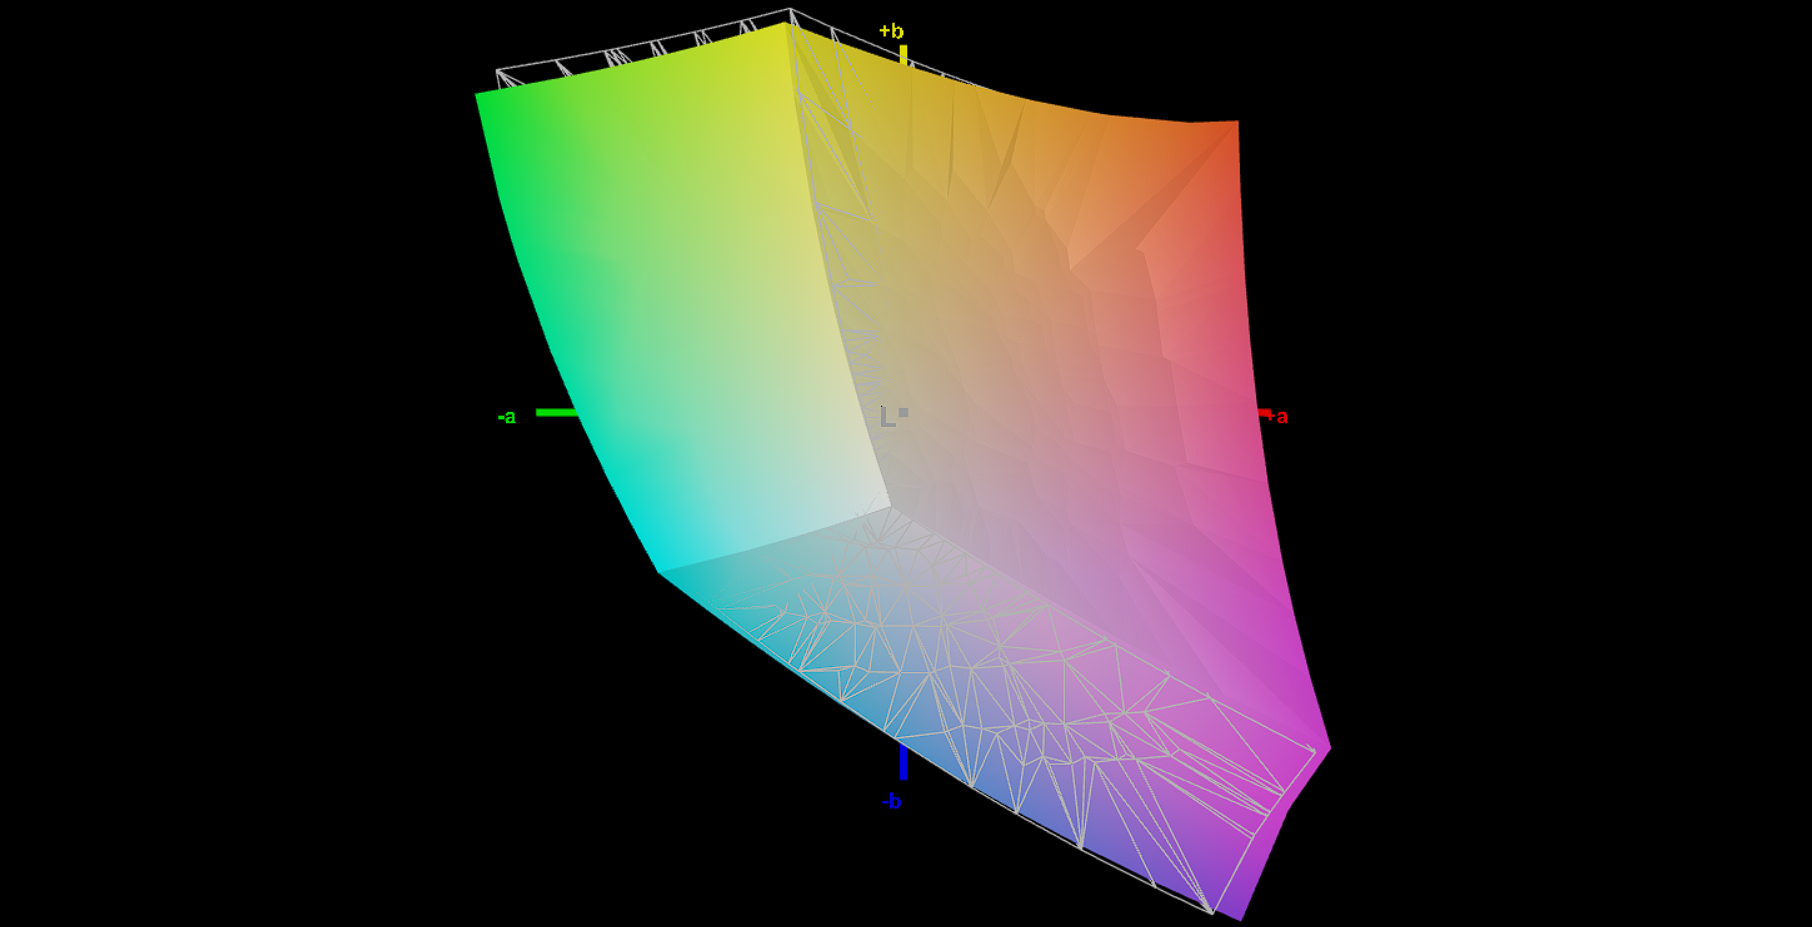
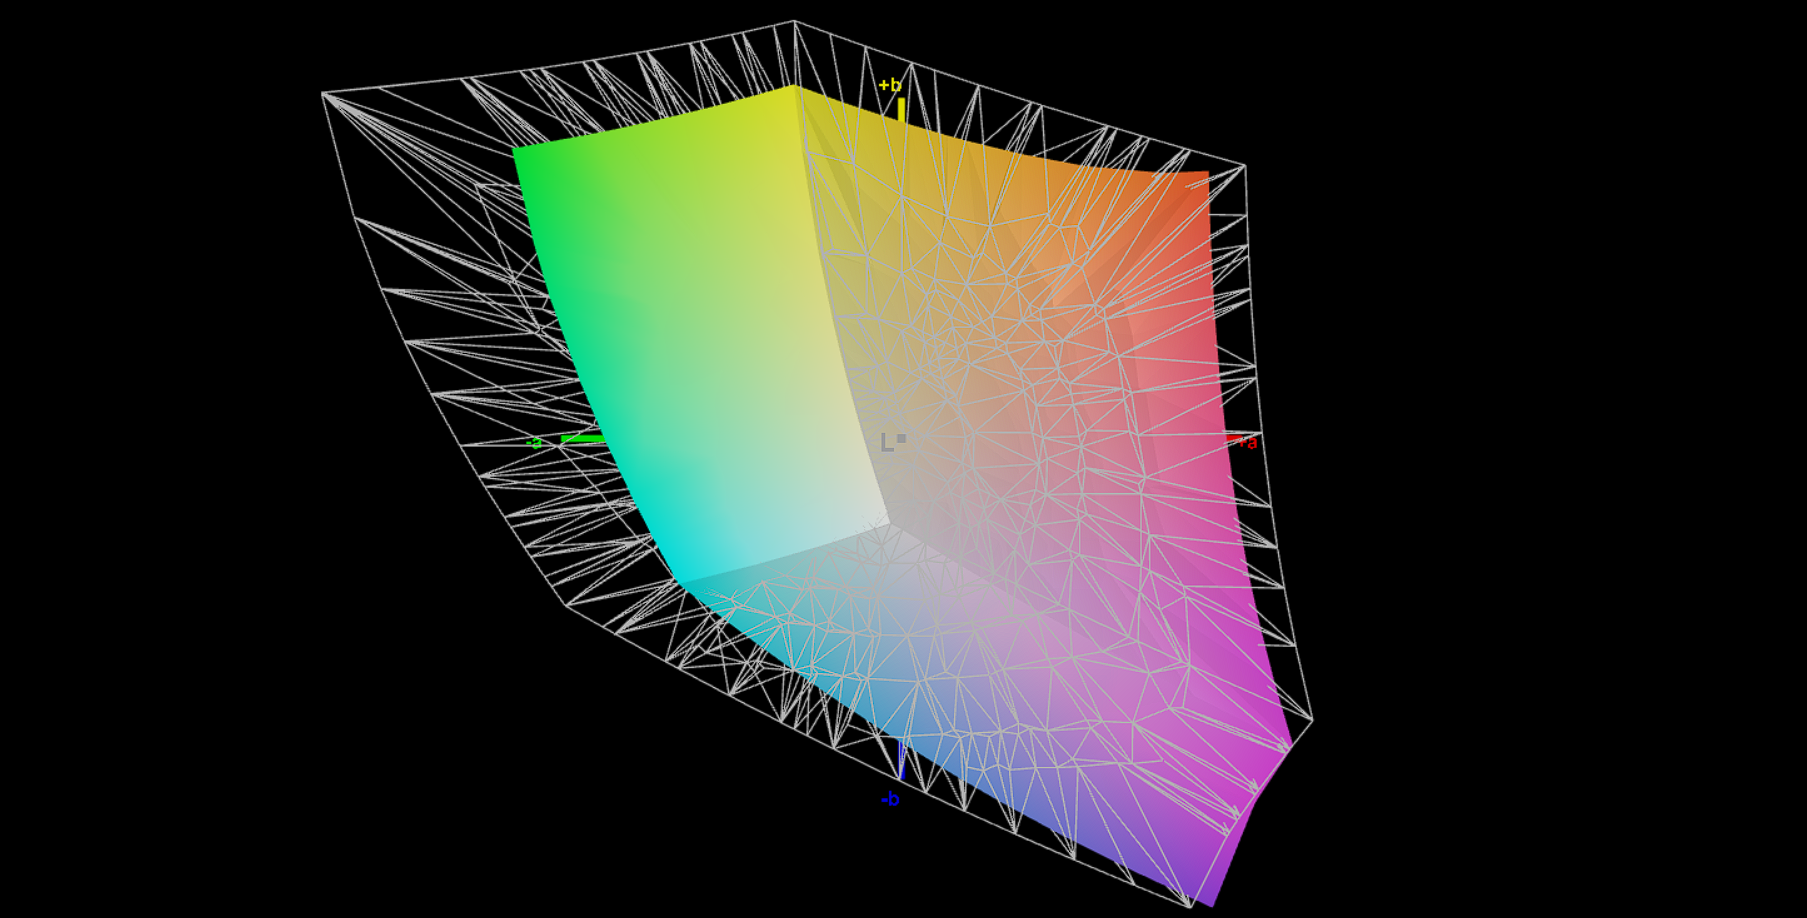
L'écran affiche les couleurs assez bien en sortie d'usine. Nous avons mesuré une déviation des couleurs de 3,26, ce qui est à peine supérieur à la valeur idéale (DeltaE < 3). Le calibrage de l'écran réduit la déviation à 0,87 et fait apparaître les niveaux de gris plus uniformes. L'écran peut afficher la quasi-totalité de l'espace couleur sRGB (98,1 %) et couvre 70 % de l'espace AdobeRGB et 69 % de l'espace DCI-P3. La dalle QHD du modèle jumeau offre une meilleure couverture globale de l'espace colorimétrique.
Vous pouvez télécharger et utiliser gratuitement le profil de couleur que nous avons créé. Le lien se trouve dans la boîte d'information ci-dessus.
Temps de réponse de l'écran
| ↔ Temps de réponse noir à blanc | ||
|---|---|---|
| 8 ms ... hausse ↗ et chute ↘ combinées | ↗ 4 ms hausse |  |
| ↘ 4 ms chute | ||
| L'écran montre de faibles temps de réponse, un bon écran pour jouer. En comparaison, tous les appareils testés affichent entre 0.1 (minimum) et 240 (maximum) ms. » 22 % des appareils testés affichent de meilleures performances. Cela signifie que les latences relevées sont meilleures que la moyenne (19.8 ms) de tous les appareils testés. | ||
| ↔ Temps de réponse gris 50% à gris 80% | ||
| 13 ms ... hausse ↗ et chute ↘ combinées | ↗ 6 ms hausse |  |
| ↘ 7 ms chute | ||
| L'écran montre de bons temps de réponse, mais insuffisant pour du jeu compétitif. En comparaison, tous les appareils testés affichent entre 0.165 (minimum) et 636 (maximum) ms. » 27 % des appareils testés affichent de meilleures performances. Cela signifie que les latences relevées sont meilleures que la moyenne (31 ms) de tous les appareils testés. | ||
Scintillement / MLI (Modulation de largeur d'impulsion)
| Scintillement / MLI (Modulation de largeur d'impulsion) non décelé |  | ||
En comparaison, 52 % des appareils testés n'emploient pas MDI pour assombrir leur écran. Nous avons relevé une moyenne à 7754 (minimum : 5 - maximum : 343500) Hz dans le cas où une MDI était active. | |||


La dalle IPS offre des angles de vision stables et peut être lue depuis n'importe quelle position. Il peut également être utilisé en extérieur, à condition que le soleil ne soit pas trop fort.

Performance - Bloc-notes Nitro avec Ampère et Rembrandt
Le Nitro 5 AN515 d'Acer - un ordinateur portable de jeu de 15,6 pouces - est disponible dans toute une série de configurations et peut être équipé d'un processeur Intel ou AMD. La configuration d'entrée de gamme est actuellement disponible pour environ 800 euros (Core i5-11400H, RTX 3050, 8 Go de RAM, 512 Go de SSD, pas de Windows). Le modèle le plus cher (Ryzen 9 6900HX, RTX 3070 Ti, 32 Go de RAM, 1 To SSD) est proposé à 2 400 euros.
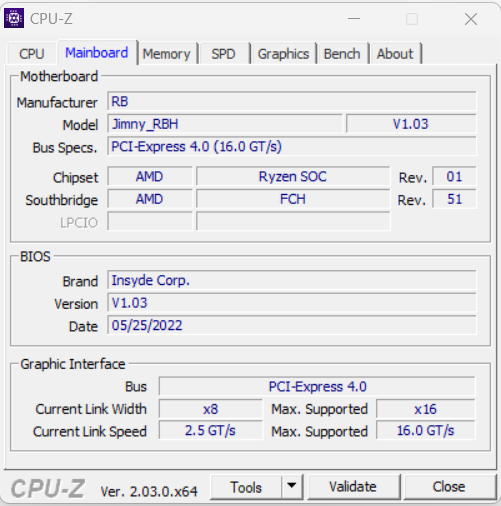
Conditions d'essai
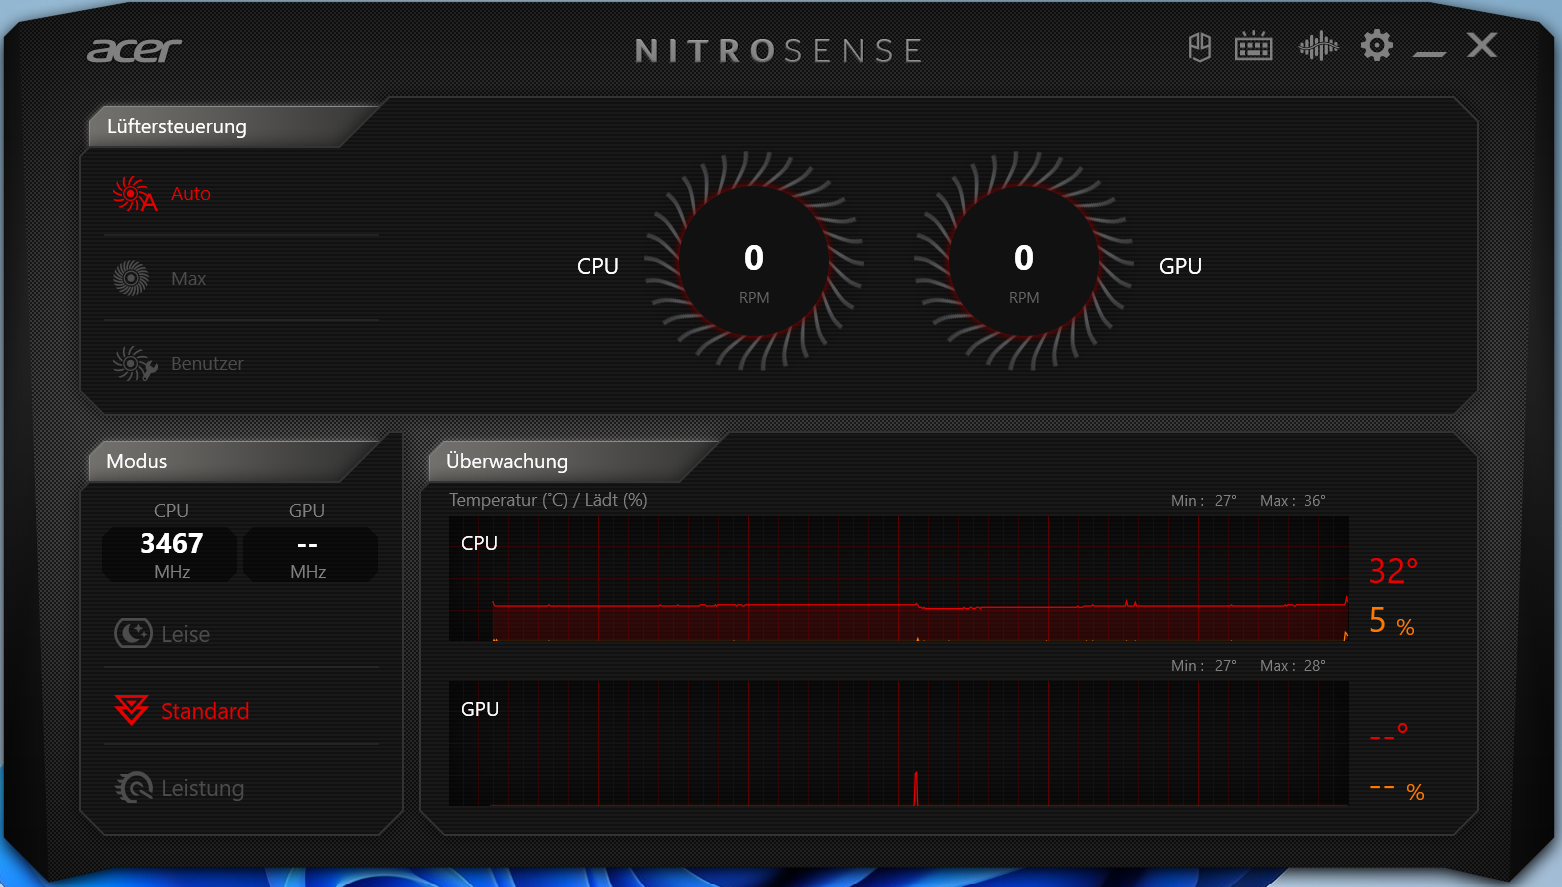
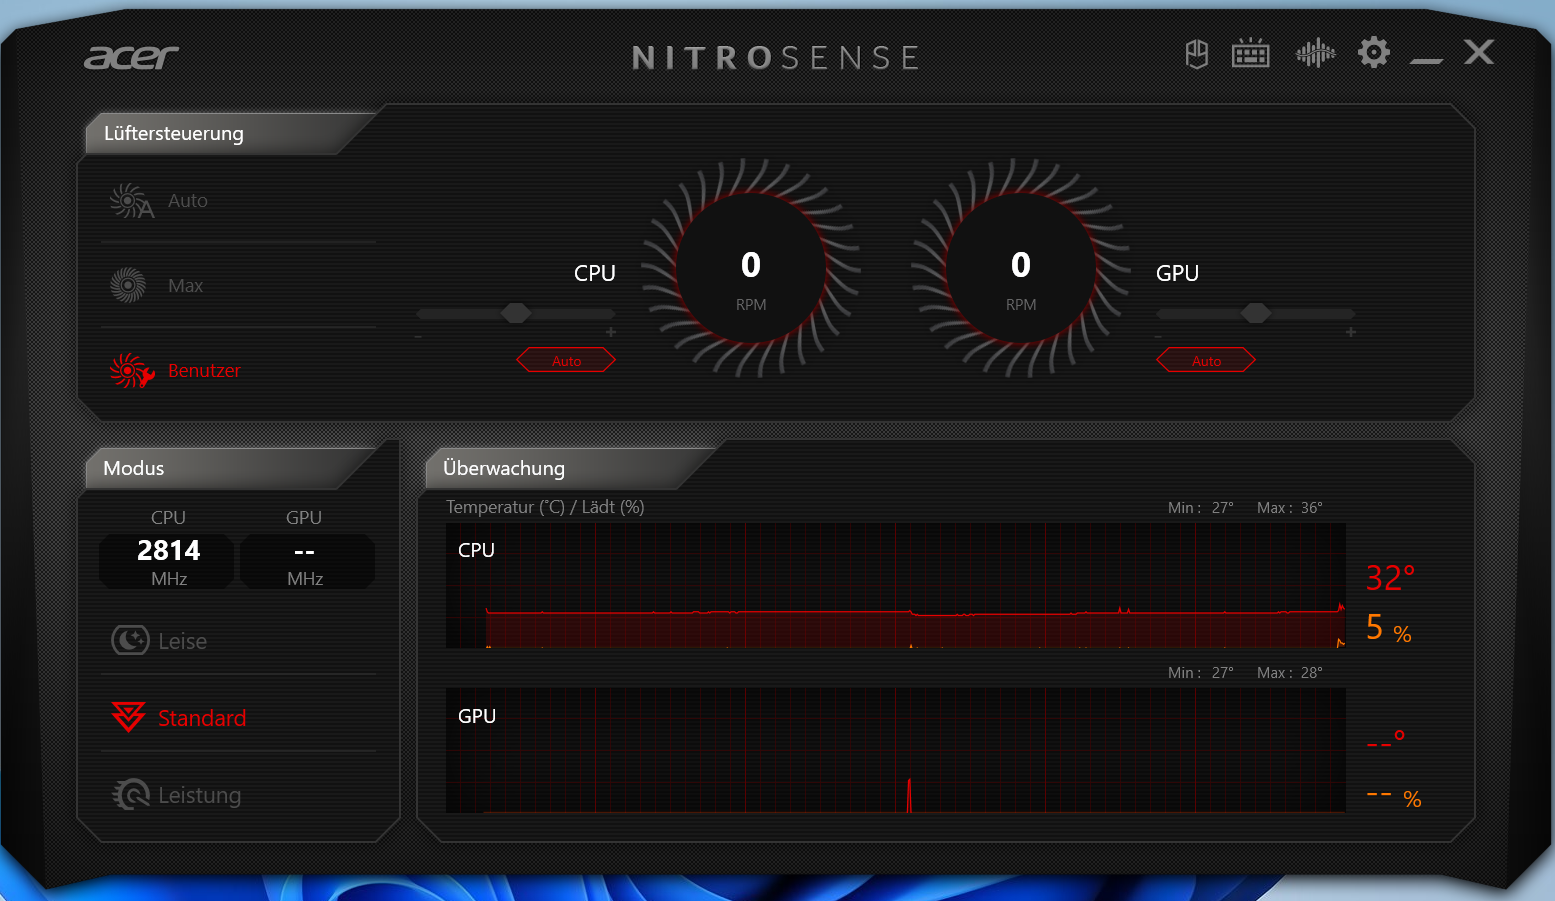
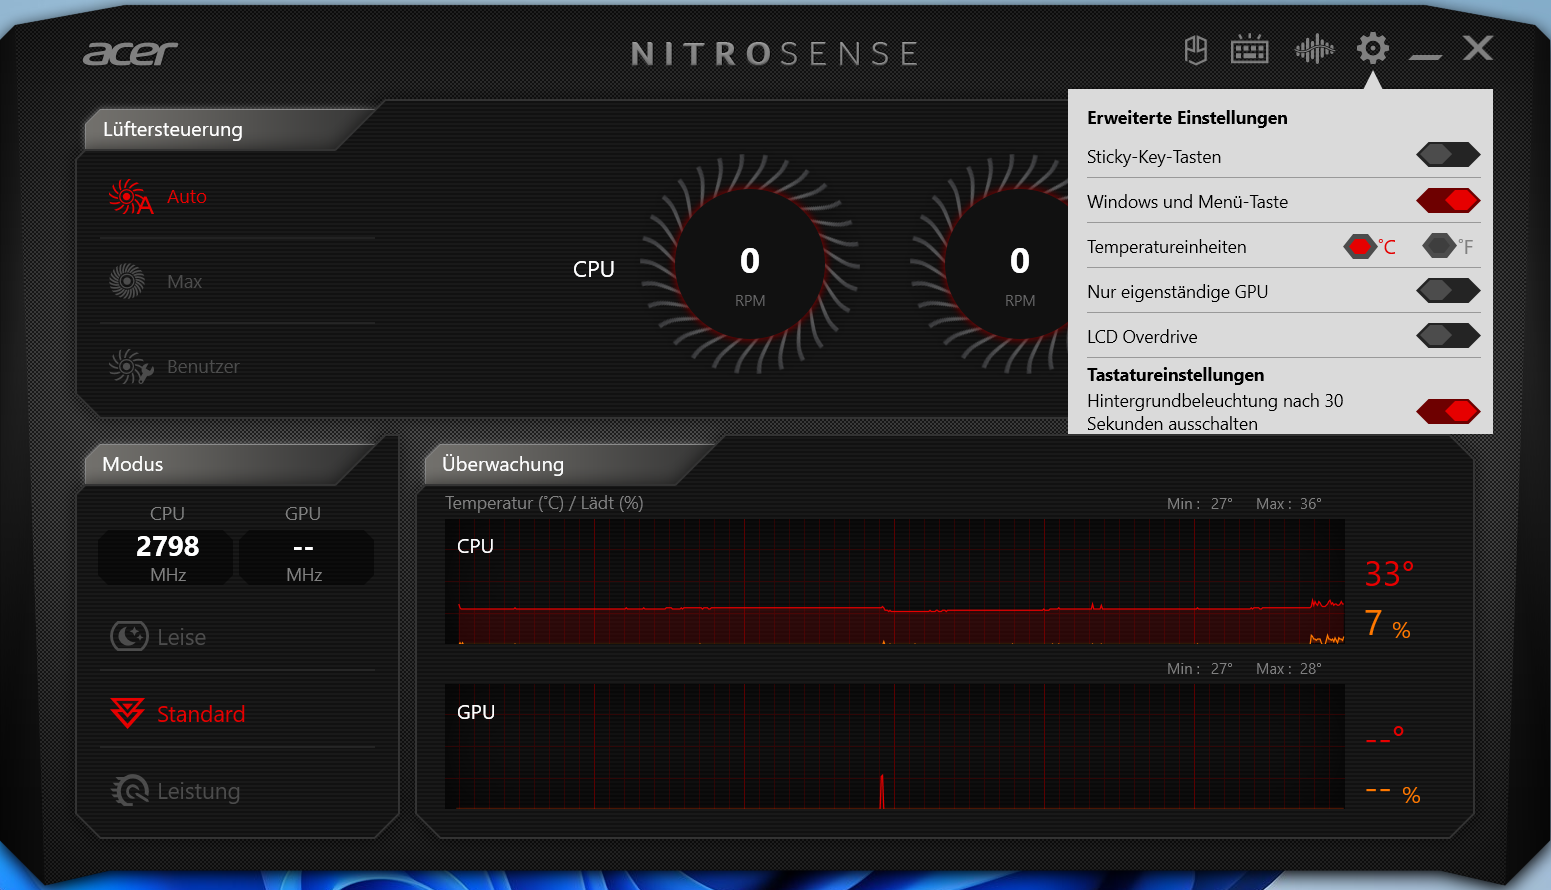
Le logiciel NitroSense préinstallé (le centre de contrôle de l'ordinateur portable, voir les images) peut être utilisé pour basculer entre les profils de performance définis par le fabricant ("performance", "standard" et "silencieux"). Nous avons effectué tous nos tests avec le profil "standard" et le contrôle du ventilateur réglé sur automatique. Les performances du CPU sont les mêmes dans tous les profils de performance ; les performances du GPU varient légèrement.
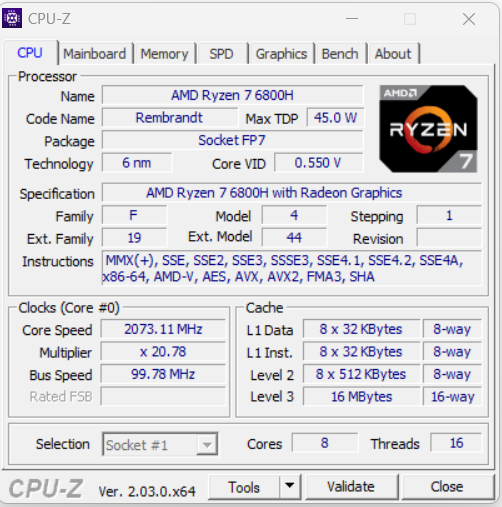
Processeur
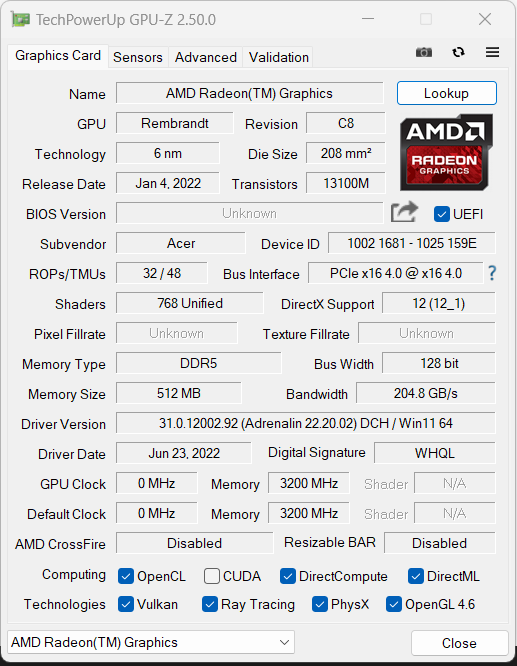
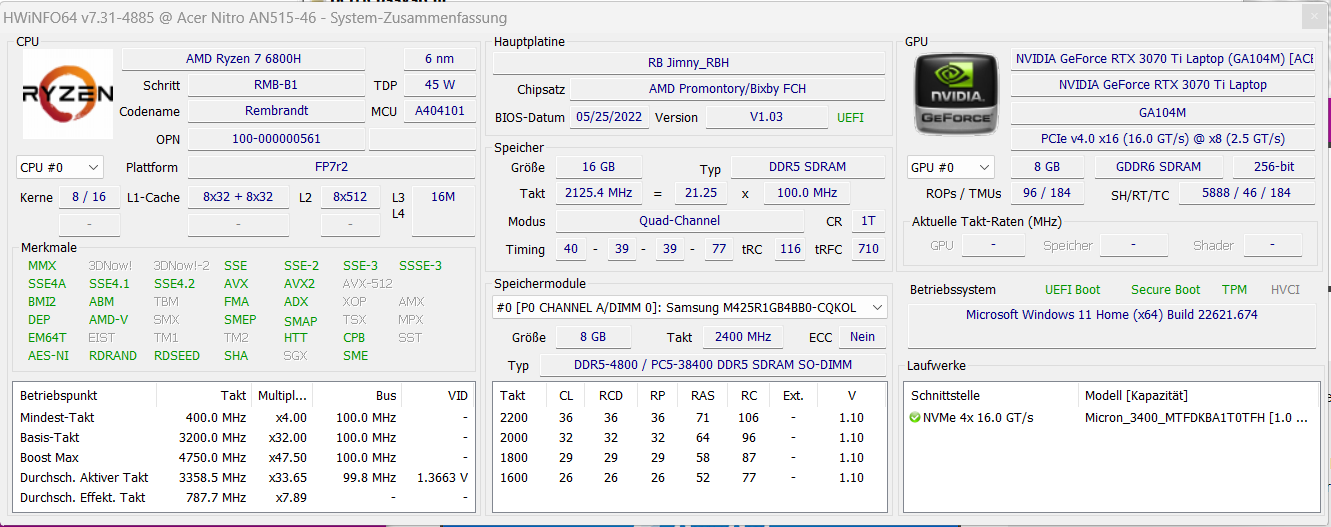
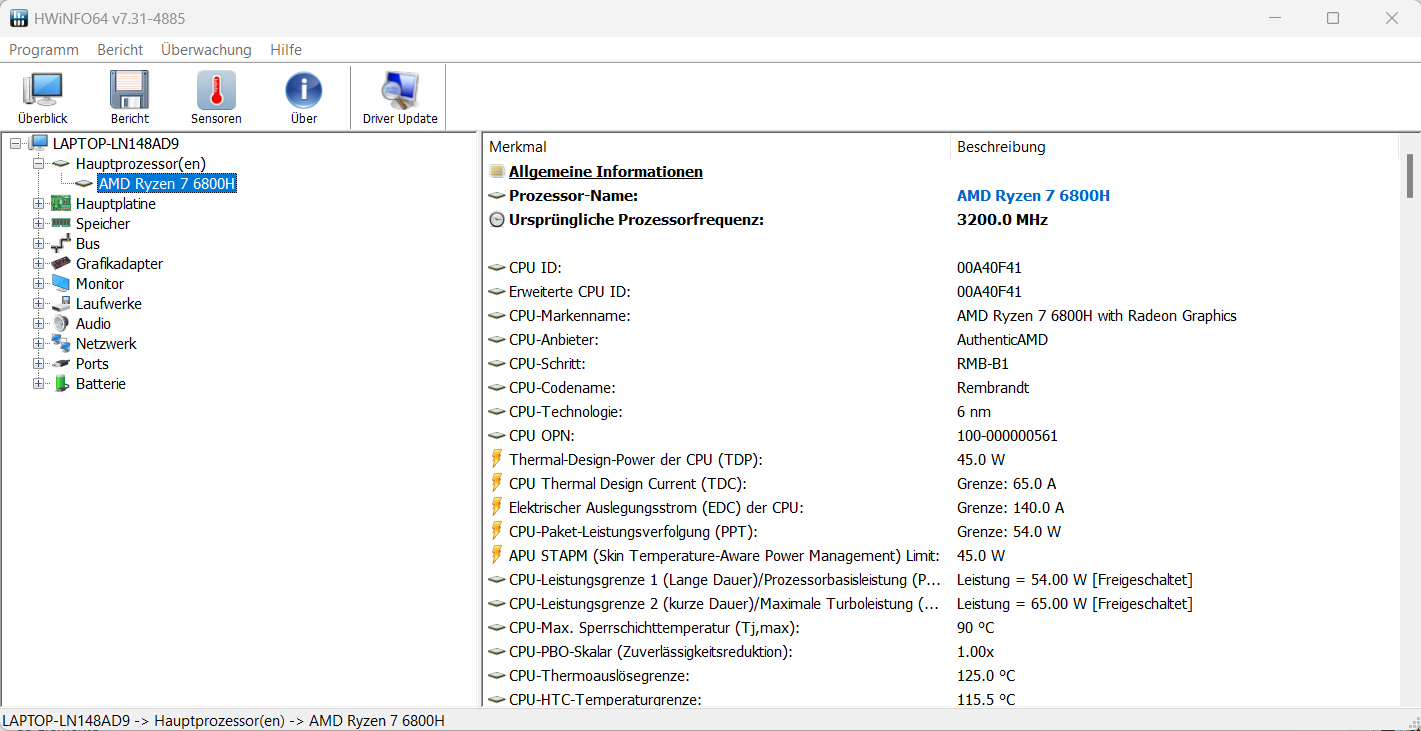
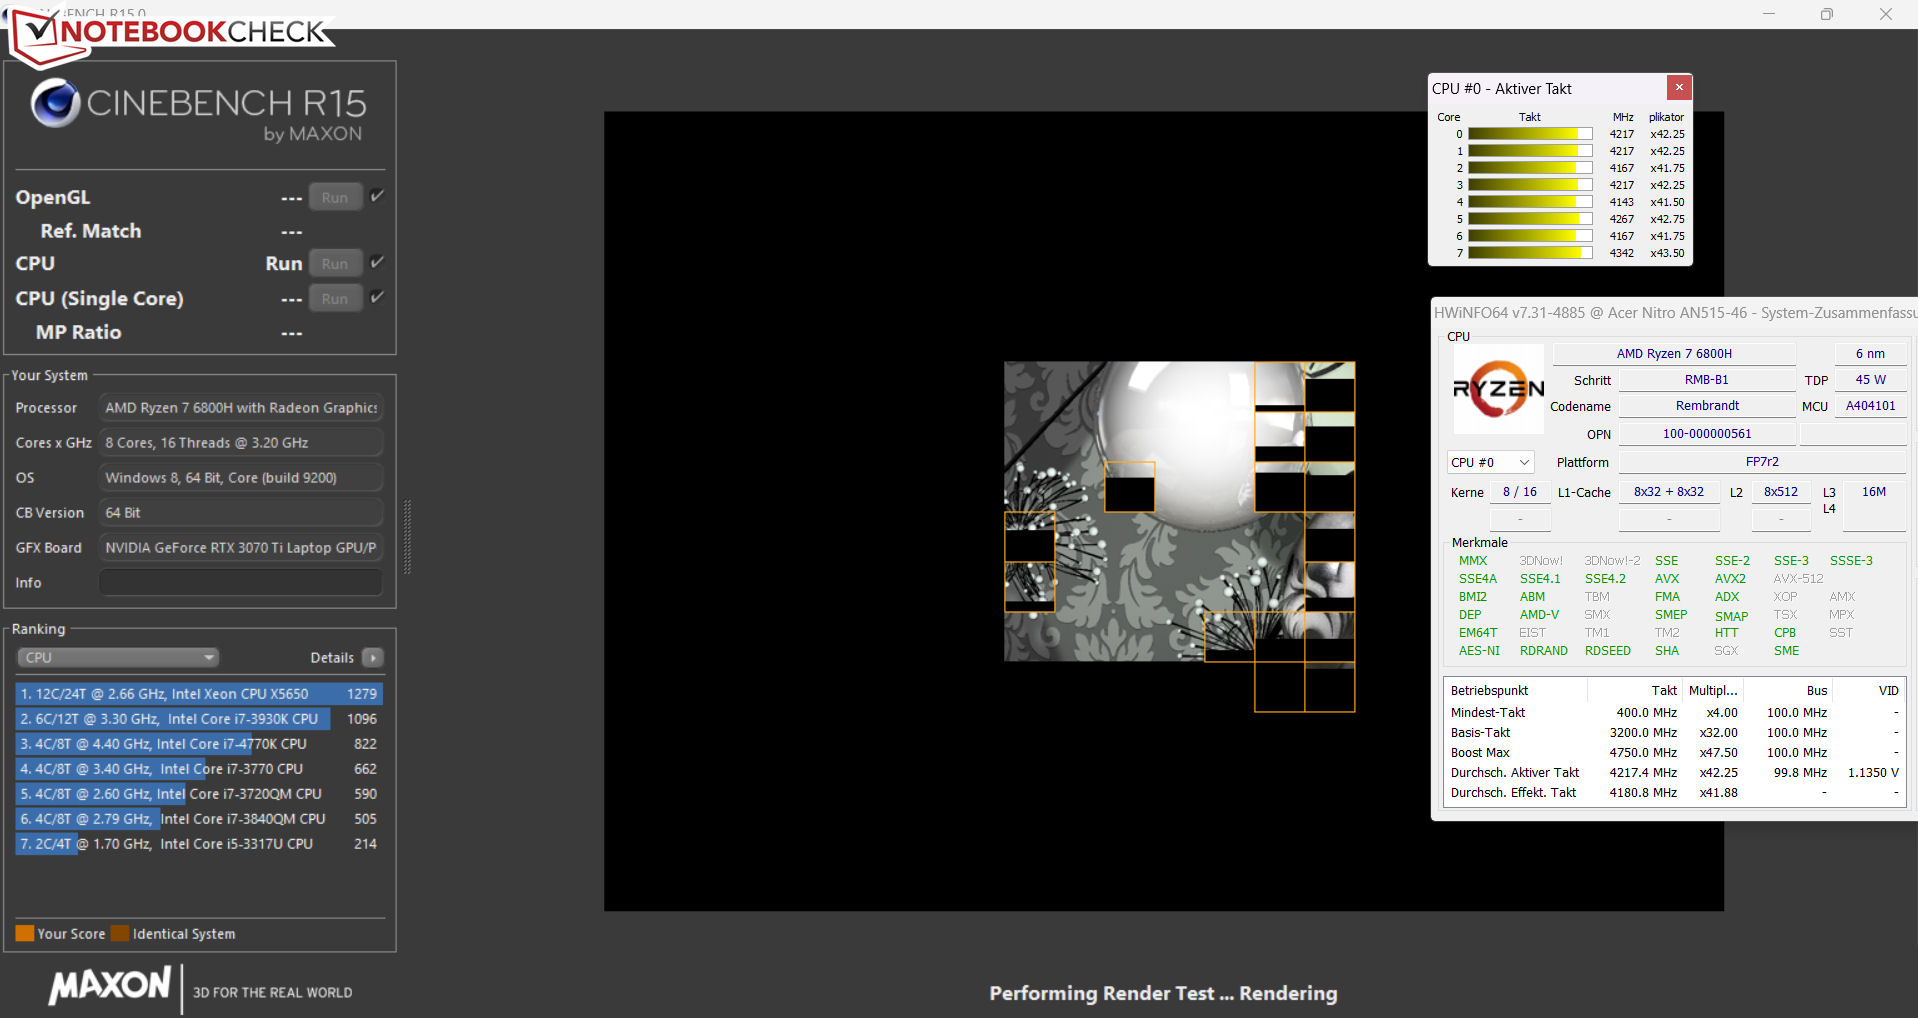
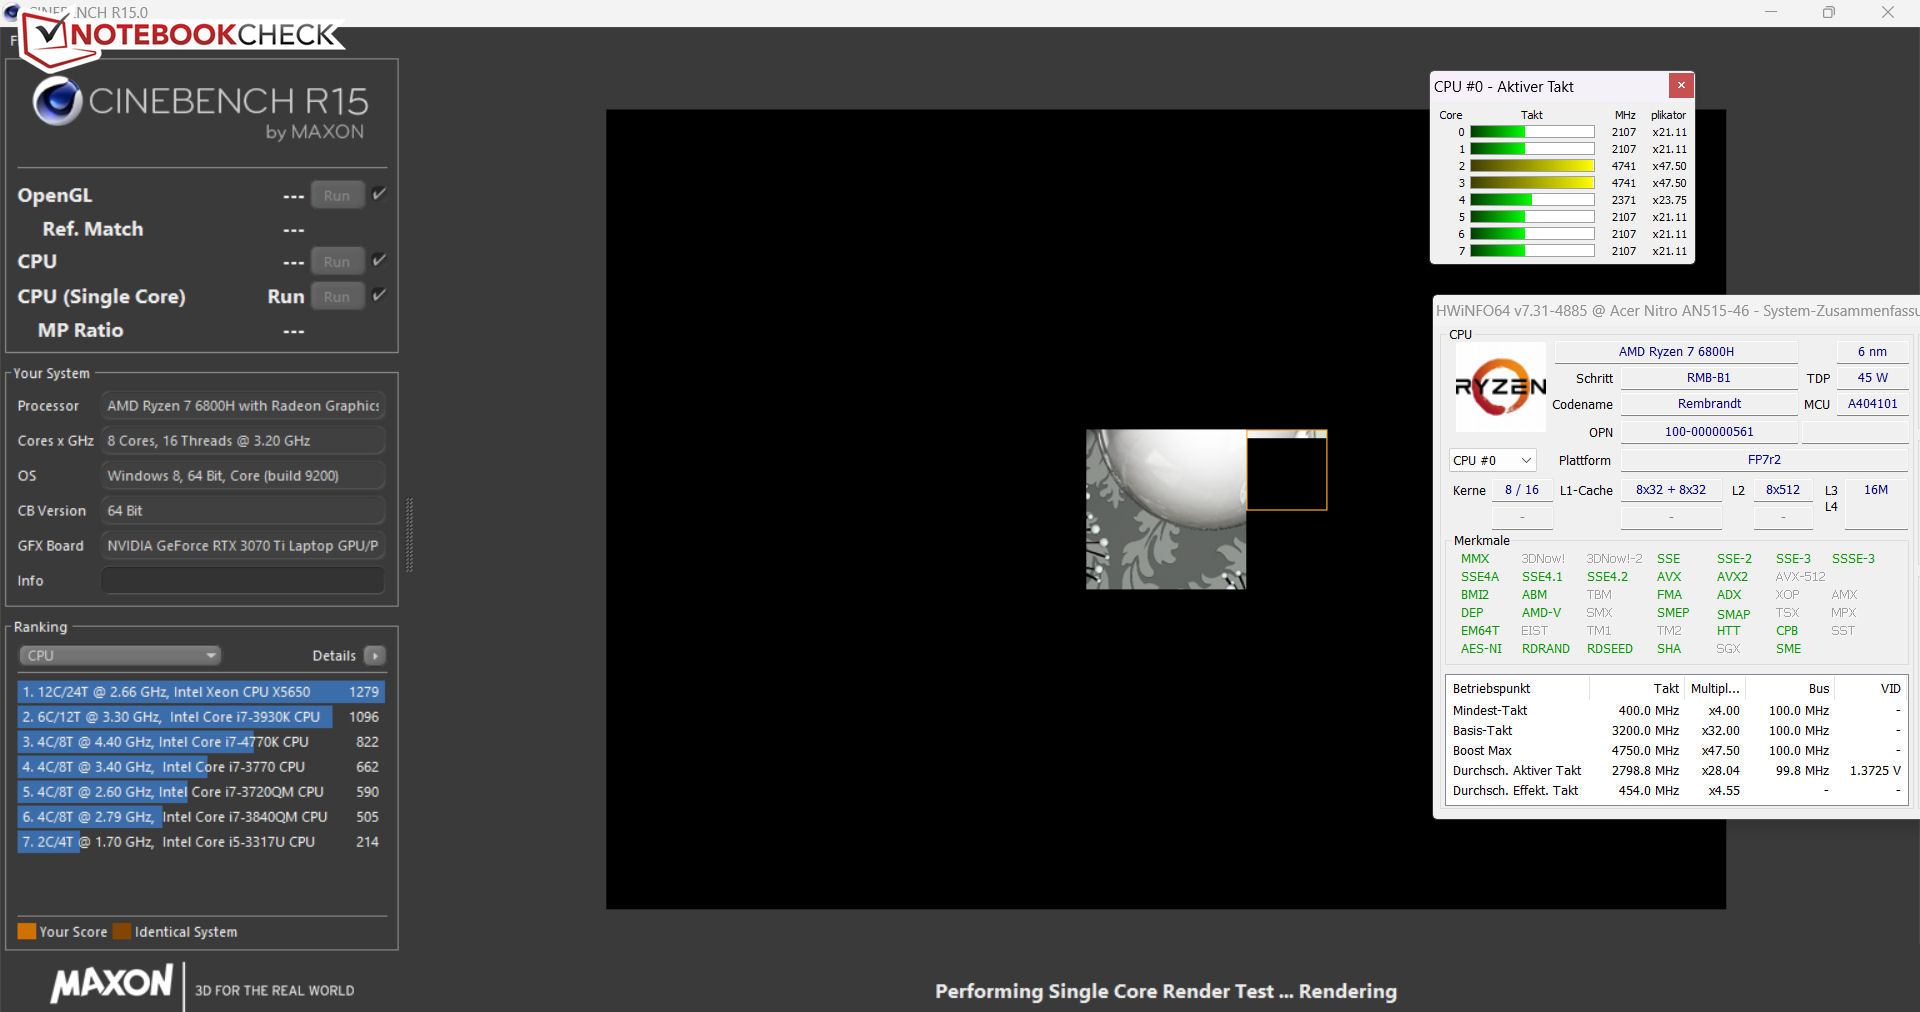
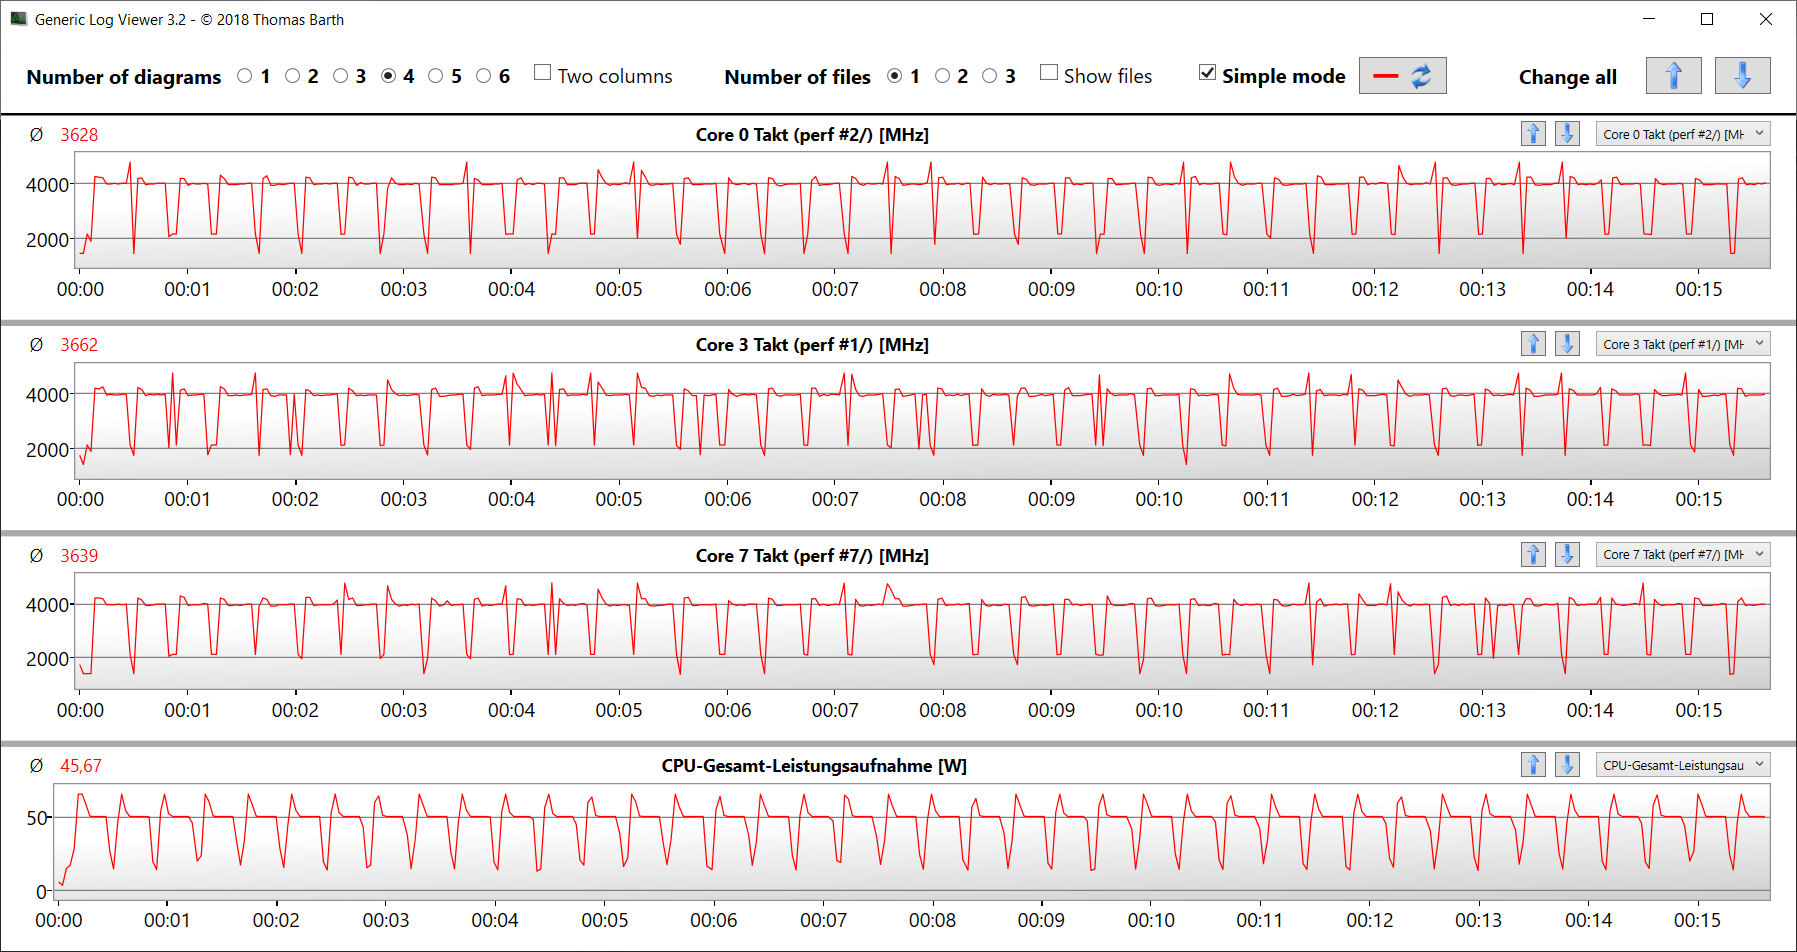
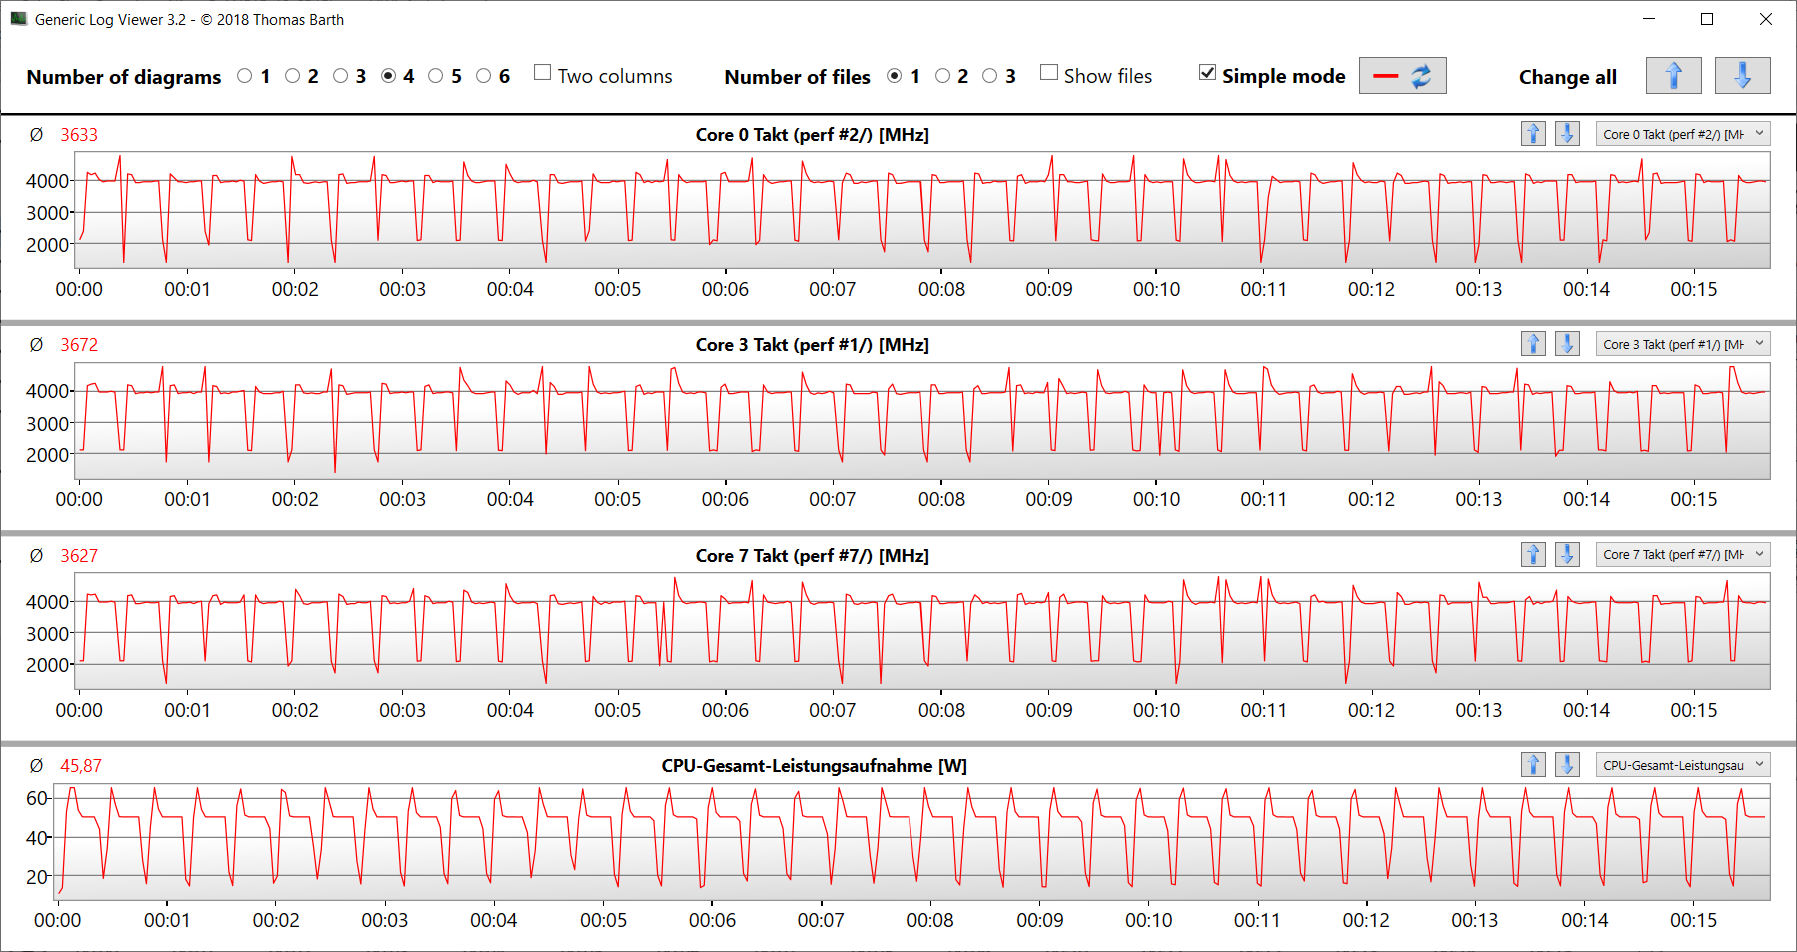
La partie CPU du Ryzen 7 6800H APU (Rembrandt) est constituée d'un processeur octa-core avec une fréquence d'horloge de base de 3,2 GHz. La fréquence d'horloge peut augmenter jusqu'à 4,75 GHz grâce au turbo. La puce prend en charge le multithreading simultané (fonctionnement de deux threads par cœur). Les résultats du benchmark du CPU sont les mêmes pour les trois profils de performance.
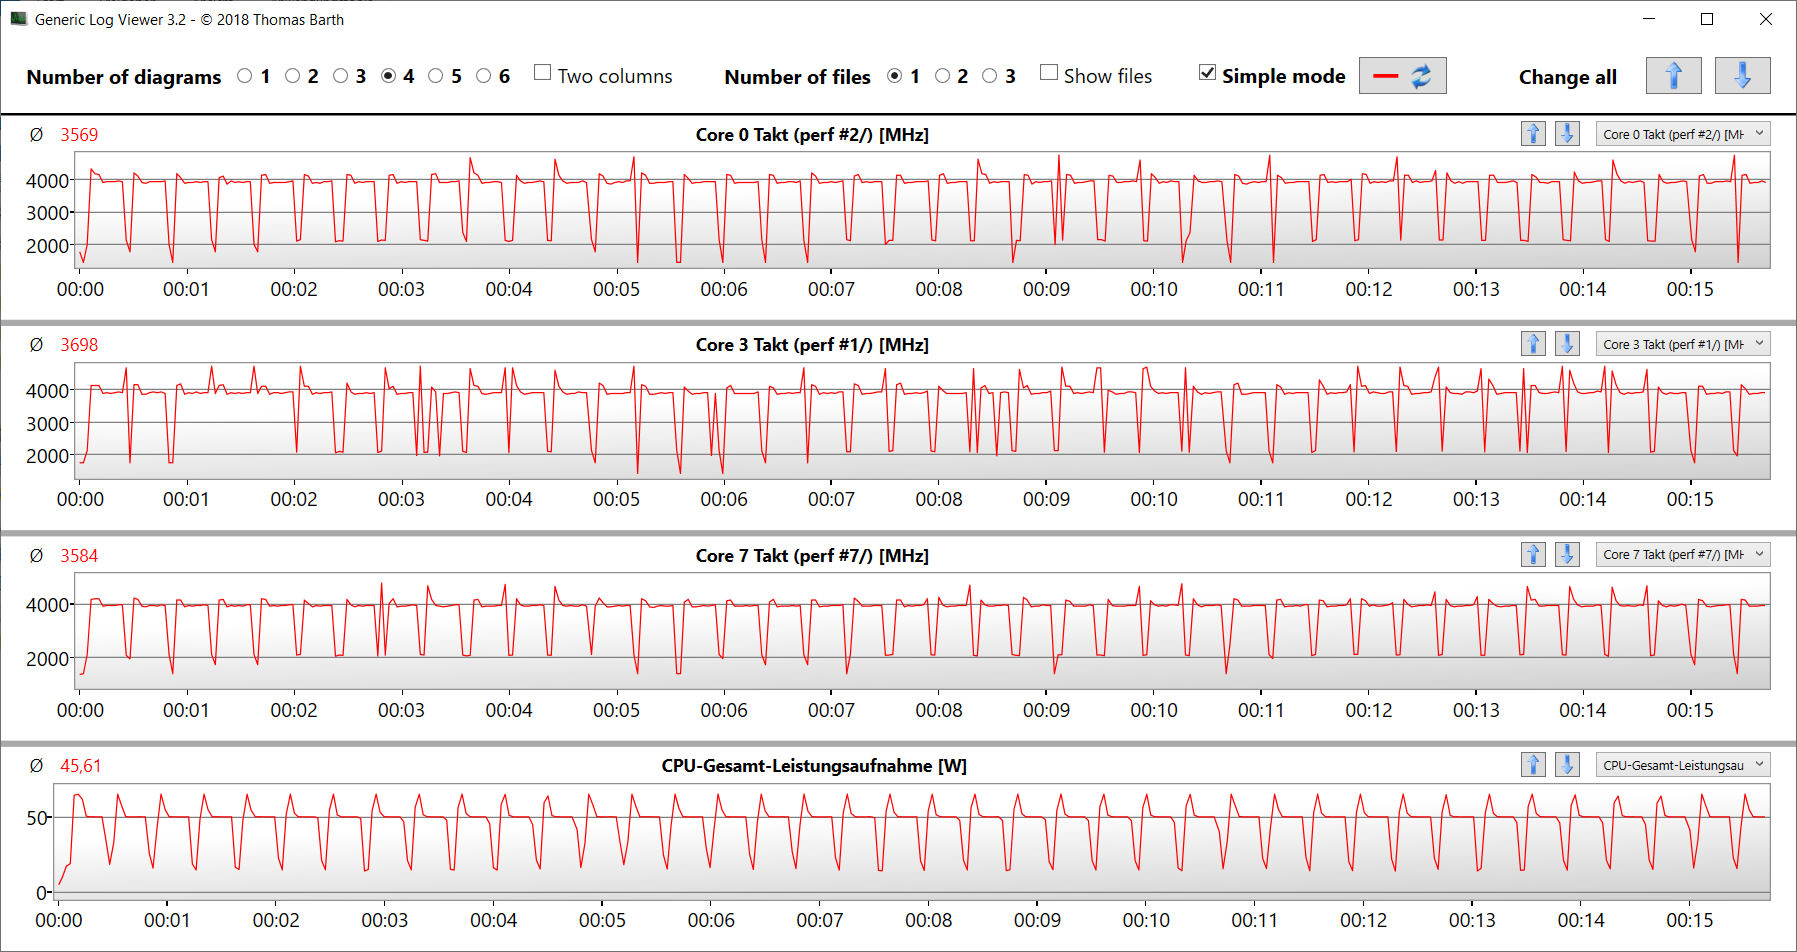
Le test multithread Cinebench R15 a donné des fréquences d'horloge comprises entre 4 et 4,2 GHz. Le test single-thread a été réalisé entre 2 et 4,75 GHz. Sur batterie, le CPU a tourné à 2,5 GHz (multithread) et de 1,2 à 2,5 GHz (single-thread). Le benchmark en boucle CB15 a confirmé que le CPU turbo peut être utilisé en continu.
Le processeur offre une bonne performance globale. Il se laisse parfois distancer par les processeurs Intel Alder Lake, surtout lorsqu'ils peuvent tirer parti de leurs cœurs de processeur supplémentaires.
Cinebench R15 Multi Loop
* ... Moindre est la valeur, meilleures sont les performances
AIDA64: FP32 Ray-Trace | FPU Julia | CPU SHA3 | CPU Queen | FPU SinJulia | FPU Mandel | CPU AES | CPU ZLib | FP64 Ray-Trace | CPU PhotoWorxx
| Performance rating | |
| Moyenne de la classe Gaming | |
| Acer Nitro 5 AN515-46-R1A1 | |
| Moyenne AMD Ryzen 7 6800H | |
| Schenker XMG Fusion 15 (Mid 22) | |
| Asus TUF Dash F15 FX517ZR | |
| MSI Katana GF66 12UGS | |
| Acer Nitro 5 AN515-58-72QR | |
| AIDA64 / FP32 Ray-Trace | |
| Moyenne de la classe Gaming (10227 - 85542, n=105, 2 dernières années) | |
| Acer Nitro 5 AN515-46-R1A1 | |
| Moyenne AMD Ryzen 7 6800H (12876 - 17031, n=8) | |
| Asus TUF Dash F15 FX517ZR | |
| Schenker XMG Fusion 15 (Mid 22) | |
| MSI Katana GF66 12UGS | |
| Acer Nitro 5 AN515-58-72QR | |
| AIDA64 / FPU Julia | |
| Moyenne de la classe Gaming (51376 - 238426, n=105, 2 dernières années) | |
| Acer Nitro 5 AN515-46-R1A1 | |
| Moyenne AMD Ryzen 7 6800H (82673 - 105987, n=8) | |
| Asus TUF Dash F15 FX517ZR | |
| Schenker XMG Fusion 15 (Mid 22) | |
| Acer Nitro 5 AN515-58-72QR | |
| MSI Katana GF66 12UGS | |
| AIDA64 / CPU SHA3 | |
| Moyenne de la classe Gaming (2180 - 10115, n=105, 2 dernières années) | |
| Schenker XMG Fusion 15 (Mid 22) | |
| Acer Nitro 5 AN515-46-R1A1 | |
| Moyenne AMD Ryzen 7 6800H (2886 - 3634, n=8) | |
| MSI Katana GF66 12UGS | |
| Acer Nitro 5 AN515-58-72QR | |
| Asus TUF Dash F15 FX517ZR | |
| AIDA64 / CPU Queen | |
| Moyenne de la classe Gaming (49785 - 173351, n=90, 2 dernières années) | |
| Acer Nitro 5 AN515-46-R1A1 | |
| MSI Katana GF66 12UGS | |
| Acer Nitro 5 AN515-58-72QR | |
| Moyenne AMD Ryzen 7 6800H (75117 - 106322, n=8) | |
| Asus TUF Dash F15 FX517ZR | |
| Schenker XMG Fusion 15 (Mid 22) | |
| AIDA64 / FPU SinJulia | |
| Moyenne de la classe Gaming (4424 - 33636, n=105, 2 dernières années) | |
| Acer Nitro 5 AN515-46-R1A1 | |
| Moyenne AMD Ryzen 7 6800H (11771 - 13120, n=8) | |
| Acer Nitro 5 AN515-58-72QR | |
| MSI Katana GF66 12UGS | |
| Schenker XMG Fusion 15 (Mid 22) | |
| Asus TUF Dash F15 FX517ZR | |
| AIDA64 / FPU Mandel | |
| Moyenne de la classe Gaming (25115 - 128721, n=105, 2 dernières années) | |
| Acer Nitro 5 AN515-46-R1A1 | |
| Moyenne AMD Ryzen 7 6800H (45287 - 58327, n=8) | |
| Schenker XMG Fusion 15 (Mid 22) | |
| Asus TUF Dash F15 FX517ZR | |
| Acer Nitro 5 AN515-58-72QR | |
| MSI Katana GF66 12UGS | |
| AIDA64 / CPU AES | |
| Schenker XMG Fusion 15 (Mid 22) | |
| Acer Nitro 5 AN515-46-R1A1 | |
| Moyenne AMD Ryzen 7 6800H (67816 - 137383, n=8) | |
| Moyenne de la classe Gaming (39258 - 247074, n=105, 2 dernières années) | |
| MSI Katana GF66 12UGS | |
| Asus TUF Dash F15 FX517ZR | |
| Acer Nitro 5 AN515-58-72QR | |
| AIDA64 / CPU ZLib | |
| Moyenne de la classe Gaming (574 - 2531, n=105, 2 dernières années) | |
| Acer Nitro 5 AN515-58-72QR | |
| MSI Katana GF66 12UGS | |
| Asus TUF Dash F15 FX517ZR | |
| Acer Nitro 5 AN515-46-R1A1 | |
| Moyenne AMD Ryzen 7 6800H (732 - 901, n=8) | |
| Schenker XMG Fusion 15 (Mid 22) | |
| AIDA64 / FP64 Ray-Trace | |
| Moyenne de la classe Gaming (5509 - 45446, n=105, 2 dernières années) | |
| Acer Nitro 5 AN515-46-R1A1 | |
| Moyenne AMD Ryzen 7 6800H (6917 - 8980, n=8) | |
| Asus TUF Dash F15 FX517ZR | |
| Schenker XMG Fusion 15 (Mid 22) | |
| Acer Nitro 5 AN515-58-72QR | |
| MSI Katana GF66 12UGS | |
| AIDA64 / CPU PhotoWorxx | |
| Moyenne de la classe Gaming (12271 - 89891, n=105, 2 dernières années) | |
| Asus TUF Dash F15 FX517ZR | |
| Moyenne AMD Ryzen 7 6800H (26496 - 30360, n=8) | |
| Acer Nitro 5 AN515-46-R1A1 | |
| MSI Katana GF66 12UGS | |
| Schenker XMG Fusion 15 (Mid 22) | |
| Acer Nitro 5 AN515-58-72QR | |
Performance du système
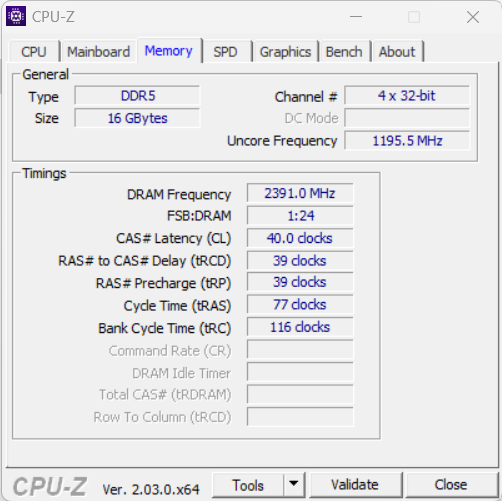
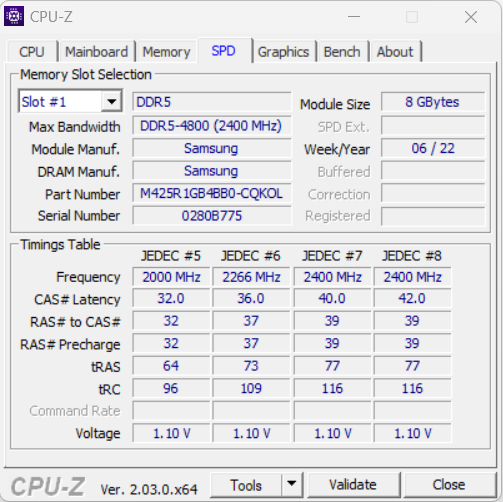
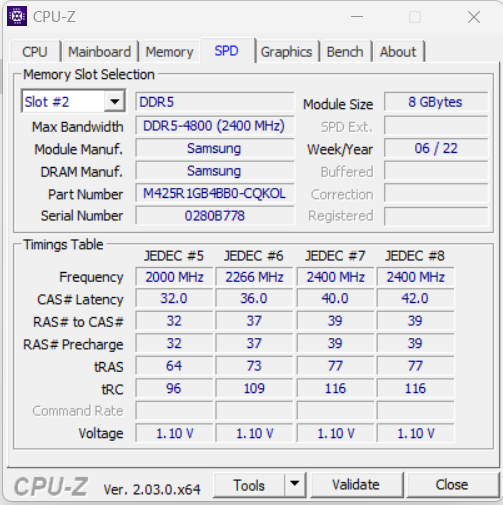
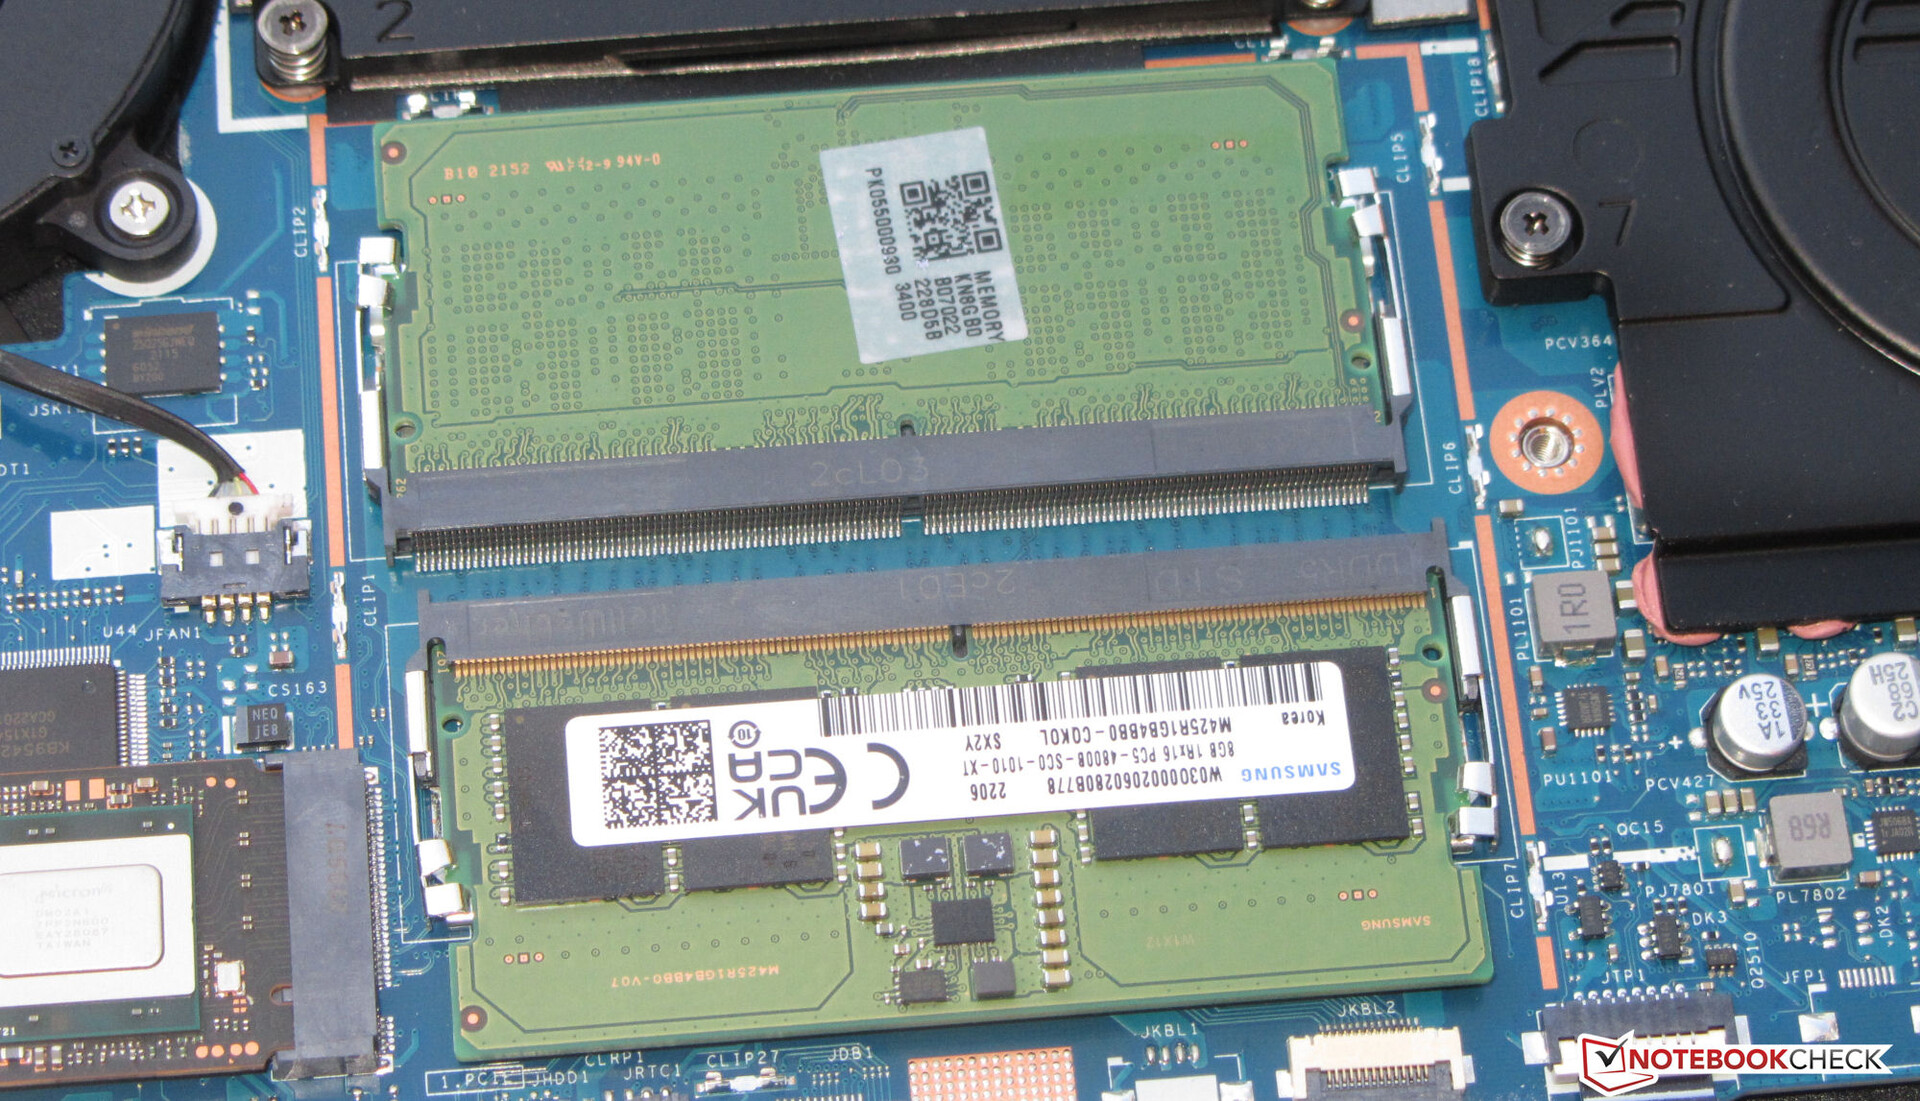
Le système bien équilibré et fluide offre une puissance de calcul suffisante pour les applications exigeantes telles que le rendu, le traitement vidéo et les jeux. Les résultats de PCMark sont bons. Les taux de transfert de la RAM (DDR5-4800) sont légèrement inférieurs à ceux d'ordinateurs portables comparables tels que le Asus TUF Dash F15.
CrossMark: Overall | Productivity | Creativity | Responsiveness
| PCMark 10 / Score | |
| Moyenne de la classe Gaming (5828 - 12414, n=93, 2 dernières années) | |
| MSI Katana GF66 12UGS | |
| Moyenne AMD Ryzen 7 6800H, NVIDIA GeForce RTX 3070 Ti Laptop GPU (6783 - 7549, n=2) | |
| Acer Nitro 5 AN515-58-72QR | |
| Asus TUF Dash F15 FX517ZR | |
| Acer Nitro 5 AN515-46-R1A1 | |
| Schenker XMG Fusion 15 (Mid 22) | |
| PCMark 10 / Essentials | |
| Moyenne de la classe Gaming (8810 - 11935, n=97, 2 dernières années) | |
| Moyenne AMD Ryzen 7 6800H, NVIDIA GeForce RTX 3070 Ti Laptop GPU (10343 - 10472, n=2) | |
| MSI Katana GF66 12UGS | |
| Acer Nitro 5 AN515-46-R1A1 | |
| Asus TUF Dash F15 FX517ZR | |
| Acer Nitro 5 AN515-58-72QR | |
| Schenker XMG Fusion 15 (Mid 22) | |
| PCMark 10 / Productivity | |
| Moyenne de la classe Gaming (6845 - 25323, n=95, 2 dernières années) | |
| MSI Katana GF66 12UGS | |
| Asus TUF Dash F15 FX517ZR | |
| Moyenne AMD Ryzen 7 6800H, NVIDIA GeForce RTX 3070 Ti Laptop GPU (8991 - 9479, n=2) | |
| Acer Nitro 5 AN515-58-72QR | |
| Acer Nitro 5 AN515-46-R1A1 | |
| Schenker XMG Fusion 15 (Mid 22) | |
| PCMark 10 / Digital Content Creation | |
| Moyenne de la classe Gaming (7602 - 19954, n=95, 2 dernières années) | |
| MSI Katana GF66 12UGS | |
| Moyenne AMD Ryzen 7 6800H, NVIDIA GeForce RTX 3070 Ti Laptop GPU (9108 - 11759, n=2) | |
| Acer Nitro 5 AN515-58-72QR | |
| Asus TUF Dash F15 FX517ZR | |
| Acer Nitro 5 AN515-46-R1A1 | |
| Schenker XMG Fusion 15 (Mid 22) | |
| CrossMark / Overall | |
| Moyenne de la classe Gaming (1366 - 2409, n=94, 2 dernières années) | |
| MSI Katana GF66 12UGS | |
| Asus TUF Dash F15 FX517ZR | |
| Acer Nitro 5 AN515-58-72QR | |
| Schenker XMG Fusion 15 (Mid 22) | |
| Moyenne AMD Ryzen 7 6800H, NVIDIA GeForce RTX 3070 Ti Laptop GPU (1522 - 1643, n=2) | |
| Acer Nitro 5 AN515-46-R1A1 | |
| CrossMark / Productivity | |
| MSI Katana GF66 12UGS | |
| Moyenne de la classe Gaming (1386 - 2254, n=94, 2 dernières années) | |
| Acer Nitro 5 AN515-58-72QR | |
| Asus TUF Dash F15 FX517ZR | |
| Schenker XMG Fusion 15 (Mid 22) | |
| Moyenne AMD Ryzen 7 6800H, NVIDIA GeForce RTX 3070 Ti Laptop GPU (1530 - 1600, n=2) | |
| Acer Nitro 5 AN515-46-R1A1 | |
| CrossMark / Creativity | |
| Moyenne de la classe Gaming (1343 - 2786, n=94, 2 dernières années) | |
| Asus TUF Dash F15 FX517ZR | |
| MSI Katana GF66 12UGS | |
| Acer Nitro 5 AN515-58-72QR | |
| Schenker XMG Fusion 15 (Mid 22) | |
| Moyenne AMD Ryzen 7 6800H, NVIDIA GeForce RTX 3070 Ti Laptop GPU (1589 - 1746, n=2) | |
| Acer Nitro 5 AN515-46-R1A1 | |
| CrossMark / Responsiveness | |
| MSI Katana GF66 12UGS | |
| Moyenne de la classe Gaming (1226 - 2334, n=94, 2 dernières années) | |
| Acer Nitro 5 AN515-58-72QR | |
| Schenker XMG Fusion 15 (Mid 22) | |
| Asus TUF Dash F15 FX517ZR | |
| Moyenne AMD Ryzen 7 6800H, NVIDIA GeForce RTX 3070 Ti Laptop GPU (1316 - 1481, n=2) | |
| Acer Nitro 5 AN515-46-R1A1 | |
| PCMark 8 Home Score Accelerated v2 | 5074 points | |
| PCMark 8 Work Score Accelerated v2 | 5934 points | |
| PCMark 10 Score | 6783 points | |
Aide | ||
| AIDA64 / Memory Copy | |
| Moyenne de la classe Gaming (21750 - 129946, n=105, 2 dernières années) | |
| Asus TUF Dash F15 FX517ZR | |
| Moyenne AMD Ryzen 7 6800H (48209 - 51186, n=8) | |
| Acer Nitro 5 AN515-46-R1A1 | |
| Schenker XMG Fusion 15 (Mid 22) | |
| MSI Katana GF66 12UGS | |
| Acer Nitro 5 AN515-58-72QR | |
| AIDA64 / Memory Read | |
| Moyenne de la classe Gaming (22956 - 118858, n=105, 2 dernières années) | |
| Asus TUF Dash F15 FX517ZR | |
| Acer Nitro 5 AN515-46-R1A1 | |
| Moyenne AMD Ryzen 7 6800H (43828 - 51778, n=8) | |
| Schenker XMG Fusion 15 (Mid 22) | |
| MSI Katana GF66 12UGS | |
| Acer Nitro 5 AN515-58-72QR | |
| AIDA64 / Memory Write | |
| Moyenne de la classe Gaming (22297 - 135096, n=105, 2 dernières années) | |
| Asus TUF Dash F15 FX517ZR | |
| Acer Nitro 5 AN515-46-R1A1 | |
| Moyenne AMD Ryzen 7 6800H (51116 - 55307, n=8) | |
| MSI Katana GF66 12UGS | |
| Schenker XMG Fusion 15 (Mid 22) | |
| Acer Nitro 5 AN515-58-72QR | |
| AIDA64 / Memory Latency | |
| Moyenne de la classe Gaming (75.3 - 259, n=105, 2 dernières années) | |
| MSI Katana GF66 12UGS | |
| Asus TUF Dash F15 FX517ZR | |
| Schenker XMG Fusion 15 (Mid 22) | |
| Acer Nitro 5 AN515-46-R1A1 | |
| Moyenne AMD Ryzen 7 6800H (83.1 - 104.1, n=8) | |
| Acer Nitro 5 AN515-58-72QR | |
| Acer Nitro 5 AN515-58-72QR | |
* ... Moindre est la valeur, meilleures sont les performances
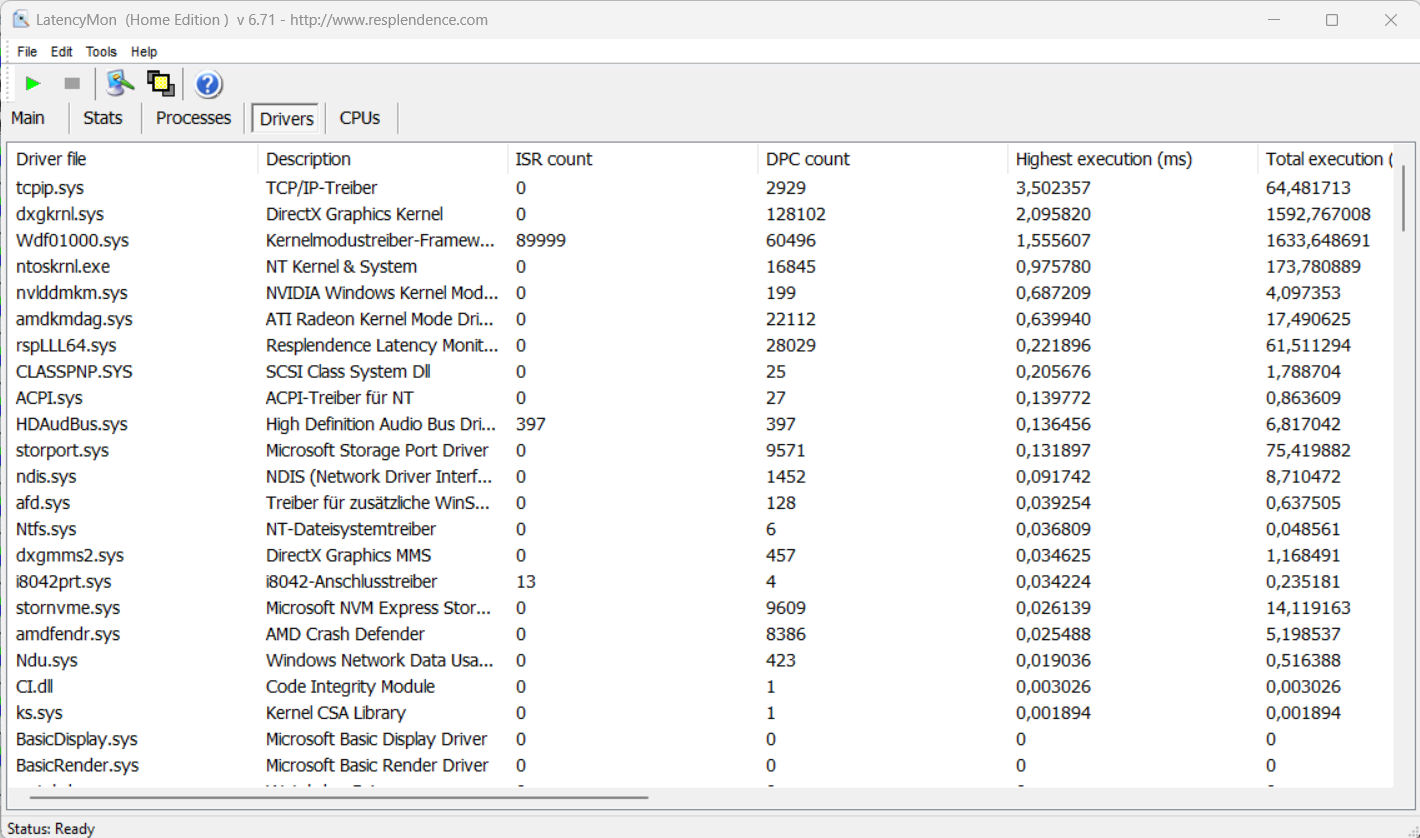
Latences DPC
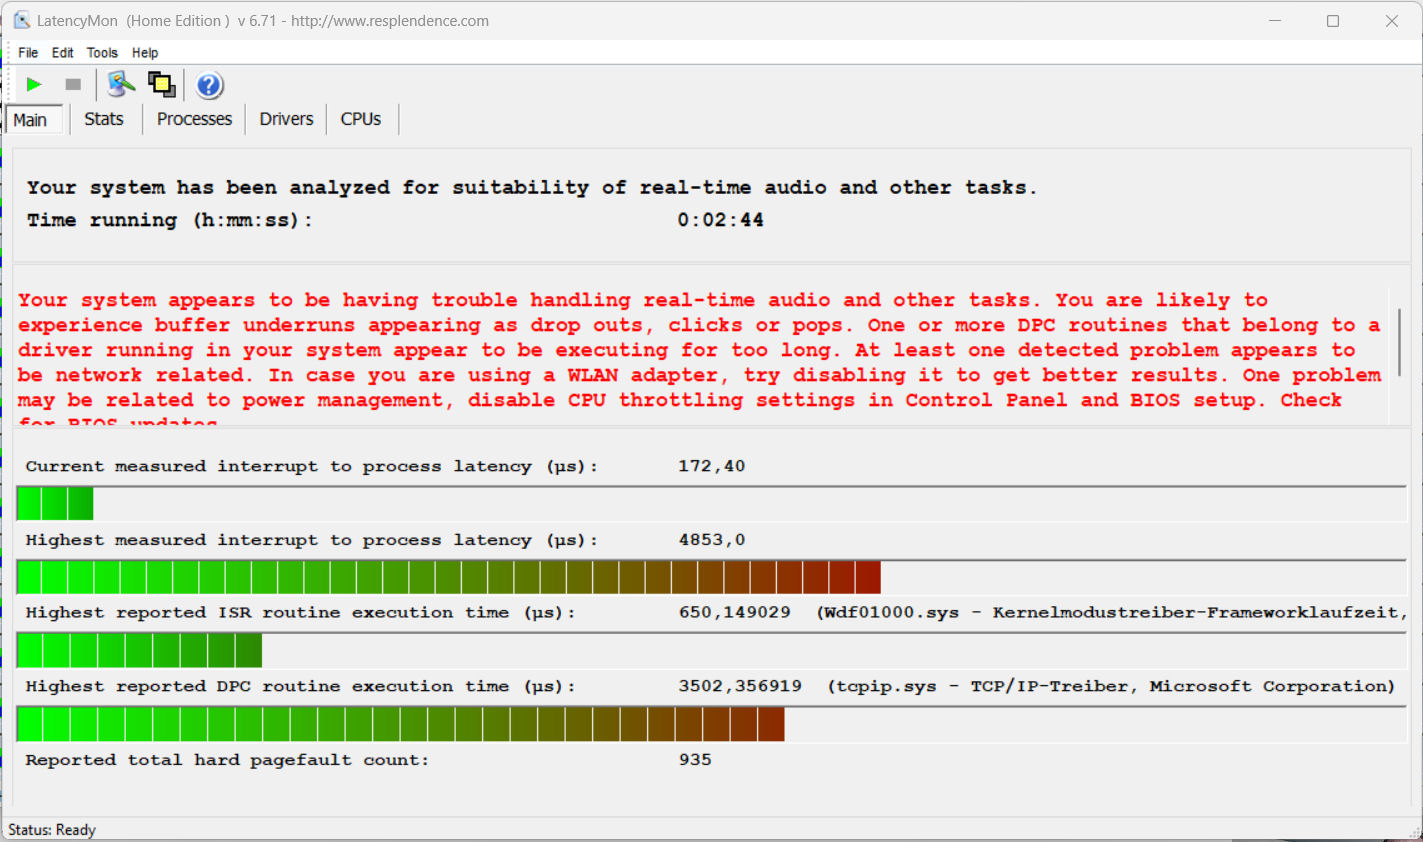
Le test standardisé Latency Monitor (navigation, lecture de vidéos 4K, exécution de Prime95 High Load) a montré quelques faiblesses en termes de latences DPC. Le système ne semble pas être adapté au traitement vidéo et audio en temps réel. Les futures mises à jour logicielles pourraient améliorer, voire aggraver cette situation.
| DPC Latencies / LatencyMon - interrupt to process latency (max), Web, Youtube, Prime95 | |
| Acer Nitro 5 AN515-46-R1A1 | |
| Schenker XMG Fusion 15 (Mid 22) | |
| Acer Nitro 5 AN515-58-72QR | |
| MSI Katana GF66 12UGS | |
| Asus TUF Dash F15 FX517ZR | |
* ... Moindre est la valeur, meilleures sont les performances
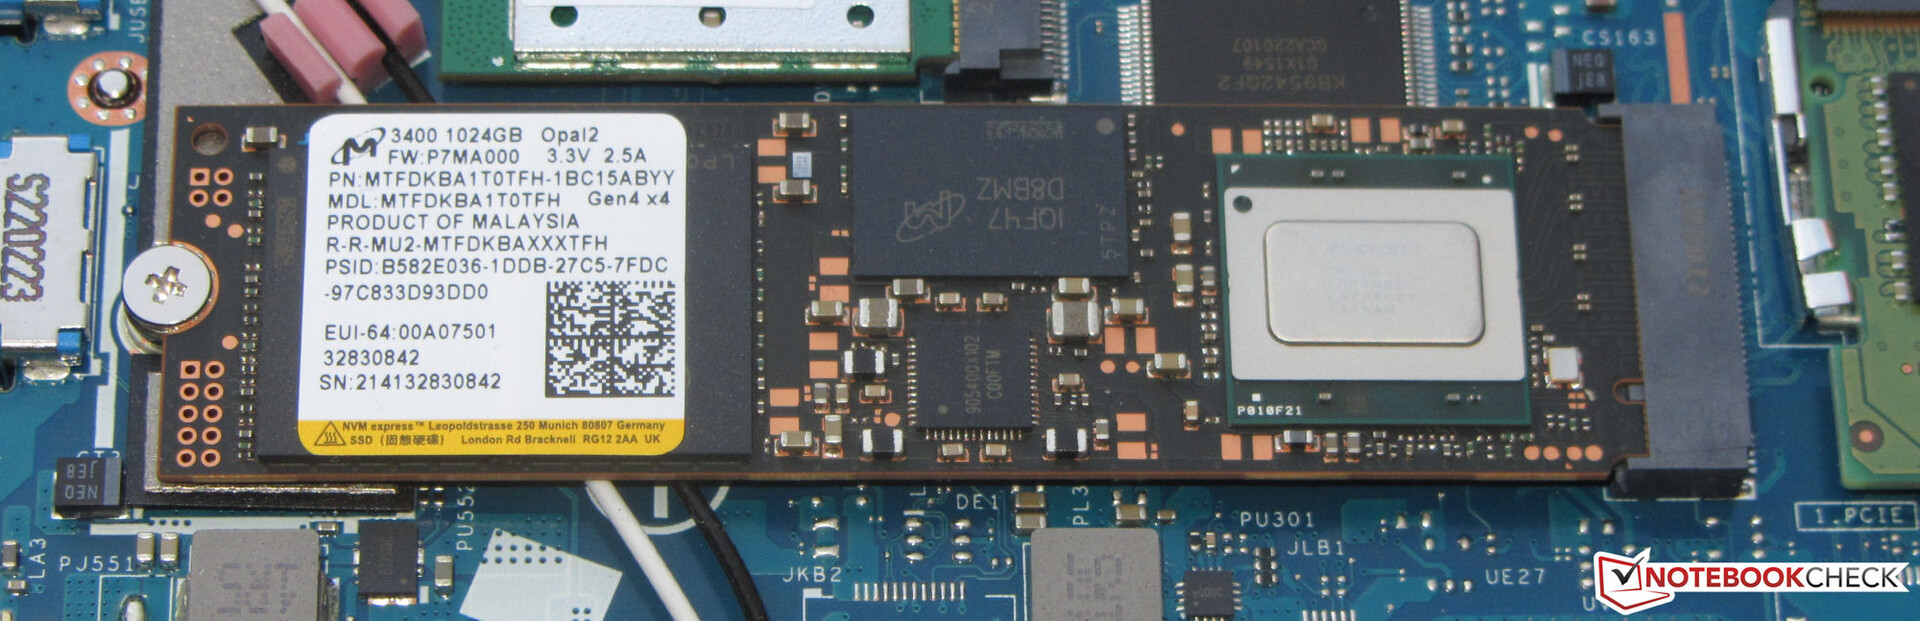
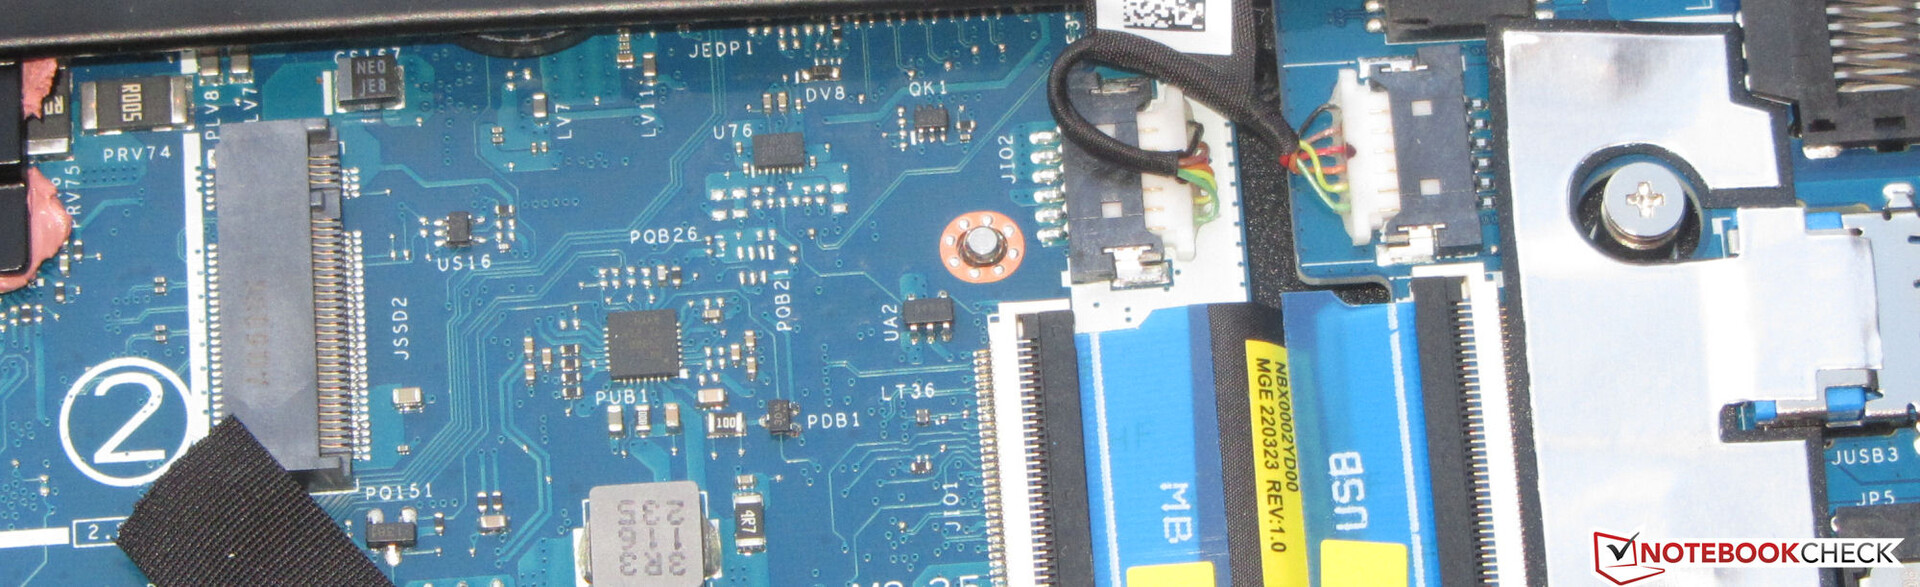
Dispositif de stockage
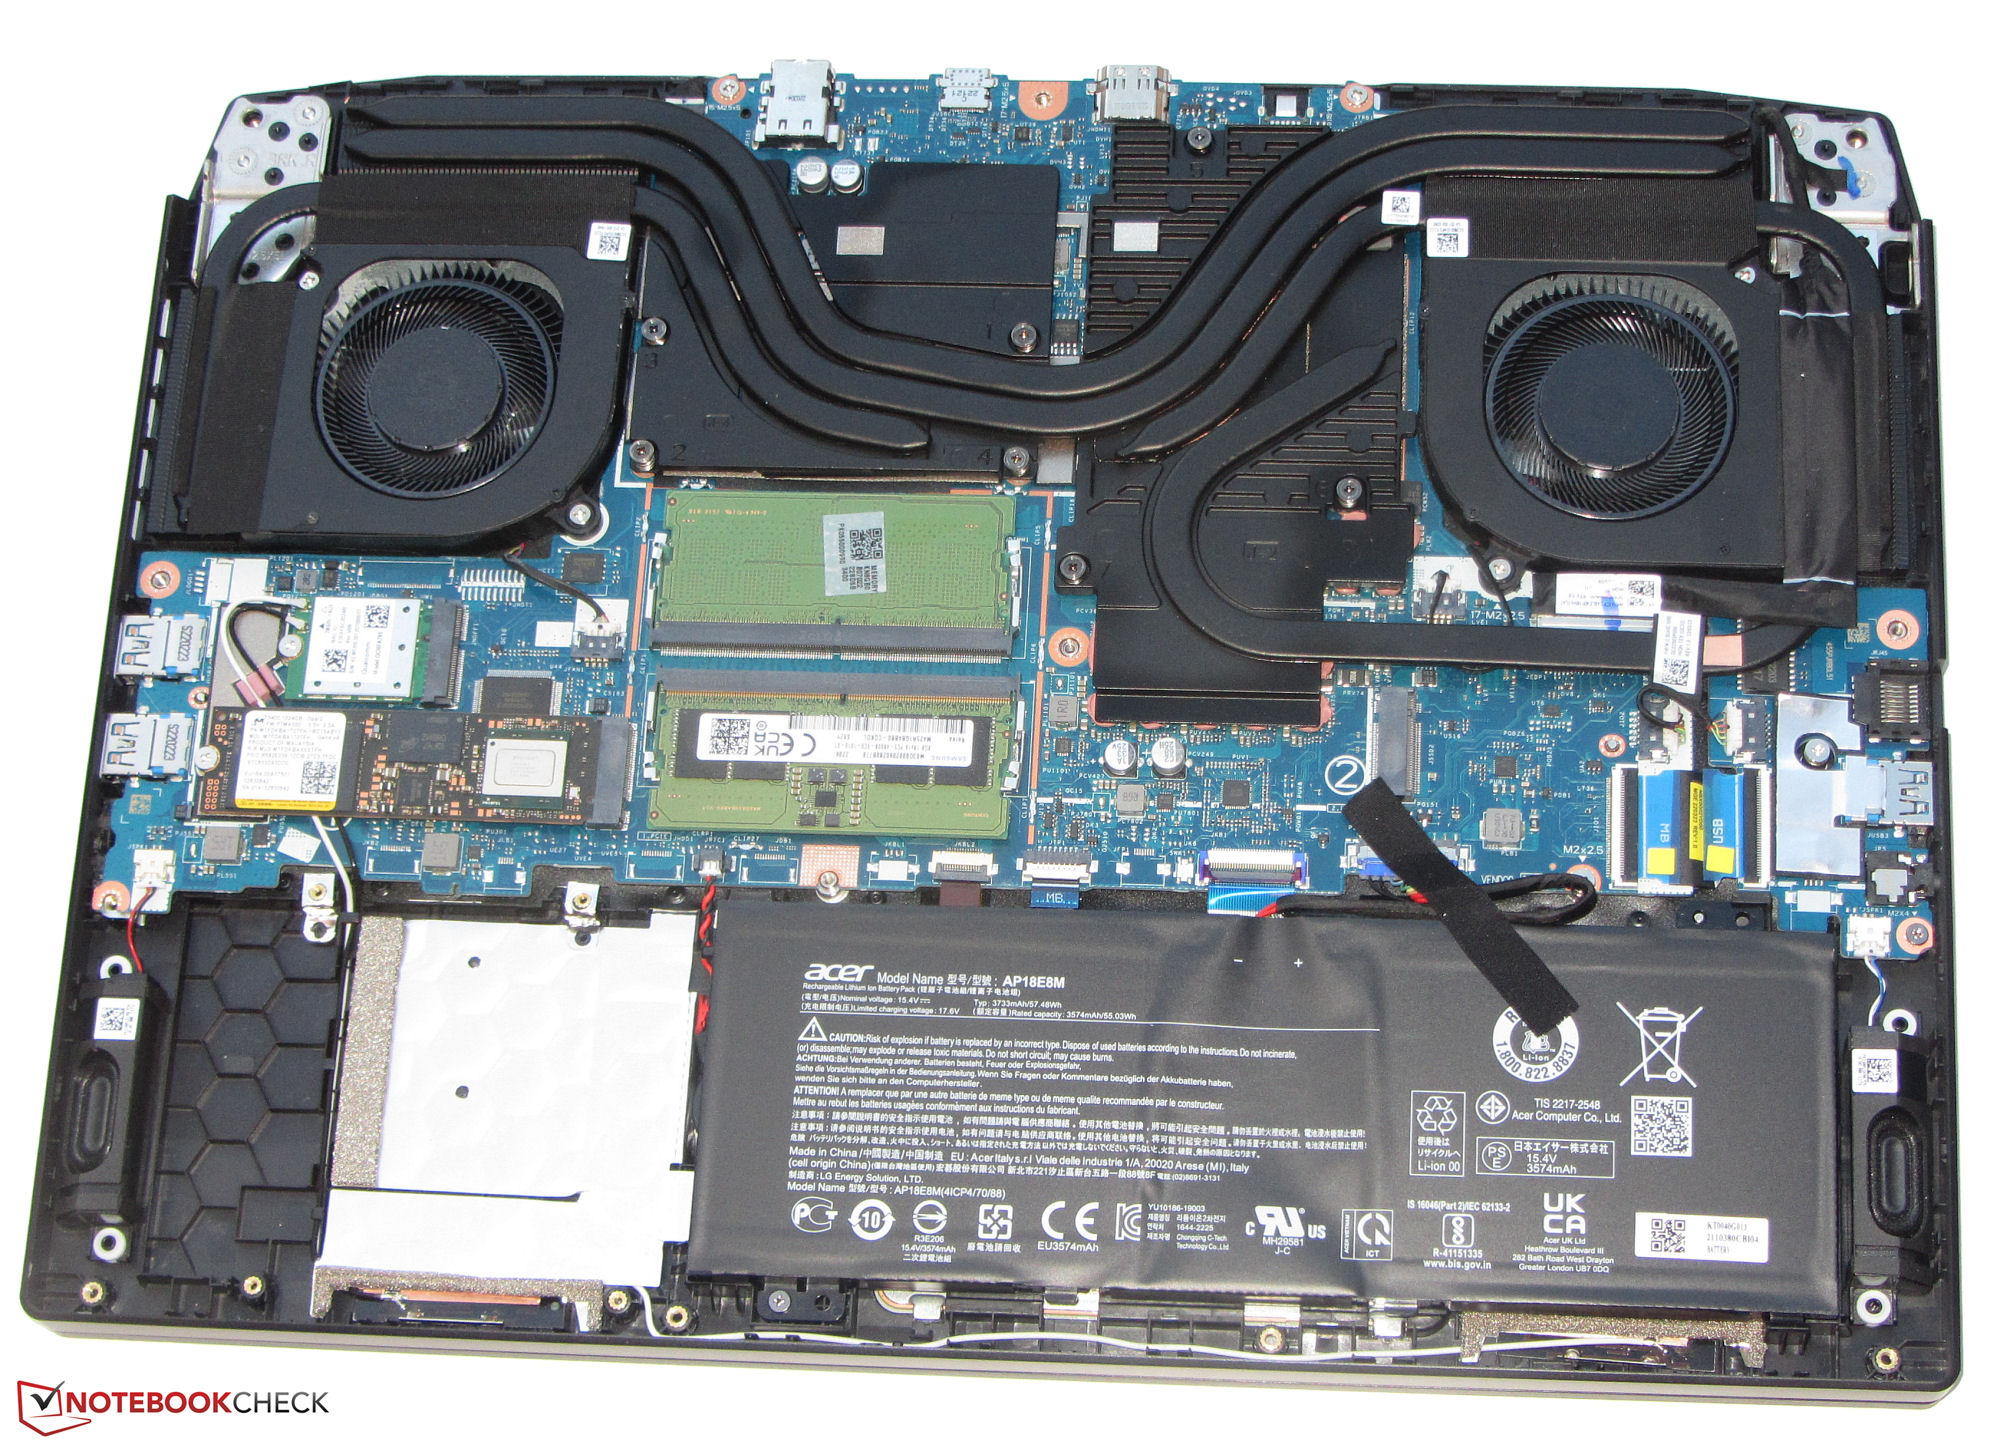
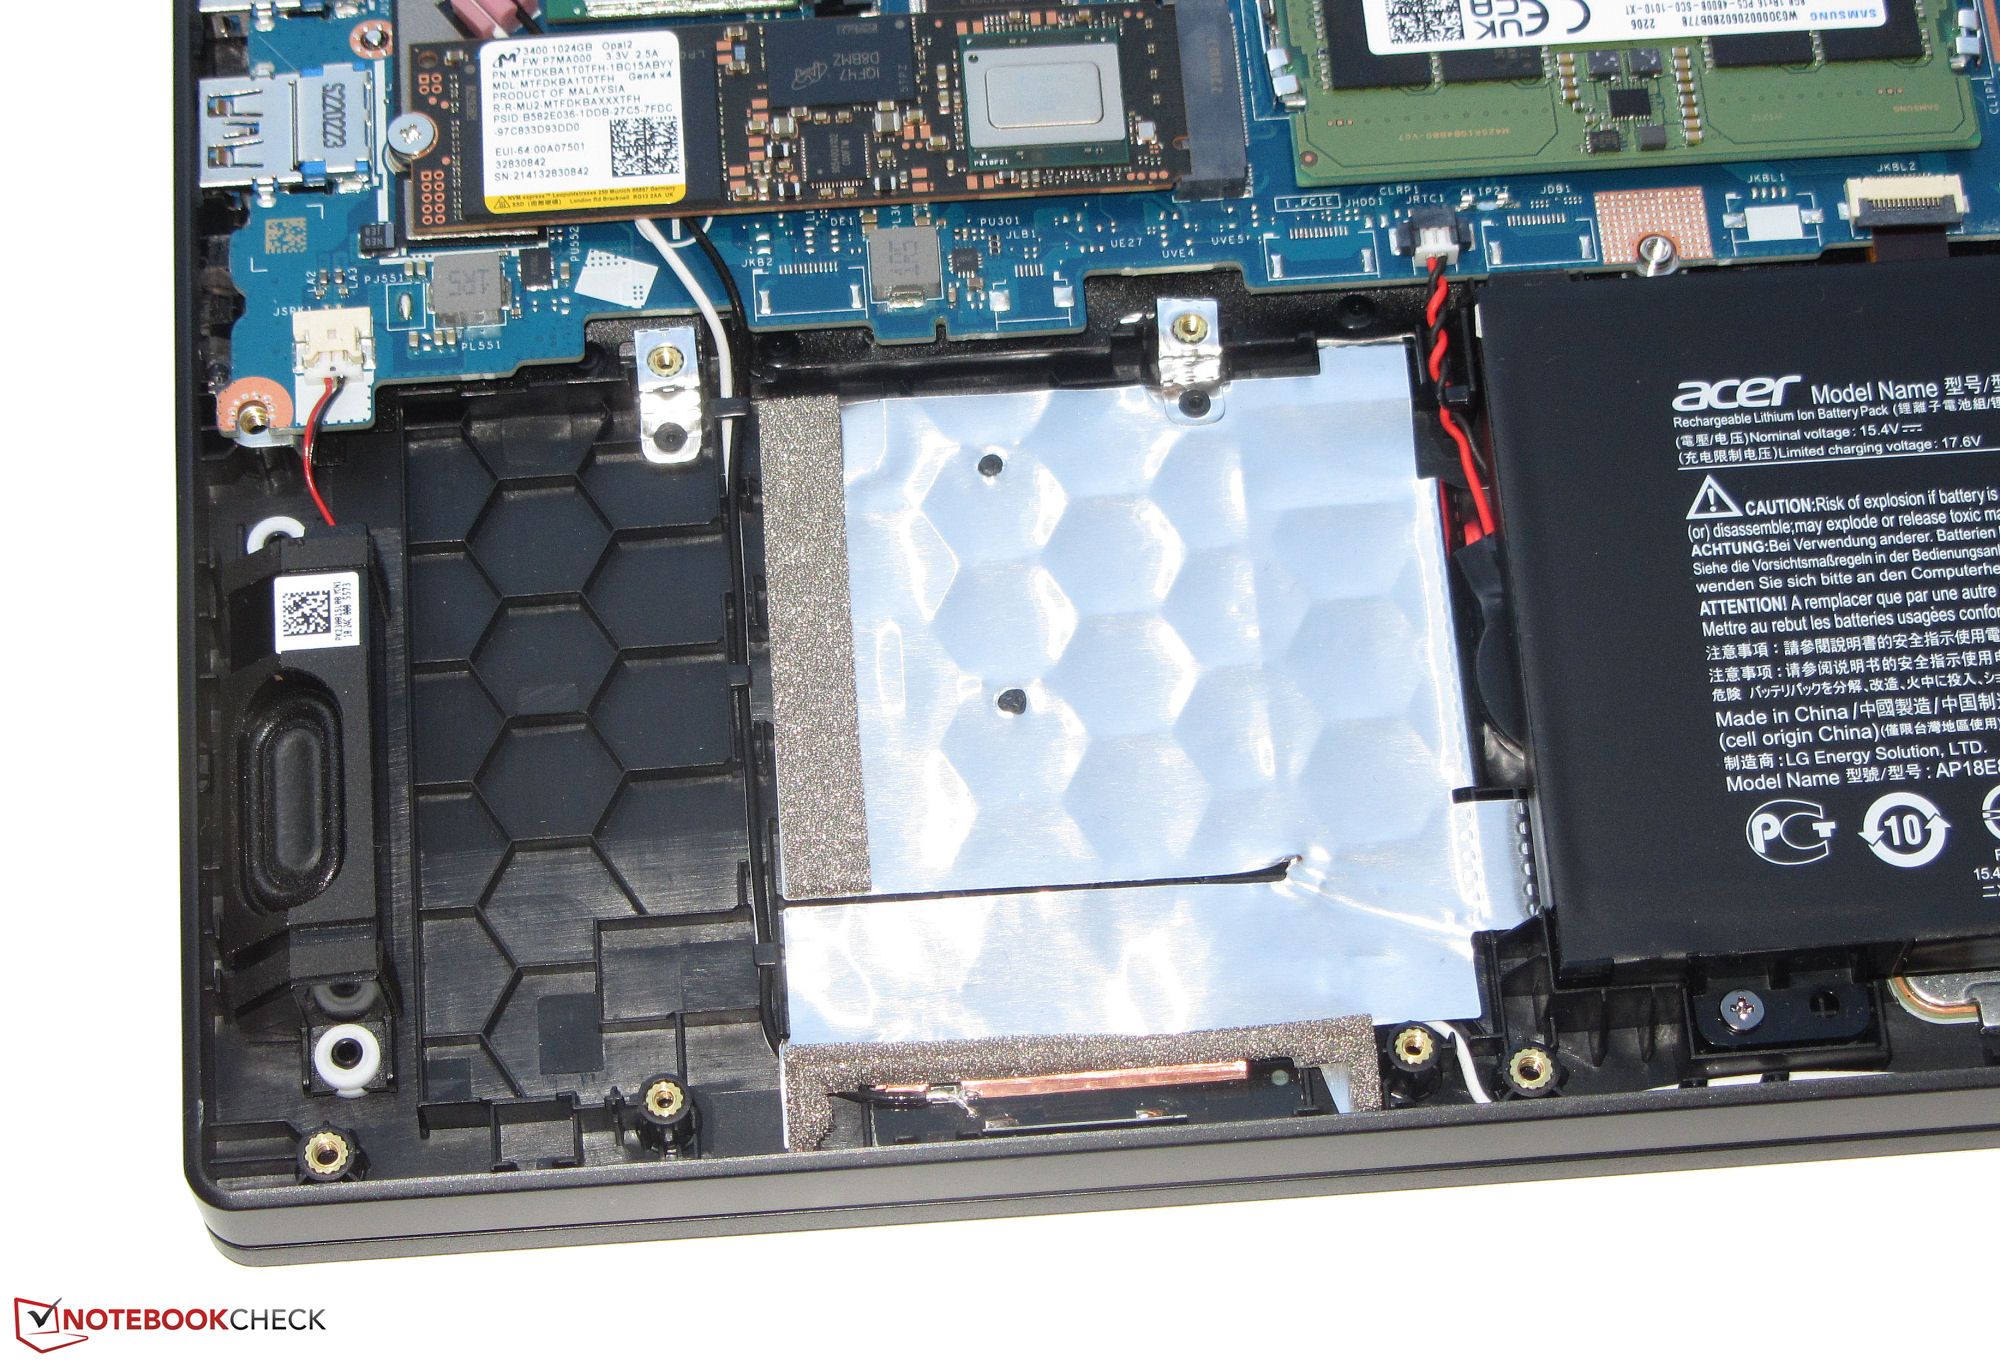
Le SSD de 1 To (PCIe 4, M.2-2280) de Micron a de très bons taux de transfert mais souffre de baisses de performances dues à l'étranglement thermique. L'AN515 dispose d'un autre emplacement pour un deuxième SSD PCIe 4. En théorie, l'ordinateur portable pourrait également être équipé d'un dispositif de stockage de 2,5 pouces, mais l'appareil n'est pas livré avec le slot SATA nécessaire ni avec un support de disque adapté.

* ... Moindre est la valeur, meilleures sont les performances
Disk Throttling: DiskSpd Read Loop, Queue Depth 8
Graphiques
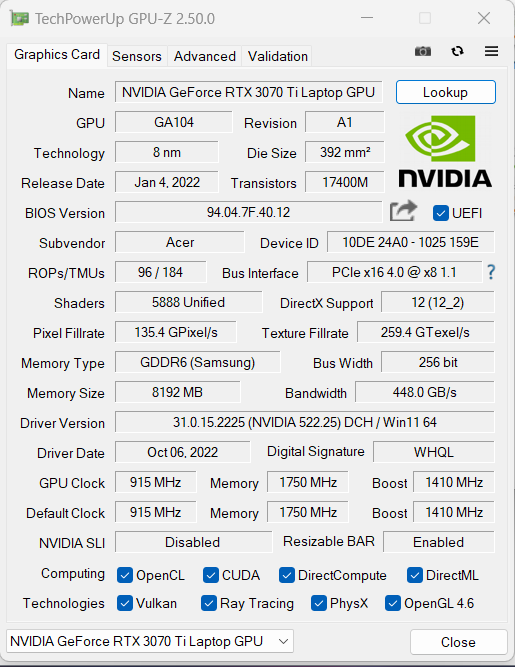
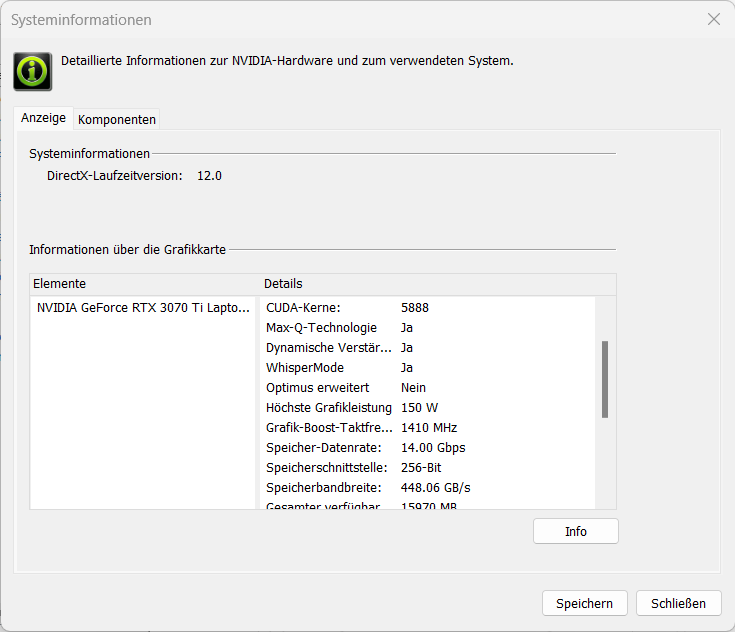
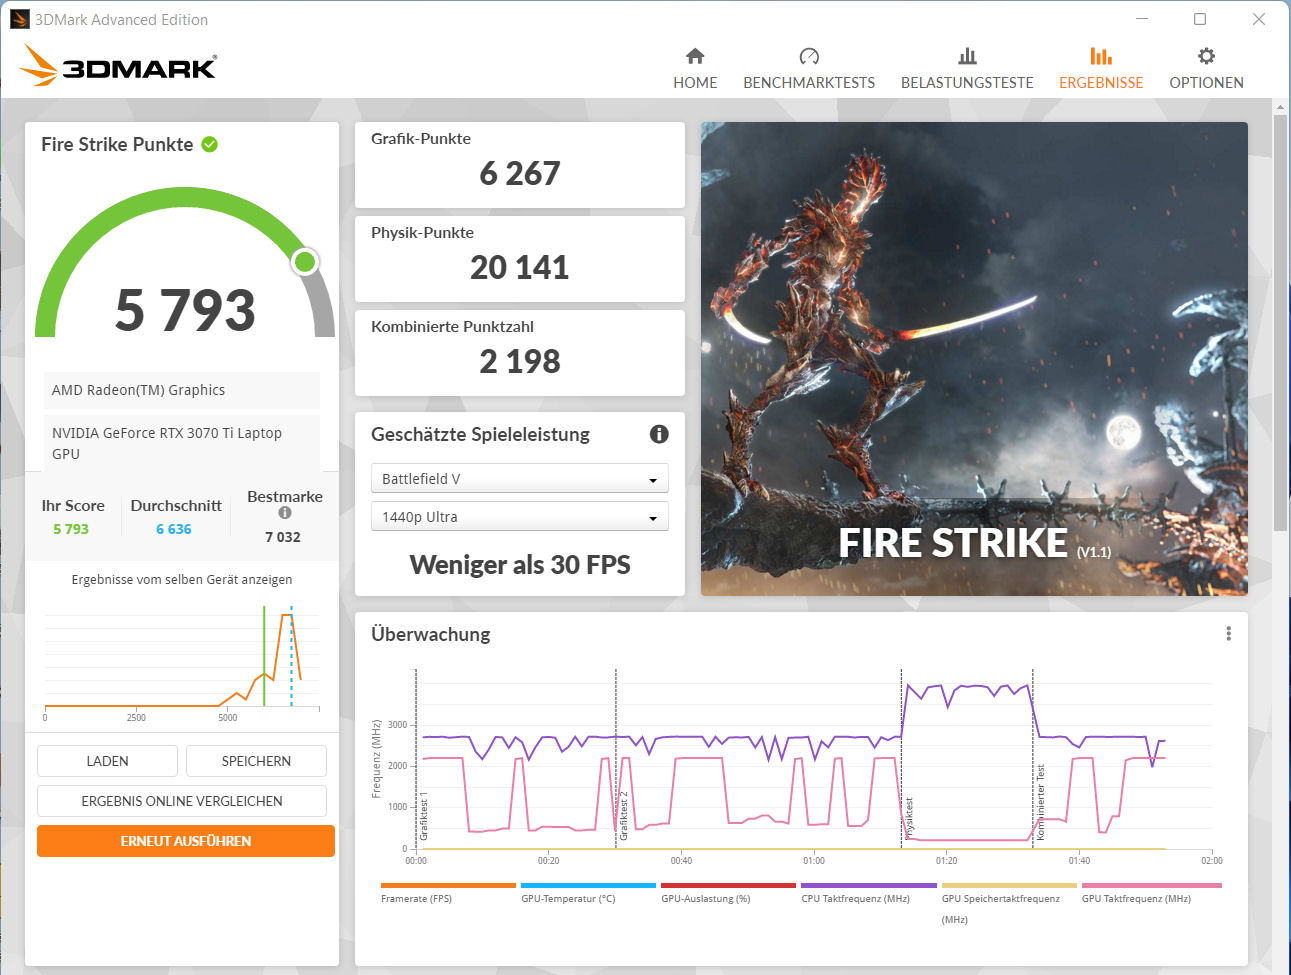
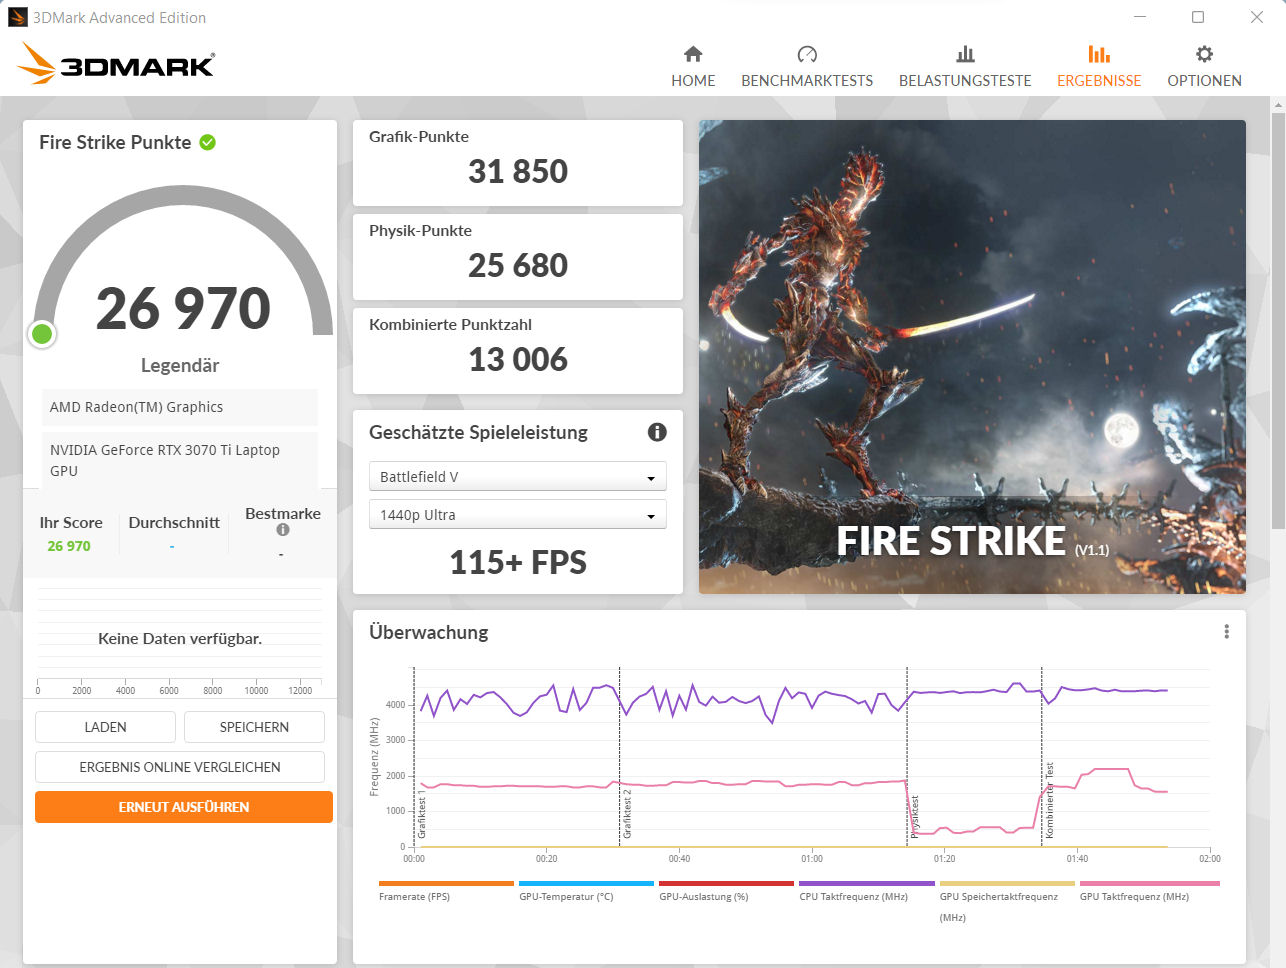
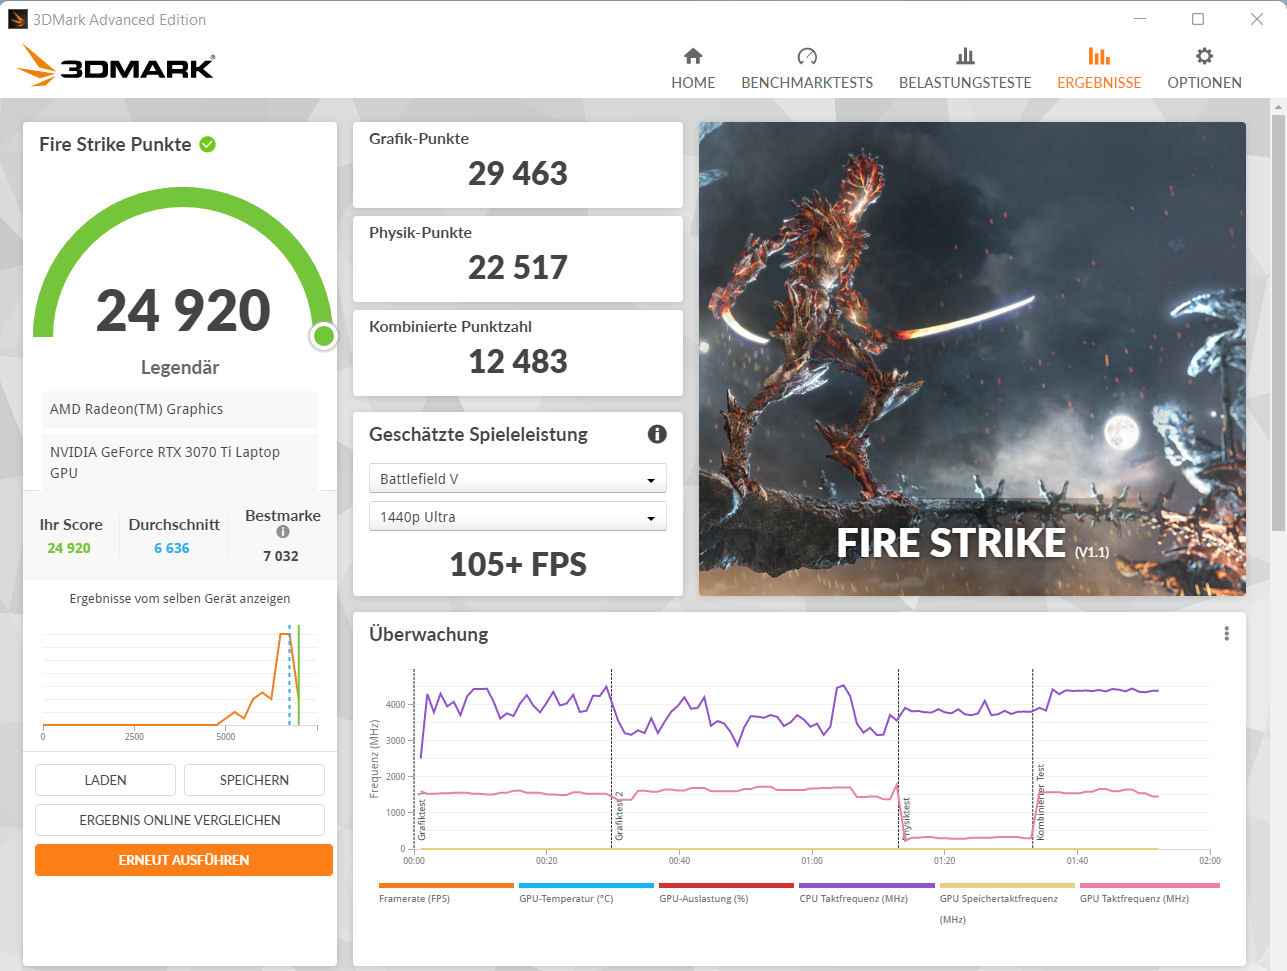
Acer a donné au GeForce RTX 3070 Ti (VRAM : 8 192 Mo GDDR6) un TGP maximum de 150 watts (125 watts + 25 watts de Dynamic Boost). Les résultats obtenus dans 3DMark sont supérieurs à la moyenne mesurée jusqu'à présent pour les GPU RTX 3070 Ti. Les différences entre les profils de performance sont minimes (voir Fire Strike screenshots). L'appareil utilise la fonction Dynamic Boost, comme on peut le voir dans notre test Witcher 3.
Les performances graphiques peuvent être légèrement améliorées en configurant la sortie d'image directe à partir du GPU GeForce. Ce changement peut être effectué dans le BIOS ou via le logiciel NitroSense (cliquez sur le symbole des paramètres). Acer utilise MUX Switch et le périphérique ne prend pas en charge Advanced Optimus.

| 3DMark Performance rating - Percent | |
| Moyenne de la classe Gaming | |
| Acer Nitro 5 AN515-46-R1A1 | |
| Acer Nitro 5 AN515-46-R1A1 | |
| Moyenne NVIDIA GeForce RTX 3070 Ti Laptop GPU | |
| Acer Nitro 5 AN515-58-72QR | |
| MSI Katana GF66 12UGS | |
| Schenker XMG Fusion 15 (Mid 22) | |
| Asus TUF Dash F15 FX517ZR | |
| 3DMark 11 - 1280x720 Performance GPU | |
| Moyenne de la classe Gaming (21841 - 80022, n=104, 2 dernières années) | |
| Acer Nitro 5 AN515-46-R1A1 (dGPU) | |
| Acer Nitro 5 AN515-46-R1A1 | |
| Acer Nitro 5 AN515-58-72QR | |
| Moyenne NVIDIA GeForce RTX 3070 Ti Laptop GPU (13799 - 42569, n=36) | |
| MSI Katana GF66 12UGS | |
| Schenker XMG Fusion 15 (Mid 22) | |
| Asus TUF Dash F15 FX517ZR | |
| 3DMark | |
| 1920x1080 Fire Strike Graphics | |
| Moyenne de la classe Gaming (12242 - 62849, n=115, 2 dernières années) | |
| Acer Nitro 5 AN515-46-R1A1 (dGPU) | |
| Acer Nitro 5 AN515-46-R1A1 | |
| Moyenne NVIDIA GeForce RTX 3070 Ti Laptop GPU (22612 - 32550, n=37) | |
| Acer Nitro 5 AN515-58-72QR | |
| MSI Katana GF66 12UGS | |
| Schenker XMG Fusion 15 (Mid 22) | |
| Asus TUF Dash F15 FX517ZR | |
| 2560x1440 Time Spy Graphics | |
| Moyenne de la classe Gaming (5012 - 26212, n=115, 2 dernières années) | |
| Acer Nitro 5 AN515-46-R1A1 (dGPU) | |
| Acer Nitro 5 AN515-46-R1A1 | |
| Moyenne NVIDIA GeForce RTX 3070 Ti Laptop GPU (8142 - 12324, n=37) | |
| Acer Nitro 5 AN515-58-72QR | |
| MSI Katana GF66 12UGS | |
| Schenker XMG Fusion 15 (Mid 22) | |
| Asus TUF Dash F15 FX517ZR | |
| 2560x1440 Port Royal Graphics | |
| Moyenne de la classe Gaming (4395 - 17286, n=71, 2 dernières années) | |
| Acer Nitro 5 AN515-46-R1A1 (dGPU) | |
| Acer Nitro 5 AN515-46-R1A1 | |
| Moyenne NVIDIA GeForce RTX 3070 Ti Laptop GPU (5091 - 7510, n=23) | |
| Acer Nitro 5 AN515-58-72QR | |
| MSI Katana GF66 12UGS | |
| Schenker XMG Fusion 15 (Mid 22) | |
| Asus TUF Dash F15 FX517ZR | |
| 3DMark 06 Standard Score | 43453 points | |
| 3DMark 11 Performance | 28137 points | |
| 3DMark Cloud Gate Standard Score | 56030 points | |
| 3DMark Fire Strike Score | 25960 points | |
| 3DMark Time Spy Score | 11042 points | |
Aide | ||
| Blender | |
| v3.3 Classroom OPTIX/RTX | |
| Asus TUF Dash F15 FX517ZR | |
| Acer Nitro 5 AN515-46-R1A1 (3.3.0) | |
| Acer Nitro 5 AN515-46-R1A1 (3.3.0, dGPU) | |
| Moyenne de la classe Gaming (9 - 32, n=106, 2 dernières années) | |
| v3.3 Classroom CUDA | |
| Asus TUF Dash F15 FX517ZR | |
| Acer Nitro 5 AN515-46-R1A1 (3.3.0) | |
| Acer Nitro 5 AN515-46-R1A1 (3.3.0, dGPU) | |
| Moyenne de la classe Gaming (15 - 228, n=106, 2 dernières années) | |
| v3.3 Classroom CPU | |
| Schenker XMG Fusion 15 (Mid 22) | |
| Asus TUF Dash F15 FX517ZR | |
| Acer Nitro 5 AN515-46-R1A1 (3.3.0) | |
| Acer Nitro 5 AN515-46-R1A1 (3.3.0, dGPU) | |
| Moyenne de la classe Gaming (122 - 565, n=102, 2 dernières années) | |
* ... Moindre est la valeur, meilleures sont les performances
Performances en matière de jeux
Le matériel prend en charge les jeux en FHD avec les paramètres maximaux. Les taux de rafraîchissement des titres testés sont souvent supérieurs à la moyenne pour la RTX 3070 Ti. La sortie d'images via le GPU GeForce augmente les fréquences d'images. Le test Witcher 3 confirme que les taux de rafraîchissement restent stables sur une longue période.
| The Witcher 3 - 1920x1080 Ultra Graphics & Postprocessing (HBAO+) | |
| Moyenne de la classe Gaming (104.7 - 240, n=7, 2 dernières années) | |
| Acer Nitro 5 AN515-46-R1A1 (dGPU) | |
| Acer Nitro 5 AN515-46-R1A1 | |
| Moyenne NVIDIA GeForce RTX 3070 Ti Laptop GPU (76.8 - 124.1, n=39) | |
| Acer Nitro 5 AN515-58-72QR | |
| MSI Katana GF66 12UGS | |
| Schenker XMG Fusion 15 (Mid 22) | |
| Asus TUF Dash F15 FX517ZR | |
| Dota 2 Reborn - 1920x1080 ultra (3/3) best looking | |
| Moyenne de la classe Gaming (84.8 - 248, n=107, 2 dernières années) | |
| MSI Katana GF66 12UGS | |
| Moyenne NVIDIA GeForce RTX 3070 Ti Laptop GPU (68.7 - 160.5, n=38) | |
| Acer Nitro 5 AN515-58-72QR | |
| Schenker XMG Fusion 15 (Mid 22) | |
| Acer Nitro 5 AN515-46-R1A1 (dGPU) | |
| Asus TUF Dash F15 FX517ZR | |
| Acer Nitro 5 AN515-46-R1A1 | |
| X-Plane 11.11 - 1920x1080 high (fps_test=3) | |
| MSI Katana GF66 12UGS | |
| Asus TUF Dash F15 FX517ZR | |
| Moyenne de la classe Gaming (55.5 - 143.5, n=109, 2 dernières années) | |
| Moyenne NVIDIA GeForce RTX 3070 Ti Laptop GPU (51.6 - 116.9, n=37) | |
| Acer Nitro 5 AN515-58-72QR | |
| Schenker XMG Fusion 15 (Mid 22) | |
| Acer Nitro 5 AN515-46-R1A1 (dGPU) | |
| Acer Nitro 5 AN515-46-R1A1 | |
| Final Fantasy XV Benchmark - 1920x1080 High Quality | |
| Moyenne de la classe Gaming (41 - 215, n=95, 2 dernières années) | |
| Acer Nitro 5 AN515-46-R1A1 (1.3, dGPU) | |
| Acer Nitro 5 AN515-46-R1A1 (1.3) | |
| Moyenne NVIDIA GeForce RTX 3070 Ti Laptop GPU (49.5 - 122.4, n=35) | |
| Schenker XMG Fusion 15 (Mid 22) (1.3) | |
| MSI Katana GF66 12UGS (1.3) | |
| Acer Nitro 5 AN515-58-72QR (1.3) | |
| Asus TUF Dash F15 FX517ZR (1.3) | |
| GTA V - 1920x1080 Highest AA:4xMSAA + FX AF:16x | |
| Moyenne de la classe Gaming (48.3 - 186.9, n=94, 2 dernières années) | |
| Moyenne NVIDIA GeForce RTX 3070 Ti Laptop GPU (44 - 123.9, n=36) | |
| Asus TUF Dash F15 FX517ZR | |
| MSI Katana GF66 12UGS | |
| Schenker XMG Fusion 15 (Mid 22) | |
| Acer Nitro 5 AN515-58-72QR | |
| Acer Nitro 5 AN515-46-R1A1 | |
| Acer Nitro 5 AN515-46-R1A1 (dGPU) | |
| Strange Brigade - 1920x1080 ultra AA:ultra AF:16 | |
| Moyenne de la classe Gaming (76.3 - 458, n=87, 2 dernières années) | |
| Acer Nitro 5 AN515-46-R1A1 (1.47.22.14 D3D12, dGPU) | |
| Moyenne NVIDIA GeForce RTX 3070 Ti Laptop GPU (109 - 221, n=37) | |
| Acer Nitro 5 AN515-58-72QR (1.47.22.14 D3D12) | |
| Acer Nitro 5 AN515-46-R1A1 (1.47.22.14 D3D12) | |
| MSI Katana GF66 12UGS (1.47.22.14 D3D12) | |
| Schenker XMG Fusion 15 (Mid 22) (1.47.22.14 D3D12) | |
| Asus TUF Dash F15 FX517ZR (1.47.22.14 D3D12) | |
| F1 22 - 1920x1080 Ultra High Preset AA:T AF:16x | |
| Acer Nitro 5 AN515-46-R1A1 (923650, dGPU) | |
| Moyenne de la classe Gaming (40.1 - 121.2, n=4, 2 dernières années) | |
| Acer Nitro 5 AN515-46-R1A1 (923662) | |
| Moyenne NVIDIA GeForce RTX 3070 Ti Laptop GPU (58.1 - 80, n=8) | |
| Far Cry 5 - 1920x1080 Ultra Preset AA:T | |
| Moyenne NVIDIA GeForce RTX 3070 Ti Laptop GPU (91 - 138, n=25) | |
| MSI Katana GF66 12UGS | |
| Moyenne de la classe Gaming (70 - 151, n=6, 2 dernières années) | |
| Acer Nitro 5 AN515-46-R1A1 (dGPU) | |
| Schenker XMG Fusion 15 (Mid 22) | |
| Acer Nitro 5 AN515-46-R1A1 | |
| Asus TUF Dash F15 FX517ZR | |
| Acer Nitro 5 AN515-58-72QR | |
| Hitman 3 - 1920x1080 Maximum Settings AF:16x | |
| Acer Nitro 5 AN515-46-R1A1 | |
| Moyenne NVIDIA GeForce RTX 3070 Ti Laptop GPU (138 - 157.7, n=3) | |
| God of War - 1920x1080 Ultra Preset | |
| Acer Nitro 5 AN515-46-R1A1 | |
| Moyenne NVIDIA GeForce RTX 3070 Ti Laptop GPU (55.1 - 64.3, n=5) | |
| Tiny Tina's Wonderlands - 1920x1080 Badass Preset (DX12) | |
| Moyenne de la classe Gaming (55 - 159.4, n=4, 2 dernières années) | |
| Acer Nitro 5 AN515-46-R1A1 | |
| Moyenne NVIDIA GeForce RTX 3070 Ti Laptop GPU (89.8 - 93.7, n=4) | |
| Asus TUF Dash F15 FX517ZR | |
| Vampire Bloodhunt - 1920x1080 Ultra Preset | |
| Moyenne NVIDIA GeForce RTX 3070 Ti Laptop GPU (168.6 - 189.9, n=2) | |
| Acer Nitro 5 AN515-46-R1A1 | |
| The Quarry - 1920x1080 Ultra Preset | |
| Acer Nitro 5 AN515-46-R1A1 | |
| Moyenne NVIDIA GeForce RTX 3070 Ti Laptop GPU (80 - 81.5, n=2) | |
Witcher 3 FPS diagram
| Bas | Moyen | Élevé | Ultra | |
|---|---|---|---|---|
| GTA V (2015) | 174.2 | 167.3 | 149.5 | 92.5 |
| The Witcher 3 (2015) | 284 | 237 | 179.4 | 108.5 |
| Dota 2 Reborn (2015) | 130.9 | 120 | 112.1 | 108.5 |
| Final Fantasy XV Benchmark (2018) | 171.8 | 139.9 | 108.6 | |
| X-Plane 11.11 (2018) | 100.3 | 89.3 | 72.3 | |
| Far Cry 5 (2018) | 134 | 116 | 112 | 106 |
| Strange Brigade (2018) | 289 | 212 | 190.3 | 177 |
| Hitman 3 (2021) | 207.9 | 169.1 | 162.1 | 157.7 |
| God of War (2022) | 117.3 | 104.8 | 88.7 | 64.3 |
| Tiny Tina's Wonderlands (2022) | 183.3 | 159.8 | 118.3 | 93.7 |
| Vampire Bloodhunt (2022) | 197.6 | 185.1 | 172.7 | 168.6 |
| F1 22 (2022) | 207 | 205 | 192.3 | 73.2 |
| The Quarry (2022) | 149.6 | 120.7 | 101.5 | 81.5 |
Émissions - l'AN515 ne chauffe que modérément
Émissions sonores
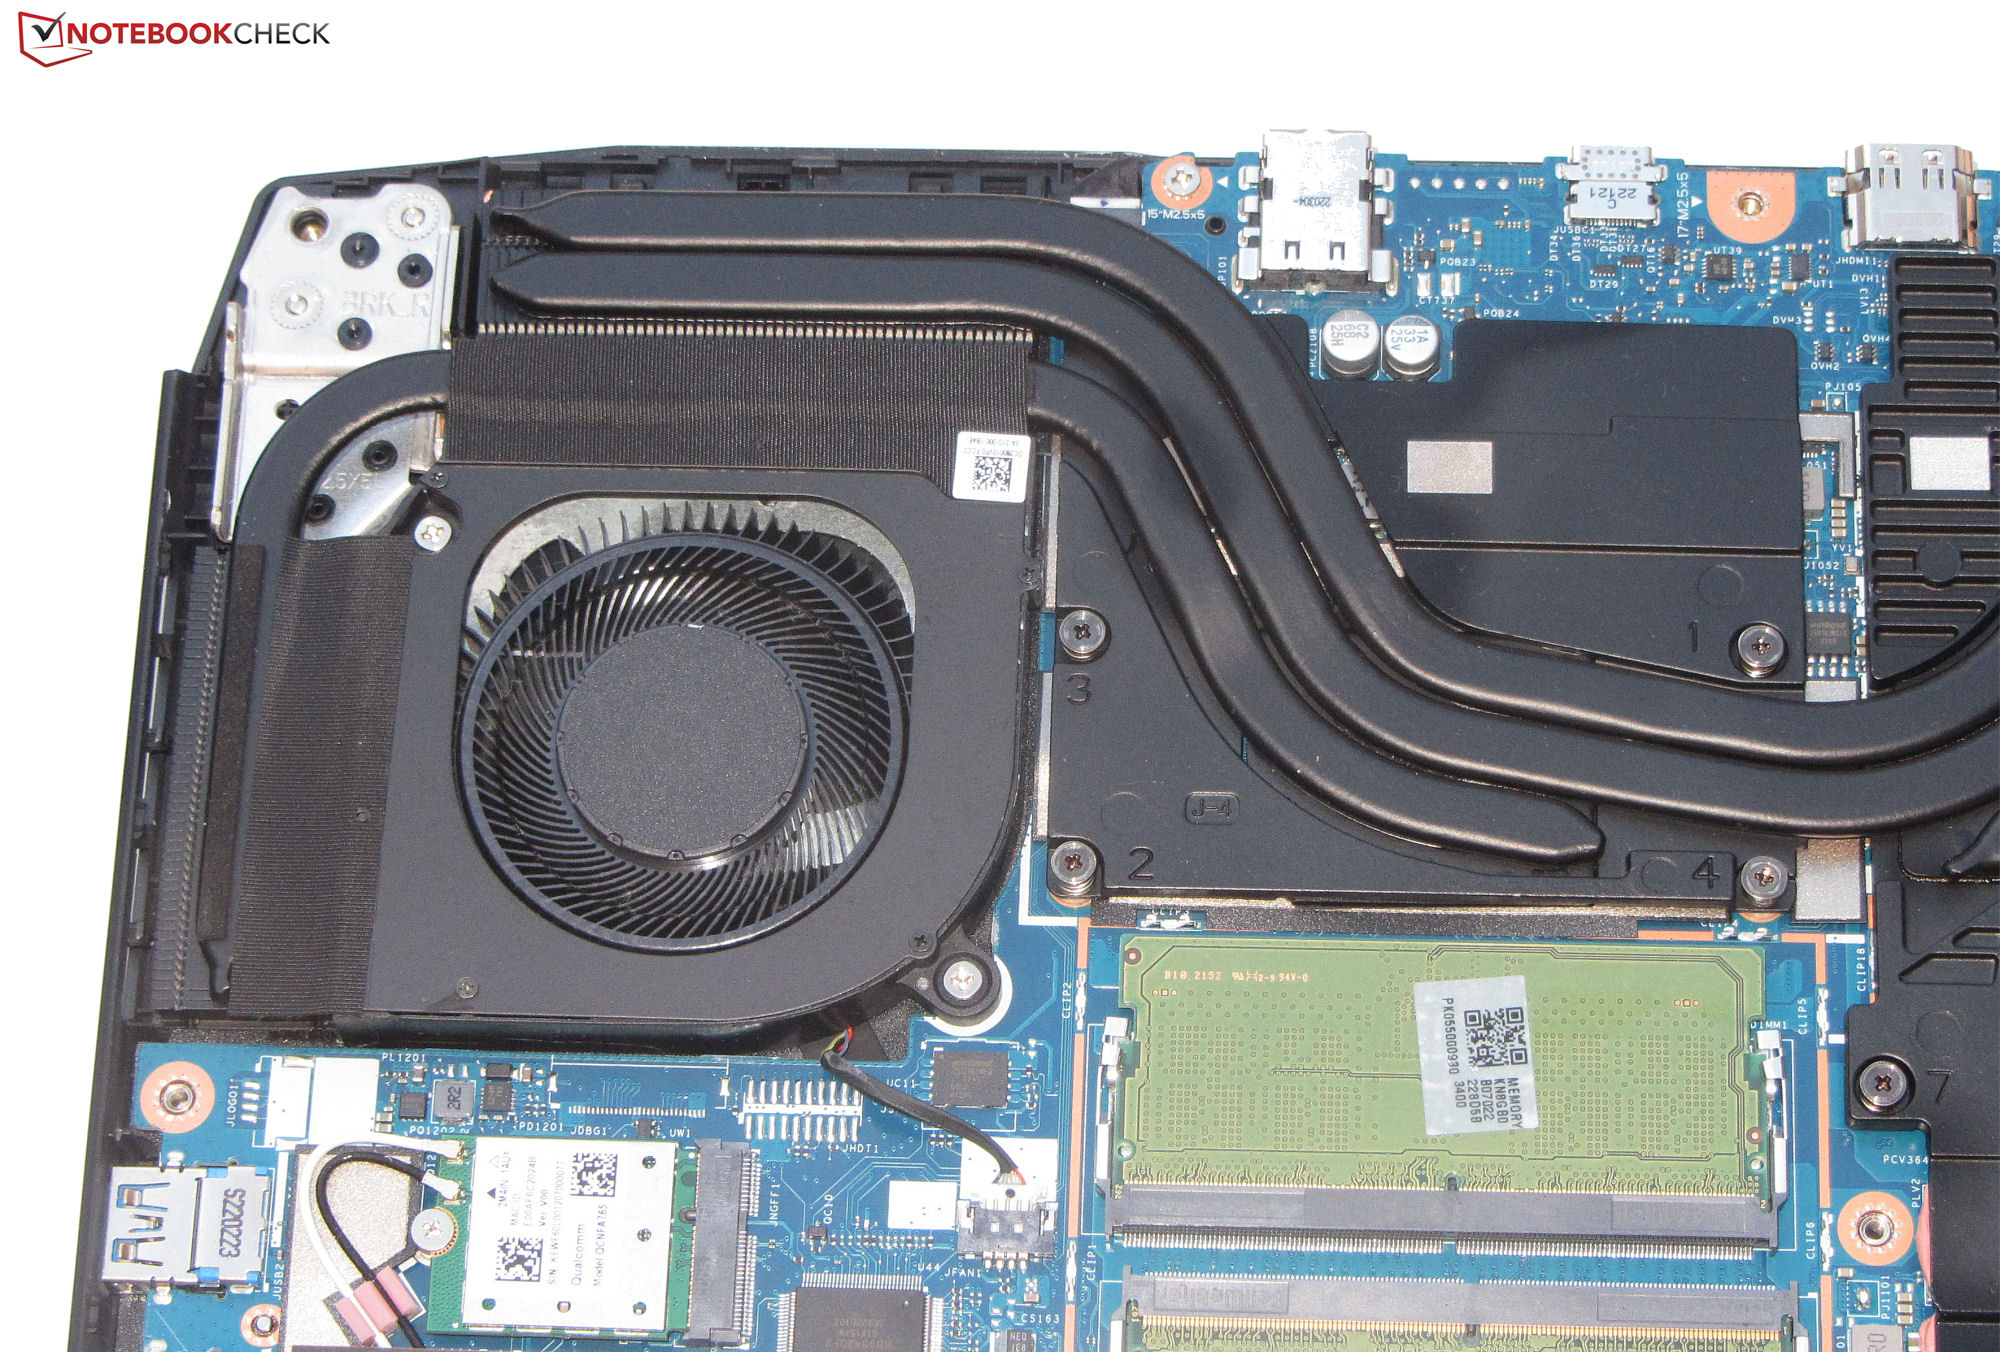
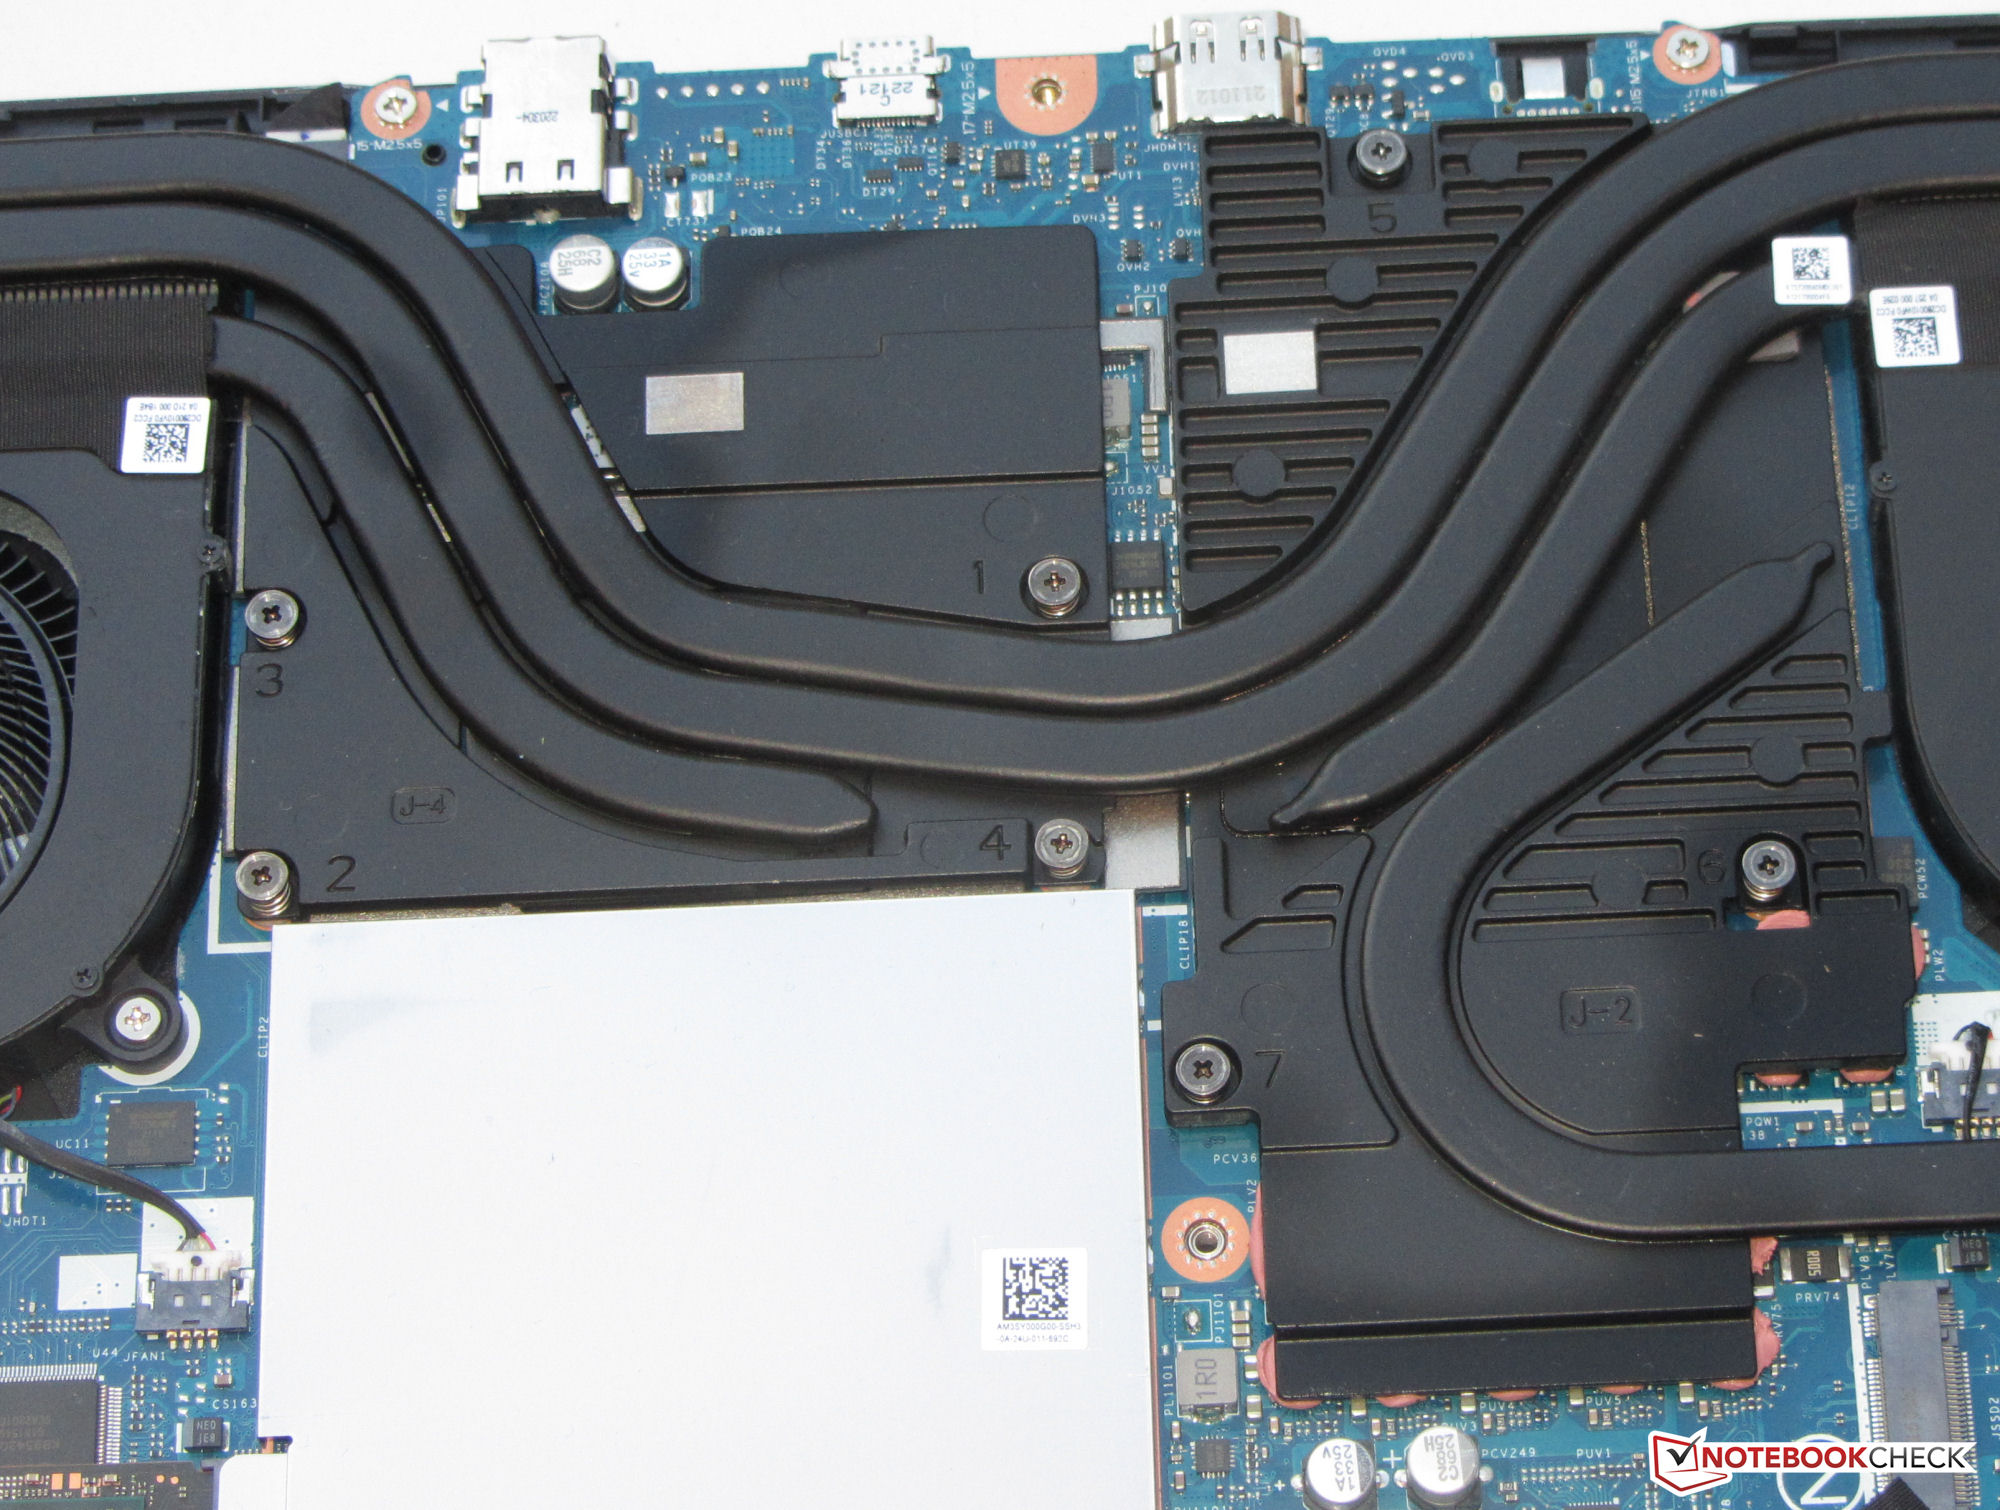
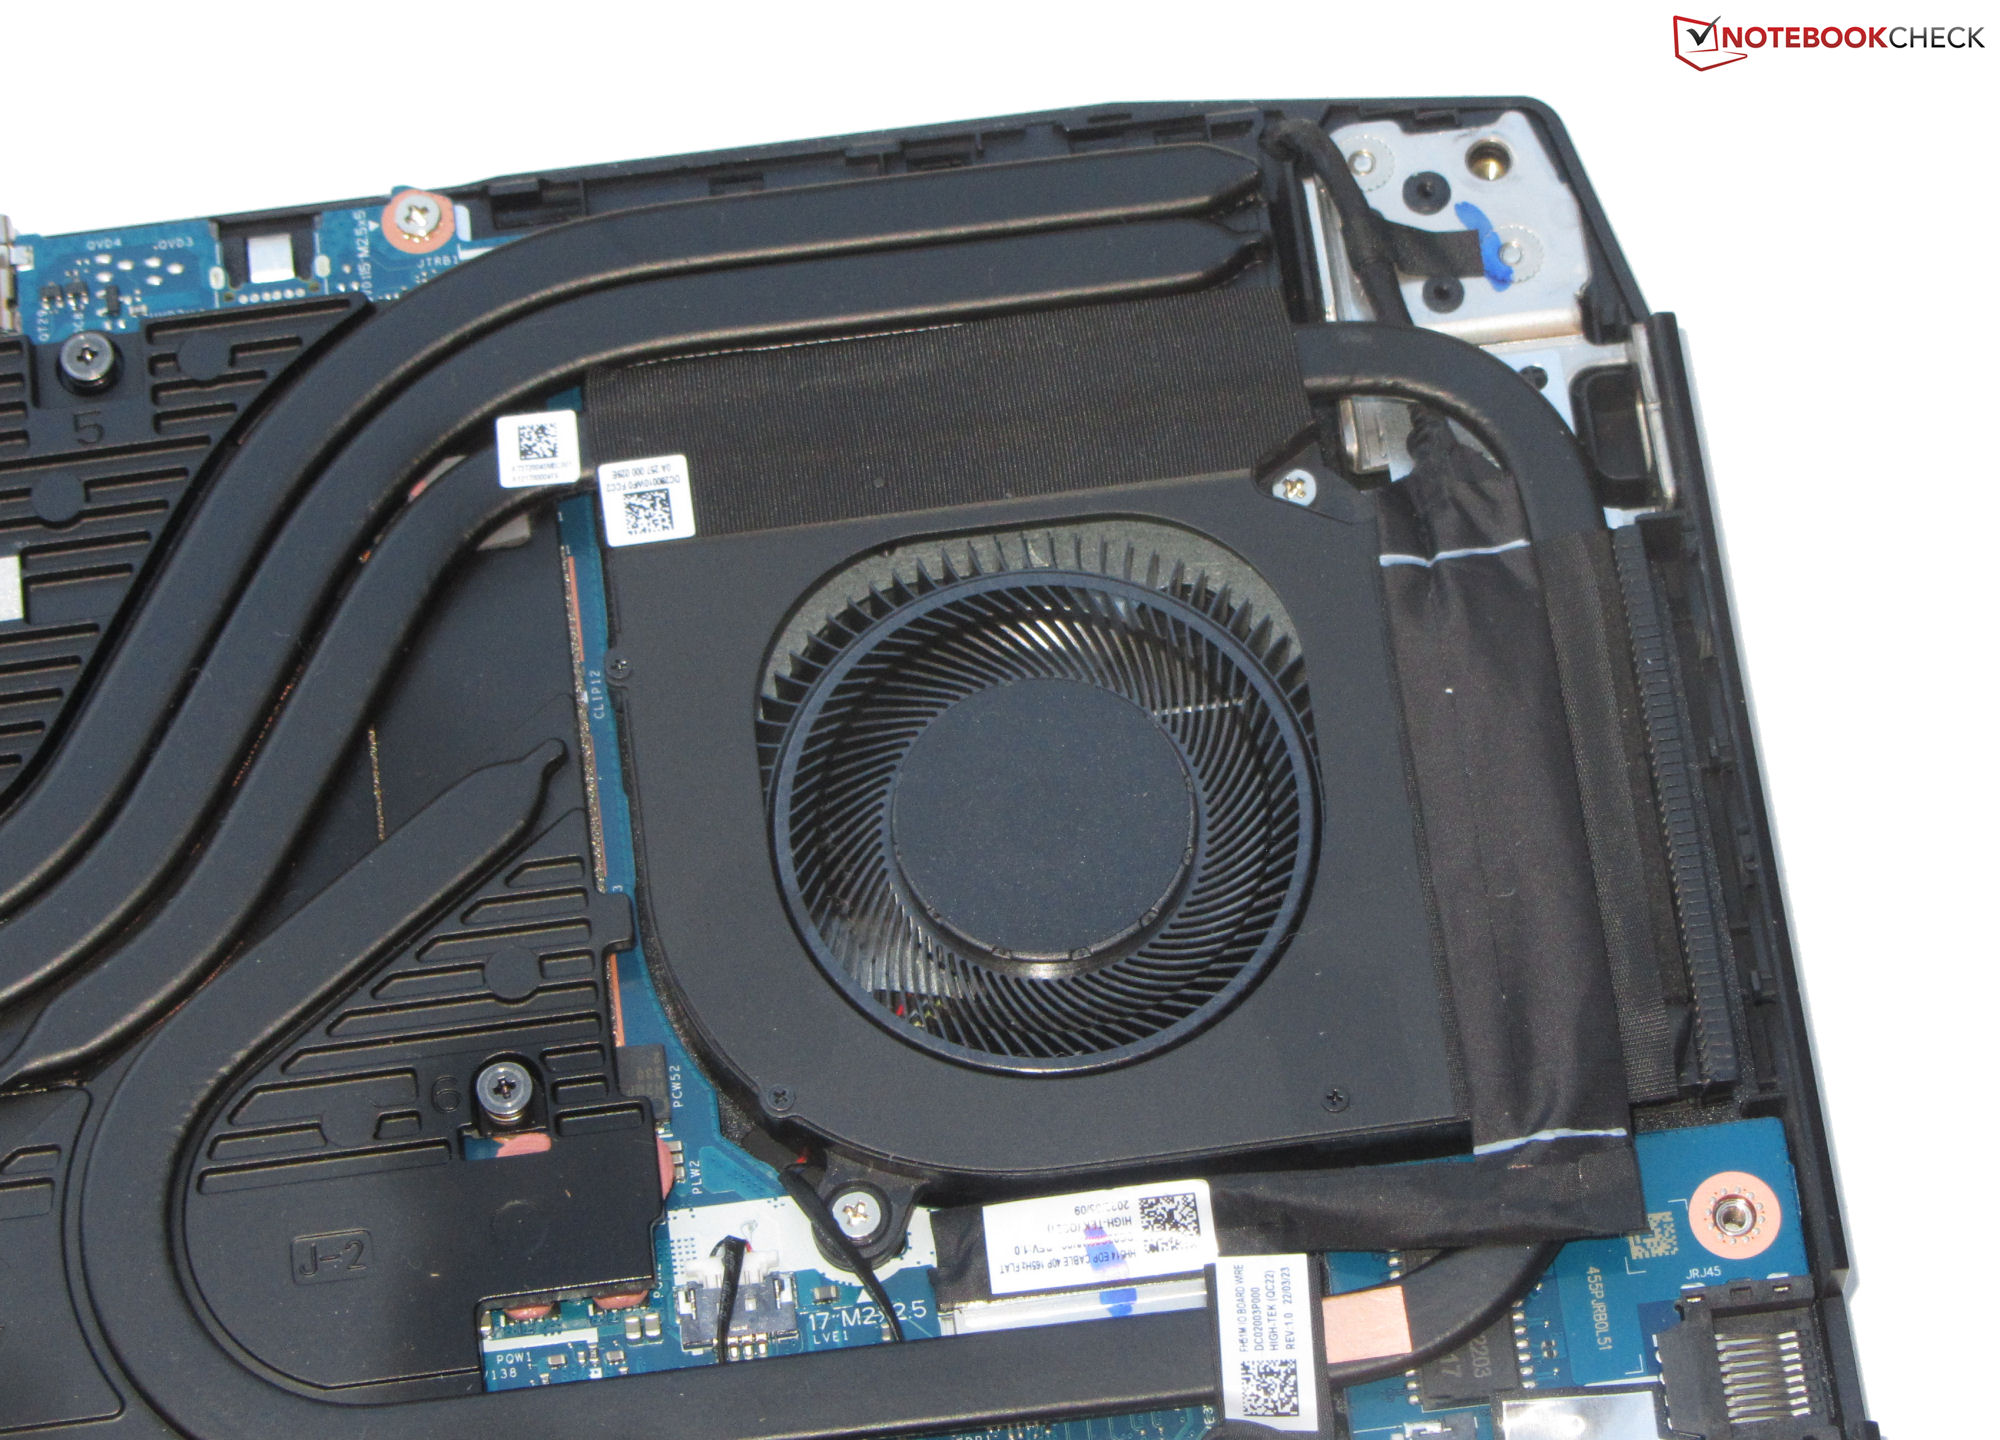
Lors d'une utilisation quotidienne (bureau, internet) et en mode ralenti, les deux ventilateurs restent assez silencieux et peuvent même s'arrêter de fonctionner de temps en temps. Cependant, ils sont quelque peu imprévisibles et le niveau sonore peut augmenter jusqu'à 44,3 dB(A). En charge, nous avons mesuré un maximum de 53,6 dB(A), ce qui est plutôt fort.
La vitesse du ventilateur peut être ralentie à l'aide du logiciel NitroSense de l'appareil, mais la courbe du ventilateur ne peut pas être ajustée. L'évolution du bruit est très similaire dans les profils "silencieux" et "standard".
Degré de la nuisance sonore
| Au repos |
| 25 / 28.6 / 44.3 dB(A) |
| Fortement sollicité |
| 47.6 / 53.6 dB(A) |
 | ||
30 dB silencieux 40 dB(A) audible 50 dB(A) bruyant |
||
min: | ||
| Acer Nitro 5 AN515-46-R1A1 GeForce RTX 3070 Ti Laptop GPU, R7 6800H, Micron 3400 1TB MTFDKBA1T0TFH | MSI Katana GF66 12UGS GeForce RTX 3070 Ti Laptop GPU, i7-12700H, Micron 2450 1TB MTFDKBA1T0TFK | Schenker XMG Fusion 15 (Mid 22) GeForce RTX 3070 Laptop GPU, i7-11800H, Samsung SSD 980 Pro 1TB MZ-V8P1T0BW | Asus TUF Dash F15 FX517ZR GeForce RTX 3070 Laptop GPU, i7-12650H, Samsung PM991a MZVLQ1T0HBLB | Acer Nitro 5 AN515-58-72QR GeForce RTX 3070 Ti Laptop GPU, i7-12700H, Samsung PM9A1 MZVL21T0HCLR | |
|---|---|---|---|---|---|
| Noise | 7% | 7% | 2% | 3% | |
| arrêt / environnement * (dB) | 25 | 26 -4% | 26 -4% | 26 -4% | 26 -4% |
| Idle Minimum * (dB) | 25 | 27 -8% | 26 -4% | 26 -4% | 26 -4% |
| Idle Average * (dB) | 28.6 | 28 2% | 28 2% | 32 -12% | 29 -1% |
| Idle Maximum * (dB) | 44.3 | 31 30% | 31 30% | 33 26% | 33 26% |
| Load Average * (dB) | 47.6 | 44 8% | 45 5% | 48 -1% | 47 1% |
| Load Maximum * (dB) | 53.6 | 45 16% | 48 10% | 49 9% | 53 1% |
| Witcher 3 ultra * (dB) | 44 | 46 | 47 | 53 |
* ... Moindre est la valeur, meilleures sont les performances
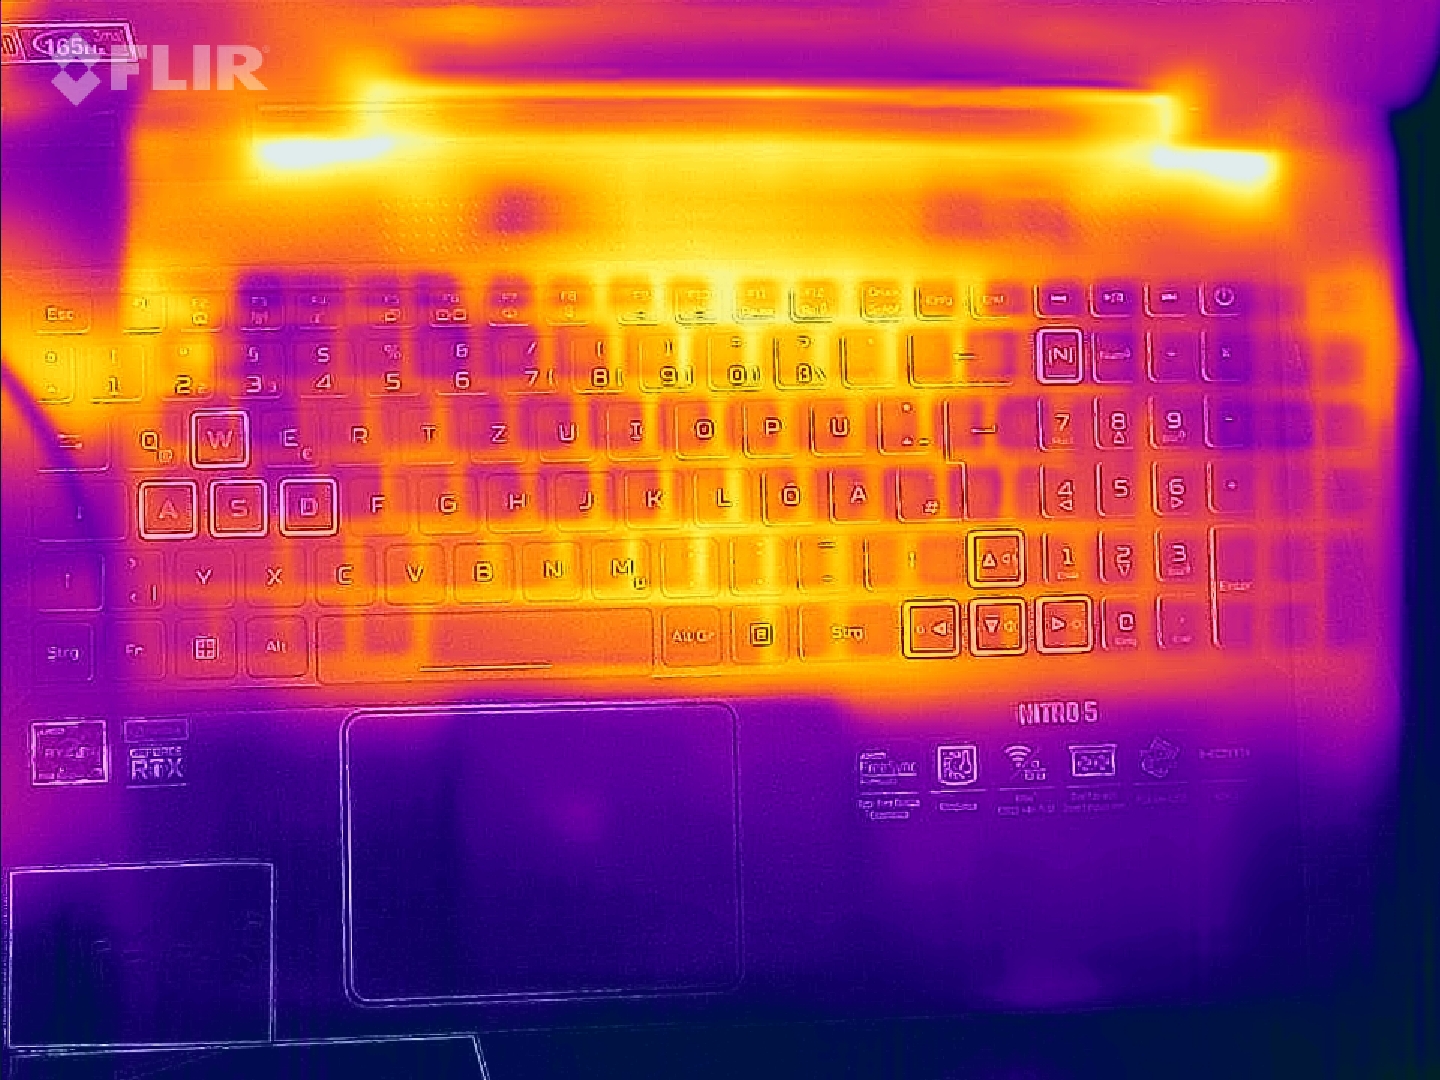
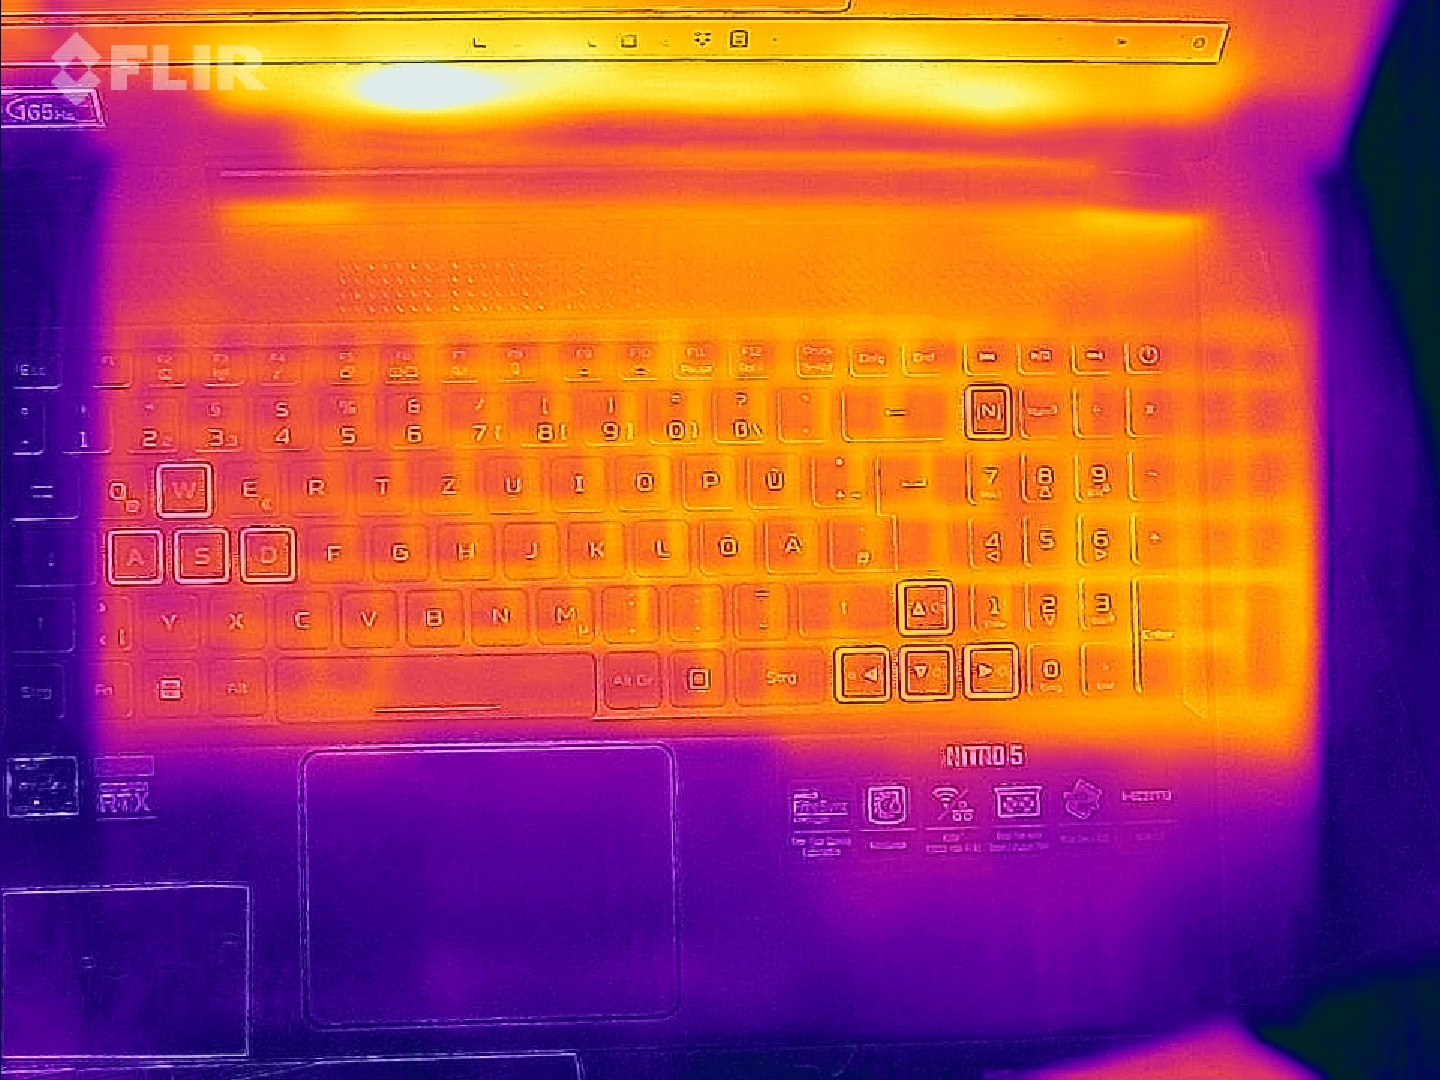
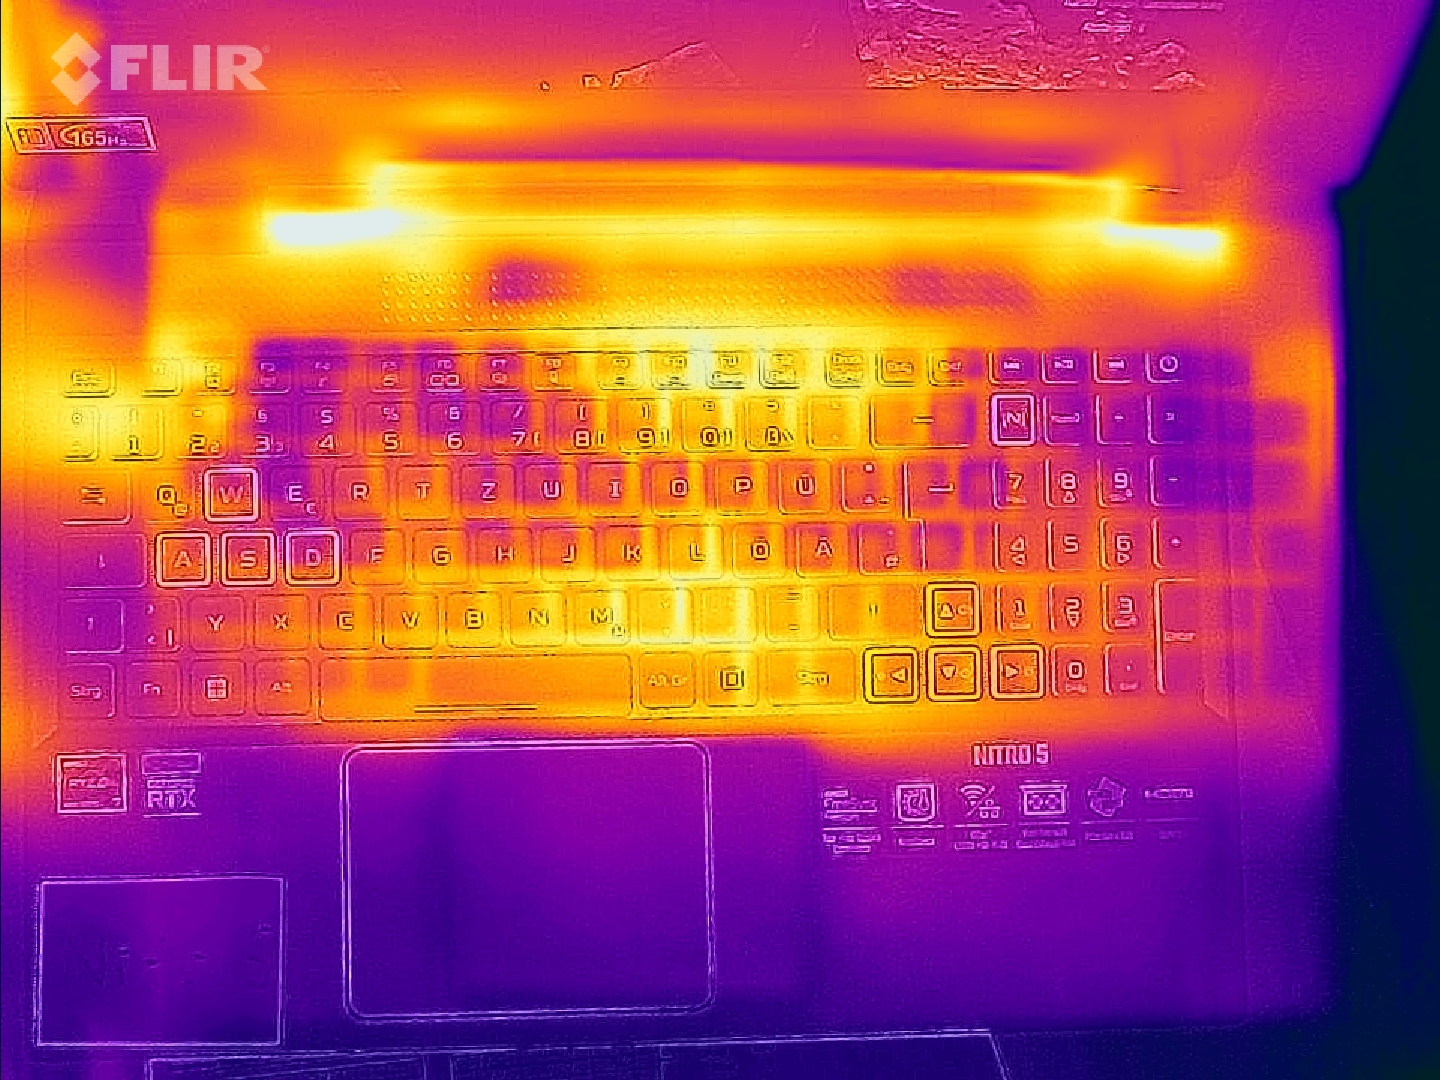
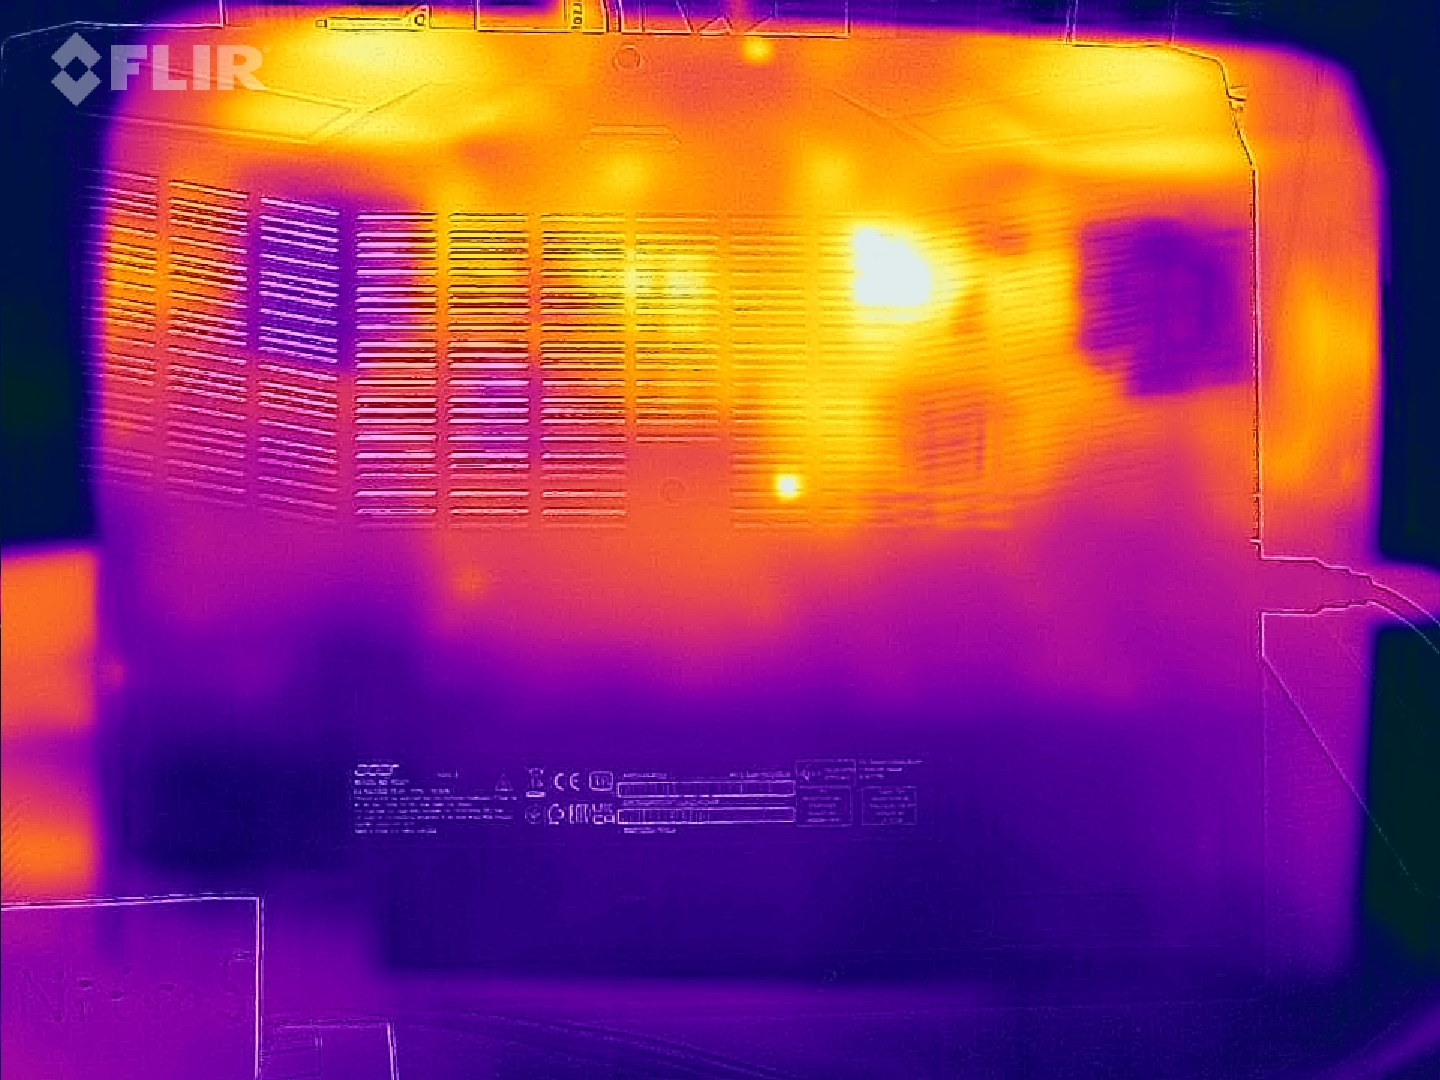
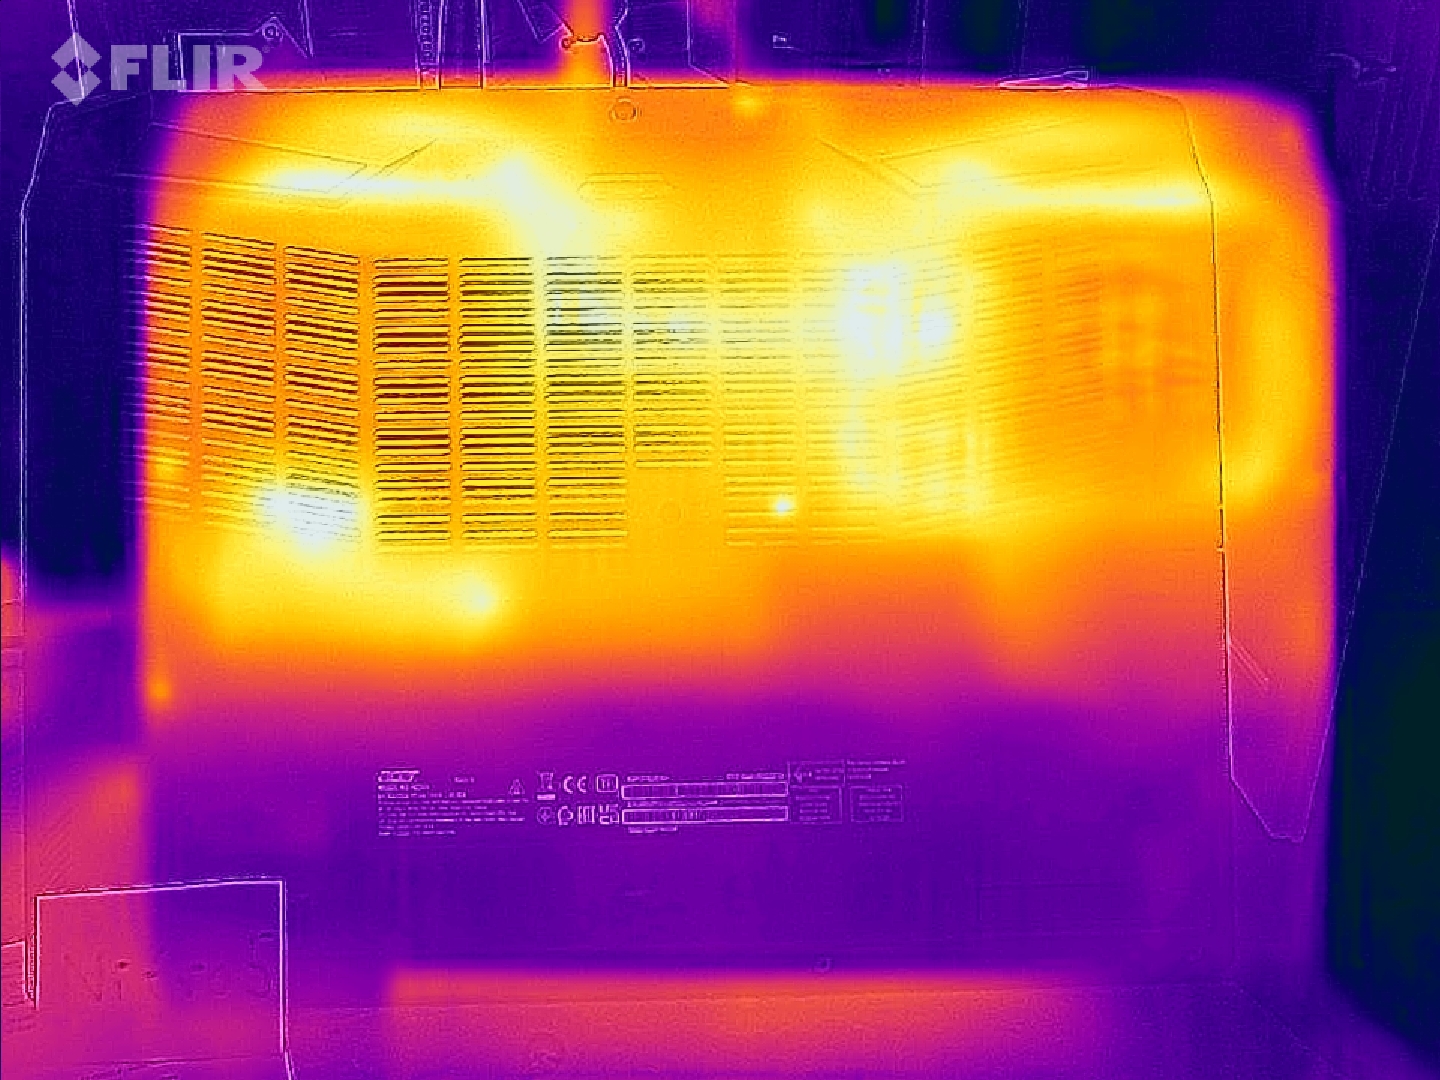
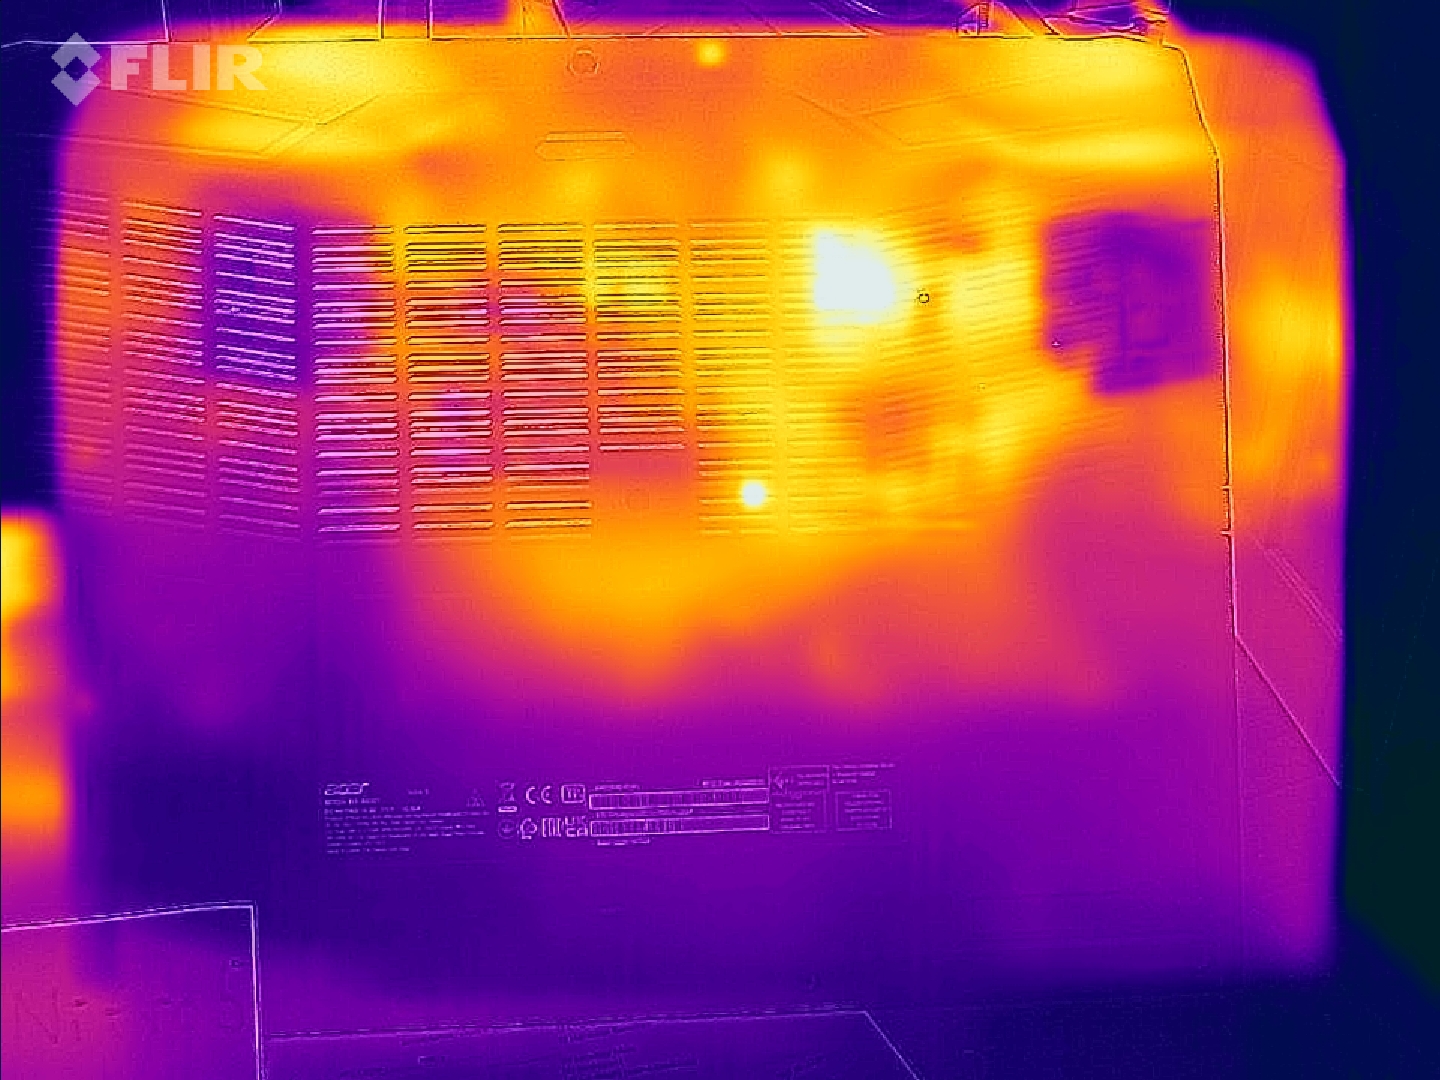
Température
Les températures de surface restent acceptables dans le cadre d'une utilisation quotidienne (bureau, Internet) et n'augmentent que modérément en cas de charge (test de résistance, Witcher 3). Cette situation est très différente de celle du modèle jumeau.
(-) La température maximale du côté supérieur est de 48.1 °C / 119 F, par rapport à la moyenne de 40.4 °C / 105 F, allant de 21.2 à 68.8 °C pour la classe Gaming.
(-) Le fond chauffe jusqu'à un maximum de 49.7 °C / 121 F, contre une moyenne de 43.2 °C / 110 F
(+) En utilisation inactive, la température moyenne du côté supérieur est de 26.4 °C / 80 F, par rapport à la moyenne du dispositif de 33.9 °C / 93 F.
(+) En jouant à The Witcher 3, la température moyenne du côté supérieur est de 31.8 °C / 89 F, alors que la moyenne de l'appareil est de 33.9 °C / 93 F.
(+) Les repose-poignets et le pavé tactile sont plus froids que la température de la peau avec un maximum de 25.2 °C / 77.4 F et sont donc froids au toucher.
(+) La température moyenne de la zone de l'appui-paume de dispositifs similaires était de 28.8 °C / 83.8 F (+3.6 °C / #6.4 F).
| Acer Nitro 5 AN515-46-R1A1 AMD Ryzen 7 6800H, NVIDIA GeForce RTX 3070 Ti Laptop GPU | MSI Katana GF66 12UGS Intel Core i7-12700H, NVIDIA GeForce RTX 3070 Ti Laptop GPU | Schenker XMG Fusion 15 (Mid 22) Intel Core i7-11800H, NVIDIA GeForce RTX 3070 Laptop GPU | Asus TUF Dash F15 FX517ZR Intel Core i7-12650H, NVIDIA GeForce RTX 3070 Laptop GPU | Acer Nitro 5 AN515-58-72QR Intel Core i7-12700H, NVIDIA GeForce RTX 3070 Ti Laptop GPU | |
|---|---|---|---|---|---|
| Heat | -25% | -20% | -9% | -5% | |
| Maximum Upper Side * (°C) | 48.1 | 61 -27% | 52 -8% | 52 -8% | 48 -0% |
| Maximum Bottom * (°C) | 49.7 | 55 -11% | 63 -27% | 52 -5% | 51 -3% |
| Idle Upper Side * (°C) | 30 | 43 -43% | 37 -23% | 33 -10% | 34 -13% |
| Idle Bottom * (°C) | 31.7 | 38 -20% | 38 -20% | 36 -14% | 33 -4% |
* ... Moindre est la valeur, meilleures sont les performances
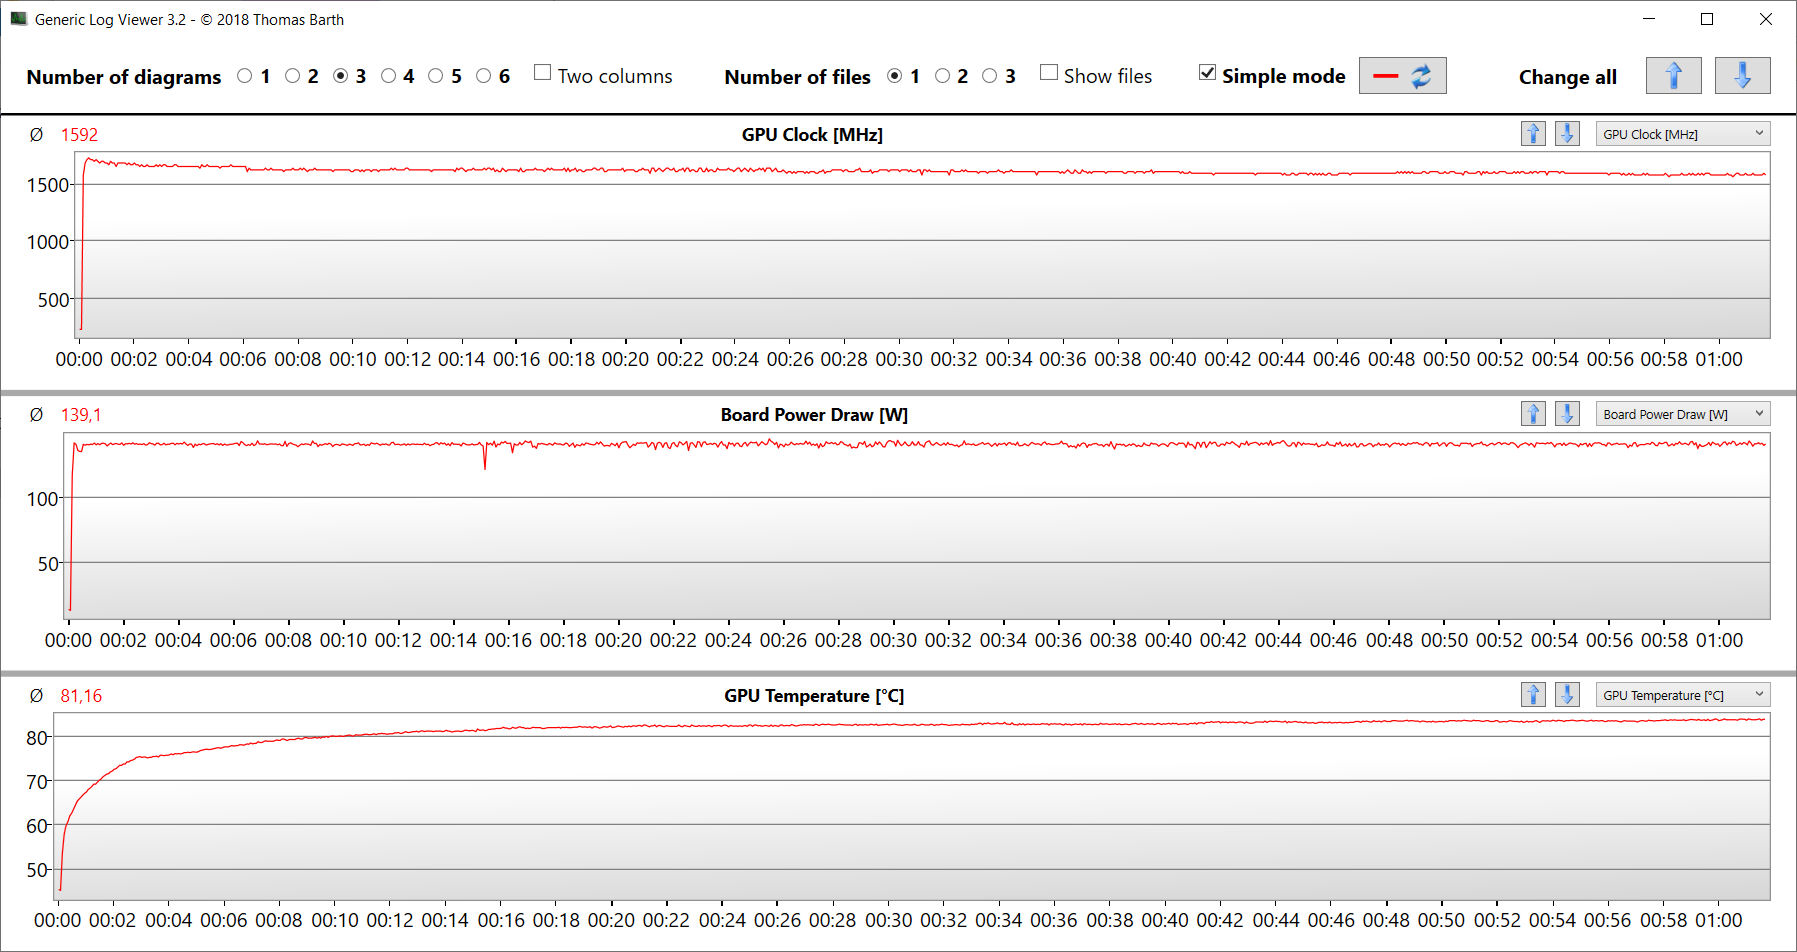
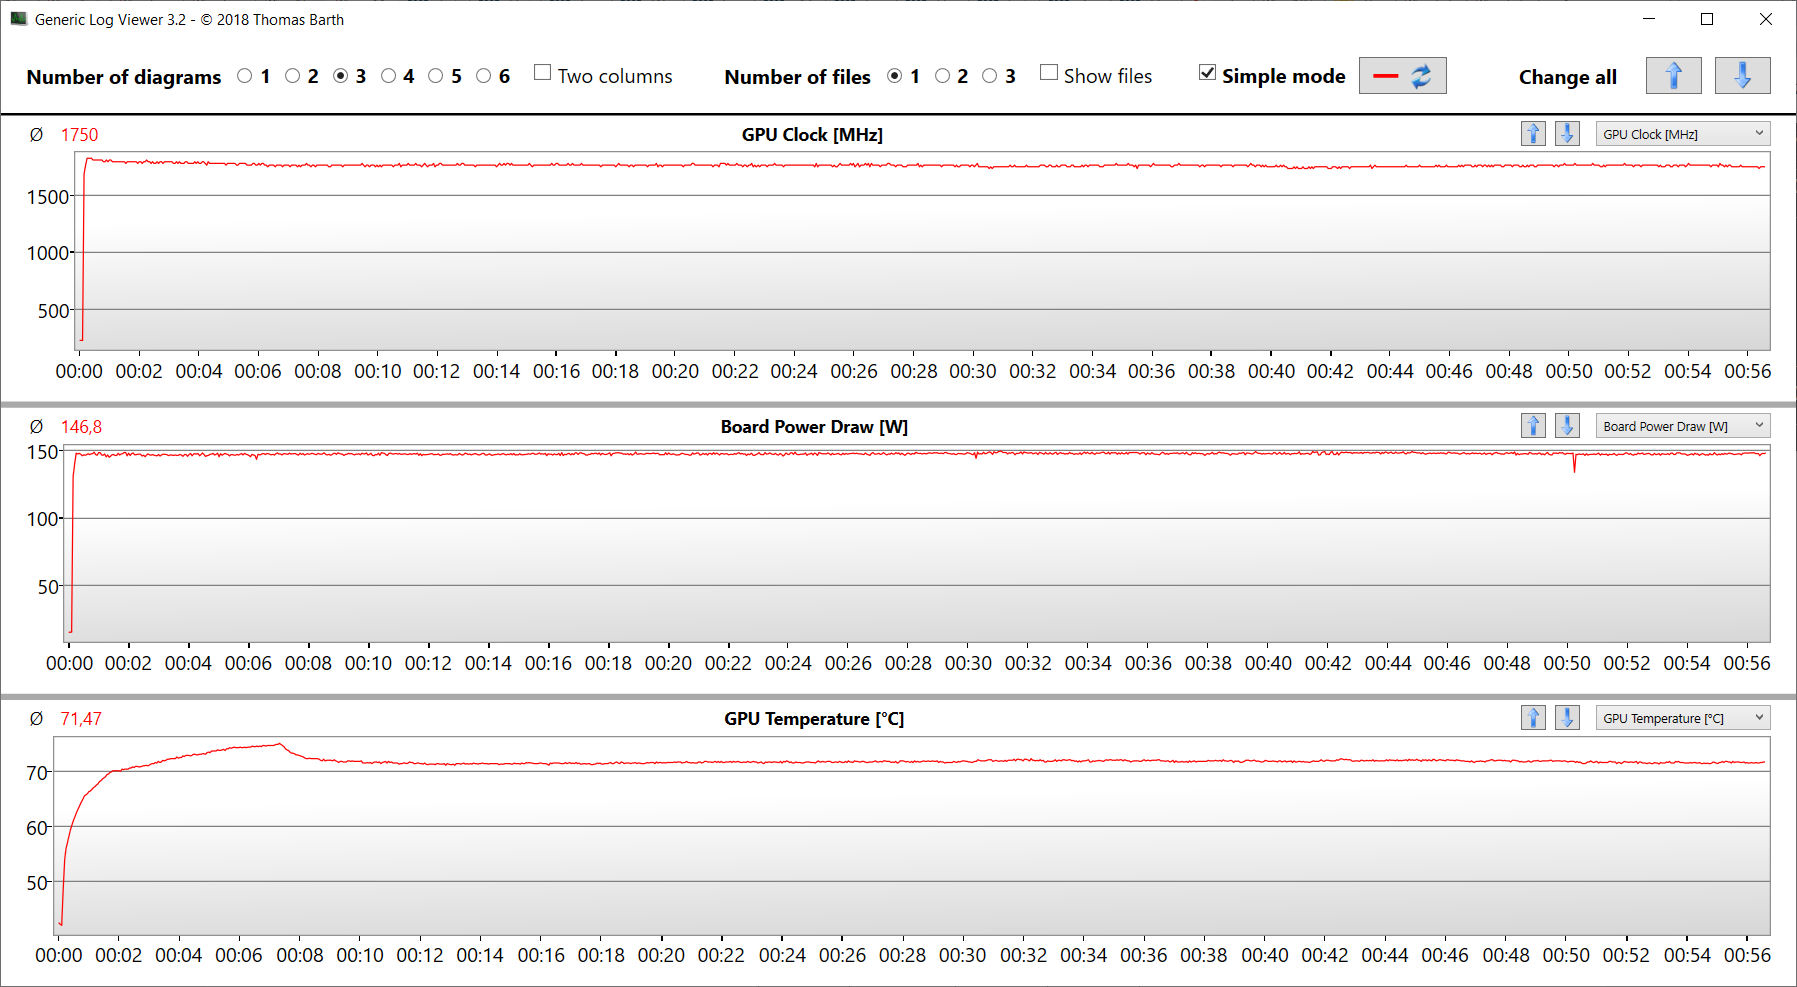
Test de stress
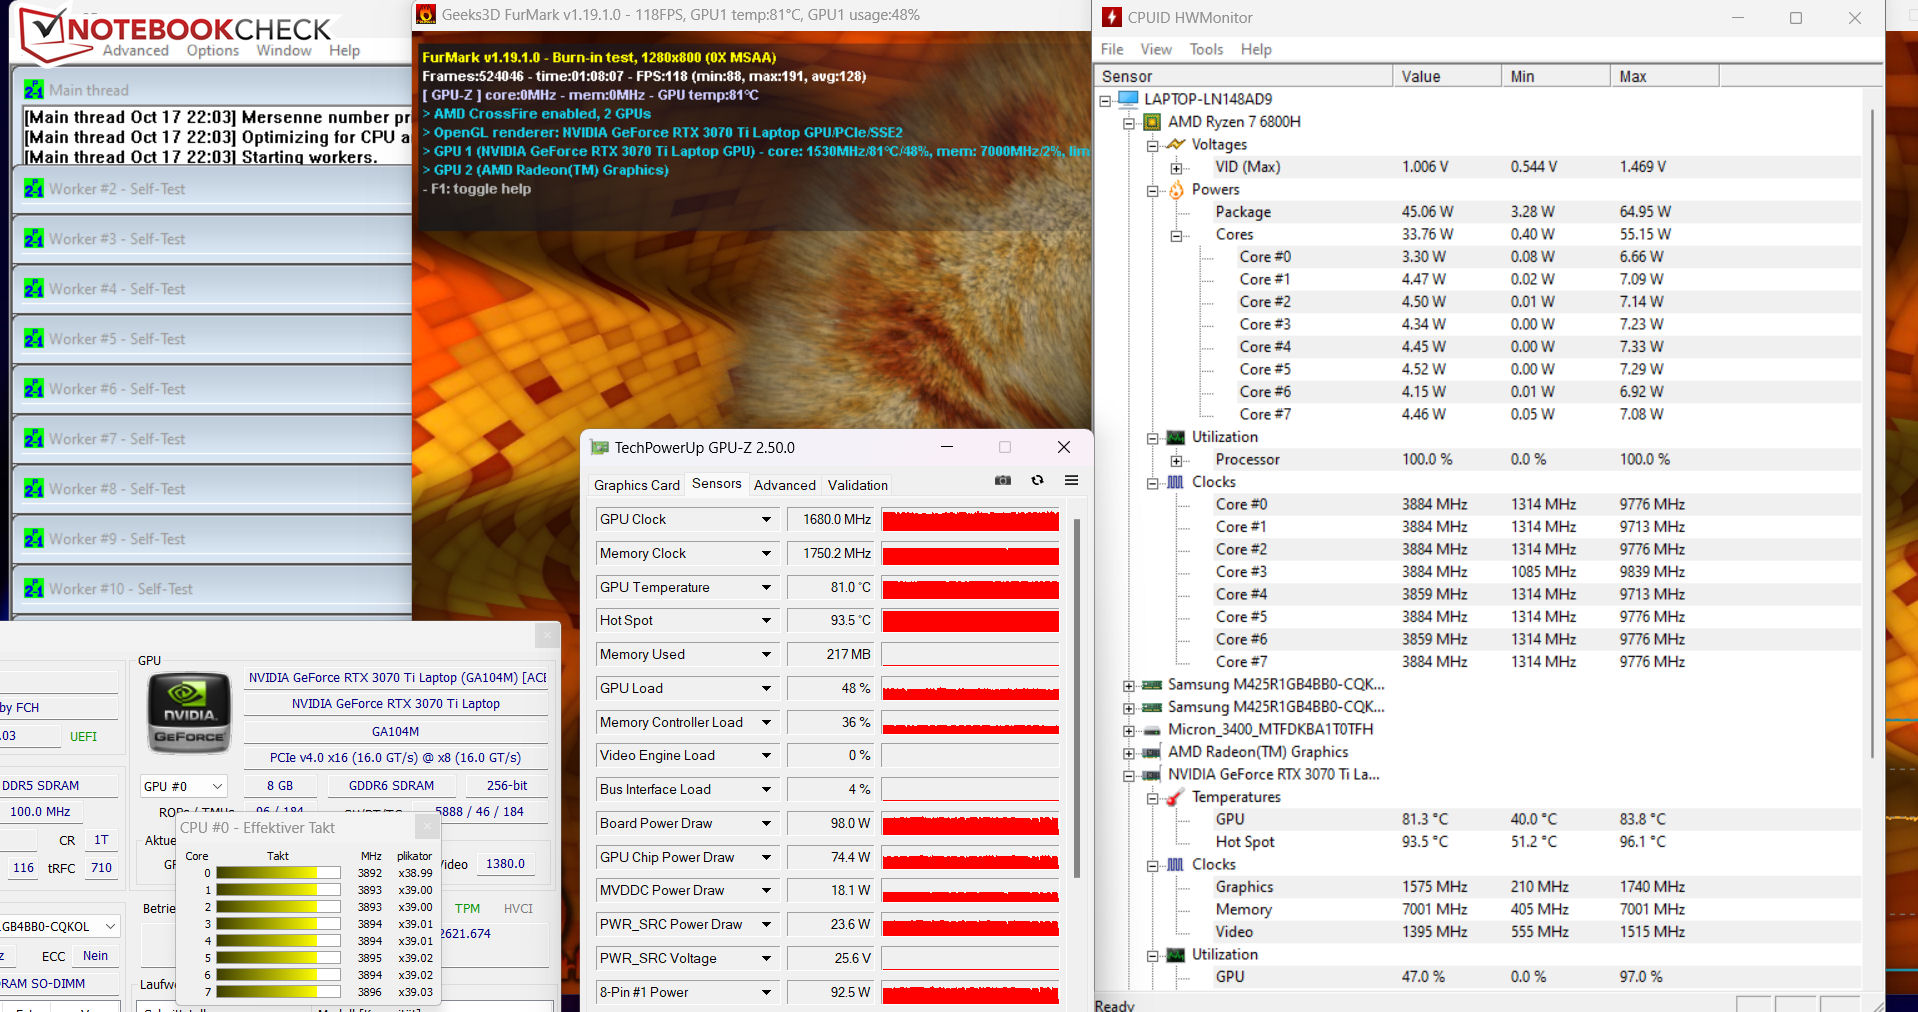
Le test de stress (Prime95 et FurMark sont activés en permanence) est un scénario extrême qui nous permet d'examiner la stabilité du système sous une charge maximale. Le CPU (4,2 à 4,3 GHz) et le GPU (1 000 à 1 600 MHz) commencent le test avec des fréquences d'horloge élevées. Alors que la fréquence d'horloge du CPU diminue légèrement au cours du test, la fréquence d'horloge du GPU se stabilise à un niveau élevé.
Haut-parleurs
Le son produit par les haut-parleurs stéréo est adéquat mais pourrait bénéficier de plus de basses.
Acer Nitro 5 AN515-46-R1A1 analyse audio
(±) | le niveau sonore du haut-parleur est moyen mais bon (76.3# dB)
Basses 100 - 315 Hz
(-) | presque aucune basse - en moyenne 23% plus bas que la médiane
(±) | la linéarité des basses est moyenne (14.2% delta à la fréquence précédente)
Médiums 400 - 2000 Hz
(+) | médiane équilibrée - seulement 3.1% de la médiane
(+) | les médiums sont linéaires (6.9% delta à la fréquence précédente)
Aiguës 2 - 16 kHz
(+) | des sommets équilibrés - à seulement 3.4% de la médiane
(+) | les aigus sont linéaires (6.3% delta à la fréquence précédente)
Globalement 100 - 16 000 Hz
(±) | la linéarité du son global est moyenne (19.7% de différence avec la médiane)
Par rapport à la même classe
» 69% de tous les appareils testés de cette catégorie étaient meilleurs, 6% similaires, 25% pires
» Le meilleur avait un delta de 6%, la moyenne était de 18%, le pire était de 132%.
Par rapport à tous les appareils testés
» 50% de tous les appareils testés étaient meilleurs, 7% similaires, 43% pires
» Le meilleur avait un delta de 4%, la moyenne était de 23%, le pire était de 134%.
Schenker XMG Fusion 15 (Mid 22) analyse audio
(+) | les haut-parleurs peuvent jouer relativement fort (82# dB)
Basses 100 - 315 Hz
(-) | presque aucune basse - en moyenne 17.6% plus bas que la médiane
(±) | la linéarité des basses est moyenne (12.1% delta à la fréquence précédente)
Médiums 400 - 2000 Hz
(+) | médiane équilibrée - seulement 3% de la médiane
(+) | les médiums sont linéaires (3.9% delta à la fréquence précédente)
Aiguës 2 - 16 kHz
(+) | des sommets équilibrés - à seulement 2.8% de la médiane
(+) | les aigus sont linéaires (5.5% delta à la fréquence précédente)
Globalement 100 - 16 000 Hz
(+) | le son global est linéaire (13.3% différence à la médiane)
Par rapport à la même classe
» 19% de tous les appareils testés de cette catégorie étaient meilleurs, 5% similaires, 76% pires
» Le meilleur avait un delta de 6%, la moyenne était de 18%, le pire était de 132%.
Par rapport à tous les appareils testés
» 14% de tous les appareils testés étaient meilleurs, 3% similaires, 83% pires
» Le meilleur avait un delta de 4%, la moyenne était de 23%, le pire était de 134%.
Gestion de l'énergie - Ordinateur Acer avec une autonomie décente
Consommation d'énergie
Nous n'avons pas remarqué d'incohérence en ce qui concerne la consommation d'énergie de l'AN515. La consommation a augmenté jusqu'à 230 watts et une moyenne de 203 watts pendant le test de stress /Witcher 3, mais elle est restée stable pendant les deux tests. L'adaptateur secteur (puissance nominale : 280 watts) est suffisamment grand pour couvrir les besoins de cet appareil.
| Éteint/en veille | |
| Au repos | |
| Fortement sollicité |
|
Légende:
min: | |
| Acer Nitro 5 AN515-46-R1A1 R7 6800H, GeForce RTX 3070 Ti Laptop GPU, Micron 3400 1TB MTFDKBA1T0TFH, IPS, 1920x1080, 15.6" | MSI Katana GF66 12UGS i7-12700H, GeForce RTX 3070 Ti Laptop GPU, Micron 2450 1TB MTFDKBA1T0TFK, IPS, 1920x1080, 15.6" | Schenker XMG Fusion 15 (Mid 22) i7-11800H, GeForce RTX 3070 Laptop GPU, Samsung SSD 980 Pro 1TB MZ-V8P1T0BW, IPS, 2560x1440, 15.6" | Asus TUF Dash F15 FX517ZR i7-12650H, GeForce RTX 3070 Laptop GPU, Samsung PM991a MZVLQ1T0HBLB, IPS, 2560x1440, 15.6" | Acer Nitro 5 AN515-58-72QR i7-12700H, GeForce RTX 3070 Ti Laptop GPU, Samsung PM9A1 MZVL21T0HCLR, IPS, 2560x1440, 15.6" | Moyenne NVIDIA GeForce RTX 3070 Ti Laptop GPU | Moyenne de la classe Gaming | |
|---|---|---|---|---|---|---|---|
| Power Consumption | -5% | -25% | -8% | -15% | -56% | -48% | |
| Idle Minimum * (Watt) | 7 | 9 -29% | 12 -71% | 10 -43% | 7 -0% | 14.2 ? -103% | 13 ? -86% |
| Idle Average * (Watt) | 8.9 | 13 -46% | 17 -91% | 14 -57% | 15 -69% | 19.9 ? -124% | 19 ? -113% |
| Idle Maximum * (Watt) | 14.4 | 20 -39% | 24 -67% | 20 -39% | 24 -67% | 26.2 ? -82% | 24.6 ? -71% |
| Load Average * (Watt) | 202 | 100 50% | 106 48% | 122 40% | 124 39% | 125.8 ? 38% | 110.7 ? 45% |
| Witcher 3 ultra * (Watt) | 203 | 149 27% | 159.9 21% | 138.6 32% | 195.1 4% | ||
| Load Maximum * (Watt) | 230 | 212 8% | 208 10% | 189 18% | 220 4% | 248 ? -8% | 259 ? -13% |
* ... Moindre est la valeur, meilleures sont les performances
Power consumption Witcher 3 / stress test
Power consumption with an external screen
Autonomie de la batterie
Après le MSI Katana (52 Wh), le Nitro a la plus faible capacité de batterie dans notre champ de comparaison (57,5 Wh). Il atteint néanmoins une autonomie décente et peut même rivaliser avec certains de ses concurrents plus généreusement équipés. Il surpasse clairement son modèle jumeau à base de processeur Intel, grâce au processeur AMD plus frugal et à la résolution d'écran inférieure.
| Acer Nitro 5 AN515-46-R1A1 R7 6800H, GeForce RTX 3070 Ti Laptop GPU, 57.5 Wh | MSI Katana GF66 12UGS i7-12700H, GeForce RTX 3070 Ti Laptop GPU, 52 Wh | Schenker XMG Fusion 15 (Mid 22) i7-11800H, GeForce RTX 3070 Laptop GPU, 93.48 Wh | Asus TUF Dash F15 FX517ZR i7-12650H, GeForce RTX 3070 Laptop GPU, 76 Wh | Acer Nitro 5 AN515-58-72QR i7-12700H, GeForce RTX 3070 Ti Laptop GPU, 57.5 Wh | Moyenne de la classe Gaming | |
|---|---|---|---|---|---|---|
| Autonomie de la batterie | -26% | 37% | 26% | -26% | 16% | |
| Reader / Idle (h) | 10.5 | 15.5 48% | 10.8 3% | 5.7 -46% | 8.27 ? -21% | |
| H.264 (h) | 5.7 | 7.5 32% | 5.8 2% | 4.7 -18% | 8.32 ? 46% | |
| WiFi v1.3 (h) | 5.8 | 2.4 -59% | 7.4 28% | 7 21% | 3.9 -33% | 7.11 ? 23% |
| Load (h) | 1.3 | 1.4 8% | 1.8 38% | 2.3 77% | 1.2 -8% | 1.502 ? 16% |
Points positifs
Points négatifs
Verdict : un ordinateur portable de jeu bien équilibré
Le Nitro 5 est conçu pour les jeux en FHD avec des paramètres maximaux, grâce à un processeur Ryzen 7800H.Ryzen 7-6800Het un ordinateur portableGeForce RTX 3070-Ti LaptopgPU (TGP : 150 W). Le SSD PCIe-4 rapide (1 To) offre l'espace de stockage nécessaire et garantit des temps de chargement courts.
Le Nitro 5 AN515-46 d'Acer est un ordinateur portable de jeu FHD rapide qui ne présente pas de faiblesses sérieuses.
Le processeur et le GPU peuvent fournir des fréquences d'horloge élevées et constantes. L'appareil ne chauffe que modérément sous charge. Malheureusement, ses émissions sonores ne sont pas meilleures que d'habitude : le Nitro 5 peut être assez bruyant. L'écran mat de 15,6 pouces (FHD, IPS, 165 Hz) nous a fait bonne impression.
L'autonomie de la batterie de l'ordinateur portable est décente, mais rien d'extraordinaire. La batterie peut être rechargée avec un adaptateur secteur universel USB-C (min. 65 watts, 20 V), car le port USB 4 prend en charge Power Delivery (et DisplayPort). Cela signifie que les utilisateurs n'auront pas nécessairement à transporter le lourd bloc d'alimentation de 280 W avec eux.
Quel modèle de Nitro 5 est le meilleur choix ? Cela dépend de vos besoins. La version AMD dispose d'une mémoire DDR5, de faibles valeurs de consommation d'énergie et d'une meilleure autonomie. Elle chauffe également moins. Le siteModèle Inteloffre des performances de CPU à un seul thread plus élevées, Thunderbolt 4 et un meilleur écran. Mais n'oubliez pas : les deux versions du Nitro sont disponibles avec une dalle FHD ou QHD
Parmi les alternatives au Nitro, citonsSchenker XMG Fusion 15 (Mid 22)et leAsus TUF Dash F15. Ces deux appareils offrent une performance GPU inférieure et chauffent sensiblement sous charge. D'un autre côté, ils sont plus compacts, pèsent moins et ont une plus grande autonomie. Le Fusion offre de loin la plus longue durée de fonctionnement.
Prix et disponibilité
L'Acer Nitro 5 AN515-46 est disponible sur le site Web du fabricant au prix de 2200 $.
Acer Nitro 5 AN515-46-R1A1
- 10/28/2022 v7 (old)
Sascha Mölck
Price comparison

