Test du Schenker XMG Fusion 15 (mi 22) : PC portable RTX 3070 léger avec bonne autonomie
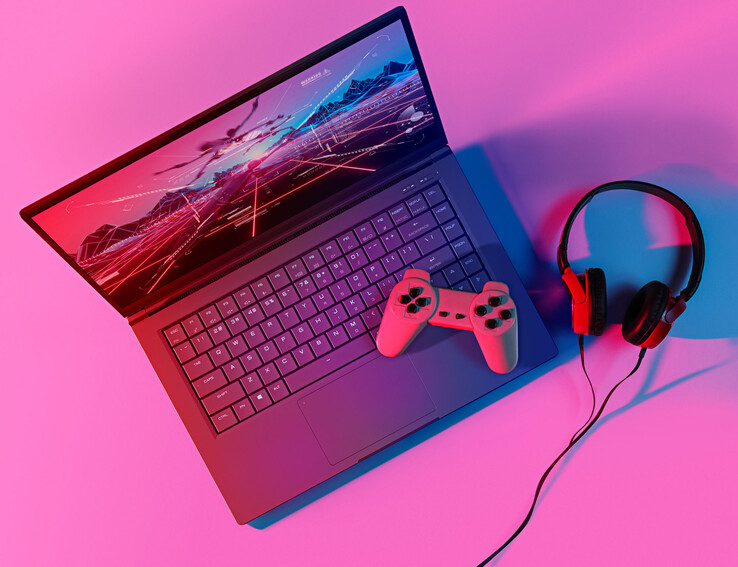
Le Schenker XMG Fusion 15 est principalement un ordinateur portable de jeu, mais il est également conçu pour le secteur de la création. L'appareil offre un compromis entre les performances, la petite taille et la portabilité : matériel haut de gamme (Core i7-11800H,GeForce Ordinateur portable RTX 3070) est associé à une batterie de 93 Wh et intégré dans un boîtier compact. L'ensemble pèse un peu moins de 2 kg. Un barebone d'Intel (NUC X15 Laptop Kit C71FBF) sert de base au Fusion.
Ses concurrents sont des appareils tout aussi compacts et légers, comme le Razer Blade 15 Base modelleMSI Delta 15et leAsus TUF Dash F15 FX517ZR. Le groupe plus large de concurrents comprend des ordinateurs portables comme le Acer Nitro 5 AN515-58et le HP Omen 16.
Comparaison avec les concurrents potentiels
Note | Date | Modèle | Poids | Épaisseur | Taille | Résolution | Prix |
|---|---|---|---|---|---|---|---|
| 87.4 % v7 (old) | 08/22 | Schenker XMG Fusion 15 (Mid 22) i7-11800H, GeForce RTX 3070 Laptop GPU | 1.9 kg | 21.65 mm | 15.60" | 2560x1440 | |
| 85.8 % v7 (old) | 07/22 | Asus TUF Dash F15 FX517ZR i7-12650H, GeForce RTX 3070 Laptop GPU | 2 kg | 20.7 mm | 15.60" | 2560x1440 | |
| 84 % v7 (old) | 06/22 | Acer Nitro 5 AN515-58-72QR i7-12700H, GeForce RTX 3070 Ti Laptop GPU | 2.5 kg | 26.8 mm | 15.60" | 2560x1440 | |
| 85.5 % v7 (old) | 05/22 | HP Omen 16-b1090ng i7-12700H, GeForce RTX 3070 Ti Laptop GPU | 2.3 kg | 23 mm | 16.10" | 2560x1440 | |
| 82.9 % v7 (old) | 10/21 | MSI Delta 15 A5EFK R9 5900HX, Radeon RX 6700M | 2 kg | 19 mm | 15.60" | 1920x1080 | |
| 85.5 % v7 (old) | 03/21 | Razer Blade 15 Base Edition 2021, i7-10750H RTX 3060 i7-10750H, GeForce RTX 3060 Laptop GPU | 2.1 kg | 19.9 mm | 15.60" | 1920x1080 |
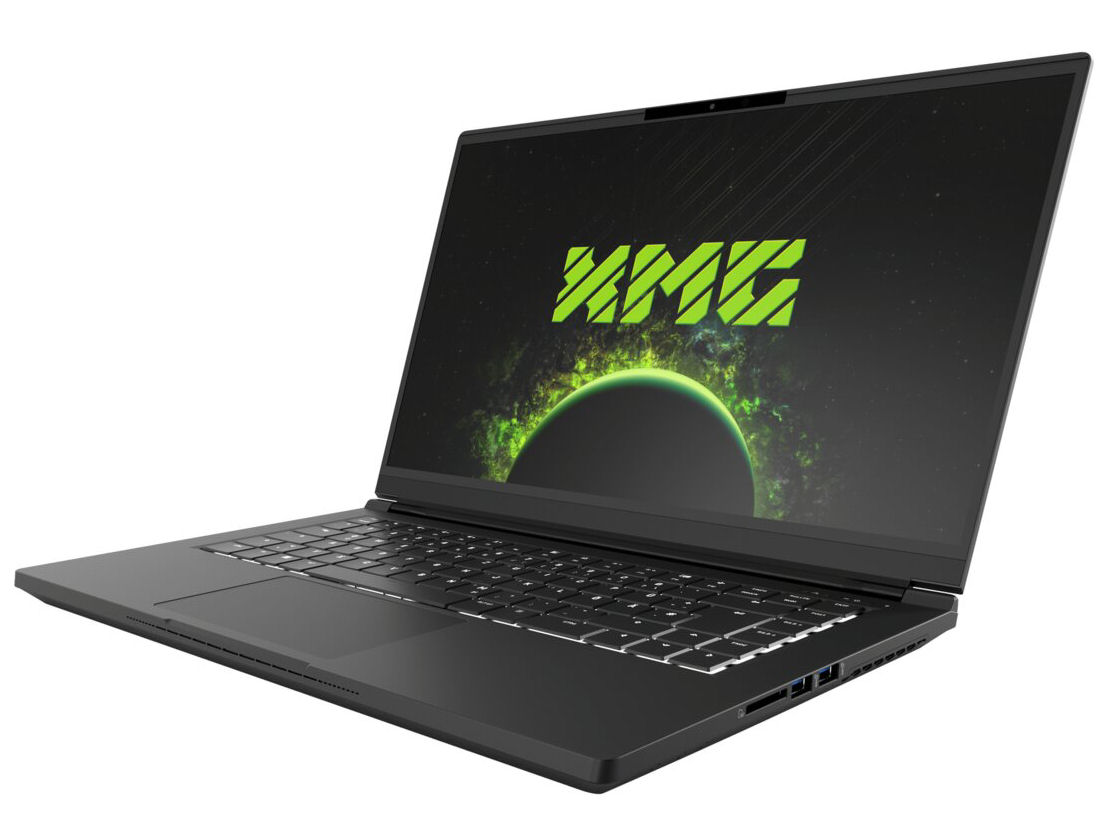
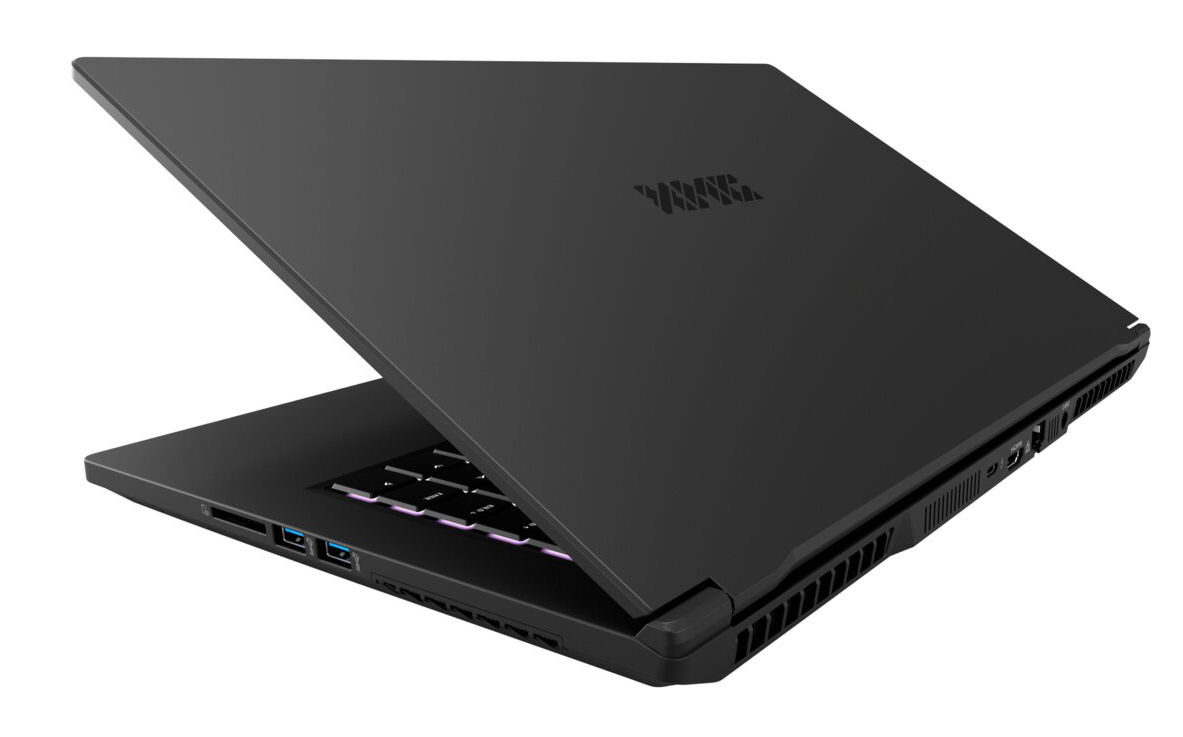
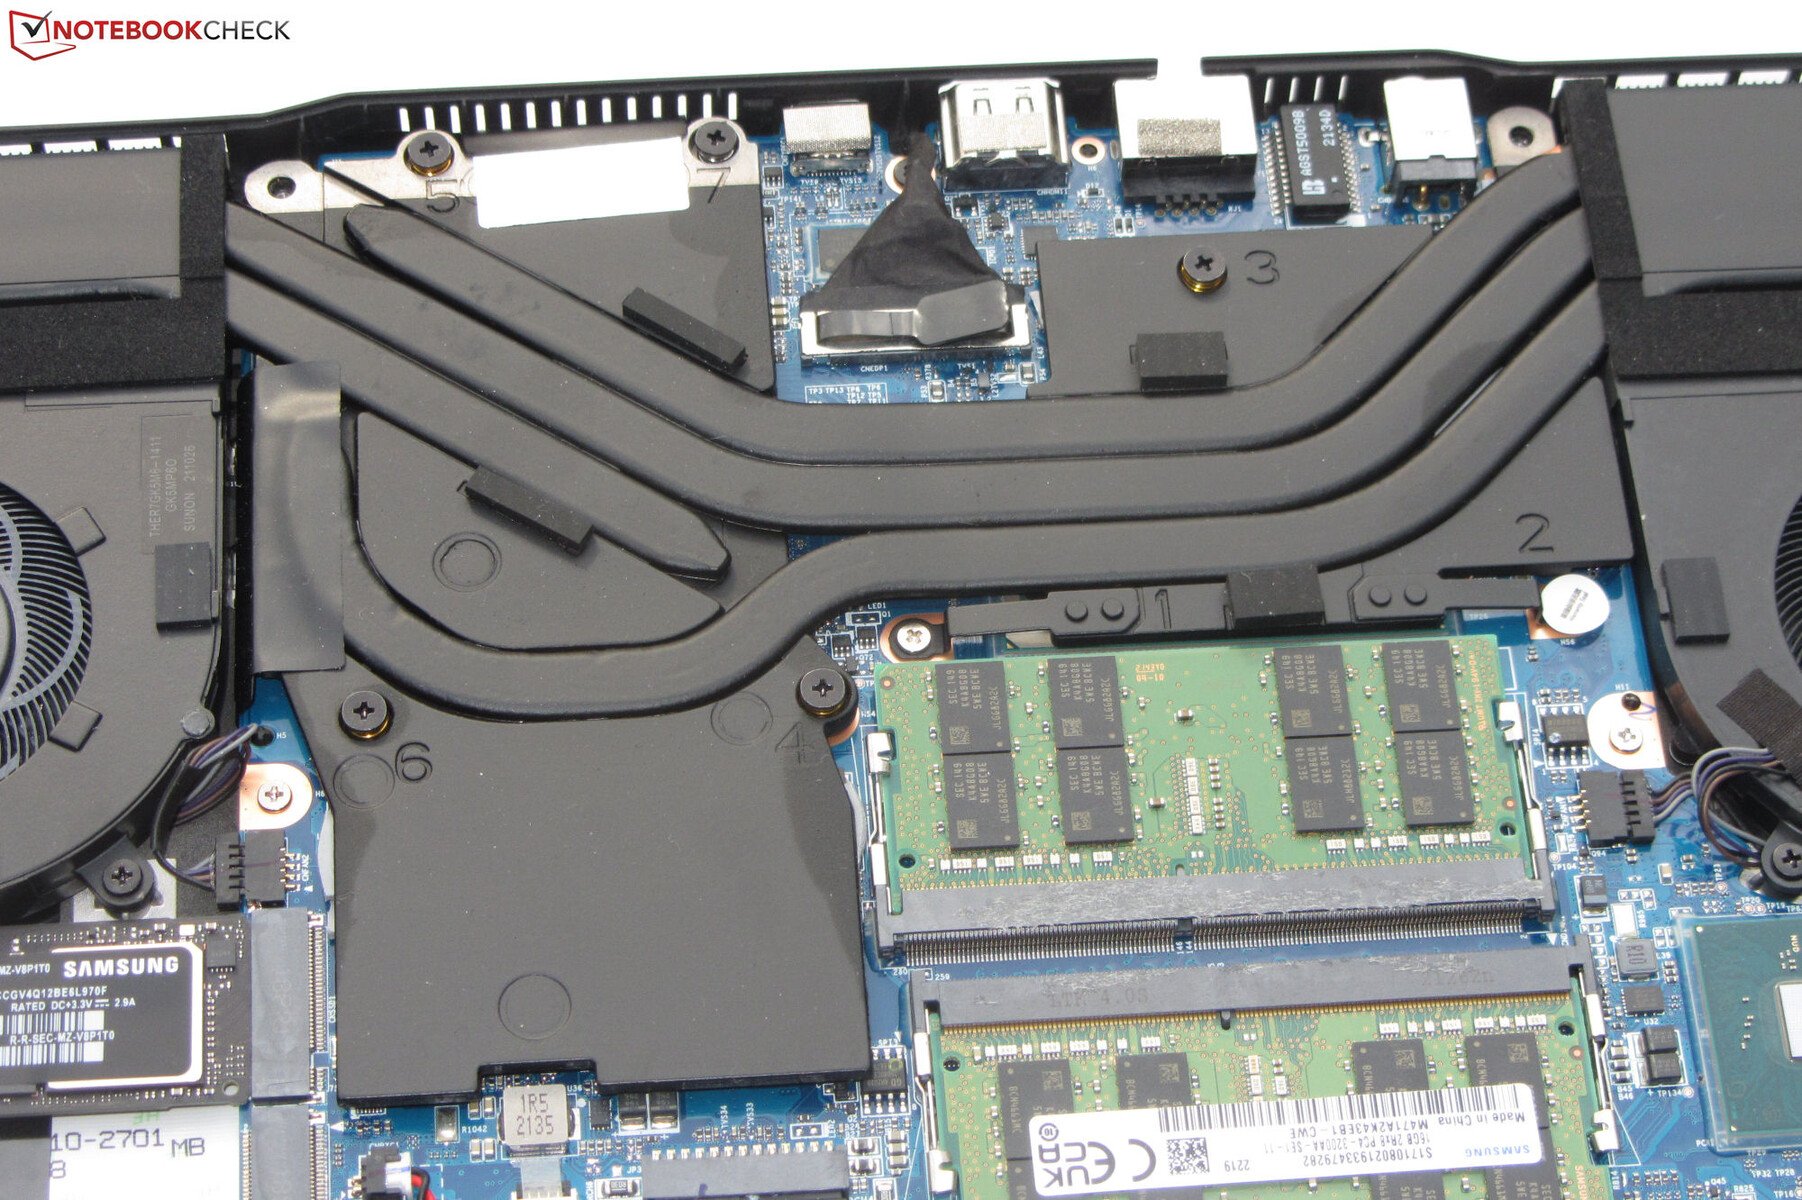
Boîtier - Un châssis en magnésium pour le Fusion
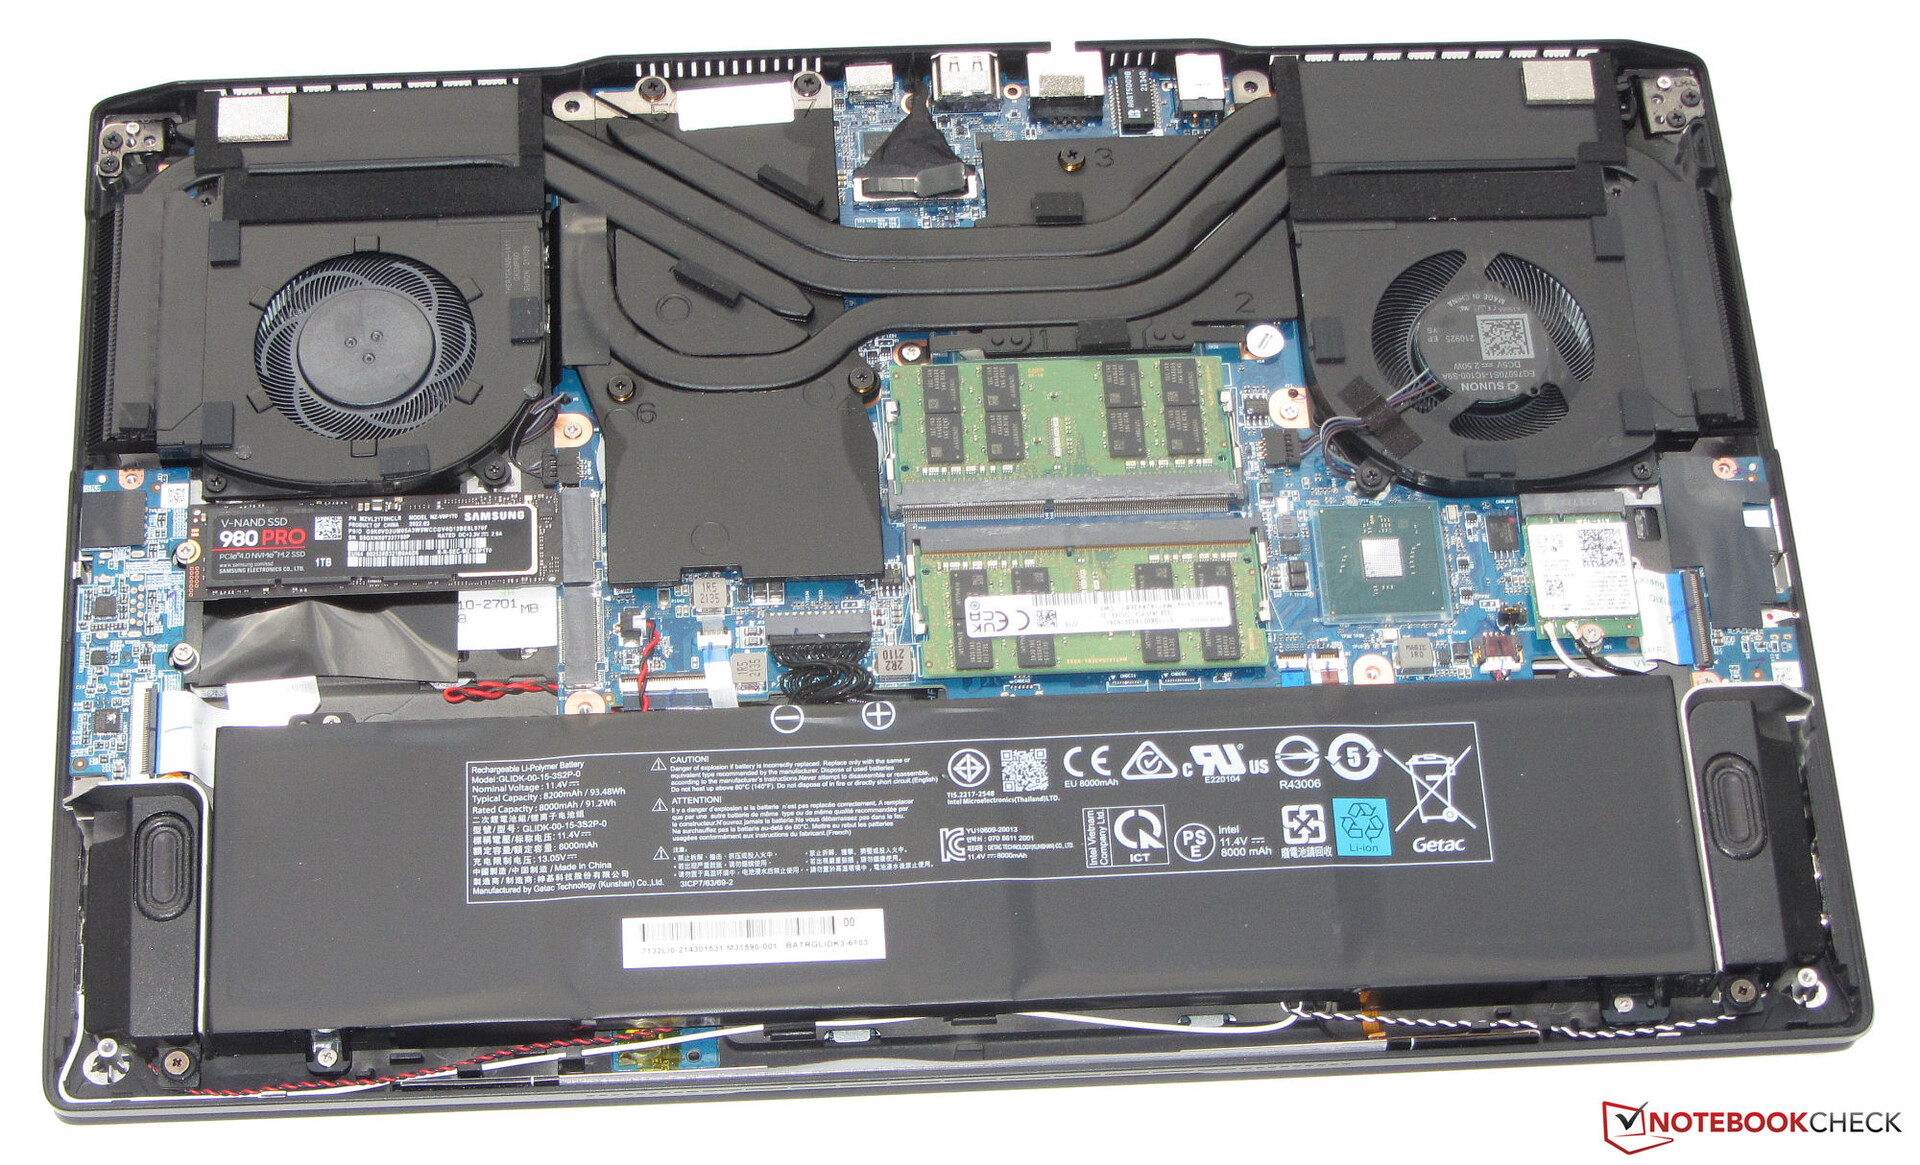
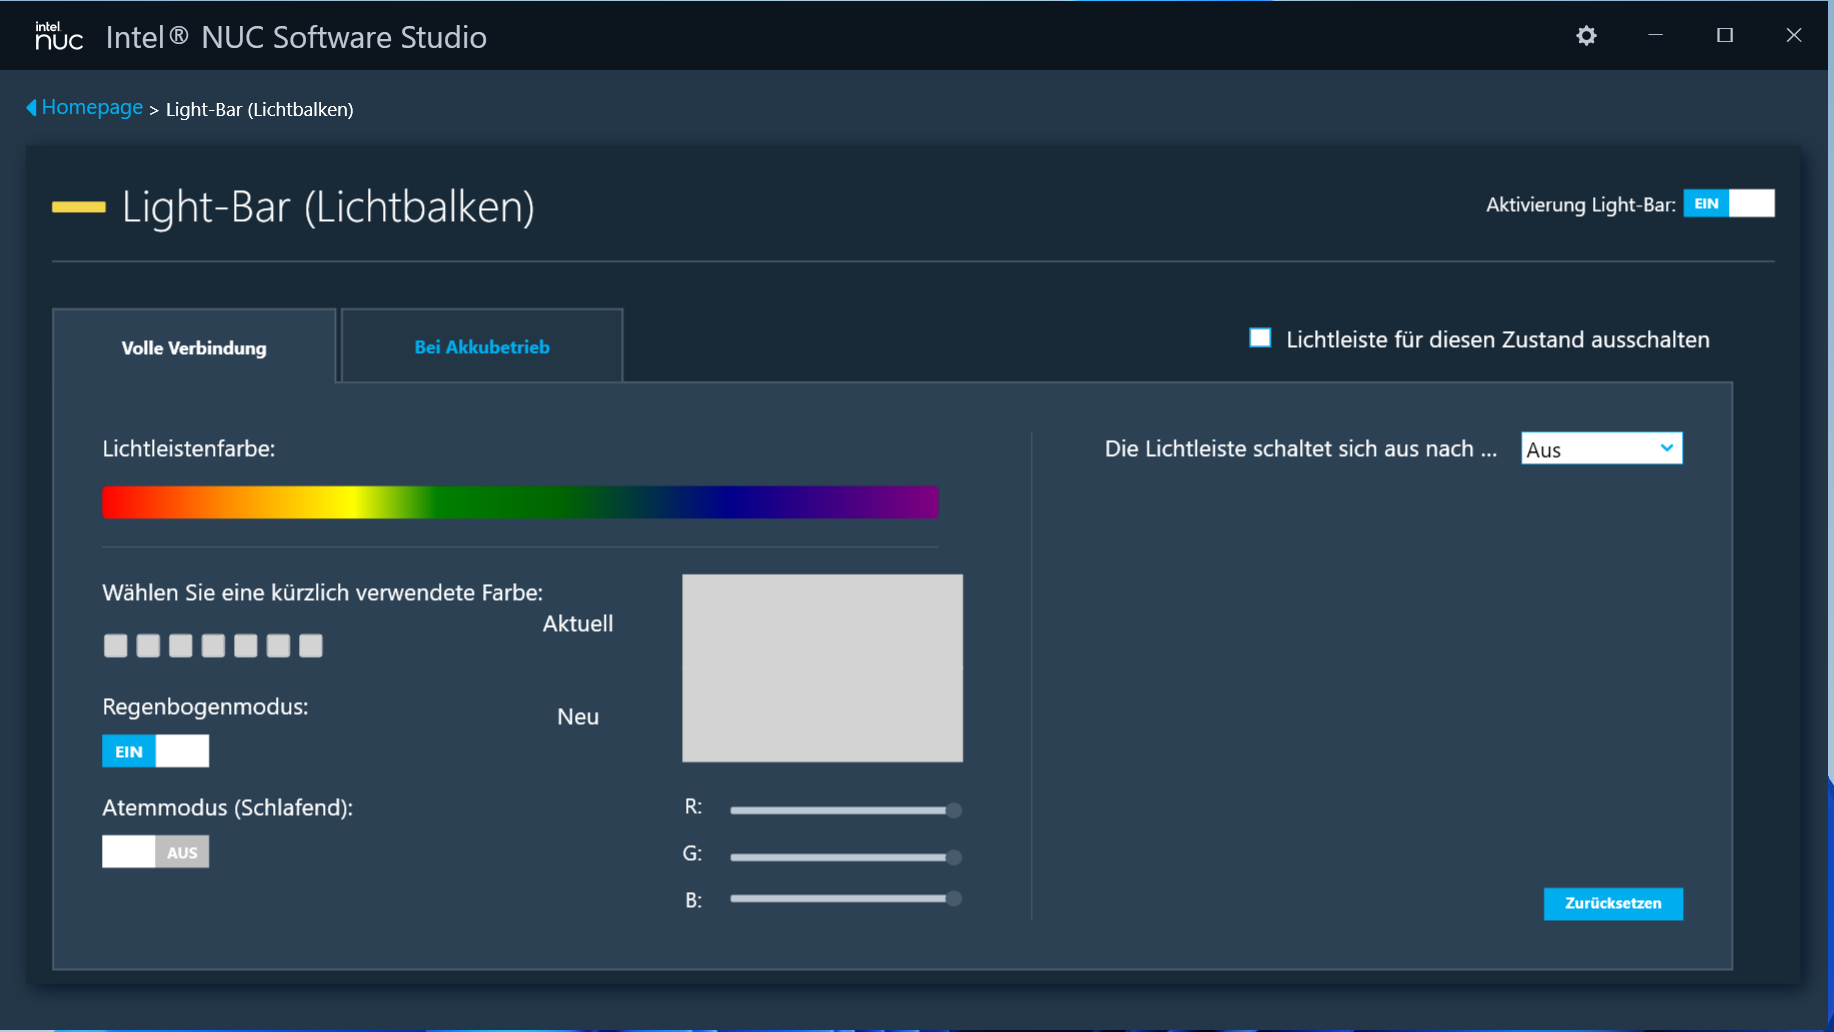
Le boîtier noir mat est fabriqué à partir d'un alliage de magnésium et offre un design épuré, sans fioritures. Schenker opte pour des surfaces lisses. Une bande de LED configurable (RGB) sur le côté du boîtier qui fait face à l'utilisateur apporte un peu de couleur en plus de l'éclairage du clavier. La batterie est intégrée à l'appareil (vissée, non collée). Vous pouvez accéder à l'intérieur après avoir retiré le couvercle inférieur.
L'ordinateur portable ne présente aucun défaut de fabrication. Les dimensions de l'espace sont exactes, et il n'y a pas de protubérance matérielle à trouver. L'unité de base peut difficilement être pliée, mais le couvercle peut l'être. Les charnières maintiennent le couvercle fermement en position, et l'angle d'ouverture maximal est de 180 degrés. Il est possible d'ouvrir le couvercle d'une seule main.


Le Fusion ne peut pas tout à fait égaler les dimensions compactes du Blade 15mais son poids est inférieur d'environ 200 grammes. Cela en fait l'appareil le plus léger de la comparaison
Connectivité - XMG 15 équipé de Thunderbolt 4
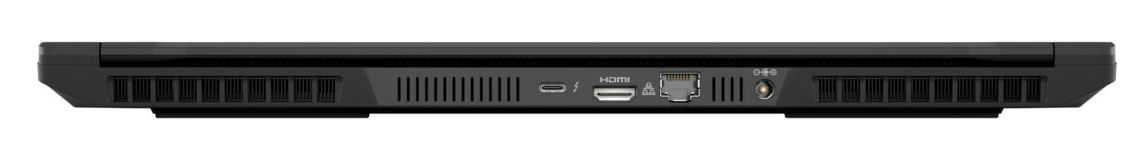
La Fusion possède trois ports USB-A (USB 3.2 Gen 2) et un port USB-C (Thunderbolt 4). Ce dernier prend en charge DisplayPort via USB-C. Au total, l'ordinateur portable offre deux sorties vidéo (1x DP, 1x HDMI). En outre, il y a une prise audio combinée, un port Gigabit Ethernet et un emplacement pour un verrou de câble.
Les ports sont répartis sur trois côtés de l'ordinateur portable. Bon : Les sorties vidéo, le port Ethernet et la connexion d'alimentation sont situés à l'arrière de l'appareil. Par conséquent, les câbles correspondants passent vers l'arrière et ne gênent pas.
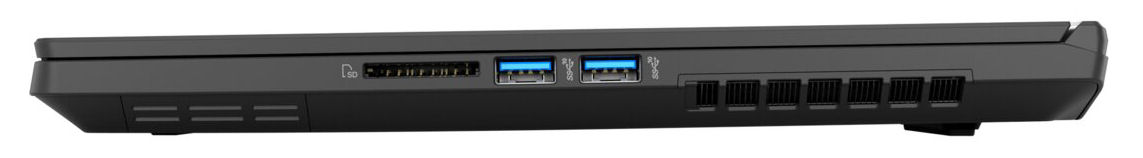
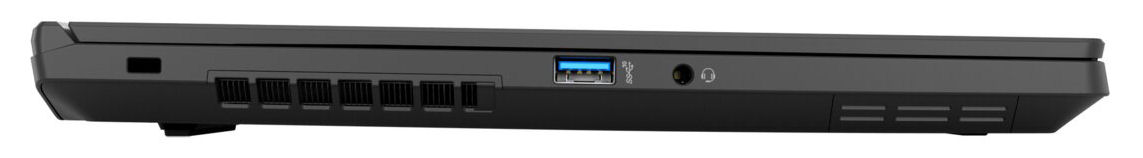
Lecteur de carte SD
Avec des taux de transfert maximum de 77 MB/s (transfert de 250 fichiers d'images jpg d'environ 5 MB chacun), le lecteur de carte mémoire SD (carte de référence : 128 GB AV PRO V60 microSD) présente des vitesses moyennes
| SD Card Reader - average JPG Copy Test (av. of 3 runs) | |
| Moyenne de la classe Gaming (20.9 - 210, n=55, 2 dernières années) | |
| Schenker XMG Fusion 15 (Mid 22) (AV PRO microSD 128 GB V60) | |
| HP Omen 16-b1090ng (AV PRO microSD 128 GB V60) | |
Communication
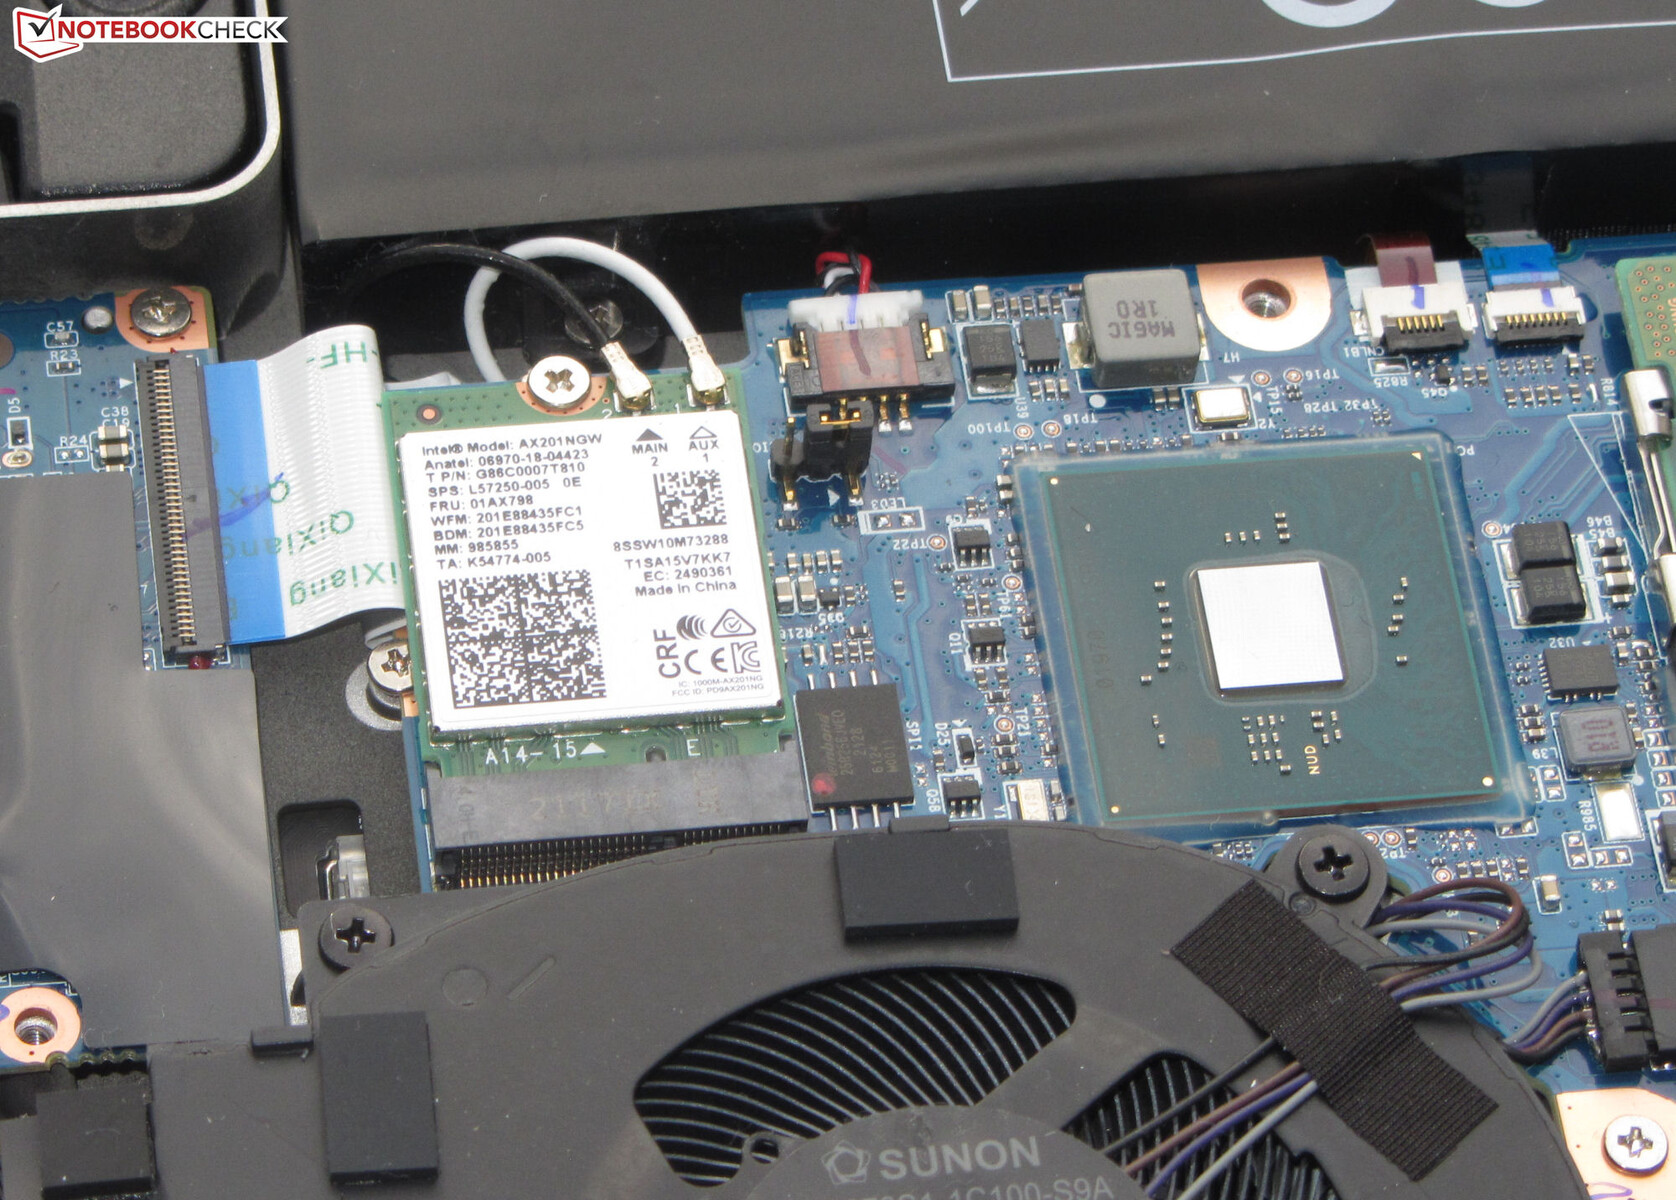
Les taux de transfert Wi-Fi déterminés dans des conditions optimales (pas d'autres appareils Wi-Fi à proximité, courte distance entre l'ordinateur portable et le PC serveur) sont très bons, et ils sont conformes aux capacités de la puce Wi-Fi (Intel AX201 ; 802.11ax). Une puce Gigabit Ethernet (Intel I225-V, 2,5 gigabits) gère les connexions au réseau filaire
Webcam
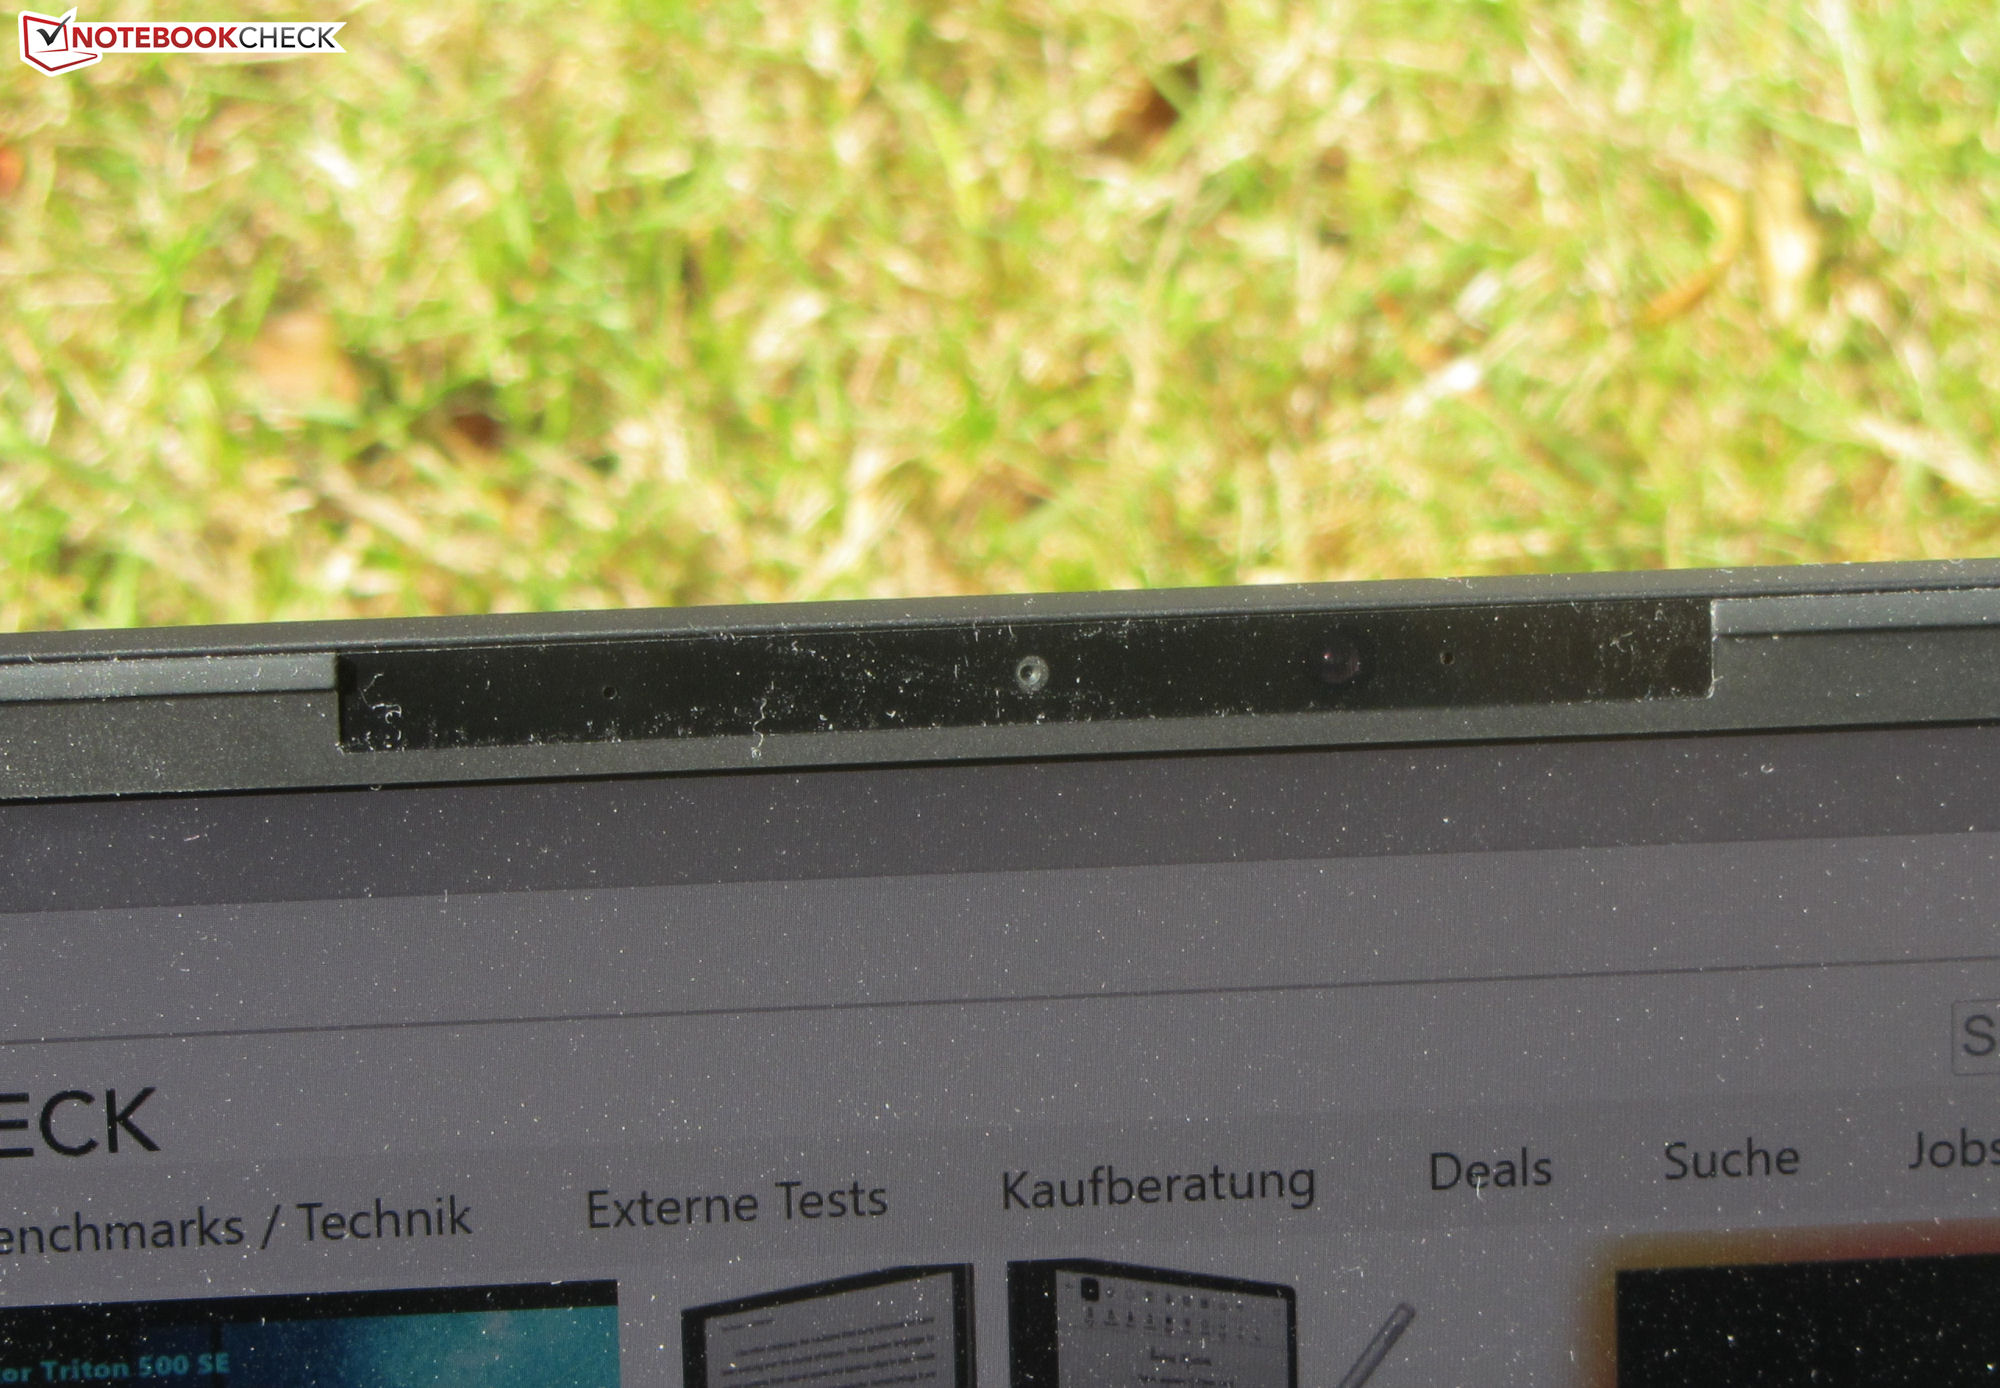
La webcam (0,9 MP) produit des images dans une résolution maximale de 1 280x720 pixels. Il y a des problèmes avec la précision des couleurs : Les couleurs s'écartent de la cible. L'appareil photo ne dispose pas d'un obturateur mécanique

 GeForce RTX 3070 Laptop GPU, i7-11800H, Samsung SSD 980 Pro 1TB MZ-V8P1T0BW")
 GeForce RTX 3070 Laptop GPU, i7-11800H, Samsung SSD 980 Pro 1TB MZ-V8P1T0BW")
Accessoires
Outre les informations relatives à la garantie et un manuel d'utilisation imprimé, l'ordinateur portable est livré avec une clé USB (pilotes, instructions), des autocollants et un tapis de souris
Maintenance
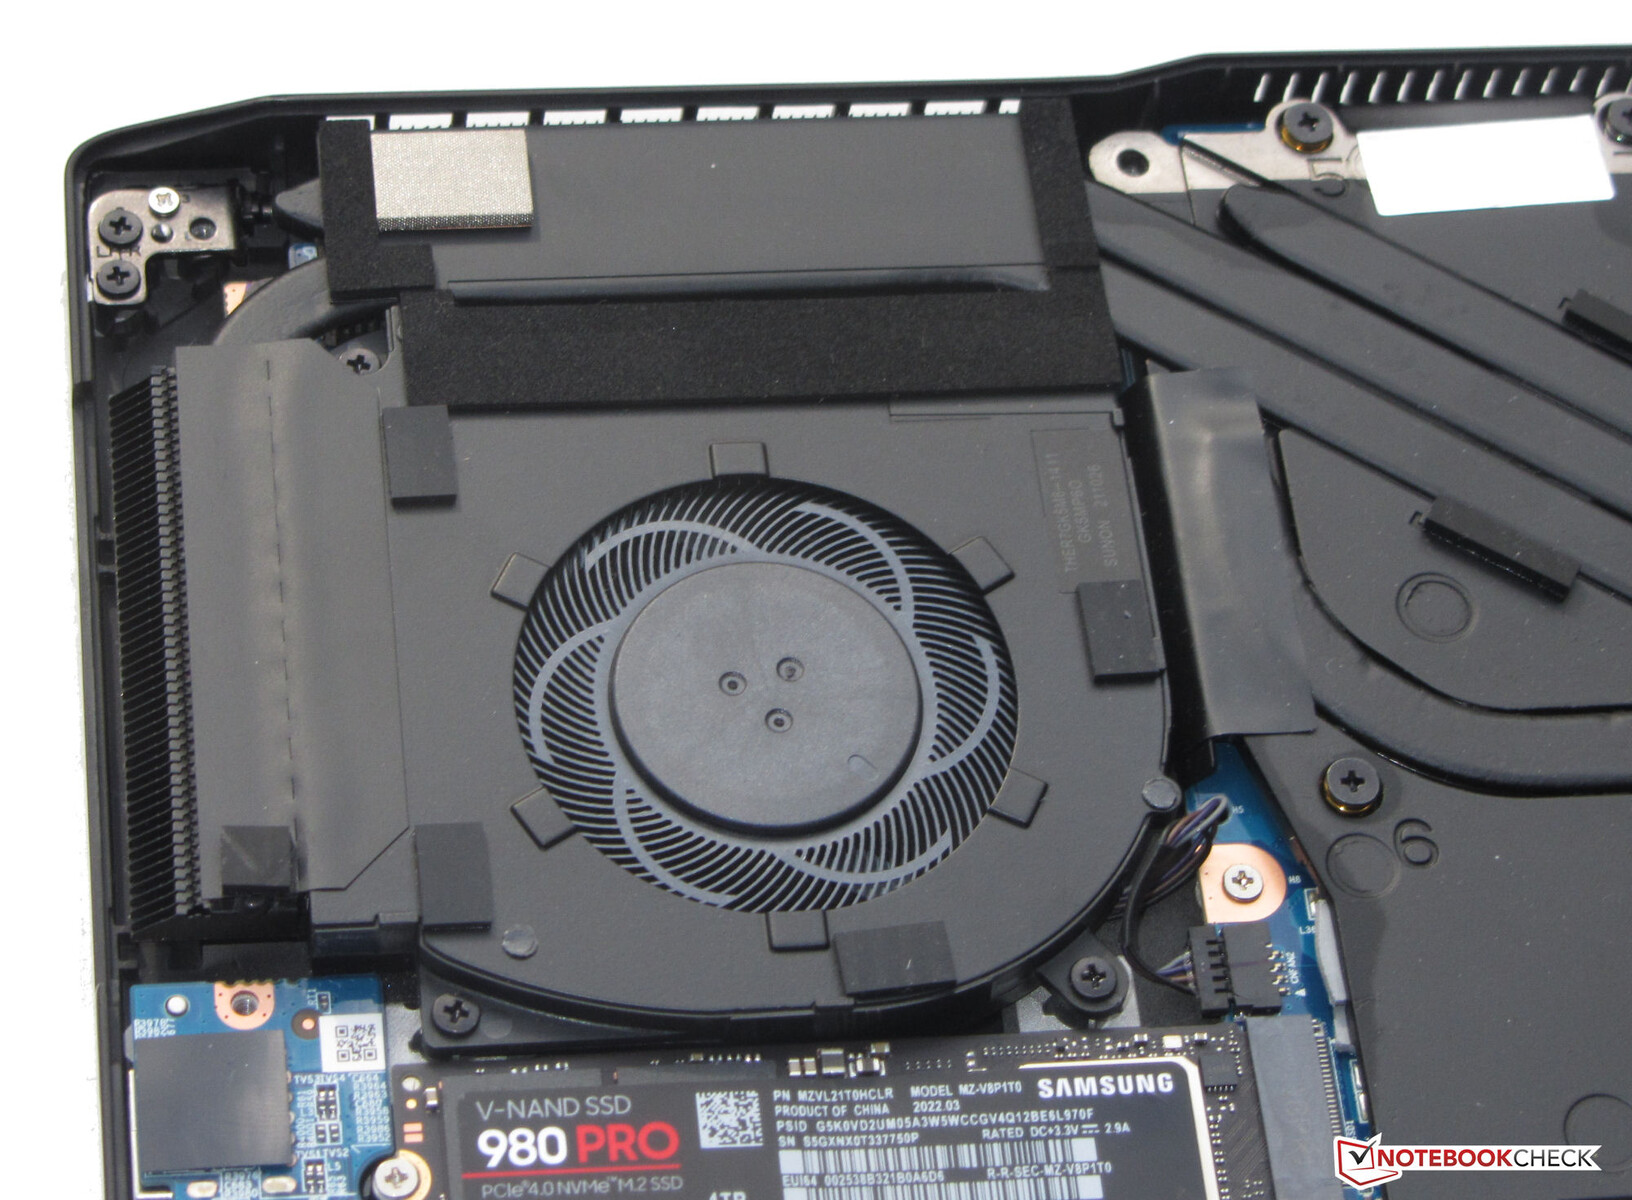
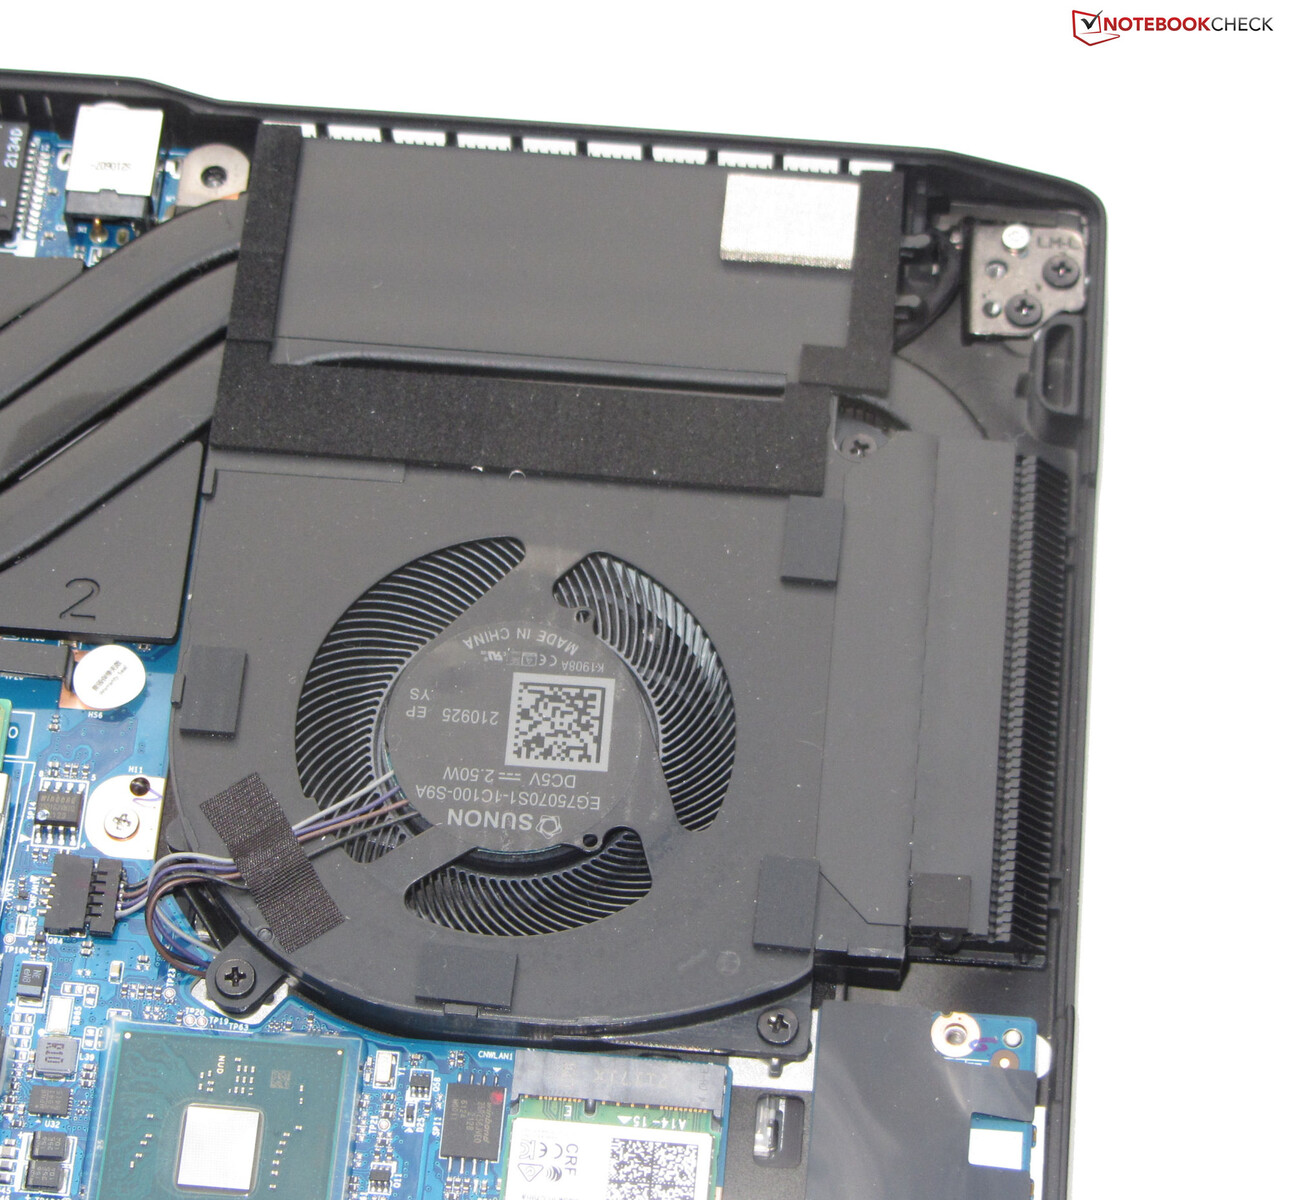
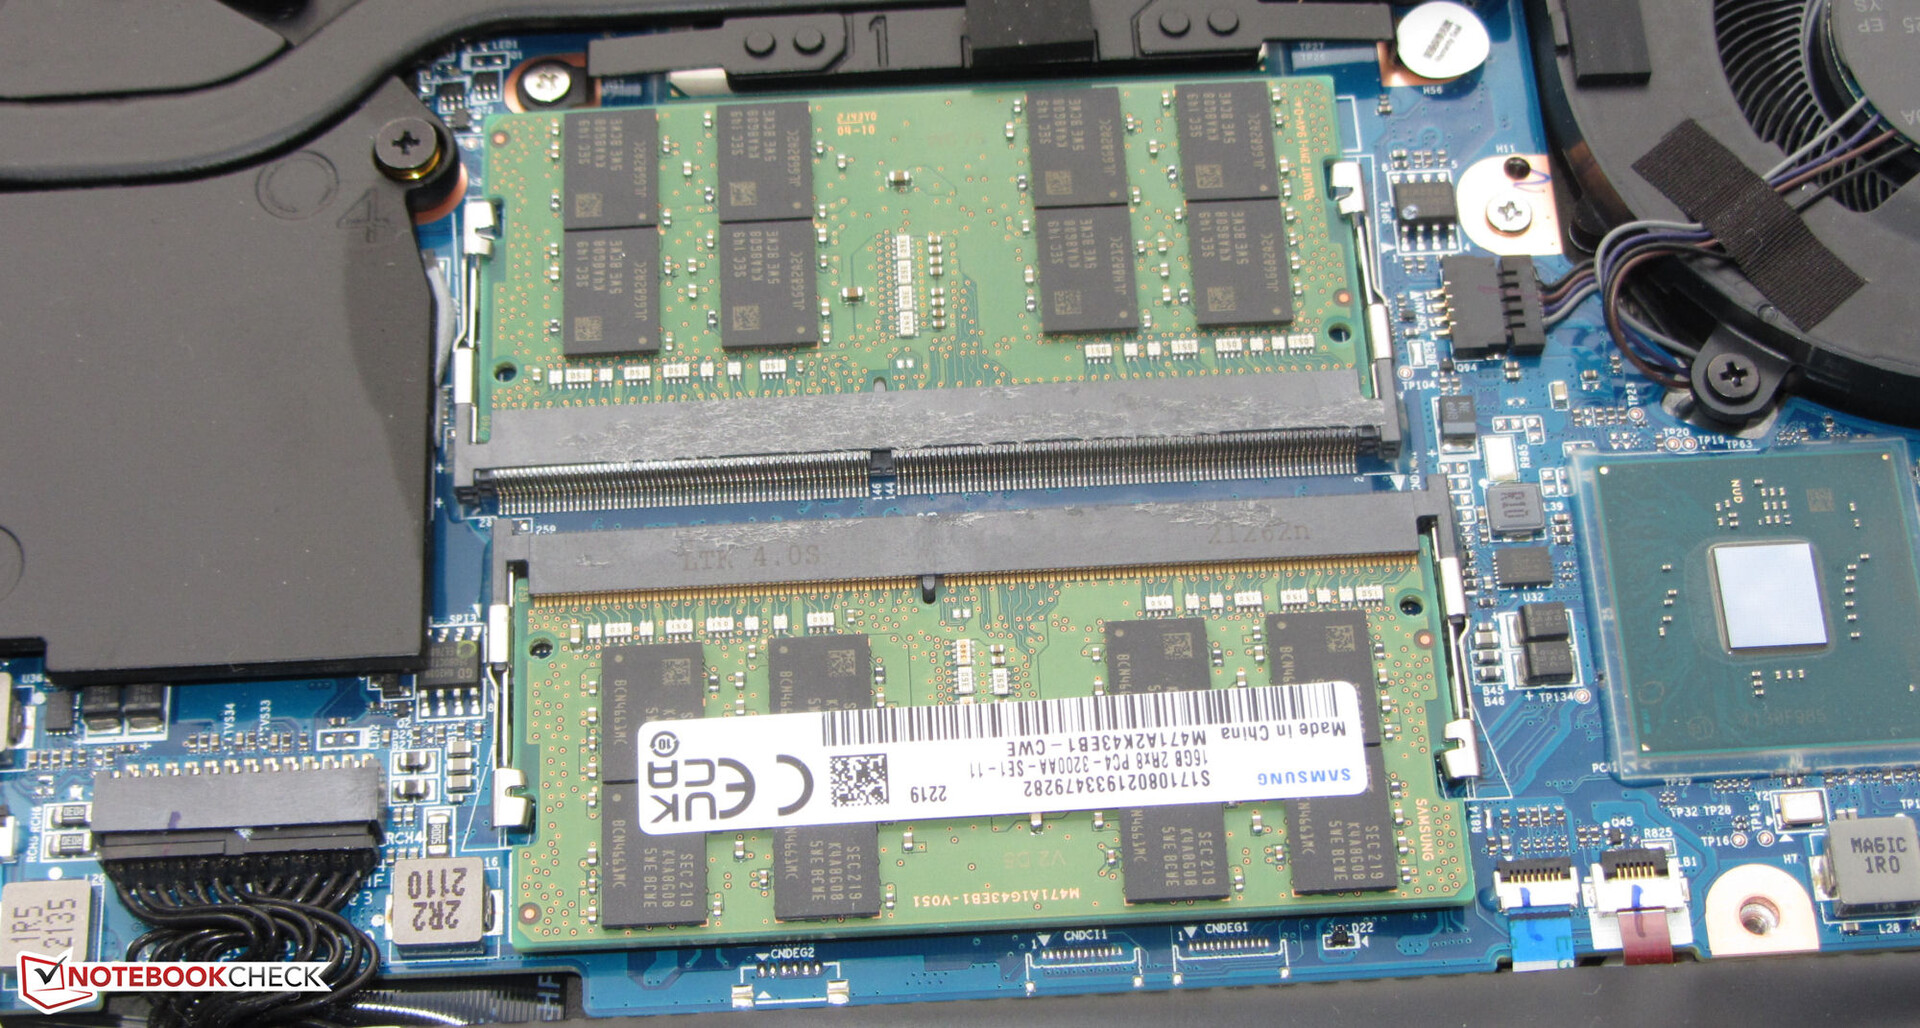
Les procédures de maintenance et de mise à niveau peuvent être effectuées sans problème. Après avoir desserré toutes les vis situées sur la partie inférieure de l'appareil, le couvercle inférieur peut être retiré assez facilement. Vous avez alors accès aux emplacements de RAM (tous deux occupés), au SSD (PCIe 4), au deuxième emplacement M.2-2280 (PCIe 3/SATA), au module Wi-Fi, aux ventilateurs, à la batterie du BIOS et à la batterie

Garantie
La garantie de base couvre deux ans - y compris le service d'enlèvement et 6 mois de réparation rapide (réparation dans les 48 heures). Une garantie de 36 mois coûte entre 100 et 149 euros (~$99,53 et $148,30) - en fonction de la période de réparation rapide choisie
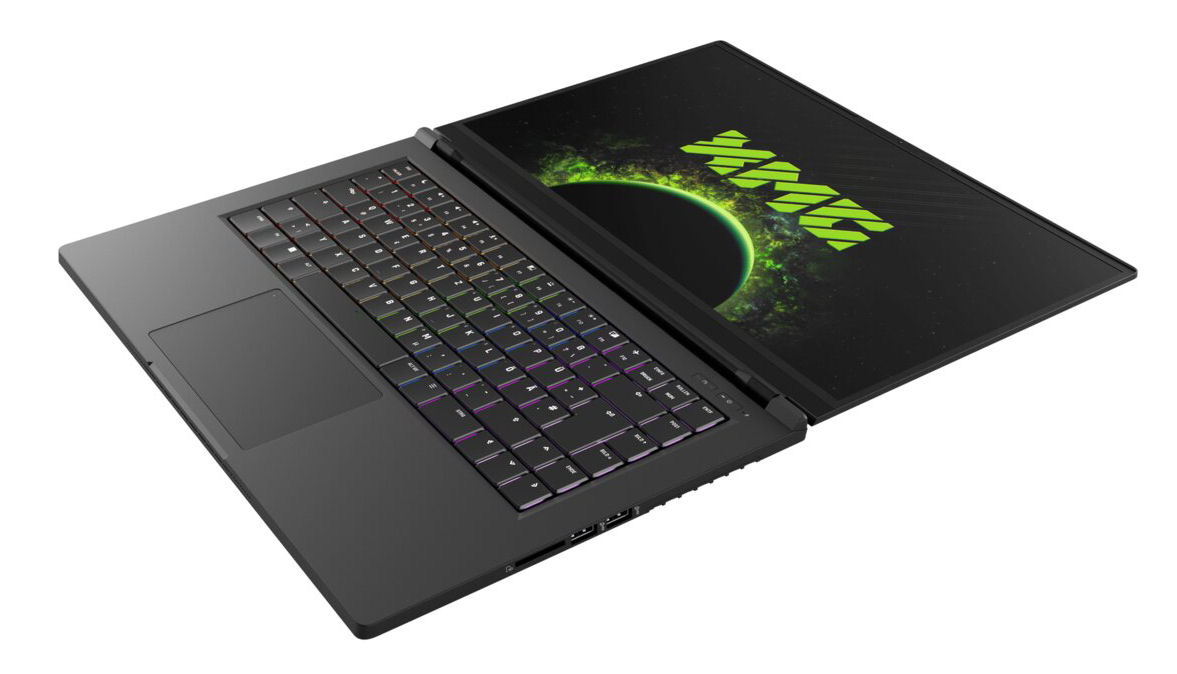
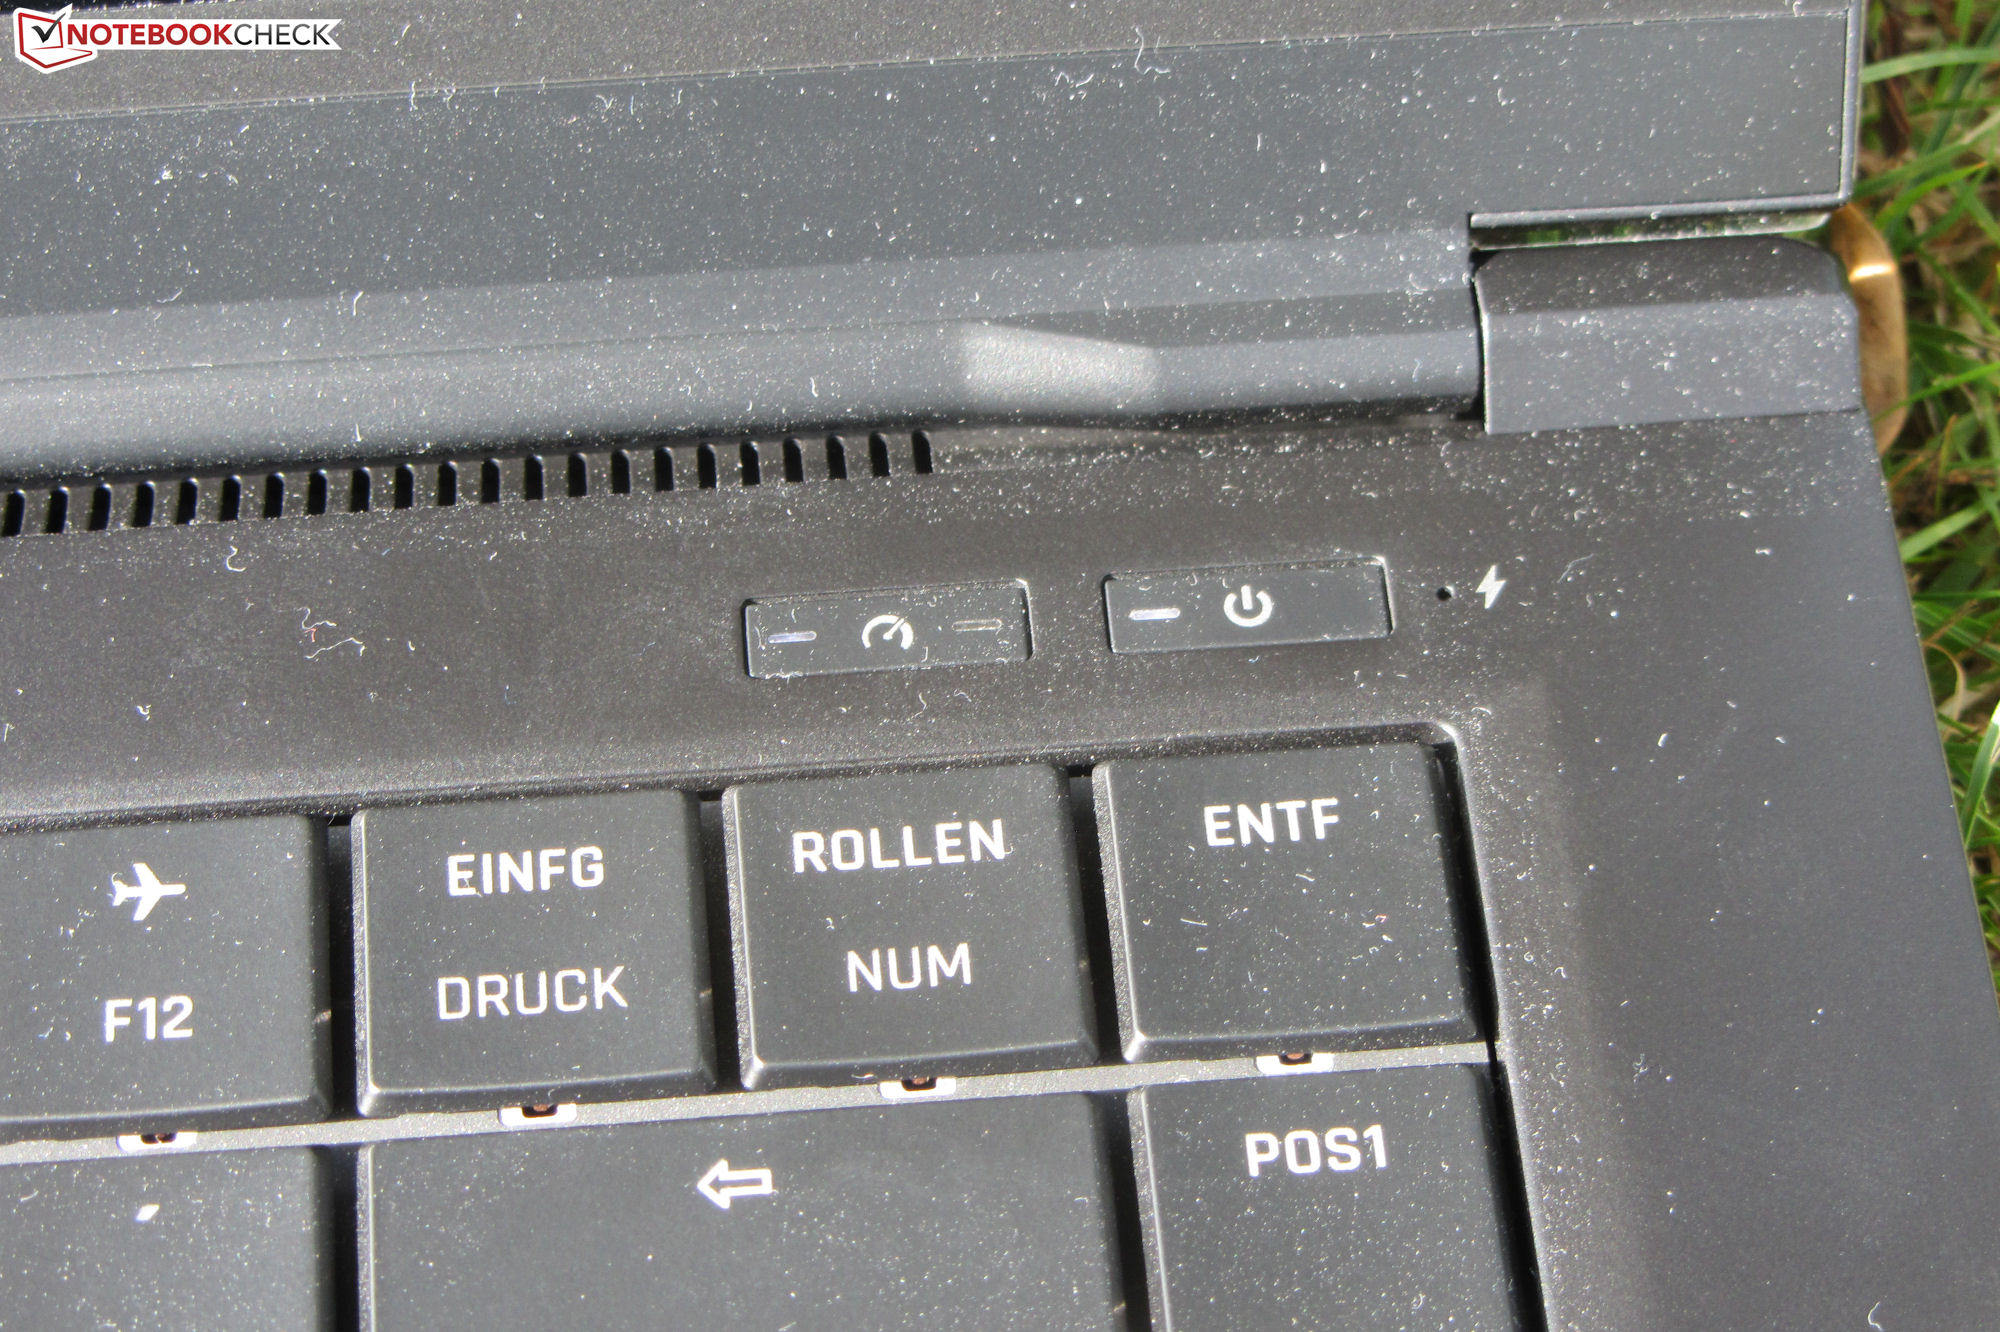
Dispositifs d'entrée - L'ordinateur portable Schenker est équipé d'un clavier mécanique
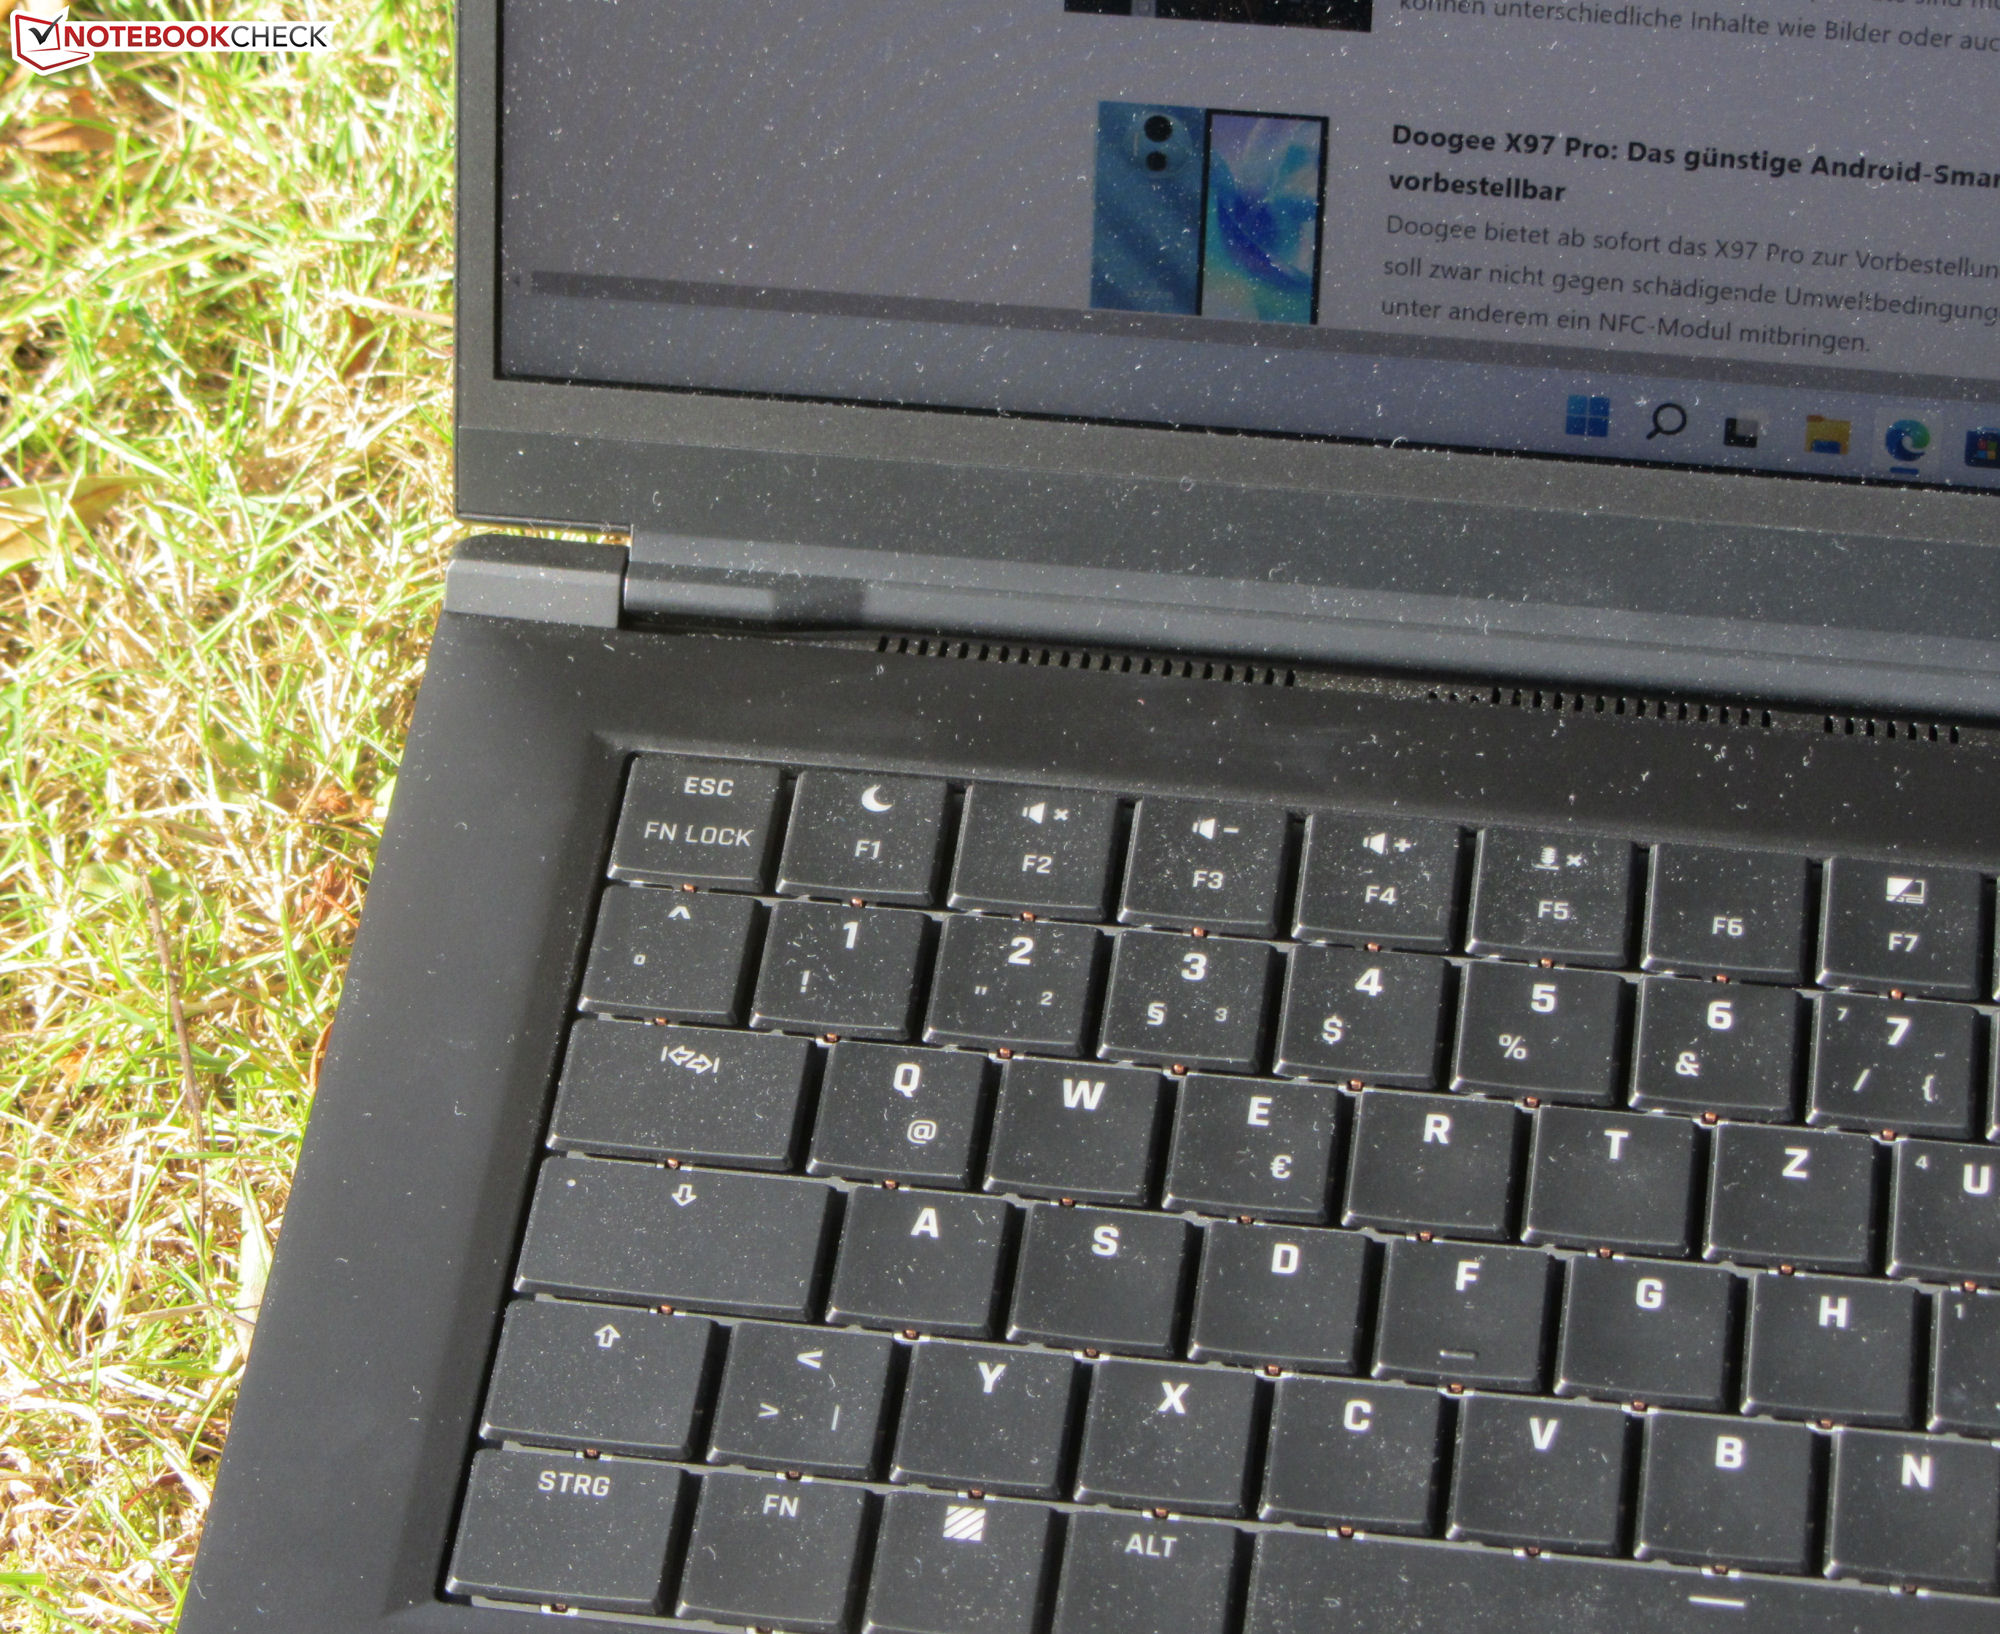
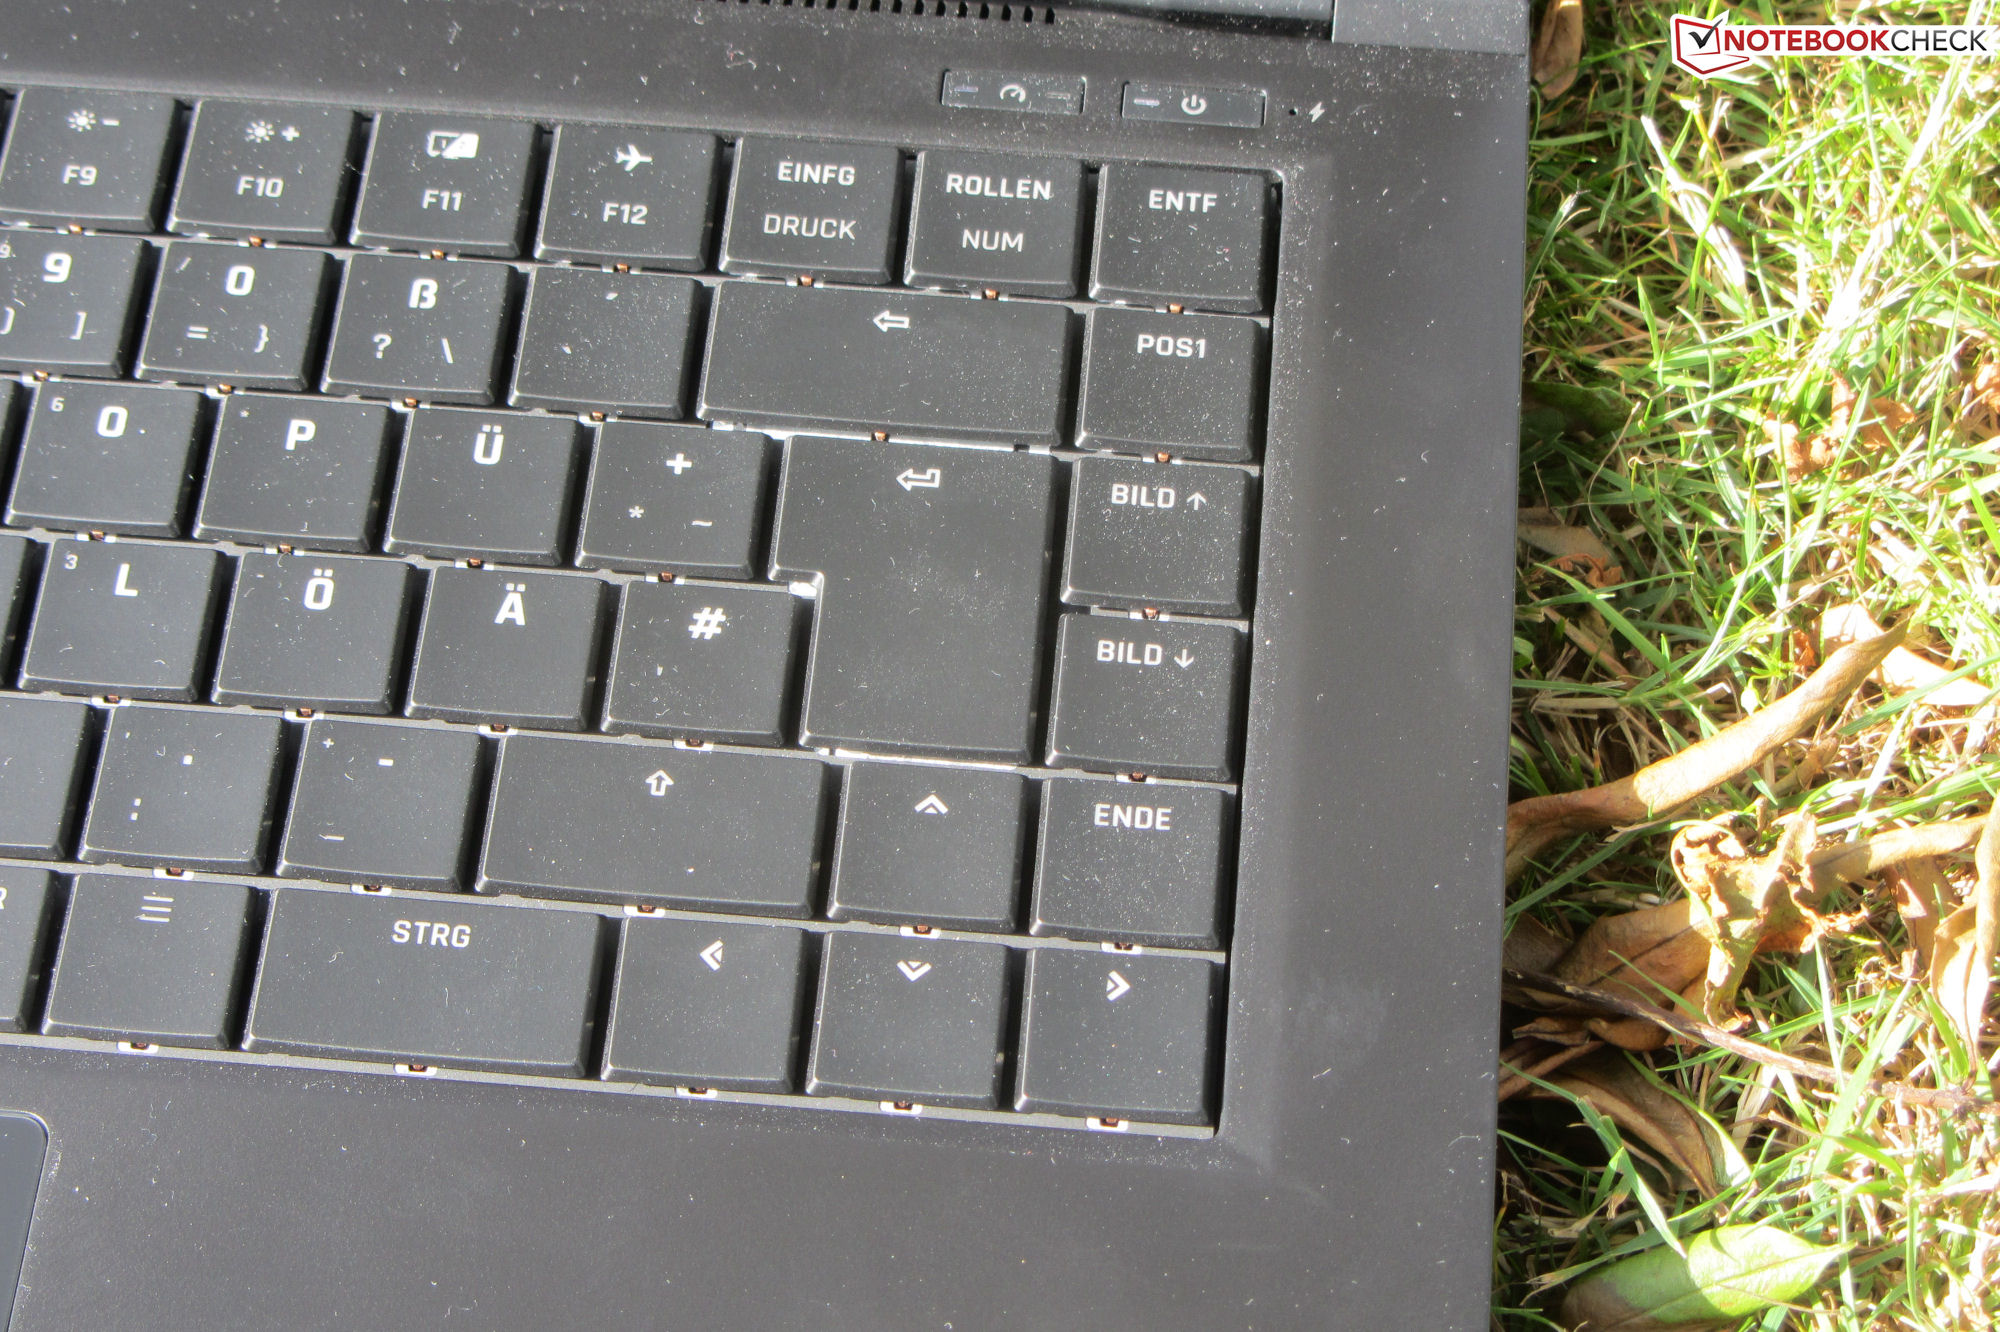
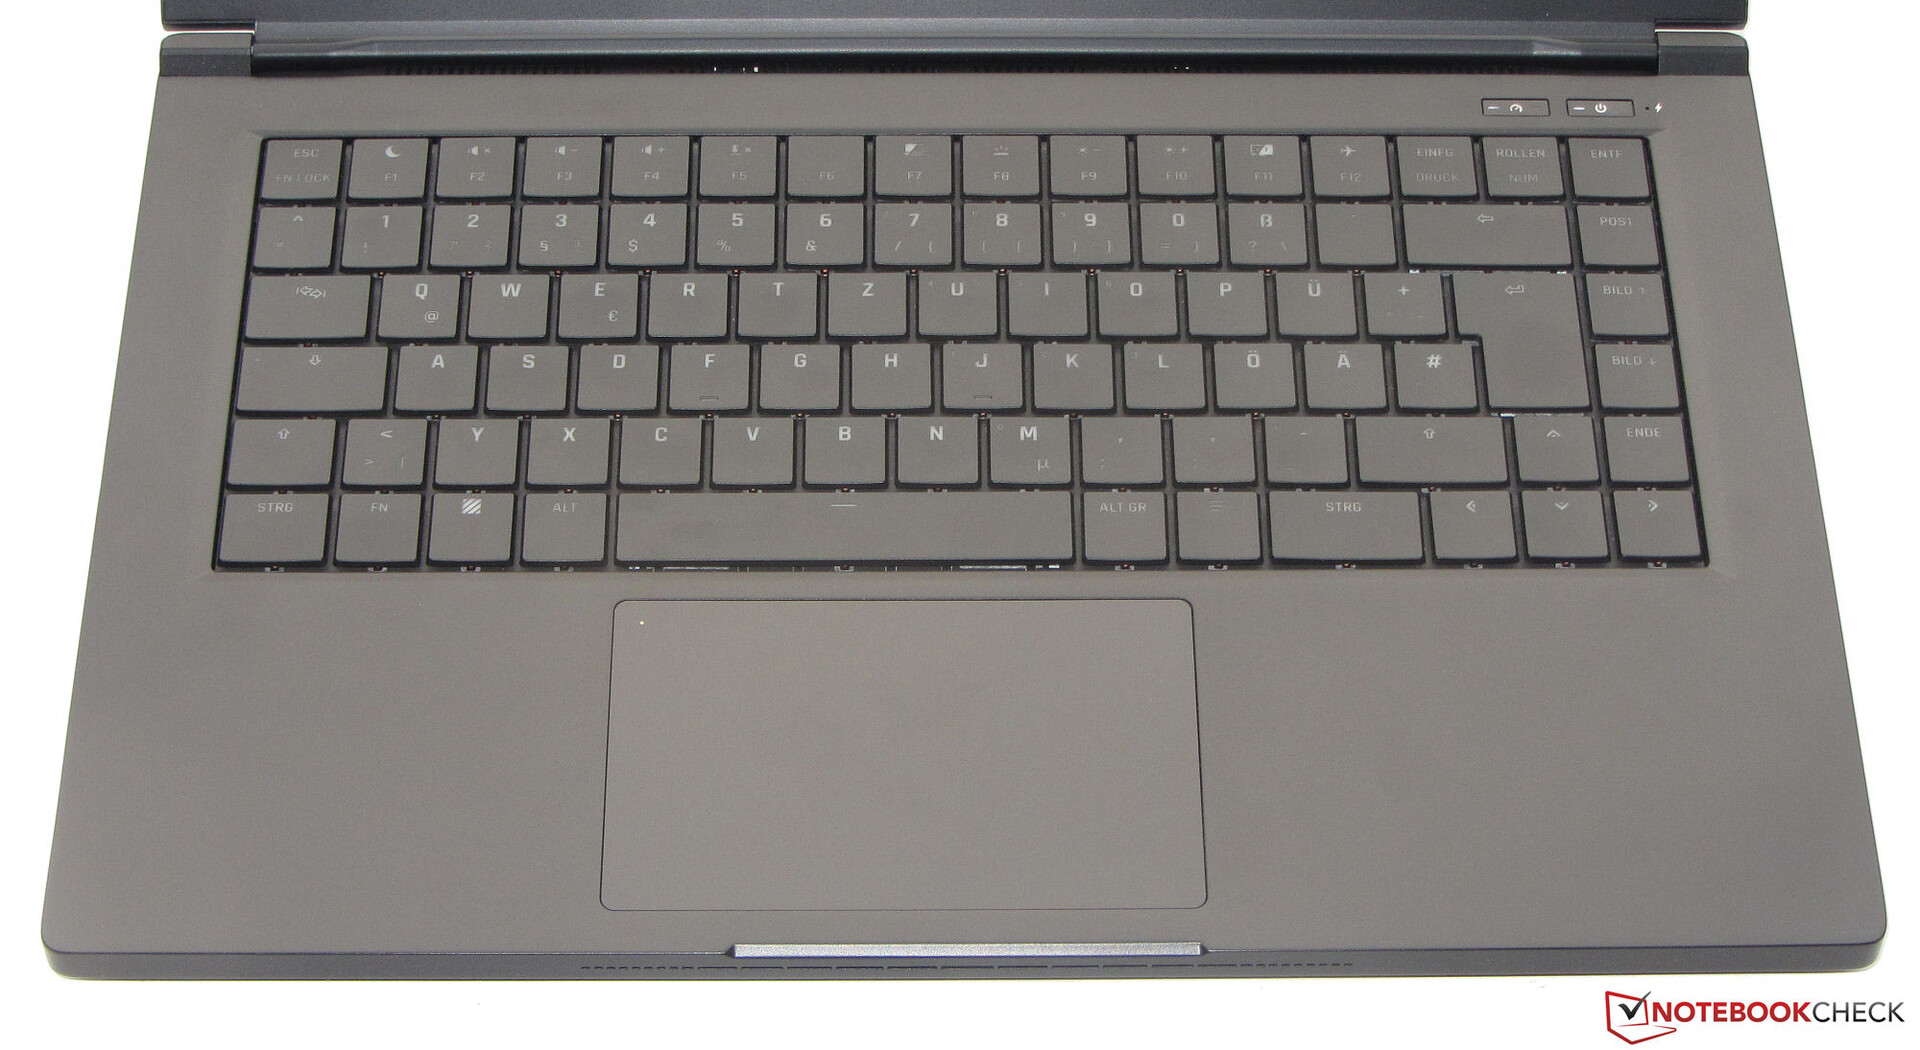
Clavier
Le clavier mécanique (avec éclairage RGB à touche unique) est composé de touches à la forme concave. Celles-ci offrent une course moyenne et ont un point de pression clairement audible et perceptible. Le clavier ne cède pas pendant la frappe. L'éclairage à deux niveaux est contrôlé par une touche de fonction. Dans l'ensemble, il s'agit d'un clavier équilibré et de bonne facture
Pavé tactile
Un ClickPad multitouch (environ 11,7 x 7,2 cm) sert de remplacement à la souris. Sa surface lisse permet aux doigts de glisser facilement dessus. Le pad a une course courte et un point de pression clair. Une double pression dans le coin supérieur gauche permet d'activer ou de désactiver le pavé (indiqué par une LED)
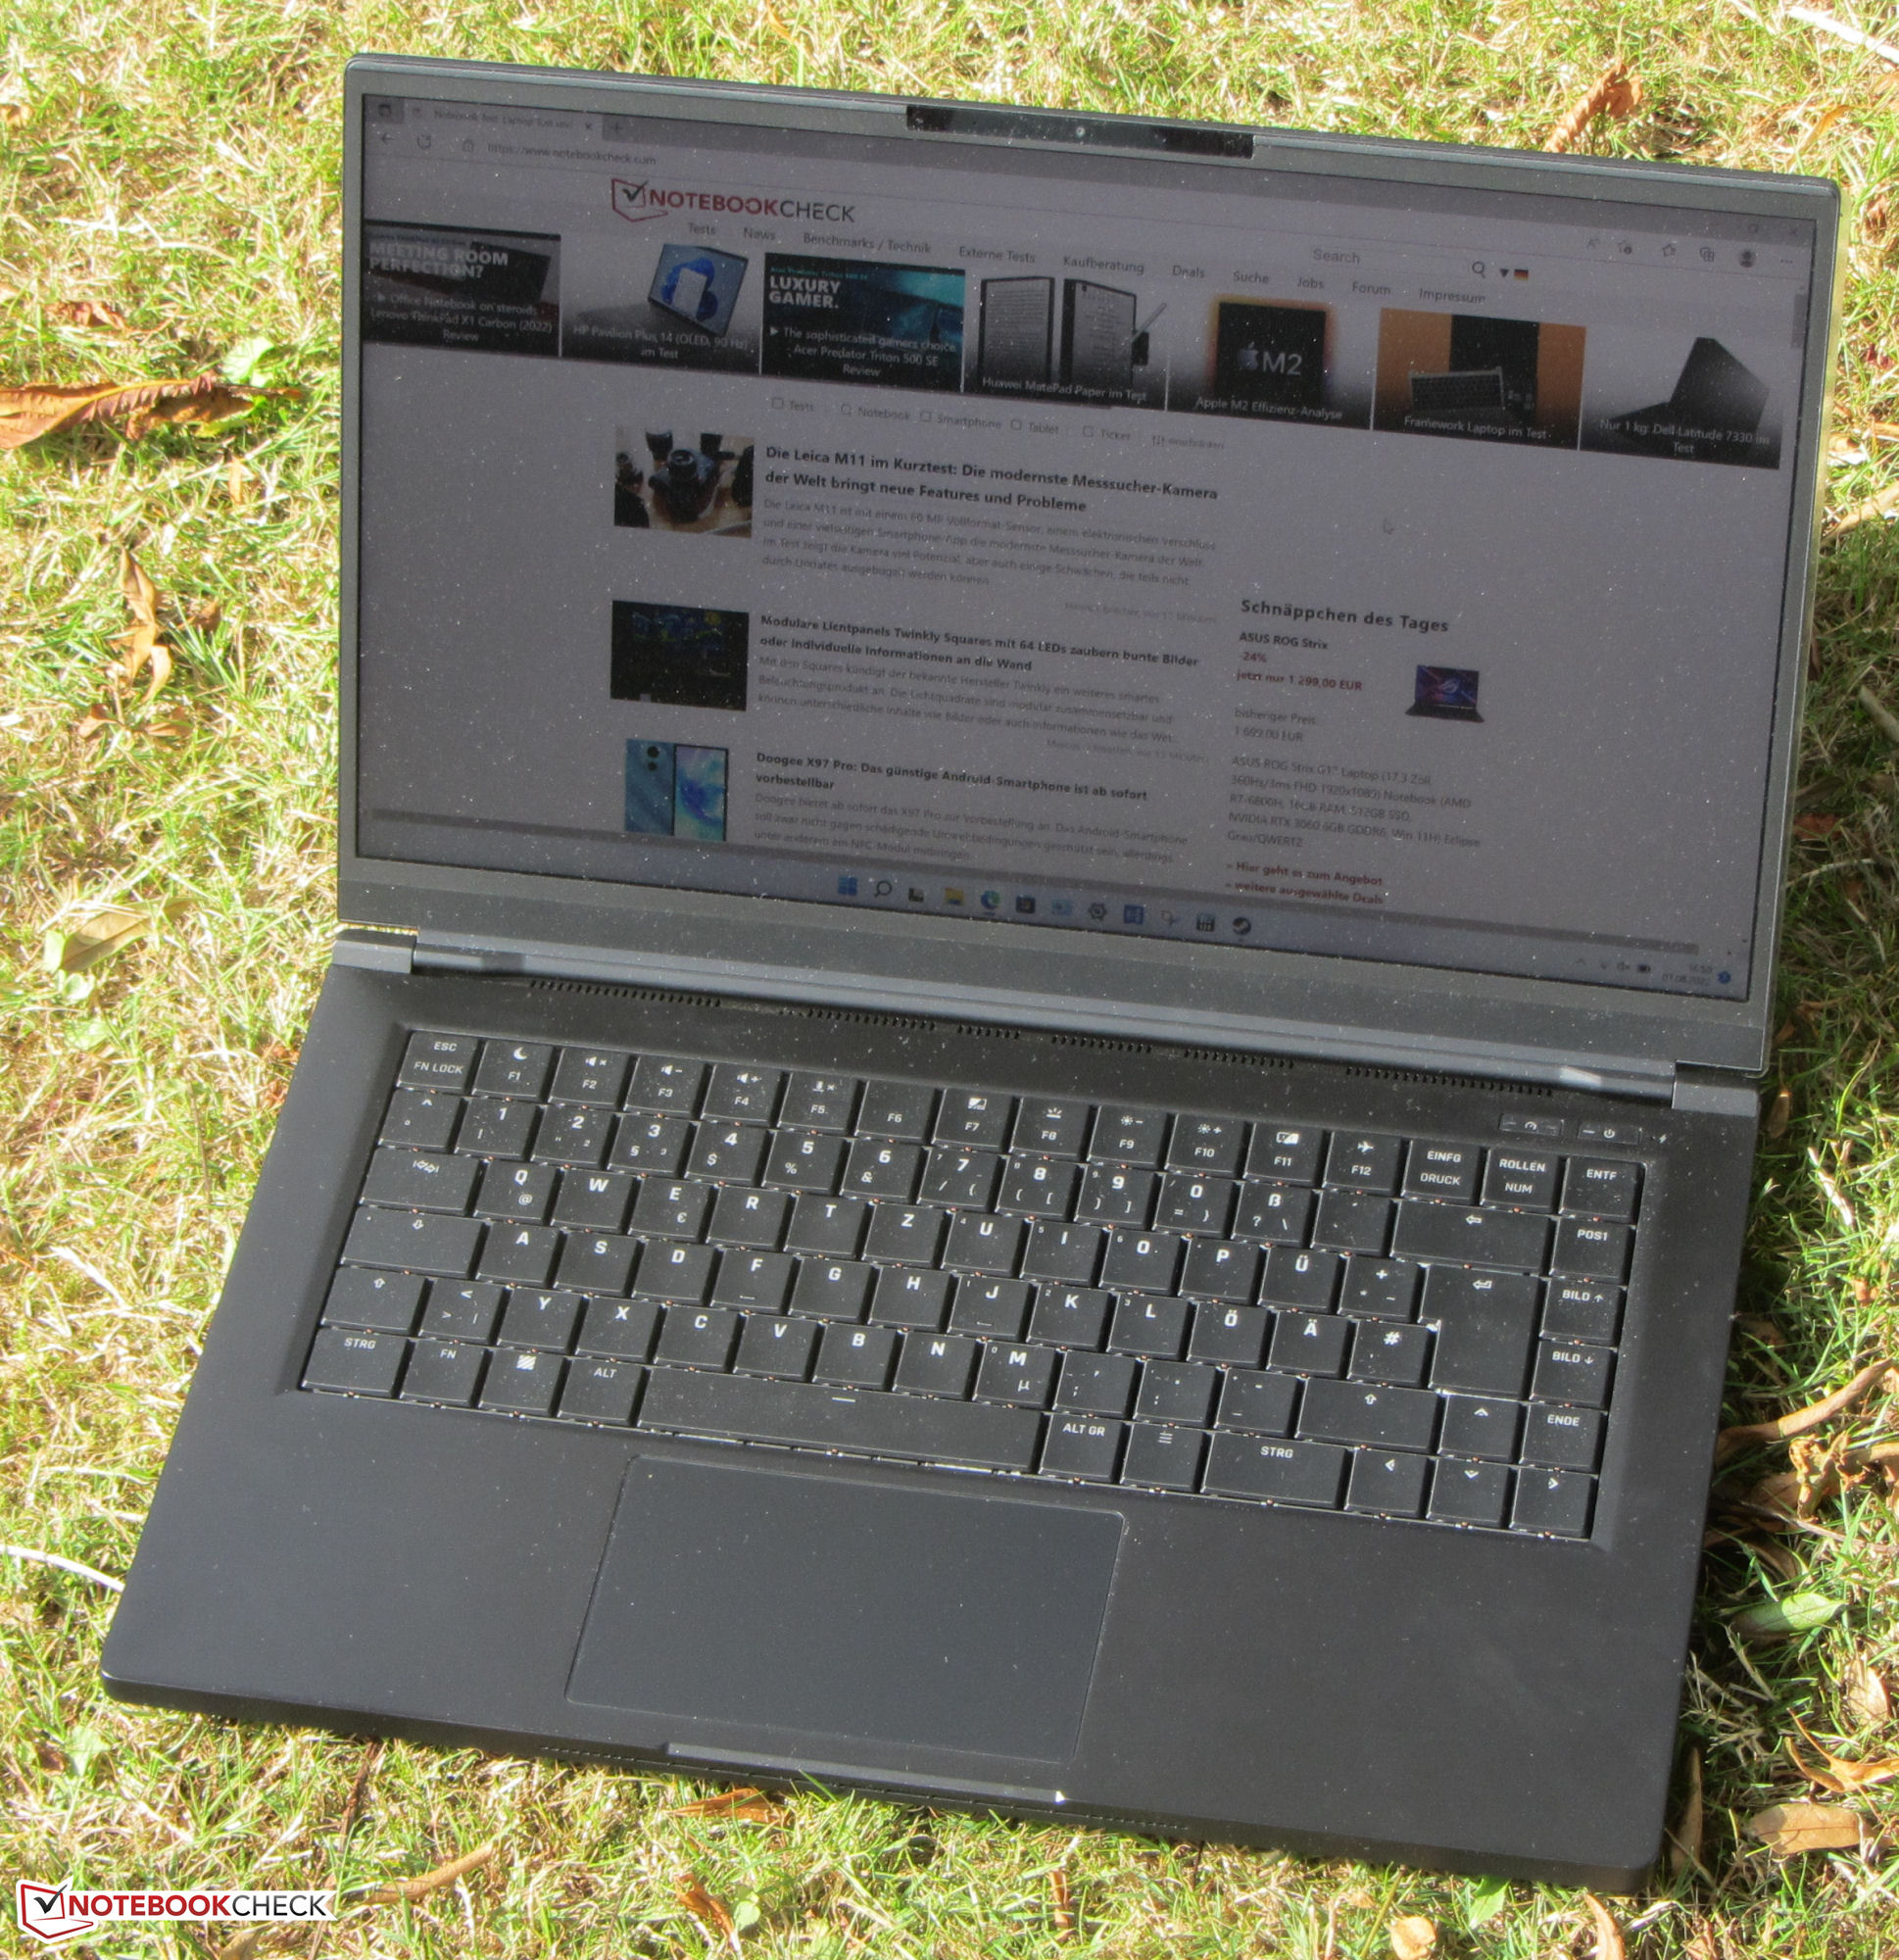
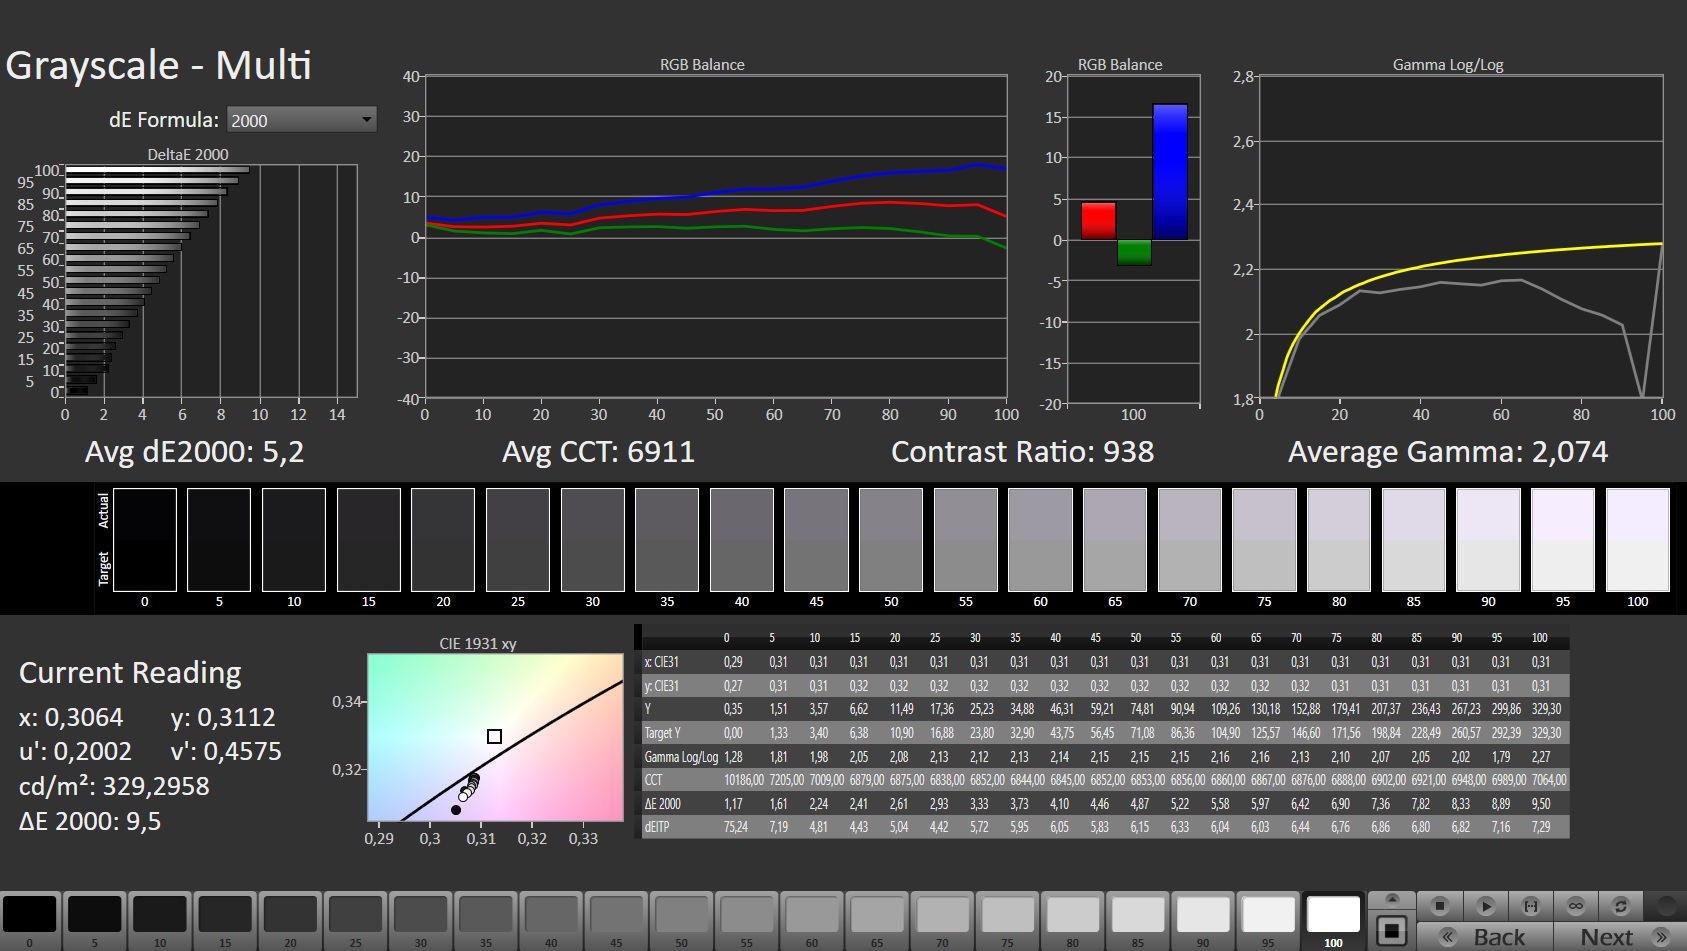
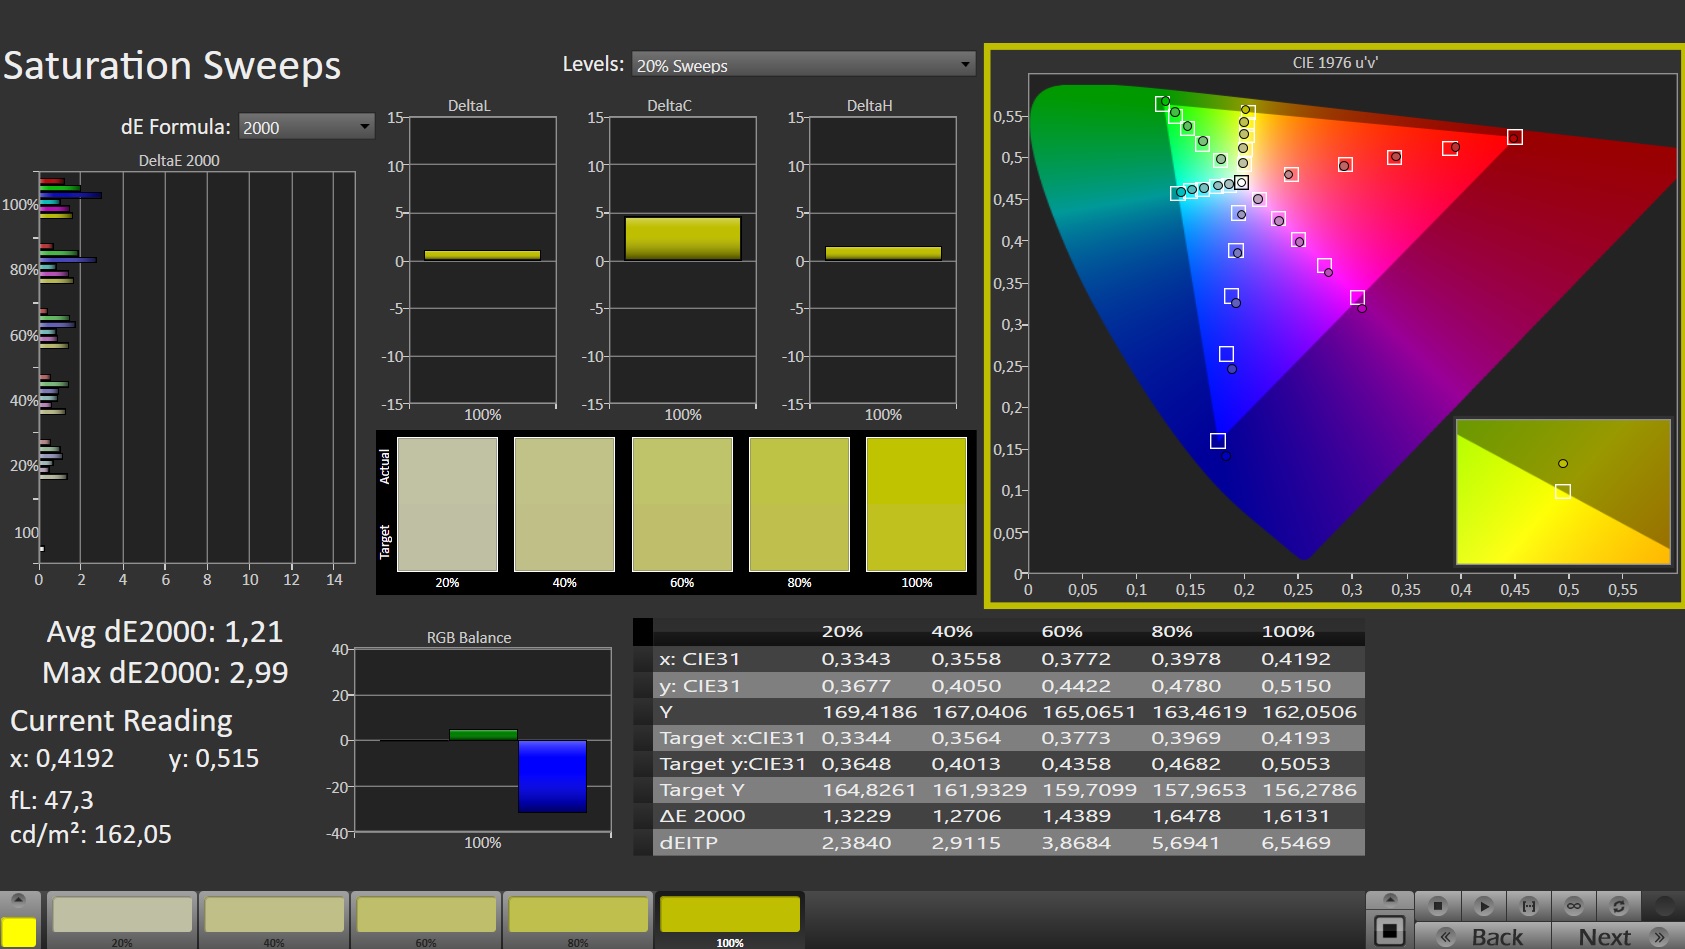
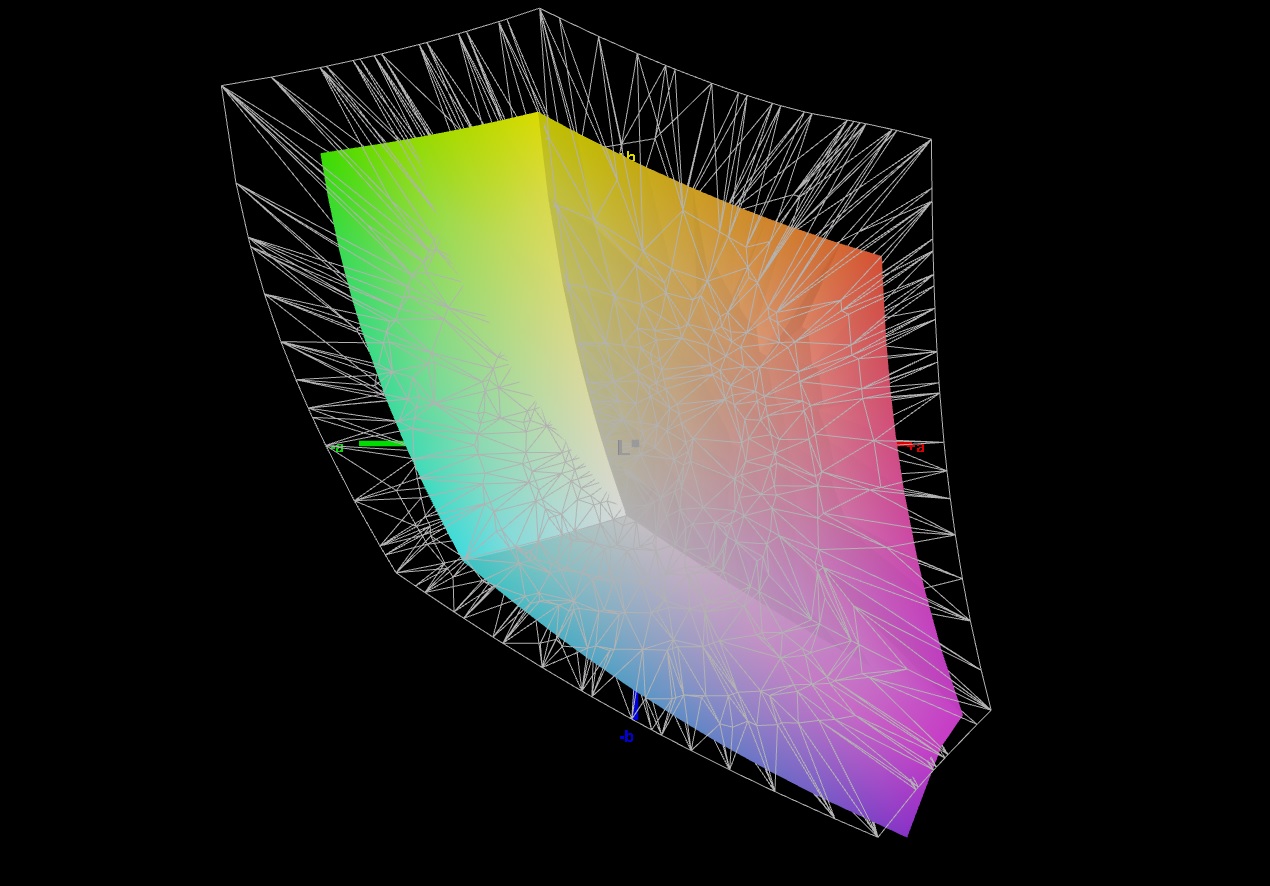
Affichage - IPS à bord
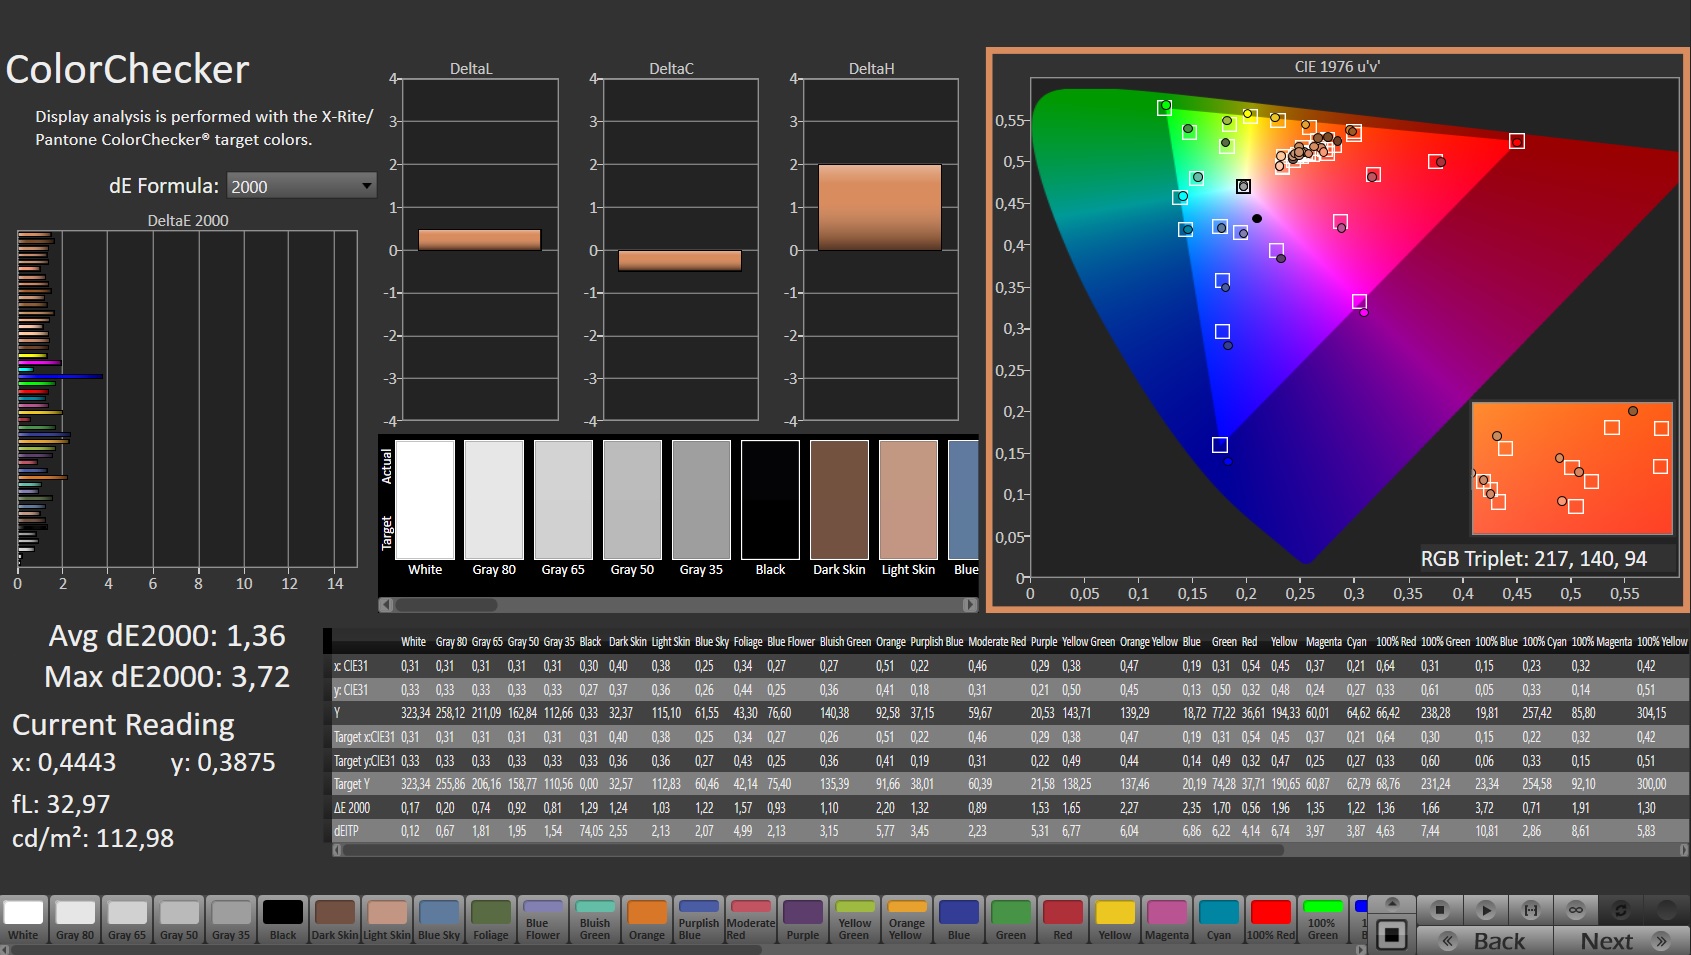
La luminosité (303,1 cd/m²) et le contraste (988:1) de l'écran mat de 15,6 pouces (2 560x1 440 pixels) atteignent à peine leurs objectifs respectifs. La dalle 165 Hz présente des temps de réponse rapides. Aucun scintillement PWM n'a pu être détecté

| |||||||||||||||||||||||||
Homogénéité de la luminosité: 89 %
Valeur mesurée au centre, sur batterie: 326 cd/m²
Contraste: 988:1 (Valeurs des noirs: 0.33 cd/m²)
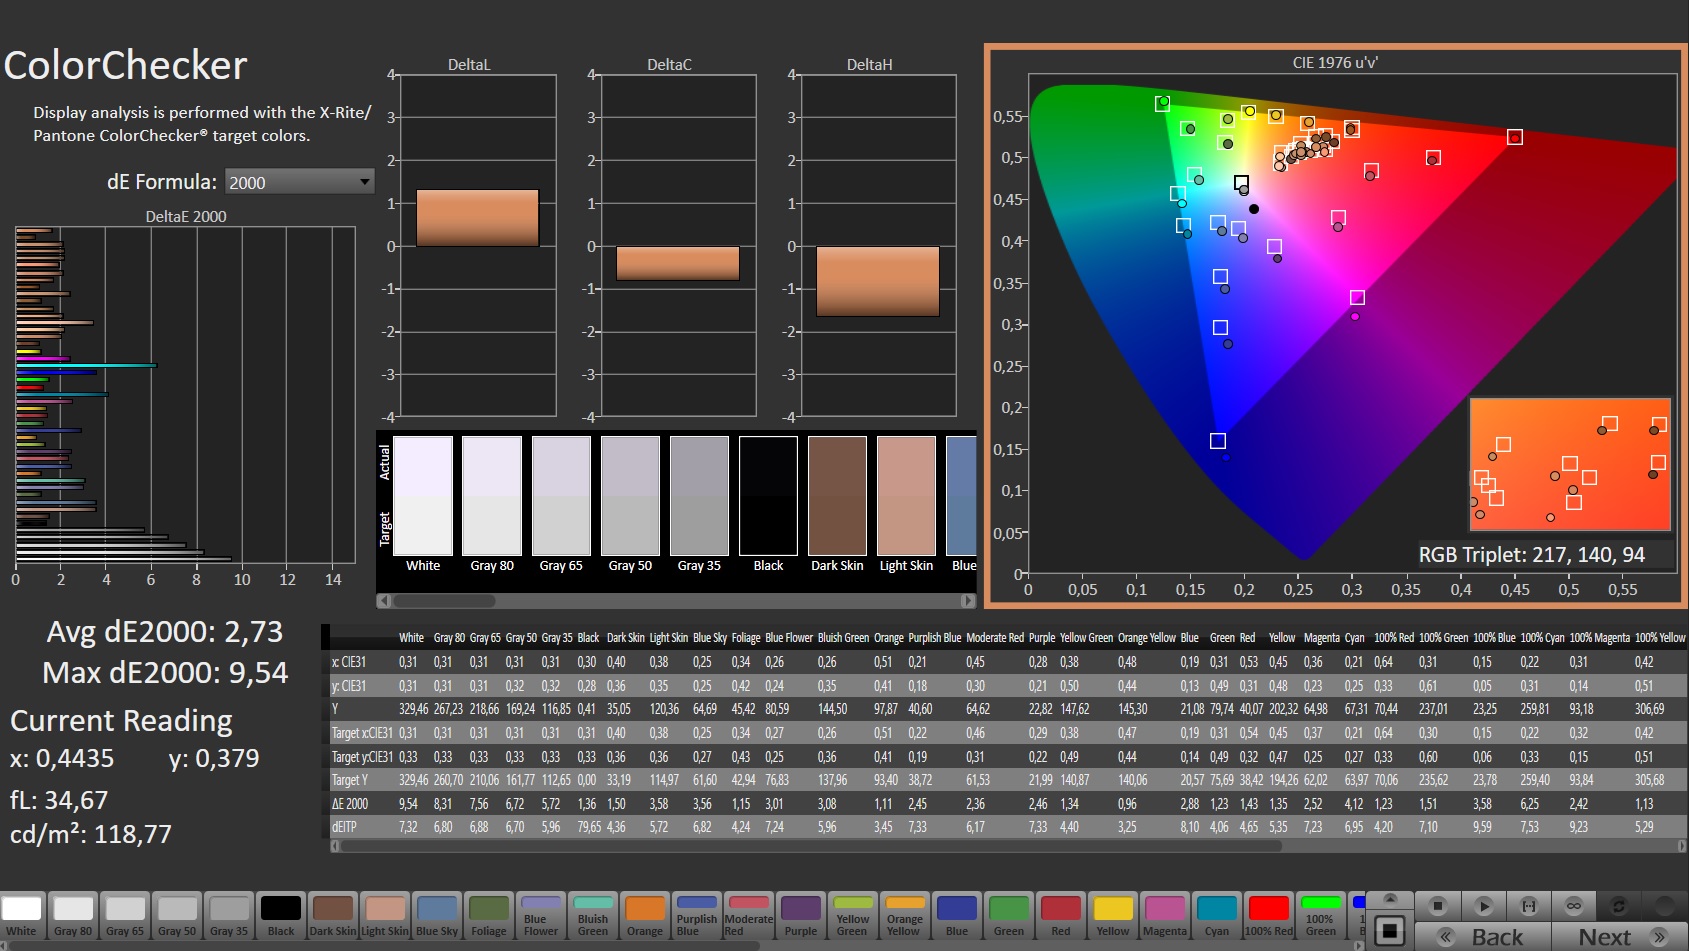
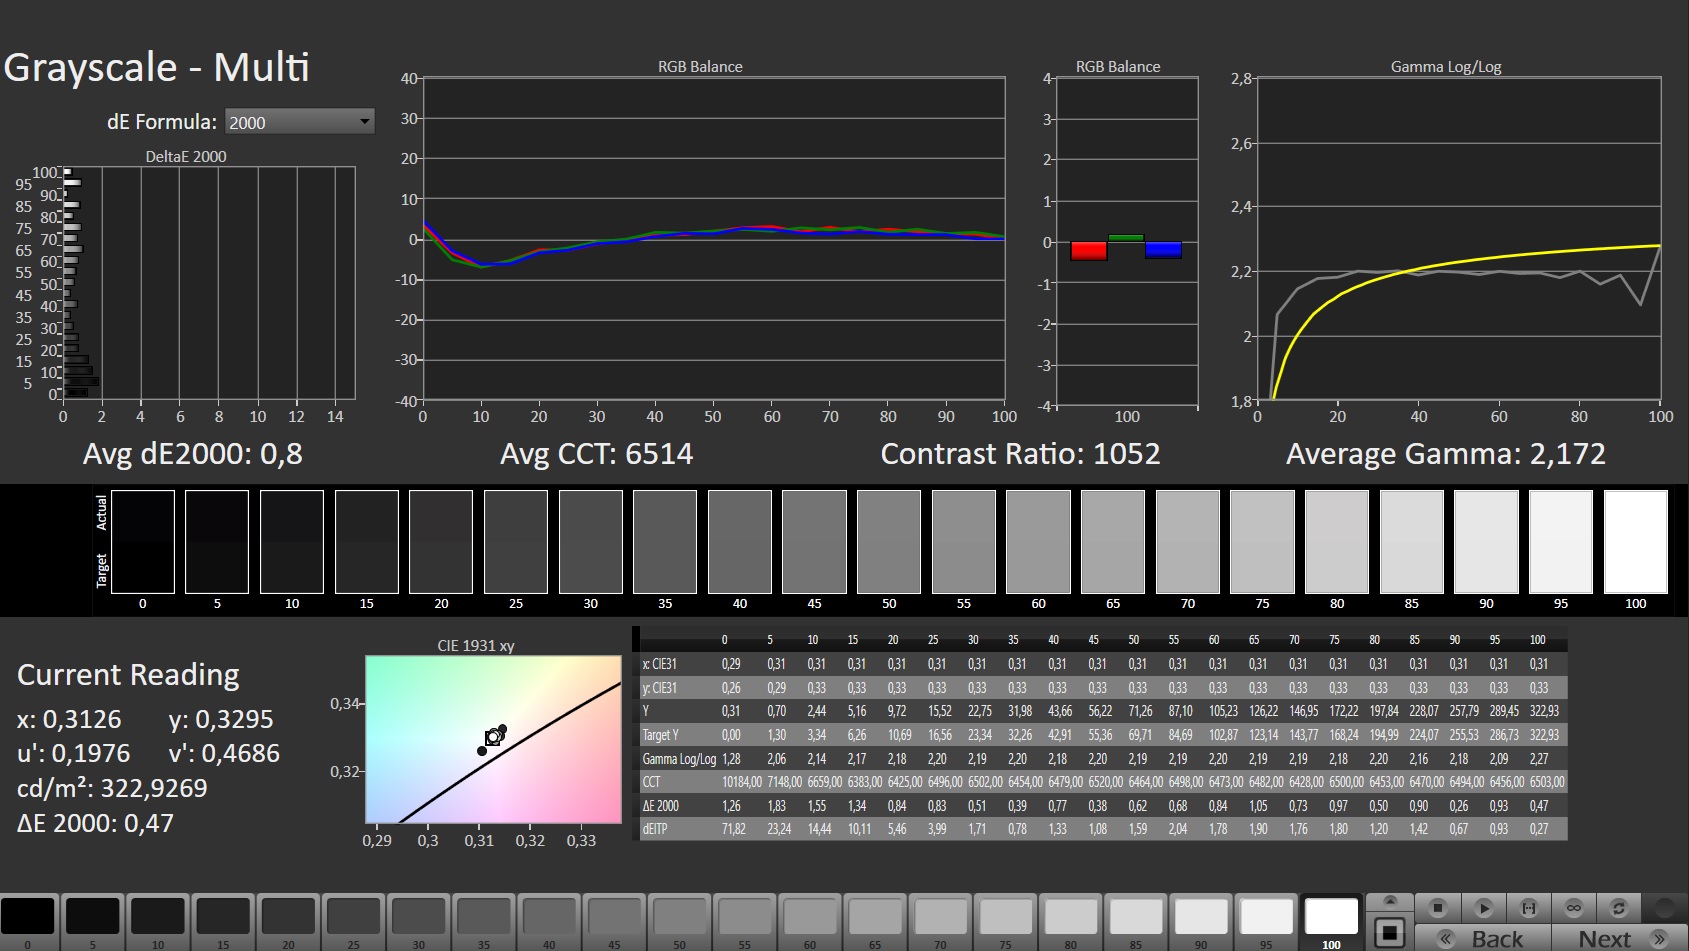
ΔE ColorChecker Calman: 2.73 | ∀{0.5-29.43 Ø4.73}
calibrated: 1.36
ΔE Greyscale Calman: 5.2 | ∀{0.09-98 Ø4.97}
68.2% AdobeRGB 1998 (Argyll 3D)
96.7% sRGB (Argyll 3D)
67.3% Display P3 (Argyll 3D)
Gamma: 2.074
CCT: 6911 K
| Schenker XMG Fusion 15 (Mid 22) BOE CQ NE156QHM-NY2, IPS, 2560x1440, 15.6" | Asus TUF Dash F15 FX517ZR BOE CQ NE156QHM-NY1, IPS, 2560x1440, 15.6" | Acer Nitro 5 AN515-58-72QR Chi Mei N156KME-GNA, IPS, 2560x1440, 15.6" | HP Omen 16-b1090ng BOE09E5, IPS, 2560x1440, 16.1" | MSI Delta 15 A5EFK LQ156M1JW03 (SHP155D), IPS-Level, 1920x1080, 15.6" | Razer Blade 15 Base Edition 2021, i7-10750H RTX 3060 BOE NV156FHM-N4K, IPS, 1920x1080, 15.6" | |
|---|---|---|---|---|---|---|
| Display | 25% | 23% | 4% | -0% | -4% | |
| Display P3 Coverage (%) | 67.3 | 98.4 46% | 95.6 42% | 71 5% | 66.5 -1% | 64.3 -4% |
| sRGB Coverage (%) | 96.7 | 99.9 3% | 99.8 3% | 97.9 1% | 97.8 1% | 91.8 -5% |
| AdobeRGB 1998 Coverage (%) | 68.2 | 85.9 26% | 85.2 25% | 73.3 7% | 67.6 -1% | 65.5 -4% |
| Response Times | 9% | -41% | -30% | -30% | -10% | |
| Response Time Grey 50% / Grey 80% * (ms) | 11.6 ? | 5.6 ? 52% | 15.7 ? -35% | 14.5 ? -25% | 12.8 ? -10% | 8.8 ? 24% |
| Response Time Black / White * (ms) | 7 ? | 9.4 ? -34% | 10.2 ? -46% | 9.4 ? -34% | 10.4 ? -49% | 10 ? -43% |
| PWM Frequency (Hz) | 23580 ? | 1000 ? | ||||
| Screen | 20% | 8% | -5% | 1% | -12% | |
| Brightness middle (cd/m²) | 326 | 286 -12% | 332 2% | 335 3% | 291 -11% | 317.2 -3% |
| Brightness (cd/m²) | 303 | 266 -12% | 303 0% | 319 5% | 266 -12% | 306 1% |
| Brightness Distribution (%) | 89 | 87 -2% | 86 -3% | 90 1% | 88 -1% | 89 0% |
| Black Level * (cd/m²) | 0.33 | 0.25 24% | 0.29 12% | 0.28 15% | 0.36 -9% | 0.31 6% |
| Contrast (:1) | 988 | 1144 16% | 1145 16% | 1196 21% | 808 -18% | 1023 4% |
| Colorchecker dE 2000 * | 2.73 | 2.14 22% | 3.61 -32% | 4.38 -60% | 2.98 -9% | 4.37 -60% |
| Colorchecker dE 2000 max. * | 9.54 | 5.22 45% | 7.71 19% | 9.48 1% | 7.59 20% | 6.62 31% |
| Colorchecker dE 2000 calibrated * | 1.36 | 0.67 51% | 0.59 57% | 1.33 2% | 0.91 33% | 2.67 -96% |
| Greyscale dE 2000 * | 5.2 | 2.8 46% | 5.2 -0% | 7 -35% | 4.2 19% | 4.5 13% |
| Gamma | 2.074 106% | 2.23 99% | 2.155 102% | 2.103 105% | 2.293 96% | 2.4 92% |
| CCT | 6911 94% | 7092 92% | 6724 97% | 6244 104% | 7624 85% | 7418 88% |
| Color Space (Percent of AdobeRGB 1998) (%) | 59.2 | |||||
| Color Space (Percent of sRGB) (%) | 91.4 | |||||
| Moyenne finale (programmes/paramètres) | 18% /
19% | -3% /
4% | -10% /
-7% | -10% /
-3% | -9% /
-10% |
* ... Moindre est la valeur, meilleures sont les performances
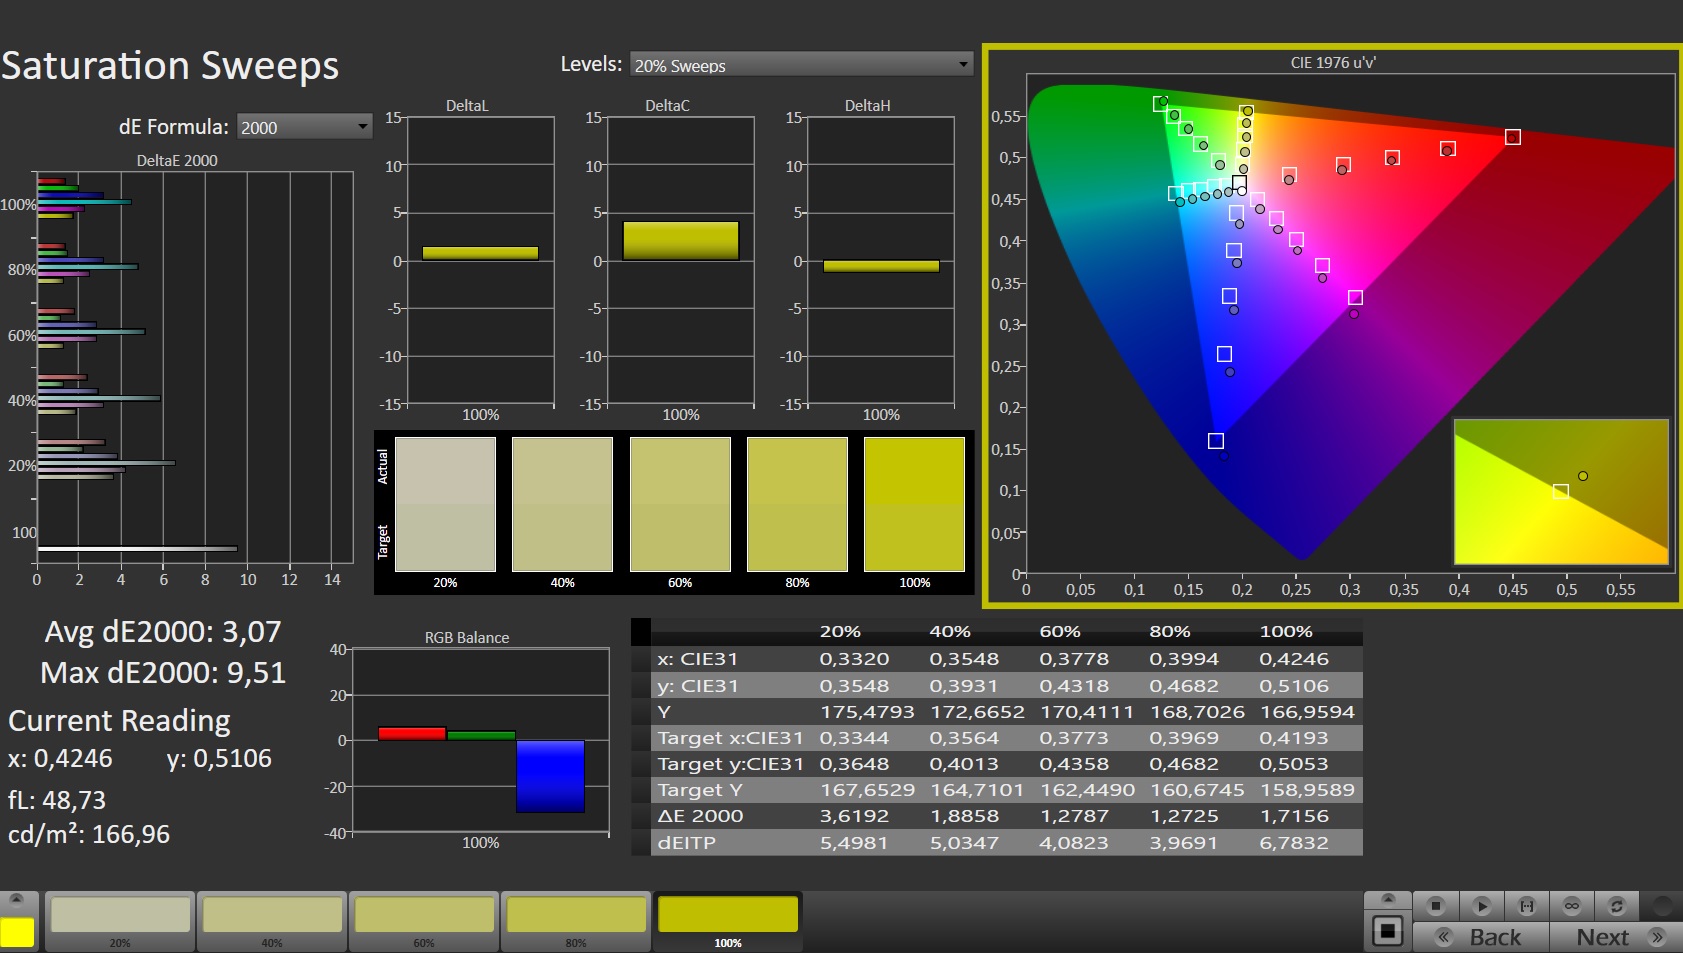
L'écran reproduit déjà bien les couleurs dès sa sortie de la boîte. La déviation de 2,73 se situe dans la fourchette cible (Delta E < 3) - cette déviation mineure n'est pas perceptible pour les spectateurs. L'étalonnage entraîne des améliorations : L'écart de couleur tombe à 1,36, et les niveaux de gris sont affichés de manière plus équilibrée. L'écran peut reproduire l'espace colorimétrique sRGB (96,7 %) presque intégralement ; les espaces colorimétriques AdobeRGB et DCI-P3 sont reproduits à 68 % et 67 %, respectivement
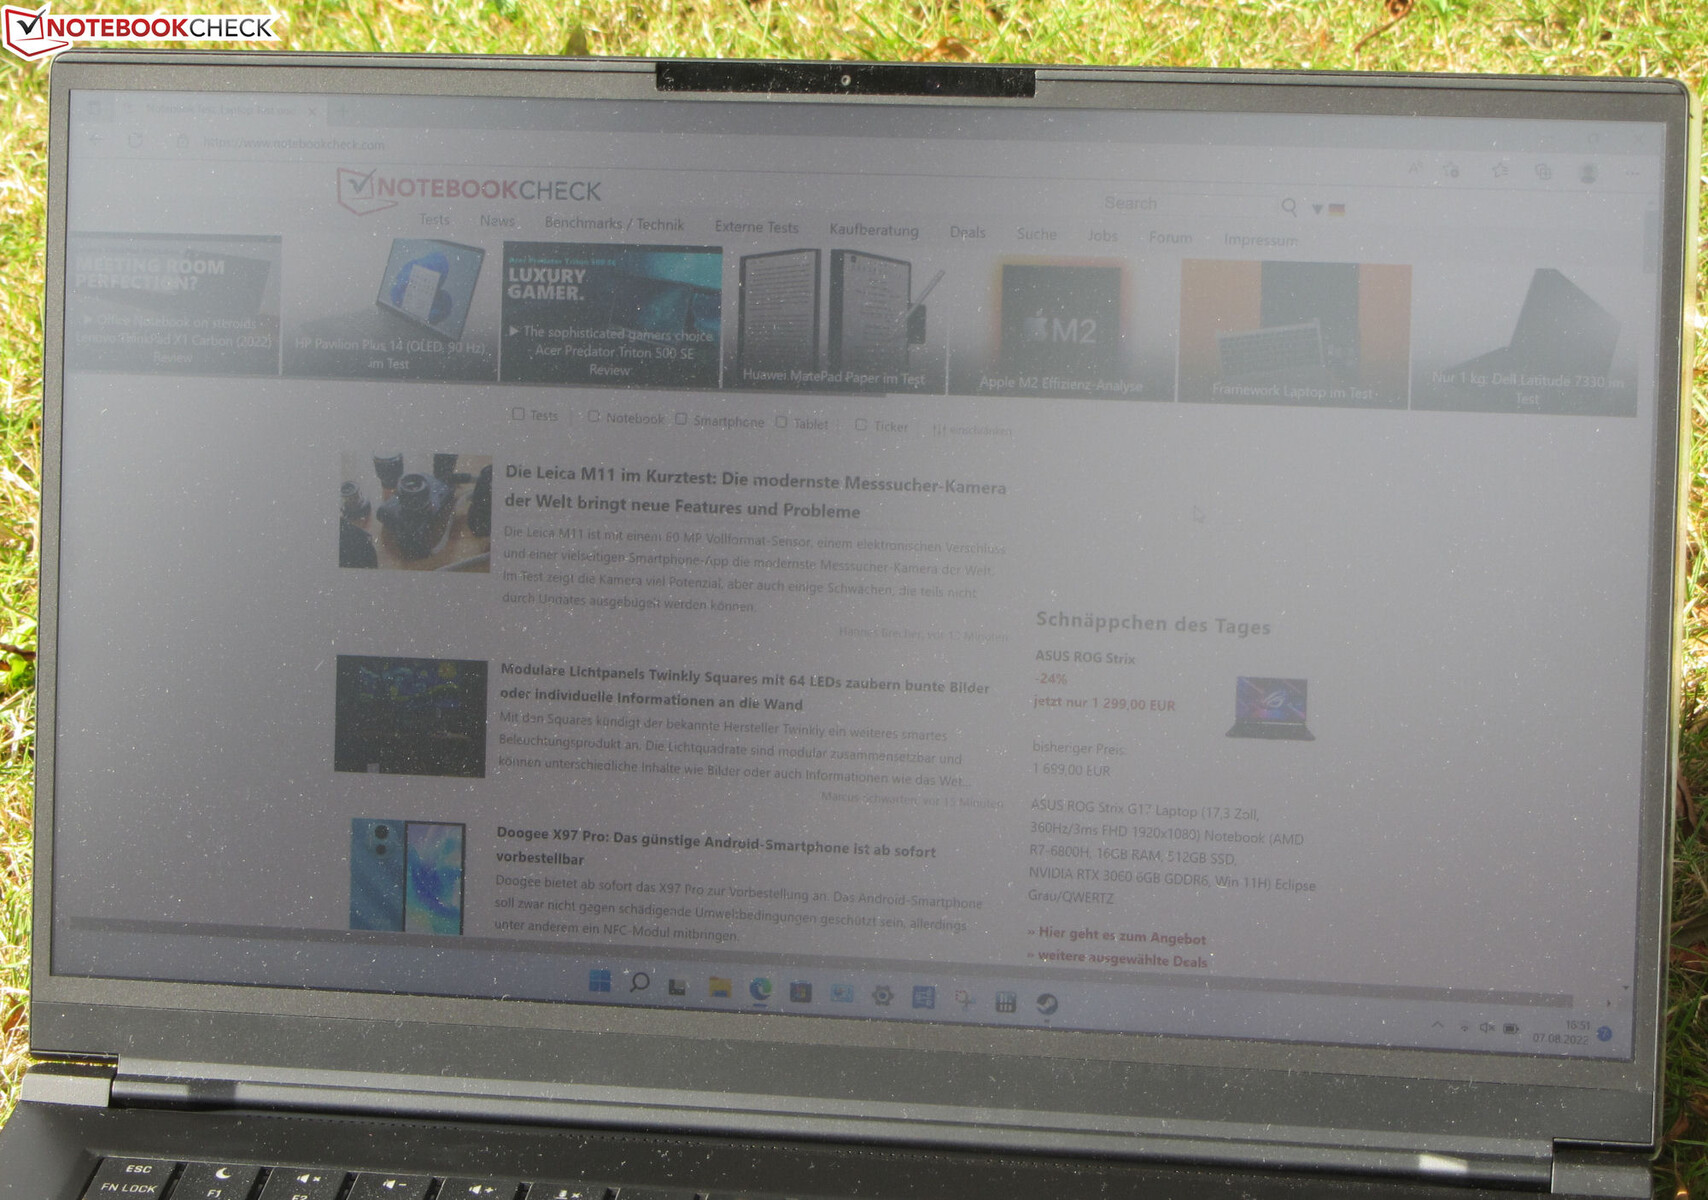
L'écran IPS à angle de vision stable est lisible dans toutes les positions. La lisibilité en extérieur est possible lorsque le soleil ne brille pas trop fort

Temps de réponse de l'écran
| ↔ Temps de réponse noir à blanc | ||
|---|---|---|
| 7 ms ... hausse ↗ et chute ↘ combinées | ↗ 3.3 ms hausse | 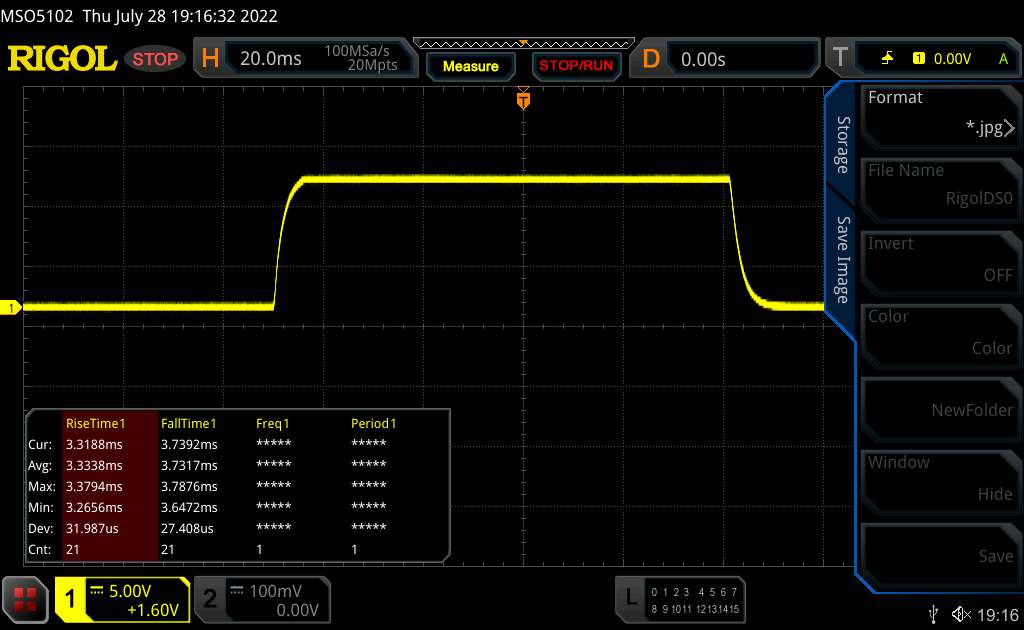 |
| ↘ 3.7 ms chute | ||
| L'écran montre de très faibles temps de réponse, parfait pour le jeu. En comparaison, tous les appareils testés affichent entre 0.1 (minimum) et 240 (maximum) ms. » 21 % des appareils testés affichent de meilleures performances. Cela signifie que les latences relevées sont meilleures que la moyenne (19.9 ms) de tous les appareils testés. | ||
| ↔ Temps de réponse gris 50% à gris 80% | ||
| 11.6 ms ... hausse ↗ et chute ↘ combinées | ↗ 5.6 ms hausse | 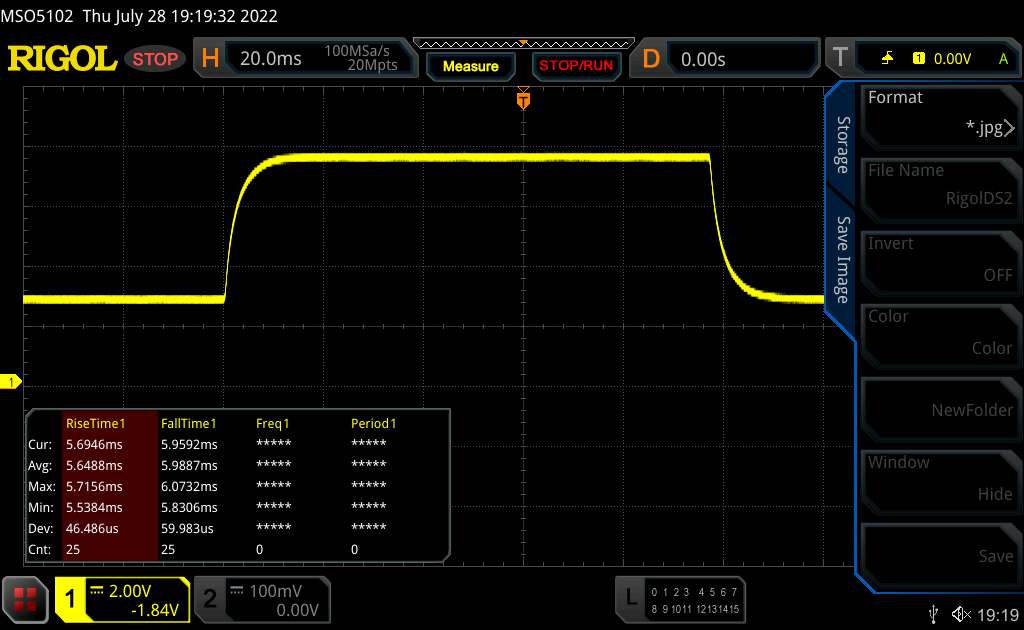 |
| ↘ 6 ms chute | ||
| L'écran montre de bons temps de réponse, mais insuffisant pour du jeu compétitif. En comparaison, tous les appareils testés affichent entre 0.165 (minimum) et 636 (maximum) ms. » 25 % des appareils testés affichent de meilleures performances. Cela signifie que les latences relevées sont meilleures que la moyenne (31.1 ms) de tous les appareils testés. | ||
Scintillement / MLI (Modulation de largeur d'impulsion)
| Scintillement / MLI (Modulation de largeur d'impulsion) non décelé | 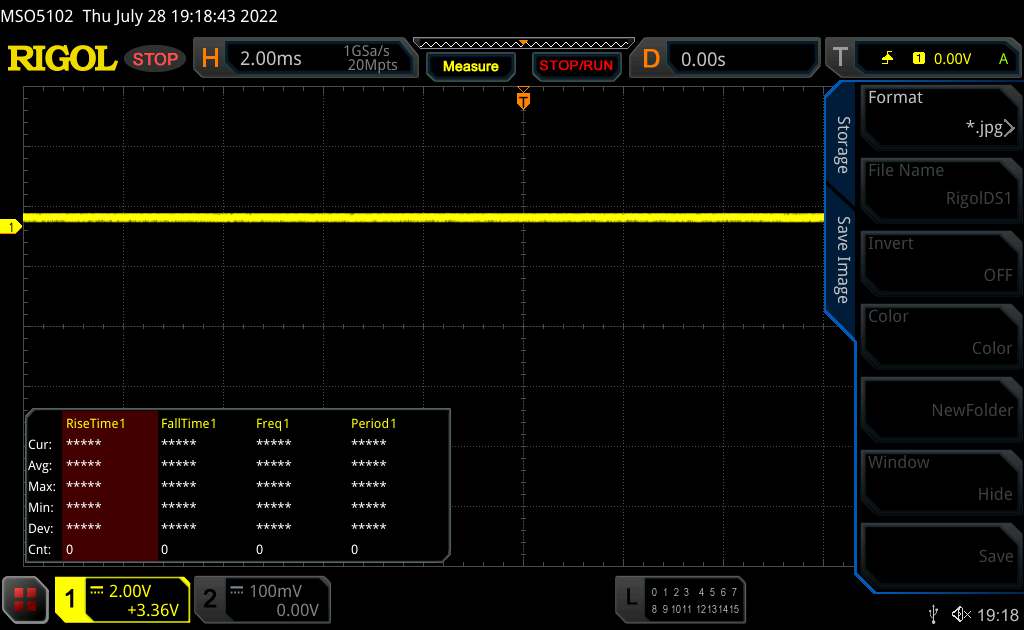 | ||
En comparaison, 52 % des appareils testés n'emploient pas MDI pour assombrir leur écran. Nous avons relevé une moyenne à 7801 (minimum : 5 - maximum : 343500) Hz dans le cas où une MDI était active. | |||
Performance - Tiger Lake rencontre Ampère
Avec le XMG Fusion 15, Schenker dispose d'un ordinateur portable puissant de 15,6 pouces, conçu pour divers domaines d'application
Conditions d'essai
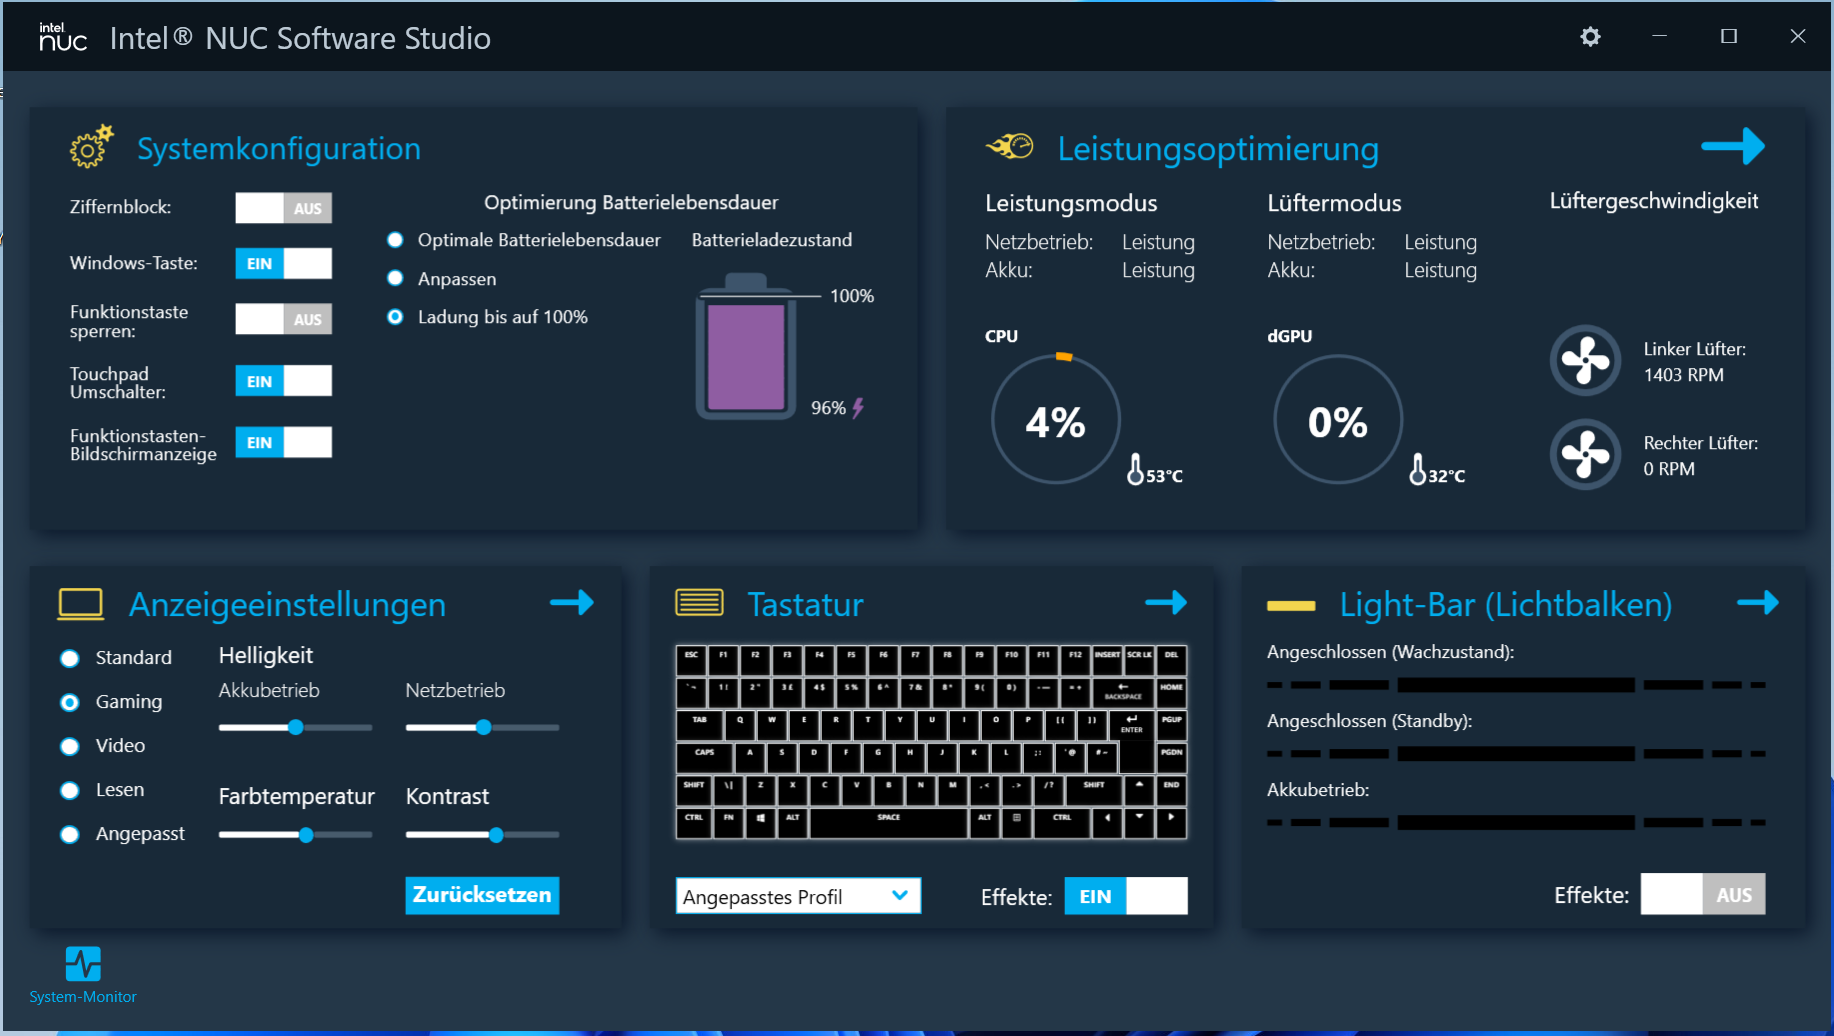
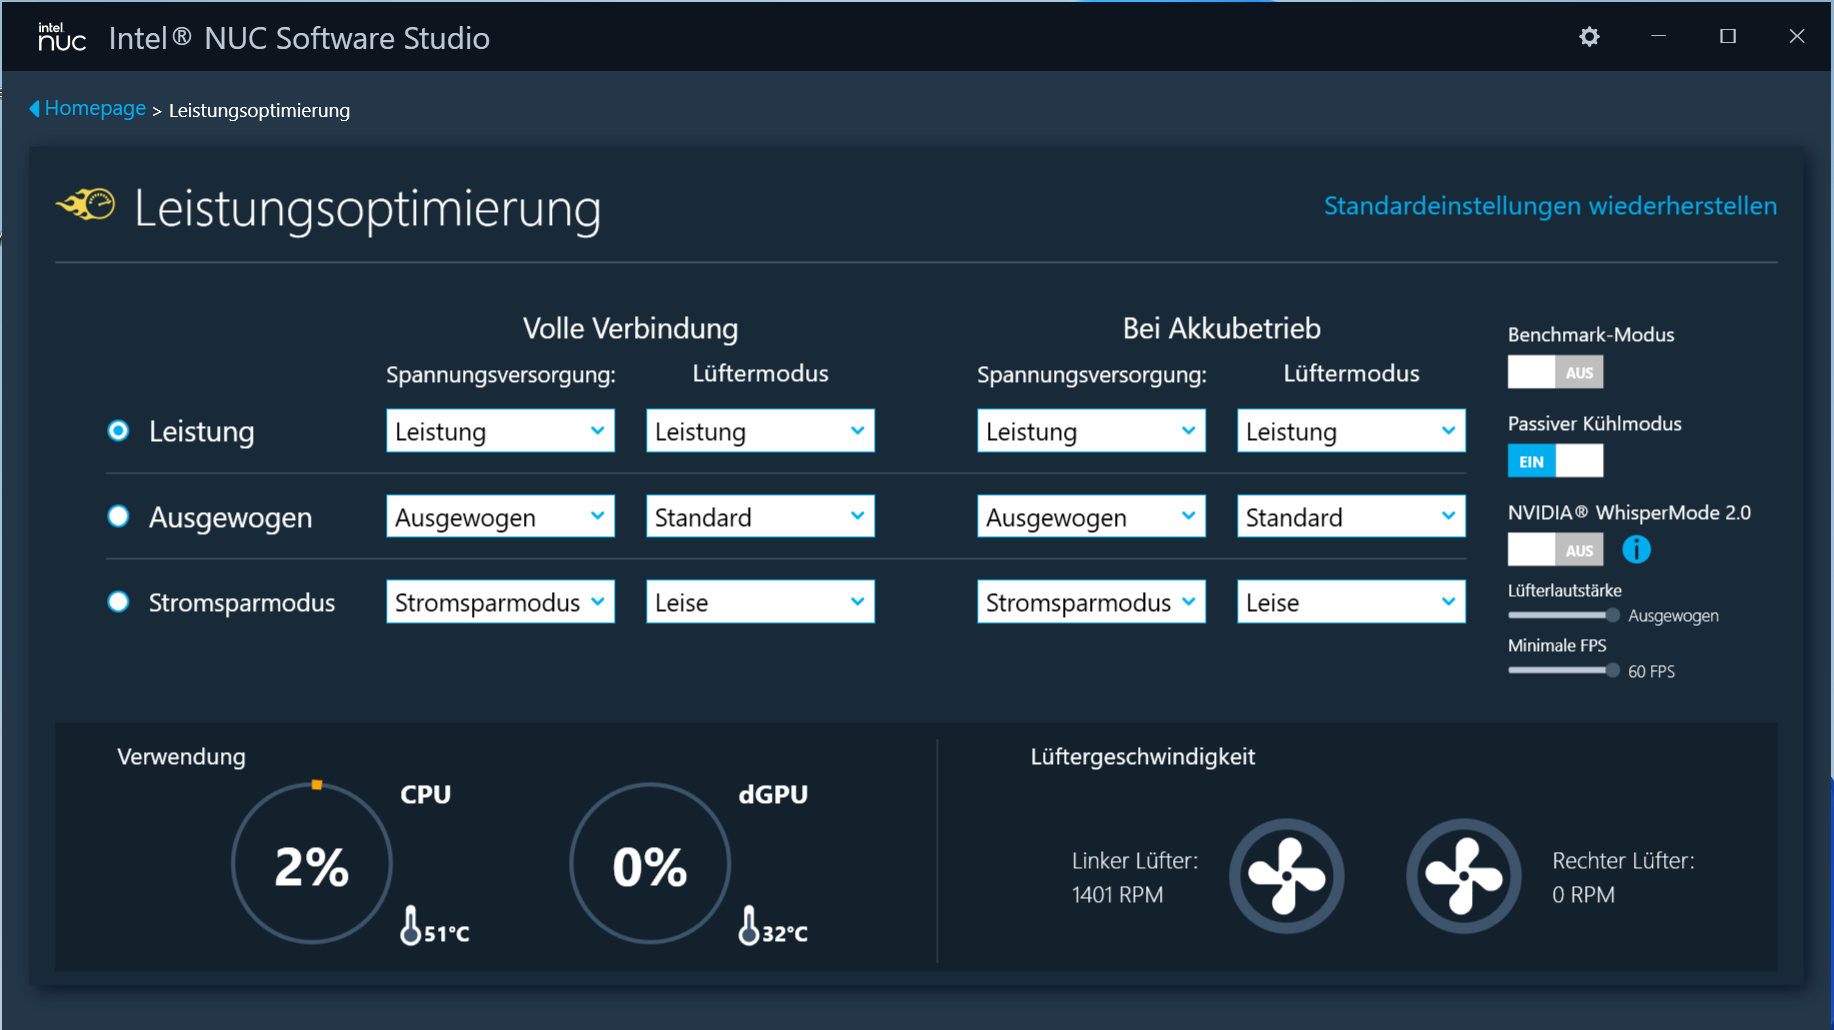
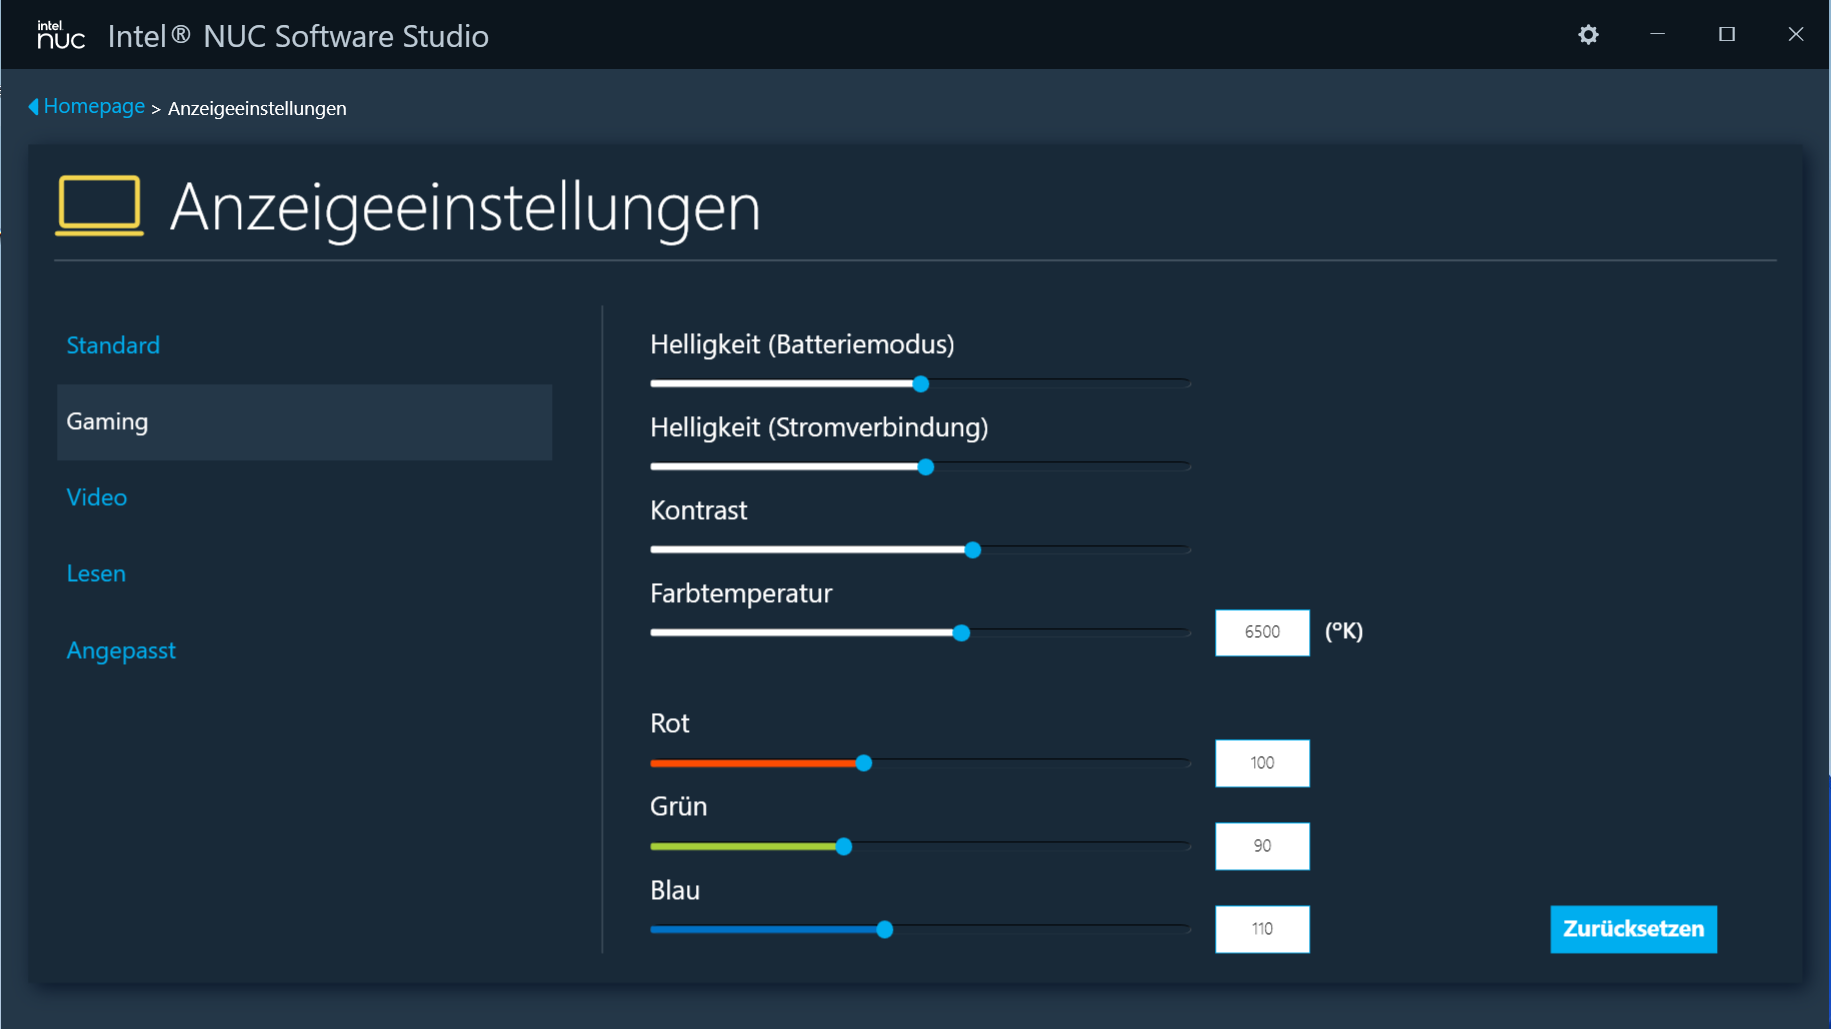
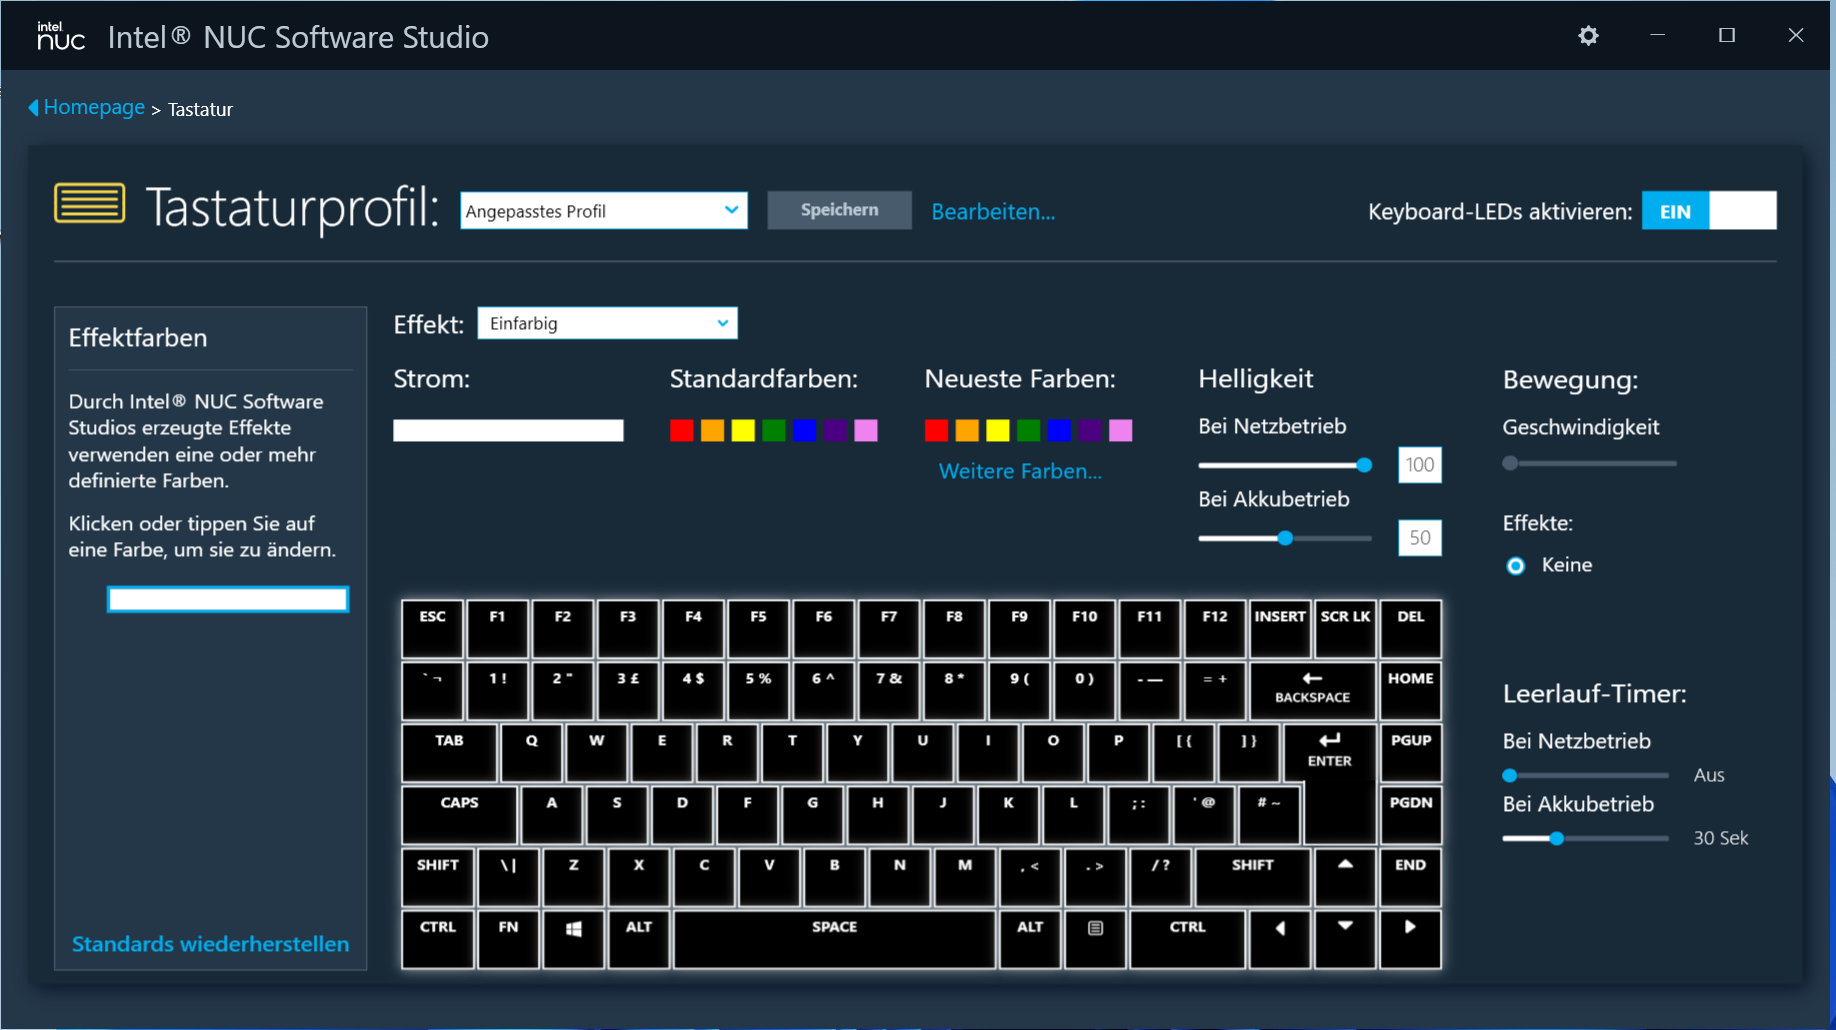
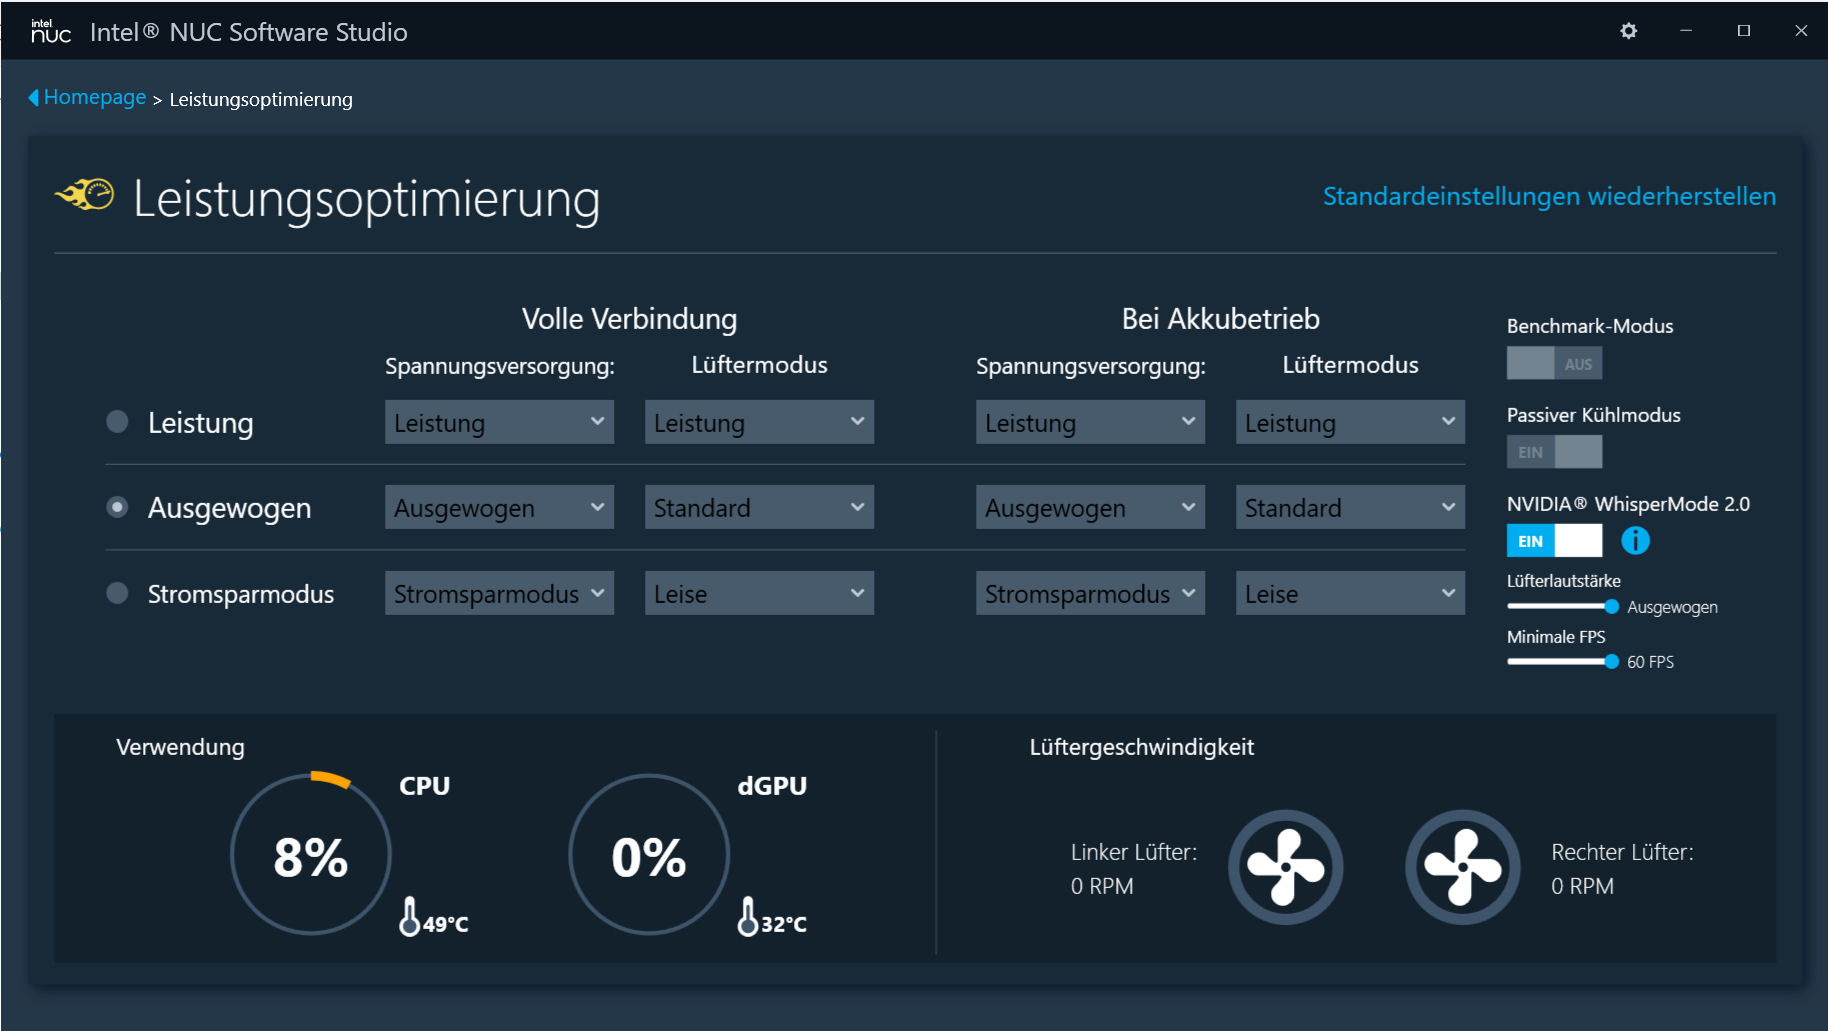
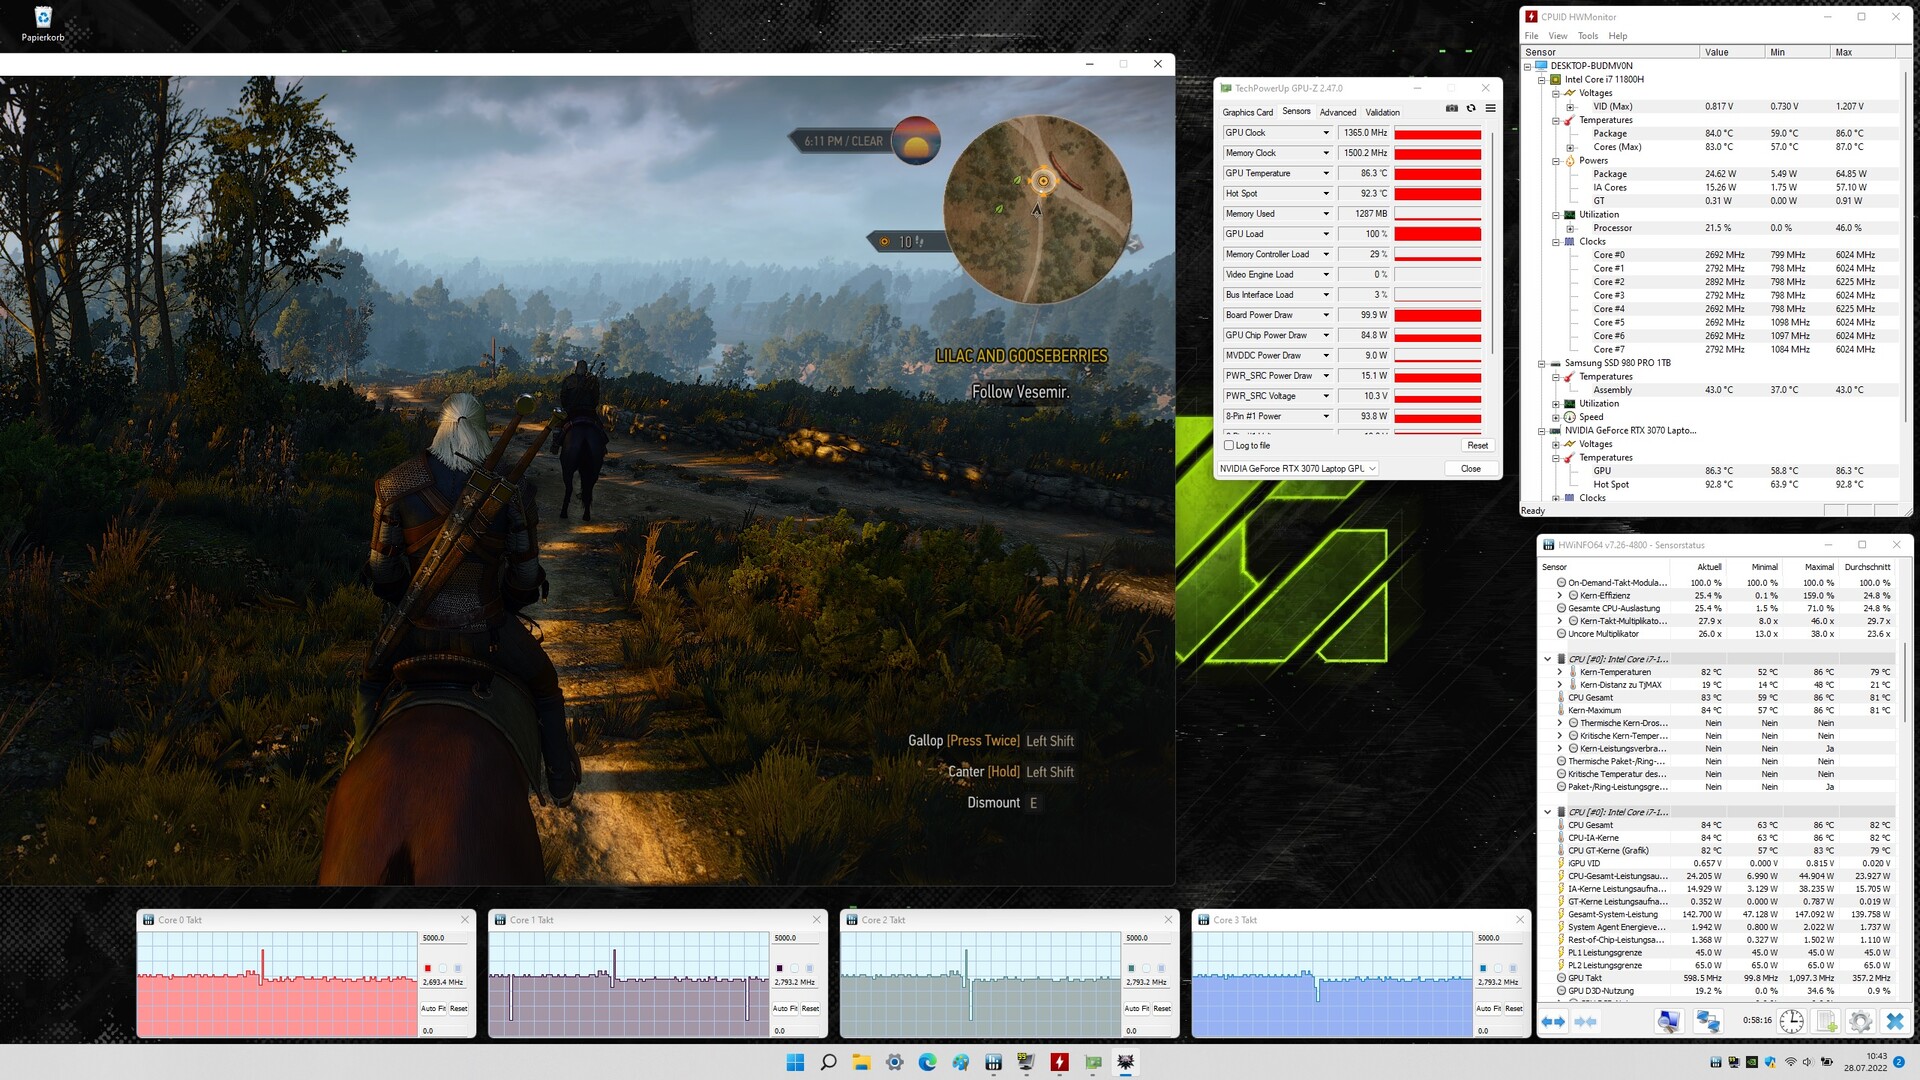
Le centre de contrôle préinstallé de l'ordinateur portable (Intel NUC Software Studio) permet aux utilisateurs de régler les performances, entre autres choses. Trois profils de performance sont disponibles, qui peuvent être changés dans l'application ou via un bouton séparé (à côté du bouton d'alimentation). Un quatrième profil est disponible au sein du centre, qui ne peut être activé que par un clic de souris : "Mode Benchmark". Ce profil libère les performances maximales du matériel intégré et permet aux ventilateurs de fonctionner en permanence à pleine puissance.
Notre test est effectué en utilisant le profil "Balanced" et la fonction active "Passive Cooling Mode". Ce sont les paramètres par défaut de la boîte. Le mode de refroidissement passif fait en sorte que les ventilateurs s'arrêtent dès que les températures le permettent. Sinon, un ventilateur fonctionnerait en permanence à faible vitesse.
| Performance | Equilibré | Economie d'énergie | Mode Benchmark | |
|---|---|---|---|---|
| Limite de puissance 1 | 65 W | 45 W | 30 W | 100 W |
| Limite de puissance 2 | 90 W | 65 W | 60 W | 110 W |
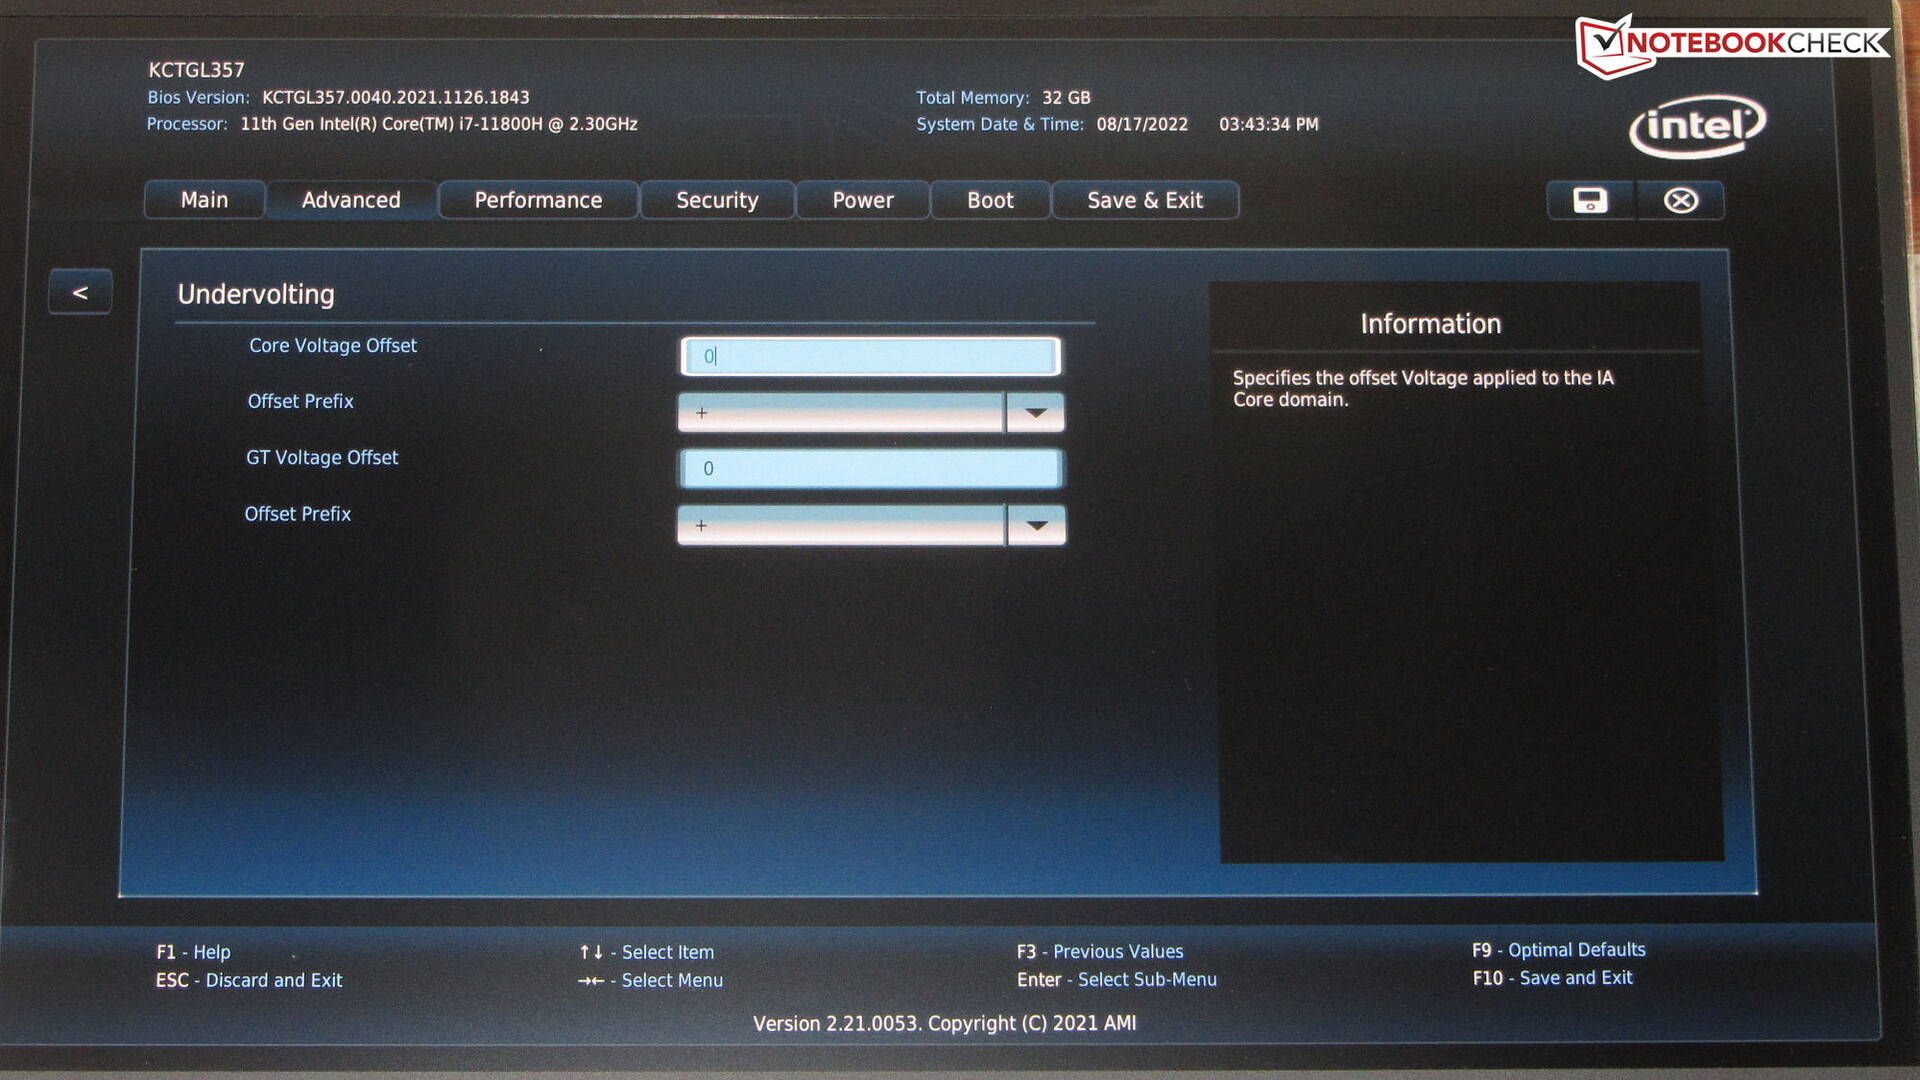
Undervolting via le BIOS
Le processeur et l'iGPU peuvent être exploités avec des tensions inférieures à celles prévues par le fabricant (undervolting). Par conséquent, la consommation d'énergie et le dégagement de chaleur diminuent. Mais attention : Un abaissement trop important de la tension peut conduire à un système instable ou défectueux. Dans ce cas, il est nécessaire de revenir au niveau de tension précédent. L'undervoltage se fait aux risques et périls de l'utilisateur
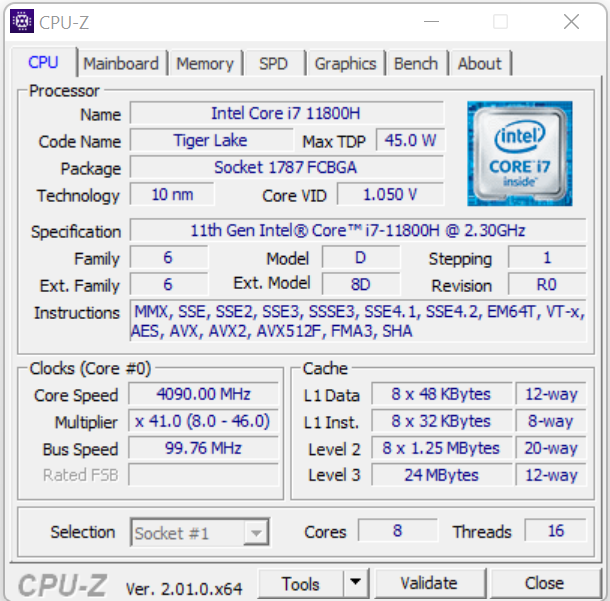
Processeur
Le processeur quadri-cœur
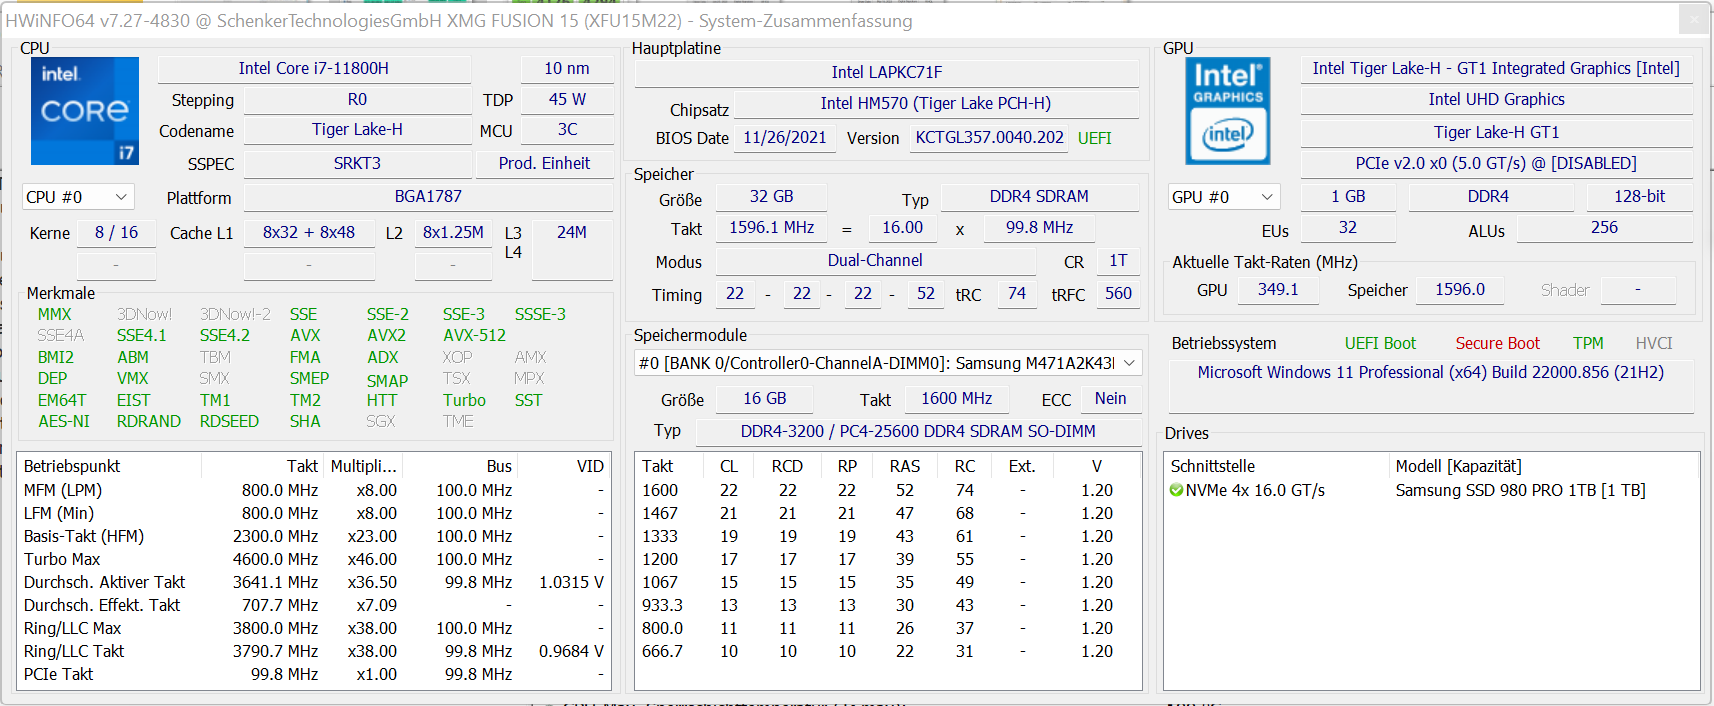
Core-i7-11800H (Tiger Lake) fonctionne à une fréquence d'horloge de base de 2,3 GHz. Une augmentation à 4,2 GHz (huit cœurs) ou 4,6 GHz (un cœur) est possible via Turbo. L'Hyper-Threading (deux threads par cœur) est pris en charge.
Le test multithread du benchmark Cinebench R15 est traité entre 1,3 et 4,2 GHz, tandis que le test single-thread est exécuté entre 1,1 et 4,6 GHz. Les fréquences d'horloge restent à un niveau similaire sur batterie.

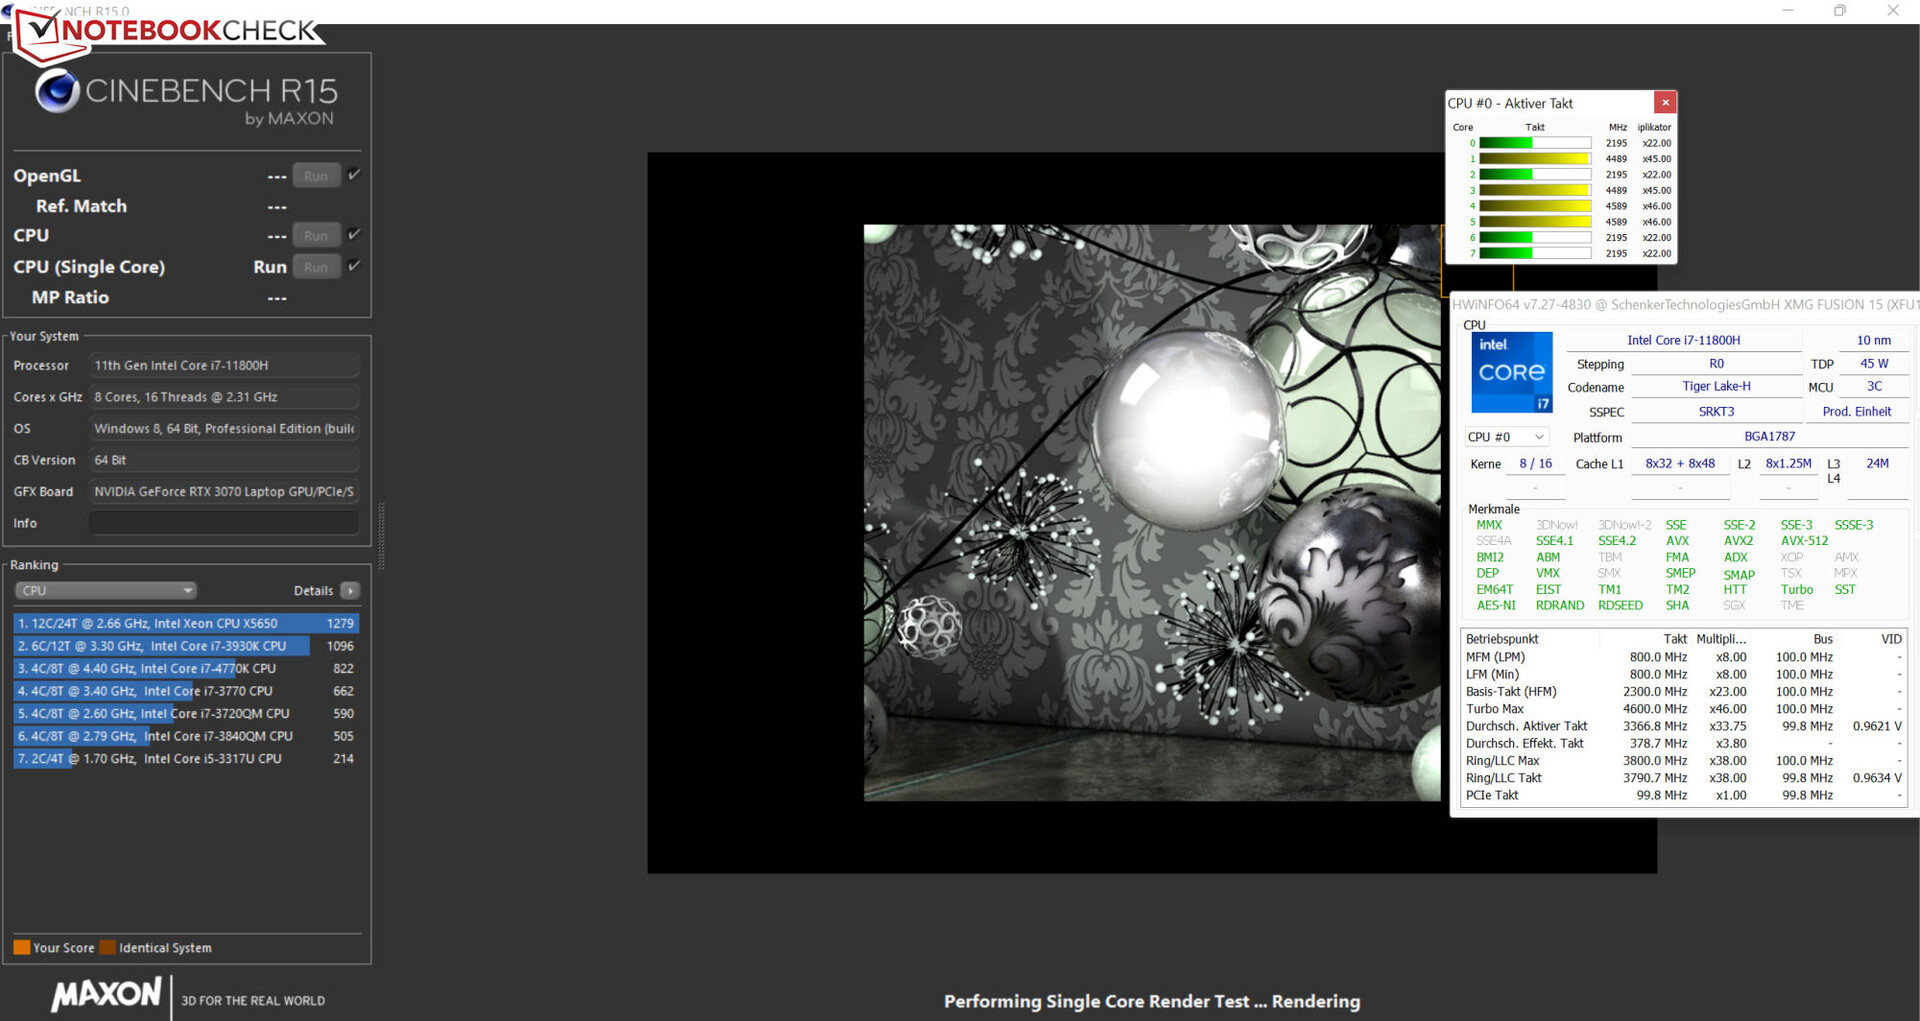
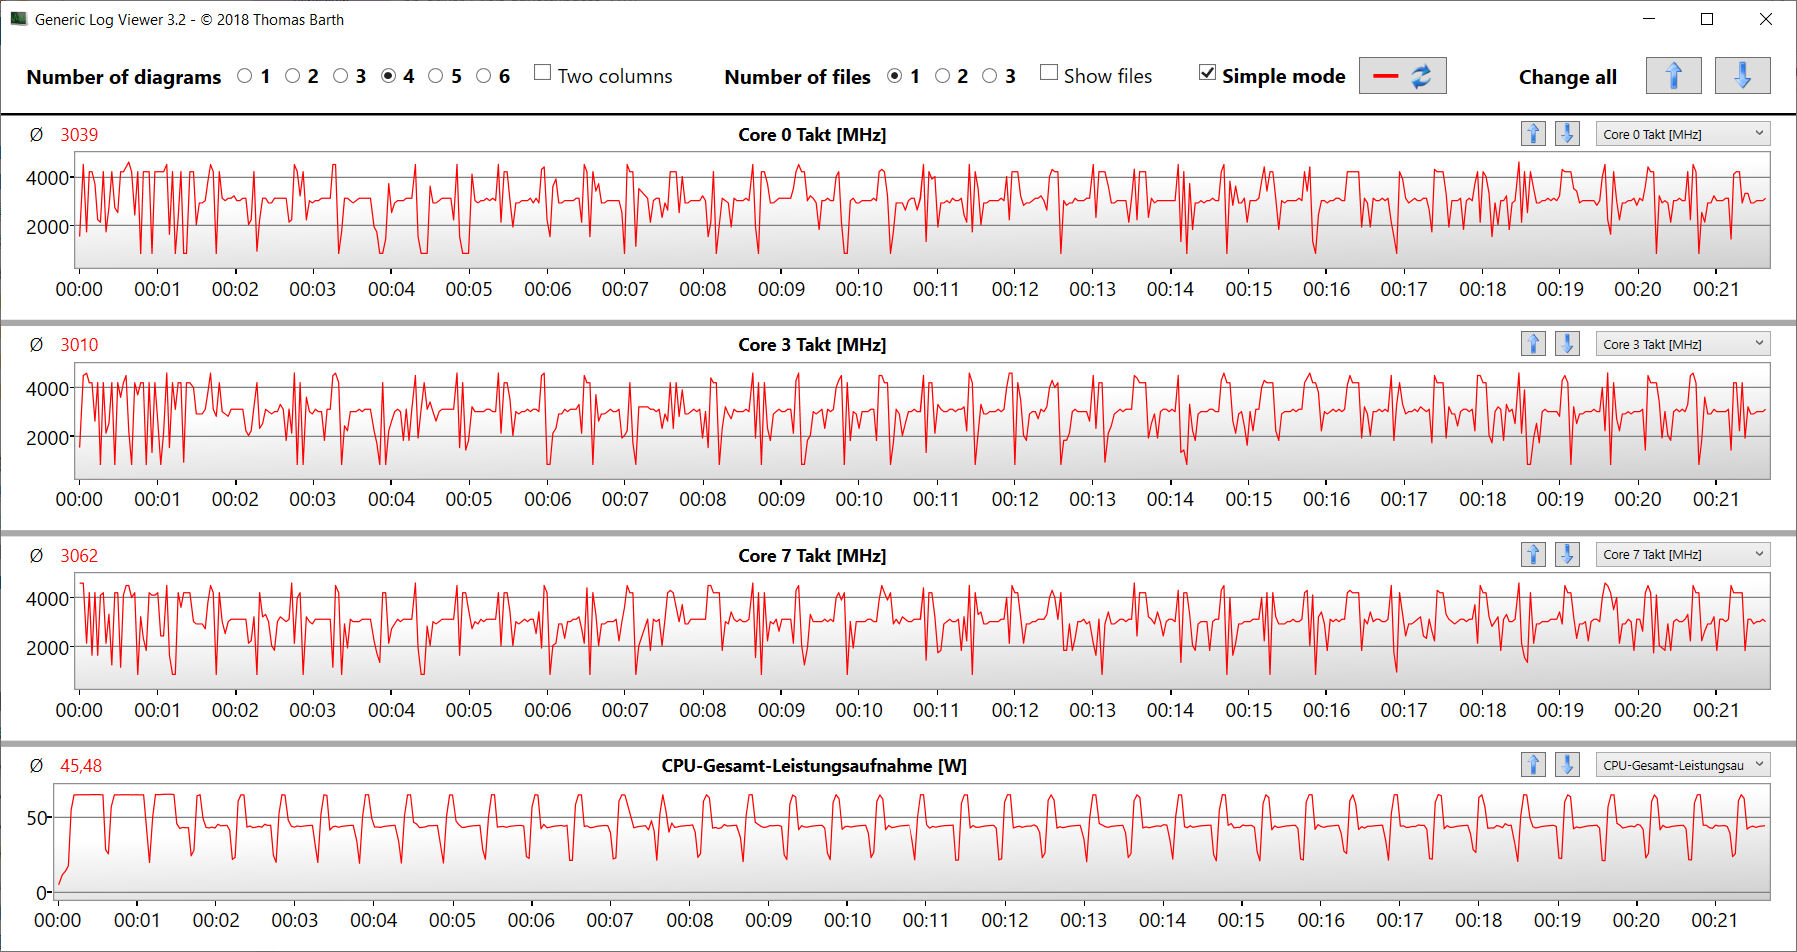
Nous vérifions si le CPU Turbo est constamment utilisé lorsqu'il est branché en exécutant le test multithread du benchmark Cinebench R15 pendant au moins 30 minutes. Le profil "Benchmark Mode" exploite le Turbo du CPU presque complètement.
Cinebench R15 Multi endurance test
| CPU Performance rating - Percent | |
| Moyenne de la classe Gaming | |
| HP Omen 16-b1090ng | |
| Acer Nitro 5 AN515-58-72QR | |
| Asus TUF Dash F15 FX517ZR | |
| Schenker XMG Fusion 15 (Mid 22) | |
| Schenker XMG Fusion 15 (Mid 22) | |
| MSI Delta 15 A5EFK | |
| Moyenne Intel Core i7-11800H | |
| Schenker XMG Fusion 15 (Mid 22) | |
| Schenker XMG Fusion 15 (Mid 22) | |
| Razer Blade 15 Base Edition 2021, i7-10750H RTX 3060 | |
| Cinebench R23 | |
| Multi Core | |
| Moyenne de la classe Gaming (10488 - 40970, n=113, 2 dernières années) | |
| Acer Nitro 5 AN515-58-72QR | |
| HP Omen 16-b1090ng | |
| Asus TUF Dash F15 FX517ZR | |
| Schenker XMG Fusion 15 (Mid 22) (Benchmark-Modus) | |
| Schenker XMG Fusion 15 (Mid 22) (Leistung) | |
| MSI Delta 15 A5EFK | |
| Moyenne Intel Core i7-11800H (6508 - 14088, n=48) | |
| Schenker XMG Fusion 15 (Mid 22) | |
| Schenker XMG Fusion 15 (Mid 22) (Stromsparmodus) | |
| Razer Blade 15 Base Edition 2021, i7-10750H RTX 3060 | |
| Single Core | |
| Moyenne de la classe Gaming (1166 - 2356, n=113, 2 dernières années) | |
| Acer Nitro 5 AN515-58-72QR | |
| Asus TUF Dash F15 FX517ZR | |
| HP Omen 16-b1090ng | |
| Schenker XMG Fusion 15 (Mid 22) | |
| Schenker XMG Fusion 15 (Mid 22) (Benchmark-Modus) | |
| Schenker XMG Fusion 15 (Mid 22) (Leistung) | |
| Moyenne Intel Core i7-11800H (1386 - 1522, n=45) | |
| Schenker XMG Fusion 15 (Mid 22) (Stromsparmodus) | |
| MSI Delta 15 A5EFK | |
| Razer Blade 15 Base Edition 2021, i7-10750H RTX 3060 | |
| Cinebench R20 | |
| CPU (Multi Core) | |
| Moyenne de la classe Gaming (4029 - 16108, n=112, 2 dernières années) | |
| Acer Nitro 5 AN515-58-72QR | |
| HP Omen 16-b1090ng | |
| Asus TUF Dash F15 FX517ZR | |
| Schenker XMG Fusion 15 (Mid 22) (Benchmark-Modus) | |
| Schenker XMG Fusion 15 (Mid 22) (Leistung) | |
| MSI Delta 15 A5EFK | |
| Moyenne Intel Core i7-11800H (2498 - 5408, n=50) | |
| Schenker XMG Fusion 15 (Mid 22) | |
| Schenker XMG Fusion 15 (Mid 22) (Stromsparmodus) | |
| Razer Blade 15 Base Edition 2021, i7-10750H RTX 3060 | |
| CPU (Single Core) | |
| Moyenne de la classe Gaming (442 - 895, n=112, 2 dernières années) | |
| Asus TUF Dash F15 FX517ZR | |
| HP Omen 16-b1090ng | |
| Acer Nitro 5 AN515-58-72QR | |
| Schenker XMG Fusion 15 (Mid 22) (Benchmark-Modus) | |
| Schenker XMG Fusion 15 (Mid 22) (Leistung) | |
| Schenker XMG Fusion 15 (Mid 22) | |
| MSI Delta 15 A5EFK | |
| Moyenne Intel Core i7-11800H (520 - 586, n=47) | |
| Schenker XMG Fusion 15 (Mid 22) (Stromsparmodus) | |
| Razer Blade 15 Base Edition 2021, i7-10750H RTX 3060 | |
| Cinebench R15 | |
| CPU Multi 64Bit | |
| Moyenne de la classe Gaming (1578 - 6271, n=113, 2 dernières années) | |
| HP Omen 16-b1090ng | |
| Acer Nitro 5 AN515-58-72QR | |
| Asus TUF Dash F15 FX517ZR | |
| MSI Delta 15 A5EFK | |
| Schenker XMG Fusion 15 (Mid 22) (Benchmark-Modus) | |
| Schenker XMG Fusion 15 (Mid 22) (Leistung) | |
| Moyenne Intel Core i7-11800H (1342 - 2173, n=50) | |
| Schenker XMG Fusion 15 (Mid 22) | |
| Schenker XMG Fusion 15 (Mid 22) (Stromsparmodus) | |
| Razer Blade 15 Base Edition 2021, i7-10750H RTX 3060 | |
| CPU Single 64Bit | |
| Moyenne de la classe Gaming (188.8 - 343, n=112, 2 dernières années) | |
| Acer Nitro 5 AN515-58-72QR | |
| HP Omen 16-b1090ng | |
| Asus TUF Dash F15 FX517ZR | |
| MSI Delta 15 A5EFK | |
| Schenker XMG Fusion 15 (Mid 22) | |
| Schenker XMG Fusion 15 (Mid 22) (Leistung) | |
| Schenker XMG Fusion 15 (Mid 22) (Benchmark-Modus) | |
| Moyenne Intel Core i7-11800H (201 - 231, n=46) | |
| Schenker XMG Fusion 15 (Mid 22) (Stromsparmodus) | |
| Razer Blade 15 Base Edition 2021, i7-10750H RTX 3060 | |
| Blender - v2.79 BMW27 CPU | |
| Razer Blade 15 Base Edition 2021, i7-10750H RTX 3060 | |
| Schenker XMG Fusion 15 (Mid 22) (Stromsparmodus) | |
| Schenker XMG Fusion 15 (Mid 22) | |
| Moyenne Intel Core i7-11800H (217 - 454, n=46) | |
| Schenker XMG Fusion 15 (Mid 22) (Leistung) | |
| MSI Delta 15 A5EFK | |
| Asus TUF Dash F15 FX517ZR | |
| Schenker XMG Fusion 15 (Mid 22) (Benchmark-Modus) | |
| Acer Nitro 5 AN515-58-72QR | |
| HP Omen 16-b1090ng | |
| Moyenne de la classe Gaming (80 - 330, n=110, 2 dernières années) | |
| 7-Zip 18.03 | |
| 7z b 4 | |
| Moyenne de la classe Gaming (33491 - 148086, n=111, 2 dernières années) | |
| HP Omen 16-b1090ng | |
| MSI Delta 15 A5EFK | |
| Asus TUF Dash F15 FX517ZR | |
| Acer Nitro 5 AN515-58-72QR | |
| Schenker XMG Fusion 15 (Mid 22) (Benchmark-Modus) | |
| Schenker XMG Fusion 15 (Mid 22) (Leistung) | |
| Moyenne Intel Core i7-11800H (33718 - 56758, n=46) | |
| Schenker XMG Fusion 15 (Mid 22) | |
| Schenker XMG Fusion 15 (Mid 22) (Stromsparmodus) | |
| Razer Blade 15 Base Edition 2021, i7-10750H RTX 3060 | |
| 7z b 4 -mmt1 | |
| Moyenne de la classe Gaming (4199 - 7436, n=111, 2 dernières années) | |
| HP Omen 16-b1090ng | |
| Acer Nitro 5 AN515-58-72QR | |
| Asus TUF Dash F15 FX517ZR | |
| MSI Delta 15 A5EFK | |
| Schenker XMG Fusion 15 (Mid 22) (Benchmark-Modus) | |
| Schenker XMG Fusion 15 (Mid 22) | |
| Moyenne Intel Core i7-11800H (5138 - 5732, n=46) | |
| Schenker XMG Fusion 15 (Mid 22) (Leistung) | |
| Schenker XMG Fusion 15 (Mid 22) (Stromsparmodus) | |
| Razer Blade 15 Base Edition 2021, i7-10750H RTX 3060 | |
| Geekbench 5.5 | |
| Multi-Core | |
| Moyenne de la classe Gaming (6460 - 27010, n=111, 2 dernières années) | |
| HP Omen 16-b1090ng | |
| Asus TUF Dash F15 FX517ZR | |
| Acer Nitro 5 AN515-58-72QR | |
| Schenker XMG Fusion 15 (Mid 22) (Benchmark-Modus) | |
| Schenker XMG Fusion 15 (Mid 22) (Leistung) | |
| MSI Delta 15 A5EFK | |
| Moyenne Intel Core i7-11800H (4655 - 9851, n=40) | |
| Schenker XMG Fusion 15 (Mid 22) | |
| Schenker XMG Fusion 15 (Mid 22) (Stromsparmodus) | |
| Razer Blade 15 Base Edition 2021, i7-10750H RTX 3060 | |
| Single-Core | |
| Moyenne de la classe Gaming (986 - 2474, n=111, 2 dernières années) | |
| HP Omen 16-b1090ng | |
| Asus TUF Dash F15 FX517ZR | |
| Acer Nitro 5 AN515-58-72QR | |
| Schenker XMG Fusion 15 (Mid 22) (Benchmark-Modus) | |
| Schenker XMG Fusion 15 (Mid 22) (Leistung) | |
| Schenker XMG Fusion 15 (Mid 22) | |
| MSI Delta 15 A5EFK | |
| Moyenne Intel Core i7-11800H (1429 - 1625, n=40) | |
| Schenker XMG Fusion 15 (Mid 22) (Stromsparmodus) | |
| Razer Blade 15 Base Edition 2021, i7-10750H RTX 3060 | |
| HWBOT x265 Benchmark v2.2 - 4k Preset | |
| Moyenne de la classe Gaming (11.5 - 44.3, n=111, 2 dernières années) | |
| HP Omen 16-b1090ng | |
| Acer Nitro 5 AN515-58-72QR | |
| Asus TUF Dash F15 FX517ZR | |
| Schenker XMG Fusion 15 (Mid 22) (Benchmark-Modus) | |
| Schenker XMG Fusion 15 (Mid 22) (Leistung) | |
| MSI Delta 15 A5EFK | |
| Moyenne Intel Core i7-11800H (7.38 - 17.4, n=46) | |
| Schenker XMG Fusion 15 (Mid 22) | |
| Schenker XMG Fusion 15 (Mid 22) (Stromsparmodus) | |
| Razer Blade 15 Base Edition 2021, i7-10750H RTX 3060 | |
| LibreOffice - 20 Documents To PDF | |
| MSI Delta 15 A5EFK | |
| Moyenne de la classe Gaming (19 - 88.8, n=111, 2 dernières années) | |
| Razer Blade 15 Base Edition 2021, i7-10750H RTX 3060 | |
| Schenker XMG Fusion 15 (Mid 22) | |
| Moyenne Intel Core i7-11800H (38.6 - 59.9, n=45) | |
| Schenker XMG Fusion 15 (Mid 22) (Stromsparmodus) | |
| Schenker XMG Fusion 15 (Mid 22) (Benchmark-Modus) | |
| Schenker XMG Fusion 15 (Mid 22) (Leistung) | |
| Acer Nitro 5 AN515-58-72QR | |
| HP Omen 16-b1090ng | |
| Asus TUF Dash F15 FX517ZR | |
| R Benchmark 2.5 - Overall mean | |
| Razer Blade 15 Base Edition 2021, i7-10750H RTX 3060 | |
| Schenker XMG Fusion 15 (Mid 22) (Stromsparmodus) | |
| Moyenne Intel Core i7-11800H (0.548 - 0.615, n=46) | |
| Schenker XMG Fusion 15 (Mid 22) | |
| Schenker XMG Fusion 15 (Mid 22) (Leistung) | |
| Schenker XMG Fusion 15 (Mid 22) (Benchmark-Modus) | |
| MSI Delta 15 A5EFK | |
| Asus TUF Dash F15 FX517ZR | |
| Acer Nitro 5 AN515-58-72QR | |
| HP Omen 16-b1090ng | |
| Moyenne de la classe Gaming (0.3439 - 0.759, n=112, 2 dernières années) | |
* ... Moindre est la valeur, meilleures sont les performances
AIDA64: FP32 Ray-Trace | FPU Julia | CPU SHA3 | CPU Queen | FPU SinJulia | FPU Mandel | CPU AES | CPU ZLib | FP64 Ray-Trace | CPU PhotoWorxx
| Performance rating | |
| Moyenne de la classe Gaming | |
| MSI Delta 15 A5EFK | |
| Schenker XMG Fusion 15 (Mid 22) | |
| Schenker XMG Fusion 15 (Mid 22) | |
| Schenker XMG Fusion 15 (Mid 22) | |
| Asus TUF Dash F15 FX517ZR | |
| Moyenne Intel Core i7-11800H | |
| HP Omen 16-b1090ng | |
| Schenker XMG Fusion 15 (Mid 22) | |
| Acer Nitro 5 AN515-58-72QR | |
| AIDA64 / FP32 Ray-Trace | |
| Moyenne de la classe Gaming (10227 - 85542, n=110, 2 dernières années) | |
| Schenker XMG Fusion 15 (Mid 22) (v6.70.6000, Benchmark-Modus) | |
| Schenker XMG Fusion 15 (Mid 22) (v6.70.6000, Leistung) | |
| MSI Delta 15 A5EFK (v6.33.5700) | |
| Asus TUF Dash F15 FX517ZR (v6.70.6000) | |
| Moyenne Intel Core i7-11800H (8772 - 15961, n=20) | |
| Schenker XMG Fusion 15 (Mid 22) (v6.70.6000) | |
| Schenker XMG Fusion 15 (Mid 22) (v6.70.6000, Stromsparmodus) | |
| Acer Nitro 5 AN515-58-72QR (v6.50.5800) | |
| HP Omen 16-b1090ng (v6.50.5800) | |
| AIDA64 / FPU Julia | |
| Moyenne de la classe Gaming (51376 - 238426, n=110, 2 dernières années) | |
| MSI Delta 15 A5EFK (v6.33.5700) | |
| Asus TUF Dash F15 FX517ZR (v6.70.6000) | |
| Schenker XMG Fusion 15 (Mid 22) (v6.70.6000, Benchmark-Modus) | |
| Schenker XMG Fusion 15 (Mid 22) (v6.70.6000) | |
| Schenker XMG Fusion 15 (Mid 22) (v6.70.6000, Leistung) | |
| Moyenne Intel Core i7-11800H (39404 - 65636, n=20) | |
| Schenker XMG Fusion 15 (Mid 22) (v6.70.6000, Stromsparmodus) | |
| Acer Nitro 5 AN515-58-72QR (v6.50.5800) | |
| HP Omen 16-b1090ng (v6.50.5800) | |
| AIDA64 / CPU SHA3 | |
| Moyenne de la classe Gaming (2180 - 9817, n=110, 2 dernières années) | |
| Schenker XMG Fusion 15 (Mid 22) (v6.70.6000, Benchmark-Modus) | |
| Schenker XMG Fusion 15 (Mid 22) (v6.70.6000, Leistung) | |
| Schenker XMG Fusion 15 (Mid 22) (v6.70.6000) | |
| Moyenne Intel Core i7-11800H (2599 - 4439, n=20) | |
| MSI Delta 15 A5EFK (v6.33.5700) | |
| Acer Nitro 5 AN515-58-72QR (v6.50.5800) | |
| Asus TUF Dash F15 FX517ZR (v6.70.6000) | |
| Schenker XMG Fusion 15 (Mid 22) (v6.70.6000, Stromsparmodus) | |
| HP Omen 16-b1090ng (v6.50.5800) | |
| AIDA64 / CPU Queen | |
| Moyenne de la classe Gaming (49785 - 173351, n=101, 2 dernières années) | |
| MSI Delta 15 A5EFK (v6.33.5700) | |
| HP Omen 16-b1090ng (v6.50.5800) | |
| Acer Nitro 5 AN515-58-72QR (v6.50.5800) | |
| Schenker XMG Fusion 15 (Mid 22) (v6.70.6000, Leistung) | |
| Schenker XMG Fusion 15 (Mid 22) (v6.70.6000, Benchmark-Modus) | |
| Moyenne Intel Core i7-11800H (85233 - 91941, n=20) | |
| Asus TUF Dash F15 FX517ZR (v6.70.6000) | |
| Schenker XMG Fusion 15 (Mid 22) (v6.70.6000, Stromsparmodus) | |
| Schenker XMG Fusion 15 (Mid 22) | |
| AIDA64 / FPU SinJulia | |
| Moyenne de la classe Gaming (4424 - 33636, n=110, 2 dernières années) | |
| MSI Delta 15 A5EFK (v6.33.5700) | |
| Acer Nitro 5 AN515-58-72QR (v6.50.5800) | |
| Schenker XMG Fusion 15 (Mid 22) (v6.70.6000, Benchmark-Modus) | |
| Schenker XMG Fusion 15 (Mid 22) (v6.70.6000, Leistung) | |
| HP Omen 16-b1090ng (v6.50.5800) | |
| Moyenne Intel Core i7-11800H (6420 - 9792, n=20) | |
| Schenker XMG Fusion 15 (Mid 22) (v6.70.6000) | |
| Asus TUF Dash F15 FX517ZR (v6.70.6000) | |
| Schenker XMG Fusion 15 (Mid 22) (v6.70.6000, Stromsparmodus) | |
| AIDA64 / FPU Mandel | |
| Moyenne de la classe Gaming (25115 - 128721, n=110, 2 dernières années) | |
| MSI Delta 15 A5EFK (v6.33.5700) | |
| Schenker XMG Fusion 15 (Mid 22) (v6.70.6000, Benchmark-Modus) | |
| Schenker XMG Fusion 15 (Mid 22) (v6.70.6000, Leistung) | |
| Schenker XMG Fusion 15 (Mid 22) (v6.70.6000) | |
| Moyenne Intel Core i7-11800H (23365 - 39464, n=20) | |
| Asus TUF Dash F15 FX517ZR (v6.70.6000) | |
| Schenker XMG Fusion 15 (Mid 22) (v6.70.6000, Stromsparmodus) | |
| Acer Nitro 5 AN515-58-72QR | |
| HP Omen 16-b1090ng (v6.50.5800) | |
| AIDA64 / CPU AES | |
| Schenker XMG Fusion 15 (Mid 22) (v6.70.6000, Benchmark-Modus) | |
| Schenker XMG Fusion 15 (Mid 22) (v6.70.6000) | |
| Schenker XMG Fusion 15 (Mid 22) (v6.70.6000, Leistung) | |
| MSI Delta 15 A5EFK (v6.33.5700) | |
| Moyenne Intel Core i7-11800H (74617 - 149388, n=20) | |
| Moyenne de la classe Gaming (39258 - 247074, n=110, 2 dernières années) | |
| Schenker XMG Fusion 15 (Mid 22) (v6.70.6000, Stromsparmodus) | |
| HP Omen 16-b1090ng (v6.50.5800) | |
| Asus TUF Dash F15 FX517ZR (v6.70.6000) | |
| Acer Nitro 5 AN515-58-72QR (v6.50.5800) | |
| AIDA64 / CPU ZLib | |
| Moyenne de la classe Gaming (574 - 2531, n=110, 2 dernières années) | |
| Acer Nitro 5 AN515-58-72QR (v6.50.5800) | |
| HP Omen 16-b1090ng (v6.50.5800) | |
| Asus TUF Dash F15 FX517ZR (v6.70.6000) | |
| MSI Delta 15 A5EFK (v6.33.5700) | |
| Schenker XMG Fusion 15 (Mid 22) (v6.70.6000, Benchmark-Modus) | |
| Schenker XMG Fusion 15 (Mid 22) (v6.70.6000, Leistung) | |
| Schenker XMG Fusion 15 (Mid 22) (v6.70.6000) | |
| Schenker XMG Fusion 15 (Mid 22) (v6.70.6000, Stromsparmodus) | |
| Moyenne Intel Core i7-11800H (461 - 830, n=43) | |
| AIDA64 / FP64 Ray-Trace | |
| Moyenne de la classe Gaming (5509 - 45446, n=110, 2 dernières années) | |
| Schenker XMG Fusion 15 (Mid 22) (v6.70.6000, Benchmark-Modus) | |
| Schenker XMG Fusion 15 (Mid 22) (v6.70.6000, Leistung) | |
| MSI Delta 15 A5EFK (v6.33.5700) | |
| Asus TUF Dash F15 FX517ZR (v6.70.6000) | |
| Moyenne Intel Core i7-11800H (4545 - 8717, n=21) | |
| Schenker XMG Fusion 15 (Mid 22) (v6.70.6000) | |
| Schenker XMG Fusion 15 (Mid 22) (v6.70.6000, Stromsparmodus) | |
| Acer Nitro 5 AN515-58-72QR (v6.50.5800) | |
| HP Omen 16-b1090ng (v6.50.5800) | |
| AIDA64 / CPU PhotoWorxx | |
| Moyenne de la classe Gaming (12271 - 89891, n=110, 2 dernières années) | |
| HP Omen 16-b1090ng (v6.50.5800) | |
| Asus TUF Dash F15 FX517ZR (v6.70.6000) | |
| Schenker XMG Fusion 15 (Mid 22) (v6.70.6000, Benchmark-Modus) | |
| Schenker XMG Fusion 15 (Mid 22) (v6.70.6000, Leistung) | |
| Schenker XMG Fusion 15 (Mid 22) (v6.70.6000) | |
| Schenker XMG Fusion 15 (Mid 22) (v6.70.6000, Stromsparmodus) | |
| Moyenne Intel Core i7-11800H (11898 - 26757, n=21) | |
| Acer Nitro 5 AN515-58-72QR (v6.50.5800) | |
| MSI Delta 15 A5EFK (v6.33.5700) | |
Performance du système
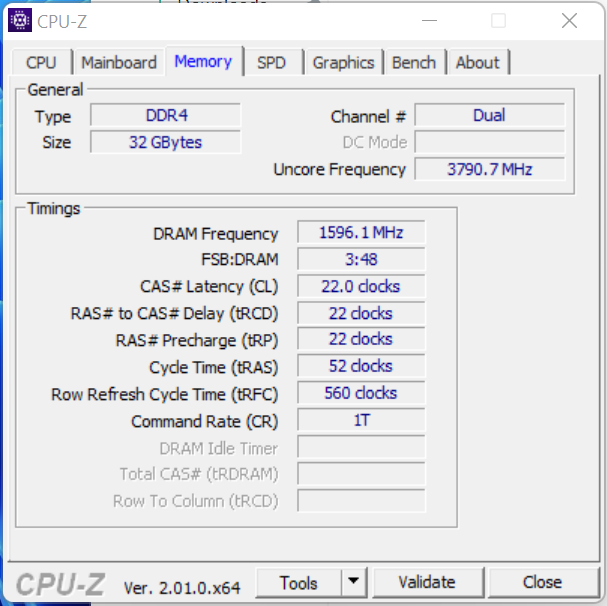
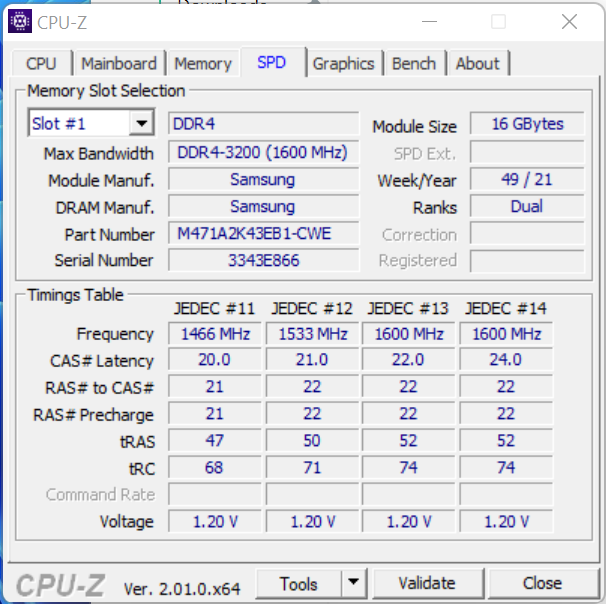
Le système bien équilibré et fluide offre une puissance de traitement suffisante pour les applications exigeantes comme le rendu et les jeux. Les résultats de PCMark sont bons. Les taux de transfert de la RAM sont à un niveau normal pour une mémoire DDR4-3200
CrossMark: Overall | Productivity | Creativity | Responsiveness
| PCMark 10 / Score | |
| Moyenne de la classe Gaming (5828 - 11574, n=96, 2 dernières années) | |
| HP Omen 16-b1090ng | |
| MSI Delta 15 A5EFK | |
| Acer Nitro 5 AN515-58-72QR | |
| Moyenne Intel Core i7-11800H, NVIDIA GeForce RTX 3070 Laptop GPU (6126 - 7311, n=11) | |
| Asus TUF Dash F15 FX517ZR | |
| Schenker XMG Fusion 15 (Mid 22) (Benchmark-Modus) | |
| Razer Blade 15 Base Edition 2021, i7-10750H RTX 3060 | |
| Schenker XMG Fusion 15 (Mid 22) | |
| PCMark 10 / Essentials | |
| Moyenne de la classe Gaming (8810 - 12600, n=100, 2 dernières années) | |
| MSI Delta 15 A5EFK | |
| HP Omen 16-b1090ng | |
| Razer Blade 15 Base Edition 2021, i7-10750H RTX 3060 | |
| Moyenne Intel Core i7-11800H, NVIDIA GeForce RTX 3070 Laptop GPU (9248 - 10832, n=11) | |
| Asus TUF Dash F15 FX517ZR | |
| Acer Nitro 5 AN515-58-72QR | |
| Schenker XMG Fusion 15 (Mid 22) (Benchmark-Modus) | |
| Schenker XMG Fusion 15 (Mid 22) | |
| PCMark 10 / Productivity | |
| Moyenne de la classe Gaming (6845 - 18766, n=98, 2 dernières années) | |
| HP Omen 16-b1090ng | |
| Asus TUF Dash F15 FX517ZR | |
| MSI Delta 15 A5EFK | |
| Schenker XMG Fusion 15 (Mid 22) (Benchmark-Modus) | |
| Moyenne Intel Core i7-11800H, NVIDIA GeForce RTX 3070 Laptop GPU (8571 - 9669, n=11) | |
| Acer Nitro 5 AN515-58-72QR | |
| Schenker XMG Fusion 15 (Mid 22) | |
| Razer Blade 15 Base Edition 2021, i7-10750H RTX 3060 | |
| PCMark 10 / Digital Content Creation | |
| Moyenne de la classe Gaming (7602 - 19657, n=98, 2 dernières années) | |
| HP Omen 16-b1090ng | |
| MSI Delta 15 A5EFK | |
| Acer Nitro 5 AN515-58-72QR | |
| Moyenne Intel Core i7-11800H, NVIDIA GeForce RTX 3070 Laptop GPU (7627 - 10851, n=11) | |
| Asus TUF Dash F15 FX517ZR | |
| Razer Blade 15 Base Edition 2021, i7-10750H RTX 3060 | |
| Schenker XMG Fusion 15 (Mid 22) (Benchmark-Modus) | |
| Schenker XMG Fusion 15 (Mid 22) | |
| CrossMark / Overall | |
| Moyenne de la classe Gaming (1366 - 2409, n=98, 2 dernières années) | |
| Asus TUF Dash F15 FX517ZR | |
| Acer Nitro 5 AN515-58-72QR | |
| Schenker XMG Fusion 15 (Mid 22) | |
| Moyenne Intel Core i7-11800H, NVIDIA GeForce RTX 3070 Laptop GPU (1569 - 1656, n=3) | |
| CrossMark / Productivity | |
| Moyenne de la classe Gaming (1386 - 2254, n=98, 2 dernières années) | |
| Acer Nitro 5 AN515-58-72QR | |
| Asus TUF Dash F15 FX517ZR | |
| Schenker XMG Fusion 15 (Mid 22) | |
| Moyenne Intel Core i7-11800H, NVIDIA GeForce RTX 3070 Laptop GPU (1573 - 1640, n=3) | |
| CrossMark / Creativity | |
| Moyenne de la classe Gaming (1343 - 2729, n=98, 2 dernières années) | |
| Asus TUF Dash F15 FX517ZR | |
| Acer Nitro 5 AN515-58-72QR | |
| Schenker XMG Fusion 15 (Mid 22) | |
| Moyenne Intel Core i7-11800H, NVIDIA GeForce RTX 3070 Laptop GPU (1613 - 1692, n=3) | |
| CrossMark / Responsiveness | |
| Moyenne de la classe Gaming (1226 - 2334, n=98, 2 dernières années) | |
| Acer Nitro 5 AN515-58-72QR | |
| Schenker XMG Fusion 15 (Mid 22) | |
| Asus TUF Dash F15 FX517ZR | |
| Moyenne Intel Core i7-11800H, NVIDIA GeForce RTX 3070 Laptop GPU (1435 - 1600, n=3) | |
| PCMark 8 Home Score Accelerated v2 | 4521 points | |
| PCMark 8 Creative Score Accelerated v2 | 6766 points | |
| PCMark 8 Work Score Accelerated v2 | 5851 points | |
| PCMark 10 Score | 6126 points | |
Aide | ||
| AIDA64 / Memory Copy | |
| Moyenne de la classe Gaming (21750 - 129946, n=110, 2 dernières années) | |
| HP Omen 16-b1090ng | |
| Asus TUF Dash F15 FX517ZR | |
| Schenker XMG Fusion 15 (Mid 22) | |
| Acer Nitro 5 AN515-58-72QR | |
| Moyenne Intel Core i7-11800H (24508 - 48144, n=21) | |
| MSI Delta 15 A5EFK | |
| AIDA64 / Memory Read | |
| Moyenne de la classe Gaming (22956 - 118858, n=110, 2 dernières années) | |
| HP Omen 16-b1090ng | |
| Asus TUF Dash F15 FX517ZR | |
| Schenker XMG Fusion 15 (Mid 22) | |
| MSI Delta 15 A5EFK | |
| Moyenne Intel Core i7-11800H (25882 - 50365, n=20) | |
| Acer Nitro 5 AN515-58-72QR | |
| AIDA64 / Memory Write | |
| Moyenne de la classe Gaming (22297 - 135096, n=110, 2 dernières années) | |
| HP Omen 16-b1090ng | |
| Asus TUF Dash F15 FX517ZR | |
| Schenker XMG Fusion 15 (Mid 22) | |
| Acer Nitro 5 AN515-58-72QR | |
| MSI Delta 15 A5EFK | |
| Moyenne Intel Core i7-11800H (22240 - 46214, n=20) | |
| AIDA64 / Memory Latency | |
| Moyenne de la classe Gaming (75.3 - 259, n=110, 2 dernières années) | |
| Asus TUF Dash F15 FX517ZR | |
| Schenker XMG Fusion 15 (Mid 22) | |
| HP Omen 16-b1090ng | |
| MSI Delta 15 A5EFK | |
| Moyenne Intel Core i7-11800H (71.9 - 104.1, n=44) | |
| Acer Nitro 5 AN515-58-72QR | |
| Acer Nitro 5 AN515-58-72QR | |
* ... Moindre est la valeur, meilleures sont les performances
Latences DPC
Le test standardisé du moniteur de latence (navigation web, lecture vidéo 4K, Prime95 à forte charge) a révélé des irrégularités au niveau des latences DPC. Le système ne semble pas adapté à l'édition vidéo et audio en temps réel. Les futures mises à jour logicielles pourraient conduire à des améliorations ou à une dégradation des performances également
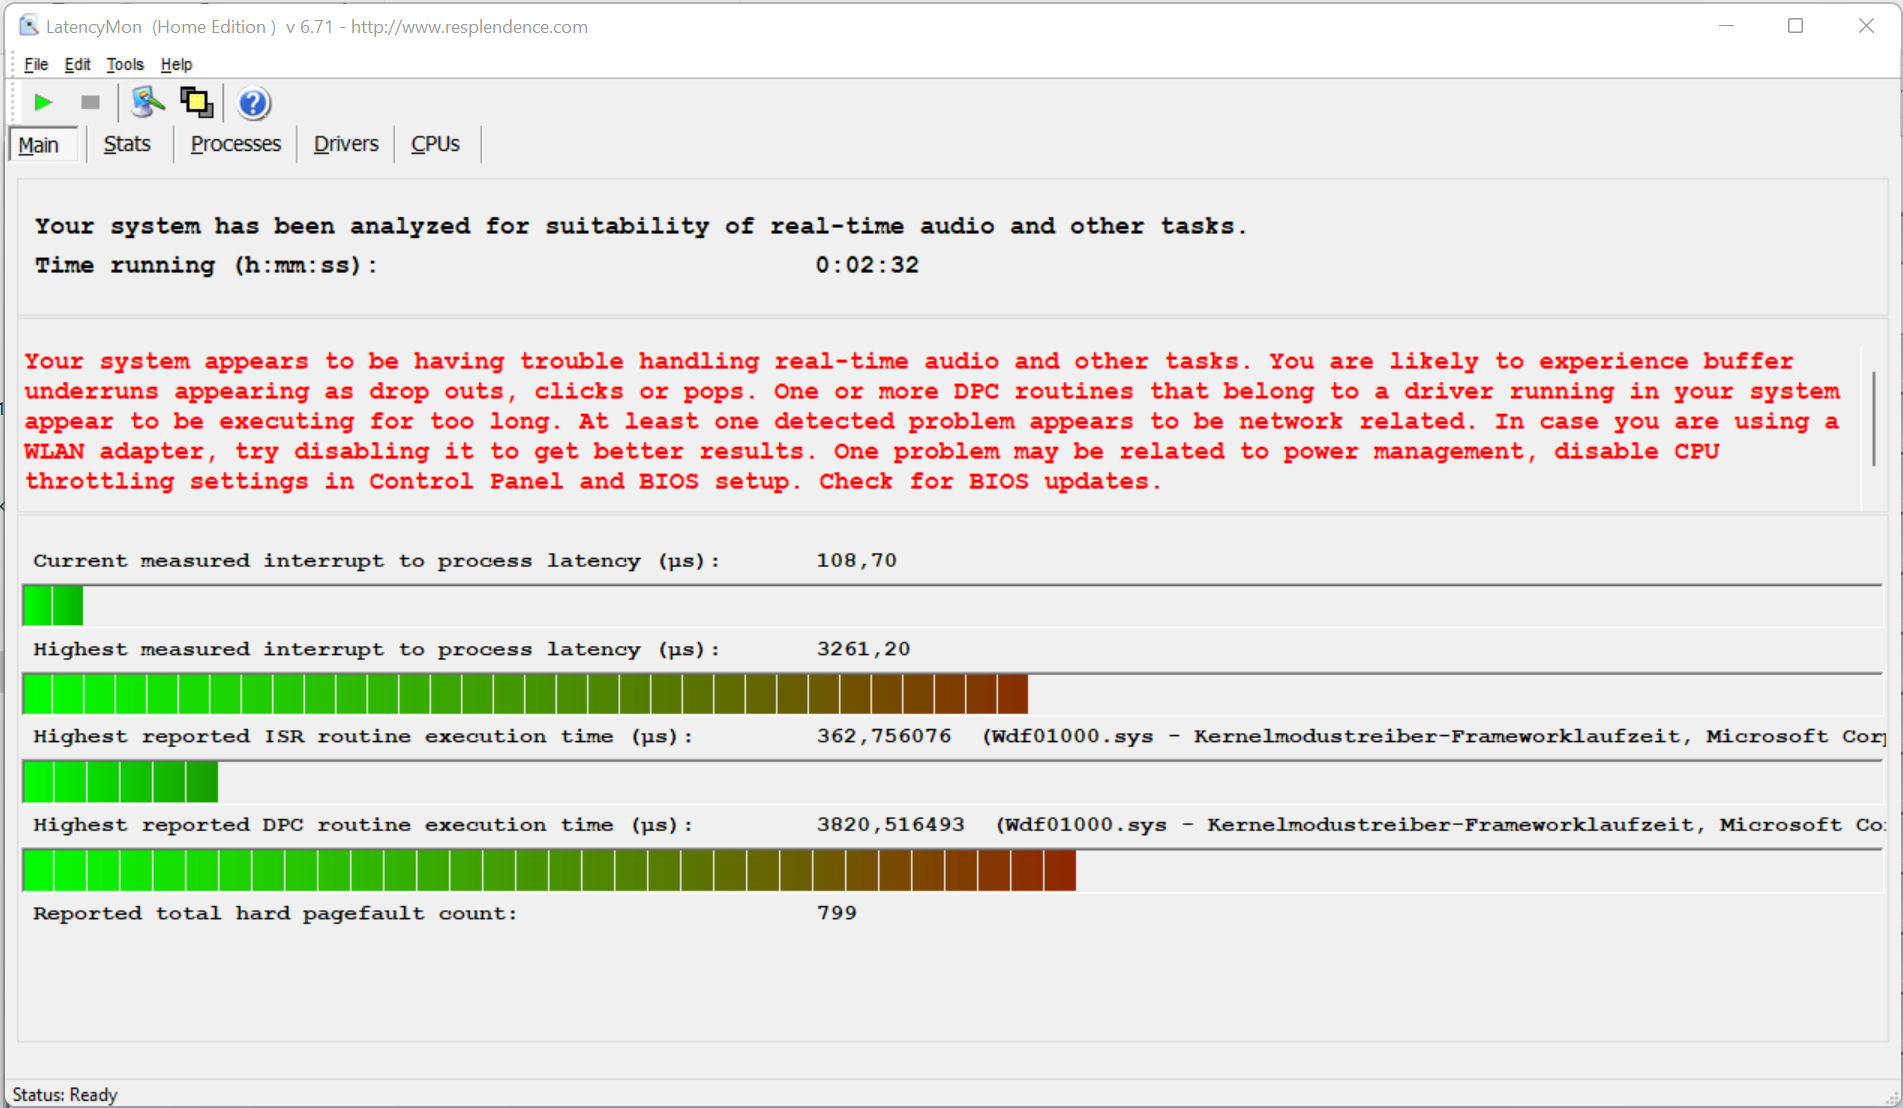
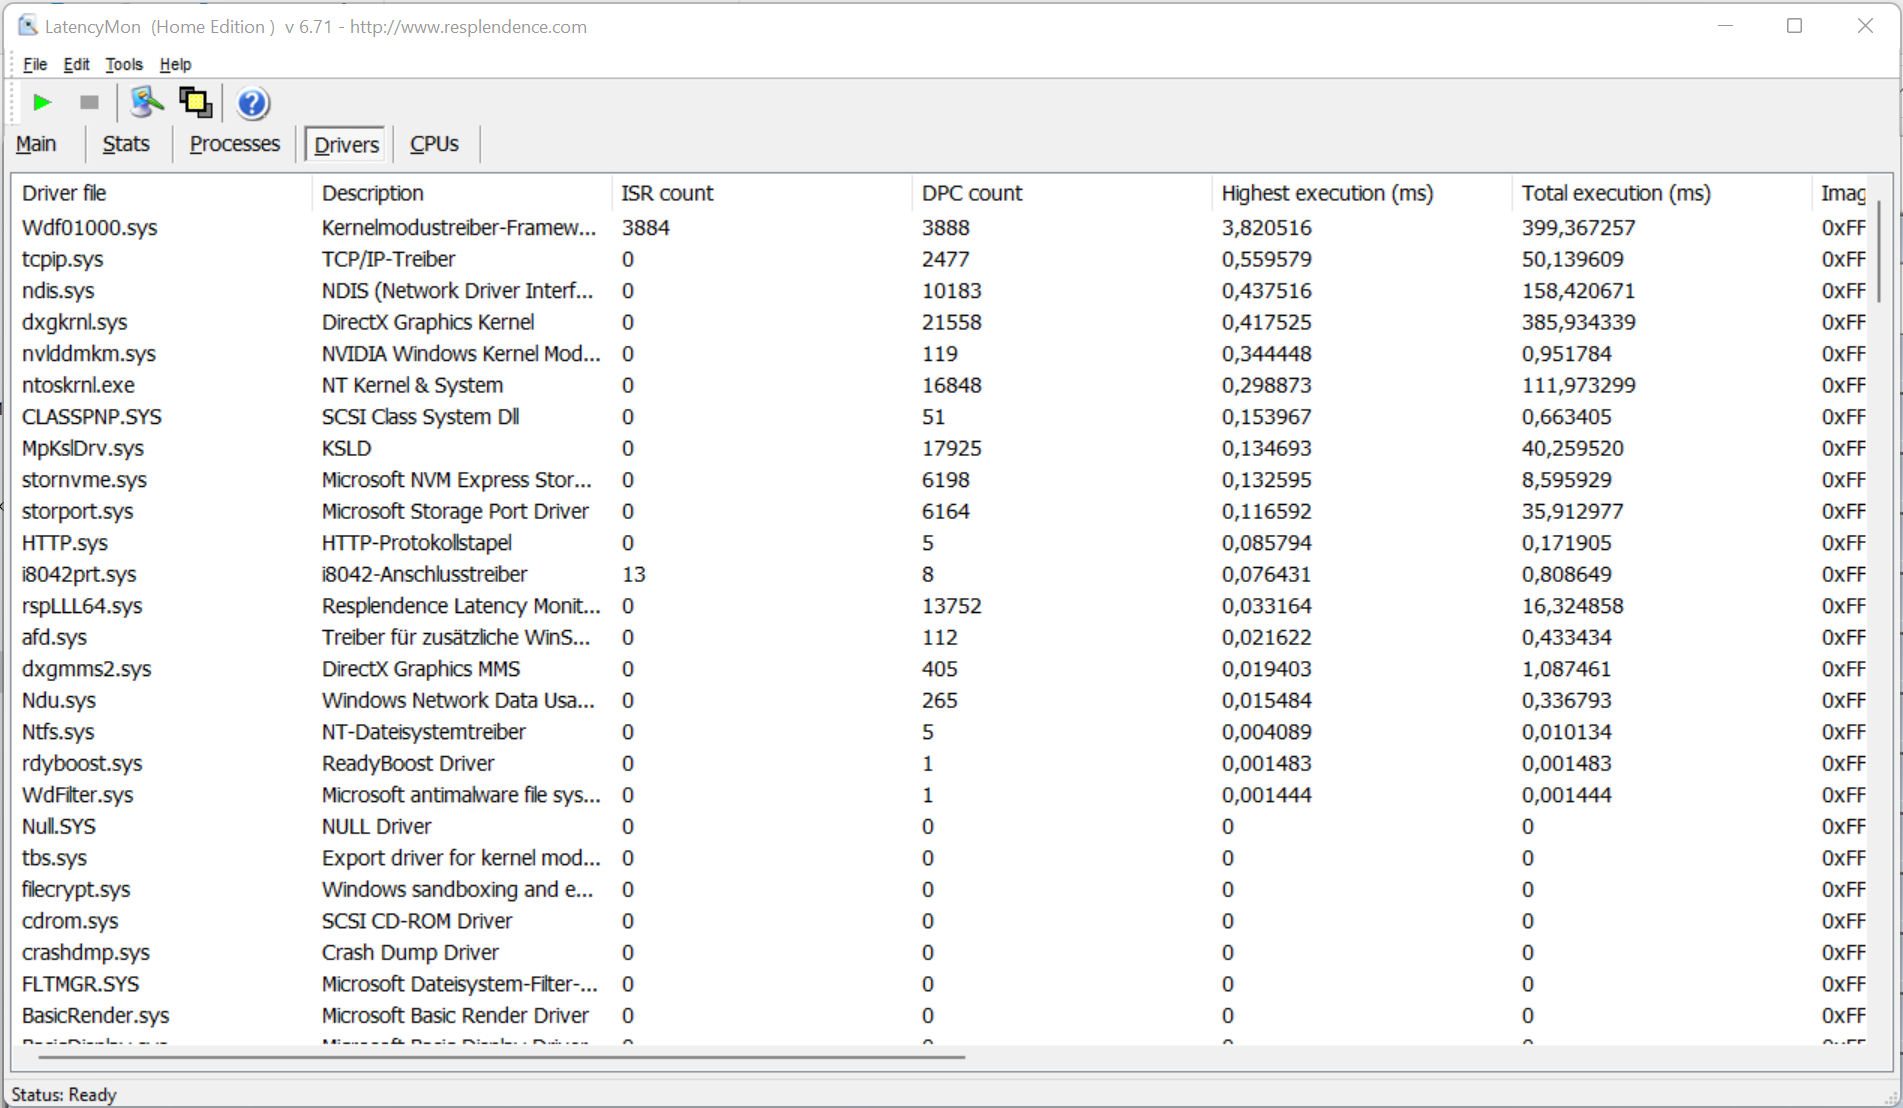
| DPC Latencies / LatencyMon - interrupt to process latency (max), Web, Youtube, Prime95 | |
| Schenker XMG Fusion 15 (Mid 22) | |
| MSI Delta 15 A5EFK | |
| Acer Nitro 5 AN515-58-72QR | |
| HP Omen 16-b1090ng | |
| Razer Blade 15 Base Edition 2021, i7-10750H RTX 3060 | |
| Asus TUF Dash F15 FX517ZR | |
* ... Moindre est la valeur, meilleures sont les performances
Stockage
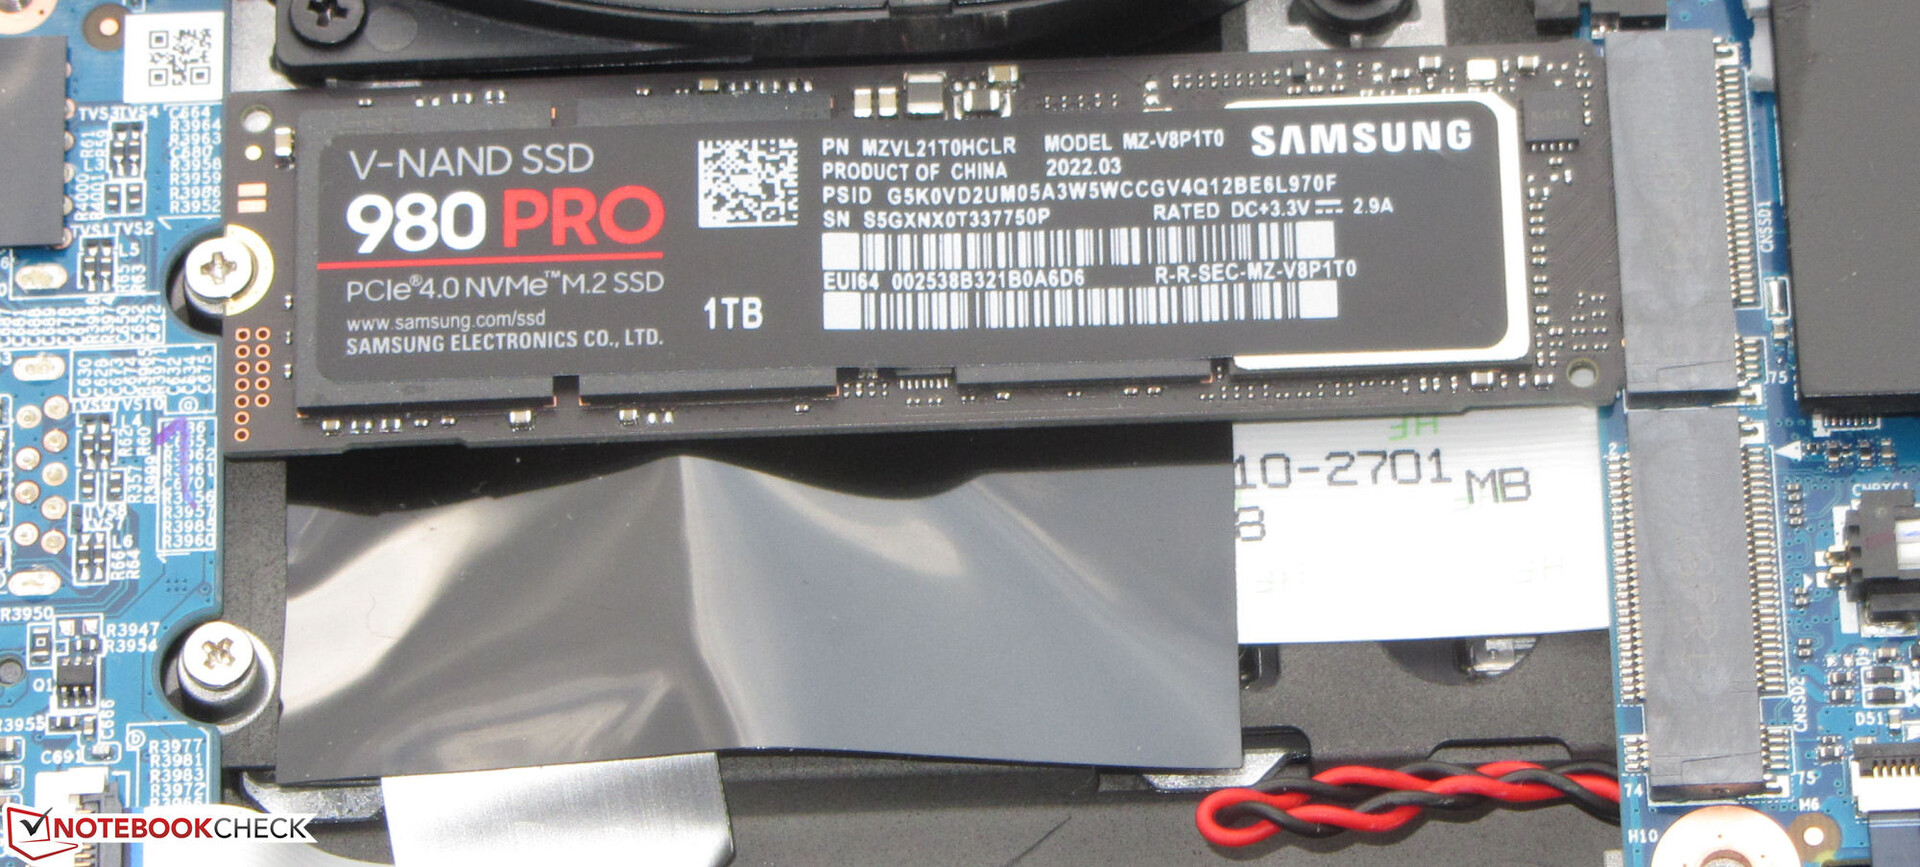
Schenker équipe l'ordinateur portable d'un SSD PCIe 4 (1 To, M.2 2280) de Samsung qui offre d'excellents taux de transfert. L'ordinateur portable peut accueillir au total deux SSD M.2-2280 (1x PCIe 4.0, 1x PCIe 3.0/SATA). Le RAID 0/1 est pris en charge

* ... Moindre est la valeur, meilleures sont les performances
Continuous load read: DiskSpd Read Loop, Queue Depth 8
Carte graphique
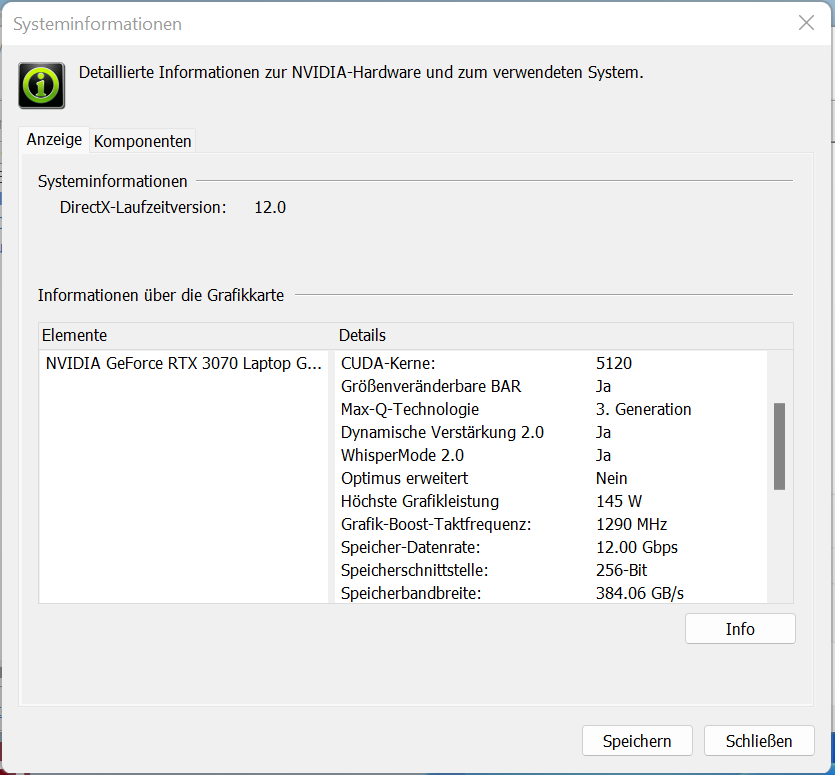
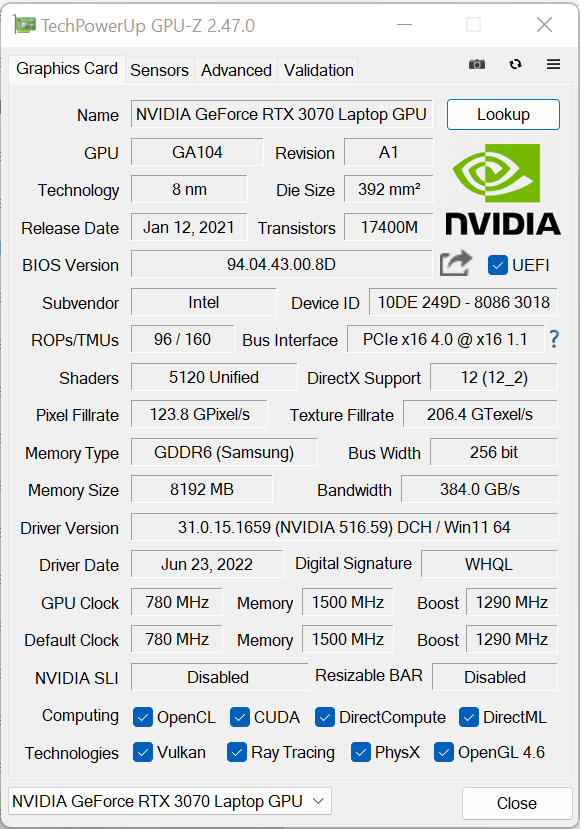
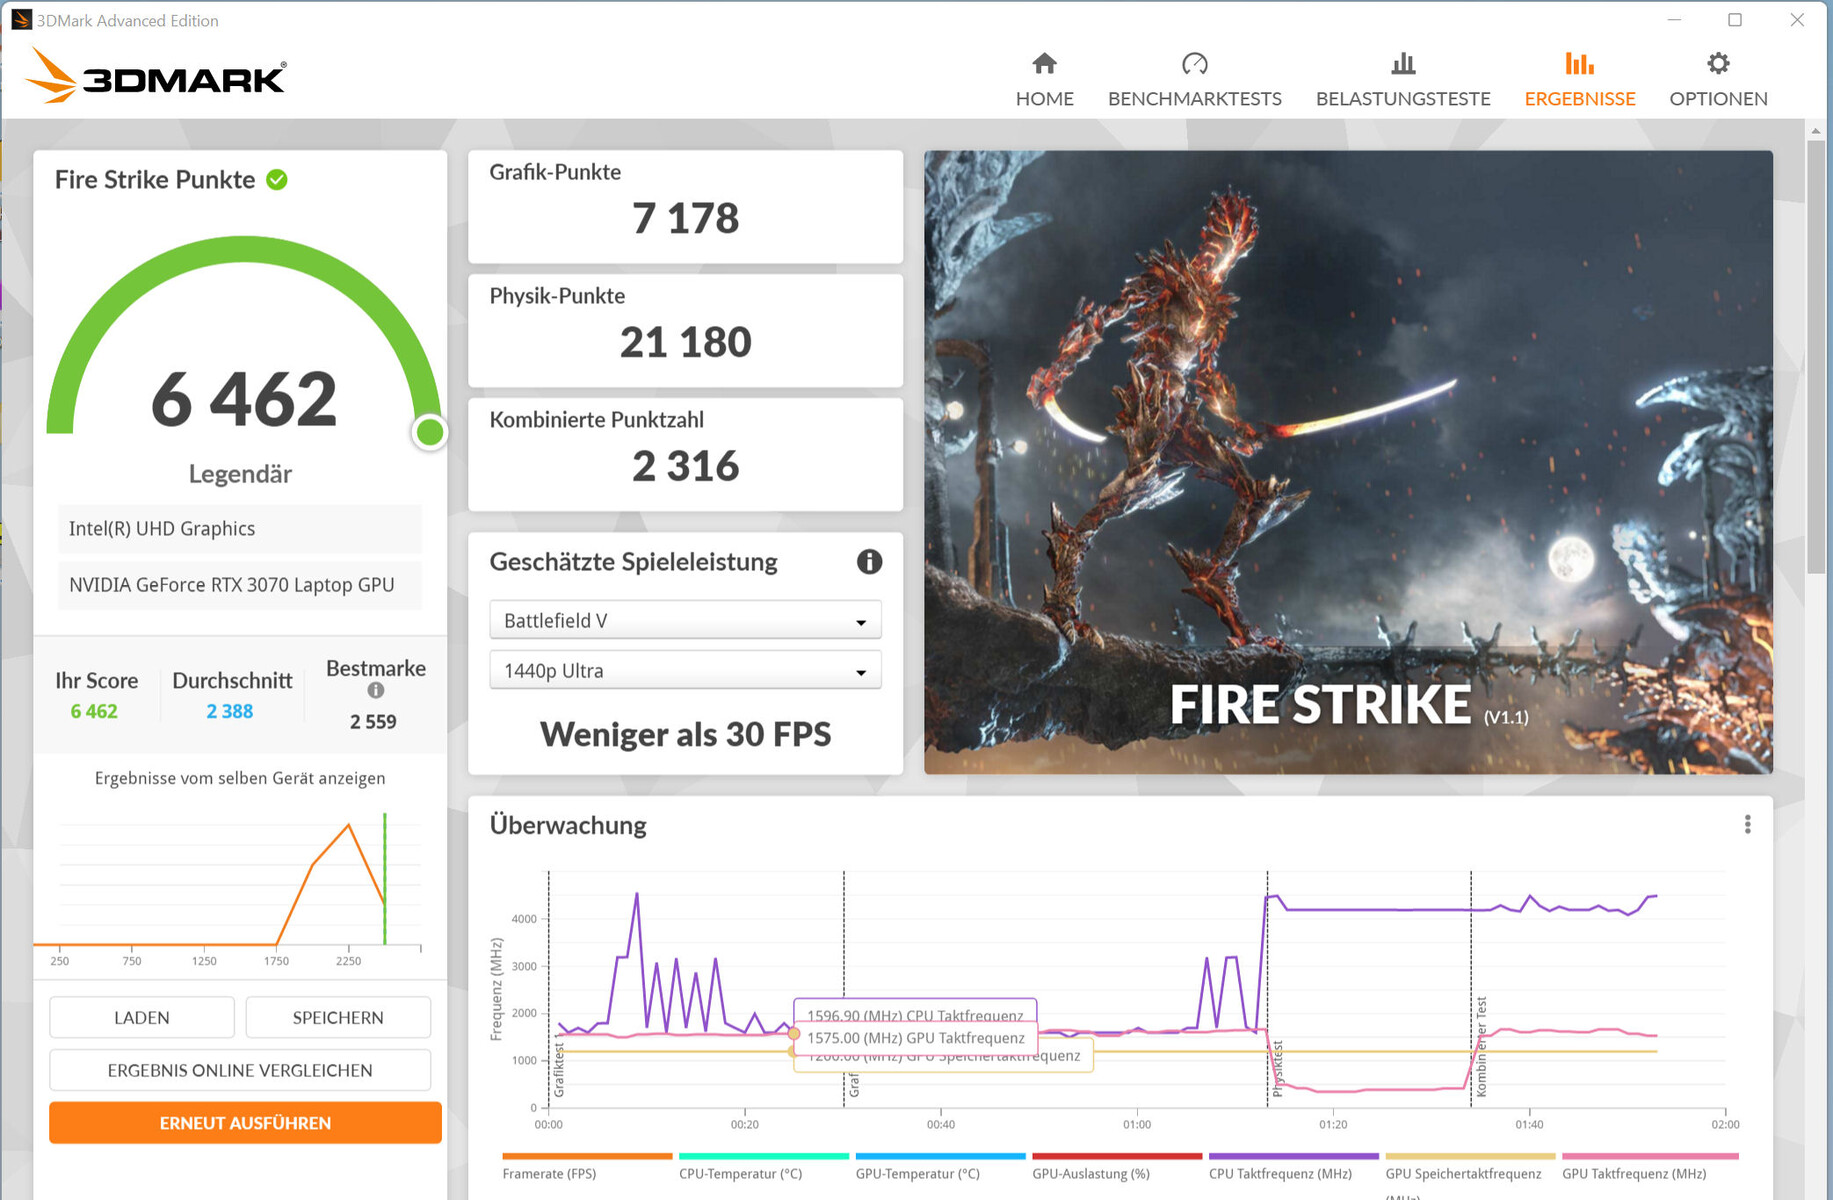
Les performances réelles d'un GPU RTX 3000 dépendent de quelques facteurs : Le refroidissement, la configuration de la mémoire et le TGP maximal qu'un fabricant d'ordinateurs portables sélectionne dans les limites définies par Nvidia. Schenker fournit leGeForce Ordinateur portable RTX 3070 Intégré avec un TGP maximum de 145 watts (125 watts + 20 watts Dynamic Boost). Toutefois, le Dynamic Boost n'est utilisé que lorsque le profil "Benchmark Mode" est actif. Le GPU peut accéder à la mémoire graphique rapide GDDR6 (8 192 Mo).
Le profil "Balanced" permet d'obtenir des résultats de benchmark comparables à la moyenne déterminée précédemment pour la RTX 3070. Le profil "Benchmark Mode" permet d'augmenter les taux. Même dans ce cas, le TGP maximal (145 W) n'est pas pleinement utilisé - c'est ce que montre notre test The Witcher 3. Cependant, une partie du Dynamic Boost est utilisée.
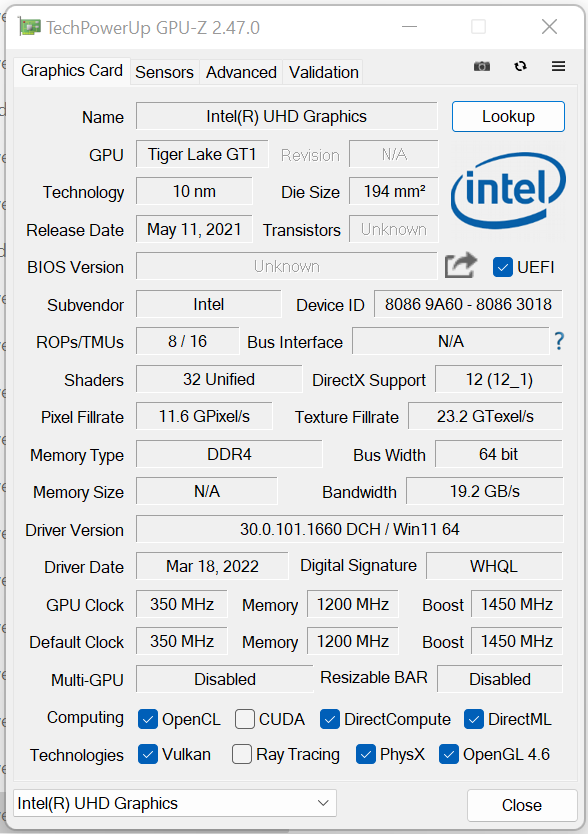
Le testUHD Graphics Xe 32EUs intégré au processeur est actif, et l'ordinateur portable fonctionne avec la solution de commutation graphique Optimus de Nvidia. Le Fusion n'offre pas l'option de sortie directe des images via le GPU RTX 3070.


| 3DMark Performance rating - Percent | |
| Moyenne de la classe Gaming | |
| Acer Nitro 5 AN515-58-72QR | |
| Schenker XMG Fusion 15 (Mid 22) | |
| MSI Delta 15 A5EFK -1! | |
| Schenker XMG Fusion 15 (Mid 22) | |
| HP Omen 16-b1090ng | |
| Moyenne NVIDIA GeForce RTX 3070 Laptop GPU | |
| Schenker XMG Fusion 15 (Mid 22) | |
| Asus TUF Dash F15 FX517ZR | |
| Razer Blade 15 Base Edition 2021, i7-10750H RTX 3060 | |
| Schenker XMG Fusion 15 (Mid 22) | |
| 3DMark 11 - 1280x720 Performance GPU | |
| Moyenne de la classe Gaming (21841 - 80022, n=109, 2 dernières années) | |
| Schenker XMG Fusion 15 (Mid 22) (Benchmark-Modus) | |
| Acer Nitro 5 AN515-58-72QR | |
| Schenker XMG Fusion 15 (Mid 22) (Leistung) | |
| HP Omen 16-b1090ng | |
| MSI Delta 15 A5EFK | |
| Moyenne NVIDIA GeForce RTX 3070 Laptop GPU (12535 - 38275, n=54) | |
| Schenker XMG Fusion 15 (Mid 22) | |
| Asus TUF Dash F15 FX517ZR | |
| Razer Blade 15 Base Edition 2021, i7-10750H RTX 3060 | |
| Schenker XMG Fusion 15 (Mid 22) (Stromsparmodus) | |
| Geekbench 5.5 - OpenCL Score | |
| Moyenne de la classe Gaming (80702 - 277970, n=108, 2 dernières années) | |
| Acer Nitro 5 AN515-58-72QR | |
| Schenker XMG Apex 15 Max | |
| Schenker XMG Fusion 15 (Mid 22) (Benchmark-Modus) | |
| Schenker XMG Fusion 15 (Mid 22) (Leistung) | |
| Schenker XMG Fusion 15 (Mid 22) | |
| HP Omen 16-b1090ng | |
| Asus TUF Dash F15 FX517ZR | |
| Moyenne NVIDIA GeForce RTX 3070 Laptop GPU (5732 - 125874, n=52) | |
| Razer Blade 15 Base Edition 2021, i7-10750H RTX 3060 | |
| MSI Delta 15 A5EFK | |
| Schenker XMG Fusion 15 (Mid 22) (Stromsparmodus) | |
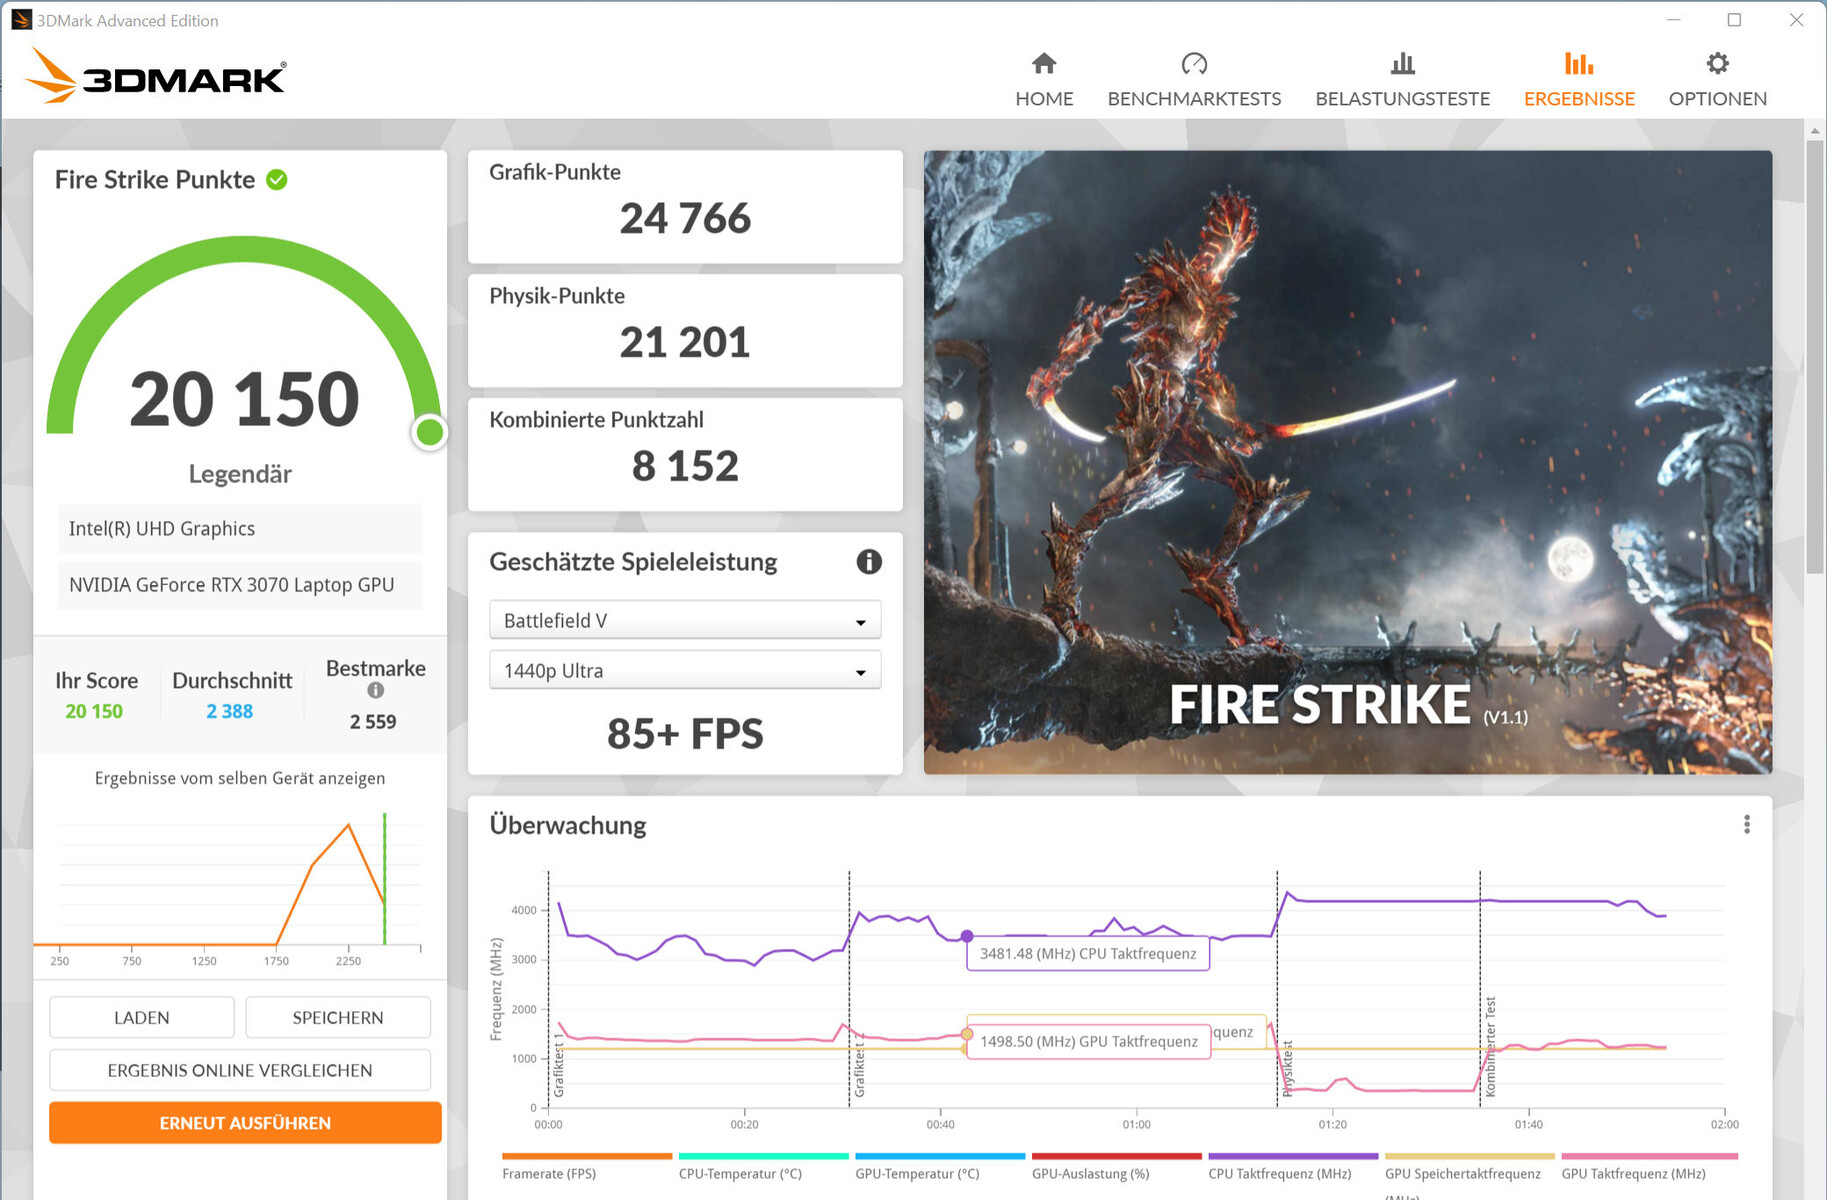
| 3DMark 11 Performance | 26211 points | |
| 3DMark Cloud Gate Standard Score | 48271 points | |
| 3DMark Fire Strike Score | 20150 points | |
| 3DMark Time Spy Score | 9025 points | |
Aide | ||
Performances de jeu
Le matériel permet de jouer en QHD avec des paramètres élevés à maximaux. Des résolutions plus élevées peuvent également être utilisées lorsqu'un écran correspondant est connecté - avec des paramètres réduits par moments. Les fréquences d'images sont dans la moyenne de la RTX 3070. Le profil "Benchmark Mode" entraîne une augmentation des taux de trame
| The Witcher 3 - 1920x1080 Ultra Graphics & Postprocessing (HBAO+) | |
| Moyenne de la classe Gaming (95 - 240, n=8, 2 dernières années) | |
| Schenker XMG Fusion 15 (Mid 22) (Benchmark-Modus) | |
| Acer Nitro 5 AN515-58-72QR | |
| HP Omen 16-b1090ng | |
| MSI Delta 15 A5EFK | |
| Schenker XMG Fusion 15 (Mid 22) | |
| Moyenne NVIDIA GeForce RTX 3070 Laptop GPU (34.9 - 109, n=52) | |
| Asus TUF Dash F15 FX517ZR | |
| Razer Blade 15 Base Edition 2021, i7-10750H RTX 3060 | |
| Dota 2 Reborn - 1920x1080 ultra (3/3) best looking | |
| Moyenne de la classe Gaming (84.8 - 248, n=113, 2 dernières années) | |
| HP Omen 16-b1090ng | |
| Acer Nitro 5 AN515-58-72QR | |
| Schenker XMG Fusion 15 (Mid 22) | |
| Schenker XMG Fusion 15 (Mid 22) (Benchmark-Modus) | |
| Razer Blade 15 Base Edition 2021, i7-10750H RTX 3060 | |
| Moyenne NVIDIA GeForce RTX 3070 Laptop GPU (26.9 - 163.9, n=58) | |
| Schenker XMG Fusion 15 (Mid 22) (Leistung) | |
| MSI Delta 15 A5EFK | |
| Asus TUF Dash F15 FX517ZR | |
| Schenker XMG Fusion 15 (Mid 22) (Stromsparmodus) | |
| X-Plane 11.11 - 1920x1080 high (fps_test=3) | |
| HP Omen 16-b1090ng | |
| Asus TUF Dash F15 FX517ZR | |
| Moyenne de la classe Gaming (52.1 - 143.5, n=116, 2 dernières années) | |
| Acer Nitro 5 AN515-58-72QR | |
| Schenker XMG Fusion 15 (Mid 22) | |
| Moyenne NVIDIA GeForce RTX 3070 Laptop GPU (12.4 - 118.8, n=61) | |
| Razer Blade 15 Base Edition 2021, i7-10750H RTX 3060 | |
| Schenker XMG Fusion 15 (Mid 22) (Benchmark-Modus) | |
| Schenker XMG Fusion 15 (Mid 22) (Leistung) | |
| Schenker XMG Fusion 15 (Mid 22) (Stromsparmodus) | |
| Final Fantasy XV Benchmark | |
| 1920x1080 High Quality | |
| Moyenne de la classe Gaming (41 - 215, n=104, 2 dernières années) | |
| Schenker XMG Fusion 15 (Mid 22) (1.3, Benchmark-Modus) | |
| HP Omen 16-b1090ng | |
| Schenker XMG Fusion 15 (Mid 22) (1.3, Leistung) | |
| Schenker XMG Fusion 15 (Mid 22) (1.3) | |
| Acer Nitro 5 AN515-58-72QR (1.3) | |
| Moyenne NVIDIA GeForce RTX 3070 Laptop GPU (27.9 - 107, n=49) | |
| Asus TUF Dash F15 FX517ZR (1.3) | |
| MSI Delta 15 A5EFK | |
| Razer Blade 15 Base Edition 2021, i7-10750H RTX 3060 (1.3) | |
| Schenker XMG Fusion 15 (Mid 22) (1.3, Stromsparmodus) | |
| 2560x1440 High Quality | |
| Moyenne de la classe Gaming (32.5 - 184.3, n=89, 2 dernières années) | |
| Schenker XMG Fusion 15 (Mid 22) (1.3, Benchmark-Modus) | |
| Schenker XMG Fusion 15 (Mid 22) (1.3, Leistung) | |
| Schenker XMG Fusion 15 (Mid 22) (1.3) | |
| Acer Nitro 5 AN515-58-72QR (1.3) | |
| Moyenne NVIDIA GeForce RTX 3070 Laptop GPU (19.8 - 79.9, n=25) | |
| Asus TUF Dash F15 FX517ZR (1.3) | |
| Schenker XMG Fusion 15 (Mid 22) (1.3, Stromsparmodus) | |
| GTA V | |
| 2560x1440 Highest AA:4xMSAA + FX AF:16x | |
| Moyenne de la classe Gaming (36.9 - 183.9, n=75, 2 dernières années) | |
| Schenker XMG Fusion 15 (Mid 22) (Benchmark-Modus) | |
| Schenker XMG Fusion 15 (Mid 22) (Leistung) | |
| Schenker XMG Fusion 15 (Mid 22) | |
| Moyenne NVIDIA GeForce RTX 3070 Laptop GPU (70.8 - 97.1, n=19) | |
| Acer Nitro 5 AN515-58-72QR | |
| Asus TUF Dash F15 FX517ZR | |
| 1920x1080 Highest AA:4xMSAA + FX AF:16x | |
| Moyenne de la classe Gaming (48.3 - 186.9, n=103, 2 dernières années) | |
| HP Omen 16-b1090ng | |
| Schenker XMG Fusion 15 (Mid 22) (Benchmark-Modus) | |
| Asus TUF Dash F15 FX517ZR | |
| Schenker XMG Fusion 15 (Mid 22) (Leistung) | |
| Schenker XMG Fusion 15 (Mid 22) | |
| Acer Nitro 5 AN515-58-72QR | |
| Moyenne NVIDIA GeForce RTX 3070 Laptop GPU (21.7 - 125.8, n=50) | |
| MSI Delta 15 A5EFK | |
| Razer Blade 15 Base Edition 2021, i7-10750H RTX 3060 | |
| Schenker XMG Fusion 15 (Mid 22) (Stromsparmodus) | |
| Strange Brigade | |
| 2560x1440 ultra AA:ultra AF:16 | |
| Moyenne de la classe Gaming (52.8 - 350, n=79, 2 dernières années) | |
| Acer Nitro 5 AN515-58-72QR (1.47.22.14 D3D12) | |
| Schenker XMG Fusion 15 (Mid 22) (1.47.22.14 D3D12, Benchmark-Modus) | |
| Schenker XMG Fusion 15 (Mid 22) (1.47.22.14 D3D12) | |
| Moyenne NVIDIA GeForce RTX 3070 Laptop GPU (82.3 - 140.5, n=18) | |
| Asus TUF Dash F15 FX517ZR (1.47.22.14 D3D12) | |
| 1920x1080 ultra AA:ultra AF:16 | |
| Moyenne de la classe Gaming (76.3 - 456, n=94, 2 dernières années) | |
| Schenker XMG Fusion 15 (Mid 22) (1.47.22.14 D3D12, Benchmark-Modus) | |
| Acer Nitro 5 AN515-58-72QR (1.47.22.14 D3D12) | |
| Schenker XMG Fusion 15 (Mid 22) (1.47.22.14 D3D12, Leistung) | |
| MSI Delta 15 A5EFK (1.47.22.14 D3D12) | |
| Schenker XMG Fusion 15 (Mid 22) (1.47.22.14 D3D12) | |
| Moyenne NVIDIA GeForce RTX 3070 Laptop GPU (36.2 - 194, n=46) | |
| Asus TUF Dash F15 FX517ZR (1.47.22.14 D3D12) | |
| HP Omen 16-b1090ng (1.47.22.14 D3D12) | |
| Razer Blade 15 Base Edition 2021, i7-10750H RTX 3060 (1.47.22.14 D3D12) | |
| Schenker XMG Fusion 15 (Mid 22) (1.47.22.14 D3D12, Stromsparmodus) | |
| F1 2021 | |
| 2560x1440 Ultra High Preset + Raytracing AA:T AF:16x | |
| Schenker XMG Fusion 15 (Mid 22) (874931, Benchmark-Modus) | |
| Schenker XMG Fusion 15 (Mid 22) (874931, Leistung) | |
| Moyenne NVIDIA GeForce RTX 3070 Laptop GPU (67.1 - 90.2, n=11) | |
| Acer Nitro 5 AN515-58-72QR (874931) | |
| Schenker XMG Fusion 15 (Mid 22) (874931) | |
| Asus TUF Dash F15 FX517ZR (874931) | |
| 1920x1080 Ultra High Preset + Raytracing AA:T AF:16x | |
| Schenker XMG Fusion 15 (Mid 22) (874931, Benchmark-Modus) | |
| Schenker XMG Fusion 15 (Mid 22) (874931, Leistung) | |
| Acer Nitro 5 AN515-58-72QR (874931) | |
| Schenker XMG Fusion 15 (Mid 22) (874931) | |
| MSI Delta 15 A5EFK | |
| Moyenne NVIDIA GeForce RTX 3070 Laptop GPU (33.1 - 123.1, n=23) | |
| Asus TUF Dash F15 FX517ZR (874931) | |
| Schenker XMG Fusion 15 (Mid 22) (874931, Stromsparmodus) | |
| Far Cry 5 | |
| 2560x1440 Ultra Preset AA:T | |
| Moyenne de la classe Gaming (90 - 149, n=8, 2 dernières années) | |
| Schenker XMG Fusion 15 (Mid 22) (Benchmark-Modus) | |
| Moyenne NVIDIA GeForce RTX 3070 Laptop GPU (81 - 101, n=18) | |
| Schenker XMG Fusion 15 (Mid 22) | |
| Asus TUF Dash F15 FX517ZR | |
| Acer Nitro 5 AN515-58-72QR | |
| 1920x1080 Ultra Preset AA:T | |
| Moyenne de la classe Gaming (70 - 151, n=10, 2 dernières années) | |
| Schenker XMG Fusion 15 (Mid 22) (Benchmark-Modus) | |
| Schenker XMG Fusion 15 (Mid 22) | |
| Moyenne NVIDIA GeForce RTX 3070 Laptop GPU (89 - 140, n=36) | |
| Asus TUF Dash F15 FX517ZR | |
| MSI Delta 15 A5EFK | |
| Acer Nitro 5 AN515-58-72QR | |
Afin de vérifier si les fréquences d'images restent largement constantes sur une période prolongée, nous avons laissé le jeu The Witcher 3 tourner pendant environ 60 minutes en résolution Full HD et avec les paramètres de qualité maximum. Le personnage n'est pas déplacé. Une baisse des taux d'images n'a pas été constatée
The Witcher 3 FPS diagram
| Bas | Moyen | Élevé | Ultra | QHD | |
|---|---|---|---|---|---|
| GTA V (2015) | 183.5 | 177 | 168.5 | 100 | 83.4 |
| The Witcher 3 (2015) | 348 | 260 | 163.4 | 91.8 | |
| Dota 2 Reborn (2015) | 155.7 | 139.4 | 132.8 | 125.3 | |
| Final Fantasy XV Benchmark (2018) | 171.3 | 121.6 | 93.8 | 72.1 | |
| X-Plane 11.11 (2018) | 121.2 | 111 | 86.8 | ||
| Far Cry 5 (2018) | 152 | 122 | 115 | 109 | 89 |
| Strange Brigade (2018) | 389 | 232 | 188.8 | 165.6 | 124.1 |
| F1 2021 (2021) | 267 | 194.2 | 170.1 | 105 | 79.8 |
Emissions - L'ordinateur portable Schenker chauffe fortement
Émissions sonores
Les deux ventilateurs produisent assez peu de bruit en utilisation quotidienne (bureau, Internet). Ils ne bougent même pas de temps en temps. Les choses deviennent bruyantes à pleine charge avec des niveaux de pression sonore maximum de 48 dB(A) (test de stress) et 46 dB(A) (notre test The Witcher 3 ), respectivement, mais ce n'est pas excessivement fort. La plupart des concurrents produisent plus de bruit, avec seulement leAsus TUF Dash F15 est à peu près au même niveau
Le développement du bruit sous charge peut être réduit de deux façons : En utilisant le profil "Power-saving Mode" ou en activant le "WhisperMode 2.0" du GPU GeForce. Ce dernier peut être activé dans le Centre de contrôle (dans la section "Optimisation des performances"). Il intègre le profil "Power-saving Mode". Le Whisper Mode doit permettre d'atteindre le niveau de bruit le plus bas possible en utilisant des niveaux de fréquence d'images suffisants pour un jeu vidéo (au moins 30 à 60 fps). Le GPU n'a pas besoin de travailler à pleine puissance ; il produit moins de chaleur et les ventilateurs peuvent ralentir.
Un mot sur le profil "Benchmark Mode" : Les ventilateurs tournent en permanence à plein régime et sont, sans surprise, clairement audibles. Tout cela se traduit par un sifflement constant. Les ventilateurs de notre échantillon n'émettent aucun bruit de fond désagréable.
Degré de la nuisance sonore
| Au repos |
| 26 / 28 / 31 dB(A) |
| Fortement sollicité |
| 45 / 48 dB(A) |
 | ||
30 dB silencieux 40 dB(A) audible 50 dB(A) bruyant |
||
min: | ||
| Schenker XMG Fusion 15 (Mid 22) i7-11800H, GeForce RTX 3070 Laptop GPU | Asus TUF Dash F15 FX517ZR i7-12650H, GeForce RTX 3070 Laptop GPU | Acer Nitro 5 AN515-58-72QR i7-12700H, GeForce RTX 3070 Ti Laptop GPU | HP Omen 16-b1090ng i7-12700H, GeForce RTX 3070 Ti Laptop GPU | MSI Delta 15 A5EFK R9 5900HX, Radeon RX 6700M | Razer Blade 15 Base Edition 2021, i7-10750H RTX 3060 i7-10750H, GeForce RTX 3060 Laptop GPU | |
|---|---|---|---|---|---|---|
| Noise | -4% | -6% | -11% | -6% | 5% | |
| arrêt / environnement * (dB) | 26 | 26 -0% | 26 -0% | 26 -0% | 25 4% | 25.3 3% |
| Idle Minimum * (dB) | 26 | 26 -0% | 26 -0% | 30 -15% | 25 4% | 25.4 2% |
| Idle Average * (dB) | 28 | 32 -14% | 29 -4% | 31 -11% | 30 -7% | 25.4 9% |
| Idle Maximum * (dB) | 31 | 33 -6% | 33 -6% | 33 -6% | 40 -29% | 25.4 18% |
| Load Average * (dB) | 45 | 48 -7% | 47 -4% | 49 -9% | 47 -4% | 42.5 6% |
| Witcher 3 ultra * (dB) | 46 | 47 -2% | 53 -15% | 53 -15% | 48 -4% | 42 9% |
| Load Maximum * (dB) | 48 | 49 -2% | 53 -10% | 57 -19% | 51 -6% | 52.2 -9% |
* ... Moindre est la valeur, meilleures sont les performances
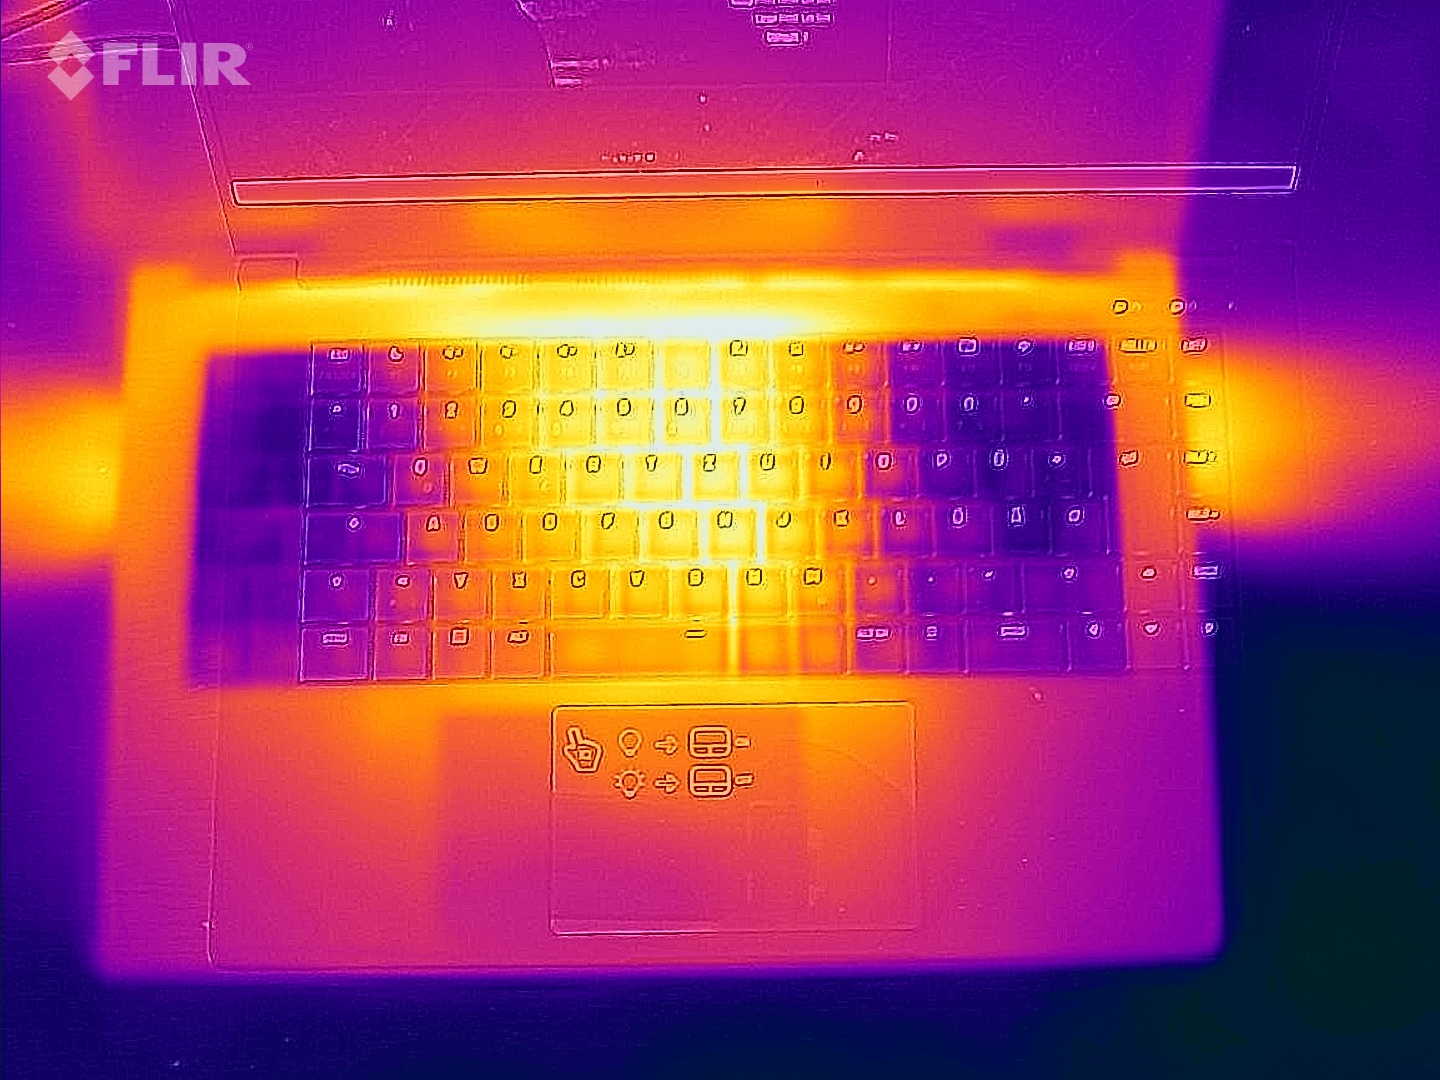
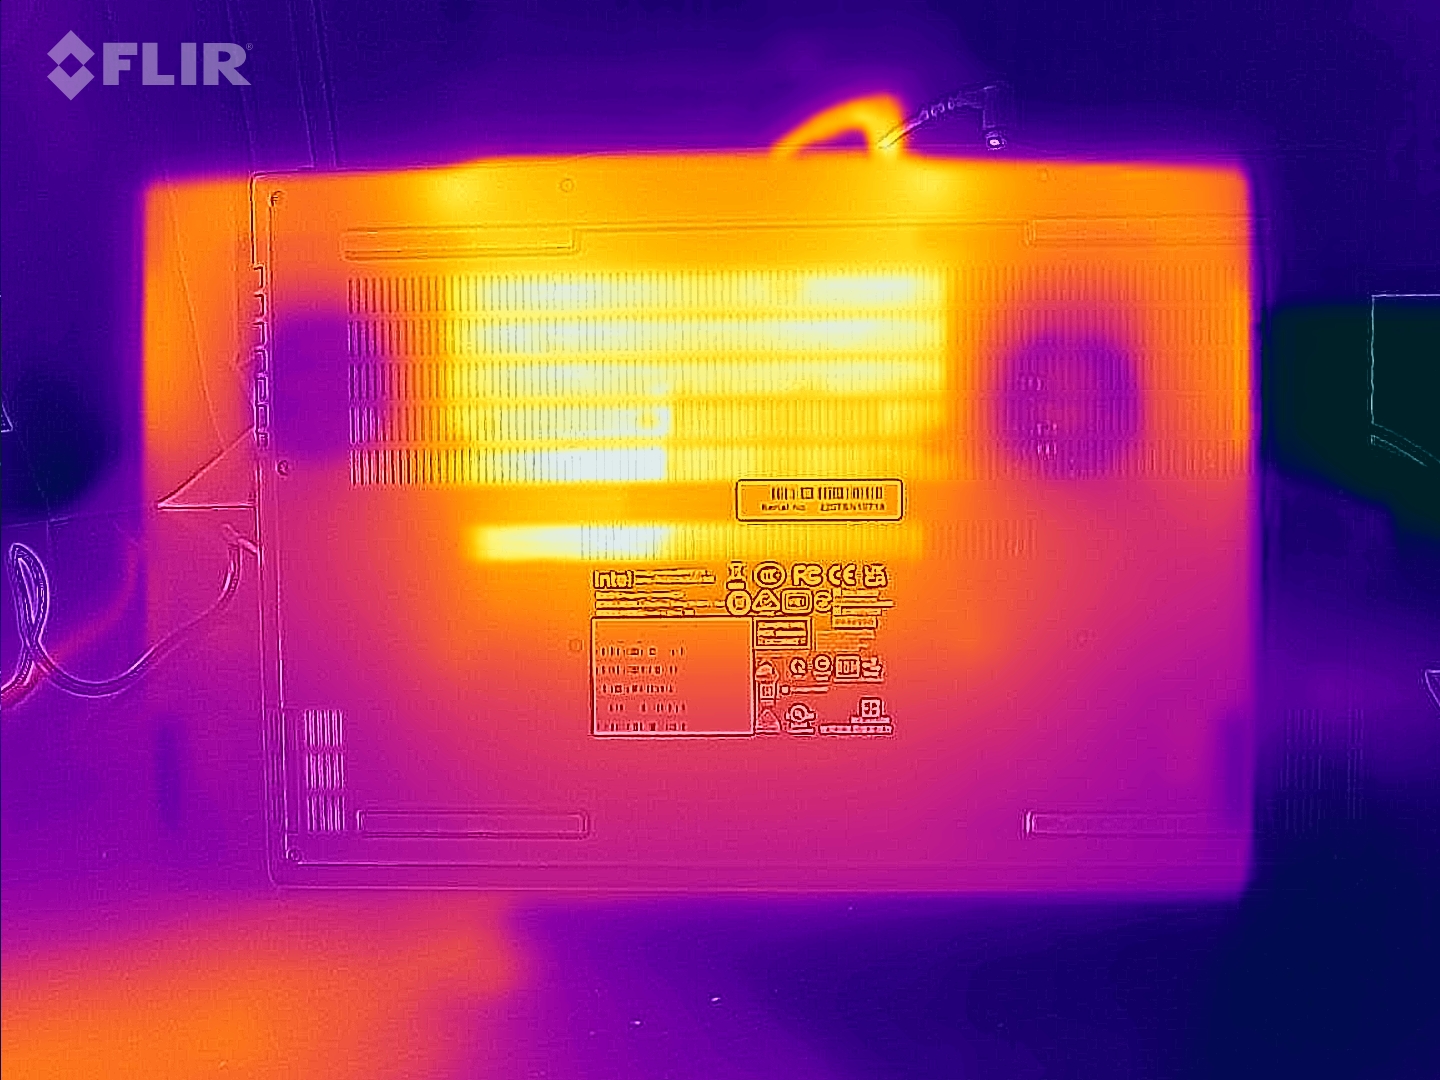
Température
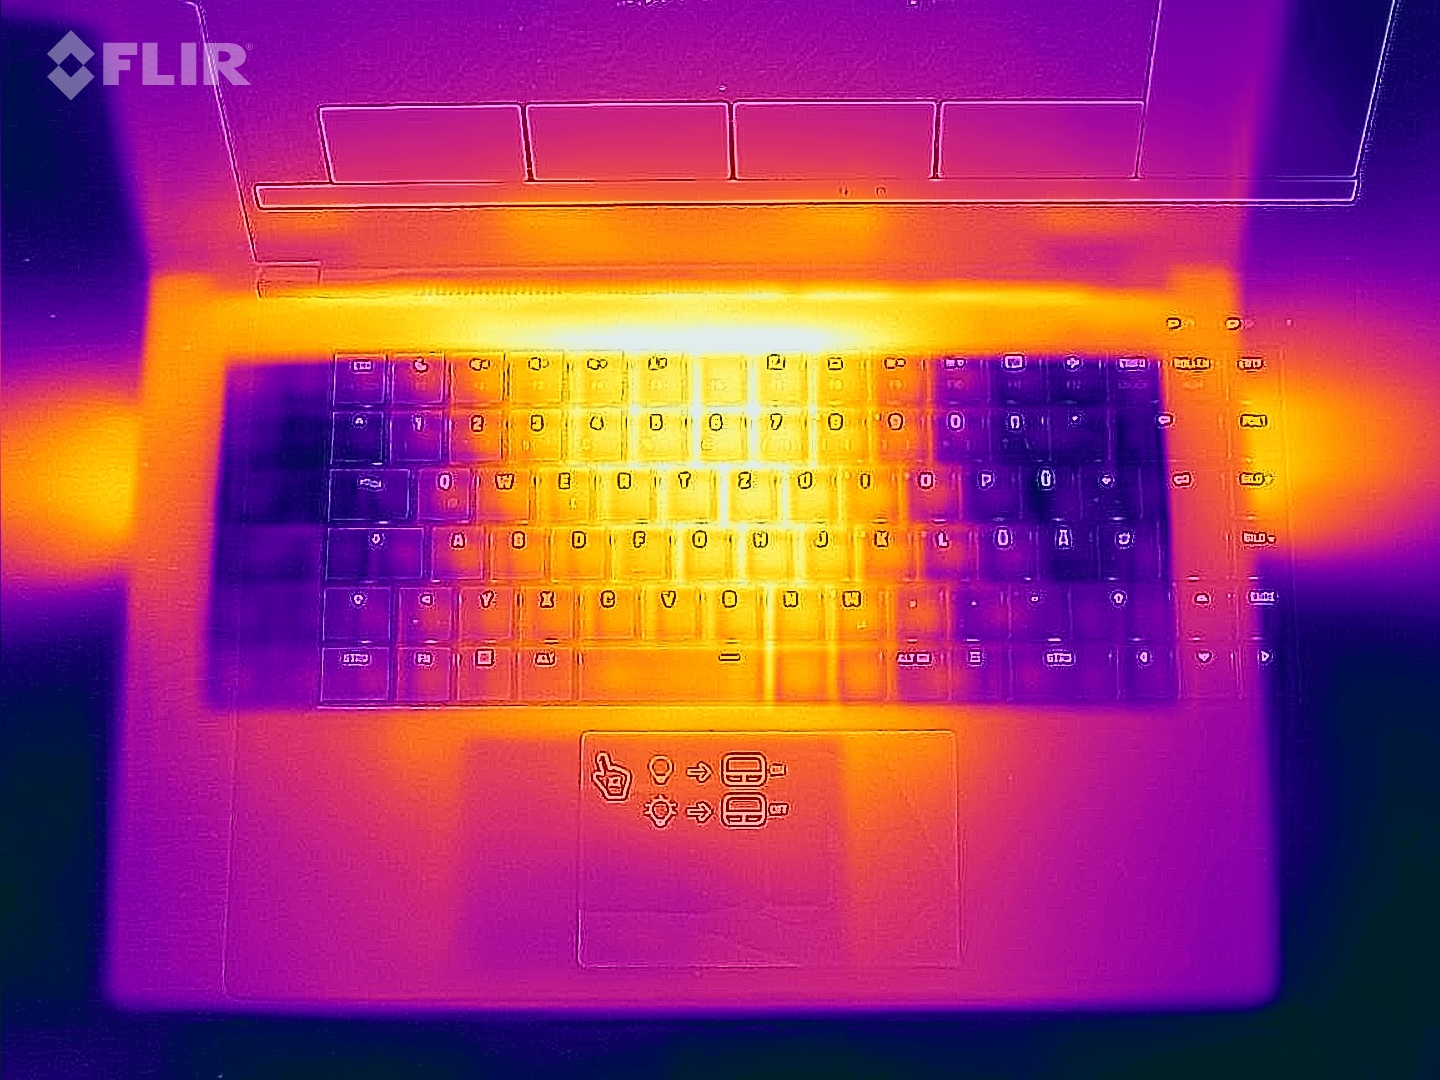
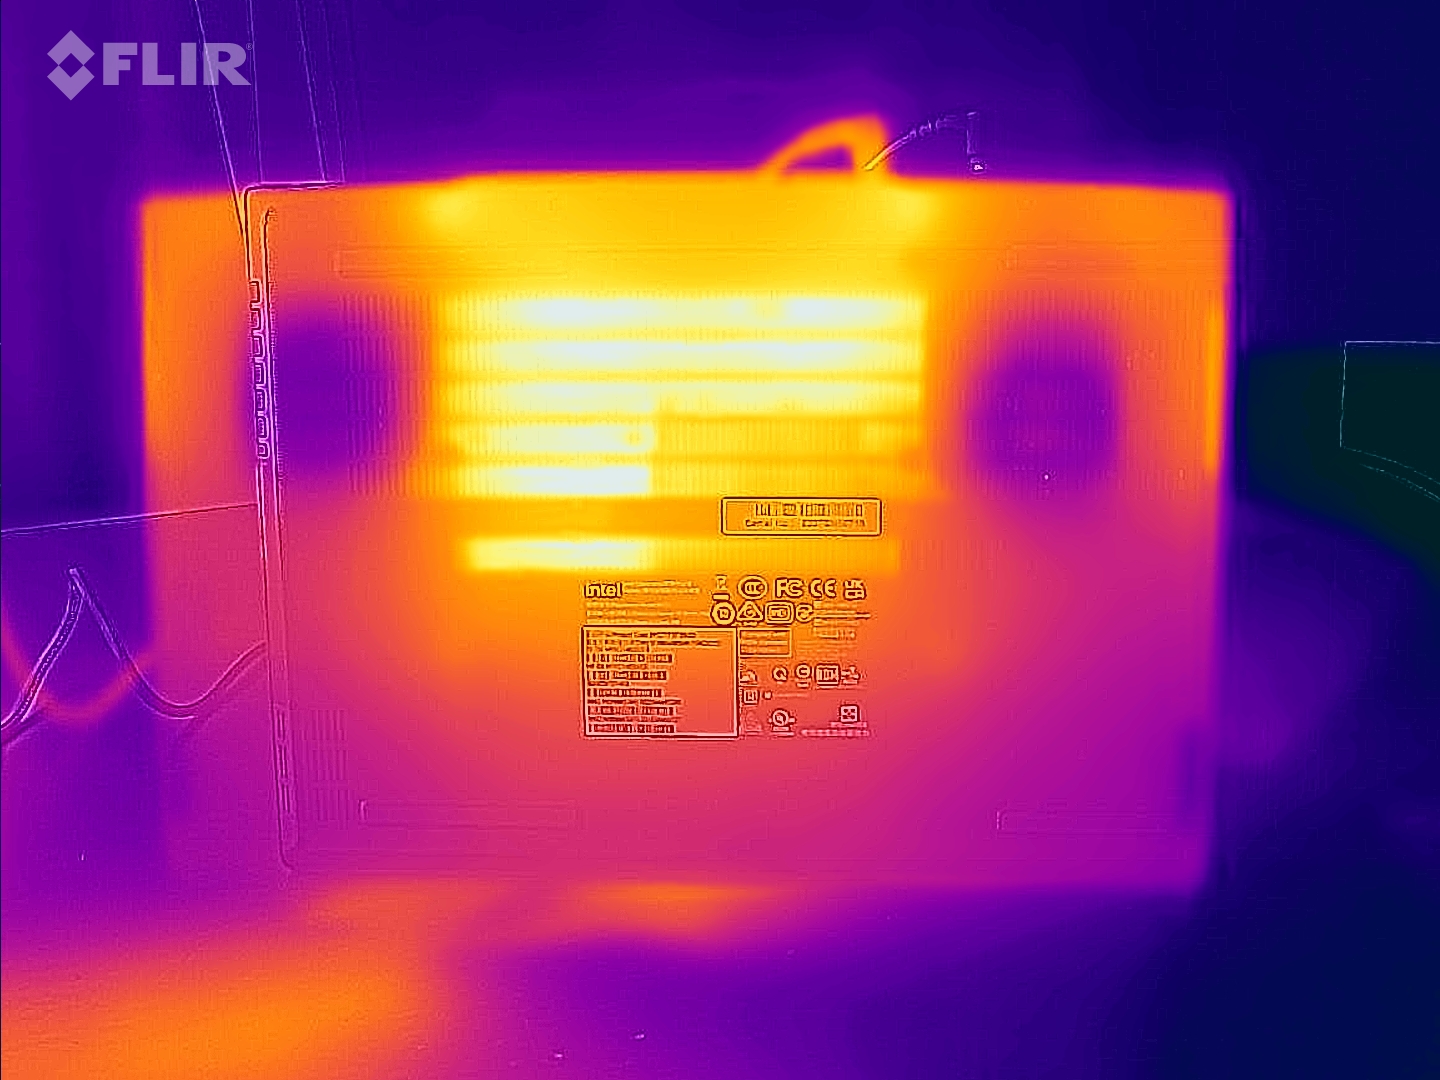
En utilisation quotidienne (bureau, Internet), les températures du boîtier restent dans une fourchette acceptable. Toutefois, l'ordinateur portable chauffe considérablement sous charge (test de résistance au stress, notre test The Witcher 3 ). Des températures légèrement supérieures à 60 °C (~140 °F) peuvent être enregistrées à plusieurs points de mesure. Les températures du processeur ne sont pas préoccupantes
(-) La température maximale du côté supérieur est de 52 °C / 126 F, par rapport à la moyenne de 40.4 °C / 105 F, allant de 21.2 à 68.8 °C pour la classe Gaming.
(-) Le fond chauffe jusqu'à un maximum de 63 °C / 145 F, contre une moyenne de 43.2 °C / 110 F
(±) En utilisation inactive, la température moyenne du côté supérieur est de 35.6 °C / 96 F, par rapport à la moyenne du dispositif de 33.9 °C / 93 F.
(-) En jouant à The Witcher 3, la température moyenne du côté supérieur est de 48.8 °C / 120 F, alors que la moyenne de l'appareil est de 33.9 °C / 93 F.
(-) Les repose-poignets et le pavé tactile peuvent devenir très chauds au toucher, avec un maximum de 46 °C / 114.8# F.
(-) La température moyenne de la zone de l'appui-paume de dispositifs similaires était de 28.8 °C / 83.8 F (-17.2 °C / #-31 F).
| Schenker XMG Fusion 15 (Mid 22) Intel Core i7-11800H, NVIDIA GeForce RTX 3070 Laptop GPU | Asus TUF Dash F15 FX517ZR Intel Core i7-12650H, NVIDIA GeForce RTX 3070 Laptop GPU | Acer Nitro 5 AN515-58-72QR Intel Core i7-12700H, NVIDIA GeForce RTX 3070 Ti Laptop GPU | HP Omen 16-b1090ng Intel Core i7-12700H, NVIDIA GeForce RTX 3070 Ti Laptop GPU | MSI Delta 15 A5EFK AMD Ryzen 9 5900HX, AMD Radeon RX 6700M | Razer Blade 15 Base Edition 2021, i7-10750H RTX 3060 Intel Core i7-10750H, NVIDIA GeForce RTX 3060 Laptop GPU | |
|---|---|---|---|---|---|---|
| Heat | 8% | 12% | 22% | 14% | 12% | |
| Maximum Upper Side * (°C) | 52 | 52 -0% | 48 8% | 41 21% | 50 4% | 45.2 13% |
| Maximum Bottom * (°C) | 63 | 52 17% | 51 19% | 62 2% | 55 13% | 48 24% |
| Idle Upper Side * (°C) | 37 | 33 11% | 34 8% | 25 32% | 31 16% | 34.4 7% |
| Idle Bottom * (°C) | 38 | 36 5% | 33 13% | 26 32% | 30 21% | 37.2 2% |
* ... Moindre est la valeur, meilleures sont les performances
Test de stress
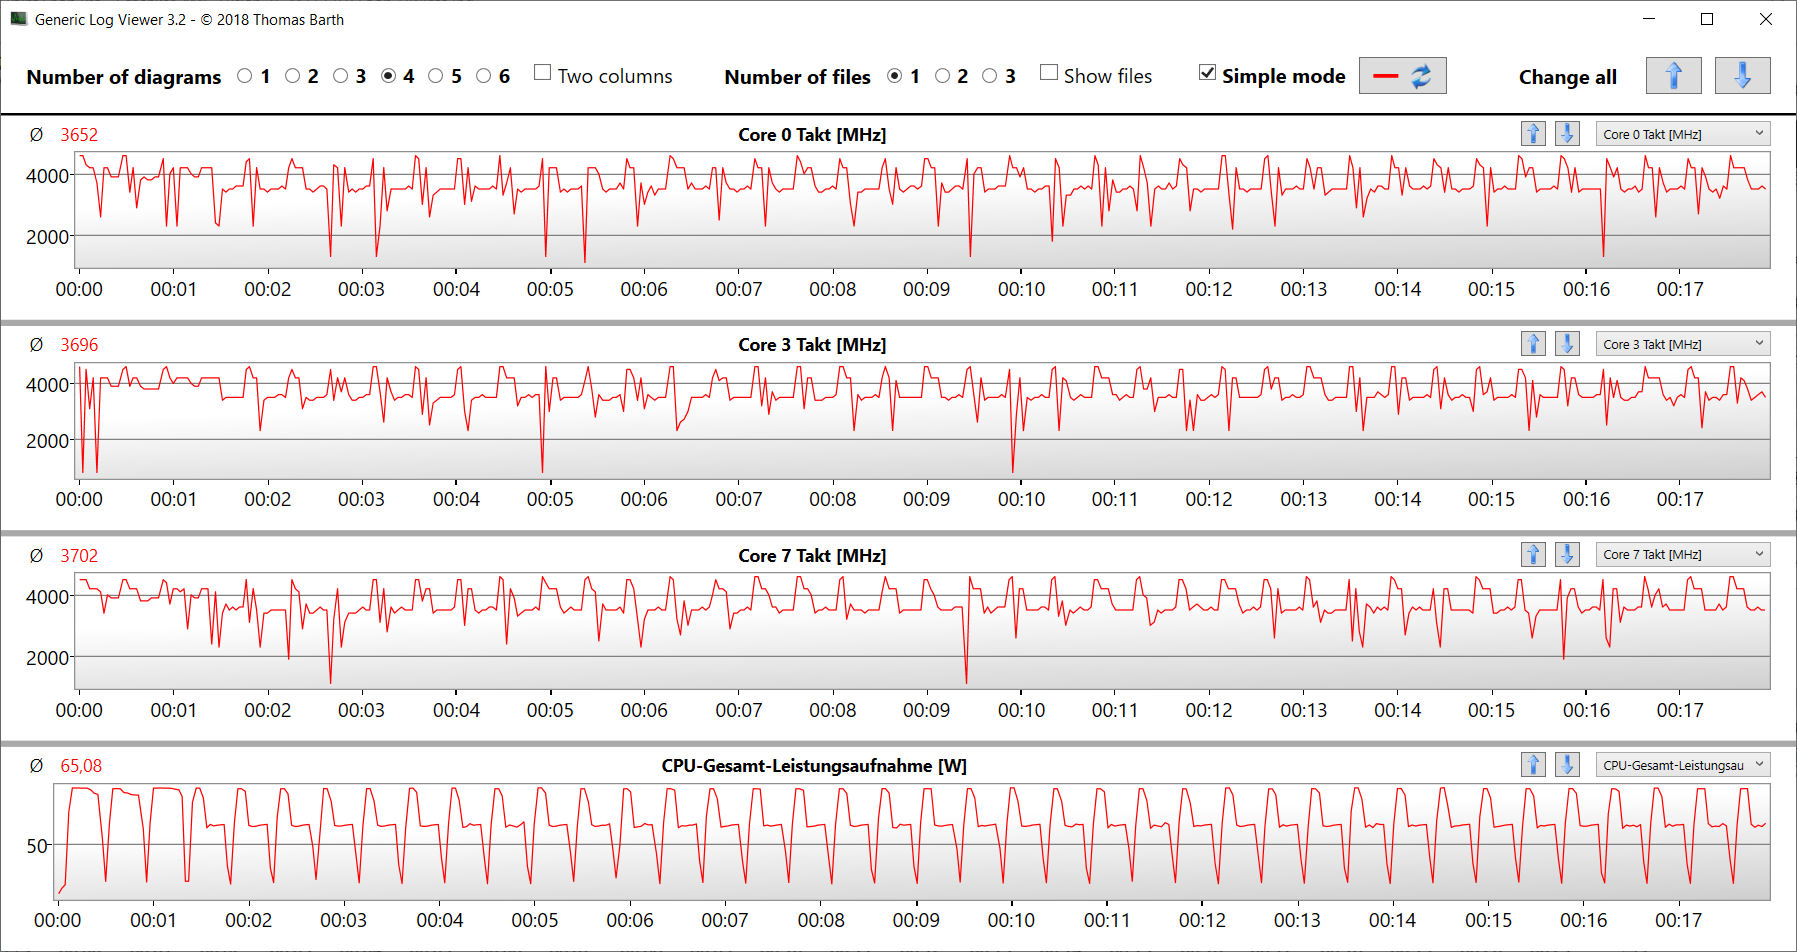
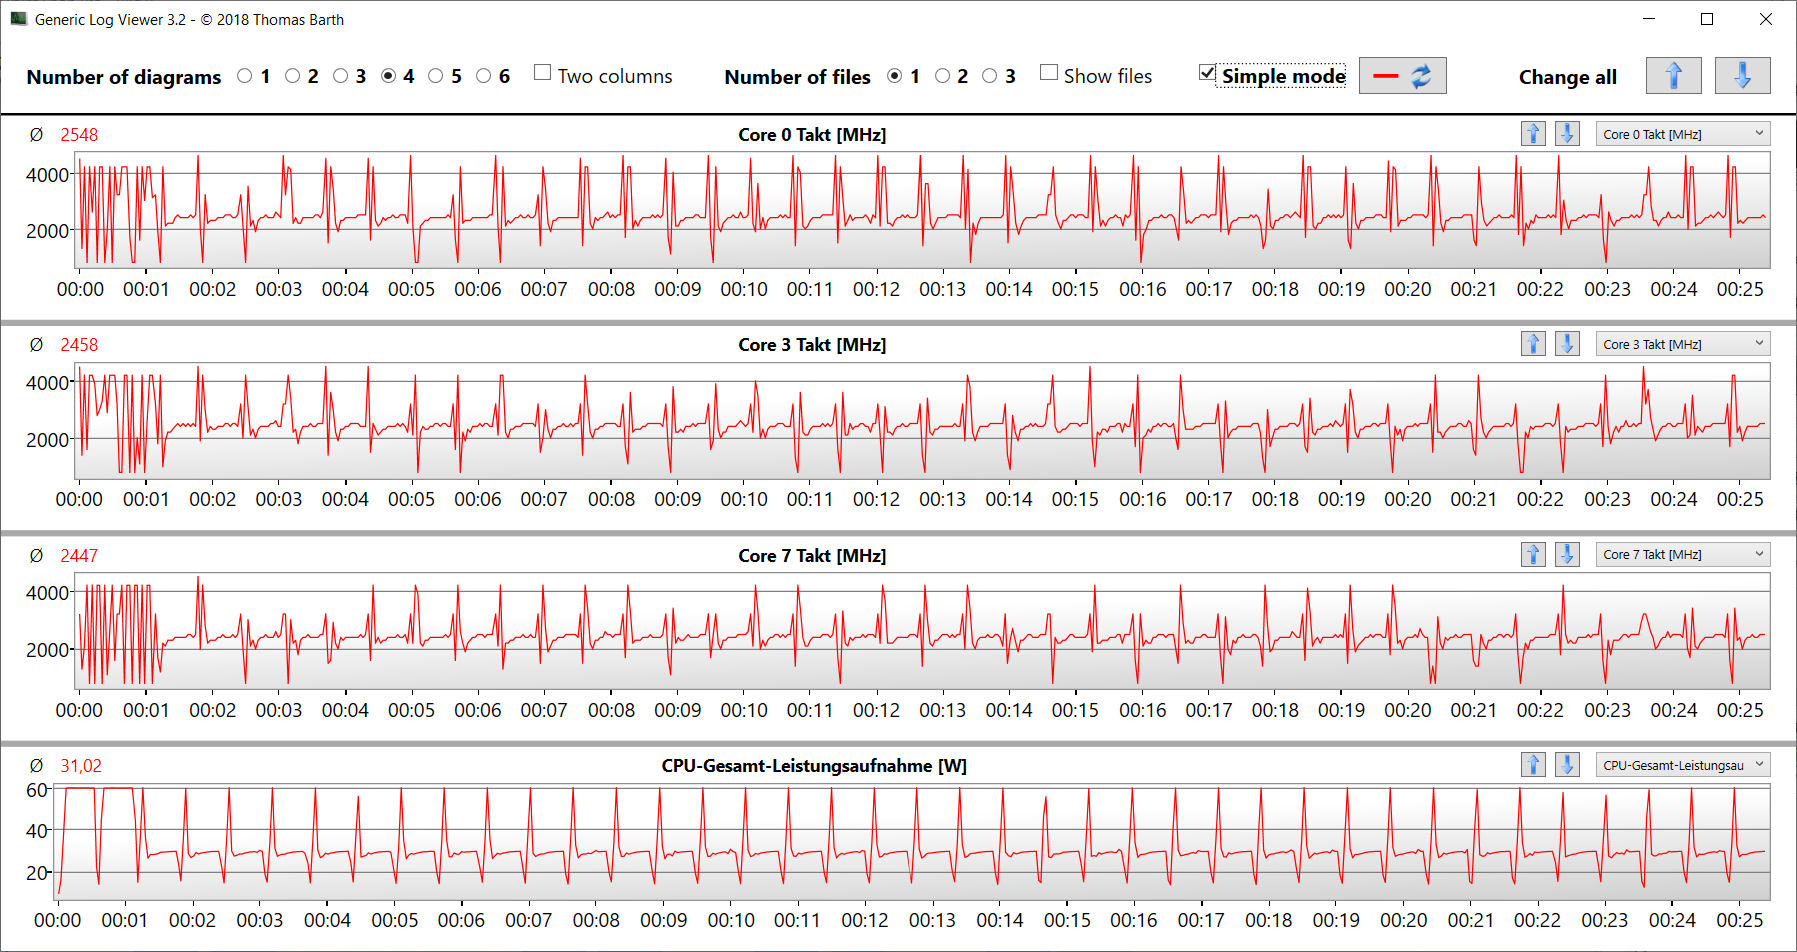
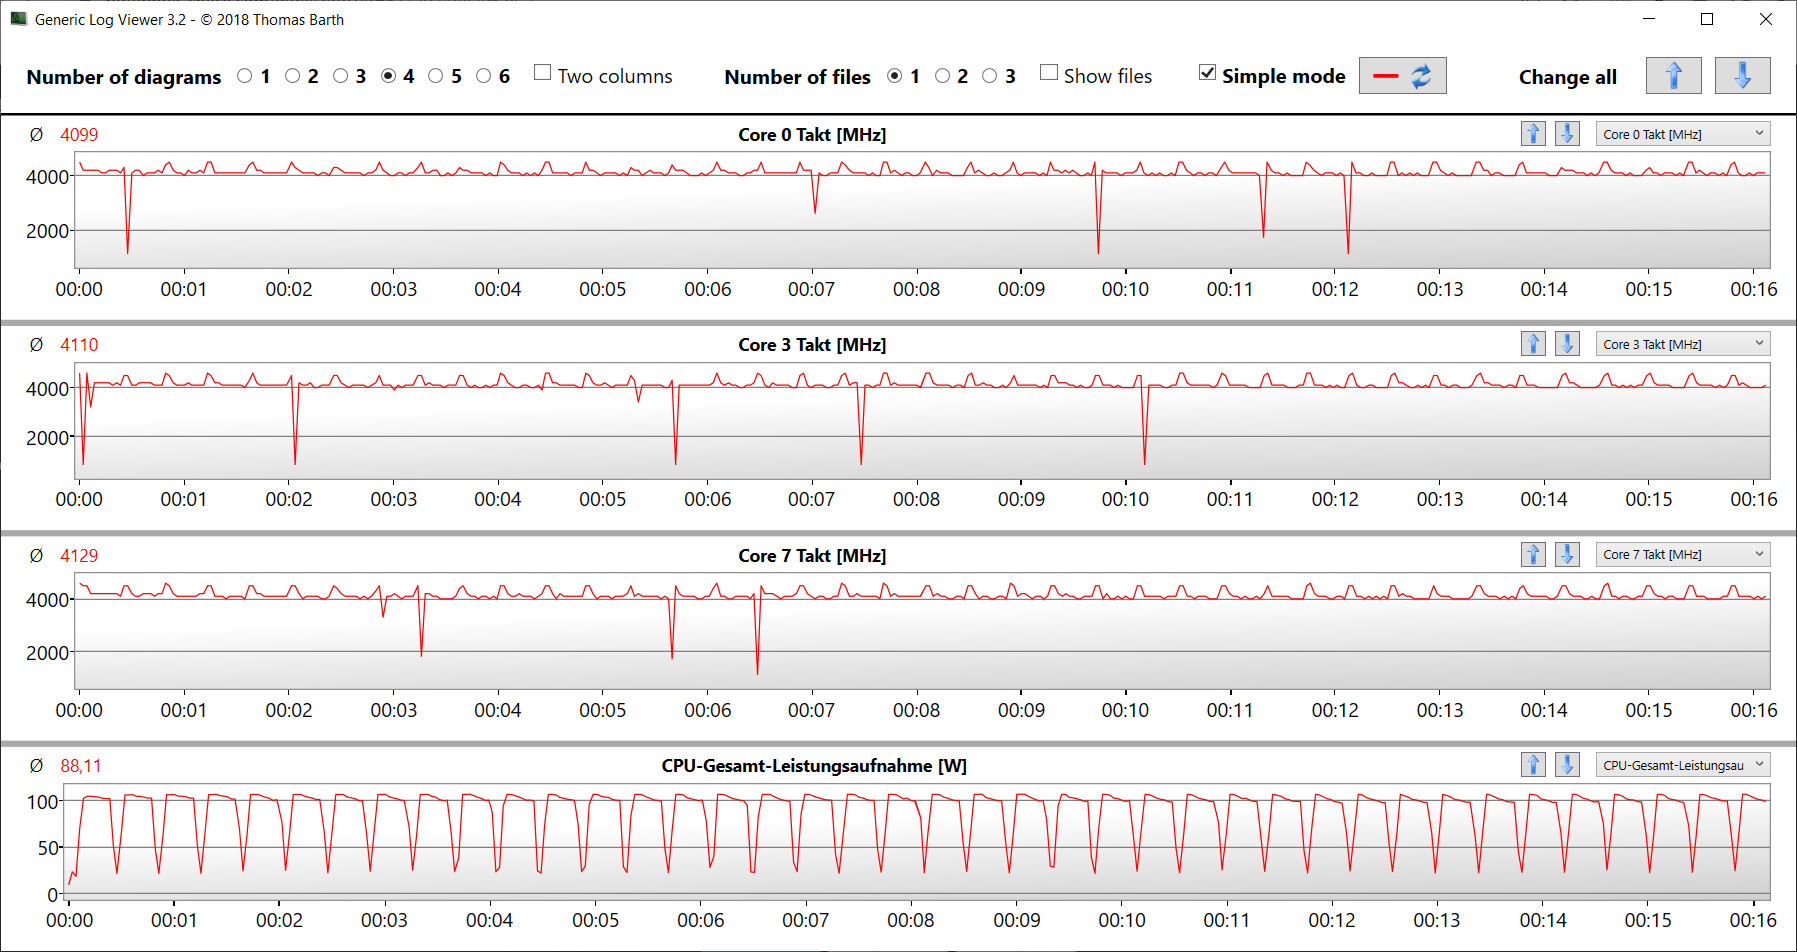
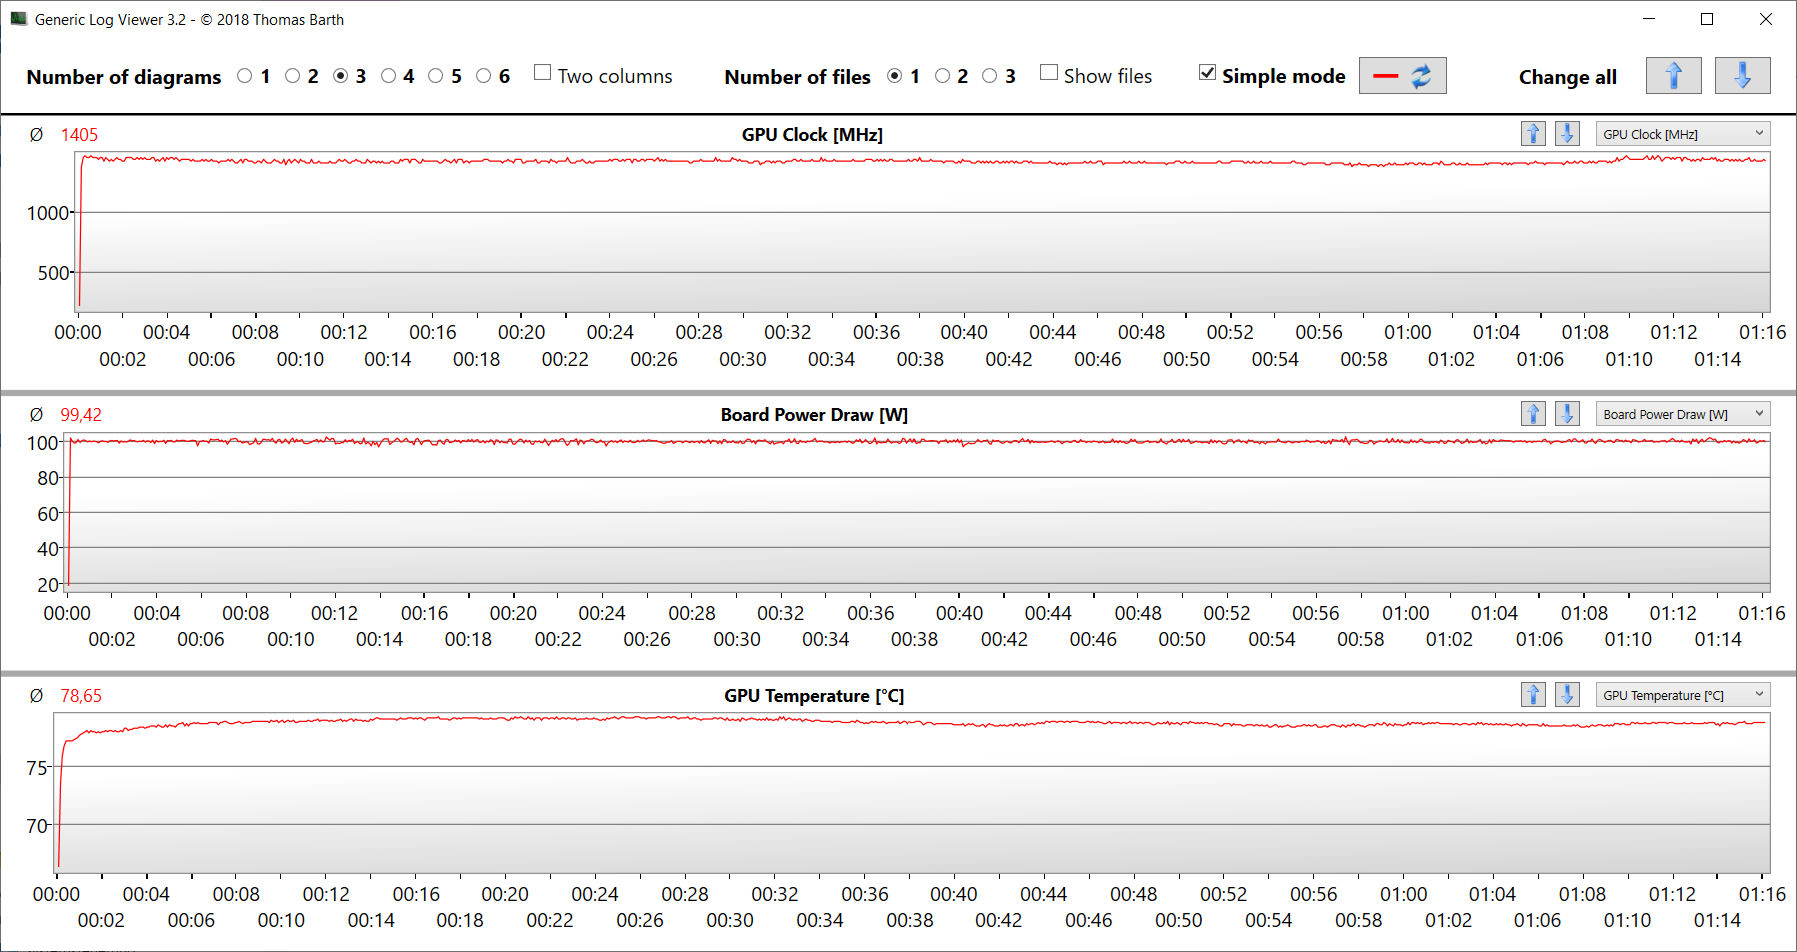
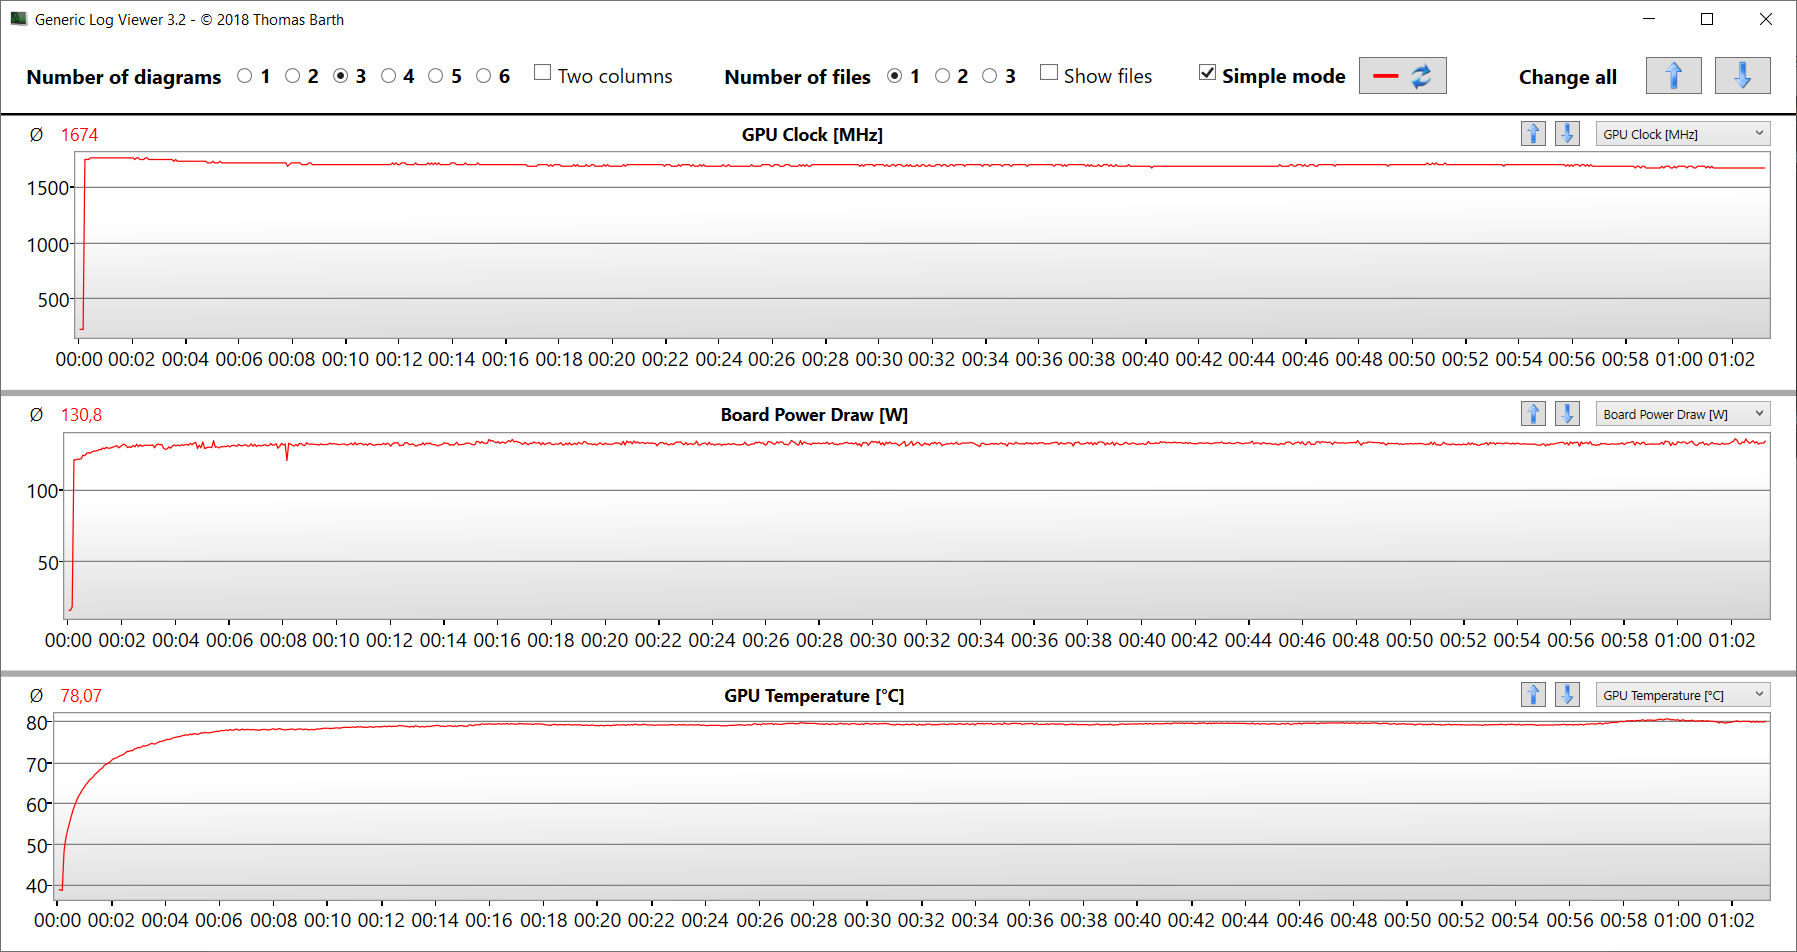
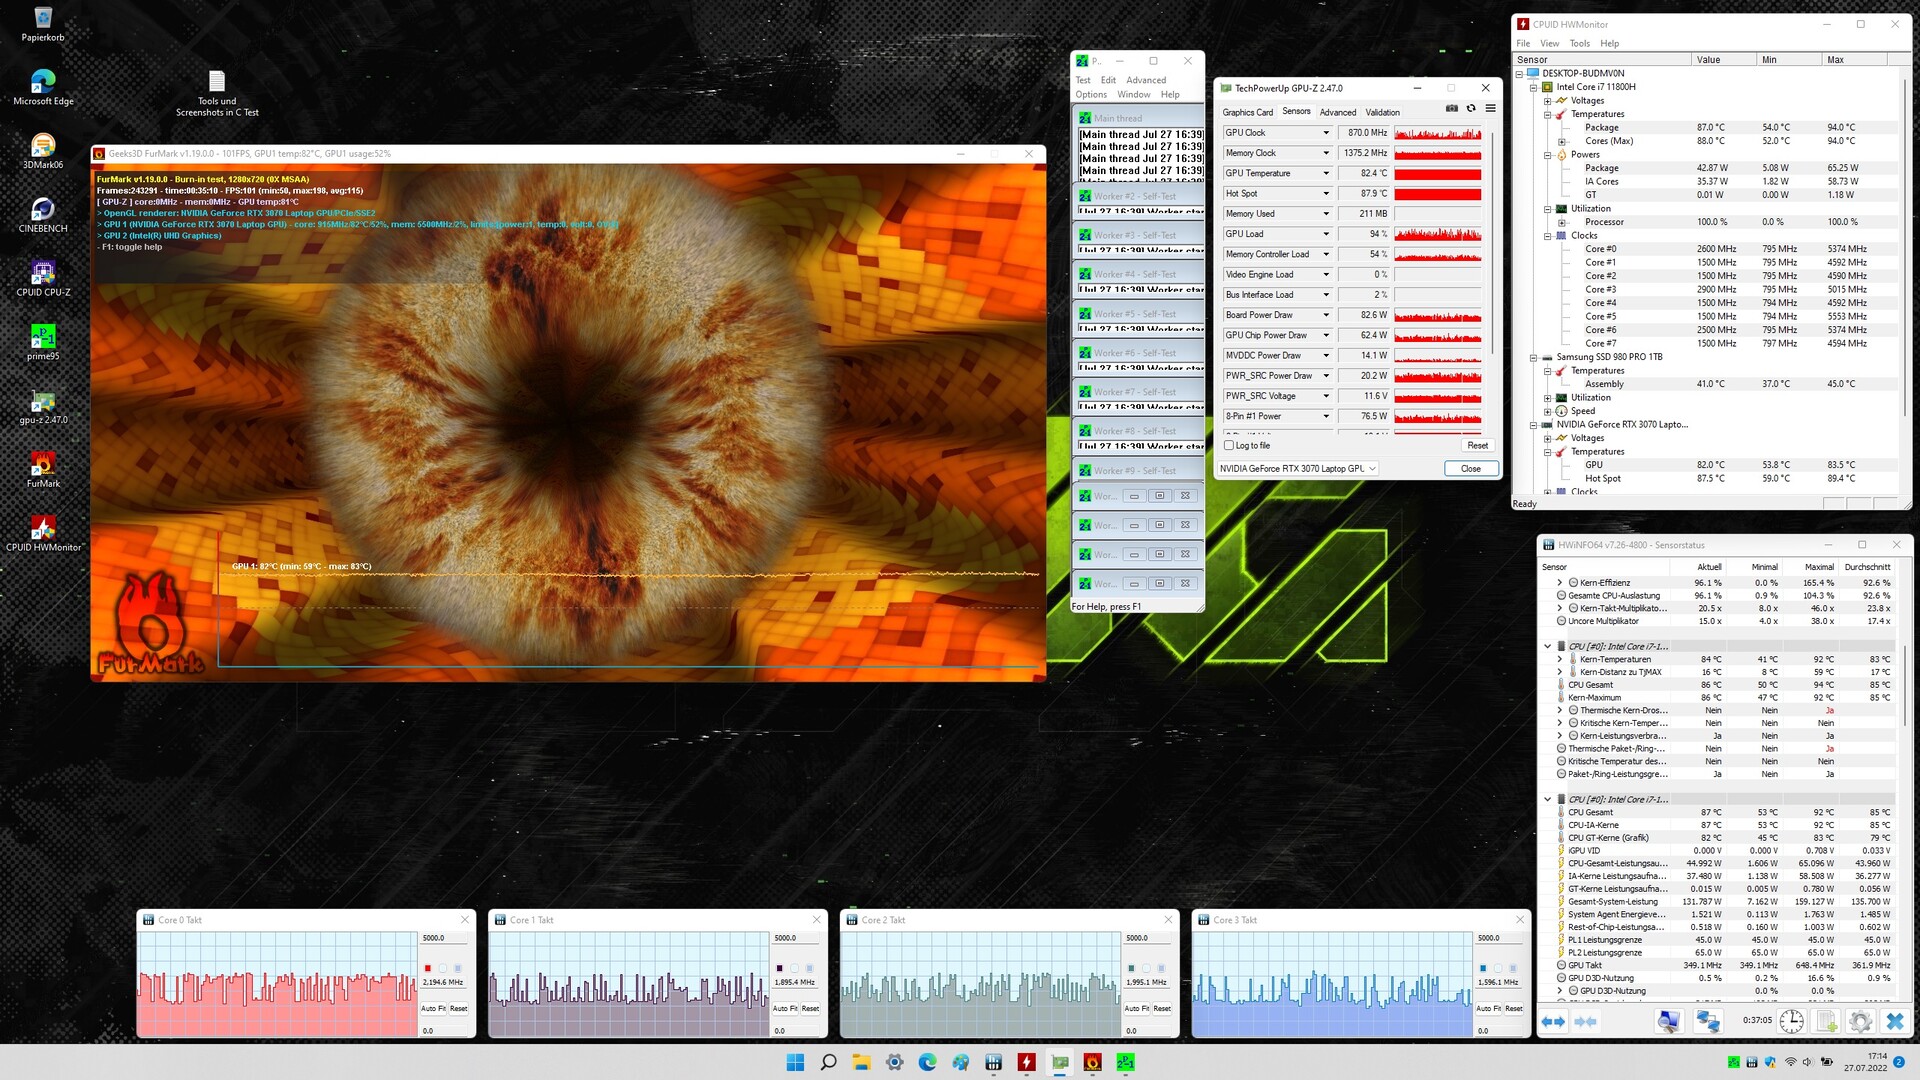
Le CPU (1,8 à 4,2 GHz) et le GPU (1 000 à 1 700 MHz) commencent le test de stress (Prime95 et FurMark fonctionnent pendant au moins une heure) avec un niveau élevé de fluctuation des vitesses de fonctionnement. Au fur et à mesure que le test progresse, les fréquences d'horloge diminuent. Le test de stress représente un scénario extrême. Nous utilisons ce test pour vérifier que le système reste stable à pleine charge.
Haut-parleurs
Les haut-parleurs stéréo produisent un son relativement bon, mais il n'y a pratiquement pas de basses. Nous vous recommandons d'utiliser des écouteurs ou des haut-parleurs externes pour une meilleure expérience sonore
Schenker XMG Fusion 15 (Mid 22) analyse audio
(+) | les haut-parleurs peuvent jouer relativement fort (82# dB)
Basses 100 - 315 Hz
(-) | presque aucune basse - en moyenne 17.6% plus bas que la médiane
(±) | la linéarité des basses est moyenne (12.1% delta à la fréquence précédente)
Médiums 400 - 2000 Hz
(+) | médiane équilibrée - seulement 3% de la médiane
(+) | les médiums sont linéaires (3.9% delta à la fréquence précédente)
Aiguës 2 - 16 kHz
(+) | des sommets équilibrés - à seulement 2.8% de la médiane
(+) | les aigus sont linéaires (5.5% delta à la fréquence précédente)
Globalement 100 - 16 000 Hz
(+) | le son global est linéaire (13.3% différence à la médiane)
Par rapport à la même classe
» 19% de tous les appareils testés de cette catégorie étaient meilleurs, 5% similaires, 76% pires
» Le meilleur avait un delta de 6%, la moyenne était de 18%, le pire était de 132%.
Par rapport à tous les appareils testés
» 14% de tous les appareils testés étaient meilleurs, 3% similaires, 83% pires
» Le meilleur avait un delta de 4%, la moyenne était de 24%, le pire était de 134%.
Gestion de l'énergie - Le NUC offre une bonne autonomie de batterie
Consommation d'énergie
Dans l'ensemble, la consommation d'énergie se situe à un niveau normal pour le matériel installé ici. Notre test The Witcher 3 et le test de stress, respectivement, entraînent une consommation moyenne de 208 watts et jusqu'à 160 watts, respectivement. Alors que notre test The Witcher 3 est exécuté avec une consommation d'énergie constante, la demande fluctue et baisse au cours du test de stress. L'alimentation fournie (230 watts) est d'une capacité suffisante
| Éteint/en veille | |
| Au repos | |
| Fortement sollicité |
|
Légende:
min: | |
| Schenker XMG Fusion 15 (Mid 22) i7-11800H, GeForce RTX 3070 Laptop GPU | Asus TUF Dash F15 FX517ZR i7-12650H, GeForce RTX 3070 Laptop GPU | Acer Nitro 5 AN515-58-72QR i7-12700H, GeForce RTX 3070 Ti Laptop GPU | HP Omen 16-b1090ng i7-12700H, GeForce RTX 3070 Ti Laptop GPU | MSI Delta 15 A5EFK R9 5900HX, Radeon RX 6700M | Razer Blade 15 Base Edition 2021, i7-10750H RTX 3060 i7-10750H, GeForce RTX 3060 Laptop GPU | Moyenne NVIDIA GeForce RTX 3070 Laptop GPU | Moyenne de la classe Gaming | |
|---|---|---|---|---|---|---|---|---|
| Power Consumption | 10% | 2% | 17% | -2% | 2% | -16% | -10% | |
| Idle Minimum * (Watt) | 12 | 10 17% | 7 42% | 4 67% | 10 17% | 11.7 2% | 15.6 ? -30% | 13.3 ? -11% |
| Idle Average * (Watt) | 17 | 14 18% | 15 12% | 10 41% | 18 -6% | 16 6% | 20.1 ? -18% | 19 ? -12% |
| Idle Maximum * (Watt) | 24 | 20 17% | 24 -0% | 19 21% | 25 -4% | 29.3 -22% | 29.4 ? -22% | 24.5 ? -2% |
| Load Average * (Watt) | 106 | 122 -15% | 124 -17% | 114 -8% | 101 5% | 95.6 10% | 110.8 ? -5% | 108.1 ? -2% |
| Witcher 3 ultra * (Watt) | 159.9 | 138.6 13% | 195.1 -22% | 183.2 -15% | 187 -17% | 141.3 12% | ||
| Load Maximum * (Watt) | 208 | 189 9% | 220 -6% | 221 -6% | 217 -4% | 197 5% | 214 ? -3% | 254 ? -22% |
* ... Moindre est la valeur, meilleures sont les performances
Energy consumption during The Witcher 3 / Stress test
Energy consumption with an external monitor
Durée de vie de la batterie
L'ordinateur portable Schenker offre la meilleure autonomie dans le domaine de la comparaison - ce n'est pas une surprise : L'ordinateur portable dispose de la plus grande capacité de batterie (93 Wh). Le portable de 15,6 pouces atteint des durées d'exécution de 7:26 heures et 7:28 heures dans notre test Wi-Fi (accès à des sites Web via un script) et notre test vidéo (court-métrage Big Buck Bunny (encodage H.264, Full HD) tournant en boucle), respectivement. Les fonctions d'économie d'énergie de l'ordinateur portable sont désactivées pendant les deux tests, et la luminosité de l'écran est réglée à environ 150 cd/m². En outre, les modules sans fil sont désactivés pour le test vidéo
| Schenker XMG Fusion 15 (Mid 22) i7-11800H, GeForce RTX 3070 Laptop GPU, 93.48 Wh | Asus TUF Dash F15 FX517ZR i7-12650H, GeForce RTX 3070 Laptop GPU, 76 Wh | Acer Nitro 5 AN515-58-72QR i7-12700H, GeForce RTX 3070 Ti Laptop GPU, 57.5 Wh | HP Omen 16-b1090ng i7-12700H, GeForce RTX 3070 Ti Laptop GPU, 83 Wh | MSI Delta 15 A5EFK R9 5900HX, Radeon RX 6700M, 82 Wh | Razer Blade 15 Base Edition 2021, i7-10750H RTX 3060 i7-10750H, GeForce RTX 3060 Laptop GPU, 65 Wh | Moyenne de la classe Gaming | |
|---|---|---|---|---|---|---|---|
| Autonomie de la batterie | -8% | -45% | -18% | -11% | -34% | -14% | |
| Reader / Idle (h) | 15.5 | 10.8 -30% | 5.7 -63% | 10.1 -35% | 11.1 -28% | 7.8 -50% | 8.71 ? -44% |
| H.264 (h) | 7.5 | 5.8 -23% | 4.7 -37% | 8.26 ? 10% | |||
| WiFi v1.3 (h) | 7.4 | 7 -5% | 3.9 -47% | 5.6 -24% | 7.9 7% | 4.8 -35% | 7.01 ? -5% |
| Load (h) | 1.8 | 2.3 28% | 1.2 -33% | 1.9 6% | 1.6 -11% | 1.5 -17% | 1.47 ? -18% |
Points positifs
Points négatifs
Verdict : compact et puissant
Le rendu et les jeux font partie des principales compétences de cet ordinateur portable compact et léger. Les jeux en QHD sont possibles avec des réglages élevés à maximaux. L'accent n'est pas mis sur la performance maximale, mais sur un compromis entre performance et portabilité.
Avec le XMG Fusion 15 (Mid 22), Schenker propose un ordinateur portable de jeu compact très performant. Il ne gagnera pas de points de style, cependant.
Le site Core i7-11800H et la GeForce RTX 3070 peuvent fonctionner à des fréquences d'horloge élevées et constantes. Selon les réglages, les performances du GPU sont égales ou supérieures à la moyenne de la RTX 3070. L'ordinateur portable chauffe très fortement en charge, et le développement du bruit atteint le niveau habituel de la classe. L'appareil peut fonctionner silencieusement dans une utilisation quotidienne.
Une batterie de 93 Wh assure une autonomie pratique d'environ 7h30 - un taux plutôt bon. Dommage : la batterie ne peut pas être chargée via le port USB-C (Thunderbolt 4). Cela aurait été une fonctionnalité très utile, surtout pour un appareil conçu pour la mobilité. Toutefois, le port Thunderbolt 4 ouvre des possibilités d'extension sous la forme d'une solution de docking ou d'un GPU externe.
Le clavier mécanique (avec rétroéclairage monotouche RGB) a laissé une bonne impression, et il est probable que ce soit un critère important pour de nombreux acheteurs potentiels. L'écran QHD mat (15,6 pouces, IPS, 165 Hz) ne souffre d'aucune faiblesse majeure, mais ce n'est pas non plus un écran de premier ordre. L'écran marque des points avec une bonne reproduction des couleurs, une couverture de l'espace colorimétrique très décente et des temps de réponse rapides.
Une alternative au Fusion serait le Asus TUF Dash F15 FX517ZRqui est également léger et compact. Cet ordinateur portable offre une meilleure couverture de l'espace colorimétrique, Adaptive Sync, un mode dGPU et Power Delivery. Les performances du GPU sont toutefois légèrement inférieures à celles du Fusion 15.
Prix et disponibilité
Le Schenker XMG Fusion 15 (Mid 2022) peut être personnalisé dans la boutique en ligne de Schenker. La variante de configuration qui nous a été fournie (Core i7-11800H, GeForce RTX 3070 Laptop, 32 GB RAM, 1 TB SSD, écran QHD) est disponible pour un peu moins de 2,000 Euros (~$1,991). Les modèles d'entrée de gamme sont disponibles à partir d'environ 1 500 euros (~1 493 $).
Conseil : Au moment de la rédaction de cet article, la boutique en ligne offre une remise de 150 euros (~$149) sur toutes les configurations de la Fusion. La remise est appliquée dans le panier d'achat.
Schenker XMG Fusion 15 (Mid 22)
- 08/21/2022 v7 (old)
Sascha Mölck
Price comparison

