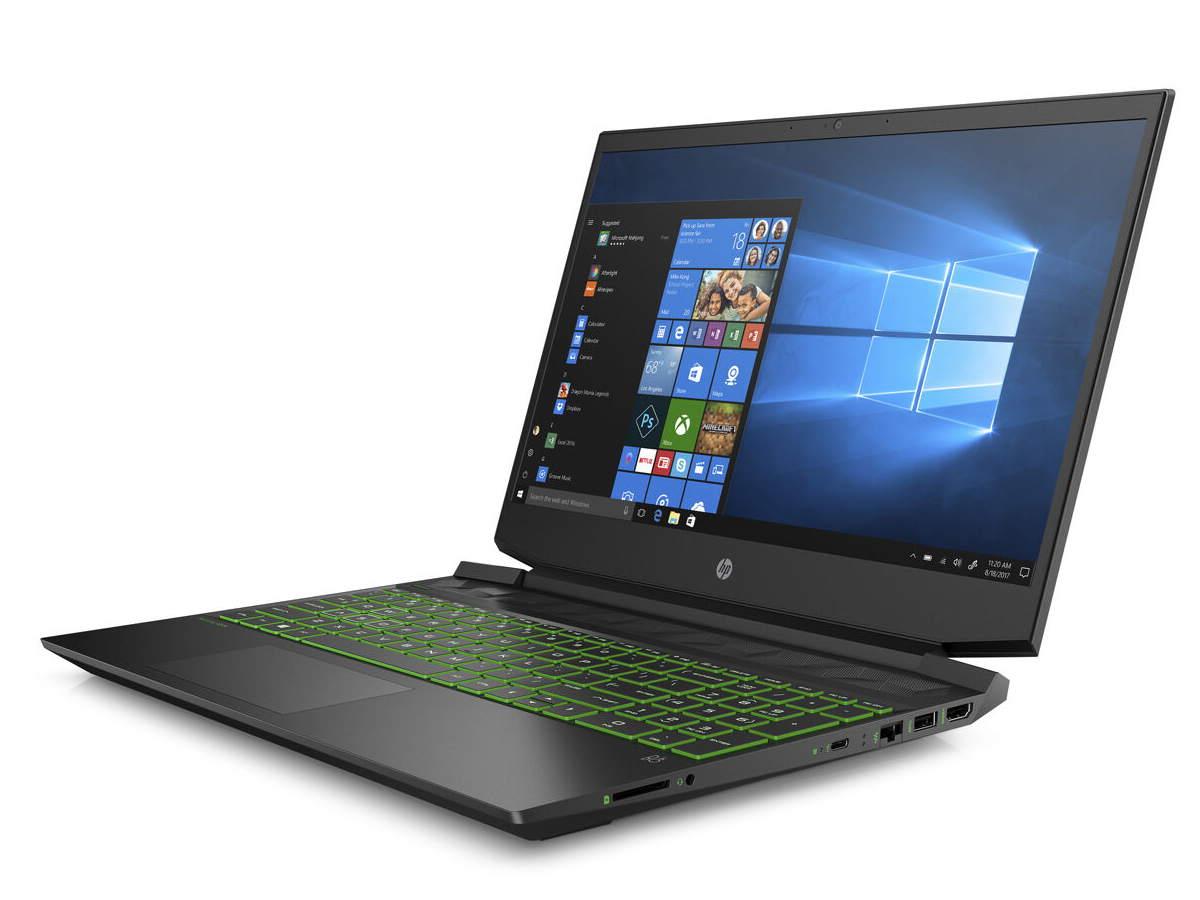
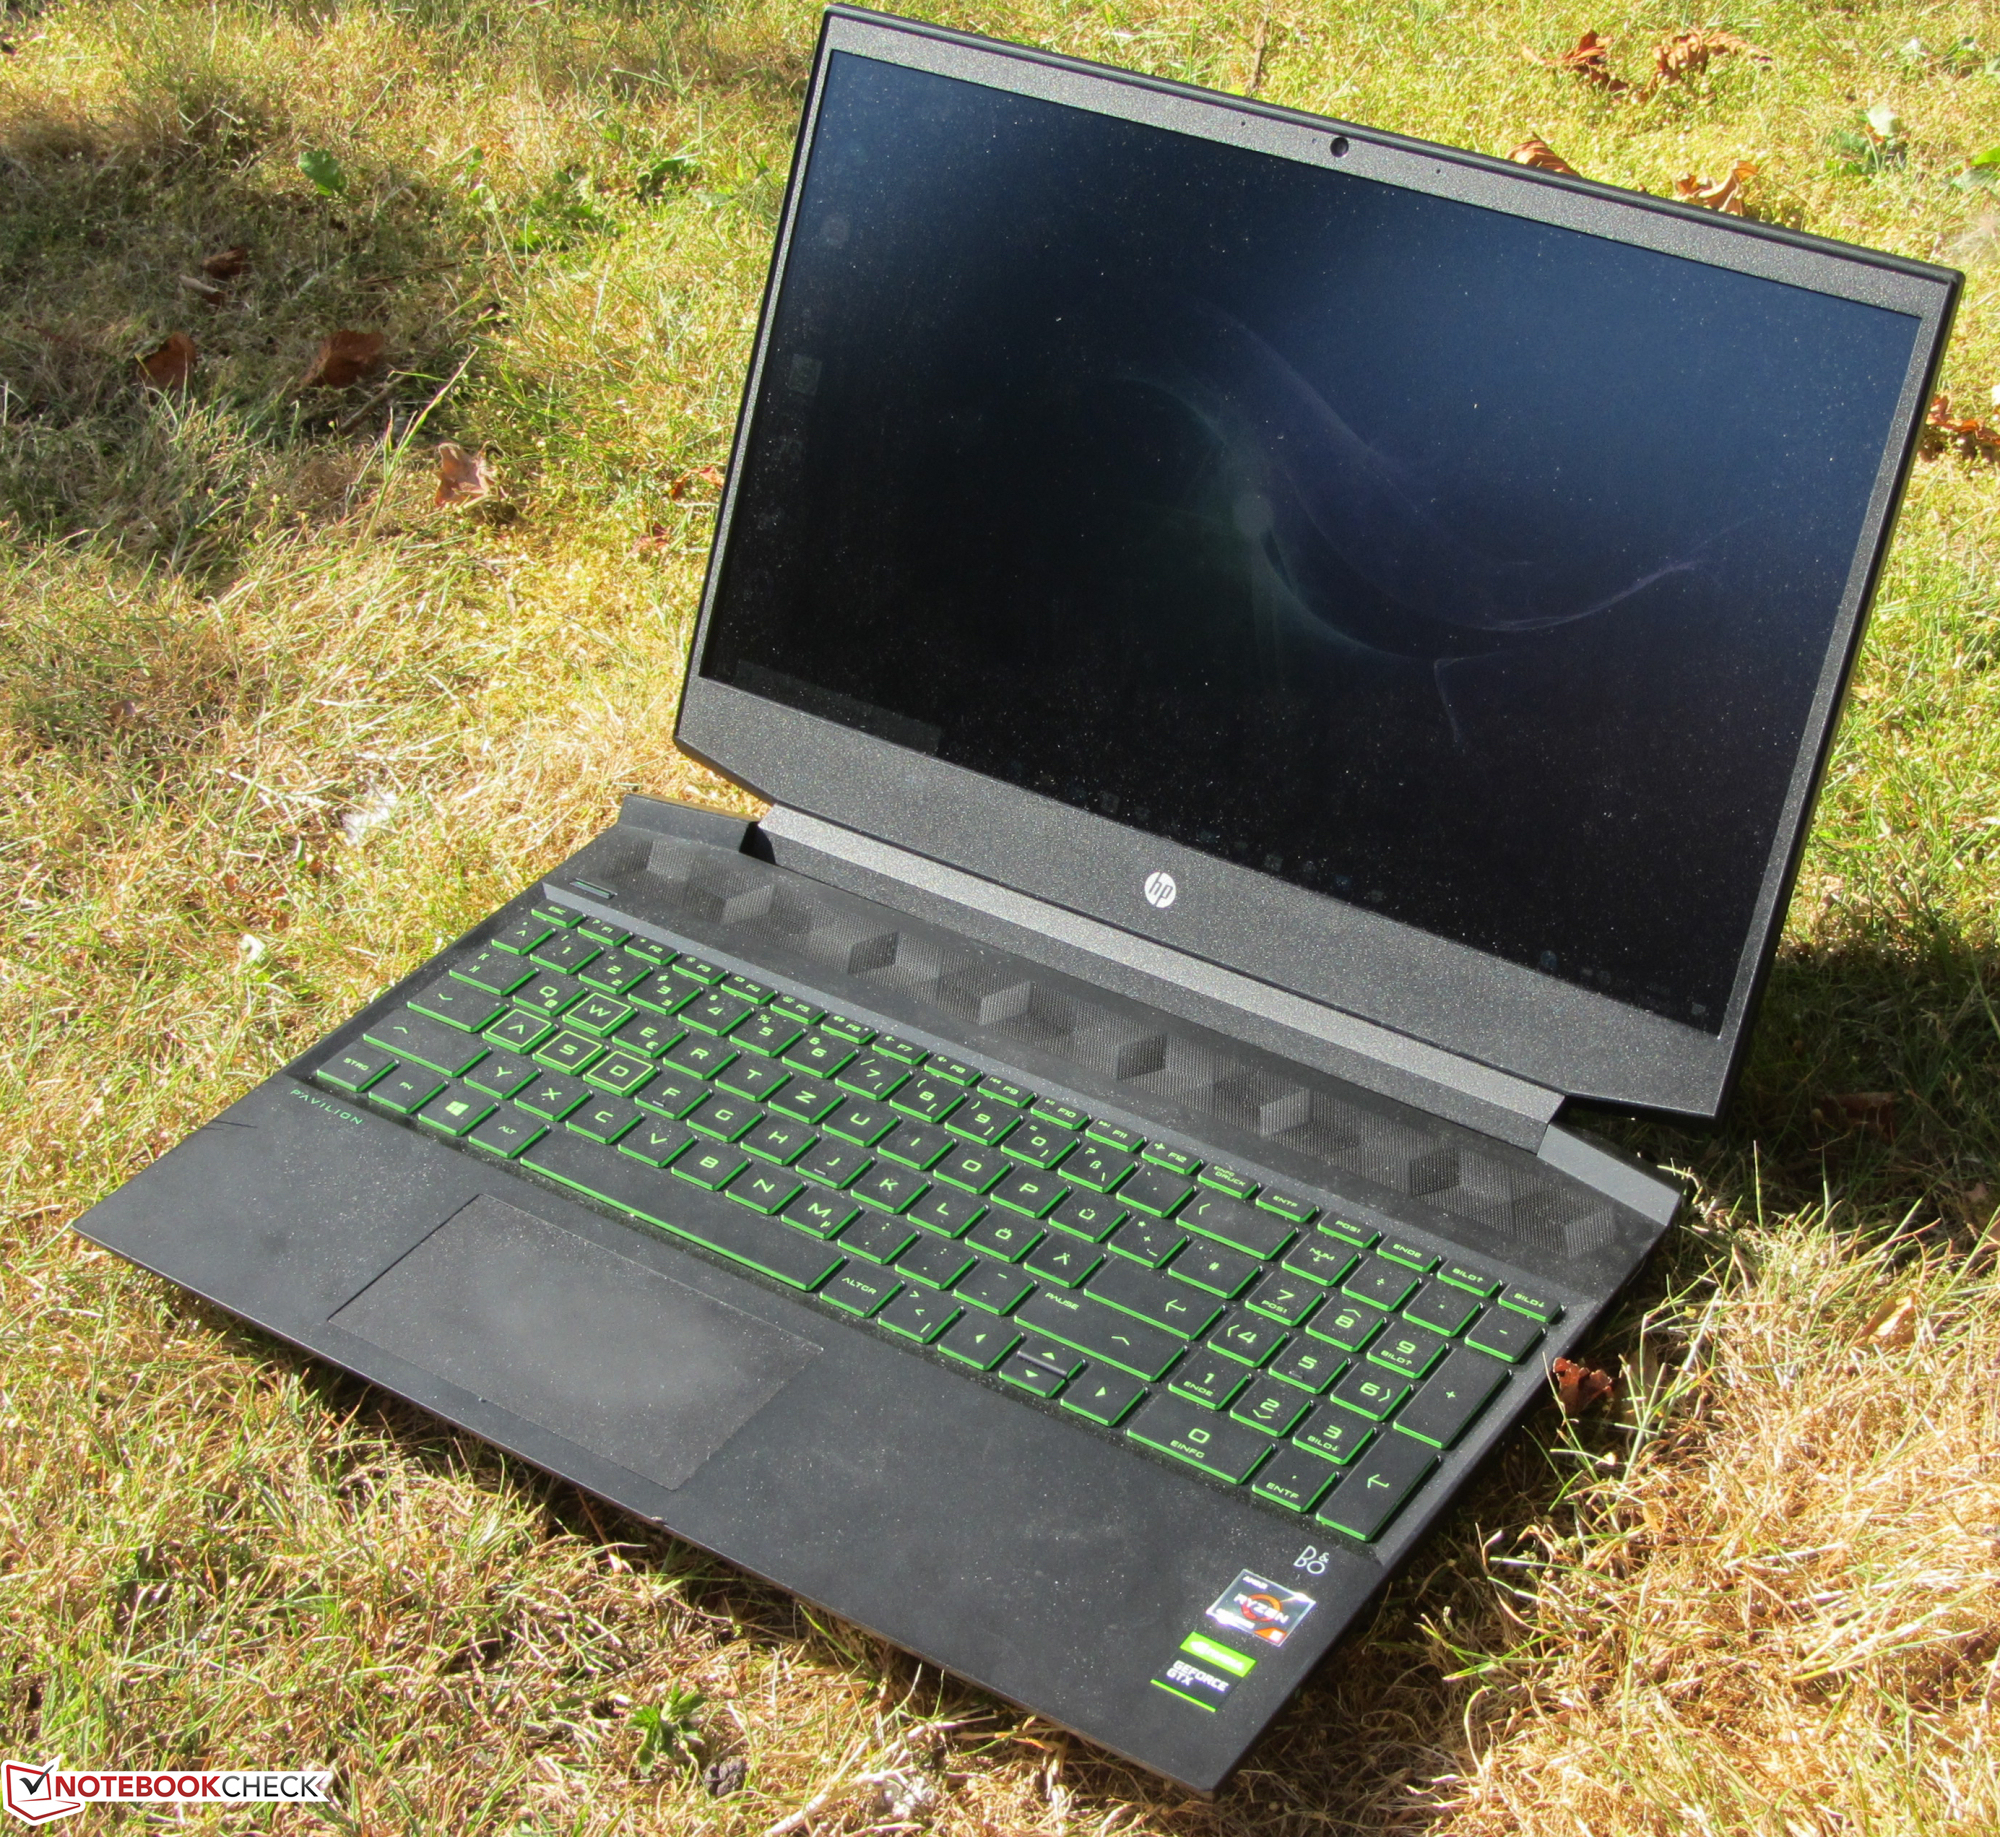
Test du HP Pavilion Gaming 15 (Ryzen 7 4800H, GTX 1660 Ti Max-Q, FHD, 144 Hz) : PC de jeu à petit prix mais puissant
Note | Date | Modèle | Poids | Épaisseur | Taille | Résolution | Prix |
|---|---|---|---|---|---|---|---|
| 81.1 % v7 (old) | 10/20 | HP Pavilion Gaming 15-ec1177ng R7 4800H, GeForce GTX 1660 Ti Max-Q | 2 kg | 23.5 mm | 15.60" | 1920x1080 | |
| 81.6 % v7 (old) | 09/20 | Dell G3 15 3500-G4DG2 i7-10750H, GeForce RTX 2060 Mobile | 2.3 kg | 22 mm | 15.60" | 1920x1080 | |
| 79.8 % v7 (old) | 08/20 | Acer Nitro 5 AN515-44-R5FT R5 4600H, GeForce GTX 1650 Ti Mobile | 2.2 kg | 24 mm | 15.60" | 1920x1080 | |
| 82.7 % v7 (old) | Asus TUF Gaming A15 FA506IV-HN172 R7 4800H, GeForce RTX 2060 Mobile | 2.2 kg | 24.9 mm | 15.60" | 1920x1080 | ||
| 78.4 % v7 (old) | 08/20 | Lenovo IdeaPad Gaming 3i 15IMH05 i5-10300H, GeForce GTX 1650 Mobile | 2.2 kg | 24.9 mm | 15.60" | 1920x1080 |
Port configuration
| SD Card Reader | |
| average JPG Copy Test (av. of 3 runs) | |
| Moyenne de la classe Gaming (20.9 - 210, n=54, 2 dernières années) | |
| HP Pavilion Gaming 15-ec1206ng (Toshiba Exceria Pro SDXC 64 GB UHS-II) | |
| HP Pavilion Gaming 15-ec1177ng (Toshiba Exceria Pro SDXC 64 GB UHS-II) | |
| HP Pavilion Gaming 15-ec0017ng (Toshiba Exceria Pro SDXC 64 GB UHS-II) | |
| HP Pavilion Gaming 15-ec0002ng (Toshiba Exceria Pro SDXC 64 GB UHS-II) | |
| Dell G3 15 3500-G4DG2 (Toshiba Exceria Pro SDXC 64 GB UHS-II) | |
| maximum AS SSD Seq Read Test (1GB) | |
| Moyenne de la classe Gaming (25.5 - 261, n=51, 2 dernières années) | |
| HP Pavilion Gaming 15-ec0017ng (Toshiba Exceria Pro SDXC 64 GB UHS-II) | |
| HP Pavilion Gaming 15-ec0002ng (Toshiba Exceria Pro SDXC 64 GB UHS-II) | |
| HP Pavilion Gaming 15-ec1177ng (Toshiba Exceria Pro SDXC 64 GB UHS-II) | |
| HP Pavilion Gaming 15-ec1206ng (Toshiba Exceria Pro SDXC 64 GB UHS-II) | |
| Dell G3 15 3500-G4DG2 (Toshiba Exceria Pro SDXC 64 GB UHS-II) | |


| |||||||||||||||||||||||||
Homogénéité de la luminosité: 84 %
Valeur mesurée au centre, sur batterie: 365 cd/m²
Contraste: 1962:1 (Valeurs des noirs: 0.185 cd/m²)
ΔE ColorChecker Calman: 2.69 | ∀{0.5-29.43 Ø4.71}
calibrated: 1.7
ΔE Greyscale Calman: 2.77 | ∀{0.09-98 Ø4.96}
92.8% sRGB (Argyll 1.6.3 3D)
60.3% AdobeRGB 1998 (Argyll 1.6.3 3D)
65.9% AdobeRGB 1998 (Argyll 3D)
93.1% sRGB (Argyll 3D)
64.9% Display P3 (Argyll 3D)
Gamma: 2.56
CCT: 6385 K
| HP Pavilion Gaming 15-ec1177ng LG Philips LP156WFG-SPK1, IPS, 1920x1080, 15.6" | Dell G3 15 3500-G4DG2 AU Optronics AUO80ED, IPS, 1920x1080, 15.6" | Acer Nitro 5 AN515-44-R5FT Panda LM156LF-2F01 (NCP004D), IPS, 1920x1080, 15.6" | Asus TUF Gaming A15 FA506IV-HN172 LM156LF-2F01, IPS, 1920x1080, 15.6" | Lenovo IdeaPad Gaming 3i 15IMH05 BOE CQ NV156FHM-NX1, IPS, 1920x1080, 15.6" | Asus ROG Strix G15 G512LI Panda LM156LF-2F01, IPS, 1920x1080, 15.6" | HP Pavilion Gaming 15-ec1206ng Chi Mei CMN150D, IPS, 1920x1080, 15.6" | HP Pavilion Gaming 15-ec0002ng Chi Mei N156HGA-EA3, TN LED, 1920x1080, 15.6" | HP Pavilion Gaming 15-ec0017ng AU Optronics B156HAK02.0, IPS, 1920x1080, 15.6" | |
|---|---|---|---|---|---|---|---|---|---|
| Display | 1% | -35% | -39% | -40% | -38% | -35% | -35% | -3% | |
| Display P3 Coverage (%) | 64.9 | 64.6 0% | 41.16 -37% | 38.92 -40% | 38.04 -41% | 39.73 -39% | 41.36 -36% | 41.22 -36% | 62.8 -3% |
| sRGB Coverage (%) | 93.1 | 93.9 1% | 61.8 -34% | 58.5 -37% | 56.6 -39% | 59.8 -36% | 62 -33% | 61.8 -34% | 89.2 -4% |
| AdobeRGB 1998 Coverage (%) | 65.9 | 66.4 1% | 42.56 -35% | 40.22 -39% | 39.3 -40% | 41.06 -38% | 42.76 -35% | 42.62 -35% | 63.8 -3% |
| Response Times | 20% | -164% | -116% | -56% | -131% | -107% | -106% | -157% | |
| Response Time Grey 50% / Grey 80% * (ms) | 16 ? | 14 ? 12% | 40.8 ? -155% | 34 ? -113% | 25 ? -56% | 33.6 ? -110% | 33.6 ? -110% | 44 ? -175% | 40 ? -150% |
| Response Time Black / White * (ms) | 11 ? | 8 ? 27% | 30 ? -173% | 24 ? -118% | 17 ? -55% | 27.6 ? -151% | 22.4 ? -104% | 15 ? -36% | 29 ? -164% |
| PWM Frequency (Hz) | 24750 ? | 250 ? | |||||||
| Screen | -28% | -55% | -66% | -89% | -79% | -23% | -107% | -33% | |
| Brightness middle (cd/m²) | 363 | 301 -17% | 287 -21% | 280 -23% | 305 -16% | 271.2 -25% | 277 -24% | 233 -36% | 302 -17% |
| Brightness (cd/m²) | 327 | 298 -9% | 271 -17% | 254 -22% | 294 -10% | 252 -23% | 248 -24% | 211 -35% | 291 -11% |
| Brightness Distribution (%) | 84 | 81 -4% | 88 5% | 88 5% | 70 -17% | 79 -6% | 83 -1% | 82 -2% | 84 0% |
| Black Level * (cd/m²) | 0.185 | 0.23 -24% | 0.25 -35% | 0.15 19% | 0.405 -119% | 0.53 -186% | 0.16 14% | 0.405 -119% | 0.25 -35% |
| Contrast (:1) | 1962 | 1309 -33% | 1148 -41% | 1867 -5% | 753 -62% | 512 -74% | 1731 -12% | 575 -71% | 1208 -38% |
| Colorchecker dE 2000 * | 2.69 | 4.68 -74% | 4.77 -77% | 5.89 -119% | 6.01 -123% | 5.04 -87% | 3.6 -34% | 8.22 -206% | 4.84 -80% |
| Colorchecker dE 2000 max. * | 5.06 | 17.15 -239% | 19 -275% | 21.9 -333% | 16.07 -218% | 8.53 -69% | 18.6 -268% | 8.18 -62% | |
| Colorchecker dE 2000 calibrated * | 1.7 | 1.87 -10% | 3.73 -119% | 4.79 -182% | 5.12 -201% | 4.26 -151% | 2.88 -69% | 2.63 -55% | |
| Greyscale dE 2000 * | 2.77 | 5.79 -109% | 2.7 3% | 4.08 -47% | 3.23 -17% | 3.4 -23% | 1.75 37% | 10.13 -266% | 4.31 -56% |
| Gamma | 2.56 86% | 2.46 89% | 2.115 104% | 2.33 94% | 2.43 91% | 2.09 105% | 2.23 99% | 2.27 97% | 2.56 86% |
| CCT | 6385 102% | 7706 84% | 7187 90% | 7303 89% | 6818 95% | 7079 92% | 6695 97% | 11323 57% | 7318 89% |
| Color Space (Percent of AdobeRGB 1998) (%) | 60.3 | 61 1% | 43 -29% | 37 -39% | 36 -40% | 37.8 -37% | 39 -35% | 39 -35% | 58 -4% |
| Color Space (Percent of sRGB) (%) | 92.8 | 94 1% | 61 -34% | 58 -37% | 56 -40% | 59.5 -36% | 62 -33% | 62 -33% | 89 -4% |
| Moyenne finale (programmes/paramètres) | -2% /
-16% | -85% /
-65% | -74% /
-67% | -62% /
-76% | -83% /
-78% | -55% /
-36% | -83% /
-92% | -64% /
-43% |
* ... Moindre est la valeur, meilleures sont les performances
Temps de réponse de l'écran
| ↔ Temps de réponse noir à blanc | ||
|---|---|---|
| 11 ms ... hausse ↗ et chute ↘ combinées | ↗ 7 ms hausse | 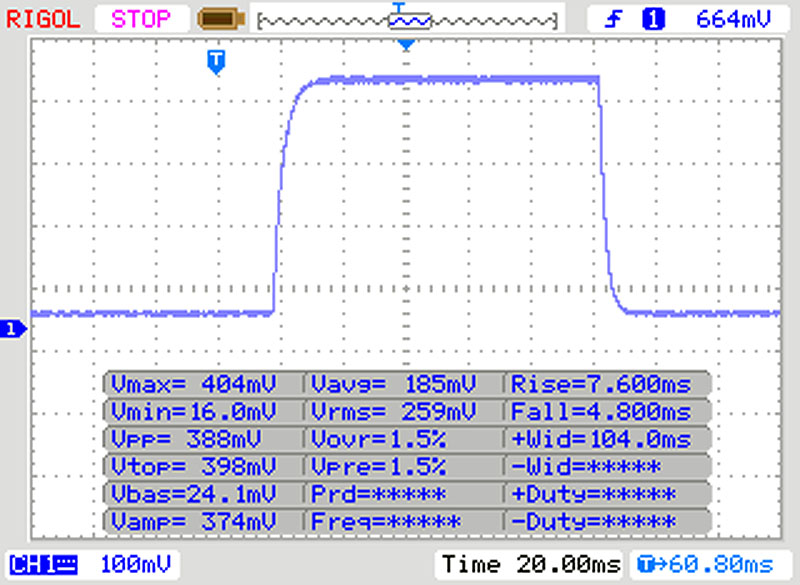 |
| ↘ 4 ms chute | ||
| L'écran montre de bons temps de réponse, mais insuffisant pour du jeu compétitif. En comparaison, tous les appareils testés affichent entre 0.1 (minimum) et 240 (maximum) ms. » 30 % des appareils testés affichent de meilleures performances. Cela signifie que les latences relevées sont meilleures que la moyenne (19.8 ms) de tous les appareils testés. | ||
| ↔ Temps de réponse gris 50% à gris 80% | ||
| 16 ms ... hausse ↗ et chute ↘ combinées | ↗ 9 ms hausse | 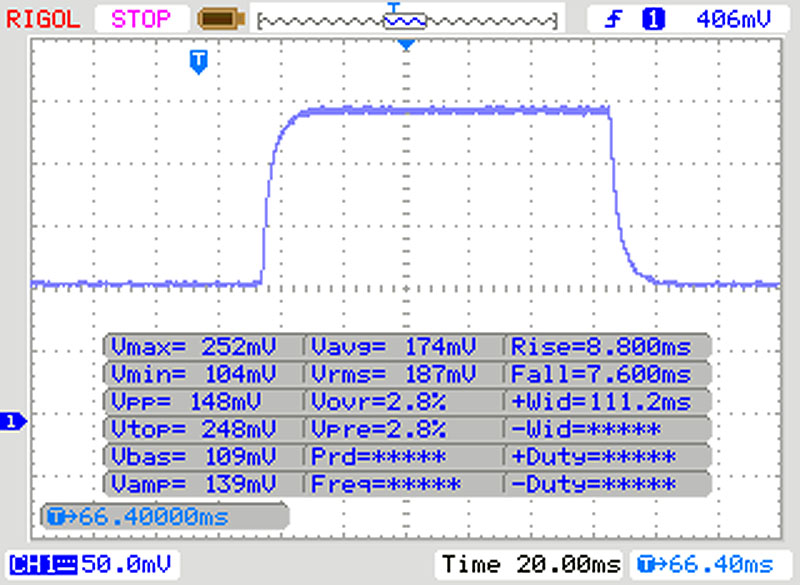 |
| ↘ 7 ms chute | ||
| L'écran montre de bons temps de réponse, mais insuffisant pour du jeu compétitif. En comparaison, tous les appareils testés affichent entre 0.165 (minimum) et 636 (maximum) ms. » 30 % des appareils testés affichent de meilleures performances. Cela signifie que les latences relevées sont meilleures que la moyenne (30.9 ms) de tous les appareils testés. | ||
Scintillement / MLI (Modulation de largeur d'impulsion)
| Scintillement / MLI (Modulation de largeur d'impulsion) non décelé | 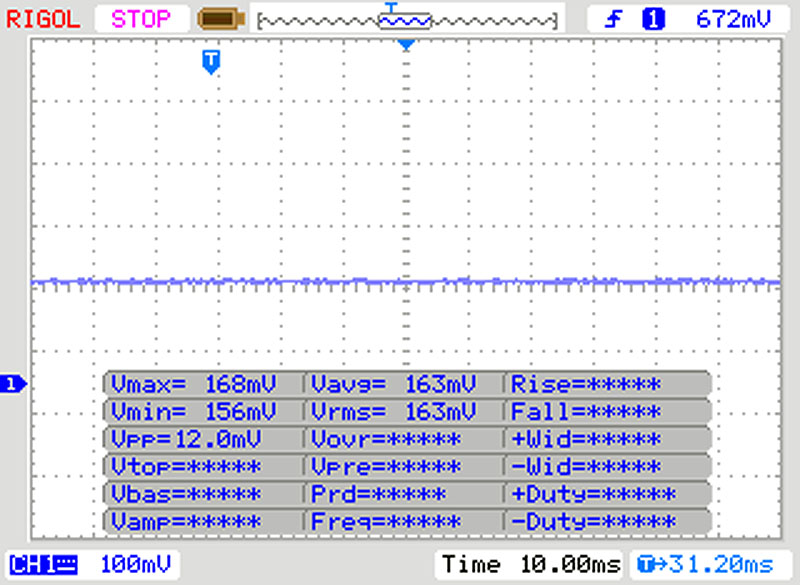 | ||
En comparaison, 52 % des appareils testés n'emploient pas MDI pour assombrir leur écran. Nous avons relevé une moyenne à 7741 (minimum : 5 - maximum : 343500) Hz dans le cas où une MDI était active. | |||
| HWBOT x265 Benchmark v2.2 - 4k Preset | |
| Moyenne de la classe Gaming (11.5 - 44.4, n=102, 2 dernières années) | |
| HP Pavilion Gaming 15-ec1177ng | |
| Moyenne AMD Ryzen 7 4800H (10.8 - 14.1, n=16) | |
| Asus TUF Gaming A15 FA506IV-HN172 | |
| HP Pavilion Gaming 15-ec1206ng | |
| Asus ROG Strix G15 G512LI | |
| Acer Nitro 5 AN515-44-R5FT | |
| Dell G3 15 3500-G4DG2 | |
| Lenovo IdeaPad Gaming 3i 15IMH05 | |
| LibreOffice - 20 Documents To PDF | |
| HP Pavilion Gaming 15-ec1206ng | |
| HP Pavilion Gaming 15-ec1177ng | |
| Acer Nitro 5 AN515-44-R5FT | |
| Moyenne AMD Ryzen 7 4800H (28.6 - 95.8, n=14) | |
| Dell G3 15 3500-G4DG2 | |
| Lenovo IdeaPad Gaming 3i 15IMH05 | |
| Moyenne de la classe Gaming (33.2 - 88.8, n=102, 2 dernières années) | |
| Asus ROG Strix G15 G512LI | |
| Asus TUF Gaming A15 FA506IV-HN172 | |
| R Benchmark 2.5 - Overall mean | |
| Dell G3 15 3500-G4DG2 | |
| Lenovo IdeaPad Gaming 3i 15IMH05 | |
| Acer Nitro 5 AN515-44-R5FT | |
| Asus ROG Strix G15 G512LI | |
| HP Pavilion Gaming 15-ec1206ng | |
| Asus TUF Gaming A15 FA506IV-HN172 | |
| Moyenne AMD Ryzen 7 4800H (0.562 - 0.603, n=15) | |
| HP Pavilion Gaming 15-ec1177ng | |
| Moyenne de la classe Gaming (0.3439 - 0.59, n=102, 2 dernières années) | |
* ... Moindre est la valeur, meilleures sont les performances
| PCMark 8 Home Score Accelerated v2 | 4805 points | |
| PCMark 8 Creative Score Accelerated v2 | 5920 points | |
| PCMark 8 Work Score Accelerated v2 | 5580 points | |
| PCMark 10 Score | 5602 points | |
Aide | ||
| PCMark 8 - Home Score Accelerated v2 | |
| Moyenne de la classe Gaming (n=12 dernières années) | |
| HP Pavilion Gaming 15-ec1177ng | |
| Moyenne AMD Ryzen 7 4800H, NVIDIA GeForce GTX 1660 Ti Max-Q (n=1) | |
| Asus TUF Gaming A15 FA506IV-HN172 | |
| Asus ROG Strix G15 G512LI | |
| HP Pavilion Gaming 15-ec1206ng | |
| HP Pavilion Gaming 15-ec0017ng | |
| Lenovo IdeaPad Gaming 3i 15IMH05 | |
| HP Pavilion Gaming 15-ec0002ng | |
| DPC Latencies / LatencyMon - interrupt to process latency (max), Web, Youtube, Prime95 | |
| Dell G3 15 3500-G4DG2 | |
| Asus ROG Strix G15 G512LI | |
| Acer Nitro 5 AN515-44-R5FT | |
| Asus TUF Gaming A15 FA506IV-HN172 | |
| HP Pavilion Gaming 15-ec1177ng | |
| Lenovo IdeaPad Gaming 3i 15IMH05 | |
| HP Pavilion Gaming 15-ec1206ng | |
* ... Moindre est la valeur, meilleures sont les performances

| HP Pavilion Gaming 15-ec1177ng Intel SSD 660p SSDPEKNW512G8 | Dell G3 15 3500-G4DG2 SK Hynix BC511 HFM512GDJTNI | Acer Nitro 5 AN515-44-R5FT SK Hynix BC511 HFM512GDJTNI | Asus TUF Gaming A15 FA506IV-HN172 Kingston OM8PCP3512F-AB | Lenovo IdeaPad Gaming 3i 15IMH05 SK hynix BC511 HFM512GDHTNI-87A0B | Asus ROG Strix G15 G512LI Intel SSD 660p SSDPEKNW512G8 | HP Pavilion Gaming 15-ec1206ng Toshiba KBG40ZNV512G | HP Pavilion Gaming 15-ec0002ng Intel SSD 660p SSDPEKNW512G8 | HP Pavilion Gaming 15-ec0017ng WDC PC SN720 SDAPNTW-256G | Moyenne Intel SSD 660p SSDPEKNW512G8 | Moyenne de la classe Gaming | |
|---|---|---|---|---|---|---|---|---|---|---|---|
| CrystalDiskMark 5.2 / 6 | -4% | 0% | 15% | 1% | -4% | 16% | -3% | 23% | -1% | 176% | |
| Write 4K (MB/s) | 110 | 99.6 -9% | 94.7 -14% | 219.8 100% | 130 18% | 125.4 14% | 111.5 1% | 136.9 24% | 148 35% | 136 ? 24% | 199 ? 81% |
| Read 4K (MB/s) | 52.8 | 38.8 -27% | 38.91 -26% | 50.2 -5% | 44.44 -16% | 52.7 0% | 38.17 -28% | 57 8% | 43.73 -17% | 55.2 ? 5% | 78.5 ? 49% |
| Write Seq (MB/s) | 983 | 1117 14% | 1056 7% | 979 0% | 1059 8% | 943 -4% | 1515 54% | 968 -2% | 1617 64% | 926 ? -6% | 3730 ? 279% |
| Read Seq (MB/s) | 1608 | 1030 -36% | 1183 -26% | 1990 24% | 1105 -31% | 1383 -14% | 1576 -2% | 1631 1% | 1753 9% | 1523 ? -5% | 3597 ? 124% |
| Write 4K Q32T1 (MB/s) | 461.3 | 445.2 -3% | 445.3 -3% | 516 12% | 490.3 6% | 437.9 -5% | 365.4 -21% | 237 -49% | 246.3 -47% | 380 ? -18% | 616 ? 34% |
| Read 4K Q32T1 (MB/s) | 345.4 | 331.8 -4% | 477.7 38% | 298.3 -14% | 309.2 -10% | 334.9 -3% | 504 46% | 337.1 -2% | 368 7% | 334 ? -3% | 711 ? 106% |
| Write Seq Q32T1 (MB/s) | 982 | 1102 12% | 1063 8% | 982 0% | 1053 7% | 960 -2% | 1493 52% | 963 -2% | 1618 65% | 987 ? 1% | 5323 ? 442% |
| Read Seq Q32T1 (MB/s) | 1820 | 2227 22% | 2154 18% | 1907 5% | 2261 24% | 1530 -16% | 2340 29% | 1863 2% | 3027 66% | 1744 ? -4% | 7102 ? 290% |
| Write 4K Q8T8 (MB/s) | 981 | 810 ? | 1308 ? | ||||||||
| Read 4K Q8T8 (MB/s) | 300.9 | 344 ? | 1647 ? | ||||||||
| AS SSD | 10% | 22% | 7% | 13% | -17% | 7% | -40% | 12% | -7% | 204% | |
| Seq Read (MB/s) | 1553 | 1305 -16% | 1504 -3% | 1682 8% | 1348 -13% | 1157 -25% | 2048 32% | 1623 5% | 2607 68% | 1423 ? -8% | 5592 ? 260% |
| Seq Write (MB/s) | 868 | 767 -12% | 1064 23% | 904 4% | 1000 15% | 675 -22% | 1039 20% | 891 3% | 1518 75% | 828 ? -5% | 3960 ? 356% |
| 4K Read (MB/s) | 56.6 | 41.84 -26% | 51.5 -9% | 60.2 6% | 48.04 -15% | 49.99 -12% | 52.8 -7% | 48.06 -15% | 39.16 -31% | 51.3 ? -9% | 71.1 ? 26% |
| 4K Write (MB/s) | 153.6 | 90.1 -41% | 123.2 -20% | 164.8 7% | 103.3 -33% | 114 -26% | 146 -5% | 102.1 -34% | 104.9 -32% | 128.9 ? -16% | 215 ? 40% |
| 4K-64 Read (MB/s) | 325.3 | 773 138% | 703 116% | 472.5 45% | 755 132% | 322.2 -1% | 1285 295% | 325.6 0% | 513 58% | 326 ? 0% | 1623 ? 399% |
| 4K-64 Write (MB/s) | 762 | 711 -7% | 730 -4% | 845 11% | 749 -2% | 759 0% | 758 -1% | 94.1 -88% | 416.7 -45% | 721 ? -5% | 2938 ? 286% |
| Access Time Read * (ms) | 0.07 | 0.09 -29% | 0.064 9% | 0.087 -24% | 0.061 13% | 0.07 -0% | 0.155 -121% | 0.171 -144% | 0.076 -9% | 0.09003 ? -29% | 0.06395 ? 9% |
| Access Time Write * (ms) | 0.046 | 0.04 13% | 0.031 33% | 0.02 57% | 0.036 22% | 0.137 -198% | 0.202 -339% | 0.048 -4% | 0.037 20% | 0.07378 ? -60% | 0.03797 ? 17% |
| Score Read (Points) | 537 | 945 76% | 905 69% | 701 31% | 938 75% | 488 -9% | 1543 187% | 536 0% | 813 51% | 519 ? -3% | 2253 ? 320% |
| Score Write (Points) | 1002 | 878 -12% | 960 -4% | 1101 10% | 952 -5% | 940 -6% | 1008 1% | 285 -72% | 673 -33% | 932 ? -7% | 3548 ? 254% |
| Score Total (Points) | 1802 | 2290 27% | 2321 29% | 2143 19% | 2365 31% | 1673 -7% | 3298 83% | 1077 -40% | 1858 3% | 1708 ? -5% | 6881 ? 282% |
| Copy ISO MB/s (MB/s) | 1301 | 675 -48% | 749 -42% | 939 -28% | 691 -47% | 566 -56% | 1639 26% | 1109 ? -15% | 3192 ? 145% | ||
| Copy Program MB/s (MB/s) | 313.7 | 248.4 -21% | 342.5 9% | 489.9 56% | 345.8 10% | 223.8 -29% | 284.2 -9% | 468 ? 49% | 989 ? 215% | ||
| Copy Game MB/s (MB/s) | 621 | 535 -14% | 571 -8% | 895 44% | 517 -17% | 104.3 -83% | 767 24% | 760 ? 22% | 2134 ? 244% | ||
| Moyenne finale (programmes/paramètres) | 3% /
4% | 11% /
13% | 11% /
10% | 7% /
8% | -11% /
-12% | 12% /
10% | -22% /
-26% | 18% /
16% | -4% /
-4% | 190% /
194% |
* ... Moindre est la valeur, meilleures sont les performances
Continuous load read: DiskSpd Read Loop, Queue Depth 8
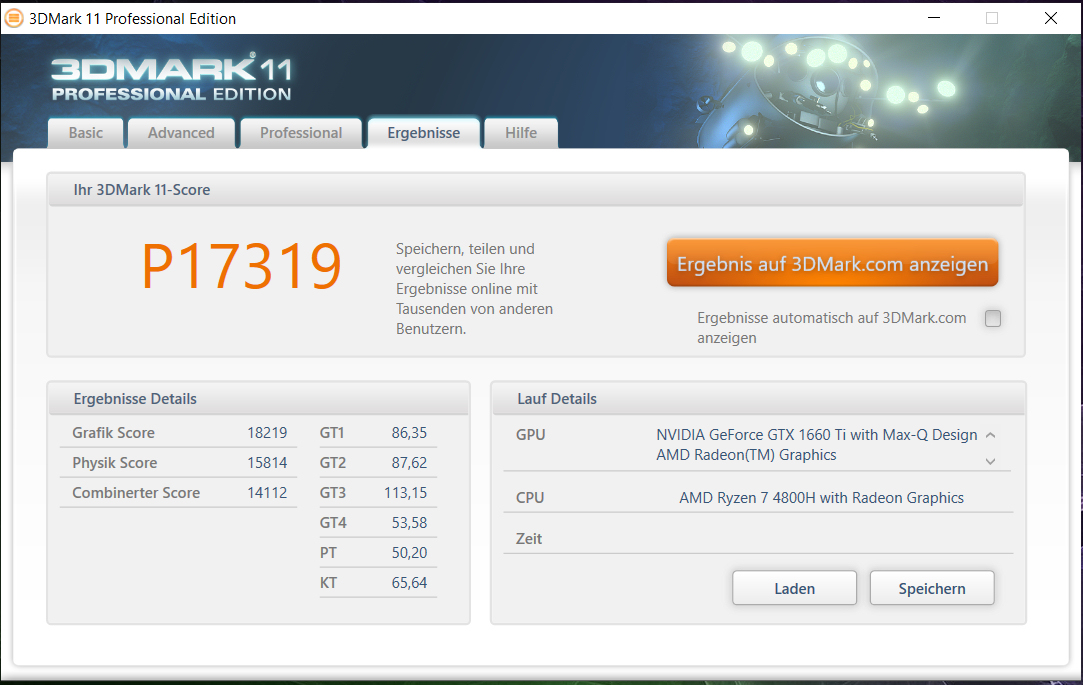
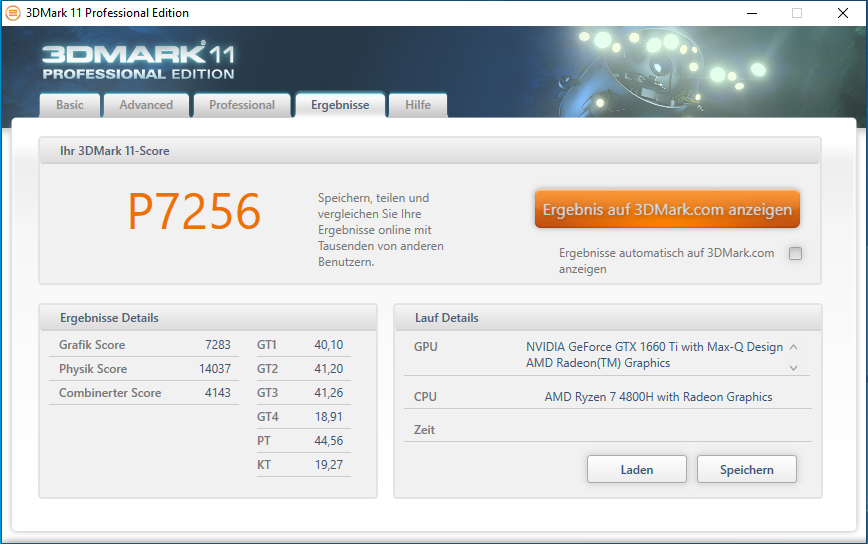
| 3DMark 11 Performance | 17319 points | |
| 3DMark Cloud Gate Standard Score | 39942 points | |
| 3DMark Fire Strike Score | 12487 points | |
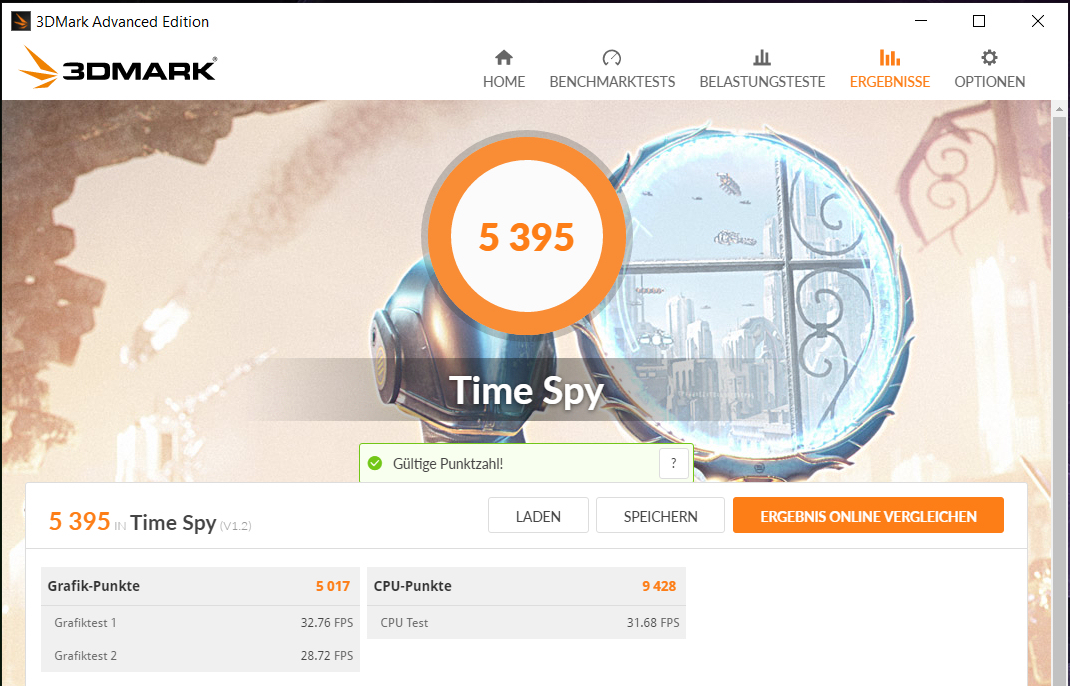
| 3DMark Time Spy Score | 6395 points | |
Aide | ||
| The Witcher 3 - 1920x1080 Ultra Graphics & Postprocessing (HBAO+) | |
| Moyenne de la classe Gaming (104.7 - 240, n=7, 2 dernières années) | |
| Asus TUF Gaming A15 FA506IV-HN172 | |
| HP Pavilion Gaming 15-ec1177ng | |
| HP Pavilion Gaming 15-ec0017ng | |
| Dell G3 15 3500-G4DG2 | |
| Moyenne NVIDIA GeForce GTX 1660 Ti Max-Q (44.8 - 53.2, n=7) | |
| Asus ROG Strix G15 G512LI | |
| HP Pavilion Gaming 15-ec1206ng | |
| Acer Nitro 5 AN515-44-R5FT | |
| Lenovo IdeaPad Gaming 3i 15IMH05 | |
| HP Pavilion Gaming 15-ec0002ng | |
| BioShock Infinite - 1920x1080 Ultra Preset, DX11 (DDOF) | |
| HP Pavilion Gaming 15-ec1177ng | |
| Asus TUF Gaming A15 FA506IV-HN172 | |
| Moyenne NVIDIA GeForce GTX 1660 Ti Max-Q (102.3 - 130, n=5) | |
| HP Pavilion Gaming 15-ec0017ng | |
| Lenovo IdeaPad Gaming 3i 15IMH05 | |
| HP Pavilion Gaming 15-ec1206ng | |
| HP Pavilion Gaming 15-ec0002ng | |
| Red Dead Redemption 2 - 1920x1080 High Settings | |
| HP Pavilion Gaming 15-ec1177ng | |
| Moyenne NVIDIA GeForce GTX 1660 Ti Max-Q (n=1) | |
| Acer Nitro 5 AN515-44-R5FT | |
| Lenovo IdeaPad Gaming 3i 15IMH05 | |
| HP Pavilion Gaming 15-ec0002ng | |
| Escape from Tarkov - 1920x1080 Ultra Preset | |
| HP Pavilion Gaming 15-ec1177ng | |
| Moyenne NVIDIA GeForce GTX 1660 Ti Max-Q (n=1) | |
| Lenovo IdeaPad Gaming 3i 15IMH05 | |
| Star Wars Jedi Fallen Order - 1920x1080 Epic Preset | |
| HP Pavilion Gaming 15-ec1177ng | |
| Moyenne NVIDIA GeForce GTX 1660 Ti Max-Q (n=1) | |
| Lenovo IdeaPad Gaming 3i 15IMH05 | |
| HP Pavilion Gaming 15-ec0002ng | |
| Call of Duty Modern Warfare 2019 - 1920x1080 Maximum Settings AA:T2X Filmic SM | |
| HP Pavilion Gaming 15-ec1177ng | |
| Moyenne NVIDIA GeForce GTX 1660 Ti Max-Q (n=1) | |
| Acer Nitro 5 AN515-44-R5FT | |
| Lenovo IdeaPad Gaming 3i 15IMH05 | |
| HP Pavilion Gaming 15-ec1206ng | |
| HP Pavilion Gaming 15-ec0002ng | |
| Doom Eternal - 1920x1080 Ultra Preset | |
| Dell G3 15 3500-G4DG2 | |
| HP Pavilion Gaming 15-ec1177ng | |
| Moyenne NVIDIA GeForce GTX 1660 Ti Max-Q (n=1) | |
| F1 2020 - 1920x1080 Ultra High Preset AA:T AF:16x | |
| HP Pavilion Gaming 15-ec1177ng | |
| Moyenne NVIDIA GeForce GTX 1660 Ti Max-Q (n=1) | |
| HP Pavilion Gaming 15-ec1206ng | |
| Death Stranding - 1920x1080 Very High Preset | |
| HP Pavilion Gaming 15-ec1177ng | |
| Moyenne NVIDIA GeForce GTX 1660 Ti Max-Q (n=1) | |
| HP Pavilion Gaming 15-ec1206ng | |
| Bas | Moyen | Élevé | Ultra | |
|---|---|---|---|---|
| BioShock Infinite (2013) | 263.2 | 249.5 | 226.9 | 119.2 |
| The Witcher 3 (2015) | 258.3 | 166.4 | 95.3 | 53.2 |
| Battlefield V (2018) | 152 | 102.6 | 92.2 | 85 |
| Apex Legends (2019) | 144 | 133.9 | 99.6 | 99.6 |
| Ghost Recon Breakpoint (2019) | 114 | 72 | 66 | 51 |
| Call of Duty Modern Warfare 2019 (2019) | 135.2 | 88 | 72.6 | 62.6 |
| Need for Speed Heat (2019) | 95.8 | 83 | 73.9 | 66.9 |
| Star Wars Jedi Fallen Order (2019) | 91.5 | 78.1 | 72.4 | |
| Red Dead Redemption 2 (2019) | 115.1 | 71.7 | 47.2 | 29.4 |
| Escape from Tarkov (2020) | 121.2 | 98.3 | 90.5 | 87.7 |
| Hunt Showdown (2020) | 176.8 | 81.2 | 63.3 | |
| Doom Eternal (2020) | 168.9 | 101.7 | 95.4 | 93.4 |
| Gears Tactics (2020) | 214.7 | 130.2 | 79.9 | 56.1 |
| F1 2020 (2020) | 219 | 130 | 112 | 79 |
| Death Stranding (2020) | 136.1 | 87.7 | 81.3 | 78.4 |
| Horizon Zero Dawn (2020) | 119 | 78 | 65 | 51 |
| Flight Simulator 2020 (2020) | 55.1 | 49.4 | 37.1 | 25.3 |
Degré de la nuisance sonore
| Au repos |
| 27 / 27 / 27 dB(A) |
| Fortement sollicité |
| 42.4 / 47 dB(A) |
 | ||
30 dB silencieux 40 dB(A) audible 50 dB(A) bruyant |
||
min: | ||
(±) La température maximale du côté supérieur est de 42.9 °C / 109 F, par rapport à la moyenne de 40.4 °C / 105 F, allant de 21.2 à 68.8 °C pour la classe Gaming.
(+) Le fond chauffe jusqu'à un maximum de 39.5 °C / 103 F, contre une moyenne de 43.2 °C / 110 F
(+) En utilisation inactive, la température moyenne du côté supérieur est de 25.6 °C / 78 F, par rapport à la moyenne du dispositif de 33.9 °C / 93 F.
(±) En jouant à The Witcher 3, la température moyenne du côté supérieur est de 32.5 °C / 91 F, alors que la moyenne de l'appareil est de 33.9 °C / 93 F.
(±) Les repose-poignets et le pavé tactile peuvent devenir très chauds au toucher, avec un maximum de 36.5 °C / 97.7# F.
(-) La température moyenne de la zone de l'appui-paume de dispositifs similaires était de 28.8 °C / 83.8 F (-7.7 °C / #-13.9 F).
HP Pavilion Gaming 15-ec1177ng analyse audio
(-) | haut-parleurs pas très forts (60.8 dB)
Basses 100 - 315 Hz
(-) | presque aucune basse - en moyenne 22% plus bas que la médiane
(±) | la linéarité des basses est moyenne (11.9% delta à la fréquence précédente)
Médiums 400 - 2000 Hz
(+) | médiane équilibrée - seulement 2.7% de la médiane
(±) | la linéarité des médiums est moyenne (10.9% delta à la fréquence précédente)
Aiguës 2 - 16 kHz
(+) | des sommets équilibrés - à seulement 2.3% de la médiane
(±) | la linéarité des aigus est moyenne (7.3% delta à la fréquence précédente)
Globalement 100 - 16 000 Hz
(±) | la linéarité du son global est moyenne (23.2% de différence avec la médiane)
Par rapport à la même classe
» 84% de tous les appareils testés de cette catégorie étaient meilleurs, 4% similaires, 11% pires
» Le meilleur avait un delta de 6%, la moyenne était de 18%, le pire était de 132%.
Par rapport à tous les appareils testés
» 70% de tous les appareils testés étaient meilleurs, 5% similaires, 25% pires
» Le meilleur avait un delta de 4%, la moyenne était de 23%, le pire était de 134%.
| Éteint/en veille | |
| Au repos | |
| Fortement sollicité |
|
Légende:
min: | |
Points positifs
Points négatifs

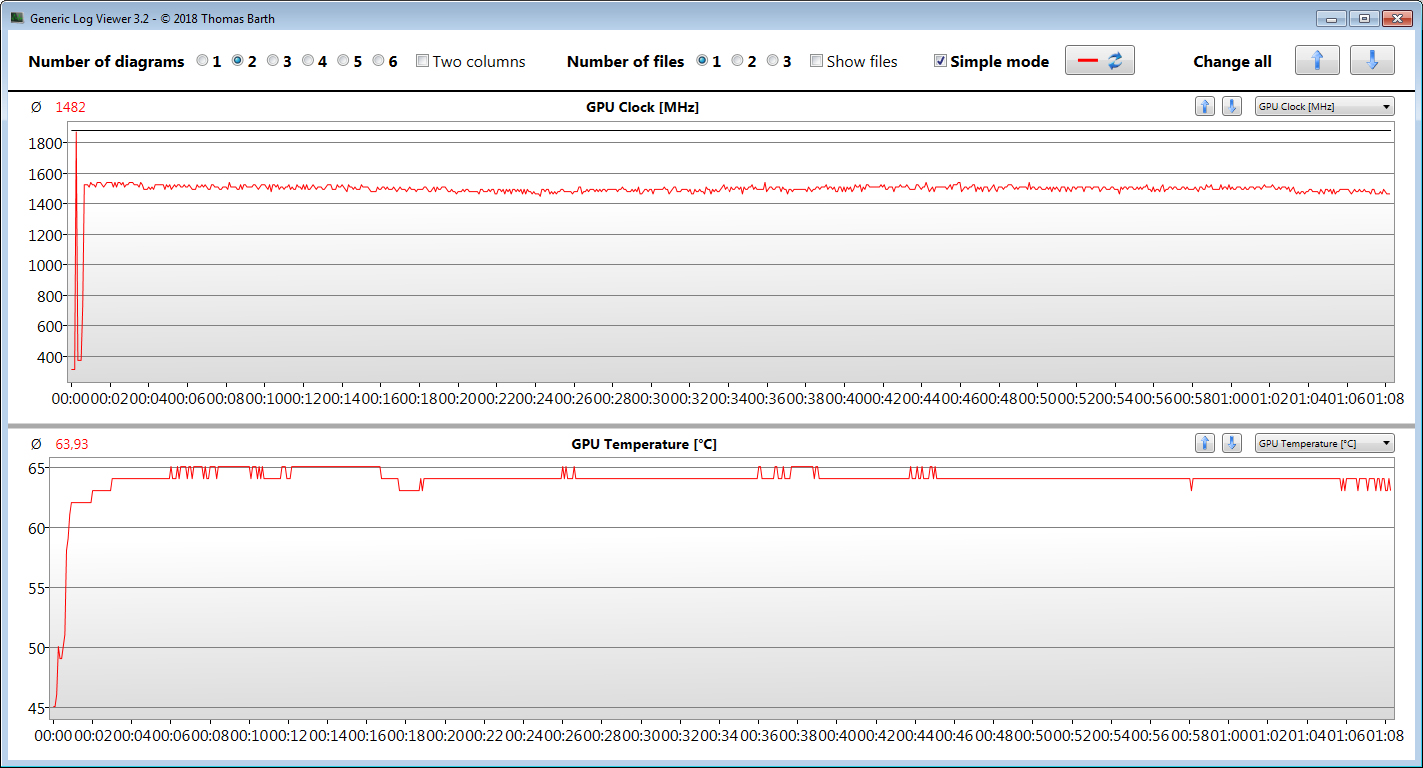
Grâce à l'APU Ryzen 7 4800H et à la carte graphique GeForce GTX 1660 Ti Max-Q, le Pavilion Gaming permet de jouer à tous les deniers jeux de façon fluide, la plupart du temps en Full HD et avec une qualité élevée ou maximale.
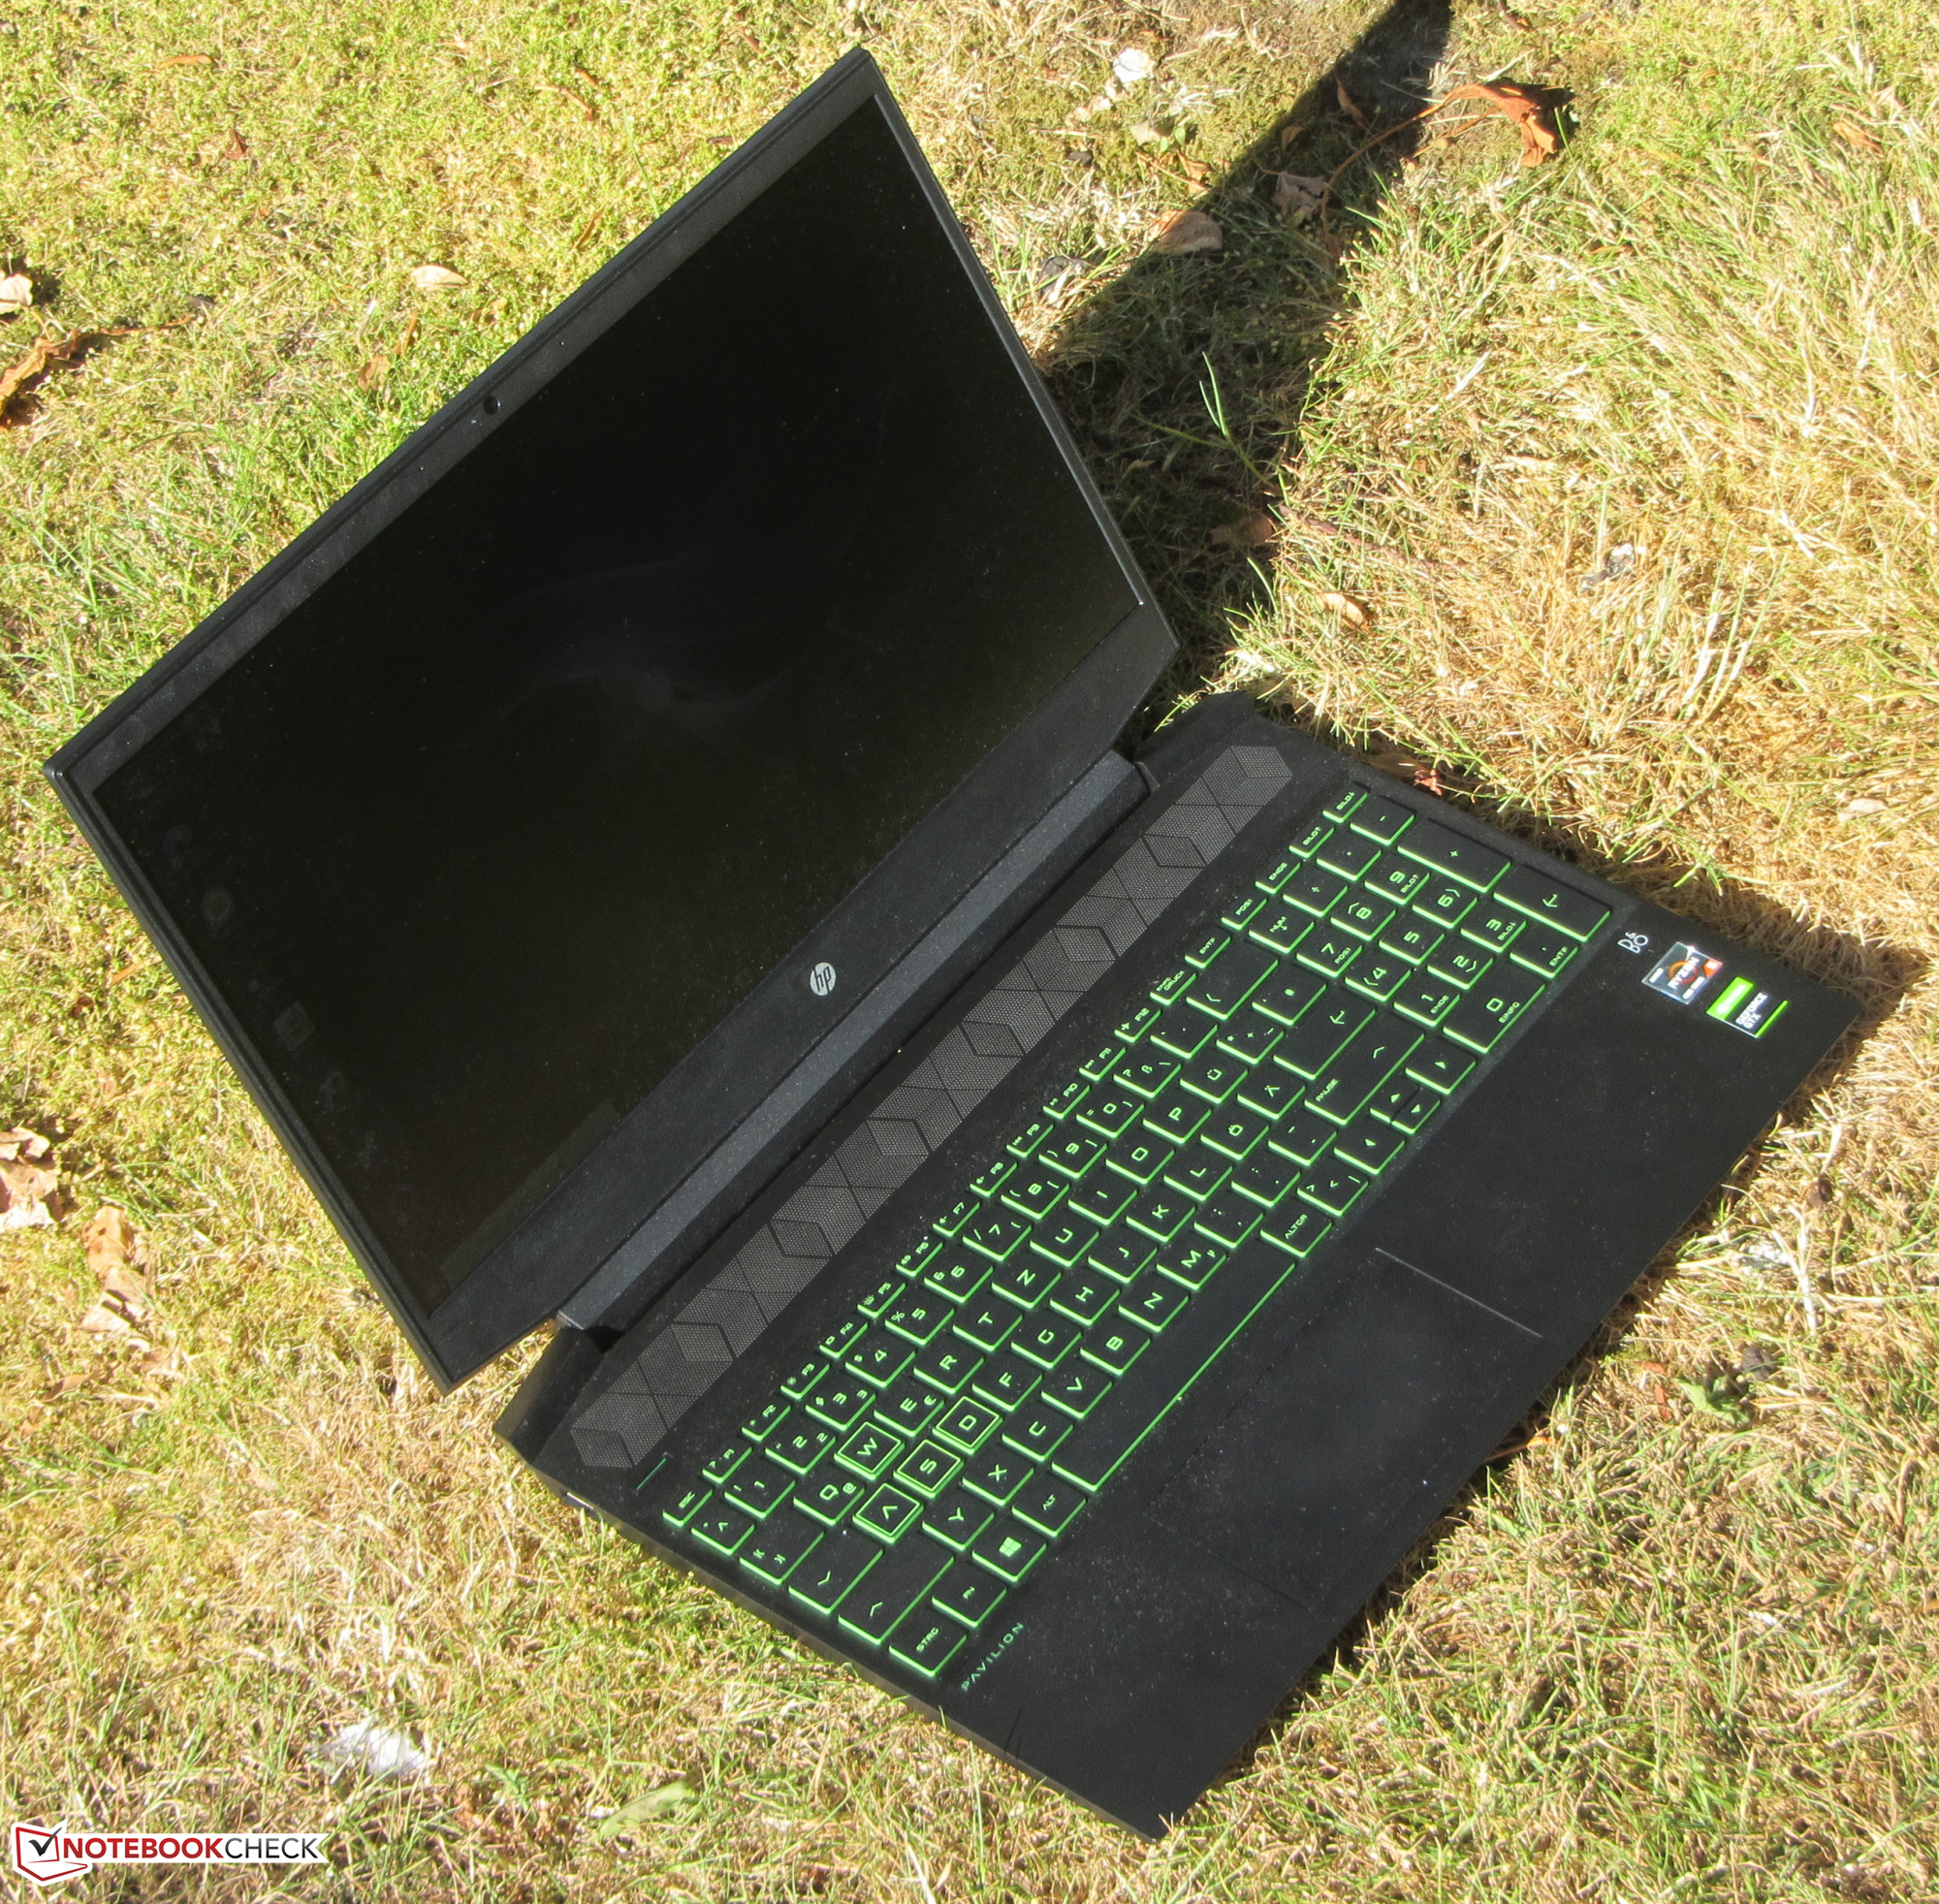
Le modèle le plus haut de gamme de la série Pavilion Gaming 15 fournit de belles performances pour un prix attractif.
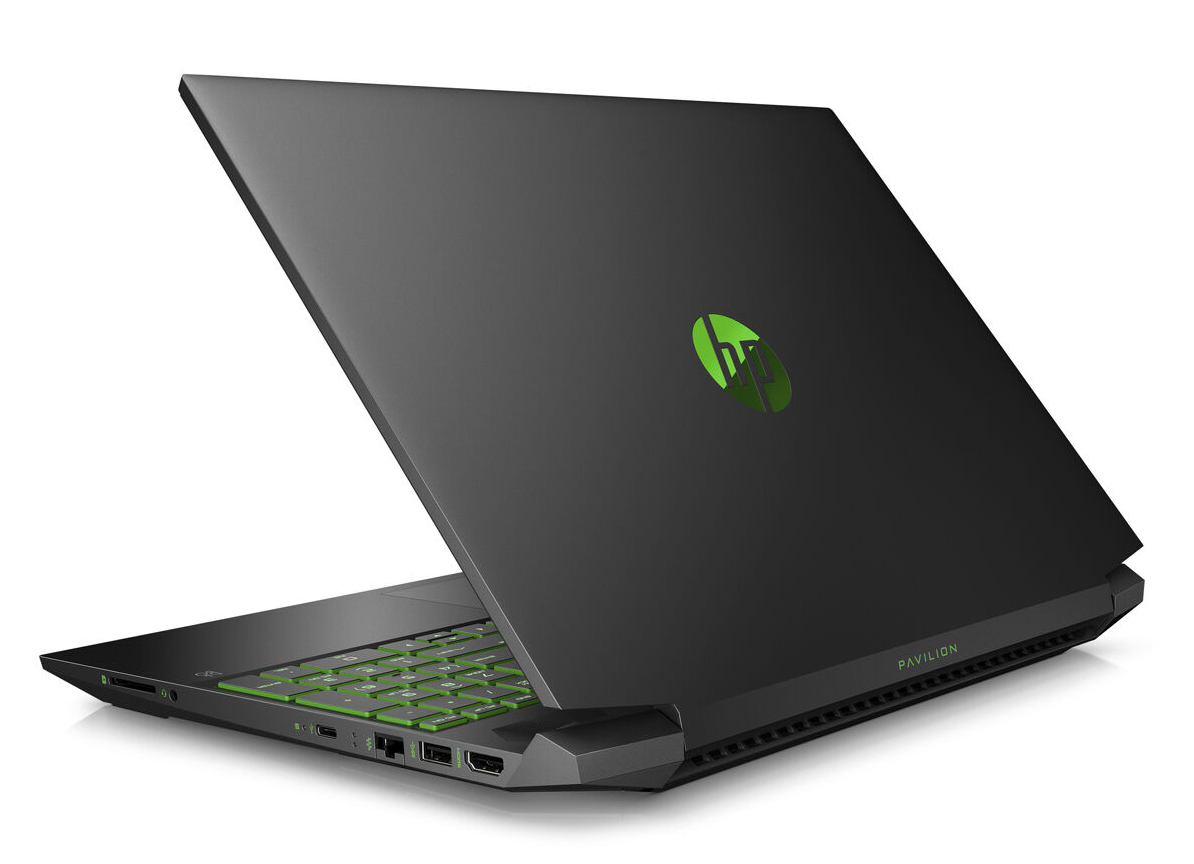
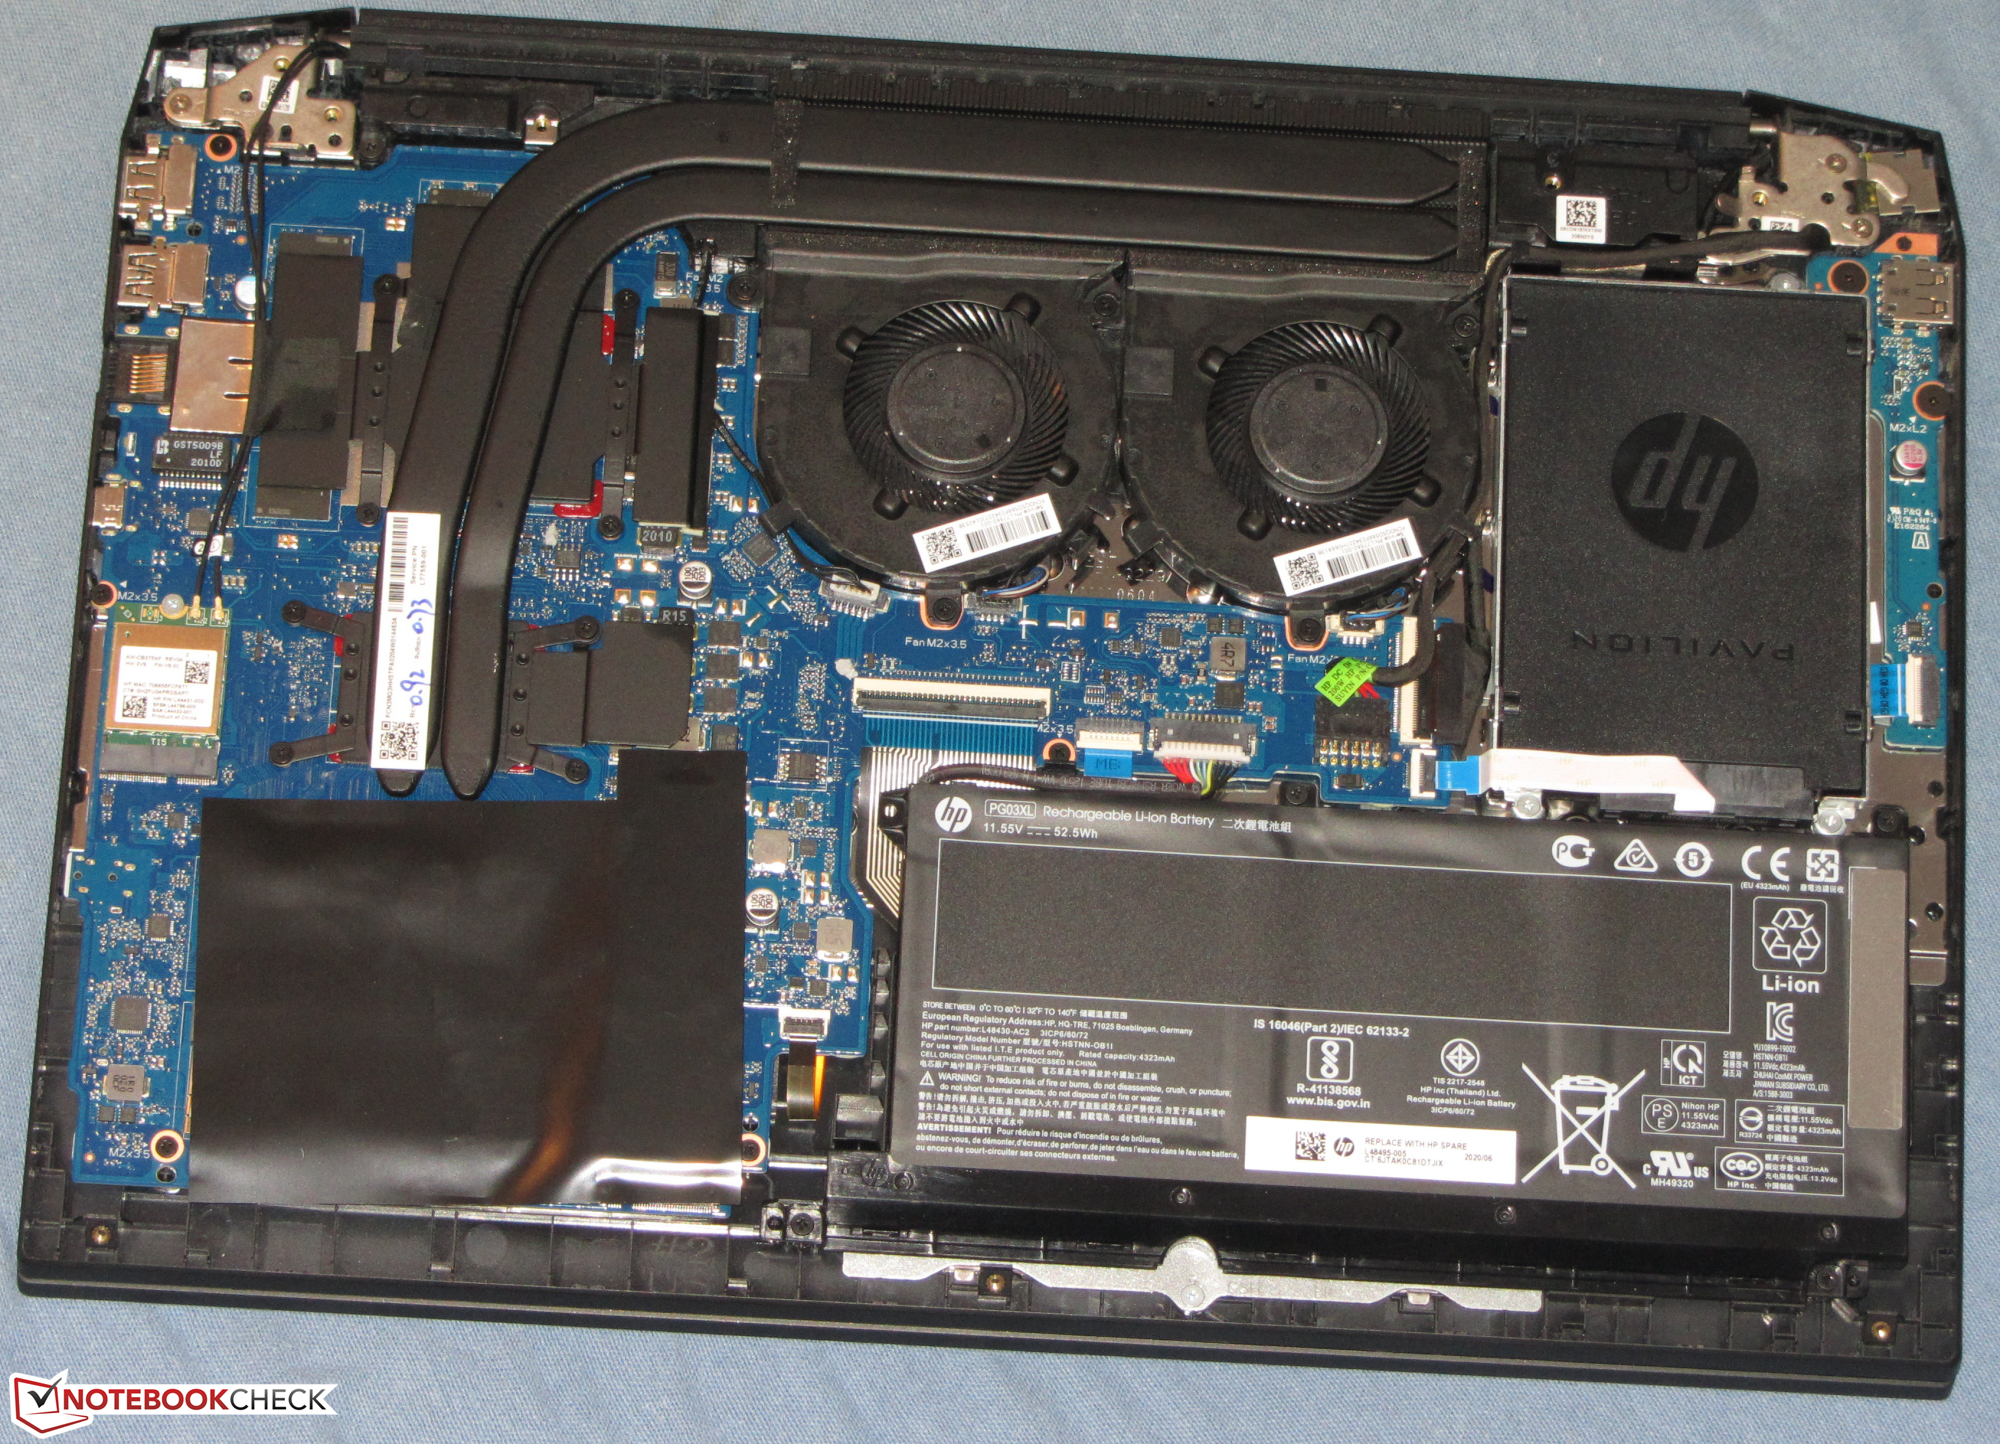
Il y a 16 Go de RAM (2x 8 Go, double canal, 32 Go au maximum). Avec 512 Go, l'espace de stockage est un peu réduit, pour un portable de jeu, mais il est toujours possible de remplacer le SSD NVMe rapide, et un disque de 2,5 pouces peut être ajouté. Toutes ces opérations d'évolution et de maintenance nécessitent de retirer la coque inférieure.
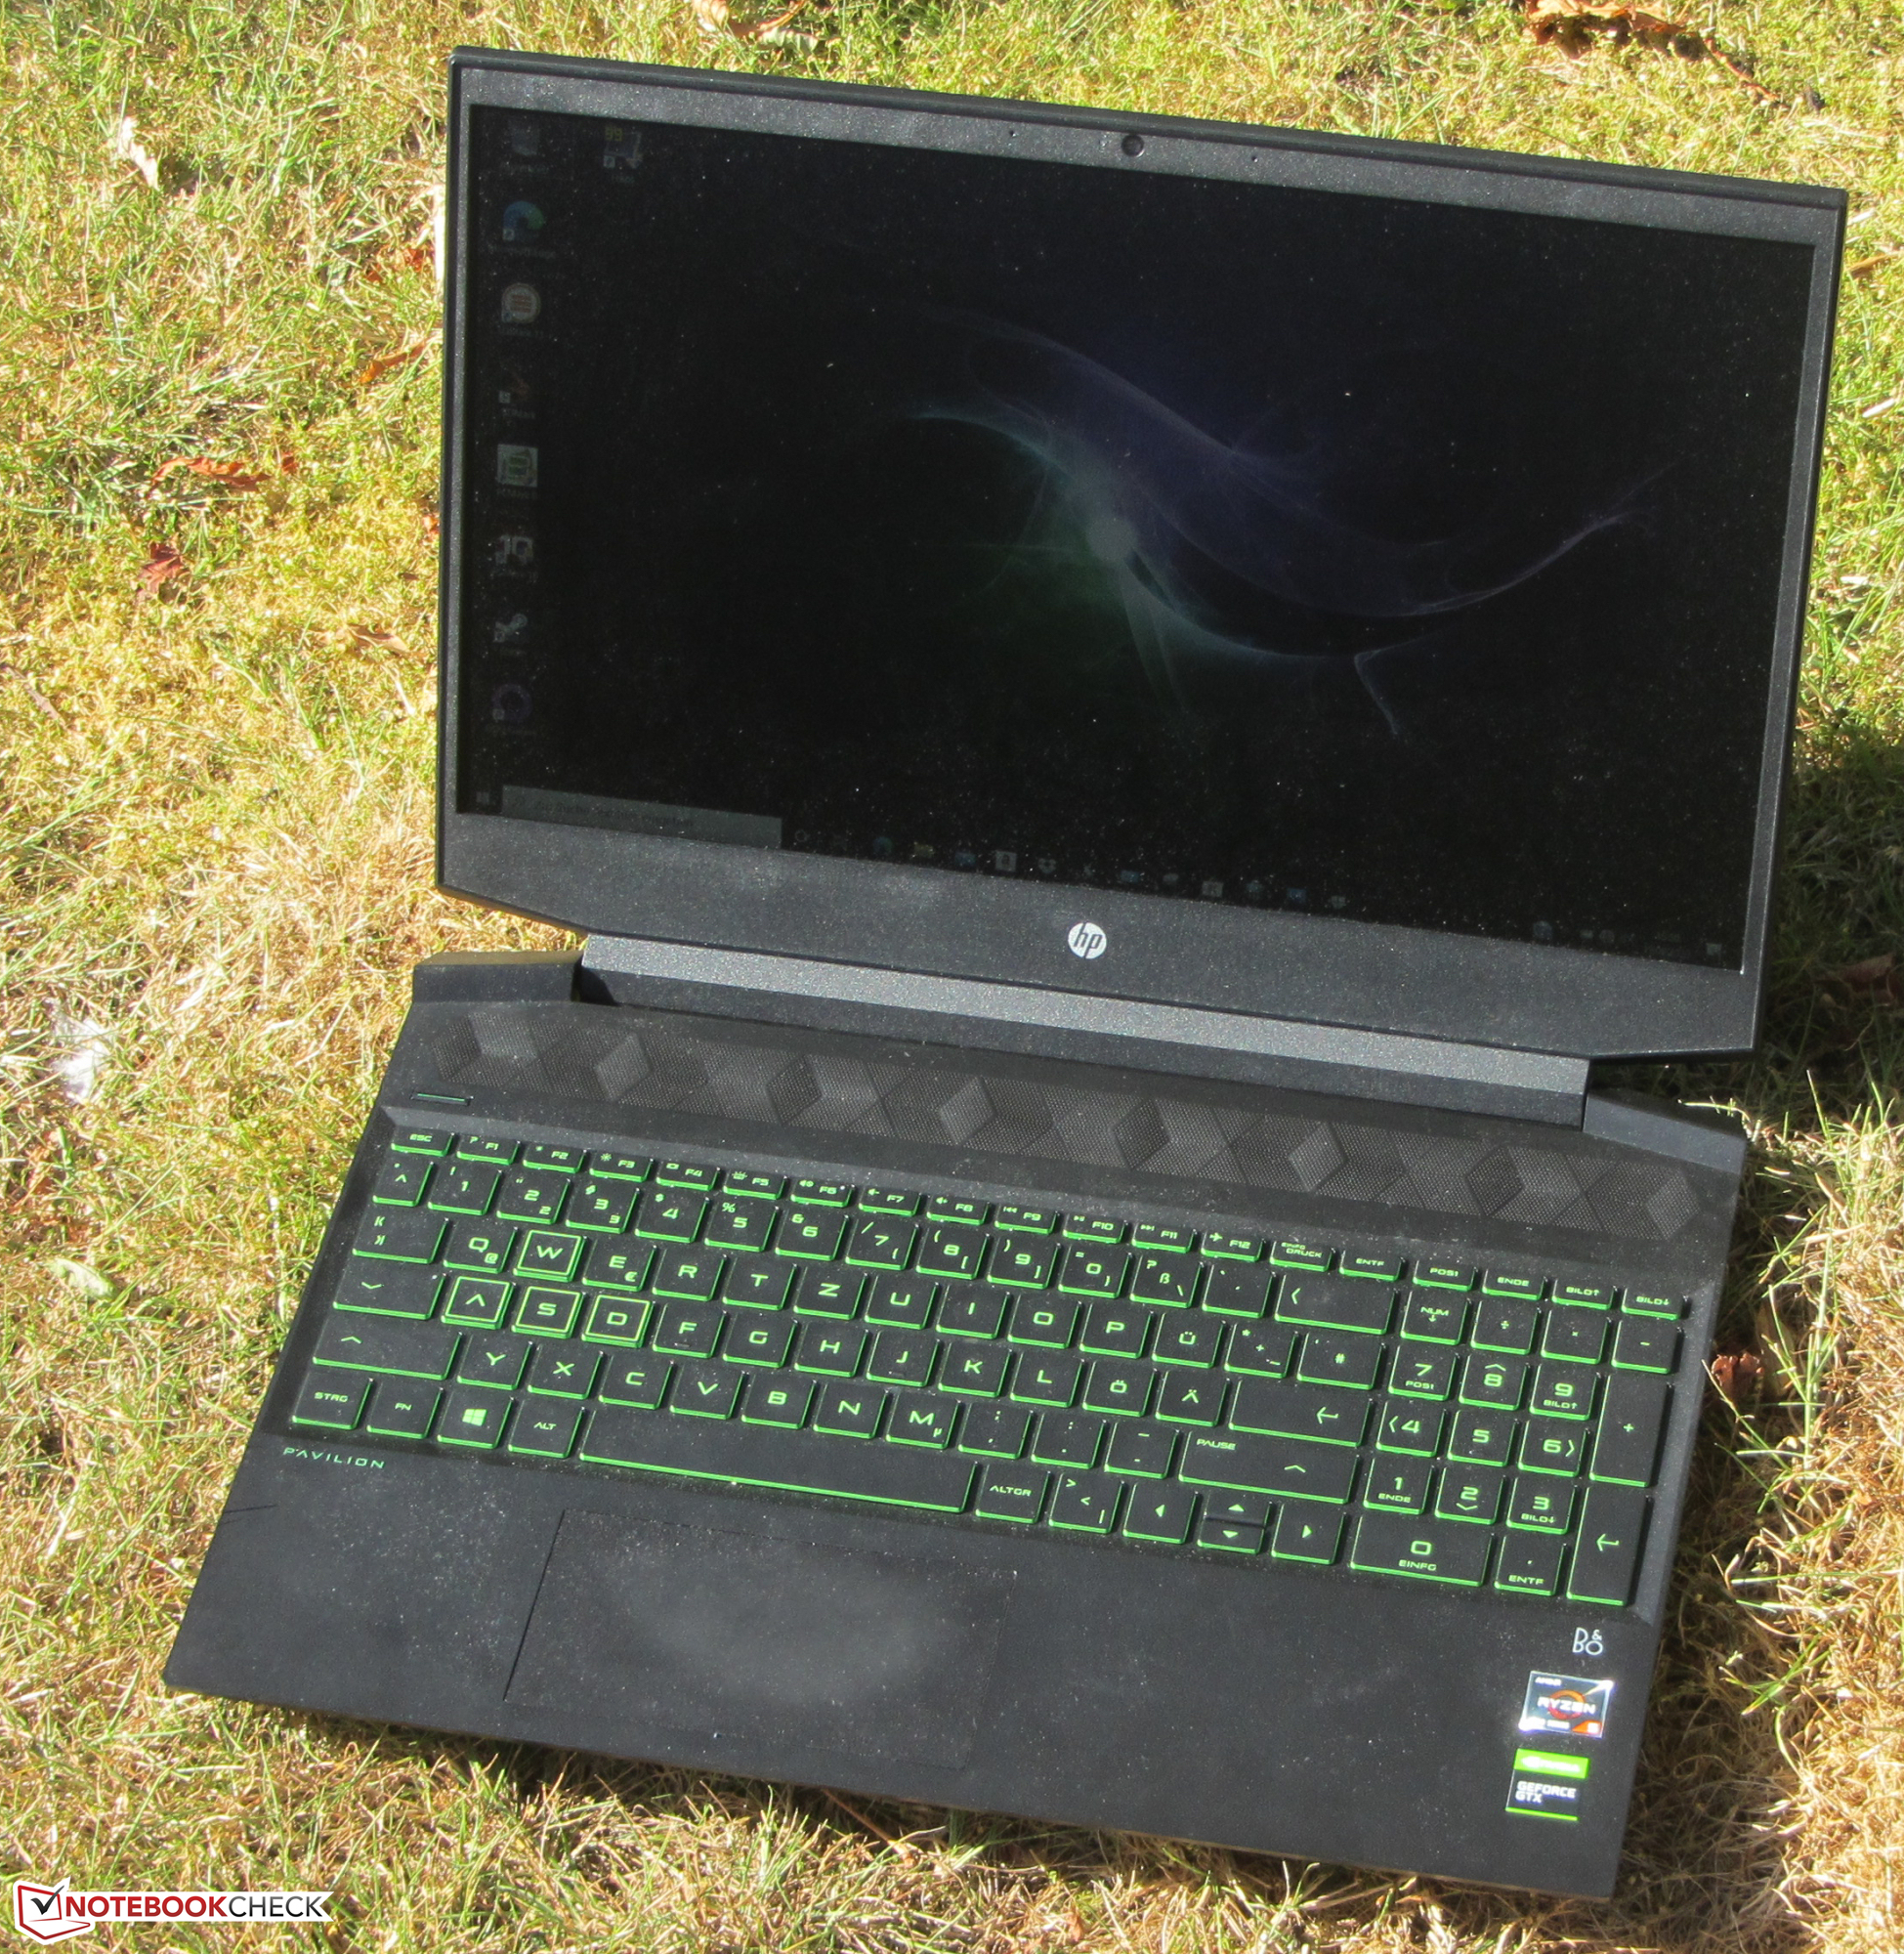
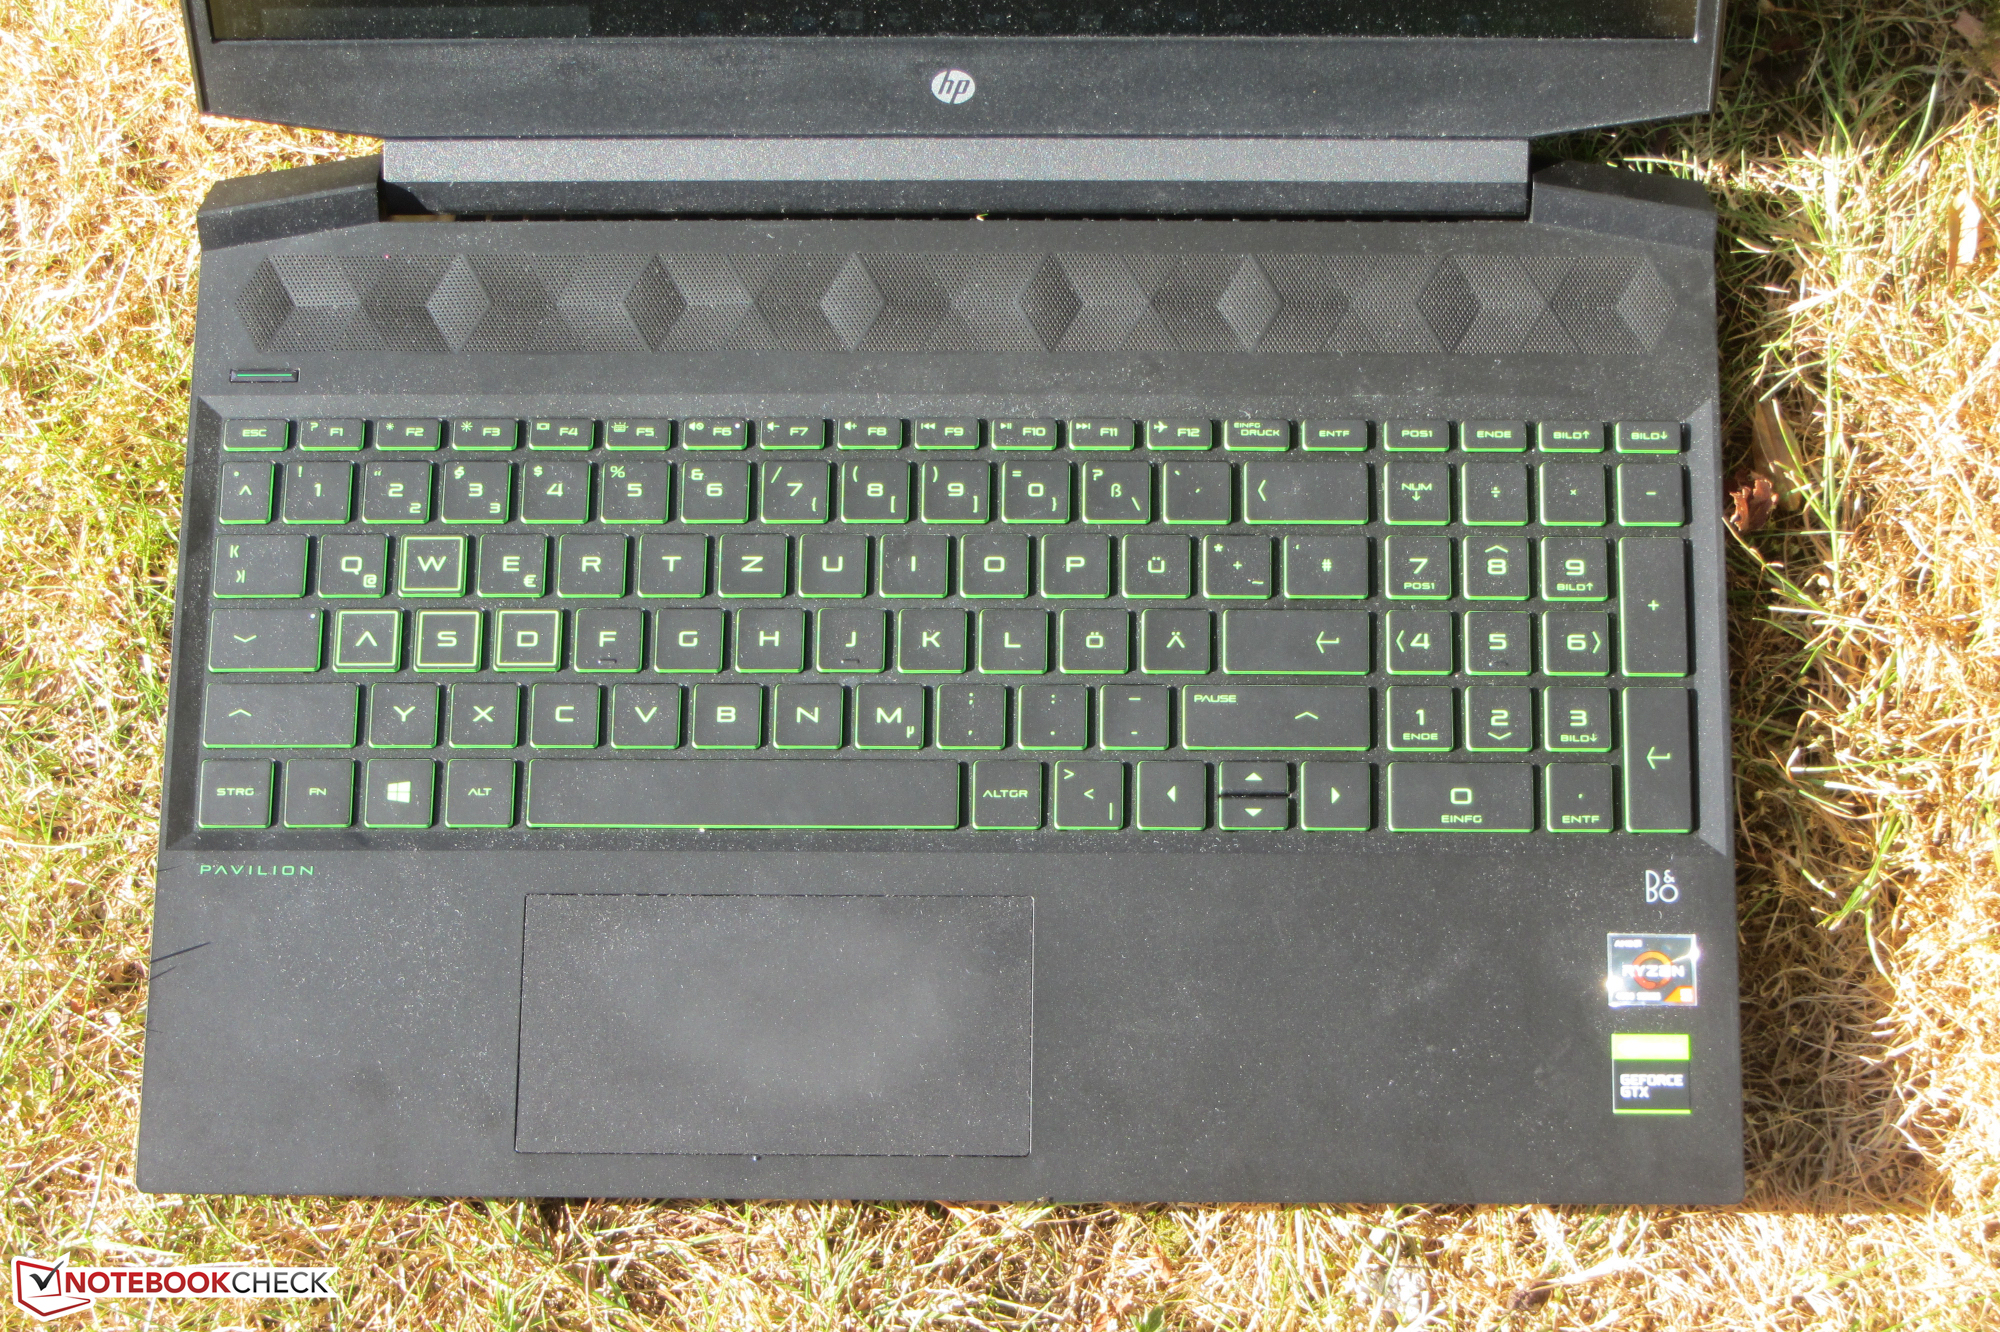
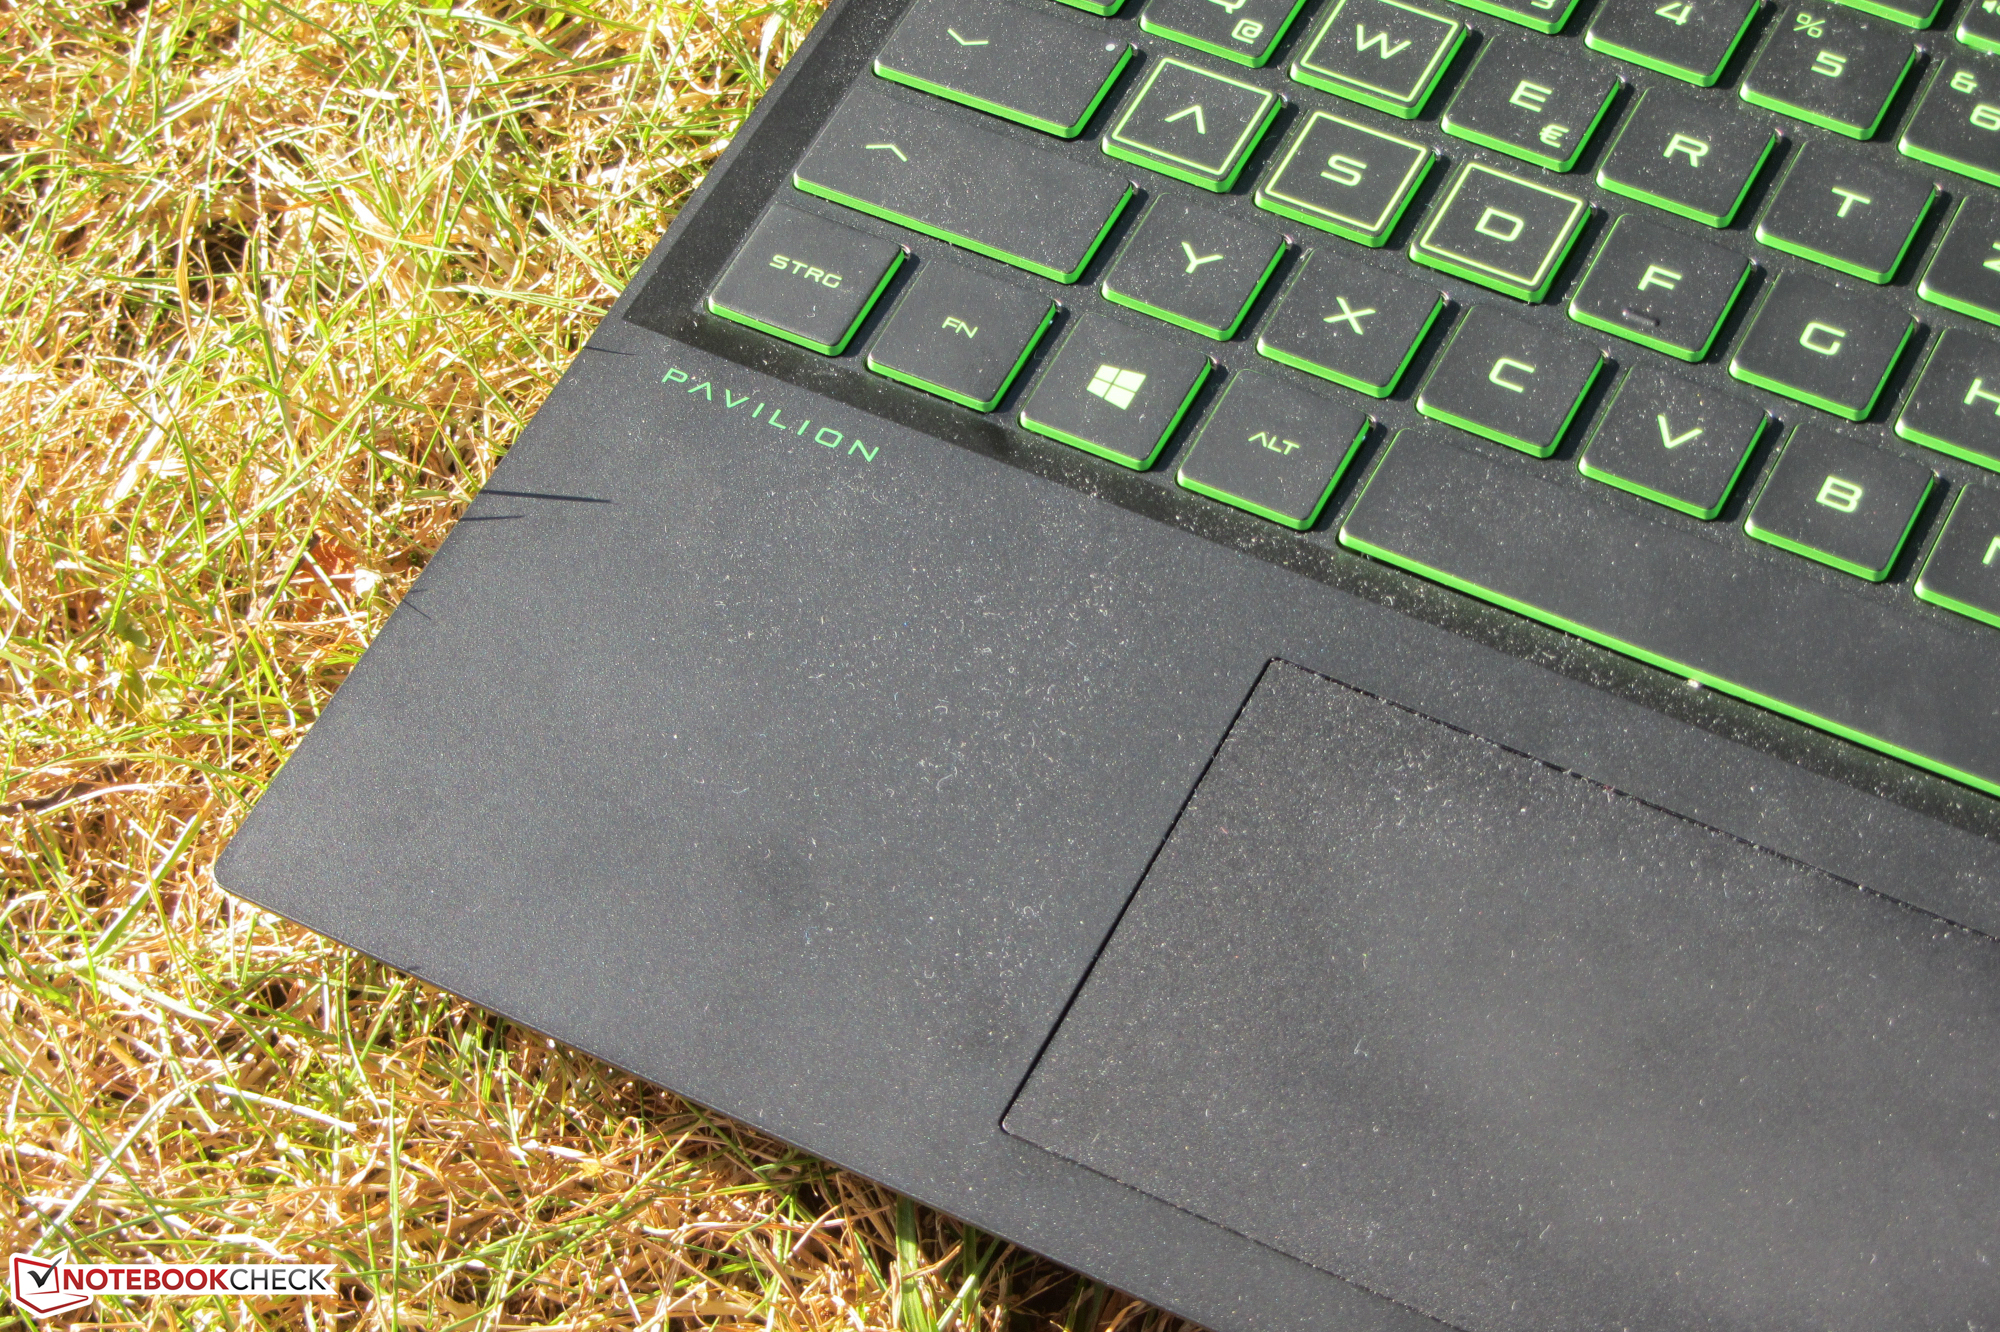
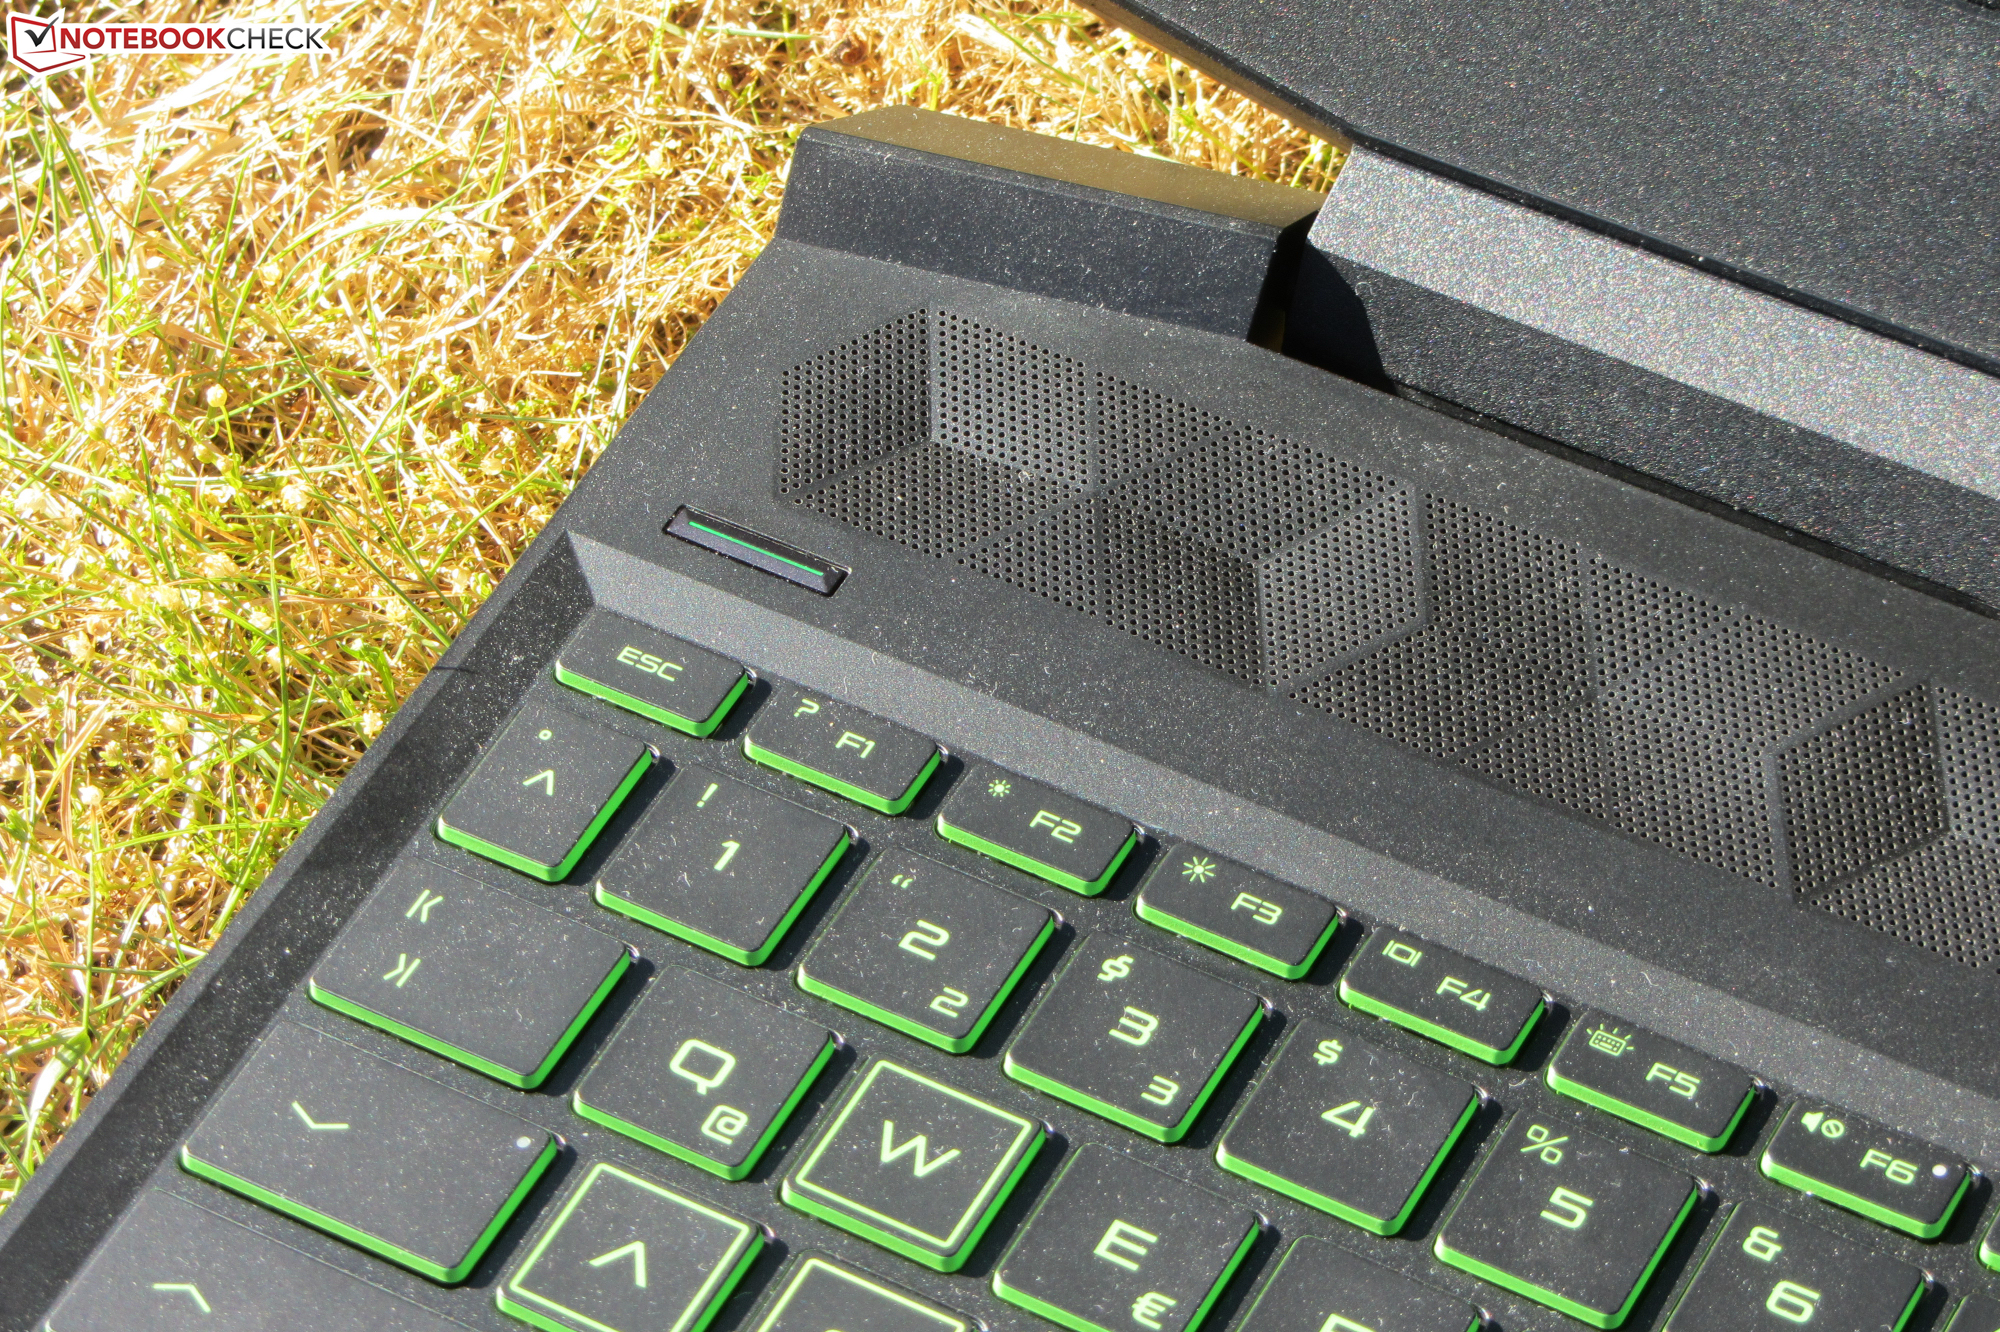
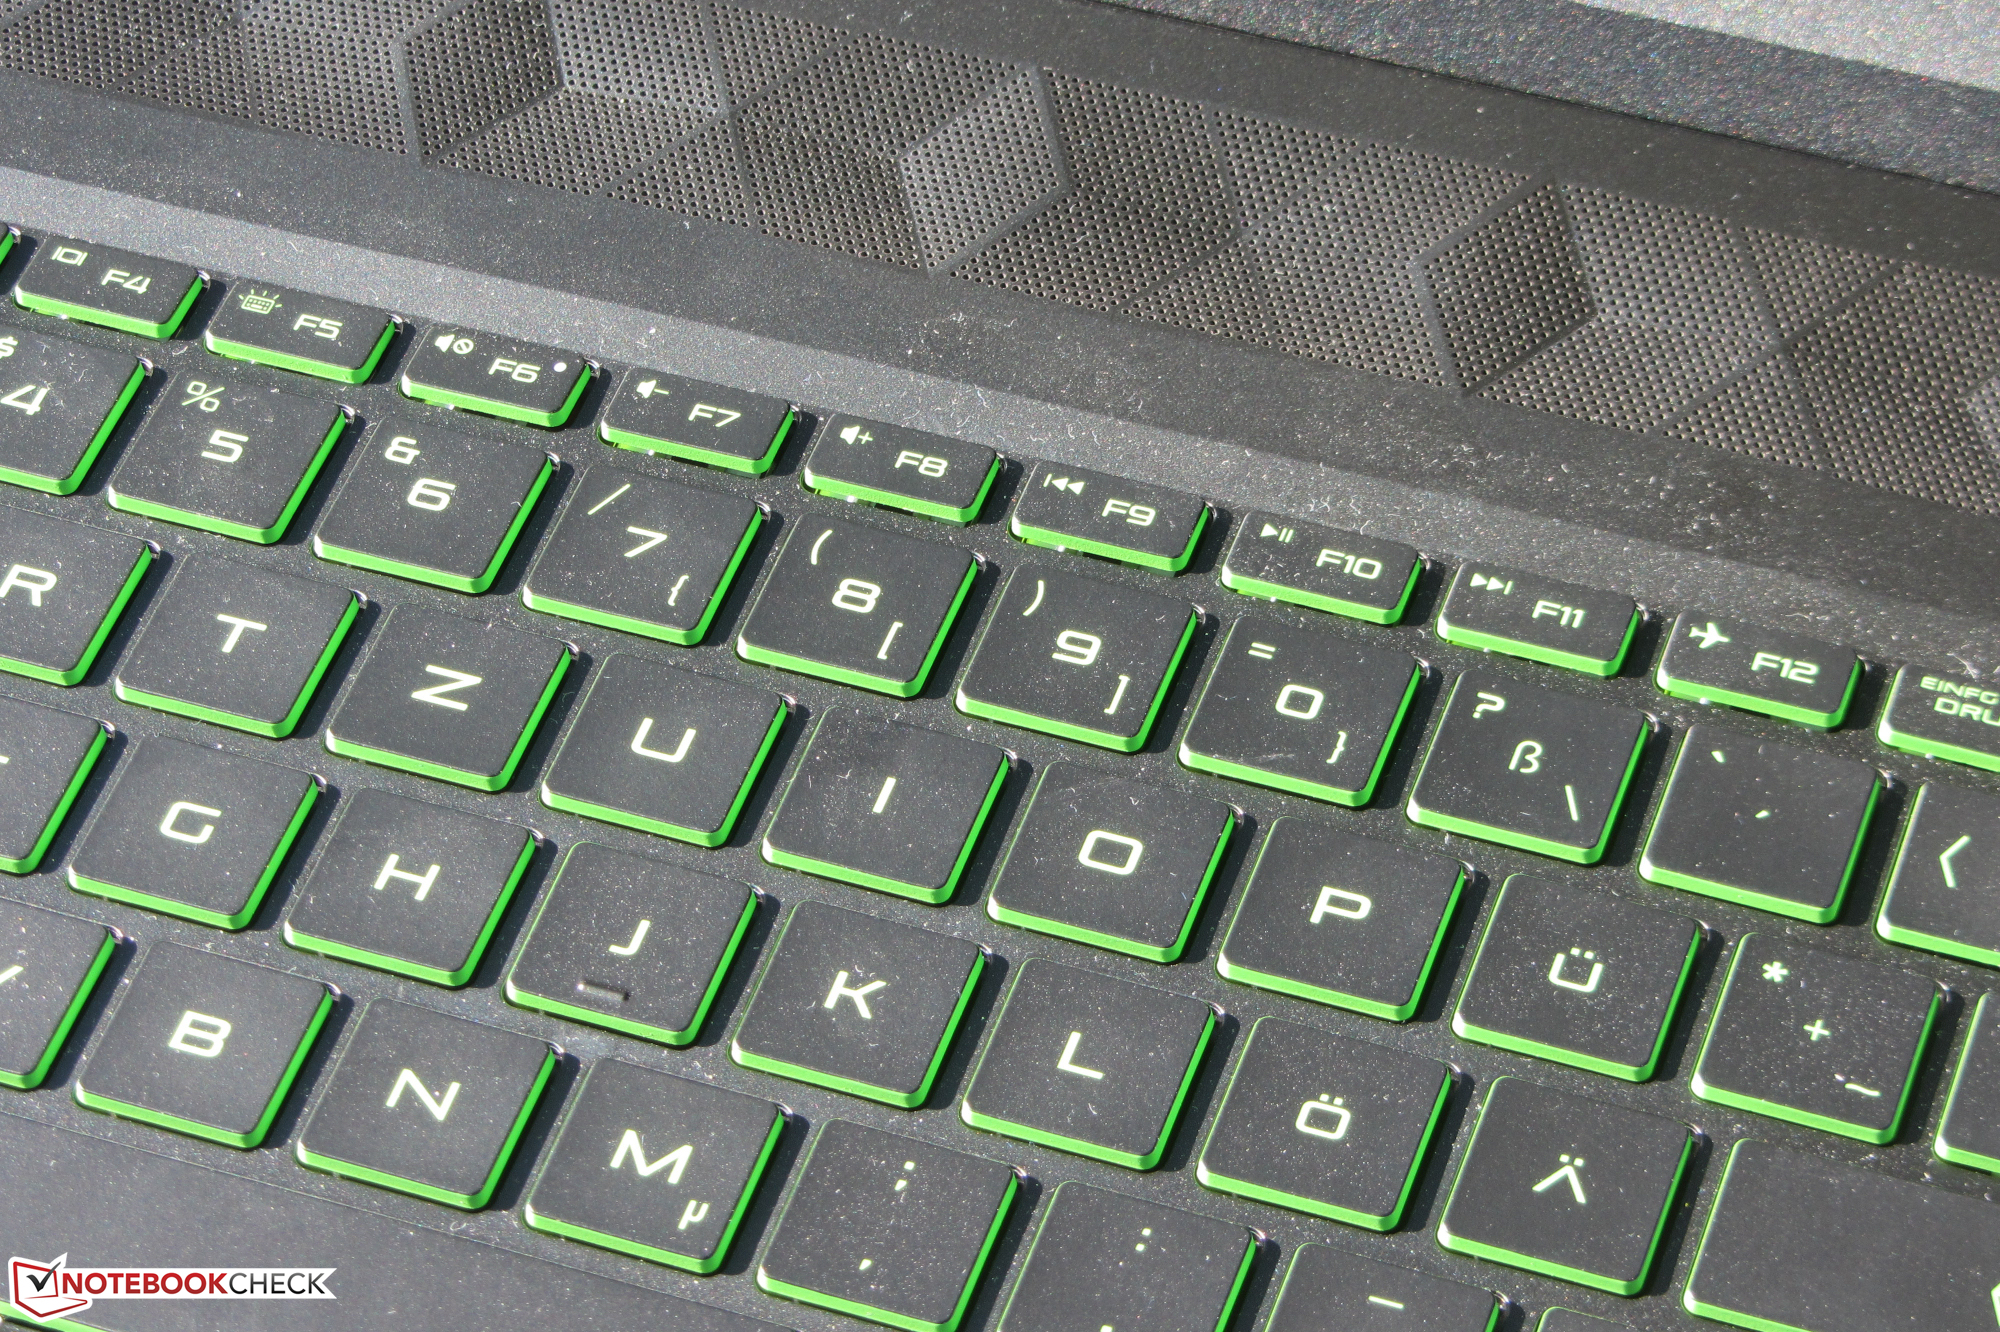
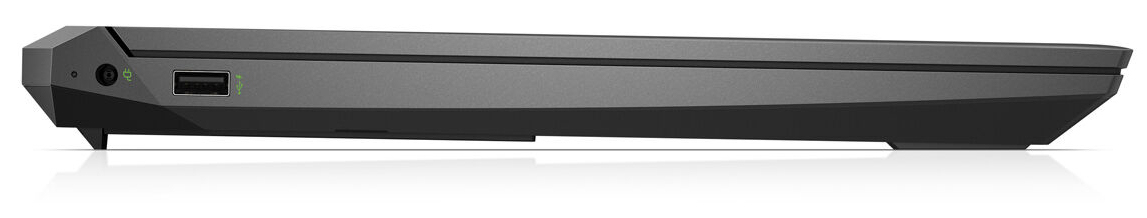
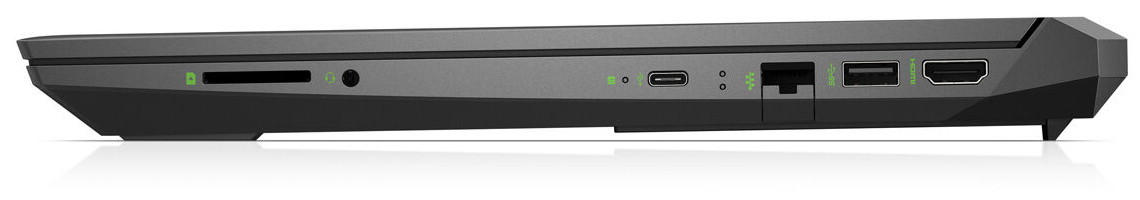
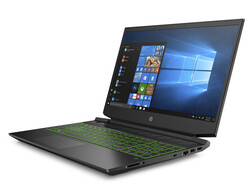
L'autonomie est correcte, sans atteindre les très bonnes valeurs des autres modèles de la série. Le clavier chiclet (rétroéclairage vert, deux niveaux de luminosité) s'avère utilisable au quotidien. En revanche les ports ne sont pas très nombreux, mais les plus importants sont présents.
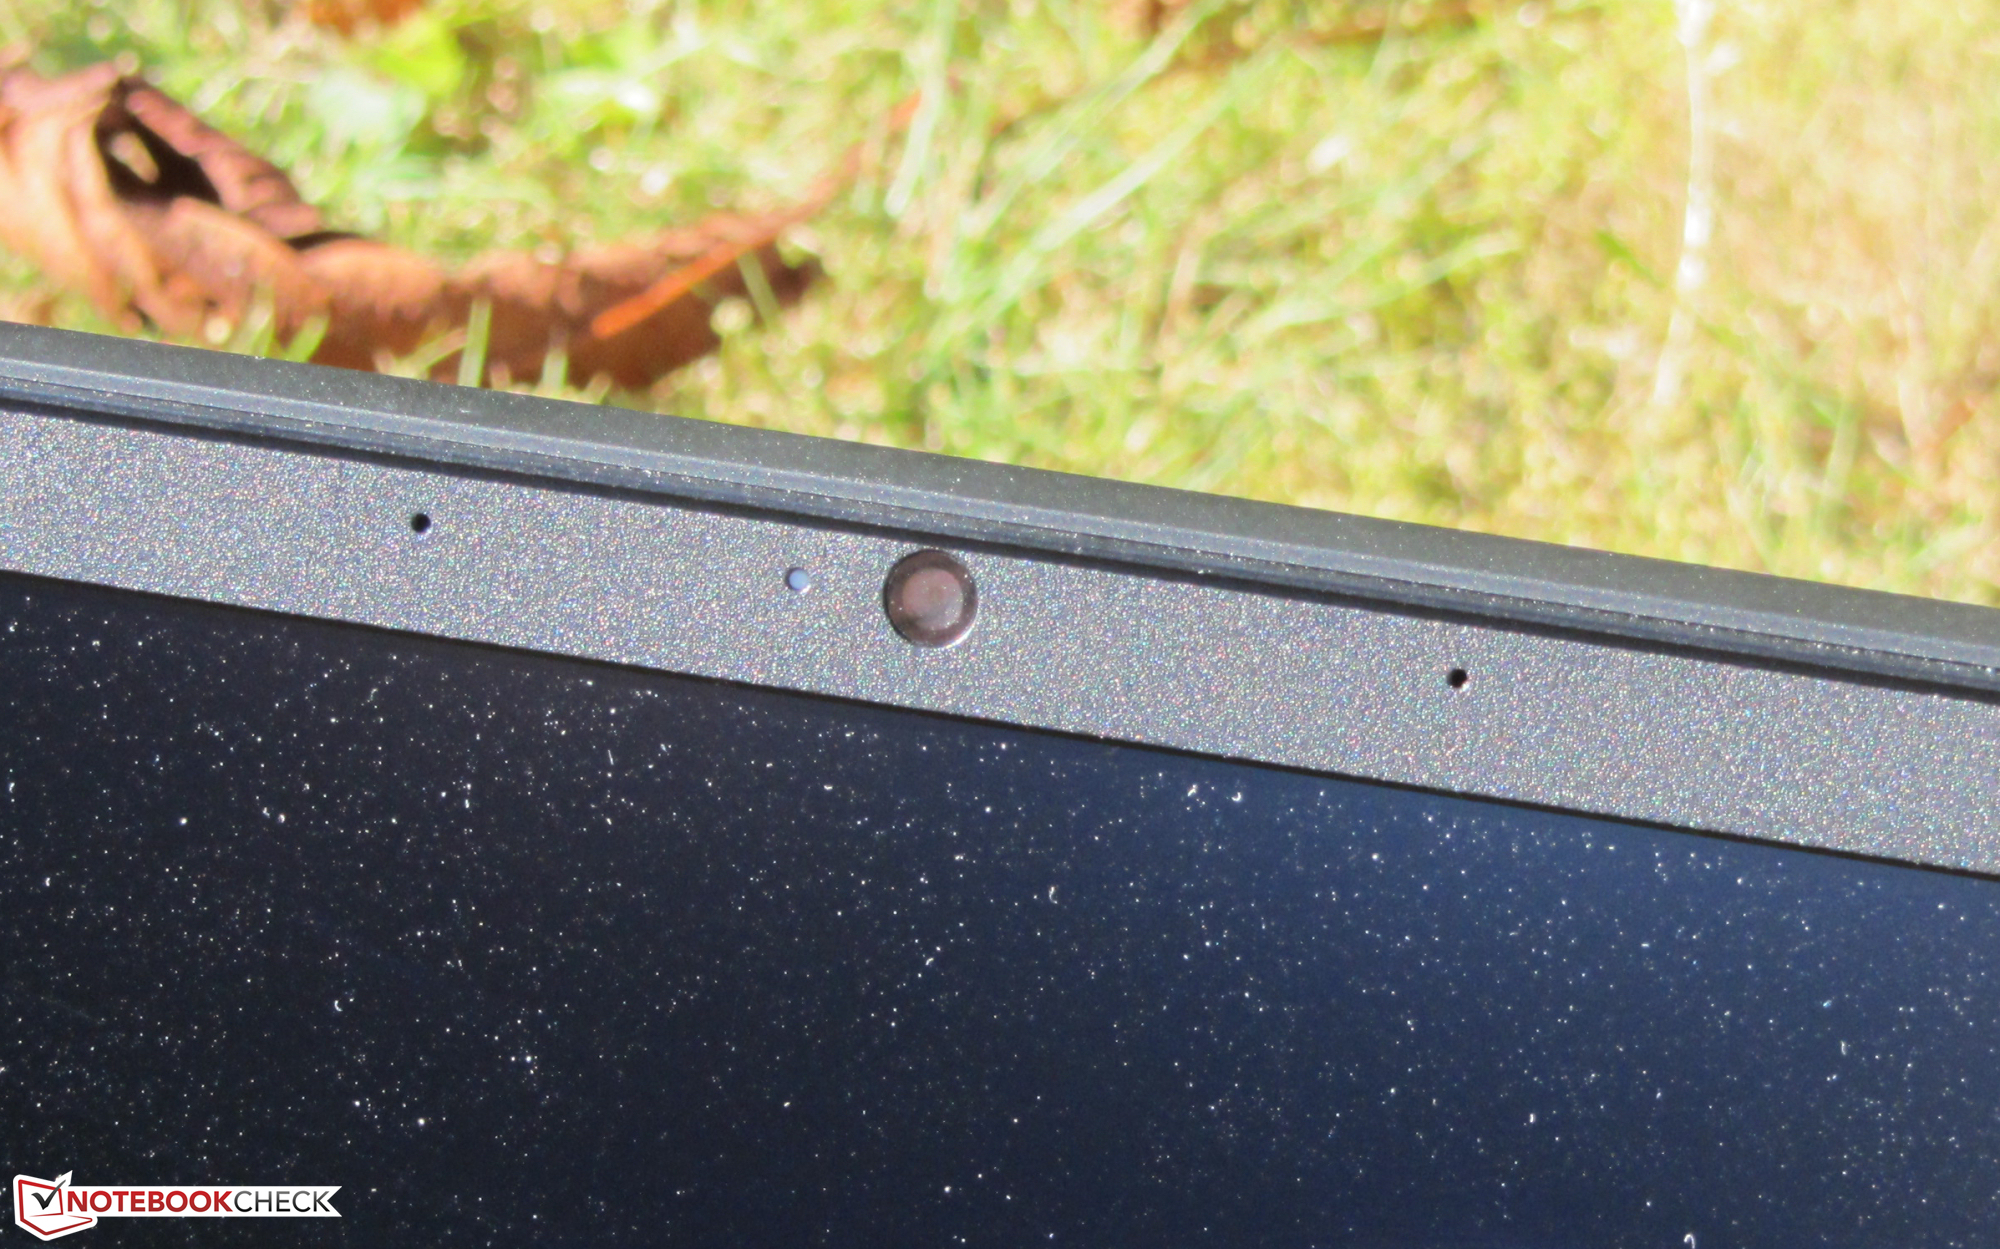
L'écran IPS enfin (Full HD) marque des points avec sa surface matte, ses angles de vision, son contraste, sa luminosité, ses temps de réponses, et la fidélité de ses couleurs. La couverture des espaces colorimétriques est également satisfaisante.
L’intégralité de cette critique est disponible en anglais en suivant ce lien.
HP Pavilion Gaming 15-ec1177ng
- 09/29/2020 v7 (old)
Sascha Mölck
Price comparison
