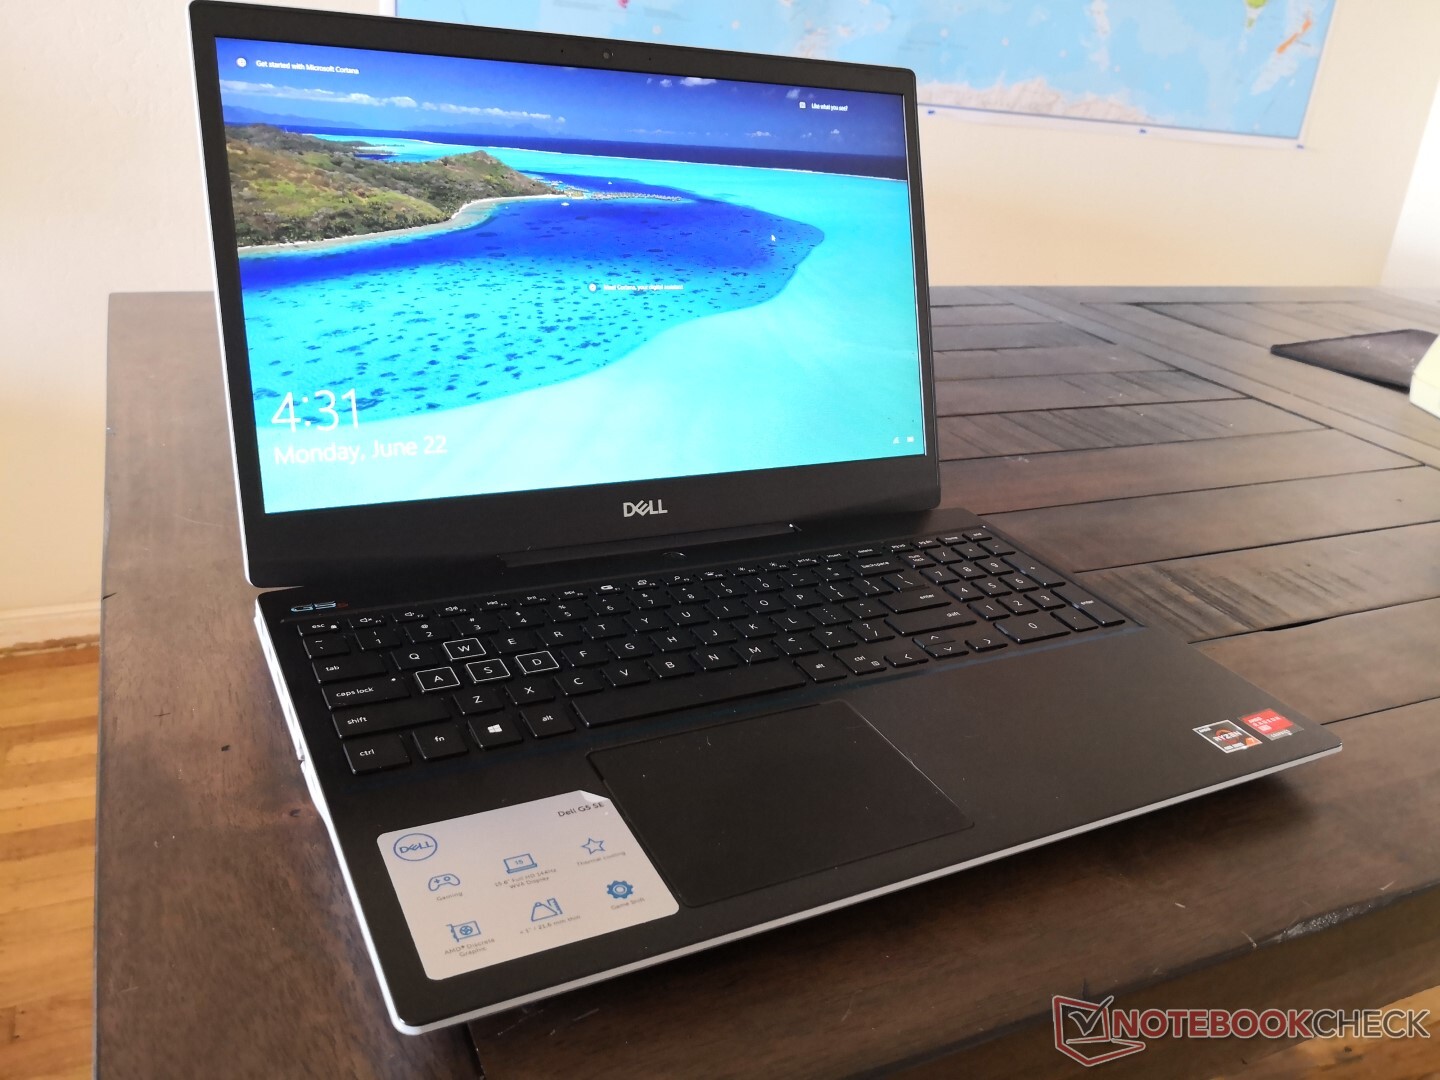
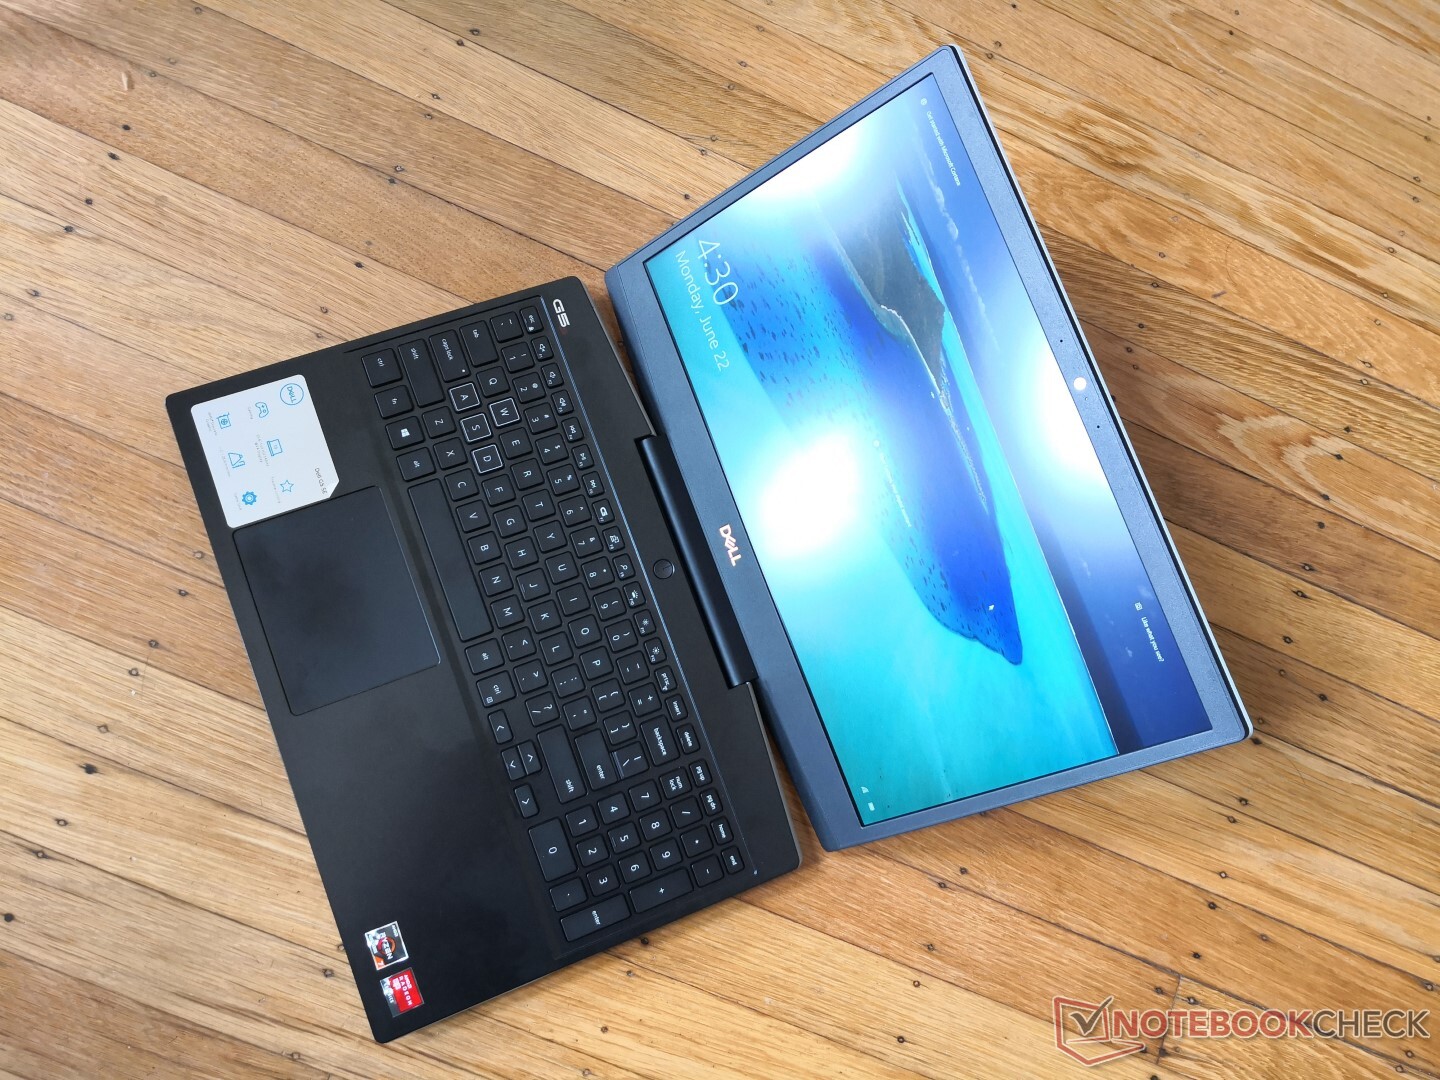
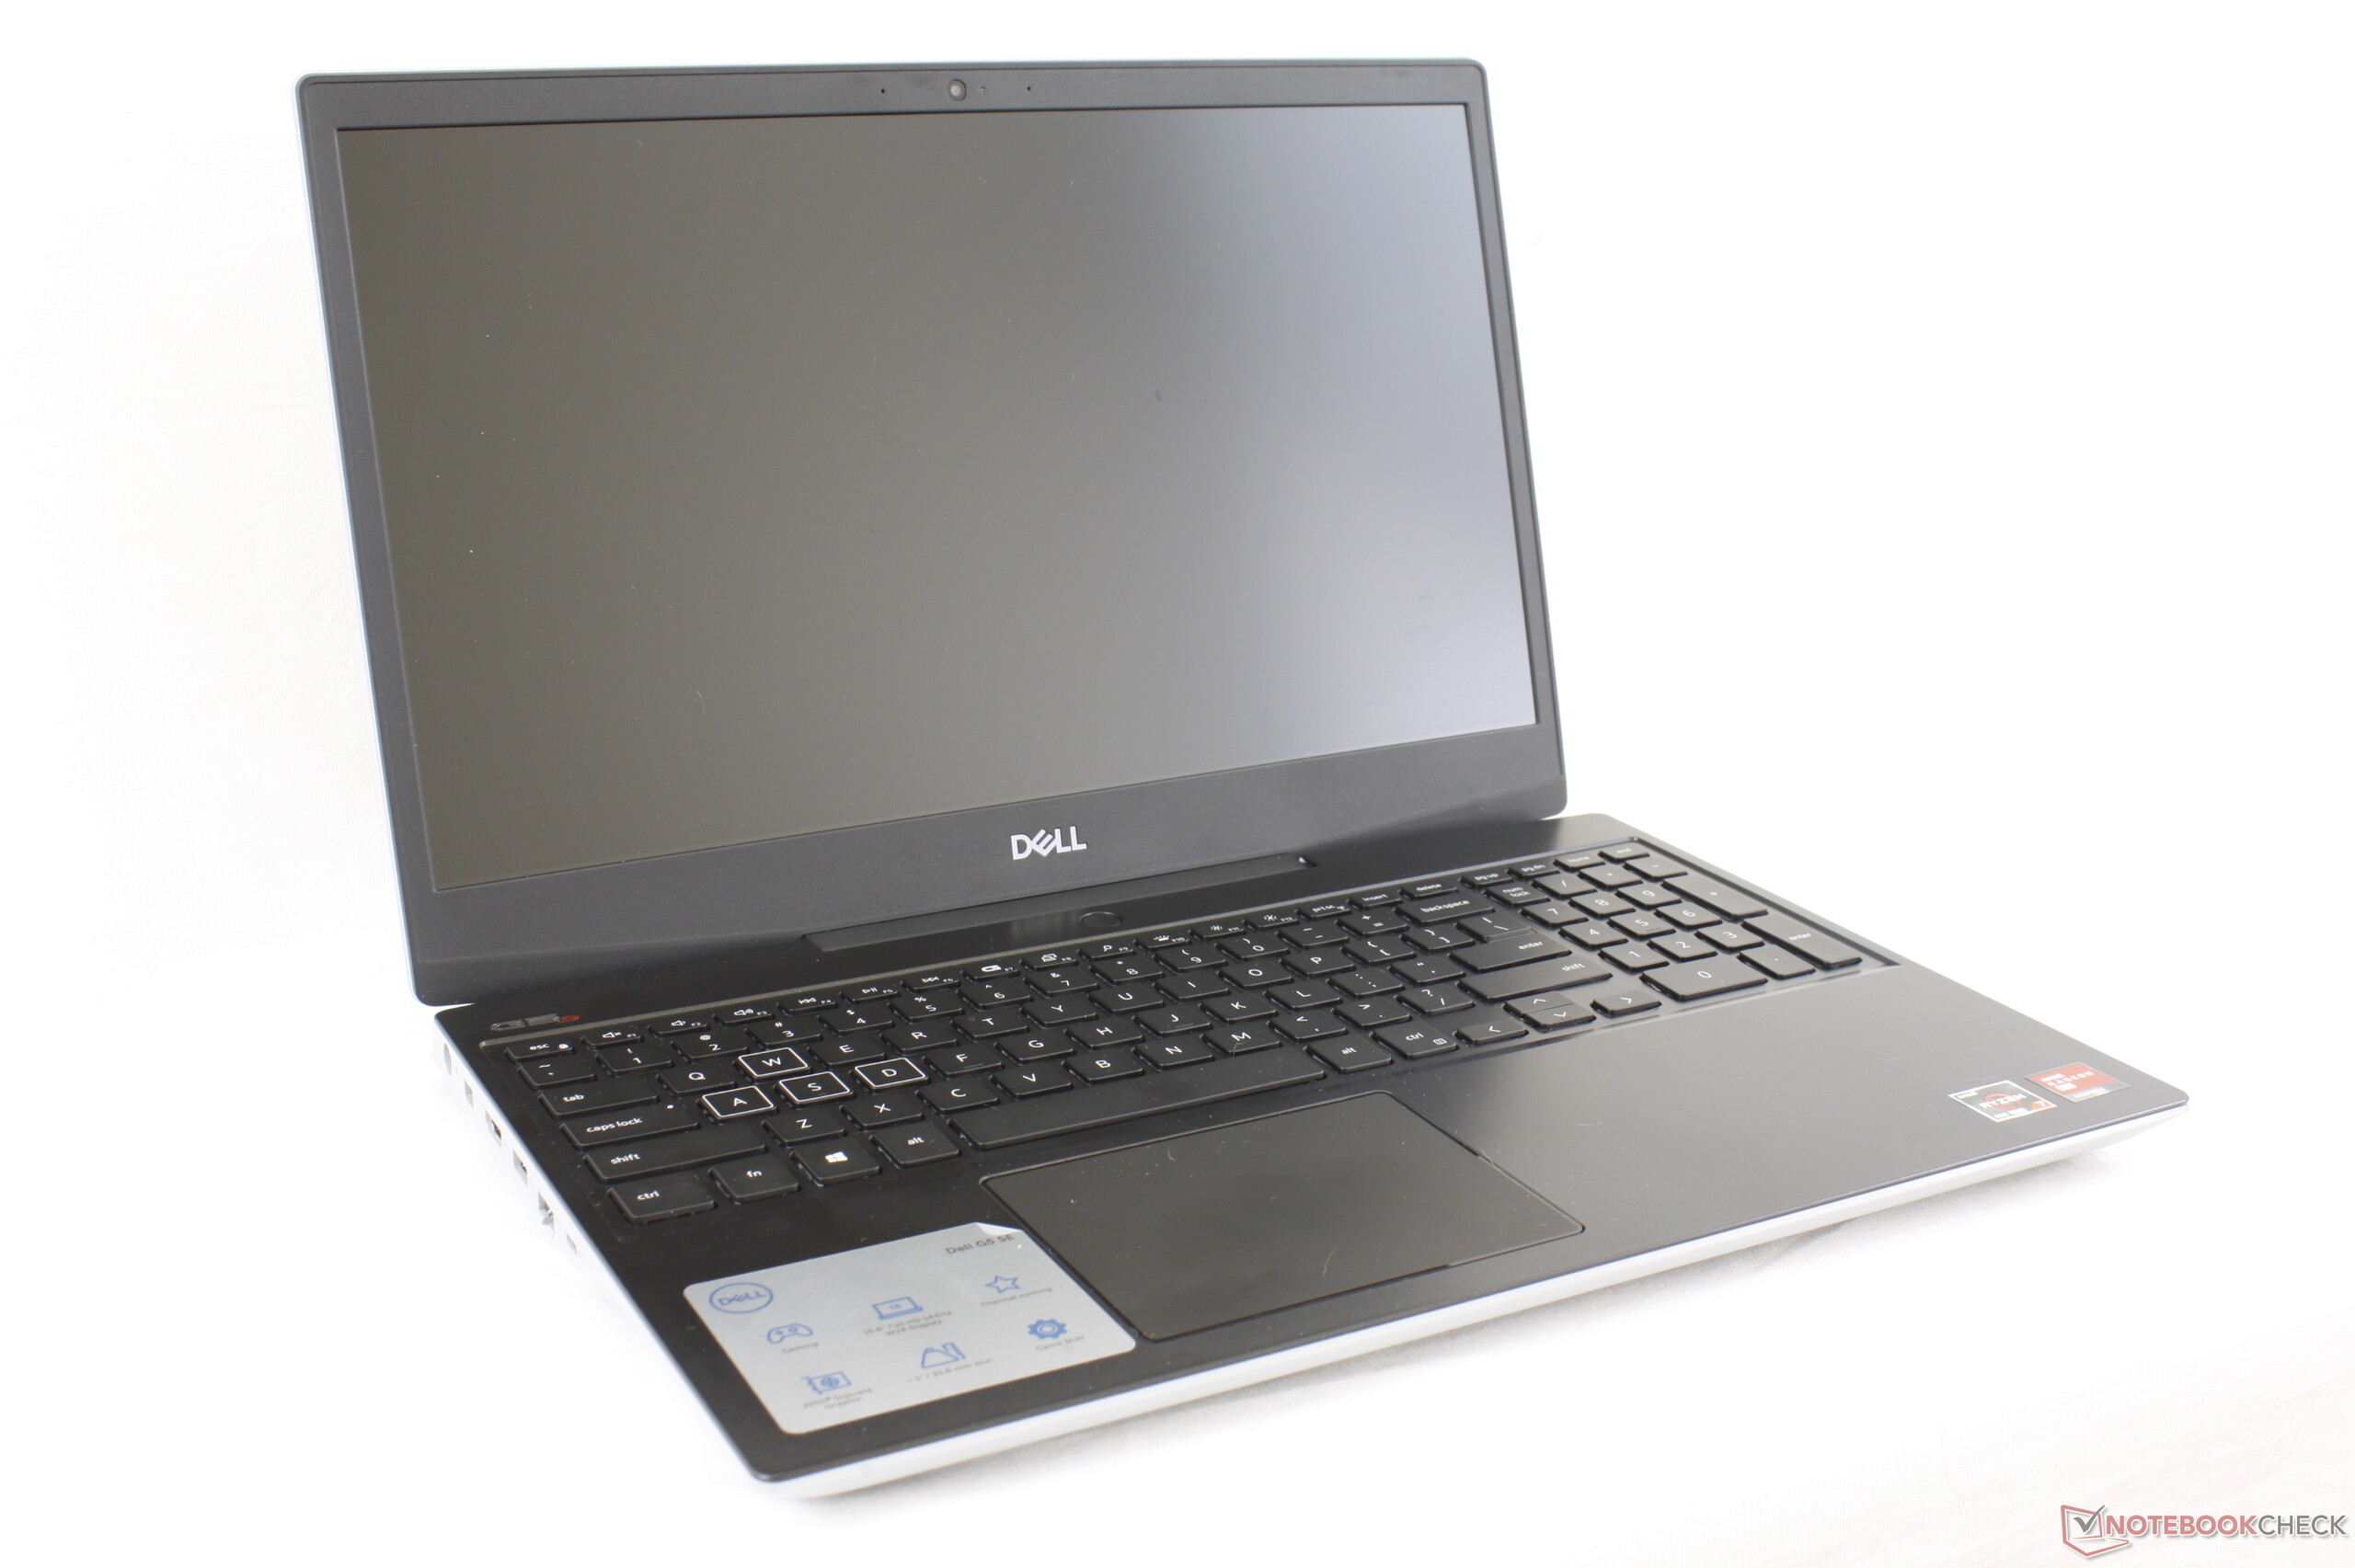
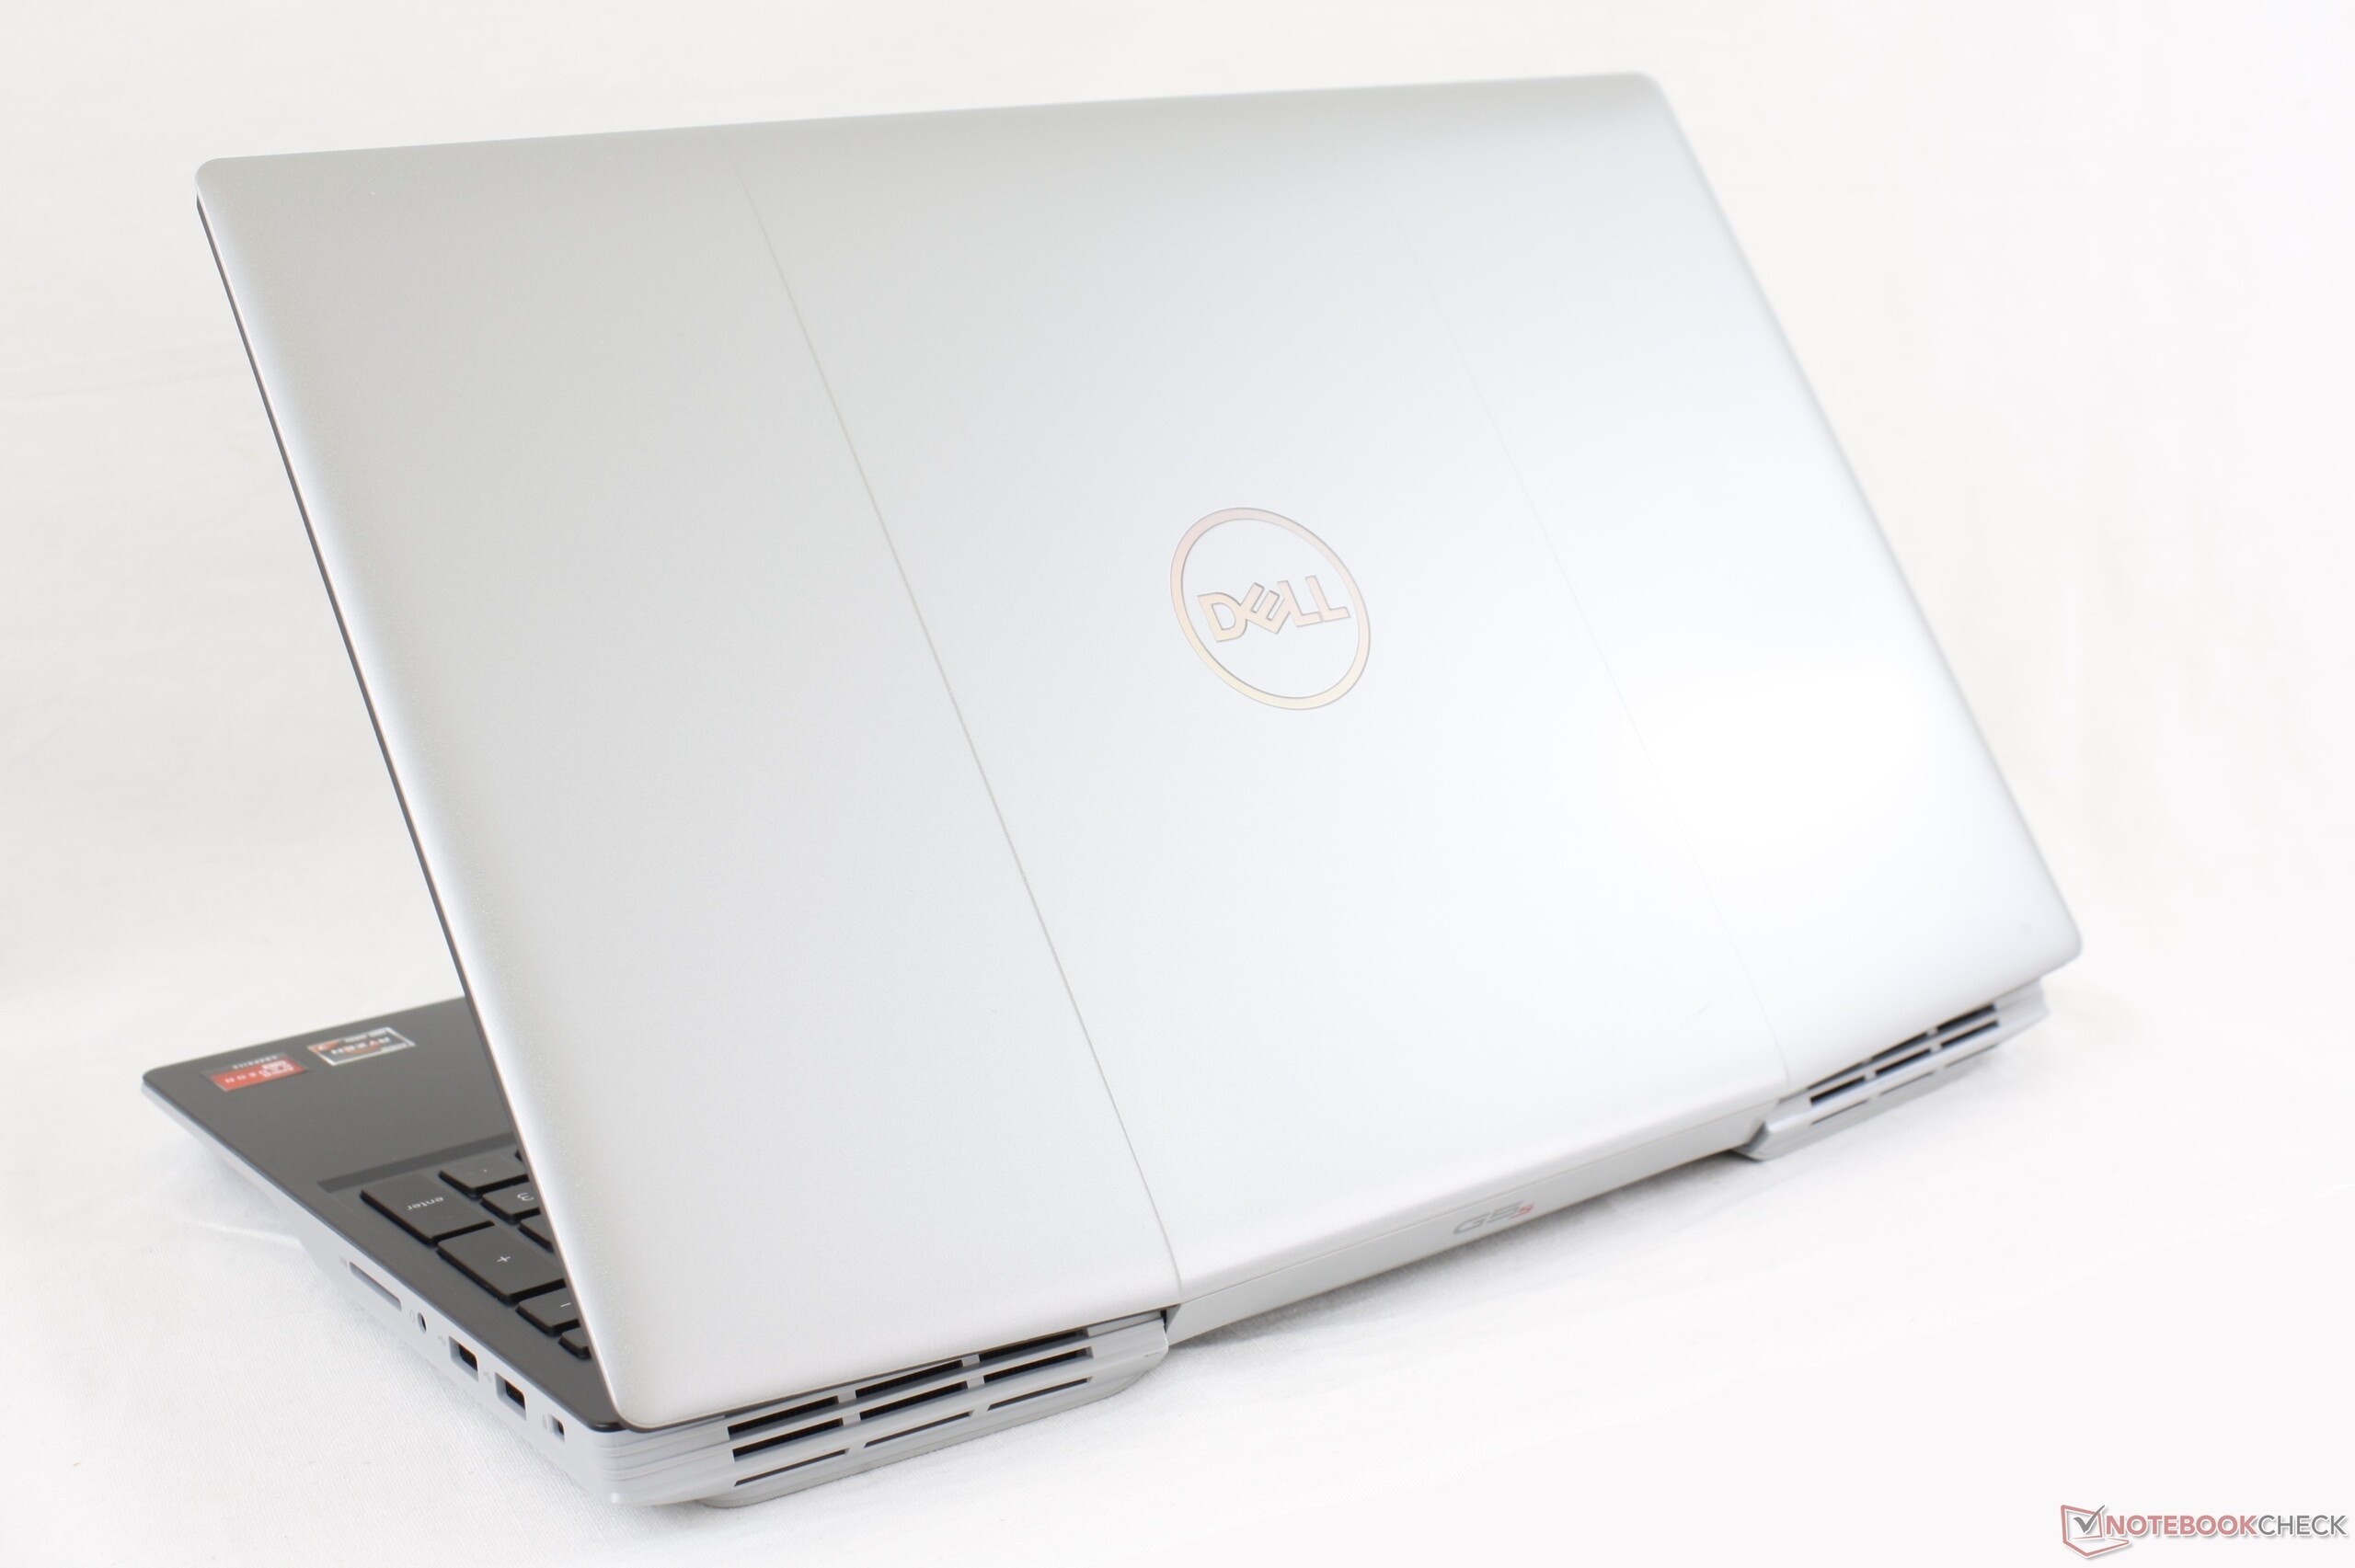
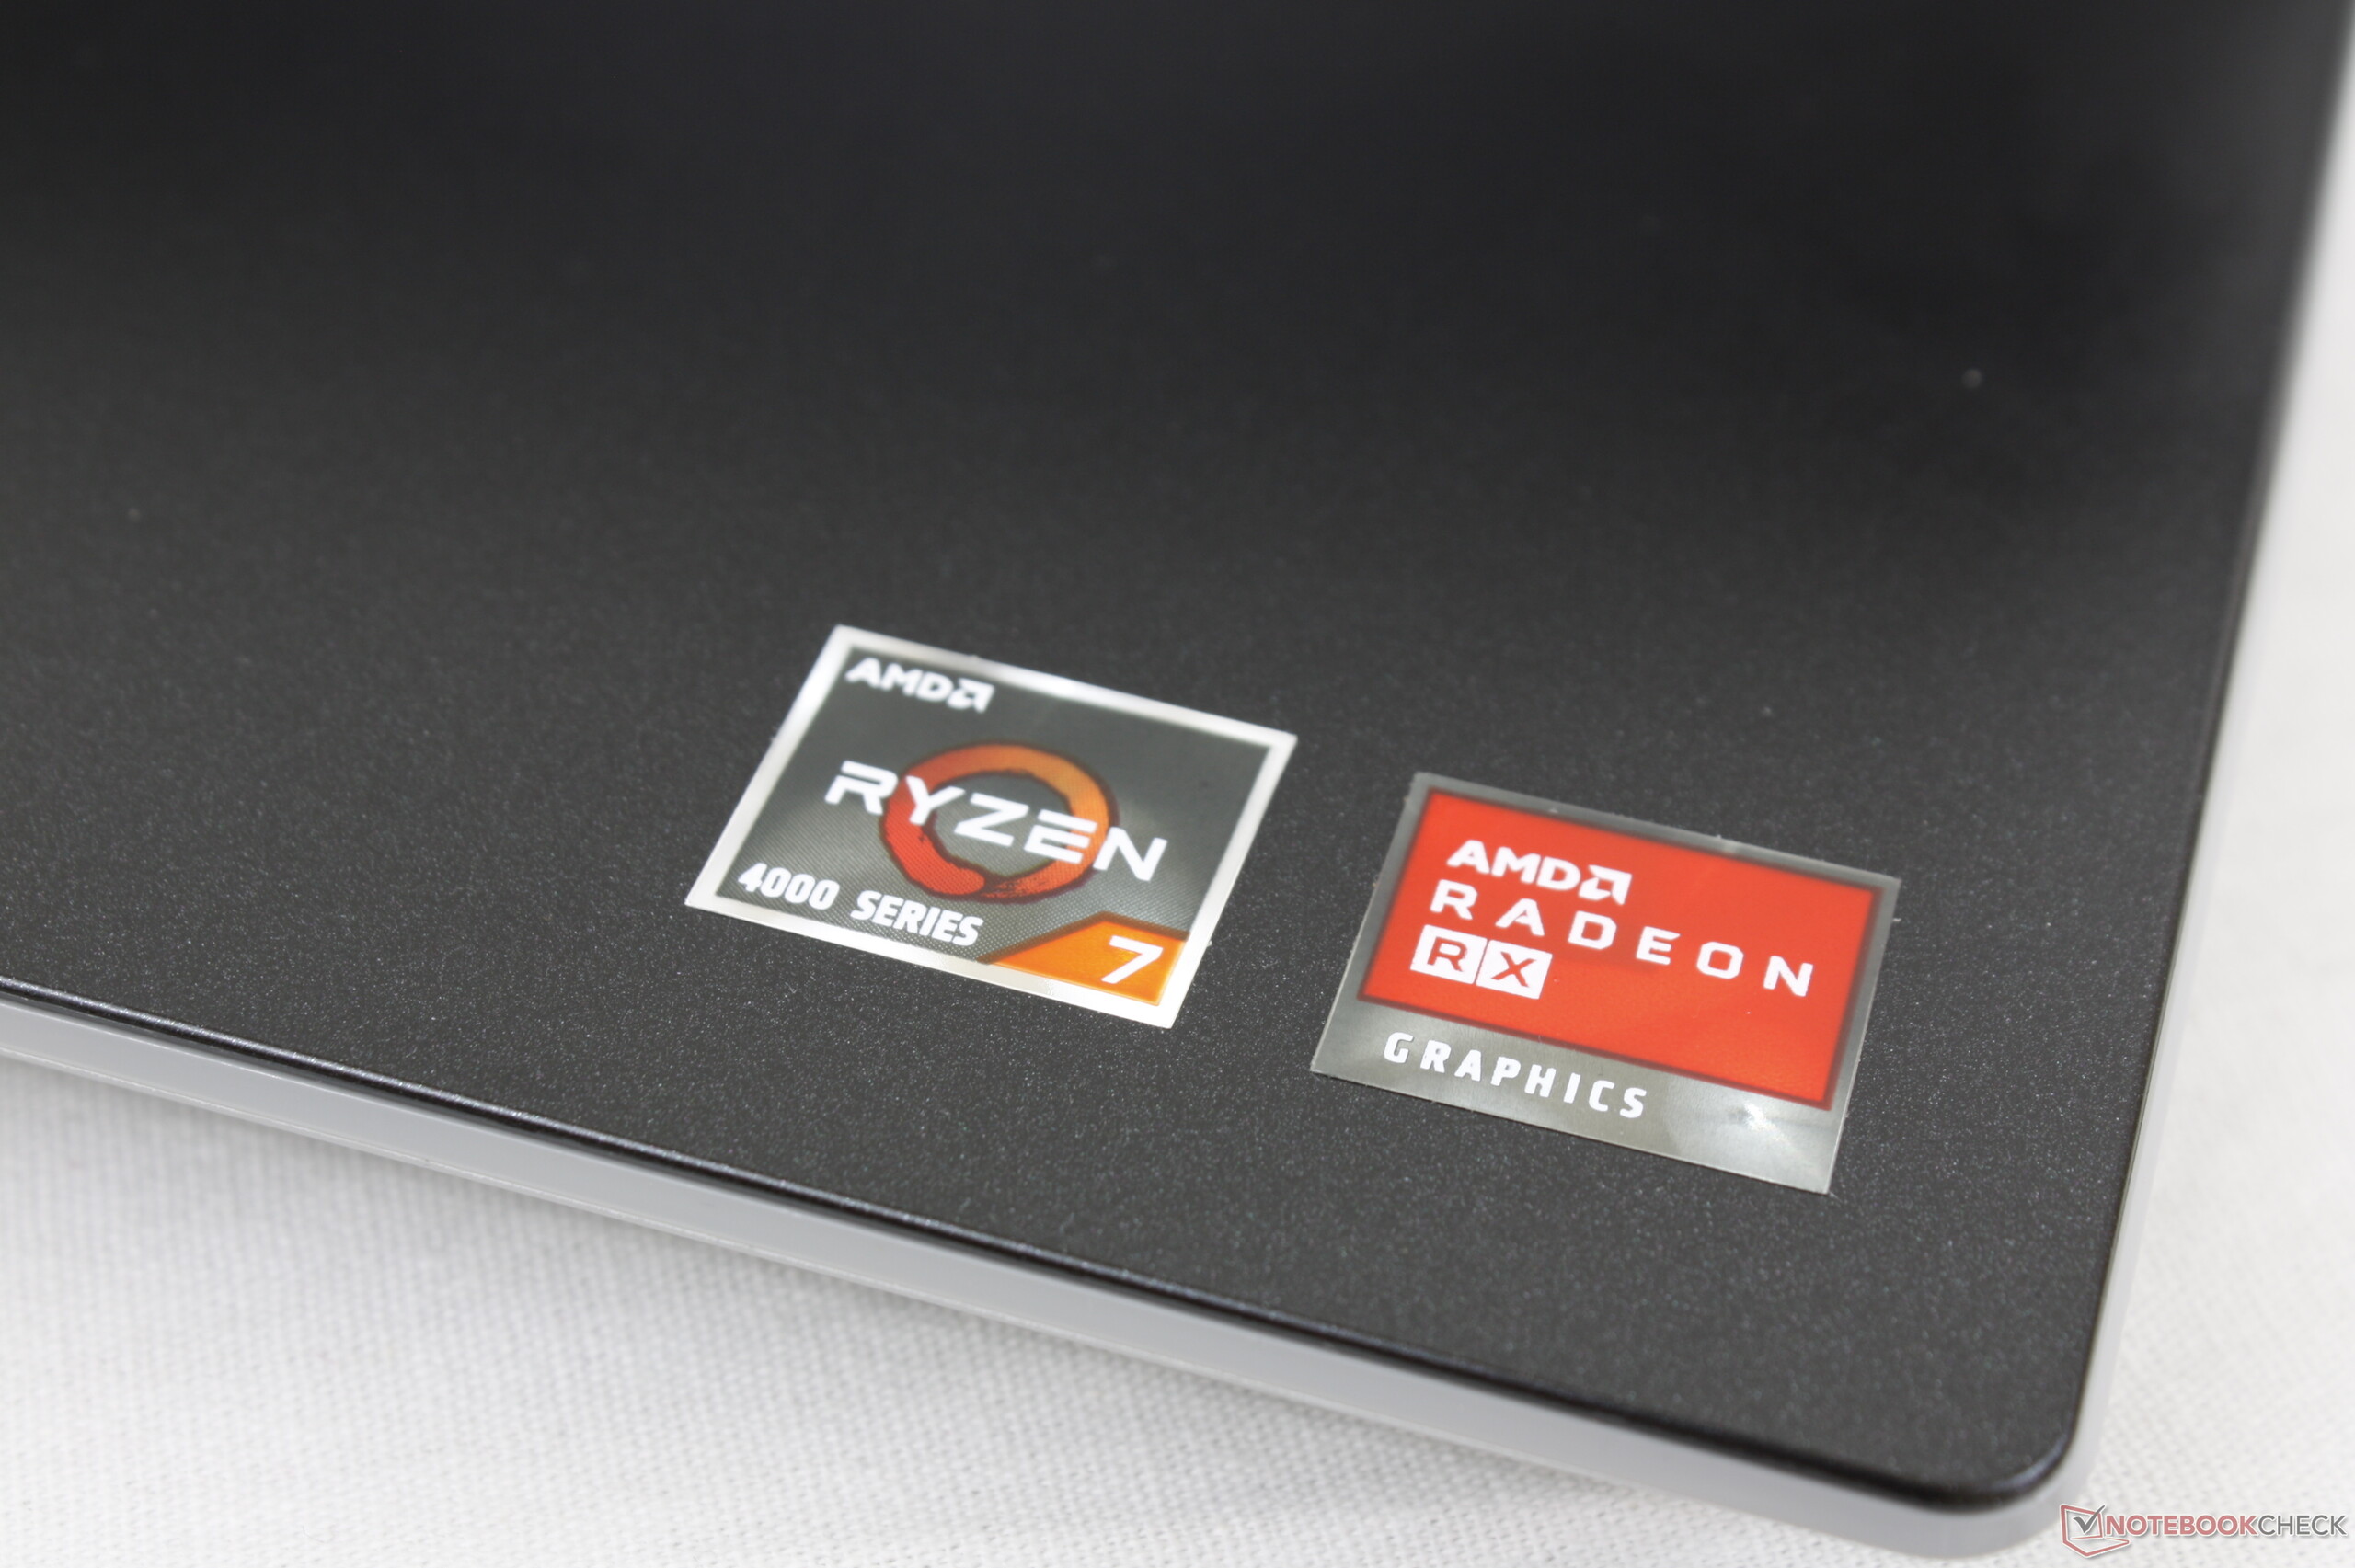
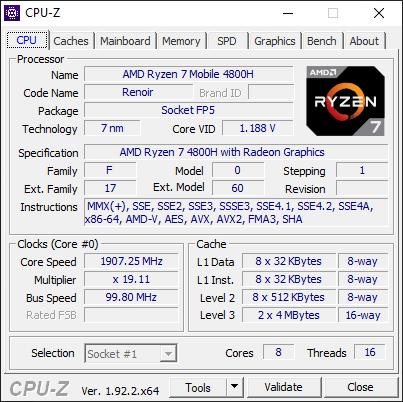
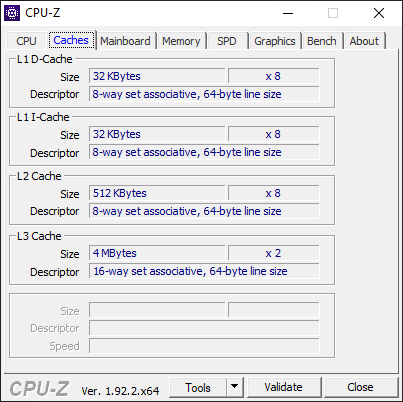
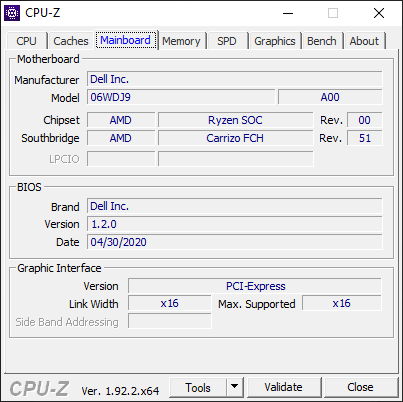
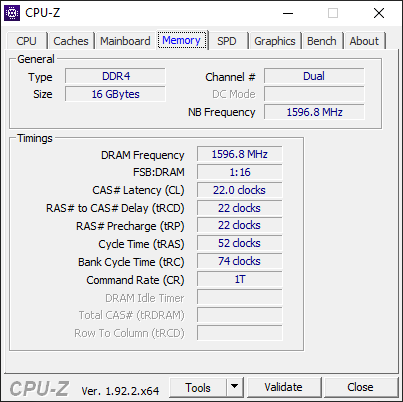
Test du Dell G5 15 Edition Spéciale (Ryzen 7 4800H, RX 5600M, FHD) : tout AMD
Note | Date | Modèle | Poids | Épaisseur | Taille | Résolution | Prix |
|---|---|---|---|---|---|---|---|
| 83.7 % v7 (old) | 08/20 | Dell G5 15 SE 5505 P89F R7 4800H, Radeon RX 5600M | 2.4 kg | 21.6 mm | 15.60" | 1920x1080 | |
| 82.7 % v7 (old) | Asus TUF Gaming A15 FA506IV-HN172 R7 4800H, GeForce RTX 2060 Mobile | 2.2 kg | 24.9 mm | 15.60" | 1920x1080 | ||
| 82.6 % v7 (old) | 11/19 | Dell G5 15 5590-P8RVW i7-9750H, GeForce RTX 2070 Max-Q | 2.8 kg | 23.7 mm | 15.60" | 1920x1080 | |
| 84.8 % v7 (old) | 10/19 | Lenovo Legion Y740-15ICHg i7-9750H, GeForce RTX 2070 Max-Q | 2.3 kg | 25 mm | 15.60" | 1920x1080 | |
| 83.2 % v7 (old) | 06/20 | MSI GP65 10SFK-047US i7-10750H, GeForce RTX 2070 Mobile | 2.3 kg | 27.5 mm | 15.60" | 1920x1080 | |
| 81.5 % v7 (old) | 07/19 | HP Omen 15-dc1020ng i5-9300H, GeForce GTX 1650 Mobile | 2.3 kg | 25 mm | 15.60" | 1920x1080 |
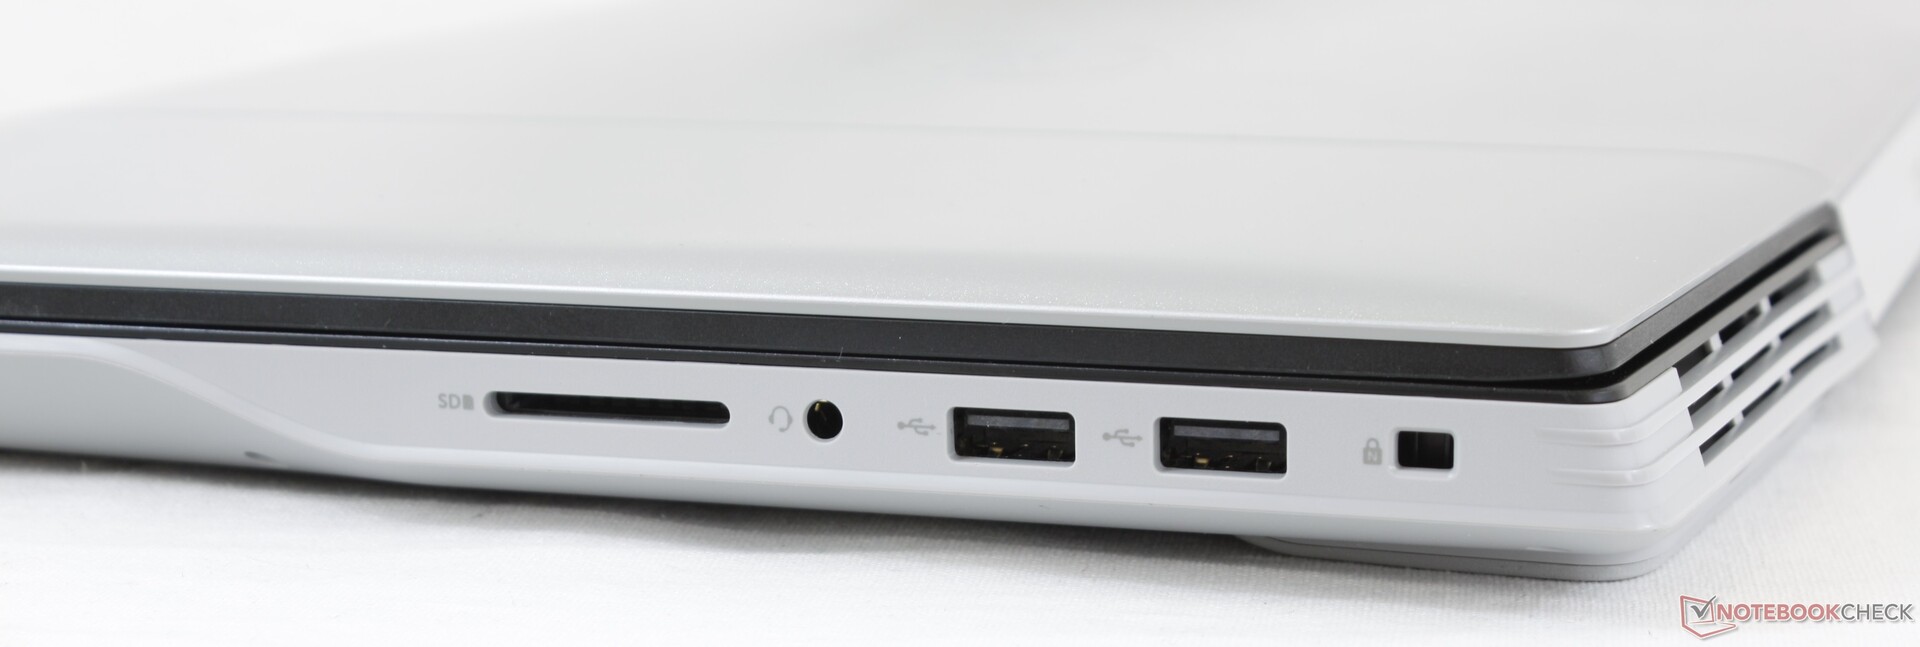
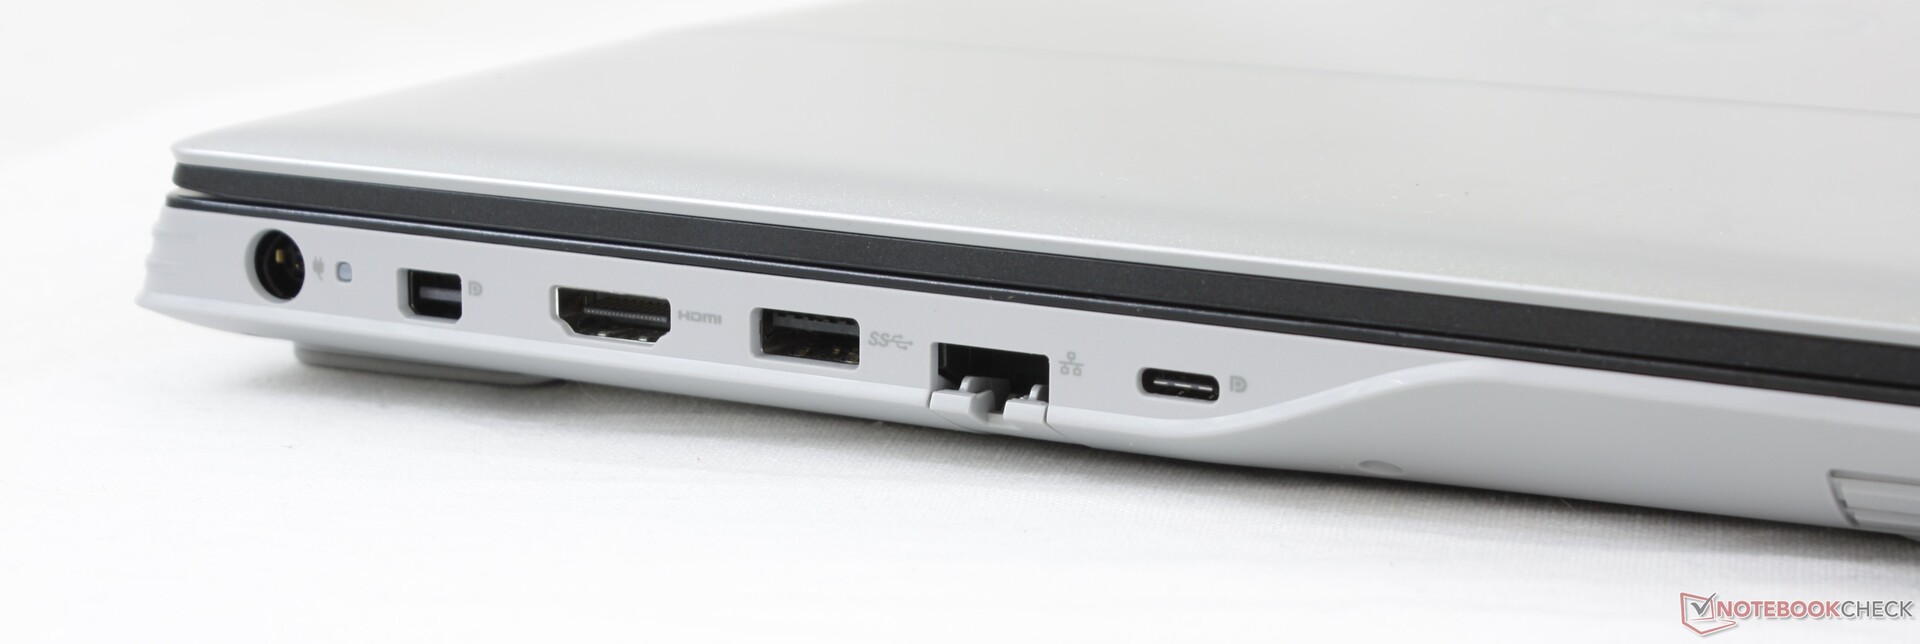
| SD Card Reader | |
| average JPG Copy Test (av. of 3 runs) | |
| HP Omen 15-dc1020ng (Toshiba Exceria Pro SDXC 64 GB UHS-II) | |
| Dell G5 15 SE 5505 P89F (Toshiba Exceria Pro SDXC 64 GB UHS-II) | |
| MSI GP65 10SFK-047US (Toshiba Exceria Pro SDXC 64 GB UHS-II) | |
| Dell G5 15 5590-P8RVW (Toshiba Exceria Pro SDXC 64 GB UHS-II) | |
| maximum AS SSD Seq Read Test (1GB) | |
| HP Omen 15-dc1020ng (Toshiba Exceria Pro SDXC 64 GB UHS-II) | |
| Dell G5 15 SE 5505 P89F (Toshiba Exceria Pro SDXC 64 GB UHS-II) | |
| MSI GP65 10SFK-047US (Toshiba Exceria Pro SDXC 64 GB UHS-II) | |
| Dell G5 15 5590-P8RVW (Toshiba Exceria Pro SDXC 64 GB UHS-II) | |
| Networking | |
| iperf3 transmit AX12 | |
| Dell G5 15 SE 5505 P89F | |
| HP Envy x360 15-dr1679cl | |
| Dell XPS 15 9500 Core i7 4K UHD | |
| Asus TUF Gaming A15 FA506IV-HN172 | |
| iperf3 receive AX12 | |
| Dell G5 15 SE 5505 P89F | |
| Dell XPS 15 9500 Core i7 4K UHD | |
| HP Envy x360 15-dr1679cl | |
| Asus TUF Gaming A15 FA506IV-HN172 | |


| |||||||||||||||||||||||||
Homogénéité de la luminosité: 77 %
Valeur mesurée au centre, sur batterie: 292 cd/m²
Contraste: 1081:1 (Valeurs des noirs: 0.27 cd/m²)
ΔE ColorChecker Calman: 3.99 | ∀{0.5-29.43 Ø4.73}
calibrated: 3.02
ΔE Greyscale Calman: 3.3 | ∀{0.09-98 Ø4.97}
89.7% sRGB (Argyll 1.6.3 3D)
58.1% AdobeRGB 1998 (Argyll 1.6.3 3D)
64.1% AdobeRGB 1998 (Argyll 3D)
90.1% sRGB (Argyll 3D)
63% Display P3 (Argyll 3D)
Gamma: 2.25
CCT: 7047 K
| Dell G5 15 SE 5505 P89F BOE NV156FH, WVA, 15.6", 1920x1080 | Asus TUF Gaming A15 FA506IV-HN172 LM156LF-2F01, IPS, 15.6", 1920x1080 | Dell G5 15 5590-P8RVW AU Optronics B156HAN (AUO80ED), IPS, 15.6", 1920x1080 | Lenovo Legion Y740-15ICHg BOE NV156FHM-N4J, IPS, 15.6", 1920x1080 | HP Omen 15-dc1020ng LGD05CE, IPS, 15.6", 1920x1080 | MSI Alpha 15 A3DDK-034 AU Optronics B156HAN08.0 (AUO80ED), IPS, 15.6", 1920x1080 | |
|---|---|---|---|---|---|---|
| Display | -37% | 3% | 5% | -38% | 3% | |
| Display P3 Coverage (%) | 63 | 38.92 -38% | 65.7 4% | 67.7 7% | 38.37 -39% | 66.4 5% |
| sRGB Coverage (%) | 90.1 | 58.5 -35% | 91.2 1% | 91.6 2% | 57.6 -36% | 91 1% |
| AdobeRGB 1998 Coverage (%) | 64.1 | 40.22 -37% | 66.7 4% | 67.1 5% | 39.69 -38% | 66.6 4% |
| Response Times | -95% | 1% | 7% | -135% | 35% | |
| Response Time Grey 50% / Grey 80% * (ms) | 20.4 ? | 34 ? -67% | 16.4 ? 20% | 19 ? 7% | 40 ? -96% | 7 ? 66% |
| Response Time Black / White * (ms) | 10.8 ? | 24 ? -122% | 12.8 ? -19% | 10 ? 7% | 29.6 ? -174% | 10.4 ? 4% |
| PWM Frequency (Hz) | 198.4 ? | |||||
| Screen | -27% | 4% | 28% | -34% | -5% | |
| Brightness middle (cd/m²) | 292 | 280 -4% | 291 0% | 477 63% | 251 -14% | 310 6% |
| Brightness (cd/m²) | 290 | 254 -12% | 295 2% | 431 49% | 232 -20% | 310 7% |
| Brightness Distribution (%) | 77 | 88 14% | 83 8% | 84 9% | 76 -1% | 86 12% |
| Black Level * (cd/m²) | 0.27 | 0.15 44% | 0.22 19% | 0.175 35% | 0.17 37% | 0.29 -7% |
| Contrast (:1) | 1081 | 1867 73% | 1323 22% | 2726 152% | 1476 37% | 1069 -1% |
| Colorchecker dE 2000 * | 3.99 | 5.89 -48% | 3.95 1% | 4.17 -5% | 6.2 -55% | 4.78 -20% |
| Colorchecker dE 2000 max. * | 6.11 | 19 -211% | 7.46 -22% | 6.97 -14% | 18.6 -204% | 8.1 -33% |
| Colorchecker dE 2000 calibrated * | 3.02 | 4.79 -59% | 2.05 32% | 2.51 17% | 4.8 -59% | 2.36 22% |
| Greyscale dE 2000 * | 3.3 | 4.08 -24% | 3.82 -16% | 3.49 -6% | 4.2 -27% | 4.78 -45% |
| Gamma | 2.25 98% | 2.33 94% | 2.49 88% | 2.5 88% | 2.32 95% | 2.43 91% |
| CCT | 7047 92% | 7303 89% | 7317 89% | 7076 92% | 7454 87% | 7739 84% |
| Color Space (Percent of AdobeRGB 1998) (%) | 58.1 | 37 -36% | 59 2% | 60 3% | 36.5 -37% | 59 2% |
| Color Space (Percent of sRGB) (%) | 89.7 | 58 -35% | 91 1% | 91 1% | 57.4 -36% | 91 1% |
| Moyenne finale (programmes/paramètres) | -53% /
-37% | 3% /
4% | 13% /
21% | -69% /
-48% | 11% /
2% |
* ... Moindre est la valeur, meilleures sont les performances
Temps de réponse de l'écran
| ↔ Temps de réponse noir à blanc | ||
|---|---|---|
| 10.8 ms ... hausse ↗ et chute ↘ combinées | ↗ 6.4 ms hausse | 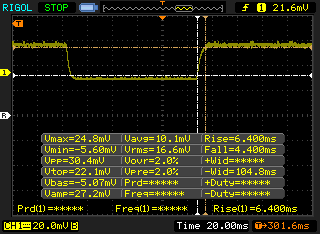 |
| ↘ 4.4 ms chute | ||
| L'écran montre de bons temps de réponse, mais insuffisant pour du jeu compétitif. En comparaison, tous les appareils testés affichent entre 0.1 (minimum) et 240 (maximum) ms. » 29 % des appareils testés affichent de meilleures performances. Cela signifie que les latences relevées sont meilleures que la moyenne (19.9 ms) de tous les appareils testés. | ||
| ↔ Temps de réponse gris 50% à gris 80% | ||
| 20.4 ms ... hausse ↗ et chute ↘ combinées | ↗ 10.8 ms hausse | 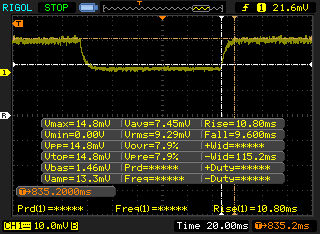 |
| ↘ 9.6 ms chute | ||
| L'écran montre de bons temps de réponse, mais insuffisant pour du jeu compétitif. En comparaison, tous les appareils testés affichent entre 0.165 (minimum) et 636 (maximum) ms. » 33 % des appareils testés affichent de meilleures performances. Cela signifie que les latences relevées sont meilleures que la moyenne (31.1 ms) de tous les appareils testés. | ||
Scintillement / MLI (Modulation de largeur d'impulsion)
| Scintillement / MLI (Modulation de largeur d'impulsion) décelé | 198.4 Hz | ≤ 99 Niveau de luminosité | 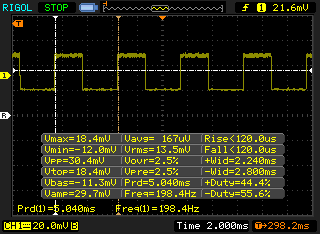 |
Le rétroéclairage de l'écran scintille à la fréquence de 198.4 Hz (certainement du fait de l'utilisation d'une MDI - Modulation de largeur d'impulsion) à un niveau de luminosité inférieur ou égal à 99 % . Aucun scintillement ne devrait être perceptible au-dessus de cette valeur. La fréquence de rafraîchissement de 198.4 Hz est relativement faible, les personnes les plus sensibles devraient percevoir un scintillement et être sujettes à une fatigue oculaire accrue (avec le niveau de luminosité indiqué) En comparaison, 52 % des appareils testés n'emploient pas MDI pour assombrir leur écran. Nous avons relevé une moyenne à 7798 (minimum : 5 - maximum : 343500) Hz dans le cas où une MDI était active. | |||
Cinebench R15: CPU Multi 64Bit | CPU Single 64Bit
Blender: v2.79 BMW27 CPU
7-Zip 18.03: 7z b 4 -mmt1 | 7z b 4
Geekbench 5.5: Single-Core | Multi-Core
HWBOT x265 Benchmark v2.2: 4k Preset
LibreOffice : 20 Documents To PDF
R Benchmark 2.5: Overall mean
| Cinebench R20 / CPU (Multi Core) | |
| AMD Radeon RX Vega 64 | |
| Eurocom Sky X4C i9-9900KS | |
| Dell G5 15 SE 5505 P89F | |
| Asus Zephyrus G14 GA401IV | |
| Moyenne AMD Ryzen 7 4800H (3692 - 4663, n=18) | |
| MSI GE66 Raider 10SFS | |
| Gigabyte Aero 15 OLED XB-8DE51B0SP | |
| MSI GE65 Raider 9SF-049US | |
| Dell XPS 15 9500 Core i7 4K UHD | |
| Acer Nitro 5 AN515-44-R5FT | |
| Schenker XMG Fusion 15 XFU15L19 | |
| MSI GE63 Raider 8SG | |
| MSI Alpha 15 A3DDK-034 | |
| Cinebench R20 / CPU (Single Core) | |
| Gigabyte Aero 15 OLED XB-8DE51B0SP | |
| Eurocom Sky X4C i9-9900KS | |
| AMD Radeon RX Vega 64 | |
| Asus Zephyrus G14 GA401IV | |
| Dell XPS 15 9500 Core i7 4K UHD | |
| Dell G5 15 SE 5505 P89F | |
| Moyenne AMD Ryzen 7 4800H (462 - 491, n=17) | |
| MSI GE66 Raider 10SFS | |
| MSI GE65 Raider 9SF-049US | |
| Schenker XMG Fusion 15 XFU15L19 | |
| Acer Nitro 5 AN515-44-R5FT | |
| MSI GE63 Raider 8SG | |
| MSI Alpha 15 A3DDK-034 | |
| Cinebench R15 / CPU Multi 64Bit | |
| AMD Radeon RX Vega 64 | |
| Dell G5 15 SE 5505 P89F | |
| Eurocom Sky X4C i9-9900KS | |
| Asus Zephyrus G14 GA401IV | |
| Moyenne AMD Ryzen 7 4800H (1652 - 1995, n=21) | |
| Gigabyte Aero 15 OLED XB-8DE51B0SP | |
| MSI GE66 Raider 10SFS | |
| MSI GE65 Raider 9SF-049US | |
| Acer Nitro 5 AN515-44-R5FT | |
| Dell XPS 15 9500 Core i7 4K UHD | |
| Schenker XMG Fusion 15 XFU15L19 | |
| MSI GE63 Raider 8SG | |
| MSI Alpha 15 A3DDK-034 | |
| Cinebench R15 / CPU Single 64Bit | |
| Eurocom Sky X4C i9-9900KS | |
| Gigabyte Aero 15 OLED XB-8DE51B0SP | |
| MSI GE66 Raider 10SFS | |
| AMD Radeon RX Vega 64 | |
| Dell XPS 15 9500 Core i7 4K UHD | |
| MSI GE65 Raider 9SF-049US | |
| Asus Zephyrus G14 GA401IV | |
| Dell G5 15 SE 5505 P89F | |
| Moyenne AMD Ryzen 7 4800H (186 - 191, n=15) | |
| Schenker XMG Fusion 15 XFU15L19 | |
| Acer Nitro 5 AN515-44-R5FT | |
| MSI GE63 Raider 8SG | |
| MSI Alpha 15 A3DDK-034 | |
| Blender / v2.79 BMW27 CPU | |
| Schenker XMG Fusion 15 XFU15L19 | |
| Dell XPS 15 9500 Core i7 4K UHD | |
| Acer Nitro 5 AN515-44-R5FT | |
| Asus Zephyrus G14 GA401IV | |
| Gigabyte Aero 15 OLED XB-8DE51B0SP | |
| MSI GE66 Raider 10SFS | |
| Dell G5 15 SE 5505 P89F | |
| Moyenne AMD Ryzen 7 4800H (248 - 299, n=15) | |
| Eurocom Sky X4C i9-9900KS | |
| AMD Radeon RX Vega 64 | |
| 7-Zip 18.03 / 7z b 4 -mmt1 | |
| Eurocom Sky X4C i9-9900KS | |
| MSI GE66 Raider 10SFS | |
| Gigabyte Aero 15 OLED XB-8DE51B0SP | |
| Dell XPS 15 9500 Core i7 4K UHD | |
| AMD Radeon RX Vega 64 | |
| Schenker XMG Fusion 15 XFU15L19 | |
| Moyenne AMD Ryzen 7 4800H (4575 - 4743, n=15) | |
| Dell G5 15 SE 5505 P89F | |
| Asus Zephyrus G14 GA401IV | |
| Acer Nitro 5 AN515-44-R5FT | |
| 7-Zip 18.03 / 7z b 4 | |
| AMD Radeon RX Vega 64 | |
| Eurocom Sky X4C i9-9900KS | |
| Moyenne AMD Ryzen 7 4800H (44827 - 53883, n=15) | |
| Dell G5 15 SE 5505 P89F | |
| Asus Zephyrus G14 GA401IV | |
| Gigabyte Aero 15 OLED XB-8DE51B0SP | |
| MSI GE66 Raider 10SFS | |
| Acer Nitro 5 AN515-44-R5FT | |
| Dell XPS 15 9500 Core i7 4K UHD | |
| Schenker XMG Fusion 15 XFU15L19 | |
| Geekbench 5.5 / Single-Core | |
| Eurocom Sky X4C i9-9900KS | |
| MSI GE66 Raider 10SFS | |
| Gigabyte Aero 15 OLED XB-8DE51B0SP | |
| Dell XPS 15 9500 Core i7 4K UHD | |
| AMD Radeon RX Vega 64 | |
| Schenker XMG Fusion 15 XFU15L19 | |
| Asus Zephyrus G14 GA401IV | |
| Moyenne AMD Ryzen 7 4800H (1154 - 1207, n=17) | |
| Dell G5 15 SE 5505 P89F | |
| Acer Nitro 5 AN515-44-R5FT | |
| MSI Alpha 15 A3DDK-034 | |
| Geekbench 5.5 / Multi-Core | |
| Eurocom Sky X4C i9-9900KS | |
| AMD Radeon RX Vega 64 | |
| MSI GE66 Raider 10SFS | |
| Gigabyte Aero 15 OLED XB-8DE51B0SP | |
| Dell XPS 15 9500 Core i7 4K UHD | |
| Dell G5 15 SE 5505 P89F | |
| Moyenne AMD Ryzen 7 4800H (5920 - 8672, n=17) | |
| Asus Zephyrus G14 GA401IV | |
| Schenker XMG Fusion 15 XFU15L19 | |
| Acer Nitro 5 AN515-44-R5FT | |
| MSI Alpha 15 A3DDK-034 | |
| HWBOT x265 Benchmark v2.2 / 4k Preset | |
| AMD Radeon RX Vega 64 | |
| Eurocom Sky X4C i9-9900KS | |
| Gigabyte Aero 15 OLED XB-8DE51B0SP | |
| MSI GE66 Raider 10SFS | |
| Dell G5 15 SE 5505 P89F | |
| Moyenne AMD Ryzen 7 4800H (10.8 - 14.1, n=16) | |
| Asus Zephyrus G14 GA401IV | |
| Schenker XMG Fusion 15 XFU15L19 | |
| Dell XPS 15 9500 Core i7 4K UHD | |
| Acer Nitro 5 AN515-44-R5FT | |
| LibreOffice / 20 Documents To PDF | |
| Dell G5 15 SE 5505 P89F | |
| Acer Nitro 5 AN515-44-R5FT | |
| Moyenne AMD Ryzen 7 4800H (28.6 - 95.8, n=14) | |
| Schenker XMG Fusion 15 XFU15L19 | |
| MSI GE66 Raider 10SFS | |
| Dell XPS 15 9500 Core i7 4K UHD | |
| Gigabyte Aero 15 OLED XB-8DE51B0SP | |
| R Benchmark 2.5 / Overall mean | |
| Acer Nitro 5 AN515-44-R5FT | |
| Schenker XMG Fusion 15 XFU15L19 | |
| Dell XPS 15 9500 Core i7 4K UHD | |
| Moyenne AMD Ryzen 7 4800H (0.562 - 0.603, n=15) | |
| Dell G5 15 SE 5505 P89F | |
| MSI GE66 Raider 10SFS | |
| Gigabyte Aero 15 OLED XB-8DE51B0SP | |
Cinebench R15: CPU Multi 64Bit | CPU Single 64Bit
Blender: v2.79 BMW27 CPU
7-Zip 18.03: 7z b 4 -mmt1 | 7z b 4
Geekbench 5.5: Single-Core | Multi-Core
HWBOT x265 Benchmark v2.2: 4k Preset
LibreOffice : 20 Documents To PDF
R Benchmark 2.5: Overall mean
* ... Moindre est la valeur, meilleures sont les performances
| PCMark 10 | |
| Score | |
| MSI GP65 10SFK-047US | |
| Lenovo Legion Y740-15ICHg | |
| Dell G5 15 SE 5505 P89F | |
| Dell G5 15 5590-P8RVW | |
| Asus TUF Gaming A15 FA506IV-HN172 | |
| HP Omen 15-dc1020ng | |
| MSI Alpha 15 A3DDK-034 | |
| Essentials | |
| MSI GP65 10SFK-047US | |
| Dell G5 15 SE 5505 P89F | |
| Lenovo Legion Y740-15ICHg | |
| Dell G5 15 5590-P8RVW | |
| Asus TUF Gaming A15 FA506IV-HN172 | |
| HP Omen 15-dc1020ng | |
| MSI Alpha 15 A3DDK-034 | |
| Productivity | |
| MSI GP65 10SFK-047US | |
| Lenovo Legion Y740-15ICHg | |
| Dell G5 15 SE 5505 P89F | |
| HP Omen 15-dc1020ng | |
| Asus TUF Gaming A15 FA506IV-HN172 | |
| Dell G5 15 5590-P8RVW | |
| MSI Alpha 15 A3DDK-034 | |
| Digital Content Creation | |
| Lenovo Legion Y740-15ICHg | |
| Dell G5 15 SE 5505 P89F | |
| MSI GP65 10SFK-047US | |
| Dell G5 15 5590-P8RVW | |
| Asus TUF Gaming A15 FA506IV-HN172 | |
| MSI Alpha 15 A3DDK-034 | |
| HP Omen 15-dc1020ng | |
| PCMark 8 | |
| Home Score Accelerated v2 | |
| Lenovo Legion Y740-15ICHg | |
| Dell G5 15 SE 5505 P89F | |
| Asus TUF Gaming A15 FA506IV-HN172 | |
| MSI GP65 10SFK-047US | |
| MSI Alpha 15 A3DDK-034 | |
| HP Omen 15-dc1020ng | |
| Work Score Accelerated v2 | |
| MSI GP65 10SFK-047US | |
| Lenovo Legion Y740-15ICHg | |
| Asus TUF Gaming A15 FA506IV-HN172 | |
| Dell G5 15 SE 5505 P89F | |
| HP Omen 15-dc1020ng | |
| MSI Alpha 15 A3DDK-034 | |
| PCMark 8 Home Score Accelerated v2 | 4894 points | |
| PCMark 8 Work Score Accelerated v2 | 5352 points | |
| PCMark 10 Score | 5936 points | |
Aide | ||
| DPC Latencies / LatencyMon - interrupt to process latency (max), Web, Youtube, Prime95 | |
| Dell XPS 15 9500 Core i7 4K UHD | |
| HP Envy x360 15-dr1679cl | |
| Dell G5 15 SE 5505 P89F | |
| Gigabyte Aero 15 OLED XB-8DE51B0SP | |
| MSI GP65 10SFK-047US | |
| Acer Nitro 5 AN515-44-R5FT | |
| MSI GE66 Raider 10SFS | |
| Asus TUF Gaming A15 FA506IV-HN172 | |
* ... Moindre est la valeur, meilleures sont les performances
| Dell G5 15 SE 5505 P89F Samsung PM991 MZ9LQ512HALU | Dell G5 15 5590-P8RVW SK Hynix BC501 HFM512GDJTNG | Asus TUF Gaming A15 FA506IV-HN172 Kingston OM8PCP3512F-AB | HP Omen 15-dc1020ng WDC PC SN720 SDAQNTW-512G | MSI Alpha 15 A3DDK-034 Kingston RBUSNS8154P3512GJ | |
|---|---|---|---|---|---|
| AS SSD | -10% | -3% | 48% | -12% | |
| Seq Read (MB/s) | 1386 | 1221 -12% | 1682 21% | 2955 113% | 1423 3% |
| Seq Write (MB/s) | 1234 | 731 -41% | 904 -27% | 2440 98% | 958 -22% |
| 4K Read (MB/s) | 41.32 | 37.93 -8% | 60.2 46% | 40.56 -2% | 33.2 -20% |
| 4K Write (MB/s) | 128 | 88.1 -31% | 164.8 29% | 118.6 -7% | 80.7 -37% |
| 4K-64 Read (MB/s) | 854 | 778 -9% | 472.5 -45% | 1283 50% | 816 -4% |
| 4K-64 Write (MB/s) | 721 | 552 -23% | 845 17% | 1538 113% | 708 -2% |
| Access Time Read * (ms) | 0.098 | 0.091 7% | 0.087 11% | 0.084 14% | 0.1 -2% |
| Access Time Write * (ms) | 0.095 | 0.043 55% | 0.02 79% | 0.032 66% | 0.047 51% |
| Score Read (Points) | 1034 | 938 -9% | 701 -32% | 1619 57% | 991 -4% |
| Score Write (Points) | 973 | 713 -27% | 1101 13% | 1901 95% | 885 -9% |
| Score Total (Points) | 2536 | 2114 -17% | 2143 -15% | 4323 70% | 2365 -7% |
| Copy ISO MB/s (MB/s) | 1284 | 675 -47% | 1418 10% | 1043 -19% | |
| Copy Program MB/s (MB/s) | 401.9 | 248.4 -38% | 392.5 -2% | 252.7 -37% | |
| Copy Game MB/s (MB/s) | 1013 | 535 -47% | 907 -10% | 483.6 -52% | |
| CrystalDiskMark 5.2 / 6 | -32% | 1% | 22% | -25% | |
| Write 4K (MB/s) | 142.1 | 64.6 -55% | 219.8 55% | 112.1 -21% | 105.4 -26% |
| Read 4K (MB/s) | 46.43 | 35.64 -23% | 50.2 8% | 42.01 -10% | 33.24 -28% |
| Write Seq (MB/s) | 1108 | 748 -32% | 979 -12% | 1964 77% | 1029 -7% |
| Read Seq (MB/s) | 1622 | 1039 -36% | 1990 23% | 2065 27% | 1098 -32% |
| Write 4K Q32T1 (MB/s) | 467 | 435.7 -7% | 516 10% | 318.2 -32% | 322.1 -31% |
| Read 4K Q32T1 (MB/s) | 525 | 292.4 -44% | 298.3 -43% | 406.7 -23% | 352 -33% |
| Write Seq Q32T1 (MB/s) | 1203 | 870 -28% | 982 -18% | 2534 111% | 1036 -14% |
| Read Seq Q32T1 (MB/s) | 2288 | 1557 -32% | 1907 -17% | 3438 50% | 1606 -30% |
| Write 4K Q8T8 (MB/s) | 981 | ||||
| Read 4K Q8T8 (MB/s) | 300.9 | ||||
| Moyenne finale (programmes/paramètres) | -21% /
-20% | -1% /
-1% | 35% /
38% | -19% /
-16% |
* ... Moindre est la valeur, meilleures sont les performances

Disk Throttling: DiskSpd Read Loop, Queue Depth 8
| 3DMark 06 Standard Score | 38139 points | |
| 3DMark Vantage P Result | 18582 points | |
| 3DMark 11 Performance | 21400 points | |
| 3DMark Ice Storm Standard Score | 76143 points | |
| 3DMark Cloud Gate Standard Score | 36805 points | |
| 3DMark Fire Strike Score | 16652 points | |
| 3DMark Time Spy Score | 6610 points | |
Aide | ||
| Shadow of the Tomb Raider - 1920x1080 Highest Preset AA:T | |
| MSI GE66 Raider 10SFS | |
| Lenovo Legion Y740-17IRH | |
| Eluktronics RP-15 | |
| Moyenne NVIDIA GeForce RTX 2060 Mobile (54 - 86, n=22) | |
| Asus Zephyrus G14 GA401IV | |
| Dell G5 15 SE 5505 P89F | |
| MSI Bravo 17 A4DDR | |
| Acer Nitro 5 AN515-44-R5FT | |
| Razer Blade Stealth Core i7 GTX 1650 Ti Max-Q 4K | |
| MSI Prestige 14 A10RD | |
| The Witcher 3 - 1920x1080 Ultra Graphics & Postprocessing (HBAO+) | |
| MSI GE66 Raider 10SFS | |
| Dell G5 15 SE 5505 P89F | |
| Eluktronics RP-15 | |
| Moyenne NVIDIA GeForce RTX 2060 Mobile (50.6 - 74, n=40) | |
| Lenovo Legion Y740-17IRH | |
| Asus Zephyrus G14 GA401IV | |
| MSI Bravo 17 A4DDR | |
| Acer Nitro 5 AN515-44-R5FT | |
| Razer Blade Stealth Core i7 GTX 1650 Ti Max-Q 4K | |
| Asus ZenBook 15 UX534FTC-A8190T | |
| MSI Prestige 14 A10RD | |
| Borderlands 3 - 1920x1080 Badass Overall Quality (DX11) | |
| MSI GE66 Raider 10SFS | |
| Lenovo Legion Y740-17IRH | |
| Moyenne NVIDIA GeForce RTX 2060 Mobile (47.5 - 57.3, n=7) | |
| Asus Zephyrus G14 GA401IV | |
| Dell G5 15 SE 5505 P89F | |
| Eluktronics RP-15 | |
| NVIDIA GeForce GTX 1060 | |
| MSI Bravo 17 A4DDR | |
| Acer Nitro 5 AN515-44-R5FT | |
| Razer Blade Stealth Core i7 GTX 1650 Ti Max-Q 4K | |
| Asus ZenBook 15 UX534FTC-A8190T | |
| MSI Prestige 14 A10RD | |
| Bas | Moyen | Élevé | Ultra | |
|---|---|---|---|---|
| The Witcher 3 (2015) | 266.4 | 103.6 | 66.1 | |
| Dota 2 Reborn (2015) | 124 | 119 | 106 | 102 |
| X-Plane 11.11 (2018) | 48.2 | 37.6 | 33.7 | |
| Shadow of the Tomb Raider (2018) | 122 | 89 | 83 | 68 |
| Assassin´s Creed Odyssey (2018) | 78 | 67 | 60 | 49 |
| Apex Legends (2019) | 143.7 | 137.1 | 110.7 | 104.1 |
| Far Cry New Dawn (2019) | 91 | 77 | 74 | 67 |
| Metro Exodus (2019) | 146.4 | 75.5 | 55.2 | 44.9 |
| Dirt Rally 2.0 (2019) | 215 | 135 | 113.6 | 77.3 |
| The Division 2 (2019) | 129 | 93 | 75 | 57 |
| Anno 1800 (2019) | 80.4 | 79.1 | 63.5 | 40 |
| Total War: Three Kingdoms (2019) | 196.8 | 96.9 | 64.9 | 44.2 |
| F1 2019 (2019) | 191 | 140 | 114 | 106 |
| Control (2019) | 176.7 | 72.3 | 53.1 | |
| Borderlands 3 (2019) | 105.2 | 81.7 | 61.2 | 47.8 |
| Ghost Recon Breakpoint (2019) | 96 | 76 | 68 | 50 |
| GRID 2019 (2019) | 186.2 | 134.3 | 116.6 | 88.6 |
| Need for Speed Heat (2019) | 86.9 | 76.6 | 70.1 | 60.1 |
| Star Wars Jedi Fallen Order (2019) | 76 | 68.4 | 67.1 | |
| Hunt Showdown (2020) | 150.7 | 91.3 | 66.2 | |
| Doom Eternal (2020) | 232.3 | 144.7 | 124 | 114.6 |
| Gears Tactics (2020) | 137.8 | 135.7 | 96.1 | 70.6 |
| Dell G5 15 SE 5505 P89F Radeon RX 5600M, R7 4800H, Samsung PM991 MZ9LQ512HALU | Dell G5 15 5590-P8RVW GeForce RTX 2070 Max-Q, i7-9750H, SK Hynix BC501 HFM512GDJTNG | Asus TUF Gaming A15 FA506IV-HN172 GeForce RTX 2060 Mobile, R7 4800H, Kingston OM8PCP3512F-AB | HP Omen 15-dc1020ng GeForce GTX 1650 Mobile, i5-9300H, WDC PC SN720 SDAQNTW-512G | MSI Alpha 15 A3DDK-034 Radeon RX 5500M, R7 3750H, Kingston RBUSNS8154P3512GJ | Lenovo Legion Y740-15ICHg GeForce RTX 2070 Max-Q, i7-9750H, WDC PC SN520 SDAPMUW-128G | |
|---|---|---|---|---|---|---|
| Noise | -20% | -10% | 0% | -32% | -10% | |
| arrêt / environnement * (dB) | 28 | 30 -7% | 30.2 -8% | 28.8 -3% | 29 -4% | 30 -7% |
| Idle Minimum * (dB) | 28 | 32 -14% | 30.2 -8% | 28.8 -3% | 36 -29% | 31.3 -12% |
| Idle Average * (dB) | 28 | 33 -18% | 30.2 -8% | 29.5 -5% | 37 -32% | 31.3 -12% |
| Idle Maximum * (dB) | 28 | 34 -21% | 30.2 -8% | 31.1 -11% | 46 -64% | 31.3 -12% |
| Load Average * (dB) | 28 | 50 -79% | 40 -43% | 35.2 -26% | 50 -79% | 42 -50% |
| Witcher 3 ultra * (dB) | 50.6 | 50 1% | 49 3% | 35.2 30% | 51 -1% | 42.1 17% |
| Load Maximum * (dB) | 50.6 | 52 -3% | 49 3% | 41 19% | 57 -13% | 46.5 8% |
* ... Moindre est la valeur, meilleures sont les performances
Degré de la nuisance sonore
| Au repos |
| 28 / 28 / 28 dB(A) |
| Fortement sollicité |
| 28 / 50.6 dB(A) |
 | ||
30 dB silencieux 40 dB(A) audible 50 dB(A) bruyant |
||
min: | ||
(-) La température maximale du côté supérieur est de 53 °C / 127 F, par rapport à la moyenne de 40.4 °C / 105 F, allant de 21.2 à 68.8 °C pour la classe Gaming.
(-) Le fond chauffe jusqu'à un maximum de 57.6 °C / 136 F, contre une moyenne de 43.2 °C / 110 F
(+) En utilisation inactive, la température moyenne du côté supérieur est de 25.4 °C / 78 F, par rapport à la moyenne du dispositif de 33.9 °C / 93 F.
(-) En jouant à The Witcher 3, la température moyenne du côté supérieur est de 44.2 °C / 112 F, alors que la moyenne de l'appareil est de 33.9 °C / 93 F.
(±) Les repose-poignets et le pavé tactile peuvent devenir très chauds au toucher, avec un maximum de 37.2 °C / 99# F.
(-) La température moyenne de la zone de l'appui-paume de dispositifs similaires était de 28.8 °C / 83.8 F (-8.4 °C / #-15.2 F).
| Éteint/en veille | |
| Au repos | |
| Fortement sollicité |
|
Légende:
min: | |
| Dell G5 15 SE 5505 P89F R7 4800H, Radeon RX 5600M, Samsung PM991 MZ9LQ512HALU, WVA, 1920x1080, 15.6" | Dell G5 15 5590-P8RVW i7-9750H, GeForce RTX 2070 Max-Q, SK Hynix BC501 HFM512GDJTNG, IPS, 1920x1080, 15.6" | Asus TUF Gaming A15 FA506IV-HN172 R7 4800H, GeForce RTX 2060 Mobile, Kingston OM8PCP3512F-AB, IPS, 1920x1080, 15.6" | HP Omen 15-dc1020ng i5-9300H, GeForce GTX 1650 Mobile, WDC PC SN720 SDAQNTW-512G, IPS, 1920x1080, 15.6" | MSI Alpha 15 A3DDK-034 R7 3750H, Radeon RX 5500M, Kingston RBUSNS8154P3512GJ, IPS, 1920x1080, 15.6" | Schenker XMG Core 15 GK5CP6V i7-9750H, GeForce GTX 1660 Ti Mobile, Samsung SSD 970 EVO Plus 500GB, IPS, 1920x1080, 15.6" | |
|---|---|---|---|---|---|---|
| Power Consumption | -24% | -1% | 22% | -57% | -16% | |
| Idle Minimum * (Watt) | 6.5 | 5 23% | 5.4 17% | 4.04 38% | 14 -115% | 9 -38% |
| Idle Average * (Watt) | 10.6 | 13 -23% | 10 6% | 7.2 32% | 18 -70% | 12 -13% |
| Idle Maximum * (Watt) | 11 | 23 -109% | 10.5 5% | 11.4 -4% | 32 -191% | 18 -64% |
| Load Average * (Watt) | 84.1 | 121 -44% | 135 -61% | 80.8 4% | 64 24% | 86 -2% |
| Witcher 3 ultra * (Watt) | 152.9 | 133 13% | 144 6% | 93.6 39% | 123 20% | 126 18% |
| Load Maximum * (Watt) | 180.4 | 184 -2% | 147 19% | 144.5 20% | 193 -7% | 173 4% |
* ... Moindre est la valeur, meilleures sont les performances
| Dell G5 15 SE 5505 P89F R7 4800H, Radeon RX 5600M, 51 Wh | Dell G5 15 5590-P8RVW i7-9750H, GeForce RTX 2070 Max-Q, 90 Wh | Asus TUF Gaming A15 FA506IV-HN172 R7 4800H, GeForce RTX 2060 Mobile, 48 Wh | HP Omen 15-dc1020ng i5-9300H, GeForce GTX 1650 Mobile, 52.5 Wh | MSI Alpha 15 A3DDK-034 R7 3750H, Radeon RX 5500M, 51 Wh | Lenovo Legion Y740-15ICHg i7-9750H, GeForce RTX 2070 Max-Q, 57 Wh | |
|---|---|---|---|---|---|---|
| Autonomie de la batterie | -8% | 5% | 8% | -43% | -52% | |
| Reader / Idle (h) | 11.2 | 8.6 -23% | 9.8 -12% | 15.9 42% | 5.8 -48% | |
| WiFi v1.3 (h) | 6.2 | 5.7 -8% | 6.2 0% | 6.4 3% | 4.1 -34% | 3 -52% |
| Load (h) | 1.5 | 1.6 7% | 1.9 27% | 1.2 -20% | 0.8 -47% | |
| Witcher 3 ultra (h) | 1 |
Points positifs
Points négatifs

Un PC portable de jeu de 15,6 pouces avec un processeur Core i7-9750H et une carte graphique GeForce RTX 2060 coûte environ 1200 $. Le Dell G5 15 SE tout AMD peut être équipé d'un Ryzen 5 4600H et d'une Radeon RX 5600M pour des performances similaires pour environ 300 $ de moins. Le rapport performances / prix est de ce fait le principal argument de l'appareil, sur un marché toujours dominé par le duo Intel - Nvidia.
Il faut cependant garder à l'esprit les défauts de la machine, dont les principaux sont des températures et un niveau sonore très élevés. Il faut s'attendre à des températures élevées du processeur dans un portable de jeu, mais les 95 °C en jeu avec des ventilateurs au maximum ne laissent pas une bonne impression, surtout pour la longévité du système.
Les autres défauts sont principalement liés au prix de l'appareil. Les fuites de lumière notables, les ports USB 2.0, l'absence d'adaptative sync ou de version 60 Hz, et le châssis tout en plastique sont des compromis classiques pour un portable de jeu à moins de 1000 $. Mais du point de vue des performances, de la maintenance et de l'écran, on s'attendrait à un appareil à quelques centaines d'euros de plus, malgré ces défauts.
Nous avons là un appareil puissant à un prix réduit. Il faut garder à l'esprit que ce niveau de performances impressionnant se fait au prix de températures et d'un niveau sonore très impressionnants.
L’intégralité de cette critique est disponible en anglais en suivant ce lien.
Dell G5 15 SE 5505 P89F
- 06/24/2020 v7 (old)
Allen Ngo
Price comparison
