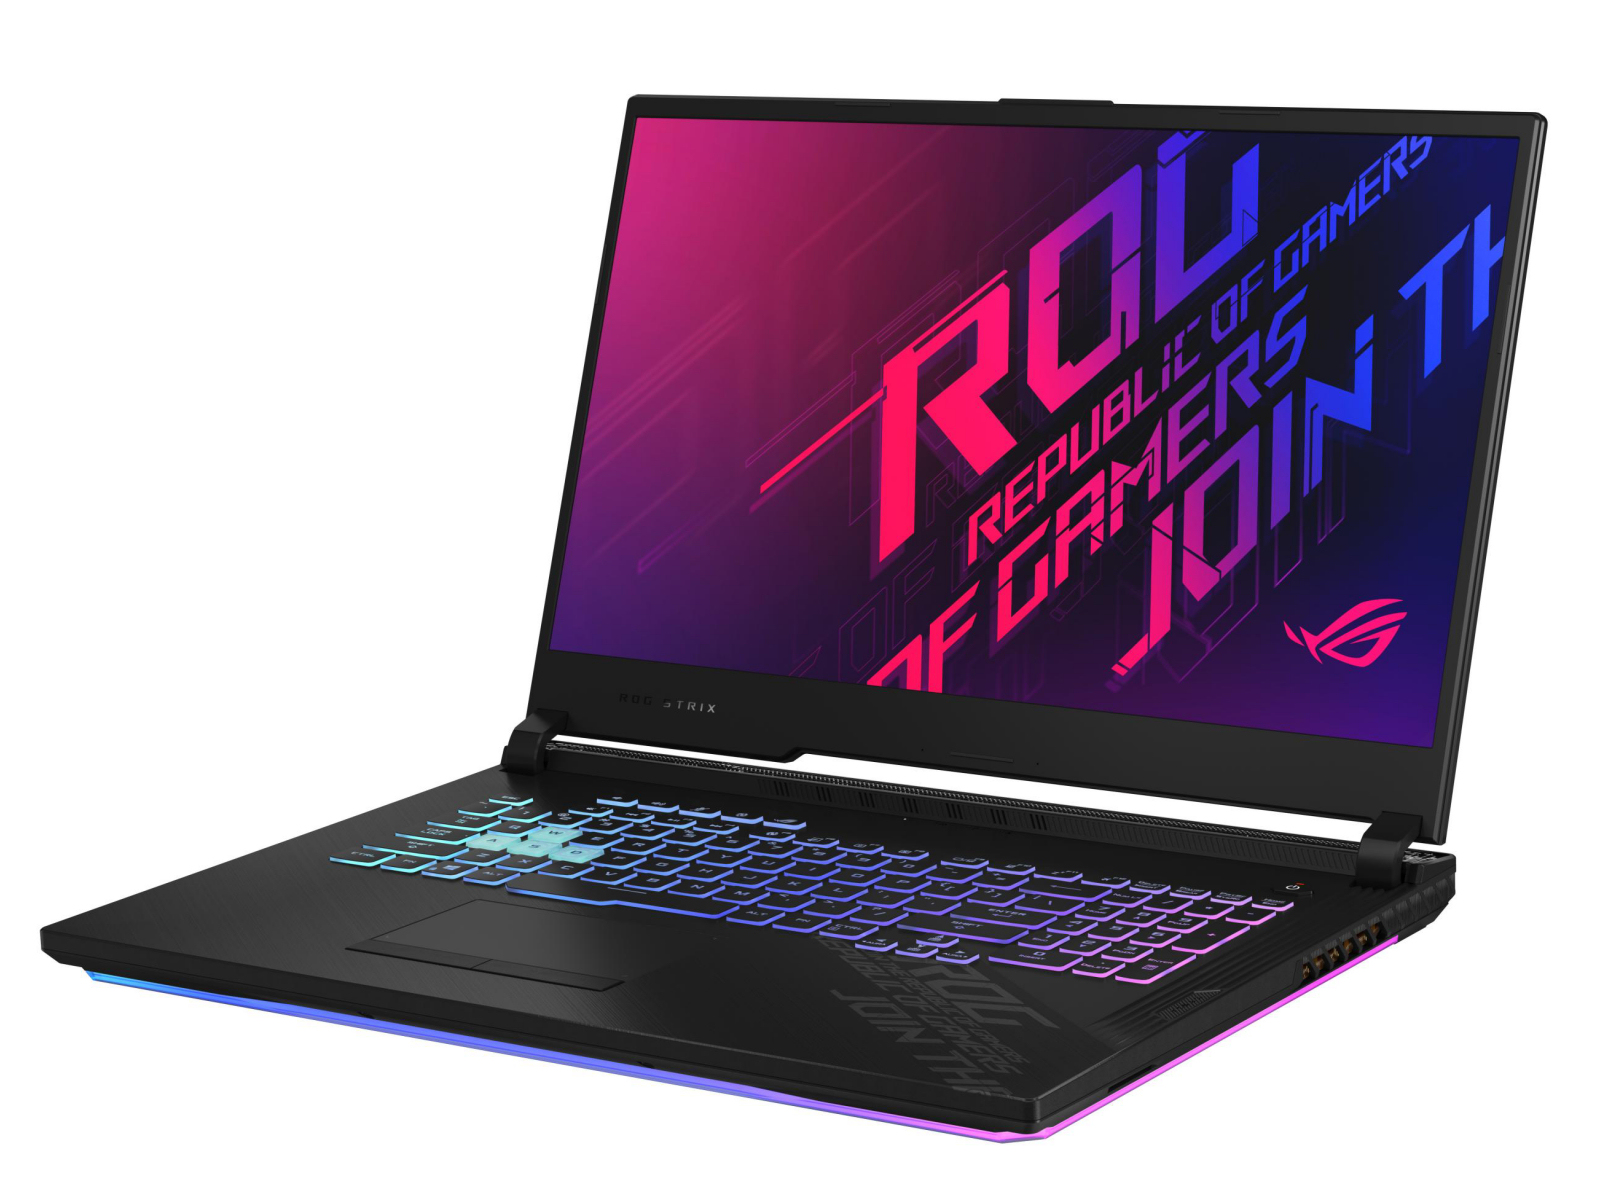
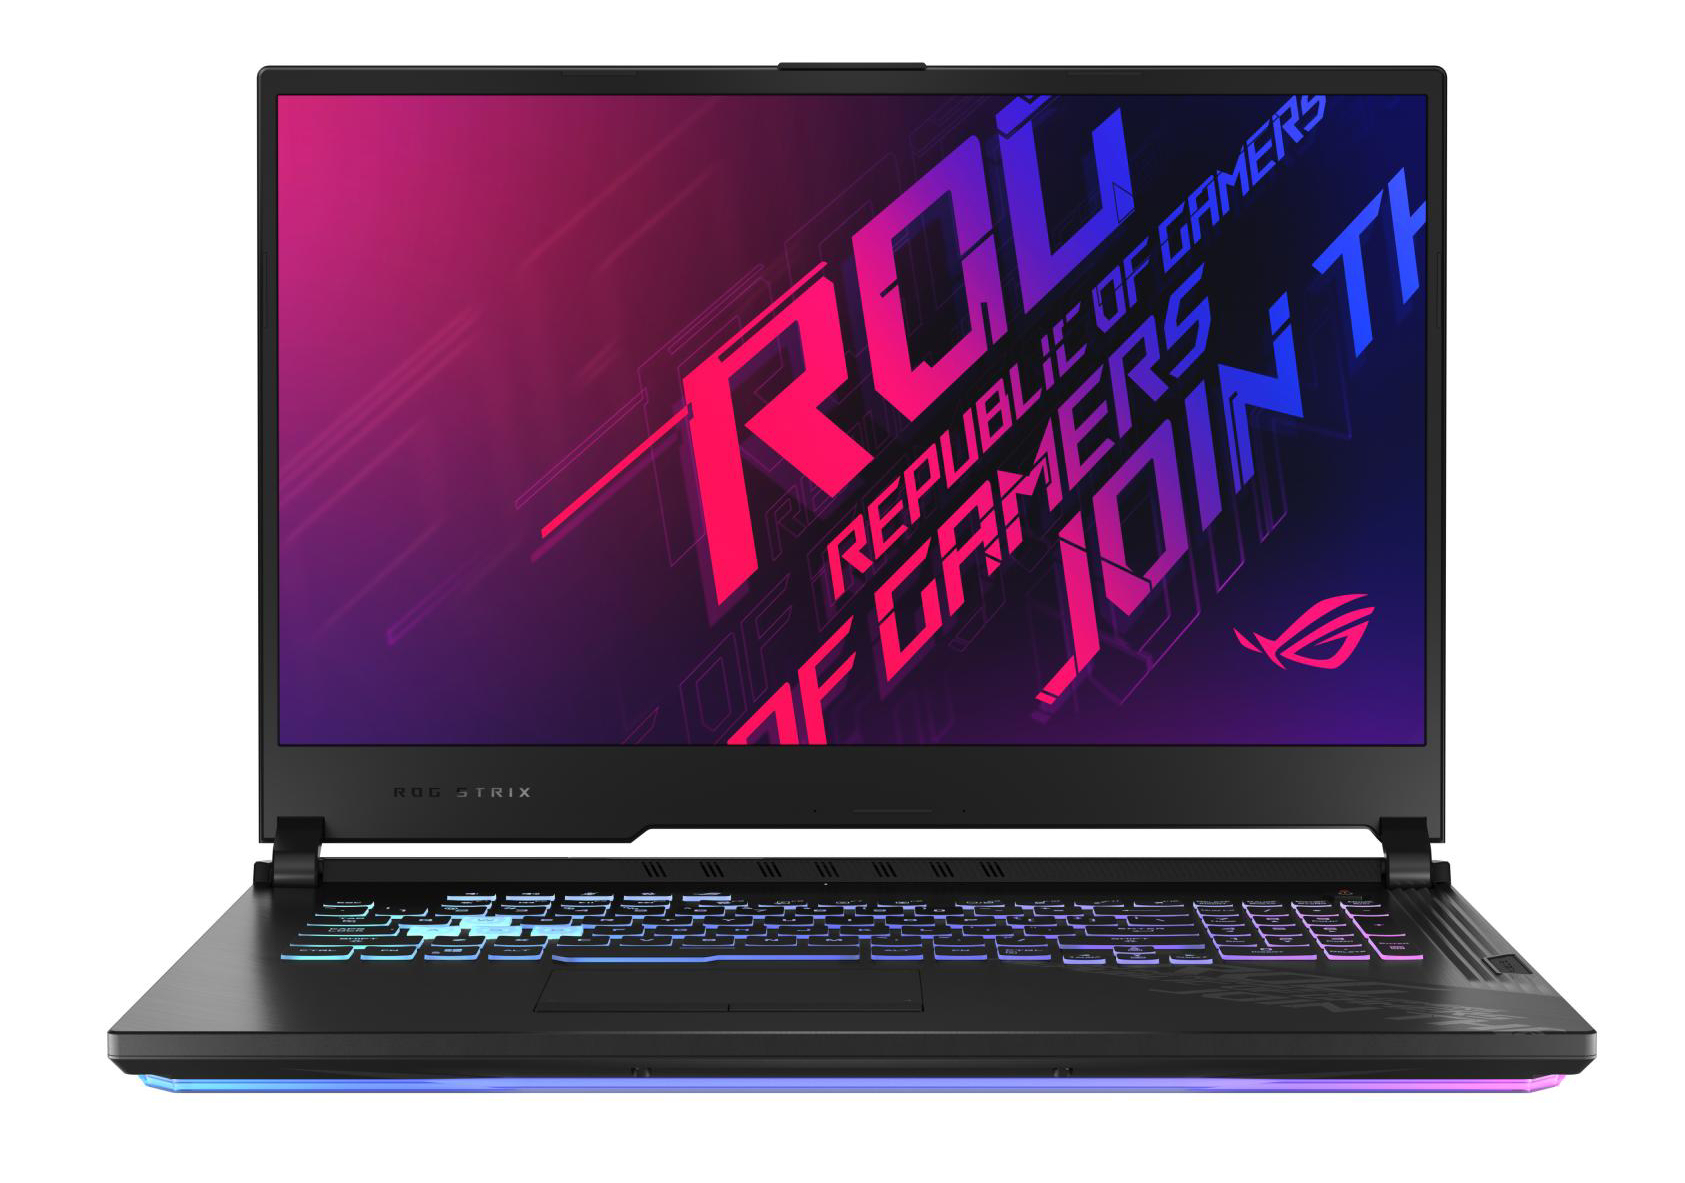
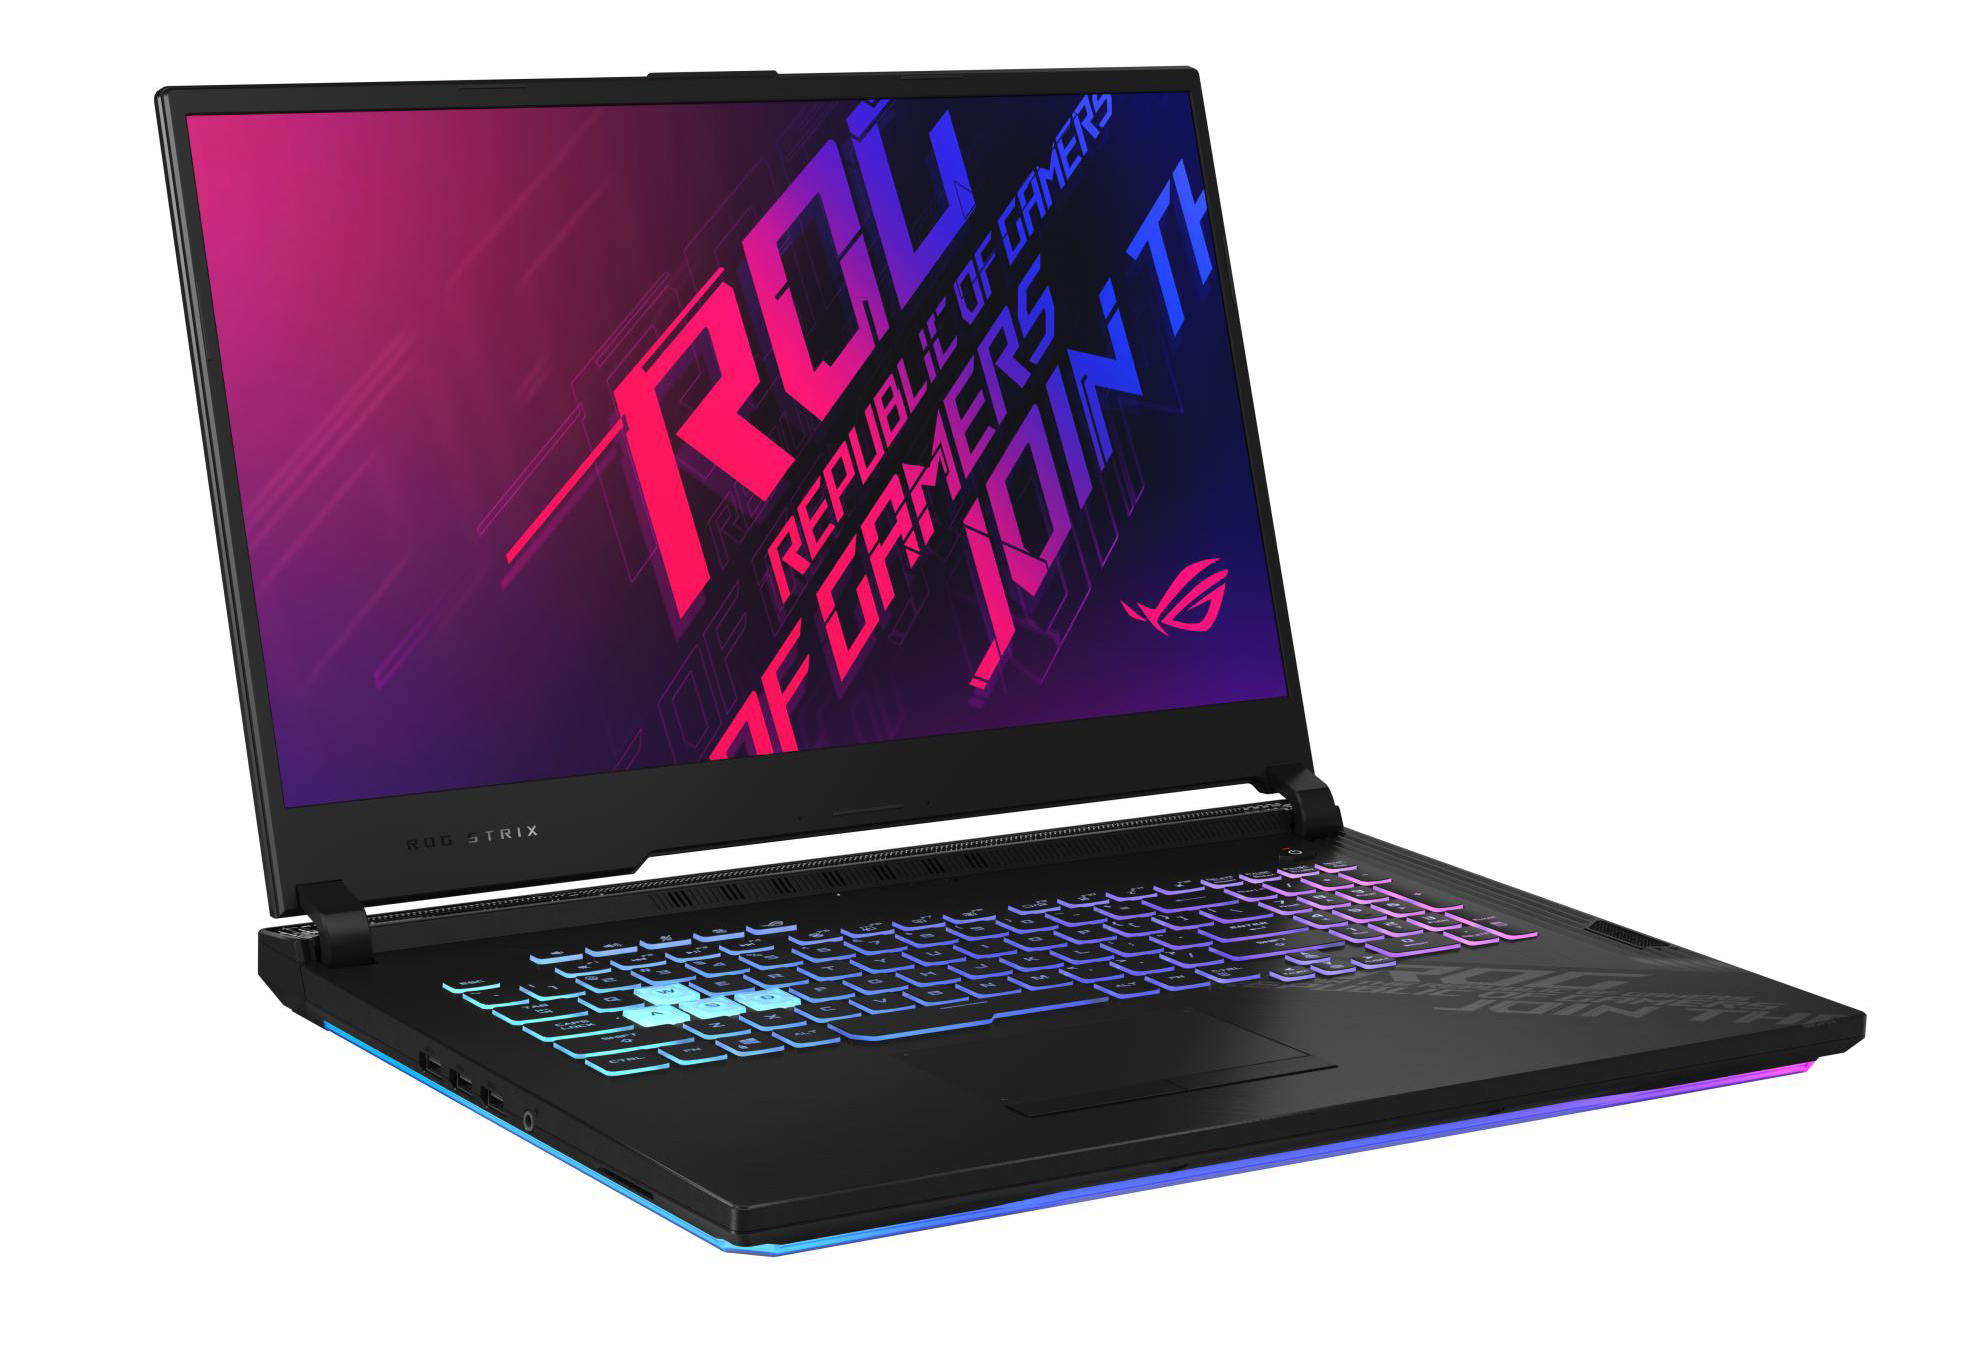
Test de l'Asus ROG Strix G17 G712LWS (i7-10750H, RTX 2070 Super, FHD, 144 Hz) : puissant PC de jeu avec son et lumière
Note | Date | Modèle | Poids | Épaisseur | Taille | Résolution | Prix |
|---|---|---|---|---|---|---|---|
| 83.1 % v7 (old) | 10/20 | Asus Strix G17 G712LWS i7-10750H, GeForce RTX 2070 Super Mobile | 2.8 kg | 26.5 mm | 17.30" | 1920x1080 | |
| 83.2 % v7 (old) | 03/20 | Schenker XMG Pro 17 PB71RD-G i7-9750H, GeForce RTX 2060 Mobile | 2.8 kg | 30 mm | 17.30" | 1920x1080 | |
| 83.5 % v7 (old) | 09/20 | MSI GL75 10SFR i7-10750H, GeForce RTX 2070 Mobile | 2.6 kg | 28 mm | 17.30" | 1920x1080 | |
| 84 % v7 (old) | 04/20 | Lenovo Legion Y740-17IRHg-81UJ001VGE i7-9750H, GeForce RTX 2080 Max-Q | 3 kg | 25.5 mm | 17.30" | 1920x1080 | |
| 83.6 % v7 (old) | 10/20 | Acer Predator Helios 300 PH317-54-75G8 i7-10750H, GeForce RTX 2060 Mobile | 2.8 kg | 25 mm | 17.30" | 1920x1080 |

| |||||||||||||||||||||||||
Homogénéité de la luminosité: 89 %
Valeur mesurée au centre, sur batterie: 323 cd/m²
Contraste: 1042:1 (Valeurs des noirs: 0.31 cd/m²)
ΔE ColorChecker Calman: 3.01 | ∀{0.5-29.43 Ø4.73}
calibrated: 1
ΔE Greyscale Calman: 3.8 | ∀{0.09-98 Ø4.97}
90% sRGB (Argyll 1.6.3 3D)
66% AdobeRGB 1998 (Argyll 1.6.3 3D)
66.4% AdobeRGB 1998 (Argyll 3D)
96.8% sRGB (Argyll 3D)
65.2% Display P3 (Argyll 3D)
Gamma: 2.154
CCT: 7507 K
| Asus Strix G17 G712LWS LG Philips LP173WFG-SPB3, IPS, 1920x1080, 17.3" | Asus ROG Strix G GL731GU-RB74 AU Optronics B173HAN04.0, IPS, 1920x1080, 17.3" | Acer Predator Helios 300 PH317-54-75G8 Chi Mei N173HCE-G33, IPS, 1920x1080, 17.3" | Schenker XMG Pro 17 PB71RD-G AU Optronics B173HAN04.0 (AUO409D), IPS, 1920x1080, 17.3" | MSI GL75 10SFR Chi Mei N173HCE-G33, IPS, 1920x1080, 17.3" | Lenovo Legion Y740-17IRHg-81UJ001VGE AUO_B173HAN03, IPS, 1920x1080, 17.3" | |
|---|---|---|---|---|---|---|
| Display | -6% | -3% | -5% | -1% | -3% | |
| Display P3 Coverage (%) | 65.2 | 61.9 -5% | 62.6 -4% | 62.8 -4% | 63.9 -2% | 63.8 -2% |
| sRGB Coverage (%) | 96.8 | 89.4 -8% | 94.3 -3% | 89.8 -7% | 96.2 -1% | 92.7 -4% |
| AdobeRGB 1998 Coverage (%) | 66.4 | 63.3 -5% | 64.7 -3% | 64.2 -3% | 66 -1% | 65.3 -2% |
| Response Times | 24% | -9% | -16% | 15% | -9% | |
| Response Time Grey 50% / Grey 80% * (ms) | 14.4 ? | 6.4 ? 56% | 16.4 ? -14% | 16.8 ? -17% | 12 ? 17% | 16 ? -11% |
| Response Time Black / White * (ms) | 10.4 ? | 11.2 ? -8% | 10.8 ? -4% | 12 ? -15% | 9 ? 13% | 11 ? -6% |
| PWM Frequency (Hz) | 24510 ? | 208 ? | ||||
| Screen | -23% | 27% | -18% | 7% | -7% | |
| Brightness middle (cd/m²) | 323 | 294.3 -9% | 322 0% | 274 -15% | 333 3% | 310 -4% |
| Brightness (cd/m²) | 300 | 289 -4% | 308 3% | 273 -9% | 309 3% | 281 -6% |
| Brightness Distribution (%) | 89 | 89 0% | 92 3% | 95 7% | 86 -3% | 85 -4% |
| Black Level * (cd/m²) | 0.31 | 0.3 3% | 0.18 42% | 0.26 16% | 0.215 31% | 0.31 -0% |
| Contrast (:1) | 1042 | 981 -6% | 1789 72% | 1054 1% | 1549 49% | 1000 -4% |
| Colorchecker dE 2000 * | 3.01 | 3.95 -31% | 1.53 49% | 4.62 -53% | 1.98 34% | 3.86 -28% |
| Colorchecker dE 2000 max. * | 7.65 | 6.49 15% | 3.14 59% | 7.66 -0% | 4.34 43% | 7.8 -2% |
| Colorchecker dE 2000 calibrated * | 1 | 3.08 -208% | 0.74 26% | 1.93 -93% | 2.01 -101% | |
| Greyscale dE 2000 * | 3.8 | 3.7 3% | 1.9 50% | 5.3 -39% | 2.97 22% | 4.48 -18% |
| Gamma | 2.154 102% | 2.07 106% | 2.144 103% | 2.34 94% | 2.41 91% | 2.5 88% |
| CCT | 7507 87% | 7155 91% | 6809 95% | 7619 85% | 6750 96% | 7542 86% |
| Color Space (Percent of AdobeRGB 1998) (%) | 66 | 57.7 -13% | 65 -2% | 58 -12% | 61 -8% | 60 -9% |
| Color Space (Percent of sRGB) (%) | 90 | 89 -1% | 87 -3% | 90 0% | 96 7% | 93 3% |
| Moyenne finale (programmes/paramètres) | -2% /
-14% | 5% /
17% | -13% /
-15% | 7% /
7% | -6% /
-6% |
* ... Moindre est la valeur, meilleures sont les performances
Temps de réponse de l'écran
| ↔ Temps de réponse noir à blanc | ||
|---|---|---|
| 10.4 ms ... hausse ↗ et chute ↘ combinées | ↗ 5.2 ms hausse | 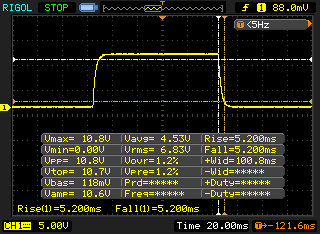 |
| ↘ 5.2 ms chute | ||
| L'écran montre de bons temps de réponse, mais insuffisant pour du jeu compétitif. En comparaison, tous les appareils testés affichent entre 0.1 (minimum) et 240 (maximum) ms. » 28 % des appareils testés affichent de meilleures performances. Cela signifie que les latences relevées sont meilleures que la moyenne (19.9 ms) de tous les appareils testés. | ||
| ↔ Temps de réponse gris 50% à gris 80% | ||
| 14.4 ms ... hausse ↗ et chute ↘ combinées | ↗ 6.8 ms hausse | 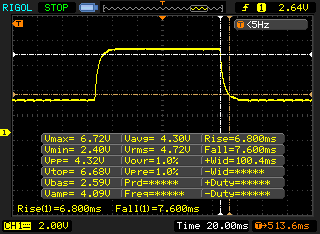 |
| ↘ 7.6 ms chute | ||
| L'écran montre de bons temps de réponse, mais insuffisant pour du jeu compétitif. En comparaison, tous les appareils testés affichent entre 0.165 (minimum) et 636 (maximum) ms. » 28 % des appareils testés affichent de meilleures performances. Cela signifie que les latences relevées sont meilleures que la moyenne (31.1 ms) de tous les appareils testés. | ||
Scintillement / MLI (Modulation de largeur d'impulsion)
| Scintillement / MLI (Modulation de largeur d'impulsion) non décelé | 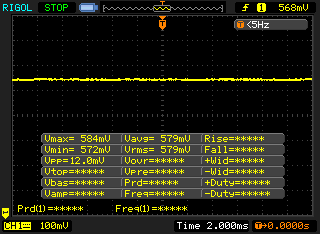 | ||
En comparaison, 52 % des appareils testés n'emploient pas MDI pour assombrir leur écran. Nous avons relevé une moyenne à 7794 (minimum : 5 - maximum : 343500) Hz dans le cas où une MDI était active. | |||
* ... Moindre est la valeur, meilleures sont les performances
| PCMark 8 Home Score Accelerated v2 | 4412 points | |
| PCMark 8 Creative Score Accelerated v2 | 4201 points | |
| PCMark 8 Work Score Accelerated v2 | 5832 points | |
| PCMark 10 Score | 5262 points | |
Aide | ||
| DPC Latencies / LatencyMon - interrupt to process latency (max), Web, Youtube, Prime95 | |
| Asus Strix G17 G712LWS | |
| MSI GL75 10SFR | |
| Acer Predator Helios 300 PH317-54-75G8 | |
* ... Moindre est la valeur, meilleures sont les performances

| Asus Strix G17 G712LWS Intel SSD 660p 1TB SSDPEKNW010T8 | Asus ROG Strix G GL731GU-RB74 Intel SSD 660p SSDPEKNW512G8 | Acer Predator Helios 300 PH317-54-75G8 WDC PC SN730 SDBQNTY-1T00 | Schenker XMG Pro 17 PB71RD-G Samsung SSD 970 EVO Plus 500GB | MSI GL75 10SFR Lite-On CL1-8D512 | Lenovo Legion Y740-17IRHg-81UJ001VGE Samsung SSD PM981 MZVLB1T0HALR | |
|---|---|---|---|---|---|---|
| CrystalDiskMark 5.2 / 6 | -16% | 27% | 20% | -4% | 16% | |
| Write 4K (MB/s) | 141.1 | 127.6 -10% | 141.9 1% | 117.5 -17% | 132.2 -6% | 101.2 -28% |
| Read 4K (MB/s) | 60.9 | 56 -8% | 48.75 -20% | 46.47 -24% | 45.62 -25% | 44.61 -27% |
| Write Seq (MB/s) | 1681 | 986 -41% | 2734 63% | 1345 -20% | 1511 -10% | 2295 37% |
| Read Seq (MB/s) | 1602 | 1605 0% | 1921 20% | 2804 75% | 1890 18% | 2174 36% |
| Write 4K Q32T1 (MB/s) | 406.6 | 451.5 11% | 422.6 4% | 368.2 -9% | 375.9 -8% | 401.2 -1% |
| Read 4K Q32T1 (MB/s) | 470.2 | 343.3 -27% | 509 8% | 412.9 -12% | 525 12% | 475.5 1% |
| Write Seq Q32T1 (MB/s) | 1759 | 983 -44% | 3055 74% | 3248 85% | 1505 -14% | 2397 36% |
| Read Seq Q32T1 (MB/s) | 1932 | 1810 -6% | 3257 69% | 3559 84% | 2008 4% | 3337 73% |
| AS SSD | -38% | 73% | 83% | -35% | 59% | |
| Seq Read (MB/s) | 1778 | 1319 -26% | 2828 59% | 2946 66% | 1923 8% | 2800 57% |
| Seq Write (MB/s) | 1478 | 930 -37% | 2677 81% | 2627 78% | 1065 -28% | 2424 64% |
| 4K Read (MB/s) | 49.76 | 49.43 -1% | 39.94 -20% | 56.9 14% | 25.43 -49% | 42.77 -14% |
| 4K Write (MB/s) | 117.9 | 104.3 -12% | 100.9 -14% | 151.7 29% | 101.9 -14% | 94.8 -20% |
| 4K-64 Read (MB/s) | 591 | 321.9 -46% | 1562 164% | 1222 107% | 477.9 -19% | 1406 138% |
| 4K-64 Write (MB/s) | 875 | 774 -12% | 1867 113% | 2444 179% | 563 -36% | 1697 94% |
| Access Time Read * (ms) | 0.082 | 0.055 33% | 0.051 38% | 0.053 35% | 0.05 39% | |
| Access Time Write * (ms) | 0.041 | 0.138 -237% | 0.037 10% | 0.025 39% | 0.126 -207% | 0.039 5% |
| Score Read (Points) | 818 | 503 -39% | 1885 130% | 1574 92% | 696 -15% | 1729 111% |
| Score Write (Points) | 1140 | 971 -15% | 2236 96% | 2859 151% | 771 -32% | 2034 78% |
| Score Total (Points) | 2377 | 1731 -27% | 5076 114% | 5232 120% | 1785 -25% | 4630 95% |
| Moyenne finale (programmes/paramètres) | -27% /
-29% | 50% /
53% | 52% /
57% | -20% /
-22% | 38% /
41% |
* ... Moindre est la valeur, meilleures sont les performances
Continuous load read: DiskSpd Read Loop, Queue Depth 8
| 3DMark 11 Performance | 20961 points | |
| 3DMark Cloud Gate Standard Score | 39220 points | |
| 3DMark Fire Strike Score | 18270 points | |
| 3DMark Time Spy Score | 8100 points | |
Aide | ||
| The Witcher 3 - 1920x1080 Ultra Graphics & Postprocessing (HBAO+) | |
| Moyenne de la classe Gaming (95 - 240, n=8, 2 dernières années) | |
| Asus Strix G17 G712LWS (Turbo) | |
| Asus Strix G17 G712LWS | |
| Moyenne NVIDIA GeForce RTX 2070 Super Mobile (76.3 - 94.6, n=8) | |
| Lenovo Legion Y740-17IRHg-81UJ001VGE | |
| MSI GL75 10SFR | |
| Acer Predator Helios 300 PH317-54-75G8 | |
| Schenker XMG Pro 17 PB71RD-G | |
| Asus ROG Strix G GL731GU-RB74 | |
| Horizon Zero Dawn - 1920x1080 Ultimate Quality | |
| Moyenne NVIDIA GeForce RTX 2070 Super Mobile (77 - 98, n=3) | |
| Asus Strix G17 G712LWS (Turbo) | |
| Asus Strix G17 G712LWS | |
| Acer Predator Helios 300 PH317-54-75G8 | |
| Doom Eternal - 1920x1080 Ultra Preset | |
| Moyenne NVIDIA GeForce RTX 2070 Super Mobile (151 - 190.4, n=5) | |
| Asus Strix G17 G712LWS (Turbo) | |
| Asus Strix G17 G712LWS | |
| MSI GL75 10SFR | |
| Acer Predator Helios 300 PH317-54-75G8 | |
| F1 2020 - 1920x1080 Ultra High Preset AA:T AF:16x | |
| Asus Strix G17 G712LWS (Turbo) | |
| Moyenne NVIDIA GeForce RTX 2070 Super Mobile (118 - 124, n=2) | |
| Asus Strix G17 G712LWS | |
| MSI GL75 10SFR | |
| Acer Predator Helios 300 PH317-54-75G8 | |
| Death Stranding - 1920x1080 Very High Preset | |
| Asus Strix G17 G712LWS (Turbo) | |
| Moyenne NVIDIA GeForce RTX 2070 Super Mobile (116.2 - 123.8, n=4) | |
| Asus Strix G17 G712LWS | |
| MSI GL75 10SFR | |
| Flight Simulator 2020 - 1920x1080 High-End AA:TAA AF:8x | |
| Moyenne NVIDIA GeForce RTX 2070 Super Mobile (48.8 - 53.3, n=2) | |
| Asus Strix G17 G712LWS | |
| Acer Predator Helios 300 PH317-54-75G8 | |
| Serious Sam 4 - 1920x1080 Ultra (DX12) AA:2xMS | |
| Moyenne NVIDIA GeForce RTX 2070 Super Mobile (71.1 - 82.1, n=4) | |
| Asus Strix G17 G712LWS | |
| Acer Predator Helios 300 PH317-54-75G8 | |
| Mafia Definitive Edition - 1920x1080 High Preset | |
| Moyenne NVIDIA GeForce RTX 2070 Super Mobile (92 - 96.6, n=2) | |
| Asus Strix G17 G712LWS | |
| Acer Predator Helios 300 PH317-54-75G8 | |
| Bas | Moyen | Élevé | Ultra | |
|---|---|---|---|---|
| BioShock Infinite (2013) | 371.8 | 308.3 | 299 | 173.4 |
| The Witcher 3 (2015) | 296.3 | 236.7 | 154.3 | 87.8 |
| Shadow of the Tomb Raider (2018) | 121 | 110 | 107 | 100 |
| Doom Eternal (2020) | 219.1 | 165.7 | 158.5 | 155.4 |
| Gears Tactics (2020) | 249.1 | 172.4 | 122.2 | 90 |
| F1 2020 (2020) | 227 | 168 | 147 | 118 |
| Death Stranding (2020) | 145 | 128.2 | 117.8 | 116.2 |
| Horizon Zero Dawn (2020) | 139 | 107 | 94 | 77 |
| Flight Simulator 2020 (2020) | 66.6 | 58 | 48.8 | 37.8 |
| Serious Sam 4 (2020) | 124 | 94 | 81.6 | 71.1 |
| Mafia Definitive Edition (2020) | 123.7 | 95.2 | 92 | |
| Star Wars Squadrons (2020) | 263.1 | 224.6 | 211.5 | 202.4 |
Degré de la nuisance sonore
| Au repos |
| 32 / 34 / 37 dB(A) |
| Fortement sollicité |
| 51 / 53 dB(A) |
 | ||
30 dB silencieux 40 dB(A) audible 50 dB(A) bruyant |
||
min: | ||
| Asus Strix G17 G712LWS i7-10750H, GeForce RTX 2070 Super Mobile | Asus ROG Strix G GL731GU-RB74 i7-9750H, GeForce GTX 1660 Ti Mobile | Schenker XMG Pro 17 PB71RD-G i7-9750H, GeForce RTX 2060 Mobile | MSI GL75 10SFR i7-10750H, GeForce RTX 2070 Mobile | Lenovo Legion Y740-17IRHg-81UJ001VGE i7-9750H, GeForce RTX 2080 Max-Q | Acer Predator Helios 300 PH317-54-75G8 i7-10750H, GeForce RTX 2060 Mobile | |
|---|---|---|---|---|---|---|
| Noise | -0% | -3% | -2% | 11% | 7% | |
| arrêt / environnement * (dB) | 25 | 28.2 -13% | 30 -20% | 30.1 -20% | 30.3 -21% | 24 4% |
| Idle Minimum * (dB) | 32 | 31.8 1% | 30 6% | 32.2 -1% | 30.3 5% | 25 22% |
| Idle Average * (dB) | 34 | 32 6% | 32 6% | 32.2 5% | 30.3 11% | 30 12% |
| Idle Maximum * (dB) | 37 | 40.6 -10% | 39 -5% | 32.2 13% | 30.5 18% | 37 -0% |
| Load Average * (dB) | 51 | 48 6% | 51 -0% | 52.8 -4% | 40.8 20% | 48 6% |
| Witcher 3 ultra * (dB) | 50 | 48 4% | 54 -8% | 53.8 -8% | 40.5 19% | 50 -0% |
| Load Maximum * (dB) | 53 | 51.5 3% | 54 -2% | 53.2 -0% | 40.8 23% | 52 2% |
* ... Moindre est la valeur, meilleures sont les performances
(-) La température maximale du côté supérieur est de 53 °C / 127 F, par rapport à la moyenne de 40.4 °C / 105 F, allant de 21.2 à 68.8 °C pour la classe Gaming.
(-) Le fond chauffe jusqu'à un maximum de 56 °C / 133 F, contre une moyenne de 43.2 °C / 110 F
(+) En utilisation inactive, la température moyenne du côté supérieur est de 27.7 °C / 82 F, par rapport à la moyenne du dispositif de 33.9 °C / 93 F.
(-) En jouant à The Witcher 3, la température moyenne du côté supérieur est de 39.6 °C / 103 F, alors que la moyenne de l'appareil est de 33.9 °C / 93 F.
(+) Les repose-poignets et le pavé tactile sont plus froids que la température de la peau avec un maximum de 28 °C / 82.4 F et sont donc froids au toucher.
(±) La température moyenne de la zone de l'appui-paume de dispositifs similaires était de 28.8 °C / 83.8 F (+0.8 °C / #1.4 F).
| Asus Strix G17 G712LWS i7-10750H, GeForce RTX 2070 Super Mobile | Asus ROG Strix G GL731GU-RB74 i7-9750H, GeForce GTX 1660 Ti Mobile | Schenker XMG Pro 17 PB71RD-G i7-9750H, GeForce RTX 2060 Mobile | MSI GL75 10SFR i7-10750H, GeForce RTX 2070 Mobile | Lenovo Legion Y740-17IRHg-81UJ001VGE i7-9750H, GeForce RTX 2080 Max-Q | Acer Predator Helios 300 PH317-54-75G8 i7-10750H, GeForce RTX 2060 Mobile | |
|---|---|---|---|---|---|---|
| Heat | 4% | 3% | 12% | 7% | -2% | |
| Maximum Upper Side * (°C) | 53 | 44.6 16% | 47 11% | 44 17% | 40.7 23% | 53 -0% |
| Maximum Bottom * (°C) | 56 | 51.6 8% | 48 14% | 42.5 24% | 42.2 25% | 59 -5% |
| Idle Upper Side * (°C) | 29 | 31.6 -9% | 30 -3% | 29.1 -0% | 31.9 -10% | 29 -0% |
| Idle Bottom * (°C) | 31 | 31.4 -1% | 34 -10% | 29.5 5% | 33.9 -9% | 32 -3% |
* ... Moindre est la valeur, meilleures sont les performances
Asus Strix G17 G712LWS analyse audio
(±) | le niveau sonore du haut-parleur est moyen mais bon (81# dB)
Basses 100 - 315 Hz
(±) | basse réduite - en moyenne 9.8% inférieure à la médiane
(±) | la linéarité des basses est moyenne (8.3% delta à la fréquence précédente)
Médiums 400 - 2000 Hz
(±) | médiane supérieure - en moyenne 5.5% supérieure à la médiane
(+) | les médiums sont linéaires (5.8% delta à la fréquence précédente)
Aiguës 2 - 16 kHz
(+) | des sommets équilibrés - à seulement 2.4% de la médiane
(+) | les aigus sont linéaires (3.4% delta à la fréquence précédente)
Globalement 100 - 16 000 Hz
(+) | le son global est linéaire (12.9% différence à la médiane)
Par rapport à la même classe
» 17% de tous les appareils testés de cette catégorie étaient meilleurs, 4% similaires, 79% pires
» Le meilleur avait un delta de 6%, la moyenne était de 18%, le pire était de 132%.
Par rapport à tous les appareils testés
» 12% de tous les appareils testés étaient meilleurs, 3% similaires, 85% pires
» Le meilleur avait un delta de 4%, la moyenne était de 24%, le pire était de 134%.
| Éteint/en veille | |
| Au repos | |
| Fortement sollicité |
|
Légende:
min: | |
| Asus Strix G17 G712LWS i7-10750H, GeForce RTX 2070 Super Mobile | Asus ROG Strix G GL731GU-RB74 i7-9750H, GeForce GTX 1660 Ti Mobile | Schenker XMG Pro 17 PB71RD-G i7-9750H, GeForce RTX 2060 Mobile | MSI GL75 10SFR i7-10750H, GeForce RTX 2070 Mobile | Lenovo Legion Y740-17IRHg-81UJ001VGE i7-9750H, GeForce RTX 2080 Max-Q | Acer Predator Helios 300 PH317-54-75G8 i7-10750H, GeForce RTX 2060 Mobile | |
|---|---|---|---|---|---|---|
| Power Consumption | -18% | 1% | -2% | -20% | 25% | |
| Idle Minimum * (Watt) | 10 | 13.6 -36% | 11 -10% | 12 -20% | 15.7 -57% | 6 40% |
| Idle Average * (Watt) | 14 | 26.2 -87% | 18 -29% | 16.6 -19% | 26.3 -88% | 11 21% |
| Idle Maximum * (Watt) | 25 | 35 -40% | 28 -12% | 18 28% | 28 -12% | 19 24% |
| Load Average * (Watt) | 134 | 113.6 15% | 99 26% | 130 3% | 136 -1% | 96 28% |
| Witcher 3 ultra * (Watt) | 186 | 134.1 28% | 146 22% | 203 -9% | 160 14% | 144 23% |
| Load Maximum * (Watt) | 230 | 200.2 13% | 210 9% | 224 3% | 177 23% | 197 14% |
* ... Moindre est la valeur, meilleures sont les performances
| Asus Strix G17 G712LWS i7-10750H, GeForce RTX 2070 Super Mobile, 66 Wh | Asus ROG Strix G GL731GU-RB74 i7-9750H, GeForce GTX 1660 Ti Mobile, 66 Wh | Schenker XMG Pro 17 PB71RD-G i7-9750H, GeForce RTX 2060 Mobile, 62 Wh | MSI GL75 10SFR i7-10750H, GeForce RTX 2070 Mobile, 51 Wh | Lenovo Legion Y740-17IRHg-81UJ001VGE i7-9750H, GeForce RTX 2080 Max-Q, 76 Wh | Acer Predator Helios 300 PH317-54-75G8 i7-10750H, GeForce RTX 2060 Mobile, 59 Wh | |
|---|---|---|---|---|---|---|
| Autonomie de la batterie | -5% | -29% | -34% | -47% | 1% | |
| Reader / Idle (h) | 9.1 | 8.6 -5% | 5.2 -43% | 6.4 -30% | 3.8 -58% | 8.2 -10% |
| H.264 (h) | 7.1 | 5.2 -27% | 2.8 -61% | 5.9 -17% | ||
| WiFi v1.3 (h) | 5.5 | 4.9 -11% | 4.1 -25% | 3.9 -29% | 3 -45% | 5.1 -7% |
| Load (h) | 1.6 | 1.6 0% | 1.3 -19% | 0.8 -50% | 1.2 -25% | 2.2 38% |
Points positifs
Points négatifs
Les composants puissants du Strix G17 permettent de jouer à tous les jeux récents - il n'y aura même aucun compromis à faire, que ce soit en ce qui concerne la résolution comme le niveau de détails.
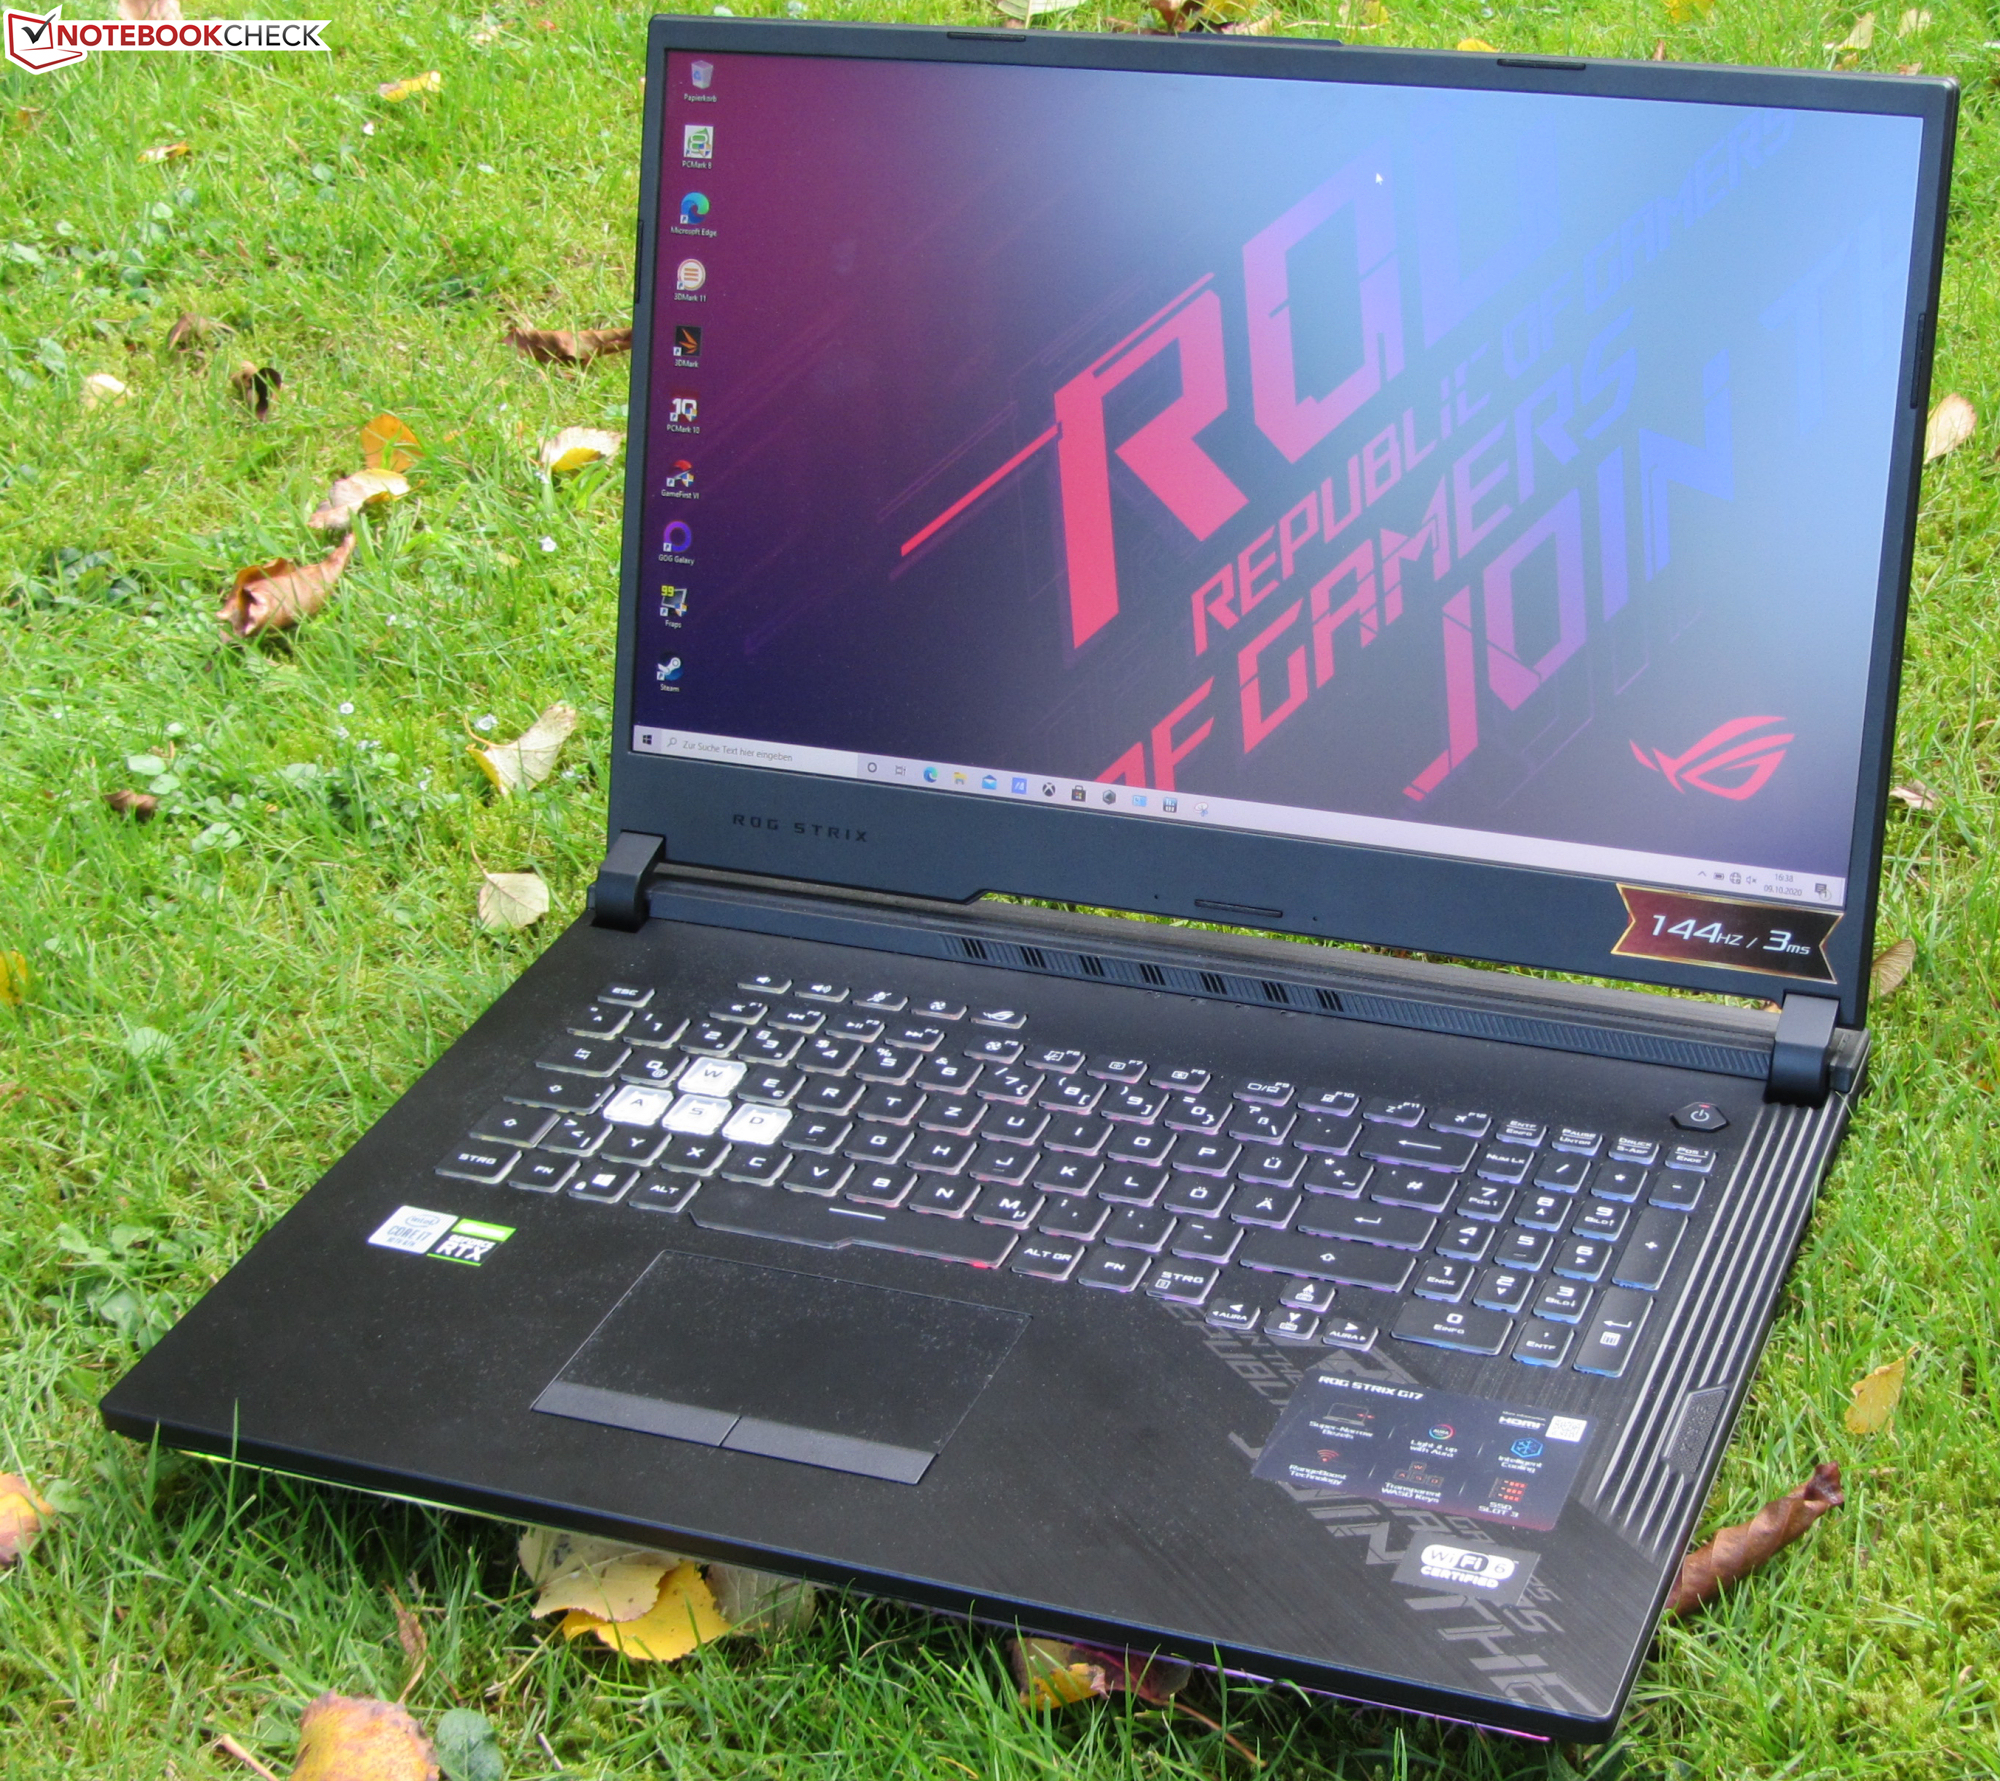
Ce qui attire l'attention sur le portable est sa barre LED qui s'étend sur trois côtés de la coque inférieure. Le modèle de couleurs peut être ajusté manuellement selon vos goûts...
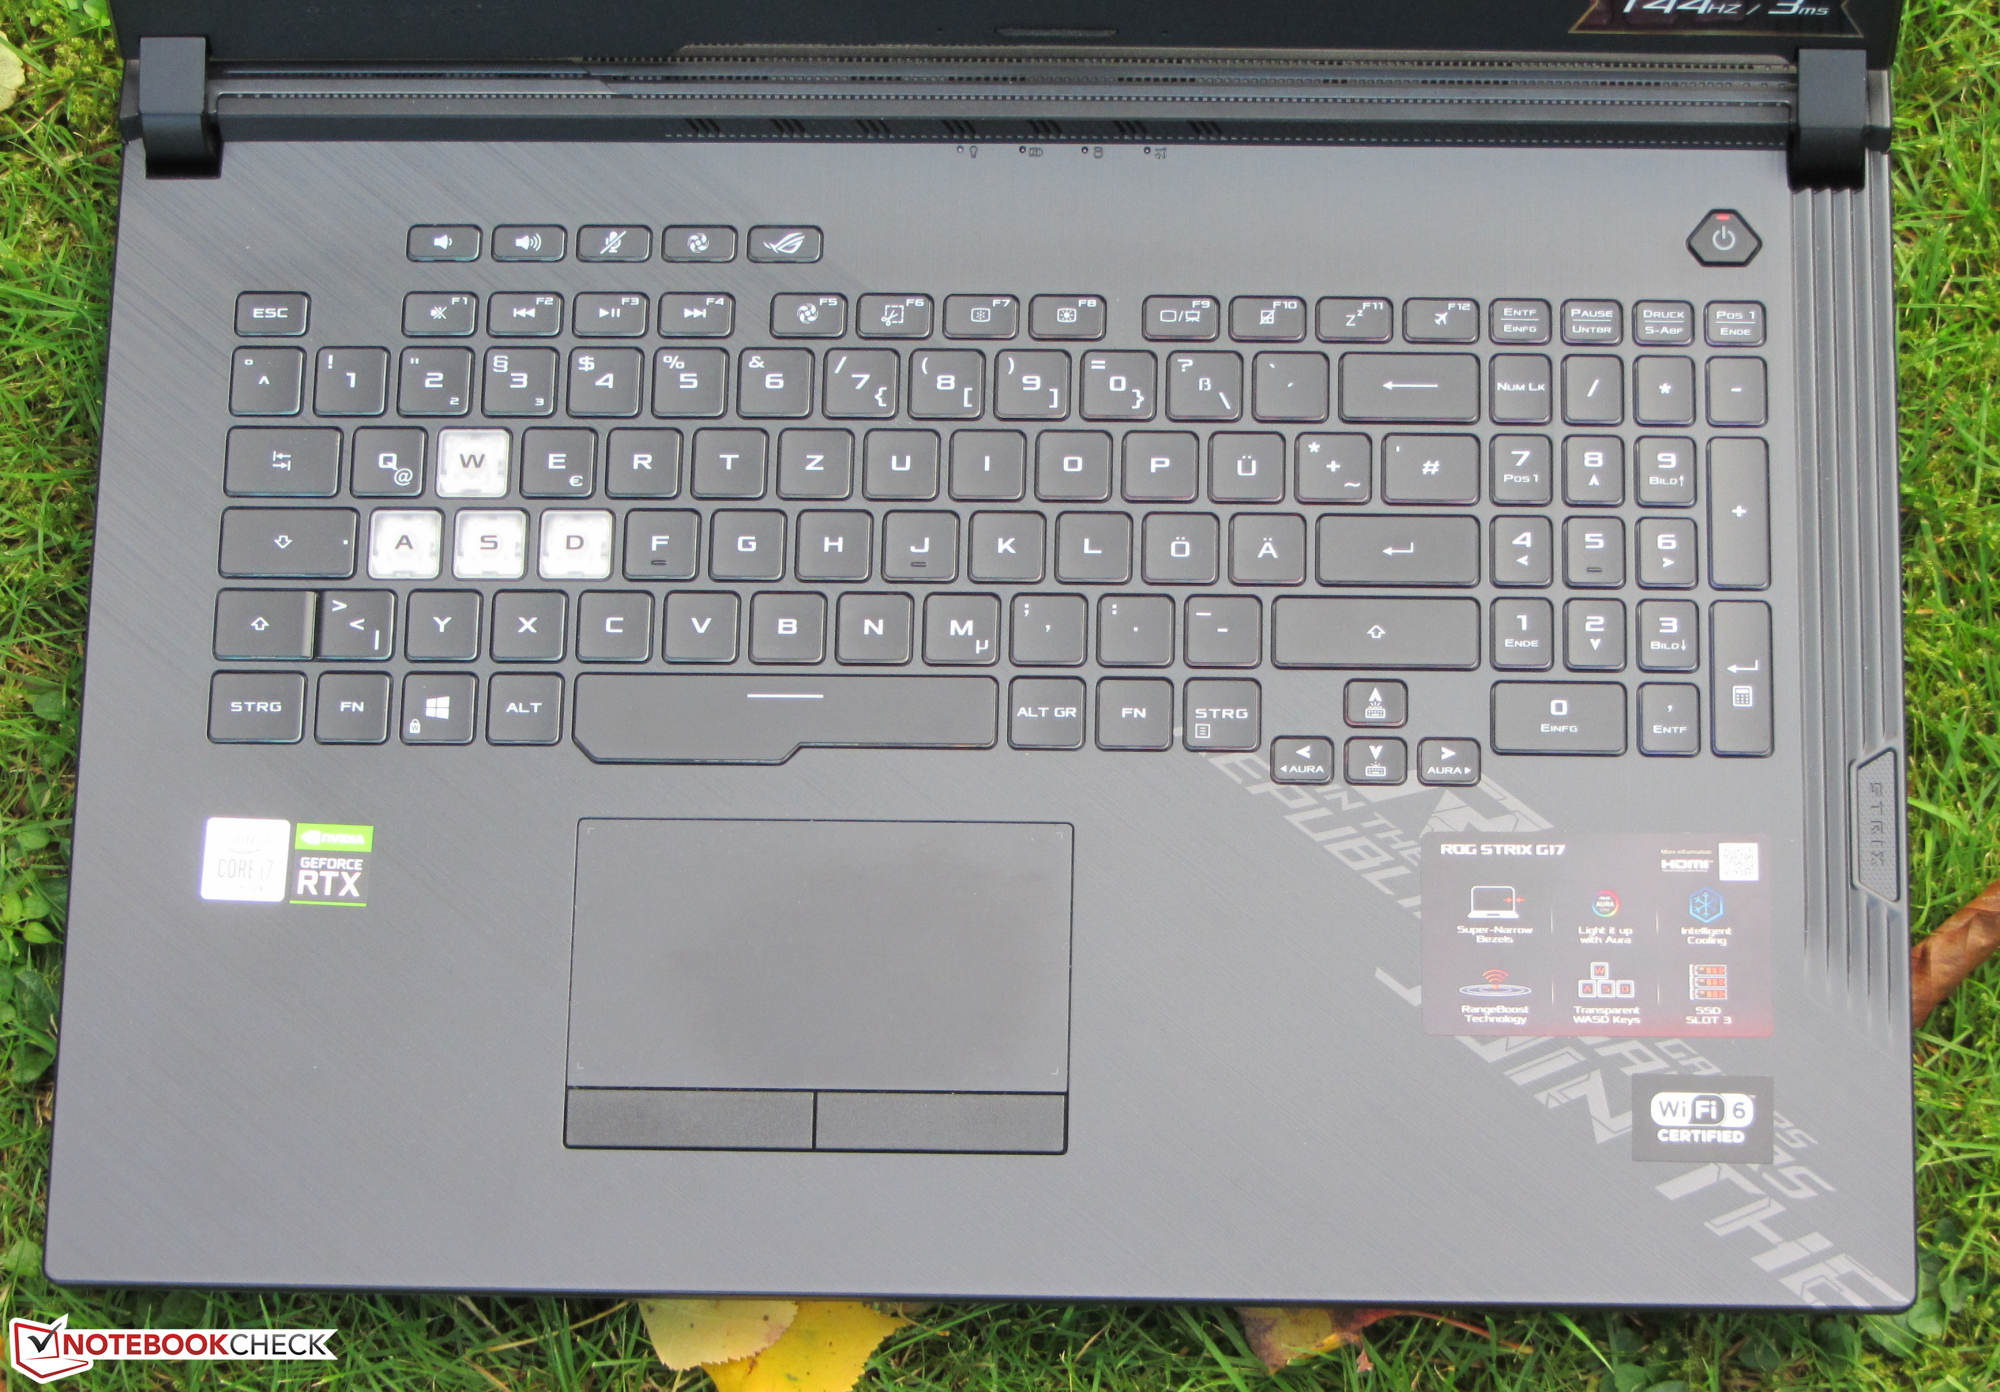
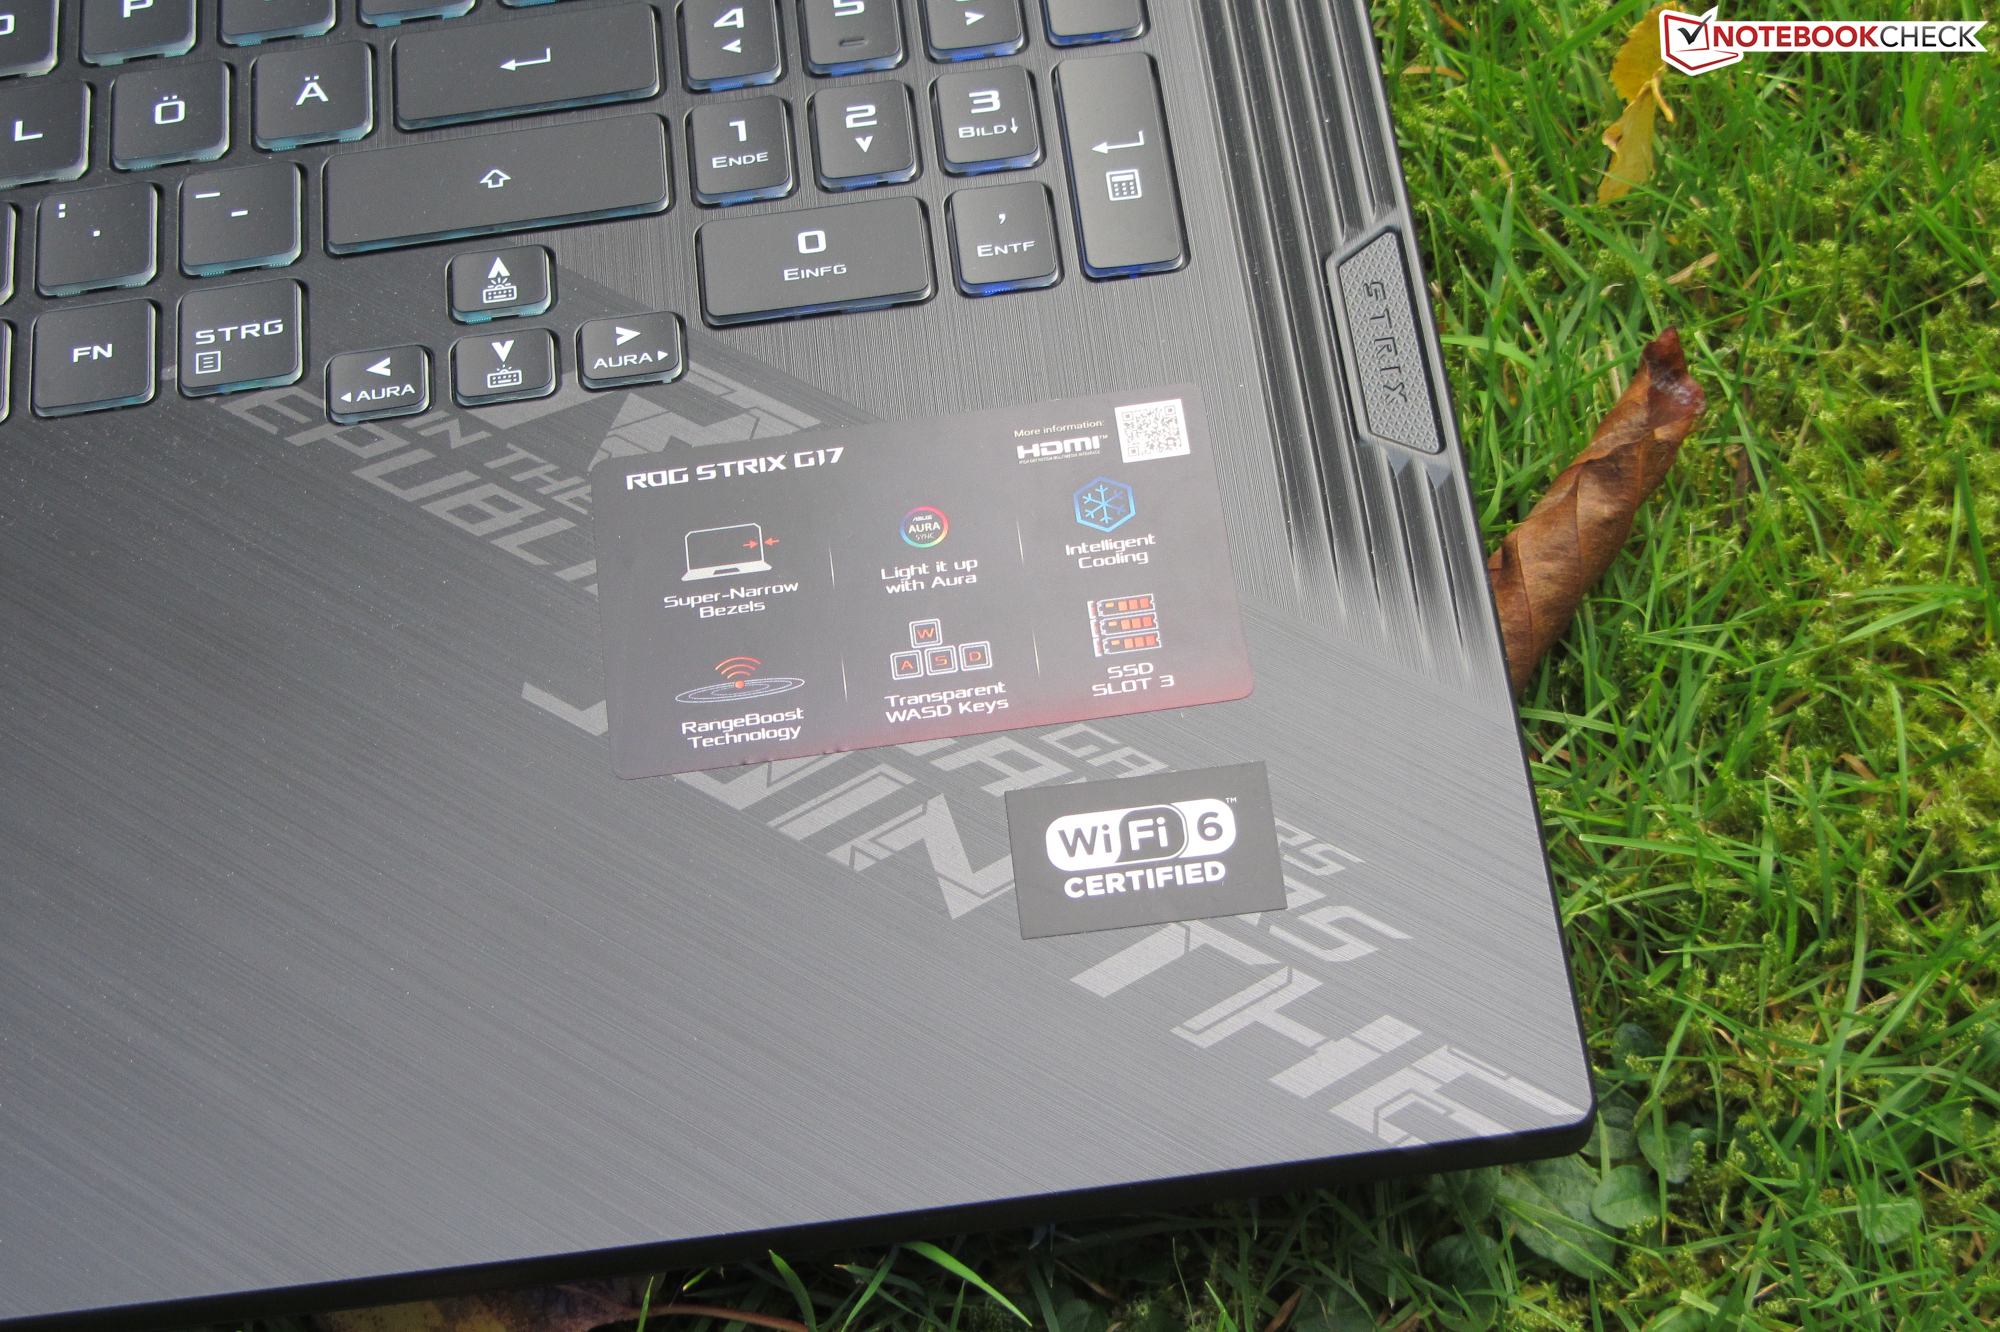
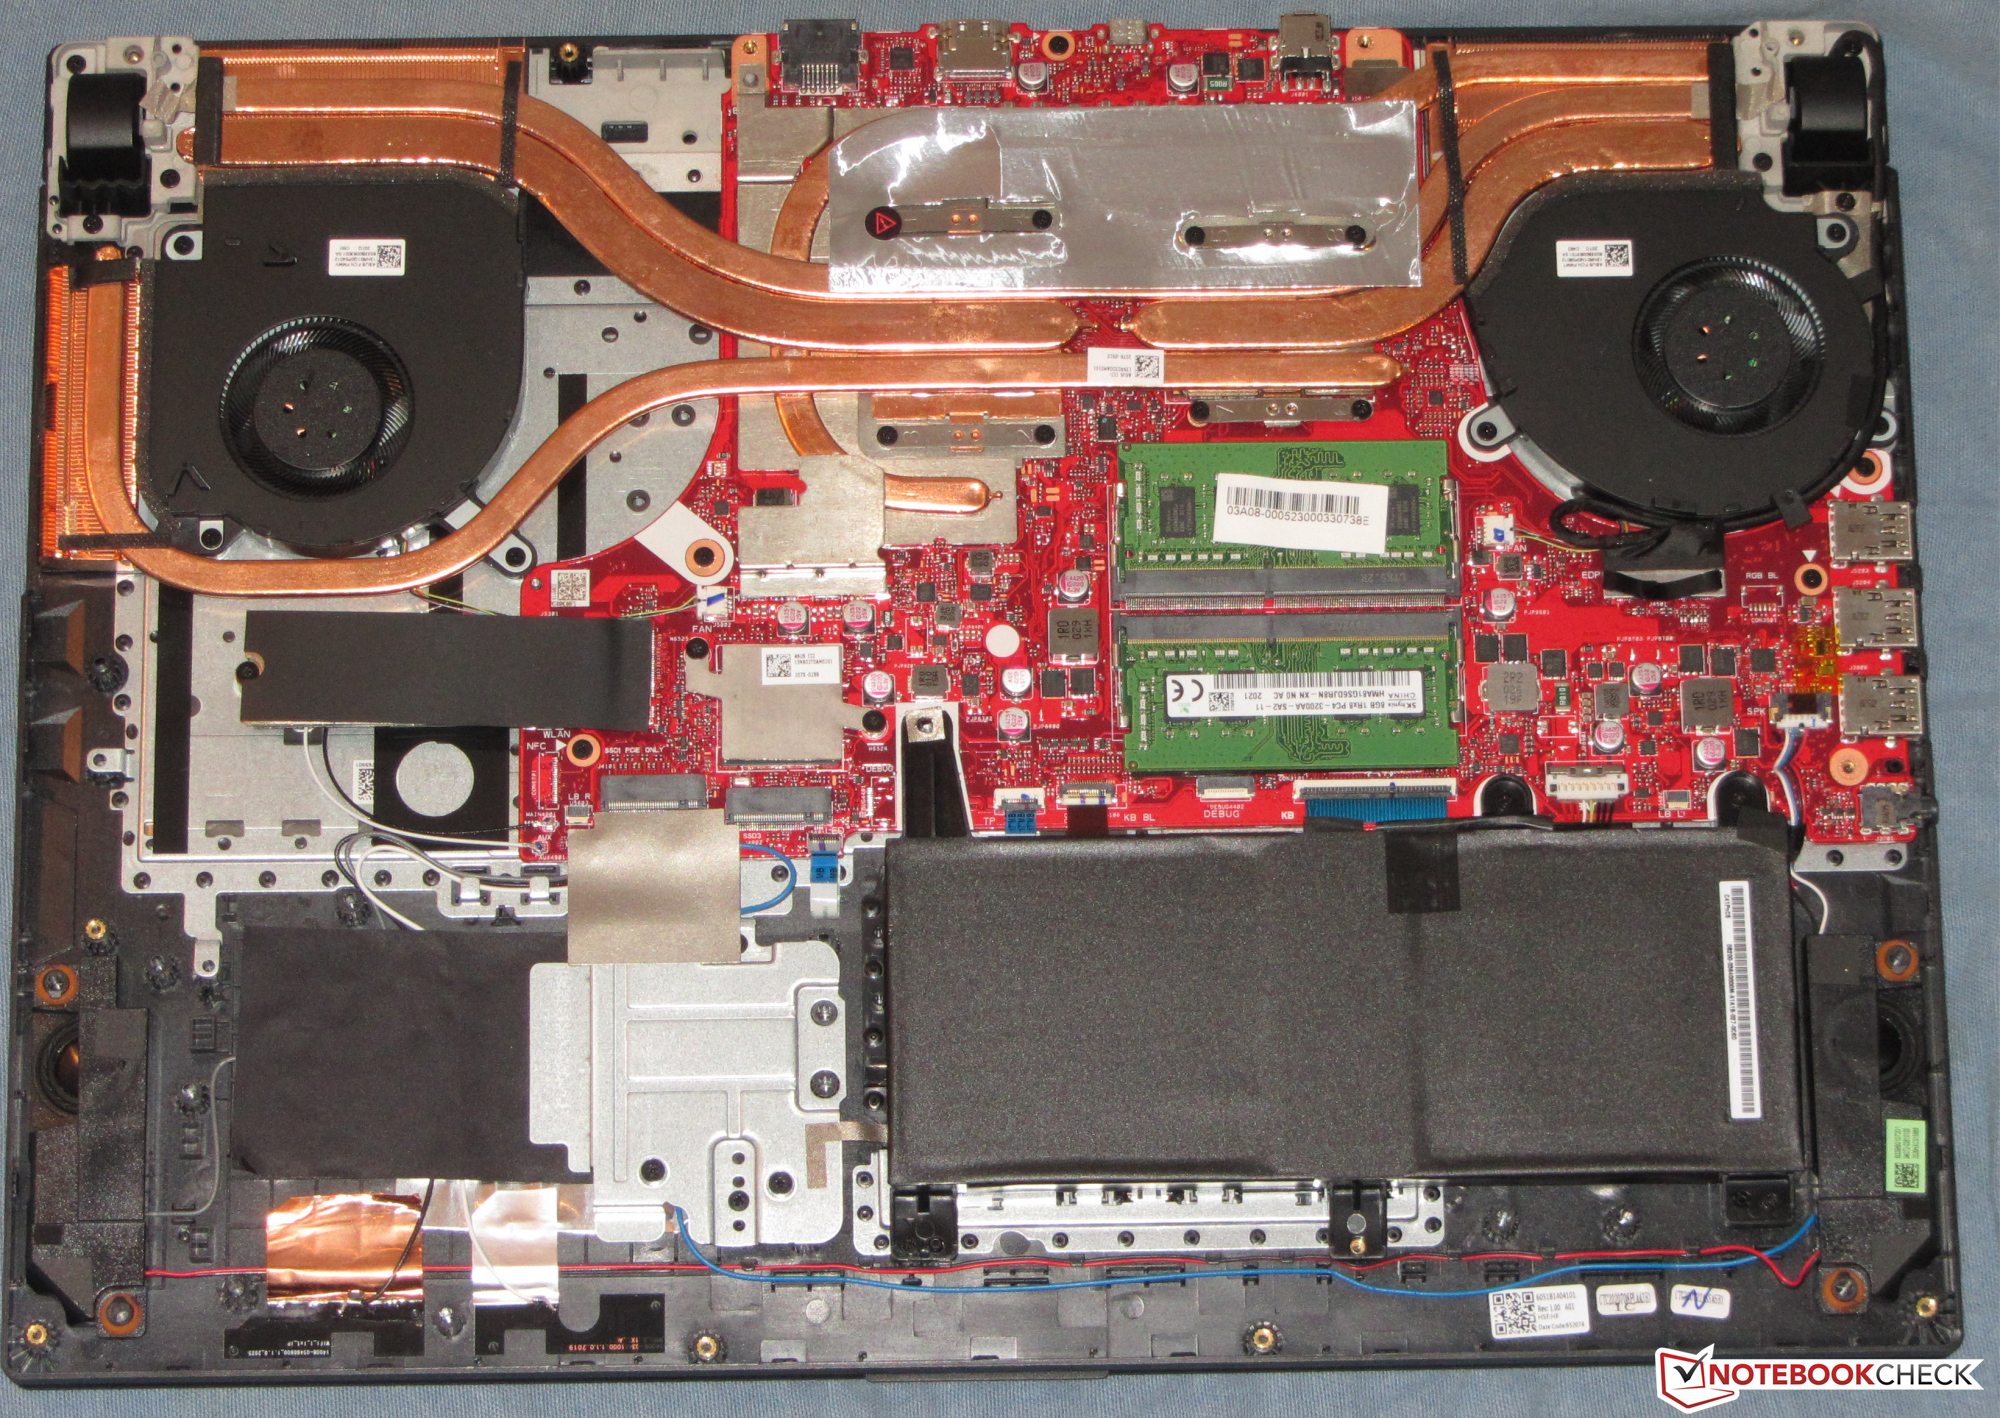
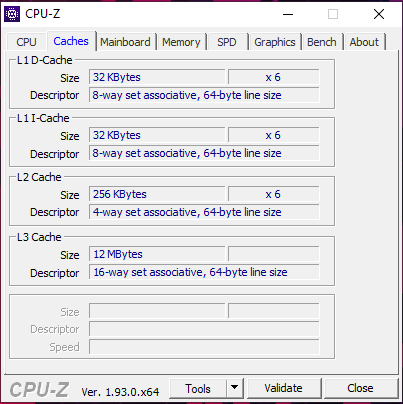
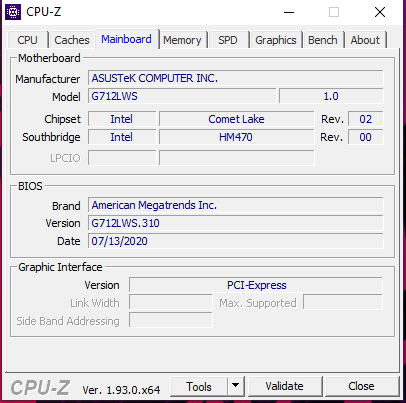
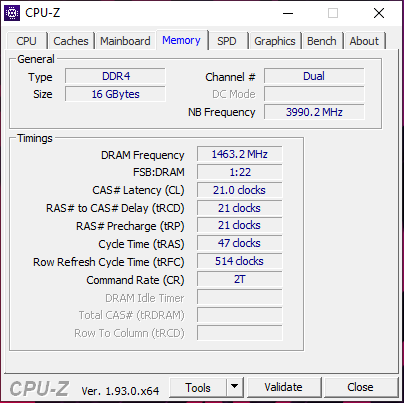
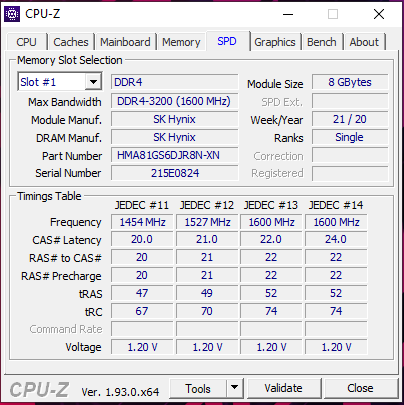
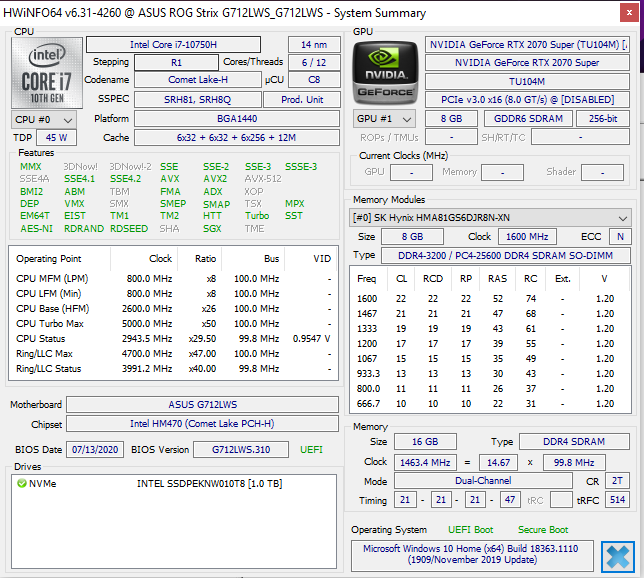
Le stockage (1 To) peut être augmenté. En plus du SSD NVMe présent, on peut mettre deux M.2 en plus. Le RAID 0 est possible. La mémoire (2x 8 Go en double canal) peut également être augmentée, mais la limite est d'après le site Asus fixée à 32 Go. Beaucoup de concurrents montent à 64 Go.
Il faut retirer la coque inférieure pour la maintenance et les mises à jour, ce qui est dans le principe faisable, mais la coque inférieure est connectée à la carte-mère par deux câbles en caoutchouc, qu'il faudra enlever délicatement. Les câbles peuvent être retirés et rattachés avec un peu d'habileté.
L'écran Full HD (IPS, 144 Hz) marque des points avec sa surface matte, ses angles de vision, sa luminosité, son contraste, ses temps de réponse, et des couleurs fidèles.
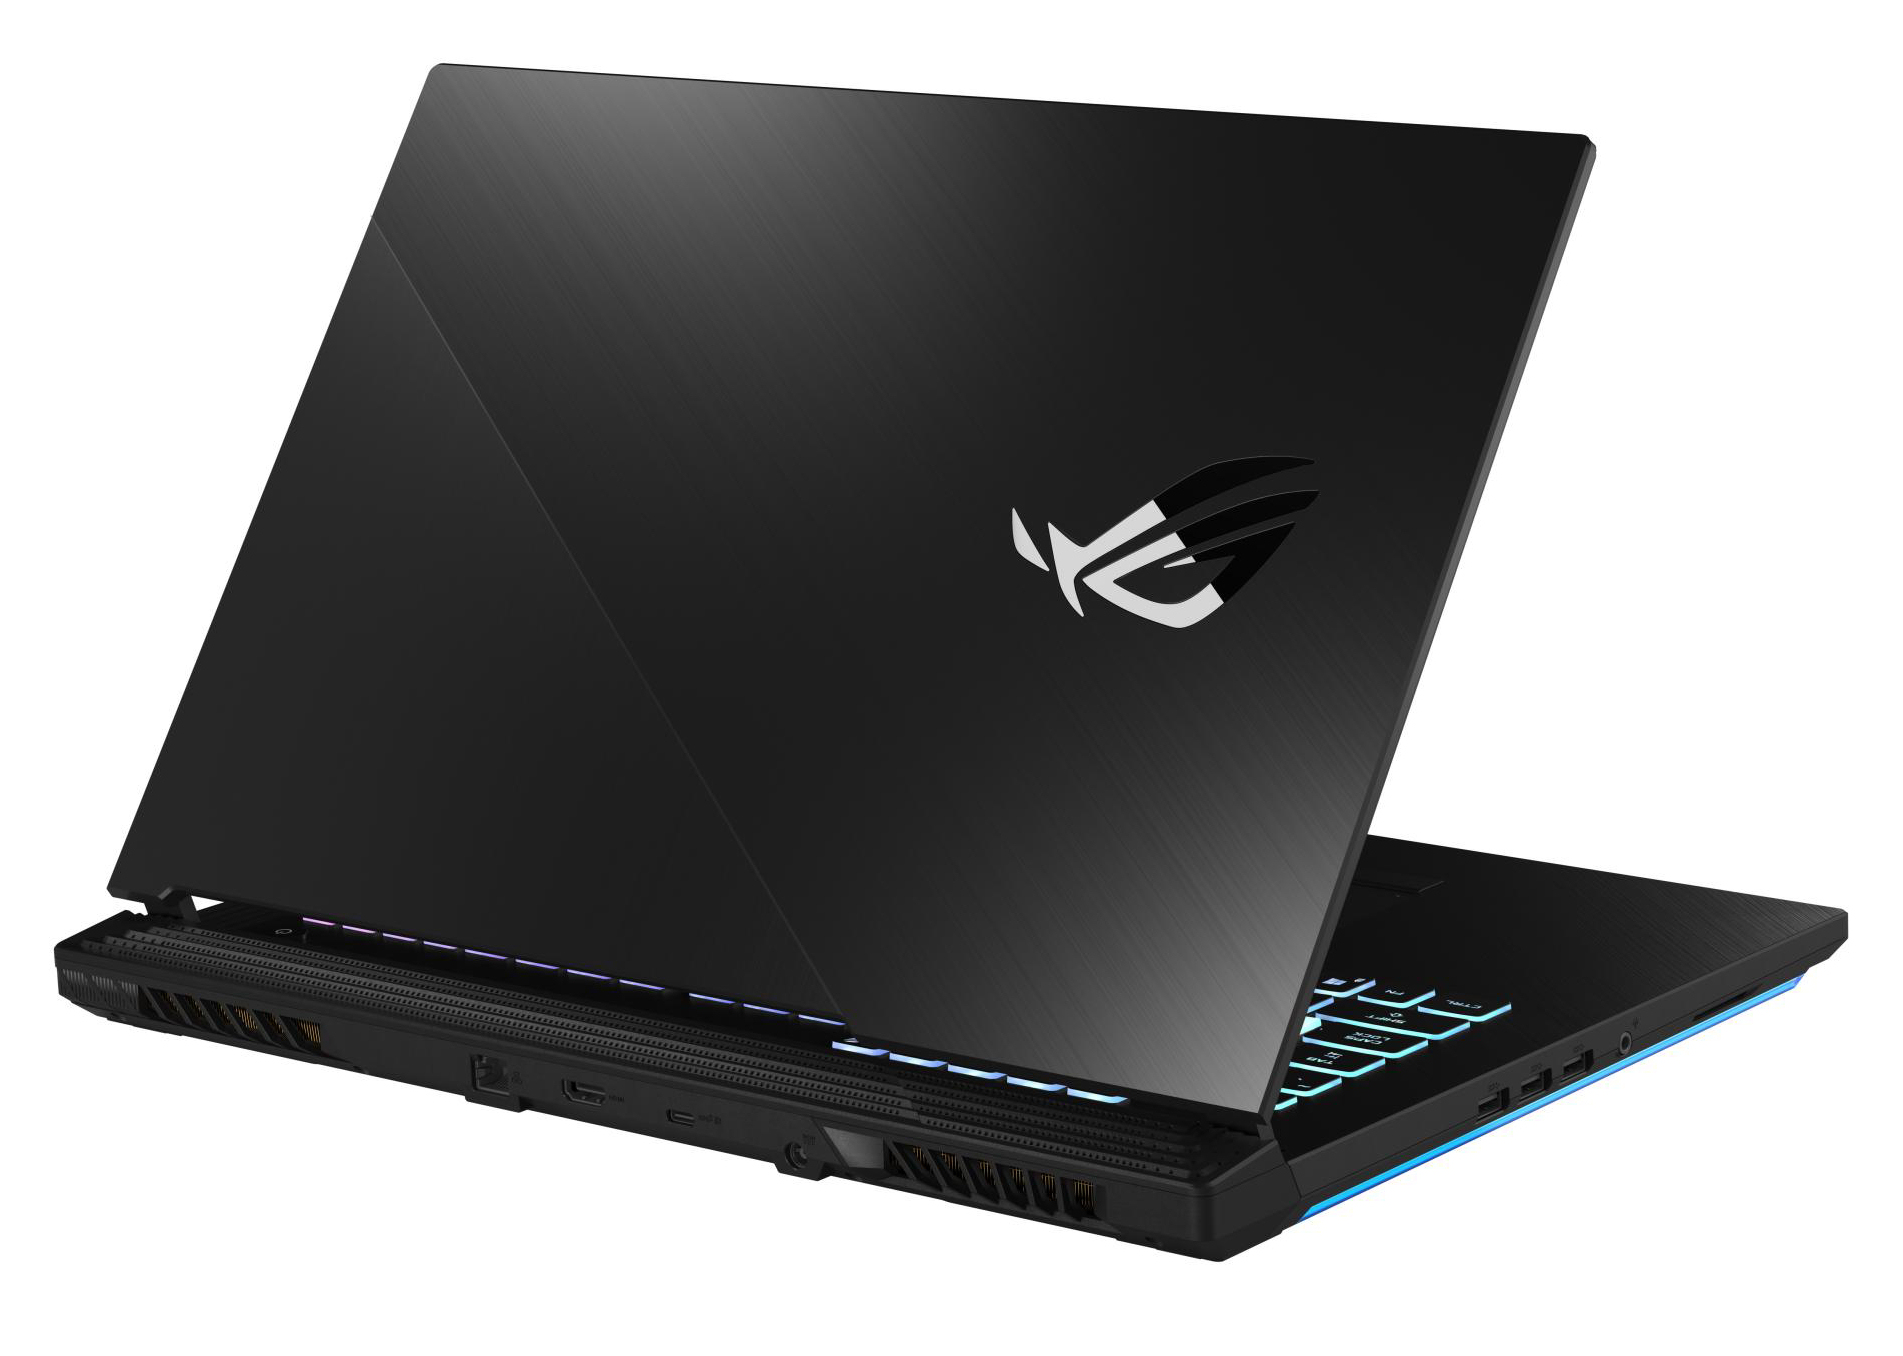
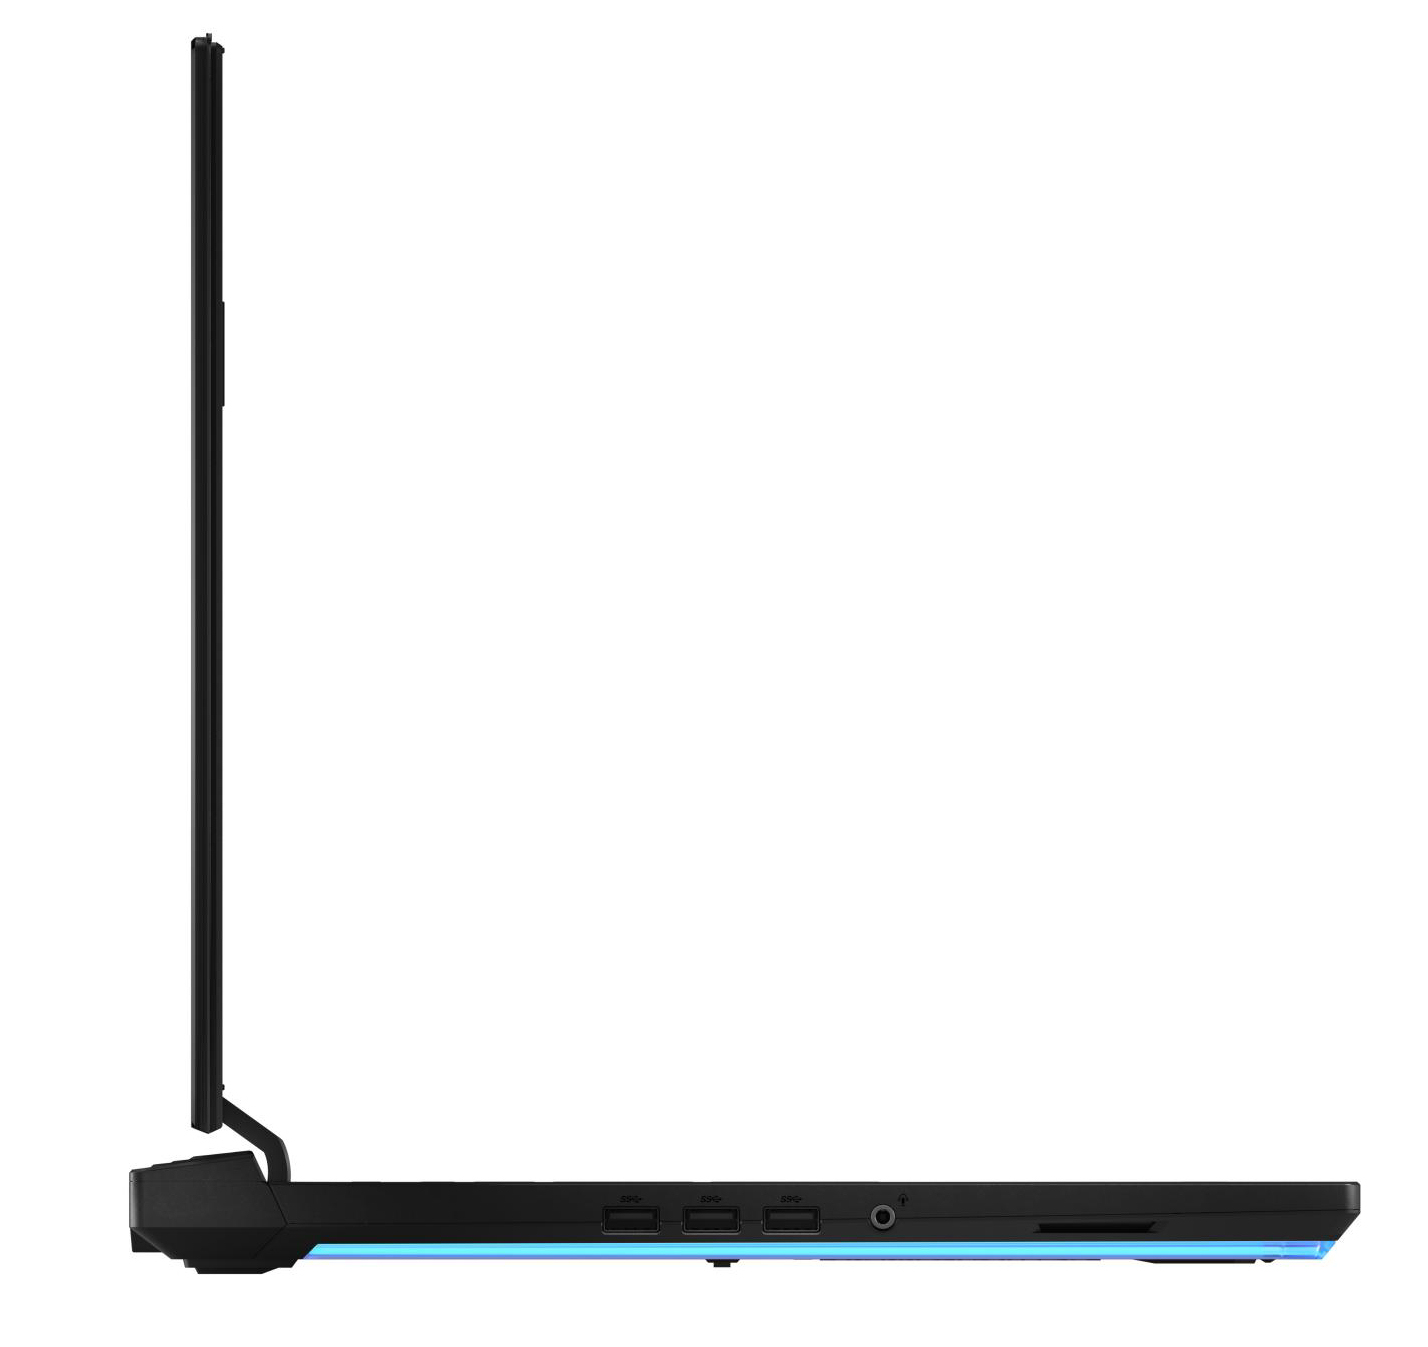
La sélection des ports, complète, inclut trois ports USB A 3.2 Gen 1, tous à gauche du châssis - Asus aurait dû en mettre au moins un à droite. Il n'y a pas de port Thunderbolt 3, et il n'y a qu'un seul port USB C 3.2 Gen 2, qui prend en charge le DisplayPort via USB C.
L’intégralité de cette critique est disponible en anglais en suivant ce lien.
Asus Strix G17 G712LWS
- 10/11/2020 v7 (old)
Sascha Mölck
Price comparison
