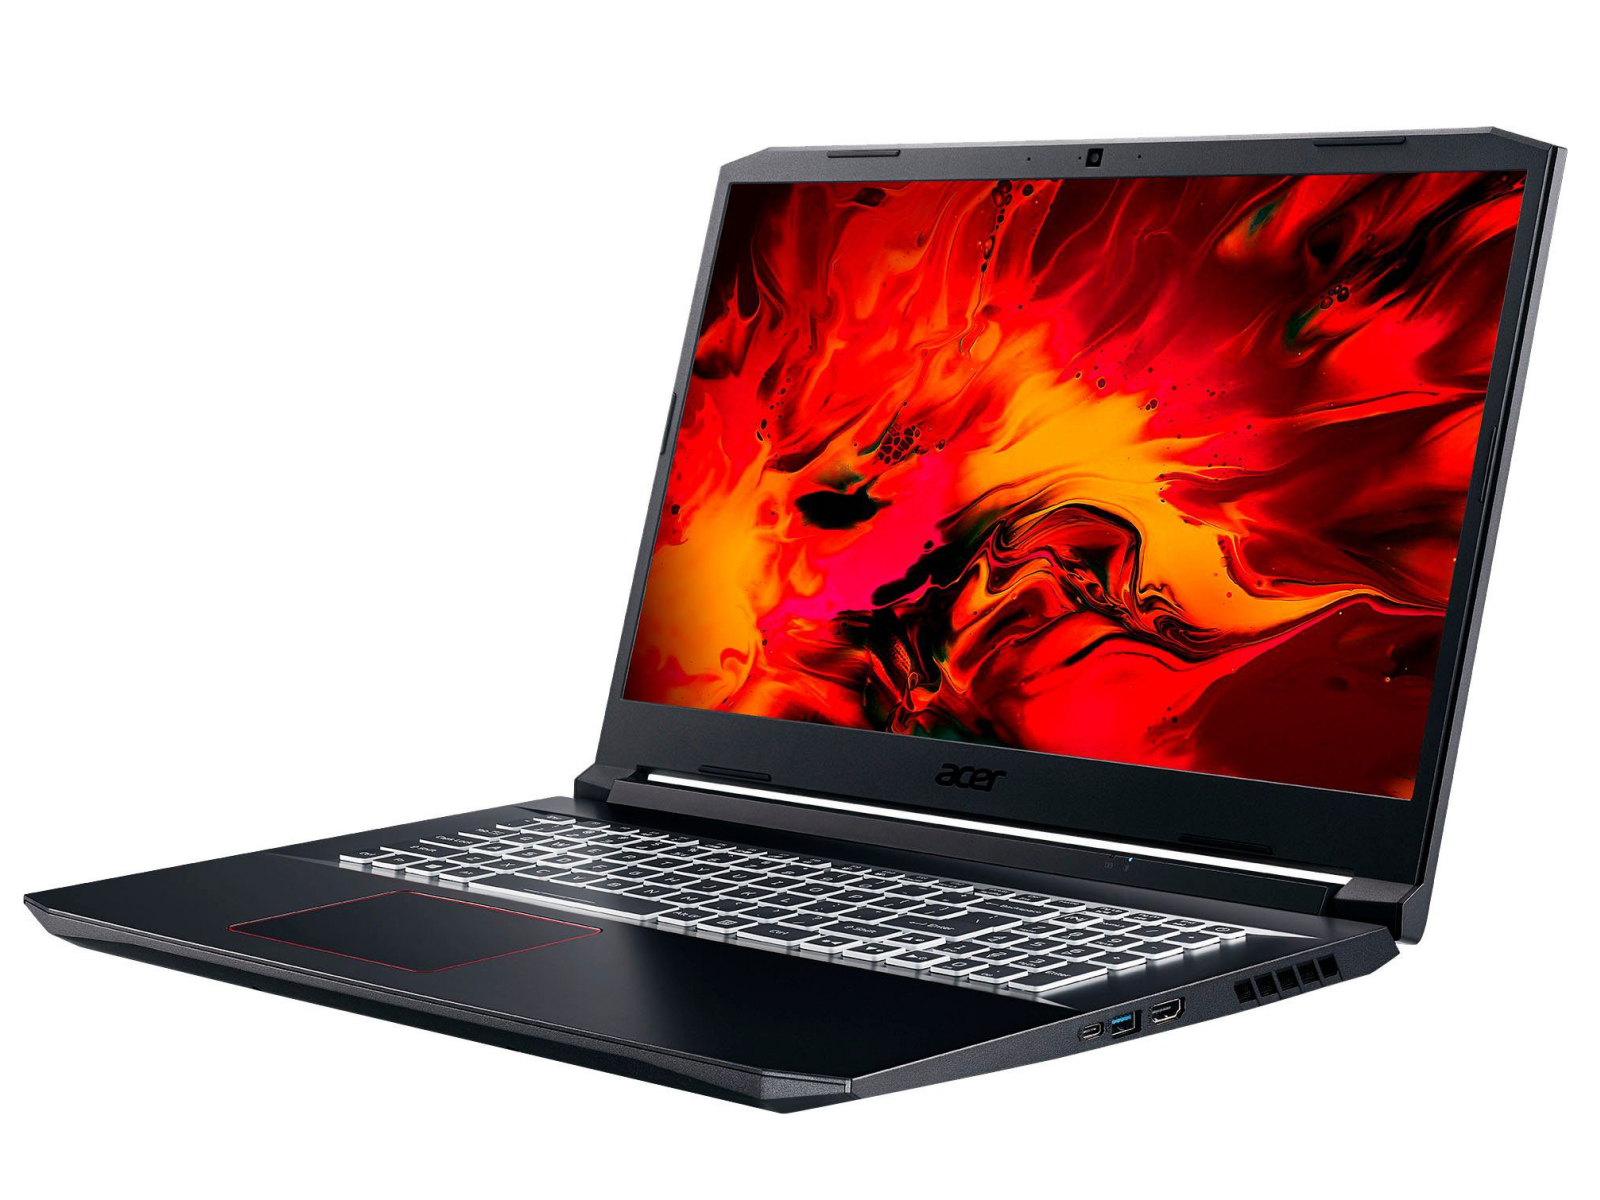
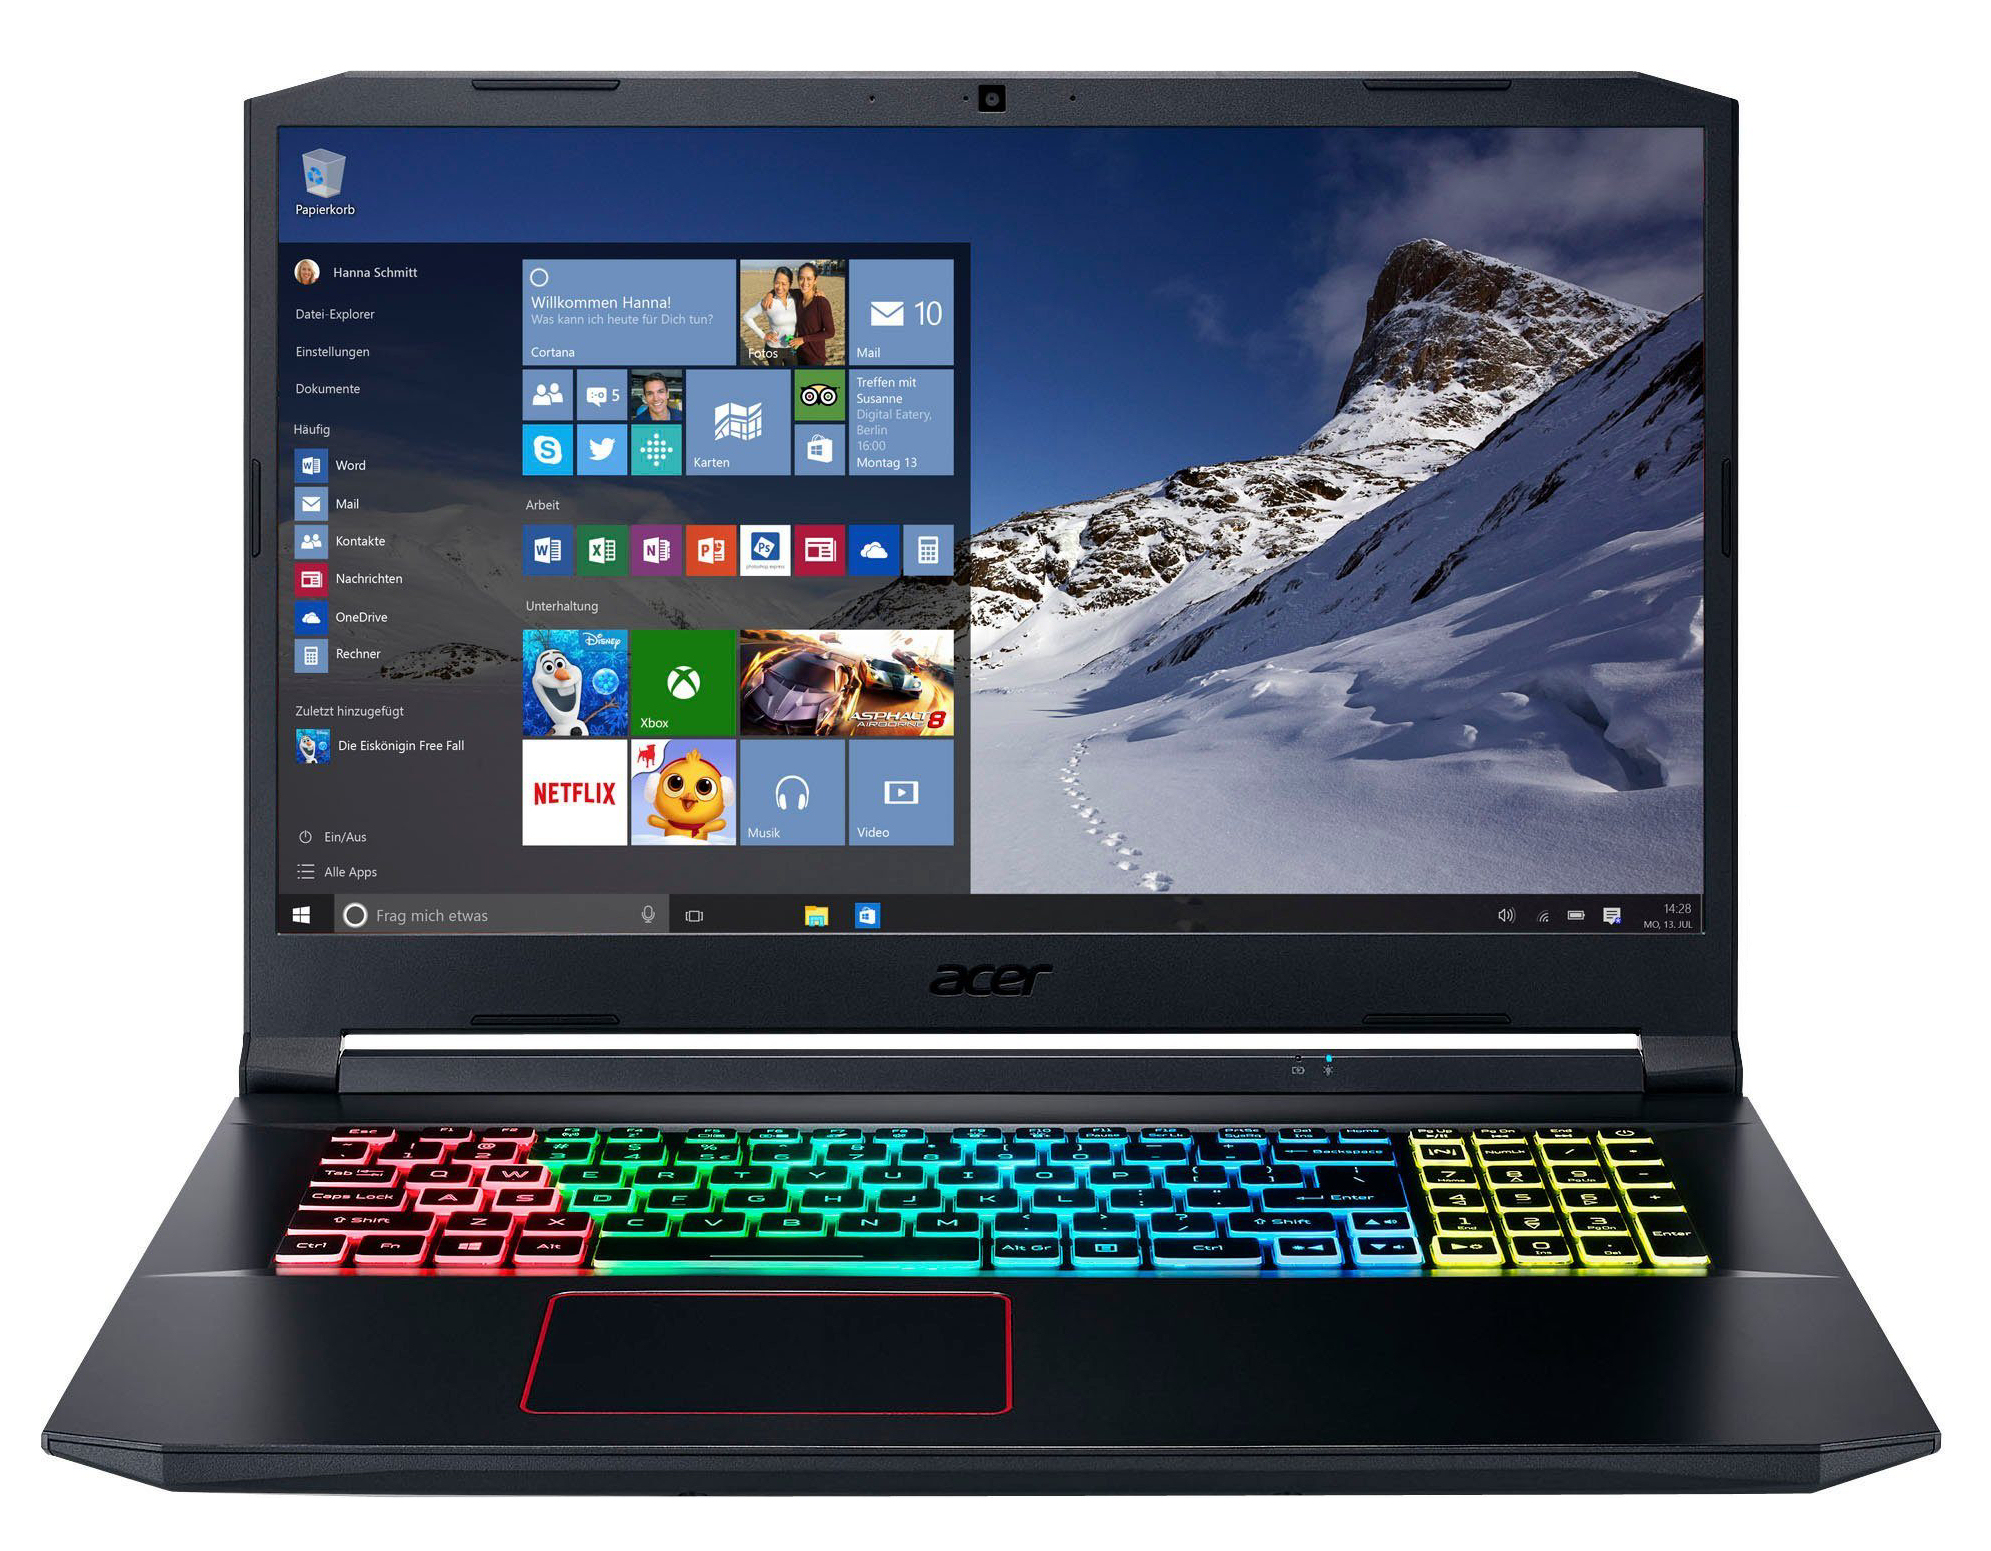
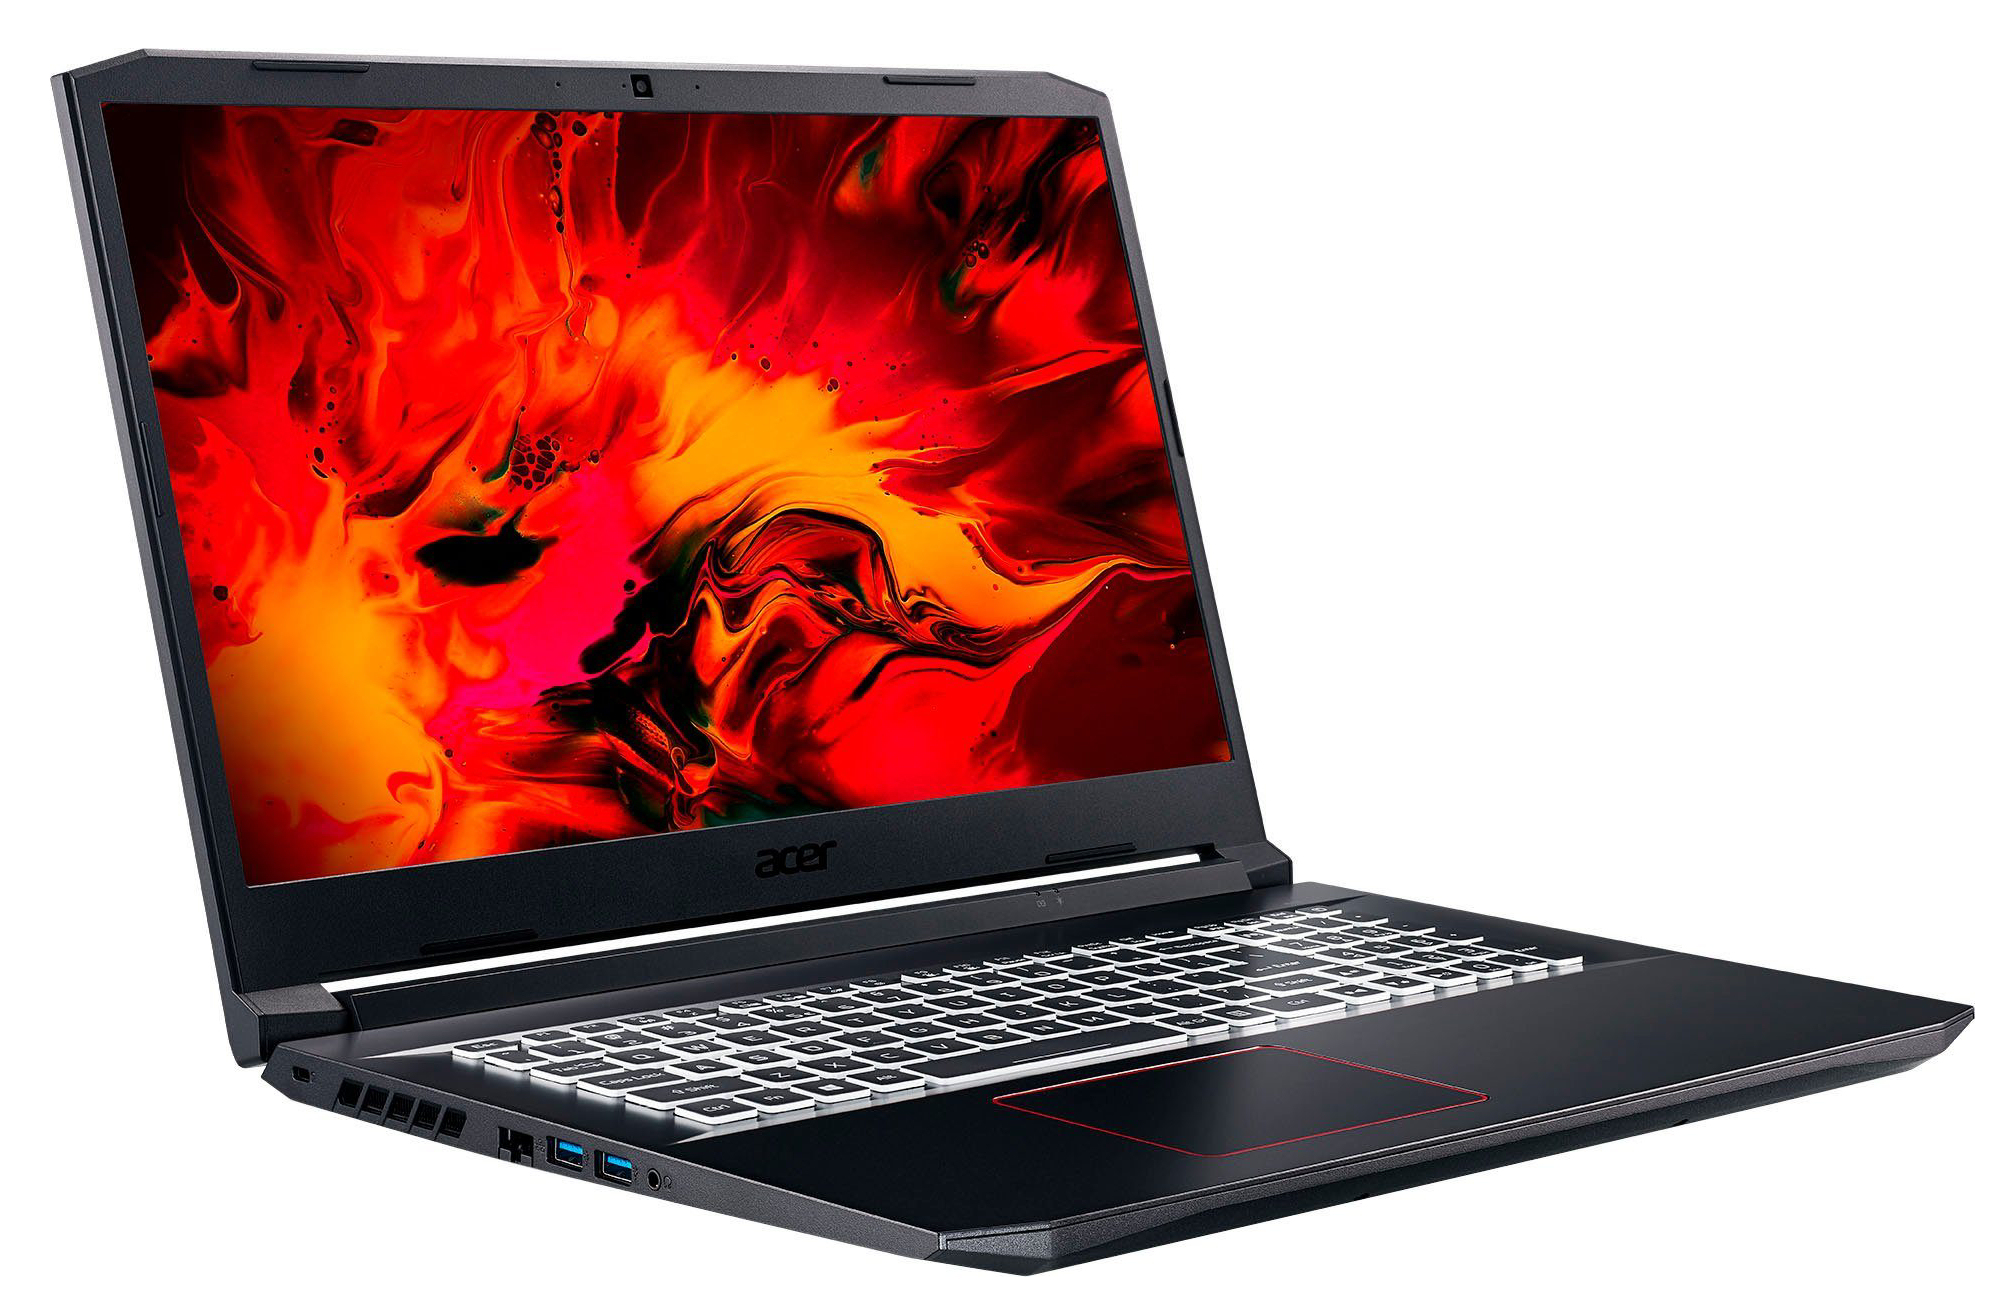
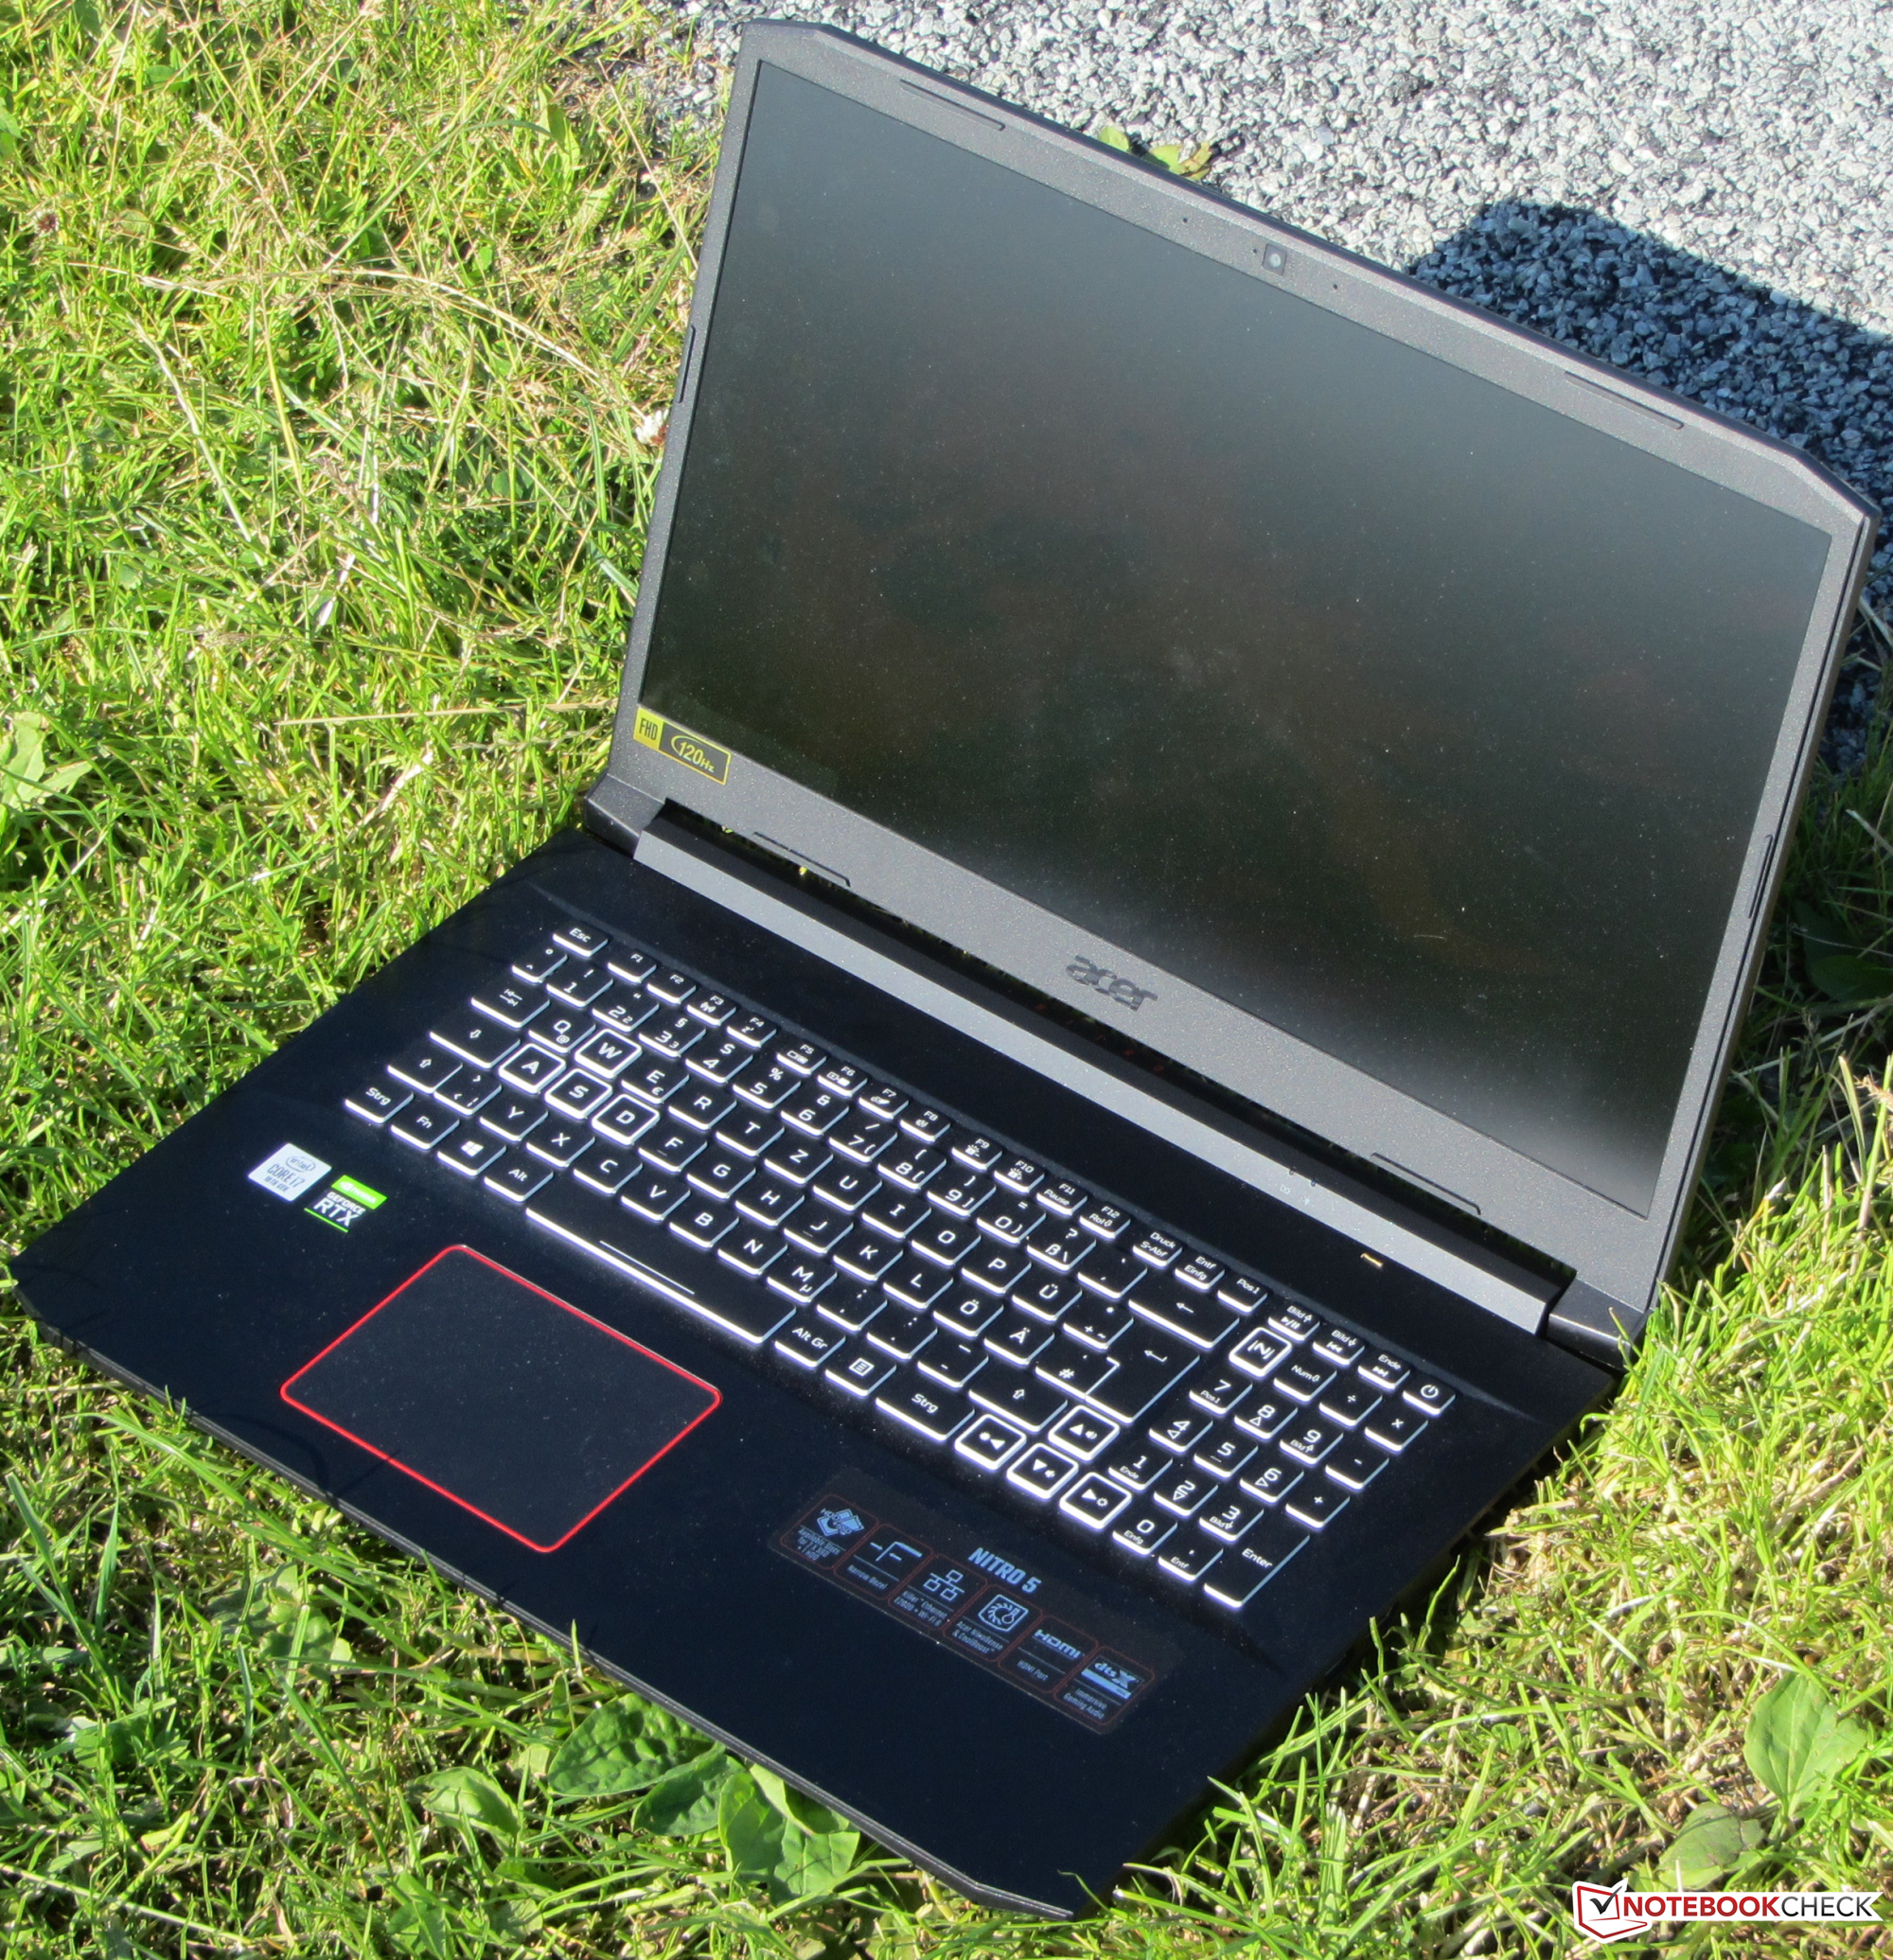
Test de l'Acer Nitro 5 AN517-52 (i7-10750H, RTX 2060, FHD, 120 Hz) : PC portable de jeu plutôt équilibré
Note | Date | Modèle | Poids | Épaisseur | Taille | Résolution | Prix |
|---|---|---|---|---|---|---|---|
| 80.6 % v7 (old) | 08/20 | Acer Nitro 5 AN517-52-77DS i7-10750H, GeForce RTX 2060 Mobile | 2.2 kg | 24.9 mm | 17.30" | 1920x1080 | |
| 82.9 % v7 (old) | 07/20 | Asus TUF A17 FA706IU-AS76 R7 4800H, GeForce GTX 1660 Ti Mobile | 2.6 kg | 26 mm | 17.30" | 1920x1080 | |
| 83.2 % v7 (old) | 03/20 | Schenker XMG Pro 17 PB71RD-G i7-9750H, GeForce RTX 2060 Mobile | 2.8 kg | 30 mm | 17.30" | 1920x1080 | |
| 81.6 % v7 (old) | 08/19 | HP Pavilion Gaming 17-cd0085cl i7-9750H, GeForce GTX 1660 Ti Max-Q | 2.8 kg | 25 mm | 17.30" | 1920x1080 | |
| 82.3 % v7 (old) | 07/19 | Lenovo Legion Y540-17IRH i5-9300H, GeForce GTX 1660 Ti Mobile | 2.8 kg | 26.3 mm | 17.30" | 1920x1080 |


| |||||||||||||||||||||||||
Homogénéité de la luminosité: 85 %
Valeur mesurée au centre, sur batterie: 263 cd/m²
Contraste: 560:1 (Valeurs des noirs: 0.47 cd/m²)
ΔE ColorChecker Calman: 5.07 | ∀{0.5-29.43 Ø4.72}
calibrated: 4.9
ΔE Greyscale Calman: 2.55 | ∀{0.09-98 Ø4.97}
59% sRGB (Argyll 1.6.3 3D)
37% AdobeRGB 1998 (Argyll 1.6.3 3D)
40.77% AdobeRGB 1998 (Argyll 3D)
58.9% sRGB (Argyll 3D)
39.47% Display P3 (Argyll 3D)
Gamma: 2.37
CCT: 6446 K
| Acer Nitro 5 AN517-52-77DS IPS, 1920x1080, 17.3" | Asus TUF A17 FA706IU-AS76 IPS, 1920x1080, 17.3" | Lenovo Legion Y540-17IRH IPS, 1920x1080, 17.3" | Schenker XMG Pro 17 PB71RD-G IPS, 1920x1080, 17.3" | HP Pavilion Gaming 17-cd0085cl IPS, 1920x1080, 17.3" | Acer Aspire Nitro 5 AN517-51-7887 IPS, 1920x1080, 17.3" | |
|---|---|---|---|---|---|---|
| Display | 2% | 72% | 56% | 57% | 57% | |
| Display P3 Coverage (%) | 39.47 | 40.55 3% | 69 75% | 62.8 59% | 63.3 60% | 62.7 59% |
| sRGB Coverage (%) | 58.9 | 59.7 1% | 98.3 67% | 89.8 52% | 90.2 53% | 92.5 57% |
| AdobeRGB 1998 Coverage (%) | 40.77 | 41.89 3% | 70.7 73% | 64.2 57% | 64.3 58% | 63.5 56% |
| Response Times | 31% | 50% | 53% | 18% | -3% | |
| Response Time Grey 50% / Grey 80% * (ms) | 35 ? | 22.4 ? 36% | 18 ? 49% | 16.8 ? 52% | 31.6 ? 10% | 37 ? -6% |
| Response Time Black / White * (ms) | 26 ? | 19.2 ? 26% | 12.8 ? 51% | 12 ? 54% | 19.6 ? 25% | 26 ? -0% |
| PWM Frequency (Hz) | ||||||
| Screen | 15% | 44% | 27% | 28% | 25% | |
| Brightness middle (cd/m²) | 263 | 264.8 1% | 286 9% | 274 4% | 299.6 14% | 407 55% |
| Brightness (cd/m²) | 246 | 253 3% | 282 15% | 273 11% | 285 16% | 364 48% |
| Brightness Distribution (%) | 85 | 90 6% | 87 2% | 95 12% | 86 1% | 84 -1% |
| Black Level * (cd/m²) | 0.47 | 0.31 34% | 0.19 60% | 0.26 45% | 0.33 30% | 0.3 36% |
| Contrast (:1) | 560 | 854 53% | 1505 169% | 1054 88% | 908 62% | 1357 142% |
| Colorchecker dE 2000 * | 5.07 | 4.73 7% | 3.57 30% | 4.62 9% | 3.68 27% | 4.55 10% |
| Colorchecker dE 2000 max. * | 20.5 | 18.89 8% | 7.5 63% | 7.66 63% | 8.05 61% | 12.44 39% |
| Colorchecker dE 2000 calibrated * | 4.9 | 4.64 5% | 1.31 73% | 1.93 61% | 3.15 36% | |
| Greyscale dE 2000 * | 2.55 | 1.4 45% | 4.51 -77% | 5.3 -108% | 3.8 -49% | 7.61 -198% |
| Gamma | 2.37 93% | 2.16 102% | 2.36 93% | 2.34 94% | 2.12 104% | 2.51 88% |
| CCT | 6446 101% | 6641 98% | 7411 88% | 7619 85% | 7240 90% | 7212 90% |
| Color Space (Percent of AdobeRGB 1998) (%) | 37 | 38.4 4% | 64 73% | 58 57% | 58.1 57% | 59 59% |
| Color Space (Percent of sRGB) (%) | 59 | 59.3 1% | 98 66% | 90 53% | 89.8 52% | 92 56% |
| Moyenne finale (programmes/paramètres) | 16% /
15% | 55% /
50% | 45% /
36% | 34% /
32% | 26% /
27% |
* ... Moindre est la valeur, meilleures sont les performances
Temps de réponse de l'écran
| ↔ Temps de réponse noir à blanc | ||
|---|---|---|
| 26 ms ... hausse ↗ et chute ↘ combinées | ↗ 14 ms hausse | 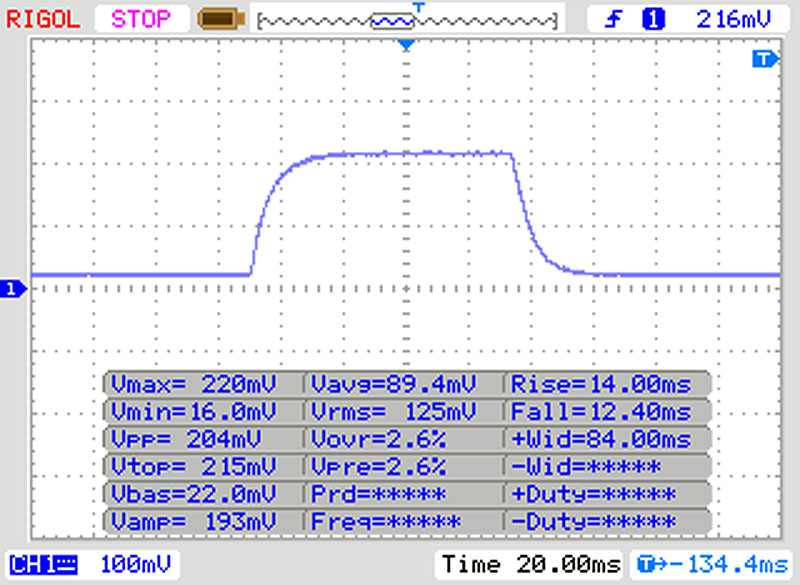 |
| ↘ 12 ms chute | ||
| L'écran souffre de latences relativement élevées, insuffisant pour le jeu. En comparaison, tous les appareils testés affichent entre 0.1 (minimum) et 240 (maximum) ms. » 62 % des appareils testés affichent de meilleures performances. Cela signifie que les latences relevées sont moins bonnes que la moyenne (19.8 ms) de tous les appareils testés. | ||
| ↔ Temps de réponse gris 50% à gris 80% | ||
| 35 ms ... hausse ↗ et chute ↘ combinées | ↗ 17 ms hausse | 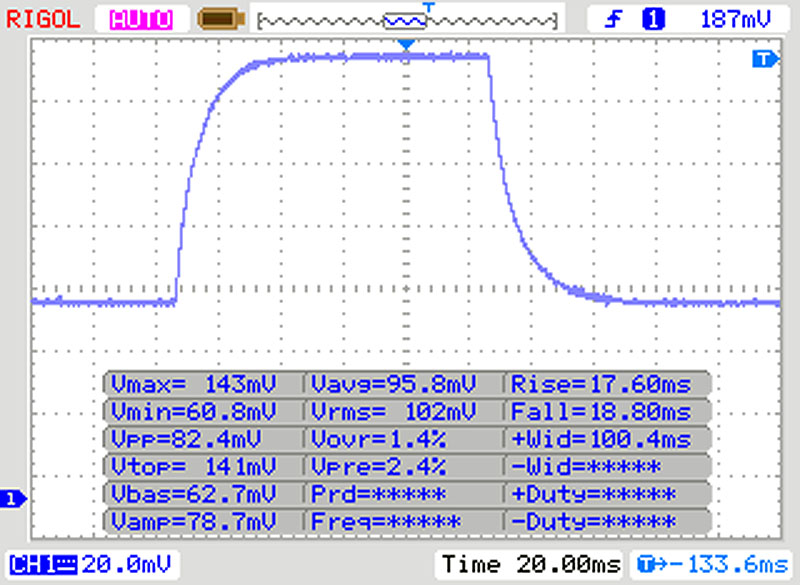 |
| ↘ 18 ms chute | ||
| L'écran souffre de latences très élevées, à éviter pour le jeu. En comparaison, tous les appareils testés affichent entre 0.165 (minimum) et 636 (maximum) ms. » 49 % des appareils testés affichent de meilleures performances. Cela signifie que les latences relevées sont moins bonnes que la moyenne (31 ms) de tous les appareils testés. | ||
Scintillement / MLI (Modulation de largeur d'impulsion)
| Scintillement / MLI (Modulation de largeur d'impulsion) non décelé | 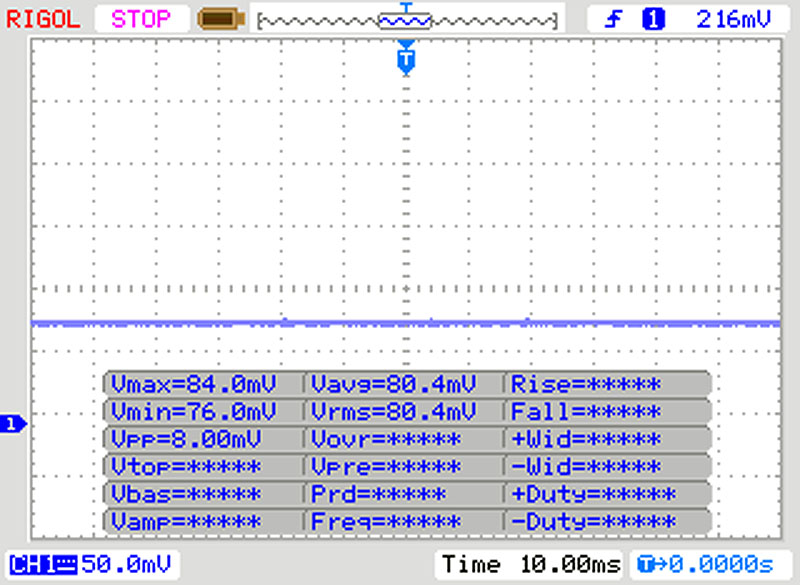 | ||
En comparaison, 52 % des appareils testés n'emploient pas MDI pour assombrir leur écran. Nous avons relevé une moyenne à 7763 (minimum : 5 - maximum : 343500) Hz dans le cas où une MDI était active. | |||
| LibreOffice - 20 Documents To PDF | |
| Asus TUF A17 FA706IU-AS76 | |
| Moyenne Intel Core i7-10750H (43.1 - 99.2, n=43) | |
| Acer Nitro 5 AN517-52-77DS | |
| Moyenne de la classe Gaming (19 - 88.8, n=108, 2 dernières années) | |
* ... Moindre est la valeur, meilleures sont les performances
| PCMark 8 Home Score Accelerated v2 | 3836 points | |
| PCMark 8 Creative Score Accelerated v2 | 4075 points | |
| PCMark 8 Work Score Accelerated v2 | 5552 points | |
| PCMark 10 Score | 5201 points | |
Aide | ||
| DPC Latencies / LatencyMon - interrupt to process latency (max), Web, Youtube, Prime95 | |
| Asus TUF A17 FA706IU-AS76 | |
| Acer Nitro 5 AN517-52-77DS | |
* ... Moindre est la valeur, meilleures sont les performances

| Acer Nitro 5 AN517-52-77DS WDC PC SN530 SDBPNPZ-1T00 | Asus TUF A17 FA706IU-AS76 Intel SSD 660p 1TB SSDPEKNW010T8 | Lenovo Legion Y540-17IRH WDC PC SN520 SDAPNUW-512G | Schenker XMG Pro 17 PB71RD-G Samsung SSD 970 EVO Plus 500GB | HP Pavilion Gaming 17-cd0085cl Samsung SSD PM981 MZVLB256HAHQ | Acer Aspire Nitro 5 AN517-51-7887 WDC PC SN520 SDAPNUW-512G | Moyenne WDC PC SN530 SDBPNPZ-1T00 | |
|---|---|---|---|---|---|---|---|
| CrystalDiskMark 5.2 / 6 | 10% | -27% | 22% | 16% | -21% | 16% | |
| Write 4K (MB/s) | 140 | 189.7 36% | 105.1 -25% | 117.5 -16% | 135.3 -3% | 104.6 -25% | 182.7 ? 31% |
| Read 4K (MB/s) | 49.04 | 62.3 27% | 34.41 -30% | 46.47 -5% | 63.7 30% | 39.76 -19% | 48.6 ? -1% |
| Write Seq (MB/s) | 1963 | 1681 -14% | 1298 -34% | 1345 -31% | 1337 -32% | 1268 -35% | 1979 ? 1% |
| Read Seq (MB/s) | 1455 | 1608 11% | 1099 -24% | 2804 93% | 1617 11% | 1414 -3% | 1828 ? 26% |
| Write 4K Q32T1 (MB/s) | 398.2 | 468.6 18% | 335.7 -16% | 368.2 -8% | 568 43% | 287.9 -28% | 498 ? 25% |
| Read 4K Q32T1 (MB/s) | 461.9 | 541 17% | 231.4 -50% | 412.9 -11% | 645 40% | 381.1 -17% | 573 ? 24% |
| Write Seq Q32T1 (MB/s) | 1969 | 1770 -10% | 1454 -26% | 3248 65% | 1428 -27% | 1319 -33% | 1980 ? 1% |
| Read Seq Q32T1 (MB/s) | 1927 | 1898 -2% | 1740 -10% | 3559 85% | 3184 65% | 1735 -10% | 2336 ? 21% |
Continuous load read: DiskSpd Read Loop, Queue Depth 8
| 3DMark 06 Standard Score | 38509 points | |
| 3DMark 11 Performance | 18057 points | |
| 3DMark Ice Storm Standard Score | 117009 points | |
| 3DMark Cloud Gate Standard Score | 31601 points | |
| 3DMark Fire Strike Score | 14191 points | |
| 3DMark Time Spy Score | 5759 points | |
Aide | ||
| BioShock Infinite - 1920x1080 Ultra Preset, DX11 (DDOF) | |
| Lenovo Legion Y740-17IRH | |
| Moyenne NVIDIA GeForce RTX 2060 Mobile (119 - 156, n=17) | |
| Acer Nitro 5 AN517-52-77DS | |
| Lenovo Legion Y540-17IRH | |
| Acer Aspire Nitro 5 AN517-51-7887 | |
| HP Pavilion Gaming 17-cd0085cl | |
| Shadow of the Tomb Raider - 1920x1080 Highest Preset AA:T | |
| Moyenne de la classe Gaming (96 - 116, n=2, 2 dernières années) | |
| Lenovo Legion Y740-17IRH | |
| Moyenne NVIDIA GeForce RTX 2060 Mobile (54 - 86, n=22) | |
| Asus TUF A17 FA706IU-AS76 | |
| Acer Nitro 5 AN517-52-77DS | |
| HP Pavilion Gaming 17-cd0085cl | |
| Bas | Moyen | Élevé | Ultra | |
|---|---|---|---|---|
| BioShock Infinite (2013) | 327.4 | 285.5 | 263.5 | 138.4 |
| The Witcher 3 (2015) | 277 | 188.3 | 108.9 | 63 |
| Dota 2 Reborn (2015) | 146.1 | 133.9 | 123.8 | 116.8 |
| X-Plane 11.11 (2018) | 98.3 | 84.1 | 75.8 | |
| Shadow of the Tomb Raider (2018) | 114 | 89 | 82 | 73 |
| Metro Exodus (2019) | 142.4 | 75.9 | 56.6 | 44.5 |
| Total War: Three Kingdoms (2019) | 229.6 | 107.4 | 66.9 | 46.3 |
| Control (2019) | 201.9 | 74.9 | 54.6 | |
| Borderlands 3 (2019) | 133 | 86.9 | 62.2 | 47.7 |
| Call of Duty Modern Warfare 2019 (2019) | 133.5 | 90.2 | 74.3 | 65.5 |
| Red Dead Redemption 2 (2019) | 116.9 | 76.1 | 50.7 | 32.5 |
| Escape from Tarkov (2020) | 121 | 121 | 117.5 | 103.3 |
| Hunt Showdown (2020) | 170.6 | 94.2 | 75 | |
| Doom Eternal (2020) | 195.6 | 125.4 | 112.4 | 108.9 |
| Gears Tactics (2020) | 236.1 | 145.6 | 93.3 | 60.7 |
Degré de la nuisance sonore
| Au repos |
| 30.2 / 30.2 / 30.2 dB(A) |
| Fortement sollicité |
| 41.5 / 44.6 dB(A) |
 | ||
30 dB silencieux 40 dB(A) audible 50 dB(A) bruyant |
||
min: | ||
| Acer Nitro 5 AN517-52-77DS i7-10750H, GeForce RTX 2060 Mobile | Asus TUF A17 FA706IU-AS76 R7 4800H, GeForce GTX 1660 Ti Mobile | Schenker XMG Pro 17 PB71RD-G i7-9750H, GeForce RTX 2060 Mobile | Lenovo Legion Y540-17IRH i5-9300H, GeForce GTX 1660 Ti Mobile | HP Pavilion Gaming 17-cd0085cl i7-9750H, GeForce GTX 1660 Ti Max-Q | Acer Aspire Nitro 5 AN517-51-7887 i7-9750H, GeForce GTX 1660 Ti Mobile | Moyenne NVIDIA GeForce RTX 2060 Mobile | Moyenne de la classe Gaming | |
|---|---|---|---|---|---|---|---|---|
| Noise | -5% | -14% | -7% | 7% | -3% | -3% | 3% | |
| arrêt / environnement * (dB) | 30.2 | 28.7 5% | 30 1% | 30 1% | 28.2 7% | 30 1% | 27.9 ? 8% | 24.1 ? 20% |
| Idle Minimum * (dB) | 30.2 | 28.7 5% | 30 1% | 30 1% | 30.1 -0% | 30.2 -0% | 29 ? 4% | 25.9 ? 14% |
| Idle Average * (dB) | 30.2 | 30.5 -1% | 32 -6% | 32 -6% | 30.1 -0% | 30.2 -0% | 30 ? 1% | 27.4 ? 9% |
| Idle Maximum * (dB) | 30.2 | 32.5 -8% | 39 -29% | 34 -13% | 30.1 -0% | 31 -3% | 33 ? -9% | 29.9 ? 1% |
| Load Average * (dB) | 41.5 | 42.5 -2% | 51 -23% | 44 -6% | 34.2 18% | 43.4 -5% | 44 ? -6% | 43 ? -4% |
| Witcher 3 ultra * (dB) | 44.5 | 50.1 -13% | 54 -21% | 50 -12% | 34.2 23% | 48.5 -9% | ||
| Load Maximum * (dB) | 44.6 | 53.4 -20% | 54 -21% | 52 -17% | 43.8 2% | 45.5 -2% | 51.6 ? -16% | 54.1 ? -21% |
* ... Moindre est la valeur, meilleures sont les performances
(-) La température maximale du côté supérieur est de 50.6 °C / 123 F, par rapport à la moyenne de 40.4 °C / 105 F, allant de 21.2 à 68.8 °C pour la classe Gaming.
(-) Le fond chauffe jusqu'à un maximum de 53.8 °C / 129 F, contre une moyenne de 43.2 °C / 110 F
(+) En utilisation inactive, la température moyenne du côté supérieur est de 25 °C / 77 F, par rapport à la moyenne du dispositif de 33.9 °C / 93 F.
(±) En jouant à The Witcher 3, la température moyenne du côté supérieur est de 37.3 °C / 99 F, alors que la moyenne de l'appareil est de 33.9 °C / 93 F.
(+) Les repose-poignets et le pavé tactile sont plus froids que la température de la peau avec un maximum de 26.1 °C / 79 F et sont donc froids au toucher.
(+) La température moyenne de la zone de l'appui-paume de dispositifs similaires était de 28.8 °C / 83.8 F (+2.7 °C / #4.8 F).
| Acer Nitro 5 AN517-52-77DS i7-10750H, GeForce RTX 2060 Mobile | Asus TUF A17 FA706IU-AS76 R7 4800H, GeForce GTX 1660 Ti Mobile | Schenker XMG Pro 17 PB71RD-G i7-9750H, GeForce RTX 2060 Mobile | Lenovo Legion Y740-17IRH i7-9750H, GeForce RTX 2060 Mobile | HP Pavilion Gaming 17-cd0085cl i7-9750H, GeForce GTX 1660 Ti Max-Q | Acer Aspire Nitro 5 AN517-51-7887 i7-9750H, GeForce GTX 1660 Ti Mobile | Moyenne NVIDIA GeForce RTX 2060 Mobile | Moyenne de la classe Gaming | |
|---|---|---|---|---|---|---|---|---|
| Heat | -4% | -4% | -3% | -11% | -5% | -7% | -5% | |
| Maximum Upper Side * (°C) | 50.6 | 47.6 6% | 47 7% | 43 15% | 42.6 16% | 51.7 -2% | 47.2 ? 7% | 45.2 ? 11% |
| Maximum Bottom * (°C) | 53.8 | 50.8 6% | 48 11% | 46 14% | 49 9% | 55.4 -3% | 52.7 ? 2% | 48.1 ? 11% |
| Idle Upper Side * (°C) | 26.6 | 33 -24% | 30 -13% | 31 -17% | 34 -28% | 29.1 -9% | 31 ? -17% | 31.1 ? -17% |
| Idle Bottom * (°C) | 27.8 | 29 -4% | 34 -22% | 34 -22% | 39.4 -42% | 29 -4% | 32.9 ? -18% | 34.3 ? -23% |
* ... Moindre est la valeur, meilleures sont les performances
Acer Nitro 5 AN517-52-77DS analyse audio
(-) | haut-parleurs pas très forts (67.8 dB)
Basses 100 - 315 Hz
(-) | presque aucune basse - en moyenne 22.3% plus bas que la médiane
(±) | la linéarité des basses est moyenne (12% delta à la fréquence précédente)
Médiums 400 - 2000 Hz
(+) | médiane équilibrée - seulement 4.1% de la médiane
(±) | la linéarité des médiums est moyenne (9.2% delta à la fréquence précédente)
Aiguës 2 - 16 kHz
(+) | des sommets équilibrés - à seulement 2.6% de la médiane
(+) | les aigus sont linéaires (6.3% delta à la fréquence précédente)
Globalement 100 - 16 000 Hz
(±) | la linéarité du son global est moyenne (22.4% de différence avec la médiane)
Par rapport à la même classe
» 80% de tous les appareils testés de cette catégorie étaient meilleurs, 6% similaires, 14% pires
» Le meilleur avait un delta de 6%, la moyenne était de 18%, le pire était de 132%.
Par rapport à tous les appareils testés
» 65% de tous les appareils testés étaient meilleurs, 6% similaires, 29% pires
» Le meilleur avait un delta de 4%, la moyenne était de 24%, le pire était de 134%.
Asus TUF A17 FA706IU-AS76 analyse audio
(±) | le niveau sonore du haut-parleur est moyen mais bon (74# dB)
Basses 100 - 315 Hz
(±) | basse réduite - en moyenne 12.7% inférieure à la médiane
(±) | la linéarité des basses est moyenne (11.5% delta à la fréquence précédente)
Médiums 400 - 2000 Hz
(+) | médiane équilibrée - seulement 4.8% de la médiane
(±) | la linéarité des médiums est moyenne (9.1% delta à la fréquence précédente)
Aiguës 2 - 16 kHz
(+) | des sommets équilibrés - à seulement 3.1% de la médiane
(±) | la linéarité des aigus est moyenne (8.7% delta à la fréquence précédente)
Globalement 100 - 16 000 Hz
(±) | la linéarité du son global est moyenne (23.5% de différence avec la médiane)
Par rapport à la même classe
» 85% de tous les appareils testés de cette catégorie étaient meilleurs, 5% similaires, 10% pires
» Le meilleur avait un delta de 6%, la moyenne était de 18%, le pire était de 132%.
Par rapport à tous les appareils testés
» 70% de tous les appareils testés étaient meilleurs, 6% similaires, 24% pires
» Le meilleur avait un delta de 4%, la moyenne était de 24%, le pire était de 134%.
| Éteint/en veille | |
| Au repos | |
| Fortement sollicité |
|
Légende:
min: | |
| Acer Nitro 5 AN517-52-77DS i7-10750H, GeForce RTX 2060 Mobile | Asus TUF A17 FA706IU-AS76 R7 4800H, GeForce GTX 1660 Ti Mobile | Schenker XMG Pro 17 PB71RD-G i7-9750H, GeForce RTX 2060 Mobile | Lenovo Legion Y540-17IRH i5-9300H, GeForce GTX 1660 Ti Mobile | HP Pavilion Gaming 17-cd0085cl i7-9750H, GeForce GTX 1660 Ti Max-Q | Acer Aspire Nitro 5 AN517-51-7887 i7-9750H, GeForce GTX 1660 Ti Mobile | Moyenne NVIDIA GeForce RTX 2060 Mobile | Moyenne de la classe Gaming | |
|---|---|---|---|---|---|---|---|---|
| Power Consumption | -15% | -60% | -89% | 5% | 10% | -61% | -79% | |
| Idle Minimum * (Watt) | 5.4 | 7.4 -37% | 11 -104% | 19 -252% | 5.4 -0% | 3.9 28% | 11.5 ? -113% | 13.1 ? -143% |
| Idle Average * (Watt) | 9.8 | 10.5 -7% | 18 -84% | 22 -124% | 9.2 6% | 8.9 9% | 16.5 ? -68% | 18.8 ? -92% |
| Idle Maximum * (Watt) | 10.9 | 17 -56% | 28 -157% | 30 -175% | 13 -19% | 12.2 -12% | 23.7 ? -117% | 24.4 ? -124% |
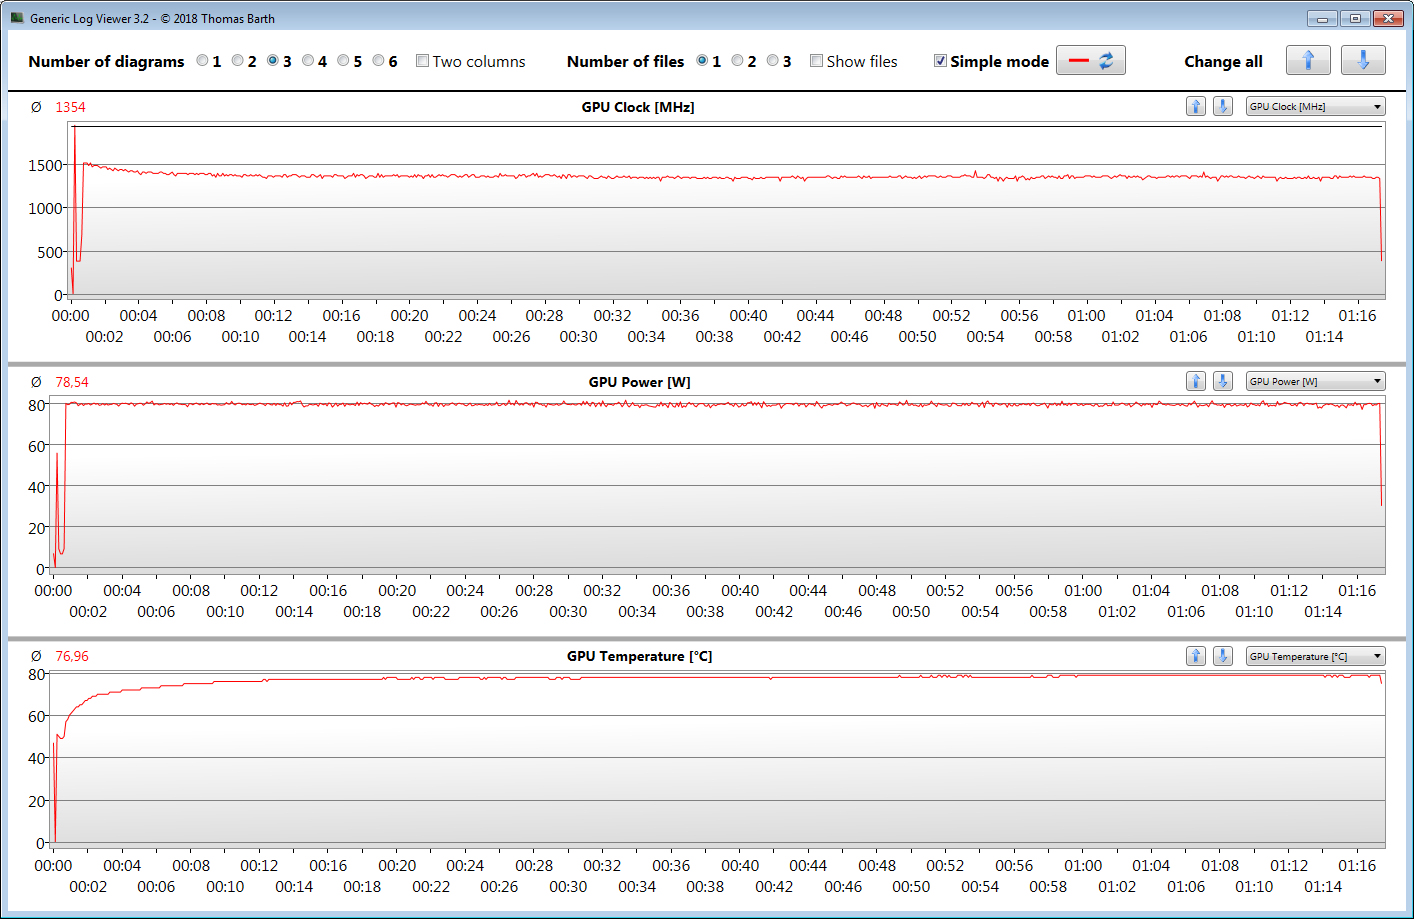
| Load Average * (Watt) | 104 | 103.7 -0% | 99 5% | 79 24% | 85.9 17% | 83 20% | 107.5 ? -3% | 108.6 ? -4% |
| Witcher 3 ultra * (Watt) | 134.3 | 128.1 5% | 146 -9% | 134 -0% | 107.9 20% | 130 3% | ||
| Load Maximum * (Watt) | 193 | 183.2 5% | 210 -9% | 201 -4% | 182.2 6% | 168 13% | 199.7 ? -3% | 254 ? -32% |
* ... Moindre est la valeur, meilleures sont les performances
| Acer Nitro 5 AN517-52-77DS i7-10750H, GeForce RTX 2060 Mobile, 57.48 Wh | Asus TUF A17 FA706IU-AS76 R7 4800H, GeForce GTX 1660 Ti Mobile, 90 Wh | Lenovo Legion Y540-17IRH i5-9300H, GeForce GTX 1660 Ti Mobile, 57 Wh | Schenker XMG Pro 17 PB71RD-G i7-9750H, GeForce RTX 2060 Mobile, 62 Wh | HP Pavilion Gaming 17-cd0085cl i7-9750H, GeForce GTX 1660 Ti Max-Q, 52.5 Wh | Acer Aspire Nitro 5 AN517-51-7887 i7-9750H, GeForce GTX 1660 Ti Mobile, 57 Wh | Moyenne de la classe Gaming | |
|---|---|---|---|---|---|---|---|
| Autonomie de la batterie | 26% | -49% | -42% | -20% | -3% | -7% | |
| Reader / Idle (h) | 11 | 9.1 -17% | 5.2 -53% | 5.2 -53% | 11.6 5% | 13.4 22% | 8.71 ? -21% |
| H.264 (h) | 7.3 | 3.4 -53% | 6.3 -14% | 8.28 ? 13% | |||
| WiFi v1.3 (h) | 6.6 | 8.5 29% | 3.7 -44% | 4.1 -38% | 5.7 -14% | 6.2 -6% | 6.96 ? 5% |
| Load (h) | 2 | 3.3 65% | 1.1 -45% | 1.3 -35% | 1 -50% | 1.7 -15% | 1.47 ? -26% |
Points positifs
Points négatifs
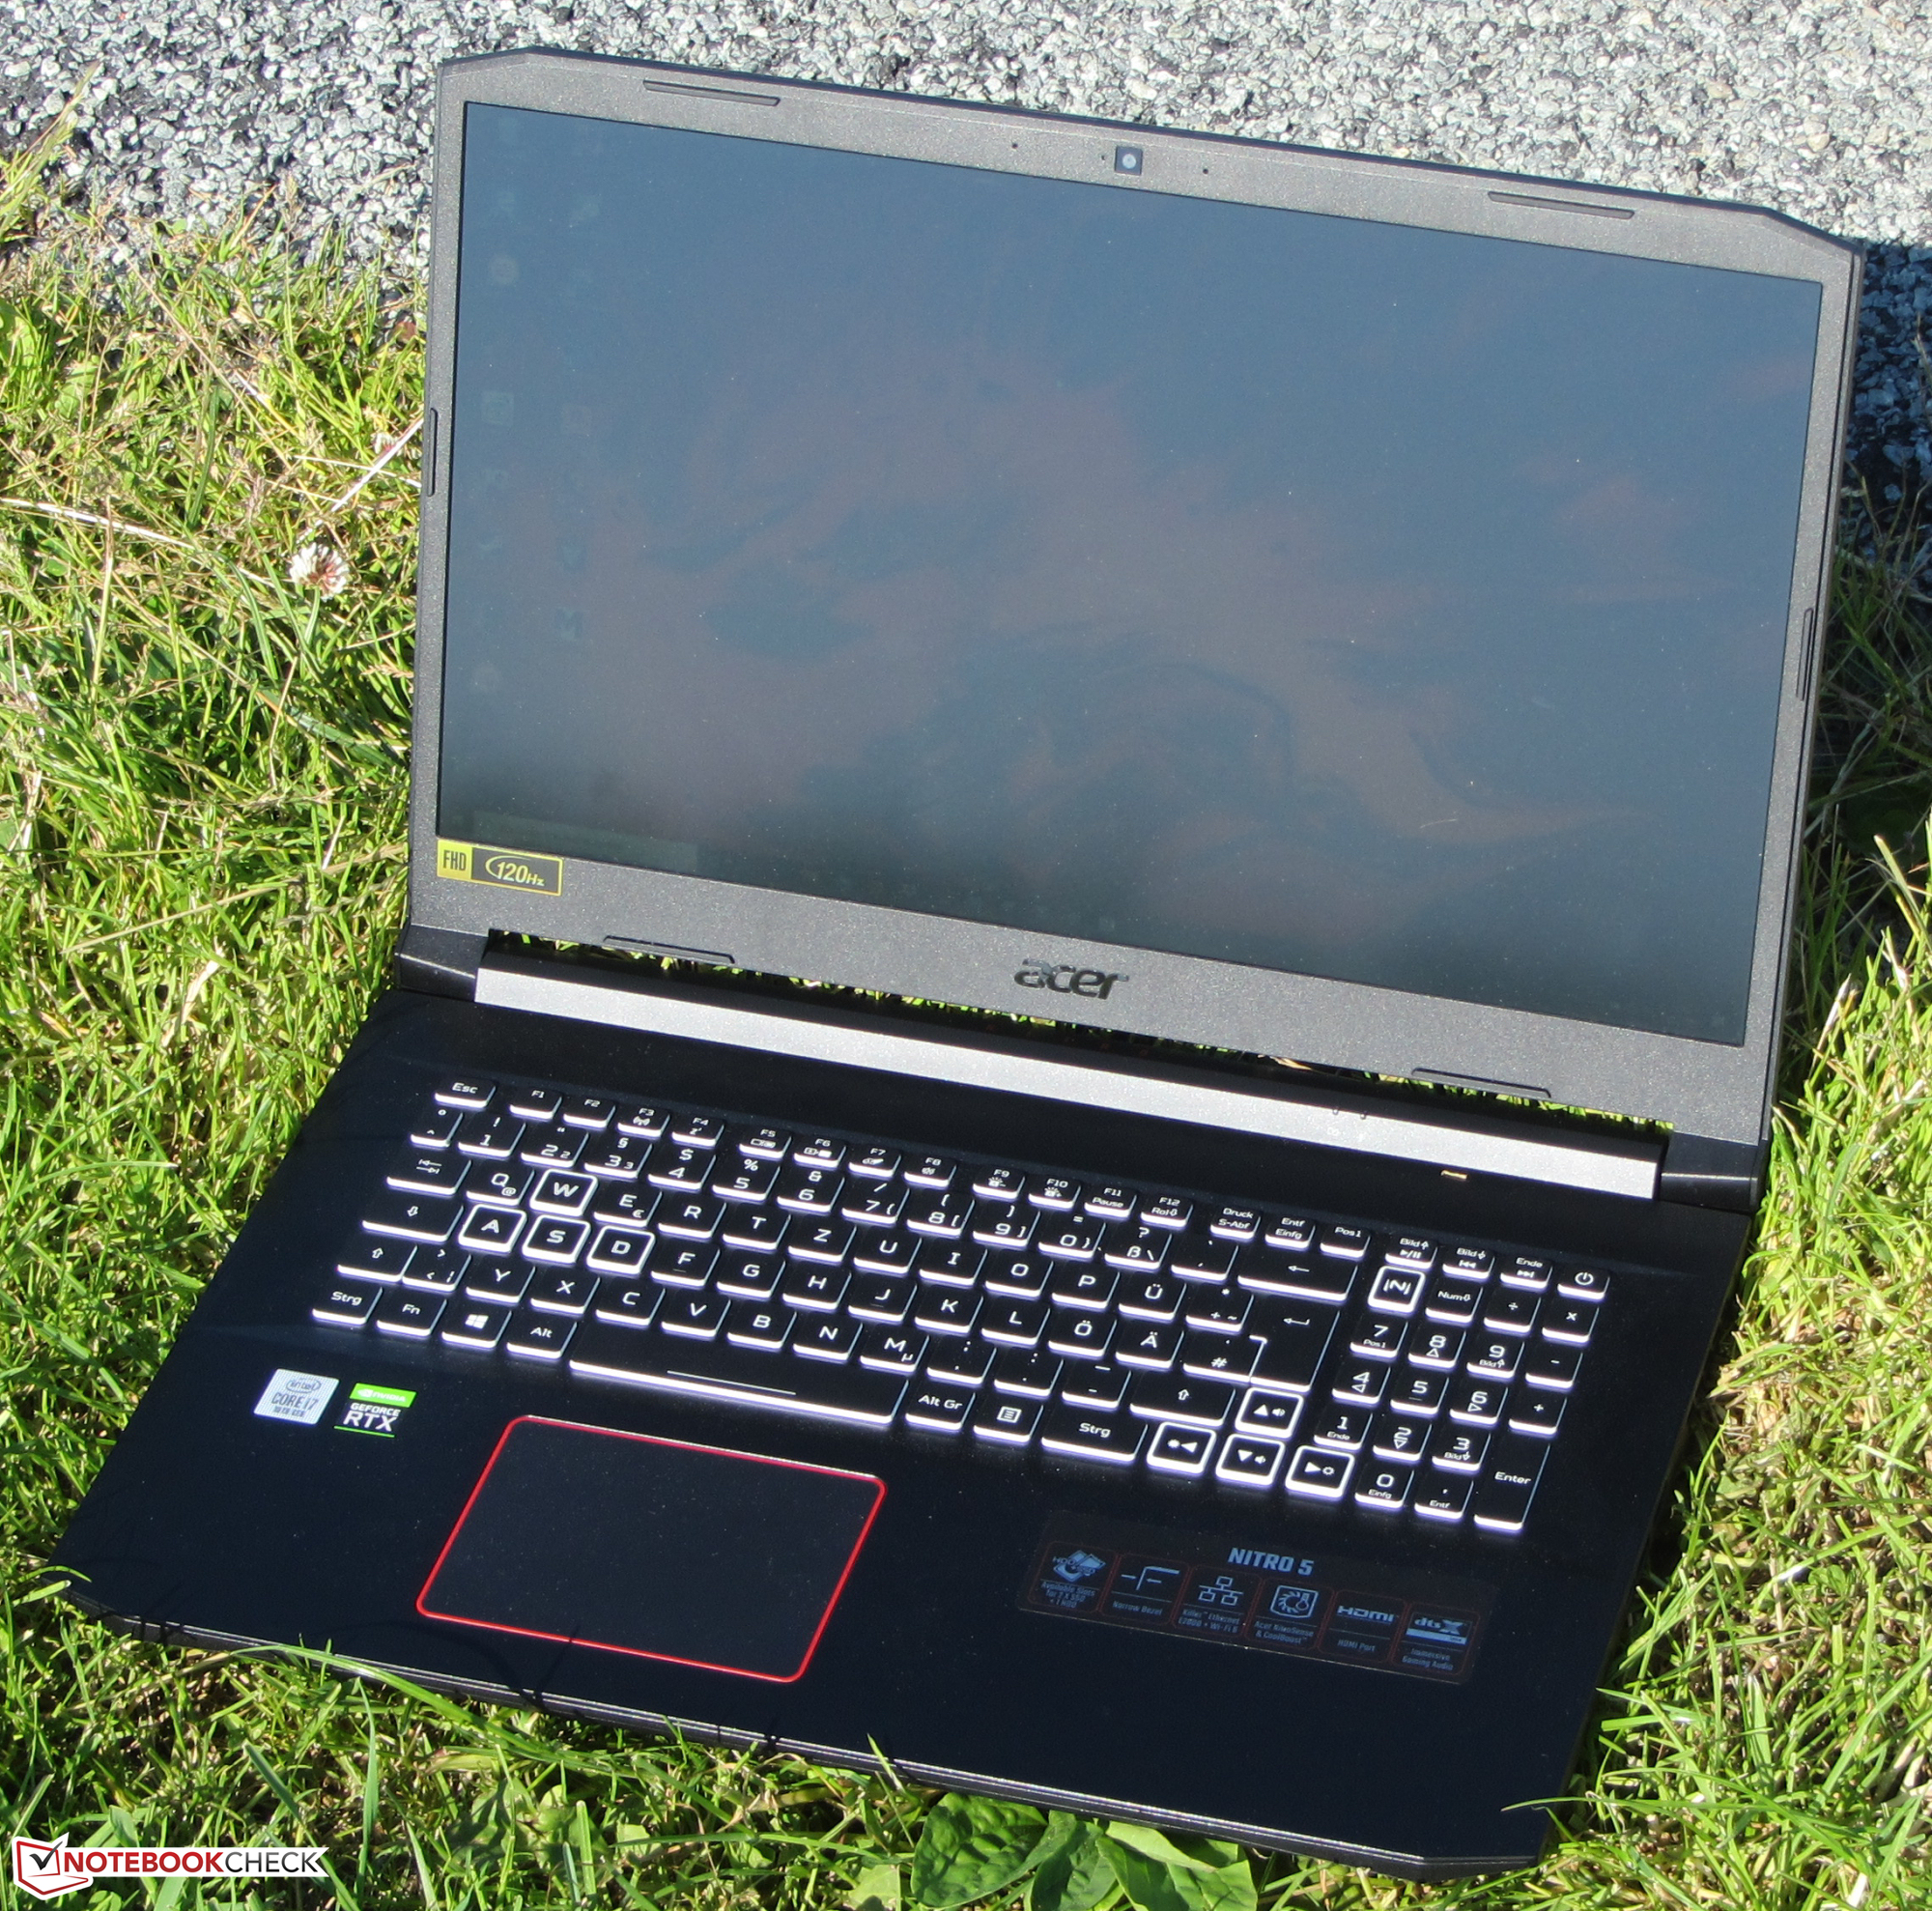
Le PC portable de jeu de 17,3 pouces d'Acer est capable de faire tourner fluidement tous les derniers jeux sur son écran mat Full HD grâce à son Core i7-10750H et à sa GeForce RTX 2060. Il est souvent possible de jouer en Full HD et avec une qualité élevée voire maximale.
L'Acer Nitro 5 AN517-52 est un PC portable de jeu équilibré, qui mériterait un meilleur écran.
Le SSD NVMe de 1 To permet de stocker nombre de jeux et d'autres logiciels. Et si celui-ci venait à être trop limité, il peut être augmenté, avec un deuxième SSD NVMe M.2 2280 et un disque de 2,5 pouces. L'appareil n'ayant pas de trappe de maintenance, il faudra cependant ouvrir la coque.
Mais c'est l'écran IPS 120 Hz qui ne s'avère pas convaincant. La luminosité, le contraste et la couverture des espaces colorimétriques sont trop faibles. Le temps de réponse peut être considéré comme moyen. Un PC portable à 1 500 € doit faire mieux. Les angles de vision larges, la surface matte et les couleurs à peu près fidèles sont en revanche les points forts de l'écran.
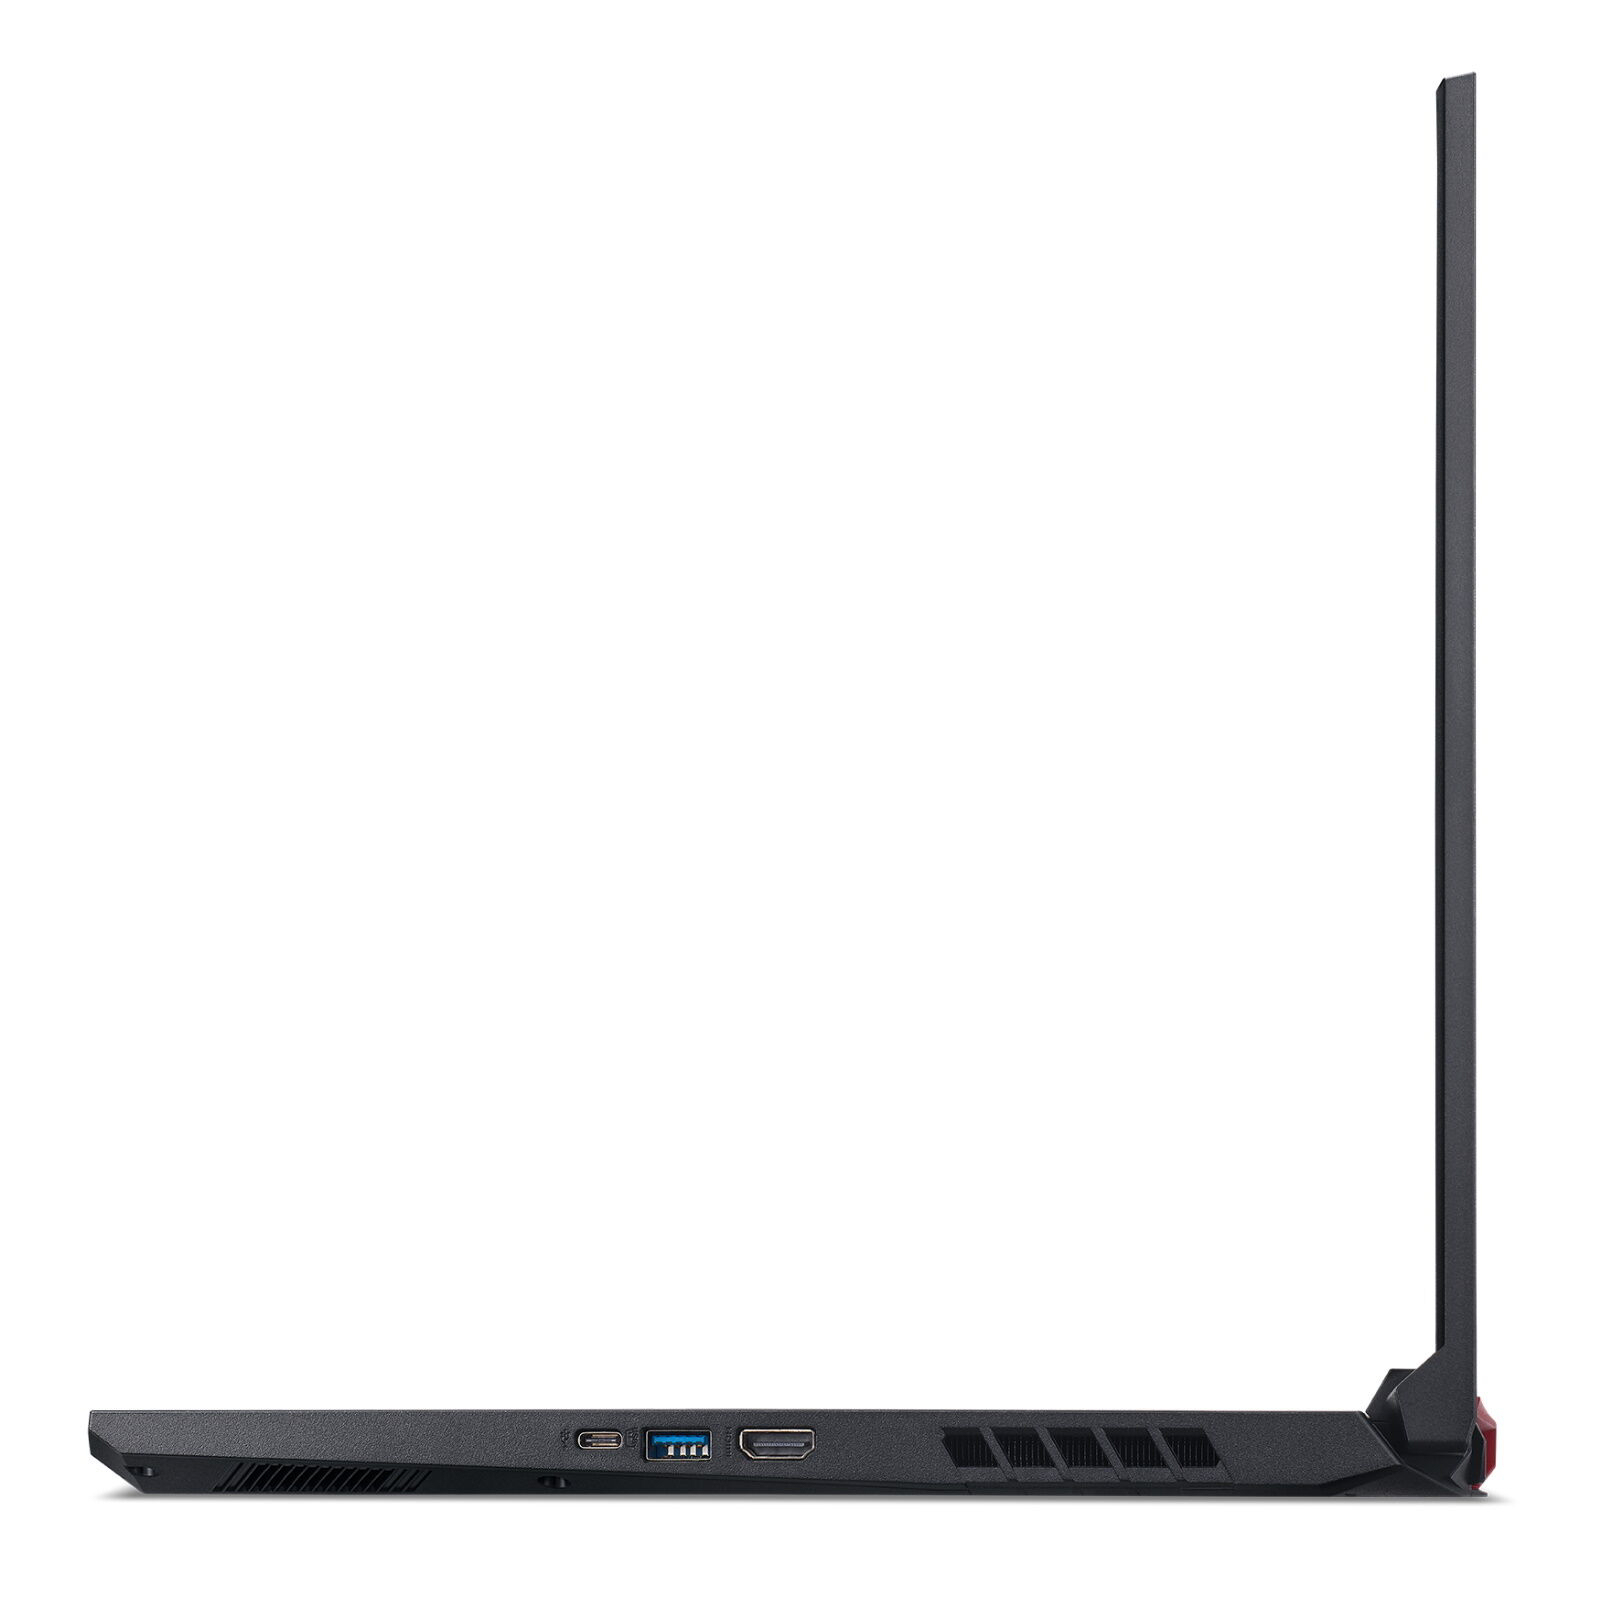
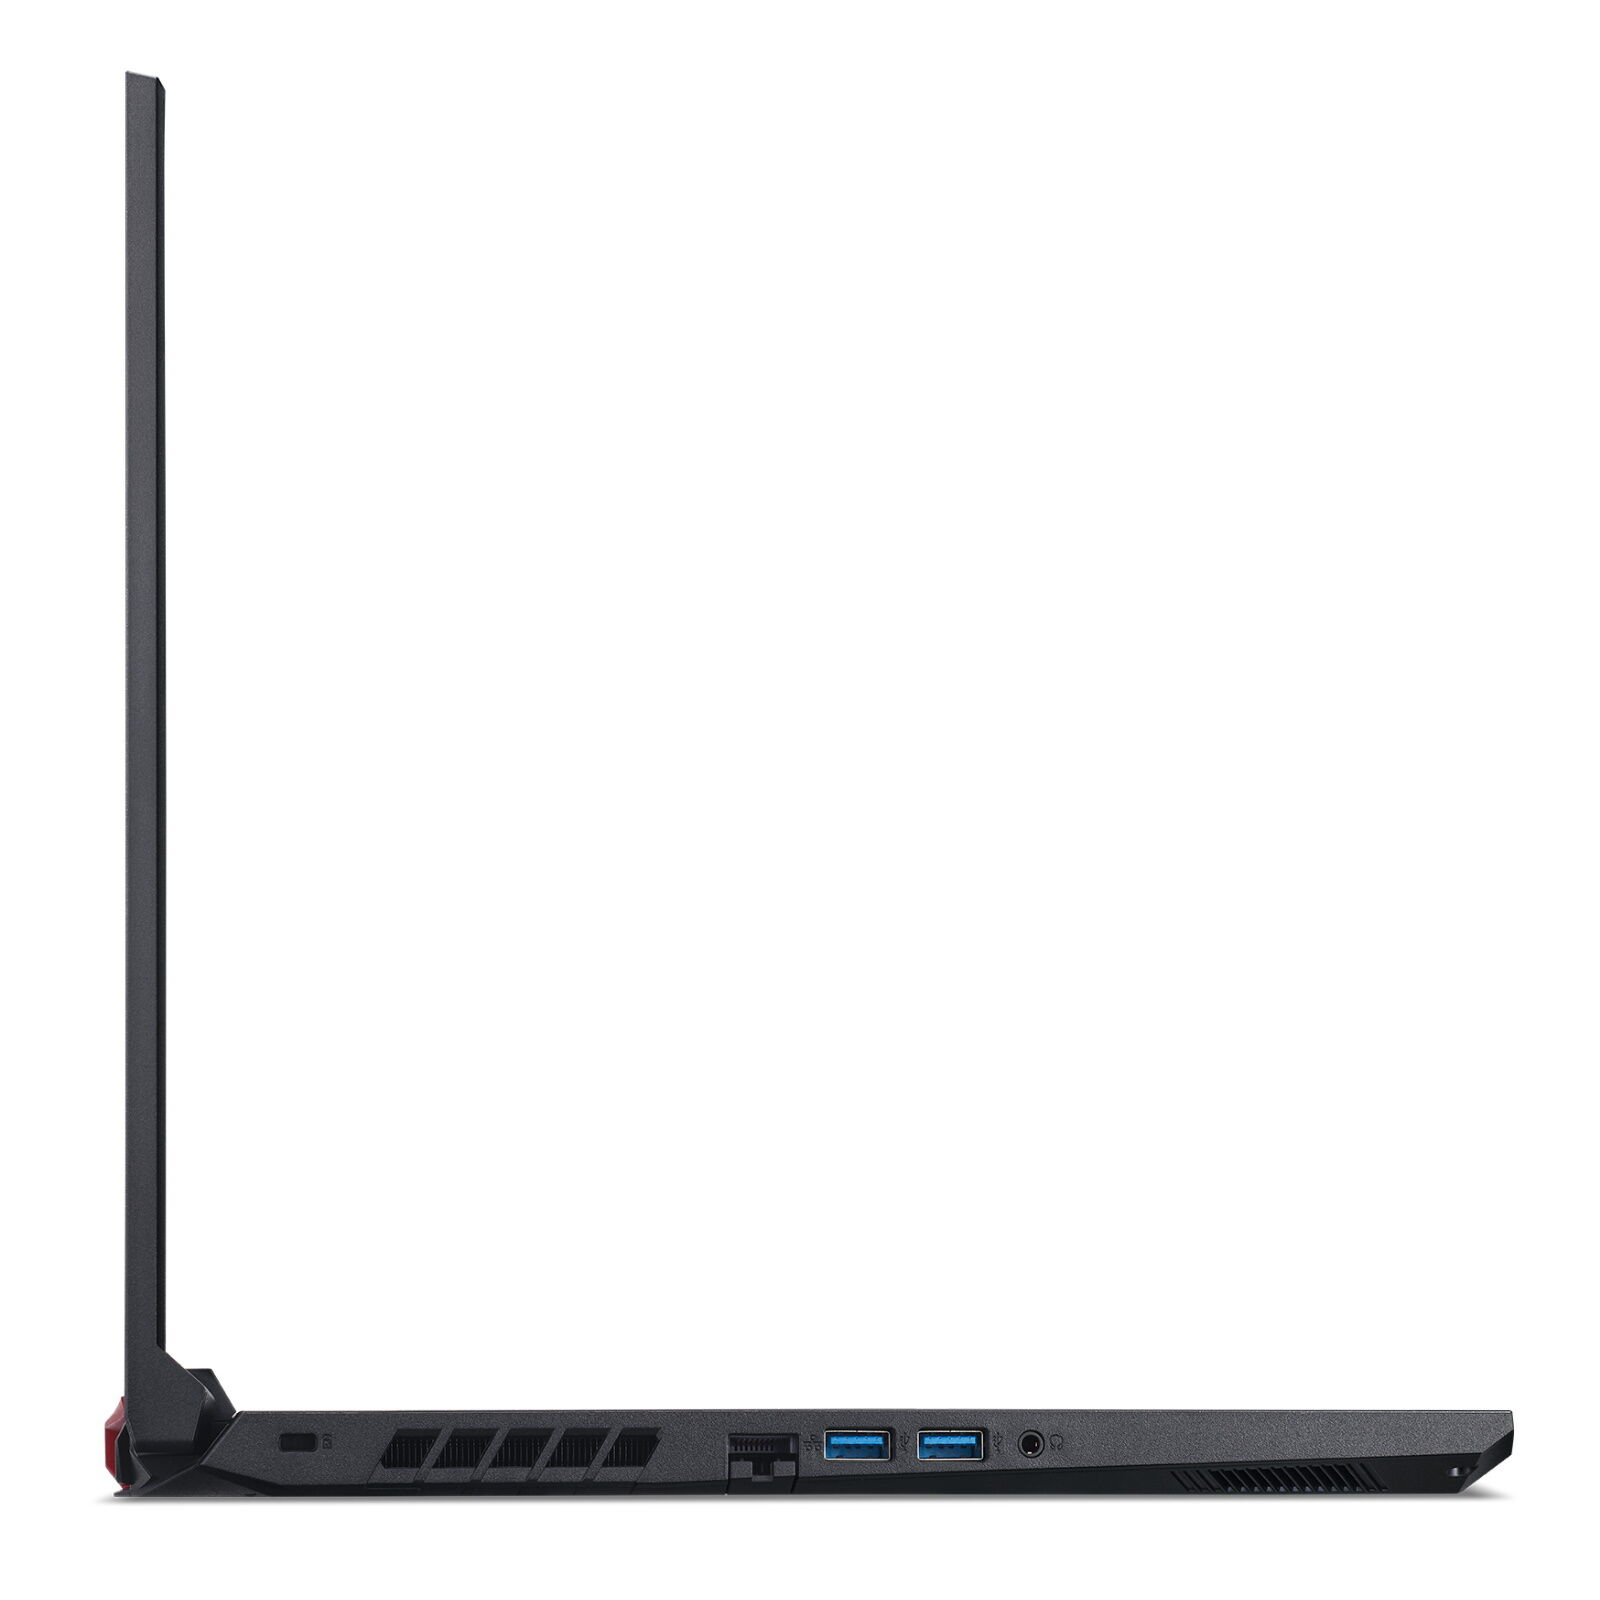
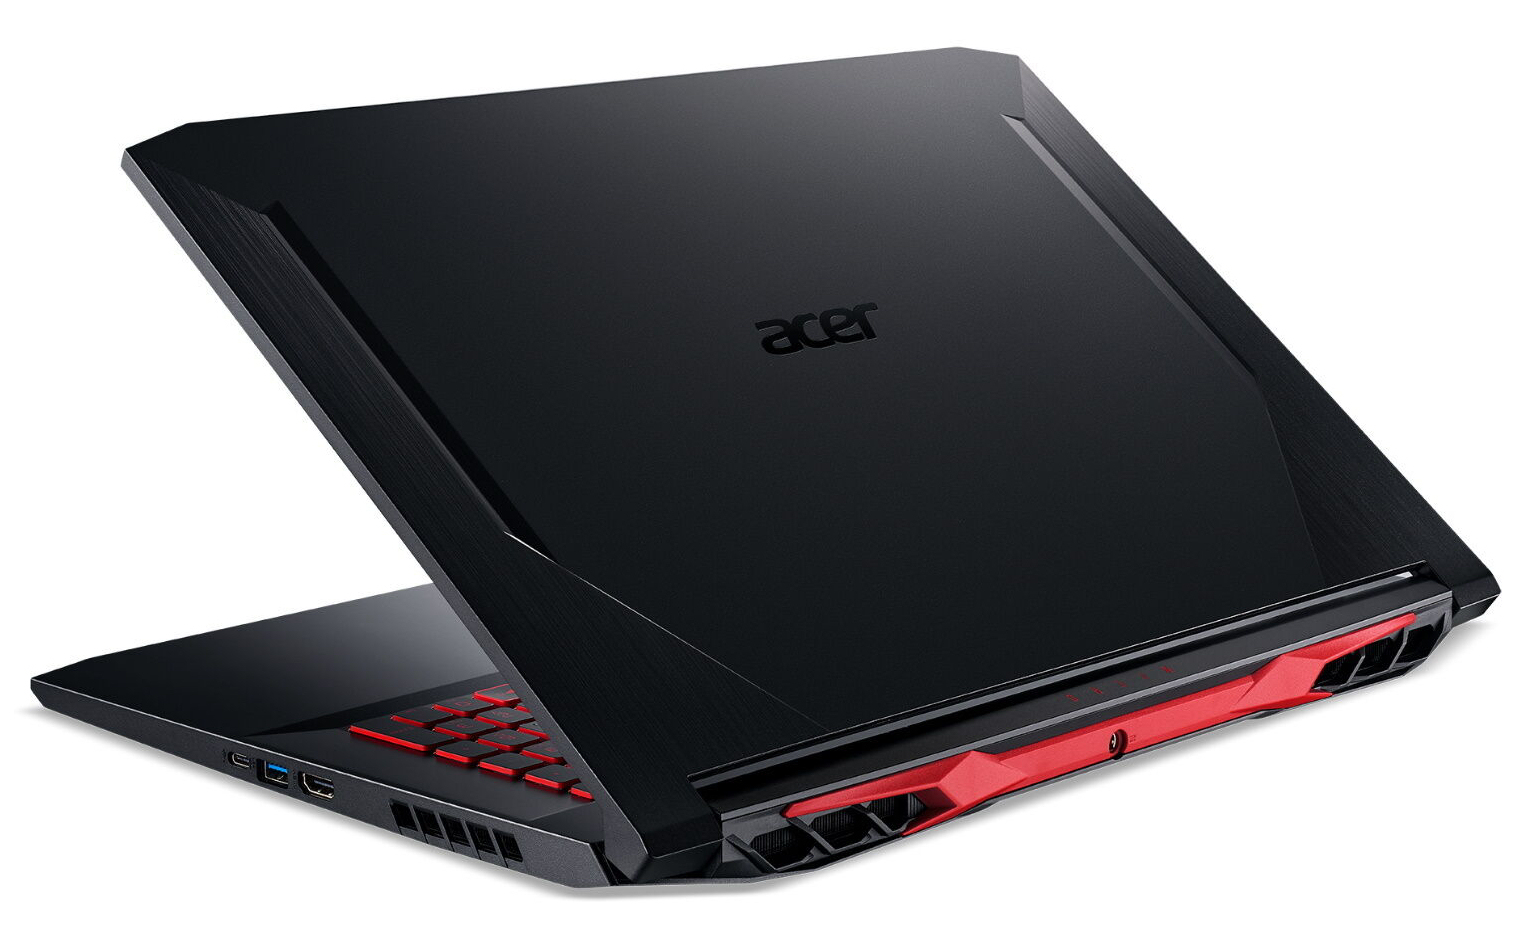
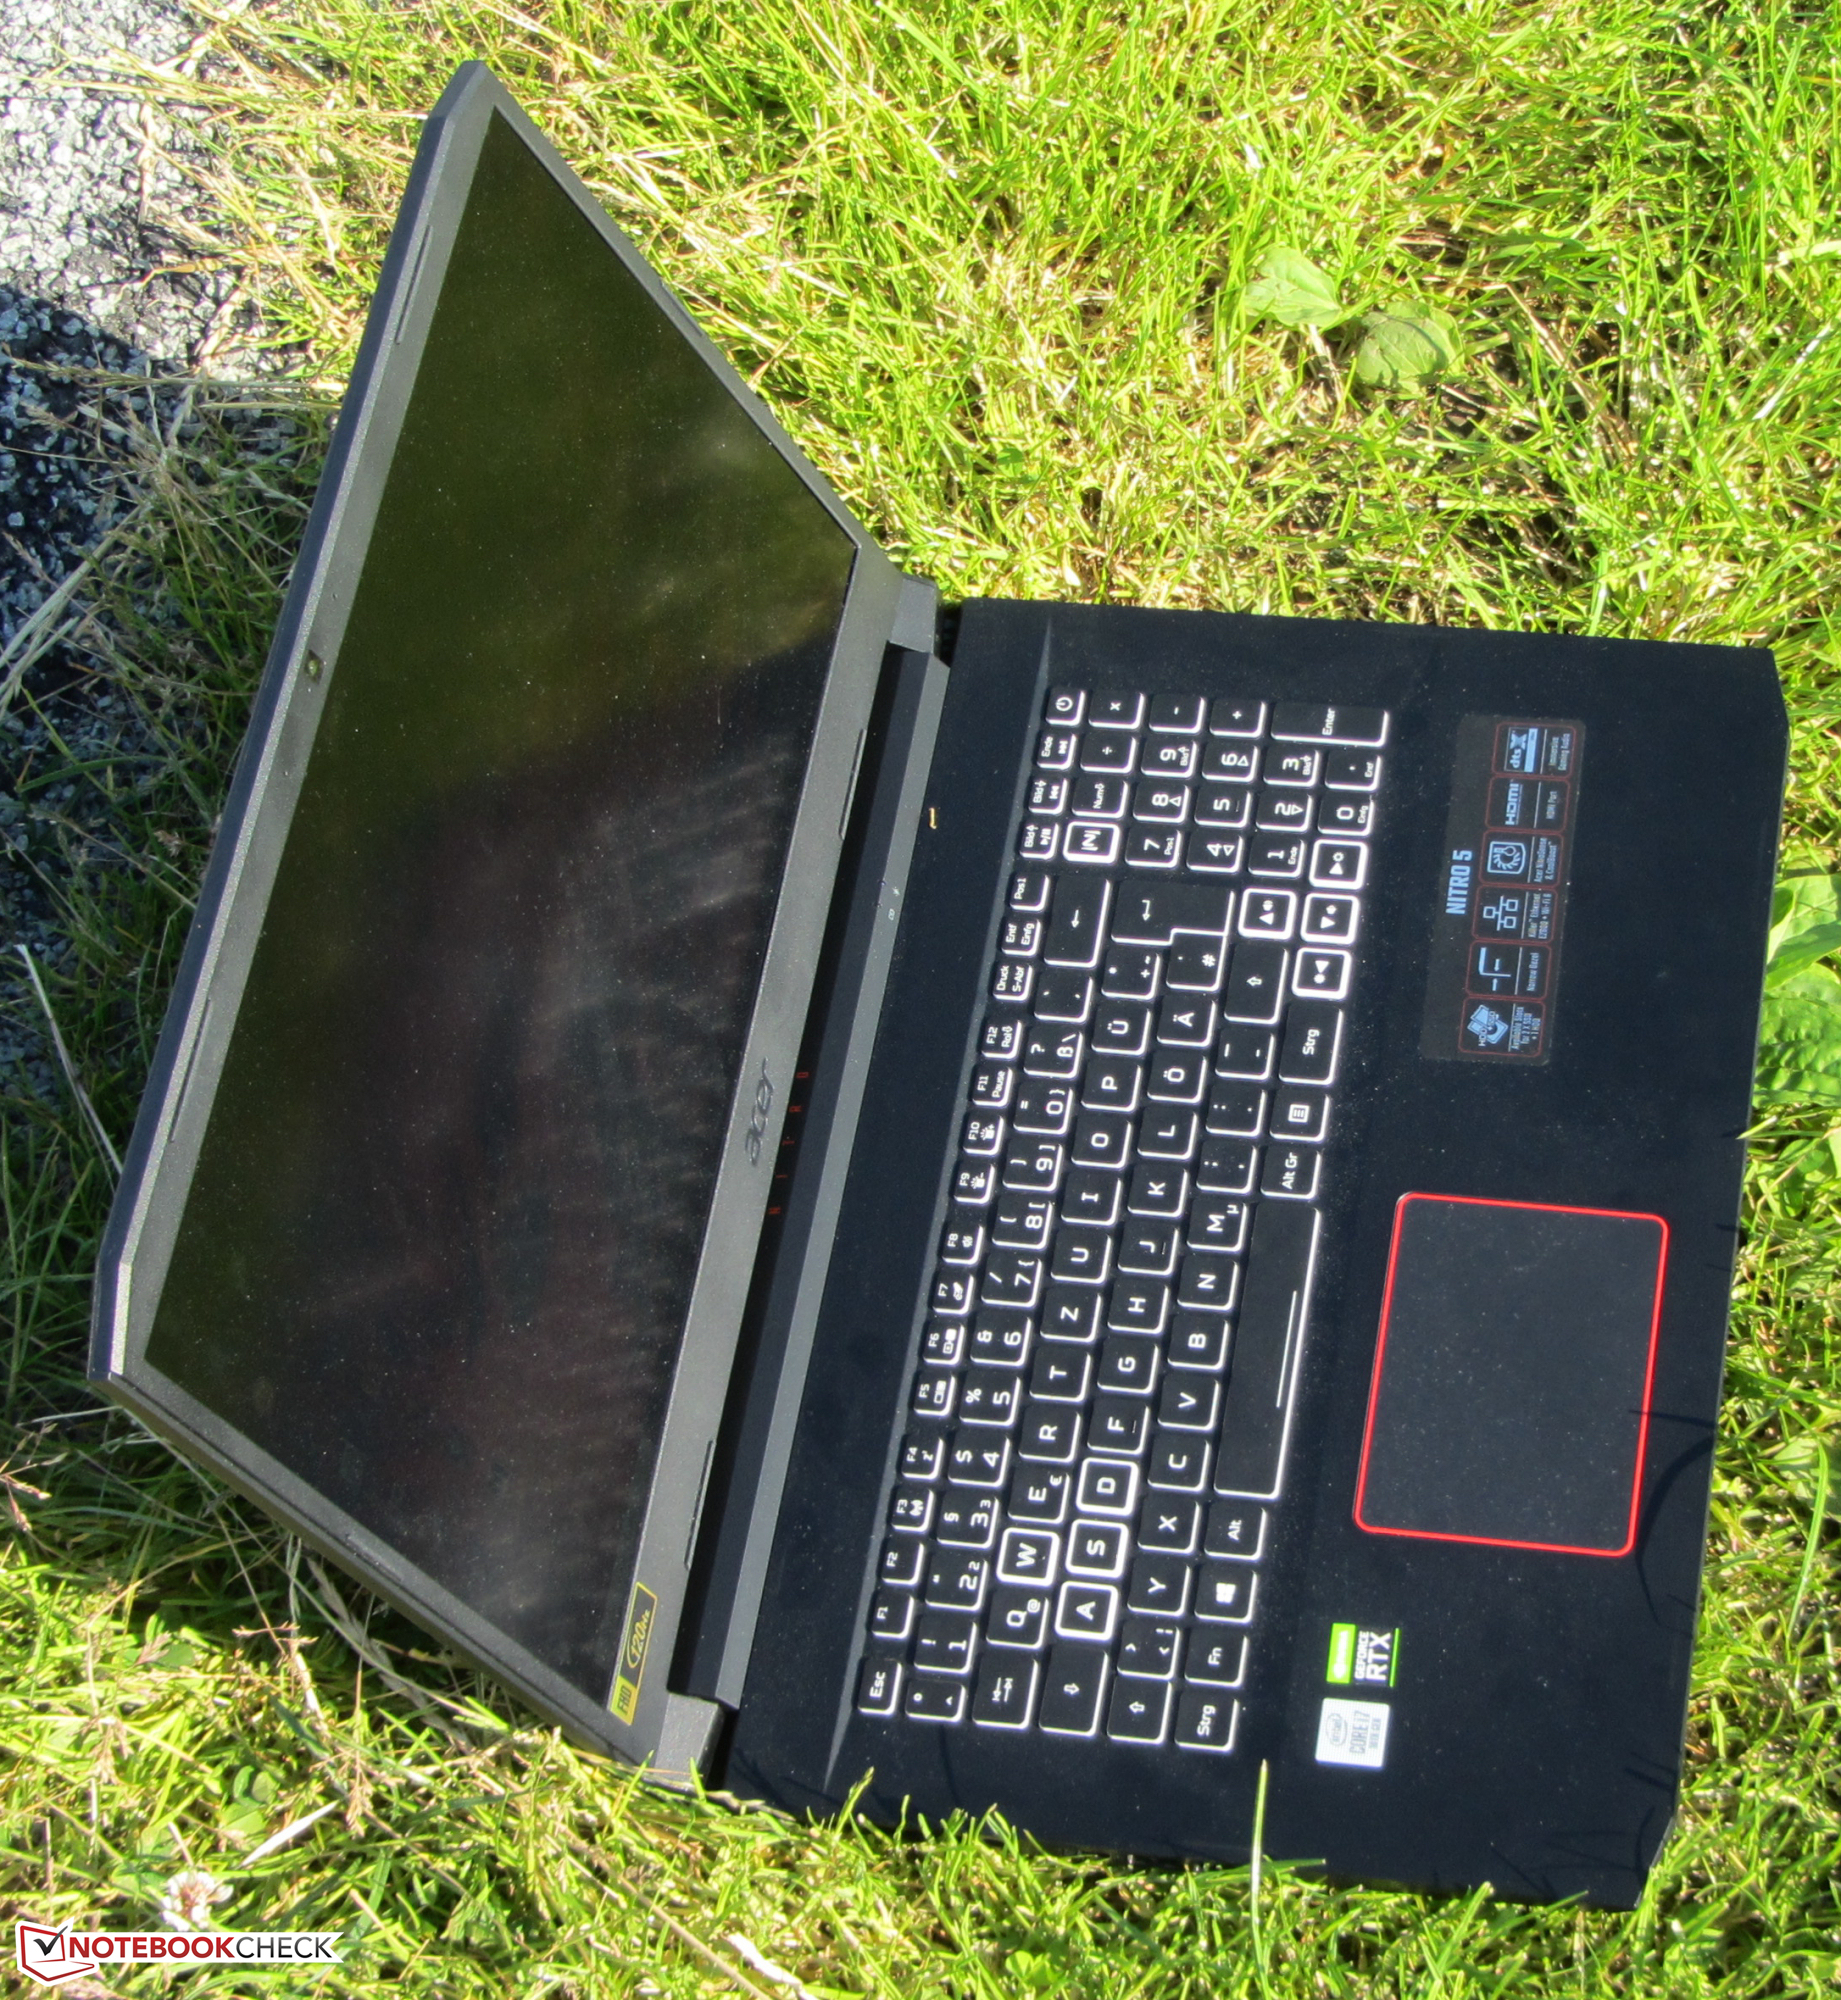
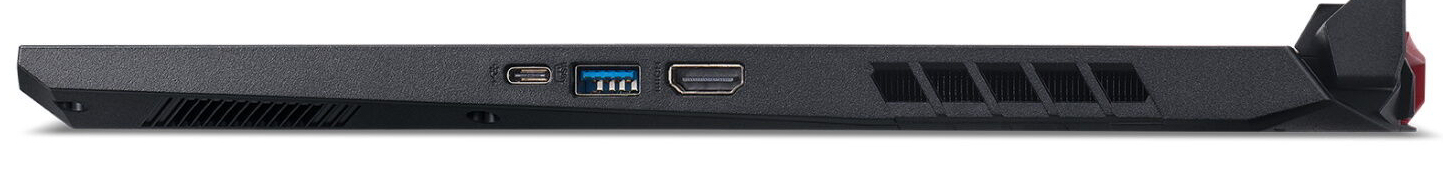
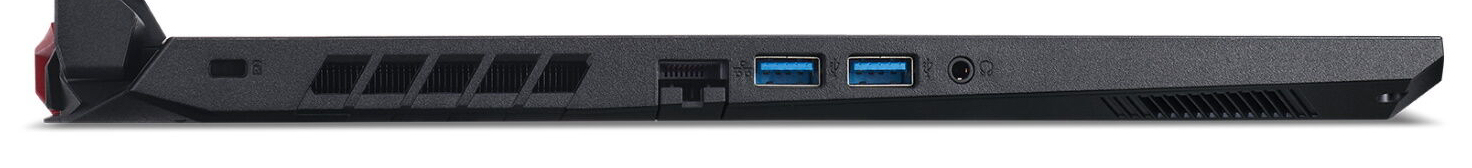
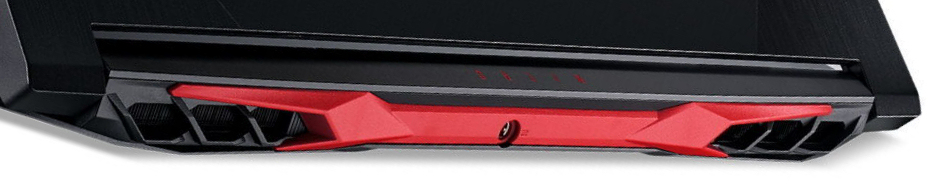
Le PC portable possède les ports les plus importants, mais fait l'impasse sur le Thunderbolt 3. Il n'y a qu'un seul port USB C 3.2 Gen. 2, non compatible DisplayPort. Le clavier (avec rétroéclairage RVB) s'avère adapté pour le quotidien. L'autonomie est quant à elle plus que bonne pour un PC portable de jeu de 17,3 pouces.
Actuellement, le PC portable coûte juste un peu moins de 1 500 €. De ce fait, il n'a pas un petit prix, mais n'en possède pas moins un bon rapport performances / prix.
L’intégralité de cette critique est disponible en anglais en suivant ce lien.
Acer Nitro 5 AN517-52-77DS
- 06/18/2020 v7 (old)
Sascha Mölck
Price comparison
